on the impact of marpol annex v upon solid waste disposal
TRANSCRIPT

Northwest and Alaska Fisheries Centers
National Marine Fisheries Service
U.S. DEPARTMENT OF COMMERCE
NWAFC PROCESSED REPORT 89-20
FINAL REPORT On the Impact of Marpol Annex V Upon Solid Waste Disposal Facilities of Coastal Alaskan Communities
October 1989 ,
This report does not constitute a publication and is for information only. All data herein are to be considered provisional.


NOTICE
This document is being made available in .PDF format for the convenience of users; however, the accuracy and correctness of the document can only be certified as was presented in the original hard copy format.
Inaccuracies in the OCR scanning process may influence text searches of the .PDF file. Light or faded ink in the original document may also affect the quality of the scanned document.


Final Report
ON THE IMPACT OF MARPOL ANNEX V UPON SOLID WASTE DISPOSAL FACILITIES OF COASTAL ALASKAN COMMUNITIES
Prepared By
Randolph Bayliss, P.E. 119 Seward Street No. 10
Juneau, Alaska 99801
C. Deming Cowles 1050 Thomas Jefferson Ave. N.w.
Washington, D.c. 20007
For
Southwest Alaska Municipal Conference 1007 West Third Avenue Suite 201
Anchorage, Alaska 99501
Funded under Grant NA-88-ABD-00002 from the
United States Department of Commerce National Oceanic and Atmospheric Administration
Marine Entanglement Research Program 7600 Sand Point Way, N.E.
Bin C15700 Seattle, Washington 98115
October 1989


EXECUTIVE SUMMARY
On the Impact of MARPOL Annex V upon Solid Waste Disposal Facilities of Coastal Alaskan Communities
Coastal communities of Unalaska, Kodiak, and Bristol Bay host large fleets of fishing vessels, seafood processing plants, and related support industries. With new MARPOL rules requiring boat operators to bring more garbage ashore, the impacts to these communities' solid waste handling and disposal facilities may be considerable. Because on-shore impact depends greatly upon to what degree larger vessels install shipboard incinerators, the impact is difficult to project.
Already these communities generate more garbage on a per capita basis than the average lower 48 towns. Many vessels have already been bringing their wastes ashore in anticipation of MARPOL. Unalaska's garbage generation rate has recently jumped to 540% higher than the national norm.
The solid waste arriving at coastal landfills has a greater materials recycling value and heat content than average municipal wastes. Unalaska's waste has an estimated heat content almost equal to that of some Alaskan coal.
The Unalaska landfill has nearly reached capacity, with three to five years left. The baler/landfills at Kodiak and Bristol Bay can expect lifetimes of 15 to 30 years.
Recommendations (abbreviated)i 1. Unalaska should begin an engineering feasibility
study to evaluate incinerator disposal with energy recovery. The study should concentrate on needs of energy customers and incinerator specifications.
2. A regional solid waste collection and management study should be undertaken for the Bristol Bay area. The collection costs and area-wide recycling and hazardous waste reduction programs should receive detailed attention.


TABLE OF CONTENTS
1. Introduction. . . . . . . . . . . . . . . . . . . . . . . . . . . . . . . 2. Purpose . .................................. .
3. Bae kground . . . . . . . . . . . . . . . . . . . . . . . . . . . . . ....
4. Legal Analysis .......................... .
5. Type and Amount of Solid Waste •..••••••••••
6. Disposal Options: Landfills •••• . . . . . . . . . . . . 7. Incineration •••.. . . . . . . . . . . . . . . . . . . . . . . . . . . 8. Recyclinq and Enerqy Recovery ••••••••••••••
9. Hazardous Wastes . .•••••..•.... . . . . . . . . . . . . . 10. Unalaska. . . . . . . . . . . . . . . . . . . . . . . . . . . . . . . . . . . 11. Kodiak .•• . . . . . . . . . . . . . . . . . . . . . . . . . . . . . . .
Page 1
2
3
5
15
22
27
30
42
44
48
12. Bristol Bay. . . . . . . . . . . . . . . . . . . . . . . . . . . . . . . . 52
13. Reqional Options. • • • • • • • • • • • • • . • • • • • • • . • • . • 54
14. Models •••••• . . . . . . . . . . . . . . . . . . . . . . . . . . . . . . . 15. Conclusions. . . . . . . . . . . . . . . . . . . . . . . . . . . . . . . . 16. Recommendations. . . . . . . . . . . . . . . . . . . . . . . . . . . . 17. References ••••.• . . . . . . . . . . . . . . . . . . . . . . . . . . .
Acknowledgements. . . . . . . . . . . . . . . . . . . . . . . . . . . 18. Appendices
A.
B.
c.
o.
E.
F.
G.
Glossary. . . . . . . . . . . . . . . . . . . . . . . . . . . . . Layman's Guide. . . . . . . . . . . . . . Solid Waste Loads and Costs
in Other Alaskan Towns.
MARPOL Annex V ••••••••••••••
Fishinq Waste Questionnaire.
. . . . . . . . .
. . . . . . . . .
. . . . . . . . . Summary of Questionnaire Results. . . . . Form C and Example APHIS Agreement. . .
58
61
62
64
67
68
71
74
83
91
94
99

Number
5-1 5-2 5-3 5-4 5-5 5-6 5-7 5-8 5-9
8-1 8-2 8-3 8-4
10-1 10-2 10-3 10-4
11-1
12-1
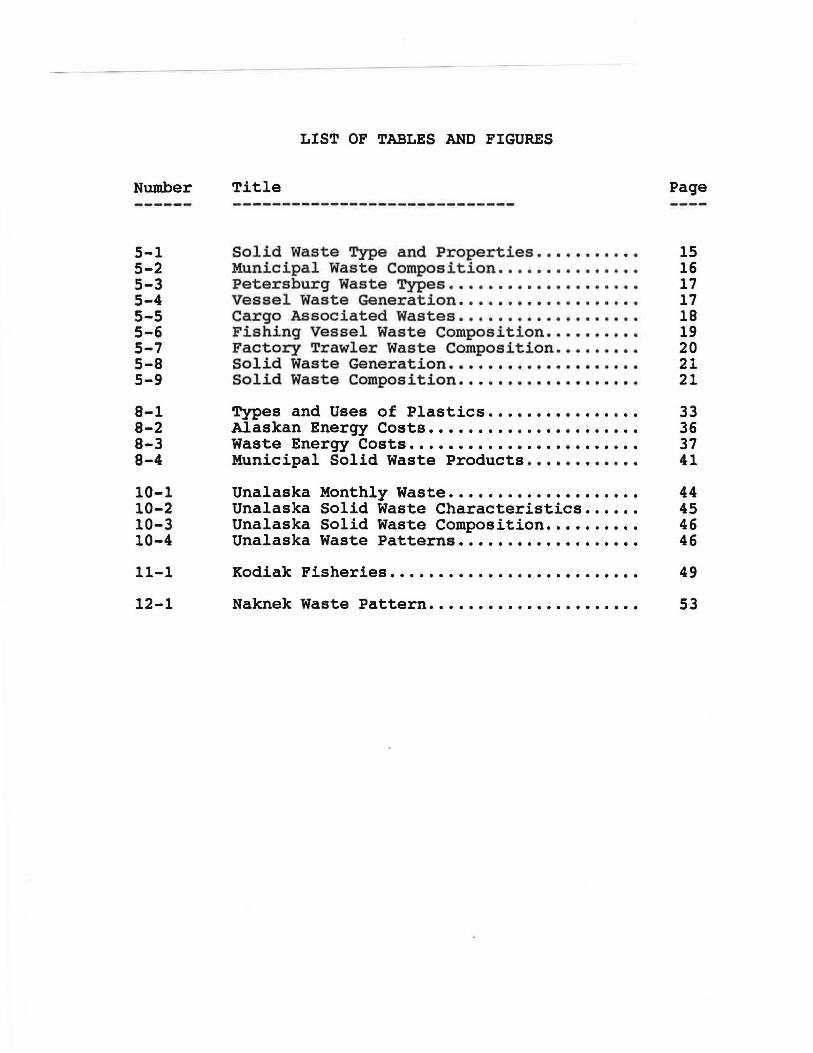
LIST OF TABLES AND FIGURES
Title
Solid Waste Type and Properties •••••..••.• Municipal Waste Composition ••••••••.••.••• Petersburg Waste Types •••••••••.••••.••••• Vessel Waste Generation •••••••.••••..•••.• Cargo Associated Wastes ••.•••••••••••••••. Fishing Vessel Waste Composition .•••.••••• Factory Trawler Waste Composition •••.••.•• Solid Waste Generation •••.••••••••••••••.• Solid Waste Composition •••••••...•••.•••••
Types and Uses of Plastics ••••.••••.•••••• Alaskan Energy Costs •••.•••.•••••••••••••• Waste Energy Costs .••••••••.•••••••••••.•• Municipal Solid Waste Products ••••••••••••
Unalaska Monthly Waste ••••.•.•.•.•••••.••• Unalaska Solid Waste Characteristics •••••• Unalaska Solid Waste Composition •••••.•••• Unalaska Waste Patterns •••••.•••.••••.••••
Kodiak Fisheries •••••••••.•.••••••••.••.••
Naknek Waste Pattern •.••.•••••••••••••.•••
Page
15 16 17 17 18 19 20 21 21
33 36 37 41
44 45 46 46
49
53


On the Impact of MARPOL Annex V upon Solid Waste Facilities
of Coastal Alaskan Communities
1.0 INTRODUCTION
New federal rules now require boat operators to bring their garbage ashore. This report concerns itself with the impact of this increase in garbage upon coastal Alaska fishing communities.
Three such communities were chosen -- Unalaska/Dutch Harbor, Kodiak, and Bristol Bay Borough. Each has different fishing seasons and fleets and different types and amounts of garbage.
Unalaska/Dutch Harbor serves as an international base of operations for factory trawlers that harvest and process bottomf ish. About 40 of these 150 to 300 foot long vessels make several hundred deliveries to Unalaska/Dutch Harbor yearly. From 30 to 90 crew spend from 20 to 50 days at sea on a typical factory trawler. Other vessels from 12 foreign countries routinely tie up to nearly 20 docks in the area.
Kodiak hosts more of a resident fleet of medium and smaller multi-fishery vessels. Crabbers from 75 to 150 feet long carry a crew of five to eight for up to month long voyages. About 300 salmon purse seiners work out of Kodiak, averaging four crew members and four months at sea.
Bristol Bay witnesses an annual invasion of salmon gillnetters. Beginning in late May, nearly two thousand 30+ foot boats appear, each with a crew of two or three. After late July, few boats remain.
This report has been primarily written for city officials: the harbor masters and public works directors who receive the first impacts from garbage brought ashore. They provide the dockside dumpsters and contend with the increased volume of garbage.
Information in this report will also be of value to administrators, engineers, and planners who manage garbage handling and disposal. Those concerned include --
-- fishermen, boat operators, and processors who generate the garbage;
-- city officials who collect and dispose of it and who attempt to comply with complicated and changing environmental regulations; and
-- state officials who regulate garbage and fund construction of garbage handling facilities.

SWAMC MARPOL Report - Page 2 - October 1989
2.0 PURPOSE AND APPROACH
Purposes of this project, as outlined in the Request for Proposals (Ref l] and further elaborated upon in the Proposal [Ref 2], included evaluation of
impacts to garbage handling and disposal facilities at Unalaska, Kodiak, and Bristol Bay;
possibilities for regional solutions to handle solid waste problems of many communities; and
funding sources that focus on user fees and governmental grant programs.
We also proposed to study various options for waste recycling and disposal in coastal communities, including pros and cons, and capital and operating costs. The impacts of new federal and state laws on these options would be addressed.
We approached the project in several manners and from several different angles.
To evaluate the impacts to the communities, we visited Unalaska/Dutch Harbor, Kodiak, and Naknek, interviewed both harbor masters and local solid waste officials, and inspected disposal sites. This enabled us to estimate current amounts and types of waste materials at these communities.
Solid waste operating,labor, and cost data from other coastal communities were obtained directly from those towns and from state agency records. Details of options for disposal of solid waste by incineration, compacting, recycling, and landfilling were obtained and evaluated.
To predict increased garbage volumes from fishing groups, questionnaires were sent to various industry representatives and the information returned was analyzed and digested. To gain further information from the fishing groups, we successfully urged the Coast Guard to hold MARPOL public hearings in Seattle to allow for Pacific and Alaskan fisheries input to the rule making process. By these methods, we estimated the amounts and types of waste materials that would be brought ashore with implementation of MARPOL Annex v.

SWAMC MARPOL Report - Page 3 - October 1989
3.0 BACKGROUND
Plastics disposal at sea has caught our attention. Almost every national magazine has displayed cover photos and featured articles lamenting our plastic laden beaches. Hideous images of gulls strangled by plastic six-pack yokes and of seals entangled in plastic fishing net haunt the classrooms of our schools. Plastic syringes float in our harbors. Plastic bags seize boat propellers and clog cooling water intakes. Discarded nets drown diving sea birds for years. Our outrage has led to laws controlli ng waste disposal at sea. Congress has also authorized money to study and mitigate these problems .
The NOAA Marine Entanglement Research Program allocates its funding in three general areas: 1) studies on impacts to marine life, 2) education to prevent disposal of garbage at sea, and 3) mitigation of the impacts. NOAA, the National Oceanic and Atmospheric Administration, has spent almost a million dollars a year along these lines. This project falls into the mitigation area, along with studies of onboard disposal methods, cleanup projects on beaches, research on plastics that degrade upon exposure to sunlight, and research on recycling of plastics.
The NOAA focus on the ports' role in implementing MARPOL began with case studies in Newport, Oregon from January 1987 through March 1988. [Ref 3] Careful records of the type and volume of garbage returned to shore were kept. Successful recycling programs were initiated. Public awareness programs made it all work effectively.
In continuing to evaluate ports' abilities to implement MARPOL, NOAA became concerned about MARPOL impact on remote ports with little solid waste management capacity and high vessel traffic. In 1988, NOAA funded a report "On the Effects of MARPOL Annex V on the Ports of Kodiak and Unalaska." [Ref 4] The present report follows up some of the recommendations of the 1988 study. The 1988 study projected trends in fishing activity and other vessels using these ports and estimated the garbage generation rates by various fishing fleets and by various other types of vessels.

SWAMC MARPOL Report - Page 4 - October 1989
Other environmental trends will be impacting our study. As new MARPOL laws will increase the garbage volumes coming ashore, new laws will change the ways these wastes can be disposed of. The new Clean Air Act will impose tougher limits on incineration of wastes, both in air emissions and in disposal of incinerator ash. New landfill siting criteria and operational rules will make it more expensive to dispose of solid waste. Today's garbage dump will become tomorrow's hazardous waste Superfund cleanup site.
One effect of these new laws will be to make it more expensive to dispose of solid waste, forcing --
-- industries to rethink their production of toxic chemicals;
-- marketers to change their packaging of products; and -- consumers to change their habits of using disposable
products
all of which will make recycling become economical.
With this background, we begin our study of MARPOL garbage impacts on three small Alaskan fishing communities.

SWAMC MARPOL Report - Page 5 - October 1989
4.0 LEGAL ANALYSIS
Legislative History hit a benchmark on December 29, 1987 when President Reagan signed the Marine Plastic Pollution Research and Control Act of 1987 (Public Law 100-220, hereinafter, "the Act"). As such, the United States ratified Annex V of the Protocol relating to the International Convention for the Prevention of Pollution from Ships (MARPOL). Annex V sets limits on the discharge of garbage into the sea and prohibits the discharge of any plastics into the sea. Annex V went into effect on December 31, 1988.
The Act authorized the Coast Guard to make rules to implement Annex v. On October 27, 1988, the Coast Guard issued a Notice of Proposed Rulemaking (53 FR 43622), proposed rules to existing rules in 33 CFR Parts 151, 155, and 158, as well as 46 CFR Part 25 (summaries of which are attached in pertinent part). The Coast Guard issued interim rules on April 28, 1989, ·making several changes to the regulations (copy attached). The interim rules took effect May 30, 1989.
As noted, these rules are interim, and still subject to change. The Coast Guard has not promulgated final rules for two reasons. First, they have not yet completed their work on information placards and record keeping requirements. Notice of these items will be published shortly. Secondly, the Coast Guard believes that they will benefit from a year's experience under the interim rule. Hence, comments will be taken on the interim rule until December 31, 1989. In the final rule, we are most likely to see "fine tuning" rather than alterations of the interim rules.
Annex V calls for a change in the way ships and ports or terminals manage garbage generated on board vessels.
4.1 Annex V sets specific requirements and restrictions for the discharge of garbage by vessels at sea. Annex V is divided into seven subsections, called "regulations," and this paper will refer to those subsections as such.
Annex V sets specific limits , on shippers as to how far from shore certain types of garbage may be discharged. Annex V applies to all U.S. vessels, wherever located, and to all foreign vessels when in the navigable waters of the U.S. or within the 200 mile Exclusive Economic Zone of the U.S. However, excluded from these regulations are U.S. government owned or operated ships if they are in noncommercial service, and other ships excluded by MARPOL 73/78.

SWAMC MARPOL Report - Page 6 - October 1989
Regulation 1· The disposal into the sea of all plastics (as defined in Sec 4.10), including synthetic ropes, synthetic fishing nets, and plastic garbage bags is prohibited. This measure covers composite products where plastics are an essential component.
Some other types of garbage can be disposed of at sea, such as packing material, rags, pottery and bottles. Regulation 3 specifies the minimum distance from shore each permitted discharge may occur.
Dunnage, lining, and other package materials which will float can be discharged no closer than 25 miles from shore.
Food wastes and all other garbage including paper products, rags, glass, metal, bottles, crockery, and similar refuse can be discharged no closer than 12 miles from shore, unless those items are ground and are capable of passing through a screen with no openings greater than one inch.
When the garbage is mixed with other garbage having different requirements, then the more stringent requirements shall apply. For example, garbage mixed with plastics can never be disposed of at sea. Ground glass mixed with dunnage can be disposed of no closer than 25 miles from shore.
Regulation 4 prohibits the disposal of any of the aforementioned materials from fixed or floating platforms engaged in "exploration, exploitation, and associated offshore processing of seabed mineral resources, and from all other ships when within 500 meters of such platforms". There is an exception: food wastes from such platforms or from ships within 500 meters of such platforms may be disposed of provided that they have passed through a comminuter or grinder with screen openings of no more than one inch and that they are disposed of at least 12 miles from the nearest land.
Regulation 5 applies to special areas and will have no effect on Alaska.
Regulation 6 specifies exceptions to the disposal requirements of Regulations 3, 4, and 5 to provide for safety and accidental discharges. For example, the disposal of garbage at sea is not a violation when that disposal is necessary to secure the safety of those on board or to save a life at sea. Under this exception, garbage could be jettisoned if necessary to maintain the stability of a vessel in distress. As well, the escape of garbage resulting from damage to a ship or its equipment is not usually a violation of MARPOL .Annex v. Finally, if_there is an accidental loss of synthetic fishing nets or other

SWAMC MARPOL Report - Page 7 - October 1989
synthetic material incidental to the repair of such nets, provided that all reasonable precautions had been taken to prevent such loss, there will be no violation of MARPOL Annex v.
Regulation 7 requires the government of each signatory nation to ensure that all ports and terminals will provide facilities to receive garbage without causing undue delay to ships, and according to the needs of the ships using them. The government of each signatory nation is also required to notify the Organization of any inadequate facilities. These rules merely require the government to ensure adequate facilities for waste disposal.
4.2 Coast Guard Definitions in terms of MARPOL use.
1. "Terminal" means a boat or ship docking or wharfage facility. A terminal must be a single entity.
2. "Port" can mean a group of terminals acting together for a common purpose, say for garbage collection services. The Coast Guard allows for this and often encourages it. Terminal operators can join together and establish themselves as "Ports" when applying for Certificates of Adequacy, defined and discussed later.
Ports can include marinas, shorebases for mineral or oil industry activity, commercial fishing facilities, shipyards, or yacht clubs. But, a port is not an unattended boat launching ramp.
Ports can be areas set up and designated by the Coast Guard for special purposes. Ports can also be a geographic place, such as Port Graham, but this has no particular meaning for MARPOL purposes.
3. "Reception Facility" means a place to hold garbage, such as a "dumpster" or other garbage container, or even mobile facilities, such as a modified ship or barge.
4. "Garbage" means all kinds of solid waste generated during the normal operation of the ship. Solid waste includes refuse, trash, waste foodstuff, bottles, cans and paper, packing material, and plastic. Other definitions of garbage can be found in Section 5.1 "Types of Solid Waste." Garbage does not mean fish waste from fish caught and processed at sea. Garbage does not include sewage, sink water, or shower water.
5. "Plastics" means materials containing synthetic chemicals that persist for long periods without decay. Plastics are formed or molded from raw resins under pressure. Plastics may be filaments, fabric, or

SW.AMC MARPOL Report - Page 8 - October 1989
combined into products, either rigid or elastic, hard or soft.
Typical marine plastics include nets, net floats, lines, ropes, strapping materials, buckets, bottles, expanded foam, and films, such as visqueen. Plastics also include composite products in which plastic plays a minor but essential element in its function. For example, in a plastic-lined paper cup.
Plastics include biodegradable and photodegradable plastics. MARPOL has allowed no special exceptions for so-called degradable plastics.
6. "Animal and Plant Inspection Service (APHIS) Wastes" mean "quarantined" garbage and include meat, dairy, and produce garbage originating from foreign ports outside the U.S. and Canada.
7. "Medical Waste" means isolation wastes, infectious agents, human blood and blood products, pathological wastes, sharps, body parts, contaminated bedding, surgical wastes and potentially contaminated laboratory wastes, dialysis wastes, and other items as prescribed by federal regulation.
8. "Person in charge" means the owner, operator, or person authorized to act on behalf of the port or terminal. In essence, the person in charge is the person responsible for the day to day operation of the port or terminal.
4.3 Coast Guard Rules fall into four categories that will affect ports in western Alaska:
a) capability of ports and terminals to receive and handle garbage, APHIS-regulated and other wastes;
b) garbage and plastics waste disposal;
c) APHIS waste disposal and approval; and
d) Certificates of Adequacy (COA's).
The following sections elaborate on these categories.

SWAMC MARPOL Report - Page 9 - October 1989
Port Capability Requirements Each day a port or terminal is in operation, the person in charge of the port or terminal must be able to provide or ensure the availability of a reception facility that is capable of receiving the garbage that a ship wishes to discharge EXCEPT
a) large quantities of spoiled or damaged cargoes not usually discharged by a ship; or,
b) garbage from ships not generally having commercial transactions with that port or terminal.
The person in charge of a port must ensure that the port or terminal's reception facility
a) is capable after August 28, 1989 of receiving APHISregulated garbage at the port or terminal no later than 24 hours after notice is given to the port or terminal of such incoming garbage;
b) is capable of receiving medical wastes (as defined in Section 4.2) and hazardous wastes, unless the port or terminal operator can provide to the master, operator, or person in charge of a ship, a list of persons authorized by federal, state, or local law or regulation to transport and treat such wastes;
c) is arranged so that it does not interfere with port or terminal operations, is conveniently located so that mariners unfamiliar with the terminal can easily locate it, and is situated so that garbage that has been discharged to it from ships cannot easily reach the water;
d) holds permits or licenses required by environmental and public health laws governing garbage handling.
A reception facility for a ship repair yard is not compelled to meet this requirement if it is capable of completing the transfer of garbage from a ship before the ship departs from the yard.
*Hazardous wastes (including certain solvents, wastewater, and chemical substances) are defined in 40 CFR 261.3 and generally refer to corrosive, toxic, ignitable wastes.

SWAMC MARPOL Report - Page 10 - October 1989
Waste Disposal Requirements cite three ways of dealing with ship-generated garbage. First, if the plastics have been separated for onshore disposal, then the remaining garbage may be
1) incinerated on board the ship; 2) discharged in accordance with the minimwn
distances in Regulation 3 of Annex V; or 3) retained on board for disposal ashore.
Second, if the plastic is mixed with other types of garbage, then
1) the mixed garbage may be incinerated on board the ship or,
2) the mixed garbage must be retained on board for disposal or resource recovery ashore.
The disposal of incinerator ashes and "clinkers" within three nautical miles of shore is prohibited. Clinkers made of plastic may NOT be discharged at sea, ever.
Finally, if APHIS-regulated wastes are to be disposed of at a port or terminal in the U.S., then the master or person in charge must notify the port or terminal at least 24 hours before entering the port, giving the name of the ship and the estimated volume of garbage requiring disposal at an approved APHIS facility.
For further discussion of the various disposal options for plastics, as well as regular "garbage," see later sections of this report. Plastics, including garbage mixed with plastics, can never be disposed of at sea, they must be brought to shore for ultimate disposal. Any regular garbage mixed with any amount of plastics must be treated as plastics for disposal at sea. For example, any incinerator ash containing unburned plastic must come ashore for shoreside disposal. Ports or terminals receiving such wastes must comply with solid waste disposal requirements of the Resource Conservation and Recovery Act and state requirements on landfilling. Both these subjects will be discussed in later sections.

SWAMC MARPOL Report - Page 11 - October 1989
APHIS Waste Requirements Ports and terminals that receive foreign ships must arrange for APHIS waste handling and disposal facilities. Ports and terminals must be able to receive APHIS "quarantined" garbage within 24 hours of notice of such incoming garbage.
APHIS wastes include meat, dairy, and produce garbage originating from foreign ports outside the U.S. and Canada. Approved facilities usually involve incinerators or sterilizers. APHIS must approve a written agreement specifying handling and disposal details. Ports or terminals receiving more than 25 port arrivals per year by ships whose last port of call was outside the Continental U.S. or Canada will have to show on Form C (Certificate of Adequacy form) the name of the APHIS approved contractor.
Exempt from providing APHIS reception facilities are ports and terminals that do not receive any foreign ships.
One particular development within the Animal and Plant Health Inspection Service has added flexibility for those handling APHIS wastes. Regarding barging or shipping APHIS wastes in the Aleutian chain or Bristol Bay areas, APHIS advised that it probably acceptable to transfer wastes to a disposal facility, assuming the use of a covered, leakproof barge or ship. To gain approval, each step involved in the transfer of waste, from the offloading vessel to the final facility, would have to be specified. Each step in the transfer process system would be subject to periodic compliance inspections at APHIS' discretion.
Generally, waivers from the APHIS requirements or any other requirements may be requested by anyone who feels that a requirement of the regulations is "impractical or unreasonable." Those seeking waivers must indicate an alternative providing at least equivalent compliance with MARPOL 73/78 Annex v.
APHIS Waste Disposal include three possible methods:
1) incineration to ash; 2) sterilization in an autoclave such that the internal
temperature maintains at least a constant 212 degrees F for 1/2 hour, then landfilled; and
3) grinding for disposal into an approved sewer system.

SWAMC MARPOL Report - Page 12 - October 1989
Certificates of Adequacy
What is a COA?
A Certificate of Adequacy is a document issued by the Coast Guard which states that a port or terminal meets the requirements of the Coast Guard regulations with respect to reception facilities. Although all ports and terminals must provide waste reception facilities, not all of them are required to have COA's.
Who needs a COA?
Ports and terminals are required to have COA's if
1)
2)
3)
they receive oceangoing ships of 400 gross tons or more, or tankers carrying residues and mixtures containing oil; they receive oceangoing ships carrying Noxious Liquid Substances; there are commercial fishing facilities which receive more than 500.000 pounds per year of commercial fishery products.
Dutch Harbor and other fishing ports in the Aleutians and the Bristol Bay areas will easily meet the 500,000 pound benchmark, and therefore, will require COA's.
Obtaining a COA
The applicant for a COA required under Annex V is the person in charge of the port or terminal (see definition in 4.2). In essence, the Coast Guard expects that the person responsible for the day to day operation of the port or terminal is the proper applicant for a COA.
Applicants must apply to the Captain of the Port (COTP) of the zone in which the port or terminal is located. For western Alaska, file applications with
Commanding Officer USCG Marine Safety Off ice 701 C Street Box 17 Anchorage, Alaska 99513
There will be nQ extensions given for applications for COA's. However, if a port or terminal believes that the COA requirement is "impractical or unreasonable", it may file a request for a waiver with the Captain of the Port (under 33 CFR 158.150).

SWAMC MARPOL Report - Page 13 - October 1989
4.4 Coast Guard Enforcement The United States is the first signatory to Annex V to have a comprehensive enforcement plan for implementation.
The Coast Guard has identified 23 people -- 4 lieutenants and 19 petty officers -- for nationwide enforcement of MARPOL rules. These people are not solely detailed to MARPOL enforcement, since their duties entail other assigned duties. While the Coast Guard intends to request more funding for MARPOL enforcement in the future, there will be a practical limitation on enforcement under the new rules.
The initial enforcement tools to be used by the Coast Guard include on the spot corrections, letters of warning from the Captain of the Port, and the assessment of civil penalties of up to $25,000 per violation. Further, the Captain of the Port has the option of denying entry by ships to ports that do not have adequate reception facilities or Certificates of Adequacy (COA's). For gross or willful violations, the Coast Guard can seek the criminal prosecution of violators, including fines of up to $50,000, and imprisonment.
At first, the Coast Guard will seek cooperation and voluntary compliance, affording ports, terminals, or vessels the opportunity to correct any minor deficiencies promptly before seeking penalties. On the other hand, the environmental community considers plastics pollution a major priority. One would expect the Coast Guard to consider the "good faith" efforts made by operators in applying for COA's, providing reception facilities, and so forth.
The MARPOL Act provides for a bounty system whereby individuals reporting violations would receive half of any fines obtained. The record has shown concern that such a system could result in substantial abuse. The Coast Guard has not yet proposed rules to implement a bounty system.

SWAMC MARPOL Report - Page 14 - October 1989
4.5 Foreign Vessel Enforcement under Annex V allows the U.S. to take action against any foreign ship within 200 miles of our EEZ. If a foreign vessel is registered to a non-signatory nation to Annex V and the Coast Guard has determined that the vessel has violated MARPOL regulations, the vessel will be treated the same as a U.S.-flagged vessel.
If a foreign vessel is registered to a signatory nation to Annex V, the Coast Guard will notify the "flag state" of the violation by letter through the State Department. The flag state is expected to proceed with proper enforcement. While the U.S. does not share any fines received by the flag state, the U.S. is entitled to a report on enforcement action taken by the flag state.

SWAMC MARPOL Report - Page 15 - October 1989
5.0 TYPE AND AMOUNT OF SOLID WASTE
Alaskan coastal fishing communities and Alaskan fishing vessels produce different types and amounts of solid waste from that normally encountered. This section provides a background in typical solid waste patterns and then compares the Alaskan situation to the norm.
5.1 Types of Solid Waste according to a standard set of Alaskan communities studied in described by these categories. names will be used to ref er to
have been characterized categories. Waste from most this report seems to be well In this report,the following
these types of solid waste.
Type
0
1
2
3
4
Table 5-1 SOLID WASTE TYPES AND PROPERTIES
Name --------Trash
Rubbish
Refuse
Garbage
Animal [Seafood]
Main Components Density (Sources) lbs/cuft ----------------- -----Paper, cardboard, 8-10
wood, plastic (Business and Commercial)
Metal and lumber 8-10 debris, rags, scraps, sweepings
(Industrial or Construction)
Food waste, paper, 15-25 plastic
(Residential: 50% trash, 50% garbage)
Food waste, 30-35 packing materials
(Restaurant, Hotel)
Carcasses, organs, 45-55 tissue wastes
(Food processing)
Heat Moisture Btu/lb Content ------ -----
8500 10%
6500 25%
4300 50%
2500 70%
1000 85%
-----------------------------------------------------------This system, developed as "Incinerator Standards"
by the Incinerator Institute of America in 1968, has been used by the City of Petersburg in their solid waste feasibility report [Ref S] and well describes waste from the City of Juneau [Ref 6].

SWAMC MARPOL Report - Page 16 - October 1989
In the fisheries context of this report, "trash" describes a large fraction of the packing waste and dunnage from seafood processing plants and factory trawlers. "Rubbish" includes the waste from construction activities associated with port development. "Animal" waste also characterizes discarded seafood waste.
The composition of typical American municipal waste has been summarized below. [Ref 7]
Table 5-2 MUNICIPAL WASTE COMPOSITION
Type of Waste Percent by Volume ------------------- -------------Trash 40%
Paper 31% Wood 4% Plastic 5%
Garbage (Food Wastes) 35% Rubbish 23%
Recyclable (Aluminum) 2% Non-Recyclable Metal 7% Glass 9% Rags, Rubber, Leather 5%
Other 2%
5.2 Volume of Municipal Wastes for Alaskan communities seems to range within or above normal limits for residential type refuse. "Normal limits" for the average American runs just over five pounds per capita per day. [Ref 7] For purposes of this report, 5.0 lb/capday will be used as the "Population Equivalent" for solid waste generation.
Normal seasonal changes in the average American's solid waste generation rates seem to hold less in common for Alaskan communities. Typical seasonal waste generation patterns seem to bottom out in February at 20 percent below the yearly average and peak from May to July at 15 percent above the yearly average. [Ref 8]
On a yearly average, Juneau's solid waste generation rates turn out typical in volume, at 5 lb/capday, but with a higher than average trash component of waste paper contributed by government offices. [Ref 6]
Petersburg's waste generation practices were studied in detail with a six month study [Ref 5] involving regular weighing of garbage trucks and periodic sorting of waste by type. In 1988, Petersburg residents discarded more than 6.6 lb/capday, 32 percent above the national average. The bottom month of the study period -- December fell 30 percent below the average month. The peak month -- July --

SWAMC MARPOL Report - Page 17 - October 1989
produced 30 percent above the average. During October, an average month, the waste was sorted by hand and classified into standard types, tabulated as follows.
Table 5-3 PETERSBURG WASTE TYPES
Type Name Composition --------- -------
0 Trash 15% 1 Rubbish 33% 2 Refuse 45% 3 Garbage 7%
The resulting mix was calculated to have a heat value of about 5500 Btu per pound and density of 12 to 16 pounds per cubic foot.
5.3 Typical Vessel Waste production rates have been estimated in the literature. Unfortunately, such rates tend to take on units of measure not easily useful for those who have to provide dumpsters and haul the waste away. In the following table, we start with waste generation rates provided from Coast Guard sources [Ref 10], make some assumptions about the character of the waste, and convert the generation rates to volumetric units.
Table 5-4 VESSEL WASTE GENERATION RATES
Rate Assumed Volume Vessel Type (kg/ Garbage Density Generated
capday) Type (lb/cuft) (cuyds/capday) ------------- -------- ----- ----------Harbor Vessel 1. 0 Refuse 15 0.005 Coastal Vessel 1.5 Refuse 15 0.008
A harbor vessel does not leave the vicinity of the port. A coastal vessel usually travels in MARPOL restricted waters.
For example, if a tour ship with crew and passengers of 1000 has been in coastal waters for three days and in compliance with MARPOL, the waste generated would be
(1000 persons)x(3 days)x(0.008 cuyds/capday)= 24 cubic yards
For cargo associated waste, other waste generation factors have been calculated as follows, again converted from metric weights (kg) given in Ref 10 to English volumes (cubic yards), assuming the waste is dunnage-like trash with a density of ten pounds per cubic foot.

SWAMC MARPOL Report - Page 18 - October 1989
Table 5-5
Type of Cargo
Break Bulk Dry Bulk Containerized
CARGO ASSOCIATED WASTES
Cubic Yards of Waste per Ten Thousand Tons of Cargo
600.0 7.5 3.0
In this table, cargo tons means standard tons (2000 lbs), not metric tons (2200 lbs).
5.4 Fishing Vessel Wastes have been characterized in this study. Questionnaires were sent to fishing groups asking for information about the volume and type of wastes generated during fishing. A copy of the questionnaire and summaries of the results can be found in Appendices E and F.
Estimates of solid waste generated in Western Alaska have been tabulated for both various salmon gear groups and herring roe fisheries.
Kodiak fishing generation wastes had been researched in the Pacific Associates report (Ref 4] as a result of the Fishermen's Wives Club survey. Week long trips with a crew of three to four would produce one to two 30-gallon bags of waste. Assuming that waste had the same character as normal household refuse, that is a density of about 15 lbs/cuft, the waste generation rates range from 1.9 to 3.8 lb/capday, with the mid range value of 2.8 lb/capday. These Kodiak rates conform with typical generation rates noted in the record of the MARPOL rule making process.
From the questionnaire survey conducted during this study, six crabbers provided estimates of waste generation. The crew ranged from five to six, days out from five to eleven, and the per capita generation rates ranged from 2.1 to 6.0 lbs/day, with an average of 4.0 lb/capday.
Questionnaire responses also provided information about the composition of typical fishing vessel wastes. From 17 crabbers delivering to Akutan and Unalaska, the following table summarizes the waste types.

SWAMC MARPOL Report - Page 19 - October 1989
Table 5-6 FISHING VESSEL WASTE COMPOSITION
Type of Waste Percent by Volume
Trash 33% Packing Materials Plastic
Garbage (Food Wastes) 38% Rubbish 29%
Recyclable (Aluminum) Non-Recyclable Metal,
Glass
17% 16%
16% 13%
5.5 Factory Trawlers present a different picture for type and volume of waste. Factory trawler wastes can contain a large amount of waste cardboard and packing materials from the on-board processing and packaging of seafoods. Factory trawlers range far from shore, often greater than the 25 mile limits for overboard disposal of dunnage, packing material, and floating fiber. Many trawlers have practiced overboard disposal of these wastes and may continue to do so legally. On the other hand, several factory trawlers have made a practice of bringing in all their waste regardless of MARPOL or 25 mile limits.
Another practice will affect the on-shore impact of MARPOL waste. Many factory trawlers -- about 25 percent of those contacted in our late 1988 survey -- have installed on-board incinerators for disposal of garbage and smaller trash. Another 25 percent indicated they'd be installing incinerators within a year. Most new factory trawlers will be installing incinerators. Incinerators reduce waste to 20 to 30 percent of their original volume. Plastic-free incinerator ashes may be thrown overboard outside the three mile limit.
Questionnaire results ranged in value and some information appears doubtful. Some responses may have excluded packing materials from galley wastes. Other responses were clearly horseback estimates. Nevertheless, waste generation estimates ranged from 1 to 16 lb/capday.

SWAMC MARPOL Report - Page 20 - October 1989
Questionnaire responses from factory trawlers also indicated a high portion of packing materials in their waste. The average of 14 responses showed the following composition of waste.
Table 5-7 FACTORY TRAWLER WASTE COMPOSITION
Type of Waste
Trash Packing Materials Plastic
Garbage (Food Wastes) Rubbish
Recyclable Non-Recyclable
Percent by Volume
59%
17% 24%
43% 16%
10% 14%
This relative composition of wastes appeared to be similar to the waste survey responses from two mothership/processors, except that the motherships produce slightly less food waste.
Information from the Unalaska/Dutch Harbor Port Director [Ref 11] and from the local garbage hauling contractor, Williwaw Sanitation [Ref 12], yields a reliable factor for those factory trawlers who will be returning all their uncompacted waste. Several factory trawlers are known for their practice of returning all their waste to dockside. These vessels carry crews of 80 to 100 for trips of 15 to 21 days. Observation confirms this waste consists of mostly trash (cardboard and fiber) and some garbage. Assuming a density of 12.S pounds per cubic foot, the factory trawler waste generation rates range from 8 to 21 pounds per person per day, with a likely median value of 13 lb/capday. If the density drops to 10 lb/cuft, the waste generation rate reduces to about 11 lb/capday.
Thus the factory trawler per capita waste generation rates appear to exceed normal vessel rates by three to four fold, the excess being attributable to high Btu value packing wastes.

SWAMC MARPOL Report - Page 21 - October 1989
5.6 SUMMARY
A partial summary of the types, volumes, and composition of solid wastes has been presented in the two following charts. To characterize the "Alaskan Coastal Resident," the Petersburg study has been selected because of its detail of information and similarity to the other coastal fishing communities under study.
T8ble 8-8 SOLID WASTE GENERATION US Average va AlukM
12 ·-------·······---····---·----·--···-.. ----·--·· .. -·-.. ·-·-··-----·--·----·-.. -··· 12
10 -··--····-·-.. --···-----------·-··----·-----·-·--·-·-·-·· .. ··----
8 ·-··---········-··----·- ·····--·· .. -· .. ·--··· ........ -----···-·--··-·--·-····-·-
6 ·--··-··-·---···-··-········ -··-···-·······-·-.. ·-----··----·--·--·---
0 US Average AK Cout Rea Ave Boater AK Crabber
SOURCE OF WASTE
TM!le 6-9 SOLID WASTE COMPOSITION US Averege va AlukM
US Average AK Coast Rea AK Crabber SOURCE OF WASTE
• 0 Truh ml 1 IMlblah • 2 RefuM
AK Trawler
10
8
0
100
90
80
70
80
60
30
20
10
0
Here again, trash means cardboard construction debris. other paper wastes.
in the Alaskan fisheries context, and packing material. Rubbish means Refuse includes food wastes and some

SWAMC MARPOL Report - Page 22 - October 1989
6.0 DISPOSAL OPTIONS: LANDFILLS
The most common disposal method for municipal solid waste is the sanitary landfill. Until recently, most regulatory efforts have been directed at upgrading open dumps into sanitary landfills. Open dumps often smolder, emitting odors and smoke, and attract rats and birds.
Landfills serve as ultimate disposal for more than simple garbage. Garbage that has been compacted and bound in the "baling" process, to be discussed in detail later in this section, is stacked and eventually covered in a landfill. Incinerator ash is often landfilled as well. Recycling operations also generate a fraction of unusable waste, which is generally landfilled.
Landfills will be discussed in terms of Southwestern Alaskan climate and terrain conditions and of MARPOL and fishing-related solid waste generation.
Specific problems for solid waste collection and disposal in coastal Alaskan communities include--
** lack of cheap gravel or other fill material to cover garbage, bales, or incinerator ash at landfills;
** lack of flat land for recycling or disposal operations, the best flat land being reserved for airports, which, because of hazards to aircraft from gulls attracted to garbage, conflicts with solid waste disposal uses;
** constant high winds which blow garbage away as fast as it's dumped or deposited;
** high rainfall which necessitates covered, leakproof collection and storage facilities and makes for high leachate potential for garbage and ash; and
** high water table, which restricts the depth of excavation and makes landfills spread out more quickly.
These conditions affect garbage receptacle and dumpster design, transfer stations, temporary storage facilities, landfill operations, and other types of recycling and disposal operations.
The following limitations on landfill disposal options have been extracted from regulations of the Alaska Department of Environmental Conservation, "DEC."

SWAMC MARPOL Report - Page 23 - October 1989
6.1 General Operating Requirements affect all landfill disposal options. These limitations have been in effect for some years and disposal facilities have had intermittent success in attaining compliance.
Accumulation and Storage Individual owners of solid waste facilities must store wastes in a safe manner that prevents litter violations until those wastes can be disposed of. [Ref 17] This will require port operators to keep dumpsters on docks. Individuals subject to this requirement who have made contractual arrangements for the removal of accumulated solid waste are not relieved of the responsibility for that removal. [Ref 17]
Transport Individuals transporting solid waste must do so in a manner that keeps the waste contained during its transport. This means that solid waste transporters must have nets or covers for trash on trucks. Furthermore, persons spilling solid waste during transport must promptly pick up the waste and clean the affected area. [Ref 17]
Solid Waste Disposal Facility The owners or operators of a solid waste facility must ensure that surface water from outside the facility does not come into contact with any covered or uncovered solid waste. Likewise, they must ensure that solid waste is not placed in surface water. Further, they must see that waste, leachate, or eroded soil from the facility does not cause a violation of water quality standards. [Ref 19] For example, culverts and trenches may be necessary to divert streams around landfills.
Owners or operators of solid waste facilities must protect against disease vectors (that is, rats, flies, and perhaps certain birds), requiring action be taken to prevent rodent infestation -- a problem that has plagued landfills in the past.
High winds, a consistent problem in Southwest Alaska, will necessitate control measures such as fencing to contain windblown litter. Litter must be kept within the facility and clear of access roads. [Ref 17)
Permit Applications Article 2, Section 200-210 of the solid waste regulations [Ref 17] mandate the requirements for solid waste facility permits and applications. A solid waste facility application may cost between $10,000 and $25,000. Unfortunately, the permit process is not only expensive, but often also time consuming, and with specific requirements.
Other State regulations require the owner or operator of a landfill to ensure that the working face of a

SWAMC MARPOL Report - Page 24 - October 1989
landfill is kept as small as is practical to reduce the potential for windblown litter and for the attraction of birds and animals. Solid waste must be compacted in twofoot increments, and be compacted before applying operational or final cover. Operational cover must also be applied to the compacted solid waste in accordance with a schedule set out according to population served. For landfills serving more than a population equivalent to a city of 2000, operational cover must be applied on a daily basis. [Ref 17]
If solid waste will not be deposited in a partly filled active portion of the facility within 30 days, then operational cover must be applied. This has presented problems for Dutch Harbor, as very little gravel is available in Southwest Alaska.
The state has the discretion to increase the cover frequency as permit stipulations for site specific conditions, such as rats or flies, nuisance bears, windblown litter, and so forth. [Ref 17]
Article 3, Section 310 [Ref 17] specifies monitoring reguirements for landfill operators and sets out sample wells and required analyses. These monitoring requirements may be seen as extraordinary, but the costs are minimal compared to the cost of cleanup if wells would ever indicate hazardous waste contamination.
Article 4, Section 410 [Ref 17] sets out requirements for the closure of solid waste landfills. We should be aware that the closure of a landfill, which may take place soon in Unalaska/Dutch Harbor, is an expensive, lengthy procedure. A number of specific provisions may be required, depending on the location, such as diverting streams, preventing rainfall from percolating through the landfill, and continued testing for five years -- with liability for cleanup if testing shows violations.
Permits for Wastewater Discharges to waters or lands, including leachate from landfills, must be issued or certified by DEC. Certain exceptions exist for small discharges of household sewage.
Discharge to Sewers advises landfill operators that if collected leachate is dumped into a city sewer and the city sewer treatment plant is overloaded, a landfill operator may have to treat his leachate before it enters the sewer.
Minimum Treatment sets end-of-pipe standards for dischargers of liquid wastes to surf ace waters or the surface of the land. Such liquid wastes include leachate from landfills. Leachate is often stronger than untreated

SW.AMC MARPOL Report - Page 25 - October 1989
sewage. If leachate is collected by underdrains beneath a landfill or naturally drains to a point, it must be treated to meet secondary treatment standards -- the same standards as for sewage -- before entering a stream (18 AAC 72.029).
Sludge Disposal requires a DEC waste permit in order to have sludge disposed of at a site.
System Plan Review requires that leachate collection and treatment be designed by professional engineers and be approved by DEC before construction.
6.2 Baler/Landfills have several advantages over landfills receiving uncompacted garbage. The solid waste is compacted, according to manufacturer, to about a 4-to-1 ratio and tied with strapping tape. Post-compacter handling costs are reduced. Cover material is only required once a week or so. Bales can be stacked neatly with no windblown litter problem. Rats and birds cannot easily invade the bales.
On the other hand, the leachate potential remains about the same, except that rainfall and surface water diversions are easier to manage because the entire fill area has been reduced by the volume of compaction. So while the potential for leachate extraction (in pounds of dissolved contaminants) remains the same, the volume of leachate generation (in gallons of flow-through) will be reduced.
Another limitation of balers is their inability to handle odd items of fisheries related waste because of shape and strength, and to handle discarded fishing nets. The compaction ratio is either not up to specifications or the baler becomes entangled.
6.3 New Landfill Operating Requirements will be forthcoming as a result of changes to RCRA, the Resource Conservation and Recovery Act, increasing regulatory pressure to upgrade operations and maintenance at existing sites. New landfills will face almost impossible odds to survive the new selection criteria for siting. [Ref 18]
Location Criteria, in the form of proposed federal rules, will make it difficult or impossible to build new solid waste disposal facilities if they are to be located
** within 10,000 feet of a jet airport; ** within 5,000 feet of a piston-aircraft
airport; ** in wetlands; ** near landslide or avalanche areas; ** in fault areas; and ** in seismic impact zones.

SWAMC MARPOL Report - Page 26 - October 1989
New Operational Restrictions would also impose tough operational and maintenance requirements for landfills, such as --
** cover with fill material EACH operating day; ** effective measures to eliminate rats and
birds; ** means to control explosive gases; ** dikes, trenches, etc. to divert water around a
landfill; ** liners and sewers to collect drainage under
neath the landfill and ** treatment of collected underground drainage; ** financial assurance to close the landfill when
its useful life ends and to correct any problems that might arise after closure;
** training for operators to recognize and turn away people who would be disposing of hazardous wastes;
** monitoring wells around landfills to sample for hazardous wastes; and
** capability to remove and clean up hazardous wastes if recognized or detected.
Sanitary landfills are not suitable for APHIS-regulated foreign garbage disposal without additional treatment, such as sterilization or incineration.

SWAMC MARPOL Report - Page 27 - October 1989
7.0 INCINERATION
Incineration reduces the volume of waste to be disposed of by 80% to 90% and eliminates the nuisance factor in garbage. Rats and birds are not attracted to incinerator ash. Much of the organic leachate potential is reduced, although some metals might enter into solution as rainfall passes through an incinerator ash landfill.
7.1 On-Shore Incineration appears well-suited for solid waste containing large portions of wood, fiber, and easily burned packing material. Such wastes add to the Btu content without increasing the potential for ash disposal problems. Energy recovery could be attractive with waste generation peaks coinciding with power demand peaks, as would be the case with fishing waste production and fish processing energy needs. Also to be considered in remote areas of Alaska are the high costs of energy, both in heating oil for residences and in diesel-electric power generation.
Disadvantages for incineration deal with the uncertainties of future federal law in air emissions from incinerators and in ash disposal from incinerators. If ash disposal at landfills is prohibited part or all of the time, then costs for ash stabilization would be added. Ash easily forms into concrete products which, due to the lack of building materials in some remote sites, could have recoverable value. Ash-concrete blocks for protection from wave erosion comes to mind, considering needs in coastal communities to protect roads, harbors, and airports.
Another important factor in energy recovery for steam and hot water systems is being able to locate an incinerator within a few hundred feet of the energy customers. Thus, if seafood processors were to be the energy customers, there would be little land use or zoning conflicts for an incinerator facility to be located nearby.
For ash disposal from incineration, the law makes a distinction between ash originating from ship-board wastes and ash from shore-side wastes. MARPOL allows plastic-free ash disposal from ships if the correct distance off shore is maintained. However, ocean dumping of shorebase-generated ash would require an EPA permit, which would be nearly impossible to obtain.
7.2 Shipboard Incineration has several obvious advantages over shore-side incineration. First, the costs of disposal are more directly borne by the generator. A small incinerator will cost be.tween $10,000 and $20,000, not counting installation. Ash disposal overboard, if plastic-

SWAMC MARPOL Report - Page 28 - October 1989
free, is allowed, if far enough offshore. And air pollution permit and emission control requirements outside the threemile limit are nonexistent.
The main disadvantage is deck space limitations which restrict incinerator use to larger vessels. Smaller incinerators do not enhance the shore-side communities' position for energy recovery. To the coastal communities, the disadvantage to ship-board incinerators is that they only dispose of part of the total waste in the region, while taking some of the high volume waste generators out of participating in a comprehensive solution.
7.3 Plastics incineration produces a relatively high Btu output, about quadruple that of normal municipal solid waste on a pound-for-pound basis. HOPE releases about 20,000 Btu/lb, nearly the same as a pound of diesel fuel. But, according to the Plastics Institute of America, the replacement of HOPE would require nearly 60,000 Btu/lb to form the plastic from its chemical raw products. Further, even efficient incineration of plastics will form hydrogen chloride gas, an aggressive, corrosive acid and toxic air pollutant. [Ref 24] Inefficient, that is low temperature, combustion of plastics will form more pollutants as unburned, reactive hydrocarbons.
7.4 Restrictions on incineration focus on the air emissions and ash disposal.
Air Quality Control considerations play a role in incinerator design and operation. Existing state of the art control technology, electrostatic precipitators or baghouse filters, remove 99+ percent of the dust in the exhaust, but some of the trace organics resist breakdown by burning and may remain in troublesome concentrations. Addition of dry lime scrubbers to existing technologies is being tested and may remove the trace organics.
Until recently, visible emissions have been the basis for regulatory control of incinerators. Even low levels of smoke emissions indicate poor combustion at low temperatures, an indicator of poor overall performance. Water vapors complicate smoke level readings but trained observers can distinguish the difference. Visible emissions levels are measured in opacity, measured in percent. According to DEC regulations, emissions from solid waste incinerators cannot exceed 20 percent opacity for more than three minutes in any hour.
Other emission standards for incinerators or fuel burning equipment using solid waste are based upon the dust concentrations per cubic foot of exhaust gas, adjusted to standard temperatures and other conditions. These

SWAMC MARPOL Report - Page 29 - October 1989
standards are based upon type and capacity of the burner and what is being burned. Measurement of dust concentrations is a complex, costly endeavor.
Permits are required by the state DEC for incinerators burning more than 1000 pounds per hour, which for a 24 hour day, equates to the garbage of a city of 4,800. Even though incinerators with less than 1000 lb/hr rating do not require permits, they must meet the emission standards and fall under other air quality limits for pollutant levels in the atmosphere. [Ref 20]
7.5 New Federal rules may restrict incinerator applications. EPA is in the process of reviewing the need for setting separate, more precise standards for incineration and incinerator ash disposal. That review encompasses the concept that some ashes may be able to be disposed of as solid waste, and some ash may have to be handled as hazardous waste. The results of that EPA initial review (and Congressional consideration) could mean that incinerator ash would require special treatment beyond disposal in approved landfills, again leading to substantial and costly design and construction factors.
The ability of states and communities to meet air emissions standards is under review in the reauthorizaton of the Clean Air Act pending in Congress, with specific focus on toxic air emissions. Depending on which wastes our coastal communities may wish to consider incinerating, toxic standards may apply.

SWAMC MARPOL Report - Page 30 - October 1989
e.o RECYCLING AND ENERGY RECOVERY
Recycling does not solve the ultimate disposal problems nor does recycling take care of all constituents of solid waste, but recycling is necessary as part of the picture. Recycling reduces the volume of waste to be disposed of and makes the disposal process easier and safer. Recycling can remove the paper, metals, and plastics that make incinerator emissions and ash toxic, and that make landfill leachate toxic.
This section sets out some background information, then discusses in detail plastics recycling, energy from garbage, and pelletizing.
Recycling can take two approaches. Each has its limitations and advantages.
First, wastes can be segregated at the source. Thus several collection systems would be in place, one for aluminum cans, one for ferrous metals, one for plastics, one for glass. Quite a bit of management control and attention is necessary to keep wastes segregated. Public education programs play a big part in this. The advantage is cheaper costs for the recycler. The disadvantage is reliance on consumers to do a good job in segregating.
Second, combined wastes may be mechanically separated at a processing plant. Typically, wastes are shredded and separated by air or water schemes. Such systems are more complex. Several of these systems will be described later in more detail.
Recycling and energy recovery involves 10 percent of the 320,000,000,000 pounds of solid waste -- both industrial and municipal -- produced in the United States each year.
One outgrowth of the need to deal with vessel wastes through incineration is resource recovery/reuse of the waste material. Federal and state law do not currently require resource recovery, although there is obviously substantial interest in waste reduction and its impact on need for additional landfill sites and conversion capacity. The valuable metals contained in the ash, and the sand to gravel consistency of the non-metallic fraction lend themselves to potential economic benefits.
Magnets, screens, and other mechanical products may be used to recove~ ferrous and non-ferrous metal. Techniques for recovery of the larger metallic components, those over one inch, are well developed. Metals are not recovered currently on an industry-wide scale in the U.S. because of

SWAMC MARPOL Report - Page 31 - October 1989
depressed scrap metal markets. Certain metals such as gold, copper, and silver could only be recovered through chemical processes.
The major component of ash is the inert, non-metallic fraction. Because its properties are similar to those of traditional aggregates, ash is commonly used as a substitute for conventional aggregate in Europe. Europeans have also used bottom ash for asphaltic paving material and as road bed and common fill material. Combined bottom and fly ash has been used in concrete. In Portland, ash is now used as an aggregate in concrete.
Municipal solid waste combustion ash has excellent properties for use in concrete by itself. It is pozzolanic, meaning that it forms a weak cement-like substance. The possibility of leaching of toxic metals from cement blocks of ash is still being researched.
8.1 Materials Recycling is preferred to energy recovery by incineration. Many waste products tend to be chemically complex. The chemical energy invested in the refining and manufacture of complex products often exceeds the energy released when incinerating them as wastes. This especially holds with plastics, a less renewable energy source as compared, say, to firewood.
The economics of materials recycling hinges on the market prices for scrap materials. In the last several years, the prices for scrap aluminum and paper have bounced around, well above and well below the break even points for economic recycling operations.
The success of any recycling business depends on a stable scrap price and a steady supply of the right kind of product, meaning well-sorted without contamination by other wastes. Often a small amount of contamination can double the re-processing costs of materials being recycled.
When considering materials recycling, the contamination factor has thermodynamic advantage. The natural forces of the universe favor more disorganization and less purity. With each cycle through the refining process, the physical and chemical properties of materials suffer a loss. To maintain these properties requires a substantial import of external energy. Take paper for an example. If you recycle clean white bond paper, you lose quality such that the recycled product is fit for use as newsprint. If you recycle newsprint, you get cardboard stock. Recycled cardboard comes back as packing material. It's often possible to retard this decay process by blending recycled materials with virgin feedstock. Each refining process takes energy. Eventually, you might incinerate

SW.AMC MARPOL Report - Page 32 - October 1989
some wastes to recover energy. Then you deal with the ash residue.
Metals can generally be easily separated and have high economic value. Iron and steel wastes can be removed by magnet separators. Aluminum and other ·metals can be removed by air or water separation.
Fiber, meaning wood, paper, and cardboard, can be relatively easily separated and recycled.
Plastics recycling has increasing potential, especially in fisheries waste. Generally, plastics make up about 7 percent of America's municipal solid waste. By the year 2000, that portion will increase to 10 percent, amounting to 38 billion pounds nationwide. More than half of that plastic comes from packaging. Less than 1 percent of the municipal waste plastics are now recovered. (Ref 27]
Yet within the plastics industry, recycling of waste plastics is conunonly and economically practiced, from 75 percent to 95 percent. [Ref 23]
Before this will be explained, let's begin with an introduction to the conunon types of plastics, both those used in packaging and in fishing. With each plastic, an abbreviation will be identified and then used throughout the rest of the section.

SWAMC MARPOL Report - Page 33 - October 1989
Table 8-1 TYPES AND USES OF PLASTICS
High-Density Polyethylene HOPE
Common Uses: Fishing Uses: Recycling:
Products: Notes:
rigid jugs for milk, soap, water 5-gal buckets, motor oil jugs, totes second most common type of recycled plastic, moderate loss of strength with re-processing drain pipe, drums, pails, toys, lumber, polyethylenes (including the type that follows) are the most widely used of all plastics
Low-Density Polyethylene LOPE
Common Uses: trash bags, ziplock bags, visqueen sheets six-pack yokes
Fishing Uses: bait wrapping, PE yarns form trawl nets, liners for fish boxes, vacuum packaging
Recycling: can be mixed with HOPE without problems
Polyethylene Terephthalate PET
Common Uses:
Fishing Uses: Recycling :
Products:
Notes:
Polystyrene
Common Uses:
Fishing Uses: Recycling :
heavy duty rigid containers, carbonated water, sodas, beer strapping tapes, buckets most commonly recycled plastic, up to 20% of waste PET bottles recycled, about 150 million pounds per year; colored PET lowers recycling value; maintains excellent strength, other physical properties upon re-processing fiberfill insulation, polyurethane insulation and boat hulls reinforced bases, aluminum caps increase recycling processing costs
PS
Type 1) rigid: cups, trays, forks Type 2) foam: coffee cups, foam trays floats for gillnets, bait trays Type 1) rigid: slight to moderate
degradation upon re-processing Type 2) foam: much degradation of physical
properties, strength
Polyvinyl Chloride PVC
Common Uses: Fishing Uses: Notes:
plumbing pipes process water piping for seafood plants very tough plastic

SWAMC MARPOL Report - Page 34 - October 1989
Polypropylene pp
Common Uses: disposable diaper lining, Fishing Uses: floating lines and ropes, battery cases,
PP yarns form trawl nets, strapping tape moderate degradation of physical properties upon re-processing
Recycling :
Nylon Nylon
Common Uses: fabric Fishing Uses:
Recycling:
Notes:
gillnets, anchor lines, sinking ropes, some trawl nets, crab pot netting,. monof ilament line can not be simply remelted as preceding plastics, must be chemically broken down and reformed into polymers commonly used fishing line involves two plastics, a nylon sheath and a PET core
[Ref 24, 25, 26, 28]
Each of these types of plastics have different melting points and other physical properties as well as different chemical bonding properties.
By themselves, any type of the above plastics can be easily and cheaply recycled. They can NOT be easily recycled if
** two or more plastic types are mixed together; or
** a plastic type is contaminated with other wastes.
To reprocess contaminated plastics such as HOPE or PET, they must go through several steps, generally described as follows:
a) grinding or shredding the waste into granules; b) compressed air separating the light contaminants; c) sink/float separating the heavy contaminants (such
as aluminum from caps) which also washes labels and dissolves adhesives;
d) drying; e) secondary shredding; f) extrusion, that is, melting into plastic pellets,
ready for molding i nto plastic products. [Ref 25]
Contamination causes the costs of recycling to skyrocket. In the case of PET containers, to remove the one

SWAMC MARPOL Report - Page 35 - October 1989
percent by weight of the aluminum caps involves about a third of the total recycling costs. [Ref 23]
To reprocess mixed plastics, they follow the above pattern except for additional separation steps. For example, to recycle nylon/PET fishing ropes, the additional steps involve dissolving the PET in napthalene. Nylon remains undissolved and can be filtered out. The separated plastics can be further purified. (Ref 26]
Thus we have the explanation for why so few waste plastics have been recycled from municipal garbage. The problem is one of collection and sorting. According to Dennis Sabourin, Vice President of Wellman, Inc, the nation's largest user of recycled plastic, "There just isn't a collection infrastructure in place or a sorting infrastructure in place to generate the plastic." (Ref 27]
Mixed or "commingled" plastic wastes have been reprocessed in recently developed commercial extrusion equipment specially designed for mixed types of plastics and those contaminated with up to 15 percent non-plastic wastes. Products include synthetic lumber for high thickness, low stress applications. Planking for marina docks resists marine boring worms. Posts for horse stalls and slats for pig styes resist chewing. Inlays on floors can be easily cleaned up. Parking lot bumpers can take a beating and be replaced. [Ref 24] However, with ordinary lumber so plentiful in the United States, the plastic lumber has stiff competition for most applications.
Recyclina of fishing nets has its pluses and minuses. Nets are designed to withstand great stresses and constructed with strength in mind. Thus, on the minus side, the plastics re-processing steps involve grinding and shredding with extra heavy duty equipment. Nylon nets are commonly recycled by Japanese gillnetters. [Ref 29] Trawl nets are likewise recycled in Japan, the process technology being simpler.
Economics of plastics recycling also takes the quality of recycled plastics into account. Likewise, the price of raw products for plastics, such as ethylene, varies with time and affects recycling. Raw ethylene has climbed from $0.30 a pound in 1985 to $0.40 a pound in 1989. [Ref 27] Since the cost of recycling HPDE milk jugs runs about $0.25 per pound, the profit margin has at least tripled.
Recycled PET (with less than 100 ppm aluminum) sells for about $0.25 to $0.35 per pound. Virgin PET costs about twice tha~ much. The capital costs of the reprocessing plant would run up to $2.5 million to handle 20 million pounds of PET yearly. At that rate, the plant could pay for itself in three to five years. [Ref 23]

SWAMC MARPOL Report - Page 36 - October 1989
Costs of re-processing quoted above do not include costs of collection. PET collection costs for emptying bins and baling bottles have ranged about $0.40 to $0.50 per pound in two English cities. (Ref 28] The State of California estimates that the cost of collecting, baling, and delivering bales to recycling plants to be around $0.36 per pound, or about two to four cents a bottle. (Ref 24]
8.2 Energy Recovery presents an attractive option to Unalaska, where energy values in solid wastes are high and energy costs to heat buildings and supply seafood processing plants are also high.
Energy Costs for various fuel sources were evaluated. The following tabulated costs are all spot or higher prices. Larger or contract purchases would reduce some of these prices by 20 percent or so, but for comparison purposes they're all relatively the same. When possible, coastal Alaskan energy costs were used as a basis:
Table 8-2 ALASKAN ENERGY COSTS
Electricity Propane Wood Coal Oil #2 Solid Waste Waste Pellets
$0.12/kw hr (City of Unalaska) $66 for 22 gal tank (Petromarine) $320/four cords spruce (Fairbanks) $36/ton (Usibelli spot price) $1.04/gallon (Petromarine) $0.008/lb (collection cost, Unalaska) $50/ton (includes collection)
------------------------~-----~---------------------
Usibelli's coal, although relatively low in Btu content when compared to western or eastern coals, has an extremely low sulfur content, meaning it'll burn cleanly with S02 emissions in compliance with air pollution standards. The heat value of Usibelli coal averages about 8,000 Btu/lb, with eastern coal at 13,250 Btu/lb and western coal at 9,000 Btu/lb.
Firewood ranges quite a bit with heat value, but we've used two million Btu/cord for this comparison. For solid waste, we've used 7000 Btu/lb, that estimated for Unalaska waste. For solid waste pellets, we've scaled up from the standard 8,000 Btu/lb, which would be typical for U.S. municipal solid waste. For pellets derived from Unalaska-type waste, it would be reasonable to assume about 10,100 Btu/lb.

SWAMC MARPOL Report - Page 37 - October 1989
The following table also takes into account some efficiencies of conversion of fuel. Electricity was given a high ~5 percent rating, which is reasonable for space heaters,;but does not take into account transmission line losses from the power plant. Propane was rated at 78 percent while oil, coal, and dRDF pellets were rated 70 percent efficient. Wood was given only 50 percent efficiency , which would be reasonable for open fireplaces but a bit low for. air-tight wood stoves of modern design.
With these assumptions and base costs, the following table gives a relative indication of the value of solid waste as a fuel type.
.a Ill
~ .. x. • ..: en 0 u
60
40
30
20
10
0 Refuse Pelleta
Table 10-3 WASTE ENERGY COSTS Solld Wute Refuse and Pelleta
Coal Firewood #2 Oii TYPE OF ENERGY SOURCE
60
40
.a 30
m
ti .. GI a. tit
20 Ii 0 u
10
0 Electric Propane
Of course, these costs do not include the costs of buying and operating the heat conversion equipment, the furnaces, fireplaces, and incinerators. These will be discussed in other sections. But a few thoughts can be inserted here. First, construction of incinerators to burn solid waste can be 50 percent funded through grant programs from the state to a municipality or borough. Also, to burn refuse-derived pellets, only a fireplace is needed. Since pellets are stable and compact, they might also find an energy export market, say Japan or Korea, where energy costs may be higher. Much more about pellets is said in following sections.
8.3 Palletizing aids both material recycling and energy recovery. Pelletizers grind up waste, form it into

SWAMC MARPOL Report - Page 38 - October 1989
brick-size blocks, and dry it. Metal cans and other scraps are easily removed from the incoming waste. Pellets burn well because of reduced moisture and removed uncombustibles.
Sixty to seventy percent of the garbage is paper, plastics and wood. These materials are processed into pellets (dRDF). The finished product is clean burning, low in sulphur content and can be stored for long periods of time. The pellets can be burned in wood or coal furnaces, and are especially well-suited for power plant use because of low emissions.
In some detail, the rest of this subsection describes the operating experience of two palletizing operations in Fairbanks. Both operations have encountered management-related difficulties, but the use of pelletizers still shows promise that needs further testing and evaluation.
Fairbanks, by virtue of its size and location, has only a few similarities to the conununities that will be impacted by Annex V of MARPOL. However, it was chosen for purposes of this report because of its experience with resource recovery of municipal solid waste. Discussion of Fairbanks' solid waste management program will lead to discussion of available resource recovery technology in Alaska.
The Fairbanks baler began operation in 1979 and served as the chief method of solid waste processing at the landfill until October 1987. The Fairbanks baler is a high density baler with a 9-to-1 ratio. Approximate capital costs were $4.5 million in 1977. In the 80's, the Borough received unsolicited proposals for the development and implementation of local resource recovery projects. In response to these overtures, the Borough issued an RFP in 1986, which requested interested parties to submit proposals on any proposed method for processing the Borough's solid waste.
Also in 1986, a test burn was performed at the University of Alaska Fairbanks power plant of a mixture of coal and densified refuse derived fuel (dRDF), more commonly known as pellets. This burn was very successful and resulted in a substantial increase in Btu output over 100 percent coal. No visible increase in emissions was detected, nor did the University experience any operational problems during the test burn. This burn was conducted as a demonstration of the feasibility of burning pellets in Fairbanks area power plants and served as part of the impetus behind the efforts of two private enterprises, Environmental Recycling, Inc (ERI), and Alaska Solid Waste (ASW) to process solid waste into fuel pellets. Both

SWAMC MARPOL Report - Page 39 - October 1989
processes were researched and have been described in the following sections.
Environmental Recycling Inc received the Borough contract in 1987 to process all the garbage being dumped at the landfill, recycle 90 percent of that garbage, and landfill the remainder. This contract also involved ERI's installation of two solid waste densifier lines within the baler building for the purpose of manufacturing fuel pellets from the garbage. These pellets would then be sold to local power plants and burned with the coal for increased Btu production.
Since contract inception, ERI as been working to install and operate pellet manufacturing equipment within the same building that houses the Borough's baler. Unfortunately, ERI has been unable to achieve the required recycling percentage of 90 percent due to a combination of equipment and operational problems. These problems are partially caused by the attempted use of relatively untested densifying equipment. While similar equipment from the same manufacturer is in use in a few other selected areas, the application of this technology to municipal solid waste is relatively new. As a result of being on the leading edge of such technology, ERI has experienced considerable problems. The equipment appears to be undersized for the municipal waste stream, resulting in severe breakage and performance problems. Also, the attempt to fit the two equipment lines into the existing baler building has resulted in additional problems relating to a considerable lack of space for both the dumping and processing of the garbage.
Review of other areas' recycling and palletizing operations appear to indicate that the contractual requirement of 90 percent is probably impossible to achieve, even if the ERI's operational and equipment problems could be overcome. Other areas are also experiencing problems with this manufacturer's equipment. No other area contacted is approaching 90 percent recycling, or expecting to achieve a percentage near that figure.
In 1988 ERI managed to recycle 4.1 percent of the 58,893 tons of solid waste received at the landfill. In addition, only 65.8 percent of the garbage was baled in 1988, while in 1987 86.5 percent was baled. ERI operated the landfill for the last three months of 1987.
Unless efforts achieve a much higher reduction in the volume of solid waste at the landfill, it appears the Borough will need a new landfill facility by 1997. Larry Kelly, General Manager of ERI, cited several problems with recycling. Current technology is too labor intensive. Inexpensive sources of fuel, such as coal, are also mentioned contributing factors in ERI's inability to produce

SWAMC MARPOL Report - Page 40 - October 1989
and market pellets. Mr. Kelly also feels that the public's attitude toward recycling is indifferent.
Alaska Solid Waste also submitted a proposal to the Borough for processing solid waste. Although the Borough did not select the ASW proposal, ASW decided to continue, through private financing, to pursue plans for construction of a solid waste processing facility.
While ASW attempted to design their equipment to eliminate some of the equipment problems experienced by ERI, ASW has yet to test their process over a long period to see if problems similar to ERI's, such as excessive breakage, jamming, have been eliminated.
ASW's system is designed to handle 250 tons of garbage per day, with 10 percent of the 250 tons going directly to a landfill. Landfilled material will be dirt, ash, gravel, glass and large construction material. The balance of the garbage will be separated into components of metals, rubbers, non-ferrous metals, paper and plastics. The equipment handles roughly 95 percent of this separation process; the balance is hand-sorted. ASW projects that the sale of scrap metal will pay for the labor required to operate the equipment.
ASW has done testing of pellets in Fairbanks, Washington, Minnesota and North Dakota. In every test, ASW claims the dRDF burned hotter, cleaner, and with less emissions than coal.
Small scale units are in final development for communities with a population of 2500 or more. The pelletizer scheduled to begin operation in Cordova is the prototype model. The smaller versions are designed to handle a maximwn of 5 tons an hour. ASW estimates garbage processing costs of $20/ton and collection costs at $30/ton. In the case of Cordova, ASW also expects to recover the full amount of processing and collection by the sale of pellets and other recyclables. According to Cordova city officials, the successful operation of the pelletizer is essential to Cordova Refuse's profit margin.

SWAMC MARPOL Report - Page 41 - October 1989
ASW assumes the following composition of average municipal solid waste:
Table 8-4 MUNICIPAL SOLID WASTE PRODUCTS
Content Constituent Final Disposition
60-70% 10%
3% 1% 1% 1%
10%
Paper, plastics, wood Metals (cans, steel) Rubber (tires, rubber products) Aluminum Cloth Wood (large materials) Dirt, ash, glass
dRDF fuel Baled Shredded Baled Baled Processed Landfill
ASW's device will process all material to 2" size. Paper, plastics, and products smaller than 2" go into a furnace and are burned for heat in the plant. Most of the ash, dirt, and glass go through the furnace where supplemental heat is added for clean burning.
ASW has attempted to get its machinery operational, and to begin accepting and processing municipal garbage. ASW intends to charge a tipping fee of only $10 per ton for recyclable garbage, a disposal cost less than half of ERI's current tipping fee of $21 per ton at the Fairbanks Landfill. If this plant does begin to operate, it may compete with other operations both for raw materials (recyclable residential and commercial garbage) and for the market in which to sell the manufactured product (the Fairbanks area power plants which would burn the fuel pellets produced). ASW has also stated its intention to possibly import garbage from the Anchorage area if necessary to ensure an adequate supply of raw materials.

SWAMC MARPOL Report - Page 42 - October 1989
9.0 HAZARDOUS WASTES
The impact of hazardous wastes upon MARPOL practices and upon solid waste disposal facilities will be difficult to project. Hazardous waste definitions and rules are in their infancy. The extent of their effect may be comprehensive.
Ordinary household solid waste contains enough paints, solvents, cleaning agents, pesticides, and toxic compounds to often pass the tests for hazardous wastes. Solid waste from boats and shipyards is more likely to be classified as hazardous wastes, considering the bottom paints, fiberglass resins, wood preservatives, polyurethane compounds, and other chemicals associated with marine activities.
Even used motor oil could easily become classified as hazardous wastes. A small amount of gasoline or dry cleaning solvent, such as Tri-Chlor or Per-Chlor, would transform waste lube oil into hazardous waste.
Considering how sensitive the lower limits are for the tests that classify solid waste, incinerator ash, or waste lube oil as hazardous waste, almost any landfill and almost any waste oil drum can be expected be prove out as contaminated at some level of "hazardous waste."
Hazardous Waste considerations present the ultimate nightmare for landfill operators. One midnight dumping can turn a landfill into a Superfund cleanup site. Fairly common wastes -- gasoline, dead batteries, acids or poisons
and many marine products -- paints, anti-fouling compounds, and fiberglass resins -- can all do untold damage to the site and environment, and cause serious problems for the landfill operator. Some of the tests for hazardous properties emphasize conditions encountered at landfills. Many existing landfills will have to be dug up and hazardous components of the waste will have to be placed in drums an~ shipped by a certified shipper to an approved disposal site. The costs for such cleanups will be astronomical.
Solid waste disposal site operators must treat hazardous wastes in special ways. For example, landfill or incinerator operators must screen incoming waste to identify and isolate obvious items of hazardous wastes, such as lead/acid batteries and some paint solvents. Special training will be required for operators.
Also, since the performance standards for landfills (meeting leachate toxicity standards) and for incinerators (meeting ash toxicity standards) will require that hazardous wastes be eliminated from solid wastes, one common recommendation would be to set up community hazardous waste

SWAMC MARPOL Report - Page 43 - October 1989
cleanup programs whereby household waste chemicals can be collected and disposed of.
Handling and transport of hazardous chemicals can only be done by firms certified by the U.S. Environmental Protection Agency. There are no approved hazardous waste disposal sites in Alaska.
For information about hazardous wastes, EPA maintains a "Hotline" 1-800-424-9346. The local state DEC office may also be able to provide information.
Ports must accept hazardous wastes if a vessel so requests, as regulated by the Coast Guard under MARPOL authority in much the same fashion as plastics wastes. MARPOL Annex I requires operators of certain ports and terminals to provide reception facilities, meaning storage tanks, for boats to offload oily wastes, such as used lube oil. A Certificate of Adequacy is required to demonstrate a port operator's ability to receive oily wastes. In these two aspects -- reception facilities and COAs -- MARPOL Annex I parallels MARPOL Annex v.
Oily waste disposal may also have parallels with solid waste/plastic waste disposal. Both wastes can be incinerated. Oily wastes, with their high Btu content, would enhance the burning ability of the combined wastes. And generally, the higher the Btu content of incinerator feedstock, the more cleanly it burns, with lessened conventional air pollutant emissions such as carbon monoxide and particulates.
Federal rules (40 CFR 264) for disposal of hazardous material were proposed on August 30, 1988, with final rules in late 1989. Specifics have not yet been worked out, but the rules will include leachate protection systems, liners, groundwater monitoring, or some combination of the three. Some upgrading may be necessary for use as a disposal site for incinerator ash. This will need to be reviewed when a conununity studies its options for incineration and landfilling.
APHIS Wastes and Medical Wastes may, by MARPOL law, become part of the combined waste disposal problem. If vessel operators wish to offload such wastes, port operators are required to provide reception , facilities. Such wastes may not be disposed of in landfills. Incineration is one of the acceptable disposal methods for such wastes.

SWAMC MARPOL Report - Page 44 - October 1989
10.0 UNALASKA
The Unalaska/Dutch Harbor area, now in the midst of a bottomf ishing boom, has an interesting volume and type of solid waste, both far in excess of normal generation rates and of high quality in terms of energy content and recyclable value. City officials claim to have "some of the finest garbage in the nation." This may be true.
10 . 1 Volume of generation appears to be about four times greater than normal expected rates. The following graph displays the monthly hauling of Williwaw Sanitation f rom January 1988 to May 1989. [Ref 32] Williwaw estimates that they haul 80 percent of t he waste generated in Unalaska/Dutch Harbor.
"' Cl
! u iii ::I u
Tele 7•1 UNALASKA MONTHLY WASTE Cubic Varda Hauled by Wllllwaw
7000 ·----·····-····--·-----·-·--···-···-··---···-····----·-·-·--·····-·-·-············-······--···- 7000
8000 ---·-····----·-···-···--·-----·-·-·--·-·······- - - ···-·-···-·-·--· ··-········--·· 6000
6000 --·-·······--·-·--······--··· ·--··---~·-·-·····-···-·-········---·· ···· ······ ······-· ·-·--· ··--·-··· · ... ····-······· .... . 6000
4000 ··- ···-····--··- ··-· ·- - .•. ·-- .•• - · ....... - · . 4000
3000 ....... ......... - .••. . .... .... •••• .•. .•.. .... ...•. ... •.•. ... ..... .... ..• .. ..... -· ·- ... ....... ··-· ... .. • .. -- .... . 3000
2000 .... - ·- .•• .• - .... ··- ... • ••..... ·-·· ..• .. .• - · ··-· -- - •• ••.. .... ... .. ··- ... ..... ••.. .. .... .... • 2000
1000 . - · ••••· -· ··-· -· .... ..... -·· ..... .... ..... --· .... ..... ·- 1000
0 0 J F M A M J J A S 0 N D J F M A M
J....uy 1988 to May 1989 • Residential Cl COIMMtrclaJ
January 1989 noted an increase in commercial waste volume from seafood processors and fishing vessels. In 1988, about 35 percent of the total waste load came from seafood processors and vessels. Since January 1989, about 52 percent of the waste load originates from these sources. About a third of this incr eased load comes from vessels.
The residential output remains fairly steady, averaging about 1265 cubic yards per month. Assuming 15 pounds per cubic foot, on the light side of residential

SWAMC MARPOL Report - Page 45 - October 1989
refuse, this equates to a population equivalent of 3400 people at 5 pounds per capita per day.
The commercial waste originates from seafood processors, dock activities, construction, and general business and support activities. The average volume of 2983 cuyd/mo when combined with a mid-range density of 10 lb/cuft calculates to an average population equivalent of 5400 for the last 17 months. However, if you focus on the recent surge in seafood activity, the population equivalent jumps to 7100.
The combined equivalent populations add up to 8800 over the 17 month period. When you account for the other 20 percent of the waste not hauled by Williwaw, the existing estimated population, based upon waste production, comes to more than 11,000 people.
Looking at the weight of both types of waste, using densities as assumed above, the daily combined waste generation amounts to 29 tons per day over the last 17 month period.
Or looking at it another way -- based upon a recent population estimate by city officials (Ref 13] of 2100 -- the per capita waste generation comes to 27 pounds per day, or about 550 percent more than the average expected rate.
Based upon the residential/commercial ratio, the combined waste has the following estimated characteristics. Included in this mixture is a 10 percent input for construction debris, estimated by Williwaw. [Ref 32]
Table 10-2 UNALASKA SOLID WASTE CHARACTERISTICS
Parameter Value
Generation Rate Density Heat Value Moisture Incombustibles
27 pounds per capita per day 12 pounds per cubic foot 7000 Btu per pound 23% 6%
--------------------------~---------------------
10.2 Composition of Unalaska's commercial waste consists of a large fraction of packing materials, such as cardboard, strapping, - and pallets. Fishing wastes such as polypropylene rope also contribute a sizeable portion of the waste load. Williwaw Sanitation estimates the composition of the waste to be as follows. [Ref 32]

SW.AMC MARPOL Report - Page 46 - October 1989
Table 10-3 UNALASKA SOLID WASTE COMPOSITION
Component -~------------~-------Wood, Cardboard, Fiber Plastic Waste Foodstuff Paper, Rubbish
Volume Fraction ---------------30%
30% 20% 20%
----------------------------------------------10.3 Seasonal variations of Unalaska waste
generation seems to hold no patterns, either as compared to typical municipal waste or within Unalaska from year to year. See Table 10-4, as follows.
Table 7-4 UNALASKA WASTE PATTERN By Month, C~ed to Typical U.S.
60 60
40 40
30 I 30 & >
~ ' . • .. ti
::E ::0 a: o( 0 20 20 ti z ::0
~ .8 o(
~ 10 10 w u 3: a: w 0 Q, "ii
0 0 m
-10 -10
-20 -20 J F M A M J J A s 0 N D J F M A M
J~ 1988 to May 1989
• Unala.:ka Wute .., Typical U.S.
10.4 Disposal Practices have improved recently. At one time, the Unalaska landfill had gained some notoriety for rat and windblown litter problems. With increased diligence in covering the incoming garbage on a more .regular pattern, these problems have been somewhat abated. Nevertheless, leachate drainage from the landfill site is readily evident. Monitoring wells have been required. Other nagging problems include proper diversion of runoff from the hillside above the landfill and the lack of decent cover material. Oversized items, such as from construction activity, tend to accumulate in one area of the landfill.

SWAMC MARPOL Report - Page 47 - October 1989
10.5 Costs were obtain from both the City of Unalaska, responsible for operating the landfill (Ref 31], and from Williwaw Sanitation, the contractor to haul garbage which transports about 85% of the waste to the landfill [Ref 32]. The remaining 15% is hauled by individuals, construction firms, or seafood processors.
Capital Costs: Operating Costs: Collection Costs:
$230,000 97,000/yr
115,000/yr
Capital costs includes two pieces of heavy equipment, a grader @ $115,000 and a bulldozer @ $113,000. Land, fencing, and office are not included.
Operating costs does not include construction of trenches and culverts to divert surface run-off around landfill, or the cost of monitoring well or testing. This is the budget amount.

SWAMC MARPOL Report - Page 48 - October 1989
11.0 KODIAK
11.l Volume of garbage generation per capita in Kodiak appears more stable and normal than other communities in this study. This probably results from a large nonfishing population in Kodiak and, of the fishing population operating out of Kodiak, a large fraction, say half, of those are resident. Compare this to Unalaska or Bristol Bay, where about 96 percent of the fishermen live elsewhere.
According to Kodiak Sanitation, the contractor hauling solid waste for the Kodiak Island Borough, the year-round average garbage hauling rate is three trips a day, seven days a week, at 31 cubic yards per trip. [Ref 35] At normal waste densities of 10 to 15 pounds per cubic foot, this equates to 12 to 19 tons per day. When compared to the number of bales per day and the likely weight per bale, the higher range seems reasonable.
According to the Borough engineer, the volume averages 30 bales a day or 180 bales a week based on a six day week. The Borough engineer estimates bale weights at about 3300 pounds each.
11.2 Composition of waste in Kodiak has a noticeable fisheries character, but seems to be diluted by a large portion of "normal" garbage. More so than any other community under study, Kodiak has a dominant fraction of regular household refuse. Even the fisheries in Kodiak seem to operate out of households in Kodiak, with the highest residence of fishermen in this study. Nevertheless, a diversity of wastes associated with the fishing industry arrives at the disposal site. Fred Nass, former owner of Kodiak Sanitation says "the garbage in Kodiak is different from most garbage elsewhere." [Ref 4] Shipping containers, pallets, wooden spools from fishing line, net and web, marine batteries, and other obvious fishing waste items catch your eye.
The problem with such odd fishing waste is that it doesn't compact well. The baling operation does not achieve the design compaction ratio of 4-to-l with pallets and spools in the waste stream.
Kodiak fishing waste also contains an amount of pre- compacted garbage. As a result of a program developed by the Kodiak Fishermen's Wives association, some of the resident fleet have installed Sears compacters on board vessels. This aspect of fishing generated waste is compatible with the Borough's baling operation, since the

SWAMC MARPOL Report - Page 49 - September 1989
boat compacted trash on-board does compress down to the 4-to-1 ratio claimed by the manufacturer. [Ref 33]
11.3 Seasonal Variation in Kodiak has been difficult to research. Every year seems to be different. Fishermen gear up for an opening, which always generates an influx of waste, then the fishery is closed without foreseeable reason. So it's hard to look back at fishery activity and relate that to waste collection. Some fisheries have less of a panic mobilization than others, resulting in less buildup in garbage production. And Kodiak has much more diversified fishing activity than any other community under study, with about ten species being attended by various gear groups. When we asked about seasonal variation in waste generation, we were repeatedly told there was no pattern in Kodiak.
The following table, taken from the Pacific Associates MARPOL report [Ref 4], demonstrates the seasonal nature of the number of Kodiak fisheries.
Table 11-1 KODIAK FISHERIES
Opening Season Gear Number Species Date Length Type of Boats --------~--- ------- ------- ----- --------Tanner Crab Jan 15 3 weeks pots 200 Herring April 3 weeks seine 42 Herring April 3 weeks gillnet 57 Salmon June Sept seine 376
tenders 40 Dungeness May Dec pots 45 Sablef ish April July long line 250 Halibut May, Jun, Sep 6 days long line 1800 Groundf ish January December trawl 40 Groundf ish January December long line 30
-----------------------------------------------------------Peak fishing garbage generation estimates
were provided by Kodiak Sanitation. [Ref 35] The various small boat harbor collection sites provide a total of nine dumpsters at 5.5 cubic yards each. When fishermen are gearing up for an opening, about 40 such dumpsters will be emptied per week. For these periods, this increment of 32 cubic yards per day, about one truck load, adds about a 33 percent increase to the average daily load.
11.4 Disposal Practices now are being improved with a view towards approaching future requirements of federal landfill operating requirements. Kodiak climate and terrain conditions do not favor landfill operations. High rainfall causes high leachate potential. Costly controls

SWAMC MARPOL Report - Page 50 - September 1989
such as construction of impermeable layers, leachate collection and control systems, monitoring programs, and so forth have been incorporated into the operating permits. (Ref 14] Even considering the costs of operating a landfill in these conditions, the Kodiak landfill has ample potential for consideration as a regional solid waste disposal site.
Unfortunately, the fisheries wastes complicate matters. Bulky fish waste items do not fit well or compact well in the baler. Many such items must be handled and disposed of separately.
Kodiak's baler has been operational since July 1987. Until July 1988, when the borough resumed control, the baler and landfill were operated by a private contractor. Dave Krase, the borough engineer, is responsible for the operation of the baler/landfill and is satisfied with the baler. He cited the obvious benefits -increased life of the landfill and decreased debris, birds and rats. He also cited reduced operating costs of the baler versus a sanitary landfill. Kodiak currently uses only 6 11 of cover a week. Balers are stacked five high and ten wide. Shade screens of a material similar to typar are used for the exposed edges, thus eliminating the need for constant filling.
Borough officials estimate there are twelve to fifteen years left on the landfill. The Coast Guard now uses the borough landfill, and original estimates have been lowered. However, Robert McFarland of the facilities department who provided the capital costs of the baler, estimates the life of the landfill to be greater.
11.5 Costs of operation and maintenance were obtained from the Kodiak Island Borough (Ref 33], Kodiak Sanitation [Ref 35], and the Alaska Department of Environmental Conservation [Ref 34].
Capital Costs:
Operating Costs: Collection Cost:
Revenue:
$3,135,000 1,050,000
204,000/yr 240,000/yr
1987 1989
$4.00/cubic yard tipping fees
January 1987 (capital) equipment costs $3,135,000 includes site upgrade, building, baler, design fees and administrative costs.
Recently funded capital costs of one million to install leachate collection system.
The operating and maintenance costs of the baler/landfill were intended to be paid entirely by tipping

SWAMC MARPOL Report - Page 51 - September 1989
and user fees. Figures for revenue generated by such fees were not available. Dave Krase stated that it is not yet a break even operation because of the need to purchase new equipment. Kodiak recently requested $508,980 in the FY 90 capital budget for landfill material and leachate control.

SWAMC MARPOL Report - Page 52 - September 1989
12.0 BRISTOL BAY
12.1 Volume of waste generation on a per capita basis eludes analysis. Certainly the volume of total waste generation is easy enough to assess, but counting the people who contribute to the garbage is a problem. There are gillnetters, seafood plant workers, and support industry workers who make up a seasonal influx of activity beyond normal census abilities. Perhaps the best way to count the people is to estimate the total garbage generation per day and divide by the standard generation factor of five pounds of garbage per person per day. This has been done in the graph in this section. Borough officials estimate that the average garbage production on a yearly basis runs between six and seven tons per day.
12.2 Composition of waste in the Naknek landfill reflects both fisheries and military influences. Discarded gillnets cause problems with entangling the tracks of earth moving equipment. Special areas of the landfill have been set aside for discarded nets. Borough officials feel the net disposal rate is higher for the Bristol Bay area than for other gillnet fisheries. In less hectic fisheries, time allows a gillnetter to repair or mend a net. In Bristol Bay, there's so little time and so much pressure to fish that it's common practice to carry spare nets and replace nets more frequently. (Ref 36]
12.3 Seasonal Variation in the Naknek landfill probably sets some sort of record for extremes. Borough officials estimate the high-to-low seasonal ratio runs up to 20-to-l or so. (Ref 36, 37] See the chart on the next page.
12.4 Disposal Practices for a baler/landfill operation in the Naknek site will probably be in good shape in the immediate future. The landfill site will probably pass muster for the new federal rules that will be cracking down on landfill operations. Limited rainfall limits leachate potential and the site is well removed from other terrain problems associated with flooding and surface runoffs. The baler, to be in operation in summer 1989, will solve the windblown litter and cover problems. The disposal system suits the situation and the Bristol Bay Borough seems to be in a good position to handle a regional solid waste disposal system. The only obstacle here might well be a regional collection program.

SWAMC MARPOL Report - Page 53 - October 1989
Table 7•6 NAKNEK WASTE PATTERN Tana per Day a. Population Equivalent
20
1a---·---------·--·-· 16+--------------··--- -·---.. --·-.. ---·-.. -····------·- 8000
14 ·------·-.. -----· .. ···-··-·-······--···-· .................................. -... 7000
12-- ..--··········-· .......... ·--··--······-···· ............ -.. 6000
10
8 ···-·-··--·-··-·-·----···-···· ·-···-··--··· ................................... _ 4000
6 ------·-------·
4 ····---·-------· ·-.. ·---··-·--·· .. -··-.. •·· 2000
I 2+----- ' ·---··---··---·-- 1000
0 ~
~ ~ ~ -- ~ ~ ~ ~ ~ ~ ~ Montha of Year
Fla Tona/Day Ill Pop Equiv
0
12.S Cost information for 1988 landfill operations and for 1989 baler/landfill projections were obtained from the Bristol Bay Borough Manager [Ref 36] and from the Bristol Bay Borough Public Works Office [Ref 37].
Capital Costs: $600,000 1989 Operating Costs: 75,000/yr
New baler construction costs break down as:
Item
Building, office Baler fob Seattle Conveyor Shipping Costs
Cost
$250,000 233,000
49,000 25,000
----~-----------------------
Operating costs were estimated at $30,000 per year for electricity and $45,000 for labor.

SWAMC MARPOL Report - Page 54 - October 1989
13.0 REGIONAL OPTIONS
Cooperation for both 1) collection and 2) disposal solid waste systems exist for conununities in the Aleutian Chain, Alaska Peninsula, and in the Bristol Bay areas who may wish to look beyond individual capability for the reception and disposal of wastes. There are two basic options.
The first option is for all affected ports to contract one outside operator, to provide reception and disposal services to the conununities. Here, one regional solid waste transportation system could take the place of many. Possibilities for such shared facilities could vary from shared mobile barge~mounted incinerators, to a singlelocation incinerator and landfill, to a single landfill serving as a central solid waste facility. If such an option were pursued, a thorough discussion with the Alaska Public Utilities Conunission would be necessary, as such a facility may be considered a utility under state law.
Another possible means of consolidating waste reception and disposal responsibilities would be for a group of conununities around Dutch Harbor to establish a port authority for Dutch Harbor/Unalaska, or for a number of conununities on the chain.
The establishment of a port authority is regulated by state law. However, the process differs, depending on the status of the community. An unorganized borough must have authority from the state; an organized borough or municipality may need additional authority (depending upon its class) from the State Legislature in order to function as a port authority. The establishment of a port authority can allow for one entity to exercise control and coordination over a nwnber of entities within a port area. Managing and planning capacity, financing capacity-including bonding and other revenue generating, are both within the power of a port authority.
Generally, port authorities may function in three areas:
1) Management of ports and enforcement of regulations; e.g., port agencies are typically granted regulatory functions such as zoning enforcement and fire fighting.
2) Provision of maritime and transportation infrastructure; e.g., land-use planning, project development, and operations, including waste management planning and financing.

3)
SWAMC MARPOL Report - Page 55 - October 1989
Economic development functions; e.g., revenue generating, bond issuance, sale or lease of land adjacent to the waterfront.
Obviously, if a community or communities wished to pursue a port authority, additional research into Title 29 of the State statutes and further discussion with the State would be in order.
Provision of maritime and transportation infrastructure are the functions most widely associated with port agencies-- the ones that give some independent port authorities great notoriety and provide the basis for active development and management of ports. These functions include: project planning and initiation, project development and project operations.
A port agency engaged in project planning and initiation typically engages in the planning for a port project and serves as the local sponsor to promote a particular project built by either the agency itself, another public agency (e.g., Alaska Department of Environmental Conservation) or a private group.
Port agencies often prepare development plans for the port district to determine what type of development is desired and the mechanisms for project development. Some ports have authority to enter long-term leases providing for another party to develop and operate facilities. The capability of financing projects often determines the agency's role in project development. If the port lacks access to funds or financing methods, then project development is largely a marketing function and of ten requires a public sector agency or private enterprise to build the desired facilities. If financing alternatives are available, the port agency may assume a more aggressive posture as project developer.
Port agencies take very different attitudes toward project operations. "Landlord Ports," typified by major California ports, take an active role in project initiation and development but then lease out the facilities on a long term basis for rental income tied either to value, volume or both.
"Operating Ports" may choose to carry out some or all operations at port facilities to provide better service to multiple users or to gain some other service advantage. Operating ports support operations via user charges as defined in published tariffs normally promulgated by the governing body of the port. Level of charges are generally dictated by statute or policy (i.e. break even or profit

SWAMC MARPOL Report - Page 56 - October 1989
making provisions) or in some cases may be arbitrarily set to provide competitive advantage over competing ports or transport modes.
Alaska Port Powers through Title 29 of the Alaska Statutes provides the authority which enables cities and boroughs to establish a port organization; plan for waterfront development; own, lease or manage properties; raise funds through the sale of revenue and general obligation bonds; and exercise financial control over public port activities.
General Law Municipalities, in AS 29.48.030, are granted the powers necessary to provide harbors, wharves and other marine facilities. These powers vary somewhat for different types of municipalities; however, they are ample and generally include the authority to
* develop and construct facilities * operate facilities * collect user fees * join with other public or private entities to
develop or finance port projects.
Formation of Port Agencies are authorized under Title 29 and guided by the Alaska Constitution, whereby municipalities may assume port powers and undertake a variety of port functions as an activity of local government. Typically, port functions are carried out by a port director who reports directly to the city manager or by a municipal department such as Transportation (as in Anchorage) or Public Works (as in Juneau).
Aside from staff, the governing structure of ports usually consists of port commissioners (elected or appointed), city manager, mayor or council/assembly.
All municipalities are given the authority to regulate the facilities and services they provide by Sec. 29.48.035. Municipalities have the power to regulate port facilities, including user fees, berthing policies and other management tools.
Use of General Tax Revenue may be spent for operating and maintenance expenses incurred to manage a port and, in fact, when the state builds a dock or berthing facility, local municipalities are responsible for operation and maintenance as part of the lease terms.
If the port facilities are owned and operated by the municipality, the port facilities a.re treated like any other service of local government. The budget of the port facility's operation is reviewed and approved as is a budget presented by any other department. Port expenses are

SWAMC MARPOL Report - Page 57 - October 1989
projected and budgeted. Home rule municipalities such as Anchorage have established port enterprise funds which allow revenues collected from port facilities to be retained in a special account to cover operation, maintenance and improvement costs. In this way, revenues collected by the ports (such as user fees) are not treated in the same manner as other general municipal revenue.
User Fees may be collected by municipalities for publicly owned port facilities, just as fees are collected for garbage pickup and sewer service. Municipalities are urged by the State Department of Transportation and Public Facilities to set fees at a level sufficient to meet operating and maintenance expenses. The level of user fees to be charged is determined by the council or as·sembly. Fees collected may be kept separate from general tax revenue, and entered into an enterprise account. (Ref 30]

SW.AMC MARPOL Report - Page 58 - October 1989
14.0 MODELS
~odels provide information upon which to predict various outcomes, in this instance, the onshore impacts of MARPOL on Alaskan coastal communities. The predicted outcomes consider variables and how those variables might change in the future. In this instance, variables include such things as --
vessel activity in Alaskan waters; waste generation by vessels; waste returned to shore facilities; types of wastes returned to shore; and costs of handling and dis~osal of wastes.
In this section, we'll examine these variables and estimate to what extent they might be expected to change as trends, and then determine how these changes will impact coastal Alaskan communities. In each set of conditions, reasonable assumptions will be explained.
14.1 Variables
Vessel Activity will focus on factory trawlers for several reasons. First, they produce most of the MARPOL garb~ge generation potential in the Southwestern Alaskan region. When you factor in the number of people and their days at sea, factory trawlers dominate the vessel activity factors.
Another reason to focus on factory trawlers is their growth potential for the next several years. Ten new factory trawlers will be added each year to the fleet. New trawlers will be larger, with double the crew size and longer trips, say twice as long. [Ref 4] This quadruples the potential waste generation per trip.
Waste Production for factory trawlers is three to four fold greater than other fishing vessels.
Waste Returned to Shore depends mostly upon the installation of ship-based incinerators. Larger vessels have the deck space and the volume of waste to warrant shipboard incinerators. In 1988, about 25 percent of the factory trawlers surveyed had incinerators and another 25 percent indicated they'd be installing them. Newly built and outfitted factory trawlers will probably be installing them.
Type of Waste Retur ned may vary with the installation of compacters and incinerators on factory trawlers and according to the distance the vessels maintain offshore. Compacters would mean that waste foodstuff and galley garbage would be handled more easily with existing

SWAMC MARPOL Report - Page 59 - October 1989
dumpsters. Incinerator ash may likely be brought ashore if vessels operate close to shore or retain unburned plastic residue in their ash.
14.2 Assumptions for model impacts are given below. Of course, the purpose of models is to deal with varying factors, so a range of assumptions can be studied.
Factory Trawlers:
Days
1988 40 vessels, 1250 crew 1989 SO vessels, 2000 crew 1990 60 vessels, 2750 crew
Fishing 1988 1989 1990
per Year for Fleet: (11 trips)(23 days)(40 vessels) 1988 + (10 vessels)(320 days) 1989 + (10 vessels)(320 days)
Waste Generation: 12 pounds per capita per day
Waste Type: 4 lb/capday 8 lb/capday
Incinerators:
galley garbage packing and dunnage
= 10,100 days = 13,300 days = 16,500 days
Reduce Weight of Waste by 70% for galley garbage by 90% for packing and dunnage by 85% overall
Contain plastic residue 50% of the time, the balance of ash will be disposed of at sea
Installed in 50% of the factory trawlers
14.3 Model MARPOL Impacts can be calculated to range with expected changes.
Maximum MARPOL Impact assumes the unlikely for comparison purposes.
Assumptions
All factory trawlers bring all waste ashore. Per capita waste generation remains stable.
1988 Waste: (40 trawlers)(ll trips/yr)(30 crew/trawler)(23 days/trip)
@ (12 lb/capday) = 3.6 million lb/yr
1989 Waste: (50 trawlers)(250 days/year)(40 crew)(l2 lb/capday)
= 6 million lb/yr
1990 Waste:

SW.AMC MARPOL Report - Page 60 - October 1989
(60 trawlers)(45 crew/trawler)(260 days/year)(l2 lb/capday) = 8.4 million lb/yr
This projection, even though unrealistic in terms of impacts to ports, does have value by indicating the waste generation to be tripling in three years.
Minimum MARPOL Impact makes idealistic assumptions at the other limits of expectations.
Assumptions
Half of the factory trawlers install incinerators. Half of the incinerator ash contains plastic residues and must be returned to shore.
The other half of the factory trawlers separate their plastics from their galley waste and dispose of the galley waste overboard as allowed by MARPOL.
Dunnage and packing materials are either incinerated without plastic residue in the ash or disposed of overboard as allowed by MARPOL.
Taking 1989 waste for an Example:
33% of total waste (from 14 . 3.1) is galley waste, so galley waste= (0.33)(6 million lb/yr) = 2 million lb/yr
16% of galley waste is plastic, so total plastic waste= (0.16)(2 million lb/yr) = 0.32
million lb/yr half of plastics separated taken ashore = 0.16 million lb/yr
half of galley waste incinerated, reduced in weight, only half with plastic in ash taken ashore:
(0.5)(2 million lb/yr)(0.30)(0.5) = 0.15 million lb/yr
total waste ashore = 0.31 million lb/yr = 310,000 lb/yr
14.4 Predicted MARPOL Impact ranges between these extremes. So to start with the 1989 maximum potential of 6,000,000 lb/yr and scale down to the more probable lower limits of 310,000 lb/yr of MAR.POL wastes shows quite a range of impact, depending upon the practices of the trawler fleet.

SWAMC MARPOL Report - Page 61 - October 1989
15.0 CONCLUSIONS
The regulatory pressures arising from public concerns about clean air, hazardous waste, and marine plastic pollution have focused our attention on our solid wastes: their costs and liabilities in disposal versus their values for materials recycling and energy recovery.
The solid waste facilities in coastal Alaskan communities have already been affected by MARPOL, not its enforcement and its effective dates, but by the public concern and voluntary compliance by many of us. On the other hand, no person can walk a remote Alaskan beach without being appalled by the plastic trash under foot. More MARPOL waste will impact our coastal facilities, but the degree of impact will depend upon ship-board practices of the fishing fleets. Many of the larger vessels will be incinerating their wastes rather than returning them ashore.
On-shore, the potential for recycling and energy recovery of MARPOL wastes and related fishery wastes appears greater than for normal solid wastes. This is fortunate, because no landfill or incinerator will be able to operate in the future without recycling programs and hazardous waste control programs working in concert.
Unalaska has immediate solid waste disposal needs. The existing landfill has limited life, on the order of three to five years. Regulatory agencies would not likely permit a normal landfill operation as a replacement. Potentially, MARPOL wastes will impact Unalaska greatly. Already, Unalaska's per capita waste generation rate exceeds the national average by 540 percent.
Kodiak's baler/landfill can be expected to easily handle the small increase in projected MARPOL impact. The landfill, with upgrading and maintenance and with recycling and hazardous waste control programs, can be expected to operate for 15 to 30 more years under new stricter rules. Kodiak could serve as a regional waste disposal area.
The Bristol Bay Borough's Naknek baler/landfill begins its first year of operation in 1989 and should also be able to meet tougher operating rules. Projected MARPOL impacts could be significant with a marine-based collection system. This site could also serve as a regional disposal center.
Because of the resident nature of the Kodiak fishing fleet, the Kodiak area would best benefit from a public education program to heighten awareness about MARPOL.

SWAMC MARPOL Report - Page 62 - October 1989
16.0 RECOMMENDATIONS
The following recommendations have been organized with follow up actions that might be funded using monies earmarked for MARPOL in state and federal budgets.
16.1 Unalaska Feasibility Studies for Incinerator grants would be in order. Feasibility studies form the precursor to the DEC construction grant process. Such studies parallel an environmental impact study format and discuss the pros and cons of various incinerator options and how the community might be affected. Economics are taken into consideration, especially those of energy customers, type of energy (steam, hot water, electricity), seasonal energy-demands, and energy sales.
The final product may set forth the specifications for an incinerator, including size, equipment characteristics, feeding system, ash handling system, auxiliary fuel type, waste oil burning capabilities, controls, instrumentation, operating temperatures, fan and ventilation equipment, overall dimensions, and so forth. Such a study may cost from $40,000 to $50,000.
16.2 Unalaska Port Authority should be established to provide legal authorization to provide area-wide MARPOL solid waste and MARPOL oily waste services and to provide for a tax system to fund the operation of services. The Port Authority could provide a small portable incinerator to handle APHIS wastes containing MARPOL plastics and some oily wastes until a municipal incinerator could be funded and built. The portable incinerator could handle wastes on a small regional scale for APHIS wastes. The smaller incinerators on the market run just under $15,000 and the costs to organize a Port Authority could run up to $15,000.
16.3 Bristol Bay Regional Solid Waste Study would be in order to fine tune the solid waste collection economics to include MARPOL wastes from the salmon and herring fisheries. Such a project would focus on garbage collection rate studies and the regional transportation system necessary to handle wastes. Again, the level of detail would get into equipment sizes and specifications and the economics of handling normal and compacted volumes of solid waste. ·
Recycling of metals and MARPOL plastics and creation of a regional infrastructure for recycling could set an example for solid waste management under new federal rules. Likewise, a system for community control of hazardous wastes, such as spring cleanup of household waste chemicals, could be part of this regional approach. Both recycling and hazardous chemical control will be integral to solid waste management in the future.

SWAMC MARPOL Report - Page 63 - October 1989
MARPOL plastics and other MARPOL wastes can serve to catalyze these programs. Public awareness programs would be necessary for these activities to be successful. An organization like the Southwest Alaska Municipal Conference could serve to organize regional recycling and hazardous waste control programs and publicize them as well. This type of study could cost up to $75,000.
16.4 Pelletizer Operations of MARPOL wastes in Cordova should be monitored and evaluated. Not enough is known about the effectiveness of this process and how it handles fishing wastes. Information on the effectiveness and costs of a small scale recycling and energy recovery operation working on fishing community wastes, which would include a significant fraction of MARPOL wastes, would be of value, especially details about volume reduction, energy and moisture content of dRDF pellets. Such a study would cost about $22,000.

SWAMC MARPOL Report - Page 64 - October 1989
17.0 REFERENCES
1. "Request for Proposals on the Impact of MARPOL .Annex V upon Solid Waste Disposal Facilities of Coastal Alaskan Communities" by the Southwest Alaska Municipal Conference
2. "On the Impact of MARPOL Annex V upon Solid Waste Disposal Facilities of Coastal Alaskan Communities" by Randolph Bayliss and c. Deming Cowles, Aug 29'88
3. "Report on a Port-Based Project to Reduce Marine Debris" Fran Recht, Project Manager, Marine Entanglement Research Program, National Marine ·Fisheries Service, 7600 Sand Point Way NE, Seattle WA 98115
4. "A Report to the Alaska Department of Environmental Conservation on the Effects of MARPOL, Annex V, on the Ports of Kodiak and Unalaska" by Pacific Associates, Larry Cotter, Eric Eckholm, Chris Blackburn, and Randolph Bayliss, Sep BB
s. "Municipal Solid Waste Treatment & Disposal Feasibility Study Report" City of Petersburg, Dave Harmon, et al, Feb B8
6. Personal conununication, Gerry Wilson, Channel Sanitation, Oct B8
7. "Municipal Waste Generation and Composition to 1990 11 Solid Waste Council and the Paper Industry, Franklin, w. et al, Solid Waste Council of the Paper Industry, Feb 79
B. "The National Solid Wastes Survey: An Interim Report - 1968" R. Black and A. Klee, U.S. Environmental Protection Agency
9. "Small Scale Municipal Solid Waste Energy Recovery Systems" Gersham, Brickner, & Bratton, Inc., Van Nostrand Reinhold, New York, 1986
10. "Worksheet for Estimating Demand for Garbage Reception Facilities" (taken from Draft Guidelines for the Implementation of Annex V, Regulations for the Prevention of Pollution by Garbage from Ships) Federal Register/Vol 53, No. 208/Thursday, October 27, 198B/Proposed Rules
11. Personal communication, Gary Daily, Port Director, City of Unalaska, Nov B8 and Jun B9
8B 12. Personal communication, Williwaw Sanitation, Jun

SWAMC MARPOL Report - Page 65 - October 1989
13. Personal Communication, Glenn Reed, Assistant City Manager, City of Unalaska, Jun 88
14. Solid Waste Permit No. 8621-BAOOS, issued to Kodiak Island Borough by the Alaska Department of Environmental Conservation, Jul 23 86
15. Larry Chimenti, Sears Contract and Commercial Sales, Pacific Northwest Region, P.O. Box 3944, Seattle WA 98124, letter to Fran Recht, Marine Refuse Disposal Project, Port of Newport, 600 SE Bay Blvd, Newport Oregon, 97365, offering compacters at $236 each fob Seattle, Nov 25'87
16. Alaska Statute 46.06.080
17. 18 AAC 60, Alaska Administrative Code, Solid Waste Disposal Regulations
18. Federal Register August 30, 1988
19. 18 AAC 70, Alaska Administrative Code, Quality Standards
20. 18 AAC SO, Alaska Administrative Code, Control
21. 18 AAC 72. Alaska Administrative Code, Disposal
22. 18 AAC 73, Alaska Administrative Code, Construction Grants
Water
Air Quality
Wastewater
23. "Solid Waste Concerns Spur Plastic Recycling Efforts" Chemical and Engineering News Jan 30'89
24. "Evaluation of Plastics Recycling Systems" Cal Recovery Systems, Inc for National Oceanic and Atmospheric Administration, 7600 Sand Point Way N.E., Seattle, Washington, Jul'88
25. "Processing PET Bottles into High Purity Flake" Trezek, G.J. and Tixier, J., Resources and Conservation, Vol 15, pl51, 1987
26. "Poly Waste and Its Utilization: A Review" Datye, K.V. et al, Resources and Conservation, Vol 11, No.2, p117, 1884
27. "Plastics Manufacturers Speed the Search for New Ways to Recycle Disposable Products" Malcolm Gladwell, Washington Post, May 2 89

SWAMC MARPOL Report - Page 66 - October 1989
28. "Report on the Conclusion of the BPF PET-A-Box Project" The British Plastics Federation, 1986
29. Personal communications with Jim Taylor, Public Works, City of Unalaska; Shuan Imboden, Petromarine; Joe Usibelli, Usibelli Coal; Williwaw Services; Ralph Bartlett, Alaska Solid Waste; Jun'89
30. "Local Government Port Powers" Alaska Department of Community and Regional Affairs, Division of Community Planning, Sep 82
31. Personal communication, City of Unalaska, May 89
32. Personal communication, Williwaw Sanitation, Nov 88 May 89 Jun 89
33. Personal communication, Kodiak Island Borough engineer Dave Krase, May 89
34. "Community Requests for FY90 Capital Budget through 50% Matching Grants Program" Division of Facility Construction and Operation, Alaska Department of Environmental Conservation, Feb 89
35. Personal communication, Kodiak Sanitation, Jun 89
36. Personal communication, Jim D. Clark, Bristol Bay Borough Manager, Nov 15 88
37. Personal communication, Jim Phelps, Bristol Bay Borough Public Works, May 11 89
38. Personal communication, City and Borough of Sitka Public Works, Jerry Simpson, May 89
39. Personal communication, Cordova Refuse Inc, Ralph Bartlett, Apr 89
40. Personal communication, Gerry Wilson, Channel Sanitation, Nov 88 May 11 89
41. Personal communication, Fred Monrean, Ketchikan Public Works engineer, May 11 89
42. Personal communication, City of Homer, May 89

SWAMC MARPOL Report - Page 67 - October 1989
ACKNOWLEDGEMENTS
Larry Cotter designed the fishing questionnaire, distributed it, and sununarized the results regarding fishing waste types and volumes.
Nadine Winters researched recycling and energy recovery technologies and gathered information from various communities regarding costs of waste collection and disposal.
Gary Daily, Port Director of Unalaska, provided local and technical information and assisted often and generally with the report. We wouldn't have gotten very far without his support and humor.
Roxanne Turner edited and helped publish the report.
The residents of western Alaska, who are angered by the plastic trash on their beaches, provided us with information, at some expense in terms of their time and their effort. All we had to do is tell people we were working on MARPOL. They knew what it meant. They dropped what they were doing to help. They made us feel welcome and valued our work.

SWAMC MARPOL Report - Page 68 - September 1989
APPENDIX A
Glossary of Abbreviations, Acronyms, and Terms
We've tried to explain what these terms mean for MARPOL and coastal Alaskans rather than simply define them.
Other definitions can be found in the main body of this report. For Coast Guard legal type terms, see Sec 4.2. For an explanation of the types of trash, see Table 6-1. For a list of the abbreviations used for common types of plastics, see Table 10-1.
Some definitions are for terms we've avoided using in this report, but are found in MARPOL regulations and more profoundly written technical reports. ------------------------------------------------------------GOVERNMENT TERMS
"MARPOL" stands for marine pollution and refers to the International Convention for the Prevention of Pollution from Ships, 1973 that control discharges at sea, especially oily and solid wastes. MARPOI1 has five annexes which each deal with these specific wastes.
"Annex V" refers to plastics and other solid waste law under MARPOL
"AAC" stands for Alaska Administrative Code, which are regulations made by state agencies. The number before the AAC tells you which department's regulations they are. For example, 18 AAC means the Department of Environmental Conservation. Violations of regulations are most often misdemeanors, meaning fines up to $5,000 and jail up to one year.
"AS" stands for Alaska Statute, which are laws passed by the Legislature and having more clout than regulations. They often carry more penalties for their violation.
"CFR" stands for Code of Federal Regulations, the publication that lists all rules of federal agencies.
"RCRA" refers to the federal statute that defines hazardous wastes and manages them. RCRA is often called a "cradle-tograve" tracking system that tries to prevent midnight dumping of hazardous wastes by means of a "manifest" that records people's signatures for wastes received. RCRA stands for Resource Conservation and Recycling Act. RCRA sets tough limits on solid waste disposal sites so that they do not become dumping grands for hazardous wastes.

SWAMC MARPOL Report - Page 69 - October 1989
"CERCLA" refers to the federal statute that deals with cleanup of abandoned hazardous waste dumps. CERCLA arose from the Love Canal incident and is often called the "Superfund" law.
"law" means all things that govern our acts. Law includes statutes passed by legislatures, acts of Congress, regulations of agencies, and terms of agency permits.
"rules" mean regulations passed by agencies. In this report, we've especially tried to use "rules" when we refer to federal regulations.
ENVIRONMENTAL TERMS
"leachate" means the liquid waste that flows from landfills. Leachate contains dissolved organic impurities and often reeks of sulfide gas. It encourages overgrowths of bacterial slimes in streams. Leachate sometimes contains other toxic compounds.
"bottom ash" means the heavy residues shoveled out of incinerators.
"fly ash" means the light residues that are generally removed by air pollution control devices from the exhaust stacks of incinerators.
"electrostatic precipitator" means an air pollution control device that removes dust by attaching an electrical charge to the dust and attracting the dust to a charge plate.
"dRDF" stands for densified refuse derived fuel. dRDF is made from garbage by shredding, air separating the light paper and plastics, drying, and compressing the garbage into pellets. Pellets contain less metal and toxic matter than garbage.
"dunnage" means the packing material placed inside boxes to prevent damage to the contents of the box. Dunnage includes bubble wrap and expanded foam plastics, like popcorn.
"clinker" means unburned ash residue that has formed into clumps. Clinkers do not necessarily have unburned plastic in them.
"graywater" means waterborne wastes that do not contain excrement, such as sink, laundry, and shower drainage.
"victual waste" means waste foodstuff.
"disease vector" means a carrier of a disease organism, like a rat carries fleas or a fly carries germs.

SWAMC MARPOL Report - Page 70 - October 1989
"conuninuter" means an industrial-strength garbage grinder.
ABBREVIATIONS
"mm" means million, "k" means thousand
"lb/capday" means pound (of waste) per capita per day
"Btu" means British thermal unit, a measure of how much heat can be obtained by burning something.
11 cuft 11 means cubic foot. About 7.5 gallons make a cuft.
"cuyd" means cubic yard. About 202 gallons make a cuyd.
"kg" means kilogram, about 2.2 pounds. Scientists use kg and other metric measures. We've tried to avoid metric measures in this report.

SWAMC MARPOL Report - Page 71 - October 1989
APPENDIX B
Layman's Guide to MARPOL Annex V
Reference to the International Convention for Prevention of Pollution from Ships, 1973, and Federal Registers dated April 28, 1989, October 27, 1988, and June 24, 1988.
4.1 History
On December 31, 1988, Annex V of the International Convention for the Prevention of Pollution from Ships (MARPOL) became law. The United States had signed MARPOL upon its creation in 1973, but, until 1988, had not signed Annex v. Annex v sets limits on the disposal of garbage at sea and prohibits the disposal of ANY plastics into the sea.
Annex V applies to all U.S. vessels, wherever located, and to all foreign vessels in U.S. waters or within the 200 mile Exclusive Economic Zone of the United States.
4.2 Plastic and Garbage Disposal Rules
The disposal into the sea of all plastics such as synthetic ropes and lines, synthetic fishing nets, monofilament line, strapping bands, visqueen, six-pack yokes, soap or beverage bottles, garbage bags, styrofoam and plastic lined cups, "degradable" or not -- is prohibited.
Disposal of the following garbage shall be made as far as practicable from the nearest land. Disposal is prohibited if the distance from nearest land is less than
a) 25 miles for dunnage, lining, and packing materials, which will float;
b) 12 miles for food wastes and other wastes such as paper products, rags, glass, metal, bottles, and crockery;
c) 3 miles for items above in (b) that have been ground up smaller than one inch in size.
When the garbage is mixed with other garbage having different requirements, then the more stringent requirements shall apply.
In peril, vessel nets to save their ships. to bring in other people's their nets.
operators can cut loose plastic Also, fishermen are not required garbage that becomes entangled in
4.3 Port and Terminal Rules
Each day of operation, a port or terminal operator must provide or ensure the availability of a reception

SWAMC MARPOL Report - Page 72 - October 1989
facility capable of receiving garbage that a ship wishes to discharge except
a) large quantities of spoiled or damaged cargoes not usually discharged by a ship; or
b) garbage from ships not having commercial transactions with that port or terminal.
Those in charge of a port or terminal must ensure that their garbage reception facility
a) is arranged so that it does not interfere with port or terminal operations, and so that garbage that has been discharged cannot easily reach the water; and
b) holds federal, state, and local permits or licenses required by environmental and health laws regarding garbage.
A ship repair yard operator must provide facilities for complete transfer of garbage from a ship before the ship departs from the yard.
4.4 Animal and Plant Health Inspection Service Wastes
Ports and terminals must be able to receive APHIS "quarantined" garbage within 24 hours of notice of such incoming garbage. APHIS wastes include meat, dairy, and produce garbage originating from foreign ports. For APHIS purposes, Canada does not count as "foreign." APHIS disposal facilities usually involve incinerators or sterilizers. APHIS must approve a written agreement specifying handling and disposal details.
4.5 Certificates of Adequacy (COA) will be issued by the Coast Guard to certify ports or terminals meet rules for vessel garbage reception facilities. All ports and terminals must provide garbage reception facilities, but not all are required to apply for COAs. Under the interim rules, ports and terminals must have COAs if they receive
a) oil tankers or ships of 400 gross tons or more; or b) oceangoing ships carrying Noxious Liquids; or c) more than 500,000 lbs/yr of commercial fi~h
products.
Upon application for an Annex v COA, an applicant must certify APHIS waste handling ability or request a waiver.
4.6 Waste Disposal of ship-generated waste follows.
If the plastics have been . separated for on-shore disposal, then the remaining garbage may be
a) incinerated on board the ship; or b) disposed of at sea if far enough offshore
per Annex V; c) retained on board for disposal ashore.

SWAMC MARPOL Report - Page 73 - September 1989
c) retained on board for disposal ashore.
If the plastic is mixed with other types of garbage, then the mixed garbage
a) may be incinerated on board the ship; or, b) must be retained for disposal ashore.
If incinerator ash contains visible lumps of plastic, the ash can not be disposed of overboard. If incinerator ash contains no lumps of plastic, the ash can be thrown overboard outside the three mile zone. There is debate over this provision and it may be modified.

SWAMC MARPOL Report - Page 74 - October 1989
APPENDIX C
Solid Waste Loads and Costs in Other Coastal Alaskan Communities
As part of this study, the costs of disposal and collection of solid waste in many other coastal Alaskan communities were obtained and evaluated for comparison purposes. This information was also used to calculate unit costs for collection and disposal for use in Section 14 discussing Models.
These cost data were obtained from a) operating records of communities and contractors; b) engineering reports and feasibility studies; c) grant applications and agency budget records; and d) manufacturer's claims and information.
Beware of easy comparisons between the various sets of information. Also beware of comparisons from one supposedly similar set of data to another. Often, significant factors are overlooked, sometimes split and sometimes lumped. Some excellent operators keep sloppy records and some sloppy operators keep excellent records. The same question can result in different answers on different days. And time changes most information, especially with equipment costs.
SITKA Incinerator/Heat Recovery Operating Records Re: City and Borough of Sitka Public Works [Ref 38]
Capital Costs:
Operating Costs:
Collection Cost:
Revenue:
$3,200,000 100,000 301,000/yr 155,000/yr 300,000/yr
1985 1988 Incinerator Landfill
$756,000/yr tipping and collection fees
1985 capital costs included an incinerator and electrostatic precipitator for air emission control, while 1988 capital costs included an upgrade of air emission control and solving building problem.
The incinerator reduces volume by 80 percent, with ash disposed of at landfill. The landfill life span has increased from 5 to 40 years. Contributing to the operating costs, the landfill also receives items such as building materials and construction debris.
The revenue figure does not include heat sales to Sheldon Jackson college.

SWAMC MARPOL Report - Page 75 - October 1989
Volume: Averages 20 tons a day or 120 tons a week based on a six ·day week.
Background: Sitka installed an incinerator in 1985 that was designed to provide all heat to Sheldon Jackson College. The trash of the City of Sitka currently heats the college as well as a new gymnasium.
The incinerator has a rated capacity of 25 tons a day, which is more than adequate for the 20 tons a day of trash generated by the city. The incinerator runs on temperatures of between 1600 and 1800 degrees F, with 1800 F being optimum.
Sitka contracts with a private contractor for collection. Trash is not sorted at the incinerator. Some items such as building material and construction debris are taken directly to the landfill because of the size. Other items such as roofing material cannot be burned at the incinerator and are also taken directly to the landfill.
The dust from the incinerator is bagged and disposed of at the landfill. Jerry Simpson, the city public works director, estimates an 80 percent reduction in volume of municipal solid waste as a result of the installation of the incinerator. He also claims, "According to EPA, we have the best landfill in Alaska."
City ordinance mandates that everyone with an electrical hook-up be assessed a fee for garbage collection. Residential customers are charged two minimum monthly fees, $6.75/month for collection and $6.00/month for what Sitka refers to as a landfill charge. Payment of the monthly fees entitles residential customers to two free cubic yards in addition to what is collected, provided it is taken to the incinerator.
For any waste in excess of the two cubic yards, or any waste taken directly to the landfill, a 3.00 cubic yard tipping fee is assessed. A similar structure is set up for commercial customers. All operating and maintenance costs of the incinerator and landfill are paid by the user fees. The fee structure does not include replacement costs for the incinerator.
There have been some complaints from residents about emissions. City officials have conducted random air quality tests and have found no problems. The City is working on developing a continuous testing program to help alleviate resident concerns. Sitka uses the DEC hazardous waste disposal program and finds it satisfactory.

SWAMC MARPOL Report - Page 76 - October 1989
CORDOVA Re:
Baler/Landfill Operating Records Cordova Refuse Inc [Ref 39]
Capital Costs:
Operating Costs: Collection Cost:
$1,206,000 1985 750,000 1980 136,000/yr 252,000/yr
1985 capital costs included baler, building, and land. The land was purchased in 1980 for $750,000.
The annual operating costs are estimated by contractor for baler, utilities, labor, landfill cover material, and rent to city.
Volume: Averages 10 bales a day or 50 bales a week based on a five day week. Average weight, 1250 lbs per bale.
Background: In August 1988, the City of Cordova signed a five year contract with Cordova Refuse Inc. for garbage collection and disposal. Cordova requires residents living within city limits to pay for garbage pickup by attaching charges to electric bills. The City collects the pick up fees and turns them over to the contractor. CRI pays the city a monthly rental fee for the baler/landfill.
The baler at Cordova is the smallest that was on the market in 1985, rated at 2.5-1 or 3-1 compacting ratio. The baler hopper measures three feet by 3.5 feet.
Roger Bartlett of CRI describes the solid waste in Cordova as typical, with the exception of construction debris and fishing nets. The debris and nets, about 10 percent of the total volume, go directly to the landfill. This estimate depends on the time of year and how well fishing season fares. In winter, most everything is baled.
Cordova disposes of 15-20 fishing nets a month which are also handled ·separately and buried.
No significant problems with the baler/landfill appear. Seagulls and crows do hover about, but they're more likely attracted to the seafood plants.
Pelletizer: In sununer 1989, CRI will install a pelletizer at no cost to the City. Don Moore, city manager, states, "Municipalities don't want to be on the leading edge of technology, but we'd like to see Alaska Solid Waste's pelletizer work." The City and CRI have an unusual agreement. The City has a contractor to maintain and operate their baler/landfill, and to provide collection services at no cost to the City. When the pelletizer ~s

SWAMC MARPOL Report - Page 77 - October 1989
installed and operating according to plan, up to ninety percent of Cordova's garbage will be recycled. The City can reap the obvious benefits with little risk or capital outlay. CRI will risk its capital expenditure on an oncetested prototype.
Cordova Refuse affiliates with Alaska Solid Waste of Fairbanks. ASW has patented a device that classifies and recycles trash. ASW estimates 70 percent of the garbage will be processed into densified refuse derived fuel (dRDF), commonly referred to as "pellets." Pellets can be burned in home wood stoves or in furnaces designed to burn solid fuel, such as coal.
CRI bases its profit in Cordova on the sale of resources recovered from the solid waste. If the project works, CRI and ASW will have proven a technology that currently doesn't exist on this small a scale.
If the pelletizer works according to plan, the life span of the landfill will increase from 5-8 years to 15-18 years.
According to Bartlett, the pelletizer can handle any wood, pallets, or construction debris that does not exceed a
11 4x12" in size. Nets will foul the pelletizer and will still have to be buried. Cordova Refuse plans to sell the pellets for home heating and sell scrap metal for recycling.
Cost estimates for a pelletizing operation, based upon a 50 ton per day maximum capacity device are
Capital Costs: Operating Costs:
$1,200,000 160,000
The capital costs include delivery and installation, but do not include a building or office.
The operating costs do not include debt service for equipment or building. The figure assumes about 6.25 tons/day for five days a week of Cordova waste and
Labor:
Supervisor: Maintenance: Utilities: Insurance/Overhead:
2 men @ $ 12.50/hr + 33% benefits $ 170/day (incl benefits) $ 148/day (incl benefits) $ 2.27/ton $ 1. 50/ton
These costs do not consider revenue from sale of dRDF pellets or metals. If 60 percent of the waste converts to dRDF and sells at $98/ton (the energy equivalent of #2 heating oil at $0.85 per gallon), about $100,000 per year would be recovered as revenue. With 1 percent aluminum at

SWAMC MARPOL Report - Page 78 - October 1989
$0.30 per pound and 5 percent metals at $25 per ton, the metal revenues would be $12,000 per year. Thus, with energy and metal recovery, about 70 percent of the palletizing operating costs will be paid.
JUNEAU Incinerator Operating Records_ Re: Channel Sanitation Inc [Ref 40]
Capital Costs: Operating Costs:
$3,500,000 1983 $1,850,000/yr
The 1983 capital costs included $375,000 for an electrostatic precipitator for air emissions control.
The annual operating costs includes landfill for ash and oversize items. Yearly cost assumes six days per week, and doesn't include reserve. Operating cost breakdown:
Item
Maintenance, Repair overhead Reserve, Profit
Total
Cost $/ton
100
45 40 15
PETERSBURG Solid Waste Engineering Feasibility Study Re: City of Petersburg Engineer [Ref 5]
Capital Costs Operation Costs/yr
Incinerator Landfill w/o Heat Rec
$6,000,000 345,000
$2,200,000 226,000
Incinerator w/ Heat Recovery
$3,200,000 321,000
This well-researched engineering feasibility analysis sets a model for future solid waste costs. The costs cited above are only one set of a large number of cost options presented. The options considered compliance with strict new landfill rules, including leachate collection and treatment, testing for hazardous wastes, monitoring for groundwater contamination, fencing, daily cover of wastes, and so forth. Likewise, it considers the new limits on incinerator operations, including air pollution control and ash disposal. The study assumed
a 1987 population of 3300, with several growth patterns; several money inflation schemes and bond interest rates; a per capita waste generation rate of 6.7 pounds per day, with consideration of future waste composition changes; and an average heat content of 5500 Btu/pound.

SWAMC MARPOL Report - Page 79 - October 1989
During the course of the study, city staff evaluated six manufacturers of incinerators, with calls to owners of incinerators for operating experience. They also evaluated heating needs and seasonal patterns of various possible heat customers, such as schools, government offices, and institutional housing.
These options and costs have been shown on the following graph. "!+Recover Heat" means incineration with a heat recovery system.
$8,000,000
$5,000,000
$4,000,000
~ 0 u _, $3,000,000 4( I-a: 4( u
$2,000,000
$1,000,000
$0
T.,._ 13-1 PETERSBURG WASTE OPTIONS Pop 3300 Cl 8.7 lb/capday 5500 Btu/lb
LandflU Incinerate Incl leachate, al,. emlMlon controla
Ill Capital Coat • ArnJal Operating
$400,000
$300,000
$200,000
$100,000
This comparison provides foresight to future costs of landfill operations that comply with RCRA laws. Costs above do not include revenue from sale of heat.
For landfills, capital costs include berms, leachate collection, treatment, and outfall system, surface water, diversion systems, closure of the existing dump, offices, scales, fencing, and monitoring wells. Operational costs do take into consideration such items as depreciation for landfill equipment, labor, supplies, overhead, and prepayments for construction of the next incremental landfill cells.
For incineration, capital costs include both baghouse and dry lime air pollution control devices, a road to the
. ash landfill, scales, building for incinerator, office, and pollution control devices, fencing, closure of the existing
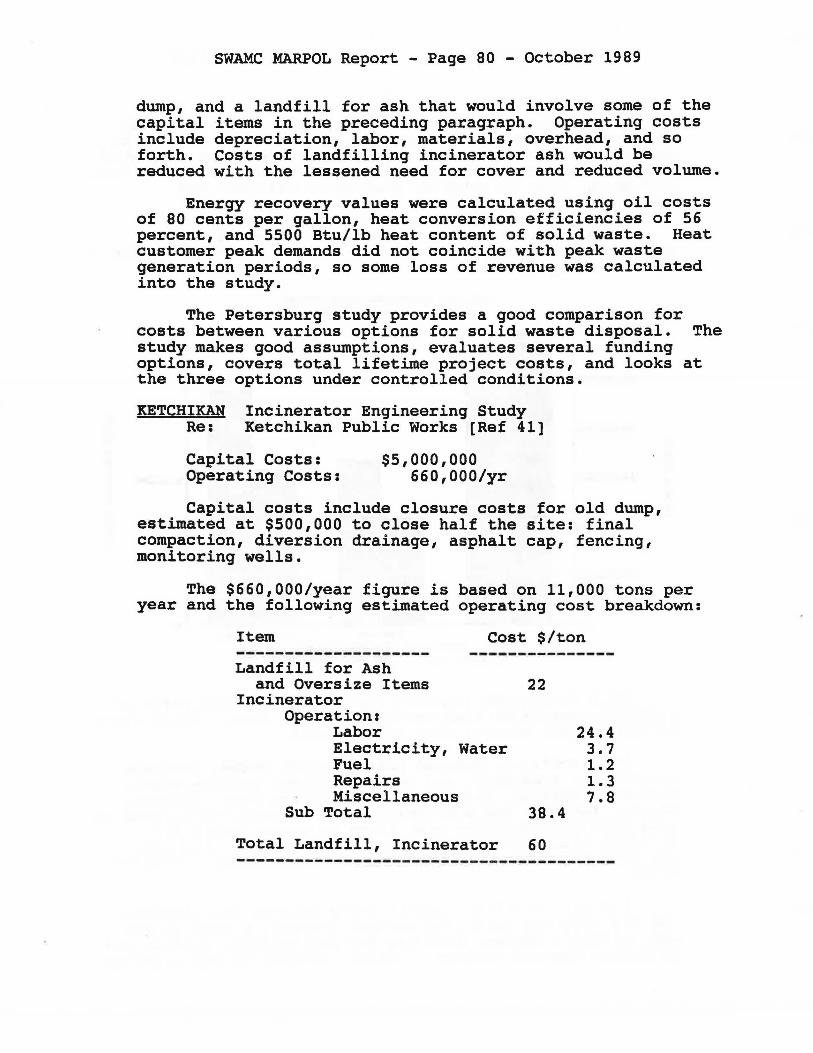
SWAMC MARPOL Report - Page 80 - October 1989
dump, and a landfill for ash that would involve some of the capital items in the preceding paragraph. Operating costs include depreciation, labor, materials, overhead, and so forth. Costs of landfilling incinerator ash would be reduced with the lessened need for cover and reduced volume.
Energy recovery values were calculated using oil costs of 80 cents per gallon, heat conversion efficiencies of 56 percent, and 5500 Btu/lb heat content of solid waste. Heat customer peak demands did not coincide with peak waste generation periods, so some loss of revenue was calculated into the study.
The Petersburg study provides a good comparison for costs between various options for solid waste disposal. The study makes good assumptions, evaluates several funding options, covers total lifetime project costs, and looks at the three options under controlled conditions.
KETCHIKAN Incinerator Engineering Study Re: Ketchikan Public Works [Ref 41]
Capital Costs: Operating Costs:
$5,000,000 660,000/yr
Capital costs include closure costs for old dump, estimated at $500,000 to close half the site: final compaction, diversion drainage, asphalt cap, fencing, monitoring wells.
The $660,000/year figure is based on 11,000 tons per year and the following estimated operating cost breakdown:
Item Cost $/ton
Landfill for Ash and Oversize Items
Incinerator Operation:
Labor Electricity, Water Fuel Repairs Miscellaneous
Sub Total
22
38.4
Total Landfill, Incinerator 60
24.4 3.7 1.2 1.3 7.8
---------------------------------------

SWAMC MARPOL Report - Page 81 - October 1989
KENAI/SOLDOTNA Operating Landfill and Projected Baler Data Re: Environmental Conservation (Ref 34]
Capital Costs: Operating Costs:
$5,400,000 1,312,000/yr
Capital expenses include the cost of closure of Kenai landfill, construction of a Kenai transfer station ($755,000 to serve 14,136 population), construction of a baler at the Soldotna landfill, and upgrading the Soldotna landfill (installing a liner, etc.) to meet new standards.
The operating costs include cost of operating Kenai transfer station. The operational cost of old Kenai landfill was $817,000 per year to serve a population of 26,000.
27,700 people are served by combined systems.
SKAGWAY Incinerator Engineering Estimates Re: Environmental Conservation (Ref 34]
Capital Costs: Operating Costs:
$771,000 91,700/yr
The capital costs include building, office, scales, air emission control devices, and provision for recycling equipment.
HOMER Landfill/Baler Operating Records Re: City of Homer (Ref 42]
Capital Costs: Operating Costs:
$3,100,000 246,000/yr
The landfill/baler serves a population of 10,400.
SEWARD Landfill/Baler Engineering Estimates Re: Environmental Conservation (Ref 34]
Capital Costs: Operating Costs:
$3,769,000 $350,000/yr
The landfill/baler serves a population of 4,426. The capital costs include a new landfill site with liner.

SWAMC MARPOL Report - Page 82 - October 1989
Summarizing Capital and Operating Cost data presents difficulties for interpretation. Use of existing operating records has a greater reliability, but the costs of equipment have increased. Use of engineering studies requires careful judgement and good sense of the future permit stipulations and the crystal ball of economics and future inflation and dollar values. It's best to compare existing records of incinerators with existing records of landfills. Likewise, compare engineering projections of incinerators with engineering projections of landfills.
COMPARISON OF EXISTING RECORDS
Existing Disposal Methods
Landfill Unalaska
Landfill/Baler Kodiak Cordova Homer
Incinerator no Heat Juneau
Incinerator w/ Heat Sitka
Capital Costs $/Person
110
346 1313
298 Recovery
119 Recovery
458
Operating Costs $/Person/Year
46
17 57 24
61
63 -------------------------------------------------------
COMPARISON OF ENGINEERING PROJECTIONS
Proposed Disposal Methods
Landfill Petersburg
Baler/Landfill Soldotna Seward
Capital Costs $/Person
1818
195 850
Bristol Bay Borough 353 Incinerator no Heat Recovery
Ketchikan 417 Petersburg 667 Skagway 1000
Incinerator w/ Heat Recovery Petersburg 970
Operating Costs $/Person/Year
105
47 79 44
55 68 115
97 ---~----~-----~----------------------------------------
Even with like comparisons, the costs are difficult to interpret. Some baler operating costs include landfill costs -- others do not. Some landfills include the cost of land -- others do not. Neither revenue from scrap metal recycling nor that from heat recovery sales has been included. Many details have been lost in the above summaries. Use the summarized information with caution.

SW.AMC MARPOL Report - Page 83 - Appendix D
P.L. lOG-220
S«. 2001
Marin• PluUc Polluuoa ~hand Conl.r'OJ Ad. ol 1987. 33 USC 1901 nae..
S3 USC 1901.
LAWS OF lOOth CONG.-llt SESS.
TITLE II-PLASTIC POLLUTION RESEARCH AND CONTROL
SEC. ZOOI. SHORT TITL&.
Dtt. 29
Thia title may be cited u the "Marine Plutic Pollution Reeearc.b and Control Act of 1987".
SEC. Z001. EFFEC1'1VI DAT&.
. ~a) lH GENDAL-E;J:cept u provided in 1u~o11.1 (b) and (c), thia tttle 1haU be effective on the date on which Annex V to the International Convention for the Prevention of Pollution from Shipe. 1973, entel"I into force for the United State..
(b) ExC'SJ"T10N8.--8ection.1 2001, 2002, 2003, 2108, 2202, 2203, 2204, and subtitle C of this title 1haU be effective oo the date of the enactment of thi.I title.
(c) lsauANcs or Rzotn.AnoNa.-(1) lH ODIDAL.-The authority to preecribe regulation.
punu.a.at to thia title ahall be effoc:tive on the date of enactment of thil title.
(2) Enscnw DA,.. or R..IOULATIONll.-Any reculatioa preacribed punuant to thlli title 1hall not be effec:t:ivw before the effective date o{ the proviaioa of thil title under which the regulation i.a preacribed.
SEC. %tOI. PRDMPT10N; ADDmONAJ. STATE REQUlllDIENT&.
(a) PunanoH.-Exoept u 1pecifically provided in thi.a title. nothina in thlli title &hall be interpreted or co111trued to 1upe~e or preempt any other proviaion of Federal or State law, either irtatu· tory or common.
(b) AoomoNA.L Su:rs R.&QvmnaNTll.-Nothing in thlli title 1h.all be con.trued or interpTeted u preemp~ any State from impo.i..D.i any additional requintmeat&.
Subtitle A-Amendments to Act to Prevent Pollution From Ships
SEC. Ziii. D£FINITION8.
Section 2 of the Act to Prevent Pollution from Shipe (33 U.S.C. 1901et1ea.) ia amended u follow-.:
(l) '1(a)" ia inaerted aft.er "Sa:. 2.". (2) Subeection (a)( U (u redMilnat.ci) 1a amended to read aa
(ollOWt: "(1) 'MARPOL Protocol' means the Protocol of 19'78 relatina
to tM lntemational Convention for the Prevention o( Pollutior: from Shlpe. 1973, and includ• the Convention;".
(3) Sublection (a)(2) (u redeei{Mt.ed) ii amended by ltrik1nf all after "and" the MCOnd time at ae_pean and inMrtina in lie1: ther90( th• followinr: "An.nu• I. II. and V thereto, incluclini any modification or ameod.menta to the Convent.ion. Protocola or Annu• which h.avw entered into form for the Unitec State.;".
(4) Subeec:tion (a)(S) (&1 rede.i.anated) ii amended by i.n.Mni.n, "and 'g&rt>..p'" a.ft.r "diach.arre".
(6) The followif\i la added at the end o( NCt.ion 2:
101 STAT. 1460

SWAMC MARPOL Report - Page 84 - Appendix D
Oec. 29 U.S.~APAN FISHERY AGREEMENT
"(b) For purpoee8 of thil Act, the requirement. of Annex V shall apply to the navigable waters of the United Statee, u well u to all other watens and vesaela over which the United Statee has juri.9diction. ".
P.L. 100-220 Sec. 2103
SEC. %10%. APPLICATION OF ACT. 33 USC 1902.
(a) IN G&NDAL-Section 3'a) of the Act to Prevent Pollution from Shipe ia amended to read u followa:
"(a) Thia Act shall apply-"(l) to a 1hip of United Statee registry or nationality, or one
operated under the authority of the United Statee, wherever located;
"<2> with respect to Annexes I and ll to the Convention, to a ship, other than a ship referred to in paragraph (1), while i.o the navigable waters of the United Statee;
''{3) with respect to the requirement.a of Annex V to the Convention, to a 1hip, other than a 1hip referred to i.n paragraph (1), while in the navigable waters or the excluaive ~ nomic zone of the United Sta tee; and
"(4) with respect to regulations preecribed under aect.ion 6 of th.is Act, any port or terminal i.o the United States.".
(b) Exci.uatoNa.-Section 3{b) of the Act to Prevent Pollution from Shipe ia amended to read as followe:
"(b)( 1) Except aa provided in paragraph (2), thla Act shall not apply to-
"(A) a w&r11hip, naval auxiliary, or other ship owned or oper· ated by the United Statee when engaged in noncommercial service; or
"{8) any other ship specifically excluded by the MARPOL Protocol.
"(2)(Al Notwithatanding any proviaion of the MARPOL Protocol. and subject to subpanlgTaph <Bl of this paragraph, the requirement.a of Annex V to the Convention shall apply aft.er 5 years after the effective dat.e of thia paragraph to a ship referred to in paragraph ll>IAl .
.. (8) Thia paragraph shall not apply during time o{ war or a declared national emergency.".
<cl Rl:CULATIONs.-Section 3(c) of the Act to Prevent Pollution from Shipe ia amended to read as folloW'll:
.. (c) The Secretary shall preecribe regulation. applicable to the 11hipe of a country not 11 party to the MARPOL Protocol. including regulation.a conforming to and giving effect to the requirement.a of Annex V aa they apply under subee<=tion (al of section 3. to enaure that their treatment is not more favorable than that accorded shipe to parties to the MARPOL Protocol.''.
SEC. %103. POLLUTION RECEPTION FACILITIES. :1:1 USC 1905
(al Drt"U.M1NATION OP ADEQUACY OP FActuiia:s.-Section &al of the Act to Prevent Pollution from Shipe is amended-
t l I ~Y inserting "( l J" immediately art.er "(al"; . <2l 1n .subeeoction <aXll, aa so redesignated, by striking"~~
t1on fac1l itiea of a port or terminal" and inserting in lieu thereof th~ following: .. a port 's or terminal's reception facilitiea for mixtures containing oil or noxious liquid subetances": and
t31 by adding at the end the following: "l2l_The St-cretary. after consulting with appropriate Fe-deral fU.trulauona
agencies, shall est.abliah regulations settanl{ critttria for deter·
101 STAT. 1461
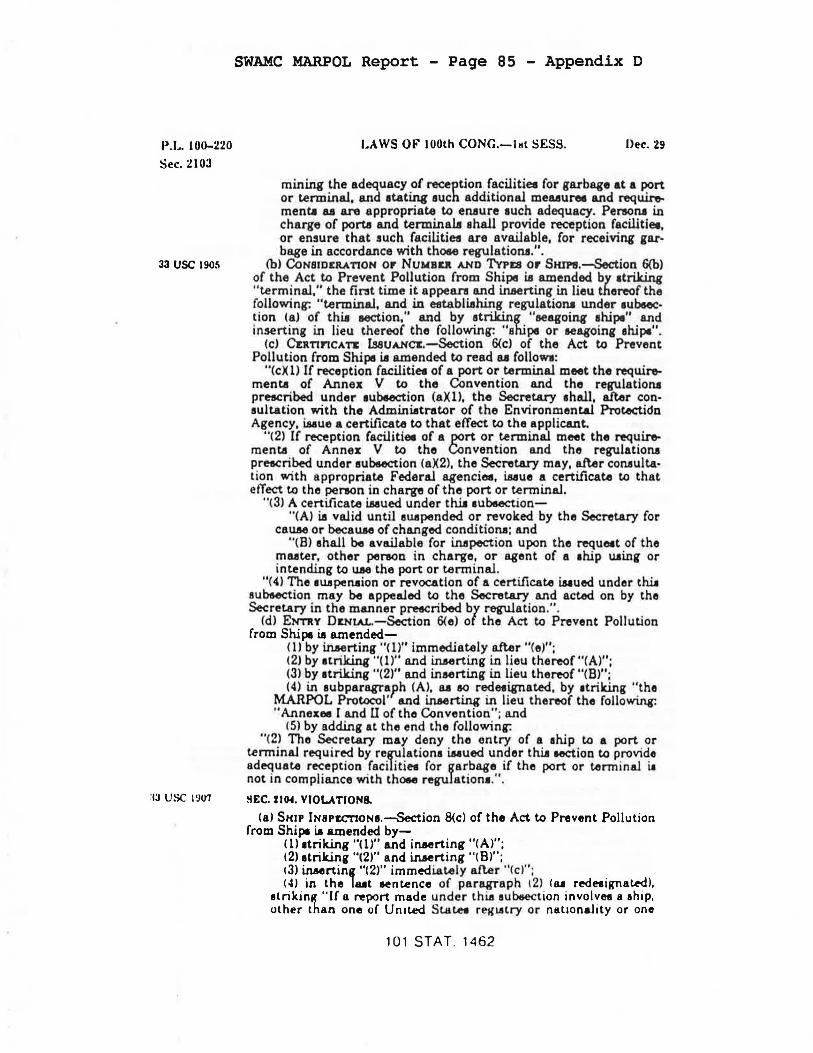
P.L. 100-220
Sec. 2103
33 USC 1905
:1:1use1901
SWAMC MARPOL Report - Page 85 - Appendix D
LAWS OF lOOth CONG.-1"t SESS. Dec. 29
mining the adequacy of reception facilities for garbage at a port or terminal, and 1tating such additional mea.aun!ll and requirement.I a.a are appropriate to enaure such adequacy. Person.1 i.n charge of porta and terminals shall provide reception facilitiee, or ensure that such facilities are available, for receiving garbage in accordance with those regulationa.".
(b) CoNstDl:RATION or Nuwsu A.ND 'I'Yl'l::S or SKIPll.-8ectioa 6(b) of the Act to Prevent Pollutloa from Shipe is amended by atriking "terminal," the fir.it time it appears and i.rulerting in lieu thereof the following: "terminal, and in establishing regulation. under 1ubeection (a) of this aection," and by striking "seagoing shipe" and inserting in Heu thereof the following: "ehipe or seagoing shipe".
(c) CERTIFlCAT'I lsauA.Nci.-Section 6(c) of the Act to Prevent Pollution from Shipe i.a amended to read u follow.:
"CcXl) If reception facilitiee of a port or terminal meet the requirementa of Annex V to the Convention and the regulatiorui prescribed under 1ub.ection (a)( 1), the Secretary 1hall, after con· sultation with the Administrator of the Environmental Protectida Agency, i.saue a certificate to that effect to the applicant.
"(2) If reception facilitiee of a port or terminal meet the requirernenta of Annex V to the Convention and the regulationa preecribed under sub.ection <aX2), the Secretary may, atUr consultation with appropriate Federal agencies. iaaue a certificate to that effect to the person in charge of the port or terminal.
"(3) A certificate iMued under th.ii aubeection-"(A) i.a valid until suspended or revolted by the Secretary for
cause or because of changed condition.a; and "(B) shall be available for i.rupection upon the requett of the
maater, other peraon in charge, or agent of a 1hip wing or intending to u.ae the port or terminal.
"(4l The 1u.apen.aion or revocation of a certificate iaaued under tha subsection may be appealed to the Secretary and acted on by the Secretary in the manner preecribed b/ regulation.".
(d) ENTKY DltNLU.-Section 6(e) o the Act to Prevent Pollution from Shipe is amended-
(1) by iruerting "(l)" Immediately after "(el"; t2) by atrik.ing "(l)" and in.aerting in lieu thereof "(A)"; (3) by striking "(2)" a.ad inserting i.n lieu thereof "(BJ"; (4) in aubparagnph (AJ, u so redeaignated, by 1trilci.ng "the
MARPOL Protocol' and iruerti.ng in Heu thereof the following: "Annexes I and 11 of the Convention"; and
( Sl by adding at the end the following: "(2) The Secretary may deny tho entry of a ah.ip to a port or
terminal required by regulations iaaued under this section to provide adequate reception facilities for garbage if the port or tenninal i.a not in compliance with those regulation•.".
!iEC. %ICM. VIOLATIONS.
(al SHIP INSPECnONs.-5ection 8(c) of the Act to Prevent Pollution from Shipe ii amended by-
( 1) •triking "(l)" and inaerting "(A)"; <2) striking "(2)" and i.Nerting "(Bl"; 13) inaerting "(2)" immediately after "lcl"; (4) in the lut eent.ence of paragraph t2l (a.1 redeeignat.edl,
atrikjnif "If a report made under thi.a subtiection involvee a ship, olher than one of Unat.ed St.ate. rel{i.atry or nationality or one
101 STAT. 1462

SWAMC MARPOL Report - Page 86 - Appendix D
oee. 29 U.S.-JAPAN FISHERY AGREEMENT
operated under the authority of the United States, the" and inaerting "The"; and
P.L. 100-220 Sec.2106
(51 ineerting before paragraph C2l Cu redesignated) the follow· inc: "(11 Thia 1ubeection appliet to in1pection. relating to poeaible violation• of Annex I or Annex II to the Convention by any seagoing ship referred to In MCtion 3CaX2> of thil Act.".
(b) SHIP IN!PICTIONI Ont11t THAN AT PORT oa TIRMINAL-5ection 33 USC 1907. 8 of the Act to Prevent Pollution from Shipe ii amended by re-de1iguting sut.ection Cd) a.t 1umection <O and inserting after 1ubleetion <cl the fallowing:
"Cd)(U The Secretary may inspect a 1hip referred to in aection 8(aX8) of thil Act to verify whether the 1hip hae dispoMd of garbage in violation of Annei: V to the Convention or thil Act.
"(2) If an inspection under thil 1ubMction indicates that a viola· tion haa occurred, the Secretary may undertake enforcement action under .ection 9 of thil Act.
"CeXll The Secretary mar inapect at any time a 1hip of United States registry or nationality or operating under the authority of the United States to which the MARPOL Protocol appliet to verify whether the 1hip hu dt.charged a harmful 1ubstance or disposed of garbage in violation of that Protocol or thi.1 Act.
"(2l IC an inspection under thia subsection indicates that a viola· tion of the MARPOL Protocol has occurred the Secretary may undertake enforcement action under section 9 of thia Act.".
SEC. ZlOL CIVIL PENALTIES. 33 USC 1908.
(a) PAYMENT P'OR INFORMATJON.-(1) INP'OlllMATION LEADING TO CONVICl10N.-8ection 9(a) of the
Act to Prevent Pollution From Ships ia amended by inserting after the tirst sentence the following: "In the discretion of the Court, an amount equal to not more than Ya of such fine may be paid to the person giving information leading to conviction.".
121 INP'ORMATION LEADING TO A.SSESSMENT Of' PENALTY.-Sec· tion 9(b) o( the Act to Prevent Pollution From Ships ia amended by adding at the end the following: "An amount equal to not more than ~<, of such penalties may be paid by the Secretary to the penon giving information leading to the assessment of such penalties.".
<bl R1:n:UHcs or V1ou.noH TO CouNTKY or REOISTRY OR NAnONAUTY.-Section 9<0 of the Act to Prevent Pollution from Shi1>9 ia amended by •triking "'to that country" and inserting "to the government of the country of the 11hip'1 ~try or nationality, or under whoee authority the 1hip LI operating' .
SEC. ZIN. PROPOSED A~E!"DMENTS TO PROTOCOL. lnt.rnationa.I C!-- • 10 f or1aniu1iona. ~taon o the Act to Prevent Pollution from Shipe is 33 usc 1909.
amended-(1) in 1ubeection Cal, by 1trikin1 "Inter-Governmental Mari·
time Con1ultative Organization" and insertini "International Maritime Orranization"; and
<2> in 1ul>Mction lbl, by 1trikin1 "Anne. I or U, appendicet to the Annexe1, or Protocol I o( the MARPOL Protocol," and inaerting "Annex I, II, or V to the Convention, appendices to thoee Annexn, or Protocol I of the Convention'', and by striking '.'lnte~-Govemment.al Maritime Con1ultative Or~aniution" and 1n.ert1nr "International Maritime Organiiation
101STAT.1463

P.L 100-220 Stt. 2107
33 USC 190:1.
~lations.
lnt.emational ~m•nta.
:1:1 use 1912
:J:J USC 1902 not.e
SWAMC MARPOL Report - Page 87 - Appendix D
LAWS <W IOOth CONG.-l11t SESS. Dec. 29
SEC. %101. ADMINISTRATION AND ENFORCEMENT: REF"USE RECO"D BOOKS: WASTE MANACE~ENT PLANS: NOTIFICATION OF CREW AND PASSENCER!l
(a) ADMINISTll.AnON ANO ENFORCEMENT, GENERAU.Y.-5ection 4(a) of the Act to prevent pollution from ships ia amended to read aa follows:
"(a) Unlesa otherwise specified in this Act. the Secretary shall administer and enforce the MARPOL Protocol and thia Act. In the administration and enforcement of the MAR.POL Protocol and this Act, Annexes I and U of the Convention apply only to seagoing ships.".
(b) REroH IU:coRo Boou; WASTE MANA.CEMENT PuNs; Non.ncATIQN or CREW AND PASSENCERS.-Section 4(b) of the Act to Prevent Pollution from Ships is amended by-
(1) inserting"(!)" aft.er "(bl"; and 12) adding at the end the following:
"(2) The Secretary of the department in which the Cout Guard ia operating shall-
"(A) within 1 year all.er the effective dat.e of thia paragraph, prescribe regulations which-
"ti) require certain ships described in section 3(a)(l) to maintain ref use record book.! and shipboard management plan5, and to display placards which notify the crew and passengen of the requirement.a of Annex V to the Conven· tion; and
"(ii) specify the ships described in section 3(a)(l) to which the regulations apply;
"(Bl seek an international agl"ttment or international agreements which apply requirements equivalent to thoee descnbed in subparagnph (A)(i) to all vesaela subject to Annex V to the Convention; and
"(CJ within 2 yellJ"! all.er the effective date of thia paragraph, report to the Congrese-
"(j) regarding activities of the Secretary under subpara· graph I Bl; and
"(ii) if the Secretary has not obtained agreements pursu· ant to subparagraph <Bl regarding the desirability of apply· ing the requirements described in subparagraph CAXil to all vesaela described in section 3Ca) which call at United Statee porta.".
SF.C. %108. COMPLIANCE WITH INTERNATIONAL LAW.
The Act to Prevent Pollution from Shipe is amended by adding at the end the following:
"SEC. 17. Any action taken under thia Act shall be taken in accordance with international law.".
Subtitle B-Studies and Report
SEC. %%01. COMPLIANCE REPORTS.
la) IN GENEKAa..-Within 1 year aft.er the effective date of thil section, and biennially thereafter for a period of 6 yean, the Sec· ret.ary of the deputment in which the Coaat Guard ii operating, in consultation with the Sec~tary of Agriculture and the Sec~tary of Commerce, shall ttpor1 to the Con~ regarding compltan~ with
101 STAT. 1464

SW.AMC MARPOL Report - Page 88 - Appendix D
oec. 29 U.S • ..JAPAN FISHERY AGREEMENT
Annex V to the .lntemati~>nal ~nvention for the Prevention of pollution from Shipt, 1973, lll United Stat.et waten.
(b) RUO•T ON lNABll.JTY TO CoMPLY.-Within 3 yean aft.er the effective date of thil Hction, the head of each Federal agency that
ratef or contracta for the operation of any ahip referred to in ::ion 3(bl<1XA) of the Act to Prevent Pollution from Ship1 that en.,. not be able to comply with the requirement.a of that aect.ion .hall report to the Congree1 deacribir18'-
CU the technical and operational impediment. to achieving that compliance;
(21 an alternative 1eheduJe for achievina that compliance u rapidly u ia technologically f euible:
(3) the 1hip1 operated or contracted for operation br the agency for which full compliance with IMIC'tion 3<b)(2)(AJ ia not tochnolQlically feuible; and
(4) any other information which the qency head con.eiden relevant and appropriate.
(cl CoNOllDlllONAL AcnoN.-Upon receipt of the compliance report under 1ubMction (b), the Collf"ll' 1hall modify the applicabil· ity of Annez V to 1hipe referred tom teetion 3(bX1XAJ of the Act to Prevent Pollution from Shipi1, u mar be appropriate with reepect to the requirement.a of Annex V to the Convention.
SEC. ms. EPA mJDY or METHODS TO R&DUCE Pl.Ame POLLUTION.
(a) lN Gl.Na.u..-The Adminiatrator of the Environmental Protec· tion Agency, in conaultation with the Secretary of Commerce, ahall commence a atudy o( the adverae effect.I of the improper diapoeal of plutic articlee on the environment and on wute diapou.l, and the variows methoda to reduce or eliminate auch adverae effect.I.
(b) Soon or Sruov.-A atudy under thi.t aect.ion ahall include the following:
(1) A list of improper di.apoeal practice. and aaeociated specific plutic a.rticJea that occur in the environment with sufficient frequency to cauee death or injury to f1.11h or wildlife, affect adver3ely the habitat of fiah or wildlife, contribute significantly to aesthetic degradation or economic loeaee in coaatal and water· front area.a, endanger human health or safety, or cause other aign.ilicant adverae impacta.
(2) A deecription of specific statutory and regulatory authority available to the Administrator of the Environmental Protection Agency, and the atepe being taken by the Admi.n.iatrator, to n!'duce the a.mount of plaatic materiala th.at enter the marine and aquatic environment.
.<3> An evaluation of the feuibility and desirability of 1ubltitutea for thoee articl• identified under p&.rql"aph (1), ~mparing the environmental and health n.u. co.ta, diapoaabll· 1ty, durabllity, and availability of auch 1ubctitutea.
(4) An evaluation of the impact. of plutia on the 10lid wute atream relative to other 101id wutea, and methoda to reduce thoee impact., including recyclinc.
(5) An evaluation of the impact of pl<ia on the 10lid wute •tn.am relativ. to other aolid wute., and methoda to reduce thoee im~ includinc-
<A) the atatua of a need for public and private reM&rch to develop and market recycled plutic article.;
<Bl methoda to facilitate the recyclini of/lutic materiab by identifyini t~ of plutic articlee to ai in their aortinc.
101 STAT. 1465
P.L. 100-220 Sec.2202
Contn.ci..
42 USC G981 no~.
Wildlife. Sefety.

1'.L. 100-220 Sec. 2202
R.rporu.
•:.! use 6!IH1 nuc..
SWAMC MARPOL Report - Page 89 - Appendix D
LAWS <W IOOth CONG.-ht 8ES8. Dec. 29
and by standardizing typee of plastic materiab, taking into account trade secreta and protection of public health;
CC) incentives, including depoeita oo plastic conlaine~. to increaae the supply of plastic material for recycling and to decreaae the amoWlt of plastic debria, especially in the marine environment;
<0) the effect of existing tax laW'll on the manufacture and distribution of virgin plastic materiala u compared with recycled plastic materia.la; and
<E> recommendationa on incentives and other mea.su~ to promote new wsee for recycled plastic articlee and to encourage or require manufacturen of plaatic a.rt.icles t.o consider re-uae and recycling in product design.
(6) An evaluation of the feasibility of making the a.rt.icles identified under paragraph (1) from degradable plut.ica material., taking into account-
<A> tne risk to human health and the environment that may be preeented by fra.Rmeote of degn.dable plastic articles and the properties oi the end-products of the degnd.ation, including biotoxicity, bioaccumulation, peniatence, and environmental fate;
(8) the efficiency and variability of degradation due to differing environmental and biological condition.a; and
(C) the coat and benefit.a of using degradable articles, including the duration for which such articles were designed to remain intact.
(c) CoNBULTA110N.-ln carrying out the study required by thia section, the Administrator shall corusult with the heada of other appropriate Federal agencies, representatives of affected industries, con.sumer and environment interest groups, and the public.
(d) RuoRT.-Within 18 montha after the date of the enactment of this Act, the Administrator of the Environmental Protection Agency shall report to the Congreee the resulta of the study required by this section, including reoommeodatiorus i.n connection therewith.
SEC. %%01. EFFECl'S OF PLASTIC MATERIALS ON THE ~ARl!'iE ENVIRONMENT.
Not later than September 30, 1988, the Secretary of Commerce shall submit to the Congre1111 a report on the effects of plastic materi.ai. on the marine environment. The report shall-
( l) identify and quantify the harmful effect.a of plaatic mat&ri.al.a on the marine environmE1nt;
(2) aaeeu the specific effect.a of plaatic mat.eri.ai. on living marine reeourcee in the marine environment;
(3) identify the typee and claaeee of plutic material.I that poee the greatest potential hazard to living marine reeourcee;
(4) analyu!, in corusult.ation with the Director of the National Bureau of Stand.arda. plaatic material.a which are claimed to be capable of reduction to environmentally benign aubmitl under the action of normal environmental forcea <including biological decomp011ition, photodegnd.ation, and hydrolyai.a); and
<5) recommend legialation which i.a neceeaary to prohibit, llu. or regulate sources of plaatic material.I that enter the manne environment.
SEC. %?04. PLASTIC POl.LlfTION PUBLIC EDUCATION PROGRAM.
(a) OunuCH Paoouw.-
101 STAT. 1466

SWAMC MARPOL Report - Page 90 - Appendix D
oec. 29 U.S • ..JAPAN FISHERY AGREEMENT
(1) IN GENEllAL.-Not later than April 1. 1988, the Admini&trator of the National Oceanic and Atmoepheric Adminiatration and the Administrator of the Environment.al Protection Agency, in conaultation with the Secretary of Tranaportation, shall jointly commence and thereat\.er conduct for a period of at lea.at 3 yean, a public outreach program to educate the public (including recrutionaJ boauir1, fi11hermen, and other uaen of the marine environmentl reg1r-din1-
f Al the harmful effect.a of plastic pollution: 181 the need to reduce 1uch pollution: ICJ the need to recycte plut1c material1: and !OJ the need to reduce the quantity of plutic debria in the
marine environment. <21 AUTHORIZED Acnvmr:s.-A public outreach program under
paragraph (1) may include-<Al work.shops with interested groups; <Bl public service announcement.: 1C1 diatribution of leaflet. and postAln; and
P.L. 10~220 Stt. 2301
<DJ any other means approp_riaui to educating the public. fbl CinUN POU.UTION PATKOU.-The Secretary of Commerce, Volunt.anmi .
along with the Administrator o( the Environment.al Protection Agency and the Secretary of the Department in which the Coaat Guard is operating, shall conduct a program to encourage the formation of volunteer groups, to be de9ignated aa "Citizen Pollution Patrola", to iuaiat in monitoring, rt'porting, cleanup, and prevention of ocean and short'line pollution.

SWAMC MARPOL Report - Page 91 - Appendix E
Use SW AMC Letterhead
MARINE DEBRIS OUESTIONNAIRE
The Southwest Alaska Municipal Conference (SW AMC) is conducting a study to determine the impact of MARPOL Annex V on various Alaska communities. As part of the study. SW AMC is attempiliig to deter.mine the amount and type of refuse generated by the fishing industry. We would appreciate your assistance in answering the following questions. Please return the questionnaire to SW AMC at the above address or drop in the marked box located outside of the Council meeWie room. All responses will be .kept confidential.
Your Name (optional): Company/Vessel Name (optional): Address (optional):
Phone Number (optional):
1.) Type of ves:iel:
Factory Trawler Longliner _ Crabber _ Catcher /Processor _ Salmon Gillnet __ Salmon Seine
2.) Size of vessel: Length __ _ Width ---
3.) Number of crew:
4.) Homeport:
S.J Length of typical voyage:
Number of days in transit __ _ Number of days fishing __ _
6.) Number of voyages each year:
7.) If you deliver raw product, do you deliver to: Mothership _ Port __
8.J If you deliver to a port, which port(s) and how many limes per year do you normally deliver?
Port Name Number of times per year

SWAMC MARPOL Report - Page 92 - Appendix E
page 2
Port Name ----- Number of times per year
Port Name ----- Number of times per year __ _
9.) If your vessel is a factory trawler or catcher/processor, where and how many times per year do you deliver?
Where ------ Number of times per year __ _
Where------- Number of times per year __ _
Where ------ Number of times per year __ _
1 O.) Please estimate the total amount of refuse generated by your vessel per voyage. This estimate can be in weight, large garbage bags, compactor bags. etc.
11.) Of the refuse generated per voyage, please estimate the percentage that is
Food waste Plastic Non-recycJeable metal and glass Recycleable metal (aluminum, etc.) and glass Packing materials
12.) Where do you store your refuse on board?
13.J What do you currently do with your refuse(
--' --' --" --~ __ i
Throw it overboard __ Deliver it to port __ Burn it __
14.) Is storage space for refuse a problem? Yes No_
1 S.) Do you have a trash compactor on board? Yes No_
If "yes", what kind is it 7 Do you feel that it assists you in storing your refuse? Yes __ No __ Why or why not? --------------------

SWAMC MARPOL Report - Page 93 - Appendix E
page 3
If "no", do you feel that the use of one would: Assist you in storing your refuse Be practical --Be beneficial Be cost effective ---Do you intend to install one? Yes __ No __
18.) Do you have an incinerator on board? Yes__ No __
If "yes". do you feel that it: Assists you in disposing of refuse __ _ Is practical __ _ Is cost effective __ _ Is beneficial __ _ What kind is it? ------------------
If "no", do you feel that use of an incinerator on your vessel would: Assist you in disposing of refuse Be practical __ _ Be cost err ective Be beneficial __ _ Do you in lend to install one 7 Yes __ No _ If "no", why not? Too e1pensive __ Don't generate enough refuse __
Other --------------------------
21.) Do you feel that the people you buy your supplies from are in tune with the need to reduce the amount of generated refuse on your vessel't Yes __ No __
22.l If the people you buy your supplies from were in tune with the need to reduce the amount of generated refuse, how much of a volume reduction do you think could be accomplished on your vessel? -----------
23.) Do you have any suggestions about possible ways to handle refuse?
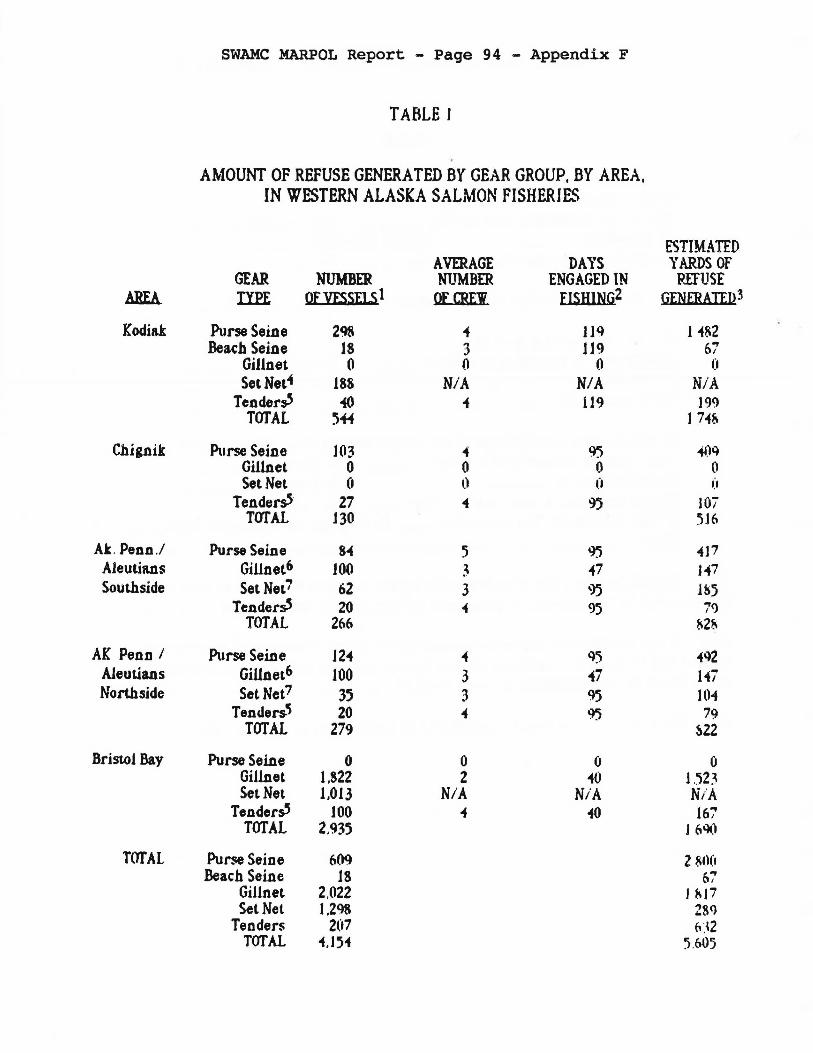
SWAMC MARPOL Report - Page 94 - Appendix F
TABLE J
AMOUNT OF REFUSE GENERATED BY GEAR GROUP, BY AREA, IN WESTERN ALASKA SALMON FISHERIES
ESTIMATED AVERAGE DAYS YARDS OF
GEAR NUMBER NUMBER ENGAGED IN PIFUSE ABEA. !IEE OFVESSEJSl OF CREW FISHING2 GENERAITD3
Kodiak Purse Seine 298 1 119 l 1S2 Beach SeiJle 18 3 119 6"' I
GHlnet 0 0 0 (I
SetNet-i 188 Ni A NIA Ni A Te.odof's5 -fO 1 119 199
TOTAL :;~ J 718
Ch.ig.oilc Purse Seine 103 1 95 ilN Gil.lJlet 0 0 0 0 Set Net (I 0 fl (1
Tenders5 27 4 95 IOi TOTAL 130 516
At . Penn./ Purse Seine 8.f 5 95 4)7 Aleutians GiJJnet6 JOO 3 17 H7 Southside Set Net7 62 3 95 1S5
Tenders5 20 4 95 79 TOTAL 266 ~28
AK Penn I Purse Seine 121 1 95 1Q2 Aleutians Gillnet6 100 3 i7 Hi Northside Set Net? 35 3 95 HH
Tenders.~ 20 .. 95 79 TOTAL 279 ~Z2
Bristo! Bay Purse Seine 0 0 0 0 Gill.net 1.822 2 10 J .523 Set Net 1,013 NiA Ni A N/A
To.ndef's5 100 4 40 167 TOTAL 2.935 J 6~)
TCTTAL Purse Seine 609 2 SO(• Beach Seine 18 67
GiUnet 2.022 J ~J 7 Set Net J.298 28<>
Tenders 207 0 :~2 TOTAL 4.1~4 5.605

Kodiak
Chignik
AK. Penn.I Aleutians
Bristol Bay
TOTAL
SOURCE:
SWAMC MARPOL Report - Page 95 - Appendix F
TABLE 2
AMOUNT OF REFUSE GENERATED BY GEAR GROUP. BY AREA. IN WESTERN ALASKA ROE HERRING FISHERIES
GEAR mE
Purse Seine Combo Gillnet
Tenders TOTAL
Purse Seine Gillnet
Tenders TOTAL
Purse Seine~ Gillnet
Tenders TOTAL
Purse Seine Gill.net
Tenders TOTAL
Purse Seille Gillnet Tender TOTAL
NUMBER Of VESSELS I
29 1
62 15
107
7 0 1 8
65 25 12
102
<f23 808 HO
1.371
,2-f 8~ 168
1,587
AVERAGE NUMBER OF CREW
4 NIA
2 ..
.. 2 1
DAYS ENGAGED IN
flSHING2
<f 5 NIA
4'5 of 5
45 0
<f 5
25 25 25
21 21 21
CFEC. Permit File Statistics By fishery By Residency. 1989 Chuck Mecham & Pete Probasco, ADF&G. Anectodot.al Comments
I Unless otherwise noted. this includes just those vessel!! which made deliverie~
ESTIMATED YARDS Of
REFUSE GE'NERATED3
55 NIA j~
2S HJ
13 0 2
15
6~ 13 13 9-f
371 35) 123 ~i9
50i '426 165
1.098
2 Jncludes total number of days i.n or about the fishing grounds. whether o.r not Lhe season was technkaUy open for fishing . 3 Determjned by .multiplying the number of vessels times the ave.rage number of c.rew times lhe days engaged in fishing time .07 (the a.mount of .refuse gene.rated per day in thirty gallon bag equivalent3 per person) divided by 6.7 (to convert to year.iJ 4 Although onJy 27 vessels actually made deliveries, 65 vessels showed up on lhe f'round!i for significant periods of time . This is often the case with this particular fishery as vessels t.bal participated in the Bristol Bay her.ring fishery wait for the herring Lo show up here b~fore they move on to other commitments.

SWAMC MARPOL Report - Page 96 - Appendix F
TABLE 3
TYPE OF GARBAGE GENERATED IN THE SALMON FISHERIES OF WESTERN ALASKA I
CUBIC CUBIC CUBIC YARDS Of YARDS Of CUBIC YARDS Of CUBIC
GEAR REFUSE FOOD YARDS OF NON- YARDS OF A& mE GENERATED WASTE Pl.A Siies REeyCLEABLE BECYCLEABLE
Kodiak Purse Seine l,182 -i59 237 237 222 Beach Seine 67 21 11 11 10
GHlnet 0 0 0 0 0 Set Net 0 0 0 0 0
Tenders 199 62 32 32 30 TOTAL f.718 512 280 280 262
Chfanit Purse Seine 109 127 6.5 65 6J Gilfnet 0 0 0 0 0 Set Net 0 0 0 0 0
Tenders 107 33 17 17 16 TOTAL .516 160 83 83 77
AK. Penn.I Purse Seine 117 129 67 67 63 Aleutians Gill net l-i7 -i6 24 24 22 Soulbsidt. Ser. Net 185 57 30 30 28
Tenders 79 25 13 13 12 TOTAL 828 257 133 133 124
AK. Penn.I Purse Seine '492 153 79 79 7i Aleutians GiHoet 117 16 21 21 22 Nortbside Set Net 101 32 17 17 J6
Tenders 79 2.5 13 13 f2 TOTAL 823 25.5 132 132 123
Bristol Bay Purse Seine 0 0 0 0 0 Gillnet 1.523 172 211 211 228 Set Net 0 0 0 0 0
Tenders 167 52 27 27 25 TOTAL l,690 521 270 270 2, ..
TOTAL Purse Seine 2.800 868 ..... 8 .... s .. 20 Beach Seine 67 21 I I II 10
Gill net J.817 563 291 291 273 Set Net 239 90 16 -46 -13
Tenders 632 196 101 101 95 TOTAL .5,606 1,738 897 897 8-i I
l The percen~e used to determine the amount of each type of garbage is the ave~e percent&&• identified by the crab harvesting component of the refuse questionnaire
CUBIC YARDS OF PACKING
MATERIAL
296 13 0 0
40 350
82 0 0
21 J03
83 29 37 16
166
98 29 21 16
165
0 305
0 33
338
560 13
363 58
126 1.121

SWAMC MARPOL Report - Page 97 - Appendix F
TABLE 4
TYPE OF GARBAGE GENERATED IN THE ROE HERRING FISHERIES OF WESTERN ALASKA t
CUBIC CUBIC CUBIC YARDS OF YARDS OF CUBIC YARDS OF CUBIC
GEAR REFUSE FOOD YARDS OF NON- YARDS OF ARBA ~ GEN6RATED WASTE PLASTICS RECYCLEABLE RECYCLEABLE
Kodlat PuneSeine 55 17 9 9 g GUI net 58 18 9 9 9
Tenders 28 9 5 5 4 TOTAL HI ..... 23 23 21
Chlanit Purse Seine 13 1 2 2 2 Gill net 0 0 0 0 0
Tenders 2 I 0 0 0 TOTAL l5 5 2 2 ~
AK. Penn./ Purse Seine* 68 2l t l I l 10 Aleutians GHlnet 13
"' 2 2 2
Tend en 13 .. " 2 ') ... .. TOTAL 9'4 29 15 15 I~
Brlslol Bay Purse Seine 371 115 59 59 56 Gittnet 355 110 57 57 53
Tenders 123 38 20 20 18 TOTAL 819 263 136 136 127
TOTAL Purse Seine 507 157 81 81 76 Gillnet -t26 132 63 63 ~ Tender 165 51 26 26 25 TOTAL 1,098 3'40 176 176 165
I The percenc.age used to determine the amount of each type of garbage is the averal(e perce.nl.age identified by the crab harvesti.ng component of the refuse questionnaire
CUBIC YARDS OF PACKING
MATERIAL
' 1 12 6
28
3 0 0 3
14 3 3
19
7~ 71 25
170
101 85 33
220

SOURCE:
SWAMC MARPOL Report - Page 98 - Appendix F
CFEC, Permit File Statistics By Fishery By Residency. 1989 Chuck Mecham & Pete Probasco, ADF&G. Anectodotal Comments
I Includes only those vessels which actually made deliveries. 2 Includes total number of days in or about the fishing grounds, whether or not the season was technically open for fishing. 3 Determined by multiplying the number of vessels times the average number of crew times the days e.o.gaged in fishi.o.g Limes .07 (the amount of refuse generated per day in thirty gallon b$g equivalents per person) divided by 6.7 (to convert to yards). 1 Refuse is generated on shore; therefore, not included in MARPOL impact calculations. 5 Estimated. · 6 There a.re approximately 200 drift gmnetters who make deliveries on both sides of the Alaska PenninsuJa. Most of these vessels fish part of the year in the south and the other part of the year iii the north. We assume 50% of the vessels fish 501. of the time on lhe soulh side, and vice versa for the north side. 7 Refuse is generated at sea; therefore, amount is included in MARPOL impact calculations

SW.AMC MARPOL Report - Page 99 - Appendix G
Fecleal ...... J ~ .. ~'tfo.·'m : f 1Hda1. AprlJ 28.-. / Jlule1 and .Resulattooa
IS ..... ,.,...._. 0... ND ~ 111S.~
, • . o- 12/ll/91
APPL CA RTIFICATE FADEQUA Y FOR
0ARBAOERECEJ7TJONFAC~ITTES
!FO'l(Af C "'91111111"'-,..._,_._CSl'*-'l--.. D' _,,,1_.,._ _______ ,.... ......... _.......,_ -....-..-..-~«a a t fl•_ .. _,...__.,.c-.,,_,..,. · ,,..,. •K 1•--•-.,...••,....., _ .,..,.._.. ..... ,...c..... .. .._...wa.-.-••--.....-.. .,..,_ -.-• .,,..,.oo .,_ .... .,-. _,.... ------.• ,,....,... ua:•a...,._,.........,...,,,._.,,,._ ...... __ ...._ __ IOIUlllO,__ .. _ ... ,,___,.,_,... ,......,..e..-e1-...-,iwca...,. ~,_---- .. -----
-r.,,.,,.-: .... -. ............. _ .......... ..,._ __ ,,, ... .,._ ...... .,.. .... ~ ..... u.. ... .__._.., ............ Ylll9. ..... ., .............................. -1111-n..--......... --...... ~ .. ... _ ... ., .. .....,...uc;nie.&n a...e-·--·----....,.~ 7'1711
"'PfNr: •••• .,_ .. ___ ............ _ .. _.,,.,. ... ,...,... ..... ~ .. '"" ..... ~·-·...-..·- ... . ______ ,,..._..,.._...,_llM:_CJJl ..... fll ............. ...., ___ .....,_,,, __ I Pl'f,,, N
c:.,.... .........
you•reapp
A. Terminal Section: Chedr. ltl• lollowing bo•n ti rhe twminal rec:eiY11 °' chcllarge1 •ny of ltl• lollo-Mng mmtnodtties lrom or IO shipl ~ailing ltl• l.,minal:
0 Oil OI ~m ptoduc:tt 0 O.teh111g1 0 A.c .. vs 0 Bulll Ory C¥QO" 0 Oisc:ha~e 0 A.c.,vt
•-,~-. ........ ..-.-,.------------------f 0 Bulk chemcal1 0 Obcharoe 0 Rec:9i11t
a F1111 a 01tct1.,.o• a Rec:••v•
~~-----------~~----....,..-----! 0 Uqulhd Q&M1 0 Oh1cll11tge 0 Rectivt iv •p a G~ai ~ a 01s.dla1oe a R*<*Y•
a Olher o Ooechwoe a A~· 3
-:P::-hon-.-llUIT'Gef-'."'-"--~-------------------f Clledl lh• lolowlng bo1St" ltl• 1111rnna1 ll•ndl1101 1SMce1 .,y °' tM klllowing lhips:
0 SNpe ol lotelgn regittry 0 U.S. lllip9 In dome.-lc trade C U.S. lh!p9 In lote;gn trede .0 Pa&Nnget 1hips
loc•llC>ft of reception laollly (Cuy. SIA!•) C VHM11 letVicing Ille ottshote min« .. •nd oil lndu stry
AflM com 11tln this section o to Section C. Comple• this ..ctlon II you ue apply Ing H • "Port."
B. Port Section:
N.a&Oi P&i
0 Unmanned twg11 C Chsmlc:al lhip1 a Conraln• lhipe a Steak bulk 1ll1pt
0 Feny boars a Fishing vesHls
UiCilion oi 1ecsp1.oan liClllly {Cny. Slare)
.... &>di
0t l'I CY IRAl'ISP . USCC-00 ~·C (l 6'11 l(W:AI IV ... I(')
SC••• loµ Number ol Terminals which will be members ol this Port? __ _
Sect ion '11 C<Jn tin ut.S on tfit nt.{_t p11!Jt

SWAMC MARPOL Report - Page 100 - Appendix G
Fed.n.1 Resiatw I Vol. 64, No. 81 I Friday, April 28. 1geg I Ruln and Regulatlona
8 . Purt Stctwn: (cont'd) Ports art "'compleu 1~ following hloc:k. entries for tach individual ttrminal which is a mtmbtr of tht Port. If tht
Port wted in Stctinn 8.1. is also one of the terminals whiclt will bt 11.Si11g tht receptionfacililiu, p~ast compkte OM o/ tlk! ttrminal tntriu ~luw.
W Individual Terminal information: (lor le1mlnalt wno wish IO b• m11mb4l1t ol a port) CJ Chedl IM following bcuH 11 lhe termlnal reOlivH OI dltdlargH
any of Ill• IClllowing aJmmodillH lrom snips 1111111"9 lh• 1erm1n.a1:
Name ol Terminal a oi °' pe•o1-..m Pftlducll 8 0tec:t1arge a A.cel'le C Bulk ory C*gGee OllCftwV• 0 Receive
Street Address C Bulk ct1emk:a11 0 OlldWge 0 Receive C Fish a Dlac:Nrge 8 Receive 0 Llquifted guff ~ Discharge Receive
Clly ;::,1ate .lip C Oeneral c:atgo Dlschatg• B Receive [] Olllef Oisc:Nrge Rec.Ne
Name 01 T erm1nai l"'erson 1n l..narge
( ) . m Cneck ll• lollowlng b01141t " Ille lennlnal handlu OI s~ r110ne Numoer ... eoc1. lllY ol lhe lclk>wlng llllps:
0 Ships ol lorelgn reglsry 0 Unmanned bWCJ" Name ot Reception Facility (if subcontractec:fJ 8 U.S. ahlps In domUllC: Wade a Olemlcal ships
U.!5 . shlp1 In lorelgn !rad• a Container ships 8 P1~er snip1 a Ste.all bull ships sn.,, aef'llang ltl• ollshot• CF~ boe1 lhlpe
Loca11on 01 Hecepuon r-ac1111y (l..lly. ~1a1e> mineral and o.t ll'dusuy 0 Fi'Shlng shlpt
Signature of Person In Charge of Terminal Stgnallr• lndlearn ~''°"In ctlatil• ol lttmlnal llcilno...ledt,jes and consents 10 being consldll'ed aa 1 m•mb9r or fl• port dHalbed In Sec11on 8. I ,
rn Individual Terminal information: llor lerminals wno WISI\ to be membell ol 1 port)
IJ:] Chaca in. fcllowinG ~· II me lamllnal recaAI• 01 dl$Char94t1 eny ol II• lollowlng comnodl'lles lrom ~ vtllWtg the l11tmlnal:
Name ol T erm1nal 0 OI a petroleum procM:ts C Oltehafve 0 ReceNe a Bu11t rJrt catgoes c Ol9Charge a Rec*ve
S1reet Address c Bulk ctlemlcal• c Oitd\arge a Rec*v. CFilh a Dlxtwve a RecMw a UqlMled gaset C~CRec*ve
1.,,1 :=,tate Lip c O...ral caigo c Dlectwge a AeceN• a on. o~ OAec1a1¥e Name or 1 erm1na1 1-'erson 1n cnarge
( ) m Ctltdl fl• ilDlollmg bairn • ttw W"*1ll twdn 0t 1entcin rn01 ~ Numoer ••COiiie eny of .,. lollowftg ahlpe:
Name ol Reception Faci~ty (if ~ubcontrscteq C Shipe of lofelgn r.glllry a ~ .... Md '*'V" C U.S. th119 In domesllc lrade a Chemc8I at11s-C U.S. "11pe In lcr.egrt hde c Cclnlmner ltllpe
C Pauengw lhlpe c Enak bulk lt»pt
Locat10n or Hecep11on 1-acllity l1.,,1ry, ::,1a1e) 0 Shis>t, MMdng l'9 allihote [] Feny boal lhlpt
mineral Ind oll lnW.-y CRINni!-..
Signature ol Person In Chargct or t~rmlnBI Stgnati.e lndlcatH person In chafge ol tefmtnal adu'IOWl.OIJH and consenlt lo l)ejng considered as a rMmber of the port.
Afttr compl~dnt lltls Jtttion to to J«tloil C. dHalt>ed 1n Sec1ion 8. I .
Th.is {><Jilt DWV bt ux·11Jlv rr11r•1el11cnJ VJ Ul'C~ lm~r PtNU

SWAMC MARPOL Report - Page 101 - Appendix G
Federal Raabter / Vol. 54, No. 81 I Friday, April 28. 1989 I Rulea and Regulationa 1839'
Section C : Cirde the location of the USCG Captain of the Port Office which has authority in yo11 area.
Commardng Officer U~G Marine Safety Office Commardng Olficer USCG Marine Satety Ofice Commatdng Otficet USCG Marine Safety Olfice Caplan d lhe POl1. long Island Sound Captain d lhe POl1. New York Commardng Officer USCG Marine Safety Office Commancing Officer USCG Marine Satety Office Commardng Officer USCG Marine Safety Office Commancing Otficet USCG Marine Safety Office Commancing Otficet' USCG Marine Safety Otfice Commancing Officef USCG Marine Safety Office Commardng Oflicec USCG Marine Safety Office Canmatdng OCficer USCG Uari:18 Safety C6ce Commardng Officer USCG Marine Salety Offic8 Commancjng Officer USCG Marine Salety Office Coowancing Officef USCG Marine Safety Ofice ConwatDng OKat USCG Marine Safety Otice Commanding Officer USCG Marine Sale:y Office Cannardng Otfcer USCG Marine Safety Ofice Commardng Officer USCG Marine Safety Olfice Commardng Officer USCG Marine Safety Office Commardng Officer USCG Marine Safety ()fa Commardng Otrar USCG Marine Safety Office Commancing Officer USCG Marine Salety Olfice Captain d the P011. Houston Commanciflg Otfaf USCG Marine Salety Olke Commardng Officer USCG Marine Safety Office Commardng Officer USCG Marine Salety Office Commardng Officer USCG Marine Salety Office Commardng Olicer USCG Marine Salety Office Commanding Officer USCG Marine Safety Otice Commardng Officer USCG Marine Salety Office Captain c:A the Port. Grand Haven Captain d lhe Port. Sd Ste. Marie Commardng Officer USCG Marine Salety Office Commanding Oflicer USCG Marine Salety atice Commardng Officer USCG Marine Safety Office Commanding Oflicer USCG Marine Safely Office Commanding Officet USCG Marine Safety Office Commarnng Officer USCG Marine Satety Office Commanding Officer USCG Marine Salety Office Commanding Officer USCG Marine ~lely Office Commanding Officer USCG Marine Salety Ollice Commanding Officer USCG Marine Safely Ollice Commanding Officer USCG Marine Safety Office Commanding Officer USCG Marine SJlety Office Commardng Officer USCG Marine Safely Office
1 Portland, ME 2 Boston,MA 3 Providenee,Rt 4 Long blind~ New HnM, CT 5 NewYoB,NY I SL I.Dull. 110 7 tu'ltlngton, WY I Loulsvllle, KY 9 Memphis, TN 10 Paducah, KY 11 Plnsbwgh, PA 12 Bllllmore, MD 13 Hampton Roads, VA 14 Phlldelphla, PA 15 Wilmington, NC 11 a.rleston,SC 17 JICk90ftVfl1e, ft 18 San Juan, PR 19 Srnnnah, GA 20 Tams>', Fl %1 Miami, A 22 Motllle, AL 23 Morgan City, LA 24 New Ortew, u 25 Houston , TX 26 Gatveston, TX Tl Port Arthur, TX 28 Corpus Christi, TX 29 Chicago, IL 30 8"'alo, NY 31 Clevetand, OH 32 Detroit, Ml. 33 Grand Haven. Mt 34 Sault Ste. Marie, Ml 35 Duluth, MN 36 Mltwau1tee, WI 37 Toledo, OH 38 long Beach, CA 39 San Diego. CA 40 San Francisco, CA 41 Portland, OR 42 PugetSound,WA 43 Anchorage, AK 44 Juneau, AK 45 Valdez, AK 46 Honolulu, HI 47 Guam
After completing this section go to Section D.

SWAMC MARPOL Report - Page 102 - Appendix G
18398 Federal Regiater /Vol. 54, No. 81 /Friday, April 28, 1989 / Rules and Regulations
5ection D: 1. Does the tenninal or port receive visits from ships arriving from foreign ports (except Canada).
0 Yes O No ti tlHI a11~wff is "NO" f10 to qu•stion nu~•' 4.
2. Does the terminal or port have facilities, either onboard or on contract. approved by the Administrator, At11mal and Plant Health Inspection Service (APHIS), U.S. Oepar1ment of Agicullure, for the disposal of galbage from foreign por1s (except Canada) in accordance with 7 CFR 330.400 and 9 CFR94.5.
oves
Cll'\'
O No (It lh• .,.,,.,.,.is "No• you may anactl • wa/11., rfHIWll in~ with 33 CFR 158 on a se~ar• •nactled slrHt.)
l'\'pt tH:INlAAIOA. SIEAl.IZ'Ell AIJJ<Xl.Avt. C lC l
--SJAJ'E
3. For those terminal(s)lport(s) requiring the services of an Animal and Plant Health Inspection Ser.lice approved facility, is the terminal or port capable of receiving all garbage from these ships visiting the tenninaVpot1 within 24 houcs ol vessel alter notification of need for such services is given?
O Yes O No (It llleansw•ls "No•you may•nadl • waiwrt«llJ•sf inMXXJtdanc. wrltl 33 CFR 158 on• saparat• an.JCh«I slrHt.}
" - Is lhe lerminal or port able to receive au galbago as defined in 33 CFR 158.120 which Iha master or person in Charge of a ship desires 10 discharge, except:
(1) large quantities ol spoiled or aamaged cargoes not usually discharged by a ship; or (2) garbage from ships not having commercial transaebons with that tenninal or port?
0 Yes O No (I ltHI .,swer l'I "No. you may alllldl •waiver f«/UHI In~ with 33 CFR 158 on• s.,,atat• an.'ICllMJ shHt)
The 18'nvnal/port person in Cll~g• ldennfted In fl• ~ICallon lllall nonly !ti• U.S. Coa51 Guard eac>1am ol the Pon (COTP) in WTlll"Q 30 days an11 any ol the tlfmtnallpon information idenifted under 33 CFA 158. 165(bl(3) changes.
CMI P.nallln. A ptfSOn who, aft• notice and an opportunity IOI I hearing, it I~: 1. 10 have made 1 lalse, fic:ii110U1 a fraudulent s&atemenl or representalion in any mall« in wt\id'l a 11a1ement or represan&alion ts requ11ed 10 be made und• ll'le Act lo Pr•wnc Palu*"1 lrom Ship$, Of lh• rt<JIAallON ll'lerwnde1, shall b4 kol.blo 10 ~o lk'iled SlatH for a CIVIi penalty. not IO ••c:eed SS.000 fOI eadl Sc.lerntn( OI rlpf'ntntallon: OI b. 10 haw VIOiated lh• Ad 10 Pfeyenc Polutlon tom Shlpt, ar IN regulallon1 l1tued ltwunder, lhll be liable ao !he unted Stain tor • 01111 penalty. no110 ••cMd $25.000, lor Md! v4olallon. Each day of a oanllnuing lliolallon can111tutes a 1epMal•
I HERESY CERTJFY THAT THE INFORIU. T10ll PROVIDED IN THS APPUCAT10N FOR A OAROAOE RECEPTION FAOUTY CERTIFICATE OF ADEQUACY FOR QAR8AOE RECEPTJOH FACIUTJES IS COMPLETE, TRUE AND CORREcr TO THE BEST OF MY ICNOWLEDOE, INFORMA TlON, AND IEUft';
SIONAT\JAE Of TERMINAtHORT PERSON W a-MOE ------- ---------
PAINTED OA TYPED NAME Of PERSON ti CHAAOE
DATE SIQNED
OH OA 8f'f OAE AUGlJS T 17. llltUMI. APPi. CAT~ TOCC>t.MAICMHT CG MPS· I I. U S. COASl GUAAO t€ AOOUAATEAS 7100 S(CONCl STAHT SW WASHHJTOH. 0 C 10!>03-0001 Al f C "1 ICW. RC Cl 1'1 IOH f AC I. ITV ()( SI<
AfTEA AUOUST T7. 1• MM. lol'fl.ICATIQll TO.
THE lOClol US. COAST OUAAO CN'TA~ a M POAT (COTI') OfTIC( cSEE ~ ,J FOR THE UST a COTP~FICES}

SW.AMC MARPOL Report - Page 103 - Appendix G
011PLIANCE AGREEMENT
' <:,. 0. ,..-
A. Regulated Garbage Hanc:!JA>g Ptocedures ,, ~ . ~ (1) Garbage rennved fran foreign arriving air~aft will be: (Clleck
appropriate box).
( ) Incinerated;
( ) Steam sterilized and cootracted for landfill burial without diversicn;
( ) Transported by an approved garbage hauler for incineration or sterilization.
Scraping residue and runoff will be g:romd into an approved sewage system as defined in 7 CFR 300.400 or 4 CFR 94.5 03 and 04.
(2) The caterer will ~t aircraft originating from a foreign location, (foreign flight), cn arrival for the purpose of decatering the aircraft. The caterer will i.mrediately notify local Plant Protection and Quarantine (PPQ) if unable to reet ~ flight on arrival, in which case the caterer will provide control over regulated garbage through assigned caterer or airline personnel in a manner acceptable to PPQ.
(3) Garbage rerroved from the 'Qi~;Jr.t will be ccntinually maintained in enclosed receptacles with no leakage, exposed garbage, or holes in plastic bags mtil disposed of in an approved manner.
( 4) The caterer is responsible for all regulated garbage including food waste, loose trays of food and unused IIEal.s, and will not allow its unauthorized di version, remval, or use.
(5) The cbck area and the area Cll"OUld garbage sterilizers, CCIJ1>actors and/or durpsters shall be kept clean and free of loose garLage. ~actor and dunpster leakage shall be contained in a marmer acceptable by PPQ.
(6) Caterers handling both foreign garbage and danestic garbage at the Sam! catering kitchen will either handle both types of garbage as foreign garbage, or will:
(a) Identify foreign flight galley equipment before its associaticn with danestic flight equiprrent and/or garbage;
(b) Keep regulated garbage segregated fran danestic garbage until incinerated, sterilized, or renoved by an appr~d cartage finn;

(c)
SWAMC MARPOL Report - Page 104 - Appendix G
Use easily identifiable cmtainers for foreign garbage. Rigid ccntainers shall be lettered with the wrds "REGUIA'1ED GARBAGE" or a similar acceptable phrase in F.nglish and any appropriate foreign language. Lettering shall be at least 2 inches high on indoor cootainers and at least 4 inches high on outdoor caitainers. C.OOtainers used for regulated garbage shall not be used for doaestic garbage; nor shall ccntainers used for dales tic garbage be used for regulated garbage; and
(d) Conspicoously post regulated handling procedures in the 'WOrl< area in F.nglish and other appropriate languages.
B. F.guipment
(1) If a sterilizer is used:
(.:i) It will be capable of heating garbage to a m:i.nimun internal t~rature of 212 OF, and maintaining it at that t:errperature for at least 30 minutes. To achieve this the sterilizer will be calibrated for the following ti.ue/temperature setting.
Temperature setting ___ PSI ____ Minim.Jn cooking cycle __ _
A maximLJn load of bags of garbage per cooking cycle is allowed. ----
(b) A thenoocouple probe will be used initially and twice each year to recalibrate the temperature recording device and adjust the sterilizatioo cycle to assure that tg: garbage is heated to a mi.nim..In internal terrperature of 212 F for at least 30 minutes. The test load shall be at the maxim.In capacity of the sterilizer and of typical carpositioo for the location. The tests will be supervised by an errployee of PPQ, Animal and Plant Heal th Inspection Service (APHIS), U.S. !EparDialt of Agriculture (USD\). The adjusted sterilizatioo cycle will be followed.
(c) The ti.Ire and tenperature record of each batch of foreign garbage shall be dated and initialed by the sterilizer operator and si~d by the supervisor. It will be retained at the establishrrem: for at least 6 m:mths and be available for review by PPQ representatives.
(d) The bottom, rear drain of the sterilizer unit will be cleared between each cycle to assure proper steam circulatim and drainage. This is acccnplished by rerroving and cleaning the strainer inside the drain and then flushing the drain with a water hose to dislodge any foreign debris, or by cleaning the strainer and flushing the drain with another system acceptable to PPQ.

SWAMC MARPOL Report - Page 105 - Appendix G
(2) If an incinerator is used, it tILJSt reduce all regulated garbage to a.t.Jh.
c. Training
(1) The establishrent shall present a training program to aqJloyees before they are permitted to handle or supervise the handling of regulated foreign arrival flight materials. This training program should be at least 1 hour in duration. Previously trained euployees shall be provided review training amually. (This training may be given in mre than one session.)
(2) The training package D1.JSt be approved by the local P~ Officer in Charge, and may include both fot:mal classroan training and on-thejob training. It must:
(a) ll?fine regulated garbage;
(b) Explain the regulations and the purpose of the regulations ;
(c) Include film, slides, or other training aids en foreigp animal and plant diseases and pests;
(d) Specifically outline, by dem:instration, illustration, or picture, proper regulated garbage handling procedures for the facility, step-by-step from stripping of aircraft to disposal; and
(e) Be presented in English and other appropriate languages.
(3) Proof of training acininistered to errployees shall be made available to P~ persormel upon request.
D. Backup System
In the event the primary garbage disposal system is inoperable, the local PPQ-APHIS-USD\ office ItulSt be notified in advance as to use of the following prearranged approved backup system: (Oleck one)
( ) Incinerator located at -------------------------------------------------~
( ) Sterilizer located at --------------------------------------------------------
( ) Other (explain) -----------------------------------------------------~
E. Notice
'Ibis agre~t may be ~diately cancelled or revoked for non-canpliance. Violation of these Federal regulations can result in a criminal penalty of up to a $5 ,000 fine, a year in jail, or both, or a civil penalty and a fine of up to $1, 000 per violatioo.


