on-road measurement of emissions from heavy-duty diesel trucks
TRANSCRIPT
On-Road Measurement of Emissions from Heavy-Duty Diesel Trucks: Impacts of Fleet Turnover and ARB’s Drayage Truck Regulation
Final Report Contract No. 09-340
Prepared for:
California Air Resources Board
Prepared by:
Robert A. Harley Principal Investigator
Department of Civil and Environmental Engineering University of California
Berkeley, CA 94720-1710
November 2014

ii
DISCLAIMER
The statements and conclusions in this Report are those of the authors and not necessarily
those of the California Air Resources Board. The mention of commercial products, their source,
or their use in connection with material reported herein is not to be construed as actual or implied
endorsement of such products.

iii
ACKNOWLEDGMENTS
The main researchers involved in this project include Chelsea Preble, Timothy Dallmann,
Thomas Kirchstetter, and Robert Harley of the University of California at Berkeley, and Nathan
Kreisberg and Susanne Hering of Aerosol Dynamics, Inc. We also acknowledge Steven
DeMartini and Nick Tang for their assistance with data analysis.
We thank the Bay Area Quality Management District for support and use of their mobile
laboratory. We are grateful to Mike Sutherland and Alicia Violet of the California Air Resources
Board for providing truck and engine data from the Drayage Truck Registry, and to Chandan
Misra who served as CARB project manager for this study.
This report was submitted in fulfillment of CARB contract 09-340, On-Road
Measurement of Emissions from Heavy-Duty Diesel Trucks: Impacts of Fleet Turnover and
ARB’s Drayage Truck Regulation, by the University of California at Berkeley under the
sponsorship of the California Air Resources Board. Work was completed as of June 18, 2014.

iv
TABLE OF CONTENTS
Abstract vii
Executive Summary viii
1. Introduction 1
2. Methods 5
3. Results 17
3.1 Changes to Port Truck Age Distribution 17
3.2 Changes in Fleet-Average Emission Factors 17
3.2.1 Black Carbon 17
3.2.2 Nitrogen Oxides 22
3.2.3 Ultrafine Particles 27
3.2.4 High Emitters 36
3.3 Changes in Emission Factor Distributions 36
3.4 Emission Factor Variability 37
4. Discussion 47
5. Recommendations 51
6. References 52
Appendix 55
v
LIST OF TABLES
Table 1: Implementation Schedule of Drayage Truck Regulation 4
Table 2: Summary of Results 19
vi
LIST OF FIGURES
Figure 1: Federal Exhaust Emission Standards 2
Figure 2: Position of Instrumented Van on Overpass 8
Figure 3: Sampled Pollutant Concentration Time Series 9
Figure 4: Schematic of Particle Sampling 10
Figure 5: Laboratory Evaluation of CO2 Analyzers 11
Figure 6: Distribution of Concurrent CO2 Measurements 12
Figure 7: Laboratory Example of FMPS Artifact 15
Figure 8: Aethalometer Filter-Loading Correction 16
Figure 9: Distribution of Port Truck Engine Model Years 18
Figure 10: BC Emission Factors by Fleet and Truck Category 20
Figure 11: BC and NO2 Emission Factors by Installer/Manufacturer 21
Figure 12: NOx Emission Factors by Fleet and Truck Category 24
Figure 13: NO2 Emission Factors by Fleet and Truck Category 25
Figure 14: NO2/NOx Emission Factors by Fleet and Truck Category 26
Figure 15: UFP Emission Factors by Fleet and Truck Category 28
Figure 16: Particle Number Emissions versus Particle Size 30
Figure 17: Particle Mass Emissions versus Particle Size 32
Figure 18: Relationship between BC and NO2 or UFP Emissions 34
Figure 19: Cumulative Fleet Emissions of BC and NOx 39
Figure 20: Cumulative Pollutant Emissions for 2013 Fleet 41
Figure 21: Distribution of BC and NOx Emissions by Truck Category 42
Figure 22: Distribution of BC and NOx Emissions by Engine Model Year 44
Figure 23: Repeatability of Measurements 46

vii
ABSTRACT
The effects of heavy-duty drayage truck fleet modernization and diesel particle filter
(DPF) retrofits were examined through measurements of truck emissions near the Port of
Oakland. Pollutant concentrations were measured at high time resolution in the exhaust plumes
of more than a thousand drayage trucks as they drove toward the Port on a major access road.
Emission factors were matched to data from a statewide drayage truck registry, including engine
make, model year, and installed emission control equipment, using recorded license plates for
each truck. Between 2009 and 2013, Phase 1 of California’s Drayage Truck Regulation led to an
increase in Port trucks equipped with DPFs (the fraction so equipped rose from 2 to 99%), and a
decrease in median engine age from 11 to 6 years. Over the same period, fleet-average emission
factors decreased by 76 ± 22% and 53 ± 8% for black carbon (BC) and oxides of nitrogen (NOx),
respectively. However, direct emissions of nitrogen dioxide (NO2) increased, and consequently
the NO2/NOx emission ratio increased from 0.03 ± 0.02 to 0.18 ± 0.03. DPF-equipped trucks had
substantially lower BC and higher NO2 emission factors than trucks without DPFs. The newest
trucks equipped with both DPFs and selective catalytic reduction (SCR) systems for NOx control
had the lowest average emission factors for BC and ultrafine particles (UFP), and an average
NO2 emission factor that was about equal to that of the Port truck fleet that was on the road in
2009 before recent emission regulations took effect. Phase 2 requirements have since led to
replacement of nearly one third of the 2013 Port truck fleet (so far mainly pre-2007 engines have
been replaced with newer engines equipped with SCR). Additional measurements of drayage
truck emissions at the Port of Oakland are recommended in 2015 to quantify the emission
impacts of increasingly widespread use of SCR for controlling NOx emissions from on-road
diesel engines, and to continue tracking trends in drayage truck emission factors over time.

viii
EXECUTIVE SUMMARY
Heavy-duty diesel trucks are a major source of nitrogen oxides (NOx) and exhaust
particulate matter (PM) emissions in California. The Statewide Drayage Truck Regulation aims
to reduce emissions of these pollutants by requiring universal use of diesel particle filter (DPF)
emission control systems and replacement of pre-1994 model year engines on drayage trucks
operating at major freight-handling facilities such as ports and rail yards. The DPF requirements
were phased in over a period of three years — between Jan 1, 2010 and Dec 31, 2012. In this
study, the effects of fleet modernization and DPF retrofits on in-use trucks were examined
through field measurements of truck emissions at the Port of Oakland. Truck emissions were
measured during 2011 and 2013, using high time resolution (1 Hz or faster) instrumentation that
could distinguish the exhaust plumes of individual trucks. This study adds to an existing record
of on-road emissions data for drayage trucks measured at the same site in 2009 and 2010.
Emission factors quantified in this study include NOx, nitrogen dioxide (NO2), black carbon
(BC), and ultrafine particle (UFP) number, in addition to particle size distributions. License
plates of passing trucks were recorded and matched to entries in the California Air Resources
Board’s (CARB) Drayage Truck Registry, which provided information such as truck engine
model year and DPF retrofit status. In this manner, emission factors could be matched to
corresponding truck attributes for 378 trucks in 2011 and 1005 trucks in 2013.
The drayage truck fleet operating at the Port of Oakland was markedly transformed in a
short period of time. In 2008, 2% of Port trucks were equipped with DPFs, and the median age of
truck engines was 11 years. In 2013, 99% of trucks were DPF-equipped, and 9% also had
selective catalytic reduction (SCR) systems for enhanced control of NOx emissions. The median

ix
age of Port truck engines had decreased to 6 years by 2013. Between 2009 and 2013, fleet-
average emission factors decreased by 76 ± 22% and 53 ± 8% for black carbon (BC) and NOx,
respectively. The use of DPFs led to increases in fleet-average emission factors for NO2 and
therefore an increase in the NO2/NOx emission ratio (from 0.03 ± 0.02 to 0.18 ± 0.03) over the
same time period.
The distributions of emission factors for Port trucks have become increasingly skewed
over time, with a minority of trucks now responsible for the majority of emissions of all
pollutants—except carbon dioxide (CO2)—measured in this study. The highest emitting 10% of
trucks observed in 2013 were respectively responsible for 30, 65, and 80% of total NOx, BC, and
ultrafine particles (UFP) emissions from all Port trucks. The highest emitters of UFP generally
were among the lowest emitters of BC, and vice versa. Likewise, the highest emitters of NO2
generally were among the lowest emitters of BC. Emission factors for UFP were variable,
whereas measured BC and especially NOx emission factors were more reproducible when the
same trucks were observed driving by on different days.
In the first set of field measurements performed in 2011 for this study, some trucks
(engine model years 2004-2006) were exempt from the requirement to have DPF systems
installed. This sub-group of trucks provided a point of reference for comparison with other sub-
fleets of trucks equipped with more advanced emission control equipment. These comparisons
showed that, on average, DPF-equipped trucks had substantially lower BC and higher NO2
emission factors compared to trucks without DPFs. Trucks emitted particles ranging in size
between 6 and 300 nm, and DPFs were most effective at reducing emissions of UFP with
diameters larger than 15 nm. The newest trucks (2010-2013 engines) that were equipped with
both DPF and SCR systems had the lowest average emission factors for BC (0.09 ± 0.04 g kg-1),

x
NOx (5 ± 1 g kg-1), and UFP ((1.6 ± 1.2) × 1015 particles kg-1). NO2 emissions from these newest
trucks (1.1 ± 0.3 g kg-1) were greater than those from trucks without DPFs (0.6 ± 0.3 g kg-1) but
were nearly equal to the pre-regulation fleet-average emissions (1.0 ± 0.7 g kg-1).
Phase 2 of the Drayage Truck Regulation required replacement of all pre-2007 engines,
on a schedule that extends beyond the second field study component of this research. Therefore,
the fraction of drayage trucks equipped with SCR is expected to increase further. The increases
in NO2 emission factors reported here, resulting from widespread use of DPFs to control diesel
PM emissions, may have been partly mitigated as use of SCR systems to control NOx emissions
has become more widespread.

1
1. INTRODUCTION
Heavy-duty diesel trucks emit the majority of nitrogen oxides (NOx) and diesel
particulate matter (PM) in urban areas in California (Dallmann and Harley, 2010; McDonald et
al., 2012). These emissions contribute to exceedances of fine particulate matter (PM2.5) and
ozone air quality standards (Lloyd and Cackette, 2001; Morawska et al., 2008), and may lead to
adverse health effects for exposed individuals (McClellan, 1987; Lloyd and Cackette, 2001;
Brugge et al., 2007; IARC, 2012). Black carbon (BC), which is a short-lived yet potent absorber
of solar radiation, comprises the majority of diesel PM (Ban-Weiss et al., 2008). Recent studies
have suggested control of diesel BC emissions as a near-term strategy to help mitigate climate
change due to anthropogenic emissions of longer-lived greenhouse gases such as carbon dioxide
(CO2) (Bond et al., 2013; Ramanathan et al., 2013).
The U.S. Environmental Protection Agency has set increasingly stringent exhaust PM
and NOx standards to reduce emissions from on-road heavy-duty diesel trucks, as shown in
Figure 1. The most recent standards correspond to emissions that are 98% lower than emissions
from trucks meeting the earliest standards that were in force approximately twenty-five years
ago. The most recent standards require the use of exhaust after-treatment control technologies.
Trucks with 2007 and newer engines are equipped at the time of manufacture with diesel particle
filter (DPF) systems for PM emission control, while trucks with 2010 and newer engines are also
equipped selective catalytic reduction (SCR) systems for NOx control. DPFs can be installed as
retrofits on older engines that are already in use (van Setten et al., 2001). Measures to accelerate
reductions of in-use diesel truck emissions have been adopted in California, given the long in-
service lifetimes of heavy-duty engines.

2
Figure 1. Federal exhaust emissions standards of NOx and PM for new heavy-duty highway engines (EPA, 2013), normalized to the earliest standards in effect as of 1988.
Previous studies have shown that DPFs effectively remove more than 90% of PM mass
from heavy-duty diesel engine exhaust (Biswas et al., 2008; Herner et al., 2009; Barone et al.,
2010). Trapped soot particles are oxidized to regenerate the filter either passively, by continuous
reaction with NO2 that is formed by catalytic oxidation of exhaust NO, or actively, for example
by episodic injection of fuel to oxidize particles trapped on the filter. The intentional conversion
of exhaust NO to NO2 in passively regenerated DPF systems leads to increased NO2 emissions

3
and higher NO2/NOx emission ratios (Carslaw, 2005; Herner et al., 2009). This effect is likely to
increase with higher exhaust temperature and increased catalytic loading of the DPF system
(Herner et al., 2009). Dynamometer testing of DPF-equipped trucks has also shown that the
reduction of total particle mass—and thus the availability of condensation surfaces for volatile
exhaust gases—may encourage homogeneous nucleation events and thereby increase ultrafine
particle (UFP) emissions (Biswas et al., 2008; Herner et al., 2011).
In California, the introduction of DPFs has been accelerated by the Statewide Drayage
Truck Regulation. Table 1 shows the implementation schedule for this rule. Over a three year
period—from Jan 1, 2010 to Dec 31, 2012—all drayage trucks were required to be equipped
with DPFs, either via retrofit or engine replacement (ARB, 2013). Trucks with 2007-2009 model
year engines are compliant through 2022, while trucks with 2010 and newer engines are fully
compliant. At the Ports of Los Angeles and Long Beach in Southern California, the drayage
truck fleet was almost entirely replaced with new equipment. The mean age of trucks there
decreased from 12.7 years to 2.5 years over a two-year period, and large associated emissions
reductions were observed for carbon monoxide, NOx, and infrared opacity: 30, 48, and 54%,
respectively (Bishop et al., 2012). In contrast to the Southern California ports where truck
replacement predominated, there was a significant element of DPF retrofitting on drayage trucks
at the Port of Oakland. Dallmann et al. (2011) measured a 41% reduction in NOx and a 54%
reduction in BC emissions between November 2009 and June 2010, associated with the first
round of emission control requirements on drayage trucks. The BC reductions resulted primarily
from increased use of DPFs, whereas NOx reductions were attributed to replacement of the oldest
trucks with newer equipment that met more stringent NOx emission standards. The initial round
of changes to the drayage truck fleet at the Port of Oakland led to an increased proportion of

4
trucks with 2004 and newer engines, as well as a reduction in mean engine age from 11.0 to 8.3
years (Dallmann et al., 2011).
Table 1. Phased implementation schedule for the Statewide Drayage Truck Regulation.
Phase of Regulation
Deadline Engine Model Year Requirement
Phase 1 January 2010
1993 & Older Banned 1994 - 2006 Retrofit with DPF or
replace with newer engine
January 2012 2004 January 2013 2005 - 2006
Phase 2 January 2014 1994 - 2006 Replace with 2007 or
newer engine
The current study builds on previous work by Dallmann et al., and features two new field
measurement campaigns that include additional pollutants not previously measured, namely
NO2, UFP number, and particle size distributions. Also, emission factors for individual trucks in
the current study were linked through transcribed license plate data to truck attributes such as
engine model year and DPF retrofit status. This made it possible to compare emission factors for
trucks with different technology and engine model year categories in this study, in addition to
quantifying changes to fleet-average emission factors measured in current and previous work.

5
2. METHODS
Following the approach of Dallmann et al. (2011), truck emissions were measured in
November 2011 and March 2013 near the Port of Oakland. Pollutant concentrations in the
exhaust plumes of individual trucks were measured using an instrumented van that was
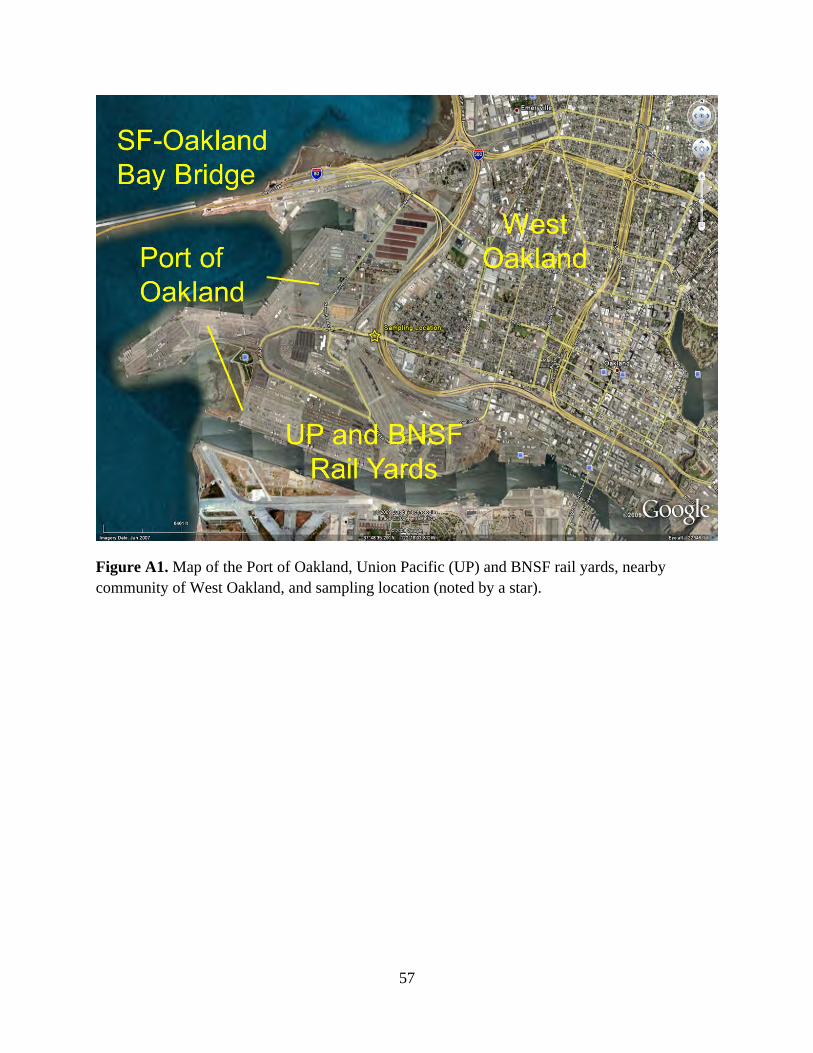
positioned on an overpass (Figure A1 of the Appendix). Westbound trucks heading toward the
Port drove underneath the overpass on a major access road. Exhaust/ambient air mixtures
sampled above the roadway were delivered to the instrumented van via a flexible aluminum duct,
as shown in Figure 3. In 2011 and 2013, concentrations of CO2, NOx, nitric oxide (NO), BC,
UFP, and particle size distributions were measured at 1 Hz or faster with the instruments listed in
Table A1 of the Appendix. A video camera at roadway level recorded truck license plates, which
were later transcribed and matched to entries in the California Air Resources Board’s (CARB)
Drayage Truck Registry. This provided data for each truck including engine model year, engine
manufacturer, and, if applicable, DPF retrofit status and installer.
A sample pollutant concentration time series is presented in Figure 3, and shows peaks
associated with three trucks that passed by in rapid succession over a time period of about one
minute. Pollutant concentration peaks were integrated to calculate fuel-based emission factors,
expressed in units of amount of pollutant emitted per kg of fuel burned, using a carbon balance
method:
EF! =! !! ! !! !"!!
!!
!"! !! !"! !! !"!!!!
!!!" w! (1)

6
The emission factor for pollutant P (EFp) is calculated over the time interval t1 ≤ t ≤ t2,
with t1 and t2 determined independently by the inflection points of each peak to account for the
fact that instruments measuring different pollutants have different response times. The numerator
and denominator, respectively, represent the baseline-subtracted peak areas for pollutant P and
CO2. When [P] and [CO2] have mass concentration units (e.g., µg m-3), the ratio represents the
relative abundances of pollutant P and CO2 present in the exhaust. The weight fraction of carbon
in diesel fuel (wc = 0.87) is used to convert emission factors from per mass of carbon to mass of
fuel burned (Ban-Weiss et al., 2009), and the ratio of 44/12 represents the total/carbon mass ratio
in CO2. NO2 emission factors were computed by difference for each truck using simultaneously
measured emission factors for NOx and NO.
Emission factors were computed for trucks for which the measured CO2 concentration
peak rose more than 7% above baseline roadway CO2 concentrations, following Dallmann et al.
(2011). The baseline was taken as the concentration measured just prior to the passage of a truck;
the timing was determined from recorded video images of passing trucks. Emission factors were
computed only when the CO2 concentration peak could be definitively attributed to a single
truck. Thus, emission factors were not computed when multiple trucks passed the sampling
location at the same time or in close succession. In 2011, 23% of passing trucks were sufficiently
spaced to resolve individual exhaust plumes, and license plates for 35% of those trucks were
clearly visible and could be transcribed. In 2013, sampling efforts were focused on the right-
hand lane (closer to the curbside video camera). This led to higher plume and license plate
capture rates: plumes for 37% of passing trucks were individually distinguishable, and plates for
63% of those trucks were visible and transcribed. In cases where there was successful CO2 plume

7
capture without other corresponding pollutant peaks, pollutant emission factors were still
computed, as illustrated in Figure 3.
As shown in Figure 4, an in-line dilution system was used to avoid exceeding the
concentration limits of the condensation particle counters (CPCs) used to measure UFP number
concentrations. The dilutor consisted of a filtered recirculating flow in a closed loop that drew
from the outlet side of a standard finned-tubular flow mixer and injected the particle-free flow
back into the upstream side of the mixing tube to be combined with the incoming aerosol flow. A
matched pair of water-based CPCs (WCPC) was placed on the upstream and downstream sides
of the dilutor to actively monitor the dilution rate. All downstream particle number
concentrations were post-corrected to account for the dilution factor, which was typically ~6.
The dilution factor was determined from the regressed slope of the line forced through zero, with
the upstream CPC concentration data as the dependent variable and the downstream CPC
concentration as the independent variable. Slight mismatches in data acquisition timing between
the independent, asynchronous data streams was handled by averaging down time series with
successively larger averaging windows until an asymptotic value was obtained for the regressed
slope.
The particle sampling configuration shown in Figure 4 was designed to minimize wall
losses by inertial separation and diffusion. Laminar flow was maintained in all sampling lines to
minimize inertial losses of accumulation mode particles that could bias particle mass
measurements. Diffusional losses of UFP were minimized by avoiding long runs of slow moving
sample flows to the instruments measuring particle number and size. Using a standard laminar
diffusion model, line losses of 10 nm particles were estimated as ~10% for the CPCs, 2% for the
fast mobility particle sizer (FMPS), and 1% for the dilution system’s mixing tube.

8
Prior to field measurements, the full setup of instruments and data logging were staged in
the laboratory and exposed to the exhaust of an inverted methane-air diffusion flame
(Kirchstetter and Novakov, 2007). The measurement of exhaust plumes of passing trucks was
simulated by episodically sampling flame exhaust instead of filtered room air. The analysis of
multiple peaks under constant flame exhaust conditions established the precision of the plume
capture sampling and carbon balance analysis methods that were used in this study. The NO2
conversion efficiency of both NOx analyzers was also evaluated using ozone titration tests, to
ensure accuracy of total NOx (NO + NO2) measurements.
Figure 2. Instrumented van positioned on an overpass sampling the exhaust from a truck en route to the Port of Oakland.

9
Figure 3. Pollutant concentration time series showing peaks that correspond to the exhaust plumes of three trucks. The first truck emitted appreciable amounts of NOx, BC, and UFP. The shaded peaks correspond to the integrated areas used to compute the emission factors shown in the figure. The second and third trucks emitted much smaller amounts of BC and UFP and the third truck emitted essentially no NOx. The integration boundaries are indicated with open circles for the second and third trucks.

10
Figure 4. Schematic of particle sampling instruments and their flow rates, and the in-line dilution system.
Laboratory testing identified a significant time response issue for the LI-COR model 820
CO2 analyzer, which tends to overshoot in reporting peak concentrations when rapid transitions
occur. Therefore, a faster response LI-7000 instrument was used in the present study, as it did
not suffer from the same problem (Figure 5). The LI-820 CO2 analyzer was used in parallel
during the 2011 field study to assess the magnitude of possible biases in earlier measurements.
Figure 6 shows a frequency distribution of the ratio of integrated CO2 peaks measured using LI-
820 and LI-7000 analyzers. As shown in Figure 6, use of LI-820 data led to overestimates in the
magnitude of CO2 peak areas by 26 ± 2% (95% confidence interval) for a sample of 389 trucks.
Therefore, baseline pollutant emission factors measured in an earlier field measurement

11
campaign at the Port of Oakland in 2009 (Dallmann et al., 2011) were multiplied by 1.26 in
making comparisons with emission factors measured using the more accurate LI-7000 CO2
analyzer in the 2011 and 2013 campaigns at the Port.
Figure 5. Comparison of time series of CO2 concentrations measured in laboratory evaluation of two LI-COR CO2 analyzers: LI-820 and LI-7000. The LI-820 overshoots when concentrations change rapidly, whereas the high performance LI-7000 transitions smoothly to match new peak concentrations.

12
Figure 6. Distribution of average ratio of CO2 peak areas measured by LI-820 and LI-7000 analyzers, as determined from concurrent measurements during the 2011 study at the Port of Oakland.
The laboratory tests also identified a concern associated with particle size distributions
measured using the FMPS. Jeong and Evans (2009) previously reported an unexpected peak near
the lower size limit (below 10 nm) of the FMPS, when sampling ambient air in both urban and
rural settings. This was posited to be due to either the data inversion algorithm or the calibration
of the FMPS electrometers used for particle detection. In our tests, the FMPS overstated the
concentration of UFP with diameters less than 10 nm on the trailing side of peaks when particle
number concentrations were rapidly decreasing. Figure 7 shows an example of this effect.

13
Accordingly, when analyzing particle size distributions measured at the Port of Oakland,
representative particle size distributions for each truck were chosen from the leading side of the
particle number concentration peak. A baseline-subtracted, normalized particle size distribution
was then determined for each truck:
Emission rate of UFP in each size bin =!"
!"#$!% !!
EF!"# (2)
Here, the particle number concentration measured in each size bin i is normalized to the total
particle number concentration, N. The product of this normalized size distribution function and
the corresponding emission factor gives the emission rate of UFP in each size bin in units of
number of particles emitted per kg of fuel burned.
Aethalometer BC data were post-corrected for time-dependent behavior that causes the
instrument response to decline with increasing filter darkening (Kirchstetter and Novakov,
2007). A modified version of the correction equation developed by Kirchstetter and Novakov
was used to adjust the BC concentration reported by the aethalometer:
BC = BCo
a exp -ATN100 + (1 - a)
(3)
where BC and BC0 are the adjusted and unadjusted BC concentrations, respectively, and ATN is
the attenuation of light by the filter. The correction parameter, a, adjusts BC0 such that BC
concentrations are independent of filter loading. This correction is validated by plotting the ratio

14
of the light absorption coefficient measured with the photoacoustic absorption spectrometer
(PAS) and the BC concentration measured with the aethalometer, as shown in Figure 8. Both
instruments respond to light-absorbing PM, but the in-situ PAS measurement is not affected by
filter loading effects. As shown, the ratio of absorption coefficient to BC0 increased by a factor
of two as the aethalometer filter progressed from pristine (ATN = 0) to heavily loaded (ATN =
150). In contrast, the ratio of absorption coefficient to BC is approximately constant and
independent of ATN. This indicates that adjusted BC concentrations can be up to two times
higher than unadjusted BC concentrations, assuming aethalometer measurements as the basis.
Our measurements of diesel truck exhaust at the Port of Oakland indicated a = 0.66,
whereas BC emission factors reported by Dallmann et al. (2011) were corrected with Kirchstetter
and Novakov’s value of a = 0.88, which was derived from testing using laboratory-generated
soot. We calculated BC emission factors (n = 1000) for each truck using both values and found
that emission factors calculated with a = 0.66 were 15 ± 2% lower on average than those
calculated using a = 0.88. Therefore, BC emission factors measured in the 2009 campaign
(Dallmann et al., 2011) were multiplied by 0.85 before making comparisons to emission factors
derived from the 2011 and 2013 field campaigns.

15
Figure 7. FMPS data showing an example of the artificial increase in ultrafine particle (UFP) number concentration of particles below 10 nm in diameter when particle number concentrations were rapidly decreasing. The top panel shows the measured particle number concentration, sampled from a constant source in the laboratory. The vertical dashed line shows the time at which the number concentration decreased and the artificial pulse of particles < 10 nm was reported. The bottom panel shows the corresponding particle size distribution at that time, including an anomalous peak in particle sizes below 10 nm.

16
Figure 8. BC concentration measured using an aethalometer and absorption coefficient measured using a photoacoustic absorption spectrometer (PAS). Unadjusted BC concentrations (BC0) depend on aethalometer filter loading (i.e., ATN) whereas the adjusted BC concentrations (BC) are independent of ATN.

17
3. RESULTS
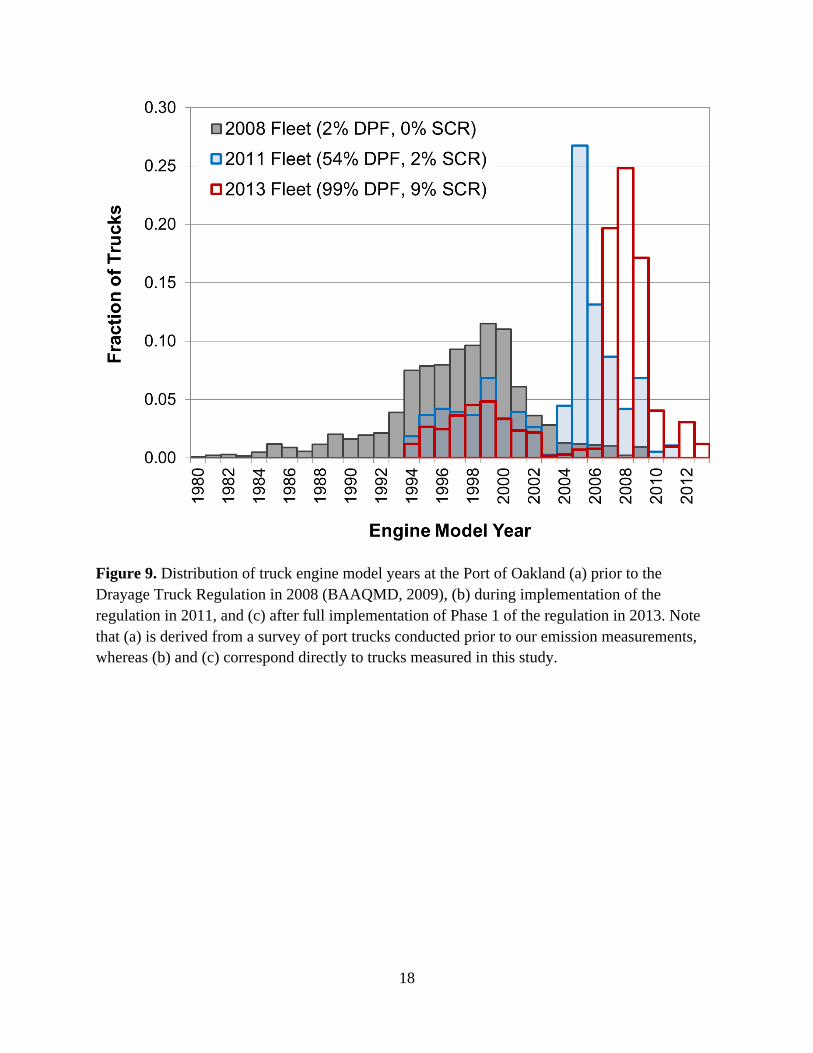
3.1 Changes to Port Truck Age Distribution. The age distribution of the truck fleet operating
at the Port of Oakland changed dramatically over a short period of time, as shown in Figure 9.
Prior to implementation of the Drayage Truck Regulation, median engine age was 11 years, and
only 2% of trucks had 2007 or newer model engines with DPFs. After full implementation of the
first phase of the regulation, 99% of trucks were equipped with DPFs, 9% had 2010 or newer
model engines with DPFs and SCR systems, and median engine age decreased to 6 years.
3.2 Changes in Fleet-Average Emission Factors. Fleet-average emission factors are presented
in Table 2, as measured at the Port of Oakland in 2009, 2011, and 2013. Emission factors broken
down more finely into four truck categories based on engine model year and installed control
technologies are also reported in Table 2 and shown in Figures 10 and 12-15: (1) trucks
retrofitted with DPFs, (2) trucks without DPFs, (3) trucks with DPFs as original equipment
installed by the manufacturer (OEM), and (4) trucks with both DPF and SCR as original
equipment. Emission factors partitioned in even greater detail based on DPF installer and engine
manufacturer are shown in Figures 11 and A2 in Appendix. In all these presentations of results,
indicated uncertainty ranges about the mean values represent the 95% confidence intervals.
3.2.1 Black Carbon. Between 2009 and 2013, average BC emission factors decreased by 76 ±
22% (see Table 2 and Figure 10). Average BC emission factors of trucks equipped with retrofit
DPFs (1994-2006 engines) and trucks with OEM DPFs (2007- 2009 engines) were similar, while
trucks with 2010 and newer engines had the lowest BC emission factors. On average, trucks with
retrofit or OEM DPFs emit 74 ± 30% less BC than trucks without DPFs, and trucks with OEM
DPFs and SCR systems (2010 and newer engines) emit 92 ± 32% less BC.
18
Figure 9. Distribution of truck engine model years at the Port of Oakland (a) prior to the Drayage Truck Regulation in 2008 (BAAQMD, 2009), (b) during implementation of the regulation in 2011, and (c) after full implementation of Phase 1 of the regulation in 2013. Note that (a) is derived from a survey of port trucks conducted prior to our emission measurements, whereas (b) and (c) correspond directly to trucks measured in this study.
19
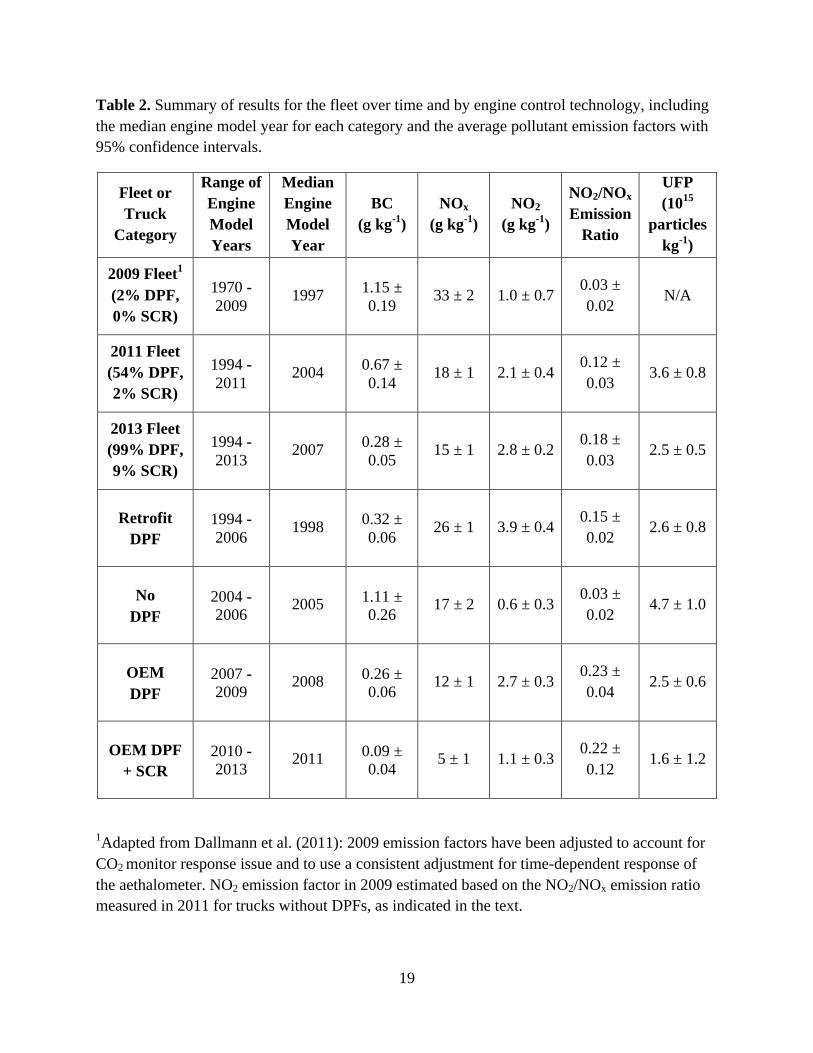
Table 2. Summary of results for the fleet over time and by engine control technology, including the median engine model year for each category and the average pollutant emission factors with 95% confidence intervals.
Fleet or Truck
Category
Range of Engine Model Years
Median Engine Model Year
BC (g kg-1)
NOx (g kg-1)
NO2
(g kg-1)
NO2/NOx Emission
Ratio
UFP (1015
particles kg-1)
2009 Fleet1
(2% DPF, 0% SCR)
1970 - 2009
1997 1.15 ± 0.19
33 ± 2 1.0 ± 0.7 0.03 ± 0.02
N/A
2011 Fleet (54% DPF, 2% SCR)
1994 - 2011
2004 0.67 ± 0.14
18 ± 1 2.1 ± 0.4 0.12 ± 0.03
3.6 ± 0.8
2013 Fleet (99% DPF, 9% SCR)
1994 - 2013
2007 0.28 ± 0.05
15 ± 1 2.8 ± 0.2 0.18 ± 0.03
2.5 ± 0.5
Retrofit DPF
1994 - 2006
1998 0.32 ± 0.06
26 ± 1 3.9 ± 0.4 0.15 ± 0.02
2.6 ± 0.8
No DPF
2004 - 2006
2005 1.11 ± 0.26
17 ± 2 0.6 ± 0.3 0.03 ± 0.02
4.7 ± 1.0
OEM DPF
2007 - 2009
2008 0.26 ± 0.06
12 ± 1 2.7 ± 0.3 0.23 ± 0.04
2.5 ± 0.6
OEM DPF + SCR
2010 - 2013
2011 0.09 ± 0.04
5 ± 1 1.1 ± 0.3 0.22 ± 0.12
1.6 ± 1.2
1Adapted from Dallmann et al. (2011): 2009 emission factors have been adjusted to account for CO2 monitor response issue and to use a consistent adjustment for time-dependent response of the aethalometer. NO2 emission factor in 2009 estimated based on the NO2/NOx emission ratio measured in 2011 for trucks without DPFs, as indicated in the text.

20
Figure 10. Fleet-average BC emission factors by year of field sampling (bars on left) and average emission factors by truck category (bars on right; includes 2011 and 2013 data only). The number of analyzed trucks is indicated in parentheses on the category axis and the error bars reflect 95% confidence intervals about the mean.

21
Figu
re 1
1. (a
) BC
and
(b) N
O2 e
mis
sion
fact
ors b
y su
pplie
rs o
f DPF
retro
fits a
nd O
EM e
ngin
es, w
ith 9
5% c
onfid
ence
inte
rval
s in
dica
ted.

22
Figure 11a shows separate BC emission factors for trucks with retrofit DPFs provided by
four different suppliers/installers. Also shown are the BC emissions from trucks equipped with
OEM DPFs (2007-2009 engines), supplied as original equipment by four major engine
manufacturers, plus an “other” category that groups together small numbers of trucks with
engines supplied by various other manufacturers. Finally, for comparison, the lowest BC
emission factors in this figure are for trucks with 2010 and newer engines with both OEM DPFs
and SCR. No disaggregation by manufacturer is shown for the newest engines because the
sample size is relatively small (n = 99 trucks). BC emission factors for trucks with Engine
Control System filters are higher than for those with DPFs installed by Donaldson and Johnson
Matthey. BC emission factors for trucks with Cleaire retrofit filters are higher than those from
trucks with Johnson Matthey filter retrofits but not higher than those installed by Donaldson at
the 95% confidence level. In contrast to the retrofit cases, none of the differences in BC emission
factors among trucks with original equipment DPFs are statistically significant.
3.2.2 Nitrogen Oxides. The fleet-average NOx emission factor decreased by 53 ± 8% between
2009 and 2013, as shown in Table 2 and Figure 12. The NO2/NOx emission ratio in 2009 was not
measured, but is assumed here to be the same as found for trucks without DPFs measured in this
study in 2011, using results for 187 trucks (NO2/NOx = 0.03 ± 0.02, see Table 2). The emission
factor for NO2 in 2009 was estimated by combining this ratio with the NOx emission factor
measured in 2009. The NO2/NOx emission ratio increased dramatically as the use of DPFs to
control exhaust PM emissions became universal for Port drayage trucks: NO2 rose from 3 to 18%
of total NOx between 2009 and 2013 (see Table 2).
Comparing the four truck categories (Figure 13), trucks retrofitted with DPFs had the
highest NO2 emission rate, which was 7 times higher than that from trucks without DPFs. The

23
NO2/NOx emission ratios were greatest for newer trucks with OEM DPFs (Figure 14), with and
without SCR systems, but engines with SCR systems had the lowest NO2 emission rate of the
three categories of DPF-equipped trucks. Despite having a similarly elevated NO2/NOx emission
ratio as observed for other DPF-equipped trucks, the NO2 emission rate for trucks with SCR
systems (2010 and newer engines) was the same as that determined for the pre-DPF era Port
truck fleet measured in 2009. This observation indicates the effectiveness of SCR in mitigating
the undesired increase in primary NO2 emissions associated with use of diesel particle filters to
control exhaust PM emissions.
While there were no significant differences in total NOx emission factors among trucks
retrofitted with DPFs from four different suppliers (Figure A2), the NO2 emission factors for
trucks retrofitted with DPFs by Donaldson and Johnson Matthey were significantly higher than
for trucks with Cleaire retrofit DPFs, as shown in Figure 11b. Examination of emissions from
newer trucks with OEM DPFs (2007-2009 model year engines) distinguished by truck engine
manufacturer revealed that trucks with Volvo engines emitted more NOx and NO2 (Figures A2
and 11b) compared to engines supplied by other manufacturers. Further, the Volvo engine NO2
emission rate exceeded that of older trucks retrofitted with DPFs (Figure 11b).

24
Figure 12. Fleet-average NOx emission factors by sampling year (bars on left) and average emission factors by truck category (bars on right; includes 2011 and 2013 data only). The number of analyzed trucks is indicated in parentheses on the category axis, and error bars reflect 95% confidence intervals about the mean.

25
Figure 13. Fleet-average NO2 emission factors by sampling year (bars on left) and average emission factors by truck category (bars on right; includes 2011 and 2013 data only). The number of analyzed trucks is indicated in parentheses on the category axis and the error bars reflect 95% confidence intervals about the mean.

26
Figure 14. Fleet-average NO2/NOx emission ratios by sampling year (bars on left) and average emission ratios by truck category (bars on right; includes 2011 and 2013 data only). The number of analyzed trucks is indicated in parentheses on the category axis and the error bars reflect 95% confidence intervals about the mean.

27
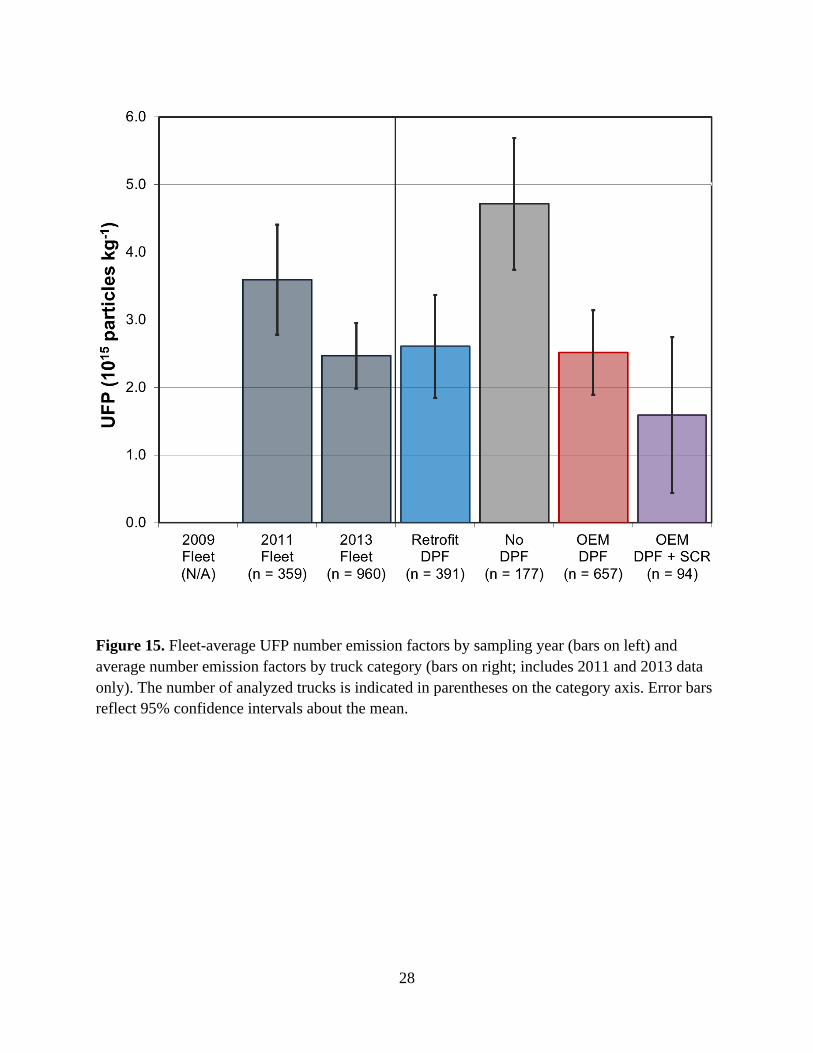
3.2.3 Ultrafine Particles. The Port fleet-average UFP number emission rate decreased 31 ± 27%
between 2011 and 2013 (see Table 2 and Figure 15). It is possible that the reduction in UFP
emissions was larger than the above calculation would suggest. While the UFP emission rate was
not measured in 2009, the emission rate measured for trucks without DPFs, (4.7 ± 1.0) × 1015
kg-1, provides an estimate of the UFP emission rate from Port trucks in 2009. (Note that the BC
emission factor for trucks without DPFs measured in 2011 was about the same as that for the
2009 fleet-average.) Using the higher baseline estimate for UFP, the estimated reduction in the
particle number emission factor between 2009 to 2013 increases to 47 ± 25%. Trucks with 2010
and newer engines had the lowest UFP emission rates, emitting one-third the number of UFP per
kg of fuel burned compared to trucks without DPFs.
UFP emission factors presented above are based on particle numbers measured with an
ultrafine water-based CPC (WCPC). Results were highly correlated (R2 = 0.9) but approximately
1.5 times higher, on average, than UFP emission factors for the same trucks calculated from
measurements made using a butanol-based CPC (Table A2 and Figure A3). The correlation was
not as good when comparing values of UFP derived using ultrafine WCPC and FMPS
measurement methods (R2 = 0.5). On average, emission factors based on the WCPC were 1.8
times higher than those based on the FMPS. The lower values derived from FMPS measurements
may be partly due to the fact that the ultrafine WCPC measures particles as small as 2.5 nm,
whereas the lower size limit of the FMPS is 5.6 nm. This result agrees with the observation of
Jeong and Evans (2009) that WCPC measurements of particle number concentration exceed
FMPS measurements, but is counter to the finding reported by Zimmerman et al. (2014) that the
FMPS overstates particle number concentrations during highly time-resolved measurements of
high emitting vehicles.
28
Figure 15. Fleet-average UFP number emission factors by sampling year (bars on left) and average number emission factors by truck category (bars on right; includes 2011 and 2013 data only). The number of analyzed trucks is indicated in parentheses on the category axis. Error bars reflect 95% confidence intervals about the mean.

29
Emission factor-weighted, normalized particle size distributions determined with
Equation 2 for each truck were averaged across each particle diameter bin to determine a
characteristic UFP emission rate distribution for each truck category, with results as shown in
Figure 16. Distributions were weighted by both FMPS- and WCPC-derived UFP emission
factors. The FMPS weighting provides a self-consistent normalization whereas the WCPC
weighting may more accurately reflect the UFP emission rate. As shown in Figure 16, trucks
emitted particles ranging in size between 6 nm (the lower bound of the FMPS) and 300 nm.
DPFs appear to be most effective in reducing the emission rate of particles larger than
approximately 15 nm: on average, the emission rates of such particles from trucks without filters
exceeded those from DPF-equipped trucks by a factor of about two. These data further indicate
that OEM DPF-equipped trucks (2007-2009 engines) had higher emissions of nucleation mode
particles (~10 nm in diameter) than either older trucks retrofitted with DPFs or trucks with 2010
and newer engines.
Particle size distributions for all four sub-groups of trucks were characterized by an
apparent peak in the smallest size bin of the FMPS (Figure 16). We present these data as
measured by the FMPS, though it is unclear if they are truly indicative of a peak in the number
concentration of particles smaller than the lower sizing limit of the FMPS.
Assuming spherical particles of uniform density (1 g cm-3) across the entire particle size
range, the particle number emission rate distributions were converted into mass emission rate
distributions, as shown in Figure 17. The PM emission factor for each category of truck could
ideally be estimated from the integrated area under each respective mass emission rate
distribution. However, the sensitivity of the FMPS decreases by an order of magnitude in going
from the smallest to largest size bins, resulting in inherent noise in the upper size bins that is

30
magnified when number concentrations are converted to mass concentrations (Figure 17).
Therefore, total PM mass emission rates corresponding to each truck category were determined
assuming lognormal distributions and doubling the area to the left of the assumed peak value of
each mass distribution (typically around 200 nm). The resulting estimated PM emission factor
for trucks without particle filters was approximately 3 times greater, on average, than that for
DPF-equipped trucks. Trucks with OEM DPF and SCR systems had the lowest PM mass
emission factor, followed by trucks with OEM DPFs and retrofit DPFs.
Figure 16a. The characteristic normalized particle number emission rate distribution for each engine control technology, as determined with the FMPS PN emission factor in Equation 2.

31
Figure 16b. The characteristic normalized particle number emission rate distribution for each engine control technology, as determined with the WCPC PN emission factor in Equation 2.

32
Figure 17a. The characteristic normalized particle mass distributions for each engine control technology, assuming spherical particles of uniform density (1 g cm-3) across the size range. The average PM emission estimated from each mass emission rate distribution is noted.
Comparing estimated PM emission factors with average BC emission factor for each
truck category gives BC/PM emission ratios. Using the FMPS-derived PM emission factor, the
BC/PM ratio for trucks without DPFs and those with retrofit DPFs is ~0.65, which agrees with
previous studies (Ban-Weiss et al., 2008), while the ratio for OEM DPF-equipped trucks is
smaller by a factor of about 2 (BC/PM = 0.34). The WCPC-derived ratios are lower: the BC/PM

33
ratio is 0.24 for retrofit DPF trucks, 0.40 for trucks without DPFs, 0.30 for OEM DPF-equipped
trucks, and 0.15 for trucks with OEM DPF and SCR systems. Even though the better sensitivity
of the WCPC to smaller particles may more accurately capture total UFP emissions, the self-
consistency of the FMPS-weighting provides a better estimate of PM mass emissions.
Figure 17b. The characteristic normalized particle mass distributions for each engine control technology, assuming spherical particles of uniform density (1 g cm-3) across the size range. The average PM emission estimated from each mass emission rate distribution is noted.
34
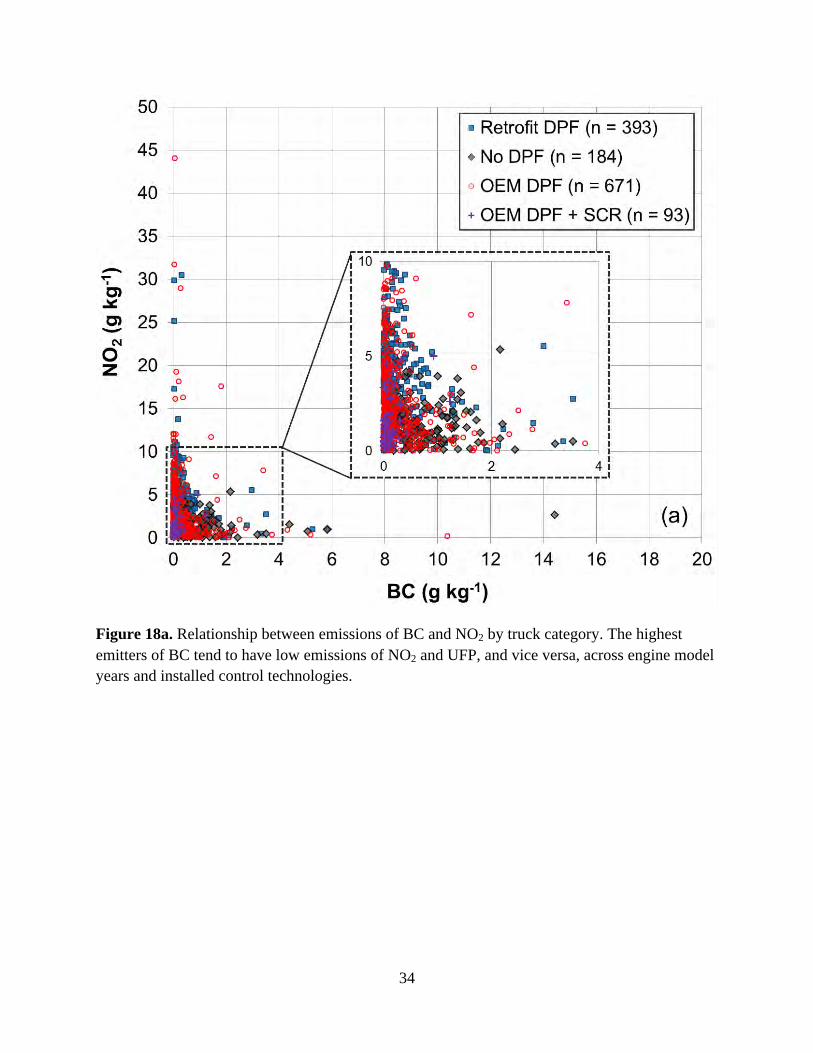
Figure 18a. Relationship between emissions of BC and NO2 by truck category. The highest emitters of BC tend to have low emissions of NO2 and UFP, and vice versa, across engine model years and installed control technologies.

35
Figure 18b. Relationship between emissions of BC and UFP by truck category. The highest emitters of BC tend to have low emissions of NO2 and UFP, and vice versa, across engine model years and installed control technologies.

36
3.2.4 High Emitters. In general, the highest emitters of BC tended to have low emissions of NO2
and UFP—and vice versa—regardless of the type or vintage of installed emission control
equipment (see Figure 18). An inverse relationship between BC and UFP has been observed
previously (Ban-Weiss et al., 2009) and is consistent with the hypothesis that UFP formation is
suppressed when large amounts of BC are present: the availability of existing (BC) particle
surface area means that condensation onto existing particle surfaces is favored over nucleation to
form new UFP (Kittelson, 1998). The relationship between BC and NO2 can be explained by the
reduction of BC mass with highly catalyzed DPFs, which would tend to increase NO2. This
inverse relationship is consistent with the BC and NO2 emissions trends of trucks with retrofit
DPFs shown in Figure 11.
3.3 Changes in Emission Factor Distributions. As fleet-average emission factors have
decreased for Port drayage trucks, emission factor distributions have become increasingly
skewed, such that a small fraction of the fleet is responsible for an increasing fraction of total
emissions, as shown in Figures 19 and 20. Particle-related emission factor distributions are more
skewed than for nitrogen oxides. In 2013, the highest emitting 10% of trucks were responsible
for 65% of total BC and 80% of total UFP, compared to 32 and 37% of total NOx and NO2
emissions, respectively. NOx emission factor distributions are also starting to show skewness,
especially as the number of engines equipped with SCR has begun to increase.
An alternative version of these distributions is presented in Figure 21, which sorts the
emission factors within each truck category from lowest to highest for both BC and NOx. Figure
21a shows that the top 5% of BC emitters within the retrofit and OEM DPF truck categories
exceeded the 2009 fleet average of 1.15 g BC kg-1, while no truck with 2010 and newer engines
had emissions above this baseline value. As in Figures 19b and 20, the distributions of NOx

37
emission factors shown in Figure 21b are less skewed, and the trend between truck categories
follows the corresponding engine model years. Only one high emitting truck equipped with an
OEM DPF and SCR system exceeded the 2009 fleet-average value of 33 g NOx kg-1.
Emission factor distributions are shown in Figure 22, separately for each engine model
year, as measured in 2011 and 2013. Trucks equipped with OEM DPFs and SCR systems not
only had the lowest BC and NOx emission factors, but also showed the least amount of
variability in measured emission rates. Variability in emission factors for many individual engine
model years increased in the 2013 field sampling campaign relative to 2011, suggesting
degradation or failure of some installed emission control systems over time. Our analysis
identified two OEM DPF trucks as the two highest BC emitters in 2013 (Figure 22a). These
trucks had emission factors of ~10 g BC kg-1 when sampled in 2013, which is significantly
higher than the fleet-average of 0.28 ± 0.05 g kg-1 and is approximately twice the level observed
for the next highest emitting trucks. In this case, the two high emitting OEM DPF trucks
represented 0.2% of the fleet based on number, but are responsible for 7% of total BC emissions
(Figure 20). This analysis also shows that trucks with 2007-2009 engines frequently emit NOx at
levels that are similar to what is observed from older trucks, even though the average emission
rate for older trucks is approximately twice as great (Figure 12). As such, even though average
emissions of BC and NOx have decreased, some newer trucks were observed to emit BC and
NOx at high levels.
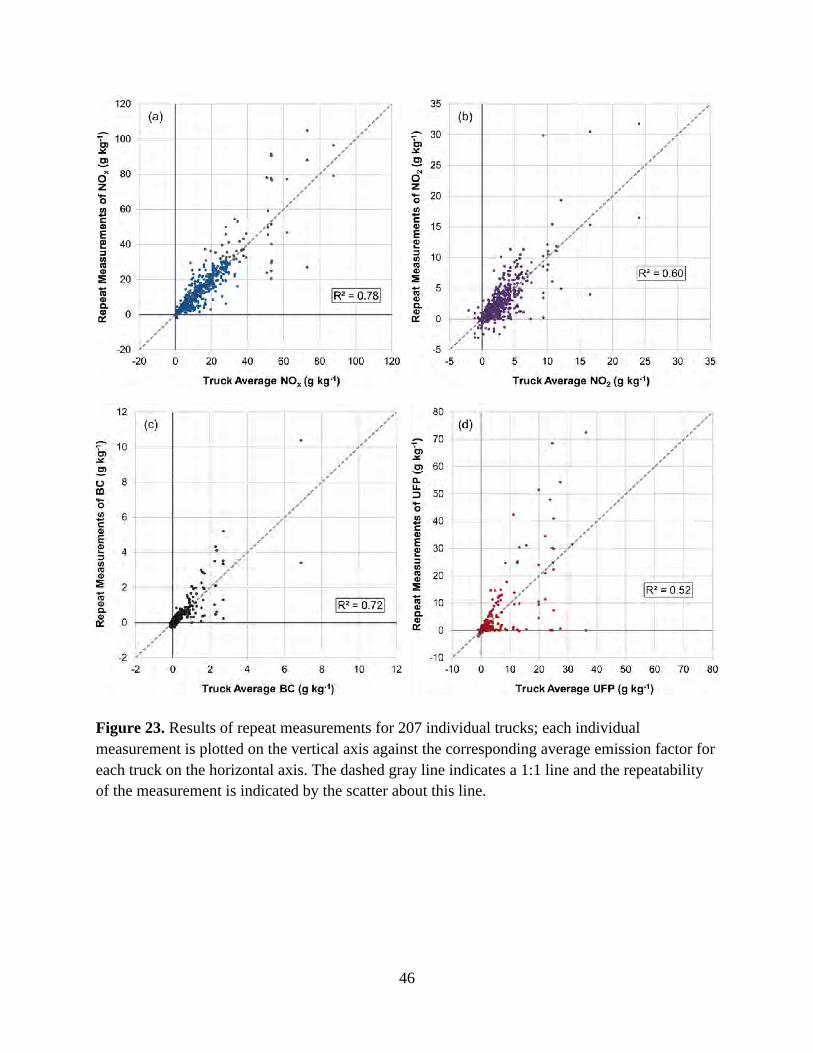
3.4 Emissions Variability. In the results presented above, the 95% confidence intervals provide
a measure of emission factor variability observed in this study. Many trucks passed by our
sampling location two or more times, and this replicate sampling provides a further opportunity
to evaluate emissions variability for individual trucks. Repeat measurements of 207 individual

38
trucks are plotted in Figure 23 against the average emission factor for the corresponding truck.
Scatter about the indicated 1:1 line is due to emission factor variability for individual trucks
sampled repeatedly. R2 values for NOx and BC are both relatively high, whereas corresponding
values for NO2 and UFP are lower. This analysis indicates that NOx and BC emission factors are
less variable than NO2 and UFP. Measurement uncertainties may contribute to variability in NO2
emission factors due to the need to calculate NO2 by difference between NOx and NO.
Variability in UFP emission factors is much greater than observed during laboratory evaluation
of the plume capture sampling method and is most likely due to real variability in UFP emission
rates from individual trucks. Fleet-average results for UFP are still meaningful, but the
variability in UFP emissions may confound snapshot-type measurements to characterize
emissions of this pollutant from individual trucks.

39
Figure 19a. Cumulative emissions for the fleet with trucks ranked from highest to lowest for BC emissions over the implementation of the Drayage Truck Regulation.

40
Figure 19b. Cumulative emissions for the fleet with trucks ranked from highest to lowest for NOx emissions over the implementation of the Drayage Truck Regulation.

41
Figure 20. Cumulative pollutant emissions for the 2013 truck fleet after the full implementation of Phase 1 of the Drayage Truck Regulation, with trucks ranked from highest to lowest in terms of emission factors for each of the pollutants.

42
Figure 21a. Distribution of BC emissions as a function of sampling period and truck category, with trucks ranked from cleanest to highest-emitting (moving from left to right). The fleet-average emission factor measured in 2009 is indicated by the horizontal dashed line.

43
Figure 21b. Distribution of NOx emissions as a function of sampling period and truck category, with trucks ranked from cleanest to highest-emitting. The fleet-average emission factor measured in 2009 is indicated by the horizontal dashed line.

44
Figure 22a. Distribution of BC emission factors across engine model years for each individually measured truck. The truck categories as measured in 2011 and 2013 are shown separately and indicated in the legend.

45
Figure 22b. Distribution of NOx emission factors across engine model years for each individually measured truck. The truck categories as measured in 2011 and 2013 are shown separately and indicated in the legend above.
46
Figure 23. Results of repeat measurements for 207 individual trucks; each individual measurement is plotted on the vertical axis against the corresponding average emission factor for each truck on the horizontal axis. The dashed gray line indicates a 1:1 line and the repeatability of the measurement is indicated by the scatter about this line.

47
4. DISCUSSION
Measured reductions in BC and NOx emission factors of 76 ± 22 and 53 ± 8%,
respectively, were found in this study following the complete implementation of the first phase
of the Drayage Truck Regulation. These reductions are larger than the corresponding initial
reductions of 54 ± 11 and 41 ± 5% reported by Dallmann et al. (2011) based on measurements
made during 2009 and 2010. The larger reductions reported here correspond to more widespread
(near universal) use of DPFs and further modernization of the truck fleet at the Port of Oakland.
Emission reductions observed at the Port over ~3.5 years, from November 2009 to March 2013,
are nearly double the 39 and 30% reductions in BC and NOx emission factors measured for
trucks at the Caldecott Tunnel over a period of 9 years, from 1997 to 2006 (Ban-Weiss et al.,
2008). The Caldecott Tunnel truck fleet was not subject to accelerated retrofit/replacement
requirements during the time span studied by Ban-Weiss et al. Thus, it is clear that changes in
emission factors from the Port truck fleet have taken place on an accelerated schedule, and
emission reductions have progressed well beyond what would be expected due to normal fleet
turnover alone.
The introduction of newer engines and adoption of after-treatment exhaust controls such
as DPFs and SCR systems have reduced fleet emissions of NOx, BC, and UFP, but have led to
increased emissions of NO2 and an increase in the NO2/NOx emission ratio from 0.03 to 0.18.
This increase in NO2 is due to the passive regeneration scheme that is part of many diesel
particle filter systems, in which NO present in the exhaust is deliberately oxidized to NO2.
There are good prospects that increases in NO2 emissions reported here will be mitigated
by the eventual replacement of pre-2007 engines. Trucks equipped with 2010 and newer engines
48
emitted 71 ± 15% less NO2 and 72 ± 27% less BC than trucks with retrofit DPFs, and 58 ± 17%
less NO2 and 67 ± 29% less BC than trucks with 2007-2009 engines. Thus, as the Port truck fleet
continues to shift towards trucks equipped with both OEM DPF and SCR systems, the reduction
in BC emission factors could rise to the 90% range on a fleet-average basis, with little if any
increase in NO2 emissions.
The emission factor-weighted particle number size distribution for trucks without DPFs
were trimodal and included broad peaks around 10, 20, and 80 nm, with the peak at 80 nm
dominating the distribution. DPFs most effectively removed particles larger than 15 nm. Thus, in
addition to reducing the UFP number emission factor, DPFs alter the size distribution of emitted
particles: the 10 nm peak becomes dominant for trucks with DPFs. DPFs on newer (2007+)
trucks include active filter regeneration, and emissions of 5-10 nm particles are known to
increase during active regeneration events (Dwyer et al., 2010). The extent to which active
regeneration events may have affected UFP emission rates in our study is unknown. Despite
previously expressed concerns that use of DPFs could lead to increases in total UFP emissions,
all categories of DPF systems examined in this study showed reductions rather than increases in
total particle number as well as PM mass emission rates, relative to a comparison group of trucks
measured in this study in 2011 with 2004-2006 engines and no DPF system installed.
Differences in operating conditions can influence pollutant emission rates. This
variability can be studied in the laboratory using engine or chassis dynamometer tests over
different driving cycles, but these tests are costly and are generally limited to a small sample
size. In-use emission evaluations as per the current study, on the other hand, can assess the
emission performance of thousands of trucks under real-world conditions. These measurements
provide emissions snapshots, though, and do not fully capture the emissions variability for those

49
trucks. In the current study, hundreds of trucks drove by the sampling location multiple times,
and we used these repeat measurements to characterize emissions variability. Overall, UFP
emissions were more variable than emissions of BC or NOx, as indicated by the wider confidence
intervals about the fleet, truck category, and installer/manufacturer averages (Figures 10-15 and
A2, Table 3) and by the greater scatter about the 1:1 trendline in the analysis of repeat
measurements for individual trucks (Figure 23).
As the drayage truck fleet has become cleaner on a fleet-average basis, emission factor
distributions have become increasingly skewed. A smaller portion of the fleet is now responsible
for a larger fraction of total pollutant emissions. Identification and follow-up for this small
fraction of high-emitting trucks within the fleet could become an effective method of further
reducing fleet emissions in the future. For instance, if the top 10% of BC emitters from the 2013
fleet when ranked from dirtiest to cleanest (see Figure 20) were removed, then fleet-average BC
emissions would decrease from 0.28 ± 0.05 to 0.11 ± 0.01 g kg-1. The trucks that comprise this
high-emitting sub-fleet have an average BC emission factor of 1.80 ± 0.10 g kg-1, which was
approximately six times the fleet average value in 2013. A number of the trucks included in this
top 10% were measured multiple times at the Port, and 64% of the repeat measurements were
also included in the top 10% of BC emissions. This suggests that the high-emitter problem for
BC is more often chronic rather than intermittent in nature. If all repeat measurements of BC by
trucks classified as in the dirtiest 10% of the 2013 fleet are included, the average BC emission
factor remains much higher than the fleet average at 1.36 ± 0.10 g kg-1. Elimination of these
high-emitting trucks (e.g., through repair or replacement) would further increase the BC
reduction measured in this study between 2009 to 2011from 76 ± 21% (shown in Figure 10) to
90 ± 22%.

50
In conclusion, widespread application of DPF systems has substantially reduced particle
emissions from heavy-duty diesel trucks near the Port of Oakland. Related increases in
emissions of primary NO2 will be offset using SCR systems. Total UFP emissions have
decreased as a result of using DPF systems to control exhaust PM, with beneficial effects most
clearly apparent at particle sizes of 15 nm and larger.

51
5. RECOMMENDATIONS
Since the completion of this study in 2013, Phase 2 of the Drayage Truck Regulation has
required the replacement of nearly one-third of the Port of Oakland truck fleet (see Table 1 and
Figure 9). Specifically, Phase 2 required replacement of 2006 and older model year engines, all
of which had been previously retrofitted with DPFs, with 2007 or newer engines. Emission
factors of NOx and NO2 are lower for 2007 and newer engines than retrofitted pre-2007 engines,
and these emissions as well as BC are lowest for 2010 and newer engines (see Figures 10, 12,
and 13). Most notably, NO2 emissions for 2010 and newer engines are comparable to the pre-
regulation fleet measured in 2009. Thus, the additional pollutant reductions that have occurred
since 2013, and especially the mitigation of increased NO2 emissions, depend on the extent to
which pre-2007 engines were replaced with either 2007-2009 or 2010 and newer engines.
Additional measurements near the Port of Oakland are recommended to verify the BC,
NOx, and NO2 emissions reductions associated with this significant further modernization of the
Port truck fleet. In addition to measuring the effects of the complete regulation (Phases 1 and 2)
on fleet composition and emissions, the supplemental measurements would enable further
evaluation of emissions from SCR-equipped trucks as more 2010 and newer engines enter the
fleet. Additional measurements would also provide an opportunity to assess the potential impacts
and prevalence of DPF system failures or degradation as a function of increasing truck/engine
age. Additional species that may be affected by use of SCR, including nitrous oxide (N2O) and
ammonia (NH3), which were not included in the current study, could also be measured. This
added data near the Port would facilitate a more robust evaluation of emissions from DPF- and
SCR-equipped trucks near the Port of Oakland.

52
6. REFERENCES
Ban-Weiss, G. A.; McLaughlin, J. P.; Harley, R. A.; Lunden, M. M.; Kirchstetter, T. W.; Kean, A. J.; Strawa, A. W.; Stevenson, E. D.; Kendall, G. R. Long-term changes in emissions of nitrogen oxides and particulate matter from on-road gasoline and diesel vehicles. Atmos. Environ. 2008, 42, 220-232; DOI 10.1016/j.atmosenv.2007.09.049.
Ban-Weiss, G. A.; Lunden, M. M.; Kirchstetter, T. W.; Harley, R. A. Measurement of black carbon and particle number emission factors from individual heavy-duty trucks. Environ. Sci. Technol. 2009, 43, 1419-1424; DOI 10.1021/es8021039.
Barone T. L.; Storey, J. M. E.; Domingo, N. An analysis of field-aged diesel particulate filter performance: Particle emissions before, during, and after regeneration. J. Air & Waste Manage. Assoc. 2010, 60, 968-976; DOI 10.3155/1047-3289.60.8.968.
BAAQMD. West Oakland Truck Survey. Bay Area Air Quality Management District, San Francisco, CA, 2009; http://www.baaqmd.gov/~/media/Files/Planning%20and%20Research/CARE%20Program/Final%20West%20Oakland%20Truck%20Survey%20Report%20Dec%202009.ashx (accessed: 17 Jun 2014).
Bishop, G. A.; Schuchmann, B. G.; Stedman, D. H.; Lawson, D. R. Emission changes resulting from the San Pedro Bay, California Ports truck retirement program. Environ. Sci. Technol. 2012, 46, 551-558; DOI 10.1021/es202392g.
Biswas, S.; Hu, S.; Verma, V.; Herner, J. D.; Robertson, W. H., Ayala, A.; Sioutas, C. Physical properties of particulate matter (PM) from late model heavy-duty diesel vehicles operating with advanced PM and NOx emission control technologies. Atmos. Environ. 2008, 42, 5622-5634; DOI 10.1016/j.atmosenv.2008.03.007.
Bond, T.C.; et al. Bounding the role of black carbon in the climate system: A scientific assessment. J. Geophys. Res. 2013, 118, 5380-5552. DOI 10.1002/jgrd.50171.
Brugge, D.; Durant, J. L., Rioux, C. Near-highway pollutants in motor vehicle exhaust: A review of epidemiologic evidence of cardiac and pulmonary health risks. Enivron. Health 2007, 6; DOI 10.1186/1476-069X-6-23.
CARB. Overview of the Statewide Drayage Truck Regulation. California Air Resources Board, Sacramento, CA, 2013; http://www.arb.ca.gov/msprog/onroad/porttruck/regfactsheet.pdf (accessed: 13 Apr 2014).
Carslaw, D. C. Evidence of an increasing NO2/NOx emissions ratio from road traffic emissions. Atmos. Environ. 2005, 39, 4793-4802; DOI 10.1016/j.atmosenv.2005.06.023.

53
Dallmann, T. R.; Harley, R. A. Evaluation of mobile source emission trends in the United States. J. Geophys. Res. 2010, 115, D14305; DOI 10.1029/2010JD013862.
Dallmann, T. R.; Harley, R. A .; Kirchstetter, T. W. Effects of diesel particle filter retrofits and accelerated fleet turnover on drayage truck emissions at the Port of Oakland. Environ. Sci. Technol. 2011, 45, 10773-10779; DOI 10.1021/es202609q.
Dwyer, H.; Ayala, A.; Zhang, S.; Collins, J.; Huai, T.; Herner, J.; Chau, W. Emissions from a diesel car during regeneration of an active diesel particulate filter. J. Aerosol Sci. 2010, 41, 541-552; DOI 10.1016/j.jaerosci.2010.04.001.
EPA. Heavy-Duty Highway Compression-Ignition Engines and Urban Buses—Exhaust Emission Standards. Office of Transportation and Air Quality, U.S. Environmental Protection Agency, Washington, DC, 2013; http://www.epa.gov/otaq/standards/heavy-duty/hdci-exhaust.htm (accessed: 17 Jun 2014).
Herner, J. D.; Hu, S.; Robertson, W. H.; Huai, T.; Collins, J. F.; Dwyer, H.; Ayala, A. Effect of advanced aftertreatment for PM and NOx control on heavy-duty diesel truck emissions. Environ. Sci. Technol. 2009, 43, 5928-5933; DOI 10.1021/es9008294.
Herner, J. D.; Hu, S.; Robertson, W. H.; Huai, T.; Chang, M.-C. O.; Rieger, P.; Ayala, A. Effect of advanced aftertreatment for PM and NOx reduction on heavy-duty diesel engine ultrafine particle emissions. Environ. Sci. Technol. 2011, 45, 2413-2419; DOI 10.1021/es102792y.
IARC. Press Release No. 213, IARC: Diesel Engine Exhaust Carcinogenic. International Agency for Research on Cancer, World Health Organization, Lyon, France, 2012; http://www.iarc.fr/en/media-centre/pr/2012/pdfs/pr213_E.pdf (accessed: 17 Jun 2014).
Jeong, C.-H.; Evans, G. J. Inter-comparison of a fast mobility particle sizer and a scanning mobility particle sizer incorporating an ultrafine water-based condensation particle counter. Aerosol Sci. Tech. 2009, 43, 364-373; DOI 10.1080/02786820802662939.
Kirchstetter, T. W.; Novakov, T. Controlled generation of black carbon particles from a diffusion flame and applications in evaluating black carbon measurement methods. Atmos. Environ. 2007, 41, 1874-1888; DOI 10.1016/j.atmosenv.2006.10.067.
Kittleson, D. B. Engines and nanoparticles: A review. J. Aerosol Sci. 1998, 29, 575-588.
Lloyd, A. C.; Cackette, T. A. Diesel engines: Environmental impact and control. J. Air & Waste Manage. Assoc. 2001, 51, 809-847.
McClellan, R. O. Health effects of exposure to diesel exhaust particles. Annu. Rev. Pharmacol. Toxicol. 1987, 27, 279-300.

54
McDonald, B. C.; Dallmann, T. R.; Martin, E. W.; Harley, R. A. Long-term trends in nitrogen oxide emissions from motor vehicles at national, state, and air basin scales. J. Geophys. Res. 2012, 117, D00V18; DOI 10.1029/2012JD018304.
Morawska, L.; Ristovski, Z.; Jayartne, E. R.; Keogh, D. U.; Ling, X. Ambient nana and ultrafine particles from motor vehicle emissions: Characteristics, ambient processing and implications on human exposure. Atmos. Environ. 2008, 42, 8113-8138; DOI 10.1016/j.atmosenv.2008.07.050.
Ramanathan, V.; et al. Black carbon and the regional climate of California. Scripps Institute of Oceanography, University of California, San Diego, CA. Report to the California Air Resources Board, Contract 08-323, 2013.
van Setten, B. A. A. L.; Makkee, M.; Moulijn, J. A. Science and technology of catalytic diesel particulate filters. Cataly. Rev. 2001, 43, 489-564.
Zimmerman, N.; Pollitt, K. J. G.; Jeong, C.-H.; Wang, J. M.; Jung, T.; Cooper, J. M.; Wallace, J. S.; Evans, G. J. Comparison of three nanoparticle sizing instruments: The influence of particle morphology. Atmos. Environ. 2014, 86, 140-147; DOI 10.1016/j.atmosenv.2013.12.023.

55
APPENDIX
Table A1. Instrumentation used to measure truck exhaust emissions in this study.
Parameter Instrument Time Resolution
CO2 concentration Nondispersive infrared gas analyzer (LI-COR LI-7000)
2 Hz
NO, NOx concentrations (the difference of which gives NO2 concentration)
Two chemiluminescent analyzers (ECO Physics CLD-64)
2 Hz
BC concentration Aethalometer (Magee Scientific AE16) 1 Hz
BC concentration Photoacoustic absorption spectrometer (PAS) with reciprocal nephelometer (custom)
1 Hz
Particle number concentration*
Ultrafine, water-based condensation particle counter (TSI 3788); lower size limit of 2.5 nm and noted as ultrafine WCPC in above text and as PUW in Table A2 and Figure A3
2 Hz
Particle number concentration
Ultrafine, butanol-based condensation particle counter (TSI 3776); lower size limit of 2.5 nm and noted as ultrafine BCPC in above text and as PUB in Table A2 and Figure A3
10 Hz
Particle number concentration, dilution factor
Two general purpose, high concentration water-based condensation particle counters (TSI 3783); lower size limit of 7 nm and noted as high concentration WCPC in above text and as PSW or PHW in Table A2 and Figure A3
2 Hz
Particle number concentration and size distribution
Fast mobility particle sizer (TSI 3091); lower size limit of 5.6 nm and noted as FMPS in above text and in Table A2 and Figure A3
1 Hz
*The reported UFP emission factors in Table 2 and Figures 15, 16b, 17b, 18b, 20, and 23d are derived from this CPC.

56
Table A2. Summary of ultrafine particle (UFP) emission factors measured using four different CPCs and the FMPS, for drayage trucks operating at the Port of Oakland in 2011 and 2013. Emission factor units are number of particles emitted per kg of diesel fuel burned. Uncertainty bounds provide 95% confidence intervals about the mean. See Table A1 for more detailed descriptions of the individual CPCs.
Fleet or Truck
Category
PUW (1015
particles kg-1)
PUB (1015
particles kg-1)
PSW (1015
particles kg-1)
PHW (1015
particles kg-1)
FMPS (1015
particles kg-1)
2011 Fleet (54% DPF, 2% SCR)
3.6 ± 0.8 2.5 ± 0.5 3.8 ± 2.5 2.5 ± 0.9 2.9 ± 0.9
2013 Fleet (99% DPF, 9% SCR)
2.5 ± 0.5 2.0 ± 0.4 1.8 ± 0.3 1.9 ± 0.5 1.3 ± 0.3
Retrofit DPF
(1994-2006) 2.6 ± 0.8 1.8 ± 0.5 2.2 ± 0.9 1.6 ± 0.6 1.0 ± 0.4
No DPF
(2004-2006) 4.7 ± 1.0 3.9 ± 0.8 3.9 ± 1.9 2.9 ± 0.8 4.3 ± 1.2
OEM DPF
(2007-2009) 2.5 ± 0.6 2.0 ± 0.5 1.9 ± 0.6 2.4 ± 0.8 1.7 ± 0.5
OEM DPF + SCR
(2010-2013) 1.6 ± 1.2 1.0 ± 1.0 1.1 ± 0.6 0.7 ± 0.4 0.7 ± 0.5
57
Figure A1. Map of the Port of Oakland, Union Pacific (UP) and BNSF rail yards, nearby community of West Oakland, and sampling location (noted by a star).

58
Figure A2. Average (a) NOx emission factors and (b) NO2/NOx emission ratios, separated by major suppliers of DPF retrofits and OEM engines, with 95% confidence intervals indicated.

59
Figure A3. Comparison of UFP emission factors determined from each of four CPCs and the FMPS, using a water CPC-derived UFP emission rate as the independent variable. The dashed line is the 1:1 diagonal; linear best fit lines and regression statistics are also shown for each plot.