on-road and in-laboratory testing to demonstrate effects of ulsd
TRANSCRIPT

1
NREL/CP-540-46533. Posted with permission. Presented at the 2009 SAE Powertrain, Fuels, and Lubricants Meeting November 2-4, 2009, San Antonio, Texas
2009-01-2733
On-Road and In-Laboratory Testing to Demonstrate Effects of ULSD, B20, and B99 on a Retrofit Urea-SCR Aftertreatment System
Kevin Walkowicz National Renewable Energy Laboratory
Kwangsam Na, William Robertson, Keshav Sahay California Air Resources Board
Mike Bogdanoff South Coast Air Quality Management District
Chris Weaver Engine, Fuel, and Emissions Engineering, Inc.
Richard Carlson Extengine Systems, Inc.
ABSTRACT
In order to demonstrate the performance of a retrofitted selective catalytic reduction (SCR) system while also addressing the issues associated with greater use of biodiesel, a 2005 International 9200i tractor owned by the City of Santa Monica was retrofitted with a titania-vanadia-tungsten catalyst and a urea dosing system supplied by Extengine Systems, Inc. This tractor was operated under normal service conditions within the City of Santa Monica refuse collection and transportation fleet. An on-board emissions measurement system supplied by Engine, Fuel, and Emissions Engineering, Inc., was installed on the vehicle; it measured the emissions and fuel use of the vehicle while it operated on ultra-low-sulfur diesel (ULSD), 20% biodiesel (B20), and 99% biodiesel (B99) on consecutive days. The vehicle, with a similar aftertreatment system, was then tested at the California Air Resources Board (CARB) Los Angeles Heavy-Duty Emissions Lab and tested on the Urban Dynamometer Driving Schedule (UDDS) to again assess the effects of ULSD, B20, and B99 on the performance of the urea-SCR aftertreatment system.
Results from this testing showed that oxides of nitrogen (NOx) emissions increased by 6%-12% when the blend was increased from ULSD to B20, by 16%-35% when the blend was increased from ULSD to B99, and by 26%-27% when it was increased from B20 to B99. Particulate matter (PM) emissions decreased by 37%-50% when the blend was increased from ULSD to B20, by 71%-79% when it was increased from ULSD to B99, and by 60%-63% when it was increased from B20 to B99. The SCR system reduced NOx
emissions by 64%-87%, and its performance was not affected by the use of biodiesel.
INTRODUCTION
Biodiesel is a renewable fuel produced from vegetable oil, animal fat, or waste cooking oil. It consists of mono-alkyl esters of fatty acids, typically methyl esters, that are required to meet the requirements of ASTM standard D6751 in the United States. Biodiesel is normally used at up to a 20 volume percent blend (known as B20) with petroleum diesel, although there is some use of higher
2
percentage blends. A number of controlled fleet evaluations have been performed for B20 [1-3], and these typically showed only minor effects on operability as long as the biodiesel used to make the blend met the ASTM standard requirements. In order to meet the U.S. Environmental Protection Agency’s (EPA’s) 2010 standard for heavy-duty engines of 0.2 g/bhp-h for NOx, many manufacturers are turning to selective catalytic reduction (SCR) with ammonia (supplied as urea) as the reductant. Only limited results of biodiesel blend performance with NOx
SCR catalysts have been reported. Williams and coworkers compared ULSD and B20 and observed no difference in the performance of an Fe-zeolite SCR catalyst tested on a medium-duty engine [4]. Subsequent testing showed lower levels of hydrocarbon adsorption and consequent inhibition of the SCR reaction at low exhaust temperatures for B20 vs. ULSD [5]. Tatur and coworkers [6] tested a light-duty vehicle equipped with a diesel particle filter (DPF)/SCR system (Fe-zeolite SCR catalyst). The emission control system was aged to 120,000 miles on B20. The SCR system’s performance was initially fuel-neutral; however, significant performance degradation was observed over the 120,000-mile aging. The degradation may have been thermal deactivation from combustion of adsorbed hydrocarbon leading to very high catalyst temperatures – a situation that would likely have been worse for ULSD because of higher exhaust hydrocarbon concentration. Alternatively, alkali metals present in the biodiesel may have poisoned the SCR catalyst.
To provide additional insight into the performance of biodiesel with a range of SCR catalysts, here we report results for on-highway and chassis dynamometer testing of heavy-duty trucks retrofitted with a vanadia-based SCR catalyst. The City of Santa Monica was contracted by the South Coast Air Quality Management District (SCAQMD) to demonstrate the viability of biodiesel used in tandem with SCR. This project is intended to demonstrate the feasibility of a retrofit SCR system to approach 2010 federal NOx
emissions standards while identifying strategies for addressing the issues associated with greater use of biodiesel.
The results from this testing, documented in this paper, show (1) the effects of varied blends of biodiesel on a urea-SCR aftertreatment system under both on-road and in-lab environments, (2) the effects of varied blends of biodiesel on the standard engine system (no SCR) under both on-road and in-lab environments, and (3) the interactive effects on emissions of biodiesel and a urea-SCR system under both on-road and in-lab environments. The NOx
ON-ROAD TRUCK & TESTING METHODS
and PM emissions are compared under all the conditions described in this paper.
TEST PLAN
The project was conducted in three phases:
1. Field testing of a vehicle fueled with B20, B99, and ULSD and without an SCR system. The truck was tested both loaded and unloaded (load = 20-25 tons).
2. Field testing of a vehicle fueled with B20, B99, and ULSD and with an SCR system. The truck was tested both loaded and unloaded (load = 20-25 tons).
3. Laboratory testing of the vehicle at the California Air Resources Board (CARB) facility in Los Angeles for B20, B99, and ULSD fuel both with and without the SCR system installed. The testing was conducted under “loaded” conditions (60,678 lb test weight).
HARDWARE TESTED
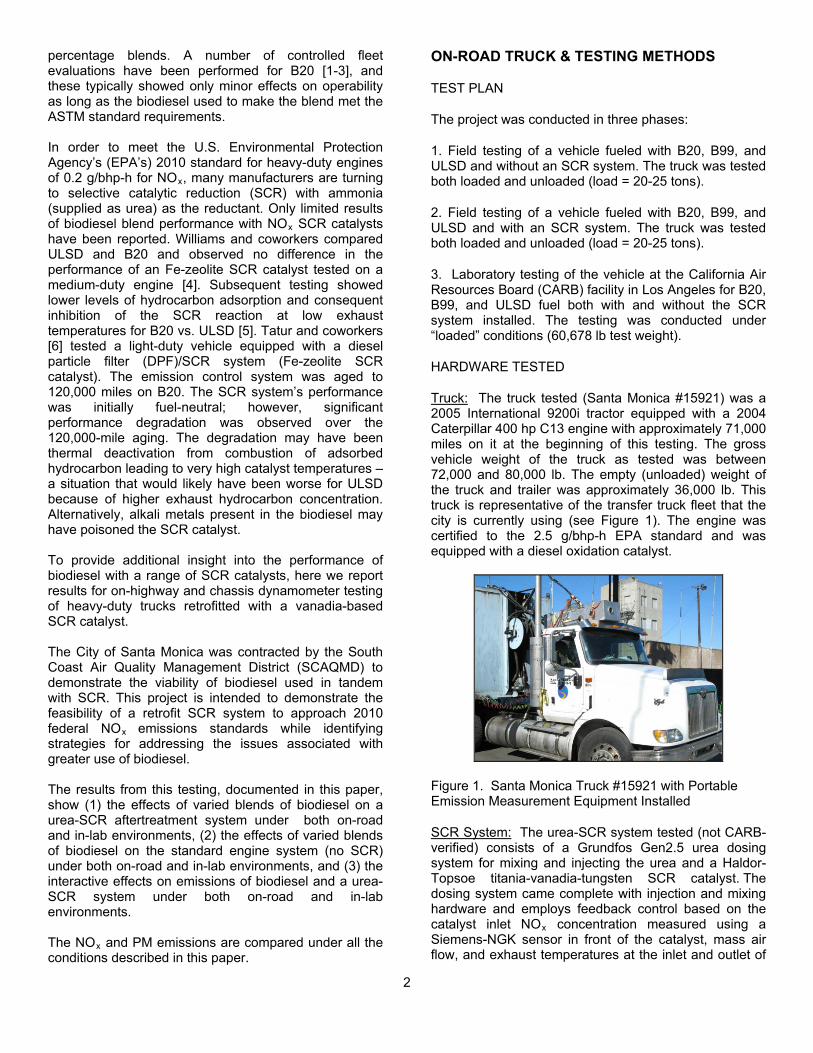
Truck: The truck tested (Santa Monica #15921) was a 2005 International 9200i tractor equipped with a 2004 Caterpillar 400 hp C13 engine with approximately 71,000 miles on it at the beginning of this testing. The gross vehicle weight of the truck as tested was between 72,000 and 80,000 lb. The empty (unloaded) weight of the truck and trailer was approximately 36,000 lb. This truck is representative of the transfer truck fleet that the city is currently using (see Figure 1). The engine was certified to the 2.5 g/bhp-h EPA standard and was equipped with a diesel oxidation catalyst.
Figure 1. Santa Monica Truck #15921 with Portable Emission Measurement Equipment Installed
SCR System: The urea-SCR system tested (not CARB-verified) consists of a Grundfos Gen2.5 urea dosing system for mixing and injecting the urea and a Haldor-Topsoe titania-vanadia-tungsten SCR catalyst. The dosing system came complete with injection and mixing hardware and employs feedback control based on the catalyst inlet NOx concentration measured using a Siemens-NGK sensor in front of the catalyst, mass air flow, and exhaust temperatures at the inlet and outlet of

3
the catalyst. Urea was metered in proportion to the mass emissions of NOx
The NO
when both the inlet and outlet temperatures exceed 200°C. The metering pump was a positive displacement unit that displaced a fixed volume of urea per revolution. The volume of the SCR catalyst was 23 L. The dosing system was air-assisted, meaning that liquid urea is injected into flowing compressed air that carries the urea to the injection nozzle and helps to atomize droplets and vaporize them. The air injection continues for 30 seconds after urea injection is stopped to purge the delivery tube and nozzle of urea. Compressed air was supplied to the dosing pump from the vehicle’s compressed air supply.
x
Figure 2 shows the system as installed behind the truck, and Figure 3 shows a system schematic.
sensor and urea injection nozzle were installed approximately 3 ft and 3.5 ft from the catalyst inlet, respectively. The original equipment muffler was removed and replaced with the SCR catalyst. Temperature sensors were mounted immediately before and after the catalyst substrate.
Figure 2. Extengine System Shown as Installed
Figure 3. Extengine ADEC SCR System Schematic
PORTABLE EMISSIONS MEASUREMENT EQUIPMENT AND TESTING METHOD
The equipment used to measure the on-road performance of the biodiesel and SCR system on the truck was a Ride Along Vehicle Emissions Measurement System (RAVEMTM) portable emissions measurement system provided by Engine, Fuel, and Emissions Engineering, Inc. This system has been benchmarked against other portable emission measurement systems such as the West Virginia University mobile laboratory and the University of California-Riverside CERT mobile laboratory, and the results showed fairly good correlation [7, 8] for NOx
• Measures NO
and PM. The variation observed is within the typical range of disagreement found among different heavy-duty full-flow CVS chassis dynamometer systems tested in round robin testing [9]. It is a fully integrated and portable system with the following included for the on-road portion of the testing:
x, carbon dioxide (CO2
• Uses mini-constant volume sampling (CVS), dilutes only a fraction of total exhaust
), carbon monoxide (CO), PM and ammonia slip
• Measures NOx
• Measures CO and CO
using California Analytical Instruments HCLD 400 (chemiluminescence) and sampled from integrating bags
2
• Measures PM by filters from diluted exhaust, partial flow
by nondispersive infrared (NDIR) analysis and samples from integrating bags
• Measures ammonia (NH3) and nitrous oxide (N2
O) by Fourier transform infrared (FTIR) analysis
The equipment was mounted on top of the cab of the truck for the duration of the testing. Figure 4 shows some details of this installation.
Figure 4. Installed RAVEM System on Test Vehicle
Engine
Urea Injector Mixer SCR Catalyst
Urea Controller And Pump
Urea Tank
A i r I n t a k e Exhaust Flow
MAF Sensor
Vehicle Air supply
Chassis Ground ADEC - II Pump Connections
C a t I n T e m p
C a t O u t T e m p
F G H I B
A D E
J
A . Flow Sensor B . Urea In C . Urea Out D . Ground E . Air Supply F . Cat Out Temp
K
G . SCR Cat In Temp H . Urea Delivery I . Nox Sensor J . 12 VDC Key Switch K . Urea Tank Level L . Warning Lights
NOT TO SCALE
L Air to Urea Injector
C

4
LABORATORY EMISSIONS MEASUREMENT EQUIPMENT AND TESTING METHOD
The test was conducted over the urban dynamometer driving schedule (UDDS) (shown in Figure 5) at a dynamometer facility operated by the CARB Heavy-Duty Diesel Emission Testing Laboratory located at the Los Angeles County Metropolitan Transit Authority Regional Rebuild Center near downtown Los Angeles. The test vehicle was placed on a chassis dynamometer (Schenck-Pegasus) with a range of simulated inertial weights from 5,000 to 100,000 lb and capable of absorbing up to 660 hp. A warm-up UDDS cycle was completed before every recorded UDDS test run. Vehicle exhaust was diluted in a Horiba critical flow venturi-constant volume sampler (CFV-CVS) with an 18-in. diameter primary dilution tunnel that was operated at 2,500 scfm. Standard gaseous pollutants and particulate emission samples were collected as specified in the Code of Federal Regulations (40 CFR, Part 86, Subpart N). Primary dilution air for the tunnel was passed through high-efficiency particulate air (HEPA) filters and a bed of charcoal before entering the tunnel. The total PM samples for mass emission measurements were collected under double-dilution conditions from a 5-in.-diameter secondary dilution tunnel with prefiltered dilution air (air passed through a HEPA filter capsule-cartridge).
Figure 5. Heavy-Duty UDDS Cycle (courtesy of dieselnet.com)
Criteria air pollutants (NOx, CO, and total hydrocarbons, or THC) and a greenhouse gas (CO2) were each analyzed on site using a Horiba gas bench with chemiluminescent, NDIR, and flame ionization detection analyzers, respectively. The PM samples for gravimetric analysis were collected on 47-mm TefloTM
SANTA MONICA DUTY CYCLE INFORMATION
(2.0 mm pore size) Teflon membrane filters (Pall-Gelman, Ann Arbor, Michigan). Temperature and humidity-controlled chambers were used for conditioning and weighing the clean and sampled filter substrates. Filter weights were determined using a microbalance with a ±0.1 µg sensitivity (Model UMX2, Mettler Toledo International Inc., USA). Preweighed filter substrates were stored in closed glass petri dishes in the conditioning chamber before and after sampling.
The City of Santa Monica operates transfer trucks to haul refuse from the City of Santa Monica transfer station to the waste-to-energy plant located in Commerce, California. The distance between the transfer station and the plant is approximately 20.9 miles (33.5 km). Route data were taken during on-road emissions testing both loaded to Commerce and unloaded back to the Santa Monica yard to ensure typical operation of the trucks and to quantify the speed-time trace for the emissions and fuel economy measurements. A representative graph of speed vs. time is shown in Figure 6. Runs were between 27 and 58 minutes long and varied traffic conditions.
GPS Speed - Santa Monica to Commerce
0
10
20
30
40
50
60
70
1 147 293 439 585 731 877 1023 1169 1315 1461 1607 1753 1899 2045 2191 2337
time
Spee
d (m
ph)
GPS_Speed
Figure 6. Speed Trace of Typical Run to Commerce
Multiple runs on various days were repeated on the same route (Santa Monica to Commerce and back) for each fuel and exhaust aftertreatment. Traffic patterns had typical day-to-day variations but were as consistent as possible given the real-world nature of the testing. Runs that took longer than 58 minutes were excluded from this report because they were determined to be nontypical as a result of the heavy volume of traffic. FUEL USED
The ULSD and B99 were delivered to test tanks at the Santa Monica facility. The B20 was blended on site from the test tanks of B99 and ULSD. A complete analysis was done on the both the ULSD and B99. Blend percent and stability tests were run on the biodiesel fuels to ensure the fuel quality of all sets of tests. Results, presented in Appendix A, showed that the B99 failed current ASTM specs on carbon residue, calcium plus magnesium, and flashpoint. These results were not available until after the on-road testing was completed, and while they show that this biodiesel is not of adequate quality for commerce, we believe this has little effect on emissions performance over the relatively short time of biodiesel use covered in this study.
5
Carbon residue is an approximate measure of the tendency of a fuel to form carbon deposits in the engine, generally a long-term durability issue. High carbon residue might be caused by contamination with lube oil or high levels of bound glycerin. Unfortunately, free and total glycerin (which includes bound glycerin) cannot be accurately measured for diesel-biodiesel blends such as B99. Metals such as calcium and magnesium can contribute to injector, fuel pump, piston, and ring wear as well as to injector deposits. It is also possible that these metals can negatively affect the performance of emission control catalysts. In both cases this is a longer-term durability concern. The primary purpose of the flashpoint specification is to limit levels of residual methanol present in biodiesel to less than 0.2 wt%. High levels of methanol can be incompatible with elastomeric components on the engine, also a long-term durability concern.
RESULTS 1. ON-ROAD EMISSIONS TEST RESULTS –
BASELINE TRUCK, NO SCR
The NOx and PM emissions results are supplied from the portable system and are described below [10]. Analysis was completed and results are discussed for two duty cycles to Commerce and from Commerce, as these data sets represented the two distinct duty cycles encountered by the truck – full and empty load. The difference in weight is approximately 20 tons. The route was the same in both directions, though speeds were variable because of traffic. The statistical significance of the results and the variation in results is discussed below.
Baseline Vehicle (no SCR) − to Commerce (loaded condition): NOx
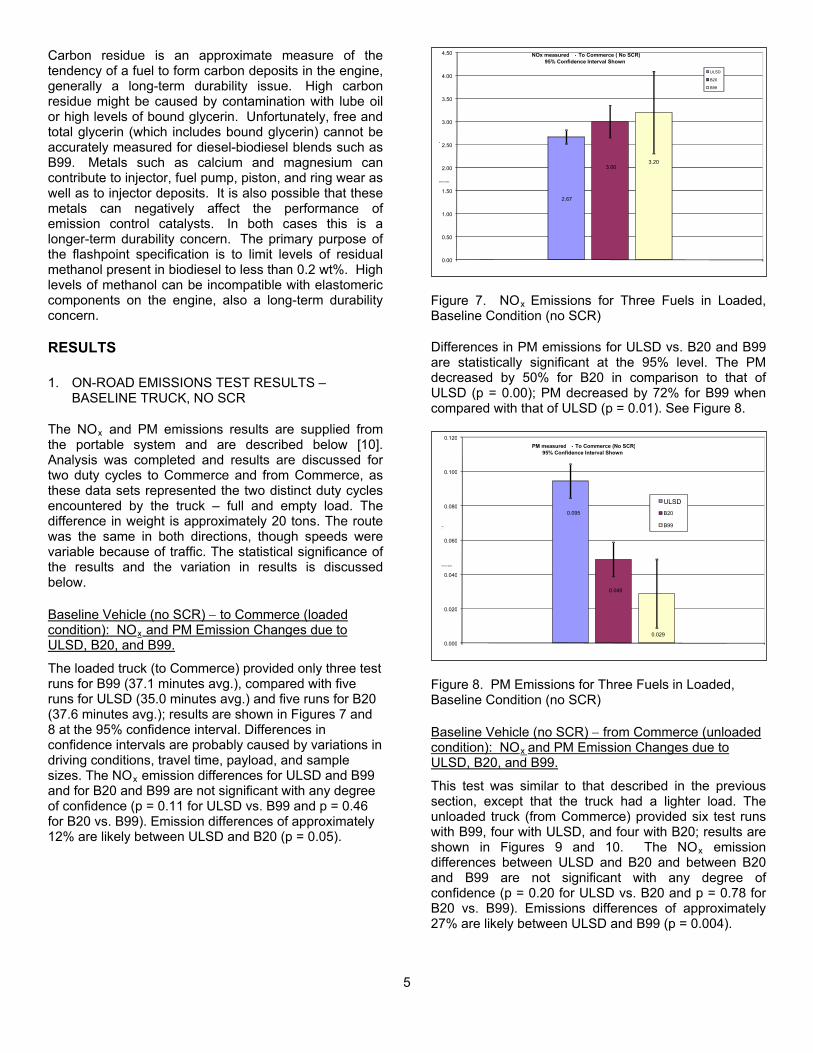
The loaded truck (to Commerce) provided only three test runs for B99 (37.1 minutes avg.), compared with five runs for ULSD (35.0 minutes avg.) and five runs for B20 (37.6 minutes avg.); results are shown in Figures 7 and 8 at the 95% confidence interval. Differences in confidence intervals are probably caused by variations in driving conditions, travel time, payload, and sample sizes. The NO
and PM Emission Changes due to ULSD, B20, and B99.
x
emission differences for ULSD and B99 and for B20 and B99 are not significant with any degree of confidence (p = 0.11 for ULSD vs. B99 and p = 0.46 for B20 vs. B99). Emission differences of approximately 12% are likely between ULSD and B20 (p = 0.05).
Figure 7. NOx
Differences in PM emissions for ULSD vs. B20 and B99 are statistically significant at the 95% level. The PM decreased by 50% for B20 in comparison to that of ULSD (p = 0.00); PM decreased by 72% for B99 when compared with that of ULSD (p = 0.01). See Figure 8.
Emissions for Three Fuels in Loaded, Baseline Condition (no SCR)
Figure 8. PM Emissions for Three Fuels in Loaded, Baseline Condition (no SCR)
Baseline Vehicle (no SCR) − from Commerce (unloaded condition): NOx
This test was similar to that described in the previous section, except that the truck had a lighter load. The unloaded truck (from Commerce) provided six test runs with B99, four with ULSD, and four with B20; results are shown in Figures 9 and 10. The NO
and PM Emission Changes due to ULSD, B20, and B99.
x emission differences between ULSD and B20 and between B20 and B99 are not significant with any degree of confidence (p = 0.20 for ULSD vs. B20 and p = 0.78 for B20 vs. B99). Emissions differences of approximately 27% are likely between ULSD and B99 (p = 0.004).
2.67
3.00 3.20
0.00
0.50
1.00
1.50
2.00
2.50
3.00
3.50
4.00
4.50
Emission (g/bhp
- hr)
NOx measured - To Commerce ( No SCR) 95% Confidence Interval Shown
ULSD B20 B99
0.095
0.049
0.029 0.000
0.020
0.040
0.060
0.080
0.100
0.120
Emission (g/bhp
- hr)
PM measured - To Commerce (No SCR) 95% Confidence Interval Shown
ULSD B20 B99

6
Figure 9. NOx
Differences in PM emissions for ULSD vs. B20 and B99 are statistically significant at the 95% level. The PM decreased by 37% for B20 in comparison to ULSD (p = 0.002); PM decreased by 71% for B99 in comparison to ULSD (p = 0.000). See Figure 10.
Emissions for Three Fuels in Unloaded, Baseline Condition (no SCR)
Figure 10. PM Emissions for Three Fuels in Unloaded, Baseline Condition (no SCR)
2. ON-ROAD EMISSIONS TEST RESULTS – WITH SCR INSTALLED ON TRUCK
The testing of the SCR system took place approximately 60 days after completion of the baseline (non-SCR truck). The purpose of this round of testing was to see the effects of biodiesel blends on an SCR system when used on the truck. Runs with test times in excess of 58 minutes were omitted because they resulted from heavy traffic. Seven test runs were omitted from this data set. The extremely long run times were an indication that the duty cycle was significantly different and not appropriate for comparison to other runs.
Fuel used for this round of tests consisted of the same ULSD and B99 and hand mixing of the same ULSD and B99 to obtain a B20 blend. Appendix A shows the fuel properties as tested for the ULSD and B99. Acid values were measured to determine if the fuels had degraded from oxidation during the 60-day interim period. These and the blend percent are listed in Table 1, and the results indicate no significant degradation.
Table 1. SCR Testing Fuel Properties
Statistical significance is discussed for each comparison for the following tests:
Vehicle w/SCR Installed – to Commerce (loaded condition): NOx
The loaded truck (to Commerce) with the SCR system installed and functional resulted in emissions analysis from three runs with B20 (37.3 minutes avg.), six runs for ULSD (33.0 minutes avg.) and four runs with B99 (31.6 minutes avg.). Results are shown in Figures 11 and 12.
and PM Emission Changes due to ULSD, B20, and B99
Differences in NOx
emissions between ULSD and B20 and between B20 and B99 are not significant with a high degree of confidence (p = 0.10 for ULSD vs. B20, and p = 0.18 for B20 vs. B99). Emissions differences of approximately 16% are likely between ULSD and B99 (p = 0.05). See Figure 11.
Figure 11. NOx
Differences in PM emissions for ULSD vs. B99 and B20 vs. B99 are statistically significant at the 95% level and are shown in Figure 12. The PM decreased by 63% for
Emissions for Three Fuels In Loaded, SCR-Equipped Truck
2.35 2.88 2.98
0.00
0.50
1.00
1.50
2.00
2.50
3.00
3.50
4.00
Emission (g/bhp
- hr)
NOx measured - From Commerce (No SCR) 95% Confidence Interval Shown
ULSD B20
B99
0.100
0.063
0.029
0.000
0.020
0.040
0.060
0.080
0.100
0.120
Emission (g/bhp
- hr)
PM measured - From Commerce (No SCR) 95% Confidence Interval Shown
ULSD B20 B99
0.83 0.97
1.16
0.00
0.20
0.40
0.60
0.80
1.00
1.20
1.40
1.60
Emission (g/bhp
- hr)
NOx measured - To Commerce (W/SCR) 95% Confidence Interval Shown
ULSD B20 B99
Fuel Sample Date Result Acid Value Acid Value Blend % (as rec'd) (extrapolated to B100)
01/31/07 18.7 <0.1 <0.5 02/01/07 18.1 <0.1 <0.5 02/12/07 19.4 <0.1 <0.5 03/07/07 100 <0.1 <0.1 03/29/07 18.2 <0.1 <0.5 04/06/07 100 0.42 0.42

7
B99 in comparison to B20 (p = 0.02). The PM decreased by 71% for B99 in comparison to ULSD (p = 0.00). Differences in PM for ULSD vs. B20 were not statistically significant (p = 0.10).
Figure 12. PM Emissions for Three Fuels In Loaded, SCR-Equipped Truck
Vehicle w/SCR installed – from Commerce (unloaded condition): NOx
The unloaded truck (from Commerce) with the SCR system installed and functional resulted in emissions analysis from only two runs with B20 (40 minutes avg.), five runs for ULSD (35.3 minutes avg.) and three runs with B99 (32.2 minutes avg.). Again, because of the high variability in the data collected and the limited amount of runs for B20, there appears to be no statistical significance between the means of the ULSD, B99, and B20 NO
and PM Emission Changes due to ULSD, B20, and B99
x
emissions for the loaded truck, as shown in Figure 13 (p = 0.15-0.72).
Figure 13. NOx
The difference in PM emissions for the ULSD vs. B99 is statistically significant at the 95% level. The PM decreased by 74% for B99 in comparison to ULSD; PM
differences for ULSD vs. B20 and B20 vs. B99 are not statistically significant because of the variation and small sample size (2) measured for B20 (0.12 < p < 0.22). See Figure 14 for PM emissions.
Emissions for Three Fuels in Unloaded, SCR-Equipped Truck
Figure 14. PM Emissions for Three Fuels in Unloaded, SCR-Equipped Truck
3. IN-LABORATORY EMISSIONS TEST RESULTS: WITH AND WITHOUT SCR INSTALLED
VEHICLE TESTED
For a second set of data and verification of the results observed during the on-road testing, the same Santa Monica truck (vehicle # 15921) was tested at the CARB LA Metro Laboratory in Los Angeles, California, in February 2009 (almost 24 months after on-road data were collected on this vehicle).
The truck was again tested with and without the retrofitted urea SCR system and simulated a 60,678 lb test weight. Before the tests, this vehicle was found to burn a significant amount of lubricating oil. Caterpillar’s oil consumption measurement procedure (Caterpillar’s Bulletin, 2007 [11]) recommends the investigation of any engine of this age using less than 60 gallons of fuel per quart of oil. The test vehicle’s fuel to lubricating oil consumption ratio was measured over the course of 1,000 miles to be 53.5 gallons of fuel per quart of oil, which is 12% less than the minimum allowable. Therefore, the test vehicle is categorized as a high-oil-consumption vehicle. The presence of excess lubricating oil in the combustion and exhaust stream may cause observed emission rates from this vehicle to differ from those of vehicles whose engines are still within the manufacturer’s specifications, and emissions can also be different from those observed when the vehicle was initially tested. This could also add to the variability seen in PM measurement during this phase of the test.
The SCR system was modified to include a different dosing pump, which may have resulted in a higher
0.91 1.04 1.07
0.00 0.20 0.40 0.60 0.80 1.00 1.20 1.40 1.60 1.80 2.00
Emission (g/test)
NOx measured - From Commerce (W/SCR) 95% Confidence Interval Shown
ULSD B20 B99
0.0579
0.0454
0.0168
0.0000
0.0100
0.0200
0.0300
0.0400
0.0500
0.0600
0.0700
Emission (g/bhp
- hr)
PM measured - To Commerce (W/ SCR) 95% Confidence Interval Shown
ULSD B20 B99
0.0737 0.0557
0.0185
- 0.0600 - 0.0400 - 0.0200 0.0000 0.0200 0.0400 0.0600 0.0800 0.1000 0.1200 0.1400 0.1600
Emission (g/bhp
- hr)
PM measured - From Commerce (W/ SCR) 95% Confidence Interval Shown
ULSD B20 B99

8
efficiency for NOx reduction than the on-road testing. It was found during the on-road testing that the engine had extremely low ammonia slip, and it was determined that additional dosing could be tolerated for this system setup. The SCR catalyst used during in-lab testing was the same one used during on-road testing; 95% confidence intervals are shown in each figure.
Vehicle w/SCR Installed – UDDS cycle: NOx
The truck was tested at the CARB facility with the SCR system installed and functional, and this resulted in emissions analysis from three runs with B20, three runs with ULSD, and three runs with B99. There is a statistically significant difference in means between ULSD vs. B99 as well B20 vs. B99. The NO
and PM Emission Changes due to ULSD, B20, and B99
x emissions increased by 35% for ULSD vs. B99 (p <0.01). The NOx emissions increased by 26% for B20 vs. B99 (p <0.01). Differences in NOx
emissions of approximately 7% are likely (with higher variability due to limited test runs and vehicle performance), as shown in Figure 15 for ULSD vs. B20 (p = 0.07).
Figure 15. NOx
Based on the high variability observed in the data (possibly due to the high level of oil that the vehicle was burning) and the limited amount of runs, there appears to be no statistical significance between the means of the ULSD, B20, and B99 for PM emissions (0.10 < P < 0.42) for the truck, as shown in Figure 16 (again, using the Student t-test at a 95% confidence level).
Emissions at CARB Lab (SCR installed)
Figure 16. PM Emissions at CARB Lab (SCR installed)
Vehicle with No SCR installed – UDDS Cycle: NOx
The truck was tested at the CARB facility with the SCR system removed; the result was an emissions analysis from three runs with B20, three runs with ULSD, and three runs with B99. There is a statistically significant difference in means between ULSD vs. B99 as well as B20 vs. B99. The NO
and PM Emission Changes due to ULSD, B20, and B99
x emissions increased by 34% for ULSD vs. B99 (p = 0.01). The NOx emissions increased by 27% for B20 vs. B99 (p = 0.01); NOx emission differences of approximately 6% are likely (with higher variability due to limited test runs and vehicle performance), as shown in Figure 17 for ULSD vs. B20 (p = 0.06).
Figure 17. NOx Emissions at CARB (baseline, no SCR)
1.77 1.89
2.39
0.00
0.50
1.00
1.50
2.00
2.50
3.00
ULSD B20 B99
Chassis Dyno NOx Measured - w/SCR
CARB - SCR
g/mile
1.00 0.72
0.36 0.00
0.50
1.00
1.50
2.00
2.50
ULSD B20 B99
Chassis Dyno PM Measured - w/SCR
CARB - SCR
g/mile

9
There is statistical significance between the means of the ULSD, B20, and B99 PM emissions for the truck, as shown in Figure 18 (using the Student t-test at a 95% confidence level). The PM reduction observed for B20 vs. ULSD was 49% (p < 0.01). The PM reduction observed for B99 vs. ULSD was 79% (p = 0.01). The PM reduction observed for B99 vs. B20 was 60% (p = 0.02).
Figure 18. PM Emissions at CARB Lab (baseline, no SCR)
CONCLUSIONS
SPECIFIC CONCLUSIONS
The NOx emission differences due to variable blends of biodiesel: All test results that showed statistical significance at the 95% confidence interval (both on-road and in-laboratory testing) showed an increase in NOx
• ULSD vs. B99: +16%-24% (on-road) to +35% (in-lab)
at increasing amounts of biodiesel. They are as follows:
• B20 vs. B99: +26% and 27% increase (both in-lab)
The PM emission differences due to variable blends of biodiesel:
• ULSD vs. B99: 71%-78% decrease (4 results, on-road) to a 79% decrease (1 result, in-lab)
All results that showed statistical significance at the 95% confidence level showed a reduction in PM for the addition of biodiesel vs. ULSD. The PM measurements for the truck yielded the following statistically significant results:
• ULSD vs. B20: 37%-50% decrease (2 results, on-road) to a 49% decrease (in-lab)
The NOx reduction due to SCR: All results having statistical significance between the means show that the
NOx
On-road testing:
reduction efficiency of the SCR system was not negatively affected by the addition of biodiesel.
• The reduction in NOx
• The reduction in NO
due to SCR during the fully loaded truck testing was 69% for ULSD, 68% for B20, and 64% for B99. These differences in reduction were not statistically significant. See Figure 19.
x
due to SCR during the unloaded truck testing was 61% for ULSD, 64% for B20, and 64% for B99. See Figure 20.
Figure 19. On-road NOx
Reductions due to Extengine SCR System (fully loaded truck)
Figure 20. On-road NOx
In-lab testing:
Reductions due to Extengine SCR System (unloaded truck)
CARB in-lab test results for the NOx reduction due to the Extengine SCR system indicate that all tests were statistically significant and showed no negative effects on SCR NOx reduction efficiency due to fuel type. The NOx reduction was shown to be 87% for all fuels (see
ULSD 2.67
ULSD w/SCR 0.83
B20 3.00
B20 w/SCR 0.97
B99 3.20
B99 w/SCR 1.16
0.00
0.50
1.00
1.50
2.00
2.50
3.00
3.50
4.00
4.50
Emission (g/bhp
- hr)
NOx measured with and without SCR - To Commerce (loaded truck) 95% Confidence Interval Shown
ULSD ULSD w/SCR B20 B20 w/SCR B99 B99 w/SCR
69% reduction 68% reduction 64% reduction
1.064
0.544 0.220
0.000 0.200 0.400 0.600 0.800 1.000 1.200 1.400 1.600
ULSD B20 B99
Chassis Dyno PM Measured - no SCR
CARB - SCR
g/mile
ULSD 2.35
ULSD w/SCR 0.91
B20 2.88
B20 w/SCR 1.04
B99 2.98
B99 w/SCR 1.07
0.00
0.50
1.00
1.50
2.00
2.50
3.00
3.50
4.00
Emission (g/bhp
- hr)
NOx measured with and without SCR - From Commerce (unloaded truck) 95% Confidence Interval Shown
ULSD ULSD w/SCR B20 B20 w/SCR B99 B99 w/SCR
61% reduction 64% reduction 64% reduction

10
Figure 20). It should be noted again that a different dosing pump was installed in the truck for the CARB in-lab testing; this may have resulted in higher SCR efficiencies than those observed in the on-road data.
Figure 21. Laboratory NOx
GENERAL CONCLUSIONS
Reduction due to SCR System on All Fuels
• Overall trends observed during the on-road and in-laboratory testing of the retrofitted Extengine SCR system as installed on the test vehicle indicated that there was not a significant decrease in the performance or efficiency of the SCR system when increased levels of biofuels were introduced.
• The use of biodiesel did result in higher NOx
• The use of biodiesel did result in lower PM emissions than the use of ULSD (in tests with statistical significance).
emissions than the use of ULSD (in tests with statistical significance).
ACKNOWLEDGMENTS AND DISCLAIMER
The author and co-authors of this report would like to acknowledge Rick Sikes and the City of Santa Monica for the use of its truck and its support for this study. The authors of this study would also like to acknowledge Tellurian Biodiesel for supplying the fuel used in this study as well as for project support. Funding for the study was provided by the South Coast Air Quality Management District as well as by the U.S. Department of Energy’s Vehicle Technologies Program in the Office of Energy Efficiency and Renewable Energy.
The statements and opinions expressed in this paper are solely those of the authors and do not represent the official position of the California Air Resources Board or other participants in this project. The mention of trade
names, products, and organizations does not constitute endorsement or recommendation for use.
REFERENCES
1. Fraer, R., Dinh, H., Proc, K., McCormick, R.L., Chandler, K., Buchholz, B. “Operating Experience and Teardown Analysis for Engines Operated on Biodiesel Blends (B20),” SAE Technical Paper 2005-01-3641 (2005).
2. Proc, K., Barnitt, R., Hayes, R.R., McCormick, R.L., Ha, L., Fang, H.L. “100,000 Mile Evaluation of Transit Buses Operated on Biodiesel Blends (B20),” SAE Technical Paper 2006-01-3253 (2006).
3. Lammert, M., Barnitt, R., McCormick, R.L. “Field Evaluation of Biodiesel (B20) Use by Transit Buses,” SAE Technical Paper 2009-01-2899 (2009).
4. Williams, A., Pedersen, D., Ireland, J., McCormick, R.L., Fang, H.L. “Effect of Biodiesel Blends on Urea Selective Catalytic Reduction Catalyst Performance with a Medium-Duty Engine,” SAE Technical Paper 2008-01-2484 (2008).
5. Williams, A., Ratcliff, M., Pedersen, D., McCormick, R.L., Cavataio, G., Ura, J. “Effect of Unburned Methyl Esters on the NOx
6. Tatur, M., Nanjundaswamy, H., Tomazic, D., Thornton, M., McCormick, R. “Biodiesel Effects on U.S. Light-Duty Tier 2 Engine and Emission Control Systems,” SAE Technical Paper 2009-01-0281 (2009).
Conversion of an Fe-Zeolite SCR Catalyst,” SAE Technical Paper 2009-01-2777 (2009).
7. Weaver, C. “Results of Correlation Testing; RAVEM vs. U.C. Riverside Full-Flow CVS,” September 2005.
8. Weaver, C. “Correlation between the Mexico City Governments RAVEM System and West Virginia University’s Transportable Heavy Duty Emissions Laboratory,” December 2006.
9. Traver, M.L., Tennant, C.J., McDaniel, T.I., McConnell, S.S., Bailey, B.K., and Maldonado, H. “Interlaboratory Cross-Check of Heavy–Duty Vehicle Chassis Dynamometers,” SAE Paper No.2002-01-2879, SAE International, Warrendale, PA 2002.
10. Weaver, C. “On-Road Emissions from a Tractor-Trailer Using ULSD, B20 and B99 Fuels With and Without a Selective Catalytic Reduction – Final Report,” August 2007.
11. Caterpillar’s Service Warranty Bulletin: Excessive Engine Oil Consumption, Bulletin No. 6.5, 1-4, 2002.

11
CONTACT
Kevin Walkowicz, Advanced Vehicle Testing and Evaluation Team Leader, National Renewable Energy Laboratory (NREL), Golden, CO.
Web: http://www.nrel.gov/vehiclesandfuels/fleettest
Email: [email protected]
DEFINITIONS, ACRONYMS, ABBREVIATIONS
NOx
PM: particulate matter
: oxides of nitrogen
SCR: selective catalytic reduction
B20 20% biodiesel, 80% diesel fuel
B99: 99% biodiesel, 1% diesel fuel
ULSD: ultra-low-sulfur diesel
DOE: U.S. Department of Energy
CARB: California Air Resources Board
EPA: Environmental Protection Agency

12
APPENDIX A. TEST FUEL SPECIFICATIONS
Property Method ULSD D975 spec B99 B100 spec B20 Proposed spec
sample date ? (pre 2/27) ? (pre 2/27) ? (pre 2/27)Copper Corrosion D130 1A No 3 max 1A No 3 max 1A No 3 max
Heat of combustion, BTU/lb D240 18492.1 - - 17892.9 -Cloud Point, C D2500 -15 Report -1 Report -8 Report
Water and Sediment, vol% D2709 0.01 0.05 max 0.01 0.05 max 0.01 0.05 maxDescription Clear & bright - Clear & bright - Clear & bright -
Viscosity @40C, mm2/s D445 2.765 1.9-4.1 3.992 1.9-6.0 2.562 1.9-4.1Carbon residue, mass% D4530 - 0.066 0.05 max 0.066 -
Ash, mass% D482 <0.001 0.01 max - 0.01 maxPhosphorus, ppm D4951 - <5 10 max -
Calcium, ppm D5185 - 5 combined with Mg, 5 max -Magnesium, ppm D5185 - 1 -
Sodium, ppm D5185 - <1 combined with K, 5 max -Potassium, ppm D5185 - <1 -
Total Aromatics, mass% D1319 13.6 35 max - 22 35 maxMono Aromatics, mass% D1319 12.5 - - 20.5 -Poly Aromatics, mass% D1319 1.1 - - 1.5 -Carbon residue, mass% D524 0.07 0.15 max - 0.35 max
Carbon, wt% D5291 86.04 - - 84.07 -Hydrogen, wt% D5291 13.75 - - 13.3 -
Sulfur D5453 4.5 15 max 2.6 15 max 3.2 15 maxLubricity, mm D6079 0.44 0.52 max - 0.205 0.52 max
Sulfated ash, wt% D874 - <0.001 0.02 max <0.001 -Flash point, C D93 76 52 min 80 130 min 118.9 52 minRancimat, hrs EN14112 - 2.62 3 min 4.4 6 minDistillation, C D86 -
T90 312.5 300-356 - 332.1 356 maxDistillation, C D1160 - 349 360 max -
Hydrocarbon types, vol% D5186 - -Aromatics 12.6 - - 34.4 -
Olefins 2.4 - - 1.8 -Saturates 85 - - 63.8 -
Results