on or in? where does atmospheric ice chemistry occur? tara kahan sumi wren
TRANSCRIPT
On or in?Where does atmospheric ice chemistry occur?
Tara Kahan Sumi Wren
On or in?Where does atmospheric ice chemistry occur?
Thanks to:
Ran Zhao
Klaudia Jumaa
Nana Kwamena
Funding:NSERCCFCAS

(Uncomfortable) conclusions
• Reactions within the ice matrix seem to be accurately modeled using aqueous parameters (if the correct concentrations are known)
• Photolysis at the air-ice surface shows different kinetics from that within the ice matrix
• Heterogeneous reaction kinetics at the air-ice interface may be quite different (or not!!) from those in the ice matrix
• Exclusion of salts to the air-ice interface may be different from bulk thermochemical predictions
• The air-ice interface presents a very different solvating environment from the liquid-air interface
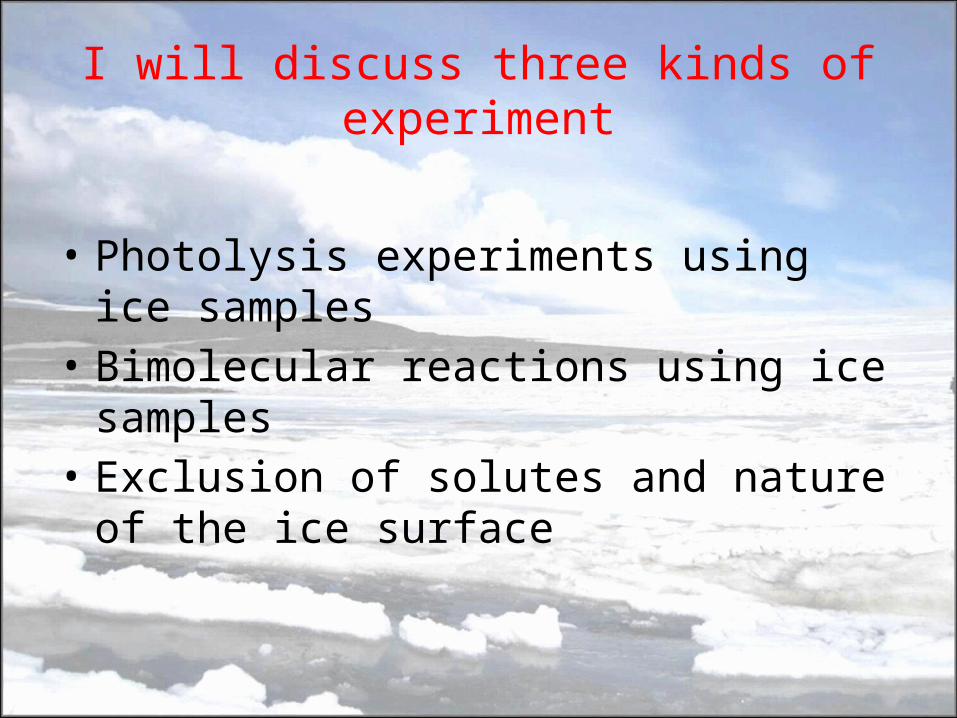
I will discuss three kinds of experiment
• Photolysis experiments using ice samples• Bimolecular reactions using ice samples• Exclusion of solutes and nature of the ice
surface

The QLL
Ice matrix
Potentially two regions of ice where reactions can occur
Reactivity may not be similar in both regions
nm s
cale
mm
sca
le
In most laboratory experiments, reagents are frozen from solution and samples are melted prior to analysis
Often the kinetics may be well predicted from aqueous-phase results
Are kinetics measured in bulk ice indicative of reactivity in the QLL?
Where does atmospheric ice chemistry occur?

Analyse for reagents & products using fluorescence,HPLC, etc.
Example 1: direct photolysis of aromatic compounds
Anthracene

Time (s)
0 1000 2000 3000 4000 5000 6000
ln(I
/Io)
-3
-2
-1
0 Aqueous solution
Ice cubes

Time (min)
0 20 40 60 80 100 120 140
ln(I
/Io)
-3
-2
-1
0
Naphthalene, waterAnthracene, water
Time (min)
0 20 40 60 80 100 120 140
ln(I
/Io)
-3
-2
-1
0
Naphthalene, iceAnthracene, iceNaphthalene, waterAnthracene, water
Anthracene and naphthalene photolysis on ice: In situ measurements
monochromator and PMT
liquid light guide
laserVarious wavelengths< 3
computer
oscilloscope
Raman/LIF
T.F. Kahan and D. J. Donaldson, J. Phys. Chem. A 111, 1277-1285 (2007)


Time (s)
0 1000 2000 3000 4000 5000 6000
ln(I/
I o)
-3
-2
-1
0
Aqueous solution
Ice cubes
Ice granules
Anthracene photolysis in bulk samples
Medium kobs (10-3 s-1)
Bulk water 0.25 0.06
Air-water interface 0.17 0.03
Ice cube 0.4 0.2
Ice granule 1.0 0.3
Air-ice interface 1.04 0.08
T. F. Kahan et al, Environ. Sci. Technol., 44, 1303-1306 (2010)

[NaX] in solution (mol L-1)
0.0 0.2 0.4 0.9 1.0
k obs
(s-1
)
0.0000
0.0002
0.0004
0.0006
0.0008
0.0010
0.0012
NaCl (296 K)NaCl (253 K)NaBr (253 K)NaCl (243 K)
Time (min)
0 10 20 30 40 50
ln(I
/I o)
-4
-3
-2
-1
0
N
N
CH3
H
O
CH3
In aqueous solution
On ice
A photolysis rate enhancement is observed for harmine on the ice surface as well.
But on frozen salt solutions the rate reverts tothat seen on the water surface
Exclusion of saltsduring freezing createsan aqueous brinelayer at the surface
T.F. Kahan et al.,Atmos. Chem. Phys., 10, 10917-10922 (2010).

Example 2: oxidation at the air-ice interface
Water surface result
Kinetics of O3(g) + Br-
S. N. Wren et al.,J. Geophys. Res. 115 Article Number: D16309 (2010).
ice matrix
brine layer
brine in liquid pockets
X-
X-
X -
X -X-X-X-
X- X-
X-
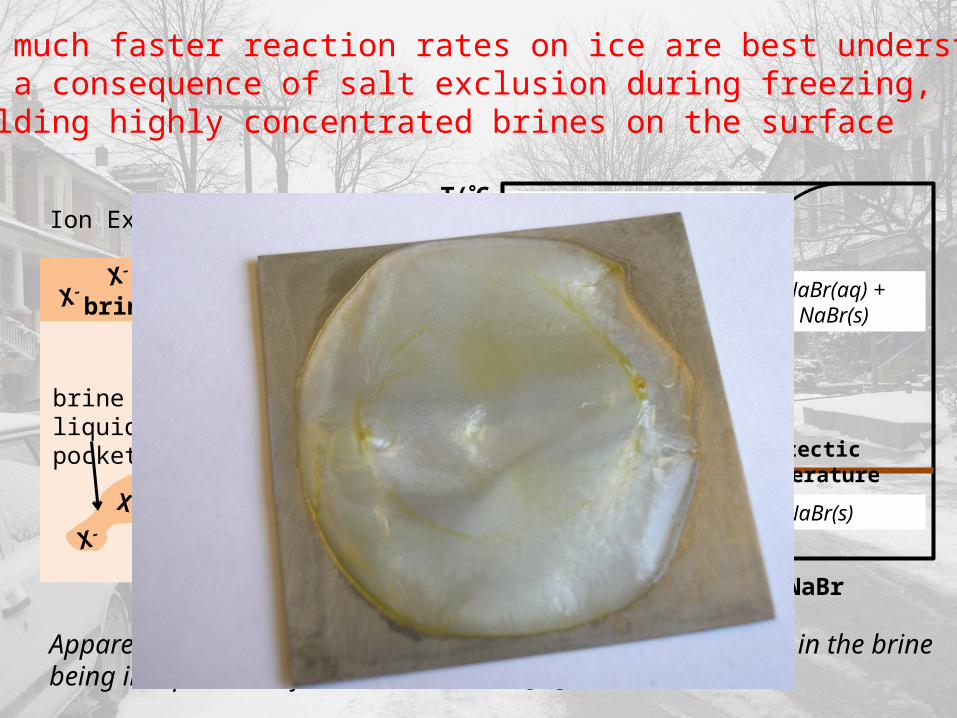
Apparent saturation in kinetics, may be consequence of the [Xˉ] in the brine being independent of the initial solution [Xˉ]
Ion Exclusion
NaBr(aq) + NaBr(s)
NaBr(aq) + H2O(aq)
ice and NaBr(s)
NaBr(aq) + ice eutectic
temperature
0
-28
-10
T(C)
mol fraction NaBr
The much faster reaction rates on ice are best understood as a consequence of salt exclusion during freezing, yielding highly concentrated brines on the surface
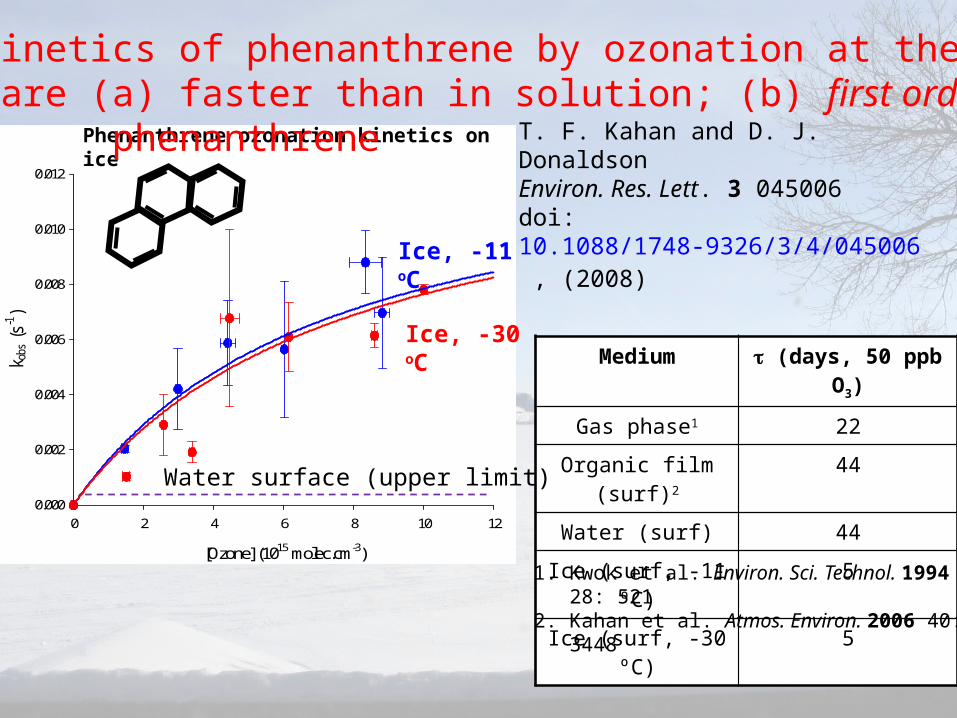
Medium (days, 50 ppb O3)
Gas phase1 22
Organic film (surf)2 44
Water (surf) 44
Ice (surf, -11 ºC) 5
Ice (surf, -30 ºC) 5[Ozone] (1015 molec.cm-3)
0 2 4 6 8 10 12
k obs (s
-1)
0.000
0.002
0.004
0.006
0.008
0.010
0.012
Ice, -30 oC
Ice, -11 oC
Phenanthrene ozonation kinetics on ice
1. Kwok et al. Environ. Sci. Technol. 1994 28: 5212. Kahan et al. Atmos. Environ. 2006 40: 3448
The loss kinetics of phenanthrene by ozonation at the air-ice interface are (a) faster than in solution; (b) first order in
phenanthreneT. F. Kahan and D. J. DonaldsonEnviron. Res. Lett. 3 045006 doi: 10.1088/1748-9326/3/4/045006 , (2008)
Water surface (upper limit)

Reactions of OH with aromatics at the air-ice interface
• OH formed from photolysis of H2O2, NO3¯, or NO2
¯
Excitation Wavelength (nm)
250 260 270 280
Inte
nsity
(ar
bitr
ary
units
)
0
1
2
3
4
5
Excitation spectra in aqueous solution
Benzene
Phenol
• Reagents frozen from solution or deposited from gas
• Anthracene + OH• Benzene + OH Phenol
Excitation Wavelength (nm)
250 260 270 280
Inte
nsi
ty (
arb
itra
ry u
nits
)
0
1
2
3
4
5
Excitation spectra in aqueous solution
Benzene + NaNO2
Irradiated sample
Phenol
Phenol formation observed from the photolysis of OH-precursors in water, but not on ice
T.F. Kahan et al., Atmos. Chem. Phys, 10, 843-854, (2010)
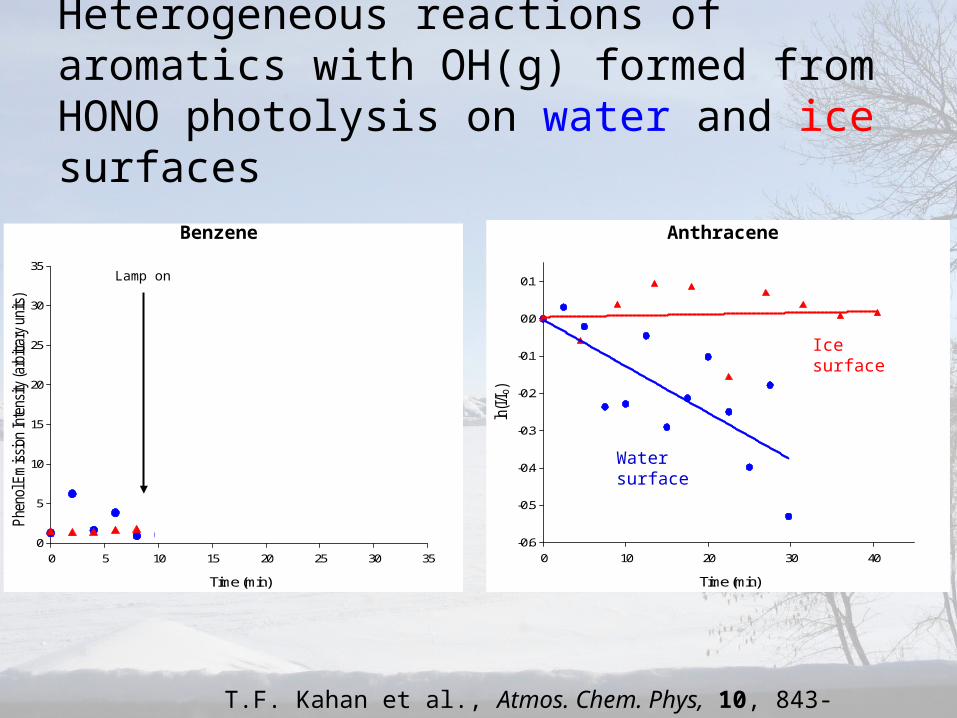
Heterogeneous reactions of aromatics with OH(g) formed from HONO photolysis on water and ice surfaces
Time (min)
0 5 10 15 20 25 30 35
Phe
nol E
mis
sion
Inte
nsity
(ar
bitr
ary
units
)
0
5
10
15
20
25
30
35Lamp on
Benzene
Phenol formation on water
No phenol formation on ice
Time (min)
0 10 20 30 40
ln(I
/Io)
-0.6
-0.5
-0.4
-0.3
-0.2
-0.1
0.0
0.1
Anthracene
Water surface
Ice surface
T.F. Kahan et al., Atmos. Chem. Phys, 10, 843-854, (2010)
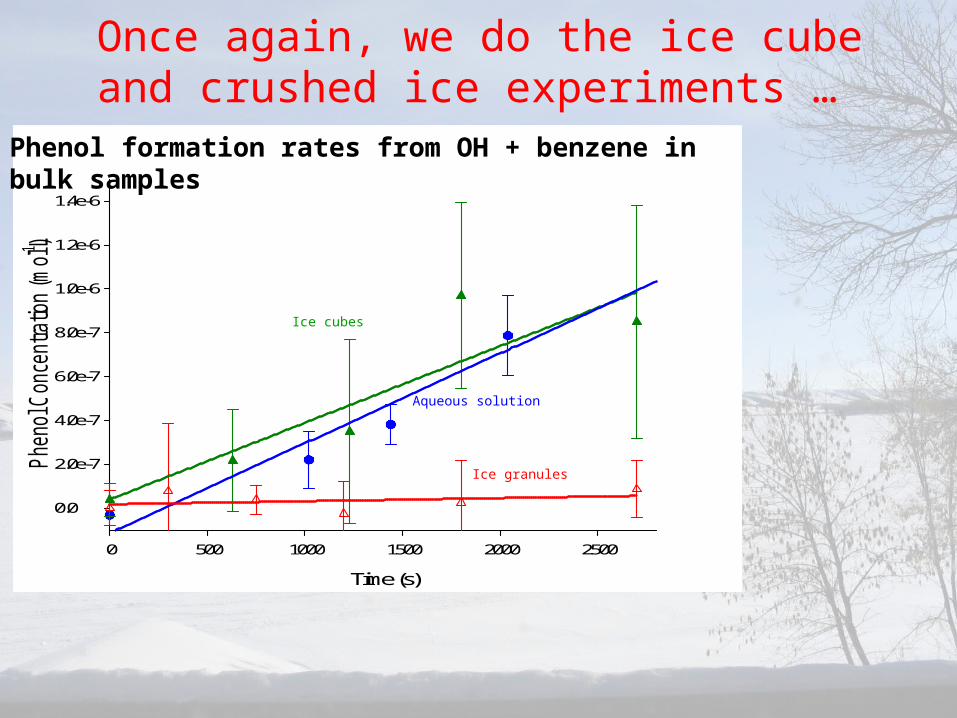
Once again, we do the ice cube and crushed ice experiments …
Time (s)
0 500 1000 1500 2000 2500
Ph
en
ol C
on
cen
tra
tion
(m
ol L-1)
0.0
2.0e-7
4.0e-7
6.0e-7
8.0e-7
1.0e-6
1.2e-6
1.4e-6
Aqueous solution
Ice cubes
Ice granules
Phenol formation rates from OH + benzene in bulk samples

How well are solutes excluded to the air-ice surface?
[NaX] in solution (mol L-1)
0.0 0.2 0.4 0.9 1.0
k obs
(s-1
)
0.0000
0.0002
0.0004
0.0006
0.0008
0.0010
0.0012
NaCl (296 K)NaCl (253 K)NaBr (253 K)NaCl (243 K)
Water surface result
Kinetics of O3 + Br-

Raman Shift (cm-1)
600 800 1000 1200 1400 1600
Nor
mal
ized
Inte
nsity
-0.1
0.0
0.1
0.2
0.3
0.4
0.5 M 1.5 M 2.5 M
For nitric acid, NaNO3 and Mg(NO3)2, we see a good Ramansignal from the nitrate sym. str. at the air-water interface
H-O-H bend
nitrate

Raman Shift (cm-1)
800 1000 1200 1400 1600
Inte
nsity
0.0
0.2
0.4
0.6
0.8
1.0
1.2
1.4
1.6
liquidfrozen
Raman Shift (cm-1)
800 1000 1200 1400 1600
Inte
nsity
0.0
0.2
0.4
0.6
0.8
1.0
liquid
Now with some understanding of nitrate intensities, we freeze 100 mM solutions of Mg(NO3)2

Mg(NO3)2·H2O Phase Diagram
-10 C
Mg(NO3)2
wt %
T (C)
21
Liquid Mg(NO3)2(aq) + H2O(aq)
Two PhasesMg(NO3)2(aq) + H2O(s)
SolidMg(NO3)2·9H2O(s)
Brine [Mg(NO3)2]19 wt% 1.3 M Mg(NO3)2
2.6 M NO3ˉ
Eutectic T

Mg(NO3)2·H2O Phase Diagram
-10
Mg(NO3)2
wt %
T (C)
Brine [Mg(NO3)2]19 wt% 1.3 M Mg(NO3)2
2.6 M NO3ˉ
Raman Shift (cm-1)
800 1000 1200 1400 1600
Nor
mal
ized
Inte
nsity
0.00
0.05
0.10
0.15
0.20
1.5 M
0.5 M
Raman Shift (cm-1)
800 1000 1200 1400 1600
Inte
nsity
0.0
0.2
0.4
0.6
0.8
1.0
1.2
1.4
1.6
frozen
• Surface [NO3 ] ˉ not predicted by equilibrium phase diagram
• Nitrate must be excluded to liquid pockets or incorporated into ice matrix
• Not consistent with our previous work on halide ozonation at the ice surface

Does the absorption spectrum and/or the photolysis quantum yield change in the QLL?
Wavelength (nm)
300 350 400 450 500
No
rma
lize
d I
nte
nsity
0.0
0.2
0.4
0.6
0.8
1.0
Naphthalene Emission
Ice
Water
Naphthalene fluorescence in hexanes at 77 K
Kawakubo et al. J. Phys. Soc. Japan 1966 21: 1469
Red-shifts in emission spectra on ice indicate self-association:-This is observed for naphthalene, anthracene, phenanthrene, benzene and phenol ... Whether aromatic is frozen from solution or deposited from the gas phase and at all concentrations studied

Molecular dynamics simulations show that aromatics on ice surfaces are not as well solvated by the water molecules presentthere as on the liquid surface dueto the fewer “free” OH at ice surface. This feature is observedalso in the Raman spectrum ofsurface water vs. ice.Thus the aromatics tend to self-associate at the ice surface to lower their energies there.
2800 3000 3200 3400 3600 38000.0
0.2
0.4
0.6
0.8
1.0

For naphthalene, the “self-associated” absorption is shifted to the red ... into the actinic region
Time (min)
0 20 40 60 80 100 120 140
ln(I
/Io)
-1.2
-1.0
-0.8
-0.6
-0.4
-0.2
0.0 Aqueous solution
Air-ice interface
Thus self-association on ice could contribute to enhanced naphthalene photolysis kinetics
Solar output
Bree and Thirunamachandran Molec. Phys. 1962 5: 397
Crystalline
Monomer
Naphthalene absorption

Excitation wavelength (nm)
260 280 300 320
Nor
mal
ized
Int
ensi
ty
0.0
0.2
0.4
0.6
0.8
1.0
Benzene photolysis on ice shows a similar enhancement ... and a similar red shift in absorption
Excitation wavelength (nm)
260 280 300 320
Nor
mal
ized
Int
ensi
ty
0.0
0.2
0.4
0.6
0.8
1.0
Water Ice
Benzene excitation spectra
Solar output
Time (min)
0 10 20 30 40 50
ln(I
/Io)
-1.2
-1.0
-0.8
-0.6
-0.4
-0.2
0.0
0.2
0.4
Benzene photolysis kinetics
Water
Ice

(Uncomfortable) conclusions
• Reactions within the ice matrix seem to be accurately modeled using aqueous parameters (if the correct concentrations are known)
• Photolysis at the air-ice surface shows different kinetics from that within the ice matrix
• Heterogeneous reaction kinetics at the air-ice interface may be quite different (or not!!) from those in the ice matrix
• Exclusion of salts to the air-ice interface may be different from bulk thermochemical predictions
• The air-ice interface presents a very different solvating environment from the liquid-air interface