omsan lojİstİk to allow for: errors in demand forecasting errors in demand forecasting mistakes in...
TRANSCRIPT

OMSAN LOJİSTİK


To allow for: To allow for:
• Errors in Demand ForecastingErrors in Demand Forecasting
• Mistakes in PlanningMistakes in Planning
• Record InaccuraciesRecord Inaccuracies
• Quality, Workforce, Machine problemsQuality, Workforce, Machine problems
• Optimum buying & production quantitiesOptimum buying & production quantities
• Smooth production cycles using seasonal stockSmooth production cycles using seasonal stock
• Maintaining High Customer ServiceMaintaining High Customer Service
Inventory is a Financial Investment
Inventory is a Financial Investment

$115 billion
Better management of inventories can make a big difference

Three types of costs often affect most inventory decisions
• Cost of Having (Holding or carrying
cost)
• Cost of Not Having (Shortage cost)
• Cost of Getting (Ordering cost)

Basic Trade-Offs
COST
Ordering or Setup
Holding or Carrying
Shortage or Backorder
Inventory Level
High Low

HOLDING OR CARRYING COSTSHOLDING OR CARRYING COSTS* Capital Cost (Opportunity Cost of $ tied up) Liquidity Risk* Storage, Handling, Insurance* Obsolescence* Deterioration, Decay, Theft, Shrinkage• Taxes• ….
SHORTAGE OR BACKORDER COSTSSHORTAGE OR BACKORDER COSTS* Lost Sales* Customer Ill Will* Information and Follow up Costs* Expediting* Production Down Time
ORDERING OR SETUP COSTSORDERING OR SETUP COSTS* Paperwork for order* Equipment Setup• Sample testing• Receiving and handling
Inventory Costs

Page 8
IP&M Performance Measures
• ICC: Inventory Carrying Cost
• GIT: Global Inventory Turnover
• FTFR: First-Time-Fill-Rate
• FFR: Final Fill Rate
• FAC: Forecast Accuracy
ICC
GIT
FTFRFFR
FAC
0
1
2
3
4
5

Page 9
Optimal Customer Service Levels
$-
$500
$1,000
$1,500
$2,000
$2,500
$3,000
50.0
00%
60.0
00%
65.0
00%
70.0
00%
75.0
00%
80.0
00%
85.0
00%
90.0
00%
92.5
00%
95.0
00%
97.0
00%
98.0
00%
99.0
00%
99.5
00%
99.7
00%
99.9
50%
Customer Service Level Measured as Fill Rate
Inventory Carrying Cost
Lost Sales Cost
Total Policy Cost

Page 10
Inventory Levels
0
500
1000
1500
2000
2500
3000
3500
4000
4500
5000
50.0
00%
60.0
00%
65.0
00%
70.0
00%
75.0
00%
80.0
00%
85.0
00%
90.0
00%
92.5
00%
95.0
00%
97.0
00%
98.0
00%
99.0
00%
99.5
00%
99.7
00%
99.9
50%
Customer Service Level Measured as Unit Fill Rate
Avera
ge I
nven
tory
Valu
e
0
1
2
3
4
5
6
Inven
tory
Tu
rns
PF
PI
SS
AIL
AIV
Inventory Turns

Fill Rate Optimizers

1. HOW MUCH to order?Balance the costs associated with ordering frequency
2. WHEN to order? When there is enough to cover demand during lead time
1. HOW MUCH to order?Balance the costs associated with ordering frequency
2. WHEN to order? When there is enough to cover demand during lead time
Basic Issues
order
Shipment

1. How Much to order?
Balance holding cost
with ordering cost
“The EOQ Approach”
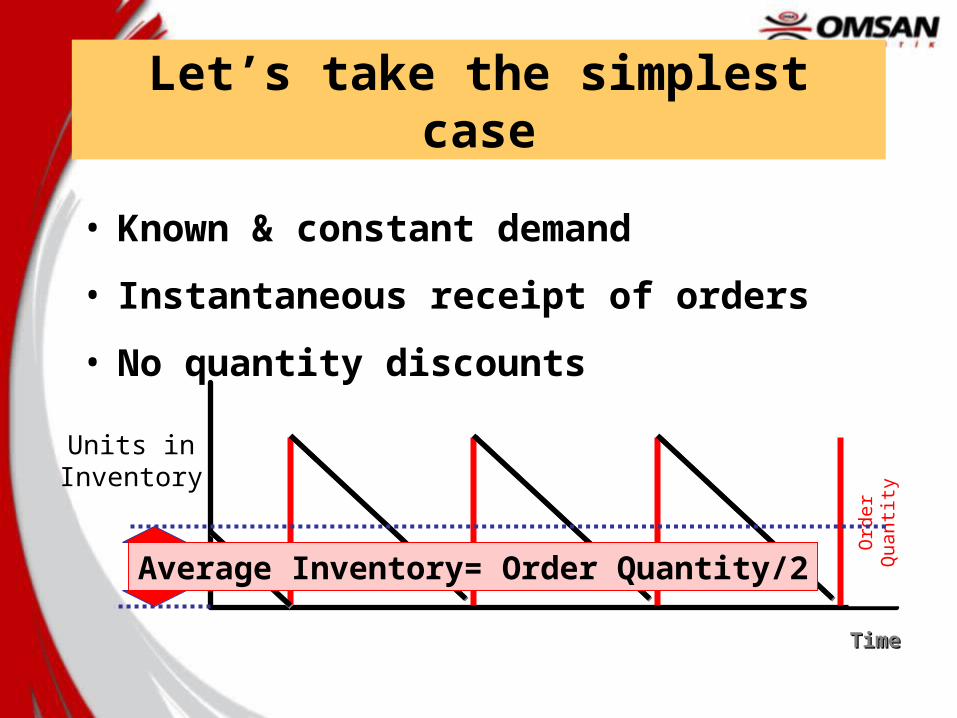
Let’s take the simplest case
• Known & constant demand
• Instantaneous receipt of orders
• No quantity discounts
TimeTime
Units in Inventory
Ord
er
Quanti
ty
Average Inventory= Order Quantity/2

Order QuantityOrder Quantity
Annual CostAnnual Cost
Holding CostHolding Cost
Total Cost CurveTotal Cost Curve
Order (Setup) CostOrder (Setup) Cost
Optimal Optimal Order Quantity (Q*)Order Quantity (Q*)
EOQ Model

H
SDEOQ
2H
SDEOQ
2
D = Demand (units/time period)S = Cost per order ($) H = Holding cost ($/unit/time period)
(= C*i)
Economic Order Quantity

Demand = 1000 units per year
Ordering Cost = 100 $/order
Unit Cost = $50
Inventory holding cost = 40 %
(or $ 0.4 per $ in Inventory /year)
Order Lead Time = 2 weeks
(assume 50 weeks per year)
An Example
What is the EOQ for this coffee maker?What is the ROP?

What if …• Interest rates go up?• Order processing is automated?• Warehouse costs drop?• Product is cost-reduced?• Minimum order quantity imposed?• Variability of demand increases?
H
SDEOQ
2H
SDEOQ
2
And a quick review of basic relationships

When? Is there enough on hand to cover the demand during lead time?
Units in stock
Time
How often should we tolerate shortage during lead time?[Conversely, what “service level” is acceptable?]
Arrival ofNext Order
Safety
Stock
Reorder Point
Lead Time
?
Shortage!
?
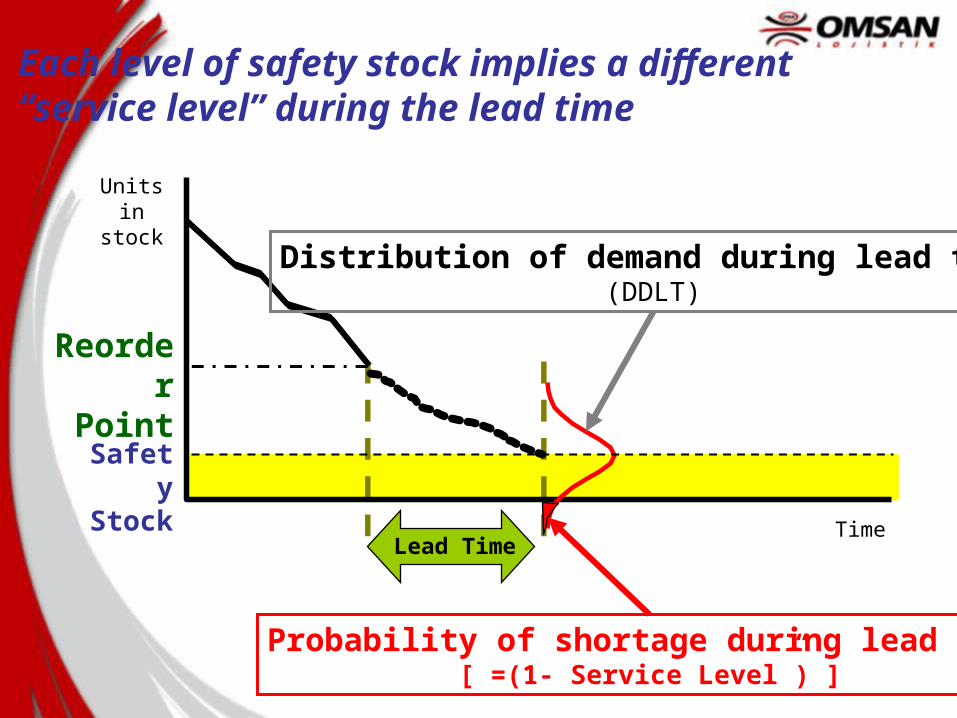
Each level of safety stock implies a different “service level” during the lead time
Safety
Stock
Reorder Point
Lead Time
Units in stock
Time
Distribution of demand during lead time(DDLT)
Probability of shortage during lead time[ =(1- Service Level”) ]

Safety
Stock
Reorder Point
Lead Time
Units in stock
Time
More clearly
AverageDDLT
P(Stockout)
SS
ServiceLevel
Demand distribution during lead time

Balance Shortage Cost [Cu]
with Holding Cost [Co]
P (DDLT > ROP) * Cu = P (DDLT< ROP) * Co
(1-Service Level) * Cu = Service Level * Co
Service Level = Cu / (Co + Cu)
This ratio is also called “Critical Fractile”
Expected cost of having too few = Expected cost of having too many
What is the appropriate service level?
© 1995 Corel Corp.
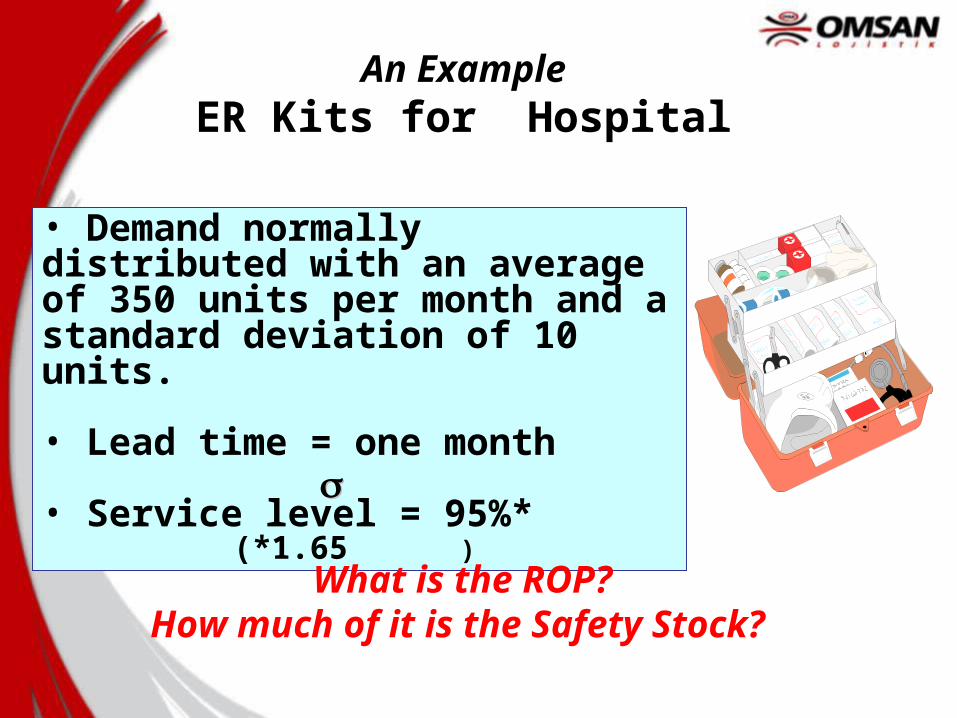
• Demand normally distributed with an average of 350 units per month and a standard deviation of 10 units.
• Lead time = one month
• Service level = 95%* (*1.65 )
An ExampleER Kits for Hospital
What is the ROP?How much of it is the Safety Stock?

XX
= 350= 350
Service Level = 95%Service Level = 95%
P(Stockout) = 5%P(Stockout) = 5%
FrequencyFrequency
xx = ?= ?
= 10= 10
Safety Stock = Safety Stock = xx - -
ROP for ER Kits
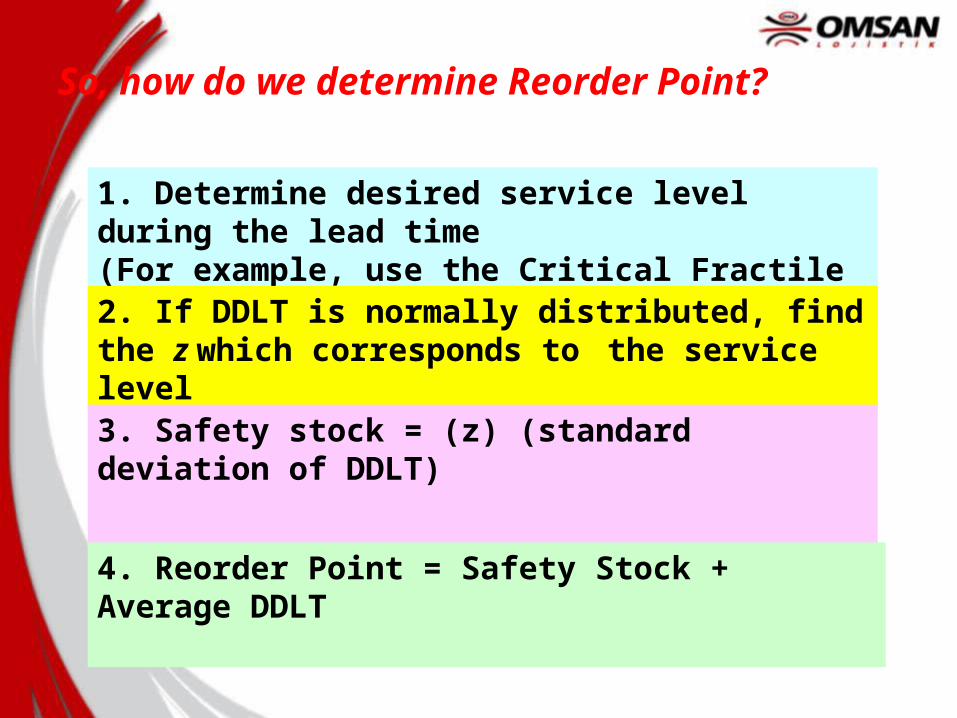
So, how do we determine Reorder Point?
1. Determine desired service level during the lead time(For example, use the Critical Fractile formula)
2. If DDLT is normally distributed, find the z which corresponds to the service level
3. Safety stock = (z) (standard deviation of DDLT)
4. Reorder Point = Safety Stock + Average DDLT

Higher service levels require very high safety stocks
Higher service levels require very high safety stocks
0.8
1.3
1.8
2.3
2.8
3.3
80% 85% 90% 95% 100%Service Level
Safe
ty S
tock

Focus on Cost Optimization
Economic Order Quantity (EOQ)Economic Shipment Load (TL,…)
Good inventory management “optimizes” the relevant costs

And utilizes frequent and up-to-date information
Focus on Cost Optimization
Economic Order Quantity (EOQ)Economic Shipment Load (TL,…)
Focus on Exchange of Information
Materials Requirement Planning (MRP)…Enterprise Resource Planning (ERP)

But most important,good inventory management is about
dealing with uncertainty and variability
Focus on Cost Optimization
Economic Order Quantity (EOQ)Economic Shipment Load (TL,…)
Focus on Flexible & Rapid Response
Just -in-Time (JIT)Mass Customized Production
Focus on Exchange of Information
Materials Requirement Planning (MRP)…Enterprise Resource Planning (ERP)