om – species distribution modelling & terravie · om – species distribution modelling &...
TRANSCRIPT

OM – Species Distribution Modelling & TerraView
Alexandre JardimLúbia Vinhas
Luciana ArasatoSilvana Amaral
O Projeto openModeller - Oficina de Trabalho
8 e 9 de outubro de 2008 - INPE

What is TerraView?
� Geographical application built using TerraLib
� Is an example of:� how to build a geographical application using
TerraLib� what you can do using this library
� Has been developed by Image Processing Division (DPI) of INPE

What is TerraView?
DBMS
TerraLib
Jfddfjh gfsdfgdfssf fsdf fsdfsd sdfsdfJfddfjh gfsdfgdfssf fsdf fsdfsd sdfsdf
Jfddfjh gfsdfgdfssf fsdf fsdfsd sdfsdf
� Set of graphical interfaces (QT toolkit) that use the TerraLib functionalities.

What is TerraView?
� Free and open source� GNU Public License
� GNU Lesser General Public License
� Available for Linux and Windows
� Release 3.2.0 � Beta version
� Official version on November
� ~ 8000 downloads in 2005 and also in 2006

What is TerraView?
� www.dpi.inpe.br/terraview� Documentation, Download and Forum

What can you do with TerraView?
� Visualize and handle vector and raster data
� Import and Export well-known geographical formats
� Shapefile, MID/MIF, ASCII SPRING
� GeoTIFF (TIFF + tfw), JPEG (+jgw)
� Address Geocoding

What can you do with TerraView?
� Analyze the geographical data through:� Attribute and Spatial Queries
� Grouping functions (creating legends)
� Pie and Bar charts
� Graphs and brushing tool

What can you do with TerraView?
� Geographical Operations:� Buffer
� Intersection (Clipping)
� Union and Difference
� Assign Data by Location
Buffer
Clipping
A
B
A
BC
Intersection

What can you do with TerraView?
� Spatial Analyses:� Spatial Statistics: Moran Index, Local Mean, etc..
� Kernel Map
� Kernel Ratio Map
� Proximity Matrix
� Skater
� Semivariogram
� Empirical Bayes

TerraView Data Model
� Main concepts:
� Database
� Layer
• Geometrical Representation
� Theme
� View

Database
� TerraView works over a database created in a DBMS, where the geographical data (raster and vector) is stored:� Free: MySQL, PostgreSQL and PostGIS
� Commercial: ACCESS, SQLServer, Oracle and Oracle Spatial
� A TerraView database is composed of a set of tables that stored the data and its metadata.

Layer
� Set of geographical information, on the same geographic region, sharing the same set of attributes.
� Aggregates similar “things”
� Contains vector or raster data
� Is associated to a cartographical projection
Layer of São Paulo municipalities

Geometrical Representation
� The geographical objects of a layer can be represented by different geometries, that is, they can have different geometrical representations� Point, polygon, line, cell, arc and node.

Theme
� Subset of geographical objects of a layer created based on: � Attribute restriction
• ex.: the municipalities whose population is smaller than 300.000.
� Spatial restriction: • ex.: the municipalities that are adjacent to São Paulo city.
� Temporal restriction• ex.: the crimes that happened in January .
� Defines the graphical visual of the data.
� It does not duplicate the layer objects, it maintains a pointer to layer objects.

Theme Tema1 (grouping)
Tema3 (Adjacent of São Paulo city)
Tema2 (Population > 70000)
Layer
View
� Defines a particular view of a user over the database
� Groups themes that will be simultaneously displayed.
� Is associated to a cartographical projection
� Since each theme can come from layers with different projections, the themes of a view are presented in the view projection.

Data Sources / Tools
TerraView: TerraLib–OM Plugin
• Species occurrences
• Environmental variables
• Results of species distribution modeling

Hands on – Using TerraView
� Preparando ambiente...
� Criar diretório� D:\Oficina_OM
� Acessar http://www.dpi.inpe.br/sil/2008_OM_Ofic/
� Baixar os arquivos
� (instalar do CD)

Hands on – Using TerraView
� Preparando ambiente...
� Unzip – arquivo dadosclimaticos.zip
� Instalar TerraView (2 versões)� TerraView_Plugin – C:\arquivo de programas
� TerraView_3.2.0s – C:\arquivo de programas
� Criar ícones na área de trabalho.

Hands on – Using TerraView
� Uso do software - TerraView� Rodar a versão TerraView3.2.0s
� Abrir Banco:� D:\Oficina_OM\
� Eedulis_LL.mdb
� Estrutura de Vistas e Temas� Vista: Oficina
� Tema: IBGE_UF_2008
� Visual
Hands on – Using TerraView
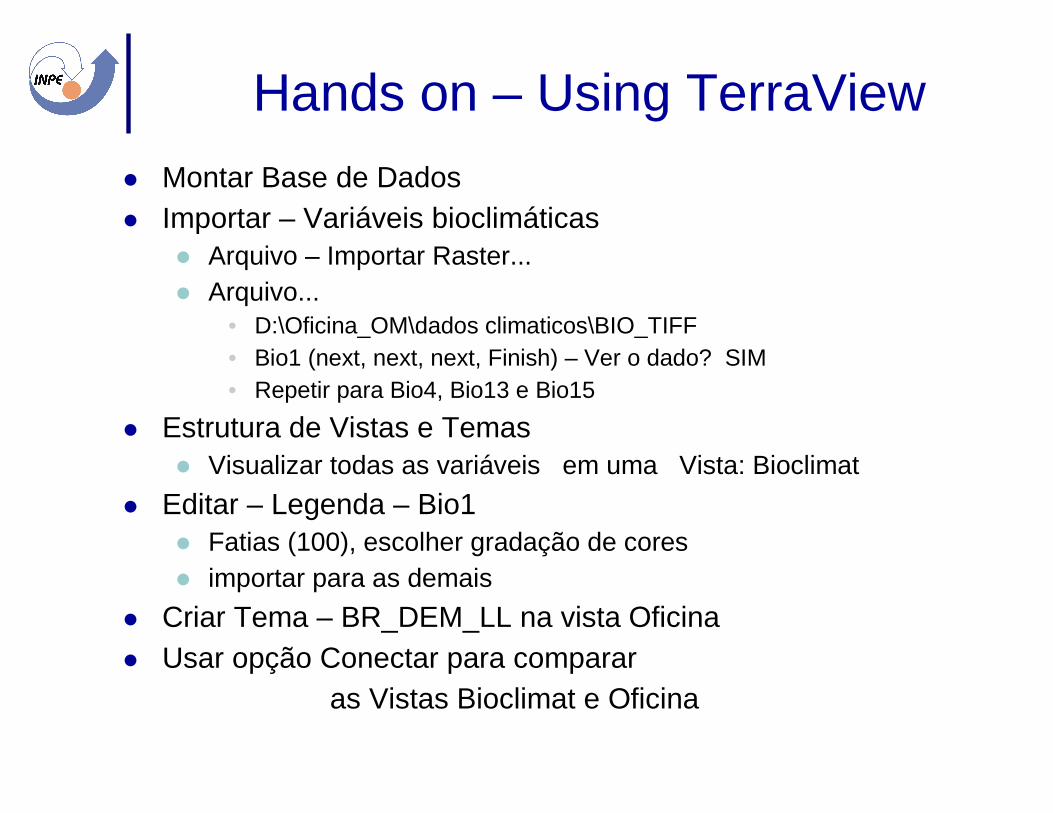
� Montar Base de Dados� Importar – Variáveis bioclimáticas
� Arquivo – Importar Raster...� Arquivo...
• D:\Oficina_OM\dados climaticos\BIO_TIFF• Bio1 (next, next, next, Finish) – Ver o dado? SIM• Repetir para Bio4, Bio13 e Bio15
� Estrutura de Vistas e Temas� Visualizar todas as variáveis em uma Vista: Bioclimat
� Editar – Legenda – Bio1� Fatias (100), escolher gradação de cores� importar para as demais
� Criar Tema – BR_DEM_LL na vista Oficina� Usar opção Conectar para comparar
as Vistas Bioclimat e Oficina

SDM & TerraView – Euterpe edulis
� Influência das variáveis bioclimáticas para a distribuição da palmeira Euterpe edulis Mar. (Juçara)1. Variáveis Climáticas
� Precipitação – meses janeiro e julho
� Temperatura máxima – meses janeiro e julho
� Temperatura mínima – meses janeiro e julho
2. Variáveis de Relevo:� Altitude
� Declividade
� Aspecto
3. Variáveis Bioclimáticas � BIO1 – Temperatura média anual
� BIO4 – Sazonalidade da Temperatura (desvio padrao*100)
� BIO13 – Precipitação dos meses mais úmidos
� BIO15 – Sazonalidade da Precipitação (Coeficiente de variação)
� Experimentos 1-2, 1-2-3 e 1-3

Hands on – SDM & TerraView –E. edulis
� Modelagem de distribuição de E. Edulis� Rodar a versão TerraView e Plugin
� Abrir Banco:� D:\Oficina_OM\� Eedulis_LL.mdb
� Importar – dados de ocorrência (dbf)� Arquivo – Importar Tabela de Pontos...� Arquivo...
• D:\Oficina_OM\ Euterpe_edulis_63.dbf• Projeção... Lat/Long SAD69• Informação de Geometria: Coord Y: LAT / CoordX:LONG
� Visualizar na Vista Oficina� Alterar o Visual.... Default (pontos)

� Plugin... OpenModeller:
• ALGORITMO• Algoritmo: Distância a Média • Saída: Nome PI: Eedulis_media_E12• Diretório: D:\Oficina_OM\ Modelos (Criar nova pasta)
• DADOS LOCALIDADE• PI de localidade: Euterpe_edulis_63
• DADOS AMBIENTAIS• Contrução de modelos
� Prec1, prec7 - Precipitação – meses janeiro e julho� tmax1, tmax7 - Temperatura máxima – meses janeiro e julho� Tmin1, tmin7 - Temperatura mínima – meses janeiro e julho� BR_DEM_LL - Altitude� BR_Slope_LL - Declividade� BR_Aspect_LL – Aspecto
� Projeção de Modelo – Mesmos PIs
• Máscara e Formato• tmin7
• FINISH (Terminar) - esperar
� Criar Tema e Legenda
Hands on – SDM & TerraView –E. edulis
Experimento 1-2Clima e Relevo

� Plugin... OpenModeller (MESMO do ANTERIOR –MUDAR)
� ALGORITMO• Saída: Nome PI: Eedulis_media_E123
� DADOS AMBIENTAIS• Contrução de modelos
� Prec1, prec7 - Precipitação – meses janeiro e julho� tmax1, tmax7 - Temperatura máxima – meses janeiro e julho� Tmin1, tmin7 - Temperatura mínima – meses janeiro e julho� BR_DEM_LL - Altitude� BR_Slope_LL - Declividade� BR_Aspect_LL – Aspecto
� Bio1, Bio4, Bio13 e Bio15
� Projeção de Modelo – Mesmos PIs
� FINISH (Terminar) - esperar ~10 min.
� Criar Tema e Legenda
� Comparar resultados em Vistas diferentes, usando opção Conectar...
Hands on – SDM & TerraView –E. edulis
Experimento 1-2-3Climat, Bio e Relevo
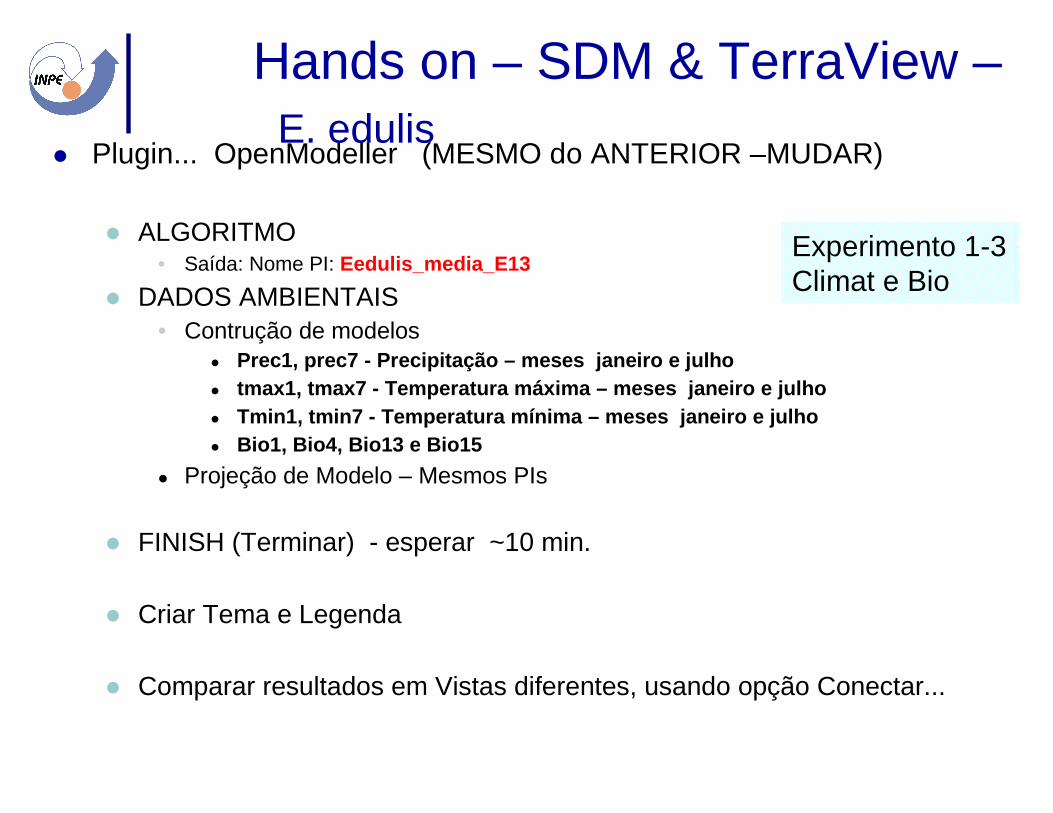
� Plugin... OpenModeller (MESMO do ANTERIOR –MUDAR)
� ALGORITMO• Saída: Nome PI: Eedulis_media_E13
� DADOS AMBIENTAIS• Contrução de modelos
� Prec1, prec7 - Precipitação – meses janeiro e julho� tmax1, tmax7 - Temperatura máxima – meses janeiro e julho� Tmin1, tmin7 - Temperatura mínima – meses janeiro e julho� Bio1, Bio4, Bio13 e Bio15
� Projeção de Modelo – Mesmos PIs
� FINISH (Terminar) - esperar ~10 min.
� Criar Tema e Legenda
� Comparar resultados em Vistas diferentes, usando opção Conectar...
Hands on – SDM & TerraView –E. edulis
Experimento 1-3Climat e Bio

Critics (only good ones)
and suggestions are welcome!!!
Muito obrigada!