oke, oluwaseyi olanrewaju (2011) a study on the
TRANSCRIPT
Preface A STUDY ON THE DEVELOPMENT OF GUIDELINES FOR THE PRODUCTION OF BITUMEN
EMULSION STABILISED RAPS FOR ROADS IN THE TROPICS
i
A STUDY ON THE DEVELOPMENT OF GUIDELINES FOR THE PRODUCTION OF BITUMEN EMULSION STABILISED RAPS FOR ROADS IN THE TROPICS
By
OKE OLUWASEYI ‘LANRE
Thesis submitted to the University of Nottingham
for the degree of Doctor of Philosophy
DECEMBER 2010
Preface A STUDY ON THE DEVELOPMENT OF GUIDELINES FOR THE PRODUCTION OF BITUMEN
EMULSION STABILISED RAPS FOR ROADS IN THE TROPICS
ii
Abstract
Eco-friendliness, energy efficiency and cost effectiveness are major drivers
responsible for cold recycled asphalt mixtures being considered as alternatives to
hot mixtures. Although such mixtures are still regarded in some quarters as
second class asphalt, results from field trials on such materials under temperate
climates have been reported to be highly impressive and encouraging. Some
developed countries with temperate climates have since developed guidelines for
the production and use of cold mixtures in road building. However, evidence from
the literature shows that little or nothing has been done to ascertain the
performance and suitability of such sustainable materials in developing countries
located in hot tropical climates. Ascertaining the performances of such will, among
other things enable the formulation of guidelines required for producing and using
these alternative sustainable materials and methods in developing countries with
hot tropical climates, where available funds for road building are increasingly
inadequate to meet demand.
The work reported in this thesis attempts to simulate what should be expected in
terms of the performance of flexible pavements containing cold mixes of bitumen
emulsion stabilized RAP as road base in hot climates. Cold recycling in-plant was
deemed appropriate for the obvious reason that it enables control of the quality of
mixtures produced. The challenge of sourcing severely aged RAPs required for this
study afforded the opportunity of developing a laboratory ageing protocol for
producing RAPs with controlled properties, typical of those found in hot tropical
belts (with residual binders of very low penetration). The result of the physico-
chemical and rheological studies showed that ageing hot mix asphalt at 125⁰C
does not degrade the binder when compared to that aged at 85⁰C, which is the
conventional protocol (for temperate climates).
A target mix design based on Overseas Road Notes (ORN) 19 and 31 for 20mm
DBM, which the literature suggests is suitable for road base layers of road
pavements, yielded an aggregate gradation containing RAP (with residual bitumen
of 20dmm penetration), 5mm granite dust and granite mineral filler in the
proportion 65:30:5 respectively. Further investigations patterned after Marshall
and Hveem mix design methods, indicated that a cationic bitumen emulsion
content of 6.5% and pre-wetting water content of 1.5% were suitable. Unlike hot
mixtures, cold mixtures due to their peculiarity i.e. intermediate nature (close to
unbound granular materials in early life and close to fully bound materials when
fully cured), require curing before being assessed for mechanical properties such
as stiffness, strength etc.
Performances of the five cold bituminous emulsions mixtures (CBEMs), one with
100% virgin aggregate, the others including RAP with binder penetrations 5, 10,
15 and 20dmm, manufactured at 20⁰C and 32⁰C (to reflect average minimum and
maximum temperatures in hot tropical climates) showed that:
Properties of CBEM are dependent on the state of curing or maturation
attained i.e. early life, intermediate life and fully cured or stable condition;
High air void content in CBEMs appears to be inevitable;
Mixing and compaction temperature is very important for achieving
relatively low air void contents in CBEMs. For example, mixing and
compacting CBEMs at 32⁰C gave better results than at 20⁰C;
Indirect Tensile Stiffness Modulus is useful for quickly ranking the CBEMs;
Preface A STUDY ON THE DEVELOPMENT OF GUIDELINES FOR THE PRODUCTION OF BITUMEN
EMULSION STABILISED RAPS FOR ROADS IN THE TROPICS
iii
The RAP CBEMs performed better than the virgin aggregate CBEM in terms
of water susceptibility;
An increase in stiffness modulus up the range from 10dmmCBEM to
15dmmCBEM and to 20dmmCBEM, with higher values than the virgin
aggregate CBEM as observed in this work gives the impression that the
residual binder in the studied RAPs is active as a result of possible
softening or rejuvenation. Alternatively, the stiffness enhancements could
possibly have been caused by the alteration of the volumetrics of such
RAP CBEMs which consequently enhanced their compactability;
Overall, RAP CBEMs are better than virgin aggregate CBEM in mechanical
performance and durability;
Fatigue lives of the CBEMs are generally lower than those for hot mix
asphalt (HMA);
The CBEMs are stress-dependent as they all fitted the k-Θ model.
The results of the analytical pavement design showed the importance of using
tools such as KENLAYER which account for the non linearity of CBEMs. Although
the structural design was a hypothetical case, the results confirmed that the
virgin aggregate CBEM was inferior in terms of axle loads to failure compared to
the RAP CBEMs, and the RAP CBEMs were inferior to HMA.
The findings of this limited investigation suggest that the studied RAP CBEMs are
suitable for low volume traffic roads, an indication of the great potential of these
sustainable materials when properly harnessed. In the light of this, a short and
concise set of guidelines for mix design of RAP CBEMs and structural design of
pavements containing such non linear materials was proposed in the thesis.
Preface A STUDY ON THE DEVELOPMENT OF GUIDELINES FOR THE PRODUCTION OF BITUMEN
EMULSION STABILISED RAPS FOR ROADS IN THE TROPICS
iv
Acknowledgements
I am eternally grateful to God for the gift of life.
Sponsorship by the University of Ado – Ekiti, Nigeria and the University of
Nottingham, UK, at the instance of which this study was made possible is
gratefully acknowledged.
I very much appreciate my supervisors, Dr. T. Parry and Dr. N. H. Thom for being
there always. I cannot thank them both enough for their time, advice, guidance,
insight, inspiration, concern, and assistance which kept me on track for the entire
duration of my study. My sincere thanks are due to Prof. G. D. Airey whose advice
and constructive criticisms contributed in no small measure to the success of this
study.
The particular help of Dr. D. Day is gratefully acknowledged. Apart from his
advice, and constructive criticisms which were helpful, he was instrumental in the
support given to this study by Nynas Bitumen, UK and Cliffe Hill Quarry. The
support of Longcliffe Quarries, UK is also duly appreciated.
The help of Dr J. Grenfell is deeply appreciated. The assistance of Mr A. Cooper
and Mr. K. Maharjan of Cooper Research Technologies, UK are gratefully
acknowledged.
Sincere thanks are due to Mr. R. Blakemore, Mr. L. Pont, Mr M. Winfield, Mr J.
Watson and their teams, in the Nottingham Transportation Engineering Centre
(NTEC) laboratories. I am very thankful for their cooperation and assistance that I
enjoyed during my study. Similarly, I gratefully acknowledge the assistance
rendered by Mr. M. Roe, helping with numerous sessions on the SEM at the initial
stage of this study and Mr A. Batchelor for his kind help, both of the Faculty of
Engineering, University of Nottingham.
I am thankful to research colleagues past and present in NTEC, too numerous to
mention, with whom I shared some great moments during my study.
I must express my deep appreciation to the members of Deeper Life Bible Church,
Nottingham and in particular, Pastor P. Akinwamide and his family for their
friendship and moral support.

Preface A STUDY ON THE DEVELOPMENT OF GUIDELINES FOR THE PRODUCTION OF BITUMEN
EMULSION STABILISED RAPS FOR ROADS IN THE TROPICS
v
My sincere thanks are due to Dr. O. Awosusi and Prof. O. Olaofe of the University
of Ado –Ekiti and Mr L. A. Olatunji of the Federal Polytechnic Ado-Ekiti who all had
keen interest in the progress of my work and were always ready to help.
I cannot thank you enough, Funmilola my wife, for your love, support and
patience while my study lasted. Thank you Anjolaoluwa and Olufolajimi for the joy
you both brought into my life during my study. Thank you to my siblings, Femi
and Kemi, Kunle and Bimbola, Kayode, and Bukola for your moral support, and
for always keeping me on my toes.
Thank you to my late father, Solomon Bola Oke who believed so much in me and
to my mother, Mercy Olufunke Oke for her moral support and encouragement. I
thank you both for giving me the necessary foundation.
Preface A STUDY ON THE DEVELOPMENT OF GUIDELINES FOR THE PRODUCTION OF BITUMEN
EMULSION STABILISED RAPS FOR ROADS IN THE TROPICS
vi
Declaration
The research reported in this thesis was conducted at the University of
Nottingham, Department of Civil Engineering, Nottingham Transportation
Engineering Centre, between October 2007 and October 2010. I declare that the
work is my own and has not been submitted for a degree at another university.
Oke, Oluwaseyi „Lanre
Nottingham
December 2010
Preface A STUDY ON THE DEVELOPMENT OF GUIDELINES FOR THE PRODUCTION OF BITUMEN
EMULSION STABILISED RAPS FOR ROADS IN THE TROPICS
vii
Table of Contents
Abstract ii
Acknowledgements iv
Declaration vi
Table of Contents vii
List of Figures xii
List of Tables xx
1 Introduction 1
1.1 Overview 1
1.2 Statement of Problem 3
1.3 Aims and Objectives 5
1.4 Scope of Study 6
1.5 Justification and Relevance of Study 6
1.6 Thesis Organisation 7
2 A Review on Flexible Pavement
Engineering and Current Practices 9
2.1 Overview 9
2.2 Common Flexible Pavement Design Methods 9
2.3 Flexible Pavement Design Practice in Nigeria 13
2.4 Common Highway Materials in Nigeria 15
2.4.1 Bitumen 16
2.4.2 Aggregates 16
2.4.3 Asphalt 18
2.4.4 Laterite 18
2.5 Some Common Tests for Mix Design and Quality Control 18
2.6 Common Flexible Pavement Defects and their Causes 20
2.7 Flexible Pavement Restoration Practices in some Developing
Countries 21
2.8 Trends in Road Restoration Practices in Developed Countries 24
2.9 State of Roads in Nigeria and other Developing Nations, and
Reasons for Failure 24
2.10 The Need for Sustainable Road Development 27
2.11 The Pavement Recycling Option for Road Restoration 28
2.12 Methods of Flexible Pavement Recycling 30
2.13 Cold Recycling Ex Situ (In-Plant) 31
2.14 Pavement Recyclability - Factors to be Considered 33
2.15 Recycling Agents 39
Preface A STUDY ON THE DEVELOPMENT OF GUIDELINES FOR THE PRODUCTION OF BITUMEN
EMULSION STABILISED RAPS FOR ROADS IN THE TROPICS
viii
2.16 Bitumen Emulsion 40
2.17 Manufacture of Bitumen Emulsions 43
2.18 Classification of Bitumen Emulsions 45
2.19 Factors that Affect the Choice and Performance of Bitumen
Emulsions 49
2.20 Tests on Emulsion 49
2.21 Curing and Breaking of Bitumen Emulsion 50
2.23 Recycling in the Tropics? 50
2.24 Summary 52
3 A Review on Laboratory Investigations
on Cold Mixes 54
3.1 Overview 54
3.2 Ageing in Bitumen and Bituminous Materials Defined 54
3.3 The Cause, Nature and Process of Ageing in Bitumen and
Bituminous Materials 55
3.4 Consequences of Ageing in Bitumen and Bituminous Mixtures 57
3.5 Laboratory Protocols that Simulate Field Ageing in
Bituminous Road Pavements 60
3.6 Cold Mixes 67
3.7 Design of Cold Mixes 70
3.8 Curing Protocols 76
3.9 Some Compaction Methods for Cold Mixes 79
3.10 Performance Characteristics of Cold Mixes 84
3.11 Interaction between Aged and Virgin Binders in Cold
Recycled Mixes 89
3.12 Cold Mixes and Structural Design 92
3.13 Summary 93
4 Laboratory Ageing Protocol for
Producing Severely Aged RAPs 95
4.1 Overview 95
4.2 Why Laboratory Aged RAPs and not RAPs from the Industry? 95
4.3 Experimental Programme for Producing and Investigating
Severely Aged RAPs 97
4.4 Materials for the Investigation 99
4.5 Physico-Chemical and Rheological Properties of Recovered
Binders from Aged Mixtures and Bulk Binders 102
4.5.1 Determination of penetration 102
4.5.2 Determination of softening point (SP) 104
4.5.3 Chemical composition of recovered binders 107
4.5.4 Tests on the Dynamic Shear Rheometer (DSR) 108
4.6 Discussion and Analysis of Results 110
4.6.1 Penetration vs. ageing time 110
4.6.2 Temperature susceptibility of the recovered aged
bituminous binders 112
Preface A STUDY ON THE DEVELOPMENT OF GUIDELINES FOR THE PRODUCTION OF BITUMEN
EMULSION STABILISED RAPS FOR ROADS IN THE TROPICS
ix
4.6.3 Chemical composition of the recovered aged
bituminous binders 112
4.6.4 Rheological properties of the recovered aged
bituminous binders 116
4.6.5 Comparison of rheological and physicochemical
properties of binders 119
4.7 Decision for Ageing Protocol and Mass Production of RAPs 119
4.8 Summary 123
5 Cold Bitumen Emulsion Mix Design
and Initial Investigation on its
Mechanical Performance 125
5.1 Overview 125
5.2 Design Consideration for Cold Mixtures 125
5.3 Experimental Plan 126
5.4 Philosophy behind Experimental Plan 127
5.5 Materials and Their Characterisation 130
5.5.1 Bitumen emulsion 130
5.5.2 20mm DBM 132
5.5.3 Virgin aggregates 135
5.5.4 Laboratory aged RAPs 135
5.6 Determination of Aggregate Gradation for Proposed Mix 135
5.7 Particle Density and Water Absorption of RAP and Virgin Aggregate 140
5.8 Estimation of Initial Binder Demand 140
5.9 Methods for Specimen Manufacturing 143
5.9.1 Mixing 144
5.9.2 Compaction 144
5.9.3 Curing Method 147
5.10 Compaction Characteristics and the Determination
of OMC and MDD 147
5.11 Determination of the Optimum Total Fluid Content
(OTLC) for CBEM 149
5.12 Determination of Optimum Bitumen Emulsion Content
(OBEC) in the Optimum Total Fluid Content (OTFC) 150
5.13 Initial Exploration of Mechanical Properties of the Designed
Cold Bituminous Emulsion Mixtures (CBEMs) 156
5.13.1 Determination of maximum density of CBEMs 156
5.13.2 The Effect of mixing time on the compactability and
stiffness properties of CBEMs 156
5.13.3 The effect of filler type, and mixing and compaction
temperature on compactability and stiffness properties
of CBEMs 160
5.13.4 The effect of applied compactive effort on stiffness
properties of CBEMs 163
5.13.5 The effect of curing protocol on CBEMs 165
5.14 Permanent Deformation Properties of CBEMs 170
5.15 Fatigue Characteristics of Selected CBEMs
at Different Stress Levels 173
Preface A STUDY ON THE DEVELOPMENT OF GUIDELINES FOR THE PRODUCTION OF BITUMEN
EMULSION STABILISED RAPS FOR ROADS IN THE TROPICS
x
5.16 Implication of the Initial Study on Some Selected CBEMs 173
5.17 Summary 173
6 Detailed Investigation of the Mechanical
Properties of Cold Bituminous Emulsion
Mixtures under Laboratory Simulated
Tropical Conditions 177
6.1 Overview 177
6.2 Experimental Programme 178
6.3 Materials and Procedure for Specimen Manufacture 178
6.4 Testing Methods 180
6.5 The Theory of the Indirect Tensile Test Mode 181
6.6 Explanations on Statistical Tools used for Analysis of Results 186
6.6.1 Normality test 186
6.6.2 Multiple regression analysis 187
6.7. Compactability of CBEMs 187
6.7.1 The effect of CBEM composition, temperature of preparation
and compactive effort on compactability post compaction 188
6.7.2 The effect of CBEM composition, temperature of preparation
and compactive effort on compactability of
fully cured specimens 194
6.8 The Indirect Tensile Stiffness Modulus (ITSM) Test 196
6.8.1 Stiffness Modulus Response and CBEM Composition 197
6.8.1.1 ITSM and CBEM composition at early life condition 199
6.8.1.2 ITSM and CBEM composition at intermediate
life condition 203
6.8.1.3 ITSM and CBEM composition at fully
cured condition 206
6.8.2 Temperature and ITSM response of CBEMs 209
6.8.3 Moisture susceptibility of CBEMs 215
6.8.4 ITSM and air voids 224
6.9 The Indirect Tensile Fatigue Test (ITFT) 229
6.9.1 Fatigue responses of CBEMs 232
6.9.2 Fatigue responses and the effect of mixing and
compaction temperatures of CBEMs 238
6.9.3 Fatigue responses and temperature susceptibility of CBEMs 238
6.10 The Repeated Load Axial Test (RLAT) – Unconfined
Mode of Testing 240
6.10.1 Effect of RAP type on deformation properties 242
6.10.2 The effect of curing on deformation properties of CBEMs 245
6.11 The Vacuum Repeated Load Axial Test (VRLAT)-Confined
Mode of Testing 246
6.12 Resilient Modulus Test 249
6.12.1 Sensitivity of the resilient modulus test and the CBEMs 259
6.12.2 The effect of air voids, and stiffness modulus on
the resilient modulus of CBEMs 259
6.13 Summary 266
Preface A STUDY ON THE DEVELOPMENT OF GUIDELINES FOR THE PRODUCTION OF BITUMEN
EMULSION STABILISED RAPS FOR ROADS IN THE TROPICS
xi
6.14 Conclusions 274
7 Structural Design and Modelling of
Flexible Pavement Containing CBEMs 275
7.1 Overview 275
7.2 Flexible Pavement Failure Criterion 278
7.3 Modelling Tools and Requirements 279
7.4 Non Linear Elastic Analysis 280
7.5 Stress and Strain Distribution in Pavements Containing CBEMs 285
7.6 The Effect of Analytical Method on Stress and Strain Distributions 286
7.7 Design of CBEM Road Base for Fatigue Life 292
7.8 The Effect of CBEM Road Base Layer Property on the
Fatigue Life of Surfacing Layer 301
7.9 The Effect of CBEM Road Base Layer Property on
Subgrade Performance 304
7.10 Summary 307
7.11 Conclusions 308
8 Some Guidelines for the use of CBEM
in Hot Tropical Climates 310
8.1 Overview 310
8.2 Laboratory Mix Design Considerations for the Use of
Cold Recycled Bituminous Emulsion Mixtures 310
8.2.1 RAP Characterisation 312
8.2.2 Considerations for the choice of bitumen emulsion 313
8.2.3 Estimation of Pre-wetting Water Content and Binder Demand 314
8.3 Structural Design of Cold Recycled Bituminous
Emulsion Mix Layers 316
9 Conclusions and Recommendations
for Future Research 321
9.1 Conclusions 321
9.2 Recommendations for Future Research 327
References 330
Preface A STUDY ON THE DEVELOPMENT OF GUIDELINES FOR THE PRODUCTION OF BITUMEN
EMULSION STABILISED RAPS FOR ROADS IN THE TROPICS
xii
List of Figures
Chapter 2
Figure 2.1: Flexible Pavement Design Curve (FMWH, 1973) 14
Figure 2.2a: Cross Section of Road Pavement Showing Failure Mechanisms
due to Fatigue Cracking and Rutting (White et al, 2002) 22
Figure 2.2b: Some Common Flexible Pavement Defects 22
Figure 2.3a: Ripped Asphalt Improperly Disposed Close to a Farmland along
Igede - Aramoko Road in Ekiti State, Nigeria 23
Figure 2.3b: Indiscriminate Dumping of Scarified Failed Pavement
Materials in Nigeria (Eyo, 2005) 23
Figure 2.4a: Current and Projected Conditions (Due to Intervention) of the
Nigeria Road Network (FERMA, 2010) 26
Figure 2.4b: Very Thick Asphalt Layer Due to Several Overlays in Ibadan,
Nigeria 29
Figure 2.5: Methods of Asphalt Recycling (Karlsson and Isacsson, 2006) 32
Figure 2.6: Cold Recycled Mix Plant (Wirtgen, 2005) 34
Figure 2.7: Cold Recycled Mix Placement (Wirtgen, 2005) 34
Figure 2.8: Process involved in Cold Recycling Ex Situ (ARRA, 2001) 35
Figure 2.9: A Guide for Choosing Recycling Type to Employ in Addressing
Pavement Problems (ARRA, 2001) 38
Figure 2.10: Photomicrograph of a Bitumen Emulsion (James, 2006) 42
Figure 2.11: The Three Broad Groups of Emulsion
(James, 2006; and Akzo Nobel, 2008) 42
Figure 2.12: Batch Emulsion Plant (James, 2006) 46
Figure 2.13: Picture of a Bitumen Emulsion Plant (James, 2006) 46
Figure 2.14: Structure of Surfactant (James, 2006) 47
Figure 2.15: Possible Stages in the Breaking of a Cationic Emulsion
(James, 2006; and Akzo Nobel, 2008) 51
Chapter 3
Figure 3.1: Chemical Functionalities in Bitumen Molecules Normally
Present or Formed on Oxidative Ageing (Petersen, 1984) 59
Figure 3.2: Viscosity Change of several Bitumens During
Service in Pavements (Zube and Skog, 1969) 59
Figure 3.3: A General Procedure for Mix Design (Jenkins, 2000) 75
Figure 3.4: Effect of Different Curing Conditions and Compaction on
Compressive Strength of Reference Grave Emulsion
(Serfass et al, 2003) 78
Figure 3.5: Relationship between Bulk Density and Number of Rotations
(note, with an increased compaction angle i.e. 1.25 to 2º,
the number of rotations needed to reach a given density is
fewer, ABS is the Swedish equivalent of SMA)
(Ulmgren, 2003) 83
Figure 3.6: Influence of Compaction on Stiffness (Serfass et al, 2003) 83
Figure 3.7: CBEMs Fatigue Performance Compared to Hot mixes
Preface A STUDY ON THE DEVELOPMENT OF GUIDELINES FOR THE PRODUCTION OF BITUMEN
EMULSION STABILISED RAPS FOR ROADS IN THE TROPICS
xiii
(Thanaya, 2007) 87
Figure 3.8: Influence of Bitumen Grade on Cold RAP Mix Stiffness versus
Time Showing the Evolutive Behaviour of Cold Mixes
(Lesueur et al, 2005; and Walter et al, 2008) 87
Figure 3.9: Diagram Illustrating the Diffusion Process within the DSR
(Lesueur et al, 2005; and Walter et al, 2008) 91
Chapter 4
Figure 4.1: Flow Chart Showing Experimental Programme for Severely
Aged RAP Production and Investigation 98
Figure 4.2: Laboratory Procedure for the Production of Severely Aged RAP 98
Figure 4.3: Stages and Condition of HMA in its Progressive
Transformation to RAP 100
Figure 4.4: Facilities for Bulk Binder Ageing 100
Figure 4.5: Binder Recovery and Physico-chemical/Rheology Testing
Facilities 101
Figure 4.6: Gradation of the Granite used for the Production of HMA 103
Figure 4.7: The Penetration Test 103
Figure 4.8: Determining the Linear Viscoelastic Range of Binders
(Petersen et al, 1994) 109
Figure 4.9: The Dynamic Shear Rheometer and its Geometry 109
Figure 4.10: Penetration of Recovered Aged Binders vs. Time of Ageing 111
Figure 4.11: Temperature Susceptibility of Recovered Binders
(Penetration vs. Softening Point) 113
Figure 4.12: Temperature Susceptibility of Recovered Binders
(Softening vs. Penetration Index) 114
Figure 4.13: Penetration of Recovered Binders vs. Asphaltene Content 115
Figure 4.14: Softening Point of Recovered Binders vs. Asphaltene Content 117
Figure 4.15: Complex Modulus Master Curves of 23dmm Pen Binders Aged
Differently Compared to the Parent 53dmm Pen Binder 118
Figure 4.16: Complex Modulus Master Curves of 20dmm Pen Binders Aged
Differently Compared to the Parent 53dmm Pen Binder 118
Figure 4.17: Complex Modulus Master Curves of 11dmm Pen Binders Aged
at 85⁰C and 125⁰C Differently Compared to the Parent
53dmm Pen Binder 120
Figure 4.18: A Comparison of the Complex Modulus and Penetration
of PAV and RTFO Aged 53dmm Pen Binder with that
of Recovered Binder 120
Figure 4.19: A Comparison of the Phase Angle and Penetration of PAV and
RTFOT Aged 53dmm Pen Binder with that of Recovered Binder 121
Figure 4.20: A Comparison of the Complex Modulus and Softening Point of
PAV and RTFOT Aged 53dmm Pen Binder with
that of Recovered Binder 121
Figure 4.21: A Comparison of the Phase Angle and Softening Point of
PAV and RTFOT Aged 53dmm Pen Binder with that of
Recovered Binder 121
Figure 4.22: A Comparison of the Complex Modulus and Asphaltene
Content of PAV and RTFO Aged 53dmm Pen Binder with that
of Recovered Binder 122
Preface A STUDY ON THE DEVELOPMENT OF GUIDELINES FOR THE PRODUCTION OF BITUMEN
EMULSION STABILISED RAPS FOR ROADS IN THE TROPICS
xiv
Figure 4.23: A Comparison of the Phase Angle and Asphaltene Content
of PAV and RTFOT Aged 53dmm Pen Binder with
that of Recovered Binder 122
Chapter 5
Figure 5.1: Flow Chart for Cold Bituminous Emulsion Mix Design 128
Figure 5.2: Percentage Loss in Mass of Cured Bitumen Emulsion at
30±2⁰C over 72Hrs 131
Figure 5.3a: Complex Modulus Master Curve Relationship for residues as
obtained from 4 trays before they were all combined 133
Figure 5.3b: Phase Angle Master Curve Relationship for residues as obtained
from 4 trays before they were all combined 133
Figure 5.4: 20mm DBM (inset at the bottom right hand corner shows the
appearance of reclaimed aggregates from the 20mm DBM) 134
Figure 5.5: Gradation Curve for Reclaimed Aggregates from 20mm DBM 134
Figure 5.6: Gradation Curves of the Designed Mix, RAP, 5mm Dust, Mineral
Filler, Maximum Density and ORN 19&31 for 20mm DBM 139
Figure 5.7: Composition and Proportion of the Designed Mix 139
Figure 5.8: Conditions of Substrates (Aggregates & RAP) During Particle
Density and Water Absorption Determination 141
Figure 5.9: RAP Conglomerates holding more moisture than Virgin
Aggregate at the Saturated Surface Dried (SSD) Condition 142
Figure 5.10: 20 Quarts Hobart Mixer 145
Figure 5.11: The Sun and Planet Mixer 145
Figure 5.12: Cooper Research Gyratory Compactor 146
Figure 5.13: Compaction Characteristics of Cold Bitumen Emulsion Mixtures 148
Figure 5.14: Strength/ Stiffness Characteristics of CBEMs with
Varying Total Fluid Content 152
Figure 5.15: Dry and Wet Strength/Stiffness Ratios for CBEMs with
Varying Total Fluid Content 152
Figure 5.16: Strength/ Stiffness Characteristics of Cold Recycled Bitumen
Emulsion Mixtures with Varying Bitumen Emulsion Content 155
Figure 5.17: Dry and Wet Strength/Stiffness Ratios CBEMs with
Varying Bitumen Emulsion Content 155
Figure 5.18: Mix Proportion for the Cold Bitumen Emulsion Mixture (CBEM) 155
Figure 5.19: The Effect of Mixing Time on the Stiffness Modulus of CBEMs 159
Figure 5.20: Effect of Compaction/Mixing Temperature and Filler Type
(Note: same compactive effort of 200gyrations
@ 600kpa ram pressure was applied) 161
Figure 5.21: The Effect of Similar Compactive Effort on the Stiffness and
Moisture Susceptibility of CBEMs 164
Figure 5.22: The Effect of Similar Void Content on the Stiffness and Water
Susceptibility of CBEMs 166
Figure 5.23: The Effect of Varying Void Content on the Stiffness and Water
Susceptibility of CBEMs 167
Figure 5.24: Effect of Curing Protocol on Stiffness Properties of
Cold Recycled Mixtures 169
Figure 5.25: Permanent Deformation Properties of CBEMs 171
Figure 5.26: Permanent Deformation Characteristics of CBEMs 172
Preface A STUDY ON THE DEVELOPMENT OF GUIDELINES FOR THE PRODUCTION OF BITUMEN
EMULSION STABILISED RAPS FOR ROADS IN THE TROPICS
xv
Figure 5.27: Fatigue Characteristics of CBEMs at Different Stress Levels 174
Chapter 6
Figure 6.1: The Nottingham Asphalt Tester Test Frames 182
Figure 6.2: The Main Components of a NAT (Shown in the VRLAT Mode) 182
Figure 6.3: Biaxial Stress Distribution under Compression Load in
the Indirect Tensile Test Mode 184
Figure 6.4: Mean Air Void Contents of CBEMs Immediately
after Compaction 191
Figure 6.5: Mean Air Void Contents of CBEMs at Simulated Early and
Intermediate Lives 191
Figure 6.6: Moisture Contents of CBEMs at Early and
Intermediate Life Conditions 193
Figure 6.7: Moisture Contents of CBEMs at Fully Cured Conditions 193
Figure 6.8: Mean Air Void Contents of CBEMs at Simulated
Fully Cured Condition 195
Figure 6.9: Different Modes of Testing in the NAT 198
Figure 6:10: The Effect of Curing Protocols on CBEMs 201
Figure 6.11: ITSM of CBEMs and their Respective Percentage
Improvements over the VA CBEM at Early life 202
Figure 6.12: ITSM of CBEMs at Simulated Intermediate Life Condition 204
Figure 6.13: Percentage Improvement of other CBEMs in ITSM over
VACBEM at Simulated Intermediate Life Condition 205
Figure 6.14: ITSM of CBEMs at Simulated Fully Cured Condition 207
Figure 6.15: Percentage Improvement of other CBEMs in ITSM over
VACBEM at Simulated Fully Cured Condition 208
Figure 6.16: A Comparison of ITSM Responses of CBEMs Manufactured at
Mixing and Compaction Temperatures of 32⁰C and 20⁰C
with 100 gyrations - Conditioned to Intermediate Life 212
Figure 6.17: A Comparison of ITSM Responses of CBEMs Manufactured at
Mixing and Compaction Temperatures of 32⁰C and 20⁰C
with 100 gyrations - Conditioned to Fully Cured 212
Figure 6.18: A Comparison of ITSM Responses of CBEMs Manufactured at
Mixing and Compaction Temperatures of 32⁰C and 20⁰C
with 200 gyrations - Conditioned to Intermediate Life 213
Figure 6.19: A Comparison of ITSM Responses of CBEMs Manufactured at
Mixing and Compaction Temperatures of 32⁰C and 20⁰C
with 200 gyrations - Conditioned to Fully Cured 213
Figure 6.20a: Protocol 1- ITSM Responses for the Severe Condition (ITSM
at 30⁰C after soaking for 24hrs at 20⁰C and 2hrs at 30⁰C) 218
Figure 6.20b: Protocol 2- ITSM Responses for the Severe Condition (ITSM
at 30⁰C after soaking for 24hrs at 30⁰C) 218
Figure 6.20c: Protocol 2- ITSM Responses for Recovery Path after Exposure
to the Severe Condition (ITSM at 20⁰C after soaking
for 24hrs at 30⁰C and 2hrs at 20⁰C) 218
Figure 6.21: Water Susceptibility of CBEMs at Intermediate Life Condition
Mixed and Compacted at 32⁰C, 100gyrations (Protocol 1) 220
Figure 6.22: Water Susceptibility of CBEMs at Intermediate Life Condition
Mixed and Compacted at 32⁰C, 200gyrations (Protocol 1) 220
Preface A STUDY ON THE DEVELOPMENT OF GUIDELINES FOR THE PRODUCTION OF BITUMEN
EMULSION STABILISED RAPS FOR ROADS IN THE TROPICS
xvi
Figure 6.23: Water Susceptibility of CBEMs at Fully Cured Condition Mixed
and Compacted at 32⁰C, 100gyrations (Protocol 1) 220
Figure 6.24: Water Susceptibility of CBEMs at Fully Cured Condition Mixed
and Compacted at 32⁰C, 200gyrations (Protocol 1) 221
Figure 6.25: Water Susceptibility of CBEMs at Intermediate Life Condition
Mixed and Compacted at 32⁰C, 100gyrations (Protocol 2) 221
Figure 6.26: Water Susceptibility of CBEMs at Intermediate Life Condition
Mixed and Compacted at 32⁰C, 200gyrations (Protocol 2) 221
Figure 6.27: Water Susceptibility of CBEMs at Fully Cured Condition Mixed
and Compacted at 32⁰C, 100gyrations (Protocol 2) 222
Figure 6.28: Water Susceptibility of CBEMs at Fully Cured Condition Mixed
and Compacted at 32⁰C, 200gyrations (Protocol 2) 222
Figure 6.29: Scatter Plot for Air Voids and ITSM @ 20⁰C of the CBEMs 225
Figure 6.30: Scatter Plot for the CBEMs showing the effect of Mixing and
Compaction temperatures on Air Voids and ITSM @ 20⁰C 225
Figure 6.31: Scatter Plot for the CBEMs showing the effect of Compactive
Effort on Air Voids and ITSM @ 20⁰C 226
Figure 6.32: Scatter Plot for the CBEMs showing the effect of Curing
Conditions on Air Voids and ITSM @ 20⁰C 226
Figure 6.33: Scatter Plot and Trend line Diagram for Air voids and ITSM
@ 20⁰C of CBEMs at Early Life (32⁰C, 200gyrations) 228
Figure 6.34: Scatter Plot for Air voids and ITSM @ 20⁰C of CBEMs at
Fully Cured Condition (32⁰C, 200gyrations) 228
Figure 6.35: Loss in ITSM at Early Life Condition due to a 1%
Rise in Air Void Content 230
Figure 6.36: Loss in ITSM at Intermediate Life Condition due to a 1%
Rise in Air Void Content 230
Figure 6.37: Loss in ITSM at Fully Cured Condition due to a 1%
Rise in Air Void Content 230
Figure 6.38: Fatigue Responses of CBEMs at Fully Cured Condition
Mixed and Compacted @ 32⁰C, Tested @ 20⁰C 234
Figure 6.39: Fatigue Responses of CBEMs at Fully Cured Condition
Mixed and Compacted @ 32⁰C, Tested @ 30⁰C 234
Figure 6.40: The Effect of Mixing and Compaction Temperature on
Cycles to Failure of CBEMs Tested at 30⁰C 239
Figure 6.41: The Effect of Mixing and Compaction Temperature on
Cycles to Failure of CBEMs Tested at 20⁰C 239
Figure 6.42: Temperature Susceptibility and Fatigue Responses of
CBEMs at 20⁰C 241
Figure 6.43: Temperature Susceptibility and Fatigue Responses of
CBEMs at 30⁰C 241
Figure 6.44: RLAT @40⁰C & 100kPa Stress for CBEMs at Early Life
Condition Mixed & Compacted @ 32⁰C & 200gyrations 243
Figure 6.45: RLAT @40⁰C & 100kPa Stress for CBEMs at Fully Cured
Condition Mixed & Compacted @ 32⁰C & 200gyrations 243
Figure 6.46: RLAT @40⁰C & 300kPa Stress for CBEMs at Early Life
Condition Mixed & Compacted @ 32⁰C & 200gyrations 244
Figure 6.47: RLAT @40⁰C & 300kPa Stress for CBEMs at Fully Cured
Condition Mixed & Compacted @ 32⁰C & 200gyrations 244
Preface A STUDY ON THE DEVELOPMENT OF GUIDELINES FOR THE PRODUCTION OF BITUMEN
EMULSION STABILISED RAPS FOR ROADS IN THE TROPICS
xvii
Figure 6.48: Rutting Indicator for CBEMs Conditioned to Early Life and
Tested at 100kPa and 40⁰C for RLAT 247
Figure 6.49: Rutting Indicator for CBEMs at Fully Cured Condition and
Tested at 100kPa and 40⁰C for RLAT 248
Figure 6.50: Rutting Indicator for CBEMs at Early Life Condition and
Tested at 300kPa and 40⁰C for RLAT 248
Figure 6.51: Rutting Indicator for CBEMs at Fully Cured Condition and
Tested at 300kPa and 40⁰C for RLAT 248
Figure 6.52: A Cold Recycled Cylindrical Core being tested in the
NAT using the VRLAT Mode 250
Figure 6.53: VRLAT @40⁰C, 300kPa Stress and 50kPa Confinement
Pressure for CBEMs at Early Life Mixed and
Compacted @ 32⁰C @ 200gyrations 251
Figure 6.54: VRLAT @40⁰C, 300kPa and 50kPa Confinement Pressure for
CBEMs at Fully Cured Condition Mixed and
Compacted @ 32⁰C @ 200gyrations 251
Figure 6.55: Rutting Indicator for CBEMs at Early Life Conditions Tested at
300kPa, 50kPa Confinement and 40⁰C for VRLAT 252
Figure 6.56: Rutting Indicator for CBEMs at Early Life and Fully Cured
Conditions Tested at 300kPa, 50kPa Confinement
and 40⁰C for VRLAT 252
Figure 6.57: Loading in Pavements under Traffic (Arnold, 2004) 255
Figure 6.58a: Bulk Stress (K- Θ) MR Model (Mishra and Tutumluer, 2007) 257
Figure 6.58b: Stress State for Resilient Modulus Testing
(Anochie-Boateng et al, 2009) 257
Figure 6.59a: Vertical Stress (kPa) for Ten Complete Cycles during Resilient
Modulus Test 257
Figure 6.59b: Corresponding Haversine Waveform for Ten Complete Cycles of
Vertical Strain (μstrain) in the Resilient Modulus Test 258
Figure 6.60: Typical Multi-Stage Test Screen Showing Vertical
Deformation of a Specimen 258
Figure 6.61: Resilient Modulus Response of VA CBEM 260
Figure 6.62: Resilient Modulus Response of 5dmm CBEM 261
Figure 6.63: Resilient Modulus Response of 10dmm CBEM 261
Figure 6.64: Resilient Modulus Response of 15dmm CBEM 262
Figure 6.65: Resilient Modulus Response of 20dmm CBEM 262
Figure 6.66: Resilient Modulus Response of CBEMs Tested at 20⁰C
for Simulated Early Life Condition 263
Figure 6.67: Resilient Modulus Response of CBEMs Tested at 30⁰C
for Simulated Early Life Condition 263
Figure 6.68: Resilient Modulus Response of CBEMs Tested at 40⁰C
for Simulated Early Life Condition 264
Figure 6.69: Resilient Modulus Response of CBEMs Tested at 20⁰C
for Simulated Fully Cured Condition 264
Figure 6.70: Resilient Modulus Response of CBEMs Tested at 30⁰C
for Simulated Fully Cured Condition 265
Figure 6.71: Resilient Modulus Response of CBEMs Tested at 40⁰C
for Simulated Fully Cured Condition 265
Figure 6.72: Loss or Gain in MR Tested at 20⁰C, 30⁰C & 40⁰C at Early
Life (EL) and Fully Cured (FC) Conditions due to a
Preface A STUDY ON THE DEVELOPMENT OF GUIDELINES FOR THE PRODUCTION OF BITUMEN
EMULSION STABILISED RAPS FOR ROADS IN THE TROPICS
xviii
1% Rise in Air Void Content 268
Figure 6.73: Loss or Gain in MR Tested at 20⁰C, 30⁰C & 40⁰C at Early
Life (EL) and Fully Cured (FC) Conditions due to
a Unit Rise in ITSM 268
Chapter 7
Figure 7.1: Hypothetical Road Pavement Structure Containing
CBEMs used for the Modelling 281
Figure 7.2: Resilient Modulus-Deviator stress Relationship for Four
Types of Subgrade (1 psi = 6.9 kPa) (Thompson
and Elliot in Huang, 1994, pg 109) 284
Figure 7.3: Vertical Stress Distribution through Pavement
Structure Case Number 9 using KENLAYER 287
Figure 7.4: Horizontal Stress Distribution through Pavement
Structure Case Number 9 using KENLAYER 287
Figure 7.5: Vertical Strain Distribution through Pavement
Structure Case Number 9 using KENLAYER 288
Figure 7.6: Horizontal Strain Distribution through Pavement
Structure Case Number 9 using KENLAYER 288
Figure 7.7: Vertical Stress Distribution through Pavement Structure
Case Number 6 using BISAR 3.0 and KENLAYER 290
Figure 7.8: Horizontal Stress Distribution through Pavement Structure
Case Number 6 using BISAR 3.0 and KENLAYER 290
Figure 7.9: Vertical Strain Distribution through Pavement Structure
Case Number 6 using BISAR 3.0 and KENLAYER 291
Figure 7.10: Horizontal Strain Distribution through Pavement Structure
Case Number 6 using BISAR 3.0 and KENLAYER 291
Figure 7.11: Vertical Stress Distribution through Pavement Structure
Case Number 6 using BISAR 3.0 (with calculated
modulus) & KENLAYER (@ 20⁰C) 293
Figure 7.12: Horizontal Stress Distribution through Pavement Structure
Case Number 6 using BISAR 3.0 (with calculated
modulus) & KENLAYER (@ 20⁰C) 294
Figure 7.13: Horizontal Strain Distribution through Pavement Structure
Case Number 6 using BISAR 3.0 (with calculated
modulus) & KENLAYER (@ 20⁰C) 294
Figure 7.15a: Vertical Strain Distribution through Pavement Structure
Case Number 6 using BISAR 3.0 (with calculated modulus)
and KENLAYER (@ 20⁰C) 295
Figure 7.15b: Designed Road Base Layer Thicknesses Using Horizontal Strains
at the Bottom of CBEM Layers to Determine Corresponding
Fatigue Lives to Critical Condition for Pavements with
Surfacing Thickness of 30mm HMA 297
Figure 7.15: Designed Road Base Layer Thicknesses Using Horizontal Strains
at the Bottom of CBEM Layers to Determine Corresponding
Fatigue Lives to Critical Condition for Pavements with
Surfacing Thickness of 50mm HMA 297
Figure 7.16: Designed Road Base Layer Thicknesses Using Horizontal Strains
at the Bottom of CBEM Layers to Determine Corresponding
Preface A STUDY ON THE DEVELOPMENT OF GUIDELINES FOR THE PRODUCTION OF BITUMEN
EMULSION STABILISED RAPS FOR ROADS IN THE TROPICS
xix
Fatigue Lives to Critical Condition for Pavements with
Surfacing Thickness of 75mm HMA 298
Figure 7.17: Designed Road Base Layer Thicknesses Using Horizontal Strains
at the Bottom of CBEM Layers to Determine Corresponding
Fatigue Lives to Critical Condition for Pavements with
Surfacing Thickness of 100mm HMA 298
Figure 7.18: Designed Road Base Layer Thicknesses Using Maximum
Horizontal Strains in the CBEM Layers to Determine
Corresponding Fatigue Lives to Critical Condition for
Pavements with Surfacing Thickness of 30mm HMA 299
Figure 7.19: Designed Road Base Layer Thicknesses Using Maximum
Horizontal Strains in the CBEM Layers to Determine
Corresponding Fatigue Lives to Critical Condition for
Pavements with Surfacing Thickness of 50mm HMA 299
Figure 7.20: Designed Road Base Layer Thicknesses Using Maximum
Horizontal Strains in the CBEM Layers to Determine
Corresponding Fatigue Lives to Critical Condition
for Pavements with Surfacing Thickness of 75mm HMA 300
Figure 7.21: Designed Road Base Layer Thicknesses Using Maximum
Horizontal Strains in the CBEM Layers to Determine
Corresponding Fatigue Lives to Critical Condition for
Pavements with Surfacing Thickness of 100mm HMA 300
Figure 7.22: Effect of Road Base Layer Thickness and Material Type
on Fatigue Lives to Critical Condition for Surfacing
Thickness of 50mm HMA 302
Figure 7.23: Effect of Road Base Layer Thickness and Material Type on
Fatigue Lives to Critical Condition for Surfacing Thickness
of 75mm HMA 302
Figure 7.24: Effect of Road Base Layer Thickness and Material Type on
Fatigue Lives to Critical Condition for Surfacing Thickness
of 30mm HMA 303
Figure 7.25: Effect of Road Base Layer Thickness and Material Type on
Permanent Deformation to Critical Condition on top of
Subgrade for Surfacing Thickness of 50mm HMA 305
Figure 7.26: Effect of Road Base Layer Thickness and Material Type on
Permanent Deformation to Critical Condition on top of
Subgrade for Surfacing Thickness of 75mm HMA 305
Figure 7.27: Effect of Road Base Layer Thickness and Material Type on
Permanent Deformation to Critical Condition on top of
Subgrade for Surfacing Thickness of 100mm HMA 306
Chapter 8
Figure 8.1: Flow Chart for Cold Recycled Bituminous Emulsion Mix Design 317
Preface A STUDY ON THE DEVELOPMENT OF GUIDELINES FOR THE PRODUCTION OF BITUMEN
EMULSION STABILISED RAPS FOR ROADS IN THE TROPICS
xx
List of Tables
Chapter 2
Table 2.1: Requirements of Bituminous Mix Design (Das, 2005) 11
Table 2.2: Various Mix Design Approaches (RILEM 17, 1998) 11
Table 2.3: Mix Design Approaches Adopted in Various
Specifications/Organisations (RILEM 17, 1998) 12
Table 2.4: Composition of Various Petroleum Crude Oils
(Corbett and Urban, 2005) 17
Table 2.5: Highway Materials, Relevant Tests and Standards for Quality
Control and Performance Monitoring 19
Table 2.6: Road Network of Nigeria broken down to Federal,
State and Local/Rural (Idowu, 2000) 26
Table 2.7: Subregional Distribution of the Road Network and Share of
Paved Road in Africa (UNECA, 2009) 26
Table 2.8: Guidelines for the Preliminary Selection of Candidate
Recycling or Reclamation Methods for Rehabilitation
of Asphalt Pavements (ARRA, 2001) 37
Table 2.9: Typical Uses of Bitumen Emulsion (Asphalt Institute and
Asphalt Emulsion Manufacturers Association, 1997) 44
Table 2.10: Testing and Specification for Bitumen Emulsions and
Emulsion Residues (James, 2006) 51
Chapter 3
Table 3.1: Factors which Affect Chemical, Rheological and Adhesion
Characteristics of Bitumen (Traxler, 1963) 56
Table 3.2: Chemical Functional Groups Formed in Bitumens
During Oxidative Ageing (Petersen et al, 1974) 59
Table 3.3: Bitumen Ageing Methods (Airey, 2003) 62
Table 3.4: Bituminous Mixture Ageing Methods (Airey, 2003) 63
Table 3.5: Aggregates for Dense-Graded Emulsion Mixtures
(Asphalt Institute and Asphalt Emulsion
Manufacturers Association, 1997) 71
Table 3.6: Surface Area Factor (SAF) (Thanaya, 2007) 74
Table 3.7: Calculation of Aggregate Surface Area (ASA) (Thanaya, 2007) 74
Table 3.8: Some Curing Methods for Foamed Bitumen (Jenkins, 2000) 77
Table 3.9: Summary of Laboratory Compaction Techniques used
for Foamed Mix Design (Jenkins, 2000) 82
Table 3.10: Properties of the CBEMS compared to Hot Mixes
(Thanaya, 2007) 86
Table 3.11a: The Beneficial Effect of Adding Cement to CBEMs
(Thanaya, 2007) 86
Table 3.11b: Beneficial Effect of Adding Cement to CBEMs (Thanaya, 2007) 86
Preface A STUDY ON THE DEVELOPMENT OF GUIDELINES FOR THE PRODUCTION OF BITUMEN
EMULSION STABILISED RAPS FOR ROADS IN THE TROPICS
xxi
Chapter 4
Table 4.1: Physical Properties, Chemical Composition and Mechanical
Properties of Virgin and Recovered Binders at Different
Ageing Temperatures and Time 105
Table 4.2: Physico-Chemical and Rheological Properties of Virgin,
RTFO and PAV Aged Binders 106
Chapter 5
Table 5.1: Percentage Loss in Mass of Cured Bitumen Emulsion
at 30±2⁰C over 72Hrs 131
Table 5.2: Gradation Properties of Some of the Openings used
Compared to that of the Maximum Density 137
Table 5.3: Gradation Properties of Materials Produced using 18mm
Opening on the Jaw Crusher 137
Table 5.4: Gradation Properties of the Designed Mix, RAP, 5mm
Dust, Mineral Filler, Maximum Density, and
ORN 19&31 for 20mm DBM 138
Table 5.5: Combination of RAP, 5m Dust and Mineral Filler to Produce the
Design Gradation 138
Table 5.6: Particle Density and Water Absorption for a Mixture of 20dmm
Pen Residual Binder RAP (65%), 5mm Dust (30%), and
Mineral Filler (5%) 141
Table 5.7: Particle Density and Water Absorption for a mixture of Virgin
Aggregates (95%) and Mineral Filler (5%) 141
Table 5.8a: Bulk Density of Compacted Materials as Read off the Gyratory
Compactor 148
Table 5.8b: Dry Density of Compacted Materials as Read off the Gyratory
Compactor 148
Table 5.9: Bulk Densities of Specimens with Varying TFC after
Curing at 40⁰C over 72Hrs 151
Table 5.10: Stiffness and Strength Values of Cold Bituminous
Emulsion Mixtures with Varying TFC 151
Table 5.11: Dry and Wet Strength/Stiffness Ratio Values for CBEMs with
Varying TFC 151
Table 5.12: Bulk Densities of CBEMs with varying Emulsion Content
after Curing at 40⁰C over 72Hrs 154
Table 5.13: Stiffness and Strength Values of CBEMs with
Varying Emulsion Content 154
Table 5.14: Dry and Wet Strength/Stiffness Ratio Values for CBEMs
with Varying Emulsion Content 154
Table 5.15a: Maximum Density for the RAP CBEMs 157
Table 5.15b: Maximum Density for the Virgin Aggregate CBEMs 157
Table 5.16: The Effect of Mixing Time on the Stiffness Modulus of CBEMs 159
Table 5.17: Effect of Filler Type, Compaction and Mixing Temperature on
Stiffness Properties of CBEMs 161
Table 5.18: Properties of CBEMs with Similar Compactive Effort 164
Table 5.19: Properties of CBEMs with Similar Void Contents 166
Table 5.20: Properties of CBEMs with Varying Void Contents 168
Preface A STUDY ON THE DEVELOPMENT OF GUIDELINES FOR THE PRODUCTION OF BITUMEN
EMULSION STABILISED RAPS FOR ROADS IN THE TROPICS
xxii
Table 5.21: Effect of Curing Protocol (Limestone Filler used) 169
Table 5.22: Properties of Recovered Binders under
Different Curing Conditions 171
Table 5.23: Permanent Deformation Properties of CBEMs 172
Table 5.24: Fatigue Properties of CBEMs 174
Chapter 6
Table 6.1: Step by Step Approach to CBEM Specimens Preparation 179
Table 6.2: One-Sample Kolmogorov-Smirnov (Normality) Test for Air
Voids at Simulated Post Compaction Air Voids 189
Table 6.3: One-Sample Kolmogorov-Smirnov (Normality) Test for Air
Voids at Simulated Early Life Condition of CBEMs 189
Figure 6.4: One-Sample Kolmogorov-Smirnov (Normality) Test for Air
Voids at Intermediate Life Condition of CBEMs 190
Table 6.5: Moisture Contents of CBEMs at Different Curing Conditions 193
Table 6.6: One-Sample Kolmogorov-Smirnov (Normality) Test for Air
Voids at Fully Cured Condition of CBEMs 195
Table 6.7: Summary of ITSM Testing Protocol (BS DD 213: 1993) 198
Table 6.8: One-Sample Kolmogorov-Smirnov (Normality) Test for ITSM
of CBEMs at Simulated Early Life, Intermediate Life and
Fully Cured Conditions 200
Table 6.9: Statistics for the Effect of Curing on ITSM (20⁰C) of CBEMs
Manufactured at 32⁰C/200gyrations 201
Table 6.10: One-Sample Kolmogorov-Smirnov (Normality) Test for
ITSM at Simulated Early Life Condition of CBEMs 202
Table 6.11: Percentage Improvements in ITSM of other CBEMs over the
VACBEM at Simulated Early Life Condition 202
Table 6.12: One-Sample Kolmogorov-Smirnov (Normality) Test for ITSM
at Simulated Intermediate Life Condition of CBEMs 204
Table 6.13: Percentage Improvements in ITSM of other CBEMs over the
VACBEM at Simulated Intermediate Life Condition 205
Table 6.14: One-Sample Kolmogorov-Smirnov (Normality) Test for ITSM
at Simulated Fully Cured Condition of CBEMs 207
Table 6.15: Percentage Improvements in ITSM of other CBEMs over the
VACBEM at Simulated Intermediate Life Condition 208
Table 6.16: Summary of ITSM Results for Temperature
Susceptibility of CBEMs 211
Table 6.17: Percentage Loss in ITSM of CBEMs due to
Temperature Increase 214
Table 6.18a: ITSM Results of Water Susceptibility of CBEMs for Protocol 1 217
Table 6.18b: ITSM Results of Water Susceptibility of CBEMs for Protocol 2 217
Table 6.19a: Results of Percentage Loss in ITSM due to Water
Susceptibility for Protocol 1 219
Table 6.19b: Results of Percentage Loss in ITSM due to Water
Susceptibility for Protocol 2 219
Table 6.20: Results of Regression Analysis of CBEMs for
ITSM versus Air voids 228
Table 6.21: Fatigue Responses of CBEMs at Fully Cured Condition 233
Table 6.22: Fatigue Life of CBEMs at Various Microstrains 236
Preface A STUDY ON THE DEVELOPMENT OF GUIDELINES FOR THE PRODUCTION OF BITUMEN
EMULSION STABILISED RAPS FOR ROADS IN THE TROPICS
xxiii
Table 6.23: Microstrain of CBEMs at Various Fatigue Lives 237
Table 6.24: Fatigue Life of CBEMs at Various Strain Levels 241
Table 6.25: Rutting Indicator for CBEMs at Early Life and Fully
Cured Conditions Tested at 40⁰C RLAT 247
Table 6.26: Rutting Indicator for CBEMs at Early Life and Fully Cured
Conditions Tested at 300kPa, 50kPa Confinement
and 40⁰C for VRLAT 252
Table 6.27: Statistics for the Resilient Modulus (MR) of CBEMs 260
Table 6.28: One-Sample Kolmogorov-Smirnov (Normality) Test for MR
and Corresponding ITSM and Air Voids at Simulated Early
Life and Fully Cured Conditions of CBEMs 267
Table 6.29: Results of Regression Analysis of CBEMs for MR vs. Air
voids and MR vs. ITSM 267
Chapter 7
Table 7.1: Pavement Layer Thicknesses used for the 16 cases Modelled 277
Table 7.2: K1, K2 and R2 Values from Resilient Modulus Test of CBEMs 283
Table 7.3: Pavement Layer Material Properties 283
Table 7.4: Calculated Modulus Values for each CBEM Sub-Layer
in KENLAYER (@ 20⁰C) 293
Chapter 8
Table 8.1: Step by Step Approach to Cold Recycled Bituminous
Emulsion Mix Specimens Preparation 318
Chapter 1 Introduction
1
1 Introduction
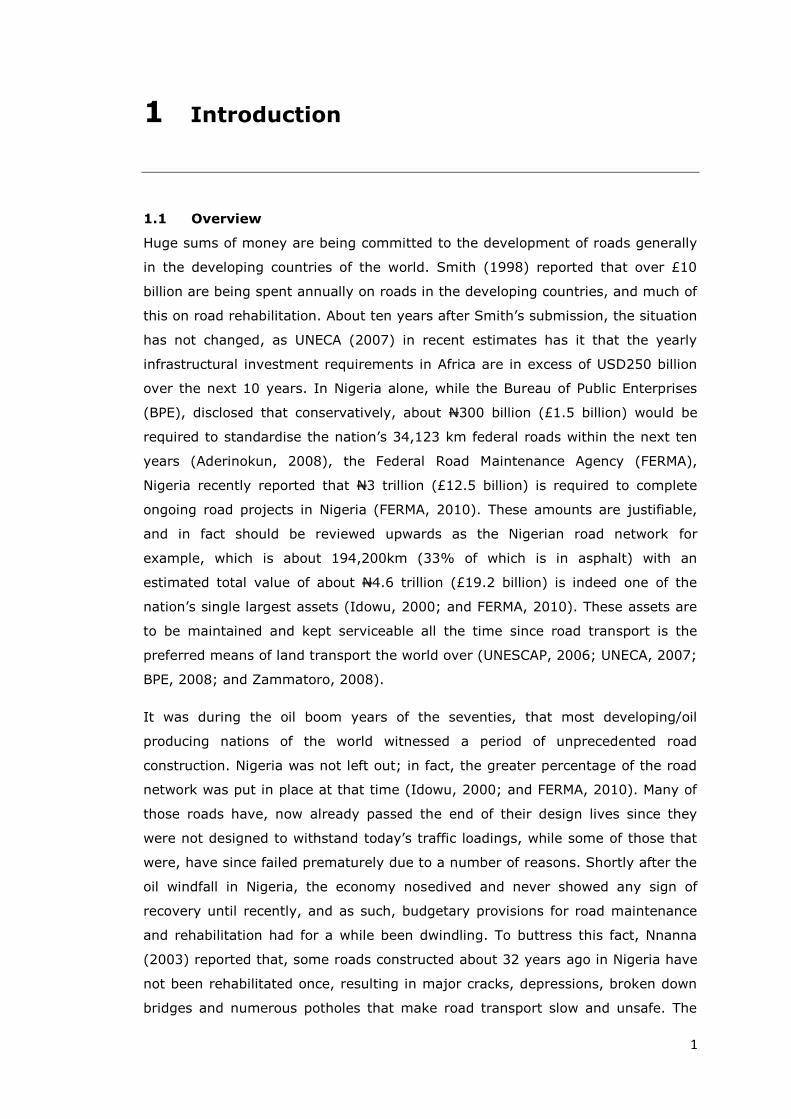
1.1 Overview
Huge sums of money are being committed to the development of roads generally
in the developing countries of the world. Smith (1998) reported that over £10
billion are being spent annually on roads in the developing countries, and much of
this on road rehabilitation. About ten years after Smith‟s submission, the situation
has not changed, as UNECA (2007) in recent estimates has it that the yearly
infrastructural investment requirements in Africa are in excess of USD250 billion
over the next 10 years. In Nigeria alone, while the Bureau of Public Enterprises
(BPE), disclosed that conservatively, about N300 billion (£1.5 billion) would be
required to standardise the nation‟s 34,123 km federal roads within the next ten
years (Aderinokun, 2008), the Federal Road Maintenance Agency (FERMA),
Nigeria recently reported that N3 trillion (£12.5 billion) is required to complete
ongoing road projects in Nigeria (FERMA, 2010). These amounts are justifiable,
and in fact should be reviewed upwards as the Nigerian road network for
example, which is about 194,200km (33% of which is in asphalt) with an
estimated total value of about N4.6 trillion (£19.2 billion) is indeed one of the
nation‟s single largest assets (Idowu, 2000; and FERMA, 2010). These assets are
to be maintained and kept serviceable all the time since road transport is the
preferred means of land transport the world over (UNESCAP, 2006; UNECA, 2007;
BPE, 2008; and Zammatoro, 2008).
It was during the oil boom years of the seventies, that most developing/oil
producing nations of the world witnessed a period of unprecedented road
construction. Nigeria was not left out; in fact, the greater percentage of the road
network was put in place at that time (Idowu, 2000; and FERMA, 2010). Many of
those roads have, now already passed the end of their design lives since they
were not designed to withstand today‟s traffic loadings, while some of those that
were, have since failed prematurely due to a number of reasons. Shortly after the
oil windfall in Nigeria, the economy nosedived and never showed any sign of
recovery until recently, and as such, budgetary provisions for road maintenance
and rehabilitation had for a while been dwindling. To buttress this fact, Nnanna
(2003) reported that, some roads constructed about 32 years ago in Nigeria have
not been rehabilitated once, resulting in major cracks, depressions, broken down
bridges and numerous potholes that make road transport slow and unsafe. The
Chapter 1 Introduction
2
state of Nigerian roads has remained poor ever since despite the desperate efforts
being made of late to revamp the road network. The roads are deteriorating faster
than ever presumed (FERMA, 2007), since the methods of rehabilitation and
strengthening of the road network currently being employed are the old methods
of total reconstruction and overlays which are very expensive, time consuming
and non eco-efficient. Of course this is understandable because the available fund
for such exercises is less than adequate for fixing the roads (Nnanna, 2003).
UNECA (2007) recently confirmed this assertion that costs for infrastructural
renewal and expansion of roads clearly exceeds the capacity of African countries!
In a bid to salvage the situation of the road network in Nigeria, BPE (2008)
reported that the Government had initiated a programme aimed at reforming the
road sector, which would thus facilitate its total recovery from its poor state. It is
heart warming that, among other things, a reviewing and updating of the Federal
Ministry of Works standards with emphasis on the Highway Manual Part 1 Design
FMW 1973 will be carried out. However, this exercise might not yield significant
results, unless provisions are made in the new standard, and also backed with
legislation which require the use of innovative methods and alternative materials
for road construction and rehabilitation that promote sustainable development
which the old standard is bereft of. Good examples of such sustainable methods
and materials are cold recycling, reclaimed asphalt pavement (RAP) and bitumen
emulsion respectively. It is now a general belief in most developed countries that
recycling assists in stretching road funds since old materials are reused and less
energy is consumed in the process (PIARC, 2003; and ARRA, 2001). The
economic, safety and environmental benefits that these tools (materials and
methods) offer would greatly assist in strengthening/overhauling and putting the
entire road network into a serviceable condition within a reasonable time if
embraced. More importantly, the recent increases in crude oil prices to the extent
that a barrel of crude oil, the major source of bitumens (Asphalt Institute and
Asphalt Emulsion Manufacturers Association, 1997) and also an essential
ingredient for making flexible pavements, reached an all time high of USD146.69
(Gorondi, 2008), should make these materials and methods highly attractive.
Even more importantly, total expenditure compared to conventional practices for
road rehabilitation could be about 40-60% less when cold recycling of roads is
adopted (Hakim and Fergusson, 2010; Thanaya, 2003; FHWA, 1997).
On this note, a study aimed at developing guidelines for the production of
bitumen emulsion stabilised RAPs for roads in the developing countries of the
world located in hot tropical belts will not be out of place.
Chapter 1 Introduction
3
1.2 Statement of Problem
In the developed countries of the world of which most have temperate climates,
emulsified bitumen had variously been used in times past as the binding medium
for surface treatment works in which fresh aggregates were used (PIARC, 2008;
Thanaya, 2003; Ibrahim, 1998; Asphalt Institute and Asphalt Emulsion
Manufacturers Association, 1997; and Needham, 1996). It had also been used on
several occasions in cold recycling; most especially full depth reclamation works
(ARRA, 2001; and PIARC, 2003). ARRA (2001) also reported further that, in the
developed countries, cold asphalt recycling and the use of RAP date back to the
1900s. Results from field trials of such cold mixes under these climates have been
reported to be highly impressive and encouraging.
Notwithstanding, these materials and methods for road rehabilitation are still
being met with a cold attitude by road managers/developers in some of these
developed countries, notably UK, Italy (Brown and Needham, 2000; and Bocci et
al, 2002) among others, mainly due to some inherent problems associated with
the qualities of the pavements produced in the process which cause them to be
regarded as „inferior‟ to conventional Hot Mix Asphalt Pavements (Needham,
1996). In fact, Carswell (2004), in a review, reported that some rate such
materials and methods as „Asphalt 2nd Class‟.
On the other hand, developing countries of the world most especially those
located in Africa (though with the exemption of South Africa (PIARC, 2008,
Jenkins, 2000)), such as Nigeria, Ghana, Benin, Burkina Faso, Republic of Congo,
among others are yet to realize the advantages of these sustainable materials,
tools and techniques for road restoration (Eyo, 2004). The climate (hot) of these
parts of the world promises to be an enhancing factor for such materials and
methods over what obtains in other places, as most researchers are of the opinion
that the presence of water in cold mixes is the main inhibitive factor to the
development of early life strength in pavements made from such cold mixes,
while roads are almost always desired by road engineers and users alike to be
available for use immediately after construction.
PIARC (2008) in a recent survey involving 15 countries from five continents, i.e.,
Africa (3), Asia (2), Australia (1), Europe (8) and North America (1), identified
some of the factors which are barriers to the uptake of recycling in the road
construction industry as:
1. Lack of client awareness of the benefits and performance of recycling,
2. Lack of necessary regulation and legislation to encourage recycling,
3. Lack of appropriate standards and specifications,
Chapter 1 Introduction
4
4. Existing test methods which are unsuitable for alternative materials,
5. Lack of appropriate quality controls (concerns over the reliability and
quality control of new methods and alternative materials),
6. The economics of recycling (the perception that new methods and
materials will be more expensive than traditional ones),
7. Conditions of contract (conditions of contract which do not encourage
innovation or flexibility),
8. Supply and demand (the difficulty of balancing supply and demand for
alternative materials),
9. Planning (difficulty getting planning permission for recycling centres in or
near urban areas),
10. Environmental concerns (concerns about pollution of the environment
through leachate or dust generation).
While issues 1, 2, 6, 7, 8, 9 and 10 above are essentially non-technical, 3, 4 and
5 are technical, and must be determined through research and experience in
countries where they are lacking. This research work will endeavour to address
some of the problems associated with the identified technical problems i.e. factors
3 and 4 mentioned above, which have been hindering cold mixes from being fully
embraced in developing countries. The main hindrance to the implementation of
cold recycling and pavement recycling generally in such countries is lack of
guidelines and standards that would facilitate a smooth implementation.
It is hoped that guidelines for the production of cold mixes for roads in such
countries should succeed this present study. Many researchers from works carried
out mainly in the developed countries of the world have reported the major
problems with cold mix as, low and slow development of stiffness of mix. These
problems have been associated with lack of proper understanding of the
interaction between the aged binder in the reclaimed asphalt pavement and the
recycling agent applied during recycling and also slow curing of mix and high
voids contents (Thanaya, 2007; Thanaya, 2003; Ibrahim, 1998; and Needham,
1996) just to mention a few. Some of these problems, which are directly or
indirectly tied to the high water content of the mix and binder properties, could
potentially be alleviated by virtue of the prevailing climatic conditions (hot
climate) in most of these developing countries. Also, the advantage that easier
logistics are involved in the delivery of cold mix (Needham, 1996) compared to
hot mix makes it more appropriate for road building in such developing countries
where most areas are to say the least still relatively remote.
Thus, this study will simulate what should be expected in terms of the
performance of pavements produced from cold mixes of bitumen emulsion
stabilized reclaimed asphalt pavement (RAP) with a focus on hot climates. It is
envisaged that at the end of this research work, the results and findings obtained
Chapter 1 Introduction
5
should facilitate the development of guidelines for the production of bitumen
emulsion stabilised RAPs for roads in the hot tropical belt of the world, paralleling
those developed in the UK that provide a framework which encourages both
innovation and the use of recycled materials (PIARC, 2008).
1.3 Aims and Objectives
The primary objective of this research is to examine the performance of bitumen
emulsion stabilised reclaimed asphalt pavement (RAP), with the expectation of
establishing a practical procedure for the use of reclaimed asphalt pavement
(RAP) in road base construction in Nigeria and other hot tropical climates of the
world. The specific task will basically involve a comprehensive laboratory
investigation. Thus in order to meet the primary objective of this research, the
following tasks will be carried out:
1. A literature review/search on asphalt pavement recycling followed by
recommendations on the most appropriate method for the scenario being
considered i.e. hot climate and developing countries;
2. Develop an efficient and effective ageing protocol for bituminous mixtures
that will facilitate easy mass production of RAPs which replicate in the
laboratory both in condition and quality what obtains in a severely aged
asphalt pavement typical of developing countries located in the hot tropical
belts of the worlds;
3. Implement a cold mix design for mixes made from severely aged RAPs,
and bitumen emulsion, suitable for road pavements in developing countries
with hot climates;
4. Investigate the resistance of the developed cold recycled mix to fatigue
cracking, permanent deformation, and durability related defects through
modified tests in the Nottingham Asphalt Tester (NAT) both in the
unconfined and confined testing modes, that simulate conditions that
pavements are normally exposed to in developing countries with hot
climates;
5. By involving RAPs with different stages of ageing severity in 3 and 4
above, establish whether the residual bitumen in severely aged RAPs are in
any way contributing to the performance of cold recycled mixtures at all;
6. Conduct a pavement design (structural design) integrating the results
obtained from performance tests in 3-5 for the purposes of predicting
performance in service over time for pavements incorporating cold
recycled mixture.
The results obtained during the study would be used to develop guidelines for the
production of cold mixes suitable for hot climates. Cut-off points and the
categorisation of RAP qualities that suits the construction of surfacing and base
courses in hot climates would be defined. Accomplishing these tasks should
enable meeting the primary objective of this research work as they should
Chapter 1 Introduction
6
ultimately assist in the Development of Guidelines for the Production of Bitumen
Emulsion Stabilised RAPs for Roads in the Tropics.
1.7 Scope of Study
The present study is limited to cold recycling ex situ with RAPs made from granite
and bitumen emulsion (cationic bitumen emulsion) as recycling agent, while cold
mixtures purely made from virgin aggregates and binder will be used as a control
for comparative analysis of results. Granite will be used as the aggregates
because it is the material that is normally used for road building in Nigeria- which
is the case study. For this reason and compatibility, a cationic type of emulsion
will be used for the research work. The RAP used in the study has been produced
in the laboratory. This should mimic/simulate what is obtained in a typical hot
tropical climate RAP and to an extent also assist in bringing to the barest
minimum the variations that could occur as a result of sourcing RAP materials
from industry. Samples will be tested under conditions characteristically typical of
hot (tropical) climates. The proposed investigative activities will essentially be
limited to the laboratory.
The Asphalt Institute- MS 19, the Asphalt Recycling and Reclaiming Association
Basic Asphalt Recycling Manual, the World Road Association (PIARC) Pavement
Recycling Guidelines and relevant Transport Research Laboratory documents for
hot climates, will all be used as guides for the cold mix designs that will be used
in the research work.
Since the major defects that are prevalent on the Nigerian road network are due
to fatigue and permanent deformation, the tests that will be conducted during this
research work to examine the performance of the cold mixes will be the relevant
tests in the NAT. Similarly, a test that partly addresses durability i.e. water
susceptibility will be conducted.
1.8 Justification and Relevance of Study
As will be discovered in succeeding chapters of this thesis, much has been done in
the developed countries of the world, of which most have temperate climates, to
ascertain the performance of cold bituminous emulsion mixes made from virgin
materials. Similarly, though on a lower scale, the use of reclaimed asphalt
pavement (RAP) under such circumstances has also received attention. Some of
these countries have since developed guidelines for the production of cold mixes.
Chapter 1 Introduction
7
Results from field trials of such cold mixes under such climates have been
reported to be highly impressive and encouraging, though, inherent problems
such as low early life strength and high porosity which are related to high water
content of such cold mixes, are still to be addressed.
However, little or nothing has been done to ascertain the performance of such
cold mixes or cold recycling of asphalt pavements in developing countries with hot
tropical climates. Ascertaining the performances of these mixes will, among other
things, assist in the integration of such sustainable construction methods and
materials into road building practices in the developing countries, where available
funds for road building are increasingly inadequate to meet demand. Apart from
assisting in stretching funds available for roads, they have generally been
acclaimed to be both energy efficient and eco-friendly when used for road
construction or upgrading.
This current work is thus an exercise tailored towards filling the gap in knowledge
in respect of this area of need which has received little or no attention. Laboratory
investigations which simulate/predict what should be expected in terms of the
performance of pavements produced from cold mixes of bitumen emulsion
stabilized RAP in hot climates will be conducted. More importantly, the goal is
that, at the end of this research work, findings will culminate in the development
of guidelines for the production of bitumen emulsion stabilised RAPs suitable for
roads in hot tropical climates of the world.
1.9 Thesis Organisation
There are nine chapters in all in this Thesis with this present Chapter being the
1st. This Chapter opened with an overview in which background information for
this study was given. This was followed by a statement of the problem and
subsequently by the aims and objectives of the research work. Among other
important things, a justification was given for the conduct of the research work.
Chapter Two is basically a literature review that discusses pavement engineering
and current practices with a special focus on Nigeria. The chapter begins similarly
with an overview and then followed by a discussion on common pavement design
methods and the current practice in Nigeria. An effort was similarly made to
identify materials being used for roads in Nigeria, and common pavement defects
and their causes. Road restoration practices were also discussed. Among other
important things, road recycling is introduced as a sustainable road restoration
practice, and bitumen emulsion is properly elaborated on.
Chapter 1 Introduction
8
Chapter Three similarly is a literature review but now focused on cold mixes.
The chapter opens by similarly giving an overview information which leads to an
explanation of the process and causes of ageing in bituminous material. Methods
of laboratory ageing of bituminous materials are also reviewed. Some of the other
important issues discussed are directly related to the general performance of cold
mixtures.
Chapter Four essentially reports the results of the procedure used for laboratory
ageing of bituminous mixtures that was developed in this work.
Chapter Five discusses cold mix design as carried out in this study. Results of
the preliminary investigations are reported in the chapter.
Chapter Six details the results of the performance of the cold mixed bitumen
emulsion mixtures after examining the materials using tests such as Indirect
Tensile Stiffness Modulus, fatigue (stress controlled) etc.
In Chapter Seven, the results of the pavement design (structural design) are
reported.
Chapter Eight lists the recommended guidelines based on the results reported
earlier in Chapters 4, 5 and 6. This is done with due regard to the experiences of
other researchers.
The last Chapter of this thesis is the 9th which details the conclusions and
recommendations made based on the entire study.
Chapter 2 A Review on Flexible Pavement Engineering and Current Practices
9
2 A Review on Flexible Pavement
Engineering and Current Practices
2.1 Overview
Ellis (1979) defined highway pavement engineering as, the process of designing,
constructing, and maintaining highway pavements in order to provide a desired
level of service for traffic. Fwa (2003) gave a clearer picture in which he stated
that, pavements are designed and constructed to provide durable all-weather
travelling surfaces for safe and speedy movement of people and goods with an
acceptable level of comfort to users. He further opined that these functional
requirements of pavements are achieved through careful considerations in the
following aspects during the design and construction phases: (a) selection of
pavement type, (b) selection of materials to be used for various pavement layers
and treatment of subgrade soils, (c) structural thickness design for pavement
layers, (d) subsurface drainage design for the pavement system, (e) surface
drainage and geometric design, and (f) ridability (capable of being ridden over) of
the pavement surface. However, the two major considerations in the structural
design of highway and airport pavements are material design and thickness
design.
This chapter essentially reviews issues that impinge on flexible pavement
engineering as it relates to both developed and developing countries. Ellis (1979)
in his work reported that the important differences between pavement
engineering in developing countries and industrialised countries are the greater
variability of construction materials, quality of construction, and the larger
fluctuations in the volume and weight of road traffic that are typically encountered
in developing countries. Meanwhile, current practices in developing countries
compared to the developed ones for road pavement
restoration/rehabilitation/strengthening, and the need to integrate alternative
methods and materials for pavement engineering among them have been
discussed.
2.2 Common Flexible Pavement Design Methods
It is known generally that civil engineering structures are designed to, be safe,
aesthetically appealing, function well and be economical. In a broader sense, Haas
Chapter 2 A Review on Flexible Pavement Engineering and Current Practices
10
et al (1994) listed the basic objectives of a pavement design process as:
1. Maximum economy, safety, and serviceability over the design
period,
2. Maximum or adequate load-carrying capacity in terms of load
magnitude and repetitions,
3. Minimum or limited deterioration over the design period,
4. Minimum or limited noise or air pollution during construction,
5. Minimum or limited disruption of adjoining land use,
6. Maximum or good aesthetics.
Das (2005) summarised the evolving trend in the basic objectives of a mix design
for flexible pavements in Table 2.1. Mamlouk (2006) in his work stated that
many methods have been advanced for the design of flexible pavements. These
methods have been described to range from very simple to highly sophisticated in
nature. Pavement design methods can be grouped into four distinct approaches
namely:
1. Methods based on experience (old, based on previous experience);
2. Methods based on soil formula or simple strength tests (old as well,
and generally assumes that pavement is supported by the subgrade
and that all other layers are required for maintaining smoothness
and control of dust);
3. Methods based on statistical evaluation of pavement performance
(empirically generated and thus limited to the conditions under
which they were generated) and;
4. Methods based on structural analysis of layered systems (most
fundamental approach as basic material responses such as
stresses, strains and deformations are considered. Though this
method is reliable and accurate most of the time, it has the
disadvantage of requiring extensive testing and computations).
In an earlier work, RILEM 17 (1998) categorised all the available approaches as
shown in Table 2.2. Out of these, many countries have adopted approaches which
have evolved through individual experiences. Some are highlighted in Table 2.3.
However, recently, PIARC (2008) and Das (2005) reported that trends have since
started tilting towards performance related and performance based approaches. It
is worth noting that most or all of these methods are specifically meant for hot
mixtures (HMA). Cold mixtures have received attention too though not as much
as HMA. Most cold mix design methods are similar to those for HMA with no
universally accepted method or procedure. Examples of guidelines already in use
for cold mix design are, Basic Asphalt Recycling Manual (ARRA, 2001), TG2
(Asphalt Academy, 2009), Wirtgen Cold Recycling Manual (Wirtgen, 2004), MS-14
and MS-19 (Asphalt Institute, 1989 and 1997). These are all based on Hveem and
Marshall methods.

Chapter 2 A Review on Flexible Pavement Engineering and Current Practices
11
Table 2.1: Requirements of Bituminous Mix Design (Das, 2005)
Table 2.2: Various Mix Design Approaches (RILEM 17, 1998)
Mix Design
Method
Description
Recipe
method
Recipe based on experience of traditional mixes of known
composition. This is an experience based approach, which has
shown good performance over a long period of time, and under
given site, traffic and weather conditions.
Empirical
mix design
method
In empirical mix design methods, optimization of several variables
is done by mechanical testing, taking into account some
specifications as limits which evolved through prior experience.
Variables considered in this approach may not be used as direct
measures of performance.
Analytical
method
The analytical method does not consider preparation of any
physical specimen. Composition is determined exclusively through
analytical computations.
Volumetric
method
In the volumetric method, proportional volume of air voids, binder
and aggregates are analyzed in a mixture, which is compacted in
the laboratory by some procedure close to the field compaction
process.
Performance
related
approach
In performance related mix design, the specimens that meet
volumetric criteria are compacted and tested with simulation
and/or fundamental tests to estimate properties that are related to
pavement performance.
Performance
based
approach
A performance based approach is based on the performance of the
complete system. Laboratory instrumentation tends to simplify the
situation, yet it is indeed difficult to simulate field conditions. The
Superpave mix design recommends use of the Superpave shear
tester, and the indirect tensile tester for evaluation in the
laboratory of the bituminous mix. These tests are basically
accelerated performance tests of bituminous mixes.
Past Present
Stability
Durability
Economy
Stiffness
Permanent Deformation
Fatigue
Temperature susceptibility
Low temperature cracking
Moisture susceptibility
Freeze-thaw
Permeability
Economical
Environment friendly
Workability
Economy
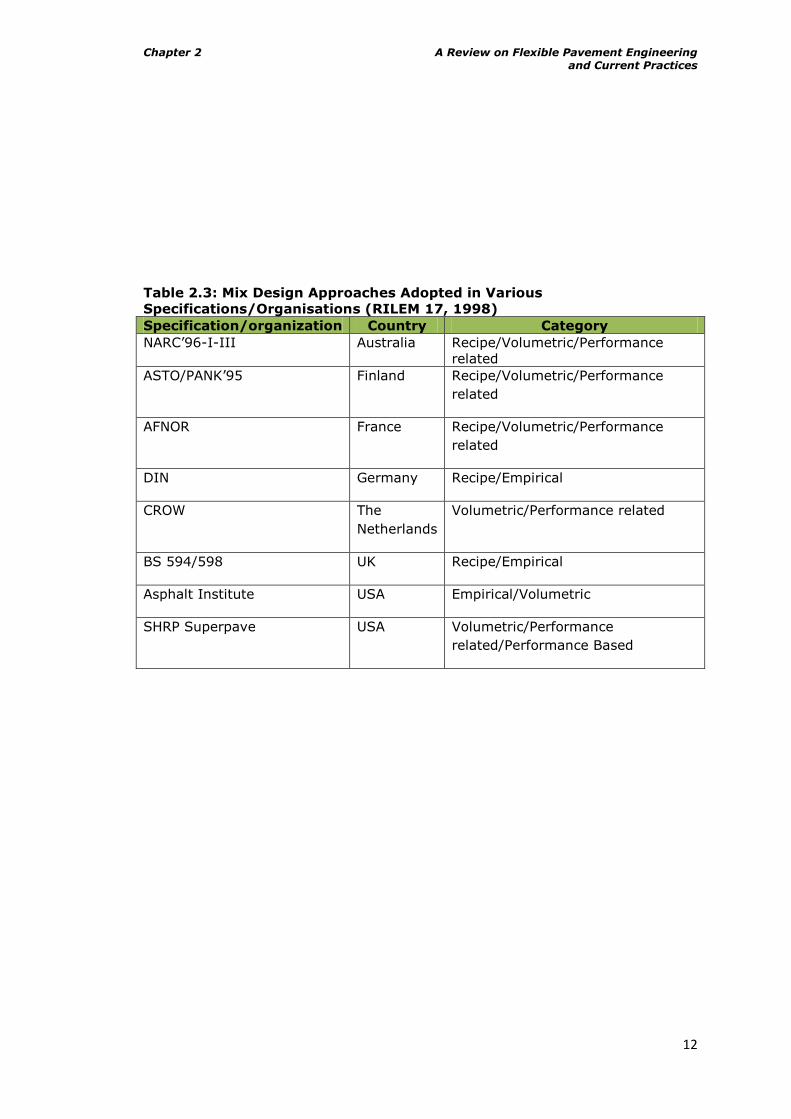
Chapter 2 A Review on Flexible Pavement Engineering and Current Practices
12
Table 2.3: Mix Design Approaches Adopted in Various
Specifications/Organisations (RILEM 17, 1998)
Specification/organization Country Category
NARC‟96-I-III Australia Recipe/Volumetric/Performance
related
ASTO/PANK‟95 Finland Recipe/Volumetric/Performance
related
AFNOR France Recipe/Volumetric/Performance
related
DIN Germany Recipe/Empirical
CROW The
Netherlands
Volumetric/Performance related
BS 594/598 UK Recipe/Empirical
Asphalt Institute USA Empirical/Volumetric
SHRP Superpave USA Volumetric/Performance
related/Performance Based
Chapter 2 A Review on Flexible Pavement Engineering and Current Practices
13
2.3 Flexible Pavement Design Practice in Nigeria
Nnanna (2003) reported that the road system in Nigeria (Latitude 9º 4‟55.20‟‟N,
Longitude 8º 40‟31.00”E) is classified into four categories namely:
(a) The Federal Trunk „A‟ Roads- These are under the Federal government and
they are developed and maintained by the Federal Government;
(b) The Federal Trunk „F‟ Roads- These were formerly under state ownership,
but were taken over by the Federal Government. With a view to upgrading
them to Federal highway standards;
(c) The State Trunk „B‟ Roads- These are under the ownership and
management of the component States;
(d) The local Government Trunk „C‟ Roads- These are under Local Government
ownership and management.
The design and construction approach to be employed when a road is to be built
in Nigeria depends on the category of the proposed road. The importance
attached increases from Trunk „C‟ Roads to Trunk „A‟ Roads as listed above.
However, the method of flexible pavement design in Nigeria is not dissimilar to
what obtains in other tropical zones of the world. The design basically is empirical
in nature, and is based on the procedures and specifications outlined in the
manual: Highway Manual Part I: Design of 1973, produced by the Federal Ministry
of Works and Housing, Nigeria. Normally after the CBR value for the subgrade and
the estimate of traffic have been determined, the thickness of the pavement
structure can be determined from the Chart shown in Figure 2.1. This manual is
normally used in conjunction with relevant British Standards, Overseas Road
Notes (TRRL Road Note 31 in particular), American Society for Testing and
Materials (ASTM) design manuals, American Association of State Highway and
Transport Officials (AASHTO) design manuals, The Asphalt Institute design
manuals, and other reference materials.
Meanwhile, Ellis (1979) stated that very few of the various methods of pavement
design that are in general use throughout the world have been devised specifically
for the design of pavements in tropical countries. Two exceptions are TRRL Road
Note 31 (suitable for the design of medium and lightly trafficked roads), and the
French CEBTP design manual for tropical roads. Other popular methods of
pavement design, such as the AASHTO method and its derivatives, though
derived empirically in industrialised countries with temperate climates, are
nevertheless often used for the design of pavements in the tropics. There are very
large differences between the designs produced by various methods of pavement
design, even when the same assumptions of subgrade strength and traffic loading
are made.
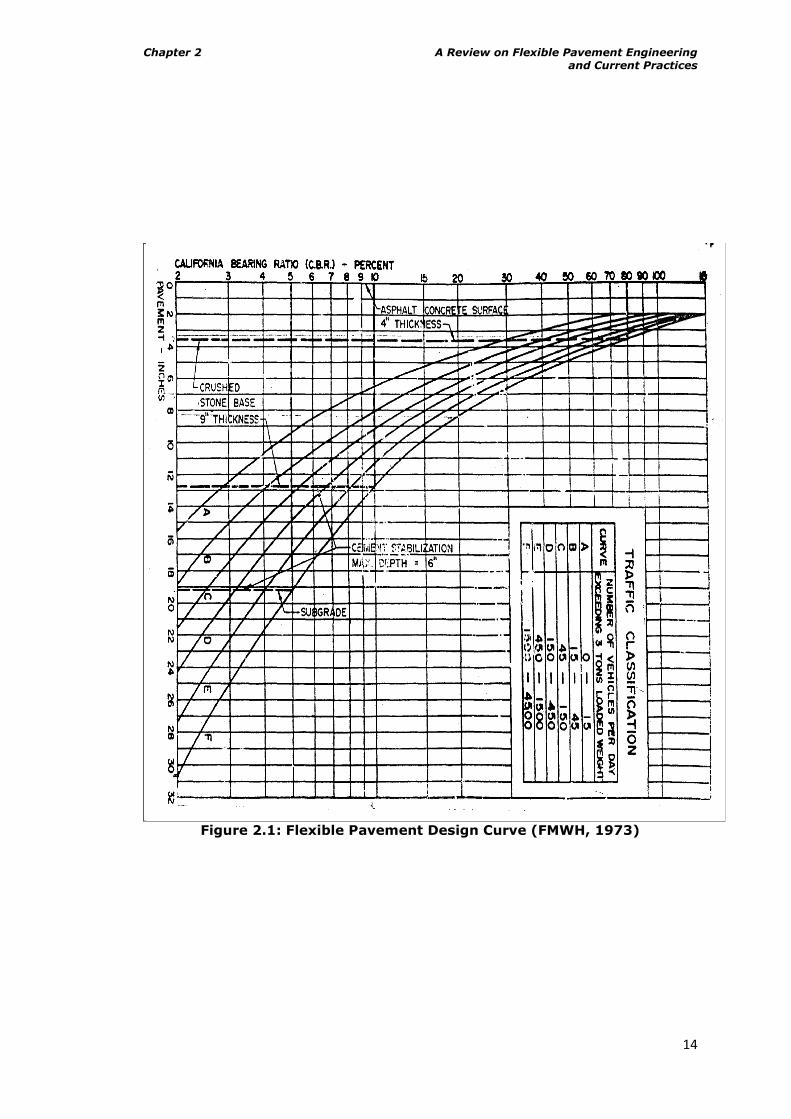
Chapter 2 A Review on Flexible Pavement Engineering and Current Practices
14
Figure 2.1: Flexible Pavement Design Curve (FMWH, 1973)
Chapter 2 A Review on Flexible Pavement Engineering and Current Practices
15
Thus, the specifications/procedures in such manuals are applied by highway
engineers in Nigeria with caution bearing in mind that these manuals were
produced mainly based on the experiences of highway engineers in the developed
countries of the temperate regions of the world in the first instance. A few of the
factors that readily come to mind when designing a road in Nigeria are; climatic
conditions, wide variability in the characteristics of available highway materials,
uncontrolled axle loads, overuse of the road network and improper/lack of
maintenance. Pavement temperature in hot climates for example has been
reported as high as 59 ºC (Johnston and Gandy, 1964).
These are very dissimilar to what obtains in the developed countries of the
temperate regions of the world. Generally, because of the large variability of
these factors, Ellis (1979) suggested that the design of road pavements in
developing countries must either include a higher „factor of safety‟ than is usual in
industrialised countries, or a higher risk of failure must be accepted. It has been
observed that the latter course is the most commonly adopted in recent times due
to the fact that, it minimises the demands made by road building on scarce
resources, and the disadvantages of partial or premature pavement failures are
much reduced by the short „design life‟ generally adopted and relative ease with
which repairs can be made on typically un-congested roads (Ellis, 1979).
This buttresses the reason why most roads are now designed to last for between
4 - 15years, which is quite different from the vogue of 25years design life in the
sixties and seventies. From experience, common flexible pavements in Nigeria are
either Surface-Dressed or in Hot Asphalt Concrete (HMA or HMAC). Campbell
(2009) reported that rigid pavements are not common in Nigeria. Surface
Dressing is usually employed as a stop gap measure knowing full well it might not
last more than 4years or 5years at most. Thus major designs are focused on Hot
Asphalt Concrete.
2.4 Common Highway Materials in Nigeria
Common materials which constitute a typical flexible pavement in Nigeria are
asphalt (Bitumen + filler + aggregate), aggregates (fine and coarse), cement,
bitumen and laterite. Asphalt normally constitutes the surfacing, while aggregates
and binders (cement or bitumen) are normally used for the road base. Laterite,
which is abundantly available in Nigeria, is normally used for the subbase. In
some cases, lateritic gravel is used as substitute for aggregates for the road base.
A lot of research work has been carried out on the suitability of laterite as a road
Chapter 2 A Review on Flexible Pavement Engineering and Current Practices
16
construction material in the tropics (Adedimila and Oti, 1987; Gidigasu, 1991).
The following road construction materials i.e. bitumen, aggregates, asphalt and
laterite, are briefly examined below within the Nigerian context.
2.4.1 Bitumen
Bitumen is a mixture of organic liquids that are highly viscous, black, sticky,
entirely soluble in carbon disulphide, and composed primarily of highly condensed
polycyclic aromatic hydrocarbons (Bonner, 2001). While it occurs naturally on its
own, it can also be obtained as a by-product of crude oil. Bitumen properties are
greatly influenced by the characteristics of its components, particularly the
structure of asphaltene and asphaltene/resin ratio of the bitumen sample. These
in turn depend mainly on the nature of the crude oil. The suitability of a crude oil
for bitumen manufacture is governed by the high weight percent of carbon
residue, high specific gravity, sulphur content of more than 5 per cent by weight,
low wax content and high asphaltene content. Unfortunately, the Nigerian crude
oil does not meet these requirements considering among other things the
American Petroleum Institute (API) gravity values and the sulphur content of a
typical Nigerian crude oil residue as illustrated in Table 2.4 (Corbett and Urban,
2005). Worse still, Nigeria which presently boasts a proven 42 billion barrel of
bitumen reserve has for logistical reasons not been able to tap this vast resource
(Adebiyi et al, 2005). Thus in order to meet demands for road construction,
Nigeria imports bitumen presently chiefly from Venezuela (Duke, 2010; and
Ministry of Mines and Steel development Nigeria, 2010). The imported bitumen is
normally straight run of penetration grade 40/50 or 60/70 or 85/100 (FMWH,
1997).
2.4.2 Aggregates
Raw materials for aggregates are in abundance in Nigeria. While the river sand is
suitable for fine aggregates, natural gravels and crushed granitic stones are
readily available to meet the demands for coarse aggregates in road construction.
The quarry dusts which are the by-products of the processes involved in the
production of crushed stones would easily pass for fillers and even fine aggregates
as well. The bulk of the work now lies in quality control. Generally, for coarse
aggregates (4.75mm and larger), the aggregate crushing value (ACV) should not
be more than 30% and also the Los Angeles Abrasion Value should not be more
than 40% (FMWH, 1997).
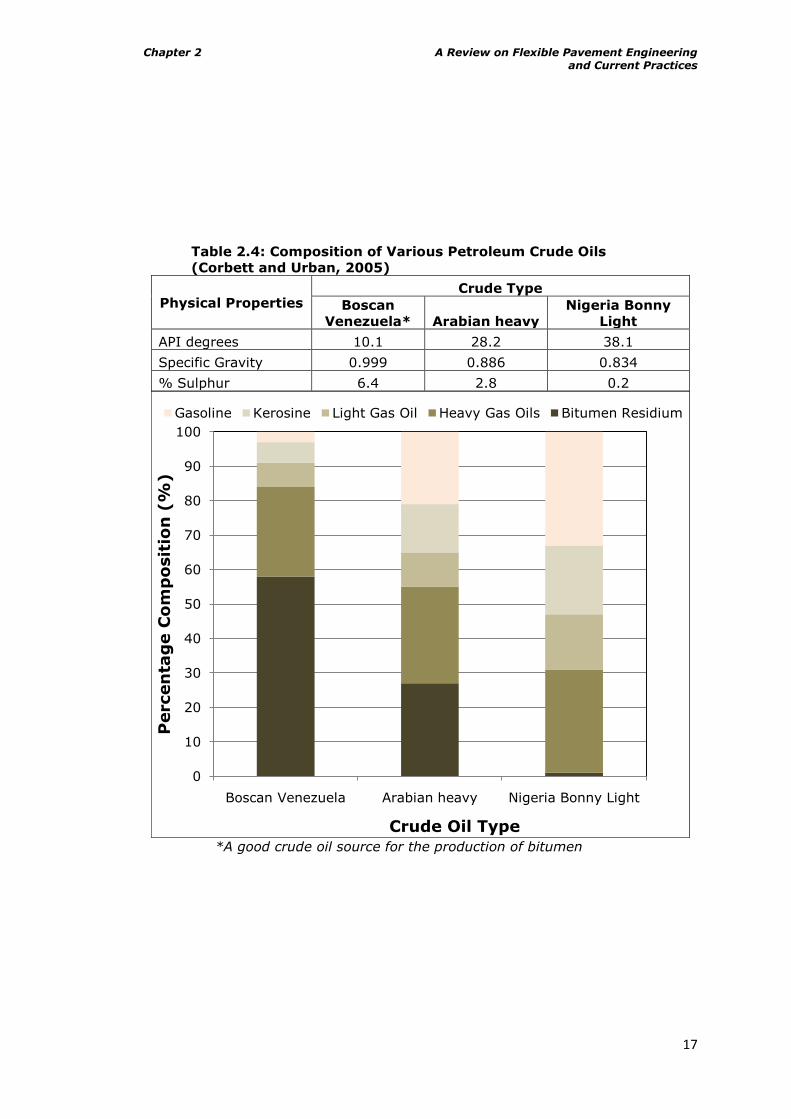
Chapter 2 A Review on Flexible Pavement Engineering and Current Practices
17
Table 2.4: Composition of Various Petroleum Crude Oils
(Corbett and Urban, 2005)
Physical Properties Crude Type
Boscan
Venezuela* Arabian heavy
Nigeria Bonny
Light
API degrees 10.1 28.2 38.1
Specific Gravity 0.999 0.886 0.834
% Sulphur 6.4 2.8 0.2
*A good crude oil source for the production of bitumen
0
10
20
30
40
50
60
70
80
90
100
Boscan Venezuela Arabian heavy Nigeria Bonny Light
Percen
tag
e C
om
po
sit
ion
(%
)
Crude Oil Type
Gasoline Kerosine Light Gas Oil Heavy Gas Oils Bitumen Residium
Chapter 2 A Review on Flexible Pavement Engineering and Current Practices
18
2.4.3 Asphalt
Asphalt either as a surface course or binder course, forms the final layer in
flexible pavement structure. It is expensive to produce and lay, and since its
durability and serviceability depends on; the proportions and properties of the
components of the mixture, the temperature of mixing and laying, and as well the
intensity and mode of compaction, it is therefore imperative that rigid control be
maintained in testing throughout the period of production. Generally, the major
work here is that of quality control. When embarking on a road construction
project in Nigeria, it is common practice to appoint a Materials Engineer, who
ensures that the quality of all the above mentioned materials conform to the
requirements of the specifications. He also has the mandate to ensure that such
materials are laid and compacted just as stated in the specifications. It is common
practice to use granite aggregates for the production of asphalt in Nigeria since
they are abundantly available (FMWH, 1997).
2.4.4 Laterite
Gidigasu (1991) described laterite as a surface formation in hot and wet tropical
areas which is enriched in iron and aluminium, and develops by intensive and long
lasting weathering of the underlying parent rock. Since Nigeria is located in the
tropical belt of the world, this material is abundantly available there, and
pavement engineers have found it very useful in the construction of highway
pavements when properly characterised. This confirms the TRRL (1993) findings
that a lot of naturally occurring granular materials in the tropics can be used
successfully as road base in flexible pavement construction. It is thus, essentially
a material for the road base and mainly subbase layers. When firm enough,
bituminous layers could be placed directly on lateritic layer. Meanwhile, TRRL
(1993), Adeyemi and Oyeyemi (2000), and Gidigasu (1991) have extensively
discussed factors and properties to be considered and checked respectively when
laterite is to be used in road construction.
2.5 Some Common Tests for Mix Design and Quality Control
There are a number of tests normally conducted on highway materials essentially
for mix design and quality control. These tests are discussed in the literature
extensively (Read and Whiteoak, 2003; and Fwa, 2003). Also standards have
been produced for guidance on how to conduct such tests. Table 2.5 summarises
the required tests for mix design and quality control of such highway materials.
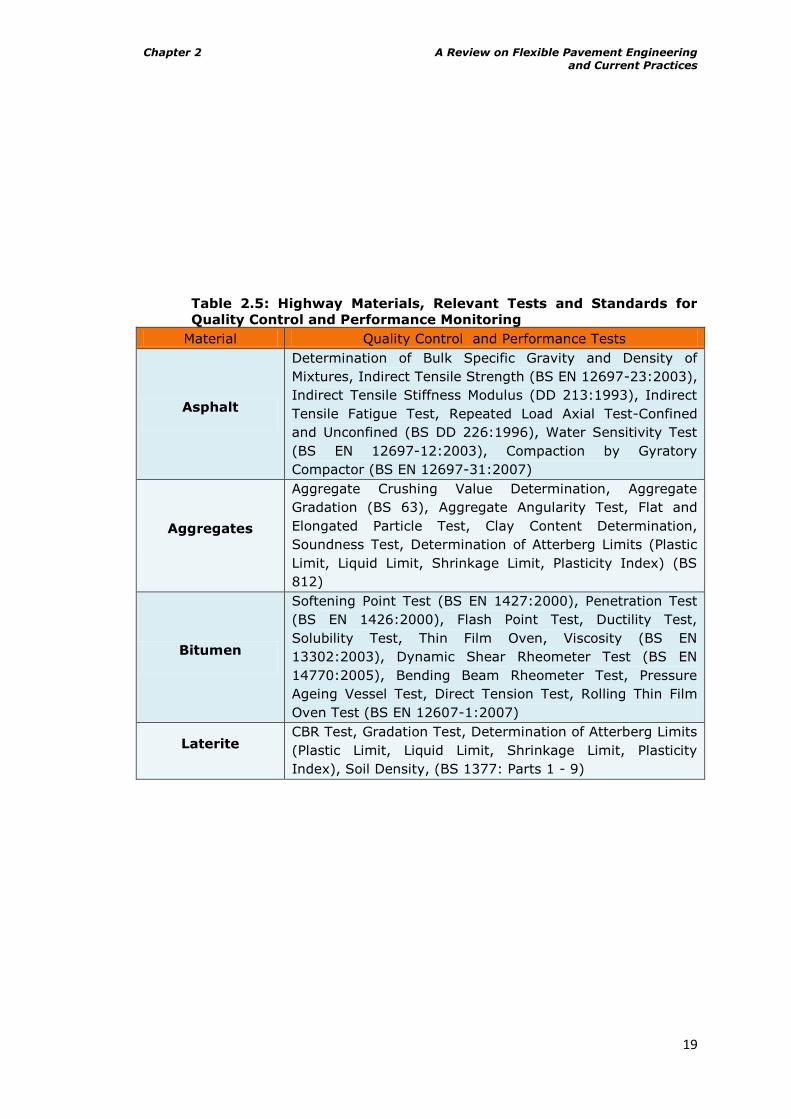
Chapter 2 A Review on Flexible Pavement Engineering and Current Practices
19
Table 2.5: Highway Materials, Relevant Tests and Standards for
Quality Control and Performance Monitoring
Material Quality Control and Performance Tests
Asphalt
Determination of Bulk Specific Gravity and Density of
Mixtures, Indirect Tensile Strength (BS EN 12697-23:2003),
Indirect Tensile Stiffness Modulus (DD 213:1993), Indirect
Tensile Fatigue Test, Repeated Load Axial Test-Confined
and Unconfined (BS DD 226:1996), Water Sensitivity Test
(BS EN 12697-12:2003), Compaction by Gyratory
Compactor (BS EN 12697-31:2007)
Aggregates
Aggregate Crushing Value Determination, Aggregate
Gradation (BS 63), Aggregate Angularity Test, Flat and
Elongated Particle Test, Clay Content Determination,
Soundness Test, Determination of Atterberg Limits (Plastic
Limit, Liquid Limit, Shrinkage Limit, Plasticity Index) (BS
812)
Bitumen
Softening Point Test (BS EN 1427:2000), Penetration Test
(BS EN 1426:2000), Flash Point Test, Ductility Test,
Solubility Test, Thin Film Oven, Viscosity (BS EN
13302:2003), Dynamic Shear Rheometer Test (BS EN
14770:2005), Bending Beam Rheometer Test, Pressure
Ageing Vessel Test, Direct Tension Test, Rolling Thin Film
Oven Test (BS EN 12607-1:2007)
Laterite CBR Test, Gradation Test, Determination of Atterberg Limits
(Plastic Limit, Liquid Limit, Shrinkage Limit, Plasticity
Index), Soil Density, (BS 1377: Parts 1 - 9)
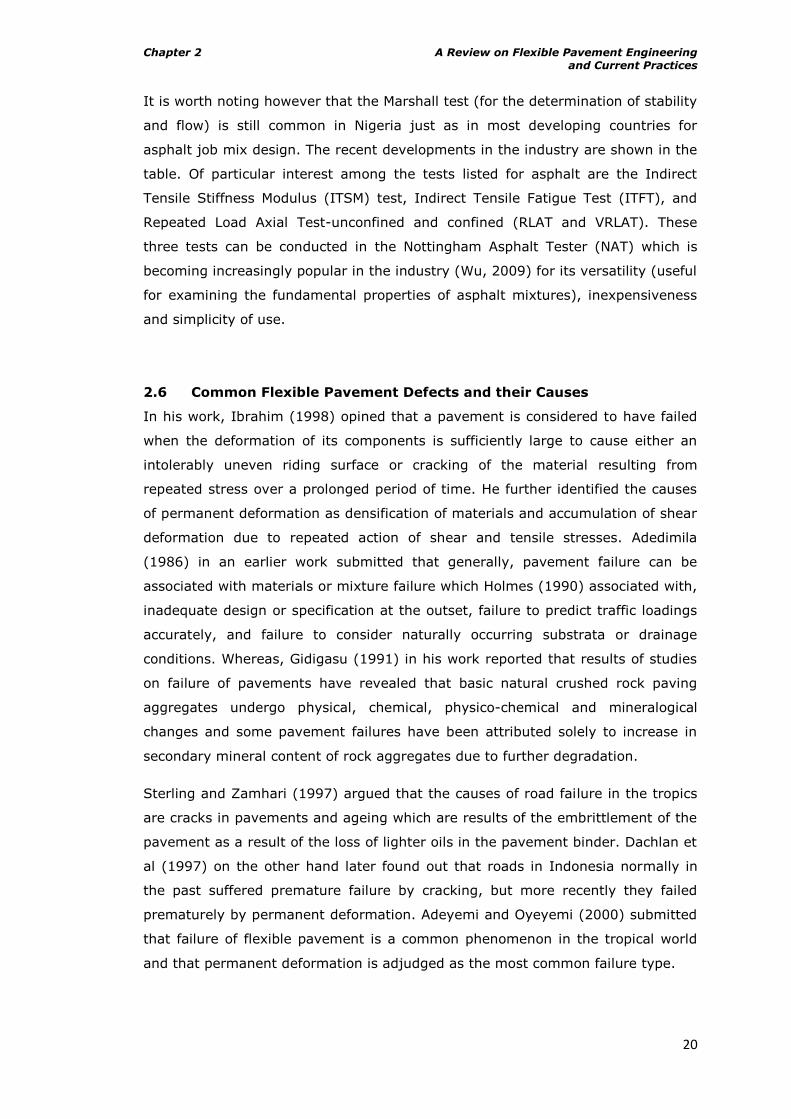
Chapter 2 A Review on Flexible Pavement Engineering and Current Practices
20
It is worth noting however that the Marshall test (for the determination of stability
and flow) is still common in Nigeria just as in most developing countries for
asphalt job mix design. The recent developments in the industry are shown in the
table. Of particular interest among the tests listed for asphalt are the Indirect
Tensile Stiffness Modulus (ITSM) test, Indirect Tensile Fatigue Test (ITFT), and
Repeated Load Axial Test-unconfined and confined (RLAT and VRLAT). These
three tests can be conducted in the Nottingham Asphalt Tester (NAT) which is
becoming increasingly popular in the industry (Wu, 2009) for its versatility (useful
for examining the fundamental properties of asphalt mixtures), inexpensiveness
and simplicity of use.
2.6 Common Flexible Pavement Defects and their Causes
In his work, Ibrahim (1998) opined that a pavement is considered to have failed
when the deformation of its components is sufficiently large to cause either an
intolerably uneven riding surface or cracking of the material resulting from
repeated stress over a prolonged period of time. He further identified the causes
of permanent deformation as densification of materials and accumulation of shear
deformation due to repeated action of shear and tensile stresses. Adedimila
(1986) in an earlier work submitted that generally, pavement failure can be
associated with materials or mixture failure which Holmes (1990) associated with,
inadequate design or specification at the outset, failure to predict traffic loadings
accurately, and failure to consider naturally occurring substrata or drainage
conditions. Whereas, Gidigasu (1991) in his work reported that results of studies
on failure of pavements have revealed that basic natural crushed rock paving
aggregates undergo physical, chemical, physico-chemical and mineralogical
changes and some pavement failures have been attributed solely to increase in
secondary mineral content of rock aggregates due to further degradation.
Sterling and Zamhari (1997) argued that the causes of road failure in the tropics
are cracks in pavements and ageing which are results of the embrittlement of the
pavement as a result of the loss of lighter oils in the pavement binder. Dachlan et
al (1997) on the other hand later found out that roads in Indonesia normally in
the past suffered premature failure by cracking, but more recently they failed
prematurely by permanent deformation. Adeyemi and Oyeyemi (2000) submitted
that failure of flexible pavement is a common phenomenon in the tropical world
and that permanent deformation is adjudged as the most common failure type.
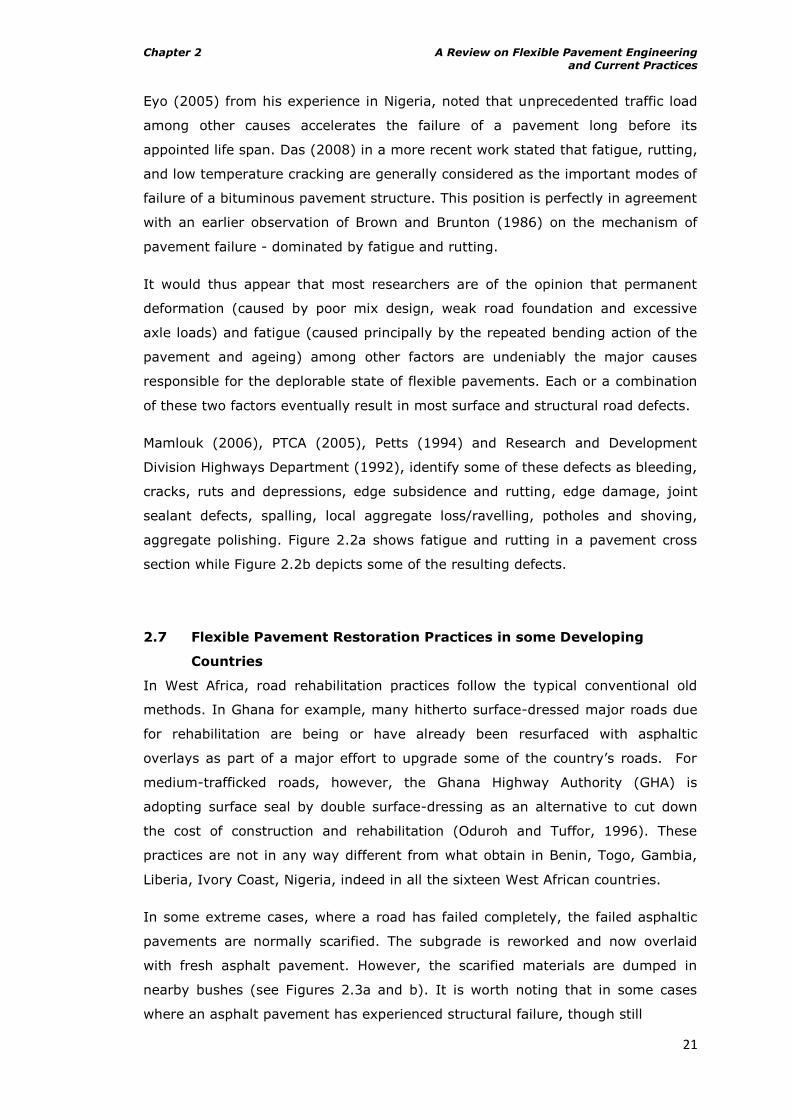
Chapter 2 A Review on Flexible Pavement Engineering and Current Practices
21
Eyo (2005) from his experience in Nigeria, noted that unprecedented traffic load
among other causes accelerates the failure of a pavement long before its
appointed life span. Das (2008) in a more recent work stated that fatigue, rutting,
and low temperature cracking are generally considered as the important modes of
failure of a bituminous pavement structure. This position is perfectly in agreement
with an earlier observation of Brown and Brunton (1986) on the mechanism of
pavement failure - dominated by fatigue and rutting.
It would thus appear that most researchers are of the opinion that permanent
deformation (caused by poor mix design, weak road foundation and excessive
axle loads) and fatigue (caused principally by the repeated bending action of the
pavement and ageing) among other factors are undeniably the major causes
responsible for the deplorable state of flexible pavements. Each or a combination
of these two factors eventually result in most surface and structural road defects.
Mamlouk (2006), PTCA (2005), Petts (1994) and Research and Development
Division Highways Department (1992), identify some of these defects as bleeding,
cracks, ruts and depressions, edge subsidence and rutting, edge damage, joint
sealant defects, spalling, local aggregate loss/ravelling, potholes and shoving,
aggregate polishing. Figure 2.2a shows fatigue and rutting in a pavement cross
section while Figure 2.2b depicts some of the resulting defects.
2.7 Flexible Pavement Restoration Practices in some Developing
Countries
In West Africa, road rehabilitation practices follow the typical conventional old
methods. In Ghana for example, many hitherto surface-dressed major roads due
for rehabilitation are being or have already been resurfaced with asphaltic
overlays as part of a major effort to upgrade some of the country‟s roads. For
medium-trafficked roads, however, the Ghana Highway Authority (GHA) is
adopting surface seal by double surface-dressing as an alternative to cut down
the cost of construction and rehabilitation (Oduroh and Tuffor, 1996). These
practices are not in any way different from what obtain in Benin, Togo, Gambia,
Liberia, Ivory Coast, Nigeria, indeed in all the sixteen West African countries.
In some extreme cases, where a road has failed completely, the failed asphaltic
pavements are normally scarified. The subgrade is reworked and now overlaid
with fresh asphalt pavement. However, the scarified materials are dumped in
nearby bushes (see Figures 2.3a and b). It is worth noting that in some cases
where an asphalt pavement has experienced structural failure, though still
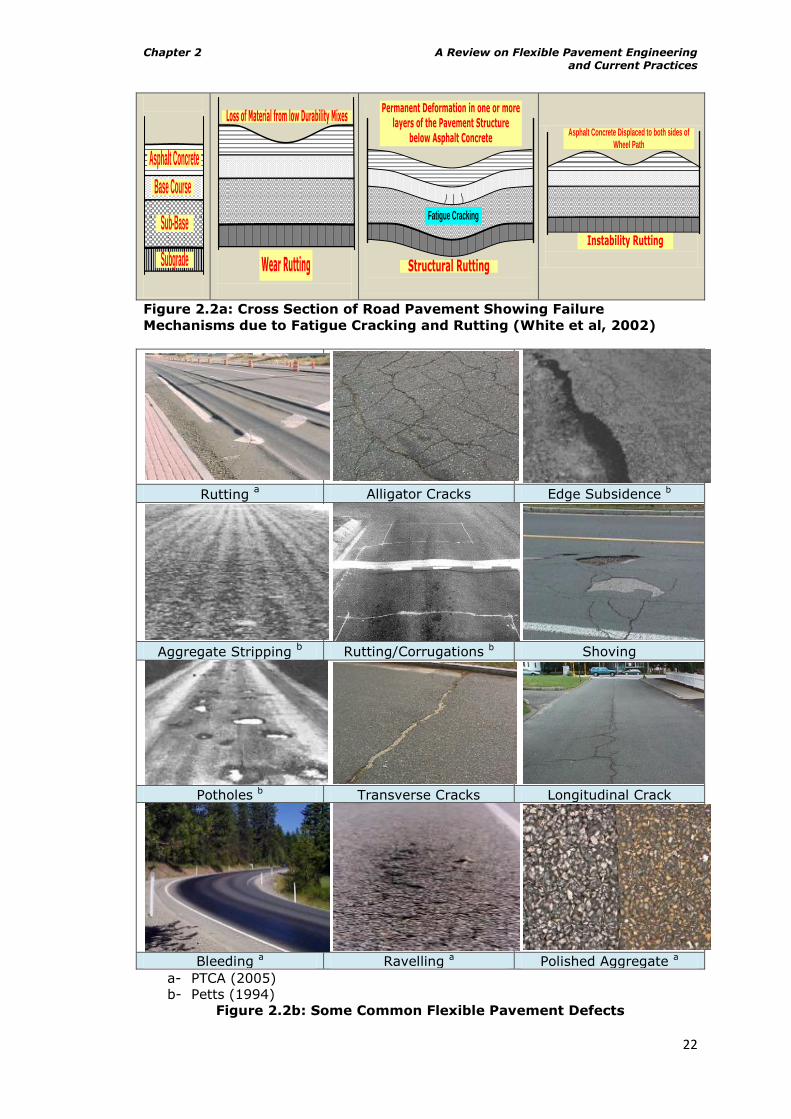
Chapter 2 A Review on Flexible Pavement Engineering and Current Practices
22
Asphalt Concrete
Base Course
Sub-Base
Subgrade
Wear Rutting
Loss of Material from low Durability Mixes
Permanent Deformation in one or more layers of the Pavement Structure
below Asphalt Concrete
Structural Rutting
Fatigue Cracking
Instability Rutting
Asphalt Concrete Displaced to both sides of
Wheel Path
Figure 2.2a: Cross Section of Road Pavement Showing Failure
Mechanisms due to Fatigue Cracking and Rutting (White et al, 2002)
Rutting
a Alligator Cracks Edge Subsidence b
Aggregate Stripping
b Rutting/Corrugations b Shoving
Potholes b Transverse Cracks Longitudinal Crack
Bleeding a Ravelling a Polished Aggregate a
a- PTCA (2005)
b- Petts (1994)
Figure 2.2b: Some Common Flexible Pavement Defects
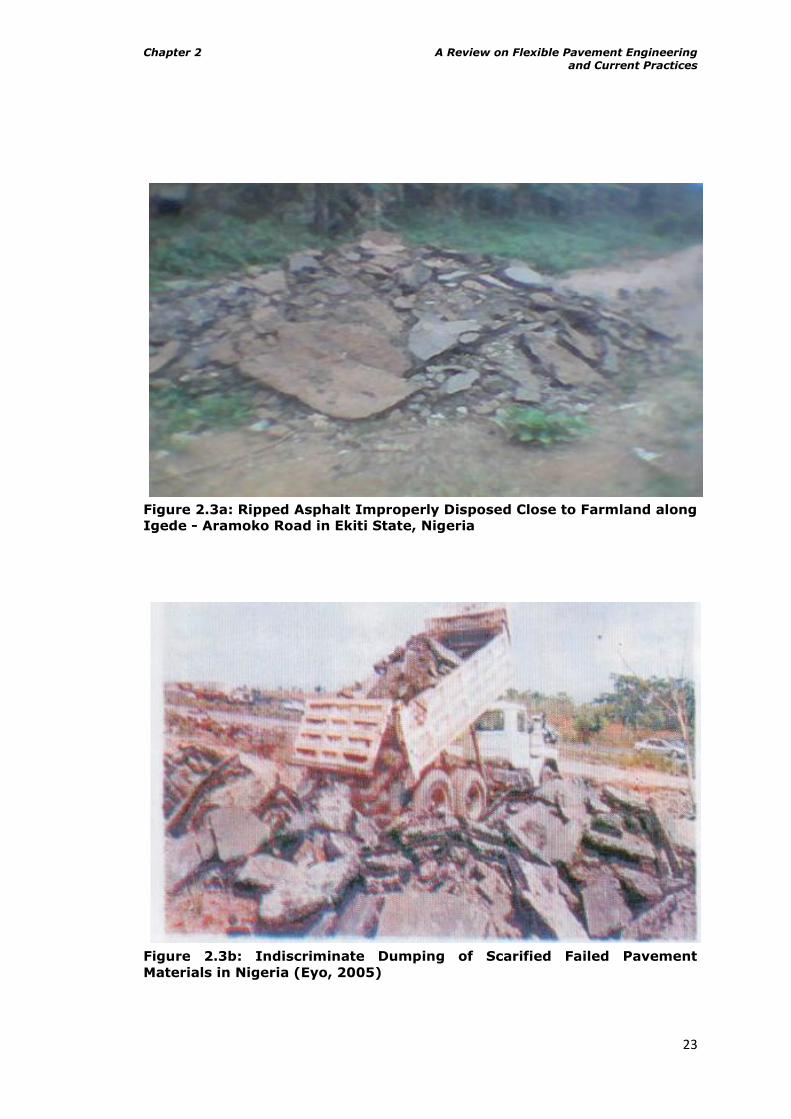
Chapter 2 A Review on Flexible Pavement Engineering and Current Practices
23
Figure 2.3a: Ripped Asphalt Improperly Disposed Close to Farmland along
Igede - Aramoko Road in Ekiti State, Nigeria
Figure 2.3b: Indiscriminate Dumping of Scarified Failed Pavement
Materials in Nigeria (Eyo, 2005)

Chapter 2 A Review on Flexible Pavement Engineering and Current Practices
24
passable, an overlay is normally applied to strengthen such pavement. Eyo
(2005) reported that stabilizers (liquid and powder), geotextiles and surfacing
materials are presently being trialled to ascertain their suitability for road
pavement rehabilitation in Nigeria.
2.8 Trends in Road Restoration Practices in Developed Countries
The present trend in road restoration practice in most developed countries of the
world is recycling, and it is being driven chiefly by the resolve of the governments
of these countries at enforcing the concept of sustainability in all human
endeavours. This concept was introduced in Rio de Janeiro in 1992 during the
United Nations Conference on Environment and Development (Roberts, 1997).
Part of the recommendations made requires limiting wastes to landfills and also
preserving the natural habitat as much as possible in all endeavours. Of course
the road sector is not excluded from this, and as such one of the best ways of
achieving this is by the reuse and recycling of construction wastes. To achieve this
goal, ARRA (2001) reported that many countries have already enacted legislation
which requires that certain percentages of material, particularly the ones used in
roadway construction and rehabilitation must be recycled or include recycled
materials. Shortage of funds needed for road management and the energy crisis
among others have also been responsible for this present trend. ARRA (2001)
reported that asphalt pavement is the most commonly recycled material in North
America. Japan, Australia, UK and other European countries too are following this
path (Merrill et al, 2004; Woodside et al, 2000; and Austroads, 2000).
2.9 State of Roads in Nigeria and other Developing Nations, and
Reasons for Failure
The performance of a road cannot in any way be isolated from its history. The
activities that characterized the pre-construction, construction and post
construction stages will have a large bearing on the performance of such a road.
Thus, roads have their individual identities and as such their performances are
characteristically functions of their histories. No two roads are the same in nature.
Therefore, the assessment of the performance of any road should always be
premised on its history.
Normally, when a road is being designed to last for N years, and all things being
equal during the construction, the assumption of the highway engineer is that
such a road will be adequately maintained throughout its life time. This is also
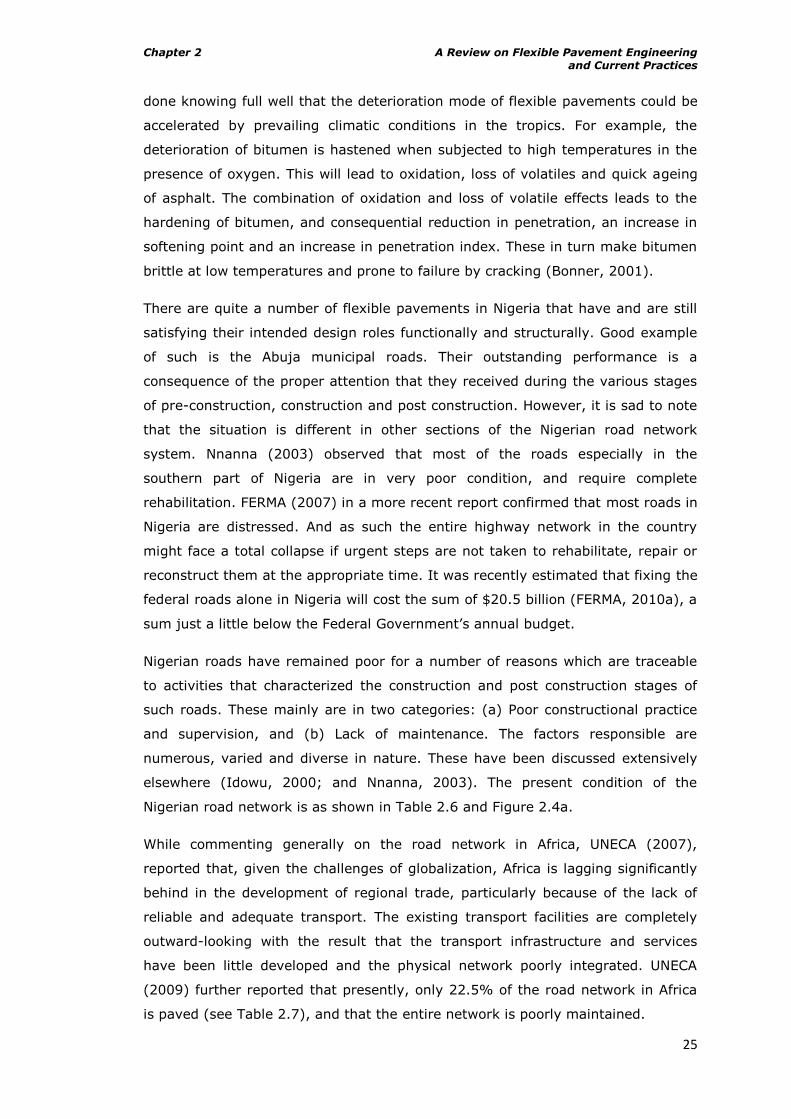
Chapter 2 A Review on Flexible Pavement Engineering and Current Practices
25
done knowing full well that the deterioration mode of flexible pavements could be
accelerated by prevailing climatic conditions in the tropics. For example, the
deterioration of bitumen is hastened when subjected to high temperatures in the
presence of oxygen. This will lead to oxidation, loss of volatiles and quick ageing
of asphalt. The combination of oxidation and loss of volatile effects leads to the
hardening of bitumen, and consequential reduction in penetration, an increase in
softening point and an increase in penetration index. These in turn make bitumen
brittle at low temperatures and prone to failure by cracking (Bonner, 2001).
There are quite a number of flexible pavements in Nigeria that have and are still
satisfying their intended design roles functionally and structurally. Good example
of such is the Abuja municipal roads. Their outstanding performance is a
consequence of the proper attention that they received during the various stages
of pre-construction, construction and post construction. However, it is sad to note
that the situation is different in other sections of the Nigerian road network
system. Nnanna (2003) observed that most of the roads especially in the
southern part of Nigeria are in very poor condition, and require complete
rehabilitation. FERMA (2007) in a more recent report confirmed that most roads in
Nigeria are distressed. And as such the entire highway network in the country
might face a total collapse if urgent steps are not taken to rehabilitate, repair or
reconstruct them at the appropriate time. It was recently estimated that fixing the
federal roads alone in Nigeria will cost the sum of $20.5 billion (FERMA, 2010a), a
sum just a little below the Federal Government‟s annual budget.
Nigerian roads have remained poor for a number of reasons which are traceable
to activities that characterized the construction and post construction stages of
such roads. These mainly are in two categories: (a) Poor constructional practice
and supervision, and (b) Lack of maintenance. The factors responsible are
numerous, varied and diverse in nature. These have been discussed extensively
elsewhere (Idowu, 2000; and Nnanna, 2003). The present condition of the
Nigerian road network is as shown in Table 2.6 and Figure 2.4a.
While commenting generally on the road network in Africa, UNECA (2007),
reported that, given the challenges of globalization, Africa is lagging significantly
behind in the development of regional trade, particularly because of the lack of
reliable and adequate transport. The existing transport facilities are completely
outward-looking with the result that the transport infrastructure and services
have been little developed and the physical network poorly integrated. UNECA
(2009) further reported that presently, only 22.5% of the road network in Africa
is paved (see Table 2.7), and that the entire network is poorly maintained.
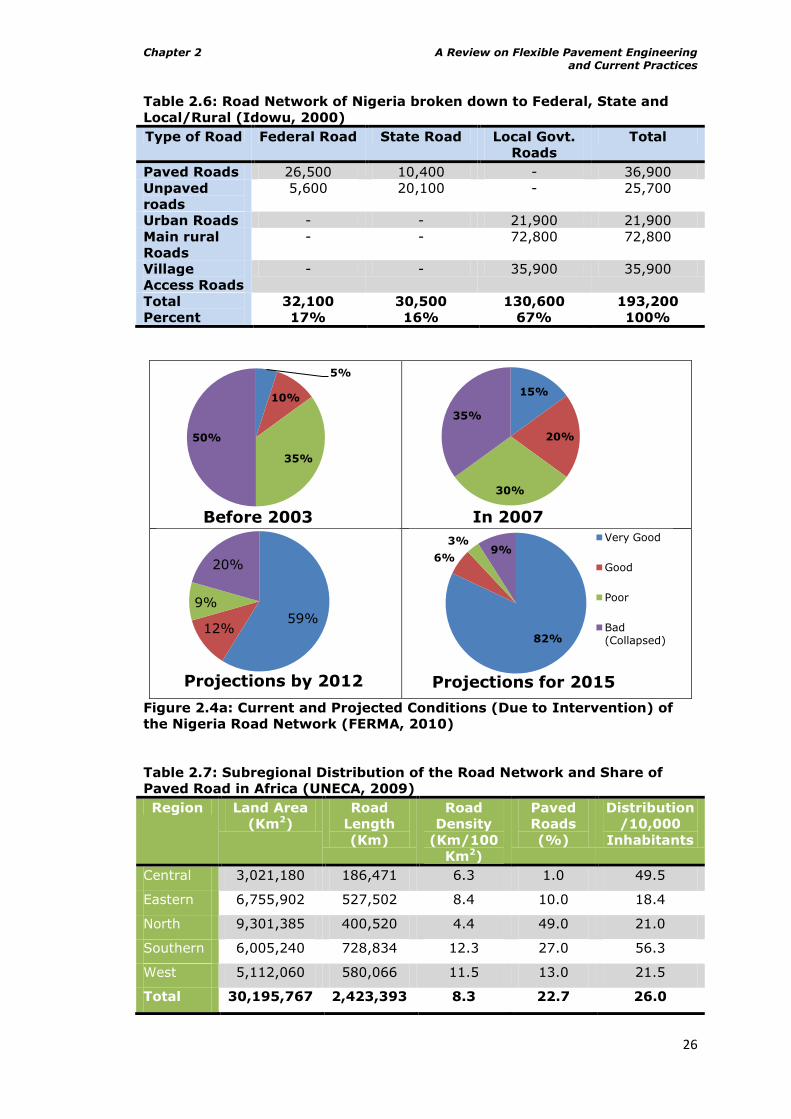
Chapter 2 A Review on Flexible Pavement Engineering and Current Practices
26
Table 2.6: Road Network of Nigeria broken down to Federal, State and
Local/Rural (Idowu, 2000)
Type of Road Federal Road State Road Local Govt.
Roads
Total
Paved Roads 26,500 10,400 - 36,900
Unpaved
roads
5,600 20,100 - 25,700
Urban Roads - - 21,900 21,900
Main rural
Roads
- - 72,800 72,800
Village
Access Roads
- - 35,900 35,900
Total
Percent
32,100
17%
30,500
16%
130,600
67%
193,200
100%
Figure 2.4a: Current and Projected Conditions (Due to Intervention) of
the Nigeria Road Network (FERMA, 2010)
Table 2.7: Subregional Distribution of the Road Network and Share of
Paved Road in Africa (UNECA, 2009)
Region Land Area
(Km2)
Road
Length
(Km)
Road
Density
(Km/100
Km2)
Paved
Roads
(%)
Distribution
/10,000
Inhabitants
Central 3,021,180 186,471 6.3 1.0 49.5
Eastern 6,755,902 527,502 8.4 10.0 18.4
North 9,301,385 400,520 4.4 49.0 21.0
Southern 6,005,240 728,834 12.3 27.0 56.3
West 5,112,060 580,066 11.5 13.0 21.5
Total 30,195,767 2,423,393 8.3 22.7 26.0
5%
10%
35%
50%
Before 2003
15%
20%
30%
35%
In 2007
59%12%
9%
20%
Projections by 2012
82%
6%
3%9%
Projections for 2015
Very Good
Good
Poor
Bad (Collapsed)
Chapter 2 A Review on Flexible Pavement Engineering and Current Practices
27
2.10 The Need for Sustainable Road Development
By timely and proper maintenance, highway engineers can extend a pavement‟s
usefulness. Eventually, however, even the best-maintained pavement will begin to
disintegrate and will need to be rehabilitated. The traditional approach to
pavement rehabilitation has been to either reconstruct it with all new material or
patch and overlay it with a new wearing surface, which is expensive, time
consuming, wasteful and causes considerable inconvenience to the road user. This
is clearly evident in the extension cum maintenance works going on along Lagos –
Ibadan expressway in Nigeria. Apart from this, it leads to the depletion of the
natural resource base essential for future development, increased hydrocarbon
pollution (Parry, 2009), the need to locate tipping sites for waste road stone, and
transport required to remove waste material and bring in new material can add
greatly to traffic congestion, reduction of the life cycle of existing pavements and
safety problems.
Additionally, a number of the processes involved in the conventional/traditional
methods do not satisfactorily comply with the provisions for conservation and
management of resources for development defined in Agenda 21 of the UN
resolutions during its Earth Summit meeting held on Sustainable Development in
Rio de Janeiro, Brazil, in 1992. For example, the provisions chiefly require among
others, protection of the atmosphere, integrated approach to the planning and
management of land resources, combating deforestation, managing fragile
ecosystems: combating desertification and drought, managing fragile ecosystems:
sustainable mountain development, promoting sustainable agriculture and rural
development, conservation of biological diversity, environmentally sound
management of biotechnology, environmentally sound management of solid
wastes and sewage-related issues (United Nations, 1992).
These disadvantages of the traditional/conventional methods of pavement
rehabilitation, and the increasing construction costs have caused highway
engineers to search for new methods of rehabilitating highway pavements.
However, for sustainable road development to be possible, road activities will
have to be redesigned to reuse raw materials and construction materials many
times over. This will include salvaging construction materials such as concrete and
asphalt from roads, the reuse of metals and other natural and synthetic materials.
Waste recycling and reuse will have to become a way of life in both developed and
developing nations. Interestingly, the developed nations are beginning to do this
but the reverse is the case in developing nations such as Nigeria. One of the most
interesting examples of resource recovery is the use of recycled products as
Chapter 2 A Review on Flexible Pavement Engineering and Current Practices
28
construction materials (Parry, 2009). The recycling concept is not particularly new
to the highway field. Various methods, some quite successful, have been
practiced in a limited manner since about 1900s (ARRA, 2001).
It is estimated that over N2.5 trillion (£11.4 billion) is spent annually on roads in
developing countries, much of this on road rehabilitation (Smith, 1998). The
Federal Government of Nigeria presently spends about N 4.44 billion (£20 million)
annually on direct labour allocation for minor road maintenance excluding
rehabilitation/major maintenance and development of new roads. The most
expensive element of the road pavement is the asphalt (bitumen + aggregate
mixture) which forms the surfacing and often forms the principal load bearing
layers of the road.
The cost of asphalt is typically more than 3 times the cost of unbound aggregate,
but when roads are rehabilitated, the asphalt is almost always removed and
discarded as a waste product. To worsen the situation, in Nigeria, the disposal is
done indiscriminately (see Figures 2.3a and b) since environmental laws are not
being fully enforced. Very large volumes of good quality aggregate and asphalt
are therefore lost and new materials must be quarried/ procured to replace the
discarded materials. The use of thick asphalt layers through overlays is (see
Figure 2.4b) increasing to keep pace with expanding networks and ever greater
traffic loadings. Unfortunately after several overlays have been done, the free
passage of high vehicles under bridges is threatened as the head rooms under
bridges keep reducing each time an overlay is applied. Thus, the need to
introduce construction techniques and tools which facilitate the reuse of old/waste
road materials in Nigeria and other developing countries cannot be
overemphasized as they play important roles in achieving sustainable road
development.
2.11 The Pavement Recycling Option for Road Restoration
The Asphalt Institute (1978) defines pavement recycling as the reworking of in-
place surface and base material while PIARC (2003) defined the recycling of road
materials as the reuse of existing road materials in road construction, with or
without changing the characteristics of the materials. In a broader sense,
recycling is reducing reclaimed materials from the road to a suitable size for
processing, blending the reclaimed materials with virgin ones and relaying the
materials as a base, binder or surface course. However, the ready availability of
cheap aggregates and binders did not make these methods very attractive to
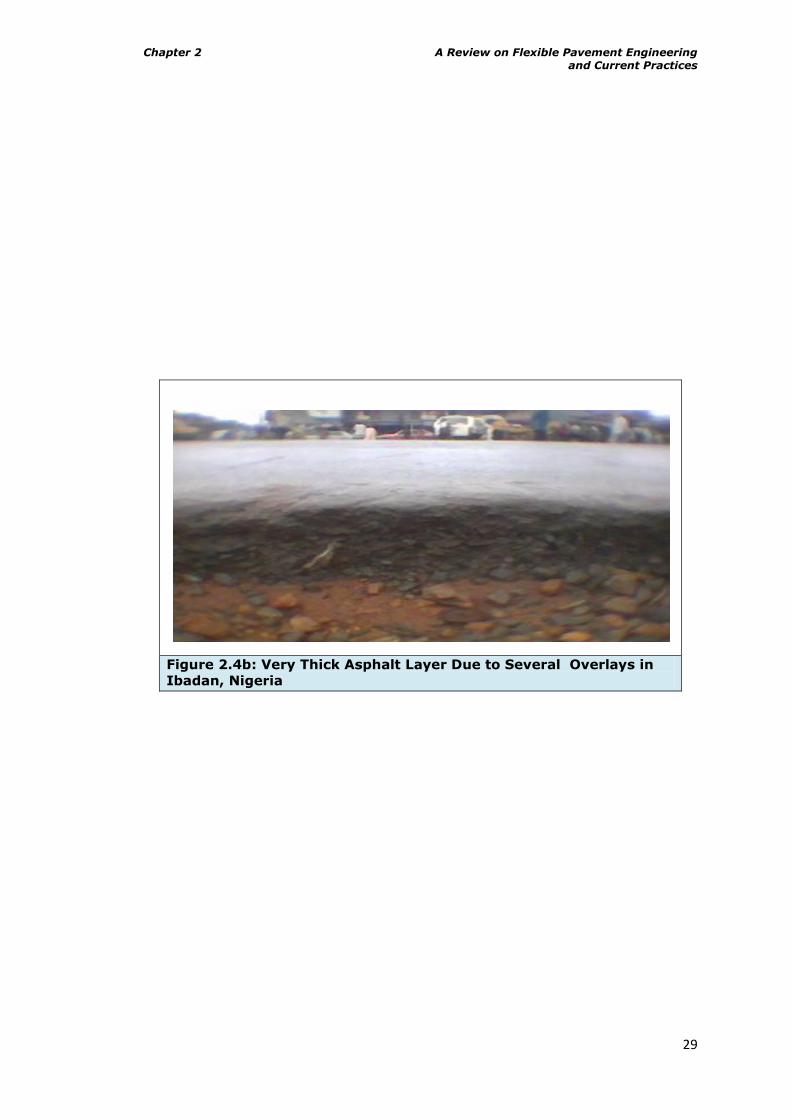
Chapter 2 A Review on Flexible Pavement Engineering and Current Practices
29
Figure 2.4b: Very Thick Asphalt Layer Due to Several Overlays in
Ibadan, Nigeria
Chapter 2 A Review on Flexible Pavement Engineering and Current Practices
30
highway engineers and it required the „energy crisis‟ which followed the 1973,
Arab-Israeli conflict to re-awaken interest in this rehabilitation method (PIARC
2001; Karlsson and Isacsson, 2006). Whereas the concept of asphalt pavement
recycling is relatively new in Nigeria, it has been successfully practiced since the
mid 20th century in the US and Europe (Eyo, 2004). Adopting this method of road
rehabilitation in Nigeria will not only engender sustainable development and large
cost savings, but will serve as one of Nigeria‟s major local contributions to the
realisation of Agenda 21; more so, any road in need of reconstruction or new
overlay is a candidate for recycling (Karlsson and Isacsson, 2006).
Recycling roads provides a lot of benefits. The first and most obvious benefit is
the saving in the amount of fresh materials required. This saving is wide-
reaching. Less material equals less quarrying (energy reduction as well as
reduced environmental impact), equals less fuel used, equals less transport
(reduced damage to road network and noise pollution). In the same vein,
experience has shown that the in situ recycling process is up to 50% faster than
conventional reconstruction (Sinclair and Valentine, 1999). This brings benefits
through reduced site supervision costs. Also, a reduced construction period
minimizes traffic delays caused by road works, which contributes to the economic
benefit of the process. Reusing the existing road and footway materials leads to a
reduction in the waste to landfill. This produces environmental and economic
benefits. Thus, this method of road reconstruction meets the requirements and
provisions of Sustainable Development as stated in Principles 1 to 27 of Agenda
21 of the UN resolutions of the Earth Summit.
2.12 Methods of Flexible Pavement Recycling
Different classifications of asphalt pavement recycling have been advanced in
literature. PIARC (2003) maintained that classifications of the main types of
recycling can be made according to:
The place where mixing is carried out (whether in situ or ex situ i.e.
in-plant),
The temperature of the process (cold or hot recycling),
The characteristics of the material to be recycled, The binder type (cement, bitumen emulsion, foamed bitumen,
bitumen).
ARRA (2001) on the other hand categorised recycling into:
Cold Planing (CP)
Chapter 2 A Review on Flexible Pavement Engineering and Current Practices
31
Hot Recycling (HR)
Hot In Place Recycling (HIR)
Cold Recycling (CR), and
Full Depth Reclamation (FDR)
ARRA (2001) further classified Hot In-Place Recycling into- Surface Recycling
(Resurfacing), Remixing and Repaving. Cold Recycling was further classified into
Cold In-Place Recycling (CIR) and Cold Central Plant Recycling (CCPR), while Full
Depth Reclamation was classified into, Pulverization, Mechanical Stabilisation,
Bituminous Stabilisation and Chemical Stabilisation. Figure 2.5 illustrates these
methods of asphalt pavement recycling as stated by Karlsson and Isacsson
(2006). However, since this work only focuses on cold recycling ex situ, i.e. in-
plant, subsequently, discussions shall only reflect this interest.
Information on all these classifications is well detailed in literature (ARRA, 2001;
PIARC, 2003; and Karlsson and Isacsson, 2006).
2.13 Cold Recycling Ex Situ (In-Plant)
ARRA (2001) in describing this method of recycling stated that it is a process in
which the asphalt recycling takes place in a central location using a stationary
cold mix plant. The stationary plant could be a specifically designed plant or a cold
in-place recycling train minus the milling machine, set up in a stationary
configuration. As the name dictates, this method of pavement rehabilitation is
usually carried out cold and without heating the reused material during the
recycling process to produce a rehabilitated pavement (ARRA, 2001). O‟Flaherty,
(1988) opined that this method is normally used in order to conserve materials
and energy, and to improve pavement surface condition.
The author explained further that, in addition, however it can be used to improve
the load carrying capacity of the pavement. The reclaimed asphalt pavement used
normally is obtained from cold planning or by ripping, removing and crushing
operations. The milled or pulverized material is stockpiled, then processed to
obtain an appropriate grading, and finally mixed in a plant to produce new treated
bituminous mixture which could be used immediately or stockpiled to be used
later. When it is to be used immediately, the recycled material is transported to
the site, where it is mechanically laid and compacted. PIARC (2003) stated that
mixers can be either continuous or batch wise.
In describing in detail a typical cold recycling plant, ARRA (2001), explained that
the plant usually consists of a number of cold feed bins for the RAP and new
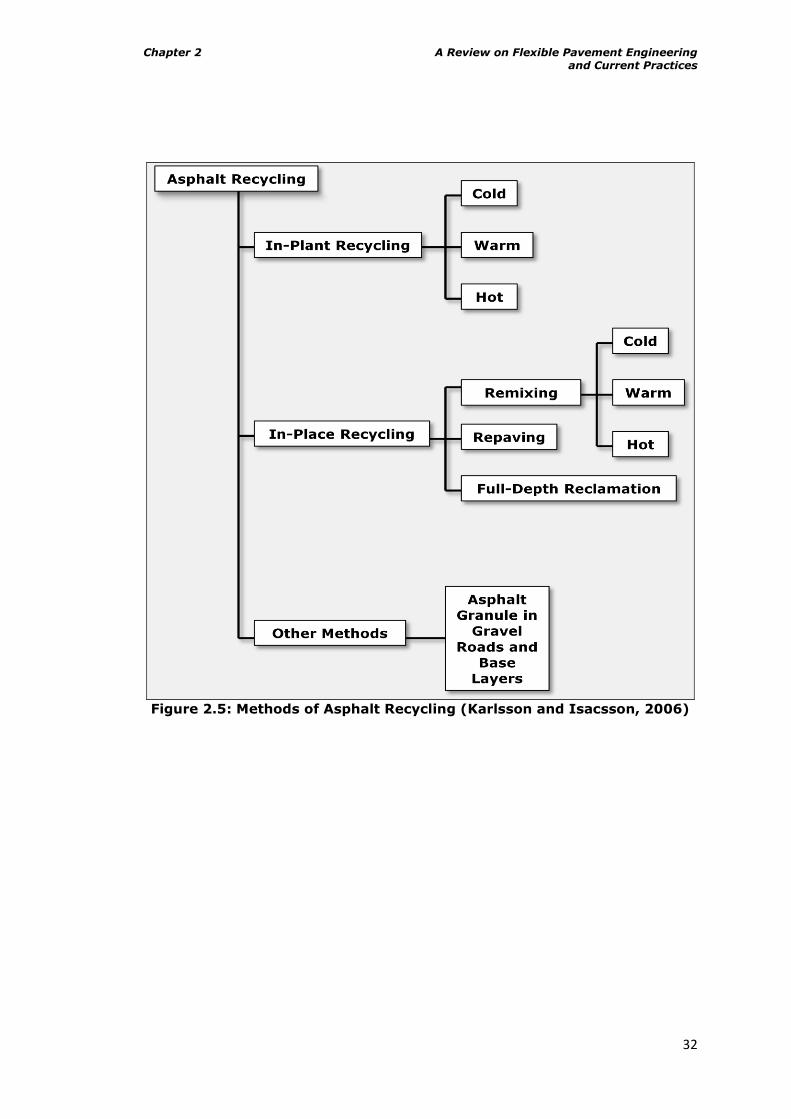
Chapter 2 A Review on Flexible Pavement Engineering and Current Practices
32
Figure 2.5: Methods of Asphalt Recycling (Karlsson and Isacsson, 2006)
Chapter 2 A Review on Flexible Pavement Engineering and Current Practices
33
aggregate, a belt scale, a computer controlled liquid recycling additive system, a
pugmill, a hopper for temporary storage and loading of haul trucks or a
conveyor/belt stacker if the cold mix is being stockpiled. Figures 2.6 and 2.7
illustrate the cold recycling plant set ups while Figure 2.8 illustrates the normal
procedure to follow for cold recycling ex situ. The recycled materials are taken to
site, placed and compacted using the conventional construction machineries
normally used in the making of HMA pavements. ARRA (2001) further stated that
the cold laid mix is usually overlain with a layer of HMA, although for some very
low traffic roadways, a single or double seal coat is sometimes used.
Apart from the main advantage that direct control over the quality of materials
being recycled is achievable through cold recycling ex situ, ARRA (2001) lists the
general advantages of cold recycling as:
Conservation of non-renewable resources
Energy conservation compared to other reconstruction methods
Eliminates the disposal problems inherent in conventional methods
Surface irregularities and cracks are interrupted and filled
Rutting, potholes and ravelling are eliminated
Base and subgrade materials are not disturbed
Pavement cross-slope and profile can be improved
Problems with existing aggregate gradation and/or asphalt binder can be
corrected with proper selection of new granular materials and stabilizing
additives
Significant structural treatment and improved ride quality
Economic savings are realised
ARRA (2001) further stated that bitumen emulsion among other recycling agents
could be used in cold recycling, but that however, the densification of cold mixes
requires higher compactive effort than conventional HMA.
2.14 Pavement Recyclability - Factors to be Considered
Karlsson and Isacsson (2006) stated that any road in need of reconstruction or
new overlay is a candidate for recycling. This assertion is just too general, though
they later opined that the re-use of asphalt means that the complexity of the
maintenance operation increases, as the reclaimed material is more difficult to
characterise compared to new material. However, on a more technical point,
PIARC (2003) opined that, the criteria for ascertaining the feasibility of recycling a
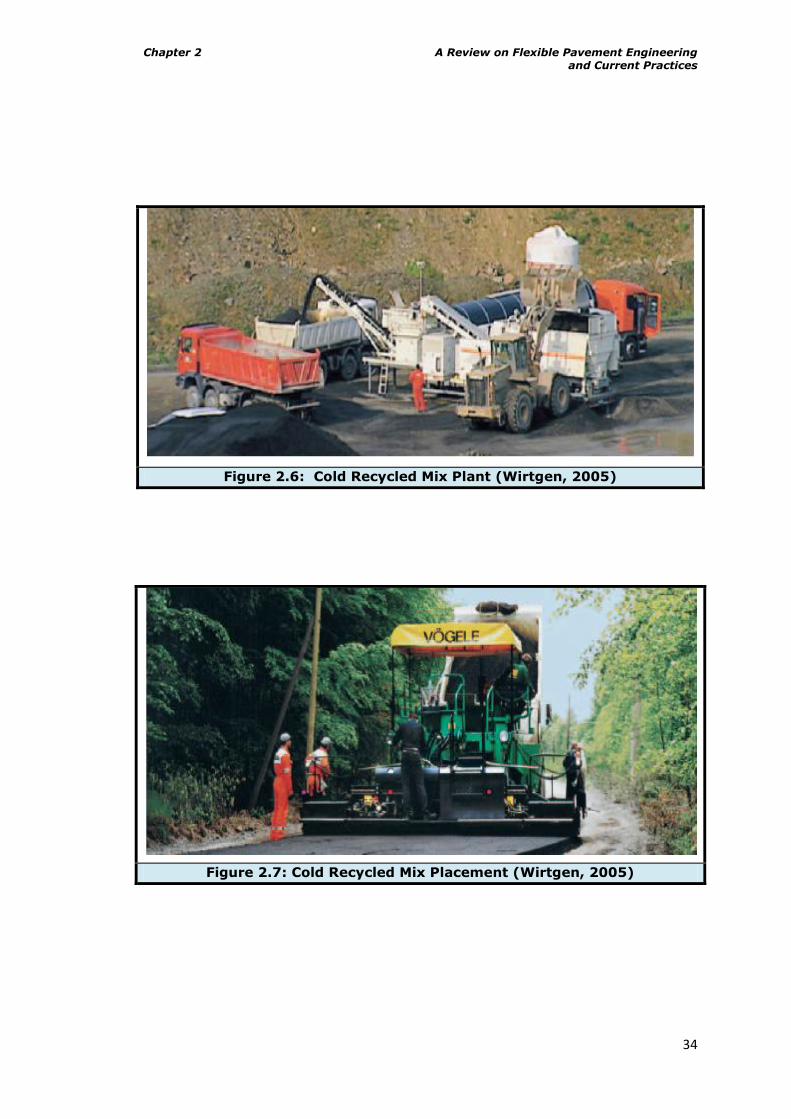
Chapter 2 A Review on Flexible Pavement Engineering and Current Practices
34
Figure 2.6: Cold Recycled Mix Plant (Wirtgen, 2005)
Figure 2.7: Cold Recycled Mix Placement (Wirtgen, 2005)
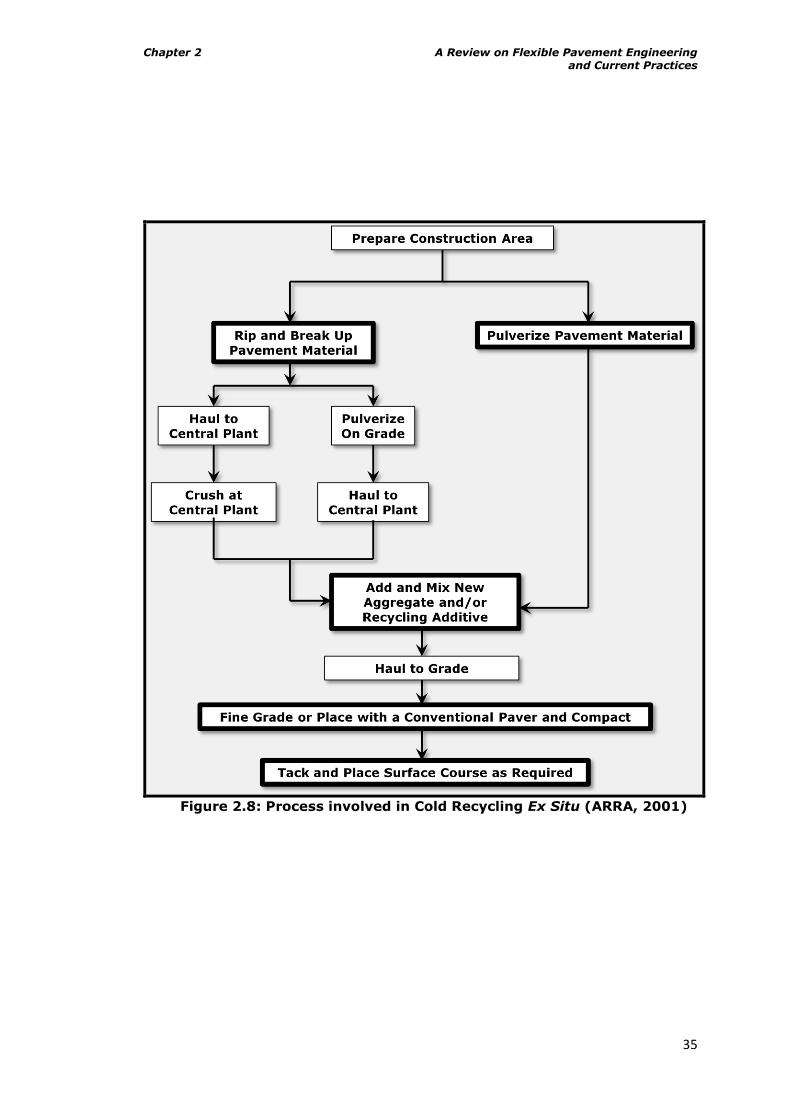
Chapter 2 A Review on Flexible Pavement Engineering and Current Practices
35
Figure 2.8: Process involved in Cold Recycling Ex Situ (ARRA, 2001)
Chapter 2 A Review on Flexible Pavement Engineering and Current Practices
36
pavement is to identify whether its deterioration comes mainly from the poor
quality of the pavement itself (insufficient thickness, granular layers contaminated
with clay, de-bonded bituminous layers, etc) or from problems related to the
subgrade. They further submitted that the recycling feasibility should be
established from knowledge of the structure of the pavement and of the
characteristics of the materials present in it.
Thus for this reason, it is necessary to examine the road, to determine the
characteristics of the materials of the pavement and to collect data on the traffic
and climate. ARRA (2001) while elaborating on this gave general guideline for the
preliminary selection of roads that are candidates for recycling or reclamation
methods for the rehabilitation of asphalt pavements. Table 2.8 details the
guidelines. However, ARRA (2001) cautioned that all of the candidate
rehabilitation techniques have disadvantages and advantages since not all
rehabilitation techniques are equally suited to treat the various pavement distress
types. Also, the ability of a rehabilitation technique to correct pavement distress is
dependent on the type of pavement distress, as well as the extent of the distress
and its severity. A suggested guide by ARRA is shown in Figure 2.9. The local
aggregate quality, amount/type of traffic, and climatic conditions are also
important factors which need to be considered.
ARRA (2001) further stated that, though economic analysis which includes life
cycle costs must be done before a decision is made on the method to be adopted,
the following factors must be generally considered:
The type and severity of the existing distresses
Age/condition of the existing pavement materials and their potential for
recycling
Expected design life and performance requirements of the rehabilitation
Traffic growth
Structural capacity of existing roadway
Environmental conditions
Acceptable future maintenance activities
Geometric, drainage, underground and surface utilities
Traffic accommodation and safety
Construction limitations
Project location and size
Contractor availability and experience
Impacts on adjacent businesses and public
Available budget
Good engineering judgement
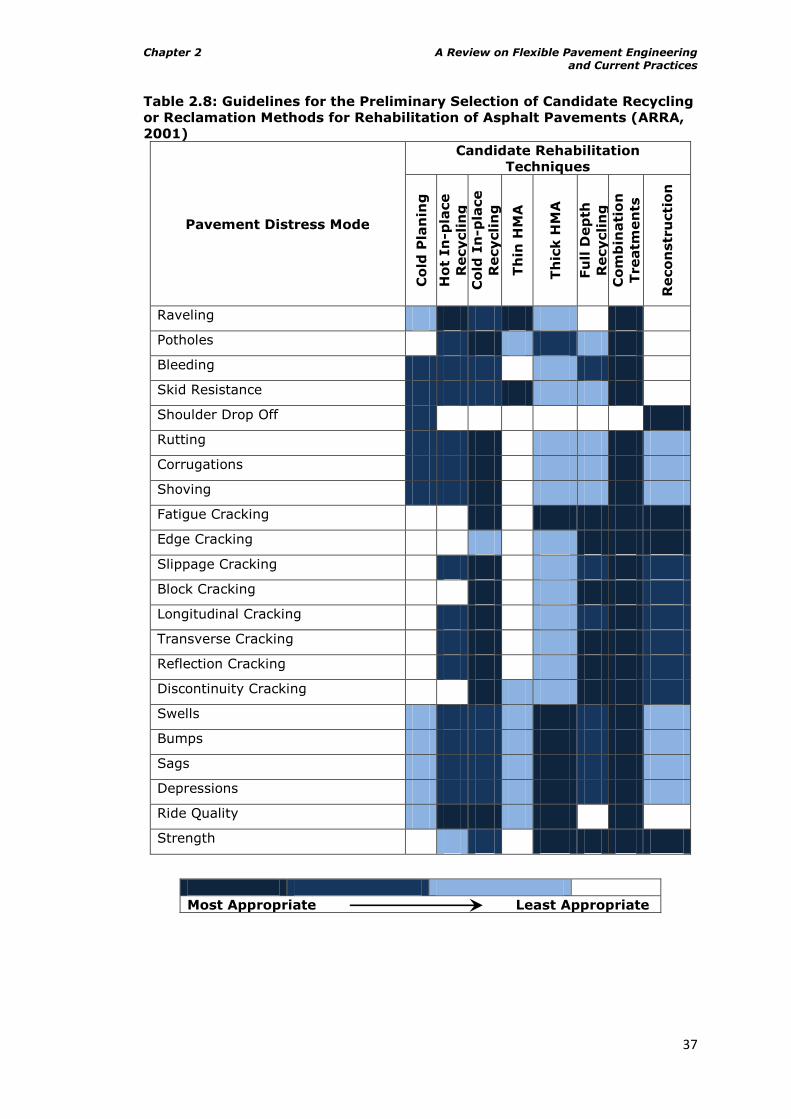
Chapter 2 A Review on Flexible Pavement Engineering and Current Practices
37
Table 2.8: Guidelines for the Preliminary Selection of Candidate Recycling
or Reclamation Methods for Rehabilitation of Asphalt Pavements (ARRA,
2001)
Pavement Distress Mode
Candidate Rehabilitation
Techniques
Co
ld P
lan
ing
Ho
t In
-p
lace
Recycli
ng
C
old
In
-pla
ce
Recycli
ng
Th
in H
MA
Th
ick H
MA
Fu
ll D
ep
th
Recycli
ng
Co
mb
inati
on
Treatm
en
ts
Reco
nstr
ucti
on
Raveling
Potholes
Bleeding
Skid Resistance
Shoulder Drop Off
Rutting
Corrugations
Shoving
Fatigue Cracking
Edge Cracking
Slippage Cracking
Block Cracking
Longitudinal Cracking
Transverse Cracking
Reflection Cracking
Discontinuity Cracking
Swells
Bumps
Sags
Depressions
Ride Quality
Strength
Most Appropriate Least Appropriate
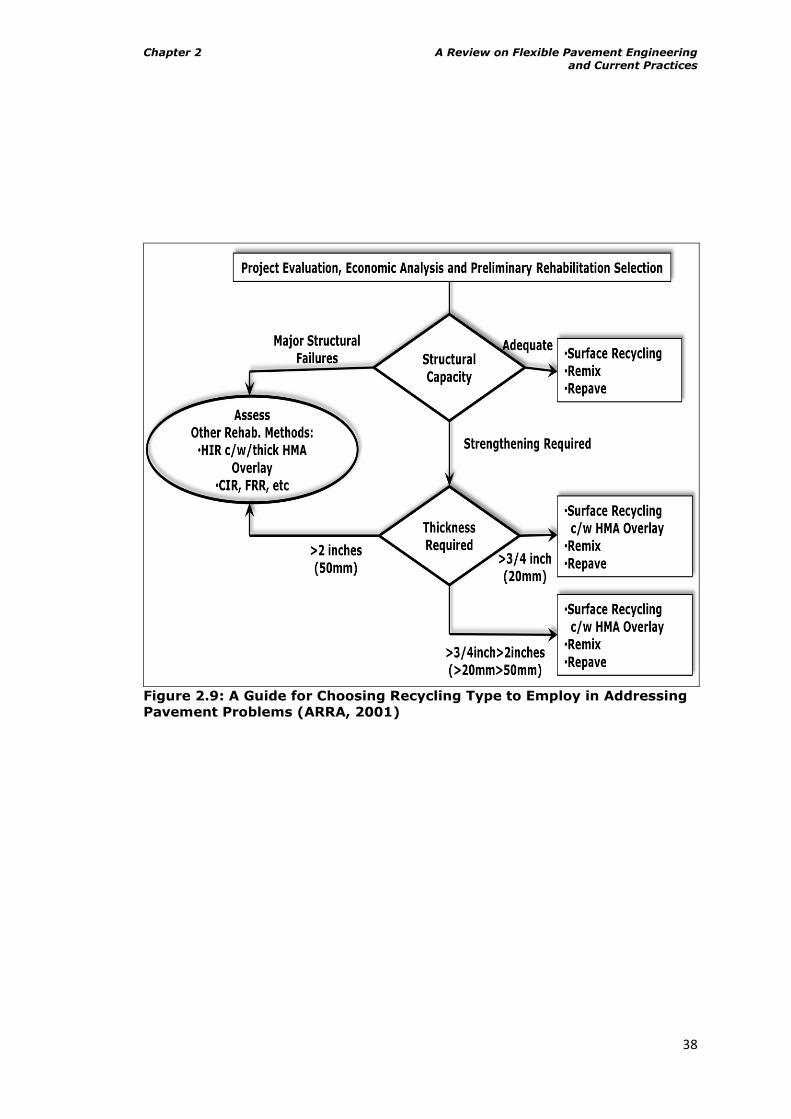
Chapter 2 A Review on Flexible Pavement Engineering and Current Practices
38
Figure 2.9: A Guide for Choosing Recycling Type to Employ in Addressing
Pavement Problems (ARRA, 2001)
Chapter 2 A Review on Flexible Pavement Engineering and Current Practices
39
2.15 Recycling Agents
A number of materials with the purpose of altering the properties of old or aged
binders during the recycling of asphalt pavements have been advanced. Karlsson
and Iscasson (2006) stated that some of the materials go by names such as,
reclaiming, recycling, modifying or softening agents (additives), recycling
modifiers, rejuvenators but also fluxing, extender or aromatic oils. They further
classified rejuvenators into two general groups:
Softening agents- examples of such are, asphalt flux oil, lube stock,
lubricating or crankcase oil, and slurry oils.
Rejuvenating agents- examples of such are lube extracts and oil
extenders.
They also reported that bitumen, bitumen emulsions, cut backs, foamed bitumen
and a number of other proprietary additives have also been used as rejuvenators.
Rejuvenators generally are expected to restore the reclaimed binder
characteristics to a consistency level appropriate for construction purposes and
pavement performance, and, at the same time, optimise the chemical
characteristics with regard to durability. A rejuvenator should also provide
sufficient additional binder to coat any new aggregate that is added to the
reclaimed mixture and satisfy mixture design requirements. Chen et al (2007) in
buttressing this affirmed that the softening agent lowers viscosity of the aged
bitumen while the rejuvenator restores the physical and chemical properties of
the aged bitumen. FHWA (1997) stated that the types of recycling agents used
include emulsified recycling agents, softer grade asphalt cements and cutback
asphalts and that however, the most commonly used recycling agents for
completely cold recycling processes are emulsified asphalt cements or emulsified
recycling agents. This is because the emulsions are liquid at ambient
temperatures and have the capacity for being dispersed throughout the mix and
do not cause major air pollution problems. At ambient temperature, the softening
effect of the recycling agent is a time and temperature dependent physico-
chemical process. Schiavi et al (2003) reported that rejuvenators are solutions or
emulsions of bituminous binders that are used to restore the properties of
softness and low viscosity to hardened (aged) bitumen and that they do this by
restoring the balance between maltenes, which are the volatile part of the
bitumen lost with time, and the asphaltenes, which are produced and precipitated
as a consequence of the ageing. Epps et al (1980) informed that rejuvenators
should easily be dispersed in the old binder, and as well be uniform from batch to
Chapter 2 A Review on Flexible Pavement Engineering and Current Practices
40
batch, and practical to use, for example preventing flashing, smoking and health
risks.
On the same note, PIARC (2003) identified cement, lime and cement, and cement
and emulsion or foamed bitumen in addition to those materials earlier mentioned
as materials which have been found very useful in quite a number of recycling
projects.
In this research work bitumen emulsion will be used as the recycling agent. This
has been chosen since cutback which is similar in operation to emulsion, is
commonly used in Nigeria. Therefore switching to emulsions should not pose
much difficulty compared to foamed bitumen and furthermore existing
equipments for cutbacks can be easily adapted to suit emulsions. Hence further
discussions will focus on bitumen emulsion.
2.16 Bitumen Emulsion
The Asphalt Institute and Asphalt Emulsion Manufacturers Association (1997) and
Read and Whiteoak (2003) reported that there are three ways to make highly
viscous bitumen into a low-viscosity liquid:
heat it,
dissolve it in a petroleum solvent
emulsify it
Thanaya (2003) while discussing same topic opined that, in addition to these
three methods, foaming the highly viscous bitumen is another method for
lowering the viscosity of such bitumen. While other methods of lowering the
viscosity of bitumen are well detailed in literature, the focus of this research work
is on bitumen emulsion. The Asphalt Institute and Asphalt Emulsion
Manufacturers Association (1997) reported that bitumen emulsions are an
effective method of preventive and corrective maintenance of existing pavements
by virtue of energy conservation (normally applied at ambient temperature), very
low or absence of atmospheric pollution and reduced hazards, that they offer
(James, 2006). Also, the fact that bitumen emulsions are suitable replacements
for cutbacks that the Nigerian road sector is used to deem them appropriate for
this research work.
James (2006) and Akzo Nobel (2008) defined an emulsion as the dispersion of
small droplets of one liquid in another. Needham (1996) stated that in contrast to
solutions, the two liquids are coexistent rather than mutually mixed. Akzo Nobel
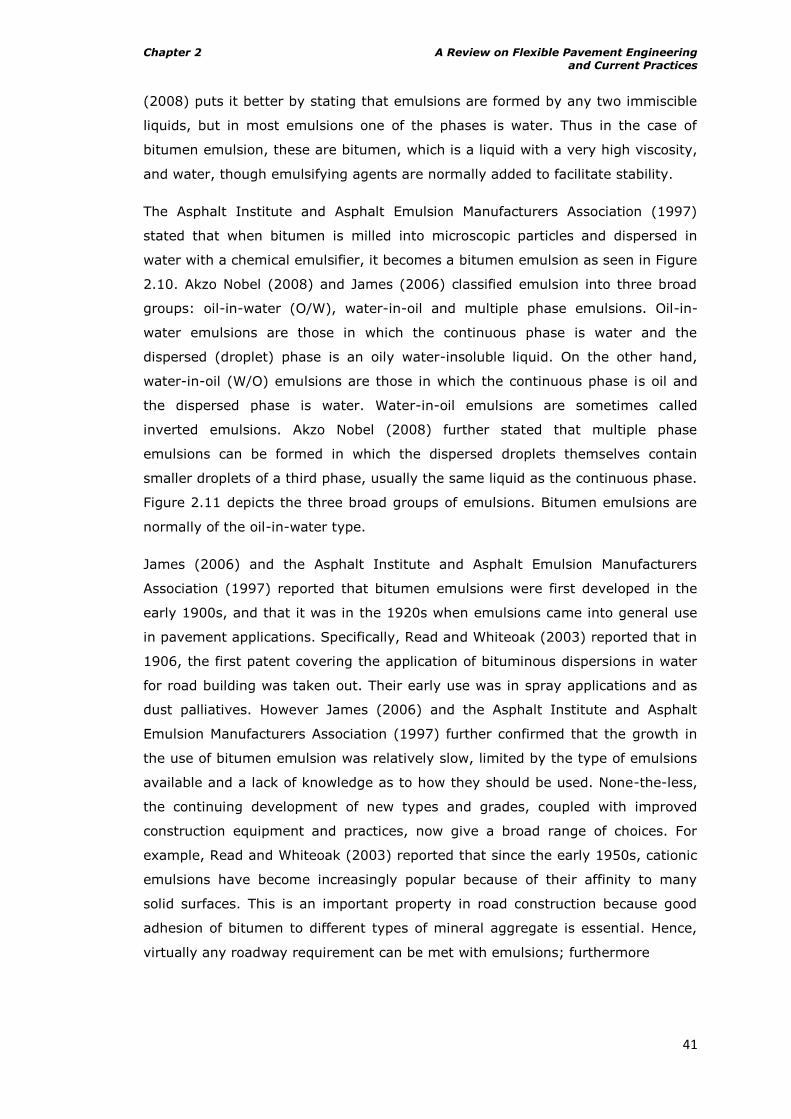
Chapter 2 A Review on Flexible Pavement Engineering and Current Practices
41
(2008) puts it better by stating that emulsions are formed by any two immiscible
liquids, but in most emulsions one of the phases is water. Thus in the case of
bitumen emulsion, these are bitumen, which is a liquid with a very high viscosity,
and water, though emulsifying agents are normally added to facilitate stability.
The Asphalt Institute and Asphalt Emulsion Manufacturers Association (1997)
stated that when bitumen is milled into microscopic particles and dispersed in
water with a chemical emulsifier, it becomes a bitumen emulsion as seen in Figure
2.10. Akzo Nobel (2008) and James (2006) classified emulsion into three broad
groups: oil-in-water (O/W), water-in-oil and multiple phase emulsions. Oil-in-
water emulsions are those in which the continuous phase is water and the
dispersed (droplet) phase is an oily water-insoluble liquid. On the other hand,
water-in-oil (W/O) emulsions are those in which the continuous phase is oil and
the dispersed phase is water. Water-in-oil emulsions are sometimes called
inverted emulsions. Akzo Nobel (2008) further stated that multiple phase
emulsions can be formed in which the dispersed droplets themselves contain
smaller droplets of a third phase, usually the same liquid as the continuous phase.
Figure 2.11 depicts the three broad groups of emulsions. Bitumen emulsions are
normally of the oil-in-water type.
James (2006) and the Asphalt Institute and Asphalt Emulsion Manufacturers
Association (1997) reported that bitumen emulsions were first developed in the
early 1900s, and that it was in the 1920s when emulsions came into general use
in pavement applications. Specifically, Read and Whiteoak (2003) reported that in
1906, the first patent covering the application of bituminous dispersions in water
for road building was taken out. Their early use was in spray applications and as
dust palliatives. However James (2006) and the Asphalt Institute and Asphalt
Emulsion Manufacturers Association (1997) further confirmed that the growth in
the use of bitumen emulsion was relatively slow, limited by the type of emulsions
available and a lack of knowledge as to how they should be used. None-the-less,
the continuing development of new types and grades, coupled with improved
construction equipment and practices, now give a broad range of choices. For
example, Read and Whiteoak (2003) reported that since the early 1950s, cationic
emulsions have become increasingly popular because of their affinity to many
solid surfaces. This is an important property in road construction because good
adhesion of bitumen to different types of mineral aggregate is essential. Hence,
virtually any roadway requirement can be met with emulsions; furthermore
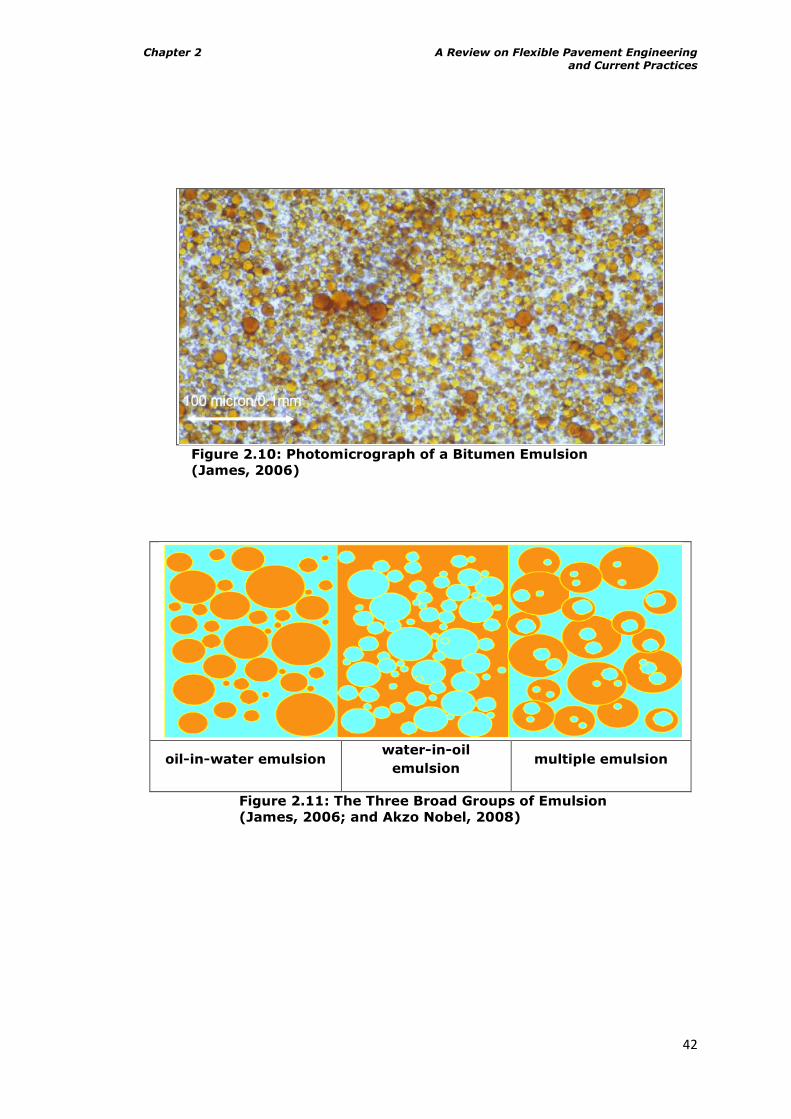
Chapter 2 A Review on Flexible Pavement Engineering and Current Practices
42
Figure 2.10: Photomicrograph of a Bitumen Emulsion
(James, 2006)
oil-in-water emulsion water-in-oil
emulsion multiple emulsion
Figure 2.11: The Three Broad Groups of Emulsion
(James, 2006; and Akzo Nobel, 2008)
Chapter 2 A Review on Flexible Pavement Engineering and Current Practices
43
judicious selection and use can yield significant economic and environmental
benefits.
Bitumen emulsions have been found useful in many road applications. Table 2.9
details some of these applications.
2.17 Manufacture of Bitumen Emulsions
James (2006) and the Asphalt Institute and Asphalt Emulsion Manufacturers
Association (1997) reported that the three main constituents used for the
manufacture of bitumen emulsions are: bitumen, water, and emulsifier. Bitumen
is the main basic ingredient of bitumen emulsion and, in most cases it makes up
from 50 to 75% of the emulsion. Although hardness of base bitumen may vary,
most emulsions are made with bitumens in the 60-250 penetration range. On
occasion, climatic conditions may require harder or softer base bitumen. In any
case, chemical compatibility of the emulsifying agent with the bitumen is essential
for production of a stable emulsion (Asphalt Institute and Asphalt Emulsion
Manufacturers Association, 1997).
Water is the second ingredient used in the manufacture of bitumen emulsions and
it makes up from 25% to 60% of a bitumen emulsion (James, 2006). The Asphalt
Institute and Asphalt Emulsion Manufacturers Association (1997) stated that the
contribution of water to the desired properties of the finished product cannot be
minimised. Impurities in water can lead to the production of an unstable bitumen
emulsion and thus, the water to be used must be carefully selected.
The third ingredient is the emulsifying agent and which makes up from 0.1% to
2.5% of the bitumen emulsion. The property of the bitumen emulsion produced
normally depends on the chemical used as the emulsifier. James (2006) listed
some minor components such as, calcium and sodium chloride (normally included
as 0.1% to 0.2% of the bitumen emulsion to reduce the osmosis of water into the
bitumen and minimize the changes in viscosity), adhesion promoters (to enhance
adhesion properties of bitumen emulsion), solvent (to improve emulsification,
reduce settlement, improve curing rate at low temperatures or to provide the
right binder viscosity) and latex (to improve properties such as cohesion,
resistance to cracking at low temperatures and resistance to flow at high
temperatures).
Bitumen emulsions are usually manufactured using a colloid mill, although other
dispersion devices are possible (Akzo Nobel, 2008). In the colloid mill energy is

Chapter 2 A Review on Flexible Pavement Engineering and Current Practices
44
Table 2.9: Typical Uses of Bitumen Emulsion (Asphalt Institute and
Asphalt Emulsion Manufacturers Association, 1997)
Type of Construction
ASTM D977
AASHTO M208
ASTM D2397
AASHTO M140
RS
-1
RS
-2
HFR
S-2
MS
-1
,
HFM
S-1
MS
-2
,
HFM
S-2
MS
-2
h,
HFM
S-2
h
HFM
S-2
s
SS
-1
SS
-1
h
CR
S-1
CR
S-2
CM
S-2
CM
S-2
h
CS
S-1
CS
S-1
h
Asphalt-Aggregate Mixtures:
Plant Mix (Hot or Warm) XA
Plant Mix (Cold)
Open-Graded Aggregate X X X XDense-Graded Aggregate X X X X XSand X X X X X
Mixed-in-Place
Open-Graded Aggregate X X X XDense-Graded Aggregate X X X X XSand X X X X XSandy Soil X X X X X
Asphalt-Aggregate Applications
Single and Multiple Surface Treatments X X X X XSand Seal X X X X X XSlurry Seal X X X X XMicro Surfacing XE
Sandwich Seal X X XCape Seal X X
Asphalt Application:
Fog Seal XB XC XC XC XC
Prime Coat XD XD XD XD XD
Tack Coat XB XC XC XC XC
Dust Palliative XC XC XC XC
Mulch Treatment XC XC XC XC
Crack Filler X X X XMaintenance mix:
Immediate Use X X XStockpile X
A Grades other than HFMS-2h may be used where experience has shown that they give satisfactory
performance
B Diluted with water by the manufacturer
C Diluted with Water
D Mixed-in prime only
E Polymer must be added during or prior to emulsification
Chapter 2 A Review on Flexible Pavement Engineering and Current Practices
45
applied to the system by passing the mixture of hot bitumen and water phase
between a rotating disc, cone or flywheel and a stator. The rotor as well as stator
may be grooved or have teeth in order to create a turbulent flow. Bitumen
emulsion can be produced either in a batch or an in-line process plant. The batch
process involves at least two process steps- water phase (soap) preparation and
the actual emulsion production. The water phase is prepared in a tank into which
heated water, emulsifier and other emulsion chemicals are metered and the
solution properly mixed. In the emulsion production process, bitumen and the
readymade water phase are dosed to the colloid mill. If solvent is to be added to
the bitumen, then a batch tank is needed for bitumen as well, or the solvent must
be dosed in-line. Figure 2.12 illustrates a typical batch emulsion plant while Figure
2.13 is a picture of an emulsion plant.
Since an entire scientific field has been devoted to the study of emulsification, it is
of no use discussing beyond this point since this work is not focusing on the
production of bitumen emulsion. Meanwhile, Akzo Nobel (2008), Baumgardner
(2006), Thanaya (2003), Ibrahim (1998), Asphalt Institute and Asphalt Emulsion
Manufacturers Association (1997) and Needham (1996) have extensively
discussed the manufacturing of bitumen emulsion among other related issues.
2.20 Classification of Bitumen Emulsions
The emulsifier is a surface-active agent or a surfactant (James, 2006; Asphalt
Institute and Asphalt Emulsion Manufacturers Association, 1997; and Akzo Nobel,
2008). The emulsifier keeps the bitumen droplets in stable suspension and
controls the breaking time. It is also the determining factor in the classification of
the emulsion. The Asphalt Institute and Asphalt Emulsion Manufacturers
Association (1997) stated that surfactants are water soluble substances whose
presence in solution markedly changes the properties of the solvent and the
surfaces they contact. They are categorized by the way they dissociate or ionize
in water. Structurally they possess a molecular balance of a long lipophilic (oil
loving), hydrocarbon tail and a polar, hydrophilic (water loving) head (see Figure
2.14). Surfactants are absorbed at the interface between liquids and gases or
liquid and solid phases. The surfactant molecule or ion acts as a bridge between
two phases (James, 2006).
While the Asphalt Institute and Asphalt Emulsion Manufacturers Association
(1997) classified bitumen emulsions as anionic, cationic, or non-ionic only, Read
and Whiteoak (2003) added a fourth group referred to as clay-stabilised
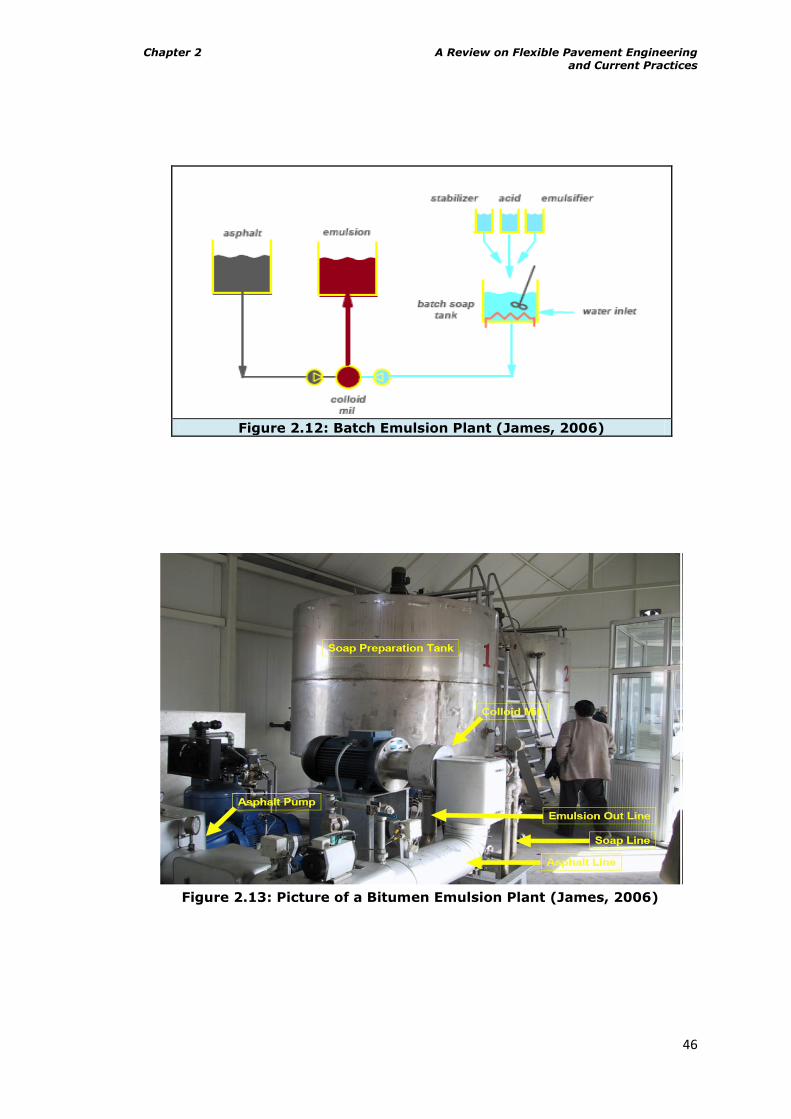
Chapter 2 A Review on Flexible Pavement Engineering and Current Practices
46
Figure 2.12: Batch Emulsion Plant (James, 2006)
Figure 2.13: Picture of a Bitumen Emulsion Plant (James, 2006)
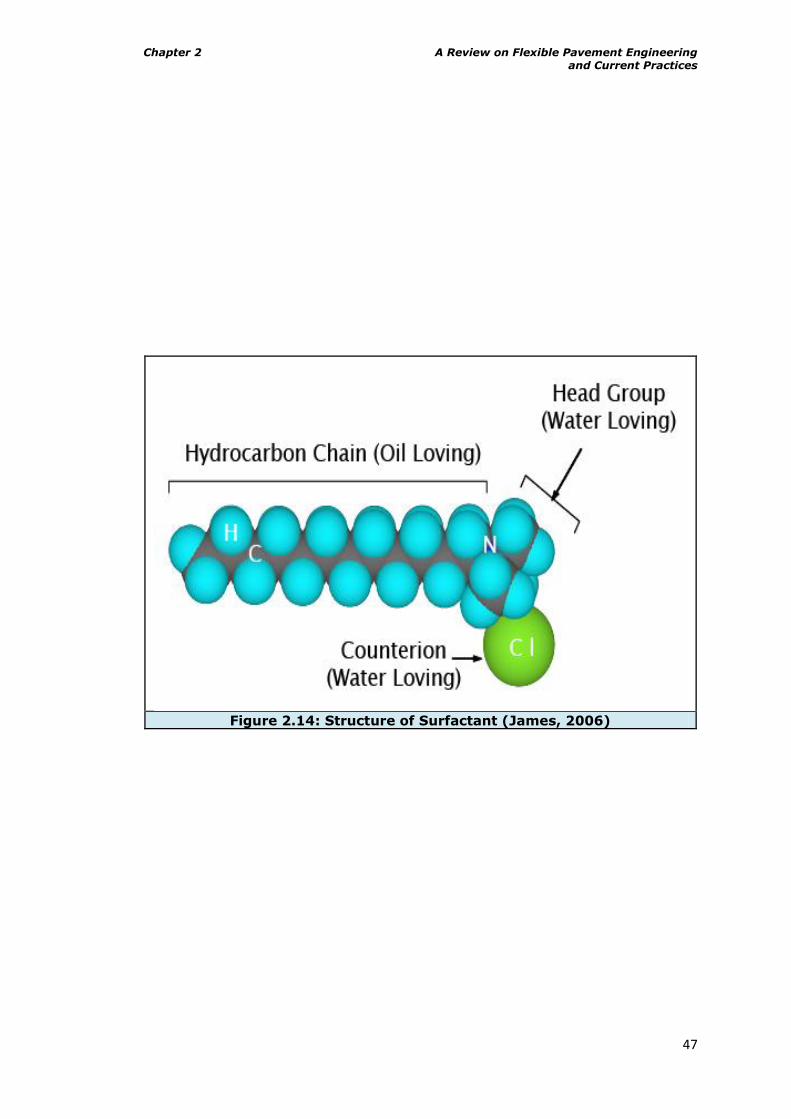
Chapter 2 A Review on Flexible Pavement Engineering and Current Practices
47
Figure 2.14: Structure of Surfactant (James, 2006)
Chapter 2 A Review on Flexible Pavement Engineering and Current Practices
48
emulsions. The most commonly used of these in road construction are the anionic
and the cationic emulsions (James, 2006; Needham, 1996; Thanaya, 2003; and
Read and Whiteoak, 2003).
Meanwhile, the Asphalt Institute and Asphalt Emulsion Manufacturers Association
(1997) reported that the most common anionic emulsifiers are fatty acids, which
are wood-product derivatives such as tall oils, rosins, and lignins. Anionic
emulsifiers are saponified (turned into soap) by reacting with sodium hydroxide or
potassium hydroxide. Most cationic emulsifiers are fatty amines (e.g. diamines,
imidazolines, and amidoamines). The amines are converted into soap by reacting
with acid, usually hydrochloric. Another type of emulsifying agent, fatty
quaternary ammonium salts, is used to produce cationic emulsions. The Asphalt
Institute and Asphalt Emulsion Manufacturers Association (1997) further stated
that, basically there are three types of surfactants that are classified according to
their dissociation characteristics in water and these are:
Anionic Surfactants: CH3(CH2)n COO-Na+ (where the electrovalent and polar
hydrocarbon group is part of the negatively charged ion, when the
compound ionizes)
Non-ionic Surfactants: CH3(CH2)n COO (CH2 CH2O)x H (Where the
hydrophilic group is covalent and polar, and which dissolves without
ionization)
Cationic Surfactants: CH3(CH2)n NH3+Cl- (where the electrovalent and polar
hydrocarbon group is part of the positively charged ion when the
compound ionizes)
The emulsifier is the single most important component in any asphalt emulsion
formulation. To be an affective emulsifier for bitumen, a surfactant must be water
soluble and possess a proper balance between the hydrophilic and lipophilic
properties.
The Asphalt Institute and Asphalt Emulsion Manufacturers Association (1997)
further classified emulsions on the basis of how quickly the asphalt droplets will
coalesce i.e. revert to asphalt cement: Rapid Setting (RS), Medium Setting (MS),
Slow Setting (SS) and Quick Setting (QS). The tendency to coalesce is closely
related to the speed with which an emulsion will become unstable and break after
contacting the surface of an aggregate. An RS emulsion has little or no ability to
mix with an aggregate, an MS emulsion is expected to mix with coarse but not
fine aggregate, SS and QS emulsions are designed to mix with the fine aggregate,
with the QS expected to break more quickly than the SS. Emulsions are further
classified by a series of numbers. The letter “C” in front of the emulsion type
denotes cationic, absence of “C” implies anionic. The numbers in the classification
indicate the relative viscosity of the emulsion. The “h” that follows certain grades
simply means that harder base bitumen is used, while “s” means softer base
Chapter 2 A Review on Flexible Pavement Engineering and Current Practices
49
bitumen e.g. MS-1 and CMS-2s, MS-2h. In this case the “2” means more viscous
than “1”.The “HF” preceding some of the anionic grades indicates high float, as
measured by the float test. High-float emulsions have a gel quality imparted by
the addition of certain chemicals that permit a thicker asphalt film on the
aggregate particles and prevent drain off of asphalt from the aggregate. These
grades are used primarily for cold and warm plant mixes, seal coats and road
mixes. Table 2.9 details these classifications.
2.19 Factors that Affect the Choice and Performance of Bitumen
Emulsions
The Asphalt Institute and Asphalt Emulsion Manufacturers Association (1997)
identified some of the factors that affect the selection of bitumen emulsion as:
Climatic conditions anticipated during construction
Aggregate type, gradation and availability
Construction equipment availability
Geographical location
Traffic control
Environmental considerations
In the same vein, The Asphalt Institute and Asphalt Emulsion Manufacturers
Association (1997) stated that the following factors among others affect the
performance of a bitumen emulsion:
Chemical properties of the base bitumen
Hardness and quantity of the base bitumen
Bitumen particle size in the emulsion
Type and concentration of the emulsifying agent
Manufacturing conditions such as temperature, pressure and shear
Ionic charge on the emulsion particles
Order of addition of the ingredients
Type of equipment used in manufacturing the emulsion
Properties of the emulsifying agent
Addition of chemical modifiers or polymers
Water quality (hardness).
They however opined there is no good substitute for a laboratory evaluation of
the emulsion and the aggregate to be used.
2.20 Tests on Emulsion
There a number of tests normally carried out to check whether emulsions meet
set specifications. Such tests are carried out on the emulsion or the residue.
Some of these common tests and the respective specifications/requirements are
detailed in Table 2.10. These tests and others are properly discussed by the
Chapter 2 A Review on Flexible Pavement Engineering and Current Practices
50
Asphalt Institute and Asphalt Emulsion Manufacturers Association (1997). Most of
the requirements stated in the table apply to temperate climates.
2.21 Curing and Breaking of Bitumen Emulsion
For bitumen emulsion to perform its ultimate function as a binder, the Asphalt
Institute and Asphalt Emulsion Manufacturers Association (1997) stated that the
water in the emulsion must separate from the bitumen phase and evaporate. This
separation is referred to as breaking or setting and is normally characterised by a
change in colour from brown to black. They further state that the specific type
and concentration of emulsifying agent primarily controls the rate of breaking.
Meanwhile (Thom, 2009) stated that emulsion needs the aggregate to be wet too
in order to produce reasonable binder coating.
Curing involves the development of the mechanical properties of the bitumen
(Asphalt Institute and Asphalt Emulsion Manufacturers Association, 1997). For
this to happen, the water must substantially evaporate, and the bitumen emulsion
particles have to coalesce and bond to the aggregate. Thom (2009) however
opined that some of the water is trapped. Figure 2.15 illustrates the processes
involved in the breaking of a typical emulsion.
The Asphalt Institute and Asphalt Emulsion Manufacturers Association (1997)
listed some factors which affect breaking and curing thus:
o water absorption
o aggregate moisture
o weather conditions
o mechanical forces
o surface area
o surface chemistry
o emulsion and aggregate temperature
o type and amount of emulsifier
2.22 Recycling in the Tropics?
There are a lot of success stories which have confirmed that asphalt pavement
recycling generally is a tool and technique for sustainable road development and
that it has come to stay in the developed countries. However, asphalt pavement
recycling is not yet being practiced fully as a method of road
rehabilitation/reclamation in most tropical nations located in Africa. PIARC (2008)
reported that only South Africa, which is located in the South of Sub Saharan
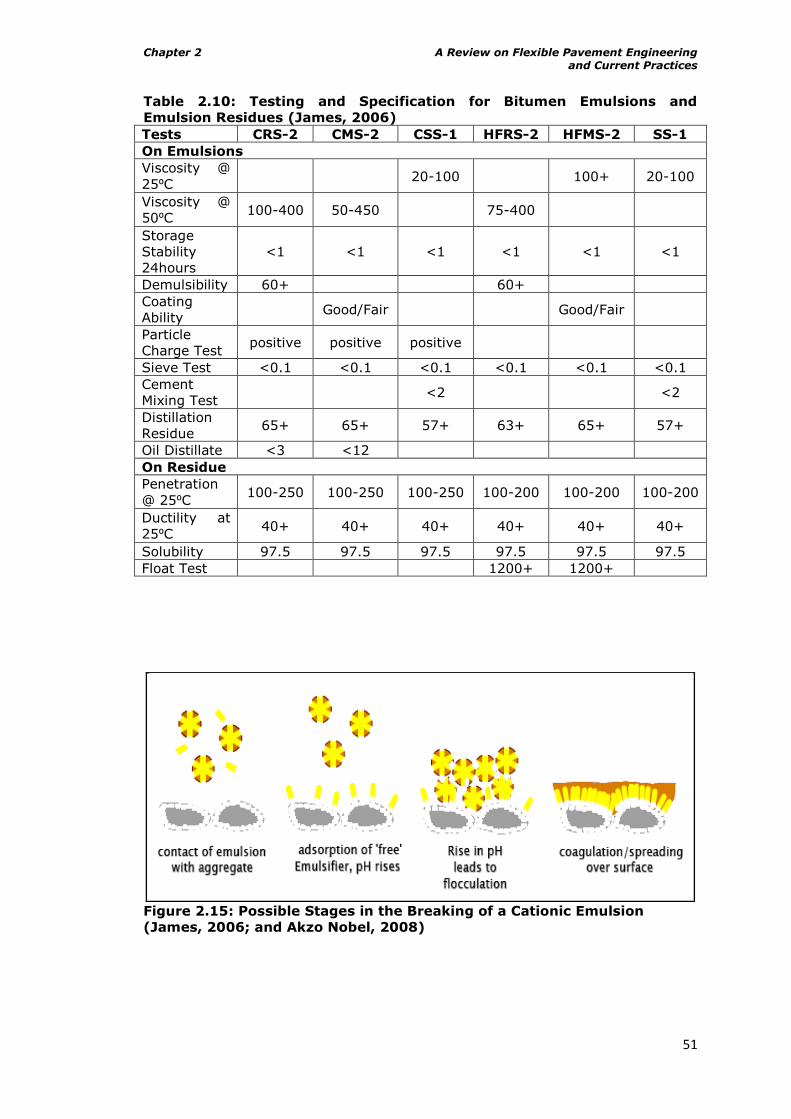
Chapter 2 A Review on Flexible Pavement Engineering and Current Practices
51
Table 2.10: Testing and Specification for Bitumen Emulsions and
Emulsion Residues (James, 2006)
Tests CRS-2 CMS-2 CSS-1 HFRS-2 HFMS-2 SS-1
On Emulsions
Viscosity @
25⁰C 20-100 100+ 20-100
Viscosity @
50⁰C 100-400 50-450 75-400
Storage
Stability
24hours
<1 <1 <1 <1 <1 <1
Demulsibility 60+ 60+
Coating
Ability Good/Fair Good/Fair
Particle
Charge Test positive positive positive
Sieve Test <0.1 <0.1 <0.1 <0.1 <0.1 <0.1 Cement
Mixing Test <2 <2
Distillation
Residue 65+ 65+ 57+ 63+ 65+ 57+
Oil Distillate <3 <12
On Residue
Penetration
@ 25⁰C 100-250 100-250 100-250 100-200 100-200 100-200
Ductility at
25⁰C 40+ 40+ 40+ 40+ 40+ 40+
Solubility 97.5 97.5 97.5 97.5 97.5 97.5
Float Test 1200+ 1200+
Figure 2.15: Possible Stages in the Breaking of a Cationic Emulsion
(James, 2006; and Akzo Nobel, 2008)
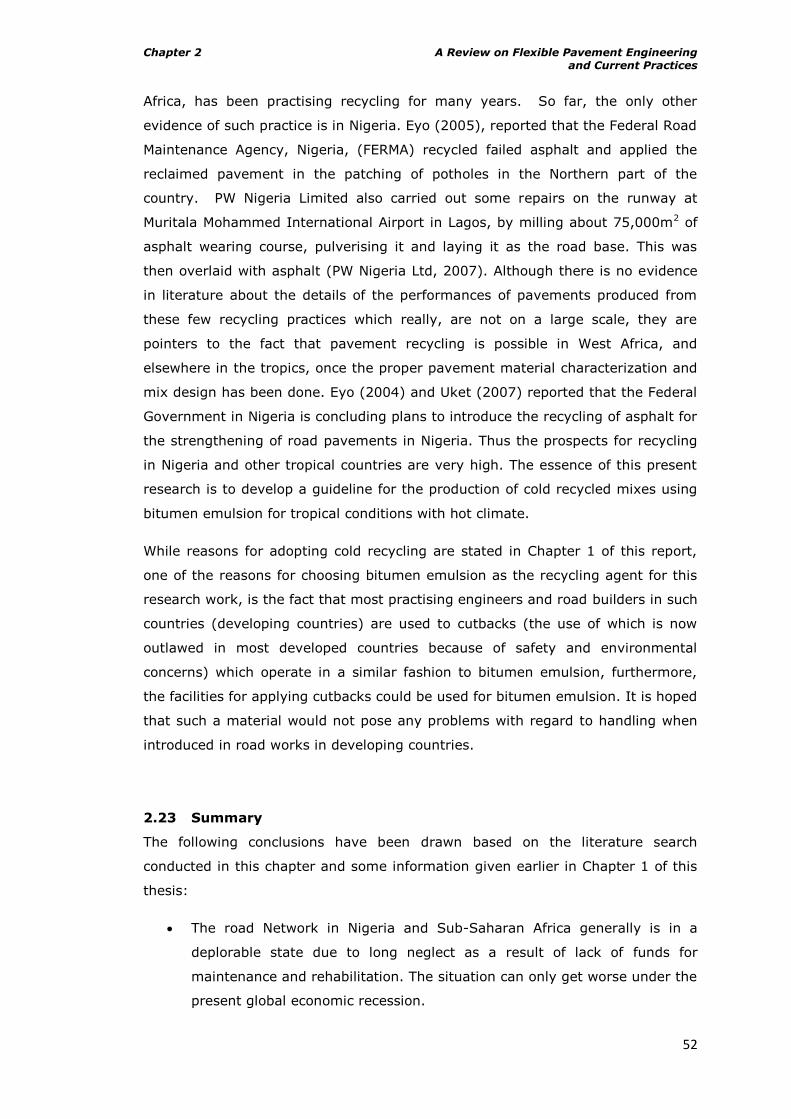
Chapter 2 A Review on Flexible Pavement Engineering and Current Practices
52
Africa, has been practising recycling for many years. So far, the only other
evidence of such practice is in Nigeria. Eyo (2005), reported that the Federal Road
Maintenance Agency, Nigeria, (FERMA) recycled failed asphalt and applied the
reclaimed pavement in the patching of potholes in the Northern part of the
country. PW Nigeria Limited also carried out some repairs on the runway at
Muritala Mohammed International Airport in Lagos, by milling about 75,000m2 of
asphalt wearing course, pulverising it and laying it as the road base. This was
then overlaid with asphalt (PW Nigeria Ltd, 2007). Although there is no evidence
in literature about the details of the performances of pavements produced from
these few recycling practices which really, are not on a large scale, they are
pointers to the fact that pavement recycling is possible in West Africa, and
elsewhere in the tropics, once the proper pavement material characterization and
mix design has been done. Eyo (2004) and Uket (2007) reported that the Federal
Government in Nigeria is concluding plans to introduce the recycling of asphalt for
the strengthening of road pavements in Nigeria. Thus the prospects for recycling
in Nigeria and other tropical countries are very high. The essence of this present
research is to develop a guideline for the production of cold recycled mixes using
bitumen emulsion for tropical conditions with hot climate.
While reasons for adopting cold recycling are stated in Chapter 1 of this report,
one of the reasons for choosing bitumen emulsion as the recycling agent for this
research work, is the fact that most practising engineers and road builders in such
countries (developing countries) are used to cutbacks (the use of which is now
outlawed in most developed countries because of safety and environmental
concerns) which operate in a similar fashion to bitumen emulsion, furthermore,
the facilities for applying cutbacks could be used for bitumen emulsion. It is hoped
that such a material would not pose any problems with regard to handling when
introduced in road works in developing countries.
2.23 Summary
The following conclusions have been drawn based on the literature search
conducted in this chapter and some information given earlier in Chapter 1 of this
thesis:
The road Network in Nigeria and Sub-Saharan Africa generally is in a
deplorable state due to long neglect as a result of lack of funds for
maintenance and rehabilitation. The situation can only get worse under the
present global economic recession.
Chapter 2 A Review on Flexible Pavement Engineering and Current Practices
53
The few road restorations being embarked upon in such places are at the
moment not sustainable and very expensive.
There is urgent need to introduce alternative methods and materials in
order to significantly cut down on costs (stretch funds) and also meet the
2015 target of achieving 82% „very good‟ condition for the entire road
network in Nigeria for example.
With only an improvement of 10% achieved over a period of 4 years
(2003 – 2007) using the conventional means of road restoration, this
implies that the target is not feasible unless extra measures such as the
use of alternative sustainable methods and materials are introduced where
applicable.
Such methods and materials have been applied successfully in America
and Europe where the climate is temperate (cold).
One out of the methods that appeal and which can be applied without
spending huge amounts on machinery is cold recycling RAPs with bitumen
emulsion with a potential cut in costs in the region of 40-60%.
Cold recycling ex situ using bitumen emulsion should not pose any
problems since cutbacks which are similar in operation to emulsions have
been used in the industry for a long time and thus are easily adaptable.
Such would also ensure good quality control.
The development of stiffness that meets minimum requirements for cold
mixes early in life should not be a problem since the hot climate that exists
in Nigeria and other Sub-Saharan Countries would aid quick evaporation of
moisture in such mixes. Moisture hitherto has been identified by
researchers as a major inhibiting factor responsible for slow stiffness
development of cold mixes in temperate climates.
There is a need to develop guidelines that will assist in making provisions
for the use of such alternative materials in the highway design manual of
Nigeria which is lacking at the moment.
Such guidelines can only be developed by formulating and assessing the
mechanical performances of mixes made with RAPs typical of road
pavements in such hot climates. Such assessment should include fatigue
and permanent deformation, having been identified as the major
mechanisms by which flexible pavements fail. It is believed that when
CBEMs are fully cured, their responses should be close to those of HMA.
Chapter 3 A Review on Laboratory Investigations on Cold Mixes
54
3 A Review on Laboratory Investigations on
Cold Mixes
3.1 Overview
Cold mixes with focus on the use of reclaimed asphalt pavements (RAPs) with
bitumen emulsions have been considered as appropriate for the scenario being
considered i.e. construction/rehabilitation of bituminous roads in developing
countries with hot tropical climates for the reasons mentioned earlier in this
thesis. The major benefits of such materials and methods are that they assist in
stretching funds available for roads, since they have been acclaimed among
others to be economical (old materials are reused), energy and eco-efficient,
when used for road construction or upgrading. Presently, developing countries of
the world are finding it difficult to adequately fund road construction,
rehabilitation and upgrading (UNECA, 2007). This study will thus revolve round
RAPs and bitumen emulsion. While bitumen emulsion could easily be sourced
locally, sourcing the heavily aged RAPs needed for this research work might pose
a problem.
Since RAPs have been extensively used in this work, it was thought proper to
start this chapter by discussing the causes of hardening in bituminous materials
and the consequences of such. This discussion is later extended to laboratory
ageing of bituminous materials and cold mixes generally. Researchers have been
able to successfully produce RAPs in the laboratory which are typical of those
found in developed countries with temperate climates (Bell, 1989; and Scholz,
1995). Meanwhile bitumen emulsion was properly discussed in the preceding
chapter.
3.2 Ageing in Bitumen and Bituminous Materials Defined
In a review carried out by Airey (2003) on ageing in bitumen and bituminous
mixtures, he described the term ageing as hardening which is primarily associated
with the loss of volatile components and oxidation of the bitumen during asphalt
mixture construction (short-term ageing) and progressive oxidation of the in-
place material in the field (long-term ageing). Scholz (1995) in his work, defined
bitumen ageing as hardening in bitumen as a result of compositional changes in
the bitumen. Srivastava and Rooijen (2000) considered that the phenomenon in
Chapter 3 A Review on Laboratory Investigations on Cold Mixes
55
which the rheological properties of bitumen change with time (i.e. bitumen
becomes harder and more elastic) is referred to as ageing. Notwithstanding the
associated causes, ageing in bitumen could be defined simply as hardening due to
changes in molecular structure and/or chemistry of bitumen with a consequential
effect on its rheology.
3.3 The Cause, Nature and Process of Ageing in Bitumen and
Bituminous Materials
Activities tailored towards understanding ageing in bitumen have a relatively long
history. Welborn (1979) recorded that since the 1930s, research has continued to
develop an understanding of the factors contributing to short term and long term
ageing. Scholz (1995) reported that many researchers have investigated age
hardening of bitumens and bituminous mixtures and have provided significant
advances toward a better understanding of the mechanisms of age hardening. In
an extensive investigation, Traxler (1963) listed 15 factors (see Table 3.1) that
could aid ageing in bitumen and which consequently lead to a change in its
chemical, rheological and adhesion characteristics. Mastrofini and Scarsella
(1999) on the same issue opined that, colloidal structure and stability of
asphaltenes in residues and bitumens are directly connected with ageing.
Srivastava and Rooijen (2000) averred that some aggregates act as catalysts for
the oxidation reactions, while others have inhibitive effects and that during
service life, oxidation depends, apart from climatic conditions and the ageing
resistance of the bitumen, mainly on the amount of air voids in the asphalt and
the bitumen film thickness.
Lu and Isacsson (2002) opined that bitumen ageing mechanisms in pavements
are two in nature with the main being irreversible, and normally characterised by
chemical changes of the binder which in turn have an impact on the rheological
properties of the bitumen. They identified oxidation, loss of volatile components
and exudation as the factors responsible for the mechanism. On the other hand,
they stated that the second mechanism is a reversible process which is called
physical hardening (steric hardening). Karlsson (2002) from his experience found
out that the degree of ageing depends on temperature, air void content of the
mixture and chemical composition of the binder. Airey (2003) advanced that
molecular structuring over time (steric hardening) and actinic light (primarily
ultraviolet radiation, particularly in desert conditions) may also contribute to
ageing. Judycki and Jaskula (2003) in line with Airey‟s findings declared in
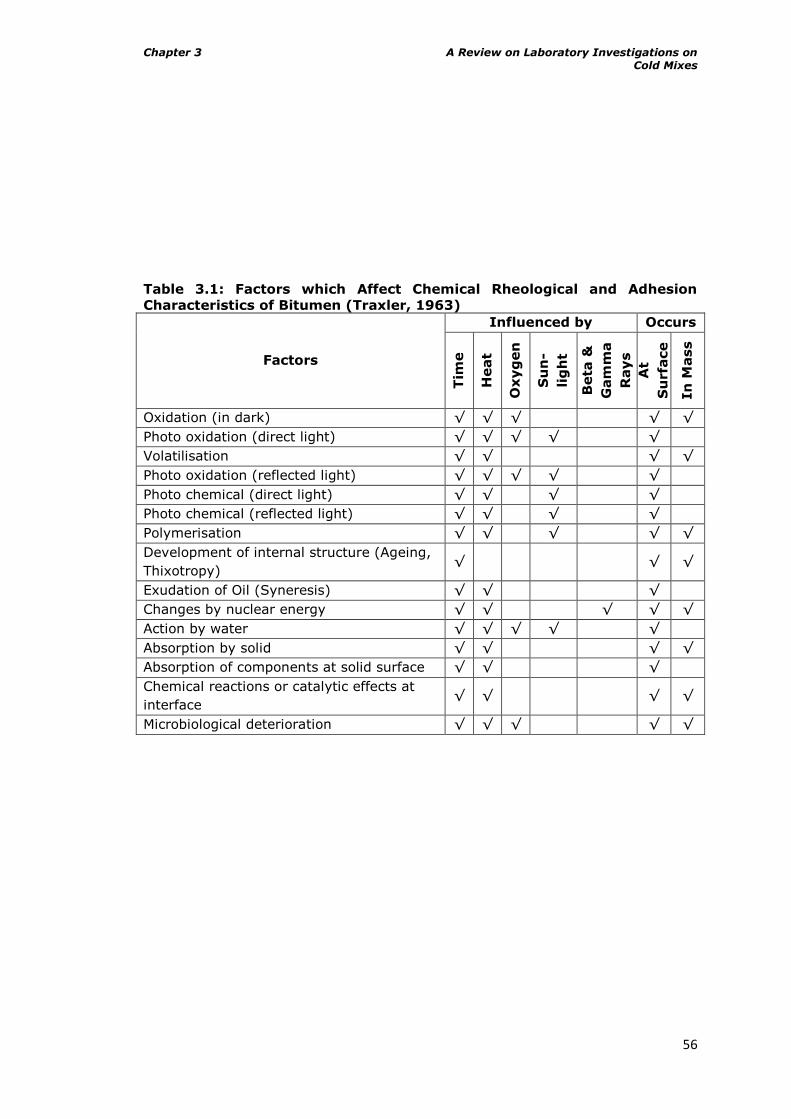
Chapter 3 A Review on Laboratory Investigations on Cold Mixes
56
Table 3.1: Factors which Affect Chemical Rheological and Adhesion
Characteristics of Bitumen (Traxler, 1963)
Factors
Influenced by Occurs
Tim
e
Heat
Oxyg
en
Su
n-
lig
ht
Beta
&
Gam
ma
Rays
At
Su
rfa
ce
In
Mass
Oxidation (in dark) √ √ √ √ √
Photo oxidation (direct light) √ √ √ √ √
Volatilisation √ √ √ √
Photo oxidation (reflected light) √ √ √ √ √
Photo chemical (direct light) √ √ √ √
Photo chemical (reflected light) √ √ √ √
Polymerisation √ √ √ √ √
Development of internal structure (Ageing,
Thixotropy) √ √ √
Exudation of Oil (Syneresis) √ √ √
Changes by nuclear energy √ √ √ √ √
Action by water √ √ √ √ √
Absorption by solid √ √ √ √
Absorption of components at solid surface √ √ √
Chemical reactions or catalytic effects at
interface √ √ √ √
Microbiological deterioration √ √ √ √ √
Chapter 3 A Review on Laboratory Investigations on Cold Mixes
57
their work that short term ageing of bitumen occurs during bitumen storage, mix
production and laying; while long term ageing occurs during the service life of the
asphalt pavement. Mouillet et al (2003) simply stated that ageing in conventional
bitumen is a complex process. In a more recent work, Chen et al (2007)
corroborated the findings of earlier researchers by reporting that the degree of
ageing in bitumen depends on temperature, air void content of the mixture and
the chemical composition of the binder, and that during bitumen oxidative ageing,
the saturates remain the same while solubilising aromatics decrease in quantity,
because the aromatics react with oxygen to produce asphaltene, which causes the
asphaltene content to increase. Also, Shen et al (2007) in agreement with
Scholz‟s findings, using gel permeation chromatography (GPC) showed that
compositional changes of the blends of aged binders are reflected well by the
chromatographic profiles measured by the GPC. Meanwhile, Carswell et al (2008)
in a general review commented that durability of asphalt pavements is a major
issue and that it is a fairly complex problem because it involves a number of
parameters, with binder ageing and moisture damage considered as prominent.
From the forgoing, it could be conveniently summarised that ageing in bitumen
and bituminous mixtures is a complex phenomenon that ultimately manifests as
hardening of the binder. Airey (2003) and Bell (1989) from their extensive
literature reviews, both agreed that the majority of researchers considering
ageing of bitumen and bituminous mixtures have come to the conclusion that, (a)
the loss of oily components by volatility or absorption, (b) changes in composition
by reaction with atmospheric oxygen and (c) molecular structuring that produces
thixotropic effects are the major factors responsible for ageing. Thus, most
researchers have limited their investigations to these three factors and indeed
recent research works have been towing this line as will be discovered in the
subsequent sections of this report.
3.4 Consequences of Ageing in Bitumen and Bituminous Mixtures
Short term ageing of bituminous mixtures i.e. during mixing, transportation,
laying and compaction, is most desired by pavement engineers for the beneficial
role of facilitating the necessary gain in stiffness required for pavements to
support traffic after construction. However, when the ageing becomes excessive,
it could lead to a failure of the pavement functionally and structurally. Scholz
(1995) reported that excessive age hardening can result in a brittle bitumen- one
with significantly reduced flow capabilities- which contributes to various forms of
cracking in the bituminous mixture. In an earlier work, Kim and Burati (1993)
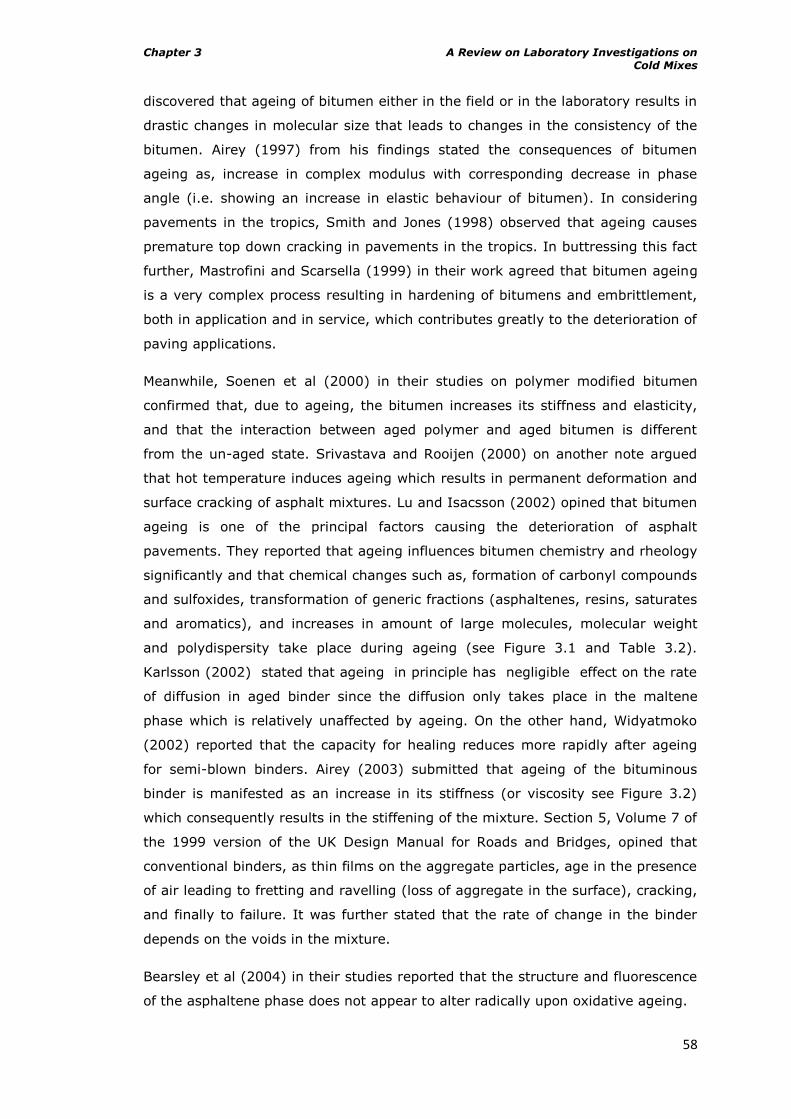
Chapter 3 A Review on Laboratory Investigations on Cold Mixes
58
discovered that ageing of bitumen either in the field or in the laboratory results in
drastic changes in molecular size that leads to changes in the consistency of the
bitumen. Airey (1997) from his findings stated the consequences of bitumen
ageing as, increase in complex modulus with corresponding decrease in phase
angle (i.e. showing an increase in elastic behaviour of bitumen). In considering
pavements in the tropics, Smith and Jones (1998) observed that ageing causes
premature top down cracking in pavements in the tropics. In buttressing this fact
further, Mastrofini and Scarsella (1999) in their work agreed that bitumen ageing
is a very complex process resulting in hardening of bitumens and embrittlement,
both in application and in service, which contributes greatly to the deterioration of
paving applications.
Meanwhile, Soenen et al (2000) in their studies on polymer modified bitumen
confirmed that, due to ageing, the bitumen increases its stiffness and elasticity,
and that the interaction between aged polymer and aged bitumen is different
from the un-aged state. Srivastava and Rooijen (2000) on another note argued
that hot temperature induces ageing which results in permanent deformation and
surface cracking of asphalt mixtures. Lu and Isacsson (2002) opined that bitumen
ageing is one of the principal factors causing the deterioration of asphalt
pavements. They reported that ageing influences bitumen chemistry and rheology
significantly and that chemical changes such as, formation of carbonyl compounds
and sulfoxides, transformation of generic fractions (asphaltenes, resins, saturates
and aromatics), and increases in amount of large molecules, molecular weight
and polydispersity take place during ageing (see Figure 3.1 and Table 3.2).
Karlsson (2002) stated that ageing in principle has negligible effect on the rate
of diffusion in aged binder since the diffusion only takes place in the maltene
phase which is relatively unaffected by ageing. On the other hand, Widyatmoko
(2002) reported that the capacity for healing reduces more rapidly after ageing
for semi-blown binders. Airey (2003) submitted that ageing of the bituminous
binder is manifested as an increase in its stiffness (or viscosity see Figure 3.2)
which consequently results in the stiffening of the mixture. Section 5, Volume 7 of
the 1999 version of the UK Design Manual for Roads and Bridges, opined that
conventional binders, as thin films on the aggregate particles, age in the presence
of air leading to fretting and ravelling (loss of aggregate in the surface), cracking,
and finally to failure. It was further stated that the rate of change in the binder
depends on the voids in the mixture.
Bearsley et al (2004) in their studies reported that the structure and fluorescence
of the asphaltene phase does not appear to alter radically upon oxidative ageing.
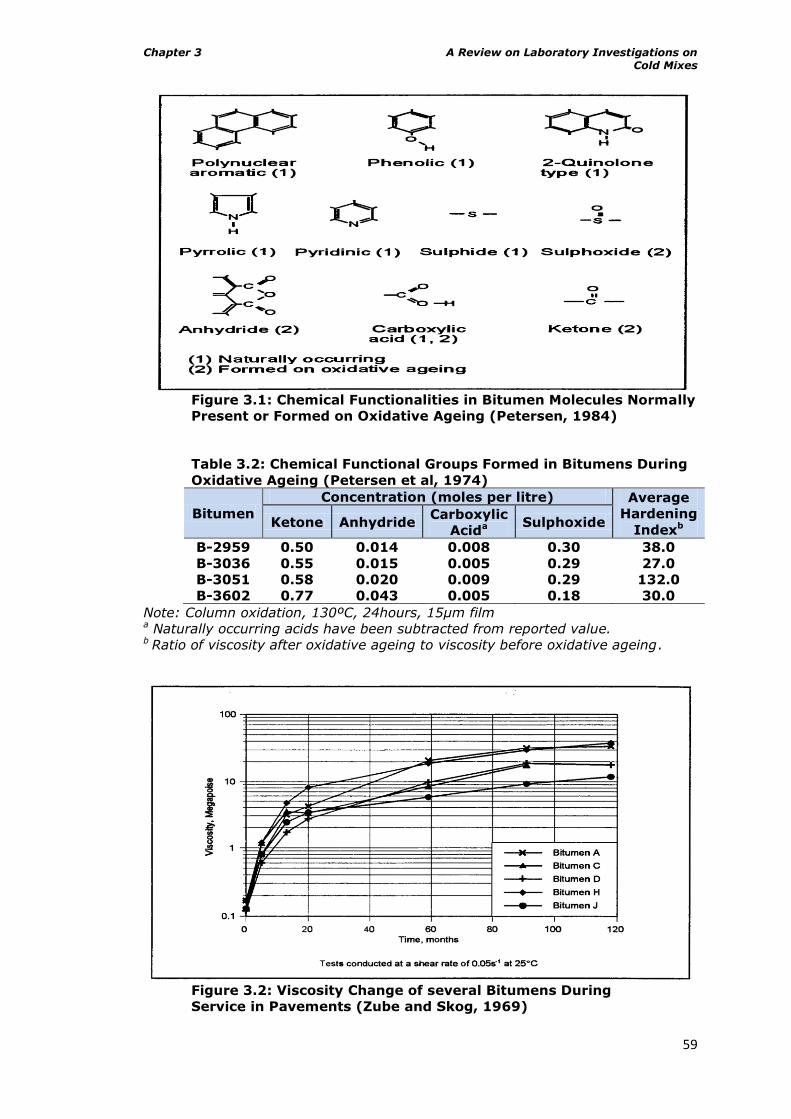
Chapter 3 A Review on Laboratory Investigations on Cold Mixes
59
Figure 3.1: Chemical Functionalities in Bitumen Molecules Normally
Present or Formed on Oxidative Ageing (Petersen, 1984)
Table 3.2: Chemical Functional Groups Formed in Bitumens During
Oxidative Ageing (Petersen et al, 1974)
Bitumen
Concentration (moles per litre) Average
Hardening
Indexb Ketone Anhydride
Carboxylic
Acida Sulphoxide
B-2959
B-3036
B-3051
B-3602
0.50
0.55
0.58
0.77
0.014
0.015
0.020
0.043
0.008
0.005
0.009
0.005
0.30
0.29
0.29
0.18
38.0
27.0
132.0
30.0
Note: Column oxidation, 130ºC, 24hours, 15µm film a Naturally occurring acids have been subtracted from reported value. b Ratio of viscosity after oxidative ageing to viscosity before oxidative ageing.
Figure 3.2: Viscosity Change of several Bitumens During
Service in Pavements (Zube and Skog, 1969)
Chapter 3 A Review on Laboratory Investigations on Cold Mixes
60
Walubita et al (2005) reported that, ageing reduced HMAC mixture fatigue
resistance and its ability to heal and that, ageing plays a significant role in HMAC
mixture fatigue performance and subsequently advised that it should be
incorporated in fatigue design and analysis. Airey et al (2005) are of the opinion
that, age hardening can have two effects, either increasing the load bearing
capacity and permanent deformation resistance of the pavement by producing a
stiffer material or reducing pavement flexibility resulting in the formation of
cracks with the possibility of total failure. Lately, Romera et al (2006) argued that
asphaltene contents increase with ageing and that aged bitumen needs a high
mixing temperature (>200°C) to behave like a fluid material able to wet, adhere
and envelop aggregate.
It is thus obvious from the account of previous researchers that, all things being
equal, ageing in bituminous mixtures could play a beneficial role most especially
when it is short term in nature as it assists the asphalt layer in a flexible
pavement to support the designed traffic loads, since it moderately stiffens the
asphalt layer. On the contrary, when the asphalt layer is aged severely or
excessively, it consequently leads to significant hardening, which imposes some
undesirable attributes on the asphalt layer in which its ability to flex gets reduced,
and thus the pavement assumes a position in which it is at the risk of imminent
failure by cracking since the fatigue life has reduced drastically. Ageing too in this
regard, could cause permanent deformation, ravelling and fretting among others.
All these eventually result in surface defects which ultimately lead to the total
failure of the road if un-attended to.
3.5 Laboratory Protocols that Simulate Field Ageing in Bituminous
Road Pavements
The need for laboratory simulations generally to mimic the behaviour of
engineering structures while in service cannot be overemphasized. Laboratory
simulations serve as avenues through which the performances of such structures
under a near to service/field condition are evaluated before being finally put in
place so that such structures would eventually serve their intended design
functions. Moreover, a pavement which is the structure being considered here,
involves a huge investment, thus every effort at the disposal of road builders
must be harnessed to ensure that such roads perform their roles efficiently and
effectively and also meet the design life at moderate costs. To this end, lots of
simulations have been carried out and are still ongoing to ascertain the
behaviour/performance of asphalt pavements while in service. One such is the
Chapter 3 A Review on Laboratory Investigations on Cold Mixes
61
effect of ageing on the performances of bitumen and bituminous mixtures.
Mastrofini and Scarsella (1999) observed that quite a number of researchers have
tried to simulate in the laboratory the ageing that takes place in service on
asphalt pavements in order to foresee bitumen behaviour during application and
service life. Notable among these are the works carried out by Bell (1989) which
was sponsored under the Strategic Highway Research Program (SHRP) of the
National Research Council in the USA, and Scholz (1995) which was carried out
under the BITUTEST programme in the UK. In his work, Bell (1989) summarised
the various methods that have been used to simulate field ageing in binders and
bituminous mixtures. Similarly, Airey (2003) did an appraisal on the different
laboratory methods that have been advanced by researchers for simulating
ageing that occurs in the field in asphaltic pavements both in the short and long
term. Indeed, these works showed that there are a lot of methods being used.
Some of these methods are summarised in Tables 3.3 and 3.4.
Ever since the works of Bell and Airey, a number of simulations have been
conducted by researchers in this regard. For example, Mouillet et al (2003)
developed a new ageing protocol in which ageing of sample was done by the
simulated oxidation of Polymer Modified Bitumens (PmBs) in the ageing cell, by
heating the sample at 130°C for 2 hours under synthetic air (80% N2, 20% 02).
Before this, the cell was heated under neutral gas from 25°C to 130°C at
111°C/min heating rate. They eventually concluded that the method used for
simulating ageing in their work would be useful for other kinds of organic
materials for which a precise ageing knowledge is essential.
In another elaborate work, Hachiya et al (2003) discovered that asphalt concretes
seem to become hard and brittle owing to both heat ageing and exposure to
natural conditions. They also confirmed that ageing of asphalt in natural
conditions varies with depth below the surface. They noted that asphalt near the
surface hardens to a greater extent and that flexural strength changes fairly little
with ageing time, strain at failure decreases clearly with ageing time and asphalt
concrete mixture increases in stiffness with ageing time. They further remarked
that the change in composition of bitumen due to ageing is a decrease in
aromatics and an increase in asphaltenes and that however, heat ageing merely
causes hardening. They also found out that samples from oxidative ageing of
asphalt concrete had flexural strength and stiffness that increased with the
duration of accelerated oxygen ageing. These authors opined that as asphalt
cannot be aged in this procedure as well as in outdoor exposure, a
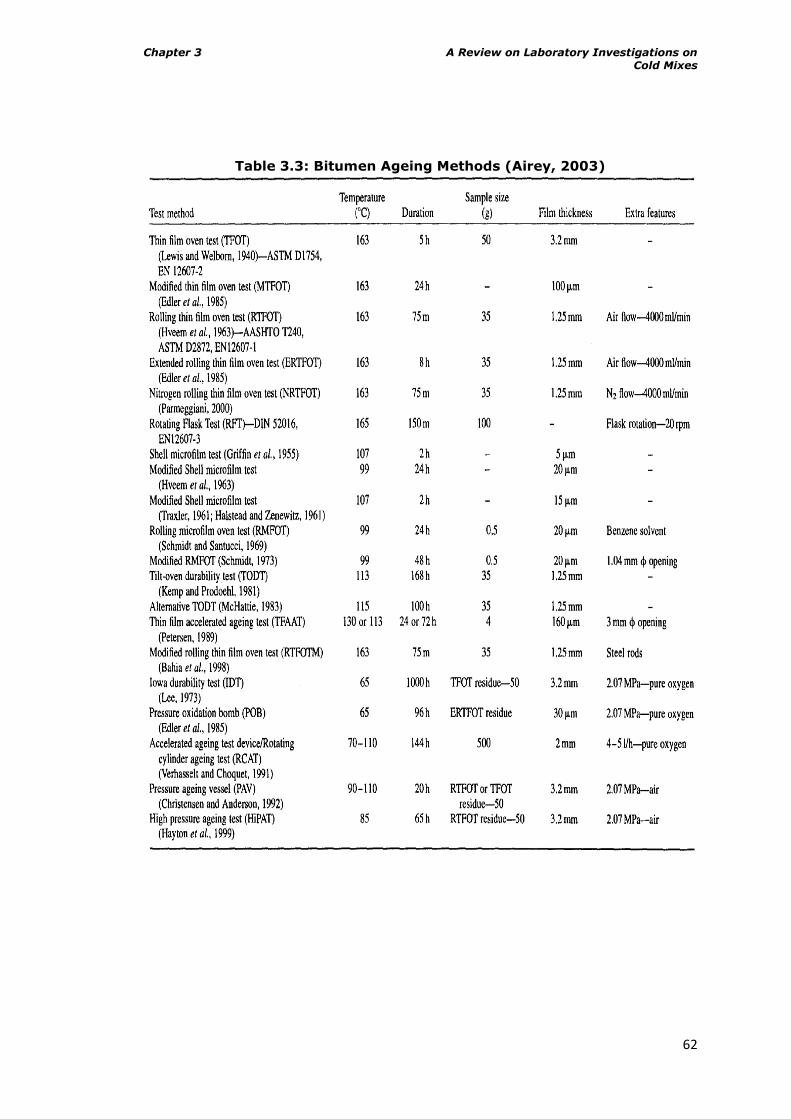
Chapter 3 A Review on Laboratory Investigations on Cold Mixes
62
Table 3.3: Bitumen Ageing Methods (Airey, 2003)
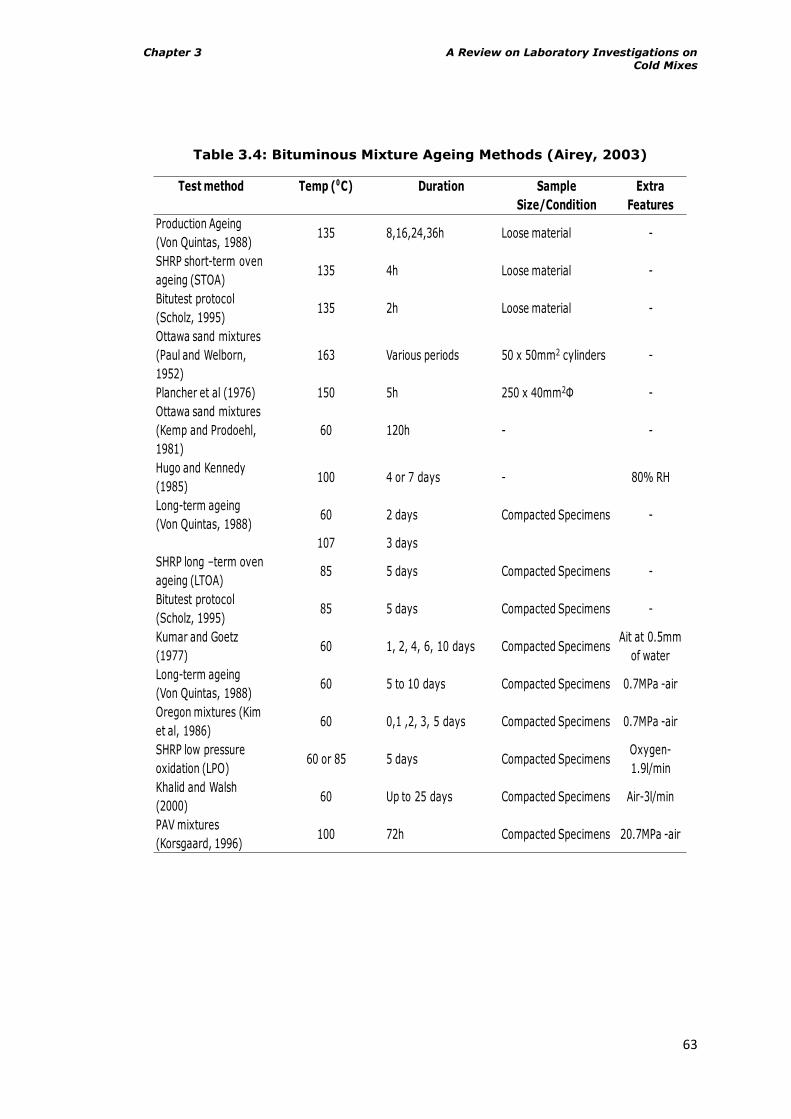
Chapter 3 A Review on Laboratory Investigations on Cold Mixes
63
Table 3.4: Bituminous Mixture Ageing Methods (Airey, 2003)
Test method Temp (⁰C) Duration Sample
Size/Condition
Extra
Features
Production Ageing
(Von Quintas, 1988)135 8,16,24,36h Loose material -
SHRP short-term oven
ageing (STOA)135 4h Loose material -
Bitutest protocol
(Scholz, 1995)135 2h Loose material -
Ottawa sand mixtures
(Paul and Welborn,
1952)
163 Various periods 50 x 50mm2 cylinders -
Plancher et al (1976) 150 5h 250 x 40mm2Ф -
Ottawa sand mixtures
(Kemp and Prodoehl,
1981)
60 120h - -
Hugo and Kennedy
(1985)100 4 or 7 days - 80% RH
Long-term ageing
(Von Quintas, 1988)60 2 days Compacted Specimens -
107 3 days
SHRP long –term oven
ageing (LTOA)85 5 days Compacted Specimens -
Bitutest protocol
(Scholz, 1995)85 5 days Compacted Specimens -
Kumar and Goetz
(1977)60 1, 2, 4, 6, 10 days Compacted Specimens
Ait at 0.5mm
of water
Long-term ageing
(Von Quintas, 1988)60 5 to 10 days Compacted Specimens 0.7MPa -air
Oregon mixtures (Kim
et al, 1986)60 0,1 ,2, 3, 5 days Compacted Specimens 0.7MPa -air
SHRP low pressure
oxidation (LPO)60 or 85 5 days Compacted Specimens
Oxygen-
1.9l/min
Khalid and Walsh
(2000)60 Up to 25 days Compacted Specimens Air-3l/min
PAV mixtures
(Korsgaard, 1996)100 72h Compacted Specimens 20.7MPa -air
Chapter 3 A Review on Laboratory Investigations on Cold Mixes
64
further modification such as a combination of heat ageing and oxygen should be
adopted to simulate actual ageing. The work ended by concluding that ageing rate
of asphalt concrete depends upon various factors such as asphalt type, asphalt
content, aggregate, and environment. They also remarked that ageing is more
pronounced in the top 5mm layer of the pavement than the other parts of the
pavement, thus ageing decreases with depth, and that even if heat ageing could
be used to evaluate hardening of asphalt concretes in terms of mechanical
properties, it cannot be used to evaluate the changes in physical and chemical
properties of asphalt.
On the same note, Walubita et al (2005) used three ageing protocols in their
study. The exposure conditions lasted for 0, 3, and 6months at 60°C, simulating
up to approximately 12 years of Texas field Hot Mix Asphaltic Concrete (HMAC) at
the critical pavement service temperature with no explanation on what critical
meant. All loose HMAC mixtures were subjected to the standard AASHTO PP24hr
short-oven ageing process at 135°C prior to 60°C ageing. After HMAC mixture
testing, aged binders were extracted for testing to characterize the binder‟s
chemical and physical properties. They found out that the mixture tensile test
conducted at 20°C indicated that as HMAC ages, it becomes more brittle, thus
breaking under tensile loading at a lower strain level.
Indeed the results of these simulations are instructive. Bell et al (1994) reported
that two days of long term oven ageing at 85°C is representative of pavement up
to 5 years old depending on climate. Four days of oven ageing at 85°C appears to
be representative of field ageing of about 15yrs in a Wet-No Freeze zone and
about 7yrs in a Dry Freeze zone. Oven ageing at 100°C for one, two and four
days causes similar changes in modulus to 85°C ageing for two, four and eight
days, but damages the samples in the process. Oven ageing at 85°C is thus
considered to be more reliable though nothing was mentioned about the nature of
the damage caused by oven ageing at 100°C. In line with these assertions, Hinds
(2007) in his analysis, and also articulated by Maguire (2008), stated that, using
the SHRP long term oven ageing technique reflects an effect equivalent to
15years in a wet no freeze climate. Kulash (1994) had earlier reported that, in the
Pressure Ageing Vessel, bitumen aged at 2.07MPa air for 20 hours at 100°C
simulates a 5year aged level in a pavement in the temperate region, and that the
forced draft oven is able to simulate field ageing (short and long term). Airey et al
(2005) observed that the Saturation Ageing Tensile Stiffness Test (SATS) was
able to reproduce the 60% reduction in stiffness modulus found for the acidic
aggregate HMB mixture in the field.
Chapter 3 A Review on Laboratory Investigations on Cold Mixes
65
It could be summarised from the foregoing that, ageing tests are basically two i.e.
those carried out on binders and those carried out on bituminous mixtures. Airey
(2003) listed ageing tests for bituminous binders thus:
- Extended Heating Procedures;
Thin Film Oven Test (TFOT),
Rolling Thin Film Oven Test (RTFOT),
Rotating Flask Test (DIN 52016),
Shell Microfilm Test,
Rolling Microfilm Oven Test (RMOT),
Tilt-oven Durability Test,
Thin Film Accelerated Ageing Test,
Modified Rolling Thin Film Oven Test,
- Oxidative (Air Blowing) Procedures;
Iowa Durability Test,
Pressure oxidation Bomb,
Accelerated Ageing test Device/Rotating Cylinder Ageing
Test (RCAT),
Pressure Ageing Vessel (PAV), High Pressure Ageing Test (HiPAT),
- Ultraviolet and Infrared Light Treatments;
- Microwave Ageing;
- Steric Hardening (no tests that address this phenomenon at the
moment).
While ageing tests for asphalt mixtures could be:
extended heating procedures,
oxidation tests,
ultraviolet/infrared treatment and,
steric hardening.
Airey (2003) observed that the TFOT and RTFOT are the most commonly used
short term ageing tests for simulating the hardening that occurs during asphalt
mixture production. Currently, the most commonly used binder tests to simulate
long-term ageing are the PAV and RCAT. In terms of long term ageing, no one
test seems to be satisfactory for all cases and the RCAT method, based on a
kinematic approach to ageing is probably the most acceptable. On the same note,
Airey (2003) recorded that the most promising methods for short term ageing of
asphalt mixtures are extended heating of the loose material and extended mixing
and that the most promising methods for long term ageing of mixtures include
extended oven ageing, such as the SHRP long-term oven ageing method,
pressure oxidation, using low pressure oxidation as well as pressurised
Chapter 3 A Review on Laboratory Investigations on Cold Mixes
66
procedures, and ultraviolet and infrared light treatments. Meanwhile tests on
mixtures could be conducted on either a compacted sample or a loose sample.
Bell (1989) on a comparative note, observed that research mostly has been
focusing on bitumen, and that there has been little research on the ageing of
asphalt mixtures, and to date, there is no standard test. Airey (2003) reasoned in
line with this assertion when he stated that extended heating procedures show
the most promise for short term ageing, and pressure oxidation and/or extended
heating the most promise for long term ageing. He further advised that the
condition for choosing whatever method used is that it should simulate conditions
in the field and emphasize oxidation. He also remarked that the forced draft oven
promises to be useful in extended oven ageing over the conventional ovens and
however cautioned that, for mixtures, an elevated temperature level used in tests
could cause specimen disruption. He also expressed a concern/need for the
evaluation of the integrity of the compacted samples at high temperatures since it
has been purportedly envisaged that the internal structure of a sample may be
disrupted at temperatures such as 140°C and that in extreme cases the samples
may slump. It must be noted that all these works have been carried out to
simulate what obtains in the temperate regions of the world.
In conclusion, this review showed that temperature is an important factor for
simulating accelerated ageing of asphalt mixtures in the laboratory. Also physical
hardening of residual binder in the mix as a consequence of ageing could affect
both the chemistry and rheology of bituminous binders. The review also showed
that extended ageing of either compacted or loose asphalt mixtures in the forced
draft oven are considered suitable to simulate both short and long term ageing in
the laboratory. Ageing of compacted specimens is considered appropriate for
cases where samples are to undergo further testing for mechanical properties
such as stiffness modulus. Ageing of loose samples in particular is deemed
appropriate for cases where aged materials are to be used as RAP in reconstituted
asphalt mix for studies on recycled asphalt mixtures. Although ageing of
compacted specimens is not used in the study discussed in this thesis, the
softening point of the binder in the asphalt mix can be used as a guide for
choosing ageing temperature to forestall specimen disruption. Ageing loose
mixtures is a more practical means for achieving uniformly aged asphalt mix in a
short laboratory time. This method also enables easy reconstitution of aged
asphalt into new asphalt mix when compared to aged compacted specimens. It
has the advantage that ageing can be conducted at high temperature, though
there is the concern that excessive and high ageing temperatures can potentially
Chapter 3 A Review on Laboratory Investigations on Cold Mixes
67
damage the binder in the mix such that the physico-chemical and rheological
properties of the binder are significantly different from what is obtained on the
road pavement.
3.6 Cold Mixes
Generally, there are basically three types of asphalt mixes used in road
construction. These are the Hot Mix (which is the conventional), the Cold Mix, and
the Warm Mix. This work focuses on cold mixes for the obvious reasons stated
earlier in Chapter 1 of this report. The term cold is used in the sense that virtually
all the operations involved in the production of the material are carried out at
ambient temperature. Needham (1996) stated that cold mix is manufactured at
ambient temperatures, although some processes can use the emulsion warmed to
around 60°C. Meanwhile, the materials being used for the preparation of cold
mixes are very similar to those in hot mix, and as was stated in Chapter 2 of this
write up, the major difference is that the bituminous binders used in cold mixes
are liquefied and applied at relatively low temperatures compared to that of hot
mix. Achieving these would mean that the binder is either emulsified or foamed.
Since the use of water is normally involved in these two processes, hydraulic
binders too are usually applied to facilitate among other things, the rapid
evaporation of water in the mix. Thanaya (2003) listed the most commonly used
types of Cold Bituminous Mixtures as:
- cold lay Macadam (cutbacks),
- grave emulsions (developed in France),
- foamed bituminous mixtures,
- CBEMs (Emulsified Asphalt Materials – USA) (Ibrahim
and Thom, 1997).
Many researchers in this field are of the opinion that, in terms of energy savings,
cold mixtures appear to be much more efficient than hot mixtures (Needham,
1996; Ibrahim, 1998; Thanaya, 2003; and Thom, 2008). Needham (1996) stated
that, cold mix can be manufactured to cater for a range of different applicational
regimes and that they are used mainly for base course and sometimes for binder
or wearing course. They are applied through a number of methods ranging from
hand application, through graders, finishers or pavers to self contained mixing
and laying plants. Compaction regimes for cold mix are quite varied at present as
different companies advocate and utilize different techniques. However, the
preferred method seems to be steel rolling, followed by very heavy pneumatic
Chapter 3 A Review on Laboratory Investigations on Cold Mixes
68
tyred roller and finally finishing with steel. Meanwhile, PIARC (2003) stated that
since cold mixes are difficult to compact, a continuous grading is suggested and
that gap gradations and stone matrix are generally unsuitable for cold recycling.
The grading envelopes used for the design of grave emulsion can be taken as a
reference when using emulsion as the recycling agent in cold recycling.
In cold mixes, and particularly in the case of recycling, in addition to the specific
area, it is necessary to take into account the capability of absorption of water and
the chemical nature of the mineral surface. Needham (1996) opined that cold mix
wearing course can be used on all but the most highly trafficked roads. Mixtures
can be produced in specialised mixing plant, motor pavers or simple concrete
mixers in which case the mixture can be produced on site. Also in line with
Needham‟s assertions, but now considering the use of RAP, Carswell et al (2008)
in an overview of the design guide and specification that is now the common
practice for recycling in the UK, reported that cold recycling using a plant mixed
process (ex situ) allows for screening and crushing of aggregates, prior to mixing
with binder(s) in plant located nearby and the laying of materials in one or more
layers using a paver. It also gives room for the introduction of alternative
aggregates from sources other than the existing pavement. They stated further
that, provided that the cold recycled materials can achieve the desired
performance, the potential use of cold recycling is not limited. However, each site
needs to be evaluated for the most appropriate maintenance selected in terms of:
location,
proximity of suitable location for setting up ex situ plant,
proximity of source(s) of alternative materials, if required,
type(s) and severity of deterioration,
extent of deterioration,
location of services within the pavement construction,
condition of drainage,
edge detail and verge condition.
Despite of all these advantages, cold mixes are still generally classified as inferior
to hot mixtures with respect to performance, although the engineering
equivalence and practical difficulties in adopting cold mixtures formulations have
not yet been clearly defined (Biczysko, 1996). Carswell (2004) remarked that,
looking at cold mixes, for example, despite the advantages for environment and
health, they are still perceived as asphalt 2nd Class, used for reinforcement, re-
profiling or for micro-surfacing, only where unavoidable, and only on secondary
roads. Leech (1994) reported that, cold bituminous emulsions mixes are not so
common in the UK because of the cold climatic conditions, more over in the UK
Chapter 3 A Review on Laboratory Investigations on Cold Mixes
69
there are sufficient HMA plants available and less remote areas- a serious
challenge for CBEMs (Ibrahim and Thom, 1997; Khalid and Eta, 1997).
This position must have been premised on the fact that such a cold climatic
condition would normally inhibit the rapid evaporation of water in the mix.
Thanaya (2003) maintained that, cold mixes did not receive attention until 1992
in the UK. To this end, Zoorob and Thanaya (2002) remarked that Cold
bituminous emulsion mixtures (CBEMs) are more universally accepted for low to
medium traffic conditions, for works in remote areas and for small scale jobs such
as reinstatement work. These notwithstanding, cold mixes have been used
successfully in France, South Africa, Sweden and USA among other countries
since the 1970s to meet various needs on the road (Thanaya, 2003; and
Needham, 1996) and thus cold mixes hold a lot of promise. Carswell (2004) in
buttressing this opined that recent experiences with cold mixes have been
showing that they are far beyond the state of being assumed as asphalt 2nd
class. He further stated that, an understanding of these mixes is improving, and it
is sure that they are finding their ways to the high class, and thus would help gain
a higher market share all over Europe. Zoorob and Thanaya (2002) in their work
further strengthened this opinion in which they found out that, CBEMs with added
cement at full curing can be comparable to conventional hot bituminous mixtures
in terms of indirect tensile stiffness modulus.
In retrospect, it is worth noting that most of the previous works have been
considering only virgin materials for cold mixes with the exception of Zoorob and
Thanaya (2002) and Thanaya (2003) that looked at the incorporation of waste
materials such as PFA, Red Porphyry Sand, Synthetic Aggregates, Steel Slag and
Crumb Rubber into CBEMs. Most researchers only mentioned the possibility of
using RAP in passing (Needham, 1996; Ibrahim, 1998; and Thanaya, 2003), and
where they are used they are just regarded as black rocks without any regard to
the properties of the residual binder in the RAP. The only related work to the
author‟s knowledge is still ongoing at the University of Iowa, USA, which concerns
cold-in place recycling typical of a temperate region (Lee, 2007). This present
work focuses on cold bituminous emulsion mixtures with RAP and virgin materials
as aggregates in a circumstance surrounded by tropical condition and as well ex
situ recycling.
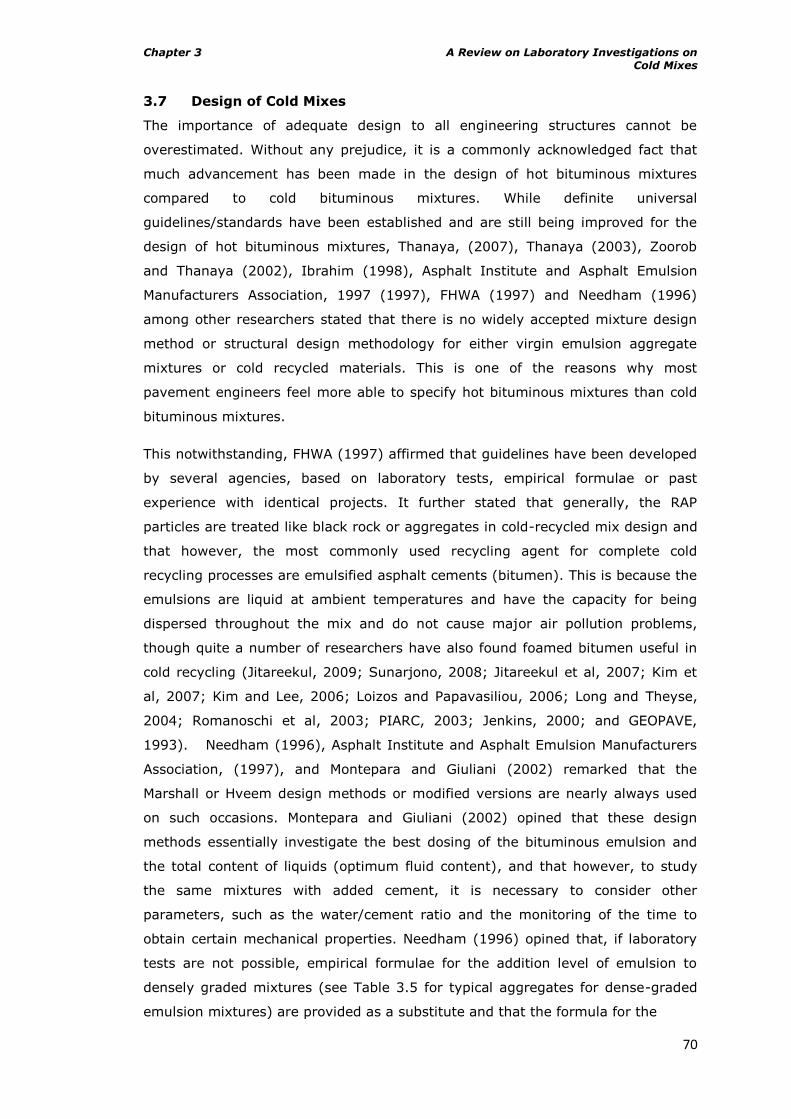
Chapter 3 A Review on Laboratory Investigations on Cold Mixes
70
3.7 Design of Cold Mixes
The importance of adequate design to all engineering structures cannot be
overestimated. Without any prejudice, it is a commonly acknowledged fact that
much advancement has been made in the design of hot bituminous mixtures
compared to cold bituminous mixtures. While definite universal
guidelines/standards have been established and are still being improved for the
design of hot bituminous mixtures, Thanaya, (2007), Thanaya (2003), Zoorob
and Thanaya (2002), Ibrahim (1998), Asphalt Institute and Asphalt Emulsion
Manufacturers Association, 1997 (1997), FHWA (1997) and Needham (1996)
among other researchers stated that there is no widely accepted mixture design
method or structural design methodology for either virgin emulsion aggregate
mixtures or cold recycled materials. This is one of the reasons why most
pavement engineers feel more able to specify hot bituminous mixtures than cold
bituminous mixtures.
This notwithstanding, FHWA (1997) affirmed that guidelines have been developed
by several agencies, based on laboratory tests, empirical formulae or past
experience with identical projects. It further stated that generally, the RAP
particles are treated like black rock or aggregates in cold-recycled mix design and
that however, the most commonly used recycling agent for complete cold
recycling processes are emulsified asphalt cements (bitumen). This is because the
emulsions are liquid at ambient temperatures and have the capacity for being
dispersed throughout the mix and do not cause major air pollution problems,
though quite a number of researchers have also found foamed bitumen useful in
cold recycling (Jitareekul, 2009; Sunarjono, 2008; Jitareekul et al, 2007; Kim et
al, 2007; Kim and Lee, 2006; Loizos and Papavasiliou, 2006; Long and Theyse,
2004; Romanoschi et al, 2003; PIARC, 2003; Jenkins, 2000; and GEOPAVE,
1993). Needham (1996), Asphalt Institute and Asphalt Emulsion Manufacturers
Association, (1997), and Montepara and Giuliani (2002) remarked that the
Marshall or Hveem design methods or modified versions are nearly always used
on such occasions. Montepara and Giuliani (2002) opined that these design
methods essentially investigate the best dosing of the bituminous emulsion and
the total content of liquids (optimum fluid content), and that however, to study
the same mixtures with added cement, it is necessary to consider other
parameters, such as the water/cement ratio and the monitoring of the time to
obtain certain mechanical properties. Needham (1996) opined that, if laboratory
tests are not possible, empirical formulae for the addition level of emulsion to
densely graded mixtures (see Table 3.5 for typical aggregates for dense-graded
emulsion mixtures) are provided as a substitute and that the formula for the
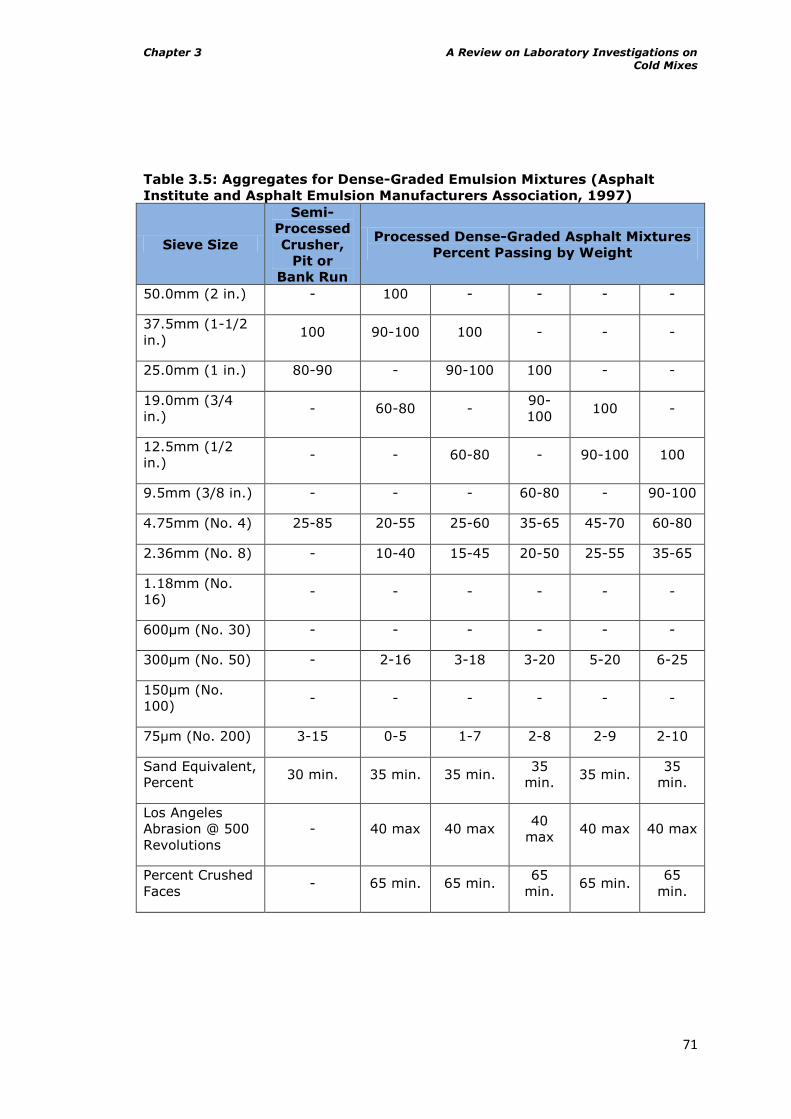
Chapter 3 A Review on Laboratory Investigations on Cold Mixes
71
Table 3.5: Aggregates for Dense-Graded Emulsion Mixtures (Asphalt
Institute and Asphalt Emulsion Manufacturers Association, 1997)
Sieve Size
Semi-
Processed
Crusher,
Pit or
Bank Run
Processed Dense-Graded Asphalt Mixtures
Percent Passing by Weight
50.0mm (2 in.) - 100 - - - -
37.5mm (1-1/2
in.) 100 90-100 100 - - -
25.0mm (1 in.) 80-90 - 90-100 100 - -
19.0mm (3/4
in.) - 60-80 -
90-
100 100 -
12.5mm (1/2
in.) - - 60-80 - 90-100 100
9.5mm (3/8 in.) - - - 60-80 - 90-100
4.75mm (No. 4) 25-85 20-55 25-60 35-65 45-70 60-80
2.36mm (No. 8) - 10-40 15-45 20-50 25-55 35-65
1.18mm (No.
16) - - - - - -
600µm (No. 30) - - - - - -
300µm (No. 50) - 2-16 3-18 3-20 5-20 6-25
150µm (No.
100) - - - - - -
75µm (No. 200) 3-15 0-5 1-7 2-8 2-9 2-10
Sand Equivalent,
Percent 30 min. 35 min. 35 min.
35
min. 35 min.
35
min.
Los Angeles
Abrasion @ 500
Revolutions
- 40 max 40 max 40
max 40 max 40 max
Percent Crushed
Faces - 65 min. 65 min.
65
min. 65 min.
65
min.

Chapter 3 A Review on Laboratory Investigations on Cold Mixes
72
initial residual binder should be as shown below in equation 3.1:
) (3.1)
Where:
P = Percent by weight of Initial Residual bitumen content by mass of total mixture
A = Percent of mineral aggregate > 2.36mm
B = Percent of mineral aggregate <2.36 and >0.75mm
C = Percent of mineral aggregate < 0.75mm
Thanaya (2007) having reviewed and experimented with some guidelines for the
design of cold mix in his work proposed that cold mix design should consider:
1 Determination of aggregate gradation, which should be continuous due to
its interlock property, giving strength to the material during early life
strength of cold mixes. This can be obtained using Cooper‟s equation:
(3.2)
Where P is the percentage material passing sieve size d (mm), D is
maximum aggregate size (mm), F is the percentage filler, and n, an
exponential value that dictates the concavity of the gradation line.
2 Estimation of initial residual bitumen content and initial emulsion content
in line with equation (3.1) above.
3 Coating test or binder compatibility test.
4 Determination of compaction level to meet porosity target;
a. Storage time for the loose mixture and condition- sealed and
unsealed,
b. Compaction by applying an initially judged compaction effort
c. Curing for dry density determination,
d. Determination of specific gravity of the mix and porosity value after
obtaining dry density data,
e. Adjustment of compaction effort and determination of compaction
effort to meet the porosity target. Suggested porosity target is 5-
10%. The following useful formulae were also suggested:
(3.3)
Where:
SGmix = Specific Gravity of the mix
%CA = Percentage of Coarse Aggregates
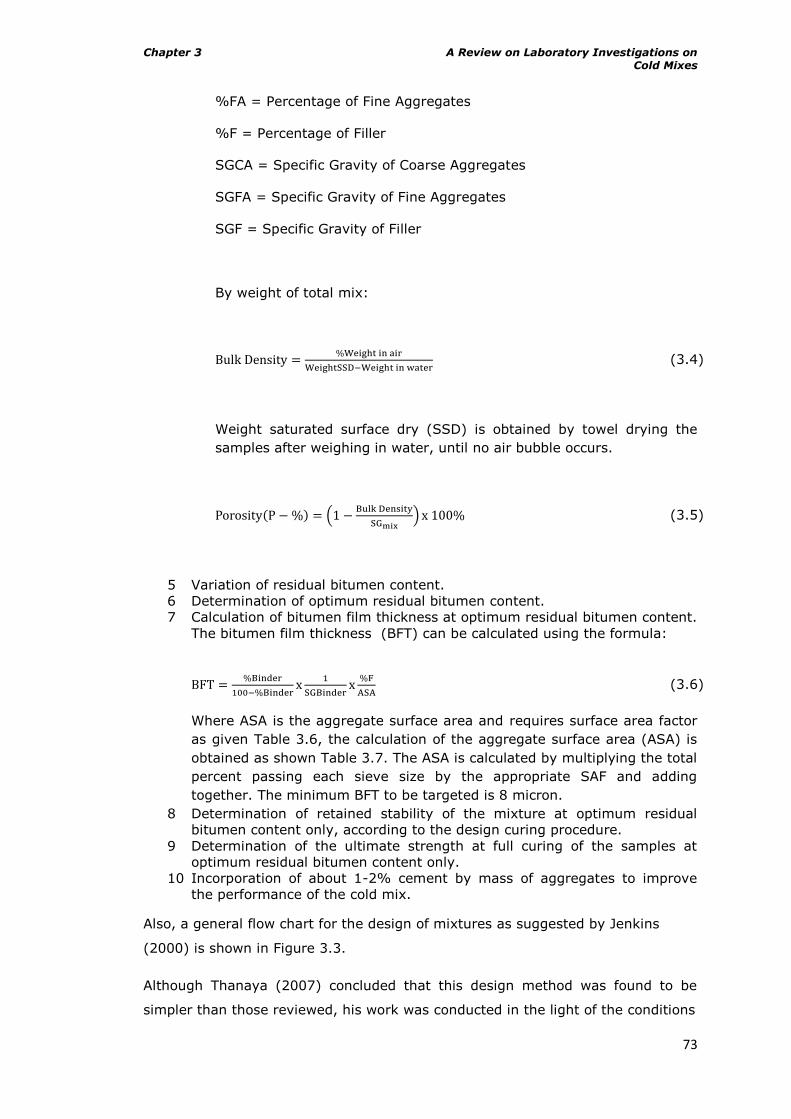
Chapter 3 A Review on Laboratory Investigations on Cold Mixes
73
%FA = Percentage of Fine Aggregates
%F = Percentage of Filler
SGCA = Specific Gravity of Coarse Aggregates
SGFA = Specific Gravity of Fine Aggregates
SGF = Specific Gravity of Filler
By weight of total mix:
(3.4)
Weight saturated surface dry (SSD) is obtained by towel drying the
samples after weighing in water, until no air bubble occurs.
(3.5)
5 Variation of residual bitumen content.
6 Determination of optimum residual bitumen content.
7 Calculation of bitumen film thickness at optimum residual bitumen content.
The bitumen film thickness (BFT) can be calculated using the formula:
(3.6)
Where ASA is the aggregate surface area and requires surface area factor
as given Table 3.6, the calculation of the aggregate surface area (ASA) is
obtained as shown Table 3.7. The ASA is calculated by multiplying the total
percent passing each sieve size by the appropriate SAF and adding
together. The minimum BFT to be targeted is 8 micron.
8 Determination of retained stability of the mixture at optimum residual
bitumen content only, according to the design curing procedure.
9 Determination of the ultimate strength at full curing of the samples at
optimum residual bitumen content only.
10 Incorporation of about 1-2% cement by mass of aggregates to improve
the performance of the cold mix.
Also, a general flow chart for the design of mixtures as suggested by Jenkins
(2000) is shown in Figure 3.3.
Although Thanaya (2007) concluded that this design method was found to be
simpler than those reviewed, his work was conducted in the light of the conditions
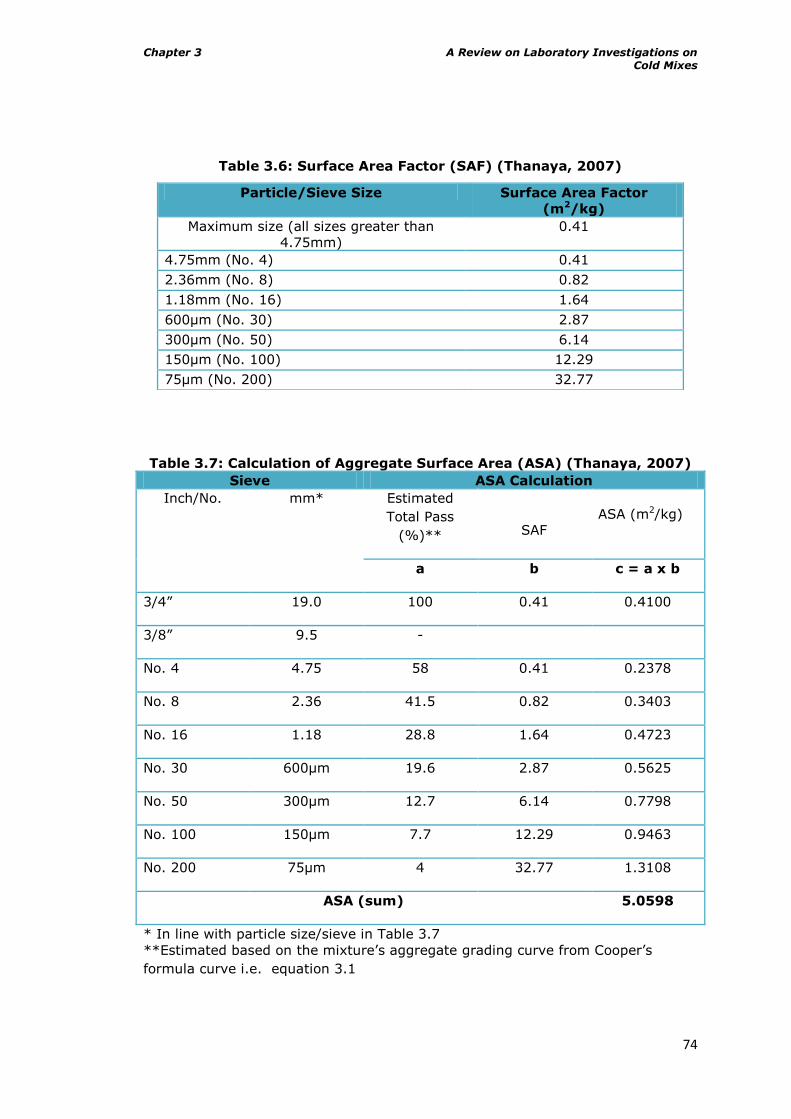
Chapter 3 A Review on Laboratory Investigations on Cold Mixes
74
Table 3.6: Surface Area Factor (SAF) (Thanaya, 2007)
Table 3.7: Calculation of Aggregate Surface Area (ASA) (Thanaya, 2007)
Sieve ASA Calculation
Inch/No. mm* Estimated
Total Pass
(%)**
SAF ASA (m2/kg)
a b c = a x b
3/4” 19.0 100 0.41 0.4100
3/8” 9.5 -
No. 4 4.75 58 0.41 0.2378
No. 8 2.36 41.5 0.82 0.3403
No. 16 1.18 28.8 1.64 0.4723
No. 30 600µm 19.6 2.87 0.5625
No. 50 300µm 12.7 6.14 0.7798
No. 100 150µm 7.7 12.29 0.9463
No. 200 75µm 4 32.77 1.3108
ASA (sum) 5.0598
* In line with particle size/sieve in Table 3.7
**Estimated based on the mixture‟s aggregate grading curve from Cooper‟s
formula curve i.e. equation 3.1
Particle/Sieve Size Surface Area Factor
(m2/kg)
Maximum size (all sizes greater than
4.75mm)
0.41
4.75mm (No. 4) 0.41
2.36mm (No. 8) 0.82
1.18mm (No. 16) 1.64
600µm (No. 30) 2.87
300µm (No. 50) 6.14
150µm (No. 100) 12.29
75µm (No. 200) 32.77
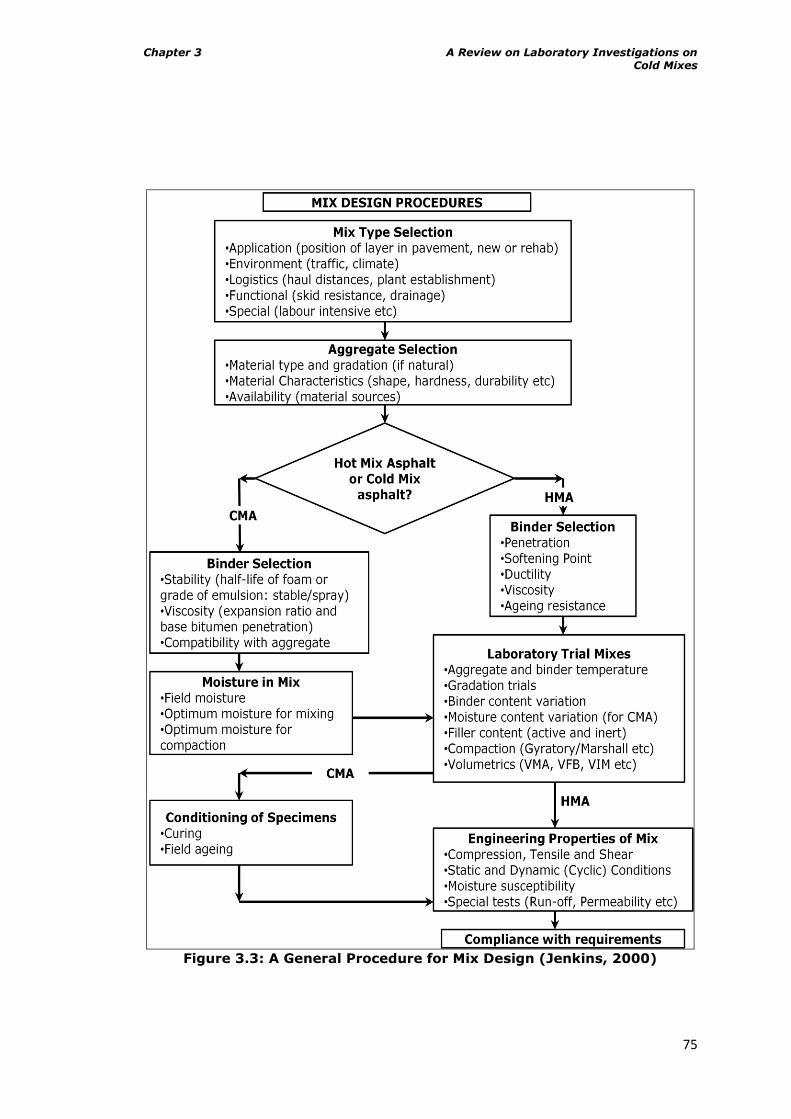
Chapter 3 A Review on Laboratory Investigations on Cold Mixes
75
Figure 3.3: A General Procedure for Mix Design (Jenkins, 2000)
Chapter 3 A Review on Laboratory Investigations on Cold Mixes
76
that obtain in temperate regions. In the same vein, while he used cationic
bitumen emulsions along with limestone, RAP and granite were never
experimented with in his work.
3.8 Curing Protocols
Unlike hot mixes, adequate and proper curing is a requirement for cold mixes
(Thom, 2009). Jenkins (2000) defined curing of cold bituminous mixes, whether
emulsion or foam as the process whereby the mixed and compacted material
discharges water through evaporation, particle charge repulsion or pore-pressure
induced flow paths. A reduction in moisture content leads to an increase in
strength of the mix (both tensile and compressive). Roberts et al (1984) found a
significant increase in tensile strength as curing temperature was increased from
23ºC to 60ºC. Bocci et al (2002) discovered that as curing time and curing
temperature increase, the performances of the mixtures considerably improve;
curing for 14 days at 20°C is almost equivalent to 7 days at 40°C. Thanaya,
(2007), Leech (1994) and Santucci (1977) reported that full curing can occur
between 2-24mths in the field. Table 3.8 details some curing methods while
Figure 3.4 shows the effect of different curing conditions and compaction on the
compressive strength of reference grave emulsion.
Jenkins (2000) consequently opined that the temperature of curing cannot be
ruled out as unimportant to mix preparation as temperature and moisture are
dependent variables with temperature influencing the rate of moisture loss.
Meanwhile, Jenkins (2000) had earlier submitted that too little moisture impedes
dispersion of the foam (emulsion), workability and compaction of the mix and too
much moisture increases the curing time and reduces the density and strength of
the compacted mix and that the moisture contents of mixes that are oven cured
in an unsealed state are generally between 0% and 1.5% and always less than
4%, which is seldom representative of field conditions. In addition, the influences
of curing temperature on changes in the binder condition have not been analysed
in the literature, which is unfortunate considering the high surface area of the
binder and higher void contents in foamed mixes. The challenge is to select the
appropriate curing conditions in the laboratory, ensuring adequate shear strength
in early life and selecting the correct stiffness for the structural design life. In
addition, compaction due to traffic requires consideration. In a related view,
Serfass et al (2003) believed that evaluating cured cold mixes in the laboratory is
clearly necessary, but reproducing exact field curing conditions is too complicated
and, above all, time consuming, and thus an accelerated curing method is
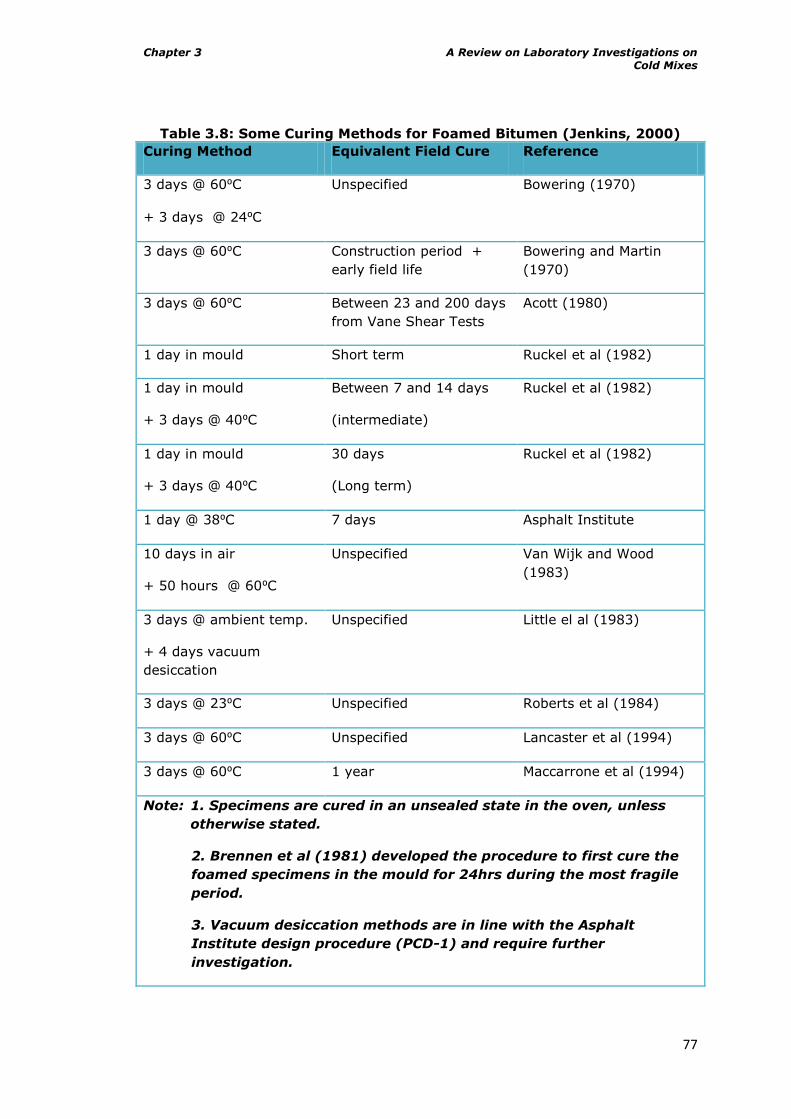
Chapter 3 A Review on Laboratory Investigations on Cold Mixes
77
Table 3.8: Some Curing Methods for Foamed Bitumen (Jenkins, 2000)
Curing Method Equivalent Field Cure Reference
3 days @ 60⁰C
+ 3 days @ 24⁰C
Unspecified Bowering (1970)
3 days @ 60⁰C Construction period +
early field life
Bowering and Martin
(1970)
3 days @ 60⁰C Between 23 and 200 days
from Vane Shear Tests
Acott (1980)
1 day in mould Short term Ruckel et al (1982)
1 day in mould
+ 3 days @ 40⁰C
Between 7 and 14 days
(intermediate)
Ruckel et al (1982)
1 day in mould
+ 3 days @ 40⁰C
30 days
(Long term)
Ruckel et al (1982)
1 day @ 38⁰C 7 days Asphalt Institute
10 days in air
+ 50 hours @ 60⁰C
Unspecified Van Wijk and Wood
(1983)
3 days @ ambient temp.
+ 4 days vacuum
desiccation
Unspecified Little el al (1983)
3 days @ 23⁰C Unspecified Roberts et al (1984)
3 days @ 60⁰C Unspecified Lancaster et al (1994)
3 days @ 60⁰C 1 year Maccarrone et al (1994)
Note: 1. Specimens are cured in an unsealed state in the oven, unless
otherwise stated.
2. Brennen et al (1981) developed the procedure to first cure the
foamed specimens in the mould for 24hrs during the most fragile
period.
3. Vacuum desiccation methods are in line with the Asphalt
Institute design procedure (PCD-1) and require further
investigation.
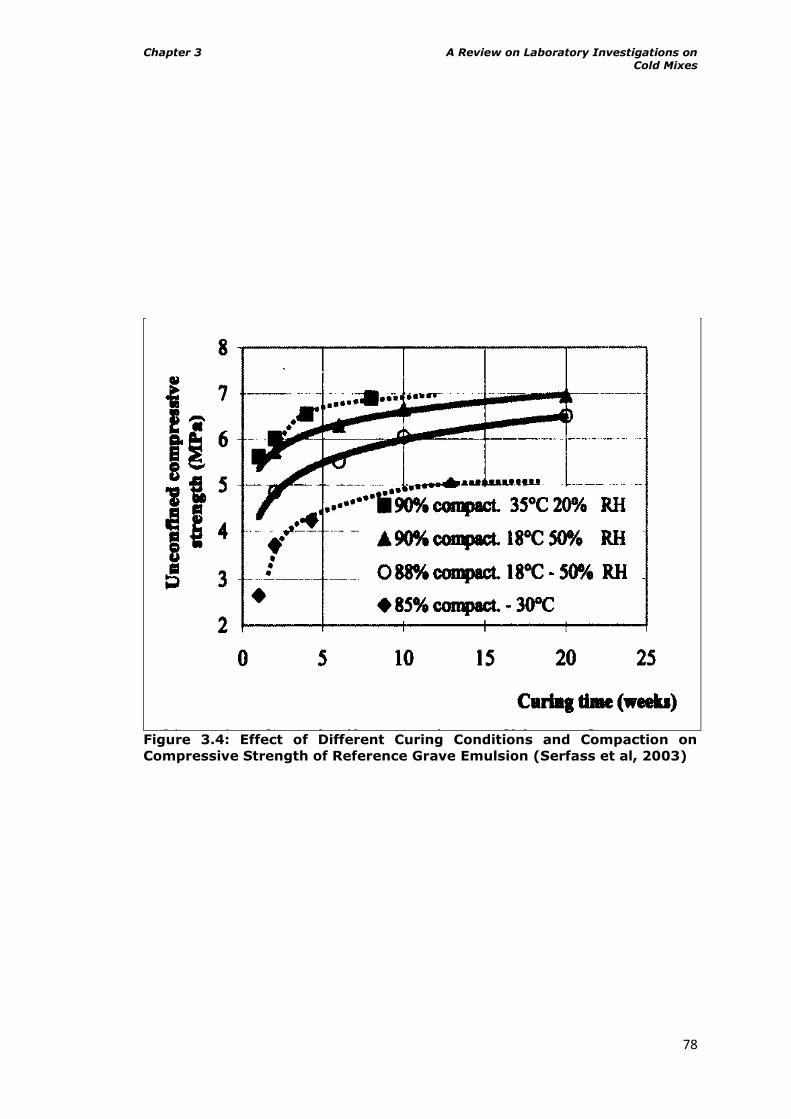
Chapter 3 A Review on Laboratory Investigations on Cold Mixes
78
Figure 3.4: Effect of Different Curing Conditions and Compaction on
Compressive Strength of Reference Grave Emulsion (Serfass et al, 2003)
Chapter 3 A Review on Laboratory Investigations on Cold Mixes
79
necessary. The requirements are that:
- The curing procedure should be as short as possible,
- It must produce materials in a state as close as possible
to their in-place mature state,
- It must not cause significant ageing of the bituminous
binder,
- The laboratory equipment should not be too
sophisticated.
Serfass et al (2003) further discovered in their study that the moisture content of
small specimens decreases very quickly, whatever the temperature. For large
specimens it takes longer. Also, too high a temperature (e.g. 50°C) tends to
produce too quick a sample drying, which can cause cracking of large samples.
They advised that, it should be borne in mind that, in the field, cold mixes rarely
become totally dry. The moisture content has often been found to be between 0.5
and 1.5% in road bases in temperate climates. They established a relationship
between the degree of compaction and stiffness modulus and thus stated that
modulus values must therefore always be related to the degree of compaction of
the mix tested. Therefore in order to obtain cold mixtures in a mature state, they
proposed that such samples should be cured for 14 days at 35°C-20% Relative
Humidity (RH). This procedure does not cause deterioration to the specimens.
35°C was chosen because it is realistic, as it prevails for long periods in the actual
pavements. It was further proposed that curing over 14 days at 18°C – 50% RH
would be appropriate for mix in a fresh state i.e. a few weeks after laying (18°C
chosen because that is a typical average daily temperature for temperate
climates).
3.9 Some Compaction Methods for Cold Mixes
Compaction is another important factor that is pivotal to the efficient performance
of cold mixtures. In buttressing this, Harun and Morosiuk (1995) remarked that
the full benefit from the use of bituminous materials in road construction can only
be achieved if a satisfactory degree of compaction is attained during construction.
They further opined that if shear failure is to be prevented then secondary
compaction of the material after construction must be limited to a safe value and
that an alternative to the use of additives is a modification of the mix design and
compaction method to produce a more mechanically stable material, again
Chapter 3 A Review on Laboratory Investigations on Cold Mixes
80
making it more resistant to deformation at high temperatures. They thus
proposed that design of mixes should be done using refusal density.
While Thanaya (2007) suggested that compaction should be done to target a
porosity within the range 5-10% generally for cold mixes which thus implies
heavy compaction effort, Jenkins (2000) opined that the distribution of binder
within a foamed mix differs from that of HMA and the inclusion of the water phase
sets these two mixes apart, in so doing introducing differences in compactability,
and that a laboratory compaction technique that not only achieves the void
content expected in the field, but also emulates the particle orientation after
rolling is to be sought. He further advised that both the volumetrics and the
engineering properties of the mix require consideration in the selection of an
appropriate compaction technique and more reliable links between laboratory and
field compaction are required. PIARC (2003) advised that, for the laboratory study
of mix design for recycling, the total fluid content to insure adequate compaction
of the mix must be determined. AEMA and AI (1997) remarked that for gradations
containing appreciable fines, aeration or drying prior to compaction may be
required. FHWA (1997) suggested that the rate at which the reaction between the
recycling agent and the aged asphalt occurs is a function of the properties of the
recycling agent and the aged asphalt cement, and the mechanical effects of the
physical processes such as mixing, compaction, traffic and climatic conditions.
Thanaya (2007) further opined that the porosity of CBEMs can be reduced to
meet a pre-selected target simply by increasing the compaction effort and that
the compaction effort is a significant variable that needs to be determined
depending on the target porosity, mixture type, storage conditions and storage
time prior to compaction. Similarly, Kim et al (2007) categorically listed
compaction method as one of the factors to be considered in design.
All these assertions of previous researchers indicate that compaction method
employed in the laboratory is very important in the design of mixtures. However,
the situation becomes more confusing as Needham (1996) stated that the field
compaction regimes for cold mix are quite varied at present as different
companies advocate and utilize different techniques and that however, the
preferred method seems to be steel rolling, followed by very heavy pneumatic
tyred roller and finally finishing with steel. To ascertain which compaction method
is the best, researchers have made every effort to produce compaction methods
in the laboratory that simulate what obtains in the field. Meanwhile, a lot of
methods for the compaction of such mixtures in the laboratory have been
developed. Needham (1996) listed them as the Marshall Hammer method, The
Chapter 3 A Review on Laboratory Investigations on Cold Mixes
81
Percentage Refusal Density Apparatus, the Static Load Press, the Roller
Compactor and the Gyratory Compactor. Ibrahim (1998) also used the Vibrating
Compactor in his work but stated that Roller Compactors have not been used in
the study of cold mixes. Some of these methods are detailed in Table 3.9.
Obviously, not all these methods have been found to be successful/applicable in
all conditions and thus efforts have been made to identify the most suitable
method which among other things mimics the compaction on the road, simple to
operate and also affordable for different operations and as well materials. In the
light of this, various studies have been conducted to ascertain best methods for
compacting mixtures and as well to understand the effect of compaction on
mixtures. Kim et al (2007) discovered from their studies that additional foamed
asphalt helped mixtures compact better under gyratory compaction, but not
under Marshall Hammer compaction. Smith and Jones (1998) in an earlier work
reported that the 75-blow Marshall compaction underestimates the effect of
secondary compaction under traffic and many of these surfacings suffer severe
structural instability leading to plastic deformation. In line with this, Kim and Lee
(2006) observed that 75 blows from the Marshall Hammer did not provide
sufficient compaction to simulate initial compaction after construction. They
opined that although the gyratory compaction method produced a higher density
value than the Marshall Compaction method, the samples made by the gyratory
compactor exhibited lower resilient modulus values than the ones prepared by the
Marshall compactor.
In another similar work, Ulmgren (2003) observed that with an increased angle of
compaction a predetermined degree of compaction is reached with fewer
rotations. Figure 3.5 shows this relationship. On another note, Thanaya (2007a)
stated that in order to achieve an air void content of between 5-10%, compaction
was done using 240 gyros- extra heavy compaction (medium compaction is
carried out at 80 gyros which is considered to be the equivalent of 50 blows using
the Marshall hammer, while heavy compaction is carried out at 120 gyros,
equivalent to 75 blows using the Marshall hammer). He concluded that the
application of a heavier compaction level is inevitable in cold mixes, as the
emulsion set and hence the mixes stiffen during compaction. Serfass et al (2003)
in their work established a relationship between the degree of compaction and
stiffness modulus. Figure 3.6 shows this relationship. Thanaya (2003) in his work
observed that, compaction of CBEMs in two layers aided escape of moisture faster
which eventually reduced the curing time.
Recently, Lee and Kim (2006) examined the compaction characteristics of RAP
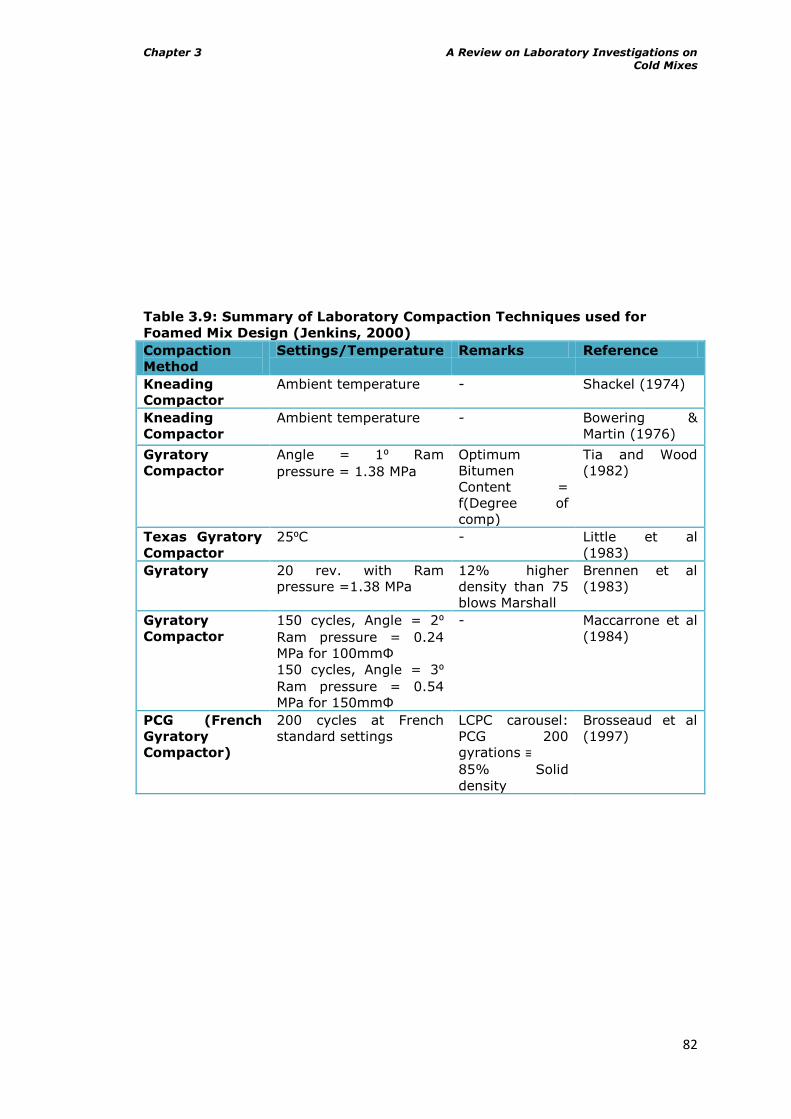
Chapter 3 A Review on Laboratory Investigations on Cold Mixes
82
Table 3.9: Summary of Laboratory Compaction Techniques used for
Foamed Mix Design (Jenkins, 2000)
Compaction
Method
Settings/Temperature Remarks Reference
Kneading
Compactor
Ambient temperature - Shackel (1974)
Kneading
Compactor
Ambient temperature - Bowering &
Martin (1976)
Gyratory
Compactor
Angle = 1⁰ Ram
pressure = 1.38 MPa
Optimum
Bitumen
Content =
f(Degree of
comp)
Tia and Wood
(1982)
Texas Gyratory
Compactor
25⁰C - Little et al
(1983)
Gyratory 20 rev. with Ram
pressure =1.38 MPa
12% higher
density than 75
blows Marshall
Brennen et al
(1983)
Gyratory
Compactor
150 cycles, Angle = 2⁰
Ram pressure = 0.24
MPa for 100mmΦ
150 cycles, Angle = 3⁰
Ram pressure = 0.54
MPa for 150mmΦ
- Maccarrone et al
(1984)
PCG (French
Gyratory
Compactor)
200 cycles at French
standard settings
LCPC carousel:
PCG 200
gyrations ≡
85% Solid
density
Brosseaud et al
(1997)
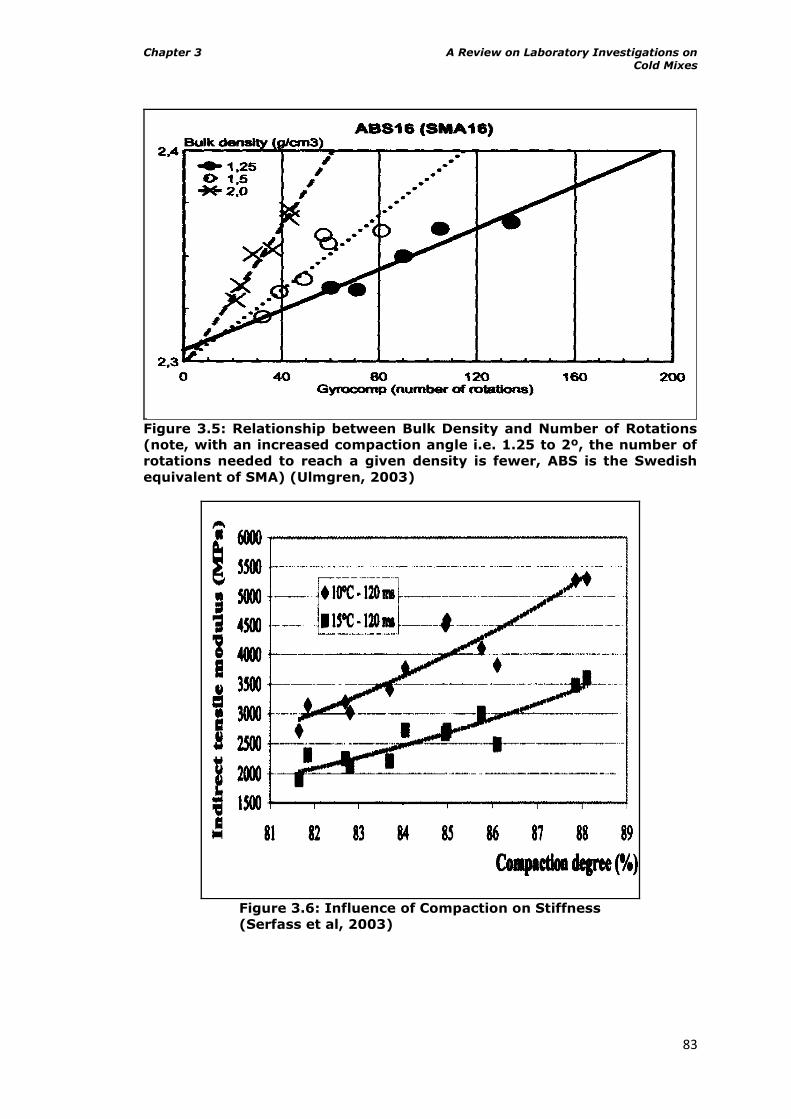
Chapter 3 A Review on Laboratory Investigations on Cold Mixes
83
Figure 3.5: Relationship between Bulk Density and Number of Rotations
(note, with an increased compaction angle i.e. 1.25 to 2º, the number of
rotations needed to reach a given density is fewer, ABS is the Swedish
equivalent of SMA) (Ulmgren, 2003)
Figure 3.6: Influence of Compaction on Stiffness
(Serfass et al, 2003)
Chapter 3 A Review on Laboratory Investigations on Cold Mixes
84
material at different temperatures and moisture contents, RAP materials were
compacted at temperatures of 25°C, 40°C and 55°C and moisture contents of
zero and 4% using the gyratory compactor without adding any additional
bitumen. The three temperatures were selected to represent the pavement
surface temperatures in the field for early fall, late spring, and peak summer
conditions respectively. Two samples were compacted up to 200 gyrations for
each of six cases of three RAP temperatures and two moisture contents. The bulk
specific gravities of compacted RAP samples with and without water were
measured and plotted against the number of gyrations. The compacted samples
with 4% water exhibited the higher bulk specific gravity than those without water
and the higher RAP temperature also produced the higher bulk specific gravity.
Also, Lee and Kim (2007) investigated the compaction characteristics of RAP
materials, and as a reference point, RAP materials were compacted using a
gyratory compactor without adding water or foamed asphalt. They found a
significant increase in bulk specific gravity by adding foamed asphalt. Moisture
content was fixed at 4%. Specimens compacted by gyratory compactor at 30
gyrations or by Marshall Hammer at 75 blows were cured at 40°C for three days
or 60°C for two days. The indirect tensile strength of gyratory compacted and
vacuum saturated specimens was more sensitive to foamed asphalt contents than
that of the Marshall hammer compacted vacuum saturated specimens. Brennan et
al (2007) concluded in their work on compaction that, the voids content of a cold
mixture can be up to 9% greater than that for a comparable hot mixture.
Indeed the development/adoption of compaction method in the laboratory which
mimics what obtains in the field is essential for coming up with efficient designs
most especially for cold mixes. As discussed earlier, it would be observed that a
lot has been done on ascertaining the best method to adopt for simulating in the
laboratory the compaction that takes place in the field. Most researchers have
been favourably disposed to the gyratory compactor, which was developed under
the SHRP programme in the USA. However, as most researchers rightly caution,
both the volumetrics and the engineering properties of the mix require
consideration in the selection of an appropriate compaction technique and more
reliable links between laboratory and field compaction are required.
3.10 Performance Characteristics of Cold Mixes
Quite a number of investigations have been carried out to examine the
performance of cold mixes. Through the outcomes of some of these
Chapter 3 A Review on Laboratory Investigations on Cold Mixes
85
investigations, the major problems of cold mixes have been identified, and
procedures for mitigating them have been proposed. Meanwhile, performances of
cold mixes are normally examined with reference to hot mixes. In a recent work,
Thanaya (2007) observed that CBEMs compared well in mechanical properties
with hot mixes as detailed in Table 3.10. On a similar note, Robinson (1997)
using cores examined in the UK in his work as reported by Thanaya (2003),
revealed that mixtures develop stiffness gradually, e.g. the ITSM value of a 6mm
Dense Macadam (200pen base emulsion) met the specification requirements of
600MPa after 10mths and the value increased to almost 800MPa after 24mths.
Thanaya (2007) further noted that considering the creep slopes of the cold mixes
studied in the work, it was confirmed that cold mixes are suitable for low to
medium trafficked roads and that the addition of 1-2% cement (see Tables 3.11a
and b) by mass of aggregates into cold asphalt emulsion mixes significantly
improves the overall mechanical properties of the CBEMs.
Brown and Needham (2000) in buttressing this submitted that adding OPC to
bitumen emulsion mixtures (cold mix) has some beneficial effects. They revealed
that without OPC, cold mix failed at less than 1000cycles in the unconfined mode
of Repeated Load Axial Tests (RLAT), but suggested that it could do better if the
triaxial mode is used. They further found out that OPC has no beneficial effect on
the performance of hot mix and that cold mix with OPC offered better resistance
to permanent deformation than the hot mix. Also, OPC acts as a secondary binder
and the addition of OPC caused a reduction in fatigue life above 200 microstrains.
They however, opined that a pavement structure might not in real life be
subjected to as high a microstrain level, thus it could be said that OPC addition
clearly extends the fatigue life of a pavement. Thanaya (2007) later confirmed
this in his work (the developed relationship is as shown in Figure 3.7) though
Ibrahim (1998) opined that there is no consensus for dealing with fatigue in cold
mixes.
For example, Khalid (2003) observed that CBEMs continue to be underutilised in
the UK in comparison with other European countries despite their significant
environmental and economic potential. He opined that the main reasons behind
this under-use are believed to be the high cost of emulsion binders and
complexity involved in the design and performance assessment of CBEMs. More
so, pavement engineers would always want to put in place structures that would
be able to perform their intended design roles immediately after construction.
Serfass et al (2003) submitted that cold mixes are evolutive materials (see Figure
3.8), especially in their early life and that their peculiar behaviour results from the
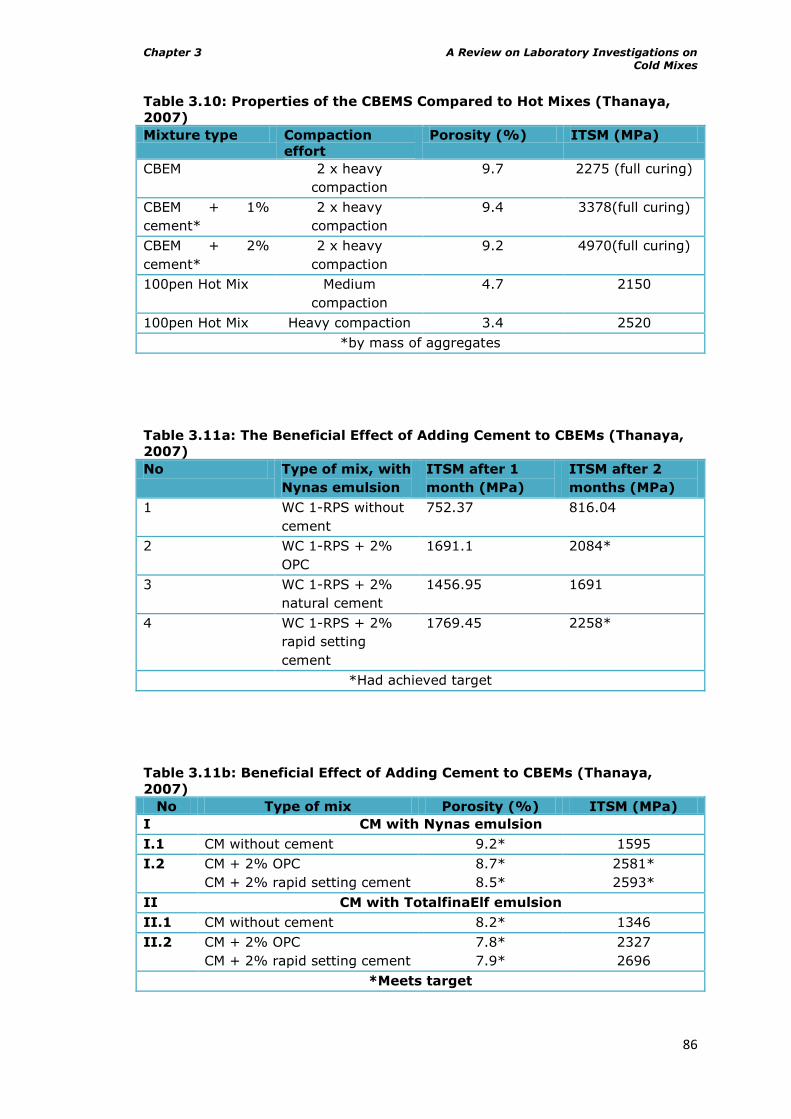
Chapter 3 A Review on Laboratory Investigations on Cold Mixes
86
Table 3.10: Properties of the CBEMS Compared to Hot Mixes (Thanaya,
2007)
Mixture type Compaction
effort
Porosity (%) ITSM (MPa)
CBEM 2 x heavy
compaction
9.7 2275 (full curing)
CBEM + 1%
cement*
2 x heavy
compaction
9.4 3378(full curing)
CBEM + 2%
cement*
2 x heavy
compaction
9.2 4970(full curing)
100pen Hot Mix Medium
compaction
4.7 2150
100pen Hot Mix Heavy compaction 3.4 2520
*by mass of aggregates
Table 3.11a: The Beneficial Effect of Adding Cement to CBEMs (Thanaya,
2007)
No Type of mix, with
Nynas emulsion
ITSM after 1
month (MPa)
ITSM after 2
months (MPa)
1 WC 1-RPS without
cement
752.37 816.04
2 WC 1-RPS + 2%
OPC
1691.1 2084*
3 WC 1-RPS + 2%
natural cement
1456.95 1691
4 WC 1-RPS + 2%
rapid setting
cement
1769.45 2258*
*Had achieved target
Table 3.11b: Beneficial Effect of Adding Cement to CBEMs (Thanaya,
2007)
No Type of mix Porosity (%) ITSM (MPa)
I CM with Nynas emulsion
I.1 CM without cement 9.2* 1595
I.2 CM + 2% OPC
CM + 2% rapid setting cement
8.7*
8.5*
2581*
2593*
II CM with TotalfinaElf emulsion
II.1 CM without cement 8.2* 1346
II.2 CM + 2% OPC
CM + 2% rapid setting cement
7.8*
7.9*
2327
2696
*Meets target
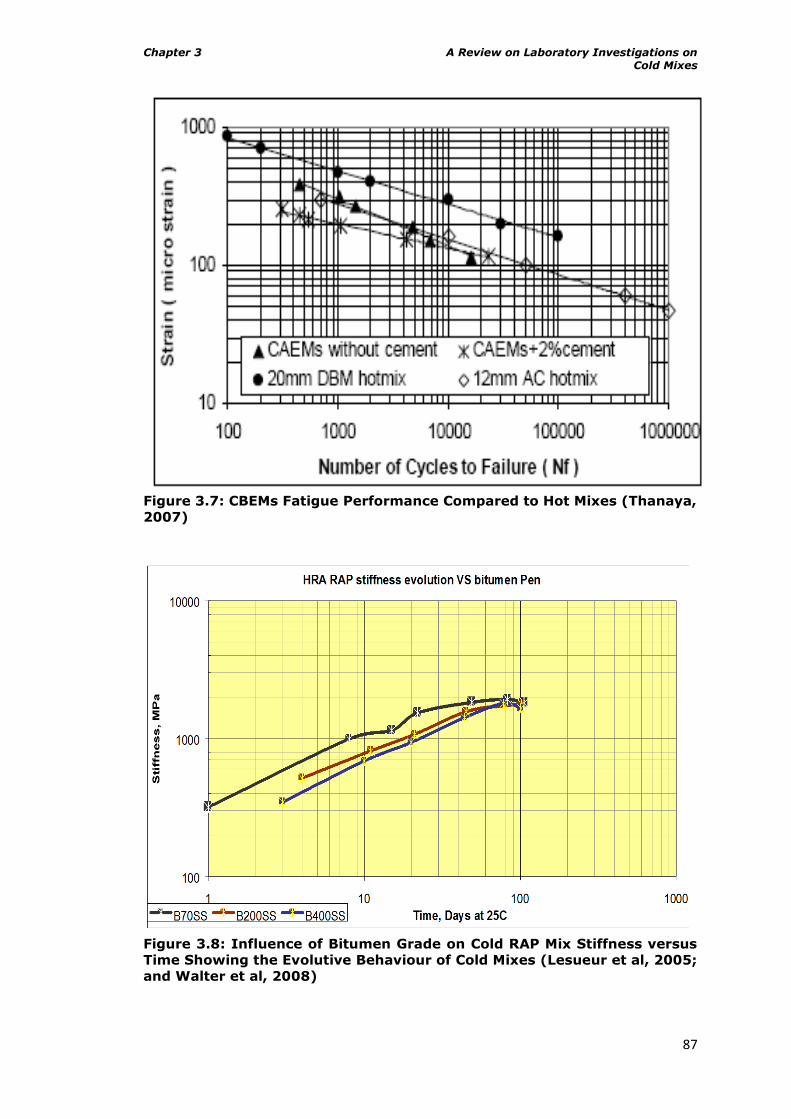
Chapter 3 A Review on Laboratory Investigations on Cold Mixes
87
Figure 3.7: CBEMs Fatigue Performance Compared to Hot Mixes (Thanaya,
2007)
Figure 3.8: Influence of Bitumen Grade on Cold RAP Mix Stiffness versus
Time Showing the Evolutive Behaviour of Cold Mixes (Lesueur et al, 2005;
and Walter et al, 2008)
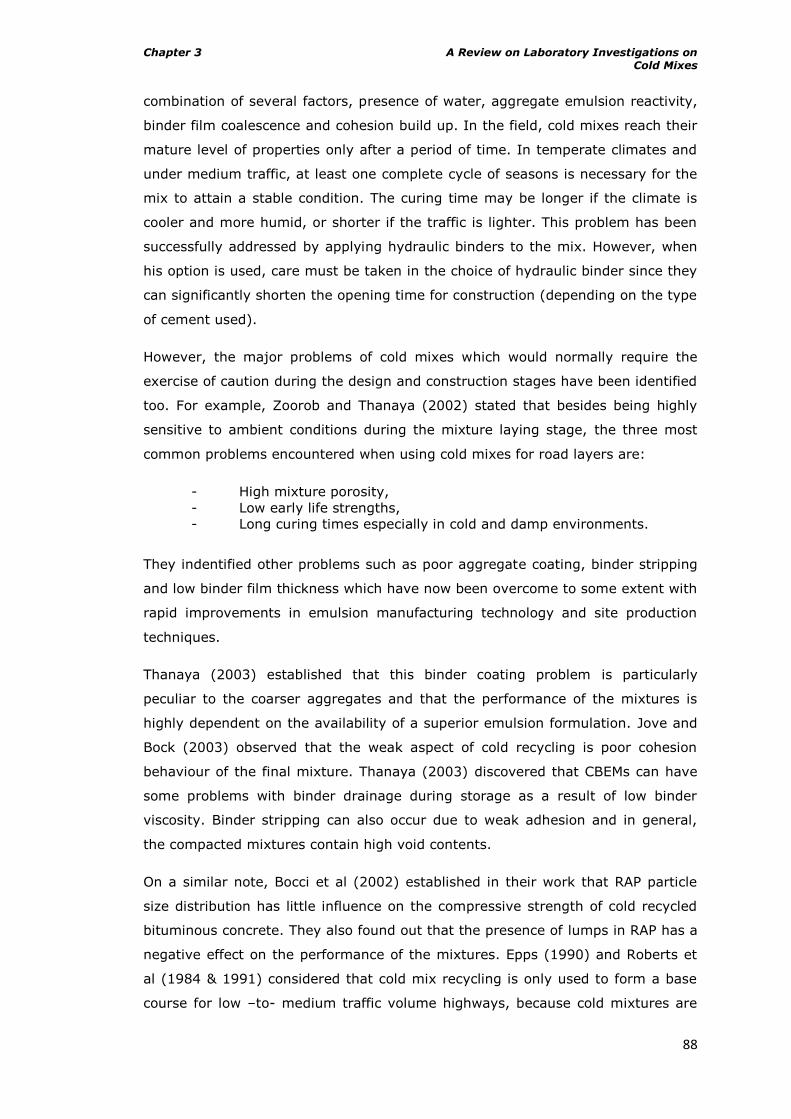
Chapter 3 A Review on Laboratory Investigations on Cold Mixes
88
combination of several factors, presence of water, aggregate emulsion reactivity,
binder film coalescence and cohesion build up. In the field, cold mixes reach their
mature level of properties only after a period of time. In temperate climates and
under medium traffic, at least one complete cycle of seasons is necessary for the
mix to attain a stable condition. The curing time may be longer if the climate is
cooler and more humid, or shorter if the traffic is lighter. This problem has been
successfully addressed by applying hydraulic binders to the mix. However, when
his option is used, care must be taken in the choice of hydraulic binder since they
can significantly shorten the opening time for construction (depending on the type
of cement used).
However, the major problems of cold mixes which would normally require the
exercise of caution during the design and construction stages have been identified
too. For example, Zoorob and Thanaya (2002) stated that besides being highly
sensitive to ambient conditions during the mixture laying stage, the three most
common problems encountered when using cold mixes for road layers are:
- High mixture porosity,
- Low early life strengths,
- Long curing times especially in cold and damp environments.
They indentified other problems such as poor aggregate coating, binder stripping
and low binder film thickness which have now been overcome to some extent with
rapid improvements in emulsion manufacturing technology and site production
techniques.
Thanaya (2003) established that this binder coating problem is particularly
peculiar to the coarser aggregates and that the performance of the mixtures is
highly dependent on the availability of a superior emulsion formulation. Jove and
Bock (2003) observed that the weak aspect of cold recycling is poor cohesion
behaviour of the final mixture. Thanaya (2003) discovered that CBEMs can have
some problems with binder drainage during storage as a result of low binder
viscosity. Binder stripping can also occur due to weak adhesion and in general,
the compacted mixtures contain high void contents.
On a similar note, Bocci et al (2002) established in their work that RAP particle
size distribution has little influence on the compressive strength of cold recycled
bituminous concrete. They also found out that the presence of lumps in RAP has a
negative effect on the performance of the mixtures. Epps (1990) and Roberts et
al (1984 & 1991) considered that cold mix recycling is only used to form a base
course for low –to- medium traffic volume highways, because cold mixtures are
Chapter 3 A Review on Laboratory Investigations on Cold Mixes
89
not structurally as strong as hot mixtures and cold recycled mixes do not have
adequate resistance to either abrasion by traffic or moisture induced damage.
Staple (1997) contrary to the experience of Robinson (Thanaya, 2003) was not
favourably disposed to the use of emulsion due to the fact that cold emulsion
mixes could not meet UK standards even after 18months of being laid as the
stiffness moduli were far too low. He observed that cold emulsion macadam had
significantly lower elastic modulus than that required. However nothing was
stated about materials used and the factors that guided selection. He further
opined in this work that the high air void content of the mix could have been
responsible for the general low stiffness. Room is generally given for some degree
of permeability and contact with air to allow for the curing or break of an
emulsion. Staple (1997) was still doubtful about the applicability of cold mixes in
road construction.
It may be observed from this review that there are a lot of challenges to
overcome if cold mix, most especially cold recycled mix is to be fully integrated
into road construction. Obviously, all of these observations have been made in the
light of the performances of such mixes under temperate conditions. In simulating
what obtains under a hot climate (temperature), one challenge is to determine
which laboratory test would be the most appropriate for characterising the
mechanical responses of recycled emulsion cold mixtures- since Ibrahim (1998)
opined that such materials exhibit composite responses i.e. during the preparation
of the mixes and laying, they behave as unbound granular materials, while after
construction and having gained appreciable strength they start acting as bound
materials. Other challenges in this regard are mentioned in the following section.
3.11 Interaction between Aged and Virgin Binders in Cold Recycled
Mixes
While a lot has been done by researchers to establish the relationship between
aged binders and recycling agents in hot recycled mixes, not much has been done
on cold recycled mixes. Quite a number of researchers have established beyond
reasonable doubt that in hot recycled mixtures, there is an interaction between
aged binders and recycling agents (Lee et al, 1983; Noureldin and Wood, 1987;
Soleymani et al, 2000; McDaniel et al, 2000; Karlsson and Isacsson, 2003;
Schiavi et al, 2003; Romera et al, 2006; Artamendi and Khalid 2006; Chen et al,
2007; and Shen et al 2007).
Chapter 3 A Review on Laboratory Investigations on Cold Mixes
90
On the other hand, FHWA (1997) stated that at ambient temperature, the
softening effect of the recycling agent is a time and temperature dependent
physico-chemical process and thus, the rate at which the reaction between the
recycling agent and the aged asphalt cement (bitumen) occurs is a function of the
properties of the recycling agent and the aged asphalt cement, and the
mechanical effects of the physical processes such as mixing, compaction, traffic
and climatic conditions. The relative contributions of the recycling agent and the
aged asphalt binder are not fully understood at this time and thus, FHWA (1997)
assumed that for cold recycled mixes, RAP only acts as black rock- which implies
that the aged binder in the RAP does not interact with the recycling agent.
The only work among the reviewed reports which shed light on the interaction
between aged binders in cold mixes and recycling agents was carried out very
recently under the SCORE project in which Lesueur et al (2005) and Walter et al
(2008), using the DSR (see Figure 3.9) and measurements of the mechanical
properties of binders (aged and rejuvenating agents) and cold recycled mixtures
respectively, established that ultimately there is an interaction between aged
binders and the recycling agents. They studied the effect of new bitumen grade
on complex modulus versus time and discovered that all samples seem to
converge after 100days which indicate that, due largely to diffusion, the 400 and
200 Pen aged bitumen evolve toward a harder grade, between 70 and 100
penetration. However, the 70 penetration binder provided the highest modulus
values both initially and for the next 100 days.
On the maturation time, they observed that cold diffusion is a slow process, the
improvement between 1 week and 1 month was negligible which tends to indicate
that most of the diffusion at ambient temperature takes place during the first 7 to
10 days. They however concluded that, DSR measurements are limited for
practical reasons to temperatures above 40°C and reducing the number of
concentration measurements is highly desirable given the large experimental
times involved. They showed in their studies that it is possible to follow the
diffusion phenomenon between new and old bitumen by measuring the evolution
of stiffness of cold RAP mix versus time as the stiffness of a mix is directly related
to the binder consistency and curing state of the emulsion binder. They also
recommended the use of rejuvenating oil for RAP containing more than 4.5%
residual bitumen and also hard grade bitumen emulsion when stiffness is the key
performance criterion.
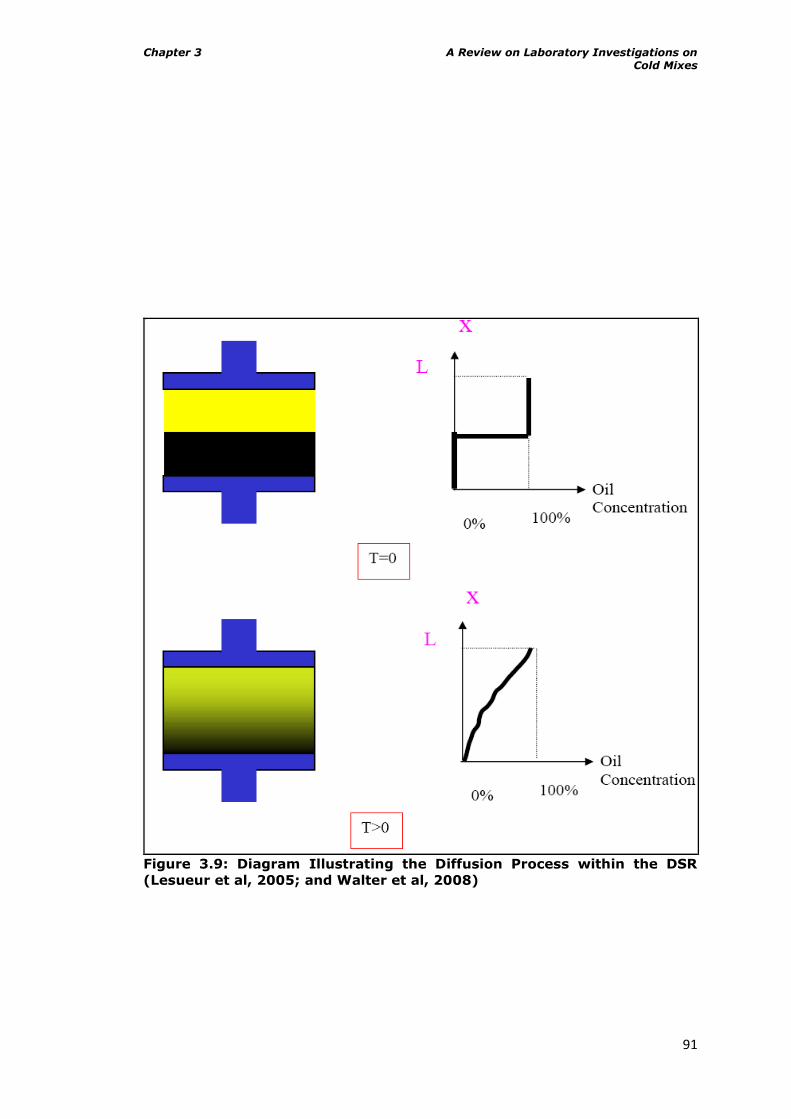
Chapter 3 A Review on Laboratory Investigations on Cold Mixes
91
Figure 3.9: Diagram Illustrating the Diffusion Process within the DSR
(Lesueur et al, 2005; and Walter et al, 2008)
Chapter 3 A Review on Laboratory Investigations on Cold Mixes
92
Meanwhile, Karlsson and Isacsson (2003) opined that the major factors which
facilitate an interaction between old and new binders in recycled mixtures are:
mechanical mixing,
compatibility (i.e. solubility parameter and molecular weight
distributions) and
diffusion
They further opined that the effectiveness of mechanical mixing is influenced by
many factors i.e. temperature, binder viscosity, mixing time and type of mixture,
and that compatibility between binders is a requirement for creating a
homogeneous binder and is mainly dependent on the nature and distribution of
intermolecular associations, which in turn determine the structural stability of
binder. Also, they remarked that diffusion is a function of: temperature,
intermolecular forces, structural rigidity of the diffusing molecules (restrictions on
bending and twisting), microscopic structure of a relatively stationary phase if
any, size and shape of the diffusing molecules or agglomerations as well as the
viscosity of the medium in which the diffusion takes place. In conclusion, they
submitted that the possibility of diffusion may not hold for low temperatures or
severely aged binders and binders showing different behaviour under the
influence of ageing.
In summary, it is obvious that more studies should be undertaken to ascertain the
interaction between aged and virgin (rejuvenating) binders in cold recycled
mixtures as information regarding this is still ambiguous. Though it has been
established in the SCORE project that an interaction exists in such circumstances,
the fact that the process involved is a time and temperature dependent physico-
chemical one, and coupled with the fact that pavement engineers would normally
desire that pavements start performing their roles efficiently shortly after being
laid make it incumbent on researchers to put in place clear cut guidelines for the
use of RAP in cold mixtures, which are based on a better understanding of the
behaviour/interaction of the binders embedded in such cold recycled mixtures. For
example, the degree of severity of ageing of binders in RAPs to be used in cold
mixtures should be set in order to ultimately get good mixture performance
almost immediately after construction.
3.12 Cold Mixes and Structural Design
Structural design is not completely new in cold mix design although there is no
universally accepted method. This aspect of design is very important for
Chapter 3 A Review on Laboratory Investigations on Cold Mixes
93
determining (by optimisation) the layer thicknesses that should give the structural
support required for the design life of a pavement. Thom (2009) suggested two
general approaches for pavements incorporating cold mixture:
treat it as hot-mix ,
treat it as a very superior granular material.
Similarly, some methods which are basically empirical in approach have been
advanced. These have been reported by Jitareekul (2009) as, the Catalogue
Method, the CBR Design Method, the Asphalt Institute Method, AASHTO Method,
and a UK method developed by Milton and Earland (1999).
In recent times also, the use of modelling tools involving multi layer linear elastic
analysis which are commonly used for optimising layer thicknesses in pavements
containing HMA have also been found useful for pavements which incorporate cold
layers (Jitareekul, 2009; Ebels, 2008; and Twagira, 2010). These are
implemented based on the results of performance tests conducted on mixtures.
BISAR 3.0 and KENLAYER among other modelling tools have been chiefly used in
this regard. Other methods which have been suggested are finite element
modelling due to the complex nature of cold mixtures (Ebels, 2008; and Twagira,
2010), though this could be time consuming.
However, as much as such modelling tools are good for layer thickness
optimisation, they must be executed with caution since cold mixtures have been
found to be stress dependent i.e. non-linear in response (Ibrahim, 1998;
Sunarjono, 2008; Ebels, 2008; and Twagira 2010) compared to HMA, whereas
most such tools assume linear elastic behaviour.
3.13 Summary
The following are the conclusions from the review conducted in this chapter:
Ageing of bitumen whether in the short or long term is inevitable in
bituminous road pavements.
Ageing in bituminous materials is evidenced by physical hardening which
could either be advantageous or otherwise in a road pavement.
Laboratory protocols (accelerated) for simulating ageing of bituminous
road pavements in temperate climates have been developed. Such
protocols are useful for predicting performance in service of bituminous
road pavements.
Chapter 3 A Review on Laboratory Investigations on Cold Mixes
94
There is a need to develop similar laboratory protocols for road pavements
in hot tropical climates.
Cold mixes are cost effective, energy efficient and environmentally
friendly, although inhibiting factors such as low early life stiffness and
strength development, high air void contents and presence of moisture in
the mix are still preventing such mixtures from being fully embraced in
some developed countries.
Most of the studies reported in literature on cold mixes have focused on
temperate climates, though with good results in most cases.
There is lack of evidence in literature of similar studies conducted in hot
tropical climates and therefore there is a need to urgently look at this
area.
There is no universally accepted method for cold mix designs (job formula)
although most of the methods which have been advanced in literature are
based on the Hveem and Marshall methods of mix design.
Adequate mixing and compaction alike are important for cold mixes.
Curing is required for cold mixes for maturation and development of
stiffness. The use of OPC in such mixes aids evaporation of moisture and
achieves quicker stiffness and strength development.
Stiffness, fatigue response, deformation properties, resilient modulus, and
water susceptibility are good means for assessing the performance of cold
mixes.
Knowledge about the interaction between virgin binders and aged residual
binders in cold recycled mixes is still ambiguous and needs further
exploration. RAPs are still regarded as black rocks when they are used in
cold recycling.
The effect of preparation temperature (mixing and compacting) of cold
mixes has not been fully accounted for in literature.
Structural design of pavements involving cold mixtures should consider the
non linear behaviour of such mixtures for good results.
Chapter 4 Laboratory Ageing Protocol for Producing Severely Aged RAPs
95
4 Laboratory Ageing Protocol for Producing
Severely Aged RAPs
4.1 Overview
This chapter describes the procedure followed in producing the reclaimed asphalt
pavements (RAPs) that were used in this research work. This was embarked upon
with the aim of producing RAP materials in the laboratory with controlled
properties, typical of those found in hot tropical belts (with residual binders of
very low penetration). Evidence from the literature as reported in Chapter 3 of
this thesis indicates that existing standard protocols for ageing bitumen and
bituminous mixtures essentially mimic ageing in road asphaltic pavements in
developed countries where their climates are mainly temperate. Asphaltic
pavement conditions in such countries are rarely left to deteriorate to the level
that was investigated in this work and thus makes the existing laboratory ageing
standard unsuitable for this exercise. The produced RAPs were subsequently used
for laboratory studies on cold recycling described in subsequent chapters of this
thesis.
4.2 Why Laboratory Aged RAPs and not RAPs from the Industry?
In developing guidelines for the use of cold recycled asphalt mixes in hot tropical
countries (with Nigeria being the case study) the first challenge is sourcing the
recyclate. For this investigation, being conducted in the UK, three options were
available, i.e. (1) Sourcing RAP from local construction industry, (2) Placing an
order for RAP materials from Nigeria and (3) Making artificial RAP in the
laboratory. The first option comes with some variables which could give
misleading results in this research work. In the UK for example, road developers
favour the use of limestone as aggregates for bituminous binder course mixtures
due to the fact that the material is abundantly available and with the advantage
of being good at resisting stripping when used in bituminous mixtures. On the
contrary, in Nigeria, which is the case study in this work, granite is normally used
for the production of bituminous mixtures since they are abundantly available.
Another fundamental issue concerns the severity of ageing of the RAP. It is not
common in the UK to allow pavements to deteriorate to levels such that
penetration values of recovered binders from RAPs would be as low as 5dmm. In
Chapter 4 Laboratory Ageing Protocol for Producing Severely Aged RAPs
96
fact, RAPs with mean penetration values less than 15dmm are not deemed
suitable for use in recycling (BS EN 13108-8:2005) or at best classified and
treated as black rock. Meanwhile, Nnanna (2003) observed that some roads
constructed about 32 years ago in Nigeria have not yet been rehabilitated. Such
long neglect must be partly responsible for the findings of Smith and Edward
(2001) in which they reported penetration values as low as 6dmm for wearing
course and 5dmm for binder course in some asphalt pavements in East Africa.
Thus the suitable materials for this research work might not be sufficiently
available in the UK. Similarly, the use of modified bituminous binders in the UK is
a major factor that could introduce significant variations to the findings of this
work if used. It might be a difficult task differentiating RAPs with modified binders
from those that are not if they are to be used for this research work. Straight run
bitumen is most frequently used as the binding medium for bituminous mixtures
in Nigeria. Concerning the second option identified for sourcing RAP materials, the
huge costs and delays that may be involved in the logistics of getting such
materials to the UK both make it unappealing and thus it was abandoned.
The third option which is, producing the RAPs in the laboratory through ageing of
virgin bituminous mixtures seems to be the most practical. Although laborious,
this will obviously allow for an exercise of control over the quality and condition of
the RAPs produced. As earlier observed in Chapter 3, standard laboratory
protocols for long term ageing of asphalt mixtures have been developed during
the Link BITUTEST and SHRP programmes in the UK and USA respectively (Bell,
1989; and Scholz, 1995). Long term laboratory ageing under these protocols is
conducted at 85⁰C over 5days, and the assumption is that this is representative of
15 years or more of ageing of pavements in service in temperate regions of the
world (Bell 1989; and Scholz, 1995).
However, these standard laboratory ageing protocols use compacted specimens
(Airey, 2003) and would require long laboratory ageing times in order to produce
the desired properties. This is understandable as such protocols were not
designed for the harsh conditions considered in this work. Ageing loose samples
at higher temperatures (105⁰C and 125⁰C) than standard will generate more
homogeneous (de la Roche et al, 2009) severely aged RAP in a practical time but
risks unduly degrading the binder in the mix. Researchers have suggested that
this degradation would normally affect the physico-chemical and rheological
properties of the binder in the mix (Airey, 2003 and Wu et al, 2007).
It was considered important to conduct this investigation and come up with an
ageing protocol that is as quick as possible without compromising the integrity of
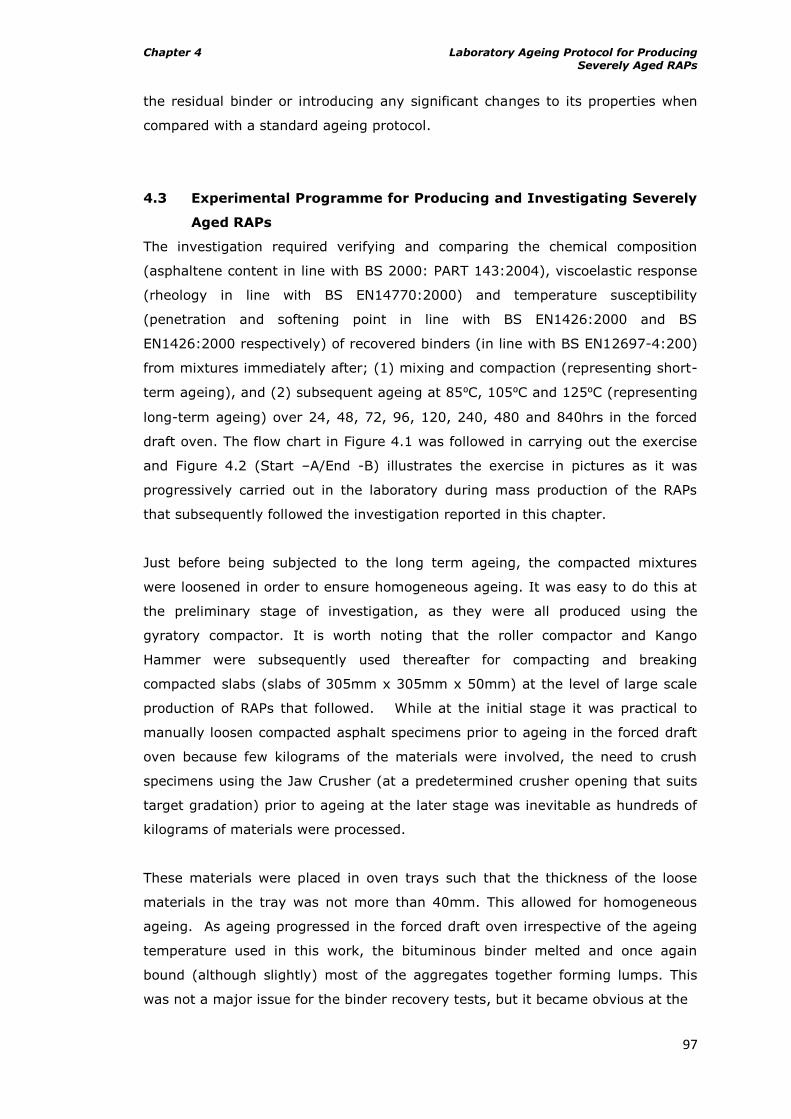
Chapter 4 Laboratory Ageing Protocol for Producing Severely Aged RAPs
97
the residual binder or introducing any significant changes to its properties when
compared with a standard ageing protocol.
4.3 Experimental Programme for Producing and Investigating Severely
Aged RAPs
The investigation required verifying and comparing the chemical composition
(asphaltene content in line with BS 2000: PART 143:2004), viscoelastic response
(rheology in line with BS EN14770:2000) and temperature susceptibility
(penetration and softening point in line with BS EN1426:2000 and BS
EN1426:2000 respectively) of recovered binders (in line with BS EN12697-4:200)
from mixtures immediately after; (1) mixing and compaction (representing short-
term ageing), and (2) subsequent ageing at 85⁰C, 105⁰C and 125⁰C (representing
long-term ageing) over 24, 48, 72, 96, 120, 240, 480 and 840hrs in the forced
draft oven. The flow chart in Figure 4.1 was followed in carrying out the exercise
and Figure 4.2 (Start –A/End -B) illustrates the exercise in pictures as it was
progressively carried out in the laboratory during mass production of the RAPs
that subsequently followed the investigation reported in this chapter.
Just before being subjected to the long term ageing, the compacted mixtures
were loosened in order to ensure homogeneous ageing. It was easy to do this at
the preliminary stage of investigation, as they were all produced using the
gyratory compactor. It is worth noting that the roller compactor and Kango
Hammer were subsequently used thereafter for compacting and breaking
compacted slabs (slabs of 305mm x 305mm x 50mm) at the level of large scale
production of RAPs that followed. While at the initial stage it was practical to
manually loosen compacted asphalt specimens prior to ageing in the forced draft
oven because few kilograms of the materials were involved, the need to crush
specimens using the Jaw Crusher (at a predetermined crusher opening that suits
target gradation) prior to ageing at the later stage was inevitable as hundreds of
kilograms of materials were processed.
These materials were placed in oven trays such that the thickness of the loose
materials in the tray was not more than 40mm. This allowed for homogeneous
ageing. As ageing progressed in the forced draft oven irrespective of the ageing
temperature used in this work, the bituminous binder melted and once again
bound (although slightly) most of the aggregates together forming lumps. This
was not a major issue for the binder recovery tests, but it became obvious at the
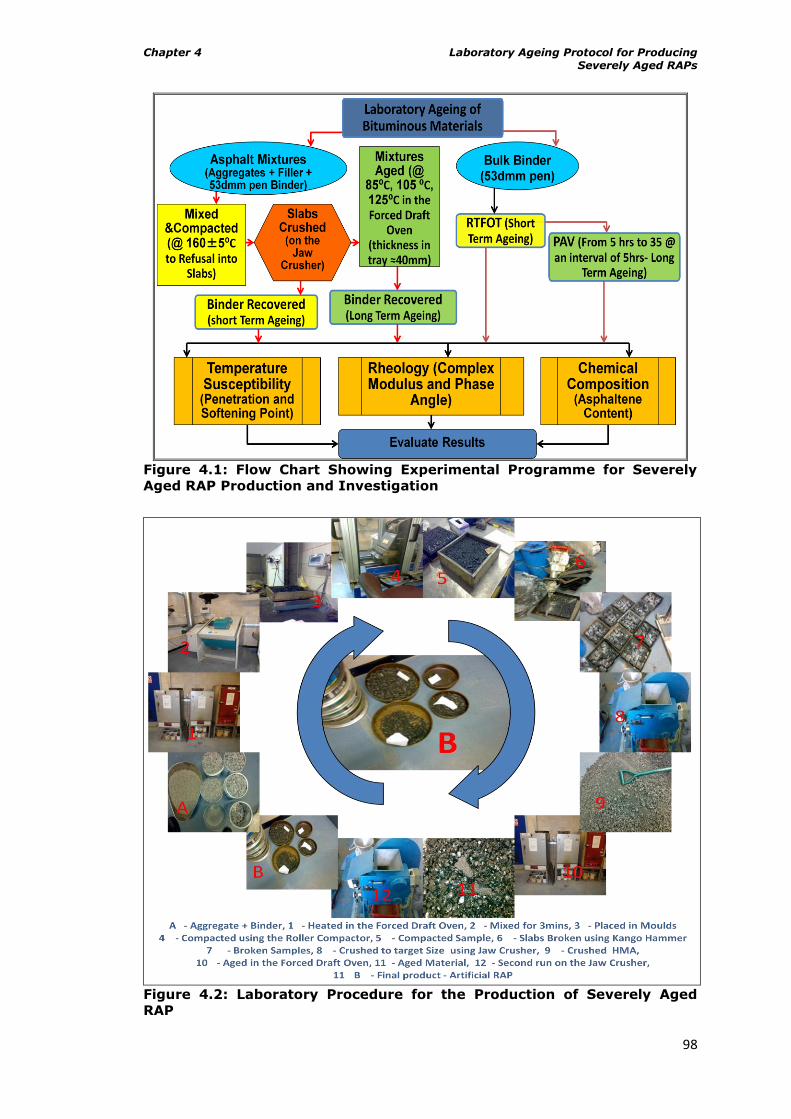
Chapter 4 Laboratory Ageing Protocol for Producing Severely Aged RAPs
98
Figure 4.1: Flow Chart Showing Experimental Programme for Severely
Aged RAP Production and Investigation
Figure 4.2: Laboratory Procedure for the Production of Severely Aged
RAP
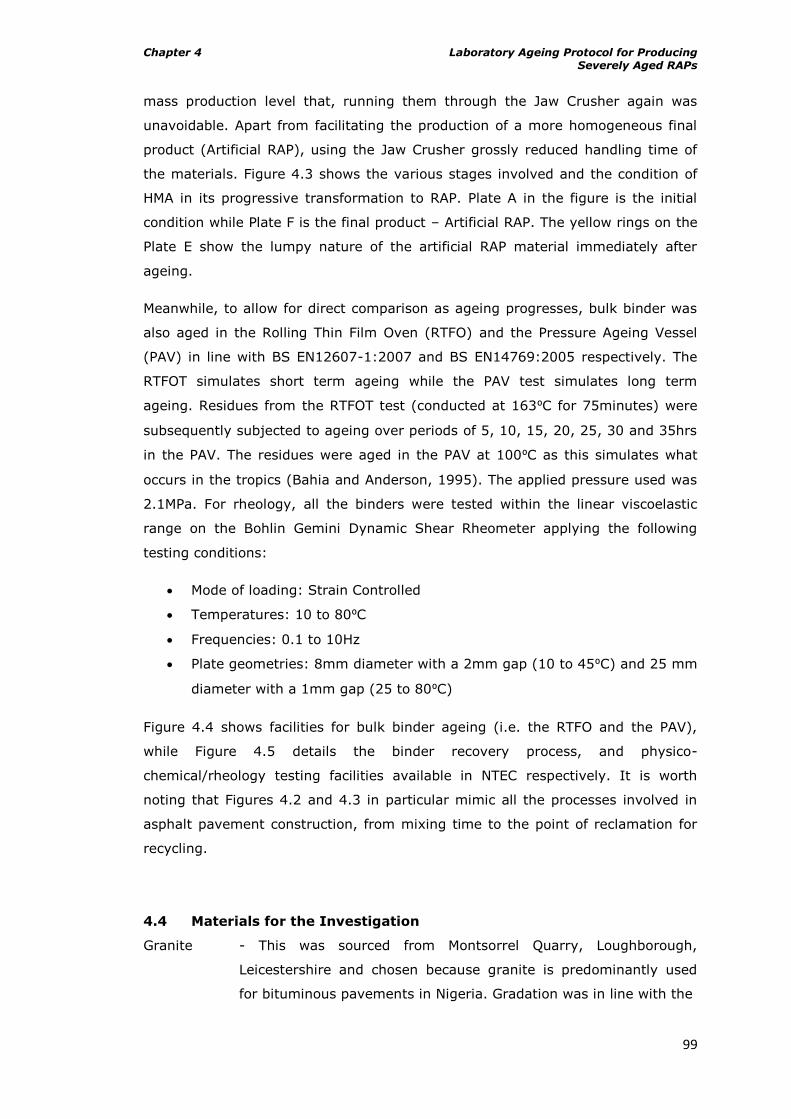
Chapter 4 Laboratory Ageing Protocol for Producing Severely Aged RAPs
99
mass production level that, running them through the Jaw Crusher again was
unavoidable. Apart from facilitating the production of a more homogeneous final
product (Artificial RAP), using the Jaw Crusher grossly reduced handling time of
the materials. Figure 4.3 shows the various stages involved and the condition of
HMA in its progressive transformation to RAP. Plate A in the figure is the initial
condition while Plate F is the final product – Artificial RAP. The yellow rings on the
Plate E show the lumpy nature of the artificial RAP material immediately after
ageing.
Meanwhile, to allow for direct comparison as ageing progresses, bulk binder was
also aged in the Rolling Thin Film Oven (RTFO) and the Pressure Ageing Vessel
(PAV) in line with BS EN12607-1:2007 and BS EN14769:2005 respectively. The
RTFOT simulates short term ageing while the PAV test simulates long term
ageing. Residues from the RTFOT test (conducted at 163⁰C for 75minutes) were
subsequently subjected to ageing over periods of 5, 10, 15, 20, 25, 30 and 35hrs
in the PAV. The residues were aged in the PAV at 100⁰C as this simulates what
occurs in the tropics (Bahia and Anderson, 1995). The applied pressure used was
2.1MPa. For rheology, all the binders were tested within the linear viscoelastic
range on the Bohlin Gemini Dynamic Shear Rheometer applying the following
testing conditions:
Mode of loading: Strain Controlled
Temperatures: 10 to 80⁰C
Frequencies: 0.1 to 10Hz
Plate geometries: 8mm diameter with a 2mm gap (10 to 45⁰C) and 25 mm
diameter with a 1mm gap (25 to 80⁰C)
Figure 4.4 shows facilities for bulk binder ageing (i.e. the RTFO and the PAV),
while Figure 4.5 details the binder recovery process, and physico-
chemical/rheology testing facilities available in NTEC respectively. It is worth
noting that Figures 4.2 and 4.3 in particular mimic all the processes involved in
asphalt pavement construction, from mixing time to the point of reclamation for
recycling.
4.4 Materials for the Investigation
Granite - This was sourced from Montsorrel Quarry, Loughborough,
Leicestershire and chosen because granite is predominantly used
for bituminous pavements in Nigeria. Gradation was in line with the
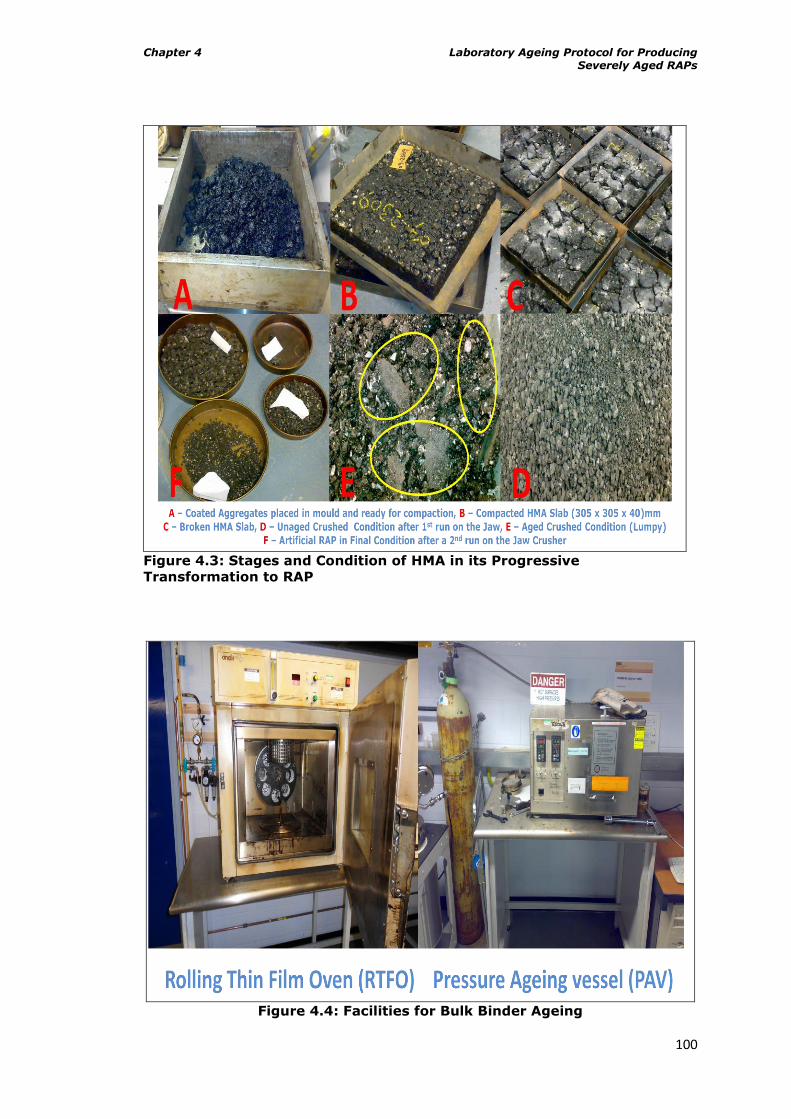
Chapter 4 Laboratory Ageing Protocol for Producing Severely Aged RAPs
100
Figure 4.3: Stages and Condition of HMA in its Progressive
Transformation to RAP
Figure 4.4: Facilities for Bulk Binder Ageing
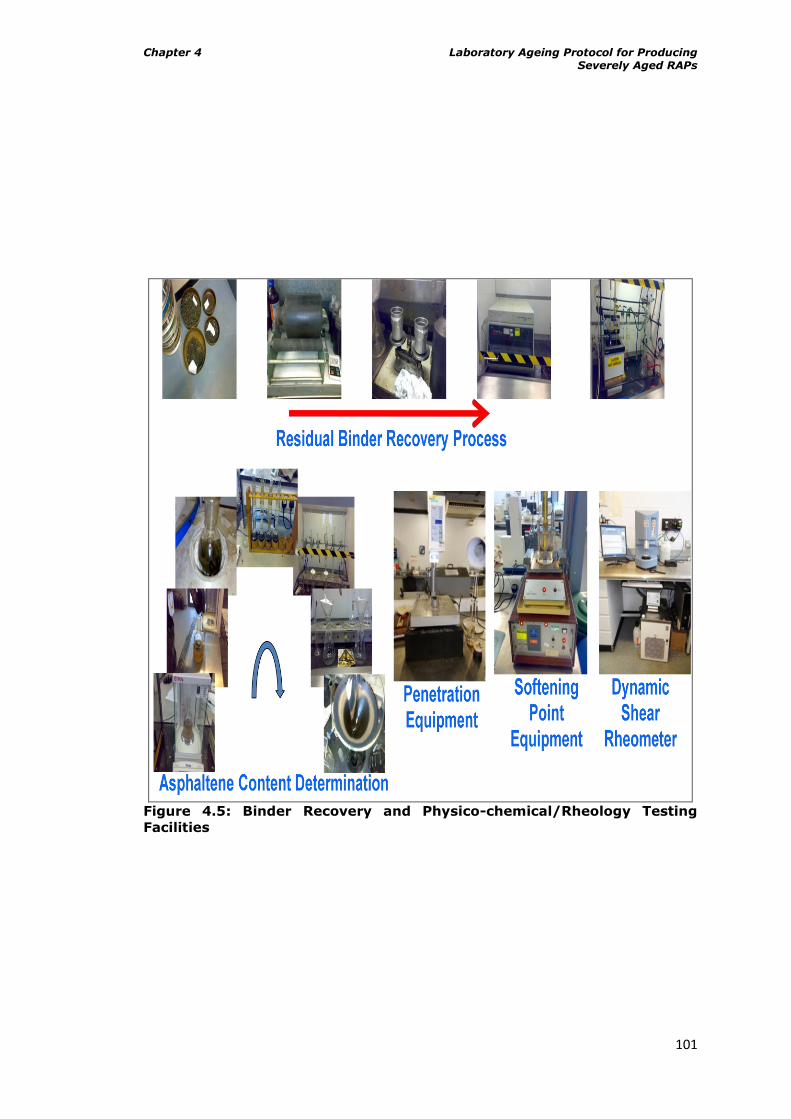
Chapter 4 Laboratory Ageing Protocol for Producing Severely Aged RAPs
101
Figure 4.5: Binder Recovery and Physico-chemical/Rheology Testing
Facilities
Chapter 4 Laboratory Ageing Protocol for Producing Severely Aged RAPs
102
requirements of ORN 19 and 31 (TRL and DFID, 2002 and TRRL,
1993) for heavily trafficked roads in the tropics.
Bitumen - This was supplied by Nynas Bitumen and it was a straight run
paving grade bituminous binder 40/60 (with measured 53dmm pen
and 51⁰C softening point) of Venezuelan origin.
HMA - Prepared in the laboratory (BS EN12697-35:2004). The mix was
compacted to refusal in line with the requirements of ORN 19 and
31 for heavily trafficked roads in the tropics. Figure 4.6 details the
gradation of the granite aggregate used for the production of the
HMA. The gyratory compactor was used for compaction of the
samples at this initial stage and the specification for production of
samples that was used is:
Number of Samples: 36
Sample Size: 100mm diameter 63.5mm thickness
Mix Type: DBM (Wearing Course)
Binder Content: Will be a function of Voids in Mineral
Aggregate (VMA) (4.6% but could be increased to around
5% to achieve a better coating)
Aggregate Type: Granite
Aggregate Gradation: In line with ORN 19 design for a 14mm
close graded surface (see Figure 4.6)
Compaction Method: Gyratory
Angle of Gyration and Compaction Stress: 1deg and 600KPa
Desired Density: Refusal at about 3-5% Voids in Mix (VIM)
4.5 Physico-Chemical and Rheological Properties of Recovered Binders
from Aged Mixtures and Bulk Binders
The tests carried out on the studied bituminous binders (virgin and recovered
alike) focused on the determination of their physical properties which include
penetration and softening point. Also tests were conducted in the Dynamic Shear
Rheometer (DSR) in the oscillation mode of testing, essentially to determine the
viscoelastic response of the binders. The asphaltene contents of all the binders
were also determined in order to ascertain their chemical compositions.
4.5.1 Determination of penetration
This test basically measures the consistency of bitumen (Read and Whiteoak,
2003). The test is such that a needle of specified dimensions is allowed to
penetrate a sample of bitumen under a known load which normally is 100g, at a
fixed temperature of 25⁰C, for a known time of 5s (see Figure 4.7). Penetration is
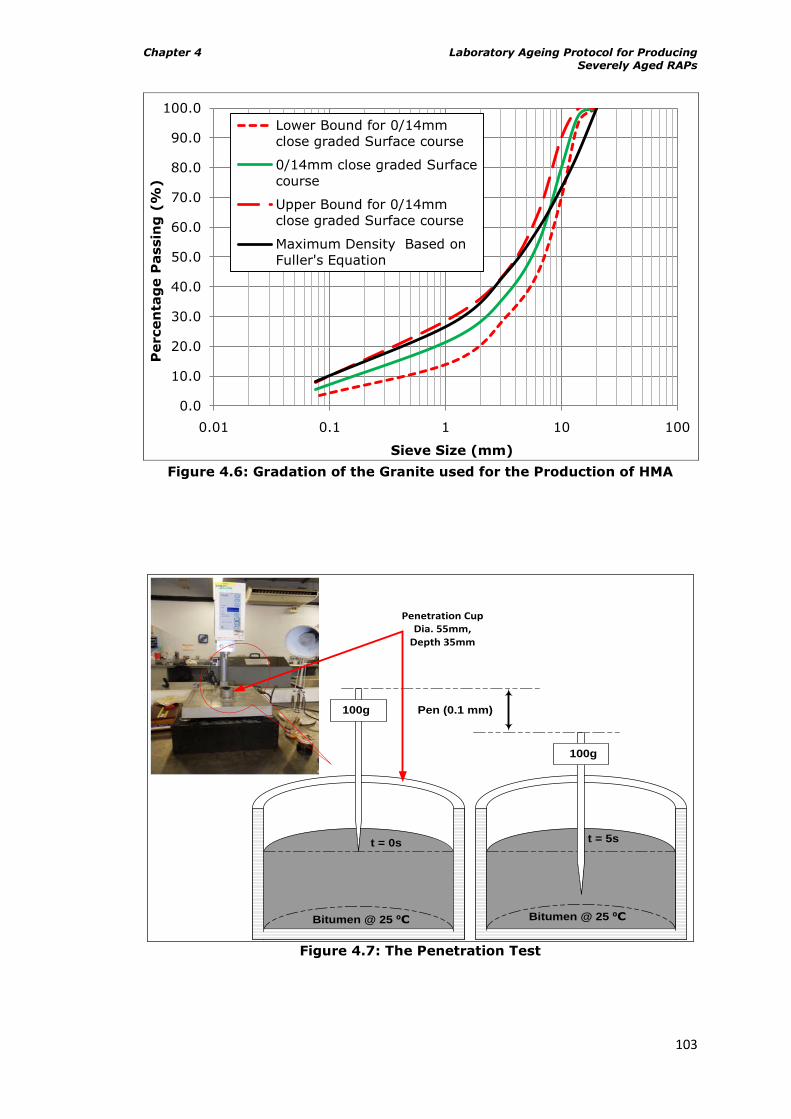
Chapter 4 Laboratory Ageing Protocol for Producing Severely Aged RAPs
103
Figure 4.6: Gradation of the Granite used for the Production of HMA
Bitumen @ 25 ⁰C
t = 0s t = 5s
Pen (0.1 mm)100g
100g
Bitumen @ 25 ⁰C
Penetration CupDia. 55mm,
Depth 35mm
Figure 4.7: The Penetration Test
0.0
10.0
20.0
30.0
40.0
50.0
60.0
70.0
80.0
90.0
100.0
0.01 0.1 1 10 100
Percen
tag
e P
assin
g (
%)
Sieve Size (mm)
Lower Bound for 0/14mm
close graded Surface course
0/14mm close graded Surface
course
Upper Bound for 0/14mm
close graded Surface course
Maximum Density Based on
Fuller's Equation
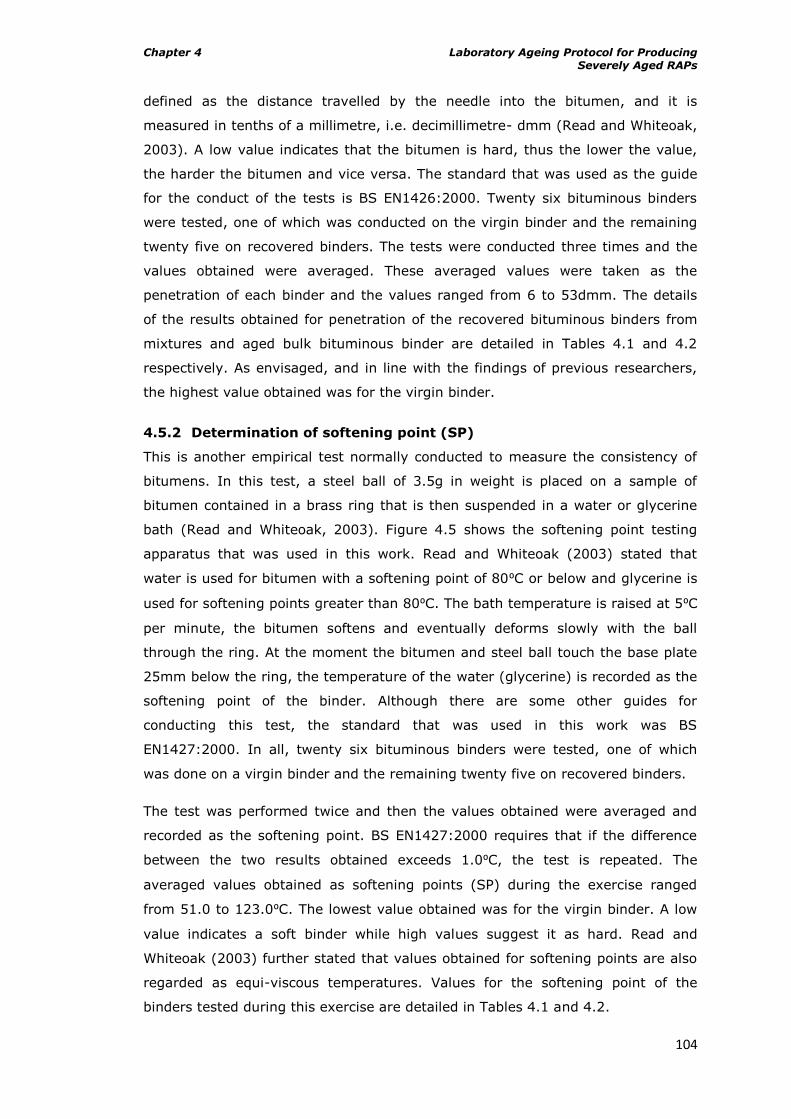
Chapter 4 Laboratory Ageing Protocol for Producing Severely Aged RAPs
104
defined as the distance travelled by the needle into the bitumen, and it is
measured in tenths of a millimetre, i.e. decimillimetre- dmm (Read and Whiteoak,
2003). A low value indicates that the bitumen is hard, thus the lower the value,
the harder the bitumen and vice versa. The standard that was used as the guide
for the conduct of the tests is BS EN1426:2000. Twenty six bituminous binders
were tested, one of which was conducted on the virgin binder and the remaining
twenty five on recovered binders. The tests were conducted three times and the
values obtained were averaged. These averaged values were taken as the
penetration of each binder and the values ranged from 6 to 53dmm. The details
of the results obtained for penetration of the recovered bituminous binders from
mixtures and aged bulk bituminous binder are detailed in Tables 4.1 and 4.2
respectively. As envisaged, and in line with the findings of previous researchers,
the highest value obtained was for the virgin binder.
4.5.2 Determination of softening point (SP)
This is another empirical test normally conducted to measure the consistency of
bitumens. In this test, a steel ball of 3.5g in weight is placed on a sample of
bitumen contained in a brass ring that is then suspended in a water or glycerine
bath (Read and Whiteoak, 2003). Figure 4.5 shows the softening point testing
apparatus that was used in this work. Read and Whiteoak (2003) stated that
water is used for bitumen with a softening point of 80⁰C or below and glycerine is
used for softening points greater than 80⁰C. The bath temperature is raised at 5⁰C
per minute, the bitumen softens and eventually deforms slowly with the ball
through the ring. At the moment the bitumen and steel ball touch the base plate
25mm below the ring, the temperature of the water (glycerine) is recorded as the
softening point of the binder. Although there are some other guides for
conducting this test, the standard that was used in this work was BS
EN1427:2000. In all, twenty six bituminous binders were tested, one of which
was done on a virgin binder and the remaining twenty five on recovered binders.
The test was performed twice and then the values obtained were averaged and
recorded as the softening point. BS EN1427:2000 requires that if the difference
between the two results obtained exceeds 1.0⁰C, the test is repeated. The
averaged values obtained as softening points (SP) during the exercise ranged
from 51.0 to 123.0⁰C. The lowest value obtained was for the virgin binder. A low
value indicates a soft binder while high values suggest it as hard. Read and
Whiteoak (2003) further stated that values obtained for softening points are also
regarded as equi-viscous temperatures. Values for the softening point of the
binders tested during this exercise are detailed in Tables 4.1 and 4.2.
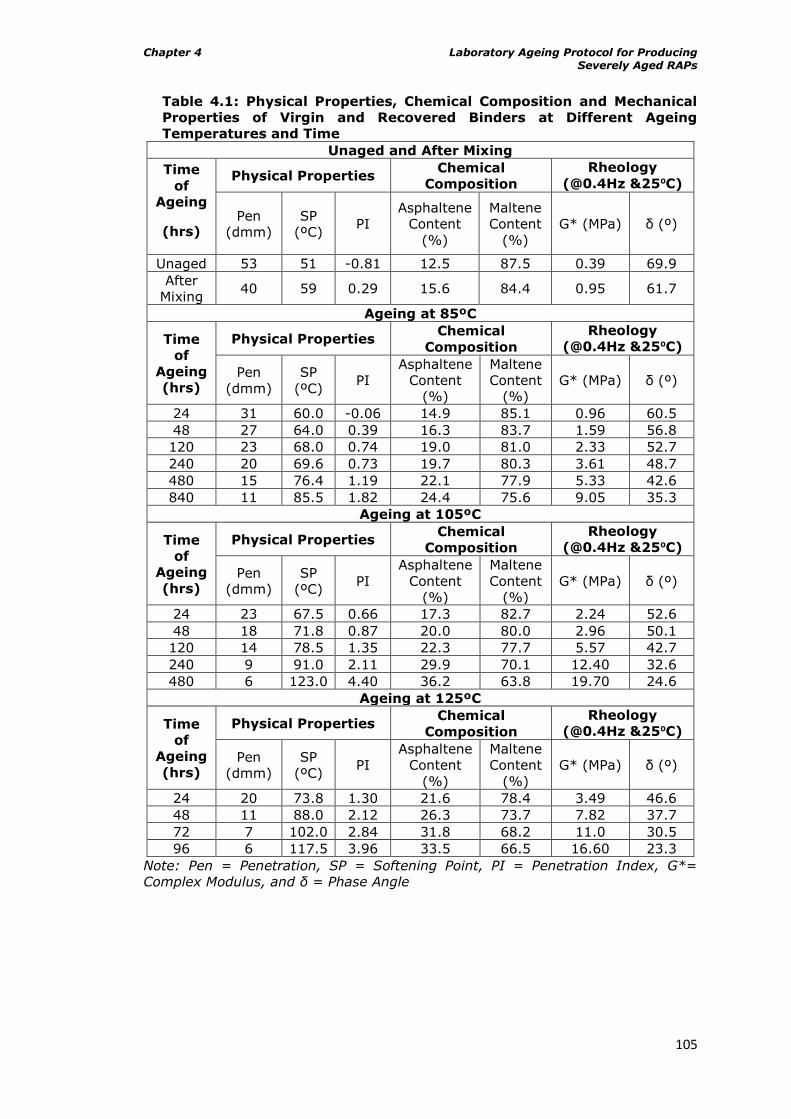
Chapter 4 Laboratory Ageing Protocol for Producing Severely Aged RAPs
105
Table 4.1: Physical Properties, Chemical Composition and Mechanical
Properties of Virgin and Recovered Binders at Different Ageing
Temperatures and Time
Unaged and After Mixing
Time
of
Ageing
(hrs)
Physical Properties Chemical
Composition
Rheology
(@0.4Hz &25⁰C)
Pen
(dmm)
SP
(ºC) PI
Asphaltene
Content
(%)
Maltene
Content
(%)
G* (MPa) δ (º)
Unaged 53 51 -0.81 12.5 87.5 0.39 69.9
After
Mixing 40 59 0.29 15.6 84.4 0.95 61.7
Ageing at 85ºC
Time
of
Ageing
(hrs)
Physical Properties Chemical
Composition
Rheology
(@0.4Hz &25⁰C)
Pen
(dmm)
SP
(ºC) PI
Asphaltene
Content
(%)
Maltene
Content
(%)
G* (MPa) δ (º)
24 31 60.0 -0.06 14.9 85.1 0.96 60.5
48 27 64.0 0.39 16.3 83.7 1.59 56.8
120 23 68.0 0.74 19.0 81.0 2.33 52.7
240 20 69.6 0.73 19.7 80.3 3.61 48.7
480 15 76.4 1.19 22.1 77.9 5.33 42.6
840 11 85.5 1.82 24.4 75.6 9.05 35.3
Ageing at 105ºC
Time
of
Ageing
(hrs)
Physical Properties Chemical
Composition
Rheology
(@0.4Hz &25⁰C)
Pen
(dmm)
SP
(ºC) PI
Asphaltene
Content
(%)
Maltene
Content
(%)
G* (MPa) δ (º)
24 23 67.5 0.66 17.3 82.7 2.24 52.6
48 18 71.8 0.87 20.0 80.0 2.96 50.1
120 14 78.5 1.35 22.3 77.7 5.57 42.7
240 9 91.0 2.11 29.9 70.1 12.40 32.6
480 6 123.0 4.40 36.2 63.8 19.70 24.6
Ageing at 125ºC
Time
of
Ageing
(hrs)
Physical Properties Chemical
Composition
Rheology
(@0.4Hz &25⁰C)
Pen
(dmm)
SP
(ºC) PI
Asphaltene
Content
(%)
Maltene
Content
(%)
G* (MPa) δ (º)
24 20 73.8 1.30 21.6 78.4 3.49 46.6
48 11 88.0 2.12 26.3 73.7 7.82 37.7
72 7 102.0 2.84 31.8 68.2 11.0 30.5
96 6 117.5 3.96 33.5 66.5 16.60 23.3
Note: Pen = Penetration, SP = Softening Point, PI = Penetration Index, G*=
Complex Modulus, and δ = Phase Angle
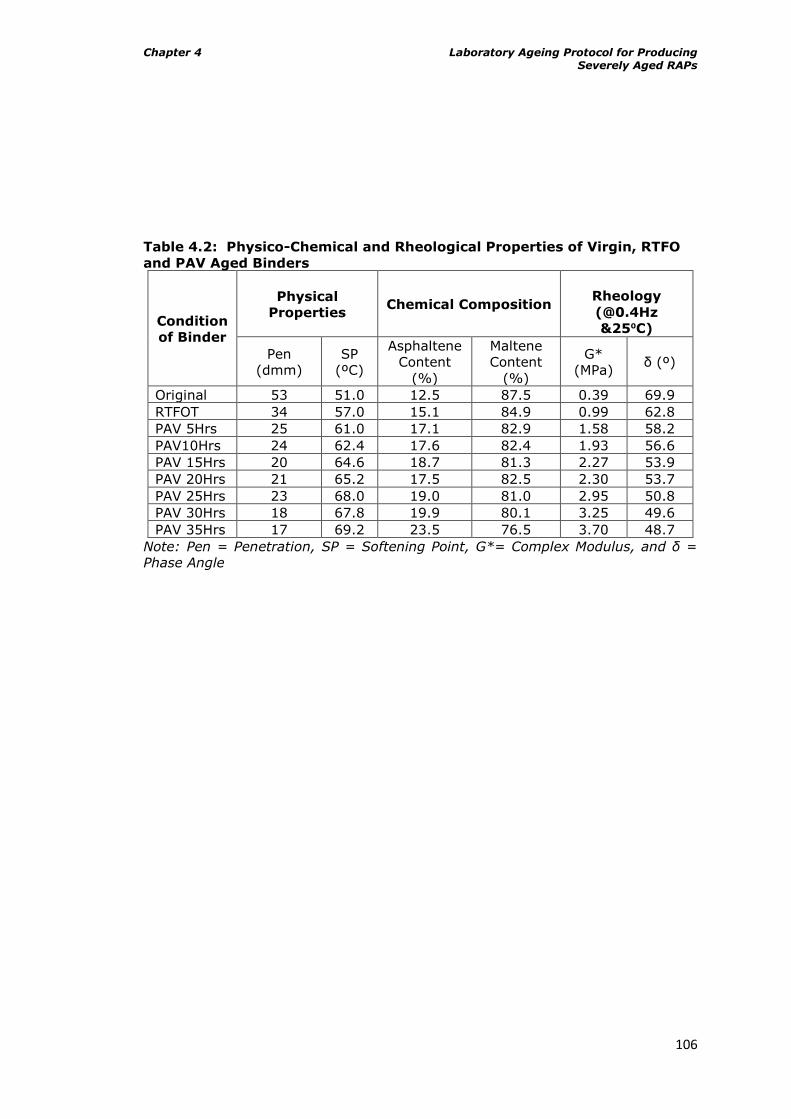
Chapter 4 Laboratory Ageing Protocol for Producing Severely Aged RAPs
106
Table 4.2: Physico-Chemical and Rheological Properties of Virgin, RTFO
and PAV Aged Binders
Condition
of Binder
Physical
Properties Chemical Composition
Rheology
(@0.4Hz
&25⁰C)
Pen
(dmm)
SP
(ºC)
Asphaltene
Content
(%)
Maltene
Content
(%)
G*
(MPa) δ (º)
Original 53 51.0 12.5 87.5 0.39 69.9
RTFOT 34 57.0 15.1 84.9 0.99 62.8
PAV 5Hrs 25 61.0 17.1 82.9 1.58 58.2
PAV10Hrs 24 62.4 17.6 82.4 1.93 56.6
PAV 15Hrs 20 64.6 18.7 81.3 2.27 53.9
PAV 20Hrs 21 65.2 17.5 82.5 2.30 53.7
PAV 25Hrs 23 68.0 19.0 81.0 2.95 50.8
PAV 30Hrs 18 67.8 19.9 80.1 3.25 49.6
PAV 35Hrs 17 69.2 23.5 76.5 3.70 48.7
Note: Pen = Penetration, SP = Softening Point, G*= Complex Modulus, and δ =
Phase Angle
Chapter 4 Laboratory Ageing Protocol for Producing Severely Aged RAPs
107
The values obtained for the penetration and softening point of the bituminous
binders were used in determining the temperature susceptibility i.e. penetration
index (PI), of the tested binders. Saleh (2006), defined temperature susceptibility
as a measure of the way the binder‟s consistency changes with a change in
temperature. Values below -2 indicate high temperature susceptibility. The values
obtained for the PI are also in Tables 4.1 and 4.2. The values were calculated
after Read and Whiteoak (2003) from:
4.1
(Where Pen and SP are the penetration and the corresponding softening point
values of the binder).
4.5.3 Chemical composition of recovered binders
The test was carried out with the aim of determining the chemical composition of
the binders and was conducted in line with BS 2000 Part 143:2004, in which the
asphaltene contents were precipitated using heptanes (C7H16). This was done by
first dissolving each bitumen sample in hot toluene (methylbenzene- C7H8
(C6H5CH3)) in order to get rid of the inorganic and the waxy components of the
binder.
Pure bitumen dissolves completely in toluene while the inorganic and waxy
components come out as precipitates. The precipitates were filtered off using a
filter paper. Thereafter, the bitumen was recovered in the fractionating column
from the toluene solution. The recovered pure bitumen was subsequently
dissolved in hot heptane. Maltenes dissolve completely in heptane, while
asphaltenes are precipitated in the process. The solution was filtered and the
precipitates - asphaltenes were subsequently recovered. The asphaltenes are
normally expressed in percentage i.e. asphaltene contents percentage (%) of the
bitumen sample. Two tests were conducted on each bitumen sample and the
results were averaged and subsequently recorded as the asphaltene content.
Tables 4.1 and 4.2 detail the chemical composition of the binders i.e. asphaltene
and maltene contents while Figure 4.4 captures some of the processes involved in
the determination thereof. The results obtained are consistent with those of other
researchers, as the asphaltene contents increased, the degree of hardness of the
recovered binders increased. The asphaltene contents of the virgin binder and the
recovered binder after mixing are 12.45% and 15.55% respectively. These results
and others are discussed later in this chapter.
Chapter 4 Laboratory Ageing Protocol for Producing Severely Aged RAPs
108
4.5.4 Tests on the Dynamic Shear Rheometer (DSR)
The Dynamic Shear Rheometer (DSR) is used for measuring the dynamic
viscoelastic properties of bituminous binders among other things (Papagiannakis
and Masad, 2008). Rahman (2004) stated that the DSR is capable of describing
the linear viscoelastic responses of binders (see Figure 4.8) over a range of
temperatures and frequencies. The DSR used in this work is shown in both
Figures 4.5 and 4.9, and the standard used for the conduct of the tests was BS
EN 14770:2005. The DSR applies sinusoidal shear strain to a sample of bitumen
sandwiched between two parallel plates as shown in Figure 4.9. The plates used
were 8mm (for temperatures between 10⁰C and 45⁰C and binder thickness of
2mm) and 25mm (for temperatures between 25⁰C and 80⁰C with a binder
thickness of 1mm) in diameter. Rahman (2004) stated that the amplitude of the
stress is measured by determining the torque transmitted through the sample in
response to the applied strain. The DSR only records two measurements i.e.
torque (Τ) and angular rotation (θ), while the remaining mechanical properties
are calculated using these two measurements. The relevant equations and the
testing geometry are as shown also in Figure 4.9. Meanwhile „r‟ in the equations
stands for the radius of the parallel plates used. The mechanical properties of
interest in this work are the complex shear modulus (G*) and the phase angle (δ)
of the binders. While G* is determined as indicated in Figure 4.9, δ is measured
automatically by the instrument by accurately determining the sinusoidal
waveforms of the strain and torque as indicated in Figure 4.9.
Before conducting any test on the bitumen, the linear viscoelastic range is first
determined by conducting an amplitude sweep. This linear range is defined from
the point G* (maximum point) to 0.95G* as indicated in Figure 4.8. The
subsequent frequency sweep and single frequency tests are conducted using the
target strain obtained from the plots of the linear viscoelastic range. The essence
of this is to ensure that all tests were conducted in the linear viscoelastic range of
each binder. Obtaining the values of the complex shear modulus (G*) and the
phase angle (δ) of the binders tested are now easy as they are automatically
recorded through the software specifically written for processing the raw data
obtained during the test in the DSR. Three tests; amplitude sweep (at 1Hz and
temperatures 20⁰C and 70⁰C for the 8mm and 25mm plates respectively), single
frequency tests (at 0.4Hz and temperature 25⁰C for both the 8mm and 25mm
plates) and frequency sweeps (at a frequency range of 0.1Hz to 10Hz,
temperature ranges of 10⁰C to 45⁰C and 25⁰C to 80⁰C for both the 8mm and
25mm plates respectively) were conducted. In all one hundred and fifty six (156)
tests were conducted on the 26 binders investigated in this exercise. The results
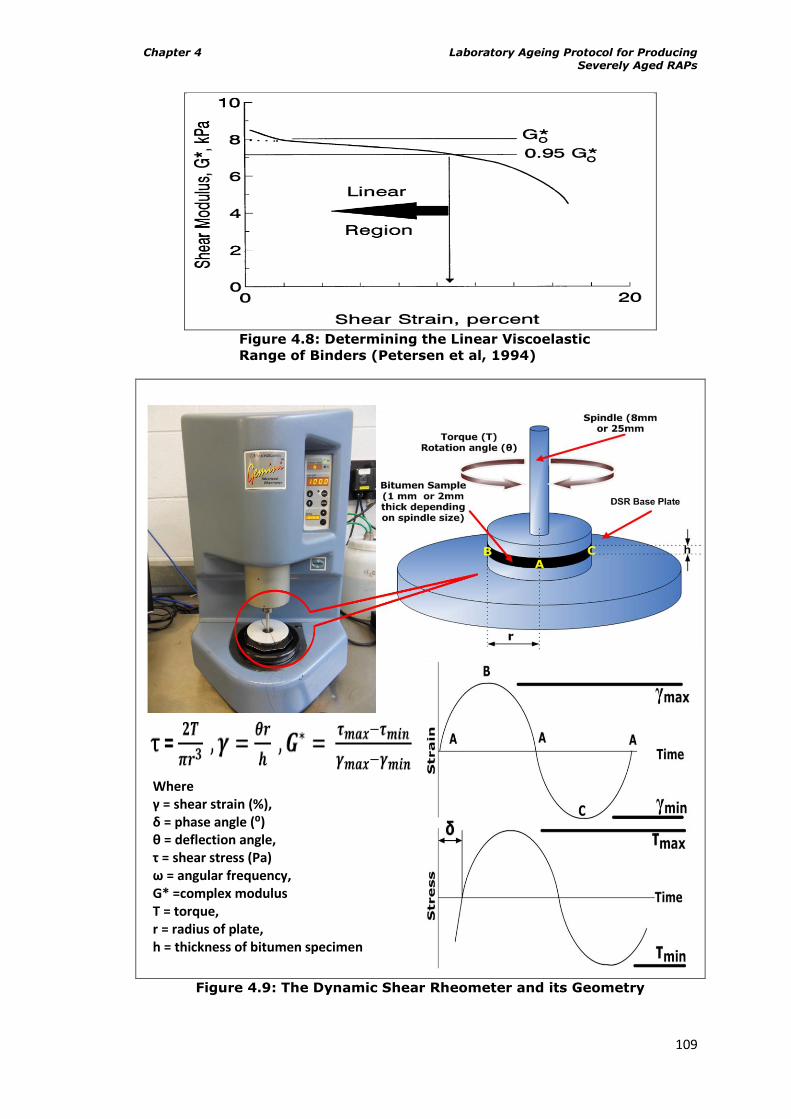
Chapter 4 Laboratory Ageing Protocol for Producing Severely Aged RAPs
109
Figure 4.8: Determining the Linear Viscoelastic
Range of Binders (Petersen et al, 1994)
Figure 4.9: The Dynamic Shear Rheometer and its Geometry
Where γ = shear strain (%), δ = phase angle (⁰) θ = deflection angle, τ = shear stress (Pa) ω = angular frequency, G* =complex modulus Τ = torque, r = radius of plate, h = thickness of bitumen specimen
Chapter 4 Laboratory Ageing Protocol for Producing Severely Aged RAPs
110
obtained (based on the single frequency tests with the earlier mentioned testing
configurations) for the complex shear modulus (G*) and the phase angle (δ) for
each of the binders are as stated in Tables 4.1 and 4.2 shown earlier.
4.6 Discussion and Analysis of Results
As mentioned in section 4.5 of this chapter, the integrity of the recovered binders
was examined through the determination of their softening points (BS EN
1427:2000), penetration (BS EN 1426:2000) (data obtained from both the
softening point and penetration tests were used in studying the temperature
susceptibility of the recovered binders), asphaltene contents (BS 2000:Part
143:2004) determination (for chemical composition of the binders) and the
determination of the viscoelastic response (BS EN 14770:2005) using results of
the measured complex modulus and phase angle obtained in the DSR. Tables 4.1
and 4.2 shown earlier detail the values obtained for the physical properties
(penetration, softening point and penetration index), the chemical composition
(asphaltene and maltene contents) and the mechanical properties (complex shear
modulus and phase angle) of the recovered binders from aged mixtures and as
well as aged bulk binders. All these were done in order to determine an effective
and efficient protocol for ageing bituminous mixtures in the laboratory without
significantly compromising the integrity of the binder in the bituminous mixture.
Meanwhile, the penetration of the binders has been used as the basis for
analysing the results, since some of the recovered binders under the three ageing
protocols i.e. 85⁰C, 105⁰C and 125⁰C gave similar penetration values. Ageing of
bituminous mixtures at 85⁰C is used as the reference (control) being the standard
practice. In all, four sets of similar penetration values occurred i.e. differently
aged binders with the same penetration values. Based on this, some relationships
were generated using the physical, chemical and mechanical properties of such
recovered binders to ascertain whether the integrity of the binders had been
compromised due to different ageing temperatures. The analysis was done
carefully taking into consideration the time required for the aged bituminous
mixtures to reach the desired severely aged level.
4.6.1 Penetration vs. ageing time
Figure 4.10 shows a plot of penetration against the time taken for ageing the
bituminous mixtures to the desired levels. After several trials a model that fits the
data was selected, and the model is indicated on the chart. It can be seen that
ageing at 85ºC is only likely to produce sufficiently aged binder (initial target
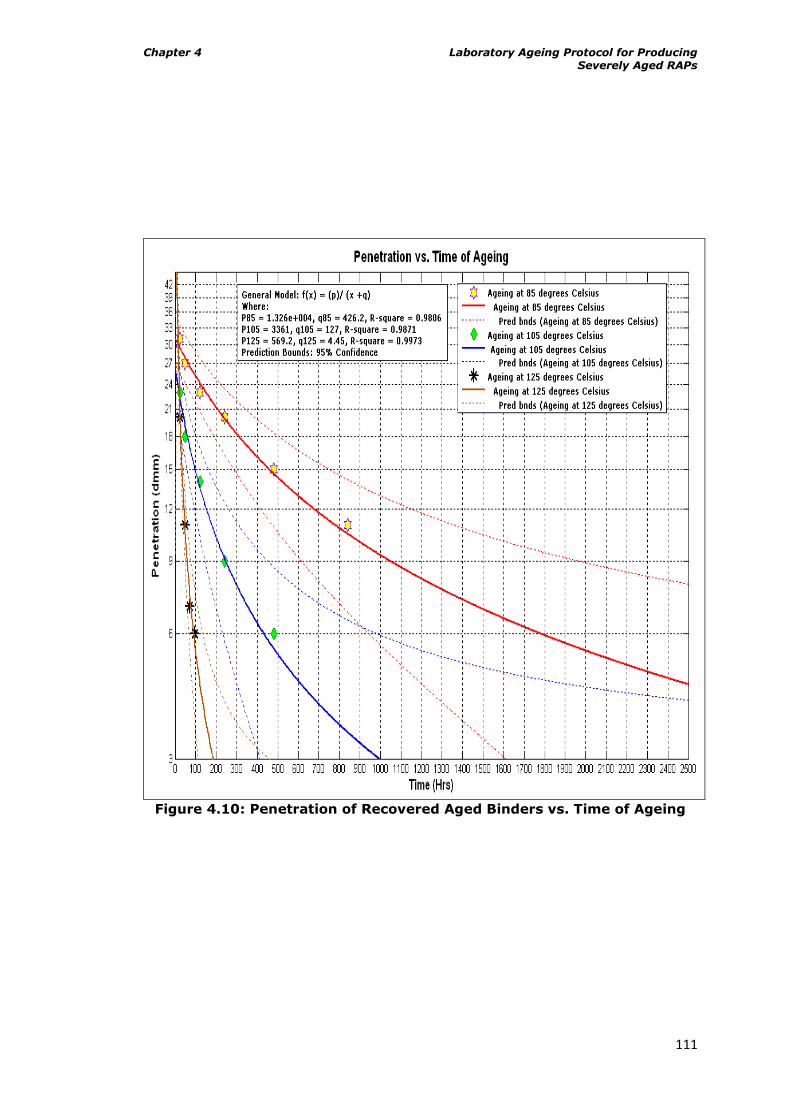
Chapter 4 Laboratory Ageing Protocol for Producing Severely Aged RAPs
111
Figure 4.10: Penetration of Recovered Aged Binders vs. Time of Ageing
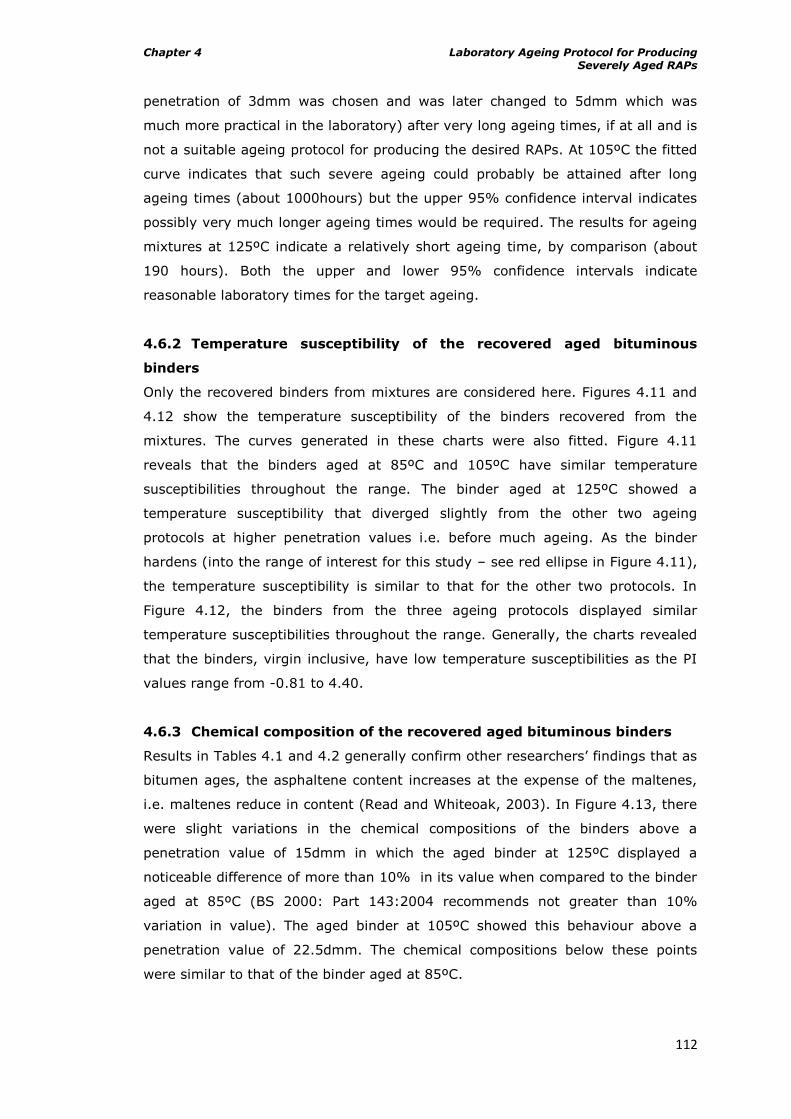
Chapter 4 Laboratory Ageing Protocol for Producing Severely Aged RAPs
112
penetration of 3dmm was chosen and was later changed to 5dmm which was
much more practical in the laboratory) after very long ageing times, if at all and is
not a suitable ageing protocol for producing the desired RAPs. At 105ºC the fitted
curve indicates that such severe ageing could probably be attained after long
ageing times (about 1000hours) but the upper 95% confidence interval indicates
possibly very much longer ageing times would be required. The results for ageing
mixtures at 125ºC indicate a relatively short ageing time, by comparison (about
190 hours). Both the upper and lower 95% confidence intervals indicate
reasonable laboratory times for the target ageing.
4.6.2 Temperature susceptibility of the recovered aged bituminous
binders
Only the recovered binders from mixtures are considered here. Figures 4.11 and
4.12 show the temperature susceptibility of the binders recovered from the
mixtures. The curves generated in these charts were also fitted. Figure 4.11
reveals that the binders aged at 85ºC and 105ºC have similar temperature
susceptibilities throughout the range. The binder aged at 125ºC showed a
temperature susceptibility that diverged slightly from the other two ageing
protocols at higher penetration values i.e. before much ageing. As the binder
hardens (into the range of interest for this study – see red ellipse in Figure 4.11),
the temperature susceptibility is similar to that for the other two protocols. In
Figure 4.12, the binders from the three ageing protocols displayed similar
temperature susceptibilities throughout the range. Generally, the charts revealed
that the binders, virgin inclusive, have low temperature susceptibilities as the PI
values range from -0.81 to 4.40.
4.6.3 Chemical composition of the recovered aged bituminous binders
Results in Tables 4.1 and 4.2 generally confirm other researchers‟ findings that as
bitumen ages, the asphaltene content increases at the expense of the maltenes,
i.e. maltenes reduce in content (Read and Whiteoak, 2003). In Figure 4.13, there
were slight variations in the chemical compositions of the binders above a
penetration value of 15dmm in which the aged binder at 125ºC displayed a
noticeable difference of more than 10% in its value when compared to the binder
aged at 85ºC (BS 2000: Part 143:2004 recommends not greater than 10%
variation in value). The aged binder at 105ºC showed this behaviour above a
penetration value of 22.5dmm. The chemical compositions below these points
were similar to that of the binder aged at 85ºC.
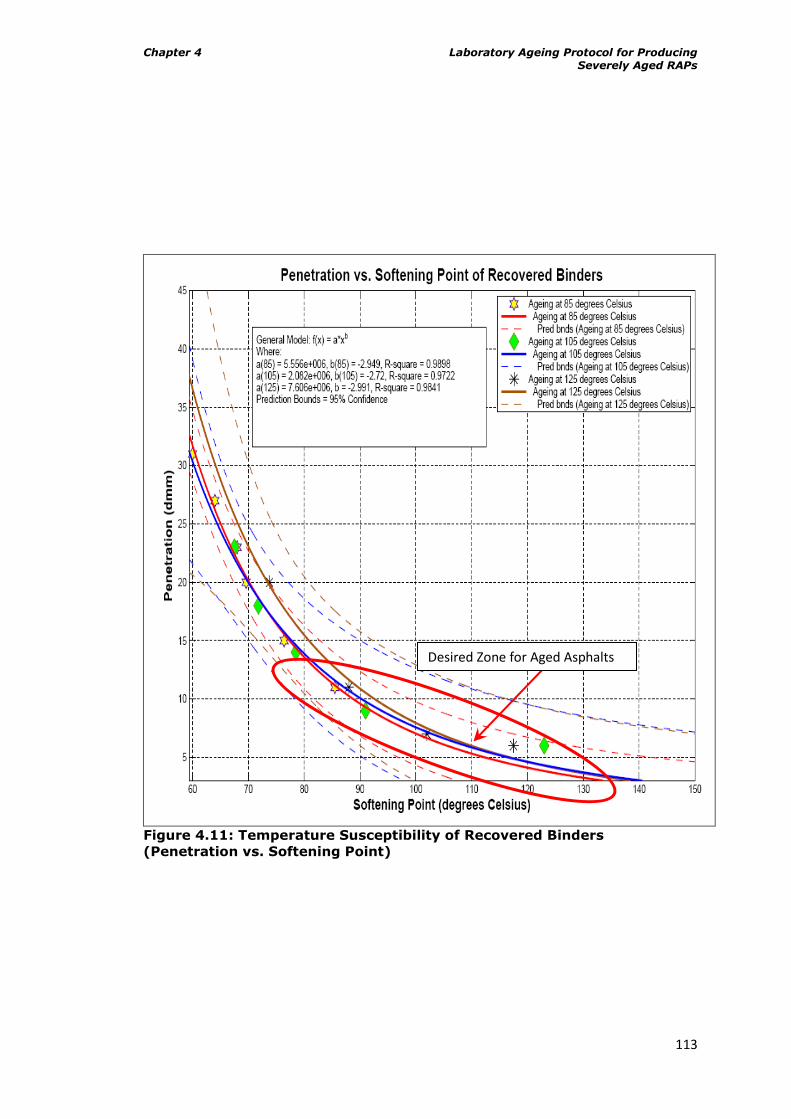
Chapter 4 Laboratory Ageing Protocol for Producing Severely Aged RAPs
113
Figure 4.11: Temperature Susceptibility of Recovered Binders
(Penetration vs. Softening Point)
Desired Zone for Aged Asphalts
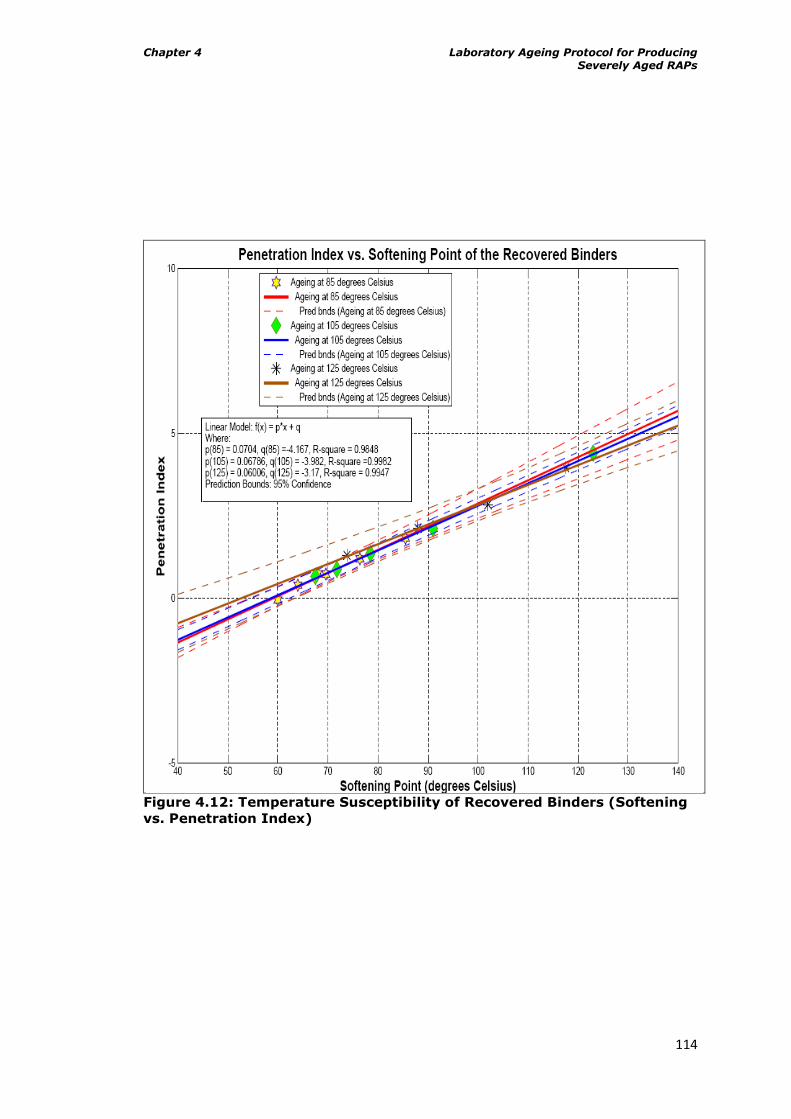
Chapter 4 Laboratory Ageing Protocol for Producing Severely Aged RAPs
114
Figure 4.12: Temperature Susceptibility of Recovered Binders (Softening
vs. Penetration Index)
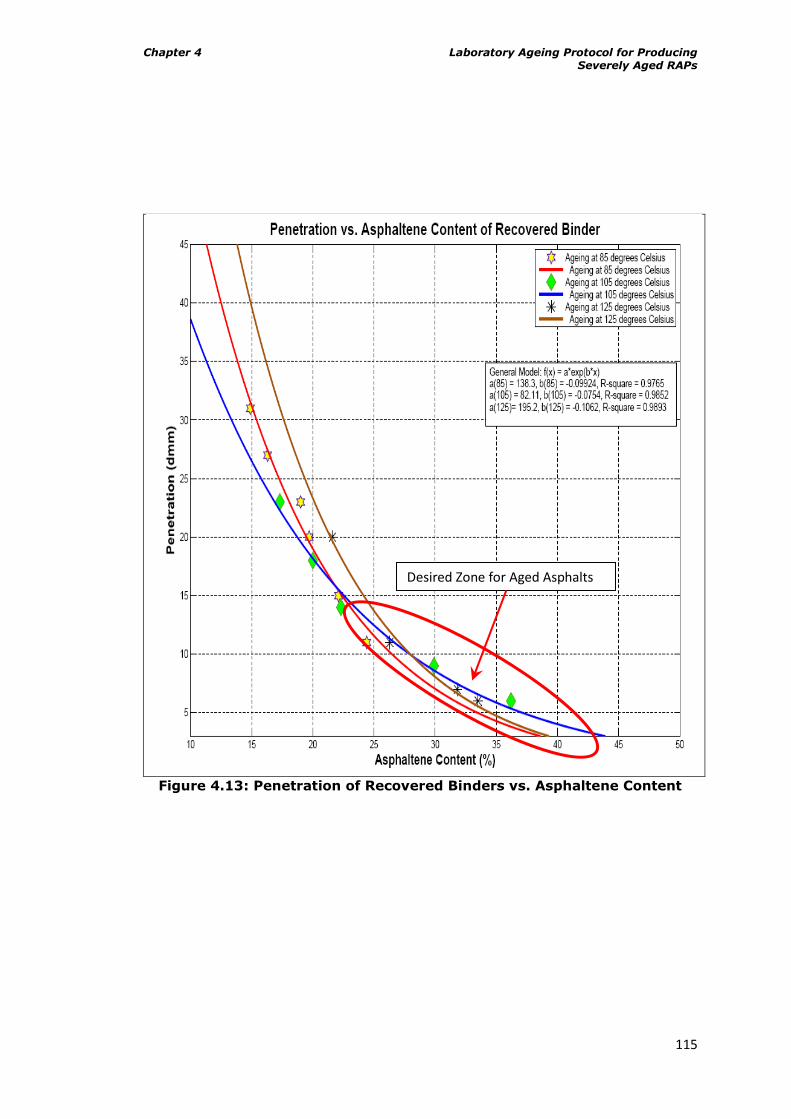
Chapter 4 Laboratory Ageing Protocol for Producing Severely Aged RAPs
115
Figure 4.13: Penetration of Recovered Binders vs. Asphaltene Content
Desired Zone for Aged Asphalts
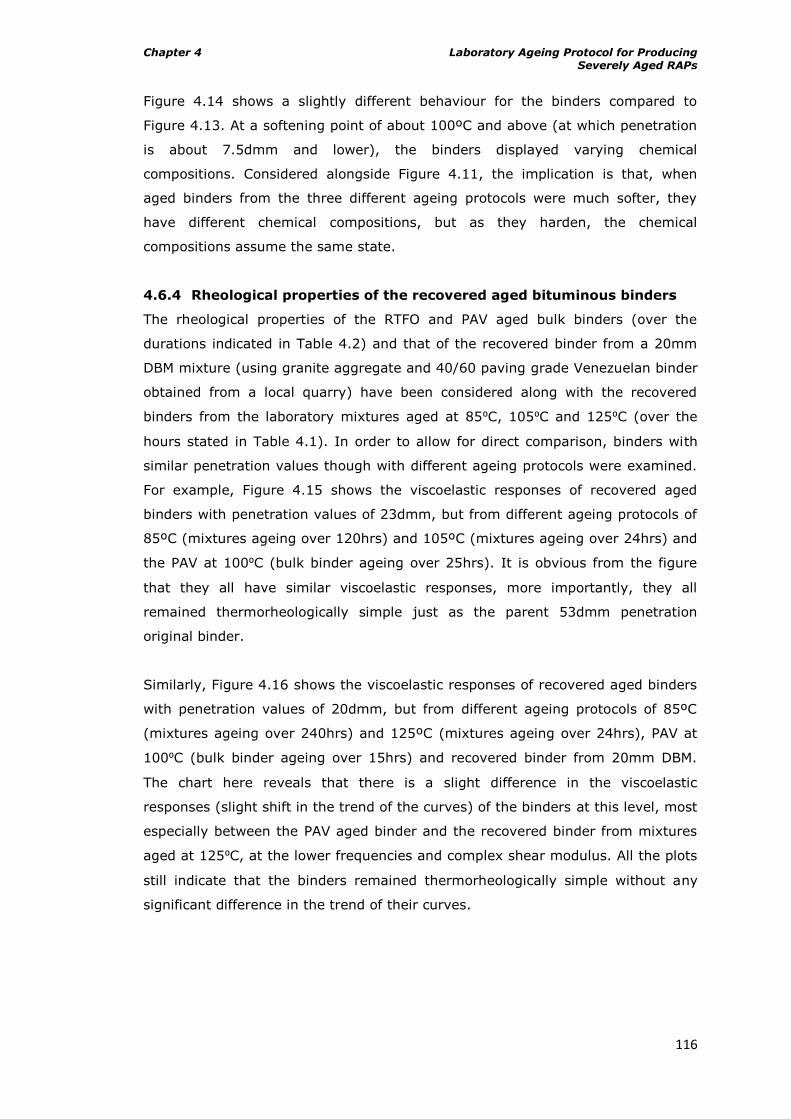
Chapter 4 Laboratory Ageing Protocol for Producing Severely Aged RAPs
116
Figure 4.14 shows a slightly different behaviour for the binders compared to
Figure 4.13. At a softening point of about 100ºC and above (at which penetration
is about 7.5dmm and lower), the binders displayed varying chemical
compositions. Considered alongside Figure 4.11, the implication is that, when
aged binders from the three different ageing protocols were much softer, they
have different chemical compositions, but as they harden, the chemical
compositions assume the same state.
4.6.4 Rheological properties of the recovered aged bituminous binders
The rheological properties of the RTFO and PAV aged bulk binders (over the
durations indicated in Table 4.2) and that of the recovered binder from a 20mm
DBM mixture (using granite aggregate and 40/60 paving grade Venezuelan binder
obtained from a local quarry) have been considered along with the recovered
binders from the laboratory mixtures aged at 85⁰C, 105⁰C and 125⁰C (over the
hours stated in Table 4.1). In order to allow for direct comparison, binders with
similar penetration values though with different ageing protocols were examined.
For example, Figure 4.15 shows the viscoelastic responses of recovered aged
binders with penetration values of 23dmm, but from different ageing protocols of
85ºC (mixtures ageing over 120hrs) and 105ºC (mixtures ageing over 24hrs) and
the PAV at 100⁰C (bulk binder ageing over 25hrs). It is obvious from the figure
that they all have similar viscoelastic responses, more importantly, they all
remained thermorheologically simple just as the parent 53dmm penetration
original binder.
Similarly, Figure 4.16 shows the viscoelastic responses of recovered aged binders
with penetration values of 20dmm, but from different ageing protocols of 85ºC
(mixtures ageing over 240hrs) and 125ºC (mixtures ageing over 24hrs), PAV at
100⁰C (bulk binder ageing over 15hrs) and recovered binder from 20mm DBM.
The chart here reveals that there is a slight difference in the viscoelastic
responses (slight shift in the trend of the curves) of the binders at this level, most
especially between the PAV aged binder and the recovered binder from mixtures
aged at 125⁰C, at the lower frequencies and complex shear modulus. All the plots
still indicate that the binders remained thermorheologically simple without any
significant difference in the trend of their curves.
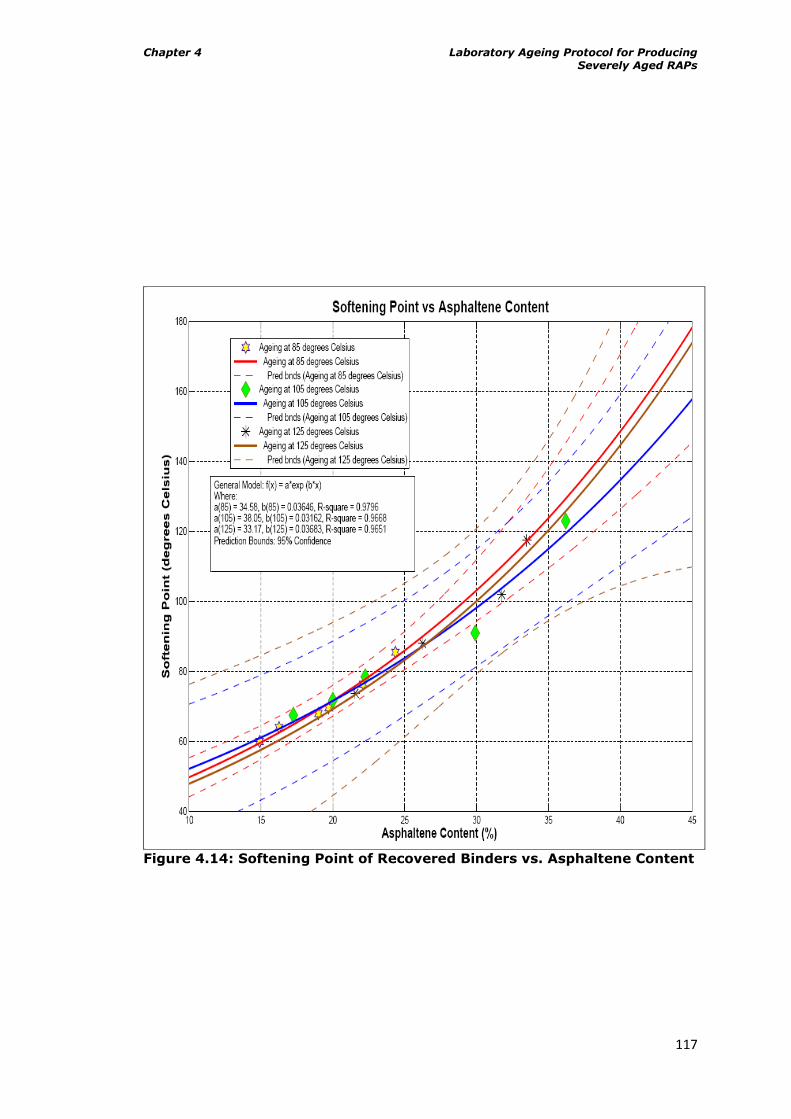
Chapter 4 Laboratory Ageing Protocol for Producing Severely Aged RAPs
117
Figure 4.14: Softening Point of Recovered Binders vs. Asphaltene Content
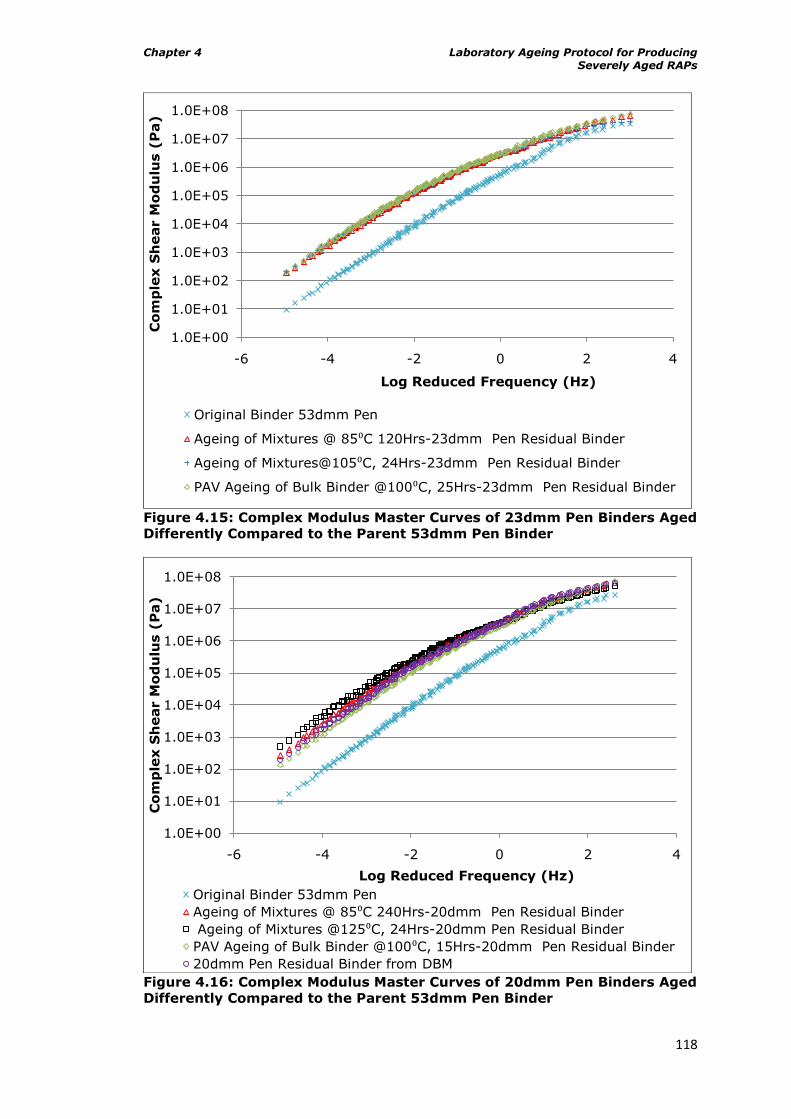
Chapter 4 Laboratory Ageing Protocol for Producing Severely Aged RAPs
118
Figure 4.15: Complex Modulus Master Curves of 23dmm Pen Binders Aged
Differently Compared to the Parent 53dmm Pen Binder
Figure 4.16: Complex Modulus Master Curves of 20dmm Pen Binders Aged
Differently Compared to the Parent 53dmm Pen Binder
1.0E+00
1.0E+01
1.0E+02
1.0E+03
1.0E+04
1.0E+05
1.0E+06
1.0E+07
1.0E+08
-6 -4 -2 0 2 4
Co
mp
lex S
hear M
od
ulu
s (
Pa)
Log Reduced Frequency (Hz)
Original Binder 53dmm Pen
Ageing of Mixtures @ 85⁰C 120Hrs-23dmm Pen Residual Binder
Ageing of Mixtures@105⁰C, 24Hrs-23dmm Pen Residual Binder
PAV Ageing of Bulk Binder @100⁰C, 25Hrs-23dmm Pen Residual Binder
1.0E+00
1.0E+01
1.0E+02
1.0E+03
1.0E+04
1.0E+05
1.0E+06
1.0E+07
1.0E+08
-6 -4 -2 0 2 4
Co
mp
lex S
hear M
od
ulu
s (
Pa)
Log Reduced Frequency (Hz)
Original Binder 53dmm Pen
Ageing of Mixtures @ 85⁰C 240Hrs-20dmm Pen Residual Binder
Ageing of Mixtures @125⁰C, 24Hrs-20dmm Pen Residual Binder
PAV Ageing of Bulk Binder @100⁰C, 15Hrs-20dmm Pen Residual Binder
20dmm Pen Residual Binder from DBM
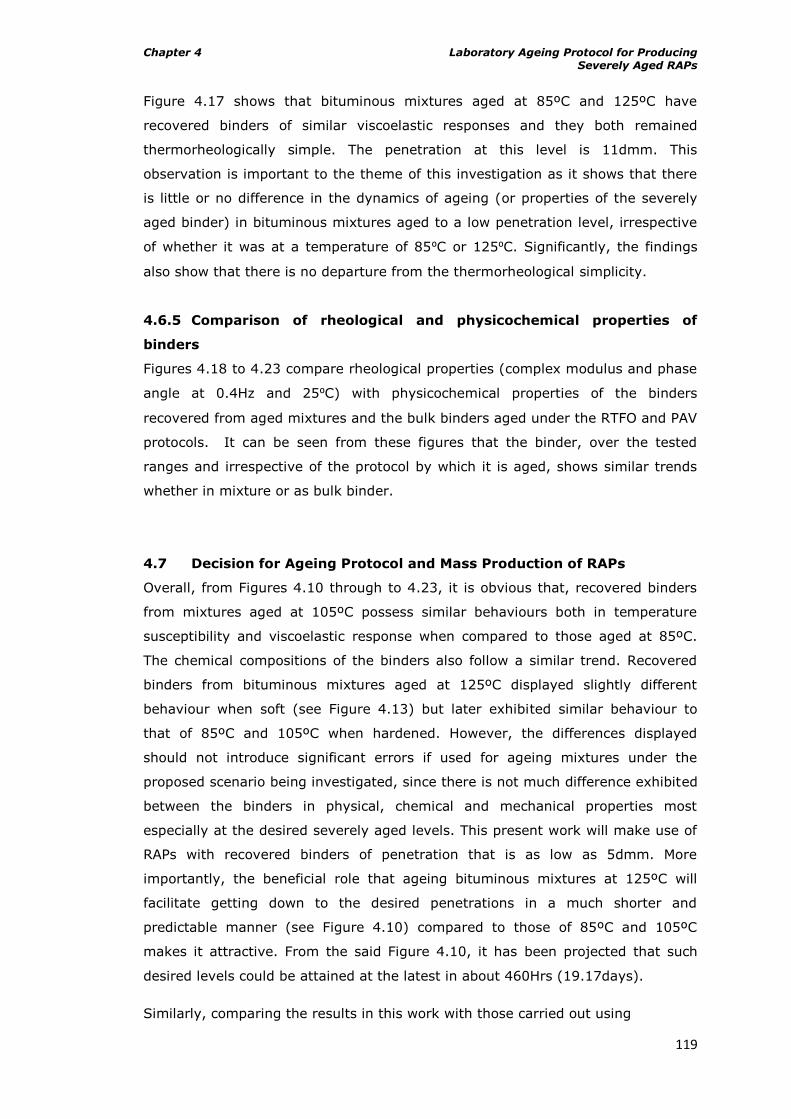
Chapter 4 Laboratory Ageing Protocol for Producing Severely Aged RAPs
119
Figure 4.17 shows that bituminous mixtures aged at 85ºC and 125ºC have
recovered binders of similar viscoelastic responses and they both remained
thermorheologically simple. The penetration at this level is 11dmm. This
observation is important to the theme of this investigation as it shows that there
is little or no difference in the dynamics of ageing (or properties of the severely
aged binder) in bituminous mixtures aged to a low penetration level, irrespective
of whether it was at a temperature of 85⁰C or 125⁰C. Significantly, the findings
also show that there is no departure from the thermorheological simplicity.
4.6.5 Comparison of rheological and physicochemical properties of
binders
Figures 4.18 to 4.23 compare rheological properties (complex modulus and phase
angle at 0.4Hz and 25⁰C) with physicochemical properties of the binders
recovered from aged mixtures and the bulk binders aged under the RTFO and PAV
protocols. It can be seen from these figures that the binder, over the tested
ranges and irrespective of the protocol by which it is aged, shows similar trends
whether in mixture or as bulk binder.
4.7 Decision for Ageing Protocol and Mass Production of RAPs
Overall, from Figures 4.10 through to 4.23, it is obvious that, recovered binders
from mixtures aged at 105ºC possess similar behaviours both in temperature
susceptibility and viscoelastic response when compared to those aged at 85ºC.
The chemical compositions of the binders also follow a similar trend. Recovered
binders from bituminous mixtures aged at 125ºC displayed slightly different
behaviour when soft (see Figure 4.13) but later exhibited similar behaviour to
that of 85ºC and 105ºC when hardened. However, the differences displayed
should not introduce significant errors if used for ageing mixtures under the
proposed scenario being investigated, since there is not much difference exhibited
between the binders in physical, chemical and mechanical properties most
especially at the desired severely aged levels. This present work will make use of
RAPs with recovered binders of penetration that is as low as 5dmm. More
importantly, the beneficial role that ageing bituminous mixtures at 125ºC will
facilitate getting down to the desired penetrations in a much shorter and
predictable manner (see Figure 4.10) compared to those of 85ºC and 105ºC
makes it attractive. From the said Figure 4.10, it has been projected that such
desired levels could be attained at the latest in about 460Hrs (19.17days).
Similarly, comparing the results in this work with those carried out using
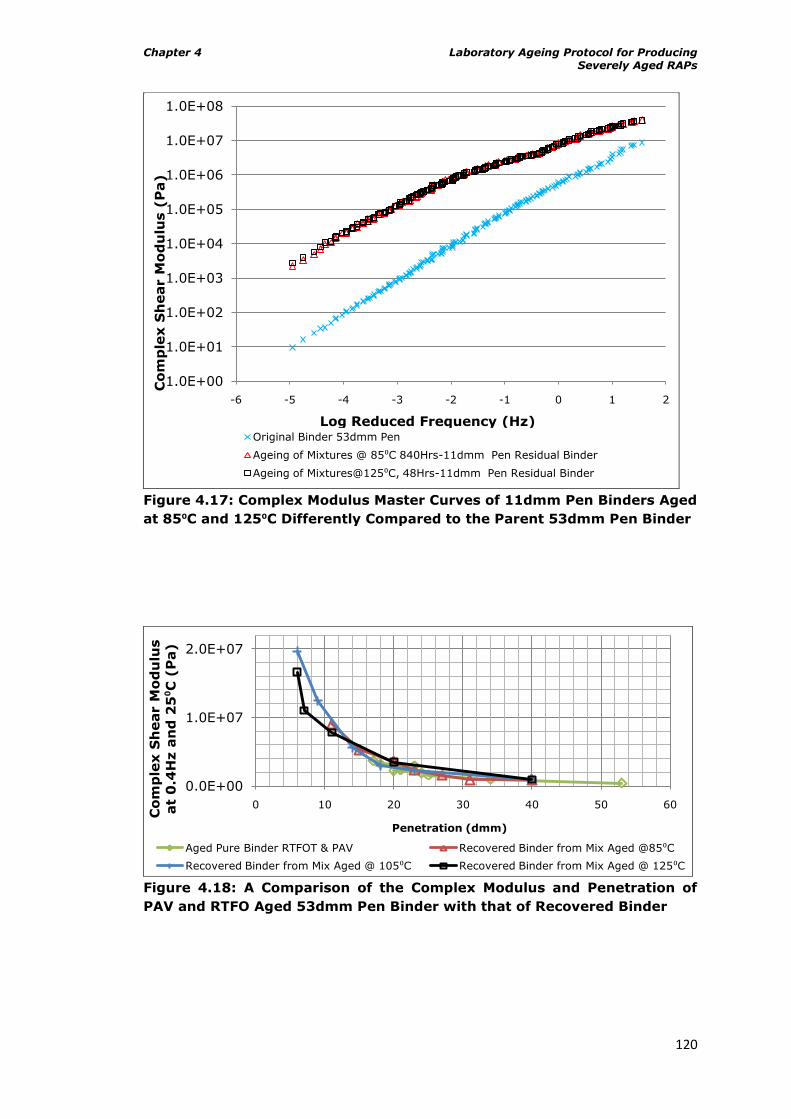
Chapter 4 Laboratory Ageing Protocol for Producing Severely Aged RAPs
120
Figure 4.17: Complex Modulus Master Curves of 11dmm Pen Binders Aged
at 85⁰C and 125⁰C Differently Compared to the Parent 53dmm Pen Binder
Figure 4.18: A Comparison of the Complex Modulus and Penetration of
PAV and RTFO Aged 53dmm Pen Binder with that of Recovered Binder
1.0E+00
1.0E+01
1.0E+02
1.0E+03
1.0E+04
1.0E+05
1.0E+06
1.0E+07
1.0E+08
-6 -5 -4 -3 -2 -1 0 1 2
Co
mp
lex S
hear M
od
ulu
s (
Pa)
Log Reduced Frequency (Hz)Original Binder 53dmm Pen
Ageing of Mixtures @ 85⁰C 840Hrs-11dmm Pen Residual Binder
Ageing of Mixtures@125⁰C, 48Hrs-11dmm Pen Residual Binder
0.0E+00
1.0E+07
2.0E+07
0 10 20 30 40 50 60
Co
mp
lex S
hear M
od
ulu
s
at
0.4
Hz a
nd
25⁰C
(P
a)
Penetration (dmm)
Aged Pure Binder RTFOT & PAV Recovered Binder from Mix Aged @85⁰C
Recovered Binder from Mix Aged @ 105⁰C Recovered Binder from Mix Aged @ 125⁰C
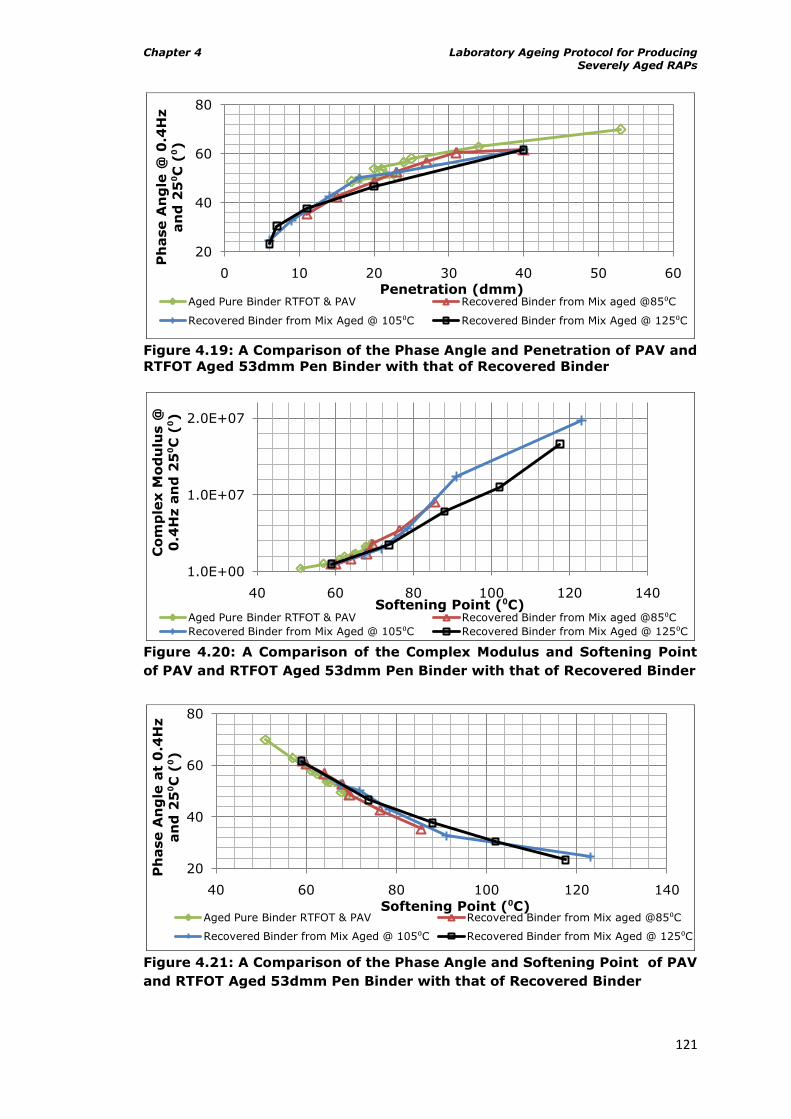
Chapter 4 Laboratory Ageing Protocol for Producing Severely Aged RAPs
121
Figure 4.19: A Comparison of the Phase Angle and Penetration of PAV and
RTFOT Aged 53dmm Pen Binder with that of Recovered Binder
Figure 4.20: A Comparison of the Complex Modulus and Softening Point
of PAV and RTFOT Aged 53dmm Pen Binder with that of Recovered Binder
Figure 4.21: A Comparison of the Phase Angle and Softening Point of PAV
and RTFOT Aged 53dmm Pen Binder with that of Recovered Binder
20
40
60
80
0 10 20 30 40 50 60
Ph
ase A
ng
le @
0.4
Hz
an
d 2
5⁰C
(⁰)
Penetration (dmm)Aged Pure Binder RTFOT & PAV Recovered Binder from Mix aged @85⁰C
Recovered Binder from Mix Aged @ 105⁰C Recovered Binder from Mix Aged @ 125⁰C
1.0E+00
1.0E+07
2.0E+07
40 60 80 100 120 140
Co
mp
lex M
od
ulu
s @
0.4
Hz a
nd
25⁰C
(⁰)
Softening Point (⁰C)Aged Pure Binder RTFOT & PAV Recovered Binder from Mix aged @85⁰C
Recovered Binder from Mix Aged @ 105⁰C Recovered Binder from Mix Aged @ 125⁰C
20
40
60
80
40 60 80 100 120 140
Ph
ase A
ng
le a
t 0
.4H
z
an
d 2
5⁰C
(⁰)
Softening Point (⁰C)Aged Pure Binder RTFOT & PAV Recovered Binder from Mix aged @85⁰C
Recovered Binder from Mix Aged @ 105⁰C Recovered Binder from Mix Aged @ 125⁰C
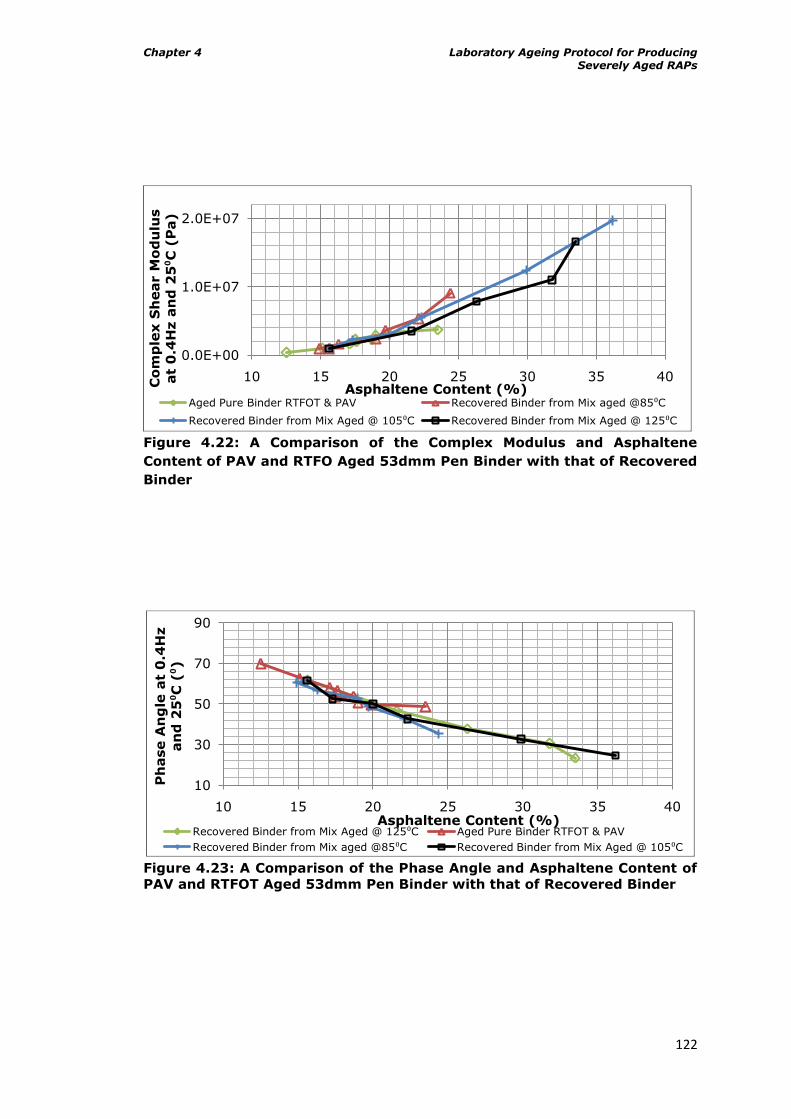
Chapter 4 Laboratory Ageing Protocol for Producing Severely Aged RAPs
122
Figure 4.22: A Comparison of the Complex Modulus and Asphaltene
Content of PAV and RTFO Aged 53dmm Pen Binder with that of Recovered
Binder
Figure 4.23: A Comparison of the Phase Angle and Asphaltene Content of
PAV and RTFOT Aged 53dmm Pen Binder with that of Recovered Binder
0.0E+00
1.0E+07
2.0E+07
10 15 20 25 30 35 40
Co
mp
lex S
hear M
od
ulu
s
at
0.4
Hz a
nd
25⁰C
(P
a)
Asphaltene Content (%)Aged Pure Binder RTFOT & PAV Recovered Binder from Mix aged @85⁰C
Recovered Binder from Mix Aged @ 105⁰C Recovered Binder from Mix Aged @ 125⁰C
10
30
50
70
90
10 15 20 25 30 35 40
Ph
ase A
ng
le a
t 0
.4H
z
an
d 2
5⁰C
(⁰)
Asphaltene Content (%)Recovered Binder from Mix Aged @ 125⁰C Aged Pure Binder RTFOT & PAV
Recovered Binder from Mix aged @85⁰C Recovered Binder from Mix Aged @ 105⁰C
Chapter 4 Laboratory Ageing Protocol for Producing Severely Aged RAPs
123
compacted specimens shows that ageing loose asphalt material accelerates
ageing. For example, ageing such loose mixtures at the standard temperature of
85⁰C over 24hrs yielded a pen of 31dmm in this work. Nguyen (2009) in his work
in which he used compacted specimens with similar binder reported a similar
penetration level of 31dmm after 120hrs of ageing. The larger direct contact area
in the loose mixtures that facilitates quicker oxidation (oxidation is the major
factor that accelerates ageing in the presence of heat) must have been
responsible for this significant difference in the rate of ageing between loose and
compacted specimens.
Consequently, the ageing protocol that will be used for ageing samples in this
research work, in order to mimic what obtains in asphalt pavements typical of hot
tropical belts is 125ºC. This overall should assist in saving much laboratory time
and at the same time obtaining sound and realistic results comparable to ageing
bituminous mixtures either at 85ºC or 105ºC.
4.8 Summary
Based on the laboratory study presented in this chapter, the following conclusions
can be drawn:
Generally, as the binder used in this study (straight run paving grade
binder 40/60 of Venezuelan origin with a penetration of 53dmm) ages,
complex modulus, asphaltene content and softening point values increase
while penetration values reduce irrespective of the ageing protocol i.e.
either as bulk binder ageing or mixture ageing, in line with other
researchers‟ findings.
Ageing bituminous materials at 85⁰C over 120hrs (5days) in the forced
draft oven did not yield the severity of ageing (below 6dmm) required to
study heavily aged pavements typical of the tropics. This standard protocol
yielded a residual binder of 23dmm penetration for the original 53dmm
penetration binder used. However, it was able to age to 11dmm
penetration after 840hrs (35days).
Ageing bituminous mixture at a higher temperature of 125⁰C in the forced
draft oven accelerates ageing, such that it only took 48hrs to reach a
penetration of 11dmm compared to 840hrs (35days) for the standard
protocol, thus saving laboratory time.
Ageing loose bituminous mixtures in the forced draft oven accelerates
ageing. For example, ageing such mixtures at the standard temperature of

Chapter 4 Laboratory Ageing Protocol for Producing Severely Aged RAPs
124
85⁰C over 24hrs yielded a pen of 31dmm in this work. Nguyen (2009) in
his work in which he used compacted specimens with similar binder
reported a similar penetration level of 31dmm after 120hrs of ageing.
The rheological properties and temperature susceptibilities of less severely
aged binders (20dmm penetration and above in this study), seem to differ
slightly. This was most obvious between the PAV aged binders and the
recovered binders of mixtures aged at 125⁰C.
The properties of more severely aged binders are independent of the
ageing protocol.
Chapter 5 Cold Bitumen Emulsion Mix Design and Initial Investigation on its Mechanical Performance
125
5 Cold Bitumen Emulsion Mix Design and
Initial Investigation on its Mechanical
Performance
5.1 Overview
For most civil engineering structures, the need for adequate design that ensures
efficient and effective performance in service cannot be overemphasized. It is
common knowledge that in executing such designs, safety, aesthetics, function
and economics are almost always given priority. Undoubtedly, flexible road
pavement structure, which is the focus of the work reported in this thesis, is no
exception. A flexible road pavement structure must principally be designed, such
that it will facilitate smooth and safe ride (or passage of vehicular traffic both in
size and weight) throughout its design life. These requirements by implication
pose the two challenges of ensuring structural and functional viability of the road
pavement throughout its design life. The design of course must be within the
budget constraints. These are accomplished by proper mix and structural design
of the pavement.
This chapter presents the process of cold bituminous emulsion mix design and
results of the initial work done in assessing the mechanical performance of the
mix. The cold mix design entailed optimising the volumetrics of the materials
involved. The mechanical tests assessed the engineering properties of the
designed mix bearing in mind durability and long term performance of the mix.
Results obtained from such mechanical performance tests are used for the
structural design aspect. Although the design principle adopted here is used for
the well established hot mixtures, it should continue to be used for cold mixes
until their nature is fully understood. More importantly, the trend in the industry
is that such cold mixtures should meet same requirements set for hot mixtures.
5.2 Design Consideration for Cold Mixtures
As there is no general existing equipment made specifically for the design of cold
mixtures, those for hot mixtures are most frequently employed though with slight
modifications. These modifications are required because cold mixtures being
intermediate materials behave as unbound granular materials in their early life
stages (because of the presence of moisture) while they assume the state of
Chapter 5 Cold Bitumen Emulsion Mix Design and Initial Investigation on its Mechanical Performance
126
bound materials just as hot mixtures after curing (due to the evaporation of a
greater part of the moisture content in the mix). This behaviour is responsible for
the various modifications that have been introduced to cold mix design over
years. However, there is no rule of the thumb that can be followed.
5.3 Experimental Plan
The objective here is to come up with a cold mix design for mixes made from
RAPs, some virgin aggregates and bitumen emulsion. Such will be suitable for
executing a study on cold recycled mixtures for road pavements in developing
countries with hot tropical climates. In this regard, harmonised recommendations
from the works of, Ibrahim (1998), Jenkins (2000), Thanaya (2007), and
Sunarjono (2008) for cold mix design as discussed in Chapter 3 of this thesis and
the guidelines given by ARRA (2001) will be used as guide. Similarly, the
suggestions given in Overseas Road Notes (ORN) 19 and 31 for aggregate (RAP)
gradation and binder selection for heavily trafficked roads in the tropics will be
applied in this work. The mix design procedure followed generally in this work
follows thus:
Produce artificial RAP in the laboratory.
Determine RAP gradation to suit the recommendations of ORN 19, 31
and other relevant TRL documents for heavily trafficked roads in the
tropics. Determine RAP binder content and gradation of extracted
aggregates.
Determine gradation of virgin aggregates. Determine the amount of
additional granular materials required.
Determine the type and grade of bitumen emulsion required for
compatibility with aggregates. Characterise the bitumen emulsion.
Estimate the initial residual bitumen content and initial emulsion content
using the empirical relationship given in MS-14 (Asphalt Institute, 1989)
Select suitable mixer (Hobart/Sun and Planet Mixers) and mixing
protocol based on the gradation of RAP-virgin aggregates.
Check Compactability of aggregates using a suitable compactor for mix
(Gyratory, vibratory, roller or Marshall). Determine Optimum Moisture
Content (OMC) and Maximum Dry Density (MDD) by varying moisture
content.
Select suitable procedure for curing (should simulate what obtains in
the road pavement).
Determine pre-wetting water content along with Optimum Total Fluid
content (OTFC). Use the estimated initial binder content along with
varying moisture content as Total Fluid Content (TFC). Start with TFC =
OMC. Test cured specimens (dry and wet) using indicative tests such as
Indirect Tensile Stiffness Modulus (ITSM) and the Indirect Tensile
Strength (ITS) tests.
Chapter 5 Cold Bitumen Emulsion Mix Design and Initial Investigation on its Mechanical Performance
127
Determine Optimum Bitumen Emulsion Content (OBEC) in Optimum
Total Fluid Content (OTFC) using indicative tests just as above.
Determine particle density and water absorption properties of
aggregates. Determine maximum density of the mix.
Determine compaction level to meet porosity target (10% air voids
content).
Conduct more indicative tests on fully optimised mix (ITS, ITSM and
water sensitivity tests).
Check compliance with relevant standards for performance.
Estimate Job Mix Formula – End of Mix Design.
Investigate engineering properties fully - fatigue response, rutting
potential, resilient modulus, water susceptibility, ageing and
temperature susceptibility.
Proceed to structural design.
Figure 5.1 is the flow chart describing this mix design process that was followed.
Meanwhile effort was made to ensure that the temperature of curing adopted was
very close to the maximum temperature that obtains in the pavement layer being
designed here (road base) for hot tropical climates. This was achieved by using
the pavement temperature prediction model suggested by Mallick and El-Korchi
(2009). The model allows for computation of temperature at the surface and any
other depth below the surface.
(5.1a)
Where, = Temperature at the surface (∘C)
= Ambient temperature (∘C)
= Latitude of the region concerned (Degrees)
For temperatures at different depths, the relationship below is used:
(5.1b)
Where, = Temperature at depth
= Temperature at the surface
= Depth from the surface (inches)
The use of this model is demonstrated in Chapter 6 of this thesis.
5.4 Philosophy behind Experimental Plan
As mentioned earlier, mix design involves determining the optimum proportions of
the mixture constituents that will ensure a satisfactory performance. ARRA (2001)
noted that three basic theories have been proposed for designing such mixtures
when RAP is involved:
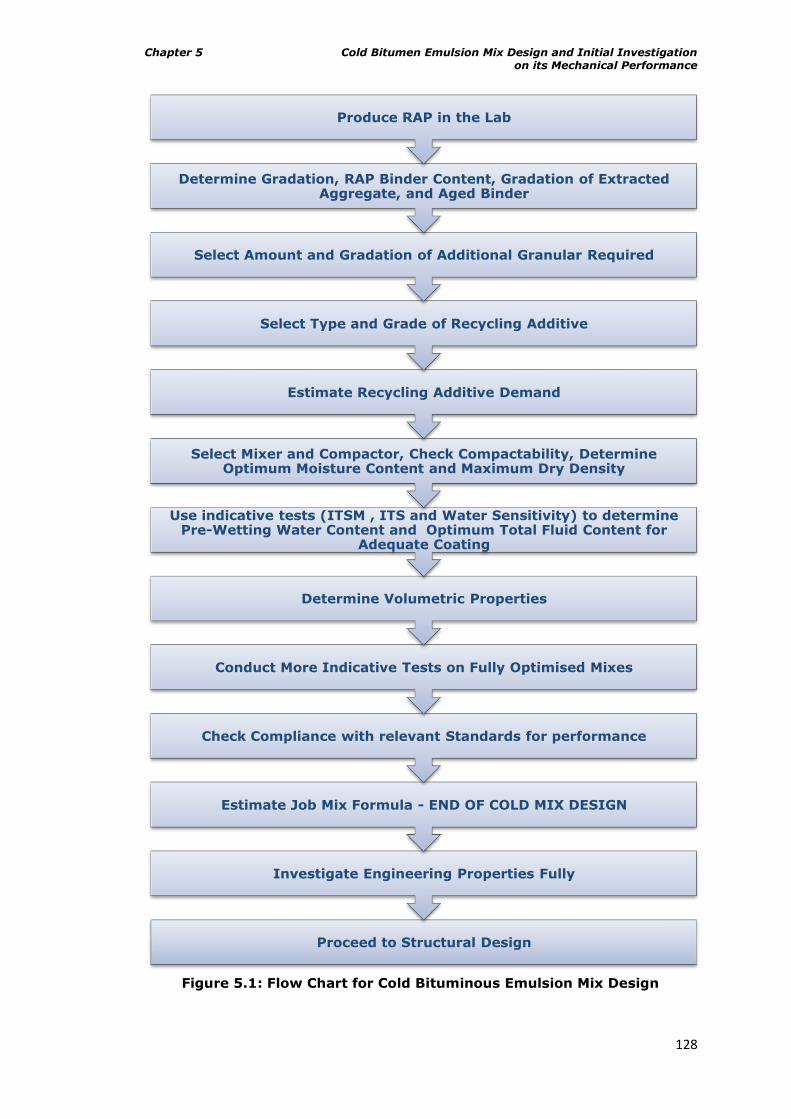
Chapter 5 Cold Bitumen Emulsion Mix Design and Initial Investigation on its Mechanical Performance
128
Figure 5.1: Flow Chart for Cold Bituminous Emulsion Mix Design
Proceed to Structural Design
Investigate Engineering Properties Fully
Estimate Job Mix Formula - END OF COLD MIX DESIGN
Check Compliance with relevant Standards for performance
Conduct More Indicative Tests on Fully Optimised Mixes
Determine Volumetric Properties
Use indicative tests (ITSM , ITS and Water Sensitivity) to determine Pre-Wetting Water Content and Optimum Total Fluid Content for
Adequate Coating
Select Mixer and Compactor, Check Compactability, Determine Optimum Moisture Content and Maximum Dry Density
Estimate Recycling Additive Demand
Select Type and Grade of Recycling Additive
Select Amount and Gradation of Additional Granular Required
Determine Gradation, RAP Binder Content, Gradation of Extracted Aggregate, and Aged Binder
Produce RAP in the Lab
Chapter 5 Cold Bitumen Emulsion Mix Design and Initial Investigation on its Mechanical Performance
129
I. RAP acts as black aggregate and mix design only requires determining the
recycling additive required to coat the aggregate.
II. Based on the evaluation of the physical and chemical characteristics of the
recovered bitumen, design is done to restore the residual aged bitumen to
its original consistency - complete restoration of binder to its initial soft
condition occurs.
III. Combines Theories I and II in which the design is based on the fact that
the degree of softening is related to the properties of the old bitumen in
RAP, recycling additive, and environmental conditions. Recommends
mechanical testing since the degree of softening of aged bitumen is
difficult to quantify.
The philosophy adopted in this work has an inclination towards the first theory.
This is because the RAP materials considered in this work have very low
penetration levels (5, 10, 15 and 20dmm), and at such levels, RAPs are regarded
as black rocks and implicitly, the residual bitumen in such RAPs is inactive. While
this may be the best practice for a cold temperate climate, it might not be a good
assumption for hot tropical climates. This is understandable since bitumen is
temperature dependent in behaviour with little or no activity taking place in it at
low temperatures (becomes brittle). Karlsson (2002) opined in his work that one
of the factors that enhance rejuvenation of bituminous binders is temperature.
Part of the primary objective of this research work is to ascertain the level at
which residual bitumen from such severely aged RAPs begins to enhance the
engineering properties of cold recycled mixes under a hot tropical climate. A
comparative study therefore must be conducted alongside with cold mix made
from 100% virgin mixtures with the same bitumen emulsion content. Having been
treated similarly, the engineering properties of the mixes i.e. recycled (with
varying degrees of ageing severity) and 100% virgin aggregate should give an
indication of the extent of contribution by residual bitumen from severely aged
RAPs to the mix properties.
The mix design here considered relies on the information obtained for the
strength and stiffness using the Indirect Tensile Strength (ITS) test and the
Indirect Tensile Stiffness Modulus (ITSM) test respectively. The RAP with 20dmm
penetration residual bitumen was used for the mix design process.
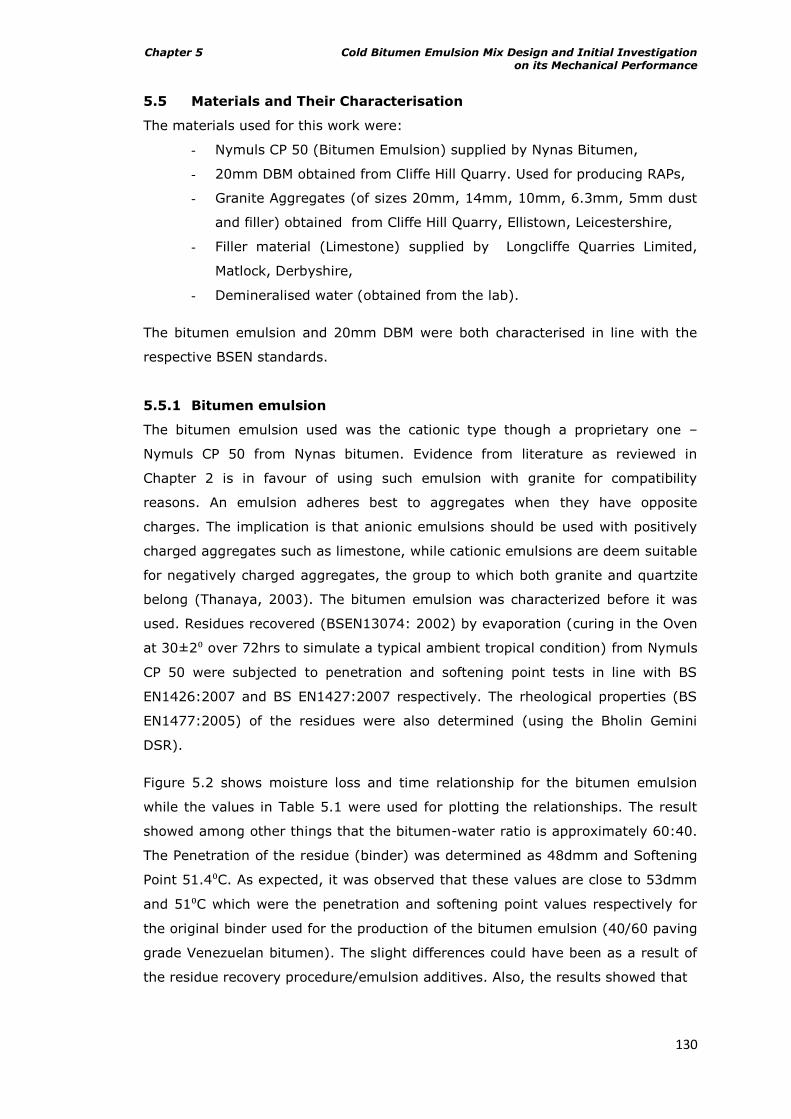
Chapter 5 Cold Bitumen Emulsion Mix Design and Initial Investigation on its Mechanical Performance
130
5.5 Materials and Their Characterisation
The materials used for this work were:
- Nymuls CP 50 (Bitumen Emulsion) supplied by Nynas Bitumen,
- 20mm DBM obtained from Cliffe Hill Quarry. Used for producing RAPs,
- Granite Aggregates (of sizes 20mm, 14mm, 10mm, 6.3mm, 5mm dust
and filler) obtained from Cliffe Hill Quarry, Ellistown, Leicestershire,
- Filler material (Limestone) supplied by Longcliffe Quarries Limited,
Matlock, Derbyshire,
- Demineralised water (obtained from the lab).
The bitumen emulsion and 20mm DBM were both characterised in line with the
respective BSEN standards.
5.5.1 Bitumen emulsion
The bitumen emulsion used was the cationic type though a proprietary one –
Nymuls CP 50 from Nynas bitumen. Evidence from literature as reviewed in
Chapter 2 is in favour of using such emulsion with granite for compatibility
reasons. An emulsion adheres best to aggregates when they have opposite
charges. The implication is that anionic emulsions should be used with positively
charged aggregates such as limestone, while cationic emulsions are deem suitable
for negatively charged aggregates, the group to which both granite and quartzite
belong (Thanaya, 2003). The bitumen emulsion was characterized before it was
used. Residues recovered (BSEN13074: 2002) by evaporation (curing in the Oven
at 30±2⁰ over 72hrs to simulate a typical ambient tropical condition) from Nymuls
CP 50 were subjected to penetration and softening point tests in line with BS
EN1426:2007 and BS EN1427:2007 respectively. The rheological properties (BS
EN1477:2005) of the residues were also determined (using the Bholin Gemini
DSR).
Figure 5.2 shows moisture loss and time relationship for the bitumen emulsion
while the values in Table 5.1 were used for plotting the relationships. The result
showed among other things that the bitumen-water ratio is approximately 60:40.
The Penetration of the residue (binder) was determined as 48dmm and Softening
Point 51.4⁰C. As expected, it was observed that these values are close to 53dmm
and 51⁰C which were the penetration and softening point values respectively for
the original binder used for the production of the bitumen emulsion (40/60 paving
grade Venezuelan bitumen). The slight differences could have been as a result of
the residue recovery procedure/emulsion additives. Also, the results showed that
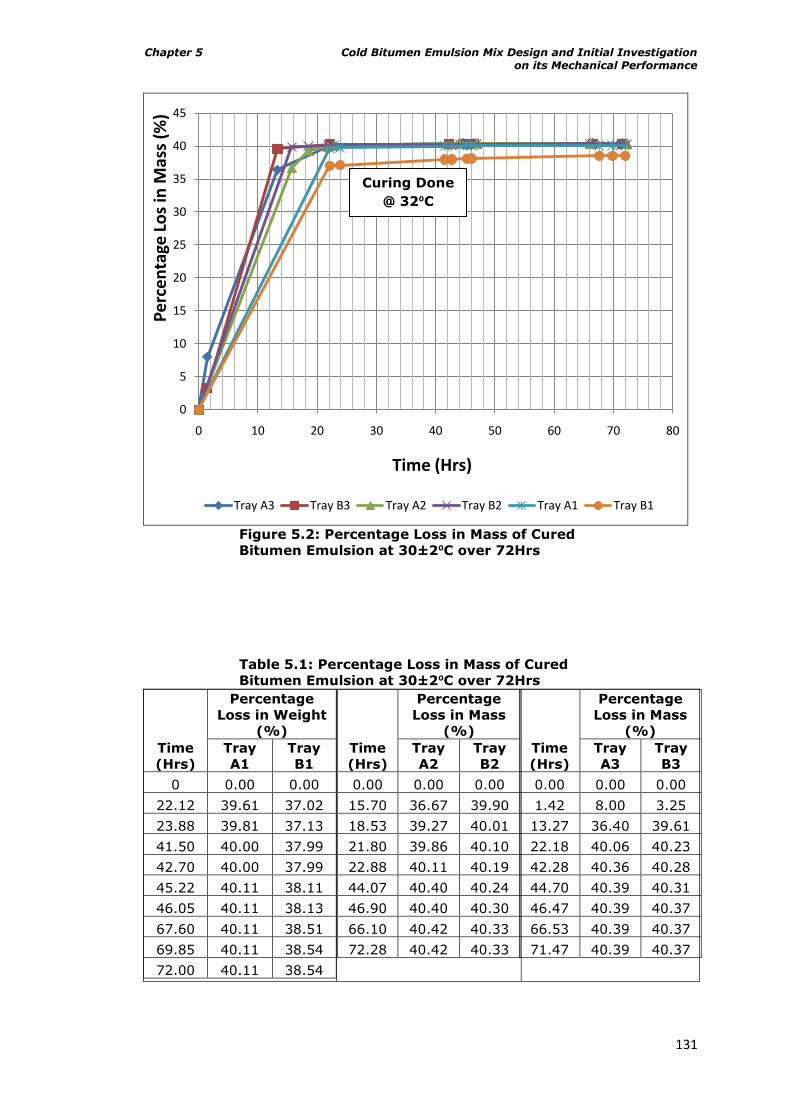
Chapter 5 Cold Bitumen Emulsion Mix Design and Initial Investigation on its Mechanical Performance
131
Figure 5.2: Percentage Loss in Mass of Cured
Bitumen Emulsion at 30±2⁰C over 72Hrs
Table 5.1: Percentage Loss in Mass of Cured
Bitumen Emulsion at 30±2⁰C over 72Hrs
Time
(Hrs)
Percentage
Loss in Weight
(%)
Tray
A1
Tray
B1
0 0.00 0.00
22.12 39.61 37.02
23.88 39.81 37.13
41.50 40.00 37.99
42.70 40.00 37.99
45.22 40.11 38.11
46.05 40.11 38.13
67.60 40.11 38.51
69.85 40.11 38.54
72.00 40.11 38.54
Time
(Hrs)
Percentage
Loss in Mass
(%)
Tray
A2
Tray
B2
0.00 0.00 0.00
15.70 36.67 39.90
18.53 39.27 40.01
21.80 39.86 40.10
22.88 40.11 40.19
44.07 40.40 40.24
46.90 40.40 40.30
66.10 40.42 40.33
72.28 40.42 40.33
Time
(Hrs)
Percentage
Loss in Mass
(%)
Tray
A3
Tray
B3
0.00 0.00 0.00
1.42 8.00 3.25
13.27 36.40 39.61
22.18 40.06 40.23
42.28 40.36 40.28
44.70 40.39 40.31
46.47 40.39 40.37
66.53 40.39 40.37
71.47 40.39 40.37
0
5
10
15
20
25
30
35
40
45
0 10 20 30 40 50 60 70 80
Pe
rce
nta
ge L
os
in M
ass
(%)
Time (Hrs)
Tray A3 Tray B3 Tray A2 Tray B2 Tray A1 Tray B1
Curing Done
@ 32⁰C
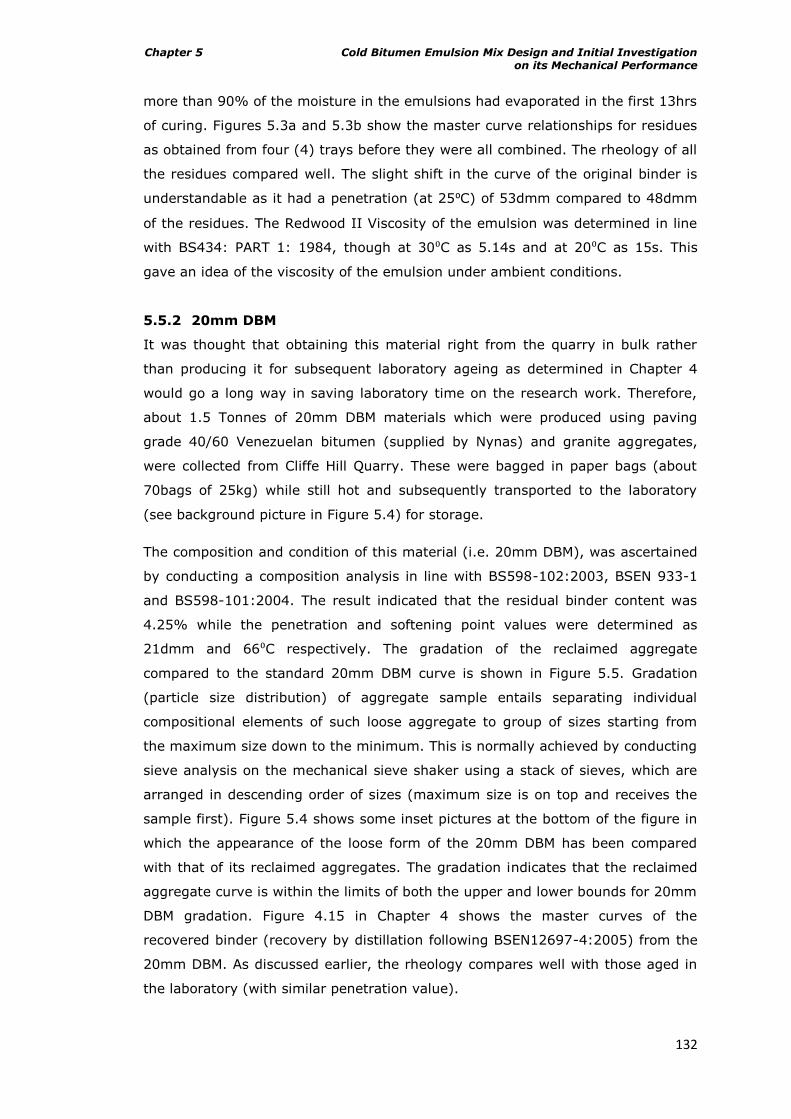
Chapter 5 Cold Bitumen Emulsion Mix Design and Initial Investigation on its Mechanical Performance
132
more than 90% of the moisture in the emulsions had evaporated in the first 13hrs
of curing. Figures 5.3a and 5.3b show the master curve relationships for residues
as obtained from four (4) trays before they were all combined. The rheology of all
the residues compared well. The slight shift in the curve of the original binder is
understandable as it had a penetration (at 25⁰C) of 53dmm compared to 48dmm
of the residues. The Redwood II Viscosity of the emulsion was determined in line
with BS434: PART 1: 1984, though at 30⁰C as 5.14s and at 20⁰C as 15s. This
gave an idea of the viscosity of the emulsion under ambient conditions.
5.5.2 20mm DBM
It was thought that obtaining this material right from the quarry in bulk rather
than producing it for subsequent laboratory ageing as determined in Chapter 4
would go a long way in saving laboratory time on the research work. Therefore,
about 1.5 Tonnes of 20mm DBM materials which were produced using paving
grade 40/60 Venezuelan bitumen (supplied by Nynas) and granite aggregates,
were collected from Cliffe Hill Quarry. These were bagged in paper bags (about
70bags of 25kg) while still hot and subsequently transported to the laboratory
(see background picture in Figure 5.4) for storage.
The composition and condition of this material (i.e. 20mm DBM), was ascertained
by conducting a composition analysis in line with BS598-102:2003, BSEN 933-1
and BS598-101:2004. The result indicated that the residual binder content was
4.25% while the penetration and softening point values were determined as
21dmm and 66⁰C respectively. The gradation of the reclaimed aggregate
compared to the standard 20mm DBM curve is shown in Figure 5.5. Gradation
(particle size distribution) of aggregate sample entails separating individual
compositional elements of such loose aggregate to group of sizes starting from
the maximum size down to the minimum. This is normally achieved by conducting
sieve analysis on the mechanical sieve shaker using a stack of sieves, which are
arranged in descending order of sizes (maximum size is on top and receives the
sample first). Figure 5.4 shows some inset pictures at the bottom of the figure in
which the appearance of the loose form of the 20mm DBM has been compared
with that of its reclaimed aggregates. The gradation indicates that the reclaimed
aggregate curve is within the limits of both the upper and lower bounds for 20mm
DBM gradation. Figure 4.15 in Chapter 4 shows the master curves of the
recovered binder (recovery by distillation following BSEN12697-4:2005) from the
20mm DBM. As discussed earlier, the rheology compares well with those aged in
the laboratory (with similar penetration value).
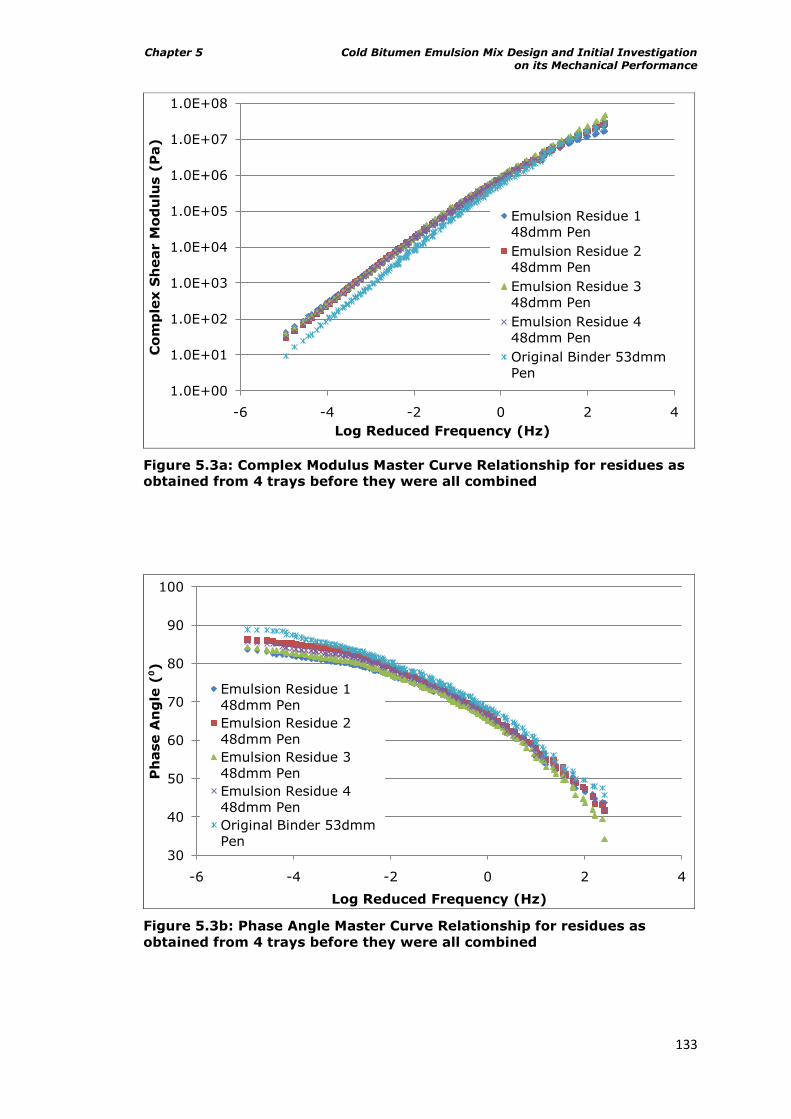
Chapter 5 Cold Bitumen Emulsion Mix Design and Initial Investigation on its Mechanical Performance
133
Figure 5.3a: Complex Modulus Master Curve Relationship for residues as
obtained from 4 trays before they were all combined
Figure 5.3b: Phase Angle Master Curve Relationship for residues as
obtained from 4 trays before they were all combined
1.0E+00
1.0E+01
1.0E+02
1.0E+03
1.0E+04
1.0E+05
1.0E+06
1.0E+07
1.0E+08
-6 -4 -2 0 2 4
Co
mp
lex S
hear M
od
ulu
s (
Pa)
Log Reduced Frequency (Hz)
Emulsion Residue 1
48dmm Pen
Emulsion Residue 2
48dmm Pen
Emulsion Residue 3
48dmm Pen
Emulsion Residue 4
48dmm Pen
Original Binder 53dmm
Pen
30
40
50
60
70
80
90
100
-6 -4 -2 0 2 4
Ph
ase A
ng
le (⁰)
Log Reduced Frequency (Hz)
Emulsion Residue 1
48dmm Pen
Emulsion Residue 2
48dmm Pen
Emulsion Residue 3
48dmm Pen
Emulsion Residue 4
48dmm Pen
Original Binder 53dmm
Pen
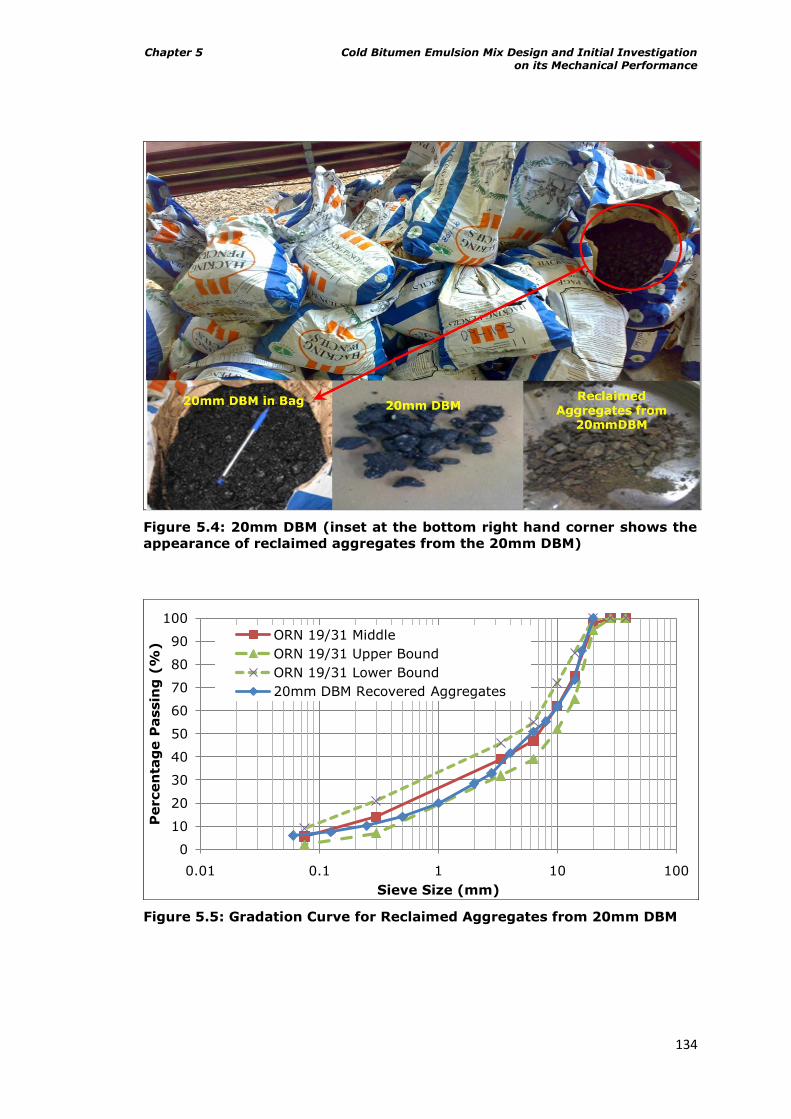
Chapter 5 Cold Bitumen Emulsion Mix Design and Initial Investigation on its Mechanical Performance
134
Figure 5.4: 20mm DBM (inset at the bottom right hand corner shows the
appearance of reclaimed aggregates from the 20mm DBM)
Figure 5.5: Gradation Curve for Reclaimed Aggregates from 20mm DBM
0
10
20
30
40
50
60
70
80
90
100
0.01 0.1 1 10 100
Percen
tag
e P
assin
g (
%)
Sieve Size (mm)
ORN 19/31 Middle
ORN 19/31 Upper Bound
ORN 19/31 Lower Bound
20mm DBM Recovered Aggregates
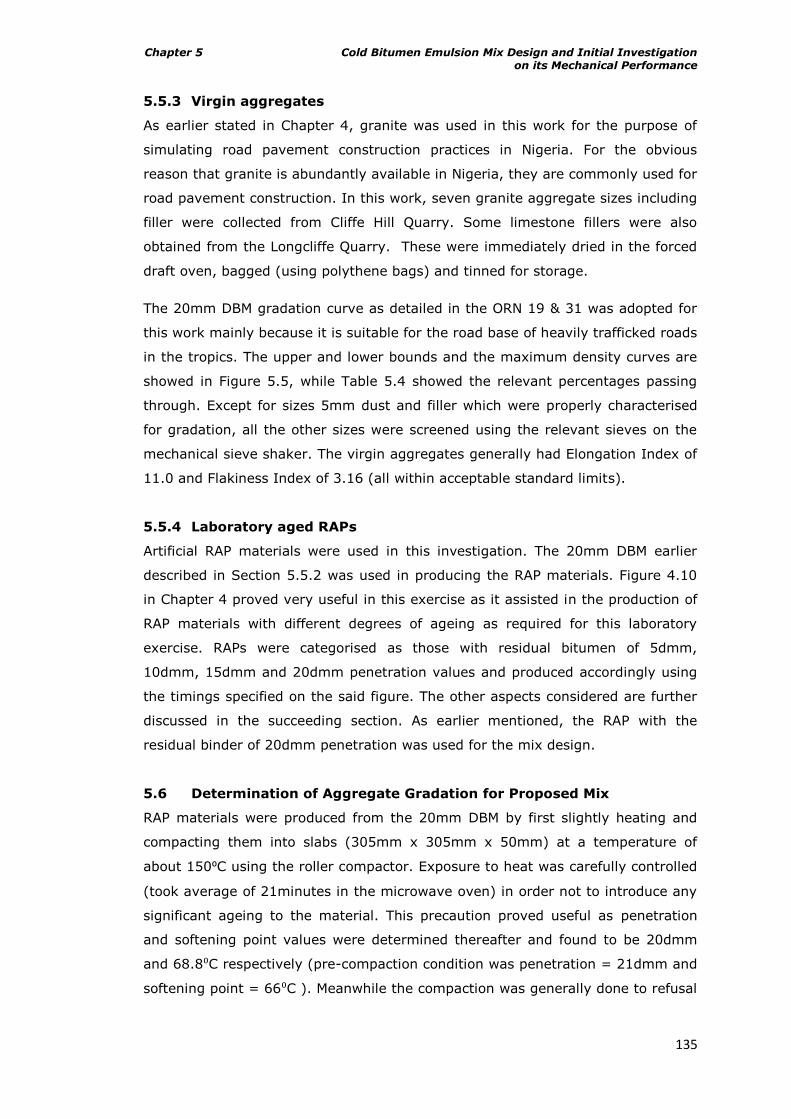
Chapter 5 Cold Bitumen Emulsion Mix Design and Initial Investigation on its Mechanical Performance
135
5.5.3 Virgin aggregates
As earlier stated in Chapter 4, granite was used in this work for the purpose of
simulating road pavement construction practices in Nigeria. For the obvious
reason that granite is abundantly available in Nigeria, they are commonly used for
road pavement construction. In this work, seven granite aggregate sizes including
filler were collected from Cliffe Hill Quarry. Some limestone fillers were also
obtained from the Longcliffe Quarry. These were immediately dried in the forced
draft oven, bagged (using polythene bags) and tinned for storage.
The 20mm DBM gradation curve as detailed in the ORN 19 & 31 was adopted for
this work mainly because it is suitable for the road base of heavily trafficked roads
in the tropics. The upper and lower bounds and the maximum density curves are
showed in Figure 5.5, while Table 5.4 showed the relevant percentages passing
through. Except for sizes 5mm dust and filler which were properly characterised
for gradation, all the other sizes were screened using the relevant sieves on the
mechanical sieve shaker. The virgin aggregates generally had Elongation Index of
11.0 and Flakiness Index of 3.16 (all within acceptable standard limits).
5.5.4 Laboratory aged RAPs
Artificial RAP materials were used in this investigation. The 20mm DBM earlier
described in Section 5.5.2 was used in producing the RAP materials. Figure 4.10
in Chapter 4 proved very useful in this exercise as it assisted in the production of
RAP materials with different degrees of ageing as required for this laboratory
exercise. RAPs were categorised as those with residual bitumen of 5dmm,
10dmm, 15dmm and 20dmm penetration values and produced accordingly using
the timings specified on the said figure. The other aspects considered are further
discussed in the succeeding section. As earlier mentioned, the RAP with the
residual binder of 20dmm penetration was used for the mix design.
5.6 Determination of Aggregate Gradation for Proposed Mix
RAP materials were produced from the 20mm DBM by first slightly heating and
compacting them into slabs (305mm x 305mm x 50mm) at a temperature of
about 150⁰C using the roller compactor. Exposure to heat was carefully controlled
(took average of 21minutes in the microwave oven) in order not to introduce any
significant ageing to the material. This precaution proved useful as penetration
and softening point values were determined thereafter and found to be 20dmm
and 68.8⁰C respectively (pre-compaction condition was penetration = 21dmm and
softening point = 66⁰C ). Meanwhile the compaction was generally done to refusal
Chapter 5 Cold Bitumen Emulsion Mix Design and Initial Investigation on its Mechanical Performance
136
(i.e. void content of about 3-5%). This compaction was done in order to simulate
the normal condition of a typical road pavement.
After compaction, the materials were allowed to cool down and then broken down
into sizeable units (70mm x 70mm x 50mm) using the Kango Hammer. The
materials were subsequently crushed using the Jaw Crusher. Crushing was done
to facilitate effective and uniform ageing within a relatively short time. Openings
of 8mm, 14mm, 18mm, 22.5mm, 24mm, 28mm and also 28mm to 14mm, 28mm
to 8mm and a combination of 18mm and 8mm were tried in a bid to determine a
suitable opening that would give a gradation which requires minimal virgin
material for the proposed design gradation i.e. 20mm DBM gradation. At the end
of the exercise, the 18mm opening was found suitable. Table 5.2 shows the
gradation properties of some of the openings used on the Jaw Crusher. Table 5.3
details the gradation properties of materials produced using the 18mm opening
on the Jaw Crusher. The materials produced in the process generally had an
average Elongation Index of 17.02 and an average Flakiness Index of 6.38 (all
within acceptable standard limits).
While the materials, just as produced directly from the crusher were taken as the
least aged set of RAPs (residual binder being 20dmm), some other sets of the
same material were further aged in the forced draft oven using the appropriate
timings in Figure 4.10 of Chapter 4. The target penetration values were 5dmm,
10dmm and 15dmm for studying the effect of varying degrees of RAP ageing on
the engineering properties of cold bituminous emulsion mixtures (CBEMs). The
gradation of the RAP material as indicated in Figure 5.6 shows that it is coarse
and thus would require some dust and filler portions in order to fall within the
ideal grading envelope for 20mm DBM. It is worth mentioning here that the
materials following this ageing became lumpy. The procedure that was followed in
rectifying this problem is fully discussed in Chapter 4 of this thesis and thus needs
no revisiting here.
After some rounds of iterations using the gradation properties of RAP, 5mm dust
and filler, with the maximum density curve properties set as target, a ratio of
65:30:5 for combining RAP, 5mm dust and mineral filler material respectively was
found suitable and subsequently adopted. Table 5.4 details the gradation
properties of the RAP, 5mm Dust, Mineral Filler, Maximum Density and ORN
19&31 for 20mm DBM, while Table 5.5 shows how the materials were combined
to produce the design gradation curve. Figure 5.6 shows graphically the gradation
of the materials while Figure 5.7 reflects the composition and proportion of the
design mix.
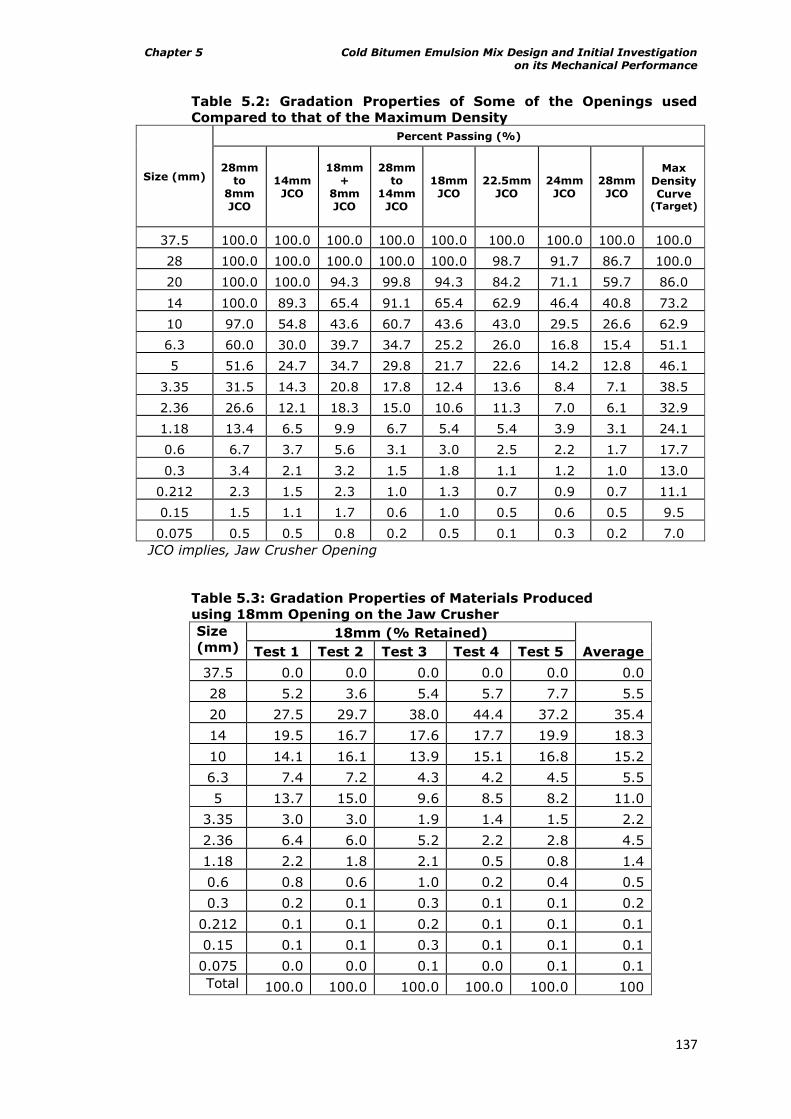
Chapter 5 Cold Bitumen Emulsion Mix Design and Initial Investigation on its Mechanical Performance
137
Table 5.2: Gradation Properties of Some of the Openings used
Compared to that of the Maximum Density
Size (mm)
Percent Passing (%)
28mm to
8mm JCO
14mm JCO
18mm +
8mm JCO
28mm to
14mm JCO
18mm JCO
22.5mm JCO
24mm JCO
28mm JCO
Max Density Curve
(Target)
37.5 100.0 100.0 100.0 100.0 100.0 100.0 100.0 100.0 100.0
28 100.0 100.0 100.0 100.0 100.0 98.7 91.7 86.7 100.0
20 100.0 100.0 94.3 99.8 94.3 84.2 71.1 59.7 86.0
14 100.0 89.3 65.4 91.1 65.4 62.9 46.4 40.8 73.2
10 97.0 54.8 43.6 60.7 43.6 43.0 29.5 26.6 62.9
6.3 60.0 30.0 39.7 34.7 25.2 26.0 16.8 15.4 51.1
5 51.6 24.7 34.7 29.8 21.7 22.6 14.2 12.8 46.1
3.35 31.5 14.3 20.8 17.8 12.4 13.6 8.4 7.1 38.5
2.36 26.6 12.1 18.3 15.0 10.6 11.3 7.0 6.1 32.9
1.18 13.4 6.5 9.9 6.7 5.4 5.4 3.9 3.1 24.1
0.6 6.7 3.7 5.6 3.1 3.0 2.5 2.2 1.7 17.7
0.3 3.4 2.1 3.2 1.5 1.8 1.1 1.2 1.0 13.0
0.212 2.3 1.5 2.3 1.0 1.3 0.7 0.9 0.7 11.1
0.15 1.5 1.1 1.7 0.6 1.0 0.5 0.6 0.5 9.5
0.075 0.5 0.5 0.8 0.2 0.5 0.1 0.3 0.2 7.0
JCO implies, Jaw Crusher Opening
Table 5.3: Gradation Properties of Materials Produced
using 18mm Opening on the Jaw Crusher
Size
(mm) 18mm (% Retained)
Average Test 1 Test 2 Test 3 Test 4 Test 5
37.5 0.0 0.0 0.0 0.0 0.0 0.0
28 5.2 3.6 5.4 5.7 7.7 5.5
20 27.5 29.7 38.0 44.4 37.2 35.4
14 19.5 16.7 17.6 17.7 19.9 18.3
10 14.1 16.1 13.9 15.1 16.8 15.2
6.3 7.4 7.2 4.3 4.2 4.5 5.5
5 13.7 15.0 9.6 8.5 8.2 11.0
3.35 3.0 3.0 1.9 1.4 1.5 2.2
2.36 6.4 6.0 5.2 2.2 2.8 4.5
1.18 2.2 1.8 2.1 0.5 0.8 1.4
0.6 0.8 0.6 1.0 0.2 0.4 0.5
0.3 0.2 0.1 0.3 0.1 0.1 0.2
0.212 0.1 0.1 0.2 0.1 0.1 0.1
0.15 0.1 0.1 0.3 0.1 0.1 0.1
0.075 0.0 0.0 0.1 0.0 0.1 0.1
Total 100.0 100.0 100.0 100.0 100.0 100
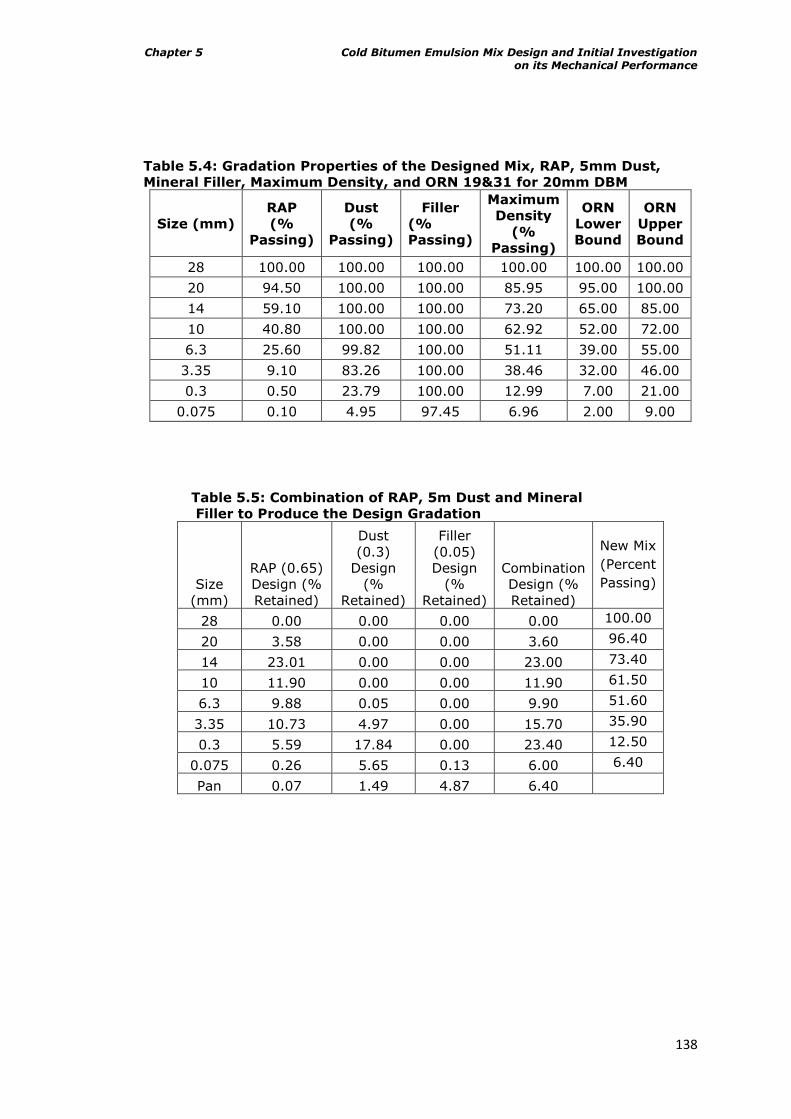
Chapter 5 Cold Bitumen Emulsion Mix Design and Initial Investigation on its Mechanical Performance
138
Table 5.4: Gradation Properties of the Designed Mix, RAP, 5mm Dust,
Mineral Filler, Maximum Density, and ORN 19&31 for 20mm DBM
Size (mm)
RAP
(%
Passing)
Dust
(%
Passing)
Filler
(%
Passing)
Maximum
Density
(%
Passing)
ORN
Lower
Bound
ORN
Upper
Bound
28 100.00 100.00 100.00 100.00 100.00 100.00
20 94.50 100.00 100.00 85.95 95.00 100.00
14 59.10 100.00 100.00 73.20 65.00 85.00
10 40.80 100.00 100.00 62.92 52.00 72.00
6.3 25.60 99.82 100.00 51.11 39.00 55.00
3.35 9.10 83.26 100.00 38.46 32.00 46.00
0.3 0.50 23.79 100.00 12.99 7.00 21.00
0.075 0.10 4.95 97.45 6.96 2.00 9.00
Table 5.5: Combination of RAP, 5m Dust and Mineral
Filler to Produce the Design Gradation
Size
(mm)
RAP (0.65)
Design (%
Retained)
Dust
(0.3)
Design
(%
Retained)
Filler
(0.05)
Design
(%
Retained)
Combination
Design (%
Retained)
New Mix
(Percent
Passing)
28 0.00 0.00 0.00 0.00 100.00
20 3.58 0.00 0.00 3.60 96.40
14 23.01 0.00 0.00 23.00 73.40
10 11.90 0.00 0.00 11.90 61.50
6.3 9.88 0.05 0.00 9.90 51.60
3.35 10.73 4.97 0.00 15.70 35.90
0.3 5.59 17.84 0.00 23.40 12.50
0.075 0.26 5.65 0.13 6.00 6.40
Pan 0.07 1.49 4.87 6.40
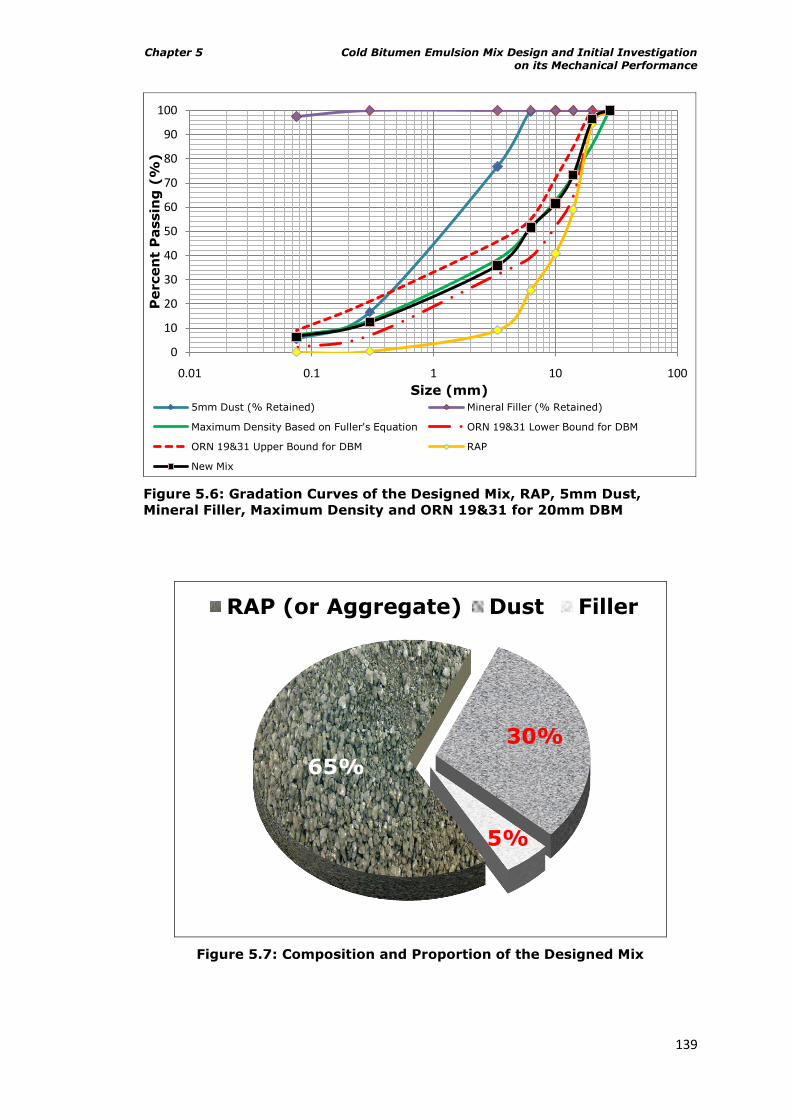
Chapter 5 Cold Bitumen Emulsion Mix Design and Initial Investigation on its Mechanical Performance
139
Figure 5.6: Gradation Curves of the Designed Mix, RAP, 5mm Dust,
Mineral Filler, Maximum Density and ORN 19&31 for 20mm DBM
Figure 5.7: Composition and Proportion of the Designed Mix
0
10
20
30
40
50
60
70
80
90
100
0.01 0.1 1 10 100
Percen
t P
assin
g (
%)
Size (mm)5mm Dust (% Retained) Mineral Filler (% Retained)
Maximum Density Based on Fuller's Equation ORN 19&31 Lower Bound for DBM
ORN 19&31 Upper Bound for DBM RAP
New Mix
65%
30%
5%
RAP (or Aggregate) Dust Filler
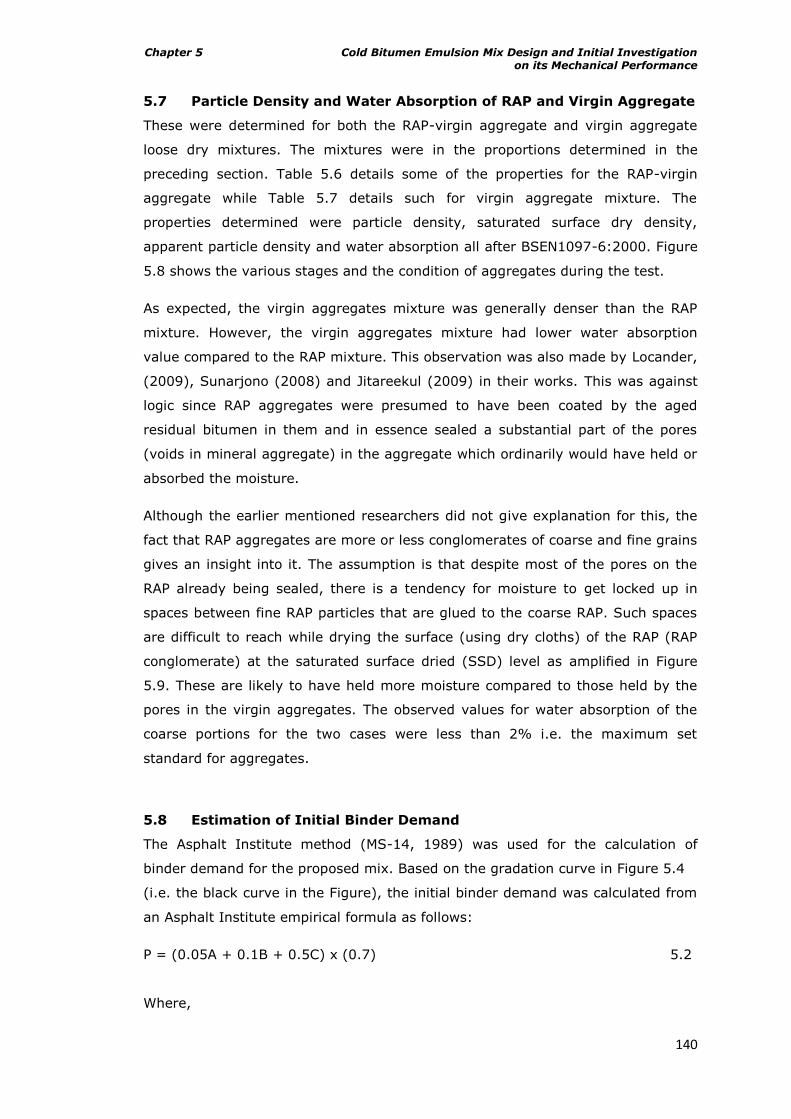
Chapter 5 Cold Bitumen Emulsion Mix Design and Initial Investigation on its Mechanical Performance
140
5.7 Particle Density and Water Absorption of RAP and Virgin Aggregate
These were determined for both the RAP-virgin aggregate and virgin aggregate
loose dry mixtures. The mixtures were in the proportions determined in the
preceding section. Table 5.6 details some of the properties for the RAP-virgin
aggregate while Table 5.7 details such for virgin aggregate mixture. The
properties determined were particle density, saturated surface dry density,
apparent particle density and water absorption all after BSEN1097-6:2000. Figure
5.8 shows the various stages and the condition of aggregates during the test.
As expected, the virgin aggregates mixture was generally denser than the RAP
mixture. However, the virgin aggregates mixture had lower water absorption
value compared to the RAP mixture. This observation was also made by Locander,
(2009), Sunarjono (2008) and Jitareekul (2009) in their works. This was against
logic since RAP aggregates were presumed to have been coated by the aged
residual bitumen in them and in essence sealed a substantial part of the pores
(voids in mineral aggregate) in the aggregate which ordinarily would have held or
absorbed the moisture.
Although the earlier mentioned researchers did not give explanation for this, the
fact that RAP aggregates are more or less conglomerates of coarse and fine grains
gives an insight into it. The assumption is that despite most of the pores on the
RAP already being sealed, there is a tendency for moisture to get locked up in
spaces between fine RAP particles that are glued to the coarse RAP. Such spaces
are difficult to reach while drying the surface (using dry cloths) of the RAP (RAP
conglomerate) at the saturated surface dried (SSD) level as amplified in Figure
5.9. These are likely to have held more moisture compared to those held by the
pores in the virgin aggregates. The observed values for water absorption of the
coarse portions for the two cases were less than 2% i.e. the maximum set
standard for aggregates.
5.8 Estimation of Initial Binder Demand
The Asphalt Institute method (MS-14, 1989) was used for the calculation of
binder demand for the proposed mix. Based on the gradation curve in Figure 5.4
(i.e. the black curve in the Figure), the initial binder demand was calculated from
an Asphalt Institute empirical formula as follows:
P = (0.05A + 0.1B + 0.5C) x (0.7) 5.2
Where,
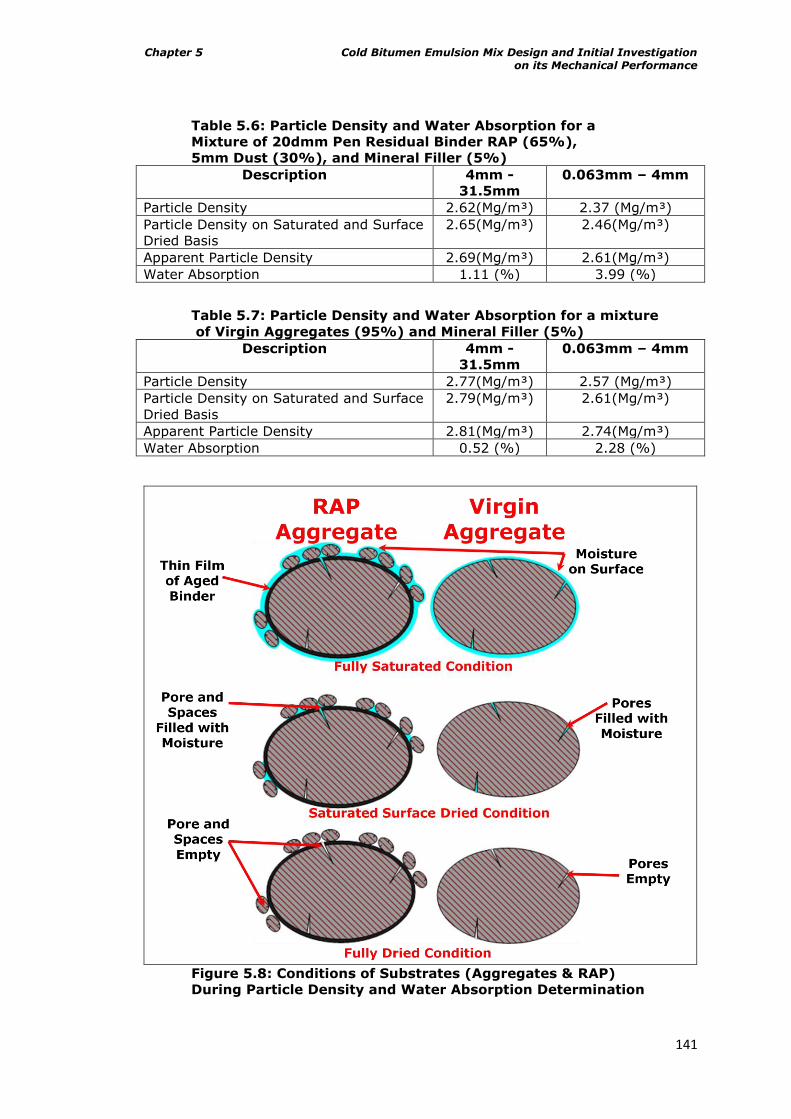
Chapter 5 Cold Bitumen Emulsion Mix Design and Initial Investigation on its Mechanical Performance
141
Table 5.6: Particle Density and Water Absorption for a
Mixture of 20dmm Pen Residual Binder RAP (65%),
5mm Dust (30%), and Mineral Filler (5%)
Description 4mm -
31.5mm
0.063mm – 4mm
Particle Density 2.62(Mg/m³) 2.37 (Mg/m³)
Particle Density on Saturated and Surface
Dried Basis
2.65(Mg/m³) 2.46(Mg/m³)
Apparent Particle Density 2.69(Mg/m³) 2.61(Mg/m³)
Water Absorption 1.11 (%) 3.99 (%)
Table 5.7: Particle Density and Water Absorption for a mixture
of Virgin Aggregates (95%) and Mineral Filler (5%)
Description 4mm -
31.5mm
0.063mm – 4mm
Particle Density 2.77(Mg/m³) 2.57 (Mg/m³)
Particle Density on Saturated and Surface
Dried Basis
2.79(Mg/m³) 2.61(Mg/m³)
Apparent Particle Density 2.81(Mg/m³) 2.74(Mg/m³)
Water Absorption 0.52 (%) 2.28 (%)
Figure 5.8: Conditions of Substrates (Aggregates & RAP)
During Particle Density and Water Absorption Determination
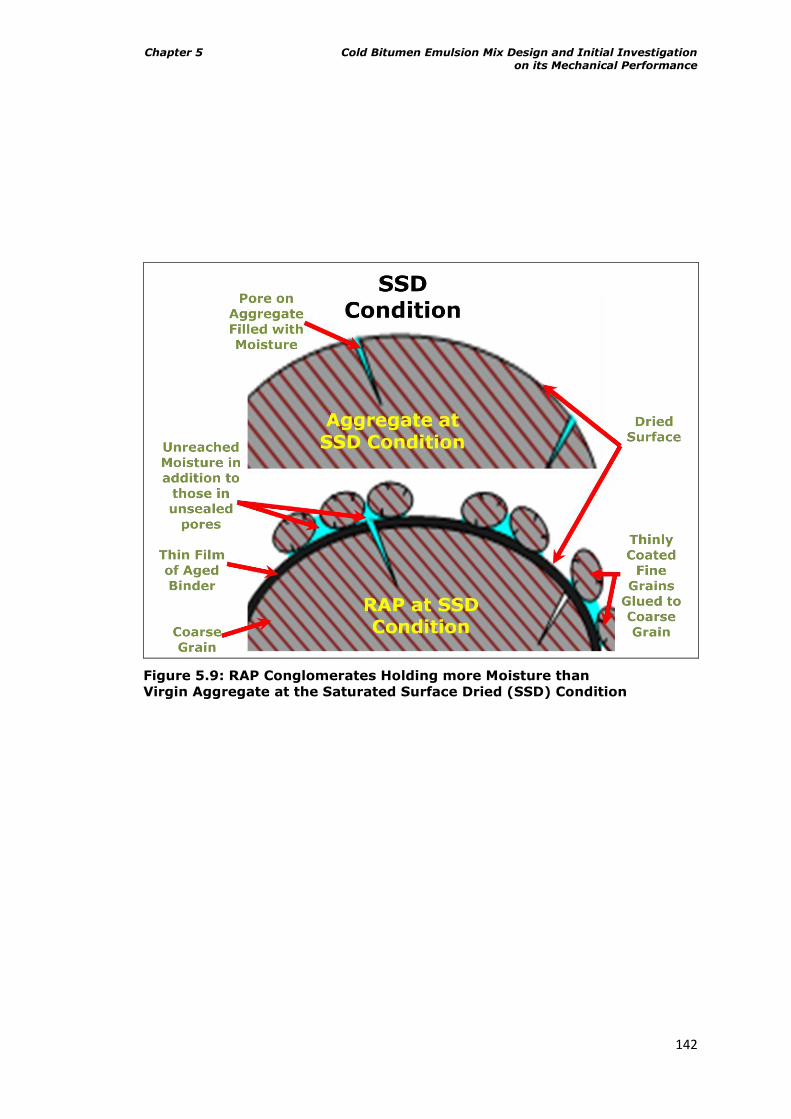
Chapter 5 Cold Bitumen Emulsion Mix Design and Initial Investigation on its Mechanical Performance
142
Figure 5.9: RAP Conglomerates Holding more Moisture than
Virgin Aggregate at the Saturated Surface Dried (SSD) Condition
Chapter 5 Cold Bitumen Emulsion Mix Design and Initial Investigation on its Mechanical Performance
143
P= % by weight of binder demand by mass of total mixture
A= % of mineral aggregate >2.36mm = 100 – 31.8 =68.2
B=% of mineral aggregate <2.36 and > 0.075mm= 31.8 - 6.4 = 25.4
C=% of mineral aggregate < 0.075mm= 6.4
Equation (5.2) was thus evaluated as 6.4%. Meanwhile, since the available
emulsion has a bitumen content of 60% , it implies that, taking into consideration
the residual binder in RAP (which constitutes 65% of the entire mix), the total
initial binder and bitumen emulsion demands are 3.6% and 6.1% (approximated
to 6% for convenience) respectively. This value eventually proved useful in the
determination of Optimum Total Fluid Content (OTFC) for Cold Bitumen Emulsion
Mixtures (CBEMs) as will be found later in this chapter.
5.9 Methods for Specimen Manufacturing
Ibrahim (1998) advised in his work that mixture composition and preparation of
test specimens are significant factors affecting the behaviour of cold bituminous
emulsion mixtures. So a number of measures were taken to ensure consistency in
this laboratory work. For example, there are two approaches for preparing and
using cold bituminous emulsion mixtures in the construction industry. These could
be mixed and stored until they are needed or mixed and immediately laid. The
approach used here was the latter as both time and space for storage were major
constraints in this work.
For the laboratory compaction of such mixtures, there were two alternatives
available as of the time that this research work commenced - the roller
compactor, and the gyratory compactor. The gyratory compactor was opted for
since it was capable of directly manufacturing the required cylindrical specimens
without introducing any significant modifications to specimens.
The roller compactor produces compacted slabs from which the required
cylindrical specimens would have to be cored out. Water jets are normally used as
lubricant for the coring and there is the tendency for specimens to be significantly
deformed during this process as a result of washing off of fine aggregates or
flipping off of coarse aggregates. Cold bituminous emulsion mixtures at this
desired stage are very fragile and so this method was not used at the mix design
level.
Several methods have been advanced for curing as discussed in Chapter 3 of this
thesis. In this exercise, no cyclic curing was done also due to the shortness of
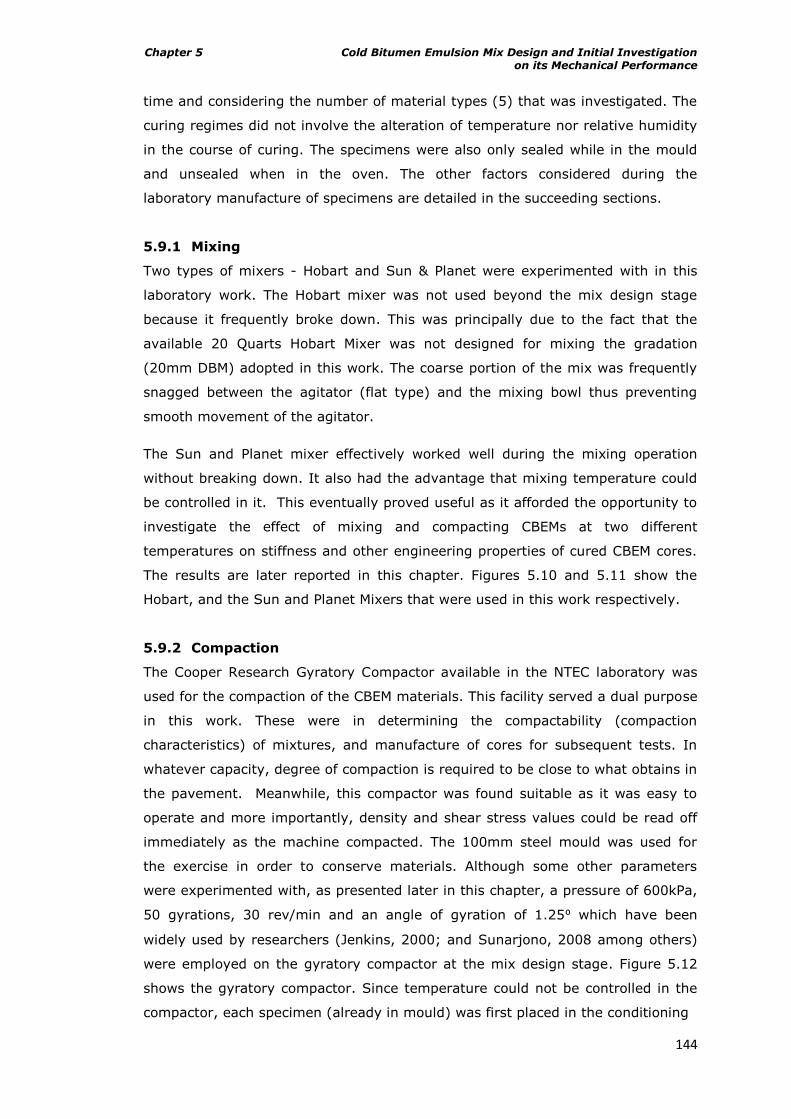
Chapter 5 Cold Bitumen Emulsion Mix Design and Initial Investigation on its Mechanical Performance
144
time and considering the number of material types (5) that was investigated. The
curing regimes did not involve the alteration of temperature nor relative humidity
in the course of curing. The specimens were also only sealed while in the mould
and unsealed when in the oven. The other factors considered during the
laboratory manufacture of specimens are detailed in the succeeding sections.
5.9.1 Mixing
Two types of mixers - Hobart and Sun & Planet were experimented with in this
laboratory work. The Hobart mixer was not used beyond the mix design stage
because it frequently broke down. This was principally due to the fact that the
available 20 Quarts Hobart Mixer was not designed for mixing the gradation
(20mm DBM) adopted in this work. The coarse portion of the mix was frequently
snagged between the agitator (flat type) and the mixing bowl thus preventing
smooth movement of the agitator.
The Sun and Planet mixer effectively worked well during the mixing operation
without breaking down. It also had the advantage that mixing temperature could
be controlled in it. This eventually proved useful as it afforded the opportunity to
investigate the effect of mixing and compacting CBEMs at two different
temperatures on stiffness and other engineering properties of cured CBEM cores.
The results are later reported in this chapter. Figures 5.10 and 5.11 show the
Hobart, and the Sun and Planet Mixers that were used in this work respectively.
5.9.2 Compaction
The Cooper Research Gyratory Compactor available in the NTEC laboratory was
used for the compaction of the CBEM materials. This facility served a dual purpose
in this work. These were in determining the compactability (compaction
characteristics) of mixtures, and manufacture of cores for subsequent tests. In
whatever capacity, degree of compaction is required to be close to what obtains in
the pavement. Meanwhile, this compactor was found suitable as it was easy to
operate and more importantly, density and shear stress values could be read off
immediately as the machine compacted. The 100mm steel mould was used for
the exercise in order to conserve materials. Although some other parameters
were experimented with, as presented later in this chapter, a pressure of 600kPa,
50 gyrations, 30 rev/min and an angle of gyration of 1.25⁰ which have been
widely used by researchers (Jenkins, 2000; and Sunarjono, 2008 among others)
were employed on the gyratory compactor at the mix design stage. Figure 5.12
shows the gyratory compactor. Since temperature could not be controlled in the
compactor, each specimen (already in mould) was first placed in the conditioning
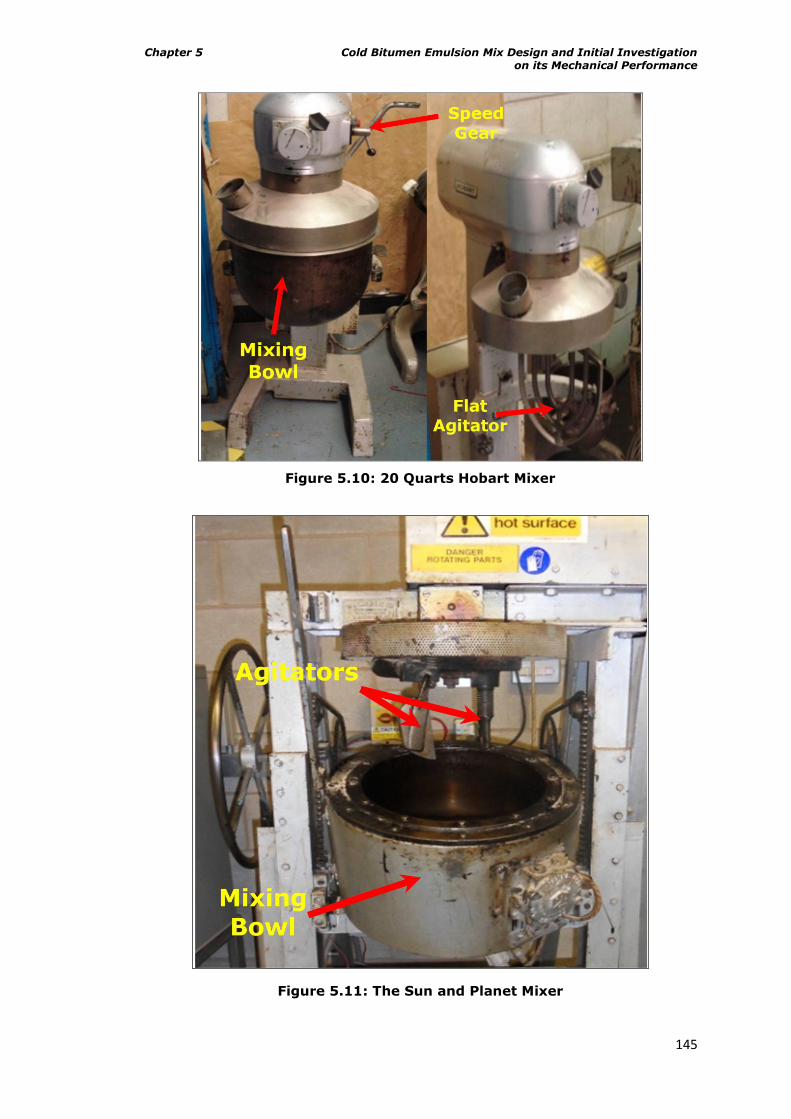
Chapter 5 Cold Bitumen Emulsion Mix Design and Initial Investigation on its Mechanical Performance
145
Figure 5.10: 20 Quarts Hobart Mixer
Figure 5.11: The Sun and Planet Mixer
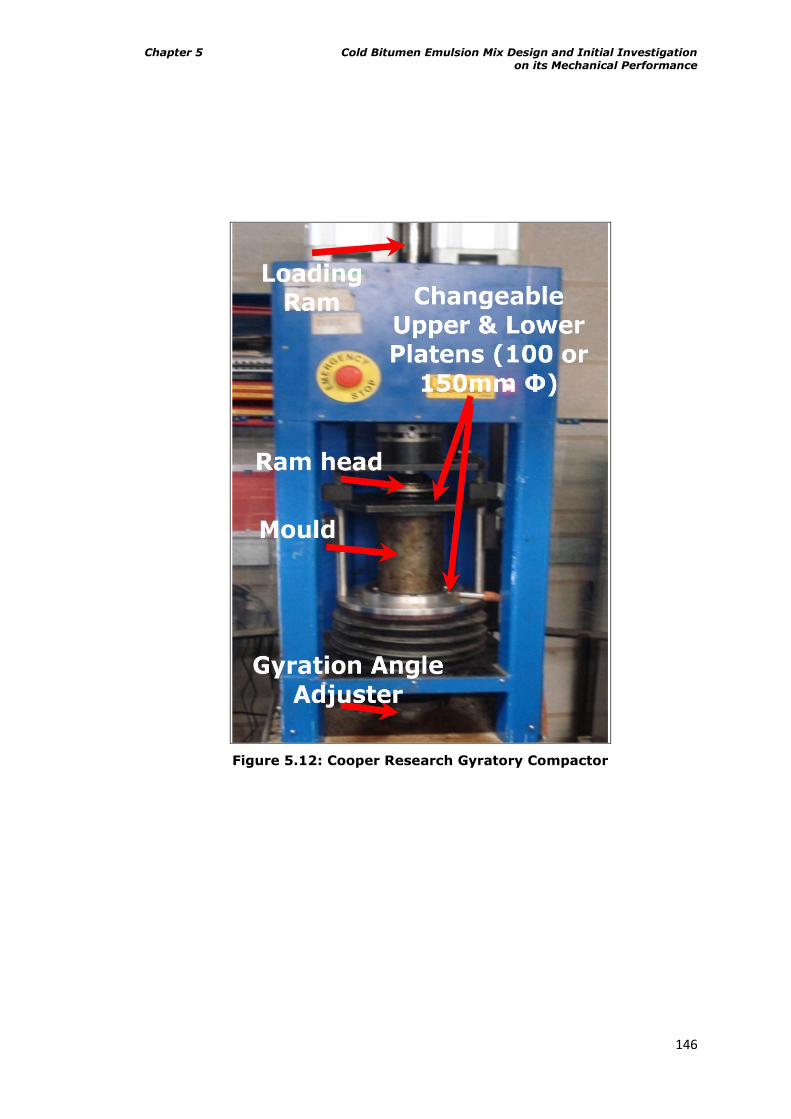
Chapter 5 Cold Bitumen Emulsion Mix Design and Initial Investigation on its Mechanical Performance
146
Figure 5.12: Cooper Research Gyratory Compactor
Chapter 5 Cold Bitumen Emulsion Mix Design and Initial Investigation on its Mechanical Performance
147
chamber at the desired temperature for about 30mins before compaction.
5.9.3 Curing Method
As discussed in Chapter 3 of this thesis, curing is mandatory for studies on cold
mixtures in order to obtain any useful information regarding their mechanical
performance. Three curing regimes were eventually used in this work. For this
design stage, an intermediate curing condition of 40⁰C over 72hrs was used. The
curing was done using a forced draft oven. Early life and fully cured conditions of
40⁰C over 12hrs and 60⁰C over 96hrs were also later applied on specimens at the
full investigation stage. The relative humidity was approximately 40% throughout.
The protocol followed was such that the specimens were left in the mould (in a
sealed condition) immediately after compaction for up to 24hrs after which they
were extruded. Specimens were subsequently placed in the forced draft oven at
the required temperature for the specified time. Just before and immediately after
curing, the specimens‟ masses were measured. The volumetric properties were
measured after curing and then they were placed in the cold store at 5⁰C until
they were ready for testing.
5.10 Compaction Characteristics and the Determination of OMC and MDD
For cold bituminous emulsion mixtures (CBEMs), evaluating the compaction
characteristics of the mix entails determining both the Optimum Moisture Content
(OMC) and Maximum Dry Density (MDD) of such. These give an idea of desirable
total fluid content in the cold bituminous mixture. The Hobart Mixer (speed II)
was used for mixing the materials, while the Cooper Research Gyratory
Compactor was used for the compaction of the materials. Having added the
specified water content, the mix was mixed for 60s. This compactor automatically
displays progressively the height, density and shear stress values of specimens as
the machine compacts. The 100mm diameter steel mould was used for the
exercise in order to conserve materials. The parameters - loading pressure of
600kPa, 50 gyrations, rate of gyration of 30rev/min and a gyration angle of 1.25⁰
were employed in the gyratory compactor during the exercise.
The moisture contents of the materials were increased at intervals of 2% starting
from 1% and ending at 9%, making a total of five levels of observation. The
materials were subsequently compacted at room temperature (20⁰C). The details
in Tables 5.8 (a and b) were used for plotting the accompanying moisture –
density graph in Figure 5.13. The dry density of the mixtures as detailed in Table
5.8b was determined using equation 5.3:
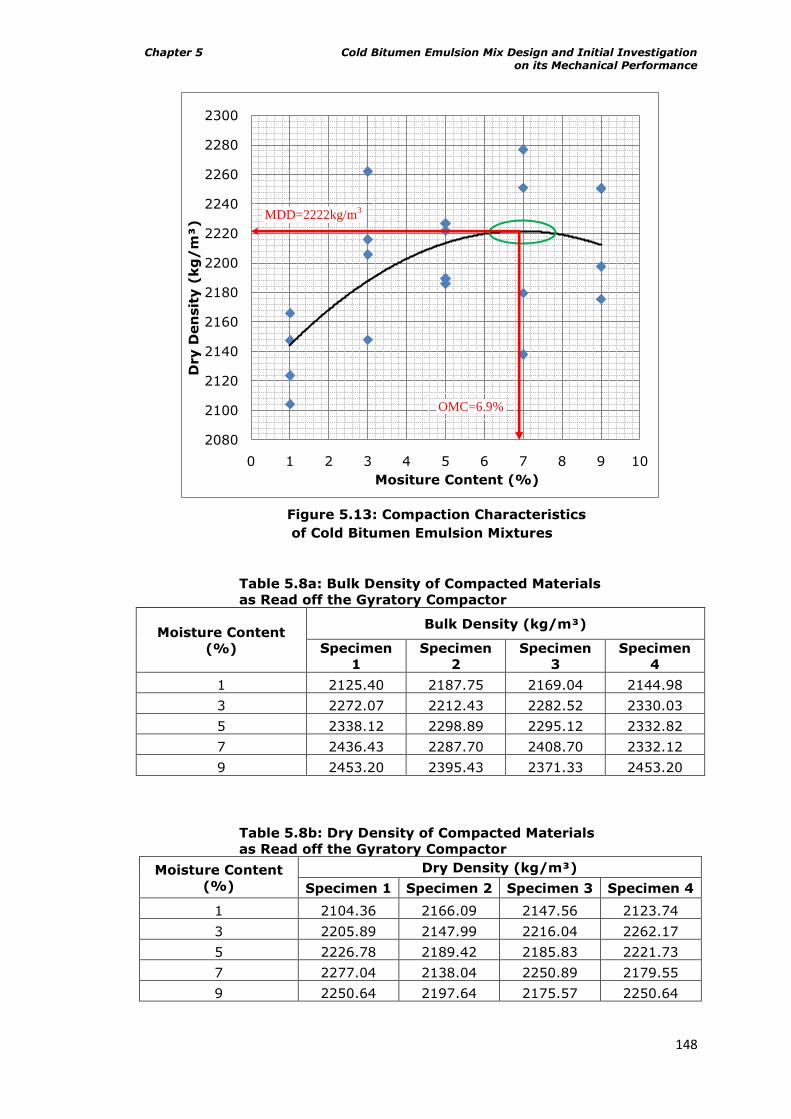
Chapter 5 Cold Bitumen Emulsion Mix Design and Initial Investigation on its Mechanical Performance
148
Figure 5.13: Compaction Characteristics
of Cold Bitumen Emulsion Mixtures
Table 5.8a: Bulk Density of Compacted Materials
as Read off the Gyratory Compactor
Moisture Content
(%)
Bulk Density (kg/m³)
Specimen
1
Specimen
2
Specimen
3
Specimen
4
1 2125.40 2187.75 2169.04 2144.98
3 2272.07 2212.43 2282.52 2330.03
5 2338.12 2298.89 2295.12 2332.82
7 2436.43 2287.70 2408.70 2332.12
9 2453.20 2395.43 2371.33 2453.20
Table 5.8b: Dry Density of Compacted Materials
as Read off the Gyratory Compactor
Moisture Content
(%)
Dry Density (kg/m³)
Specimen 1 Specimen 2 Specimen 3 Specimen 4
1 2104.36 2166.09 2147.56 2123.74
3 2205.89 2147.99 2216.04 2262.17
5 2226.78 2189.42 2185.83 2221.73
7 2277.04 2138.04 2250.89 2179.55
9 2250.64 2197.64 2175.57 2250.64
2080
2100
2120
2140
2160
2180
2200
2220
2240
2260
2280
2300
0 1 2 3 4 5 6 7 8 9 10
Dry D
en
sit
y (
kg
/m
³)
Mositure Content (%)
MDD=2222kg/m3
OMC=6.9%
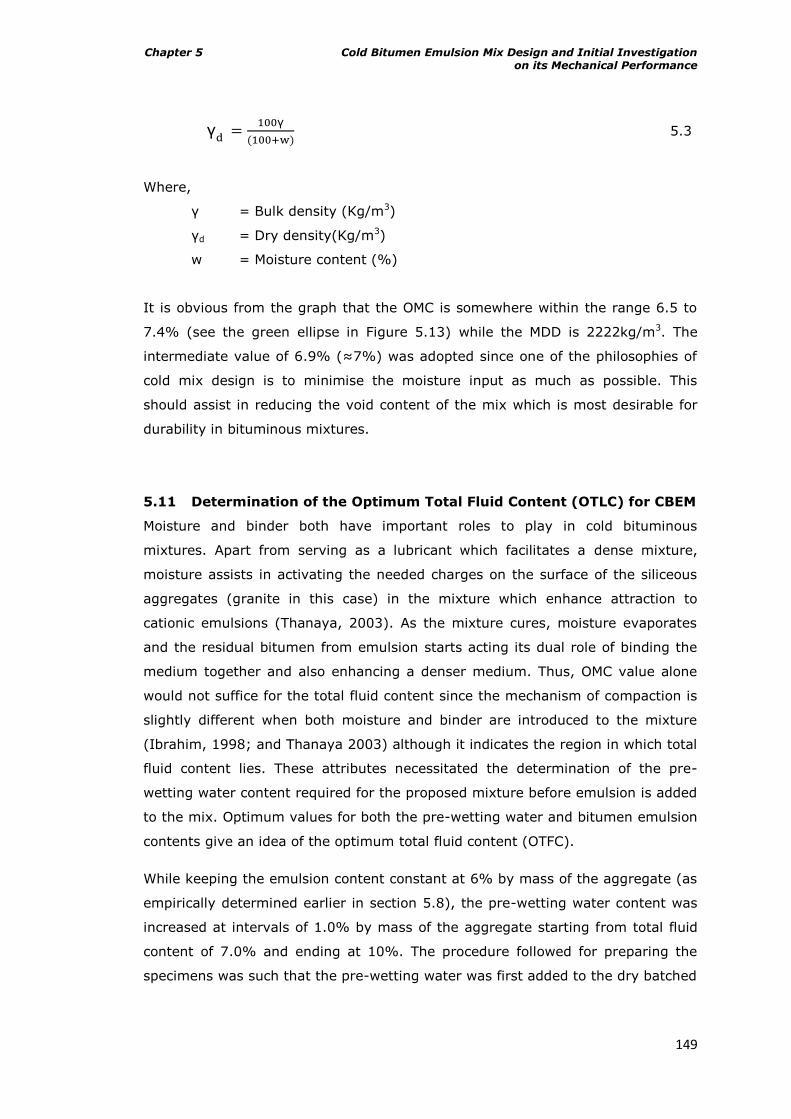
Chapter 5 Cold Bitumen Emulsion Mix Design and Initial Investigation on its Mechanical Performance
149
5.3
Where,
= Bulk density (Kg/m3)
d = Dry density(Kg/m3)
w = Moisture content (%)
It is obvious from the graph that the OMC is somewhere within the range 6.5 to
7.4% (see the green ellipse in Figure 5.13) while the MDD is 2222kg/m3. The
intermediate value of 6.9% (≈7%) was adopted since one of the philosophies of
cold mix design is to minimise the moisture input as much as possible. This
should assist in reducing the void content of the mix which is most desirable for
durability in bituminous mixtures.
5.11 Determination of the Optimum Total Fluid Content (OTLC) for CBEM
Moisture and binder both have important roles to play in cold bituminous
mixtures. Apart from serving as a lubricant which facilitates a dense mixture,
moisture assists in activating the needed charges on the surface of the siliceous
aggregates (granite in this case) in the mixture which enhance attraction to
cationic emulsions (Thanaya, 2003). As the mixture cures, moisture evaporates
and the residual bitumen from emulsion starts acting its dual role of binding the
medium together and also enhancing a denser medium. Thus, OMC value alone
would not suffice for the total fluid content since the mechanism of compaction is
slightly different when both moisture and binder are introduced to the mixture
(Ibrahim, 1998; and Thanaya 2003) although it indicates the region in which total
fluid content lies. These attributes necessitated the determination of the pre-
wetting water content required for the proposed mixture before emulsion is added
to the mix. Optimum values for both the pre-wetting water and bitumen emulsion
contents give an idea of the optimum total fluid content (OTFC).
While keeping the emulsion content constant at 6% by mass of the aggregate (as
empirically determined earlier in section 5.8), the pre-wetting water content was
increased at intervals of 1.0% by mass of the aggregate starting from total fluid
content of 7.0% and ending at 10%. The procedure followed for preparing the
specimens was such that the pre-wetting water was first added to the dry batched
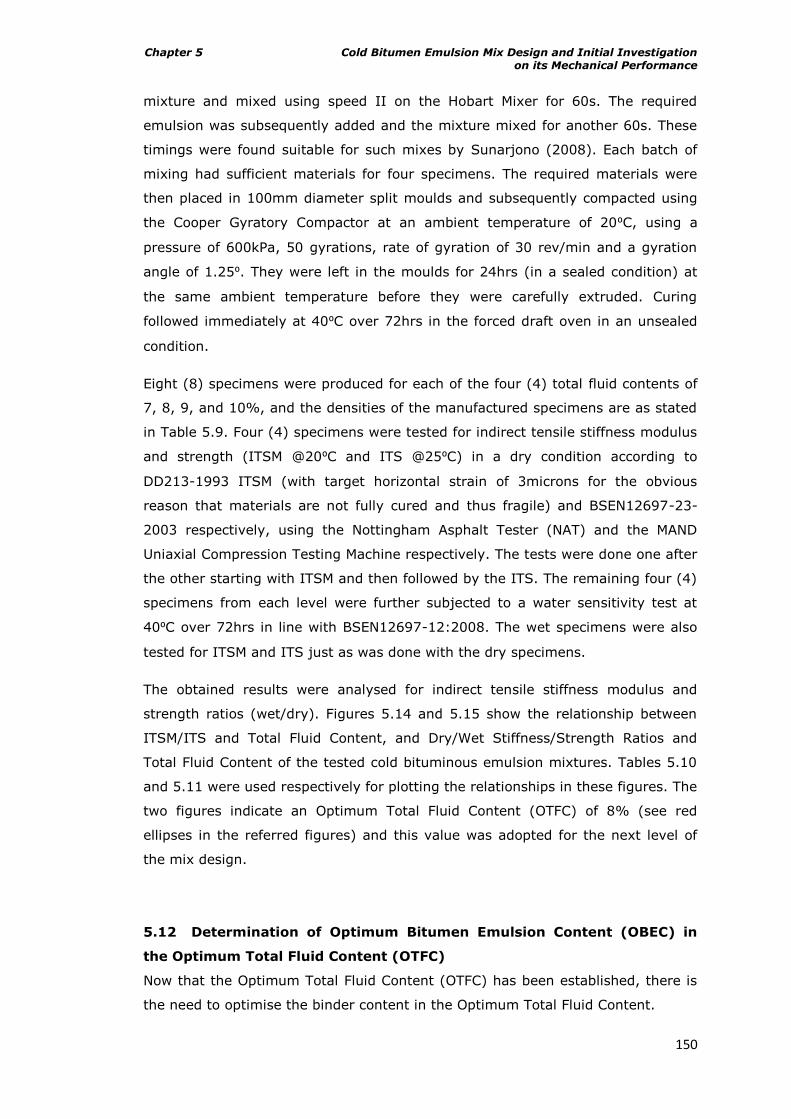
Chapter 5 Cold Bitumen Emulsion Mix Design and Initial Investigation on its Mechanical Performance
150
mixture and mixed using speed II on the Hobart Mixer for 60s. The required
emulsion was subsequently added and the mixture mixed for another 60s. These
timings were found suitable for such mixes by Sunarjono (2008). Each batch of
mixing had sufficient materials for four specimens. The required materials were
then placed in 100mm diameter split moulds and subsequently compacted using
the Cooper Gyratory Compactor at an ambient temperature of 20⁰C, using a
pressure of 600kPa, 50 gyrations, rate of gyration of 30 rev/min and a gyration
angle of 1.25⁰. They were left in the moulds for 24hrs (in a sealed condition) at
the same ambient temperature before they were carefully extruded. Curing
followed immediately at 40⁰C over 72hrs in the forced draft oven in an unsealed
condition.
Eight (8) specimens were produced for each of the four (4) total fluid contents of
7, 8, 9, and 10%, and the densities of the manufactured specimens are as stated
in Table 5.9. Four (4) specimens were tested for indirect tensile stiffness modulus
and strength (ITSM @20⁰C and ITS @25⁰C) in a dry condition according to
DD213-1993 ITSM (with target horizontal strain of 3microns for the obvious
reason that materials are not fully cured and thus fragile) and BSEN12697-23-
2003 respectively, using the Nottingham Asphalt Tester (NAT) and the MAND
Uniaxial Compression Testing Machine respectively. The tests were done one after
the other starting with ITSM and then followed by the ITS. The remaining four (4)
specimens from each level were further subjected to a water sensitivity test at
40⁰C over 72hrs in line with BSEN12697-12:2008. The wet specimens were also
tested for ITSM and ITS just as was done with the dry specimens.
The obtained results were analysed for indirect tensile stiffness modulus and
strength ratios (wet/dry). Figures 5.14 and 5.15 show the relationship between
ITSM/ITS and Total Fluid Content, and Dry/Wet Stiffness/Strength Ratios and
Total Fluid Content of the tested cold bituminous emulsion mixtures. Tables 5.10
and 5.11 were used respectively for plotting the relationships in these figures. The
two figures indicate an Optimum Total Fluid Content (OTFC) of 8% (see red
ellipses in the referred figures) and this value was adopted for the next level of
the mix design.
5.12 Determination of Optimum Bitumen Emulsion Content (OBEC) in
the Optimum Total Fluid Content (OTFC)
Now that the Optimum Total Fluid Content (OTFC) has been established, there is
the need to optimise the binder content in the Optimum Total Fluid Content.
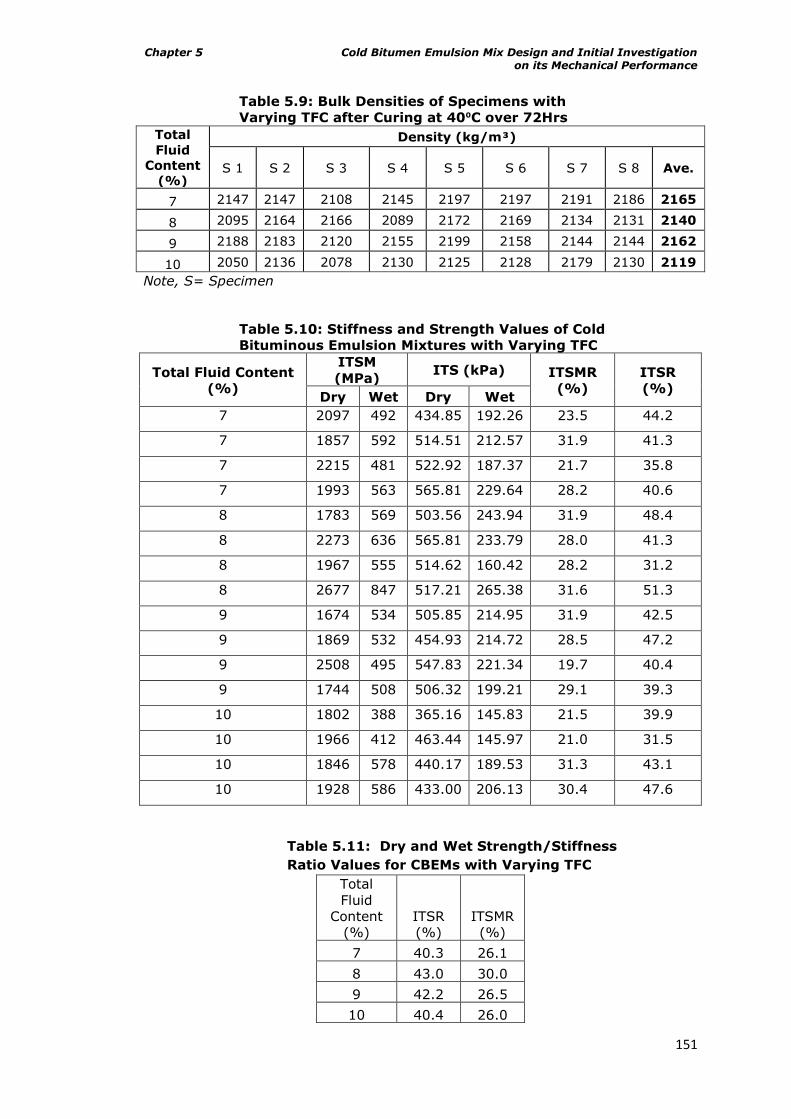
Chapter 5 Cold Bitumen Emulsion Mix Design and Initial Investigation on its Mechanical Performance
151
Table 5.9: Bulk Densities of Specimens with
Varying TFC after Curing at 40⁰C over 72Hrs
Total
Fluid
Content
(%)
Density (kg/m³)
S 1 S 2 S 3 S 4 S 5 S 6 S 7 S 8 Ave.
7 2147 2147 2108 2145 2197 2197 2191 2186 2165
8 2095 2164 2166 2089 2172 2169 2134 2131 2140
9 2188 2183 2120 2155 2199 2158 2144 2144 2162
10 2050 2136 2078 2130 2125 2128 2179 2130 2119
Note, S= Specimen
Table 5.10: Stiffness and Strength Values of Cold
Bituminous Emulsion Mixtures with Varying TFC
Total Fluid Content
(%)
ITSM
(MPa) ITS (kPa) ITSMR
(%)
ITSR
(%) Dry Wet Dry Wet
7 2097 492 434.85 192.26 23.5 44.2
7 1857 592 514.51 212.57 31.9 41.3
7 2215 481 522.92 187.37 21.7 35.8
7 1993 563 565.81 229.64 28.2 40.6
8 1783 569 503.56 243.94 31.9 48.4
8 2273 636 565.81 233.79 28.0 41.3
8 1967 555 514.62 160.42 28.2 31.2
8 2677 847 517.21 265.38 31.6 51.3
9 1674 534 505.85 214.95 31.9 42.5
9 1869 532 454.93 214.72 28.5 47.2
9 2508 495 547.83 221.34 19.7 40.4
9 1744 508 506.32 199.21 29.1 39.3
10 1802 388 365.16 145.83 21.5 39.9
10 1966 412 463.44 145.97 21.0 31.5
10 1846 578 440.17 189.53 31.3 43.1
10 1928 586 433.00 206.13 30.4 47.6
Table 5.11: Dry and Wet Strength/Stiffness
Ratio Values for CBEMs with Varying TFC
Total
Fluid
Content
(%)
ITSR
(%)
ITSMR
(%)
7 40.3 26.1
8 43.0 30.0
9 42.2 26.5
10 40.4 26.0
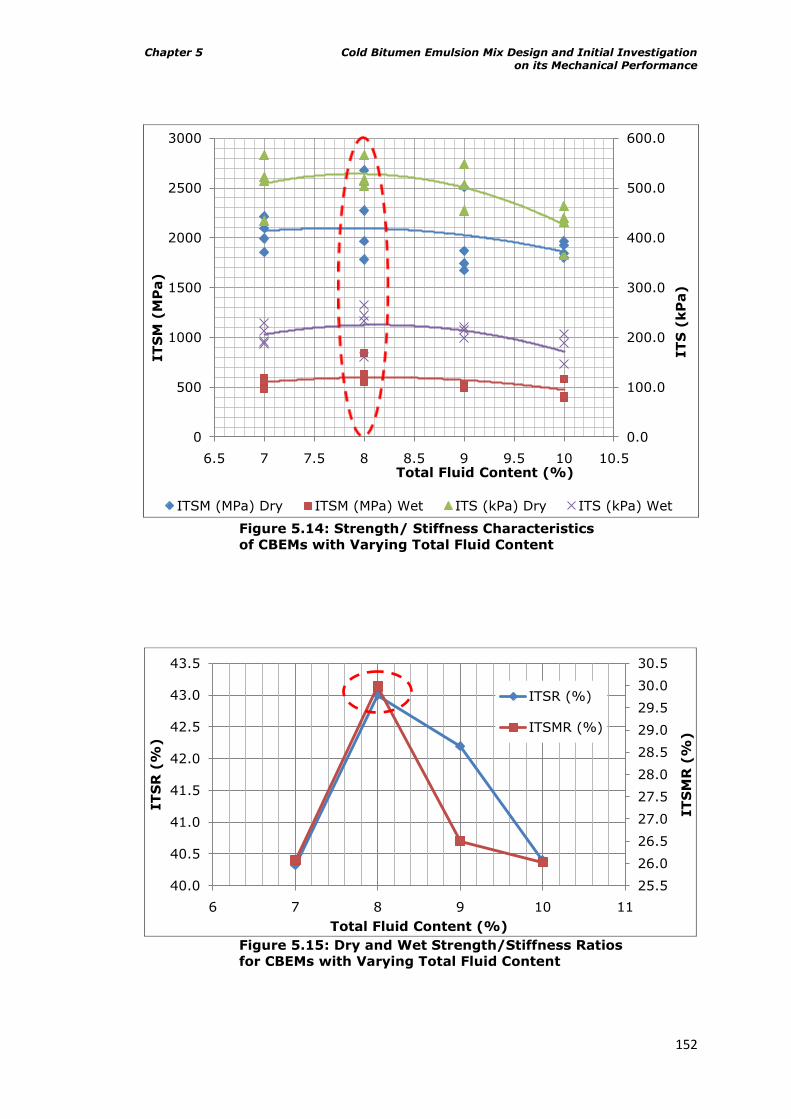
Chapter 5 Cold Bitumen Emulsion Mix Design and Initial Investigation on its Mechanical Performance
152
Figure 5.14: Strength/ Stiffness Characteristics
of CBEMs with Varying Total Fluid Content
Figure 5.15: Dry and Wet Strength/Stiffness Ratios
for CBEMs with Varying Total Fluid Content
0.0
100.0
200.0
300.0
400.0
500.0
600.0
0
500
1000
1500
2000
2500
3000
6.5 7 7.5 8 8.5 9 9.5 10 10.5
IT
S (
kP
a)
IT
SM
(M
Pa)
Total Fluid Content (%)
ITSM (MPa) Dry ITSM (MPa) Wet ITS (kPa) Dry ITS (kPa) Wet
25.5
26.0
26.5
27.0
27.5
28.0
28.5
29.0
29.5
30.0
30.5
40.0
40.5
41.0
41.5
42.0
42.5
43.0
43.5
6 7 8 9 10 11
IT
SM
R (
%)
IT
SR
(%
)
Total Fluid Content (%)
ITSR (%)
ITSMR (%)
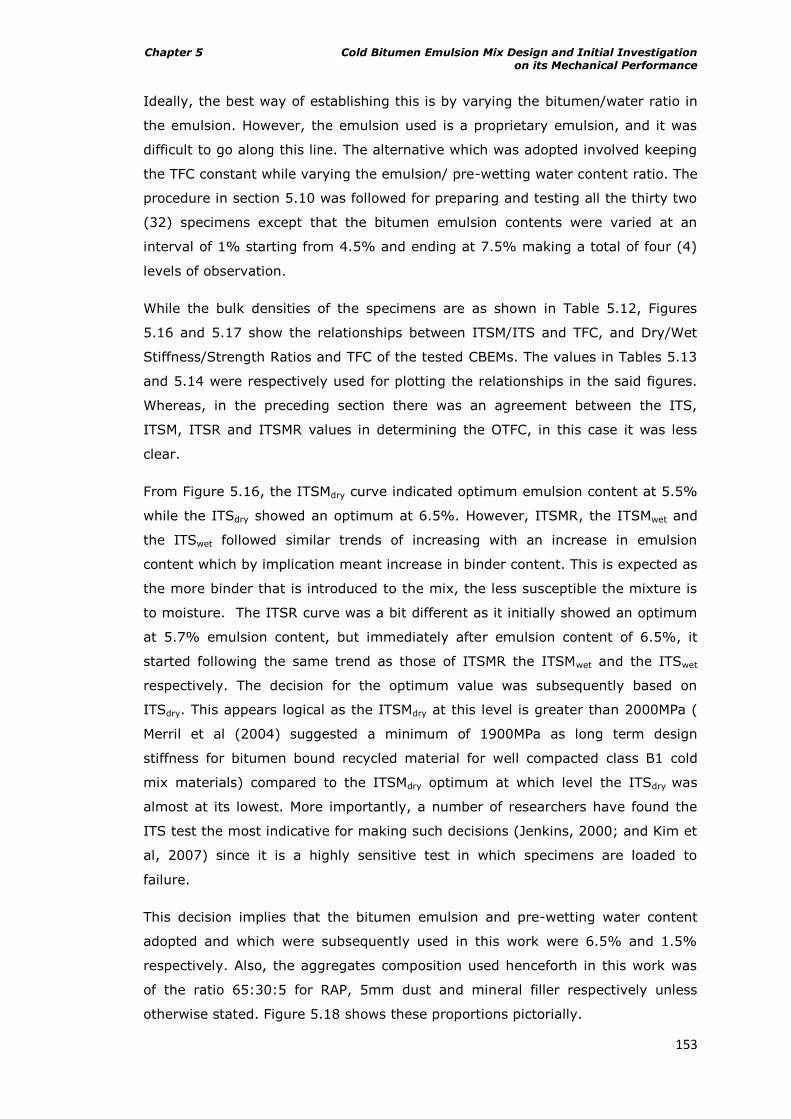
Chapter 5 Cold Bitumen Emulsion Mix Design and Initial Investigation on its Mechanical Performance
153
Ideally, the best way of establishing this is by varying the bitumen/water ratio in
the emulsion. However, the emulsion used is a proprietary emulsion, and it was
difficult to go along this line. The alternative which was adopted involved keeping
the TFC constant while varying the emulsion/ pre-wetting water content ratio. The
procedure in section 5.10 was followed for preparing and testing all the thirty two
(32) specimens except that the bitumen emulsion contents were varied at an
interval of 1% starting from 4.5% and ending at 7.5% making a total of four (4)
levels of observation.
While the bulk densities of the specimens are as shown in Table 5.12, Figures
5.16 and 5.17 show the relationships between ITSM/ITS and TFC, and Dry/Wet
Stiffness/Strength Ratios and TFC of the tested CBEMs. The values in Tables 5.13
and 5.14 were respectively used for plotting the relationships in the said figures.
Whereas, in the preceding section there was an agreement between the ITS,
ITSM, ITSR and ITSMR values in determining the OTFC, in this case it was less
clear.
From Figure 5.16, the ITSMdry curve indicated optimum emulsion content at 5.5%
while the ITSdry showed an optimum at 6.5%. However, ITSMR, the ITSMwet and
the ITSwet followed similar trends of increasing with an increase in emulsion
content which by implication meant increase in binder content. This is expected as
the more binder that is introduced to the mix, the less susceptible the mixture is
to moisture. The ITSR curve was a bit different as it initially showed an optimum
at 5.7% emulsion content, but immediately after emulsion content of 6.5%, it
started following the same trend as those of ITSMR the ITSMwet and the ITSwet
respectively. The decision for the optimum value was subsequently based on
ITSdry. This appears logical as the ITSMdry at this level is greater than 2000MPa (
Merril et al (2004) suggested a minimum of 1900MPa as long term design
stiffness for bitumen bound recycled material for well compacted class B1 cold
mix materials) compared to the ITSMdry optimum at which level the ITSdry was
almost at its lowest. More importantly, a number of researchers have found the
ITS test the most indicative for making such decisions (Jenkins, 2000; and Kim et
al, 2007) since it is a highly sensitive test in which specimens are loaded to
failure.
This decision implies that the bitumen emulsion and pre-wetting water content
adopted and which were subsequently used in this work were 6.5% and 1.5%
respectively. Also, the aggregates composition used henceforth in this work was
of the ratio 65:30:5 for RAP, 5mm dust and mineral filler respectively unless
otherwise stated. Figure 5.18 shows these proportions pictorially.
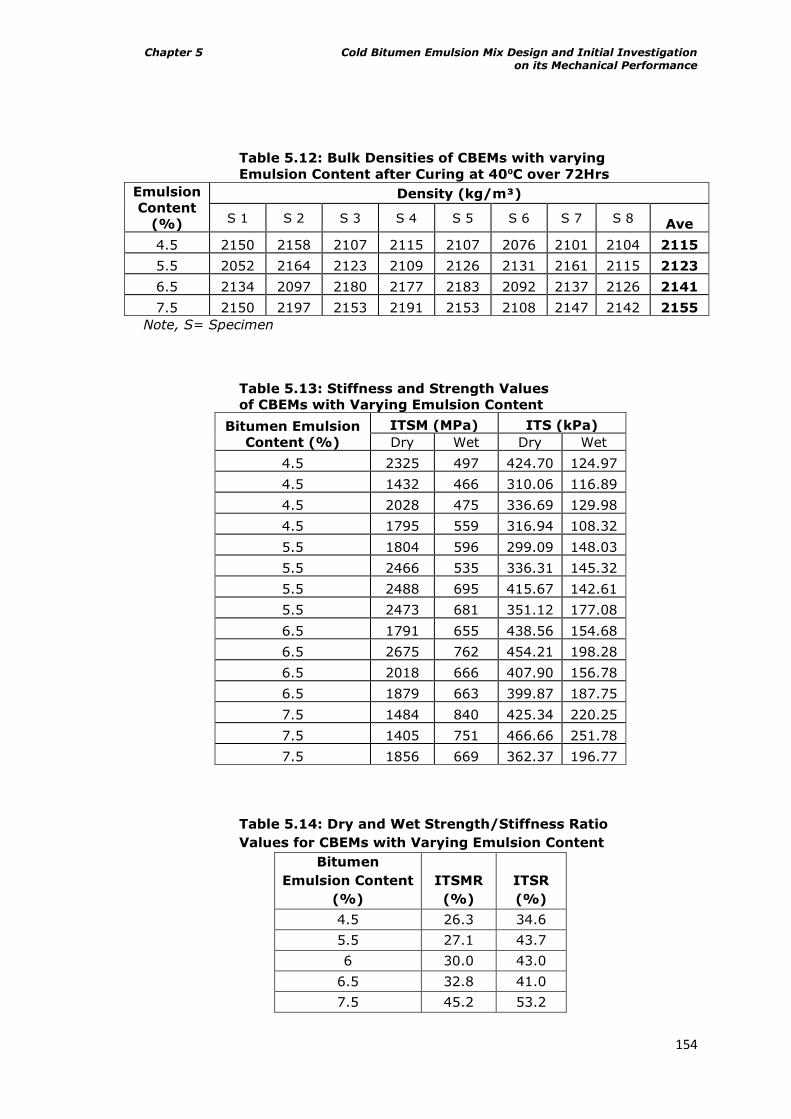
Chapter 5 Cold Bitumen Emulsion Mix Design and Initial Investigation on its Mechanical Performance
154
Table 5.12: Bulk Densities of CBEMs with varying
Emulsion Content after Curing at 40⁰C over 72Hrs
Emulsion
Content
(%)
Density (kg/m³)
S 1 S 2 S 3 S 4 S 5 S 6 S 7 S 8 Ave
4.5 2150 2158 2107 2115 2107 2076 2101 2104 2115
5.5 2052 2164 2123 2109 2126 2131 2161 2115 2123
6.5 2134 2097 2180 2177 2183 2092 2137 2126 2141
7.5 2150 2197 2153 2191 2153 2108 2147 2142 2155
Note, S= Specimen
Table 5.13: Stiffness and Strength Values
of CBEMs with Varying Emulsion Content
Bitumen Emulsion
Content (%)
ITSM (MPa) ITS (kPa)
Dry Wet Dry Wet
4.5 2325 497 424.70 124.97
4.5 1432 466 310.06 116.89
4.5 2028 475 336.69 129.98
4.5 1795 559 316.94 108.32
5.5 1804 596 299.09 148.03
5.5 2466 535 336.31 145.32
5.5 2488 695 415.67 142.61
5.5 2473 681 351.12 177.08
6.5 1791 655 438.56 154.68
6.5 2675 762 454.21 198.28
6.5 2018 666 407.90 156.78
6.5 1879 663 399.87 187.75
7.5 1484 840 425.34 220.25
7.5 1405 751 466.66 251.78
7.5 1856 669 362.37 196.77
Table 5.14: Dry and Wet Strength/Stiffness Ratio
Values for CBEMs with Varying Emulsion Content
Bitumen
Emulsion Content
(%)
ITSMR
(%)
ITSR
(%)
4.5 26.3 34.6
5.5 27.1 43.7
6 30.0 43.0
6.5 32.8 41.0
7.5 45.2 53.2
Chapter 5 Cold Bitumen Emulsion Mix Design and Initial Investigation on its Mechanical Performance
155
Figure 5.16: Strength/ Stiffness Characteristics of Cold Recycled Bitumen
Emulsion Mixtures with Varying Bitumen Emulsion Content
Figure 5.17: Dry and Wet Strength/Stiffness Ratios
CBEMs with Varying Bitumen Emulsion Content
Figure 5.18: Mix Proportion for the
Cold Bitumen Emulsion Mixture (CBEM)
0.0
50.0
100.0
150.0
200.0
250.0
300.0
350.0
400.0
450.0
0.0
500.0
1000.0
1500.0
2000.0
2500.0
4 5 6 7 8
IT
S (
kP
a)
IT
SM
(M
Pa)
Emulsion Content (%)ITSM (MPa) Dry ITSM (MPa) Wet ITS (kPa) Dry ITS (kPa) Wet
0.0
10.0
20.0
30.0
40.0
50.0
60.0
4 5 6 7 8
Rati
o (
%)
Emulsion Content (%)
ITSMR (%) ITSR (%)
Chapter 5 Cold Bitumen Emulsion Mix Design and Initial Investigation on its Mechanical Performance
156
5.13 Initial Exploration of Mechanical Properties of the Designed Cold
Bituminous Emulsion Mixtures (CBEMs)
A number of investigations to evaluate the characteristics of the CBEMs due to the
effect of certain factors which could adversely affect the performance of the
produced mixtures were investigated. The following sections detail the findings of
these investigations. The RAP with residual bitumen of 20dmm was used here,
except where otherwise stated. While other parameters remained as for the mix
design stage, it is worth noting that conditioning of the specimens for water
susceptibility was done by first vacuum saturating the specimens at a pressure of
about 140mbar for about 10minutes followed by soaking in water at a
temperature 25⁰C for 24hrs as suggested by Jenkins (2000) and Sunarjono
(2008). This was considered helpful as most of the virgin aggregate CBEMs that
were later discussed in Section 5.13.4 had become very weak with stiffness
values in some cases just a little above 200MPa. All the mechanical tests were
conducted at 20⁰C on the NAT.
5.13.1 Determination of maximum density of CBEMs
Before any further investigations were made beyond this point, the maximum
(Rice) densities of the mixtures (RAP and Virgin aggregate alike) were determined
after BSEN12697-5:2002. This was needed in order to properly account for the
void content of the produced mixtures henceforth. Tables 5.15 (a) and (b) detail
the maximum density for the RAP and Virgin Aggregate CBEMs respectively.
5.13.2 The Effect of mixing time on the compactability and stiffness
properties of CBEMs
As earlier mentioned in this chapter the need to change to the Sun and Planet
Mixer was inevitable due to the inability of the Hobart Mixer to cope with the
gradation for the design mix. The Sun and Planet Mixer was thus investigated for
the appropriate mixing times for both the pre-wetting water and bitumen
emulsion addition to the mix. Although temperature could be controlled on this
mixer, it has only one speed. The experience of Ibrahim (1998) on this mixer
with similar mixtures gave a head start for the investigation. He generally used a
mixing time of 120s for pre-wetting water while he used times ranging from 90s
to 120s for mixing bitumen emulsion (depending on the nature of the emulsion).
Therefore, pre-wetting water mixing times paired with the following corresponding
mixing times for bitumen emulsion were used respectively: 90s, 90s; 90s, 120s
and; 120s, 120s.
The pre-wetting water was added to the mix from the onset of mixing. After
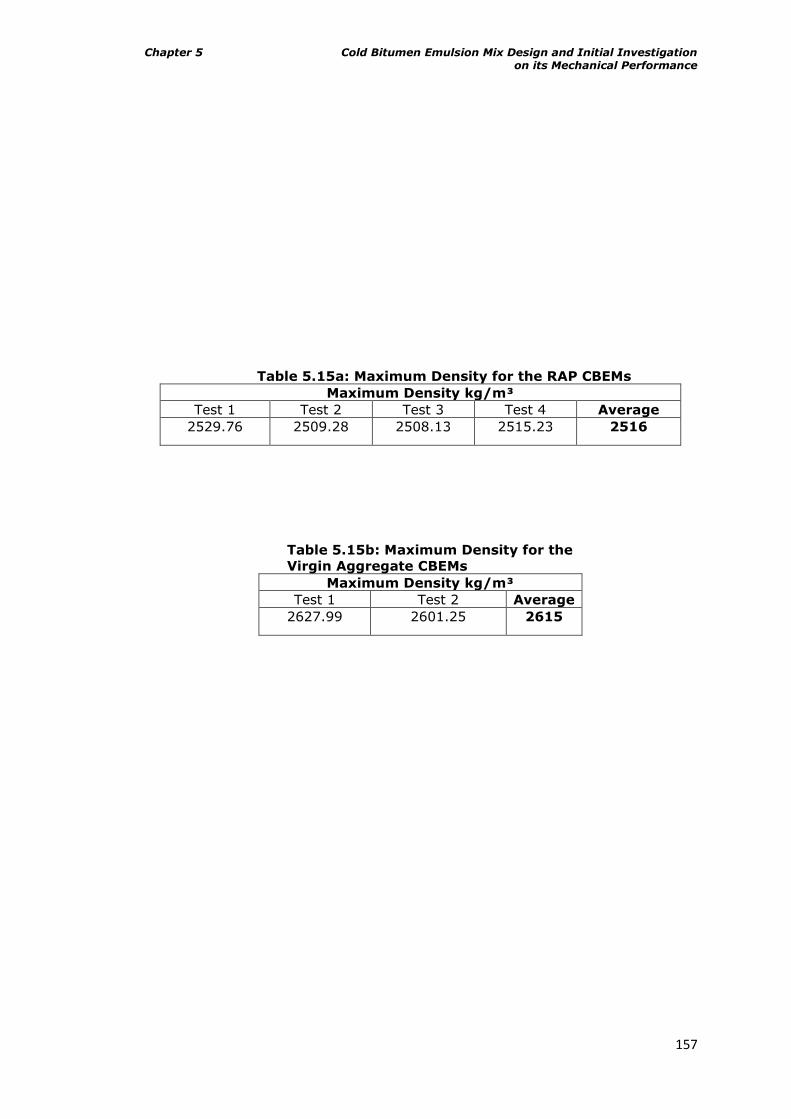
Chapter 5 Cold Bitumen Emulsion Mix Design and Initial Investigation on its Mechanical Performance
157
Table 5.15a: Maximum Density for the RAP CBEMs
Maximum Density kg/m³
Test 1 Test 2 Test 3 Test 4 Average
2529.76 2509.28 2508.13 2515.23 2516
Table 5.15b: Maximum Density for the
Virgin Aggregate CBEMs
Maximum Density kg/m³
Test 1 Test 2 Average
2627.99 2601.25 2615
Chapter 5 Cold Bitumen Emulsion Mix Design and Initial Investigation on its Mechanical Performance
158
mixing halfway into each specified time (i.e. pre-wetting water and bitumen
emulsion mixing times) the mixer was stopped to allow for manual stirring using
spatulas before the mixing was completed. This further ensured uniform
distribution of the fluids.
Except for mixing time, and the target number of gyrations of 200, the cylindrical
cores were produced and cured similarly as in Section 5.11 of this chapter. Figure
5.19 and Table 5.16 both detail the results of the investigation. The results
indicate that the mixing time pair of 120s, 120s for pre-wetting water and
bitumen emulsion respectively gave the best stiffness response and the lowest air
void content whether in dry (cured) condition or wet condition. The pair of 90s,
90s for mixing the pre-wetting water and bitumen emulsion with aggregates gave
the lowest stiffness value and highest air voids content. However the moisture
loss trend throughout the range upon curing was observed to be similar.
The difference in stiffness values for the 90s, 90s pair and the 90s, 120s pair was
quite large i.e. 568MPa (which also represents a 36.1% improvement over the
stiffness of the former) compared to that between 90s, 120s pair and the 120s,
120s pair, i.e. 142MPa (which similarly represents a 6.6% improvement over the
stiffness of the former). While the results indicate that a paired mixing time of
90s, 90s for both pre-wetting water and bitumen emulsion respectively was
inadequate, it was obvious that increasing the paired mixing time beyond 120s,
120s might not be beneficial as the difference between the stiffness values at this
point and those of the 90s, 120s pair were not that significant. It is thus assumed
that the 120s, 120s pair is the optimum (or very close to the optimum value).
Going beyond this level could have induced emulsion breaking and subsequent
inhibition of proper packing during compaction.
This investigation shows that CBEMs are very sensitive materials as a difference
of 30s during mixing could make a marked difference to their stiffness and
compactability properties especially in this case where the breaking of the
bitumen emulsion is a physico-chemical process. Although this is fully
investigated using statistical tools later in Chapter 6 of this thesis, there is an
indication here that stiffness is influenced by air voids content. As air voids
increase, stiffness modulus decreases and vice versa. The investigation summarily
informs of the need to apply just enough mixing time for both the pre-wetting
water and bitumen emulsion in order to enhance the performance of CBEMs. At
such an optimum level, it is believed that the materials have been properly coated
(optimum degree of aggregate wetness achieved) and also the emulsion in the
mix has not started breaking which are desirable for performance.
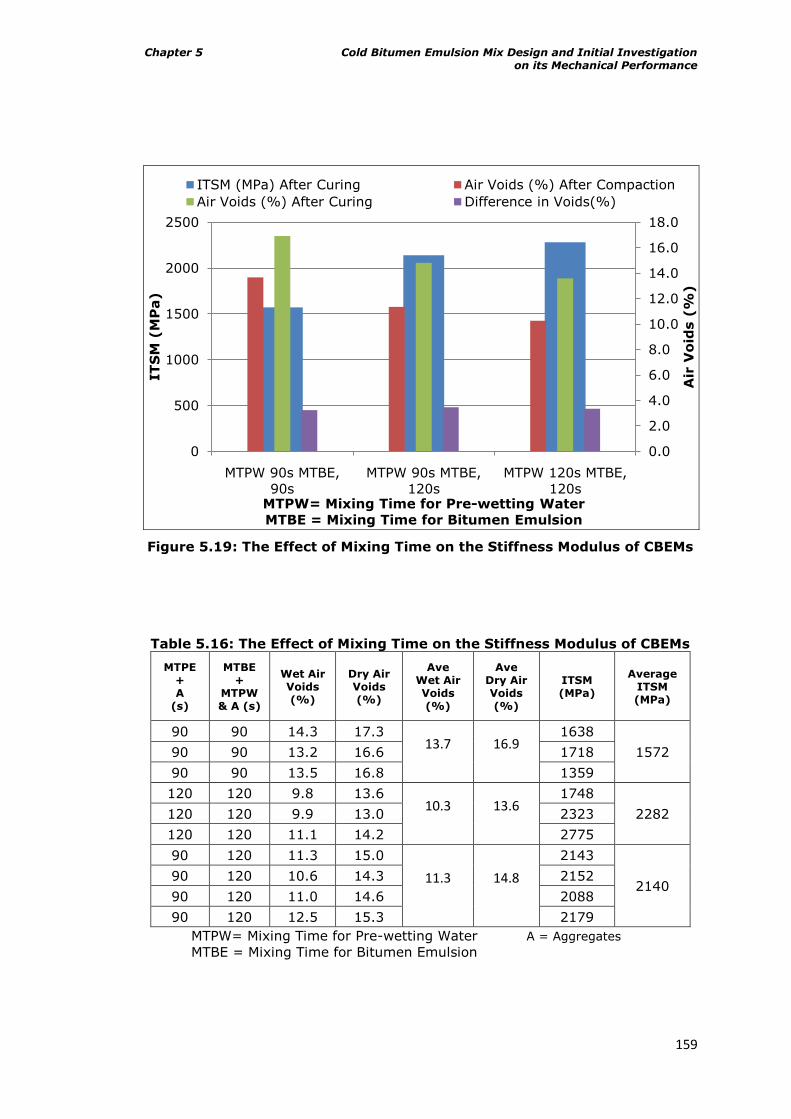
Chapter 5 Cold Bitumen Emulsion Mix Design and Initial Investigation on its Mechanical Performance
159
Figure 5.19: The Effect of Mixing Time on the Stiffness Modulus of CBEMs
Table 5.16: The Effect of Mixing Time on the Stiffness Modulus of CBEMs
MTPE + A
(s)
MTBE +
MTPW & A (s)
Wet Air Voids (%)
Dry Air Voids (%)
Ave Wet Air Voids (%)
Ave Dry Air Voids (%)
ITSM (MPa)
Average ITSM (MPa)
90 90 14.3 17.3 13.7 16.9
1638
1572 90 90 13.2 16.6 1718
90 90 13.5 16.8 1359
120 120 9.8 13.6 10.3 13.6
1748
2282 120 120 9.9 13.0 2323
120 120 11.1 14.2 2775
90 120 11.3 15.0
11.3 14.8
2143
2140 90 120 10.6 14.3 2152
90 120 11.0 14.6 2088
90 120 12.5 15.3 2179
MTPW= Mixing Time for Pre-wetting Water A = Aggregates
MTBE = Mixing Time for Bitumen Emulsion
0.0
2.0
4.0
6.0
8.0
10.0
12.0
14.0
16.0
18.0
0
500
1000
1500
2000
2500
MTPW 90s MTBE,
90s
MTPW 90s MTBE,
120s
MTPW 120s MTBE,
120s
Air
Vo
ids (
%)
IT
SM
(M
Pa)
MTPW= Mixing Time for Pre-wetting Water
MTBE = Mixing Time for Bitumen Emulsion
ITSM (MPa) After Curing Air Voids (%) After Compaction
Air Voids (%) After Curing Difference in Voids(%)
Chapter 5 Cold Bitumen Emulsion Mix Design and Initial Investigation on its Mechanical Performance
160
5.13.3 The effect of filler type, and mixing and compaction temperature
on compactability and stiffness properties of CBEMs
Up till this point in this study, only limestone filler was used due to the fact that it
was the only filler type that was available when the laboratory work started. Also,
mixing and compaction activities have both been carried out at 20⁰C (ambient
temperature) since temperature could not be controlled on the Hobart Mixer
which was used up till this point. However, replacement of the limestone filler
with granite as soon as it was made available was considered necessary as
granite fillers are always used for asphalt mixtures in Nigeria since they are
abundantly available. Similarly, introducing a slightly elevated temperature of
32⁰C for the mixing and compaction processes was thought necessary since the
average maximum air temperature for Ibadan a typical tropical City in Nigeria has
been selected for this research work, which is 32⁰C (BBC Weather, 2008). As
earlier noted, the Sun and Planet mixer had an advantage of temperature control
while in operation. It was envisaged that the introduction of these new measures
should simulate road pavement construction practice in Nigeria. Except for a fixed
target number of gyrations of 200 applied and adoption of a mixing time of 120s
for pre-wetting water and 120s for bitumen emulsion addition, all other
parameters used in the previous section remained the same here.
The graph in Figure 5.20 and details in Table 5.17 clearly indicate that the CBEMs
containing granite filler generally had higher dry stiffness properties than those
with limestone filler although the latter performed much better both in wet
stiffness and compactability properties. These observations were irrespective of
the compaction and mixing temperatures used. The CBEMs with limestone filler
demonstrated a good ITSMR with the observed values clearly above average
compared to those containing granite filler which had values generally below
average. This observation for ITSMR is in conformity with other researcher‟s
findings on the good anti-stripping properties of limestone filler in hot asphalt
mixtures (Airey et al, 2005). However, it is worth noting that irrespective of the
filler type used and the temperature of mixing and compaction, moisture loss was
similar just as observed in the preceding section. This implies that the degree of
curing is not affected by filler type in the CBEMs studied.
Similarly, the effect of mixing and compaction temperature on the compactability
and stiffness responses of CBEMs irrespective of the filler type used were studied
just as indicated in Figure 5.20 and the accompanying Table 5.17. Mixing and
compaction of CBEMs at 32⁰C gave better responses in stiffness and
compactability compared to 20⁰C. For example, the granite filler CBEMs prepared
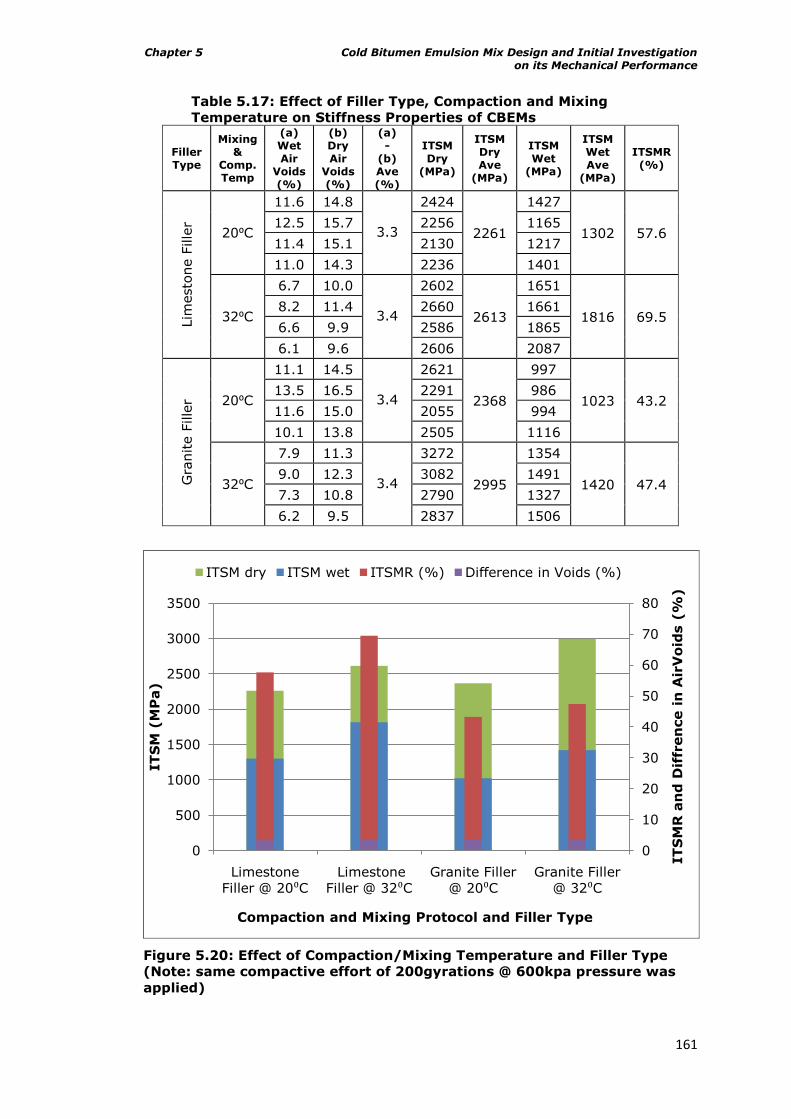
Chapter 5 Cold Bitumen Emulsion Mix Design and Initial Investigation on its Mechanical Performance
161
Table 5.17: Effect of Filler Type, Compaction and Mixing
Temperature on Stiffness Properties of CBEMs
Filler Type
Mixing &
Comp. Temp
(a) Wet Air
Voids (%)
(b) Dry Air
Voids (%)
(a) -
(b) Ave (%)
ITSM Dry
(MPa)
ITSM Dry Ave
(MPa)
ITSM Wet
(MPa)
ITSM Wet Ave
(MPa)
ITSMR (%)
Lim
esto
ne F
ille
r
20⁰C
11.6 14.8
3.3
2424
2261
1427
1302 57.6 12.5 15.7 2256 1165
11.4 15.1 2130 1217
11.0 14.3 2236 1401
32⁰C
6.7 10.0
3.4
2602
2613
1651
1816 69.5 8.2 11.4 2660 1661
6.6 9.9 2586 1865
6.1 9.6 2606 2087
Gra
nite F
ille
r 20⁰C
11.1 14.5
3.4
2621
2368
997
1023 43.2 13.5 16.5 2291 986
11.6 15.0 2055 994
10.1 13.8 2505 1116
32⁰C
7.9 11.3
3.4
3272
2995
1354
1420 47.4 9.0 12.3 3082 1491
7.3 10.8 2790 1327
6.2 9.5 2837 1506
Figure 5.20: Effect of Compaction/Mixing Temperature and Filler Type
(Note: same compactive effort of 200gyrations @ 600kpa pressure was
applied)
0
10
20
30
40
50
60
70
80
0
500
1000
1500
2000
2500
3000
3500
Limestone
Filler @ 20⁰CLimestone
Filler @ 32⁰CGranite Filler
@ 20⁰CGranite Filler
@ 32⁰C
IT
SM
R a
nd
Dif
fren
ce i
n A
irV
oid
s (
%)
IT
SM
(M
Pa)
Compaction and Mixing Protocol and Filler Type
ITSM dry ITSM wet ITSMR (%) Difference in Voids (%)
Chapter 5 Cold Bitumen Emulsion Mix Design and Initial Investigation on its Mechanical Performance
162
at 32⁰C gave improvements of 26.5%, 38.8% and 9.7% for dry stiffness modulus,
wet stiffness modulus and ITSMR values respectively over those prepared at 20⁰C.
The observed values for limestone filler CBEMs were similar as improvements of
15.6%, 39.5% and 11.6% for dry stiffness modulus, wet stiffness modulus and
ITSMR values respectively were noted for those prepared at 32⁰C over those
prepared at 20⁰C. Irrespective of the temperature of mixing and compaction,
moisture loss was similar just as observed in the preceding section. This also
implies that the curing protocol used here was not affected by the temperature at
which the CBEMs studied were prepared.
These performances were also observed for compactability of the CBEMs although
a reduction here implies enhancement. For limestone filler CBEMs there were
reductions of 40.9% and 31.6% reduction in wet and dry air voids contents
respectively for those CBEMs prepared at 32⁰C compared to those at 20⁰C. In the
case of granite filler CBEMs, the reductions observed were 38.8% and 31.0%
reduction in wet and dry air voids contents respectively for those CBEMs prepared
at 32⁰C compared to those at 20⁰C. These reductions could have been a result of
the residual bitumen in the bitumen emulsion becoming less viscous at 32⁰C
compared to 20⁰C as noted in section 5.5.1 of this chapter. Apart from enhancing
the lubricating effect of the bitumen emulsion which subsequently facilitates good
packing of the substrates (aggregates), it is also believed that at such
temperature, the residual bitumen in the RAP is getting excited (active) and
possibly rejuvenated by the fairly soft residual bitumen in the emulsion. Although
the extent of this possible rejuvenation cannot be ascertained, Karlsson (2002)
observed in his work that, diffusion which is enhanced by temperature is one of
the key factors that facilitate the rejuvenation of aged bituminous binders.
Possible changes in the volumetrics which subsequently enhanced compactability
of the mixtures could also have been responsible for these observations.
Subsequent to these observations, the decision to use granite filler for producing
CBEMs was adopted for the detailed investigation reported in Chapter 6 in order
to properly represent what obtains in the road construction industry in Nigeria
although it was obvious from this study that limestone fillers performed better.
Also these investigations showed that slightly elevated temperature of 32⁰C for
mixing and the compaction of CBEMs resulted in better mixtures compared to
those at 20⁰C. This is expected to be a plus for cold recycling practice if adopted
in a hot tropical country such as Nigeria. It similarly gives an indication that it is
beneficial if such mixtures are prepared and laid at such temperatures in the
temperate climates where cold recycling is already being practiced.
Chapter 5 Cold Bitumen Emulsion Mix Design and Initial Investigation on its Mechanical Performance
163
5.13.4 The effect of applied compactive effort on stiffness properties of
CBEMs
CBEMs have been observed by researchers (Ebels, 2008; Ibrahim, 2008; Jenkins,
2000; Sunarjono, 2008; Thanaya, 2003; and Twagira, 2010) as materials that are
difficult to compact compared to hot mixtures. These researchers are however of
the opinion that when either the pressure or the gyration angle are increased
individually or combined, the specimen reaches the desired density quicker.
However, there is the possibility that some other important properties of the
mixture could have been compromised in the process. An effort was thus made to
study the effect of changing these two parameters on the stiffness (wet and dry)
of the CBEMs. Along with CBEMs containing RAPs with residual binders of 20dmm
penetration, the virgin aggregate mixture was studied here. While every other
parameter holds for the virgin aggregate mixture, the aggregate proportion
changed to 95% virgin aggregate and 5% filler.
It is worth restating here that the following parameters have been used on the
Cooper Research Gyratory Compactor up to this point:
Pressure – 600kPa
Gyration angle – 1.25⁰
Rate of Gyration - 30 rev/min
Mould Size – 100mm diameter
Target Number of Gyration – 50 (for design stage), 200
A pressure of 800kPa (maximum attainable) and gyration angles of 1.5⁰ and 2.0⁰
were thus explored along with those previously used. The effect of similar
compactive effort on the stiffness and moisture susceptibility of CBEMs are shown
in Figure 5.21 and Table 5.18. From Figure 5.21, it is obvious that the virgin
aggregate CBEMs were only able to attain better ITSMdry values than the RAP
CBEMs at a greater angle of gyration (1.5⁰) and later at a higher compactive
pressure (800kPa). Irrespective of the property of the compactive effort (angle of
gyration and pressure), the RAP CBEMs had better ITSMwet which is most desired
for pavement materials being a major indicator of durability. This logically
enhanced the ITSMR of the RAP CBEMs, almost doubling that of the virgin
aggregate CBEMs at some points. Similarly, the result shows the superior positive
effect of compaction at 600kPa and 1.25⁰ on the ITSMR over those of higher
compactive effort (higher angle of gyration and pressure). More importantly,
having been treated similarly, the RAP CBEMs had lower void content than the
virgin aggregate CBEMs. Low void content (porosity) has been widely regarded as
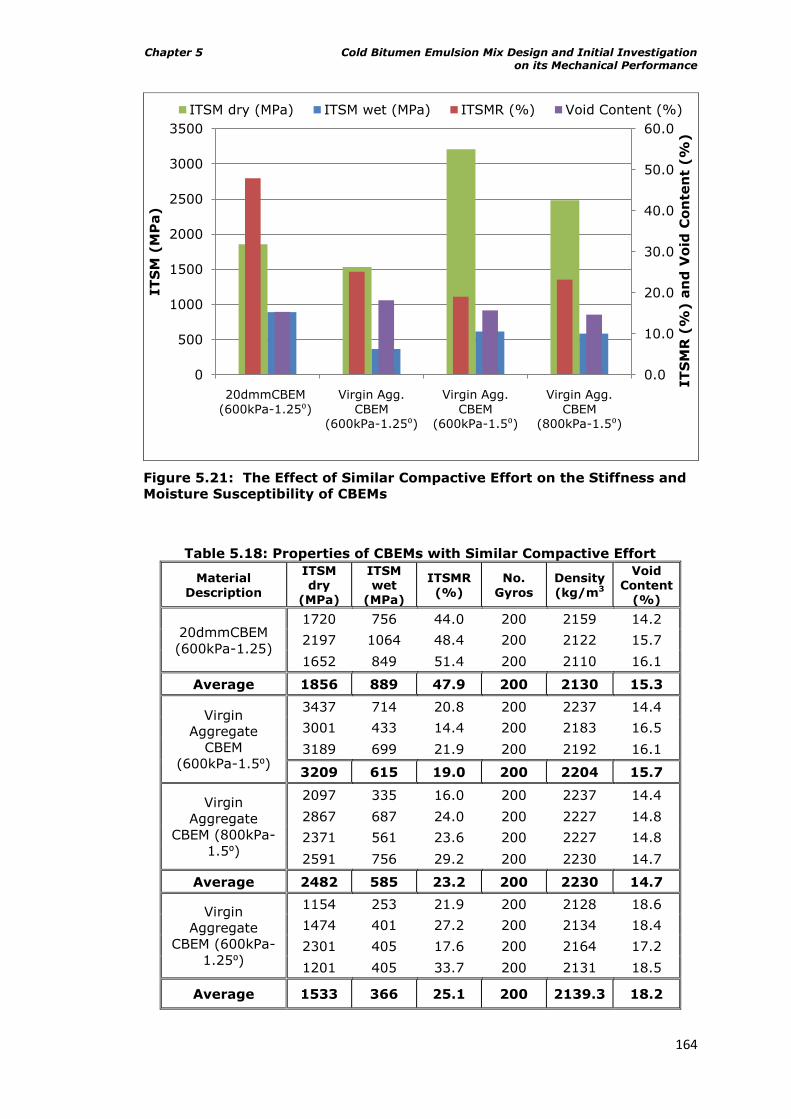
Chapter 5 Cold Bitumen Emulsion Mix Design and Initial Investigation on its Mechanical Performance
164
Figure 5.21: The Effect of Similar Compactive Effort on the Stiffness and
Moisture Susceptibility of CBEMs
Table 5.18: Properties of CBEMs with Similar Compactive Effort
Material
Description
ITSM dry
(MPa)
ITSM wet
(MPa)
ITSMR
(%)
No.
Gyros
Density
(kg/m3
Void Content
(%)
20dmmCBEM
(600kPa-1.25)
1720 756 44.0 200 2159 14.2
2197 1064 48.4 200 2122 15.7
1652 849 51.4 200 2110 16.1
Average 1856 889 47.9 200 2130 15.3
Virgin
Aggregate
CBEM
(600kPa-1.5⁰)
3437 714 20.8 200 2237 14.4
3001 433 14.4 200 2183 16.5
3189 699 21.9 200 2192 16.1
3209 615 19.0 200 2204 15.7
Virgin
Aggregate
CBEM (800kPa-
1.5⁰)
2097 335 16.0 200 2237 14.4
2867 687 24.0 200 2227 14.8
2371 561 23.6 200 2227 14.8
2591 756 29.2 200 2230 14.7
Average 2482 585 23.2 200 2230 14.7
Virgin
Aggregate
CBEM (600kPa-
1.25⁰)
1154 253 21.9 200 2128 18.6
1474 401 27.2 200 2134 18.4
2301 405 17.6 200 2164 17.2
1201 405 33.7 200 2131 18.5
Average 1533 366 25.1 200 2139.3 18.2
0.0
10.0
20.0
30.0
40.0
50.0
60.0
0
500
1000
1500
2000
2500
3000
3500
20dmmCBEM
(600kPa-1.25⁰) Virgin Agg.
CBEM (600kPa-1.25⁰)
Virgin Agg.
CBEM (600kPa-1.5⁰)
Virgin Agg.
CBEM (800kPa-1.5⁰)
IT
SM
R (
%) a
nd
Vo
id C
on
ten
t (%
)
IT
SM
(M
Pa)
ITSM dry (MPa) ITSM wet (MPa) ITSMR (%) Void Content (%)
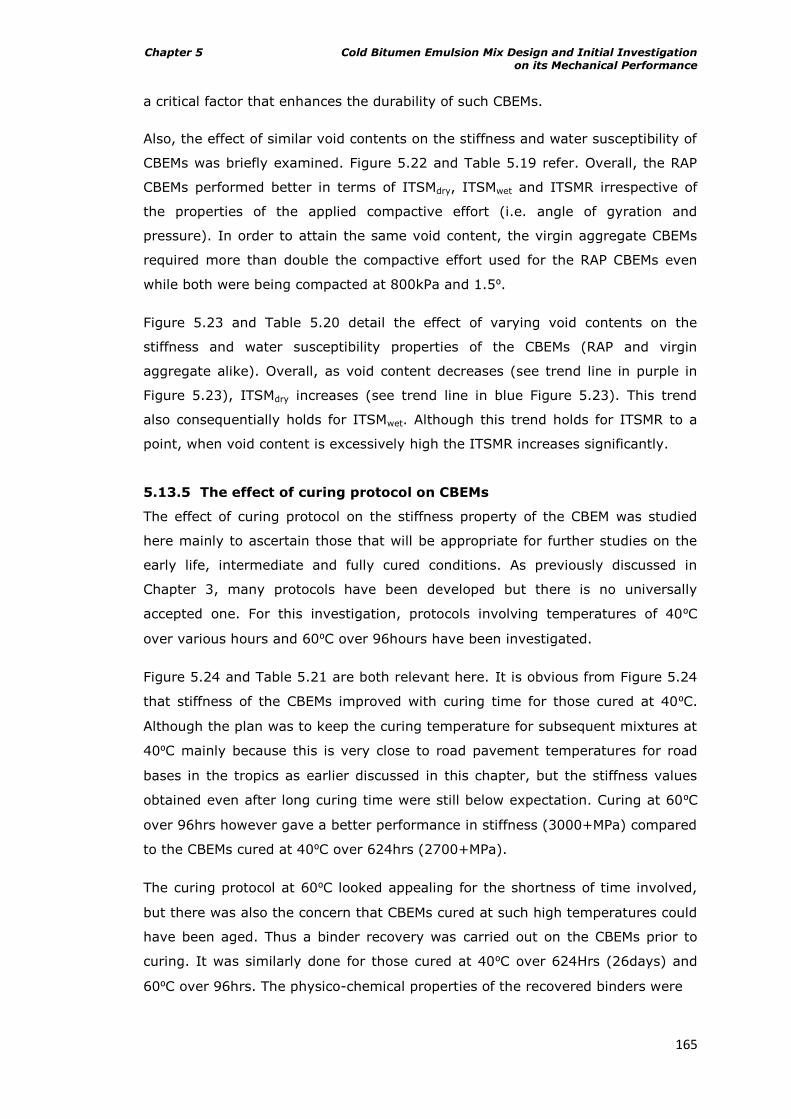
Chapter 5 Cold Bitumen Emulsion Mix Design and Initial Investigation on its Mechanical Performance
165
a critical factor that enhances the durability of such CBEMs.
Also, the effect of similar void contents on the stiffness and water susceptibility of
CBEMs was briefly examined. Figure 5.22 and Table 5.19 refer. Overall, the RAP
CBEMs performed better in terms of ITSMdry, ITSMwet and ITSMR irrespective of
the properties of the applied compactive effort (i.e. angle of gyration and
pressure). In order to attain the same void content, the virgin aggregate CBEMs
required more than double the compactive effort used for the RAP CBEMs even
while both were being compacted at 800kPa and 1.5⁰.
Figure 5.23 and Table 5.20 detail the effect of varying void contents on the
stiffness and water susceptibility properties of the CBEMs (RAP and virgin
aggregate alike). Overall, as void content decreases (see trend line in purple in
Figure 5.23), ITSMdry increases (see trend line in blue Figure 5.23). This trend
also consequentially holds for ITSMwet. Although this trend holds for ITSMR to a
point, when void content is excessively high the ITSMR increases significantly.
5.13.5 The effect of curing protocol on CBEMs
The effect of curing protocol on the stiffness property of the CBEM was studied
here mainly to ascertain those that will be appropriate for further studies on the
early life, intermediate and fully cured conditions. As previously discussed in
Chapter 3, many protocols have been developed but there is no universally
accepted one. For this investigation, protocols involving temperatures of 40⁰C
over various hours and 60⁰C over 96hours have been investigated.
Figure 5.24 and Table 5.21 are both relevant here. It is obvious from Figure 5.24
that stiffness of the CBEMs improved with curing time for those cured at 40⁰C.
Although the plan was to keep the curing temperature for subsequent mixtures at
40⁰C mainly because this is very close to road pavement temperatures for road
bases in the tropics as earlier discussed in this chapter, but the stiffness values
obtained even after long curing time were still below expectation. Curing at 60⁰C
over 96hrs however gave a better performance in stiffness (3000+MPa) compared
to the CBEMs cured at 40⁰C over 624hrs (2700+MPa).
The curing protocol at 60⁰C looked appealing for the shortness of time involved,
but there was also the concern that CBEMs cured at such high temperatures could
have been aged. Thus a binder recovery was carried out on the CBEMs prior to
curing. It was similarly done for those cured at 40⁰C over 624Hrs (26days) and
60⁰C over 96hrs. The physico-chemical properties of the recovered binders were
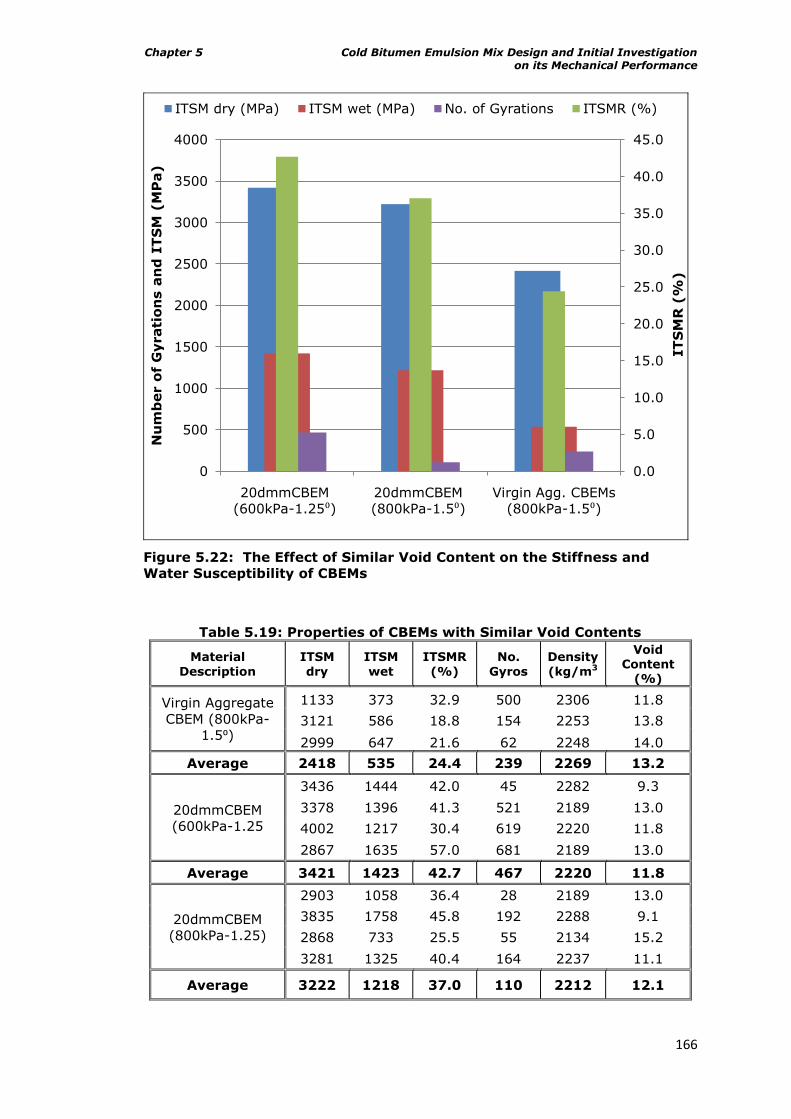
Chapter 5 Cold Bitumen Emulsion Mix Design and Initial Investigation on its Mechanical Performance
166
Figure 5.22: The Effect of Similar Void Content on the Stiffness and
Water Susceptibility of CBEMs
Table 5.19: Properties of CBEMs with Similar Void Contents
Material
Description
ITSM
dry
ITSM
wet
ITSMR
(%)
No.
Gyros
Density
(kg/m3
Void Content
(%)
Virgin Aggregate
CBEM (800kPa-
1.5⁰)
1133 373 32.9 500 2306 11.8
3121 586 18.8 154 2253 13.8
2999 647 21.6 62 2248 14.0
Average 2418 535 24.4 239 2269 13.2
20dmmCBEM
(600kPa-1.25
3436 1444 42.0 45 2282 9.3
3378 1396 41.3 521 2189 13.0
4002 1217 30.4 619 2220 11.8
2867 1635 57.0 681 2189 13.0
Average 3421 1423 42.7 467 2220 11.8
20dmmCBEM
(800kPa-1.25)
2903 1058 36.4 28 2189 13.0
3835 1758 45.8 192 2288 9.1
2868 733 25.5 55 2134 15.2
3281 1325 40.4 164 2237 11.1
Average 3222 1218 37.0 110 2212 12.1
0.0
5.0
10.0
15.0
20.0
25.0
30.0
35.0
40.0
45.0
0
500
1000
1500
2000
2500
3000
3500
4000
20dmmCBEM
(600kPa-1.25⁰) 20dmmCBEM
(800kPa-1.5⁰) Virgin Agg. CBEMs
(800kPa-1.5⁰)
IT
SM
R (
%)
Nu
mb
er o
f G
yrati
on
s a
nd
IT
SM
(M
Pa)
ITSM dry (MPa) ITSM wet (MPa) No. of Gyrations ITSMR (%)
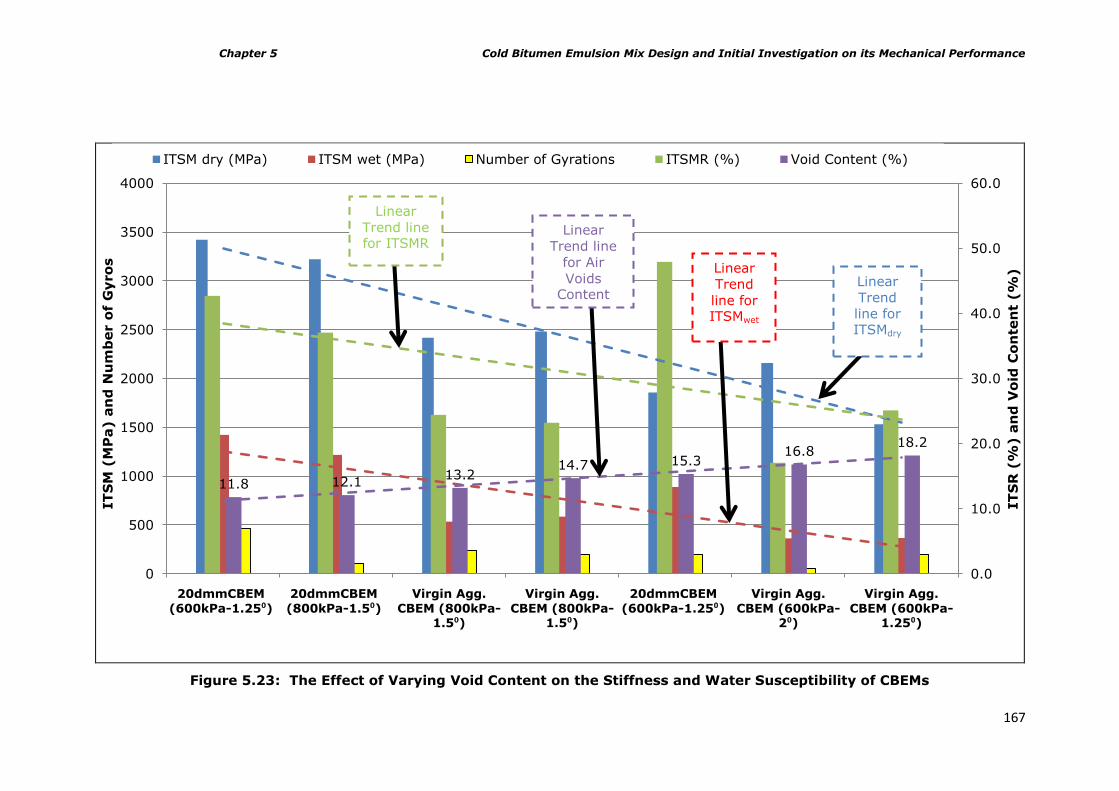
Chapter 5 Cold Bitumen Emulsion Mix Design and Initial Investigation on its Mechanical Performance
167
Figure 5.23: The Effect of Varying Void Content on the Stiffness and Water Susceptibility of CBEMs
11.8 12.113.2
14.7 15.316.8
18.2
0.0
10.0
20.0
30.0
40.0
50.0
60.0
0
500
1000
1500
2000
2500
3000
3500
4000
20dmmCBEM
(600kPa-1.25⁰)
20dmmCBEM
(800kPa-1.5⁰)
Virgin Agg.
CBEM (800kPa-1.5⁰)
Virgin Agg.
CBEM (800kPa-1.5⁰)
20dmmCBEM
(600kPa-1.25⁰)
Virgin Agg.
CBEM (600kPa-2⁰)
Virgin Agg.
CBEM (600kPa-1.25⁰)
IT
SR
(%
) a
nd
Vo
id C
on
ten
t (%
)
IT
SM
(M
Pa) a
nd
Nu
mb
er o
f G
yro
s
ITSM dry (MPa) ITSM wet (MPa) Number of Gyrations ITSMR (%) Void Content (%)
Linear
Trend line for ITSMR
Linear
Trend line
for Air
Voids Content
Linear
Trend
line for ITSMwet
Linear
Trend
line for ITSMdry
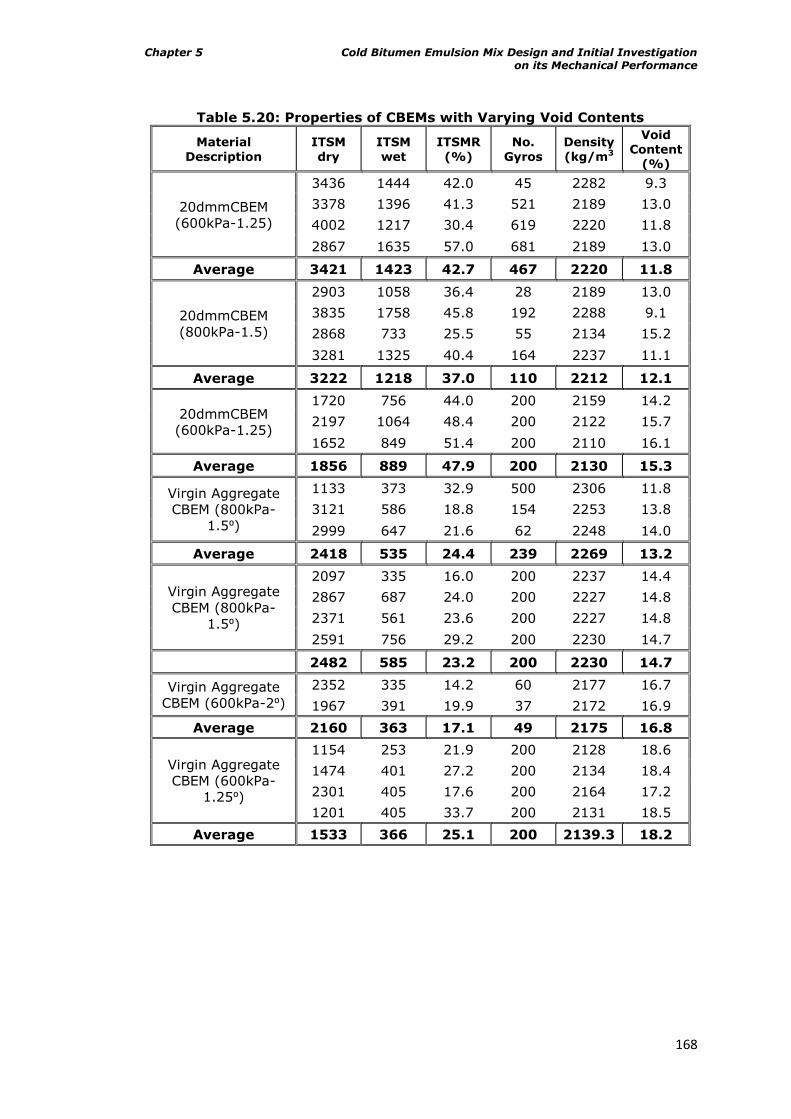
Chapter 5 Cold Bitumen Emulsion Mix Design and Initial Investigation on its Mechanical Performance
168
Table 5.20: Properties of CBEMs with Varying Void Contents
Material
Description
ITSM
dry
ITSM
wet
ITSMR
(%)
No.
Gyros
Density
(kg/m3
Void Content
(%)
20dmmCBEM
(600kPa-1.25)
3436 1444 42.0 45 2282 9.3
3378 1396 41.3 521 2189 13.0
4002 1217 30.4 619 2220 11.8
2867 1635 57.0 681 2189 13.0
Average 3421 1423 42.7 467 2220 11.8
20dmmCBEM
(800kPa-1.5)
2903 1058 36.4 28 2189 13.0
3835 1758 45.8 192 2288 9.1
2868 733 25.5 55 2134 15.2
3281 1325 40.4 164 2237 11.1
Average 3222 1218 37.0 110 2212 12.1
20dmmCBEM
(600kPa-1.25)
1720 756 44.0 200 2159 14.2
2197 1064 48.4 200 2122 15.7
1652 849 51.4 200 2110 16.1
Average 1856 889 47.9 200 2130 15.3
Virgin Aggregate
CBEM (800kPa-
1.5⁰)
1133 373 32.9 500 2306 11.8
3121 586 18.8 154 2253 13.8
2999 647 21.6 62 2248 14.0
Average 2418 535 24.4 239 2269 13.2
Virgin Aggregate
CBEM (800kPa-
1.5⁰)
2097 335 16.0 200 2237 14.4
2867 687 24.0 200 2227 14.8
2371 561 23.6 200 2227 14.8
2591 756 29.2 200 2230 14.7
2482 585 23.2 200 2230 14.7
Virgin Aggregate
CBEM (600kPa-2⁰)
2352 335 14.2 60 2177 16.7
1967 391 19.9 37 2172 16.9
Average 2160 363 17.1 49 2175 16.8
Virgin Aggregate
CBEM (600kPa-
1.25⁰)
1154 253 21.9 200 2128 18.6
1474 401 27.2 200 2134 18.4
2301 405 17.6 200 2164 17.2
1201 405 33.7 200 2131 18.5
Average 1533 366 25.1 200 2139.3 18.2
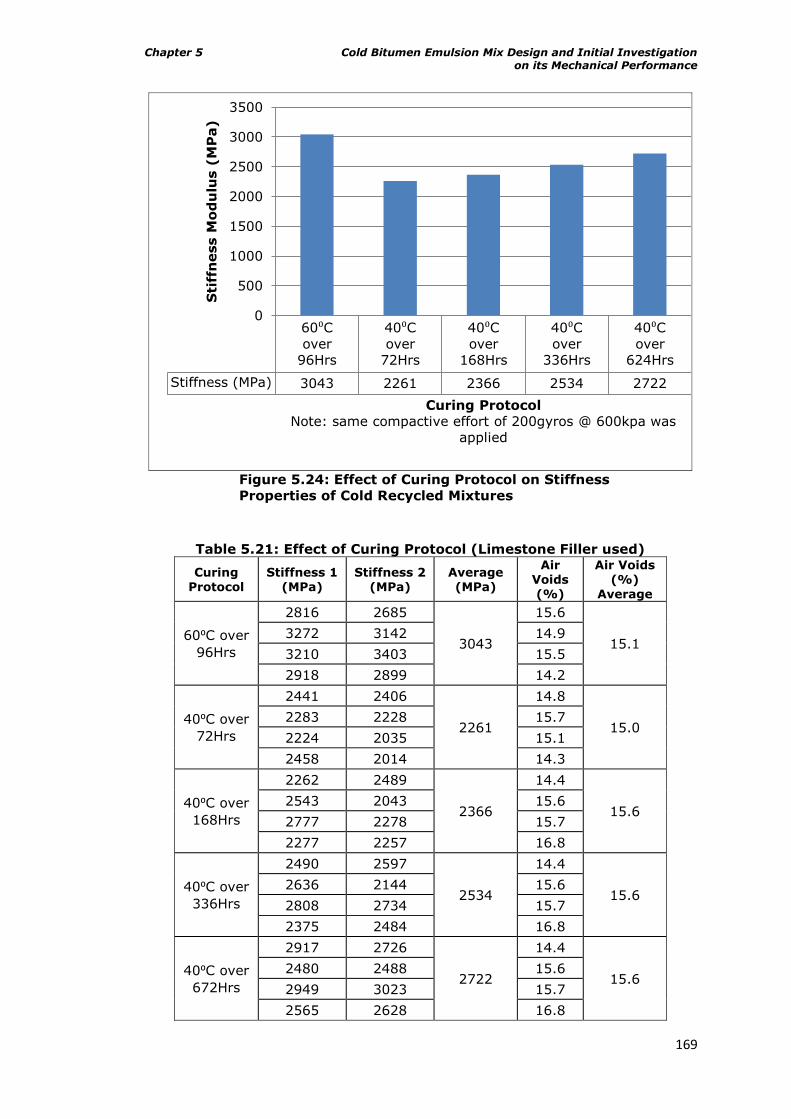
Chapter 5 Cold Bitumen Emulsion Mix Design and Initial Investigation on its Mechanical Performance
169
Figure 5.24: Effect of Curing Protocol on Stiffness
Properties of Cold Recycled Mixtures
Table 5.21: Effect of Curing Protocol (Limestone Filler used)
Curing Protocol
Stiffness 1 (MPa)
Stiffness 2 (MPa)
Average (MPa)
Air Voids (%)
Air Voids (%)
Average
60⁰C over
96Hrs
2816 2685
3043
15.6
15.1 3272 3142 14.9
3210 3403 15.5
2918 2899 14.2
40⁰C over
72Hrs
2441 2406
2261
14.8
15.0 2283 2228 15.7
2224 2035 15.1
2458 2014 14.3
40⁰C over
168Hrs
2262 2489
2366
14.4
15.6 2543 2043 15.6
2777 2278 15.7
2277 2257 16.8
40⁰C over
336Hrs
2490 2597
2534
14.4
15.6 2636 2144 15.6
2808 2734 15.7
2375 2484 16.8
40⁰C over
672Hrs
2917 2726
2722
14.4
15.6 2480 2488 15.6
2949 3023 15.7
2565 2628 16.8
60⁰C
over
96Hrs
40⁰C
over
72Hrs
40⁰C
over
168Hrs
40⁰C
over
336Hrs
40⁰C
over
624Hrs
Stiffness (MPa) 3043 2261 2366 2534 2722
0
500
1000
1500
2000
2500
3000
3500
Sti
ffn
ess M
od
ulu
s (
MP
a)
Curing Protocol
Note: same compactive effort of 200gyros @ 600kpa was
applied
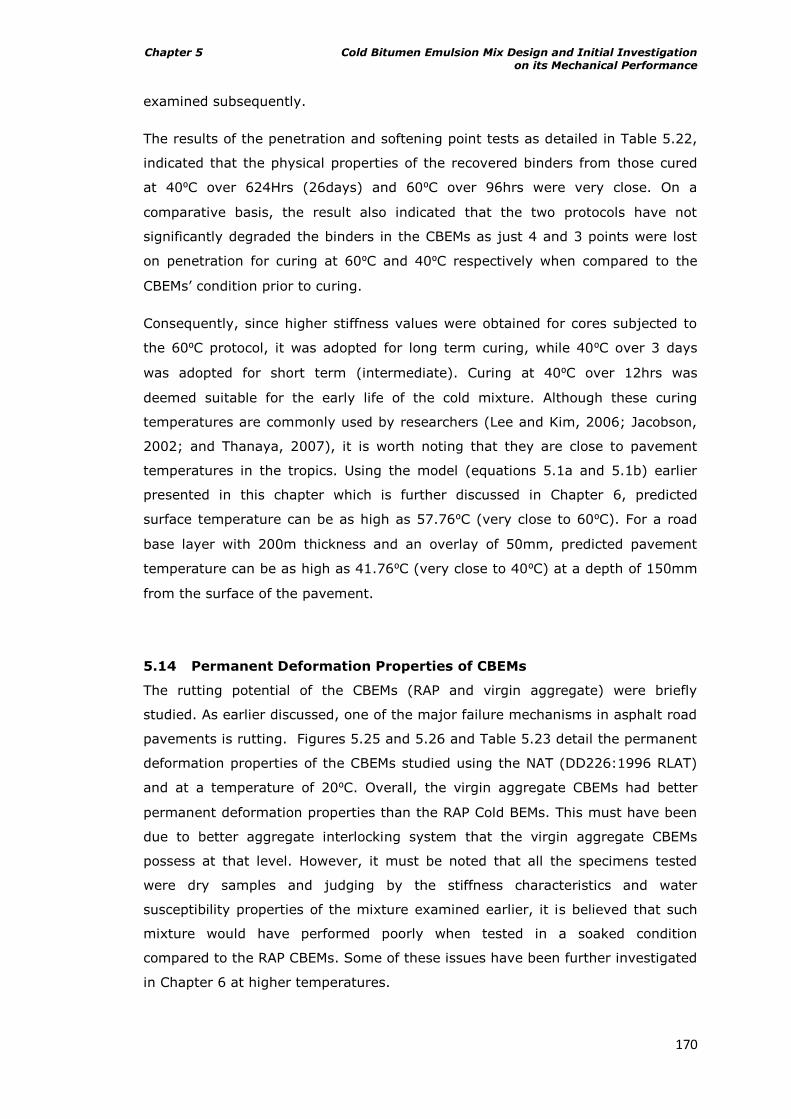
Chapter 5 Cold Bitumen Emulsion Mix Design and Initial Investigation on its Mechanical Performance
170
examined subsequently.
The results of the penetration and softening point tests as detailed in Table 5.22,
indicated that the physical properties of the recovered binders from those cured
at 40⁰C over 624Hrs (26days) and 60⁰C over 96hrs were very close. On a
comparative basis, the result also indicated that the two protocols have not
significantly degraded the binders in the CBEMs as just 4 and 3 points were lost
on penetration for curing at 60⁰C and 40⁰C respectively when compared to the
CBEMs‟ condition prior to curing.
Consequently, since higher stiffness values were obtained for cores subjected to
the 60⁰C protocol, it was adopted for long term curing, while 40⁰C over 3 days
was adopted for short term (intermediate). Curing at 40⁰C over 12hrs was
deemed suitable for the early life of the cold mixture. Although these curing
temperatures are commonly used by researchers (Lee and Kim, 2006; Jacobson,
2002; and Thanaya, 2007), it is worth noting that they are close to pavement
temperatures in the tropics. Using the model (equations 5.1a and 5.1b) earlier
presented in this chapter which is further discussed in Chapter 6, predicted
surface temperature can be as high as 57.76⁰C (very close to 60⁰C). For a road
base layer with 200m thickness and an overlay of 50mm, predicted pavement
temperature can be as high as 41.76⁰C (very close to 40⁰C) at a depth of 150mm
from the surface of the pavement.
5.14 Permanent Deformation Properties of CBEMs
The rutting potential of the CBEMs (RAP and virgin aggregate) were briefly
studied. As earlier discussed, one of the major failure mechanisms in asphalt road
pavements is rutting. Figures 5.25 and 5.26 and Table 5.23 detail the permanent
deformation properties of the CBEMs studied using the NAT (DD226:1996 RLAT)
and at a temperature of 20⁰C. Overall, the virgin aggregate CBEMs had better
permanent deformation properties than the RAP Cold BEMs. This must have been
due to better aggregate interlocking system that the virgin aggregate CBEMs
possess at that level. However, it must be noted that all the specimens tested
were dry samples and judging by the stiffness characteristics and water
susceptibility properties of the mixture examined earlier, it is believed that such
mixture would have performed poorly when tested in a soaked condition
compared to the RAP CBEMs. Some of these issues have been further investigated
in Chapter 6 at higher temperatures.
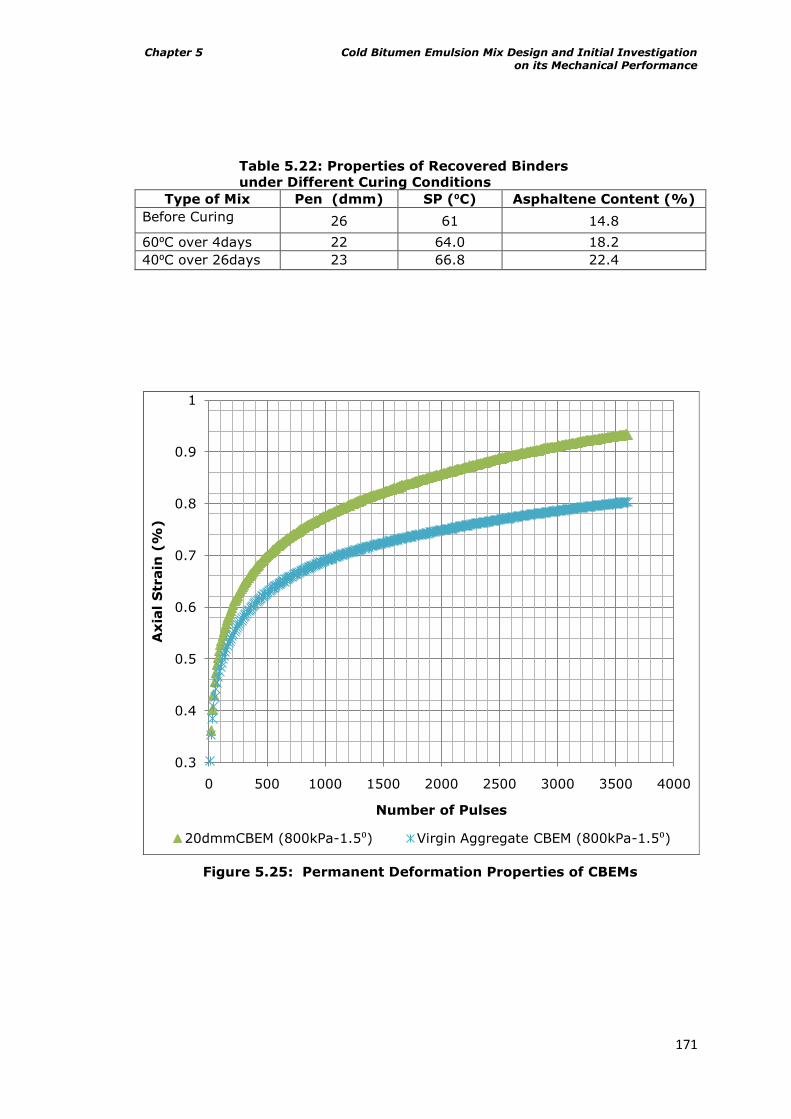
Chapter 5 Cold Bitumen Emulsion Mix Design and Initial Investigation on its Mechanical Performance
171
Table 5.22: Properties of Recovered Binders
under Different Curing Conditions
Type of Mix Pen (dmm) SP (⁰C) Asphaltene Content (%)
Before Curing 26 61 14.8
60⁰C over 4days 22 64.0 18.2
40⁰C over 26days 23 66.8 22.4
Figure 5.25: Permanent Deformation Properties of CBEMs
0.3
0.4
0.5
0.6
0.7
0.8
0.9
1
0 500 1000 1500 2000 2500 3000 3500 4000
Axia
l S
train
(%
)
Number of Pulses
20dmmCBEM (800kPa-1.5⁰) Virgin Aggregate CBEM (800kPa-1.5⁰)
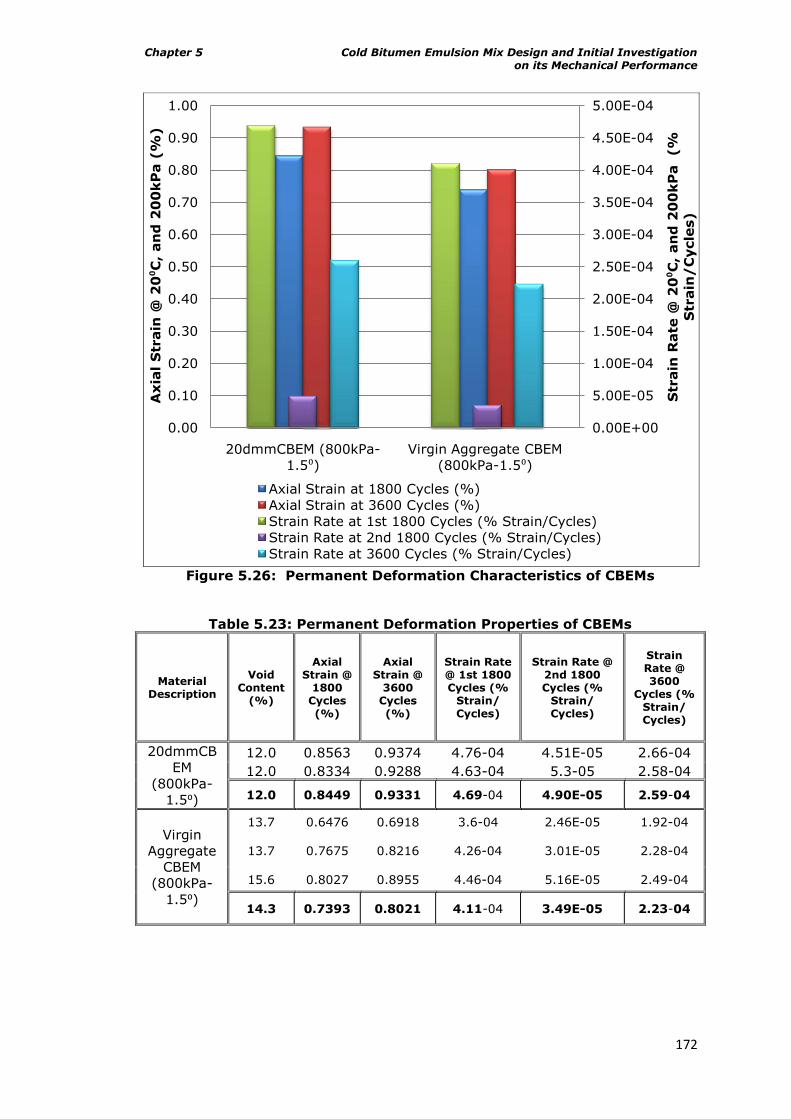
Chapter 5 Cold Bitumen Emulsion Mix Design and Initial Investigation on its Mechanical Performance
172
Figure 5.26: Permanent Deformation Characteristics of CBEMs
Table 5.23: Permanent Deformation Properties of CBEMs
Material Description
Void Content
(%)
Axial Strain @
1800 Cycles (%)
Axial Strain @
3600 Cycles (%)
Strain Rate @ 1st 1800 Cycles (%
Strain/ Cycles)
Strain Rate @ 2nd 1800 Cycles (%
Strain/ Cycles)
Strain Rate @ 3600
Cycles (% Strain/ Cycles)
20dmmCB
EM
(800kPa-
1.5⁰)
12.0 0.8563 0.9374 4.76-04 4.51E-05 2.66-04
12.0 0.8334 0.9288 4.63-04 5.3-05 2.58-04
12.0 0.8449 0.9331 4.69-04 4.90E-05 2.59-04
Virgin
Aggregate
CBEM
(800kPa-
1.5⁰)
13.7 0.6476 0.6918 3.6-04 2.46E-05 1.92-04
13.7 0.7675 0.8216 4.26-04 3.01E-05 2.28-04
15.6 0.8027 0.8955 4.46-04 5.16E-05 2.49-04
14.3 0.7393 0.8021 4.11-04 3.49E-05 2.23-04
0.00E+00
5.00E-05
1.00E-04
1.50E-04
2.00E-04
2.50E-04
3.00E-04
3.50E-04
4.00E-04
4.50E-04
5.00E-04
0.00
0.10
0.20
0.30
0.40
0.50
0.60
0.70
0.80
0.90
1.00
20dmmCBEM (800kPa-
1.5⁰) Virgin Aggregate CBEM
(800kPa-1.5⁰)
Str
ain
Rate
@ 2
0⁰C
, an
d 2
00
kP
a
(%
Str
ain
/C
ycle
s)
Axia
l S
train
@ 2
0⁰C
, an
d 2
00
kP
a (
%)
Axial Strain at 1800 Cycles (%)
Axial Strain at 3600 Cycles (%)
Strain Rate at 1st 1800 Cycles (% Strain/Cycles)
Strain Rate at 2nd 1800 Cycles (% Strain/Cycles)
Strain Rate at 3600 Cycles (% Strain/Cycles)
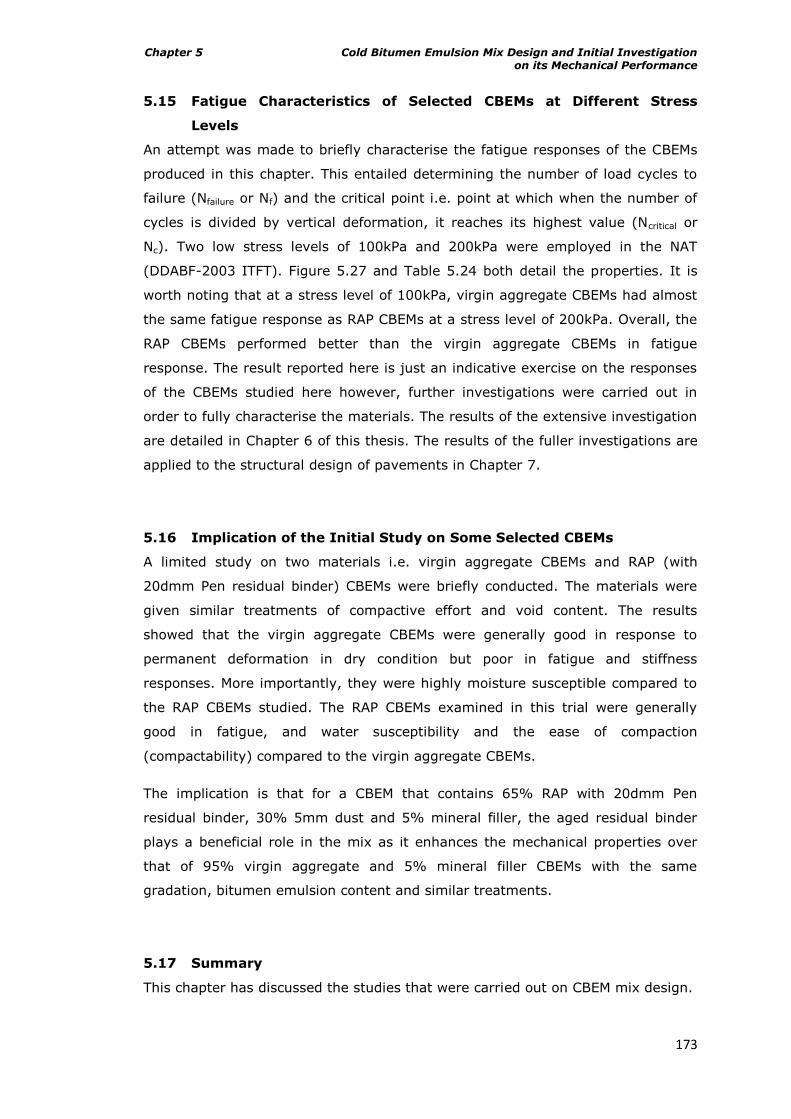
Chapter 5 Cold Bitumen Emulsion Mix Design and Initial Investigation on its Mechanical Performance
173
5.15 Fatigue Characteristics of Selected CBEMs at Different Stress
Levels
An attempt was made to briefly characterise the fatigue responses of the CBEMs
produced in this chapter. This entailed determining the number of load cycles to
failure (Nfailure or Nf) and the critical point i.e. point at which when the number of
cycles is divided by vertical deformation, it reaches its highest value (Ncritical or
Nc). Two low stress levels of 100kPa and 200kPa were employed in the NAT
(DDABF-2003 ITFT). Figure 5.27 and Table 5.24 both detail the properties. It is
worth noting that at a stress level of 100kPa, virgin aggregate CBEMs had almost
the same fatigue response as RAP CBEMs at a stress level of 200kPa. Overall, the
RAP CBEMs performed better than the virgin aggregate CBEMs in fatigue
response. The result reported here is just an indicative exercise on the responses
of the CBEMs studied here however, further investigations were carried out in
order to fully characterise the materials. The results of the extensive investigation
are detailed in Chapter 6 of this thesis. The results of the fuller investigations are
applied to the structural design of pavements in Chapter 7.
5.16 Implication of the Initial Study on Some Selected CBEMs
A limited study on two materials i.e. virgin aggregate CBEMs and RAP (with
20dmm Pen residual binder) CBEMs were briefly conducted. The materials were
given similar treatments of compactive effort and void content. The results
showed that the virgin aggregate CBEMs were generally good in response to
permanent deformation in dry condition but poor in fatigue and stiffness
responses. More importantly, they were highly moisture susceptible compared to
the RAP CBEMs studied. The RAP CBEMs examined in this trial were generally
good in fatigue, and water susceptibility and the ease of compaction
(compactability) compared to the virgin aggregate CBEMs.
The implication is that for a CBEM that contains 65% RAP with 20dmm Pen
residual binder, 30% 5mm dust and 5% mineral filler, the aged residual binder
plays a beneficial role in the mix as it enhances the mechanical properties over
that of 95% virgin aggregate and 5% mineral filler CBEMs with the same
gradation, bitumen emulsion content and similar treatments.
5.17 Summary
This chapter has discussed the studies that were carried out on CBEM mix design.
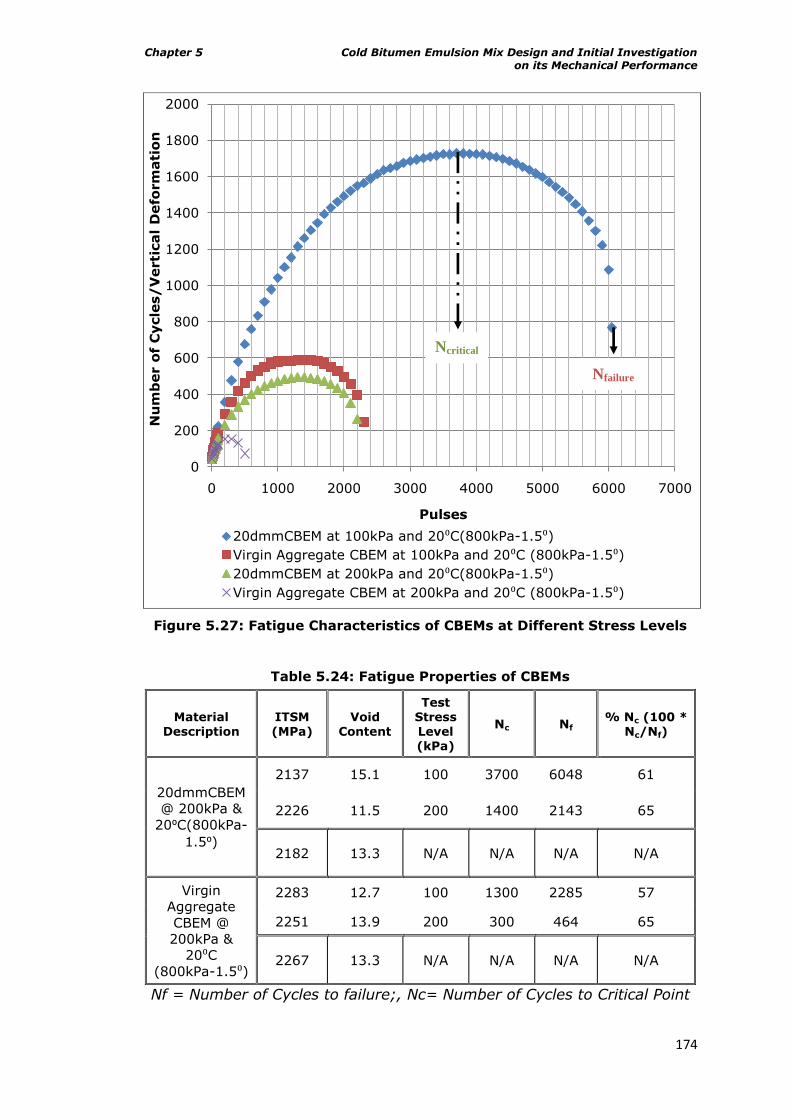
Chapter 5 Cold Bitumen Emulsion Mix Design and Initial Investigation on its Mechanical Performance
174
Figure 5.27: Fatigue Characteristics of CBEMs at Different Stress Levels
Table 5.24: Fatigue Properties of CBEMs
Nf = Number of Cycles to failure;, Nc= Number of Cycles to Critical Point
0
200
400
600
800
1000
1200
1400
1600
1800
2000
0 1000 2000 3000 4000 5000 6000 7000
Nu
mb
er o
f C
ycle
s/
Verti
cal
Defo
rm
ati
on
Pulses
20dmmCBEM at 100kPa and 20⁰C(800kPa-1.5⁰)
Virgin Aggregate CBEM at 100kPa and 20⁰C (800kPa-1.5⁰)
20dmmCBEM at 200kPa and 20⁰C(800kPa-1.5⁰)
Virgin Aggregate CBEM at 200kPa and 20⁰C (800kPa-1.5⁰)
Material Description
ITSM (MPa)
Void Content
Test Stress Level (kPa)
Nc Nf % Nc (100 *
Nc/Nf)
20dmmCBEM
@ 200kPa &
20⁰C(800kPa-
1.5⁰)
2137 15.1 100 3700 6048 61
2226 11.5 200 1400 2143 65
2182 13.3 N/A N/A N/A N/A
Virgin
Aggregate
CBEM @
200kPa &
20⁰C
(800kPa-1.5⁰)
2283 12.7 100 1300 2285 57
2251 13.9 200 300 464 65
2267 13.3 N/A N/A N/A N/A
Nfailure
Ncritical
Chapter 5 Cold Bitumen Emulsion Mix Design and Initial Investigation on its Mechanical Performance
175
RAP with residual bitumen of 20dmm penetration was used for the exercise. The
plan is to use this mix design for the manufacture of CBEMs containing RAPs with
varying degrees of severity of ageing. Also, a report on a limited investigation on
the mechanical properties of the CBEMs produced during the mix design was also
presented. The following general conclusions can be drawn from the studies:
Mix proportions of 65:30:5 for RAP, 5mm Dust and Filler respectively were
found suitable and were adopted for subsequent manufacture of CBEM
specimens. The RAP materials used for this mix design contained residual
bitumen with penetration value of 20dmm and granite virgin aggregates.
The Optimum Moisture Content and MDD values were found as 7% and
2222kg/m3 for the mix studied. The OMC in particular proved useful in the
determination of the optimum total fluid content (OTFC) for the mix
studied in this work.
The Optimum Bitumen Emulsion Content (OBEC) and Pre-wetting Water
Content were determined as 6.5% and 1.5% respectively making an
Optimum Total Fluid Content (OTFC) for the CBEMs to be 8%.
The Indirect Tensile Stiffness Modulus (ITSM) test proved useful along side
the Indirect Tensile Strength (ITS) test as an indicative test for ranking
CBEMs during mix design. With ITSM (a non destructive test), materials
can be conserved as the same set of specimens tested dry can also be
tested for water susceptibility. ITS tests (destructive test) are common for
mix designs of this nature.
Just enough mixing times for both the addition of pre-wetting water and
bitumen emulsion are recommended for CBEMs in order to ensure
adequate coating and also at such timings, the bitumen emulsion in the
mix has not started breaking. All these together facilitate good
compactability and stiffness properties for the CBEM. Inadequate mixing
time can significantly reduce compactability and stiffness response. A
36.1% reduction in stiffness property as a result of such inadequate
timings was observed in this study.
As observed in this study, limestone filler significantly reduces the water
susceptibility of CBEMs. Limestone has been known to be good at inhibiting
stripping. However, granite filler gave better dry stiffness properties
compared to limestone. Granite aggregate was adopted for subsequent
CBEMs mainly because it is often used in Nigeria which is the study area of
this work.
Chapter 5 Cold Bitumen Emulsion Mix Design and Initial Investigation on its Mechanical Performance
176
Mixing and the compaction of CBEMs at a temperature of 32⁰C gave better
results in compactability, stiffness properties and water susceptibility when
compared to those similarly done at 20⁰C. Such slightly elevated
temperature simulates a typical average maximum temperature in the
tropics. The two temperatures have been adopted for further studies on
the CBEMs. Improvement in stiffness as high as 39.5% was achieved at a
temperature of 32⁰C over 20⁰C in such circumstance.
As observed in this study, the use of parameters of 600kPa pressure and
1.25⁰ gyration angle on the Cooper Research Gyratory Compactor
enhanced the CBEM durability especially the water susceptibility properties
compared to other higher compactive efforts such as pressure of 800kPa
and gyration angles of 1.5⁰ and 2⁰. The 600kPa pressure and 1.25⁰
gyration angle parameters were subsequently adopted for the manufacture
of all the specimens used in this study.
Characterisation of the recovered binder from CBEMs cured at 40⁰C over
624hrs in the forced draft oven compared to those cured at 60⁰C over
96hrs also in the forced draft oven showed very close physico-chemical
properties. The results obtained from the two protocols also showed that
the bitumen in the mix had not significantly degraded compared to the
same properties of the CBEMs characterised prior to curing. Based on the
study, curing protocols of 40⁰C over 12hrs for early life, 40⁰C over 72hrs
for intermediate life and 60⁰C over 96hrs for fully cured condition have
been adopted for further studies on the CBEMs.
As observed in this limited work, filler type (with the exception of active
fillers which were not experimented with in this work) does not influence
curing.
Limited comparative studies on CBEMs containing 100% virgin aggregates,
and 65% RAP indicated a better fatigue response by the RAP CBEMs while
the virgin aggregate CBEM gave a better performance against rutting. The
two results (i.e. fatigue and rutting potential alike) indicate that the
residual bitumen in the RAP is contributing to the enhancement of the
mechanical–properties of the RAP CBEM. This point is further investigated
in Chapter 6 of this thesis.
Chapter 6 Detailed Investigation of the Mechanical Properties of Cold Bituminous Emulsion Mixtures under Laboratory
Simulated Tropical Conditions
177
6 Detailed Investigation of the Mechanical
Properties of Cold Bituminous Emulsion
Mixtures under Laboratory Simulated
Tropical Conditions
6.1 Overview
This chapter describes the investigations carried out on the cold bituminous
emulsion mixture (CBEM) designed in the previous chapter. The study involved
CBEMs made from different types of RAP materials (i.e. RAPs with different
degrees of severity of ageing). This study is deemed appropriate since among
other things, proper characterisation of the engineering properties of the
materials has been conducted and this is increasingly becoming the standard
practice in the industry for ensuring adequate road pavement design. More
importantly, knowledge of such performance is desirable under simulated hot
tropical conditions, the main focus of this research work. The outcomes, it is
believed will help in categorising (ranking) the appropriateness of such severely
aged RAPs for cold recycling of road pavements in hot tropical climates.
So as to account for and also evaluate the effect of the RAPs‟ condition on the
studied properties of the CBEMs on a comparative scale, CBEMs with 100% virgin
materials were similarly included. Such virgin materials are commonly used for
the construction of road base layers in Nigeria though cement stabilised.
Meanwhile statistical tools involving both descriptive and inductive analyses were
employed in the comparative analyses as is common practice for such studies
among researchers (Mubaraki, 2010; Nguyen, 2009; Brennan et al, 2007; Hurley
and Prowell, 2006; Tandon et al, 2006; Soleymani et al, 1999; Kandal et al,
1998; Bell et al, 1994; Tayebali et al, 1994; Kandal and Khatri, 1992; and
Adedimila, 1986). Tools of this nature are good at ascertaining the significance
and influence of the material condition on their properties though within certain
confidence levels.
Furthermore, as fatigue and rutting among others have both been identified by
researchers as the major failure mechanisms in road pavements (Brown and
Brunton, 1986), most structural designs of road pavement require information
about the stiffness/resilient modulus properties, fatigue and rutting responses of
materials for the road pavement among other things. The results obtained for
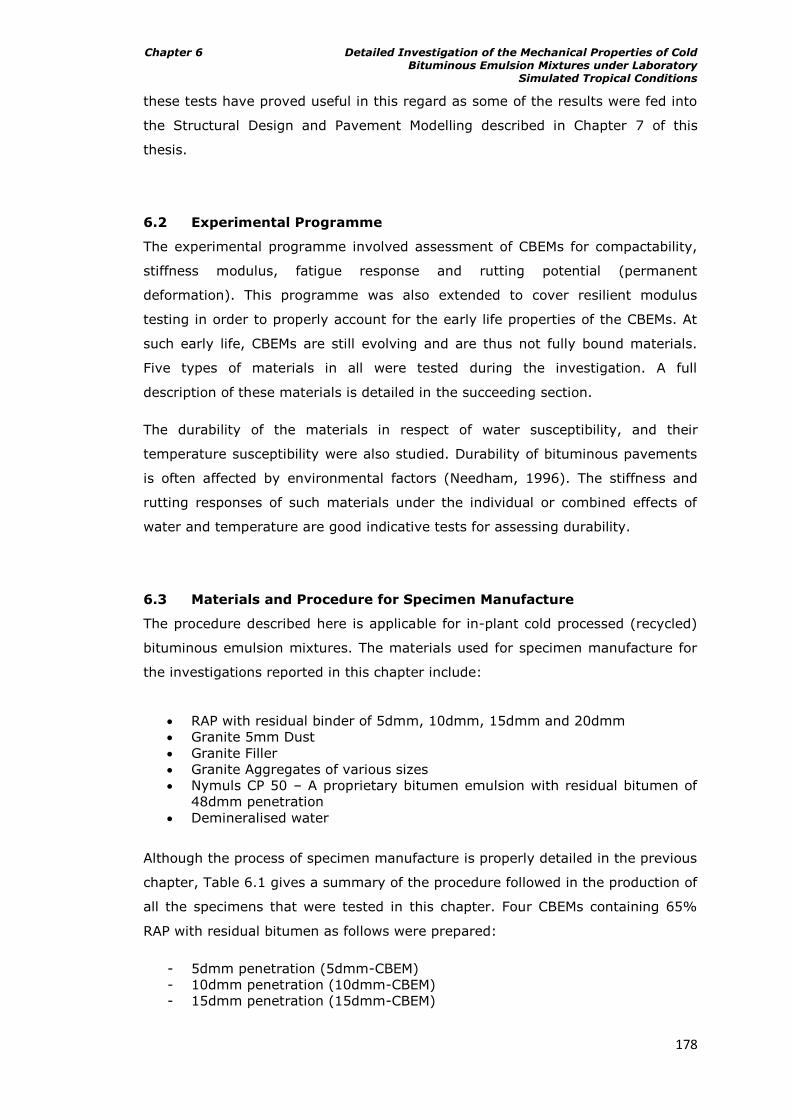
Chapter 6 Detailed Investigation of the Mechanical Properties of Cold Bituminous Emulsion Mixtures under Laboratory
Simulated Tropical Conditions
178
these tests have proved useful in this regard as some of the results were fed into
the Structural Design and Pavement Modelling described in Chapter 7 of this
thesis.
6.2 Experimental Programme
The experimental programme involved assessment of CBEMs for compactability,
stiffness modulus, fatigue response and rutting potential (permanent
deformation). This programme was also extended to cover resilient modulus
testing in order to properly account for the early life properties of the CBEMs. At
such early life, CBEMs are still evolving and are thus not fully bound materials.
Five types of materials in all were tested during the investigation. A full
description of these materials is detailed in the succeeding section.
The durability of the materials in respect of water susceptibility, and their
temperature susceptibility were also studied. Durability of bituminous pavements
is often affected by environmental factors (Needham, 1996). The stiffness and
rutting responses of such materials under the individual or combined effects of
water and temperature are good indicative tests for assessing durability.
6.3 Materials and Procedure for Specimen Manufacture
The procedure described here is applicable for in-plant cold processed (recycled)
bituminous emulsion mixtures. The materials used for specimen manufacture for
the investigations reported in this chapter include:
RAP with residual binder of 5dmm, 10dmm, 15dmm and 20dmm
Granite 5mm Dust
Granite Filler
Granite Aggregates of various sizes
Nymuls CP 50 – A proprietary bitumen emulsion with residual bitumen of
48dmm penetration
Demineralised water
Although the process of specimen manufacture is properly detailed in the previous
chapter, Table 6.1 gives a summary of the procedure followed in the production of
all the specimens that were tested in this chapter. Four CBEMs containing 65%
RAP with residual bitumen as follows were prepared:
- 5dmm penetration (5dmm-CBEM)
- 10dmm penetration (10dmm-CBEM)
- 15dmm penetration (15dmm-CBEM)
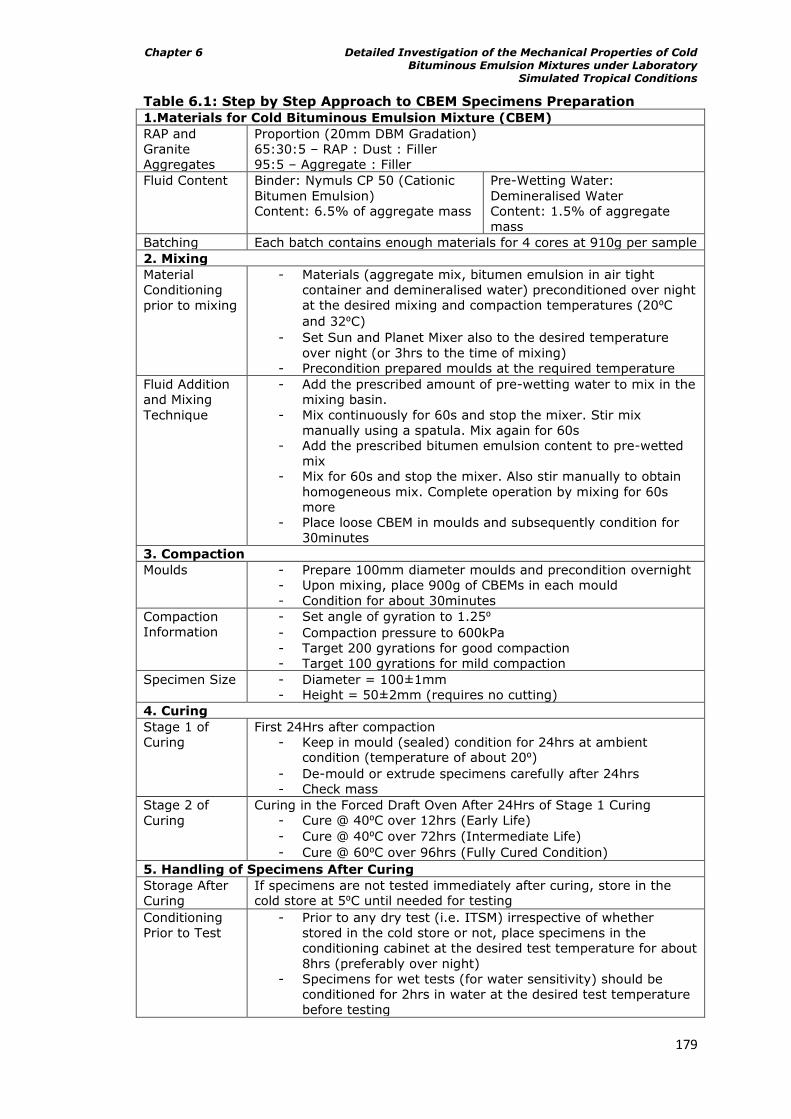
Chapter 6 Detailed Investigation of the Mechanical Properties of Cold Bituminous Emulsion Mixtures under Laboratory
Simulated Tropical Conditions
179
Table 6.1: Step by Step Approach to CBEM Specimens Preparation
1.Materials for Cold Bituminous Emulsion Mixture (CBEM)
RAP and
Granite
Aggregates
Proportion (20mm DBM Gradation)
65:30:5 – RAP : Dust : Filler
95:5 – Aggregate : Filler
Fluid Content Binder: Nymuls CP 50 (Cationic
Bitumen Emulsion)
Content: 6.5% of aggregate mass
Pre-Wetting Water:
Demineralised Water
Content: 1.5% of aggregate
mass
Batching Each batch contains enough materials for 4 cores at 910g per sample
2. Mixing
Material
Conditioning
prior to mixing
- Materials (aggregate mix, bitumen emulsion in air tight
container and demineralised water) preconditioned over night
at the desired mixing and compaction temperatures (20⁰C
and 32⁰C)
- Set Sun and Planet Mixer also to the desired temperature
over night (or 3hrs to the time of mixing)
- Precondition prepared moulds at the required temperature
Fluid Addition
and Mixing
Technique
- Add the prescribed amount of pre-wetting water to mix in the
mixing basin.
- Mix continuously for 60s and stop the mixer. Stir mix
manually using a spatula. Mix again for 60s
- Add the prescribed bitumen emulsion content to pre-wetted
mix
- Mix for 60s and stop the mixer. Also stir manually to obtain
homogeneous mix. Complete operation by mixing for 60s
more
- Place loose CBEM in moulds and subsequently condition for
30minutes
3. Compaction
Moulds - Prepare 100mm diameter moulds and precondition overnight
- Upon mixing, place 900g of CBEMs in each mould
- Condition for about 30minutes
Compaction
Information
- Set angle of gyration to 1.25⁰
- Compaction pressure to 600kPa
- Target 200 gyrations for good compaction
- Target 100 gyrations for mild compaction
Specimen Size - Diameter = 100±1mm
- Height = 50±2mm (requires no cutting)
4. Curing
Stage 1 of
Curing
First 24Hrs after compaction
- Keep in mould (sealed) condition for 24hrs at ambient condition (temperature of about 20⁰)
- De-mould or extrude specimens carefully after 24hrs
- Check mass
Stage 2 of
Curing
Curing in the Forced Draft Oven After 24Hrs of Stage 1 Curing
- Cure @ 40⁰C over 12hrs (Early Life)
- Cure @ 40⁰C over 72hrs (Intermediate Life)
- Cure @ 60⁰C over 96hrs (Fully Cured Condition)
5. Handling of Specimens After Curing
Storage After
Curing
If specimens are not tested immediately after curing, store in the cold store at 5⁰C until needed for testing
Conditioning
Prior to Test
- Prior to any dry test (i.e. ITSM) irrespective of whether
stored in the cold store or not, place specimens in the
conditioning cabinet at the desired test temperature for about
8hrs (preferably over night)
- Specimens for wet tests (for water sensitivity) should be
conditioned for 2hrs in water at the desired test temperature
before testing
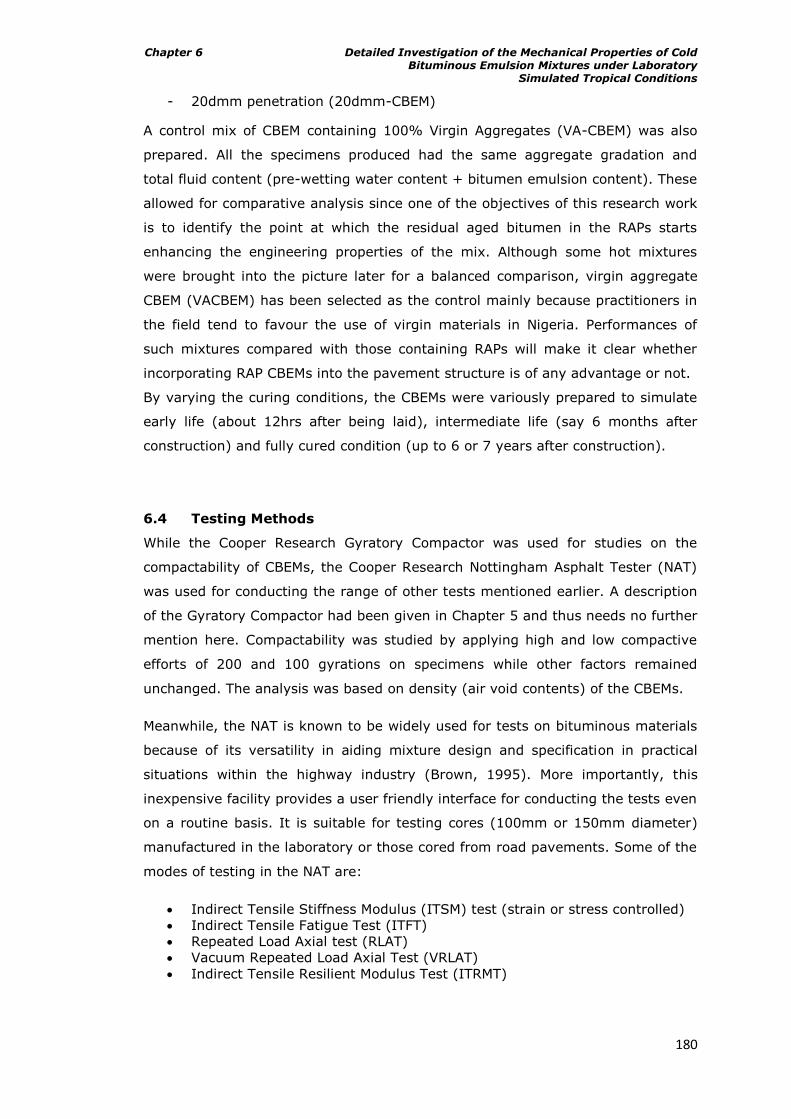
Chapter 6 Detailed Investigation of the Mechanical Properties of Cold Bituminous Emulsion Mixtures under Laboratory
Simulated Tropical Conditions
180
- 20dmm penetration (20dmm-CBEM)
A control mix of CBEM containing 100% Virgin Aggregates (VA-CBEM) was also
prepared. All the specimens produced had the same aggregate gradation and
total fluid content (pre-wetting water content + bitumen emulsion content). These
allowed for comparative analysis since one of the objectives of this research work
is to identify the point at which the residual aged bitumen in the RAPs starts
enhancing the engineering properties of the mix. Although some hot mixtures
were brought into the picture later for a balanced comparison, virgin aggregate
CBEM (VACBEM) has been selected as the control mainly because practitioners in
the field tend to favour the use of virgin materials in Nigeria. Performances of
such mixtures compared with those containing RAPs will make it clear whether
incorporating RAP CBEMs into the pavement structure is of any advantage or not.
By varying the curing conditions, the CBEMs were variously prepared to simulate
early life (about 12hrs after being laid), intermediate life (say 6 months after
construction) and fully cured condition (up to 6 or 7 years after construction).
6.4 Testing Methods
While the Cooper Research Gyratory Compactor was used for studies on the
compactability of CBEMs, the Cooper Research Nottingham Asphalt Tester (NAT)
was used for conducting the range of other tests mentioned earlier. A description
of the Gyratory Compactor had been given in Chapter 5 and thus needs no further
mention here. Compactability was studied by applying high and low compactive
efforts of 200 and 100 gyrations on specimens while other factors remained
unchanged. The analysis was based on density (air void contents) of the CBEMs.
Meanwhile, the NAT is known to be widely used for tests on bituminous materials
because of its versatility in aiding mixture design and specification in practical
situations within the highway industry (Brown, 1995). More importantly, this
inexpensive facility provides a user friendly interface for conducting the tests even
on a routine basis. It is suitable for testing cores (100mm or 150mm diameter)
manufactured in the laboratory or those cored from road pavements. Some of the
modes of testing in the NAT are:
Indirect Tensile Stiffness Modulus (ITSM) test (strain or stress controlled)
Indirect Tensile Fatigue Test (ITFT)
Repeated Load Axial test (RLAT)
Vacuum Repeated Load Axial Test (VRLAT)
Indirect Tensile Resilient Modulus Test (ITRMT)
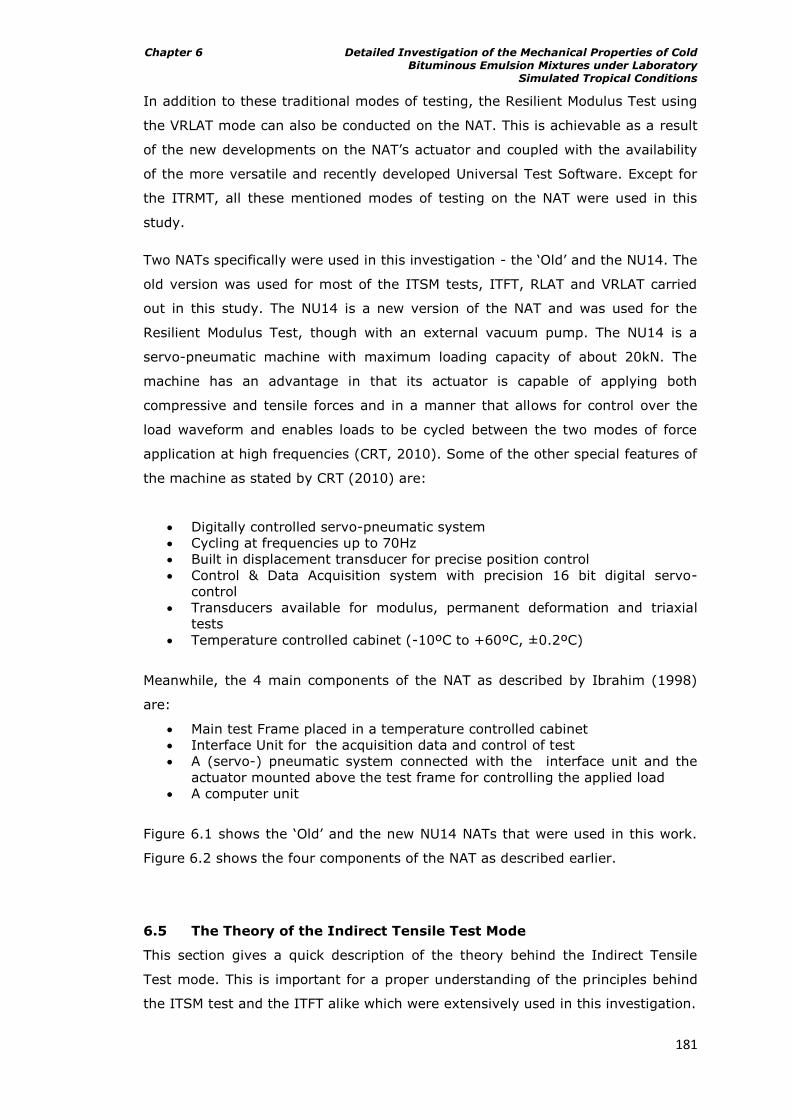
Chapter 6 Detailed Investigation of the Mechanical Properties of Cold Bituminous Emulsion Mixtures under Laboratory
Simulated Tropical Conditions
181
In addition to these traditional modes of testing, the Resilient Modulus Test using
the VRLAT mode can also be conducted on the NAT. This is achievable as a result
of the new developments on the NAT‟s actuator and coupled with the availability
of the more versatile and recently developed Universal Test Software. Except for
the ITRMT, all these mentioned modes of testing on the NAT were used in this
study.
Two NATs specifically were used in this investigation - the „Old‟ and the NU14. The
old version was used for most of the ITSM tests, ITFT, RLAT and VRLAT carried
out in this study. The NU14 is a new version of the NAT and was used for the
Resilient Modulus Test, though with an external vacuum pump. The NU14 is a
servo-pneumatic machine with maximum loading capacity of about 20kN. The
machine has an advantage in that its actuator is capable of applying both
compressive and tensile forces and in a manner that allows for control over the
load waveform and enables loads to be cycled between the two modes of force
application at high frequencies (CRT, 2010). Some of the other special features of
the machine as stated by CRT (2010) are:
Digitally controlled servo-pneumatic system
Cycling at frequencies up to 70Hz
Built in displacement transducer for precise position control
Control & Data Acquisition system with precision 16 bit digital servo-
control
Transducers available for modulus, permanent deformation and triaxial
tests
Temperature controlled cabinet (-10ºC to +60ºC, ±0.2ºC)
Meanwhile, the 4 main components of the NAT as described by Ibrahim (1998)
are:
Main test Frame placed in a temperature controlled cabinet
Interface Unit for the acquisition data and control of test
A (servo-) pneumatic system connected with the interface unit and the
actuator mounted above the test frame for controlling the applied load
A computer unit
Figure 6.1 shows the „Old‟ and the new NU14 NATs that were used in this work.
Figure 6.2 shows the four components of the NAT as described earlier.
6.5 The Theory of the Indirect Tensile Test Mode
This section gives a quick description of the theory behind the Indirect Tensile
Test mode. This is important for a proper understanding of the principles behind
the ITSM test and the ITFT alike which were extensively used in this investigation.
Chapter 6 Detailed Investigation of the Mechanical Properties of Cold Bituminous Emulsion Mixtures under Laboratory
Simulated Tropical Conditions
182
Figure 6.1: The Nottingham Asphalt Tester Test Frames
Figure 6.2: The Main Components of a NAT (Shown in the VRLAT Mode)
Chapter 6 Detailed Investigation of the Mechanical Properties of Cold Bituminous Emulsion Mixtures under Laboratory
Simulated Tropical Conditions
183
Sunarjono (2008) reported that in the indirect tensile test mode, the compression
load is applied across the vertical diameter of a cylindrical specimen and it results
in a biaxial stress distribution in the specimen as shown in Figure 6.3. This
diagram indicates that both a vertical compressive stress (σvx) and a horizontal
tensile stress (σhx) are induced on the horizontal diameter of the specimen and
the magnitudes of the stresses vary along the diameter. However, they both
reach maximum value at the centre of the specimen. He opined that by
measuring the horizontal deformation, the values of both the maximum strain and
the stiffness modulus of the specimen can be calculated. The calculations are
however based on the following assumptions stated by Read (1996) as follows:
The specimen is subjected to plane stress conditions (σz=0).
The material is linear elastic.
The material is homogeneous and behaves in an isotropic manner.
Poisson‟s ratio for the material is known.
The vertical load (P) is applied as a line loading.
With all these conditions satisfied, Read and Whiteoak (2003) stated that the
stress conditions are in consonance with the theory of elasticity. The theory shows
that when the width of the loading strip is less than or equal to 10% of the
diameter of the specimen and the distance of the element of material from the
centre is very small then:
σhx =
6.1
σvx =
6.2
Their averages can further be expressed as follows:
σ =
6.3
σ =
6.4
Where:
d= specimen diameter
t = specimen thickness
P = applied compression or vertical load
σhx = maximum horizontal tensile stress at the centre of the specimen
σvx = maximum vertical compressive stress at the centre of the specimen
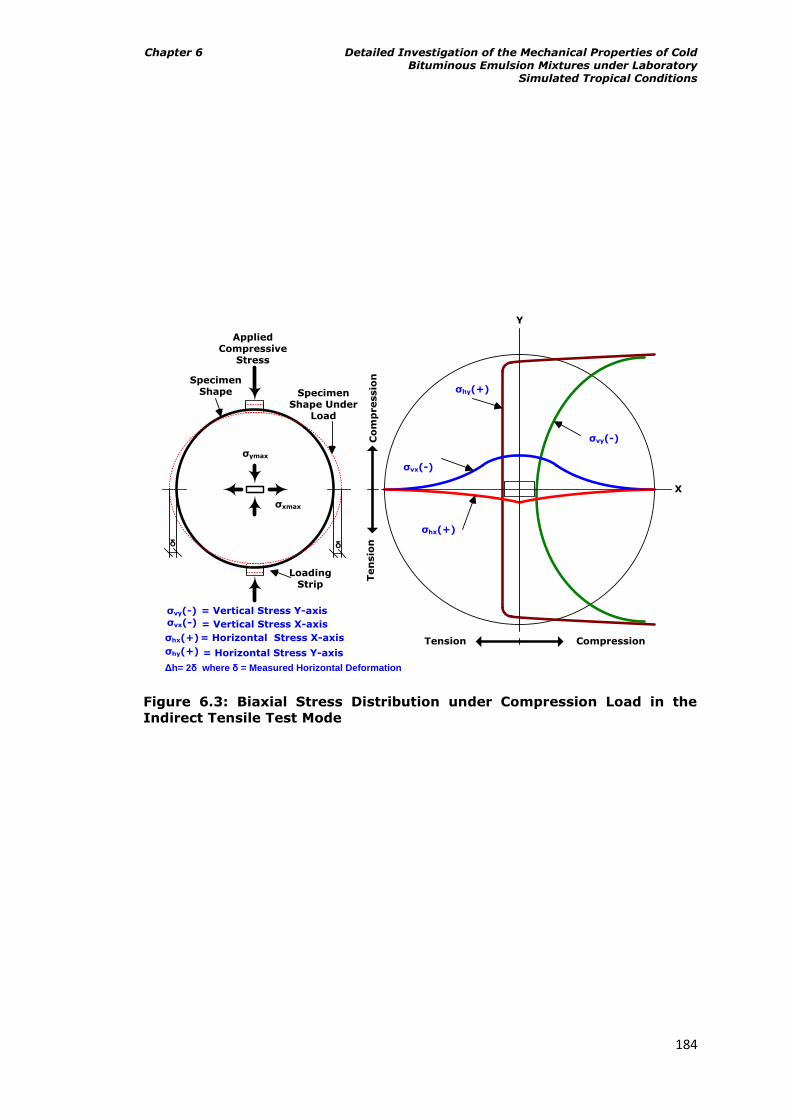
Chapter 6 Detailed Investigation of the Mechanical Properties of Cold Bituminous Emulsion Mixtures under Laboratory
Simulated Tropical Conditions
184
Co
mp
ressio
nTen
sio
n
Applied Compressive
Stress
CompressionTension
Δh= 2δ where δ = Measured Horizontal Deformation
Loading Strip
σymax
σxmax
σvy(-)
Y
X
σhy(+)
σvx(-)
σhx(+)
= Horizontal Stress X-axisσhx(+)
= Vertical Stress Y-axisσvy(-)
= Vertical Stress X-axisσvx(-)
Specimen Shape Specimen
Shape Under Load
δ δ
= Horizontal Stress Y-axisσhy(+)
Figure 6.3: Biaxial Stress Distribution under Compression Load in the
Indirect Tensile Test Mode
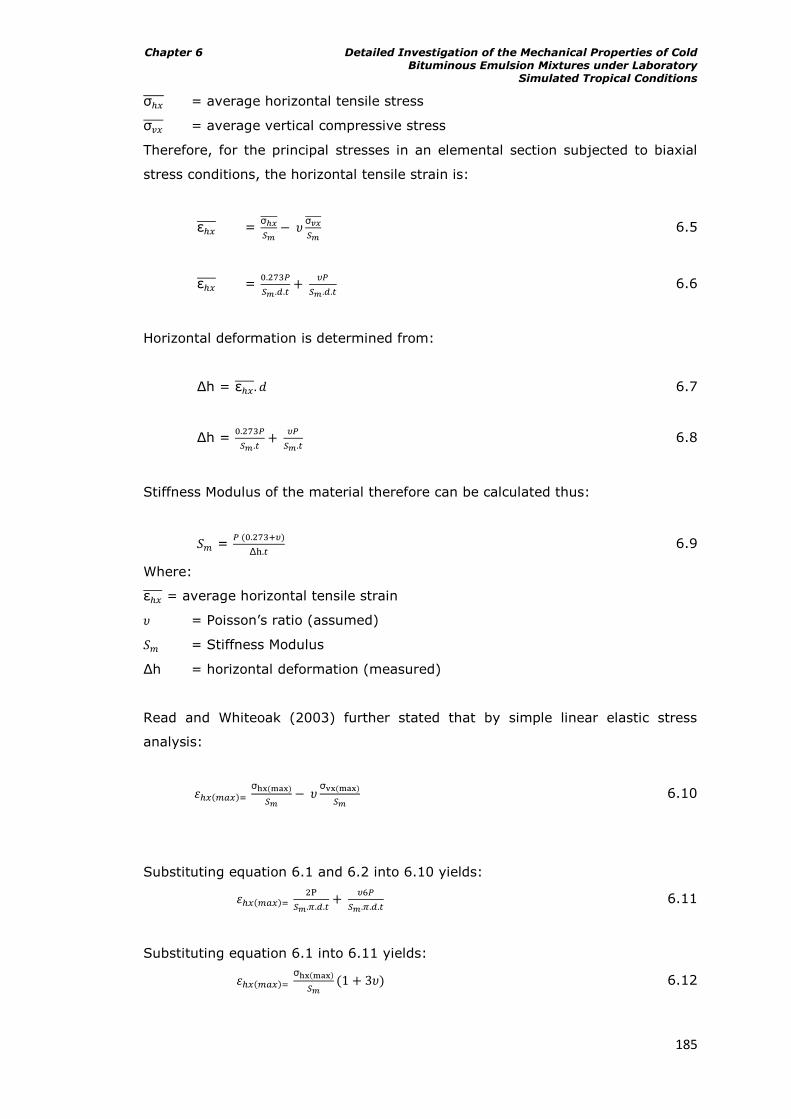
Chapter 6 Detailed Investigation of the Mechanical Properties of Cold Bituminous Emulsion Mixtures under Laboratory
Simulated Tropical Conditions
185
σ = average horizontal tensile stress
σ = average vertical compressive stress
Therefore, for the principal stresses in an elemental section subjected to biaxial
stress conditions, the horizontal tensile strain is:
= σ
σ
6.5
=
6.6
Horizontal deformation is determined from:
Δh = 6.7
Δh =
6.8
Stiffness Modulus of the material therefore can be calculated thus:
=
Δ 6.9
Where:
= average horizontal tensile strain
= Poisson‟s ratio (assumed)
= Stiffness Modulus
Δh = horizontal deformation (measured)
Read and Whiteoak (2003) further stated that by simple linear elastic stress
analysis:
σ
σ
6.10
Substituting equation 6.1 and 6.2 into 6.10 yields:
6.11
Substituting equation 6.1 into 6.11 yields:
σ
6.12
Chapter 6 Detailed Investigation of the Mechanical Properties of Cold Bituminous Emulsion Mixtures under Laboratory
Simulated Tropical Conditions
186
Equation 6.12 is used for calculating maximum tensile strain ( at the
centre of the specimen. This strain is required for the indirect tensile fatigue test.
It follows from the equation that stiffness modulus and the maximum tensile
stress values are needed in order to calculate the tensile strain in the fatigue test.
6.6 Explanations on Statistical Tools used for Analysis of Results
This section gives brief descriptions of the statistical tools that were used in
analysing the results obtained from the experimental investigation conducted and
presented in this chapter.
6.6.1 Normality test
Park (2008) advised that it is important to check the pattern of distribution before
analysing data. The results of the normality test will guide in choosing the
appropriate test (parametric or non-parametric), for analysing the data. Two
tests, graphical and numerical, are available for checking the normality of data.
Park (2008) opined that numerical tests are more objective and the most popular
methods are the Kolmogorov-Smirnov test (K-S test) and the Shapiro-Wilk test
(W-S test). When the distribution is normal, parametric tests are used for further
analysis and if otherwise, non-parametric tests are employed.
The One-Sample Kolmogorov-Smirnov (Normality) Test (in the SPSS 16) was
used in this chapter. The SPSS 16 manual states that the test procedure
compares the observed cumulative distribution function with a specified
theoretical distribution, which may be normal, uniform, Poisson or exponential.
The Kolmogorov-Smirnov Z is computed from the largest difference (in absolute
value) between the observed and theoretical cumulative distribution functions.
This goodness-of-fit test tests whether the observations could reasonably have
come from the specified distribution.
The output of the test gives sample size, normal parameters (mean and standard
deviation), most extreme differences, Kolmogorov-Smirnov Z and the two-tailed
significance of the test statistic which is the p-value. The p-value ranges from
zero to one. If p>0.05, the observed cumulative distribution compares with or is
not significantly different from the specified theoretical distribution and therefore
the distribution is normal. However, if p<0.05, the difference between the two
distributions is significant and therefore the cumulative distribution is not
normally distributed (Mubaraki, 2010).
Chapter 6 Detailed Investigation of the Mechanical Properties of Cold Bituminous Emulsion Mixtures under Laboratory
Simulated Tropical Conditions
187
6.6.2 Multiple regression analysis
Multiple regression analysis was conducted in this chapter using STATA software.
Multiple regression analysis is a technique that estimates a single regression
model with the prediction of the dependent (y) variable from a set of independent
(x) variables (SADLP, 2010). Multiple regressions assume that data sample follow
a normal distribution and that the relationship is linear. The method is particularly
important when dealing with large number of variables that express common
information. For example the dependent variable “y” is assumed to be a function
of a set of “k” independent variables x1, x2, x3… Xk, and this yields a regression
equation thus:
Y = a + b1x1 + b2x2 + ….. + bkxk 6.13
Each “b” is a partial slope coefficient i.e. when all other independent variable is
equal to zero, or held constant, in other words, each “b” coefficient is the slope of
the relationship between that particular independent variable “x” and the
dependent variable “y”. For example, the “b1” coefficient in equation 6.13 refers
to the slope between “x1” and the independent variable when all other variables
in the equation, x2, x3, etc equal to zero. Multiple regression analysis therefore
allows for stating relationships between two main variables while controlling for
other factors – also known as partial effects (SADLP, 2010).
For example, multiple regression analysis were useful in ascertaining the
relationship between air void content and stiffness modulus of the CBEMs studied
in this chapter i.e. VACBEM, 5dmmCBEM, 10dmmCBEM, 15dmmCBEM and
20dmmCBEM while controlling for the effect of the five CBEM types. Within this
grouped data, each CBEM type was taken as a subgroup such that from equation
6.13, VACBEM was coded as “x1”, 5dmmCBEM was coded as “x2”, etc in the
regression model. This method was similarly useful for taking into account the
preparation method used for the CBEMs i.e. 20⁰C, 100 gyrations 20⁰C, 200
gyrations, etc as discussed in this chapter.
6.7. Compactability of CBEMs
A reasonable level of compactability is desirable for CBEMs in order to guard
against rutting and problems associated with durability of asphalt mixtures. Thus
the compactability of the CBEMs was studied by applying two compactive efforts
of 100 and 200 gyrations. All other conditions apply as stated in Table 6.1. The air
Chapter 6 Detailed Investigation of the Mechanical Properties of Cold Bituminous Emulsion Mixtures under Laboratory
Simulated Tropical Conditions
188
void content (density) was used for the analyses as it is a good measure of the
degree of compaction and in essence compactability of the material.
6.7.1 The effect of CBEM composition, temperature of preparation and
compactive effort on compactability post compaction
An investigation involving the five CBEMs, prepared under conditions simulating
post compaction was conducted. Post compaction is assumed to be the three
stages of, (1) immediately after compaction (extruded specimens after curing in
mould for 24hrs), (2) early life (curing of the extruded cores in the forced draft
oven over a period of 12hrs at 40⁰C in an unsealed condition after the stage 1
curing in the mould) and (3) intermediate life conditions (same with early life
condition with curing in the force draft oven extended beyond 12hrs to 72hrs). In
order to account for the effect of compactive effort, temperature of preparation of
specimens and CBEM type, the following parameters were considered:
Number of gyrations : 100 and 200 gyrations
Mixing and Compaction Temperature : 20⁰C and 32⁰C
Tables 6.2, 6.3 and 6.4 show the result of the One-Sample Kolmogorov-Smirnov
(Normality) Tests conducted on the measured air voids of the CBEMs for
conditions simulating immediately after compaction, early life and intermediate
life respectively. The results of the normality tests indicate that all the
measurements were normally distributed as all the values in Asymp. Sig. (2-
tailed) row were greater than 0.05. Since the distribution is normal, therefore the
results can be presented using descriptive statistics. The tables similarly contain
the respective values for the mean and standard deviation of the measured air
voids. The standard deviation values were generally low which indicate low
variation in the observed air void contents, and they do not follow a specific
trend. The mean values of the air voids were used in plotting Figures 6.4 and 6.5.
Figure 6.4 shows the mean air void contents for the five CBEMs immediately after
compaction. The figure clearly shows that the 20dmmCBEM had the best air void
contents i.e. lowest values with the VACBEM having the highest values for
preparation temperature of 32⁰C. Although the air voids were generally lower
than 16% at this level, the figure shows that the CBEMs prepared at 20⁰C were
less compact compared to those prepared at 32⁰C. At preparation temperature of
20⁰C, the 20dmmCBEM indicated the lowest air void contents (though with values
higher than those observed at 32⁰C) while the 10dmmCBEM had the highest
values. The figure shows that the compactive effort of 200 gyrations gave better
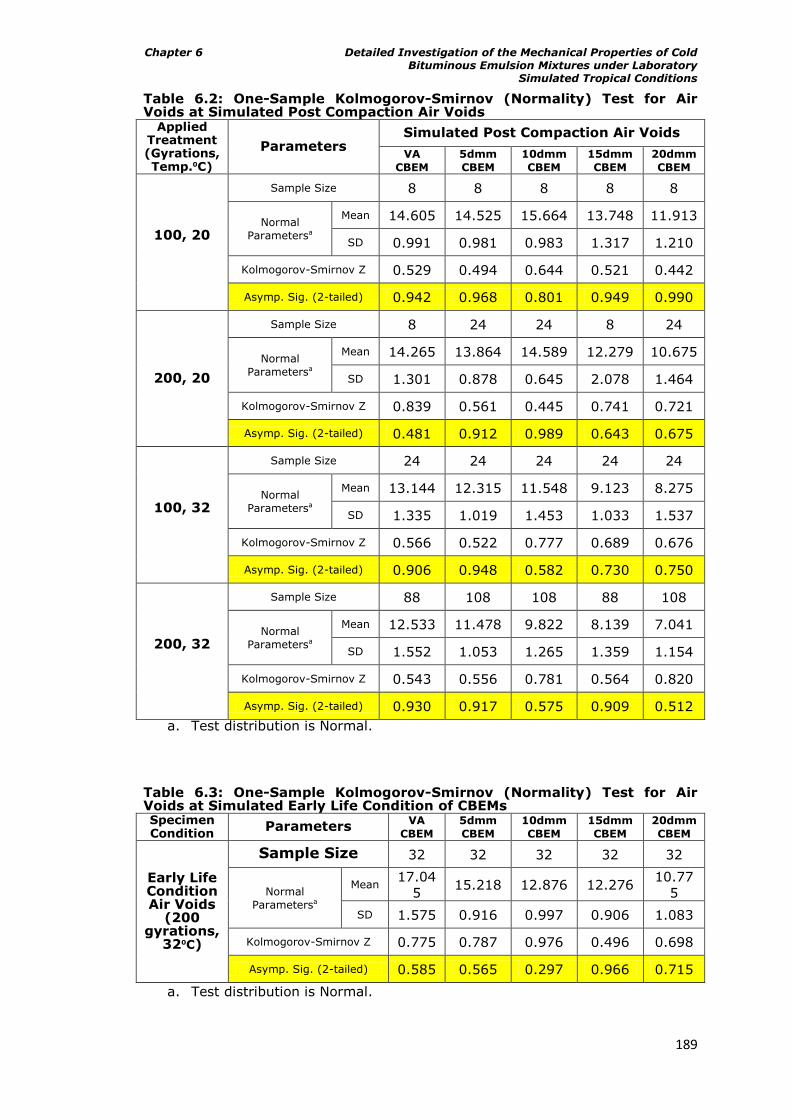
Chapter 6 Detailed Investigation of the Mechanical Properties of Cold Bituminous Emulsion Mixtures under Laboratory
Simulated Tropical Conditions
189
Table 6.2: One-Sample Kolmogorov-Smirnov (Normality) Test for Air Voids at Simulated Post Compaction Air Voids
Applied Treatment (Gyrations, Temp.⁰C)
Parameters Simulated Post Compaction Air Voids
VA
CBEM
5dmm
CBEM
10dmm
CBEM
15dmm
CBEM
20dmm
CBEM
100, 20
Sample Size 8 8 8 8 8
Normal
Parametersa
Mean 14.605 14.525 15.664 13.748 11.913
SD 0.991 0.981 0.983 1.317 1.210
Kolmogorov-Smirnov Z 0.529 0.494 0.644 0.521 0.442
Asymp. Sig. (2-tailed) 0.942 0.968 0.801 0.949 0.990
200, 20
Sample Size 8 24 24 8 24
Normal
Parametersa
Mean 14.265 13.864 14.589 12.279 10.675
SD 1.301 0.878 0.645 2.078 1.464
Kolmogorov-Smirnov Z 0.839 0.561 0.445 0.741 0.721
Asymp. Sig. (2-tailed) 0.481 0.912 0.989 0.643 0.675
100, 32
Sample Size 24 24 24 24 24
Normal
Parametersa
Mean 13.144 12.315 11.548 9.123 8.275
SD 1.335 1.019 1.453 1.033 1.537
Kolmogorov-Smirnov Z 0.566 0.522 0.777 0.689 0.676
Asymp. Sig. (2-tailed) 0.906 0.948 0.582 0.730 0.750
200, 32
Sample Size 88 108 108 88 108
Normal
Parametersa
Mean 12.533 11.478 9.822 8.139 7.041
SD 1.552 1.053 1.265 1.359 1.154
Kolmogorov-Smirnov Z 0.543 0.556 0.781 0.564 0.820
Asymp. Sig. (2-tailed) 0.930 0.917 0.575 0.909 0.512
a. Test distribution is Normal.
Table 6.3: One-Sample Kolmogorov-Smirnov (Normality) Test for Air Voids at Simulated Early Life Condition of CBEMs Specimen Condition
Parameters VA
CBEM 5dmm
CBEM 10dmm
CBEM 15dmm
CBEM 20dmm
CBEM
Early Life Condition Air Voids
(200 gyrations,
32⁰C)
Sample Size 32 32 32 32 32
Normal
Parametersa
Mean 17.04
5 15.218 12.876 12.276
10.77
5
SD 1.575 0.916 0.997 0.906 1.083
Kolmogorov-Smirnov Z 0.775 0.787 0.976 0.496 0.698
Asymp. Sig. (2-tailed) 0.585 0.565 0.297 0.966 0.715
a. Test distribution is Normal.
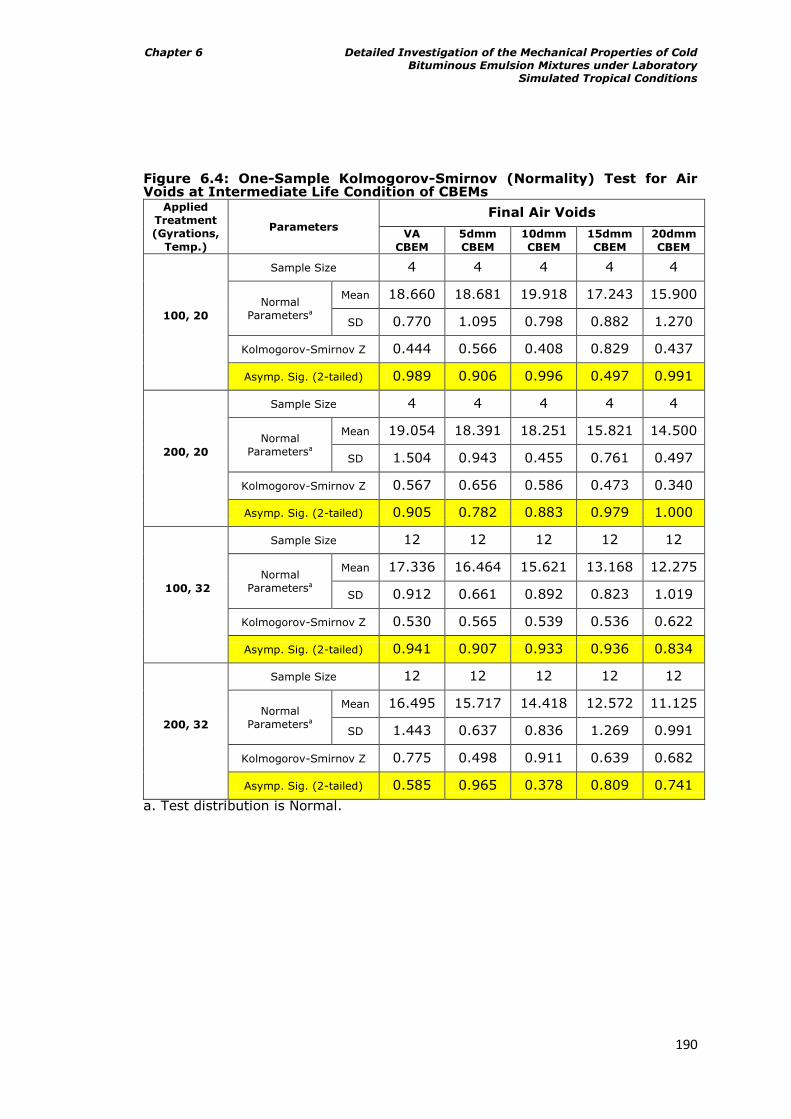
Chapter 6 Detailed Investigation of the Mechanical Properties of Cold Bituminous Emulsion Mixtures under Laboratory
Simulated Tropical Conditions
190
Figure 6.4: One-Sample Kolmogorov-Smirnov (Normality) Test for Air Voids at Intermediate Life Condition of CBEMs
Applied
Treatment
(Gyrations,
Temp.)
Parameters
Final Air Voids
VA
CBEM
5dmm
CBEM
10dmm
CBEM
15dmm
CBEM
20dmm
CBEM
100, 20
Sample Size 4 4 4 4 4
Normal
Parametersa
Mean 18.660 18.681 19.918 17.243 15.900
SD 0.770 1.095 0.798 0.882 1.270
Kolmogorov-Smirnov Z 0.444 0.566 0.408 0.829 0.437
Asymp. Sig. (2-tailed) 0.989 0.906 0.996 0.497 0.991
200, 20
Sample Size 4 4 4 4 4
Normal
Parametersa
Mean 19.054 18.391 18.251 15.821 14.500
SD 1.504 0.943 0.455 0.761 0.497
Kolmogorov-Smirnov Z 0.567 0.656 0.586 0.473 0.340
Asymp. Sig. (2-tailed) 0.905 0.782 0.883 0.979 1.000
100, 32
Sample Size 12 12 12 12 12
Normal
Parametersa
Mean 17.336 16.464 15.621 13.168 12.275
SD 0.912 0.661 0.892 0.823 1.019
Kolmogorov-Smirnov Z 0.530 0.565 0.539 0.536 0.622
Asymp. Sig. (2-tailed) 0.941 0.907 0.933 0.936 0.834
200, 32
Sample Size 12 12 12 12 12
Normal
Parametersa
Mean 16.495 15.717 14.418 12.572 11.125
SD 1.443 0.637 0.836 1.269 0.991
Kolmogorov-Smirnov Z 0.775 0.498 0.911 0.639 0.682
Asymp. Sig. (2-tailed) 0.585 0.965 0.378 0.809 0.741
a. Test distribution is Normal.
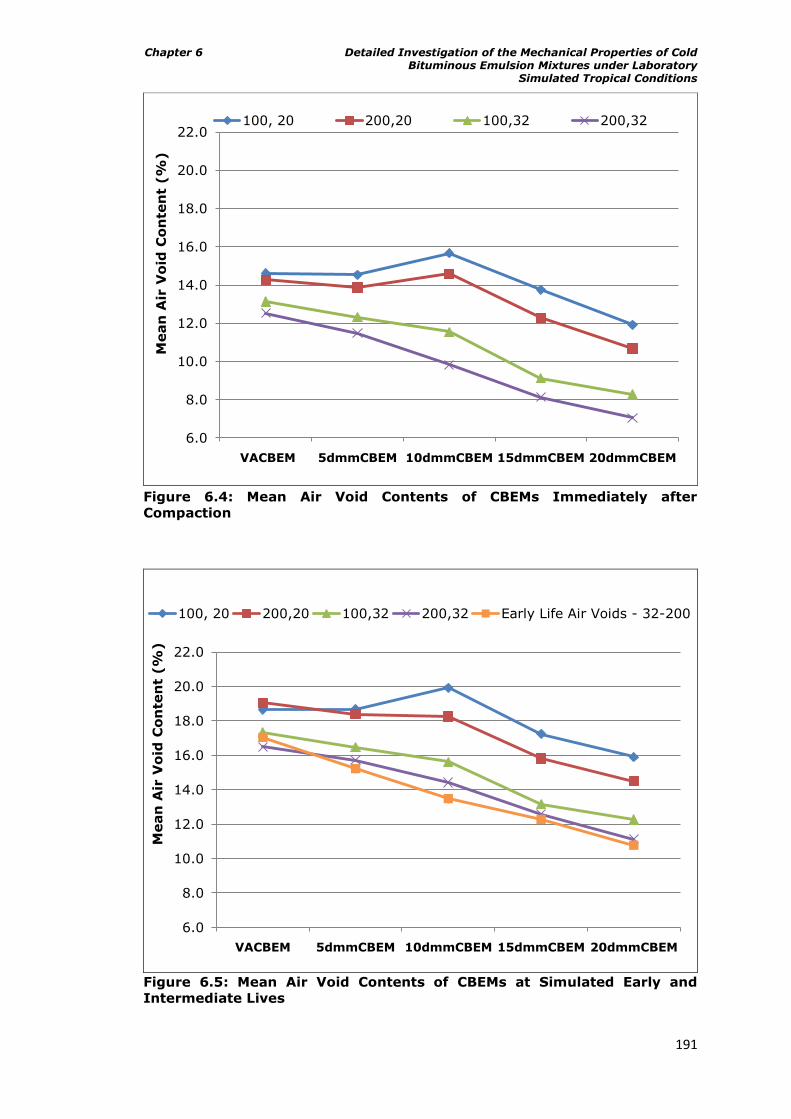
Chapter 6 Detailed Investigation of the Mechanical Properties of Cold Bituminous Emulsion Mixtures under Laboratory
Simulated Tropical Conditions
191
Figure 6.4: Mean Air Void Contents of CBEMs Immediately after
Compaction
Figure 6.5: Mean Air Void Contents of CBEMs at Simulated Early and
Intermediate Lives
6.0
8.0
10.0
12.0
14.0
16.0
18.0
20.0
22.0
VACBEM 5dmmCBEM 10dmmCBEM 15dmmCBEM 20dmmCBEM
Mean
Air
Vo
id C
on
ten
t (%
)
100, 20 200,20 100,32 200,32
6.0
8.0
10.0
12.0
14.0
16.0
18.0
20.0
22.0
VACBEM 5dmmCBEM 10dmmCBEM 15dmmCBEM 20dmmCBEM
Mean
Air
Vo
id C
on
ten
t (%
)
100, 20 200,20 100,32 200,32 Early Life Air Voids - 32-200
Chapter 6 Detailed Investigation of the Mechanical Properties of Cold Bituminous Emulsion Mixtures under Laboratory
Simulated Tropical Conditions
192
response compared to 100 gyrations.
No doubt, the mixing and compaction temperature of 32⁰C was a major factor for
the enhancement of CBEMs prepared at that temperature. It is very likely that at
such temperature, the severely aged residual bitumen in the RAPs was
„excited‟/softened or possibly rejuvenated thus becoming less viscous. This in
effect aided better lubrication during compaction resulting in a higher level of
compaction as evidenced in the air void content values. This effect could also
have demobilised some of the RAP fines which hitherto were glued to the coarse
RAPs by the residual aged binder in the RAP. It implies thus that at such
temperature, the CBEMs in effect had more lubricants than the VACBEM. Another
important factor that could have contributed to the lower air void contents of the
CBEMs prepared at 32⁰C was the viscosity of the bitumen emulsion at such
temperature. The Redwood II viscosity test conducted on the bitumen emulsion
indicated values of 5.14s and 15s for temperatures of 30⁰C and 20⁰C respectively.
Figure 6.5 shows the mean air void contents of the CBEMs at simulated early and
intermediate lives. The results similarly indicated that preparation (mixing and
compaction) temperature and compactive effort both play important roles in
ensuring compactability of CBEMs. However, mixing and compaction temperature
had greater influence on compactability compared to compactive effort. For
example, the mean air void contents for the combination 32⁰C - 100 gyrations
were generally lower (better) than those observed for 20⁰C - 200 gyrations. This
observation was irrespective of RAP type in CBEM, with 20dmmCBEM having the
lowest air void contents and the 5dmmCBEM, the highest content of air void.
Furthermore, the observed trend in Figure 6.5 is similar to that of Figure 6.4,
however, the mean air void contents were generally higher than those previously
observed in Figure 6.4. This as result of further loss of moisture contents in the
CBEMs. The mean moisture contents at different curing conditions and the
standard deviation are detailed in Table 6.5 while Figures 6.6 and 6.7 are the
graphical representations of mean moisture contents at early and intermediate life
conditions, and the fully cured conditions respectively. This might not be a true
picture of what obtains on site. As these results indicate, within the first few hours
of laying the material, a significant portion of the moisture in the CBEM
evaporates (about 71% of total moisture content), which subsequently raises the
level of the air void contents. This is a weak point for this laboratory simulation
since ordinarily, within a short time after the construction, vehicles will start
trafficking the road pavement. Loads from such vehicular traffic would aid further
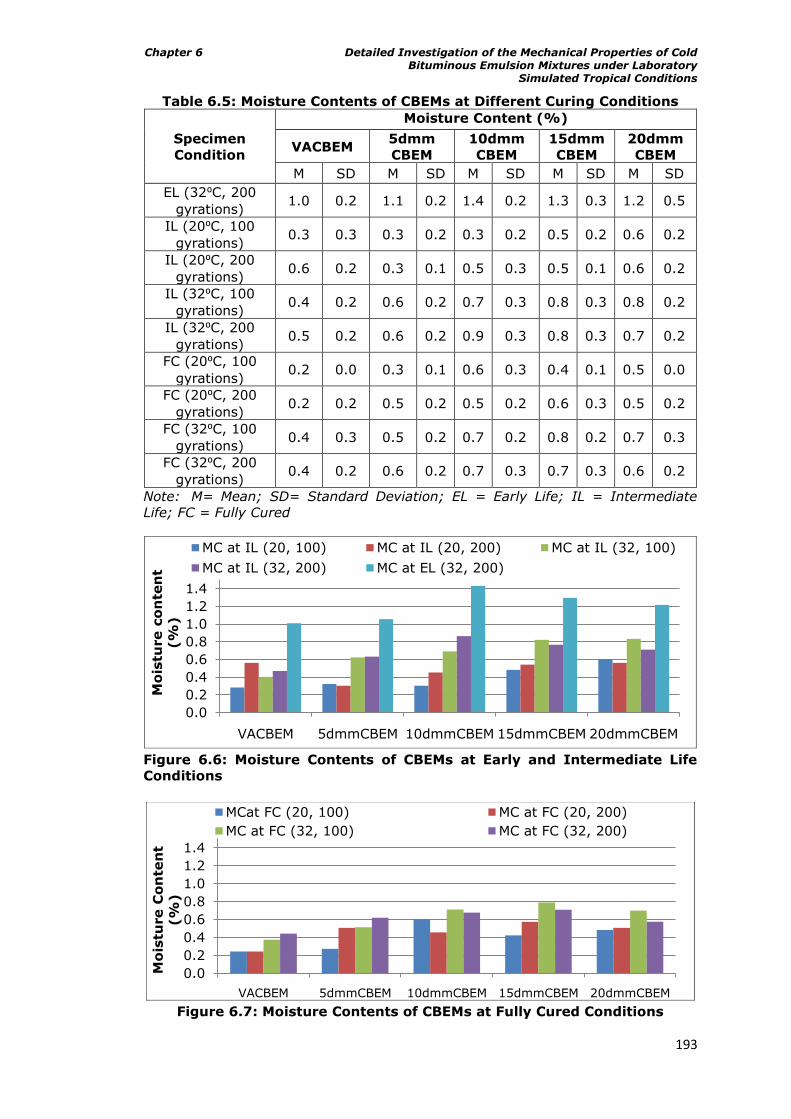
Chapter 6 Detailed Investigation of the Mechanical Properties of Cold Bituminous Emulsion Mixtures under Laboratory
Simulated Tropical Conditions
193
Table 6.5: Moisture Contents of CBEMs at Different Curing Conditions
Specimen
Condition
Moisture Content (%)
VACBEM 5dmm
CBEM
10dmm
CBEM
15dmm
CBEM
20dmm
CBEM
M SD M SD M SD M SD M SD
EL (32⁰C, 200
gyrations) 1.0 0.2 1.1 0.2 1.4 0.2 1.3 0.3 1.2 0.5
IL (20⁰C, 100
gyrations) 0.3 0.3 0.3 0.2 0.3 0.2 0.5 0.2 0.6 0.2
IL (20⁰C, 200
gyrations) 0.6 0.2 0.3 0.1 0.5 0.3 0.5 0.1 0.6 0.2
IL (32⁰C, 100
gyrations) 0.4 0.2 0.6 0.2 0.7 0.3 0.8 0.3 0.8 0.2
IL (32⁰C, 200
gyrations) 0.5 0.2 0.6 0.2 0.9 0.3 0.8 0.3 0.7 0.2
FC (20⁰C, 100
gyrations) 0.2 0.0 0.3 0.1 0.6 0.3 0.4 0.1 0.5 0.0
FC (20⁰C, 200
gyrations) 0.2 0.2 0.5 0.2 0.5 0.2 0.6 0.3 0.5 0.2
FC (32⁰C, 100
gyrations) 0.4 0.3 0.5 0.2 0.7 0.2 0.8 0.2 0.7 0.3
FC (32⁰C, 200
gyrations) 0.4 0.2 0.6 0.2 0.7 0.3 0.7 0.3 0.6 0.2
Note: M= Mean; SD= Standard Deviation; EL = Early Life; IL = Intermediate
Life; FC = Fully Cured
Figure 6.6: Moisture Contents of CBEMs at Early and Intermediate Life
Conditions
Figure 6.7: Moisture Contents of CBEMs at Fully Cured Conditions
0.0
0.2
0.4
0.6
0.8
1.0
1.2
1.4
VACBEM 5dmmCBEM 10dmmCBEM 15dmmCBEM 20dmmCBEM
Mo
istu
re c
on
ten
t
(%
)
MC at IL (20, 100) MC at IL (20, 200) MC at IL (32, 100)
MC at IL (32, 200) MC at EL (32, 200)
0.0
0.2
0.4
0.6
0.8
1.0
1.2
1.4
VACBEM 5dmmCBEM 10dmmCBEM 15dmmCBEM 20dmmCBEM
Mo
istu
re C
on
ten
t
(%
)
MCat FC (20, 100) MC at FC (20, 200)
MC at FC (32, 100) MC at FC (32, 200)
Chapter 6 Detailed Investigation of the Mechanical Properties of Cold Bituminous Emulsion Mixtures under Laboratory
Simulated Tropical Conditions
194
consolidation in the road pavement with an accompanying reduction in air void
contents. The specimens studied here did not receive further compaction after
manufacture. Serfass et al (2009) in a study in which initial air voids of CBEMs
were compared with those of later life found a reduction in air voids (though not
significant) in road pavements.
The trends in Figures 6.6 and 6.7 show that air void content affects the rate of
moisture loss in the CBEMs. The higher the initial air void content, the higher the
rate of moisture loss from the CBEM. In this regard, the VACBEM showed the
highest loss of moisture content. Ojum (2009) in a related work observed similar
trend.
6.7.2 The effect of CBEM composition, temperature of preparation and
compactive effort on compactability of fully cured specimens
Similar studies to those carried out in the preceding section were also conducted
on specimens conditioned to simulate fully cured condition. With all other
conditions for specimen preparation as previously done in the preceding section
held, the following were also investigated at this level along with the effect of
material type:
Number of gyrations : 100 and 200 gyrations
Mixing and Compaction Temperature : 20⁰C and 32⁰C
Curing Protocol : 60⁰C over 96hrs
Again, before any analysis was conducted, the results of the measurements for
the air void contents were also tested for normality. The results are as indicated
in Table 6.6. The One-Sample Kolmogorov-Smirnov (Normality) Test showed that
the measurements were similarly normally distributed (all the values in Asymp.
Sig. (2-tailed) row were greater than 0.05). Similarly, the standard deviation
values were generally low which indicate low variation in the observed air void
contents, and they do not follow a specific trend as was observed in the previous
section. Figure 6.8 shows that the mean air void contents of the CBEMs at mixing
and compaction temperature of 32⁰C for fully cured condition followed similar
trend as observed in the preceding section. However, the trend of the air voids of
the RAP CBEMs compared to those of the VACBEM at the mixing and compaction
temperature of 20⁰C were not completely consistent with the observations made
in the preceding section. This observation was most obvious for those compacted
using the compactive effort of 200 gyrations as there was no significant difference
from those compacted using 100 gyrations.
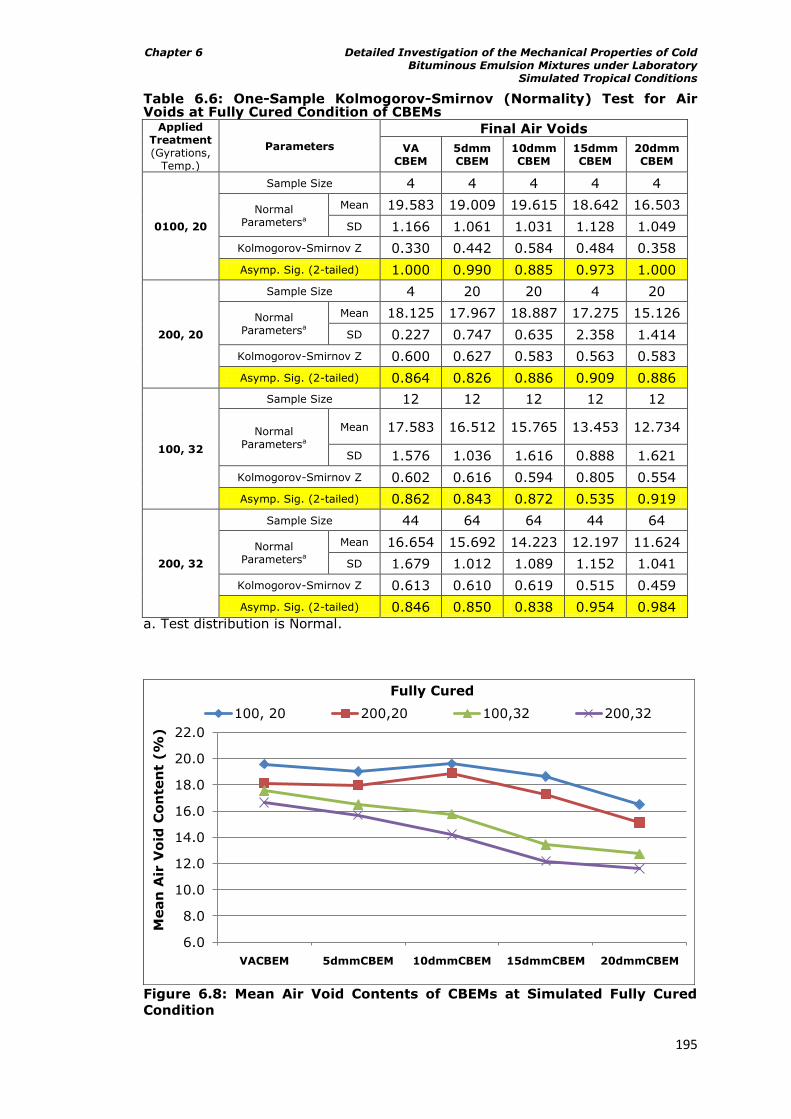
Chapter 6 Detailed Investigation of the Mechanical Properties of Cold Bituminous Emulsion Mixtures under Laboratory
Simulated Tropical Conditions
195
Table 6.6: One-Sample Kolmogorov-Smirnov (Normality) Test for Air Voids at Fully Cured Condition of CBEMs
Applied Treatment (Gyrations,
Temp.)
Parameters
Final Air Voids
VA CBEM
5dmm CBEM
10dmm CBEM
15dmm CBEM
20dmm CBEM
0100, 20
Sample Size 4 4 4 4 4
Normal Parametersa
Mean 19.583 19.009 19.615 18.642 16.503
SD 1.166 1.061 1.031 1.128 1.049
Kolmogorov-Smirnov Z 0.330 0.442 0.584 0.484 0.358
Asymp. Sig. (2-tailed) 1.000 0.990 0.885 0.973 1.000
200, 20
Sample Size 4 20 20 4 20
Normal Parametersa
Mean 18.125 17.967 18.887 17.275 15.126
SD 0.227 0.747 0.635 2.358 1.414
Kolmogorov-Smirnov Z 0.600 0.627 0.583 0.563 0.583
Asymp. Sig. (2-tailed) 0.864 0.826 0.886 0.909 0.886
100, 32
Sample Size 12 12 12 12 12
Normal Parametersa
Mean 17.583 16.512 15.765 13.453 12.734
SD 1.576 1.036 1.616 0.888 1.621
Kolmogorov-Smirnov Z 0.602 0.616 0.594 0.805 0.554
Asymp. Sig. (2-tailed) 0.862 0.843 0.872 0.535 0.919
200, 32
Sample Size 44 64 64 44 64
Normal Parametersa
Mean 16.654 15.692 14.223 12.197 11.624
SD 1.679 1.012 1.089 1.152 1.041
Kolmogorov-Smirnov Z 0.613 0.610 0.619 0.515 0.459
Asymp. Sig. (2-tailed) 0.846 0.850 0.838 0.954 0.984
a. Test distribution is Normal.
Figure 6.8: Mean Air Void Contents of CBEMs at Simulated Fully Cured
Condition
6.0
8.0
10.0
12.0
14.0
16.0
18.0
20.0
22.0
VACBEM 5dmmCBEM 10dmmCBEM 15dmmCBEM 20dmmCBEM
Mean
Air
Vo
id C
on
ten
t (%
)
Fully Cured
100, 20 200,20 100,32 200,32
Chapter 6 Detailed Investigation of the Mechanical Properties of Cold Bituminous Emulsion Mixtures under Laboratory
Simulated Tropical Conditions
196
These results clearly imply that apart from better compactability being attainable
as observed in the preceding section, the consistency and reproducibility of
similar air void contents in CBEMs mixed and compacted at 32⁰C are uniform and
significantly better compared to those mixed and compacted at 20⁰C. The results
also confirmed that there is little difference in compactability of CBEMs achieved
when compactive effort of 100 gyrations or 200 gyrations is applied compared to
the effect of mixing and compaction temperatures 32⁰C of 20⁰C which is
significant. The 10dmmCBEM performed poorest in compactability at 20⁰C.
The trends observed in this study for the air voids suggest that initial air void
content (at the point of construction) directly impacts (affects) the path of later
in-service air void contents and similarly moisture contents of CBEMs. In
particular, the moisture contents at the fully cured condition (though very low
now i.e. ≤ 0.8%) suggest that the CBEMs might not totally become dry. Serfass et
al (2003) argued that moisture content of cold mixes has often been found to be
between 0.5 and 1.5% in road bases in temperate climate. Although the VACBEM
showed the lowest value for moisture content at fully cured condition, it is
believed that with further consolidation of the CBEMs in-service, the
accompanying reduction in air void contents will reduce the rate of moisture loss
since contact with air and heat (agents of evaporation) by the CBEM is further
reduced. On average, the CBEMs containing severely aged RAPs performed
significantly better than those of the VACBEM in compactability as earlier
observed in the previous sections.
6.8 The Indirect Tensile Stiffness Modulus (ITSM) Test
Stiffness modulus gives an indication as to the expected performance of the
respective bituminous layers of a road pavement in service. The performance in
this regard is with respect to the ability of the layer to effectively spread traffic
loading safely without imposing significant stresses/strains on the underlying
layers. Therefore knowledge of stiffness property of any layer in such road
pavements is required for adequate structural design. This property, for
bituminous mixtures is strongly dependent on the temperature and frequency
(period) of loading (Read and Whiteoak, 2003).
The Indirect Tensile Stiffness Modulus test is the common means of measuring
this property of bituminous mixtures in the UK. In fact the ITSM test has been
reported as the most frequently conducted test in the NAT (Wu, 2009). Apart
from being inexpensive, the test is simple and can be quickly conducted compared
Chapter 6 Detailed Investigation of the Mechanical Properties of Cold Bituminous Emulsion Mixtures under Laboratory
Simulated Tropical Conditions
197
to other traditional means of testing the stiffness modulus of bituminous
mixtures. Brown (1995) reported that up to 100 specimens can be tested for
ITSM in a working day. Experience from the studies reported in this chapter
confirms such claims as at some point about 120 specimens were successfully
completed in about 9hrs. Another advantage of this test is that it allows cylindrical
specimens, usually either 100 or 150mm in diameter to be tested. The test
specimen does not need to be long, typically 30 to 80mm, which is convenient
when coring pavements. The load to be applied is lower than that required, for
example in a direct compression test. The test also offers a convenient means of
applying tensile stress under compressive loading (Brown, 1995).
ITSM tests are regarded as non-destructive tests and are normally conducted
using the BS DD 213: 1993 as a guide. Plate A in Figure 6.9 shows the ITSM
testing mode in the NAT. A summary of the test protocol from the mentioned
standard is detailed in Table 6.7. It is worth noting however that, the target
horizontal deformation used in this study was 3 μm due to the fragile nature of
the specimens. Santagata et al (2009) used a target of 2 μm in their work and
found it very useful for cold mixtures. All specimens tested in this study were
100±2mm in diameter and 50±2mm thick. Also, tests were conducted at 30⁰C
and 40⁰C as well as the standard of 20⁰C. In addition, the standard requires that
all specimens are tested twice on diameters 90⁰±10⁰ apart and the measurements
are averaged and recorded as the result, though with the condition that such
measurements do not differ by more than 10%. This was followed in this study
except for occasions where specimens were too fragile. Prior to testing, all
specimens must have been brought to the required test temperature in the
conditioning cabinet (for about 7hrs). During the test, once information on
deformation (measured by two Linear Variable Differential Transformers - LVDTs),
load, specimen dimensions and Poisson‟s ratio are available, equation 6.9 applies
for the stiffness modulus.
6.8.1 Stiffness Modulus Response and CBEM Composition
Measurements were made for the specimens at the early life, intermediate life
and fully cured conditions. The indirect tensile stiffness modulus (ITSM) responses
as presented here were measured at 20⁰C after curing for the respective cases
discussed. Before delving into the investigation in full, an attempt was made to
check the effectiveness of the chosen curing protocols which simulate early life
(12hrs at 40⁰C), intermediate life (72hrs at 40⁰C) and fully cured (96hrs at 40⁰C)
conditions. The short analysis was based only on CBEMs mixed and compacted at
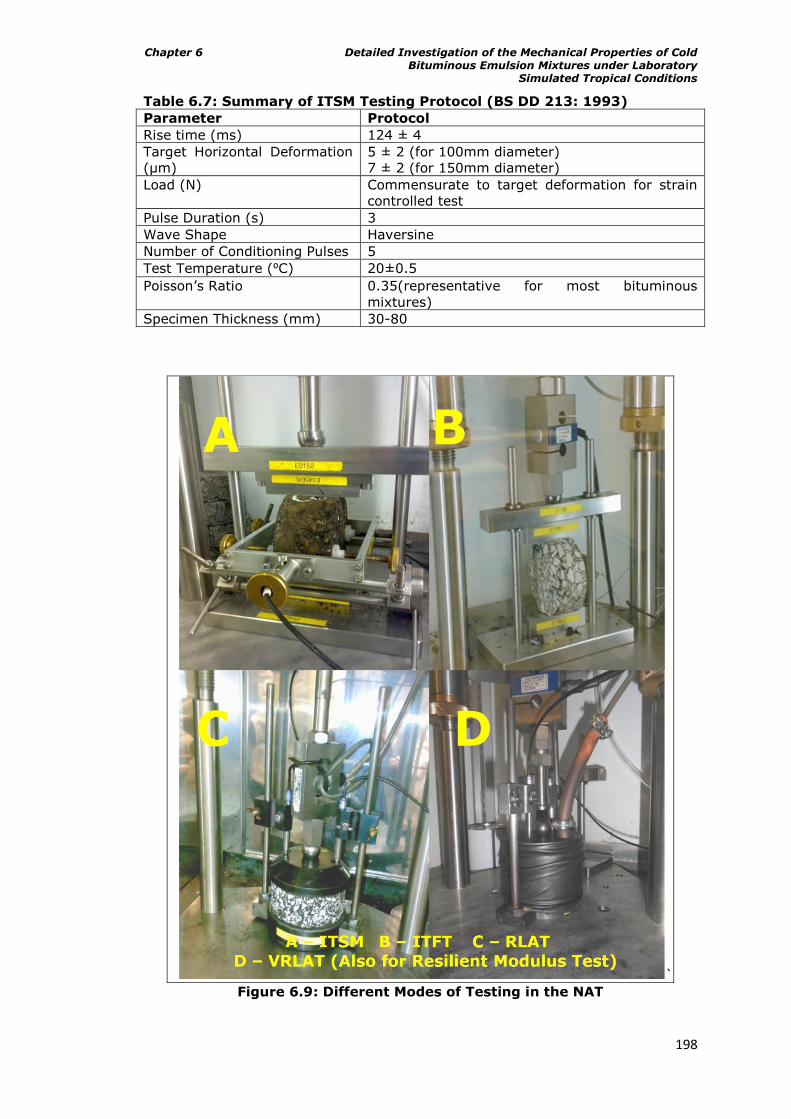
Chapter 6 Detailed Investigation of the Mechanical Properties of Cold Bituminous Emulsion Mixtures under Laboratory
Simulated Tropical Conditions
198
Table 6.7: Summary of ITSM Testing Protocol (BS DD 213: 1993)
Parameter Protocol
Rise time (ms) 124 ± 4
Target Horizontal Deformation
(μm)
5 ± 2 (for 100mm diameter)
7 ± 2 (for 150mm diameter)
Load (N) Commensurate to target deformation for strain
controlled test
Pulse Duration (s) 3
Wave Shape Haversine
Number of Conditioning Pulses 5
Test Temperature (⁰C) 20±0.5
Poisson‟s Ratio 0.35(representative for most bituminous
mixtures)
Specimen Thickness (mm) 30-80
`
Figure 6.9: Different Modes of Testing in the NAT
Chapter 6 Detailed Investigation of the Mechanical Properties of Cold Bituminous Emulsion Mixtures under Laboratory
Simulated Tropical Conditions
199
32⁰C using a compactive effort of 200 gyrations. All the observed measurements
were tested for normality. The statistics for the measurements were also
ascertained. The results of the One-Sample Kolmogorov-Smirnov (Normality) Test
on the measured ITSM values are as detailed in Table 6.8 while some of the
statistics are as detailed in Table 6.9. Figure 6.10 shows the effect of the curing
protocols on the ITSM responses of the CBEMs. The result of the normality test
indicated that the measurements were normally distributed since all the values in
Asymp. Sig. (2-tailed) row were greater than 0.05. The higher this value the
better the goodness of fit. The figure shows a logical trend since it generally
indicates that the longer the time of curing the higher the ITSM. The steeper
trend observed for 60⁰C 96hrs compared to that of 40⁰C 12hrs and 40⁰C 72hrs is
attributable to the change in temperature. These protocols are here assumed to
be good enough to simulate the desired conditions.
6.8.1.1 ITSM and CBEM composition at early life condition
The ITSM values were measured for all the five CBEMs produced under the
simulated early life condition. As done previously, all the observed measurements
were tested for normality. The results of the One-Sample Kolmogorov-Smirnov
(Normality) Test on the measured ITSM values for simulated early life condition
are as detailed in Table 6.10. The result indicated that the measurements were
similarly normally distributed since all the values in Asymp. Sig. (2-tailed) row
were greater than 0.05. The Table contains also the values for the standard
deviation and means of ITSM for five CBEMs. More importantly, the results
generally indicate that the ITSM test was good enough at ranking the CBEMs in
the expected logical order at this early life condition.
Figure 6.11 and Table 6.11 show the results and the percentage improvements in
ITSM of the CBEMs over the VACBEM at simulated early life condition. They are in
agreement with earlier findings reported on compactability. The other CBEMs
performed better than the VACBEM. 5dmmCBEM had the least percentage
improvement of 8.8% while 20dmmCBEM had the highest of 32%. As the
penetration of the residual binder in the severely aged RAP increases, there is a
corresponding increase in ITSM. The trend in Figure 6.11 however suggests that
the ITSM values might plateau just after the 20dmmCBEM as previously observed
for compactability of the CBEMs in the early life. This gives an indication that
there is probably a correlation between the compactability of the CBEMs and the
corresponding ITSM value. Such relationship exits for HMA (Tayebali et al, 1994).
This is investigated in this chapter.
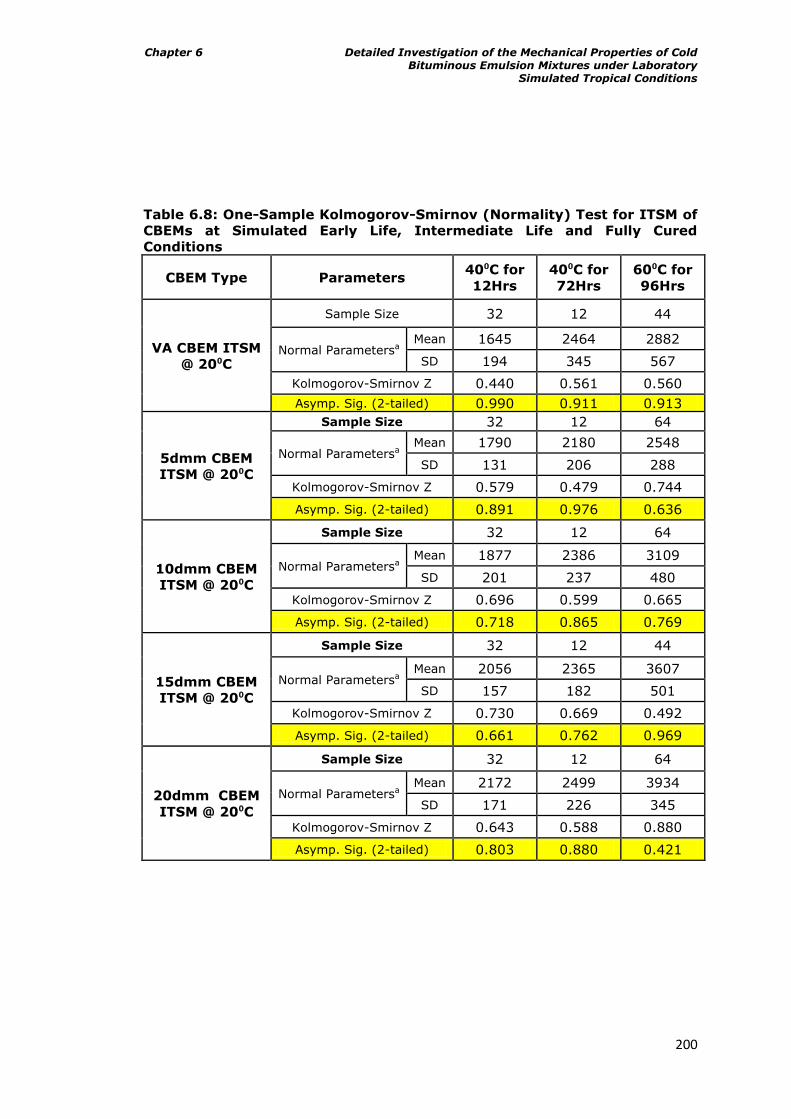
Chapter 6 Detailed Investigation of the Mechanical Properties of Cold Bituminous Emulsion Mixtures under Laboratory
Simulated Tropical Conditions
200
Table 6.8: One-Sample Kolmogorov-Smirnov (Normality) Test for ITSM of
CBEMs at Simulated Early Life, Intermediate Life and Fully Cured
Conditions
CBEM Type Parameters 40⁰C for
12Hrs
40⁰C for
72Hrs
60⁰C for
96Hrs
VA CBEM ITSM
@ 20⁰C
Sample Size 32 12 44
Normal Parametersa Mean 1645 2464 2882
SD 194 345 567
Kolmogorov-Smirnov Z 0.440 0.561 0.560
Asymp. Sig. (2-tailed) 0.990 0.911 0.913
5dmm CBEM
ITSM @ 20⁰C
Sample Size 32 12 64
Normal Parametersa Mean 1790 2180 2548
SD 131 206 288
Kolmogorov-Smirnov Z 0.579 0.479 0.744
Asymp. Sig. (2-tailed) 0.891 0.976 0.636
10dmm CBEM
ITSM @ 20⁰C
Sample Size 32 12 64
Normal Parametersa Mean 1877 2386 3109
SD 201 237 480
Kolmogorov-Smirnov Z 0.696 0.599 0.665
Asymp. Sig. (2-tailed) 0.718 0.865 0.769
15dmm CBEM
ITSM @ 20⁰C
Sample Size 32 12 44
Normal Parametersa Mean 2056 2365 3607
SD 157 182 501
Kolmogorov-Smirnov Z 0.730 0.669 0.492
Asymp. Sig. (2-tailed) 0.661 0.762 0.969
20dmm CBEM
ITSM @ 20⁰C
Sample Size 32 12 64
Normal Parametersa Mean 2172 2499 3934
SD 171 226 345
Kolmogorov-Smirnov Z 0.643 0.588 0.880
Asymp. Sig. (2-tailed) 0.803 0.880 0.421
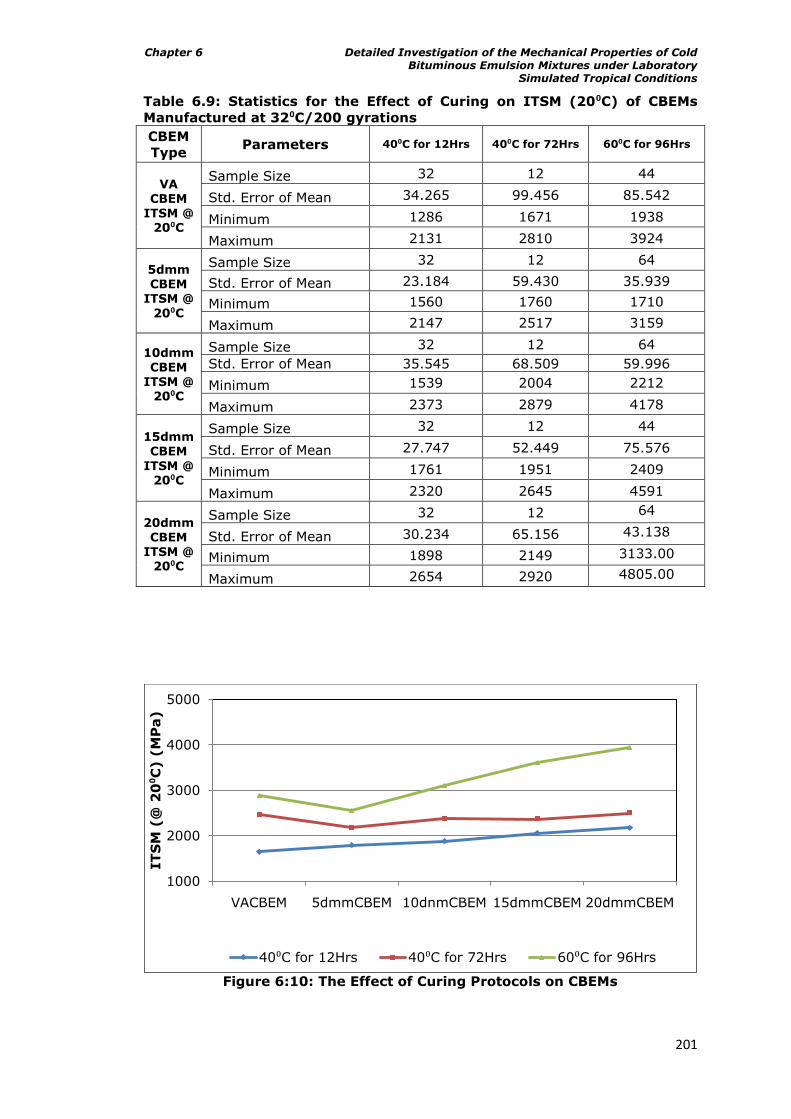
Chapter 6 Detailed Investigation of the Mechanical Properties of Cold Bituminous Emulsion Mixtures under Laboratory
Simulated Tropical Conditions
201
Table 6.9: Statistics for the Effect of Curing on ITSM (20⁰C) of CBEMs
Manufactured at 32⁰C/200 gyrations
CBEM
Type Parameters 40⁰C for 12Hrs 40⁰C for 72Hrs 60⁰C for 96Hrs
VA CBEM
ITSM @ 20⁰C
Sample Size 32 12 44
Std. Error of Mean 34.265 99.456 85.542
Minimum 1286 1671 1938
Maximum 2131 2810 3924
5dmm CBEM
ITSM @ 20⁰C
Sample Size 32 12 64
Std. Error of Mean 23.184 59.430 35.939
Minimum 1560 1760 1710
Maximum 2147 2517 3159
10dmm CBEM
ITSM @ 20⁰C
Sample Size 32 12 64
Std. Error of Mean 35.545 68.509 59.996
Minimum 1539 2004 2212
Maximum 2373 2879 4178
15dmm CBEM
ITSM @ 20⁰C
Sample Size 32 12 44
Std. Error of Mean 27.747 52.449 75.576
Minimum 1761 1951 2409
Maximum 2320 2645 4591
20dmm CBEM
ITSM @ 20⁰C
Sample Size 32 12 64
Std. Error of Mean 30.234 65.156 43.138
Minimum 1898 2149 3133.00
Maximum 2654 2920 4805.00
Figure 6:10: The Effect of Curing Protocols on CBEMs
1000
2000
3000
4000
5000
VACBEM 5dmmCBEM 10dnmCBEM 15dmmCBEM 20dmmCBEM
IT
SM
(@
20⁰C
) (
MP
a)
40⁰C for 12Hrs 40⁰C for 72Hrs 60⁰C for 96Hrs
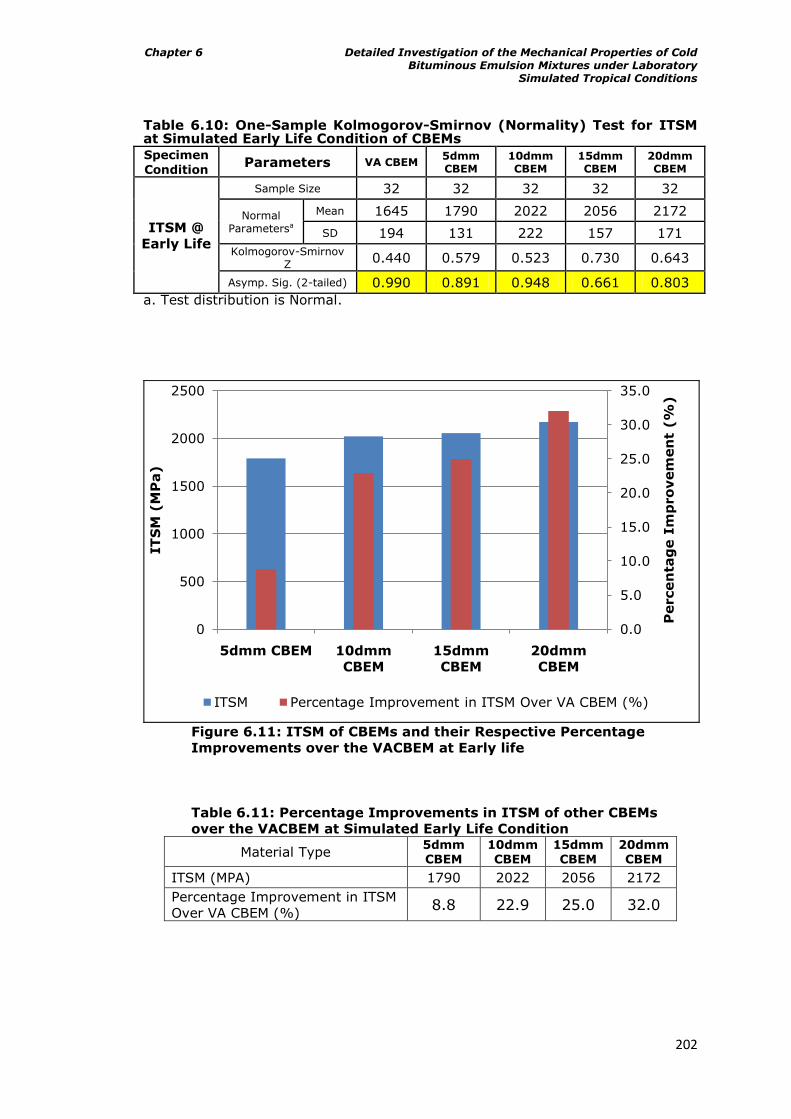
Chapter 6 Detailed Investigation of the Mechanical Properties of Cold Bituminous Emulsion Mixtures under Laboratory
Simulated Tropical Conditions
202
Table 6.10: One-Sample Kolmogorov-Smirnov (Normality) Test for ITSM at Simulated Early Life Condition of CBEMs Specimen
Condition Parameters VA CBEM
5dmm CBEM
10dmm CBEM
15dmm CBEM
20dmm CBEM
ITSM @
Early Life
Sample Size 32 32 32 32 32
Normal Parametersa
Mean 1645 1790 2022 2056 2172
SD 194 131 222 157 171
Kolmogorov-Smirnov Z
0.440 0.579 0.523 0.730 0.643
Asymp. Sig. (2-tailed) 0.990 0.891 0.948 0.661 0.803
a. Test distribution is Normal.
Figure 6.11: ITSM of CBEMs and their Respective Percentage
Improvements over the VACBEM at Early life
Table 6.11: Percentage Improvements in ITSM of other CBEMs
over the VACBEM at Simulated Early Life Condition
Material Type 5dmm CBEM
10dmm CBEM
15dmm CBEM
20dmm CBEM
ITSM (MPA) 1790 2022 2056 2172
Percentage Improvement in ITSM
Over VA CBEM (%) 8.8 22.9 25.0 32.0
0.0
5.0
10.0
15.0
20.0
25.0
30.0
35.0
0
500
1000
1500
2000
2500
5dmm CBEM 10dmm
CBEM
15dmm
CBEM
20dmm
CBEMP
ercen
tag
e I
mp
ro
vem
en
t (%
)
IT
SM
(M
Pa)
ITSM Percentage Improvement in ITSM Over VA CBEM (%)
Chapter 6 Detailed Investigation of the Mechanical Properties of Cold Bituminous Emulsion Mixtures under Laboratory
Simulated Tropical Conditions
203
6.8.1.2 ITSM and CBEM composition at intermediate life condition
All the specimens prepared for the intermediate life condition were similarly
tested for ITSM. The study here afforded the opportunity to investigate the effect
of compactive effort and temperature of mixing and compaction on the ITSM
responses of CBEMs as was done for compactability.
The results of the One-Sample Kolmogorov-Smirnov (Normality) Test on the
measured ITSM values for simulated intermediate life of CBEMs are detailed in
Table 6.12. The results again indicated that the measurements were normally
distributed as all the values in Asymp. Sig. (2-tailed) row were greater than 0.05.
The table similarly contains the standard deviation and mean values of the
distribution. Figure 6.12 shows the ITSM responses of the CBEMs at the simulated
intermediate life. The figure indicates that, the ITSM was not good enough to rank
the CBEMs at the intermediate life condition as there is no clear trend observed
compared to the early life condition. However, the figure shows that all the CBEMs
mixed and compacted at 32⁰C have ITSM values clearly above 2000MPa
(irrespective of the compactive effort applied) which indicates that the CBEMs are
progressively evolving when compared to those values observed for early life.
Table 6.13 and Figure 6.13 both detail the percentage improvements in ITSM of
RAP CBEMs over those for the VACBEM at simulated intermediate life condition.
Figure 6.13 in particular corroborates the earlier observation of lack of clear
trend. The VACBEM performed better in all cases with the exception of the
20dmmCBEM. The 5dmmCBEM and 15dmmCBEM only indicated better
performances at the mixing and compaction temperature of 20⁰C and compactive
effort of 200 gyrations. 10dmmCBEM generally was poorer than VACBEM as
observed in the figure. It was also observed from Figure 6.12 that the ITSM
responses at the mixing and compaction temperature of 20⁰C with the low
compactive effort of 100 gyrations were higher than those for higher compactive
effort of 200 gyrations for the VACBEM and 5dmmCBEM. The only reasonable
explanation is that at such operational temperature, the optimum degree of
compactness of the mix facilitated by the presence of fluid (moisture and
emulsion) was reached at very near 100 gyrations under aggregate-fluid-
aggregate interaction in the matrix, with the 5dmm RAP behaving just as the
virgin aggregates i.e. black rock. Black rock is a RAP in which the residual binder
in it is regarded as inactive or not contributing to the properties of the new mix.
Beyond 100 gyrations, aggregate-aggregate interaction plays a predominant role
in the matrix, and with further compaction, defragmentation of the coarse
aggregates in the mix starts to occur. This ordinarily will alter and accordingly
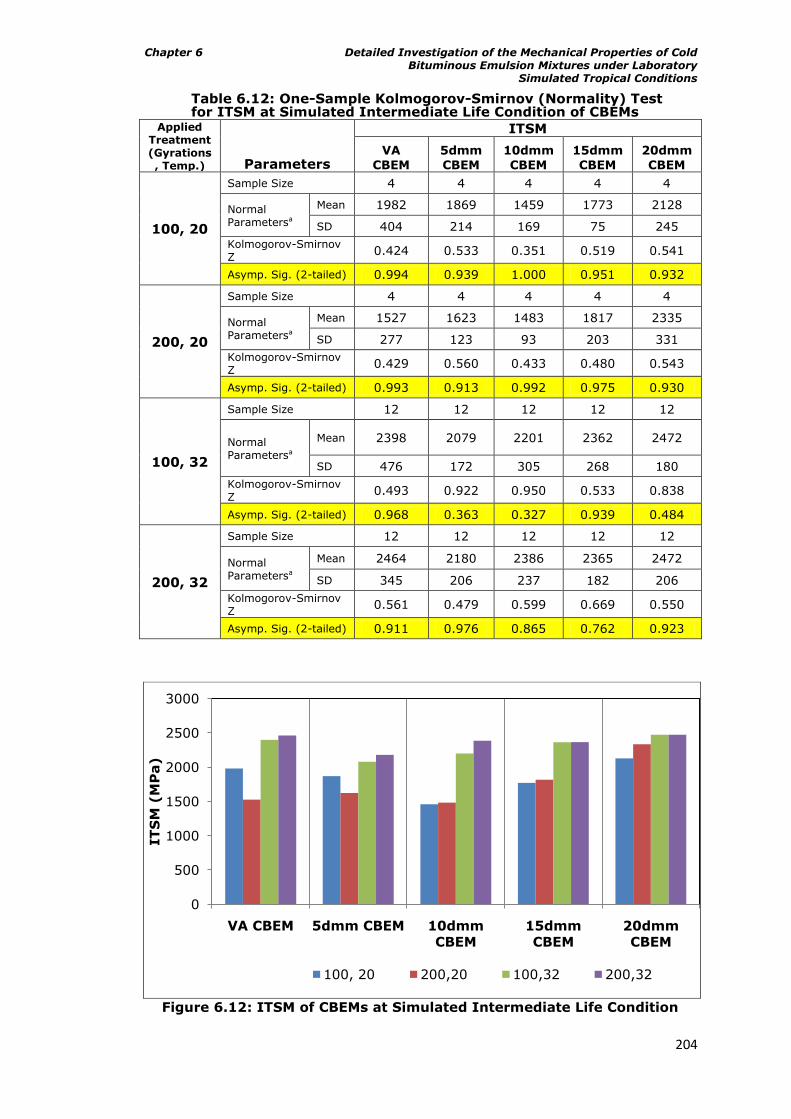
Chapter 6 Detailed Investigation of the Mechanical Properties of Cold Bituminous Emulsion Mixtures under Laboratory
Simulated Tropical Conditions
204
Table 6.12: One-Sample Kolmogorov-Smirnov (Normality) Test for ITSM at Simulated Intermediate Life Condition of CBEMs
Applied Treatment (Gyrations, Temp.) Parameters
ITSM
VA
CBEM
5dmm
CBEM
10dmm
CBEM
15dmm
CBEM
20dmm
CBEM
100, 20
Sample Size 4 4 4 4 4
Normal Parametersa
Mean 1982 1869 1459 1773 2128
SD 404 214 169 75 245
Kolmogorov-Smirnov Z
0.424 0.533 0.351 0.519 0.541
Asymp. Sig. (2-tailed) 0.994 0.939 1.000 0.951 0.932
200, 20
Sample Size 4 4 4 4 4
Normal Parametersa
Mean 1527 1623 1483 1817 2335
SD 277 123 93 203 331
Kolmogorov-Smirnov Z
0.429 0.560 0.433 0.480 0.543
Asymp. Sig. (2-tailed) 0.993 0.913 0.992 0.975 0.930
100, 32
Sample Size 12 12 12 12 12
Normal Parametersa
Mean 2398 2079 2201 2362 2472
SD 476 172 305 268 180
Kolmogorov-Smirnov Z
0.493 0.922 0.950 0.533 0.838
Asymp. Sig. (2-tailed) 0.968 0.363 0.327 0.939 0.484
200, 32
Sample Size 12 12 12 12 12
Normal Parametersa
Mean 2464 2180 2386 2365 2472
SD 345 206 237 182 206
Kolmogorov-Smirnov Z
0.561 0.479 0.599 0.669 0.550
Asymp. Sig. (2-tailed) 0.911 0.976 0.865 0.762 0.923
Figure 6.12: ITSM of CBEMs at Simulated Intermediate Life Condition
0
500
1000
1500
2000
2500
3000
VA CBEM 5dmm CBEM 10dmm
CBEM
15dmm
CBEM
20dmm
CBEM
IT
SM
(M
Pa)
100, 20 200,20 100,32 200,32
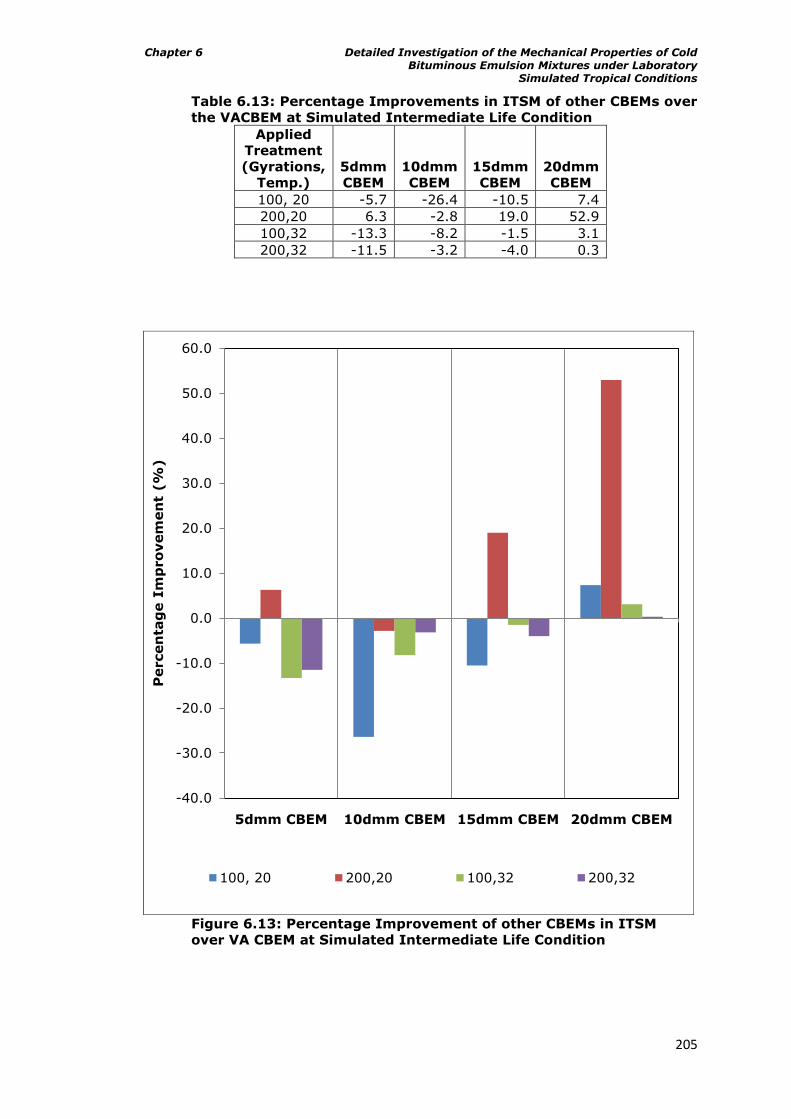
Chapter 6 Detailed Investigation of the Mechanical Properties of Cold Bituminous Emulsion Mixtures under Laboratory
Simulated Tropical Conditions
205
Table 6.13: Percentage Improvements in ITSM of other CBEMs over
the VACBEM at Simulated Intermediate Life Condition
Applied
Treatment
(Gyrations,
Temp.)
5dmm
CBEM
10dmm
CBEM
15dmm
CBEM
20dmm
CBEM
100, 20 -5.7 -26.4 -10.5 7.4
200,20 6.3 -2.8 19.0 52.9
100,32 -13.3 -8.2 -1.5 3.1
200,32 -11.5 -3.2 -4.0 0.3
Figure 6.13: Percentage Improvement of other CBEMs in ITSM
over VA CBEM at Simulated Intermediate Life Condition
-40.0
-30.0
-20.0
-10.0
0.0
10.0
20.0
30.0
40.0
50.0
60.0
5dmm CBEM 10dmm CBEM 15dmm CBEM 20dmm CBEM
Percen
tag
e I
mp
ro
vem
en
t (%
)
100, 20 200,20 100,32 200,32
Chapter 6 Detailed Investigation of the Mechanical Properties of Cold Bituminous Emulsion Mixtures under Laboratory
Simulated Tropical Conditions
206
weaken the skeleton of the matrix responsible for strength and stiffness.
The ITSM responses of the 10dmmCBEM, 15dmmCBEM and 20dmmCBEM at these
mixing and compaction temperatures with similar compactive efforts were logical
though with a significant difference noticed in the latter of the three. This
suggests that the 10dmm, 15dmm and 20dmm RAPs were not completely acting
as black rock at these temperatures, with improvement as penetration value of
the residual bitumen increases. These observations which are probably
attributable to the fact that the CBEMs are still evolving at this stage confirm the
views expressed by other researchers (Ibrahim, 1998; and Thanaya, 2003) on
CBEMs that they are complex materials.
6.8.1.3 ITSM and CBEM composition at fully cured condition
A further investigation though similar in procedure to that of the preceding
section was conducted on fully cured specimens. The results of the One-Sample
Kolmogorov-Smirnov (Normality) Test on the measured ITSM values for simulated
fully cured condition of CBEMs are detailed in Table 6.14. The results indicate a
normal distribution for the measurements as all the values in Asymp. Sig. (2-
tailed) row were greater than 0.05. Figure 6.14 shows the general ITSM
responses of the CBEMs at fully cured condition. The trend of ITSM responses as
observed in the figure is clearer here than was in the preceding section. All ITSM
responses seem to be logical here (irrespective of mode of manufacture). Table
6.15 and Figure 6.15 show a similar trend for percentage improvements of RAP
CBEMs in ITSM over the VACBEM. As observed here, the VACBEM was superior in
ITSM response compared to the 5dmmCBEM. Also, there is an indication of better
performance over the 10dmmCBEM and 15dmmCBEM by the VACBEM generally at
the mixing and compaction temperature of 20⁰C irrespective of the compactive
effort applied.
Although the 20dmmCBEM significantly improved here compared to the
intermediate life ITSM responses, the figure indicates the best response as
expected at mixing and compaction temperature of 32⁰C but at the lower
compactive effort of 100 gyrations. Meanwhile, as more bars are now on the
positive side of percentage improvement over the VACBEM when compared to
those of the preceding section, it therefore suggests that the CBEM is still
improving with increasing binder penetration and only further research validated
by field results can confirm where this ultimately stops.
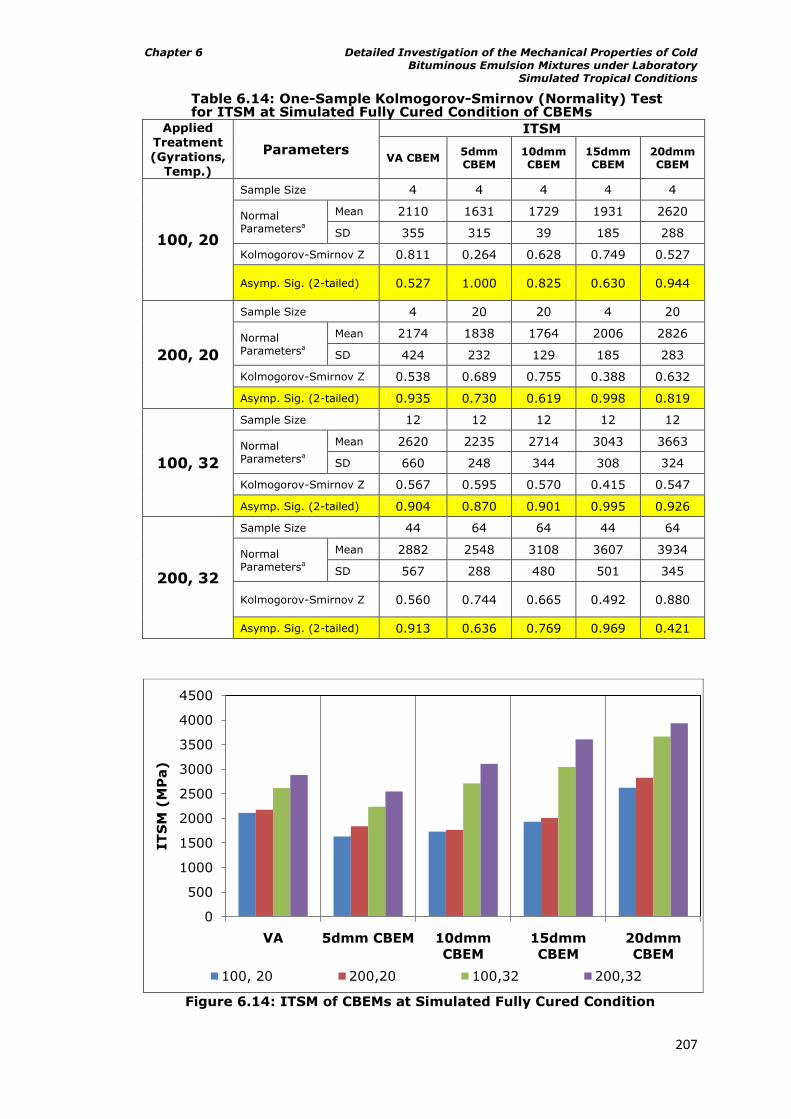
Chapter 6 Detailed Investigation of the Mechanical Properties of Cold Bituminous Emulsion Mixtures under Laboratory
Simulated Tropical Conditions
207
Table 6.14: One-Sample Kolmogorov-Smirnov (Normality) Test for ITSM at Simulated Fully Cured Condition of CBEMs
Applied Treatment (Gyrations,
Temp.)
Parameters
ITSM
VA CBEM 5dmm CBEM
10dmm CBEM
15dmm CBEM
20dmm CBEM
100, 20
Sample Size 4 4 4 4 4
Normal Parametersa
Mean 2110 1631 1729 1931 2620
SD 355 315 39 185 288
Kolmogorov-Smirnov Z 0.811 0.264 0.628 0.749 0.527
Asymp. Sig. (2-tailed) 0.527 1.000 0.825 0.630 0.944
200, 20
Sample Size 4 20 20 4 20
Normal Parametersa
Mean 2174 1838 1764 2006 2826
SD 424 232 129 185 283
Kolmogorov-Smirnov Z 0.538 0.689 0.755 0.388 0.632
Asymp. Sig. (2-tailed) 0.935 0.730 0.619 0.998 0.819
100, 32
Sample Size 12 12 12 12 12
Normal Parametersa
Mean 2620 2235 2714 3043 3663
SD 660 248 344 308 324
Kolmogorov-Smirnov Z 0.567 0.595 0.570 0.415 0.547
Asymp. Sig. (2-tailed) 0.904 0.870 0.901 0.995 0.926
200, 32
Sample Size 44 64 64 44 64
Normal Parametersa
Mean 2882 2548 3108 3607 3934
SD 567 288 480 501 345
Kolmogorov-Smirnov Z 0.560 0.744 0.665 0.492 0.880
Asymp. Sig. (2-tailed) 0.913 0.636 0.769 0.969 0.421
Figure 6.14: ITSM of CBEMs at Simulated Fully Cured Condition
0
500
1000
1500
2000
2500
3000
3500
4000
4500
VA 5dmm CBEM 10dmm
CBEM
15dmm
CBEM
20dmm
CBEM
IT
SM
(M
Pa)
100, 20 200,20 100,32 200,32
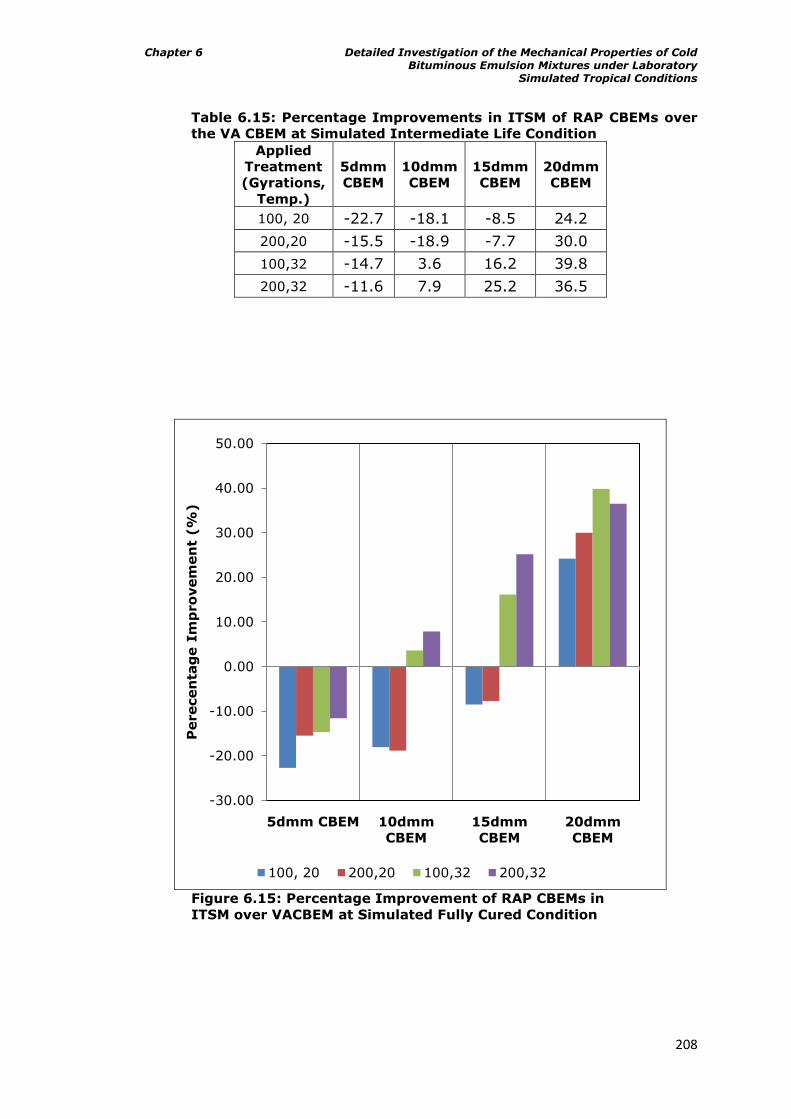
Chapter 6 Detailed Investigation of the Mechanical Properties of Cold Bituminous Emulsion Mixtures under Laboratory
Simulated Tropical Conditions
208
Table 6.15: Percentage Improvements in ITSM of RAP CBEMs over
the VA CBEM at Simulated Intermediate Life Condition
Applied
Treatment
(Gyrations,
Temp.)
5dmm
CBEM
10dmm
CBEM
15dmm
CBEM
20dmm
CBEM
100, 20 -22.7 -18.1 -8.5 24.2
200,20 -15.5 -18.9 -7.7 30.0
100,32 -14.7 3.6 16.2 39.8
200,32 -11.6 7.9 25.2 36.5
Figure 6.15: Percentage Improvement of RAP CBEMs in
ITSM over VACBEM at Simulated Fully Cured Condition
-30.00
-20.00
-10.00
0.00
10.00
20.00
30.00
40.00
50.00
5dmm CBEM 10dmm
CBEM
15dmm
CBEM
20dmm
CBEM
Perecen
tag
e I
mp
ro
vem
en
t (%
)
100, 20 200,20 100,32 200,32
Chapter 6 Detailed Investigation of the Mechanical Properties of Cold Bituminous Emulsion Mixtures under Laboratory
Simulated Tropical Conditions
209
The observed trend again confirms that CBEMs are complex materials. The ITSM
responses indicate that they are in some cases not clearly predictable especially
when severely aged RAPs such as the 5dmm and 10dmm RAPs are involved.
Although the ITSM test clearly ranked the CBEMs in early life as earlier observed,
since the trends observed for subsequent simulated life conditions were in some
cases not clear, characterisation of the mechanical performance of CBEMs by the
ITSM test should be complemented with other tests to gain more knowledge on
the behaviour of the materials. Thus the good performance of VACBEM as
observed in the preceding section (intermediate life condition) and even at this
fully cured condition over some of the RAP CBEMs should be interpreted with
caution. The very high air void contents consistently observed for VACBEM in
sections 6.7.1 and 6.7.2 of this chapter compared to the RAP CBEMs obviously
predisposes it to problems associated with durability in bituminous mixtures.
6.8.2 Temperature and ITSM response of CBEMs
Ascertaining the temperature susceptibility of bituminous materials is required in
order to have a good knowledge of such materials in service under extreme
conditions. Naturally bitumen is temperature susceptible i.e. becomes brittle at
low temperatures and gets increasingly less viscous and ready to flow at high
temperatures. While low temperatures make such materials susceptible to
cracking they are prone to rutting at high temperatures. Under such hot
conditions too, oxidative ageing is enhanced especially when the mixture is highly
porous. A properly constituted mixture however should be able to weather
through these extremes without necessarily reducing the overall structural
integrity of the road pavement.
An attempt was thus made to ascertain the thermal susceptibilities of the five
CBEMS. Only CBEMs that simulate intermediate life and fully cured conditions
were considered. Materials simulating early life were excluded due to their fragile
nature. The study here examined the effects of CBEM material type, mixing and
compaction temperature and compactive effort on the stiffness properties of the
materials. Four specimens were studied at each observation level. In order to
reduce variations, the same sets of specimens were studied at each of the chosen
testing temperatures of 20⁰C, 30⁰C and 40⁰C. These testing temperatures have
been considered appropriate based on the pavement temperature prediction
model suggested earlier in Chapter 5 i.e.
Tsurf = Tair – 0.00618 lat2 + 0.2289 lat + 24.4 6.14
Td = Tsurf (1 -0.063d + 0.007 d2 – 0.0004d3) 6.15
Chapter 6 Detailed Investigation of the Mechanical Properties of Cold Bituminous Emulsion Mixtures under Laboratory
Simulated Tropical Conditions
210
Where
Tair = Average yearly ambient air temperature (32⁰C for Max and 21⁰C for Min;
Nigerian conditions, BBC Weather, 2008)
Tsurf = Temperature at the surface of pavement (in ⁰F)
Td = Temperature at the desired depth in pavement (in ⁰F)
d = Desired depth in pavement (in inches)
lat = Latitude of location (7.4⁰ for Ibadan, Nigeria)
At the stated temperatures for Tair (maximum and minimum alike) and a
pavement depth of 150mm (taking an overlay of 50mm, and a road base of
200mm for example),
Tsurf maximum = 57.76⁰C
Tsurf minimum = 46.76⁰C
Td(150mm) maximum = 41.76⁰C
Td(150mm) minimum = 33.2⁰C
These were rounded to 30⁰C and 40⁰C for ease. A temperature of 20⁰C was
included being the standard for ITSM tests.
Table 6.16 details a summary of the ITSM results along with the respective
average air void contents of the specimens. Figures 6.16 to 6.19 are relevant
here. Figures 6.16 and 6.18 detail the ITSM responses of CBEMs conditioned to
simulate intermediate life while Figures 6.17 and 6.19 depict the ITSM responses
for those conditioned to simulate fully cured. Table 6.17 details the percentage
loss in ITSM of CBEMs due to temperature increase.
The relevant figures for intermediate life show that the ITSM responses for the
CBEMs were generally below 2500MPa irrespective of testing temperature. This
observation is not unexpected as the CBEMs are still evolving at this point. The
CBEMs did not follow a distinct trend at intermediate life when compared to those
that had been fully cured. Also the effect of mixing and compaction temperature
is not as clear as observed for the fully cured condition.
ITSM responses tested at 20⁰C for fully cured CBEMs mixed and compacted at
32⁰C were generally above 2500MPa (with the exception of the 5dmmCBEM)
irrespective of the compactive effort applied as observed in Figures 6.17 and
6.19. However, the responses dropped to around 1500MPa for ITSM tests
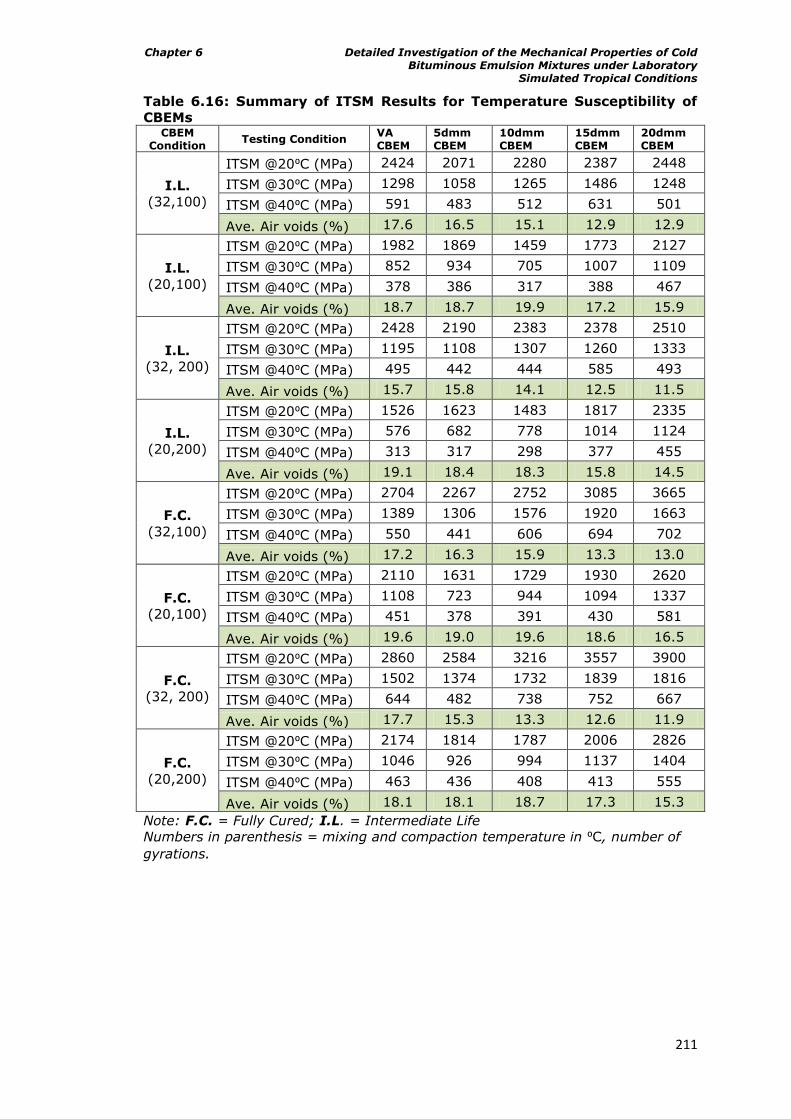
Chapter 6 Detailed Investigation of the Mechanical Properties of Cold Bituminous Emulsion Mixtures under Laboratory
Simulated Tropical Conditions
211
Table 6.16: Summary of ITSM Results for Temperature Susceptibility of
CBEMs CBEM
Condition Testing Condition
VA CBEM
5dmm CBEM
10dmm CBEM
15dmm CBEM
20dmm CBEM
I.L.
(32,100)
ITSM @20⁰C (MPa) 2424 2071 2280 2387 2448
ITSM @30⁰C (MPa) 1298 1058 1265 1486 1248
ITSM @40⁰C (MPa) 591 483 512 631 501
Ave. Air voids (%) 17.6 16.5 15.1 12.9 12.9
I.L.
(20,100)
ITSM @20⁰C (MPa) 1982 1869 1459 1773 2127
ITSM @30⁰C (MPa) 852 934 705 1007 1109
ITSM @40⁰C (MPa) 378 386 317 388 467
Ave. Air voids (%) 18.7 18.7 19.9 17.2 15.9
I.L.
(32, 200)
ITSM @20⁰C (MPa) 2428 2190 2383 2378 2510
ITSM @30⁰C (MPa) 1195 1108 1307 1260 1333
ITSM @40⁰C (MPa) 495 442 444 585 493
Ave. Air voids (%) 15.7 15.8 14.1 12.5 11.5
I.L.
(20,200)
ITSM @20⁰C (MPa) 1526 1623 1483 1817 2335
ITSM @30⁰C (MPa) 576 682 778 1014 1124
ITSM @40⁰C (MPa) 313 317 298 377 455
Ave. Air voids (%) 19.1 18.4 18.3 15.8 14.5
F.C.
(32,100)
ITSM @20⁰C (MPa) 2704 2267 2752 3085 3665
ITSM @30⁰C (MPa) 1389 1306 1576 1920 1663
ITSM @40⁰C (MPa) 550 441 606 694 702
Ave. Air voids (%) 17.2 16.3 15.9 13.3 13.0
F.C.
(20,100)
ITSM @20⁰C (MPa) 2110 1631 1729 1930 2620
ITSM @30⁰C (MPa) 1108 723 944 1094 1337
ITSM @40⁰C (MPa) 451 378 391 430 581
Ave. Air voids (%) 19.6 19.0 19.6 18.6 16.5
F.C.
(32, 200)
ITSM @20⁰C (MPa) 2860 2584 3216 3557 3900
ITSM @30⁰C (MPa) 1502 1374 1732 1839 1816
ITSM @40⁰C (MPa) 644 482 738 752 667
Ave. Air voids (%) 17.7 15.3 13.3 12.6 11.9
F.C.
(20,200)
ITSM @20⁰C (MPa) 2174 1814 1787 2006 2826
ITSM @30⁰C (MPa) 1046 926 994 1137 1404
ITSM @40⁰C (MPa) 463 436 408 413 555
Ave. Air voids (%) 18.1 18.1 18.7 17.3 15.3
Note: F.C. = Fully Cured; I.L. = Intermediate Life
Numbers in parenthesis = mixing and compaction temperature in ⁰C, number of
gyrations.
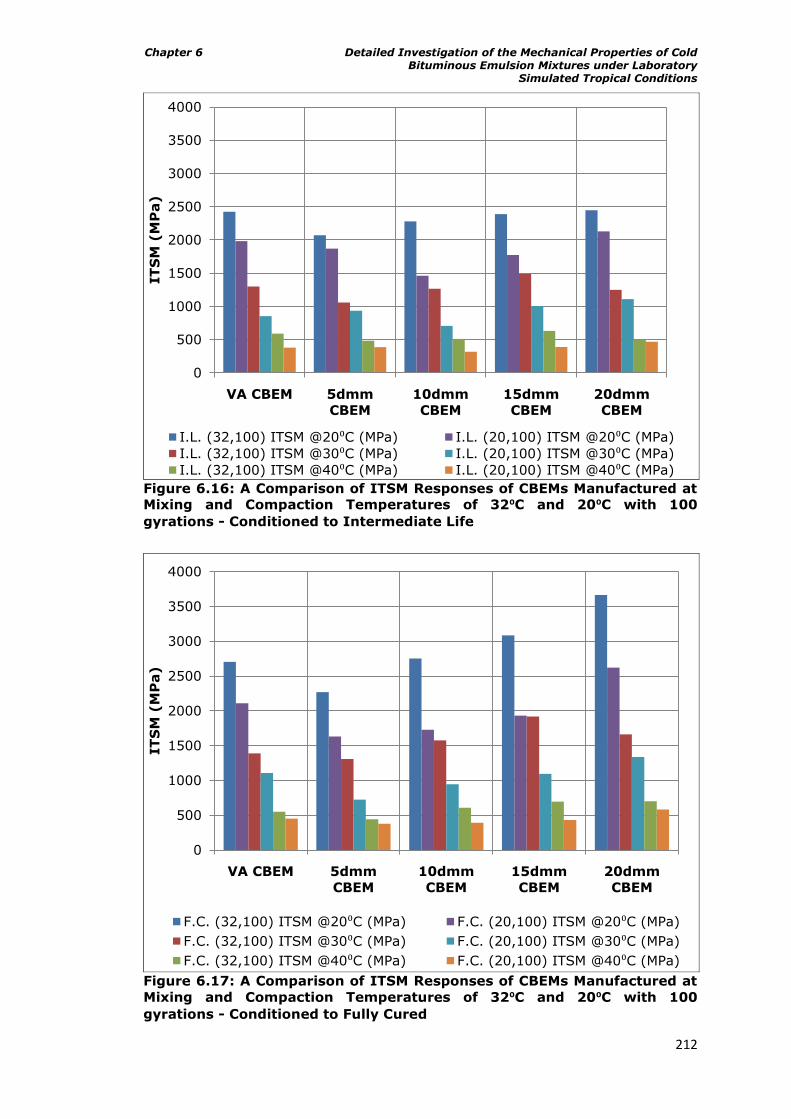
Chapter 6 Detailed Investigation of the Mechanical Properties of Cold Bituminous Emulsion Mixtures under Laboratory
Simulated Tropical Conditions
212
Figure 6.16: A Comparison of ITSM Responses of CBEMs Manufactured at
Mixing and Compaction Temperatures of 32⁰C and 20⁰C with 100
gyrations - Conditioned to Intermediate Life
Figure 6.17: A Comparison of ITSM Responses of CBEMs Manufactured at
Mixing and Compaction Temperatures of 32⁰C and 20⁰C with 100
gyrations - Conditioned to Fully Cured
0
500
1000
1500
2000
2500
3000
3500
4000
VA CBEM 5dmm
CBEM
10dmm
CBEM
15dmm
CBEM
20dmm
CBEM
IT
SM
(M
Pa)
I.L. (32,100) ITSM @20⁰C (MPa) I.L. (20,100) ITSM @20⁰C (MPa)
I.L. (32,100) ITSM @30⁰C (MPa) I.L. (20,100) ITSM @30⁰C (MPa)
I.L. (32,100) ITSM @40⁰C (MPa) I.L. (20,100) ITSM @40⁰C (MPa)
0
500
1000
1500
2000
2500
3000
3500
4000
VA CBEM 5dmm
CBEM
10dmm
CBEM
15dmm
CBEM
20dmm
CBEM
IT
SM
(M
Pa)
F.C. (32,100) ITSM @20⁰C (MPa) F.C. (20,100) ITSM @20⁰C (MPa)
F.C. (32,100) ITSM @30⁰C (MPa) F.C. (20,100) ITSM @30⁰C (MPa)
F.C. (32,100) ITSM @40⁰C (MPa) F.C. (20,100) ITSM @40⁰C (MPa)
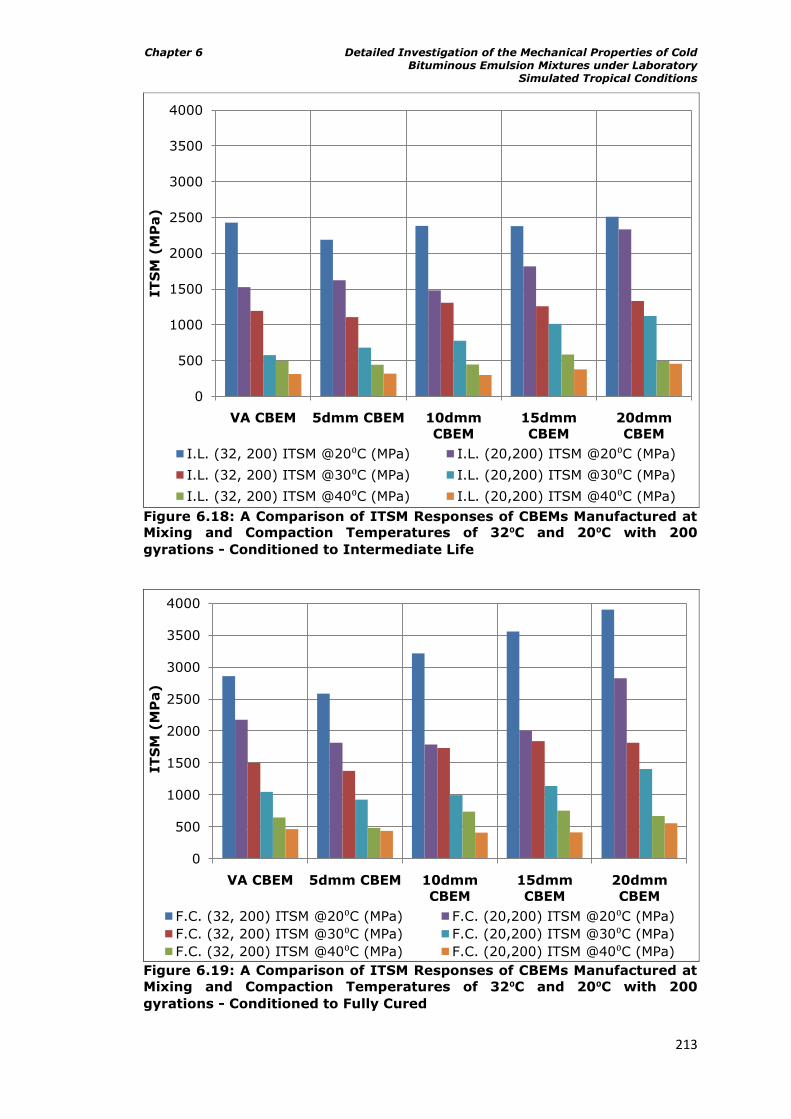
Chapter 6 Detailed Investigation of the Mechanical Properties of Cold Bituminous Emulsion Mixtures under Laboratory
Simulated Tropical Conditions
213
Figure 6.18: A Comparison of ITSM Responses of CBEMs Manufactured at
Mixing and Compaction Temperatures of 32⁰C and 20⁰C with 200
gyrations - Conditioned to Intermediate Life
Figure 6.19: A Comparison of ITSM Responses of CBEMs Manufactured at
Mixing and Compaction Temperatures of 32⁰C and 20⁰C with 200
gyrations - Conditioned to Fully Cured
0
500
1000
1500
2000
2500
3000
3500
4000
VA CBEM 5dmm CBEM 10dmm
CBEM
15dmm
CBEM
20dmm
CBEM
IT
SM
(M
Pa)
I.L. (32, 200) ITSM @20⁰C (MPa) I.L. (20,200) ITSM @20⁰C (MPa)
I.L. (32, 200) ITSM @30⁰C (MPa) I.L. (20,200) ITSM @30⁰C (MPa)
I.L. (32, 200) ITSM @40⁰C (MPa) I.L. (20,200) ITSM @40⁰C (MPa)
0
500
1000
1500
2000
2500
3000
3500
4000
VA CBEM 5dmm CBEM 10dmm
CBEM
15dmm
CBEM
20dmm
CBEM
IT
SM
(M
Pa)
F.C. (32, 200) ITSM @20⁰C (MPa) F.C. (20,200) ITSM @20⁰C (MPa)
F.C. (32, 200) ITSM @30⁰C (MPa) F.C. (20,200) ITSM @30⁰C (MPa)
F.C. (32, 200) ITSM @40⁰C (MPa) F.C. (20,200) ITSM @40⁰C (MPa)
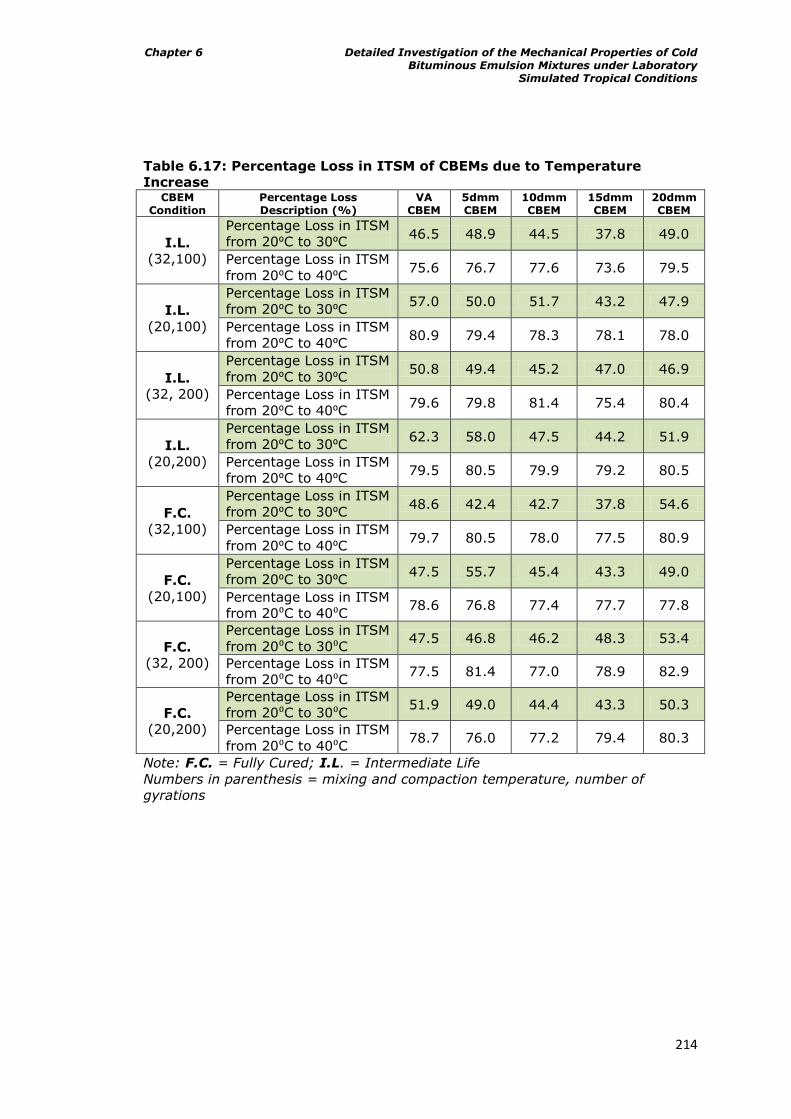
Chapter 6 Detailed Investigation of the Mechanical Properties of Cold Bituminous Emulsion Mixtures under Laboratory
Simulated Tropical Conditions
214
Table 6.17: Percentage Loss in ITSM of CBEMs due to Temperature
Increase CBEM
Condition Percentage Loss Description (%)
VA CBEM
5dmm CBEM
10dmm CBEM
15dmm CBEM
20dmm CBEM
I.L.
(32,100)
Percentage Loss in ITSM
from 20⁰C to 30⁰C 46.5 48.9 44.5 37.8 49.0
Percentage Loss in ITSM
from 20⁰C to 40⁰C 75.6 76.7 77.6 73.6 79.5
I.L.
(20,100)
Percentage Loss in ITSM
from 20⁰C to 30⁰C 57.0 50.0 51.7 43.2 47.9
Percentage Loss in ITSM
from 20⁰C to 40⁰C 80.9 79.4 78.3 78.1 78.0
I.L.
(32, 200)
Percentage Loss in ITSM
from 20⁰C to 30⁰C 50.8 49.4 45.2 47.0 46.9
Percentage Loss in ITSM
from 20⁰C to 40⁰C 79.6 79.8 81.4 75.4 80.4
I.L.
(20,200)
Percentage Loss in ITSM
from 20⁰C to 30⁰C 62.3 58.0 47.5 44.2 51.9
Percentage Loss in ITSM
from 20⁰C to 40⁰C 79.5 80.5 79.9 79.2 80.5
F.C.
(32,100)
Percentage Loss in ITSM
from 20⁰C to 30⁰C 48.6 42.4 42.7 37.8 54.6
Percentage Loss in ITSM
from 20⁰C to 40⁰C 79.7 80.5 78.0 77.5 80.9
F.C.
(20,100)
Percentage Loss in ITSM
from 20⁰C to 30⁰C 47.5 55.7 45.4 43.3 49.0
Percentage Loss in ITSM
from 20⁰C to 40⁰C 78.6 76.8 77.4 77.7 77.8
F.C.
(32, 200)
Percentage Loss in ITSM
from 20⁰C to 30⁰C 47.5 46.8 46.2 48.3 53.4
Percentage Loss in ITSM
from 20⁰C to 40⁰C 77.5 81.4 77.0 78.9 82.9
F.C.
(20,200)
Percentage Loss in ITSM
from 20⁰C to 30⁰C 51.9 49.0 44.4 43.3 50.3
Percentage Loss in ITSM
from 20⁰C to 40⁰C 78.7 76.0 77.2 79.4 80.3
Note: F.C. = Fully Cured; I.L. = Intermediate Life
Numbers in parenthesis = mixing and compaction temperature, number of
gyrations
Chapter 6 Detailed Investigation of the Mechanical Properties of Cold Bituminous Emulsion Mixtures under Laboratory
Simulated Tropical Conditions
215
conducted at 30⁰C and further down to around 650MPa for tests conducted at
40⁰C on the same specimens. The 5dmmCBEM showed the least good
performance for the three test temperatures.
The four graphs again confirm the observations made earlier on the superiority of
CBEMs prepared at 32⁰C compared to those of 20⁰C. Irrespective of the CBEM
type, the condition of curing and testing temperature for ITSM, CBEMs prepared
at 32⁰C consistently performed better than those prepared at 20⁰C even at ITSM
test temperature of 40⁰C.
Overall, the figures indicate that all the materials prepared at 32⁰C, 100 gyrations
have least loss in ITSM which suggests just enough compactive effort along with
appropriate temperature for preparation of CBEMs. More importantly, the VACBEM
as observed here indicates that it has the highest temperature susceptibility.
6.8.3 Moisture susceptibility of CBEMs
This exercise naturally follows since the temperature susceptibility test at 30⁰C
and 40⁰C did not yield clear enough results for appropriate ranking of the CBEMs.
A moisture susceptibility test was considered appropriate since the CBEMs are
subjected to the combined effects of temperature and moisture, two of the known
agents responsible for altering the durability of bituminous mixtures. More
importantly, moisture susceptibility of bituminous materials is generally agreed
among researchers as an indicative means of predicting the durability of
bituminous mixtures while in service. The presence of moisture in some
bituminous mixtures is known to also promote stripping.
The ITSM test just as was done for the temperature susceptibility test was used
here. Due to shortness of time and materials, the test was limited to specimens
prepared for intermediate life and fully cured conditions at the mixing and
compaction temperature of 32⁰C. Two protocols were used for the test. The first
involved soaking specimens in water at 20⁰C for 24hrs followed by testing for
ITSM. The ITSM tests were conducted at 20⁰C (mild condition) first and then at
30⁰C (severe condition) after specimens had been conditioned for 2hrs at that
temperature. Prior to soaking, the specimens were tested dry at 20⁰C for ITSM.
The second protocol similarly involved soaking specimens at 30⁰C for 24hrs.
These were followed by ITSM testing at 30⁰C (severe condition) first and then at
20⁰C (mild condition) after the specimens have been conditioned at that
temperature for 2hrs. Four specimens were studied at each level of observation
making a total of 32 specimens tested for each of the CBEMs. It is worth
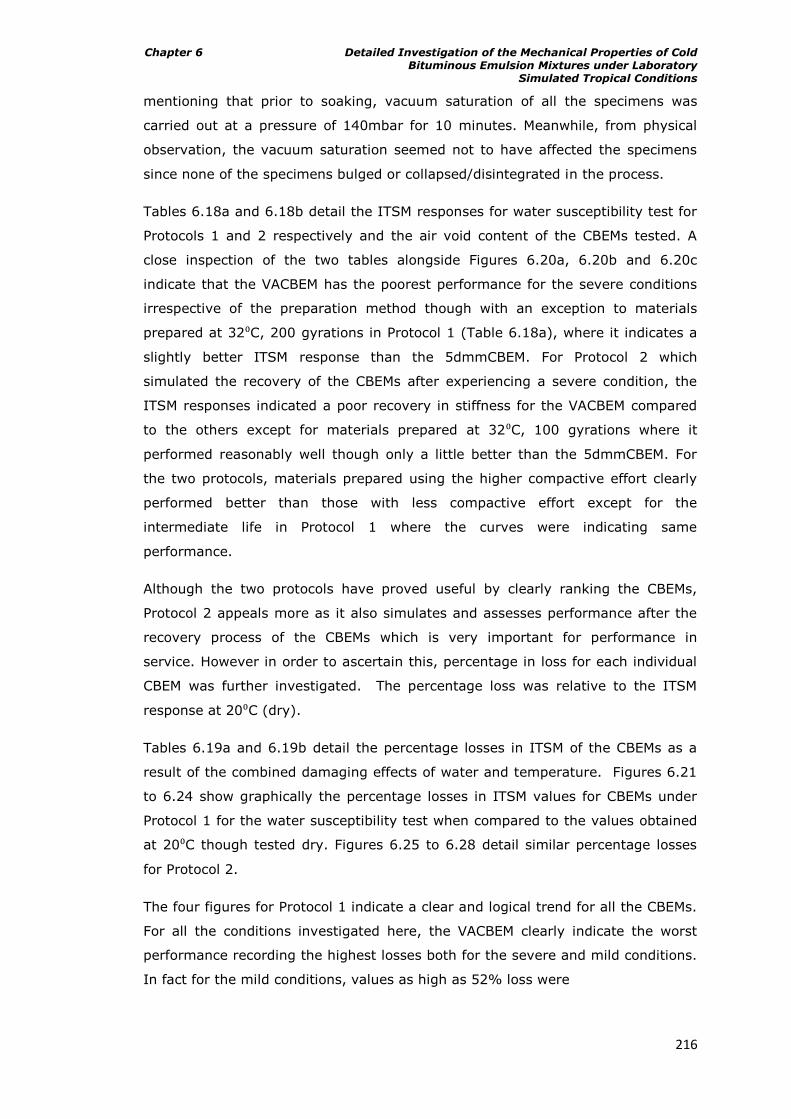
Chapter 6 Detailed Investigation of the Mechanical Properties of Cold Bituminous Emulsion Mixtures under Laboratory
Simulated Tropical Conditions
216
mentioning that prior to soaking, vacuum saturation of all the specimens was
carried out at a pressure of 140mbar for 10 minutes. Meanwhile, from physical
observation, the vacuum saturation seemed not to have affected the specimens
since none of the specimens bulged or collapsed/disintegrated in the process.
Tables 6.18a and 6.18b detail the ITSM responses for water susceptibility test for
Protocols 1 and 2 respectively and the air void content of the CBEMs tested. A
close inspection of the two tables alongside Figures 6.20a, 6.20b and 6.20c
indicate that the VACBEM has the poorest performance for the severe conditions
irrespective of the preparation method though with an exception to materials
prepared at 32⁰C, 200 gyrations in Protocol 1 (Table 6.18a), where it indicates a
slightly better ITSM response than the 5dmmCBEM. For Protocol 2 which
simulated the recovery of the CBEMs after experiencing a severe condition, the
ITSM responses indicated a poor recovery in stiffness for the VACBEM compared
to the others except for materials prepared at 32⁰C, 100 gyrations where it
performed reasonably well though only a little better than the 5dmmCBEM. For
the two protocols, materials prepared using the higher compactive effort clearly
performed better than those with less compactive effort except for the
intermediate life in Protocol 1 where the curves were indicating same
performance.
Although the two protocols have proved useful by clearly ranking the CBEMs,
Protocol 2 appeals more as it also simulates and assesses performance after the
recovery process of the CBEMs which is very important for performance in
service. However in order to ascertain this, percentage in loss for each individual
CBEM was further investigated. The percentage loss was relative to the ITSM
response at 20⁰C (dry).
Tables 6.19a and 6.19b detail the percentage losses in ITSM of the CBEMs as a
result of the combined damaging effects of water and temperature. Figures 6.21
to 6.24 show graphically the percentage losses in ITSM values for CBEMs under
Protocol 1 for the water susceptibility test when compared to the values obtained
at 20⁰C though tested dry. Figures 6.25 to 6.28 detail similar percentage losses
for Protocol 2.
The four figures for Protocol 1 indicate a clear and logical trend for all the CBEMs.
For all the conditions investigated here, the VACBEM clearly indicate the worst
performance recording the highest losses both for the severe and mild conditions.
In fact for the mild conditions, values as high as 52% loss were
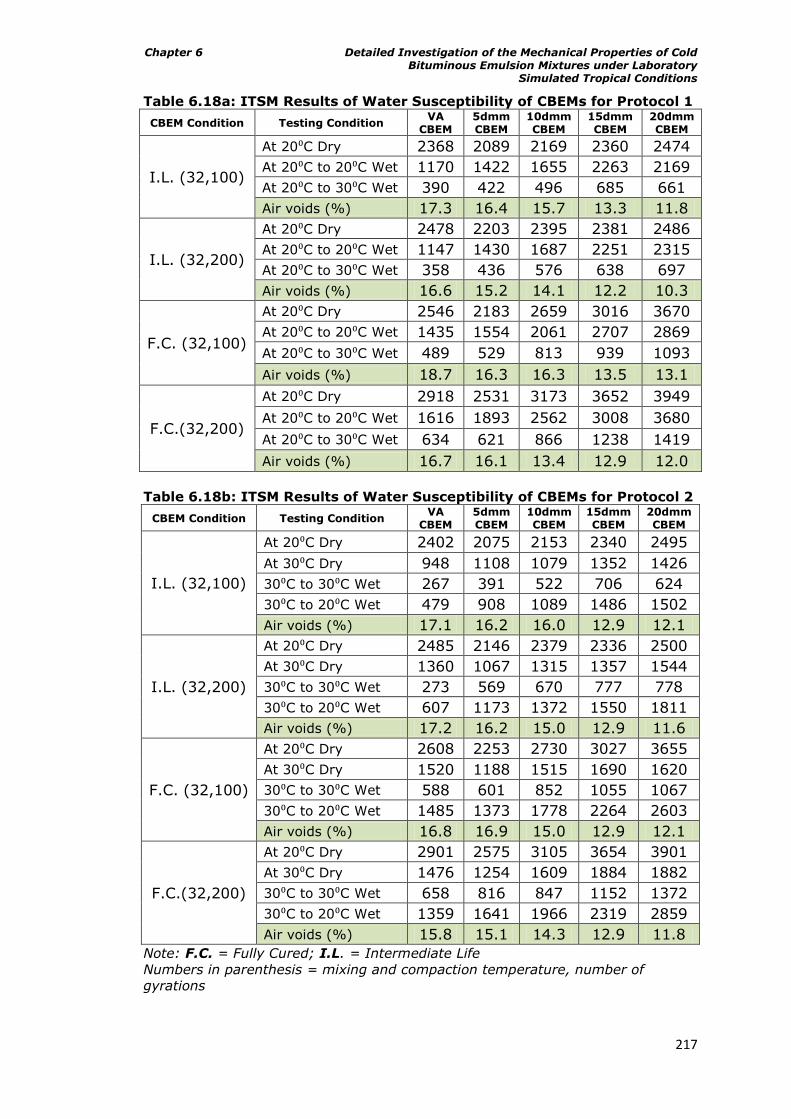
Chapter 6 Detailed Investigation of the Mechanical Properties of Cold Bituminous Emulsion Mixtures under Laboratory
Simulated Tropical Conditions
217
Table 6.18a: ITSM Results of Water Susceptibility of CBEMs for Protocol 1
CBEM Condition Testing Condition VA CBEM
5dmm CBEM
10dmm CBEM
15dmm CBEM
20dmm CBEM
I.L. (32,100)
At 20⁰C Dry 2368 2089 2169 2360 2474
At 20⁰C to 20⁰C Wet 1170 1422 1655 2263 2169
At 20⁰C to 30⁰C Wet 390 422 496 685 661
Air voids (%) 17.3 16.4 15.7 13.3 11.8
I.L. (32,200)
At 20⁰C Dry 2478 2203 2395 2381 2486
At 20⁰C to 20⁰C Wet 1147 1430 1687 2251 2315
At 20⁰C to 30⁰C Wet 358 436 576 638 697
Air voids (%) 16.6 15.2 14.1 12.2 10.3
F.C. (32,100)
At 20⁰C Dry 2546 2183 2659 3016 3670
At 20⁰C to 20⁰C Wet 1435 1554 2061 2707 2869
At 20⁰C to 30⁰C Wet 489 529 813 939 1093
Air voids (%) 18.7 16.3 16.3 13.5 13.1
F.C.(32,200)
At 20⁰C Dry 2918 2531 3173 3652 3949
At 20⁰C to 20⁰C Wet 1616 1893 2562 3008 3680
At 20⁰C to 30⁰C Wet 634 621 866 1238 1419
Air voids (%) 16.7 16.1 13.4 12.9 12.0
Table 6.18b: ITSM Results of Water Susceptibility of CBEMs for Protocol 2
CBEM Condition Testing Condition VA CBEM
5dmm CBEM
10dmm CBEM
15dmm CBEM
20dmm CBEM
I.L. (32,100)
At 20⁰C Dry 2402 2075 2153 2340 2495
At 30⁰C Dry 948 1108 1079 1352 1426
30⁰C to 30⁰C Wet 267 391 522 706 624
30⁰C to 20⁰C Wet 479 908 1089 1486 1502
Air voids (%) 17.1 16.2 16.0 12.9 12.1
I.L. (32,200)
At 20⁰C Dry 2485 2146 2379 2336 2500
At 30⁰C Dry 1360 1067 1315 1357 1544
30⁰C to 30⁰C Wet 273 569 670 777 778
30⁰C to 20⁰C Wet 607 1173 1372 1550 1811
Air voids (%) 17.2 16.2 15.0 12.9 11.6
F.C. (32,100)
At 20⁰C Dry 2608 2253 2730 3027 3655
At 30⁰C Dry 1520 1188 1515 1690 1620
30⁰C to 30⁰C Wet 588 601 852 1055 1067
30⁰C to 20⁰C Wet 1485 1373 1778 2264 2603
Air voids (%) 16.8 16.9 15.0 12.9 12.1
F.C.(32,200)
At 20⁰C Dry 2901 2575 3105 3654 3901
At 30⁰C Dry 1476 1254 1609 1884 1882
30⁰C to 30⁰C Wet 658 816 847 1152 1372
30⁰C to 20⁰C Wet 1359 1641 1966 2319 2859
Air voids (%) 15.8 15.1 14.3 12.9 11.8
Note: F.C. = Fully Cured; I.L. = Intermediate Life
Numbers in parenthesis = mixing and compaction temperature, number of
gyrations
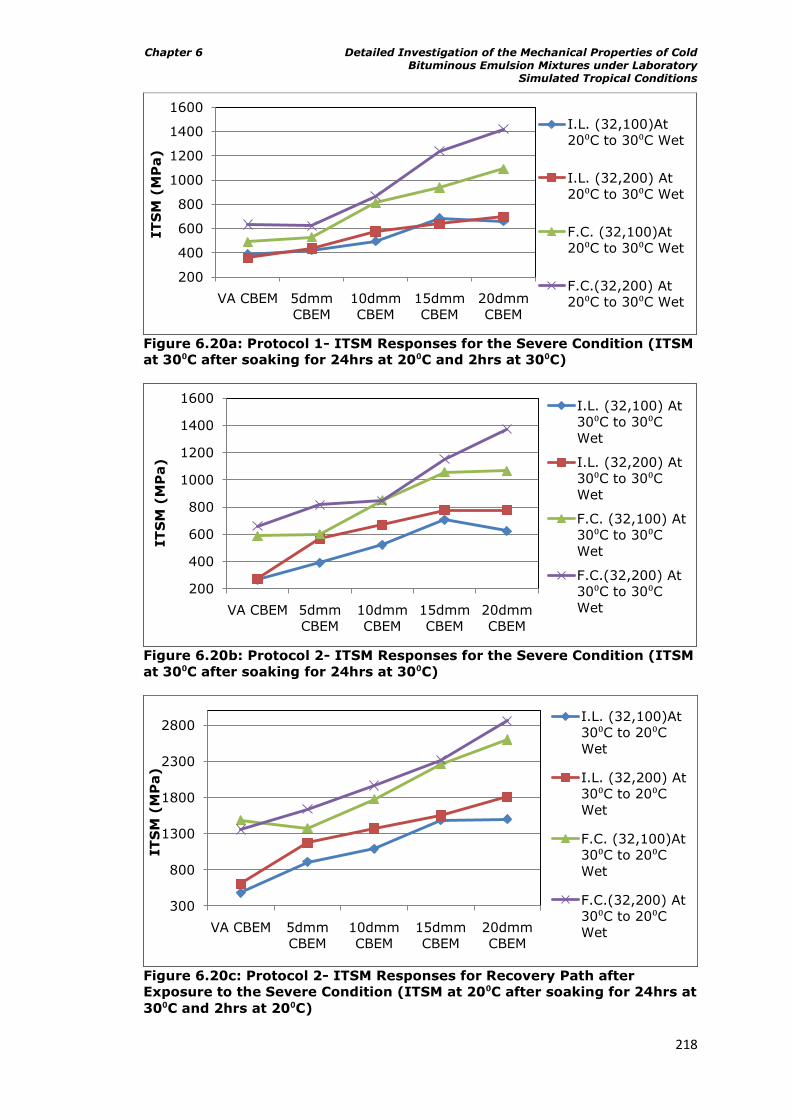
Chapter 6 Detailed Investigation of the Mechanical Properties of Cold Bituminous Emulsion Mixtures under Laboratory
Simulated Tropical Conditions
218
Figure 6.20a: Protocol 1- ITSM Responses for the Severe Condition (ITSM
at 30⁰C after soaking for 24hrs at 20⁰C and 2hrs at 30⁰C)
Figure 6.20b: Protocol 2- ITSM Responses for the Severe Condition (ITSM
at 30⁰C after soaking for 24hrs at 30⁰C)
Figure 6.20c: Protocol 2- ITSM Responses for Recovery Path after
Exposure to the Severe Condition (ITSM at 20⁰C after soaking for 24hrs at
30⁰C and 2hrs at 20⁰C)
200
400
600
800
1000
1200
1400
1600
VA CBEM 5dmm
CBEM
10dmm
CBEM
15dmm
CBEM
20dmm
CBEM
IT
SM
(M
Pa)
I.L. (32,100)At
20⁰C to 30⁰C Wet
I.L. (32,200) At
20⁰C to 30⁰C Wet
F.C. (32,100)At
20⁰C to 30⁰C Wet
F.C.(32,200) At
20⁰C to 30⁰C Wet
200
400
600
800
1000
1200
1400
1600
VA CBEM 5dmm
CBEM
10dmm
CBEM
15dmm
CBEM
20dmm
CBEM
IT
SM
(M
Pa)
I.L. (32,100) At
30⁰C to 30⁰C
Wet
I.L. (32,200) At
30⁰C to 30⁰C
Wet
F.C. (32,100) At
30⁰C to 30⁰C
Wet
F.C.(32,200) At
30⁰C to 30⁰C
Wet
300
800
1300
1800
2300
2800
VA CBEM 5dmm
CBEM
10dmm
CBEM
15dmm
CBEM
20dmm
CBEM
IT
SM
(M
Pa)
I.L. (32,100)At
30⁰C to 20⁰C
Wet
I.L. (32,200) At
30⁰C to 20⁰C
Wet
F.C. (32,100)At
30⁰C to 20⁰C
Wet
F.C.(32,200) At
30⁰C to 20⁰C
Wet
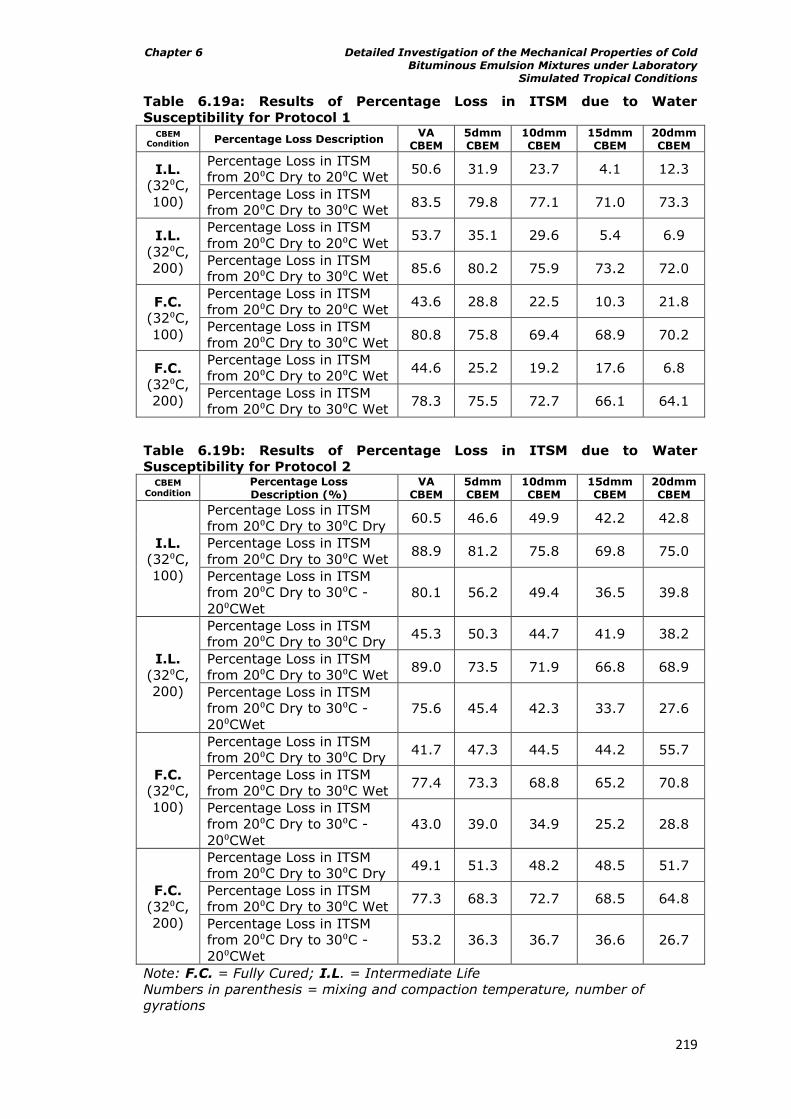
Chapter 6 Detailed Investigation of the Mechanical Properties of Cold Bituminous Emulsion Mixtures under Laboratory
Simulated Tropical Conditions
219
Table 6.19a: Results of Percentage Loss in ITSM due to Water
Susceptibility for Protocol 1 CBEM
Condition Percentage Loss Description VA
CBEM 5dmm CBEM
10dmm CBEM
15dmm CBEM
20dmm CBEM
I.L.
(32⁰C,
100)
Percentage Loss in ITSM
from 20⁰C Dry to 20⁰C Wet 50.6 31.9 23.7 4.1 12.3
Percentage Loss in ITSM
from 20⁰C Dry to 30⁰C Wet 83.5 79.8 77.1 71.0 73.3
I.L.
(32⁰C,
200)
Percentage Loss in ITSM
from 20⁰C Dry to 20⁰C Wet 53.7 35.1 29.6 5.4 6.9
Percentage Loss in ITSM
from 20⁰C Dry to 30⁰C Wet 85.6 80.2 75.9 73.2 72.0
F.C.
(32⁰C,
100)
Percentage Loss in ITSM
from 20⁰C Dry to 20⁰C Wet 43.6 28.8 22.5 10.3 21.8
Percentage Loss in ITSM
from 20⁰C Dry to 30⁰C Wet 80.8 75.8 69.4 68.9 70.2
F.C.
(32⁰C,
200)
Percentage Loss in ITSM
from 20⁰C Dry to 20⁰C Wet 44.6 25.2 19.2 17.6 6.8
Percentage Loss in ITSM
from 20⁰C Dry to 30⁰C Wet 78.3 75.5 72.7 66.1 64.1
Table 6.19b: Results of Percentage Loss in ITSM due to Water
Susceptibility for Protocol 2 CBEM
Condition
Percentage Loss Description (%)
VA CBEM
5dmm CBEM
10dmm CBEM
15dmm CBEM
20dmm CBEM
I.L.
(32⁰C,
100)
Percentage Loss in ITSM
from 20⁰C Dry to 30⁰C Dry 60.5 46.6 49.9 42.2 42.8
Percentage Loss in ITSM
from 20⁰C Dry to 30⁰C Wet 88.9 81.2 75.8 69.8 75.0
Percentage Loss in ITSM
from 20⁰C Dry to 30⁰C -
20⁰CWet
80.1 56.2 49.4 36.5 39.8
I.L.
(32⁰C,
200)
Percentage Loss in ITSM
from 20⁰C Dry to 30⁰C Dry 45.3 50.3 44.7 41.9 38.2
Percentage Loss in ITSM
from 20⁰C Dry to 30⁰C Wet 89.0 73.5 71.9 66.8 68.9
Percentage Loss in ITSM
from 20⁰C Dry to 30⁰C -
20⁰CWet
75.6 45.4 42.3 33.7 27.6
F.C.
(32⁰C,
100)
Percentage Loss in ITSM
from 20⁰C Dry to 30⁰C Dry 41.7 47.3 44.5 44.2 55.7
Percentage Loss in ITSM
from 20⁰C Dry to 30⁰C Wet 77.4 73.3 68.8 65.2 70.8
Percentage Loss in ITSM
from 20⁰C Dry to 30⁰C -
20⁰CWet
43.0 39.0 34.9 25.2 28.8
F.C.
(32⁰C,
200)
Percentage Loss in ITSM
from 20⁰C Dry to 30⁰C Dry 49.1 51.3 48.2 48.5 51.7
Percentage Loss in ITSM
from 20⁰C Dry to 30⁰C Wet 77.3 68.3 72.7 68.5 64.8
Percentage Loss in ITSM
from 20⁰C Dry to 30⁰C -
20⁰CWet
53.2 36.3 36.7 36.6 26.7
Note: F.C. = Fully Cured; I.L. = Intermediate Life
Numbers in parenthesis = mixing and compaction temperature, number of
gyrations
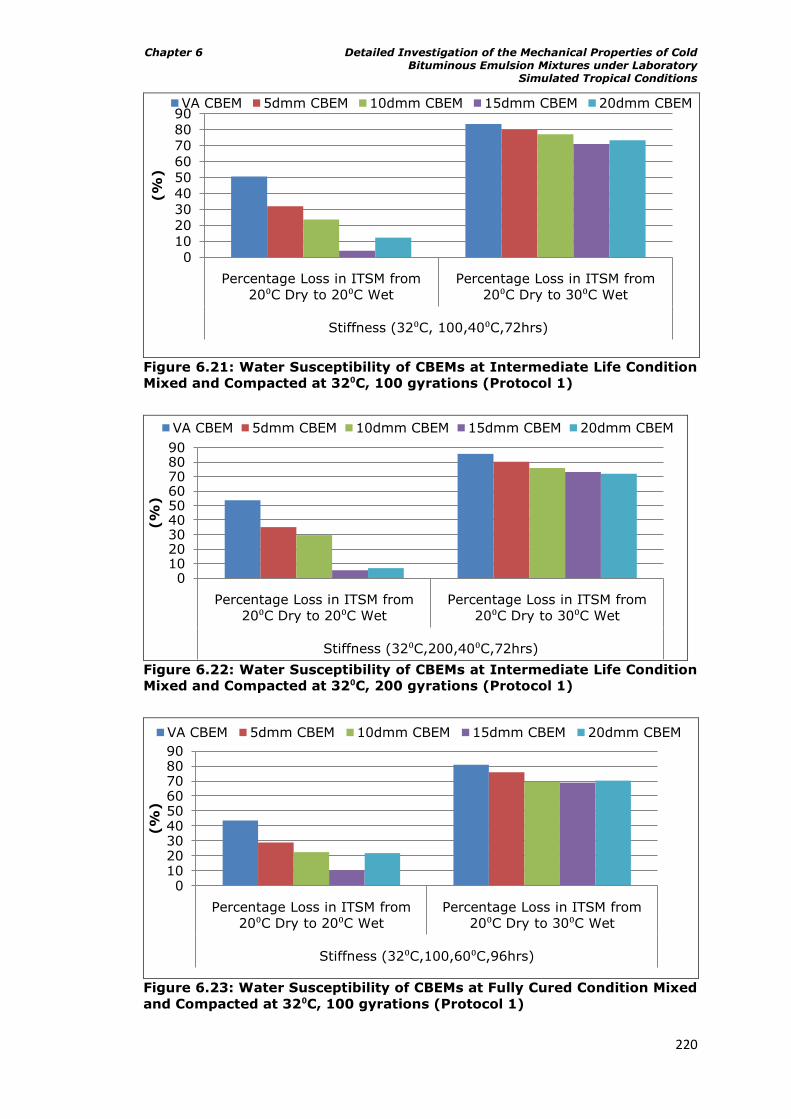
Chapter 6 Detailed Investigation of the Mechanical Properties of Cold Bituminous Emulsion Mixtures under Laboratory
Simulated Tropical Conditions
220
Figure 6.21: Water Susceptibility of CBEMs at Intermediate Life Condition
Mixed and Compacted at 32⁰C, 100 gyrations (Protocol 1)
Figure 6.22: Water Susceptibility of CBEMs at Intermediate Life Condition
Mixed and Compacted at 32⁰C, 200 gyrations (Protocol 1)
Figure 6.23: Water Susceptibility of CBEMs at Fully Cured Condition Mixed
and Compacted at 32⁰C, 100 gyrations (Protocol 1)
0102030405060708090
Percentage Loss in ITSM from
20⁰C Dry to 20⁰C Wet
Percentage Loss in ITSM from
20⁰C Dry to 30⁰C Wet
Stiffness (32⁰C, 100,40⁰C,72hrs)
(%
)
VA CBEM 5dmm CBEM 10dmm CBEM 15dmm CBEM 20dmm CBEM
0102030405060708090
Percentage Loss in ITSM from
20⁰C Dry to 20⁰C Wet
Percentage Loss in ITSM from
20⁰C Dry to 30⁰C Wet
Stiffness (32⁰C,200,40⁰C,72hrs)
(%
)
VA CBEM 5dmm CBEM 10dmm CBEM 15dmm CBEM 20dmm CBEM
0102030405060708090
Percentage Loss in ITSM from
20⁰C Dry to 20⁰C Wet
Percentage Loss in ITSM from
20⁰C Dry to 30⁰C Wet
Stiffness (32⁰C,100,60⁰C,96hrs)
(%
)
VA CBEM 5dmm CBEM 10dmm CBEM 15dmm CBEM 20dmm CBEM
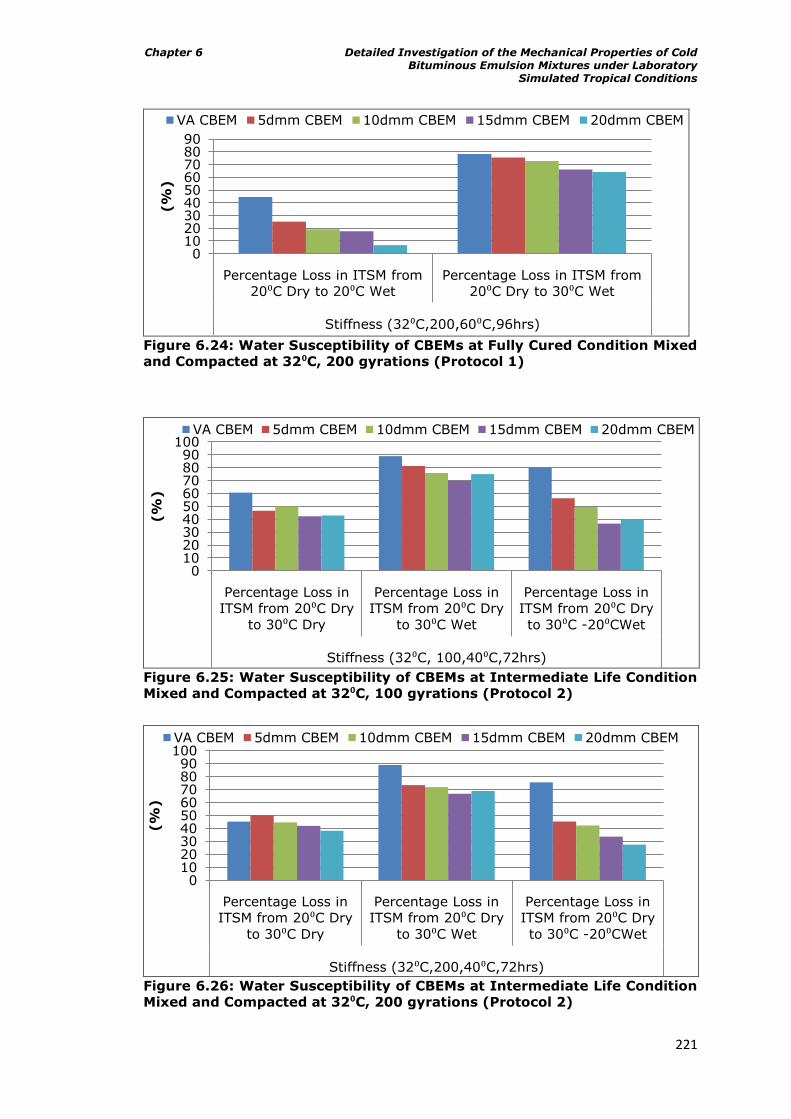
Chapter 6 Detailed Investigation of the Mechanical Properties of Cold Bituminous Emulsion Mixtures under Laboratory
Simulated Tropical Conditions
221
Figure 6.24: Water Susceptibility of CBEMs at Fully Cured Condition Mixed
and Compacted at 32⁰C, 200 gyrations (Protocol 1)
Figure 6.25: Water Susceptibility of CBEMs at Intermediate Life Condition
Mixed and Compacted at 32⁰C, 100 gyrations (Protocol 2)
Figure 6.26: Water Susceptibility of CBEMs at Intermediate Life Condition
Mixed and Compacted at 32⁰C, 200 gyrations (Protocol 2)
0102030405060708090
Percentage Loss in ITSM from
20⁰C Dry to 20⁰C Wet
Percentage Loss in ITSM from
20⁰C Dry to 30⁰C Wet
Stiffness (32⁰C,200,60⁰C,96hrs)
(%
)
VA CBEM 5dmm CBEM 10dmm CBEM 15dmm CBEM 20dmm CBEM
0102030405060708090
100
Percentage Loss in
ITSM from 20⁰C Dry
to 30⁰C Dry
Percentage Loss in
ITSM from 20⁰C Dry
to 30⁰C Wet
Percentage Loss in
ITSM from 20⁰C Dry
to 30⁰C -20⁰CWet
Stiffness (32⁰C, 100,40⁰C,72hrs)
(%
)
VA CBEM 5dmm CBEM 10dmm CBEM 15dmm CBEM 20dmm CBEM
0102030405060708090
100
Percentage Loss in
ITSM from 20⁰C Dry
to 30⁰C Dry
Percentage Loss in
ITSM from 20⁰C Dry
to 30⁰C Wet
Percentage Loss in
ITSM from 20⁰C Dry
to 30⁰C -20⁰CWet
Stiffness (32⁰C,200,40⁰C,72hrs)
(%
)
VA CBEM 5dmm CBEM 10dmm CBEM 15dmm CBEM 20dmm CBEM
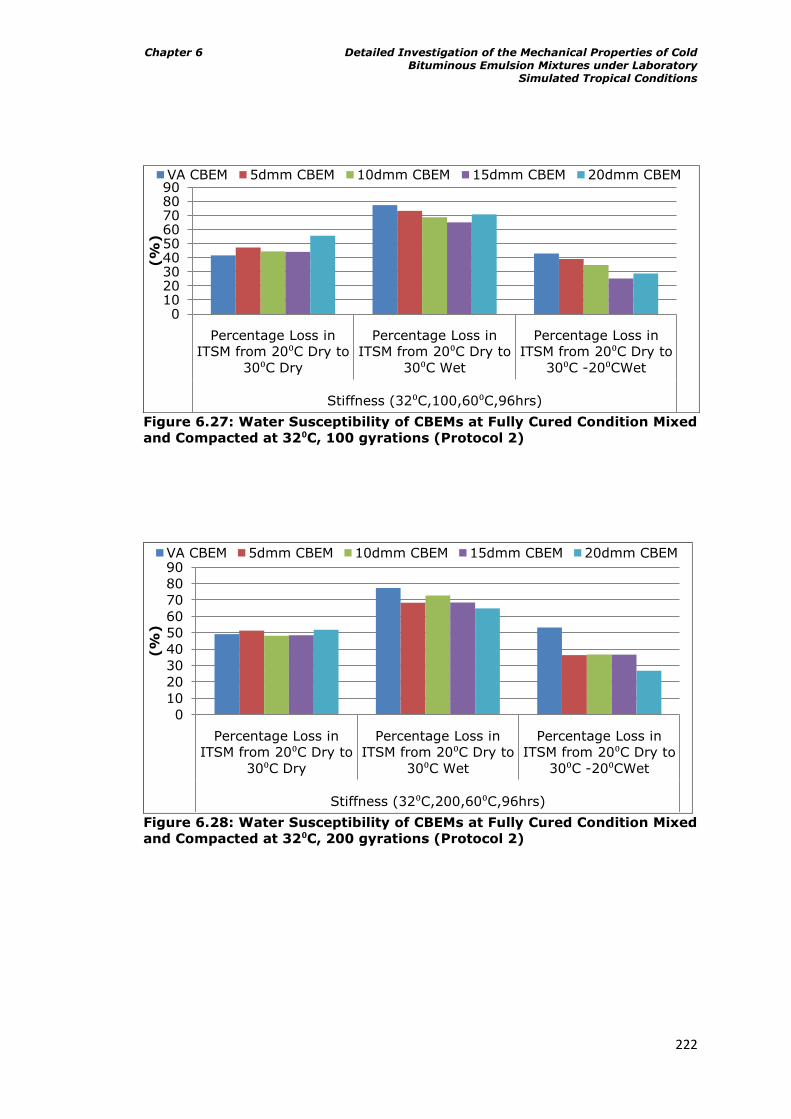
Chapter 6 Detailed Investigation of the Mechanical Properties of Cold Bituminous Emulsion Mixtures under Laboratory
Simulated Tropical Conditions
222
Figure 6.27: Water Susceptibility of CBEMs at Fully Cured Condition Mixed
and Compacted at 32⁰C, 100 gyrations (Protocol 2)
Figure 6.28: Water Susceptibility of CBEMs at Fully Cured Condition Mixed
and Compacted at 32⁰C, 200 gyrations (Protocol 2)
0102030405060708090
Percentage Loss in
ITSM from 20⁰C Dry to
30⁰C Dry
Percentage Loss in
ITSM from 20⁰C Dry to
30⁰C Wet
Percentage Loss in
ITSM from 20⁰C Dry to
30⁰C -20⁰CWet
Stiffness (32⁰C,100,60⁰C,96hrs)
(%
)
VA CBEM 5dmm CBEM 10dmm CBEM 15dmm CBEM 20dmm CBEM
0
10
20
30
40
50
60
70
80
90
Percentage Loss in
ITSM from 20⁰C Dry to
30⁰C Dry
Percentage Loss in
ITSM from 20⁰C Dry to
30⁰C Wet
Percentage Loss in
ITSM from 20⁰C Dry to
30⁰C -20⁰CWet
Stiffness (32⁰C,200,60⁰C,96hrs)
(%
)
VA CBEM 5dmm CBEM 10dmm CBEM 15dmm CBEM 20dmm CBEM
Chapter 6 Detailed Investigation of the Mechanical Properties of Cold Bituminous Emulsion Mixtures under Laboratory
Simulated Tropical Conditions
223
observed for VACBEM, while the 5dmmCBEM which is next in rank recorded a
little above 30% loss for the same conditions. For the higher compactive effort,
the 20mmCBEM consistently recorded the least loss i.e. the best performance for
the severe condition of testing irrespective of the curing condition applied on the
CBEMs. Although Figure 6.24 which is for materials prepared at 32⁰C and 200
gyrations (fully cured) clearly ranked the CBEMs for both the mild and severe
conditions of testing in a logical order starting with VACBEM up the range to the
20dmmCBEM, the 15dmmCBEM contrary to logic recorded the overall best
performance. The same figure indicated that CBEMs prepared at this level have
the best resistance under severe conditions.
The Figures 6.25 to 6.28 for Protocol 2 detail responses for both temperature
susceptibility and water damaging effects on the CBEMs. This has been purposely
done in order to ascertain the effectiveness of the temperature susceptibility test
at being able to rank the materials. It is obvious from the figures that
measurements for the temperature susceptibility did not follow a clear order
compared to the water damaging test. Although the trend for the severe condition
here were not completely consistent with the observations made for CBEMs
prepared at 32⁰C, 200 gyrations, overall again, the VACBEM indicated the least
good performance for both the severe and mild conditions (recovery path) with
the 15dmmCBEM still having the best performance.
For the recovery process in Protocol 2, the VACBEM achieved a significant
improvement for materials prepared at 32⁰C, 100 gyrations just as the RAP
CBEMs. The recovery path for other conditions was generally poor for the VACBEM
while it was rather impressive for the RAP CBEMs. The poor performance of the
VACBEM could have been partly as a result of its high air void content, while the
lower air voids of the RAP CBEMs could have been partly responsible for their
better performance. More importantly, it is believed that the residual bitumen in
the severely aged RAPs that constitute the RAP CBEMs could possibly have been
rejuvenated thus providing a larger volume of active binder. This must have been
responsible for the impressive performance observed for these RAP CBEMs in the
recovery process and generally in being able to reasonably contain the water
damaging effects when compared to the VACBEM. Comparing the results obtained
here with the results of the temperature susceptibility tests, it is however likely
that those CBEM materials prepared at 20⁰C might not have been able to contain
the water damaging effects as those prepared at 32⁰C did. While this is an
interesting area for future investigations, the two water susceptibility protocols as
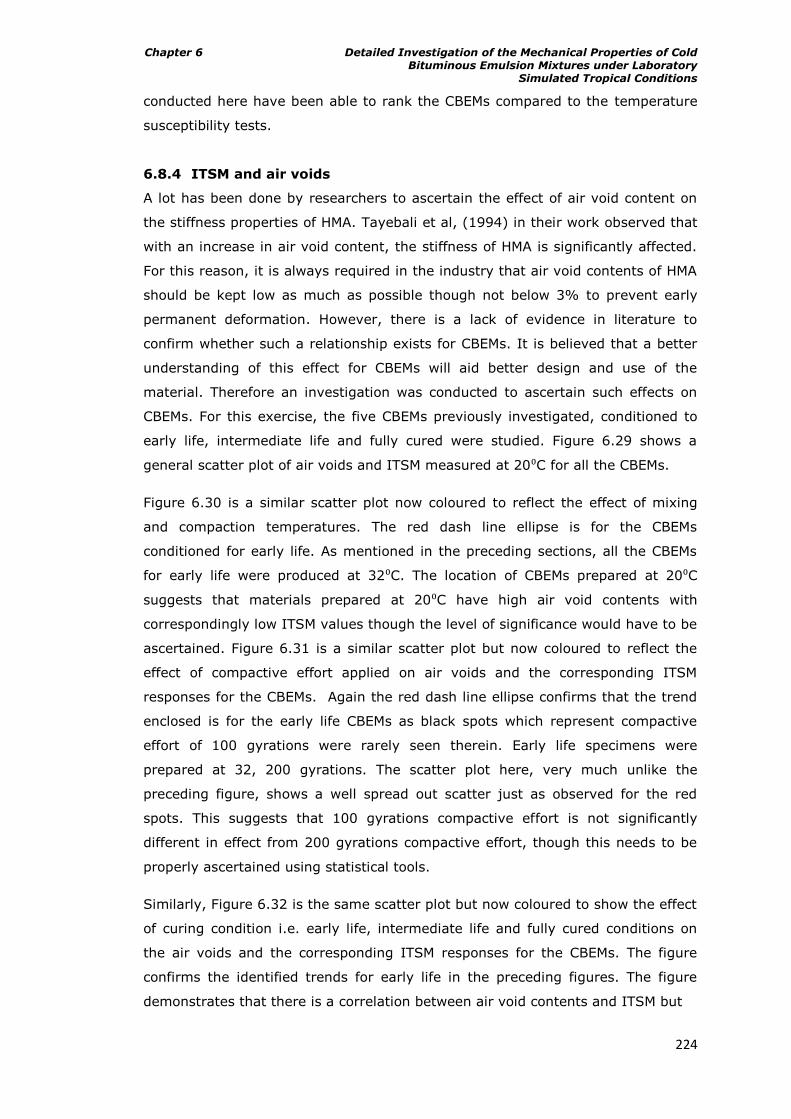
Chapter 6 Detailed Investigation of the Mechanical Properties of Cold Bituminous Emulsion Mixtures under Laboratory
Simulated Tropical Conditions
224
conducted here have been able to rank the CBEMs compared to the temperature
susceptibility tests.
6.8.4 ITSM and air voids
A lot has been done by researchers to ascertain the effect of air void content on
the stiffness properties of HMA. Tayebali et al, (1994) in their work observed that
with an increase in air void content, the stiffness of HMA is significantly affected.
For this reason, it is always required in the industry that air void contents of HMA
should be kept low as much as possible though not below 3% to prevent early
permanent deformation. However, there is a lack of evidence in literature to
confirm whether such a relationship exists for CBEMs. It is believed that a better
understanding of this effect for CBEMs will aid better design and use of the
material. Therefore an investigation was conducted to ascertain such effects on
CBEMs. For this exercise, the five CBEMs previously investigated, conditioned to
early life, intermediate life and fully cured were studied. Figure 6.29 shows a
general scatter plot of air voids and ITSM measured at 20⁰C for all the CBEMs.
Figure 6.30 is a similar scatter plot now coloured to reflect the effect of mixing
and compaction temperatures. The red dash line ellipse is for the CBEMs
conditioned for early life. As mentioned in the preceding sections, all the CBEMs
for early life were produced at 32⁰C. The location of CBEMs prepared at 20⁰C
suggests that materials prepared at 20⁰C have high air void contents with
correspondingly low ITSM values though the level of significance would have to be
ascertained. Figure 6.31 is a similar scatter plot but now coloured to reflect the
effect of compactive effort applied on air voids and the corresponding ITSM
responses for the CBEMs. Again the red dash line ellipse confirms that the trend
enclosed is for the early life CBEMs as black spots which represent compactive
effort of 100 gyrations were rarely seen therein. Early life specimens were
prepared at 32, 200 gyrations. The scatter plot here, very much unlike the
preceding figure, shows a well spread out scatter just as observed for the red
spots. This suggests that 100 gyrations compactive effort is not significantly
different in effect from 200 gyrations compactive effort, though this needs to be
properly ascertained using statistical tools.
Similarly, Figure 6.32 is the same scatter plot but now coloured to show the effect
of curing condition i.e. early life, intermediate life and fully cured conditions on
the air voids and the corresponding ITSM responses for the CBEMs. The figure
confirms the identified trends for early life in the preceding figures. The figure
demonstrates that there is a correlation between air void contents and ITSM but
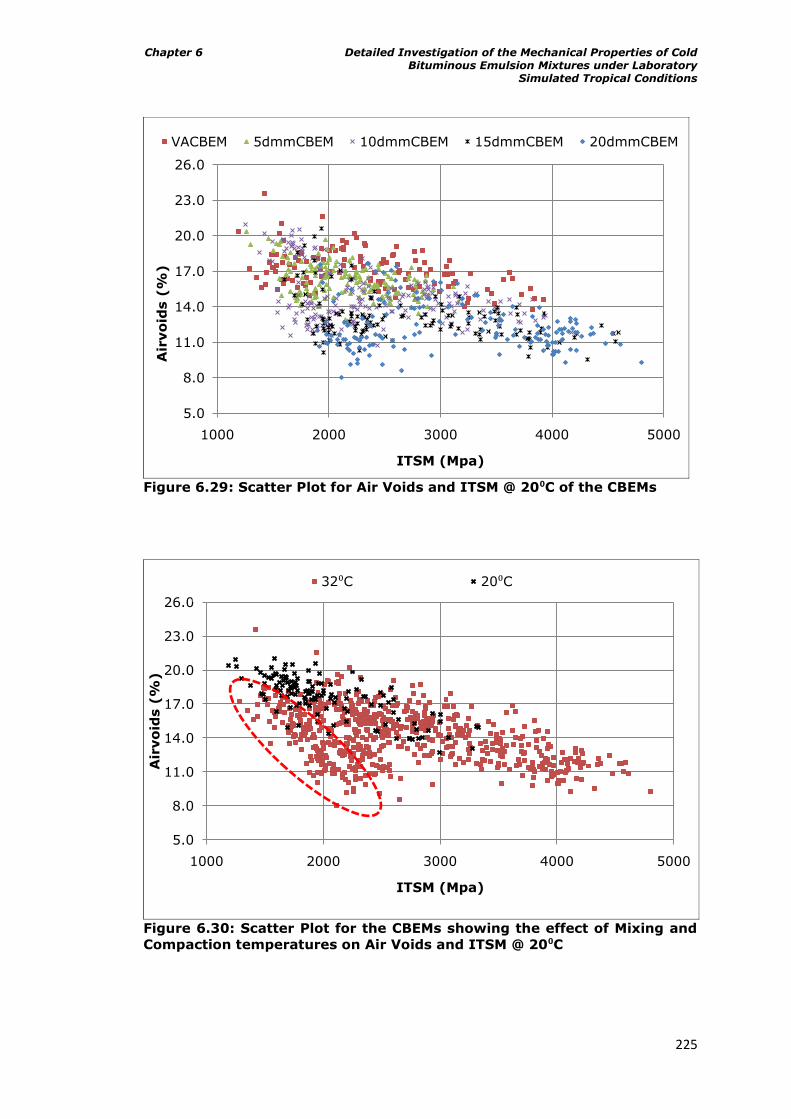
Chapter 6 Detailed Investigation of the Mechanical Properties of Cold Bituminous Emulsion Mixtures under Laboratory
Simulated Tropical Conditions
225
Figure 6.29: Scatter Plot for Air Voids and ITSM @ 20⁰C of the CBEMs
Figure 6.30: Scatter Plot for the CBEMs showing the effect of Mixing and
Compaction temperatures on Air Voids and ITSM @ 20⁰C
5.0
8.0
11.0
14.0
17.0
20.0
23.0
26.0
1000 2000 3000 4000 5000
Air
vo
ids (
%)
ITSM (Mpa)
VACBEM 5dmmCBEM 10dmmCBEM 15dmmCBEM 20dmmCBEM
5.0
8.0
11.0
14.0
17.0
20.0
23.0
26.0
1000 2000 3000 4000 5000
Air
vo
ids (
%)
ITSM (Mpa)
32⁰C 20⁰C
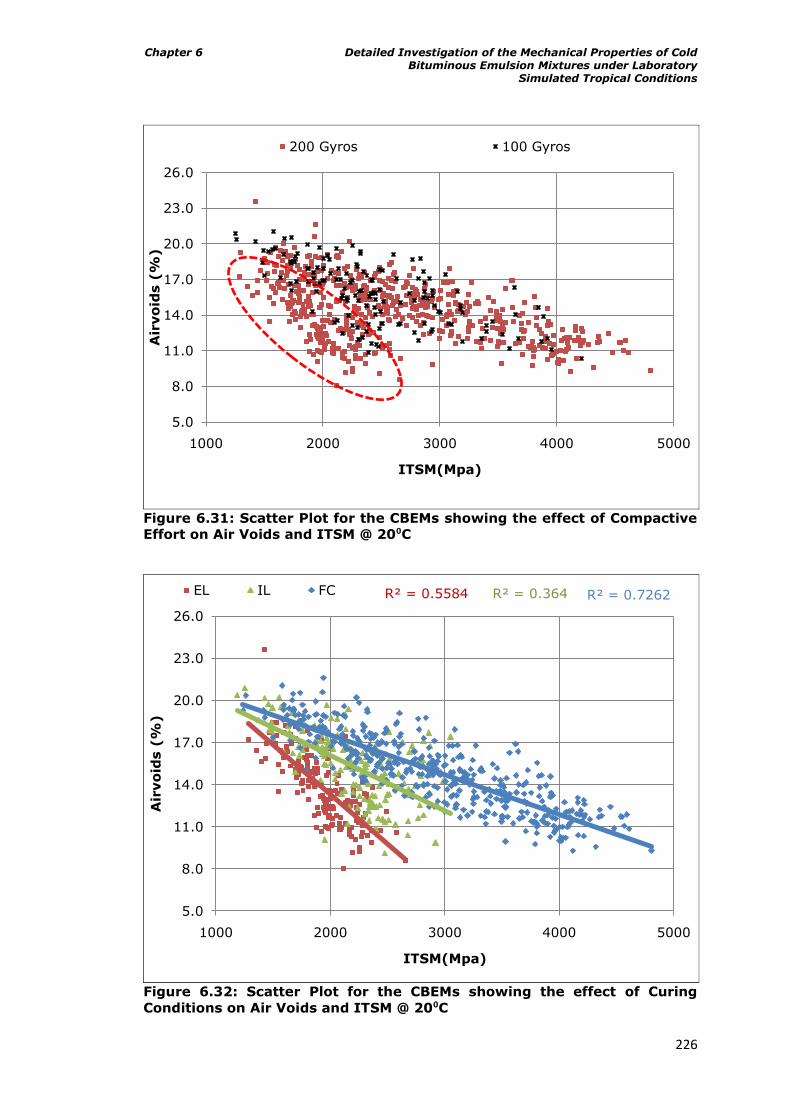
Chapter 6 Detailed Investigation of the Mechanical Properties of Cold Bituminous Emulsion Mixtures under Laboratory
Simulated Tropical Conditions
226
Figure 6.31: Scatter Plot for the CBEMs showing the effect of Compactive
Effort on Air Voids and ITSM @ 20⁰C
Figure 6.32: Scatter Plot for the CBEMs showing the effect of Curing
Conditions on Air Voids and ITSM @ 20⁰C
5.0
8.0
11.0
14.0
17.0
20.0
23.0
26.0
1000 2000 3000 4000 5000
Air
vo
ids (
%)
ITSM(Mpa)
200 Gyros 100 Gyros
R² = 0.5584 R² = 0.364 R² = 0.7262
5.0
8.0
11.0
14.0
17.0
20.0
23.0
26.0
1000 2000 3000 4000 5000
Air
vo
ids (
%)
ITSM(Mpa)
EL IL FC
Chapter 6 Detailed Investigation of the Mechanical Properties of Cold Bituminous Emulsion Mixtures under Laboratory
Simulated Tropical Conditions
227
strongly influenced by curing condition. The trend in the early life is steeper
(negative linear relationship) than that for the intermediate life and fully cured
(F.C.) conditions. This steepness in trend due to high moisture contents obviously
makes the CBEMs at early life less stiff compared to the fully cured CBEMs. At
early life the moisture contents for the CBEMs were generally above 1.0%
compared to the fully cured conditions where moisture contents were as low as
0.2% as detailed in Table 6.5.
Figure 6.33 shows the scatter plot of CBEMs produced and conditioned to early life
while Figure 6.34 shows the scatter plot of CBEMs produced using similar
procedures to those of early life but now fully cured. These two figures
demonstrate that there is a correlation between air void content and ITSM but
strongly influenced by curing condition. The trend in the early life is steeper than
for the intermediate life condition despite having similar ranges of air void
contents. These observations therefore call for caution in directly applying the air
void – stiffness relationship for HMA to CBEMs.
In order to have a fuller understanding of the air voids – stiffness relationship of
CBEMs, a multiple regression analysis as explained in section 6.6.2 of this chapter
using STATA was conducted to ascertain the effect of curing state and CBEM
material type on such relationship, and if it really exists. While the case of CBEMs
produced to simulate early life was straightforward as no variables were involved
and normal regression analysis could therefore be used, the cases for CBEMs
conditioned to simulate intermediate life (I.L.) and fully cured (F.C.) were
different.
So as to have a fairly high sample number for each case and also for brevity, all
specimens for these two curing conditions were grouped irrespective of the
procedure followed for production of the CBEMs. For each of these respective
groups i.e. I.L. and F.C. created for each of the five CBEMs, the CBEMs produced
at 20⁰C, 100 gyrations were used as the reference variable set in the regression
model. Those produced using 20⁰C and 200 gyrations, 32⁰C and 100 gyrations,
32⁰C and 200 gyrations in the mentioned order were taken as the other variables
in that order in the regression model. This arrangement considers that these
other CBEMs were treated differently compared to the reference variable set. For
each of the five CBEMs, 32 specimens were studied for each group of E.L. and I.L.
data, while 64, 100, 100, 64 and 100 were studied for the VACBEM, 5dmmCBEM,
10dmmCBEM, 15dmmCBEM and 20dmmCBEM respectively for F.C. Table 6.20
details the results of regression analysis of CBEMs for ITSM versus air voids.
Included in the table are values of coefficient, standard error, confidence intervals
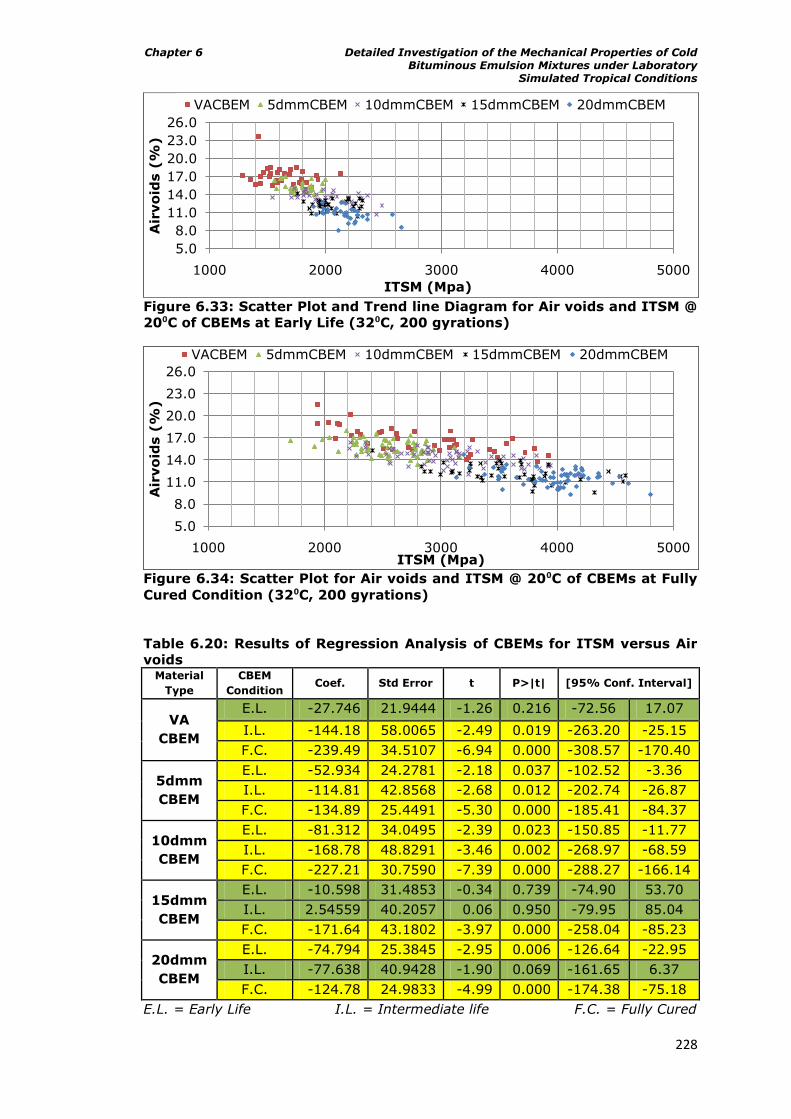
Chapter 6 Detailed Investigation of the Mechanical Properties of Cold Bituminous Emulsion Mixtures under Laboratory
Simulated Tropical Conditions
228
Figure 6.33: Scatter Plot and Trend line Diagram for Air voids and ITSM @
20⁰C of CBEMs at Early Life (32⁰C, 200 gyrations)
Figure 6.34: Scatter Plot for Air voids and ITSM @ 20⁰C of CBEMs at Fully
Cured Condition (32⁰C, 200 gyrations)
Table 6.20: Results of Regression Analysis of CBEMs for ITSM versus Air
voids Material
Type
CBEM
Condition Coef. Std Error t P>|t| [95% Conf. Interval]
VA
CBEM
E.L. -27.746 21.9444 -1.26 0.216 -72.56 17.07
I.L. -144.18 58.0065 -2.49 0.019 -263.20 -25.15
F.C. -239.49 34.5107 -6.94 0.000 -308.57 -170.40
5dmm
CBEM
E.L. -52.934 24.2781 -2.18 0.037 -102.52 -3.36
I.L. -114.81 42.8568 -2.68 0.012 -202.74 -26.87
F.C. -134.89 25.4491 -5.30 0.000 -185.41 -84.37
10dmm
CBEM
E.L. -81.312 34.0495 -2.39 0.023 -150.85 -11.77
I.L. -168.78 48.8291 -3.46 0.002 -268.97 -68.59
F.C. -227.21 30.7590 -7.39 0.000 -288.27 -166.14
15dmm
CBEM
E.L. -10.598 31.4853 -0.34 0.739 -74.90 53.70
I.L. 2.54559 40.2057 0.06 0.950 -79.95 85.04
F.C. -171.64 43.1802 -3.97 0.000 -258.04 -85.23
20dmm
CBEM
E.L. -74.794 25.3845 -2.95 0.006 -126.64 -22.95
I.L. -77.638 40.9428 -1.90 0.069 -161.65 6.37
F.C. -124.78 24.9833 -4.99 0.000 -174.38 -75.18
E.L. = Early Life I.L. = Intermediate life F.C. = Fully Cured
5.0
8.0
11.0
14.0
17.0
20.0
23.0
26.0
1000 2000 3000 4000 5000
Air
vo
ids (
%)
ITSM (Mpa)
VACBEM 5dmmCBEM 10dmmCBEM 15dmmCBEM 20dmmCBEM
5.0
8.0
11.0
14.0
17.0
20.0
23.0
26.0
1000 2000 3000 4000 5000
Air
vo
ids (
%)
ITSM (Mpa)
VACBEM 5dmmCBEM 10dmmCBEM 15dmmCBEM 20dmmCBEM
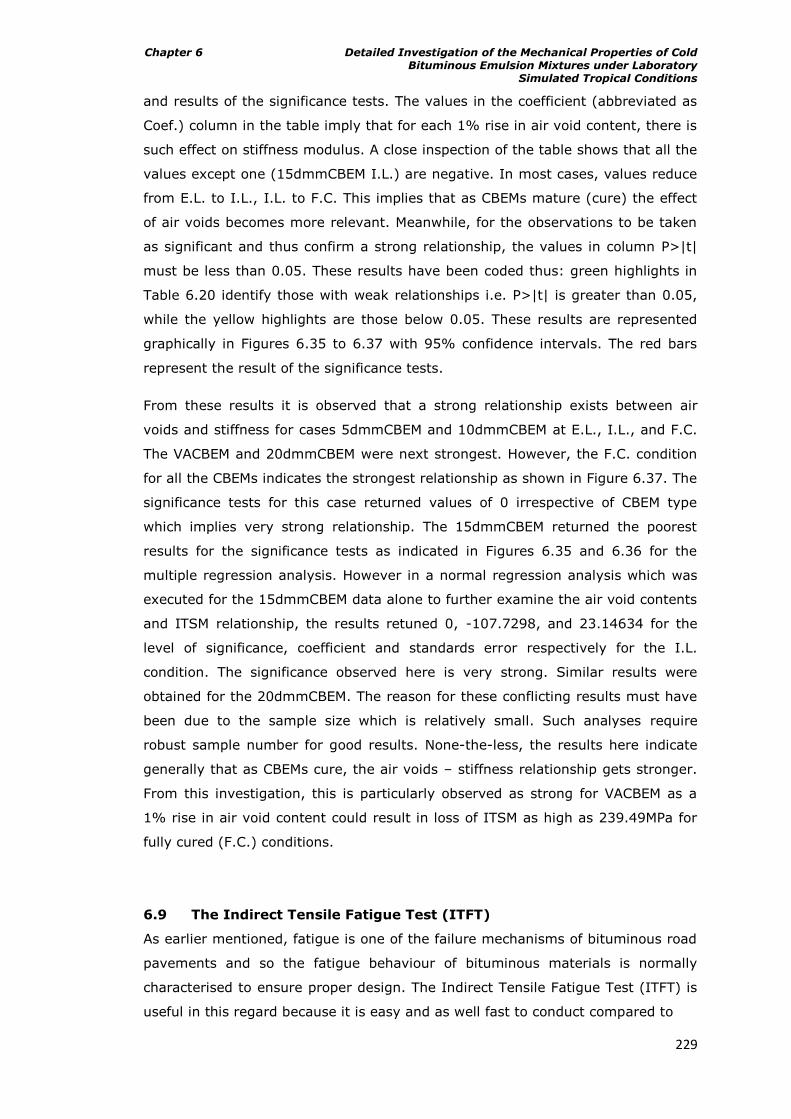
Chapter 6 Detailed Investigation of the Mechanical Properties of Cold Bituminous Emulsion Mixtures under Laboratory
Simulated Tropical Conditions
229
and results of the significance tests. The values in the coefficient (abbreviated as
Coef.) column in the table imply that for each 1% rise in air void content, there is
such effect on stiffness modulus. A close inspection of the table shows that all the
values except one (15dmmCBEM I.L.) are negative. In most cases, values reduce
from E.L. to I.L., I.L. to F.C. This implies that as CBEMs mature (cure) the effect
of air voids becomes more relevant. Meanwhile, for the observations to be taken
as significant and thus confirm a strong relationship, the values in column P>|t|
must be less than 0.05. These results have been coded thus: green highlights in
Table 6.20 identify those with weak relationships i.e. P>|t| is greater than 0.05,
while the yellow highlights are those below 0.05. These results are represented
graphically in Figures 6.35 to 6.37 with 95% confidence intervals. The red bars
represent the result of the significance tests.
From these results it is observed that a strong relationship exists between air
voids and stiffness for cases 5dmmCBEM and 10dmmCBEM at E.L., I.L., and F.C.
The VACBEM and 20dmmCBEM were next strongest. However, the F.C. condition
for all the CBEMs indicates the strongest relationship as shown in Figure 6.37. The
significance tests for this case returned values of 0 irrespective of CBEM type
which implies very strong relationship. The 15dmmCBEM returned the poorest
results for the significance tests as indicated in Figures 6.35 and 6.36 for the
multiple regression analysis. However in a normal regression analysis which was
executed for the 15dmmCBEM data alone to further examine the air void contents
and ITSM relationship, the results retuned 0, -107.7298, and 23.14634 for the
level of significance, coefficient and standards error respectively for the I.L.
condition. The significance observed here is very strong. Similar results were
obtained for the 20dmmCBEM. The reason for these conflicting results must have
been due to the sample size which is relatively small. Such analyses require
robust sample number for good results. None-the-less, the results here indicate
generally that as CBEMs cure, the air voids – stiffness relationship gets stronger.
From this investigation, this is particularly observed as strong for VACBEM as a
1% rise in air void content could result in loss of ITSM as high as 239.49MPa for
fully cured (F.C.) conditions.
6.9 The Indirect Tensile Fatigue Test (ITFT)
As earlier mentioned, fatigue is one of the failure mechanisms of bituminous road
pavements and so the fatigue behaviour of bituminous materials is normally
characterised to ensure proper design. The Indirect Tensile Fatigue Test (ITFT) is
useful in this regard because it is easy and as well fast to conduct compared to
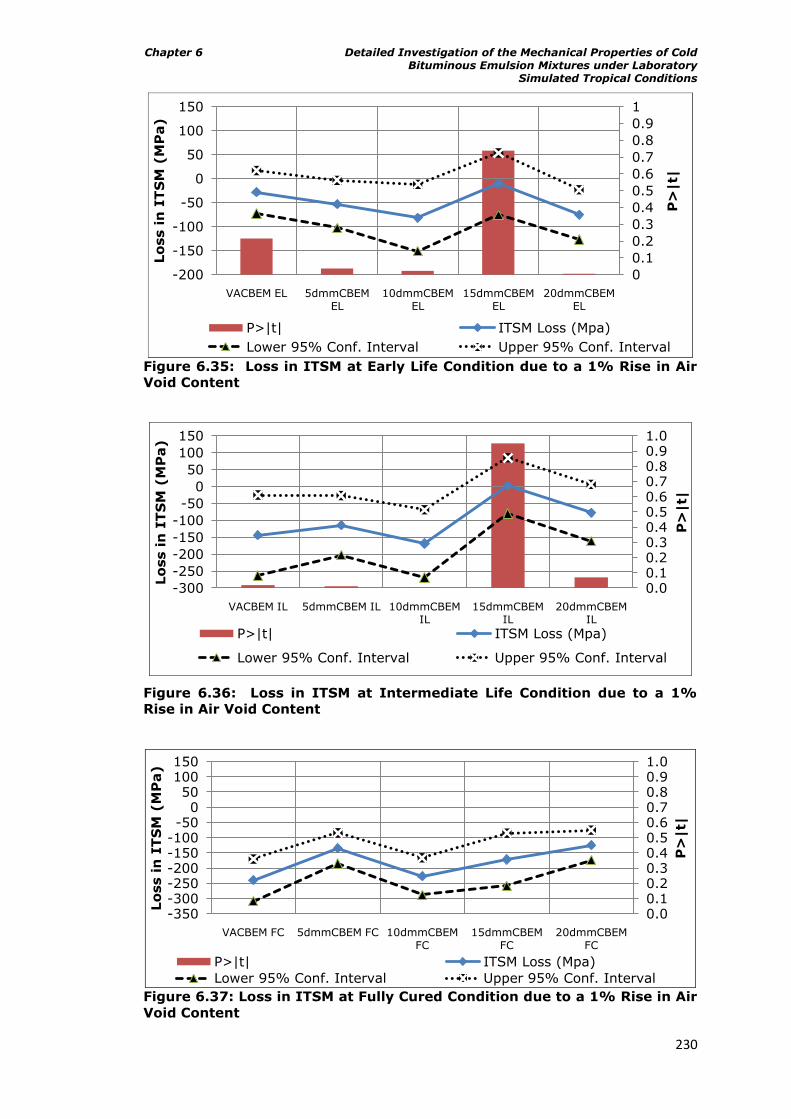
Chapter 6 Detailed Investigation of the Mechanical Properties of Cold Bituminous Emulsion Mixtures under Laboratory
Simulated Tropical Conditions
230
Figure 6.35: Loss in ITSM at Early Life Condition due to a 1% Rise in Air
Void Content
Figure 6.36: Loss in ITSM at Intermediate Life Condition due to a 1%
Rise in Air Void Content
Figure 6.37: Loss in ITSM at Fully Cured Condition due to a 1% Rise in Air
Void Content
0
0.1
0.2
0.3
0.4
0.5
0.6
0.7
0.8
0.9
1
-200
-150
-100
-50
0
50
100
150
VACBEM EL 5dmmCBEM EL
10dmmCBEM EL
15dmmCBEM EL
20dmmCBEM EL
P>
|t|
Lo
ss i
n I
TS
M (
MP
a)
P>|t| ITSM Loss (Mpa)
Lower 95% Conf. Interval Upper 95% Conf. Interval
0.00.10.20.30.40.50.60.70.80.91.0
-300
-250
-200
-150
-100
-50
0
50
100
150
VACBEM IL 5dmmCBEM IL 10dmmCBEM IL
15dmmCBEM IL
20dmmCBEM IL
P>
|t|
Lo
ss i
n I
TS
M (
MP
a)
P>|t| ITSM Loss (Mpa)
Lower 95% Conf. Interval Upper 95% Conf. Interval
0.00.10.20.30.40.50.60.70.80.91.0
-350-300-250-200-150-100-50
050
100150
VACBEM FC 5dmmCBEM FC 10dmmCBEM FC
15dmmCBEM FC
20dmmCBEM FC
P>
|t|
Lo
ss i
n I
TS
M (
MP
a)
P>|t| ITSM Loss (Mpa)
Lower 95% Conf. Interval Upper 95% Conf. Interval
Chapter 6 Detailed Investigation of the Mechanical Properties of Cold Bituminous Emulsion Mixtures under Laboratory
Simulated Tropical Conditions
231
other fatigue tests i.e. beam fatigue tests. This is mainly because cylindrical
specimens either manufactured in the laboratory or cored from the road are also
used for the test just as for the ITSM. Plate B in Figure 6.9 shows the ITFT mode
of testing in the NAT. As in the ITSM test, every other assumption for specimen
and condition of testing holds for the ITFT as outlined by Read (1996), except
that load is applied repeatedly along the vertical diameter until the specimen fails
i.e. when the loading strip vertically deforms by 9mm. This load induces an
indirect tensile stress on the horizontal diameter. Rahman (2004) reported that
the magnitude of the stresses varies along the diameter but that they are at a
maximum at the centre of the specimen. Thus prior to the ITFT test, an ITSM test
in stress controlled mode is conducted on specimens at the required test stress
level for the ITFT to determine the horizontal deformation and corresponding
ITSM values. Once the test has been done, equations 6.1 and 6.12 are used to
determine the maximum stress and maximum strain at the centre of the
specimen.
The CBEM specimens used were 50±2mm thick. Tests were conducted at 20⁰C
and 30⁰C. Trimming was not considered appropriate for such fragile mixtures in
order not to compromise the integrity of the specimens. Also for very weak
specimen conditions, especially for tests conducted at 30⁰C, stress levels as low
as 300kPa were chosen as the maximum. For the analysis of results, the initial
maximum tensile strain at the centre of the specimen ( ) for each
respective stress level as determined for each specimen using equation 6.12 was
subsequently plotted against corresponding number of cycles to failure (Nf).
Linear regression analysis using the least square method was then applied to the
data. It is common for researchers to fit the curves using the relationship below
suggested by Pell (1973):
6.16
Where:
= Number of load applications to failure
= maximum strain at the centre of specimen
c, m = factors depending on the composition and properties of the mixture; m
is the slope of the fatigue line.
Chapter 6 Detailed Investigation of the Mechanical Properties of Cold Bituminous Emulsion Mixtures under Laboratory
Simulated Tropical Conditions
232
6.9.1 Fatigue responses of CBEMs
For this test, only CBEMs that were fully cured, mixed and compacted at 20⁰C and
32⁰C applying compactive effort of 200 gyrations were examined. 15dmmCBEMs
were not included in this study. Also the VACBEM prepared at 20⁰C was not
included. Table 6.21 details the fatigue responses of the CBEMs using the
equations for strain and cycles to failure and the R-squared values. Equations for
20mmDBM and 28mmDBM 50 studied by Read (1996) were included for
comparison though tested at lower temperatures. Meanwhile the R-squared
values in the table show a good fitness of the data for the relationship stated in
equation 6.16 since all the values were above 0.90. For brevity, only figures in
which VACBEM are represented have been plotted here since it is the control
mixture. Figures 6.38 and 6.39 show the regressed fatigue lines for the tests
conducted at 20⁰C and 30⁰C respectively. Figure 6.38 which is for tests conducted
at 20⁰C demonstrates that the 20dmmCBEM has the longest fatigue life of all the
CBEMs studied, while the 5dmmCBEM indicated the shortest. This is against logic
at face value as researchers have suggested that the material with the stiffest
bitumen gives the longest fatigue life (Cooper and Pell, 1974). The explanation for
this observation is that the residual bitumen from the emulsion played the
prominent role in the fatigue response of the 5dmmCBEM. The activeness of aged
residual bitumen was not significant enough to alter the property of the overall
active binder in the mix.
Aside from the VACBEM which ordinarily was expected to have displayed the least
fatigue life response, the next in rank to the 5dmmCBEM is the 10dmmCBEM. It is
likely that a relatively higher portion of the residual aged bitumen from the
10dmm RAP has possibly been rejuvenated compared to the 5dmmCBEM.
Therefore, it is logical for the 20dmmCBEM to have demonstrated the longest
fatigue life since it has the greatest possible potential for rejuvenation (if any
rejuvenation is taking place) as a result of it containing the most active and
stiffest bitumen at the temperature of 30⁰C used for the preparation of the
CBEMs. The preparation temperature was probably sufficient to excite a
significant portion of the residual aged bitumen in the 20dmm RAP causing it to
interact with the residual binder from the emulsion and in the process altering the
overall behaviour of the active binder in the mix i.e. becoming stiffer. This order
could have changed if the preparation temperature was sufficiently high to excite
all the residual aged binders in the 5dmm and 10dmm RAPs. Figure 6.39 for the
tests conducted at 30⁰C shows that the 5dmmCBEM displayed the longest fatigue
life while the VACBEM indicated the shortest of all the CBEMs tested. This
observation appears logical except for the order of the 10dmmCBEM and
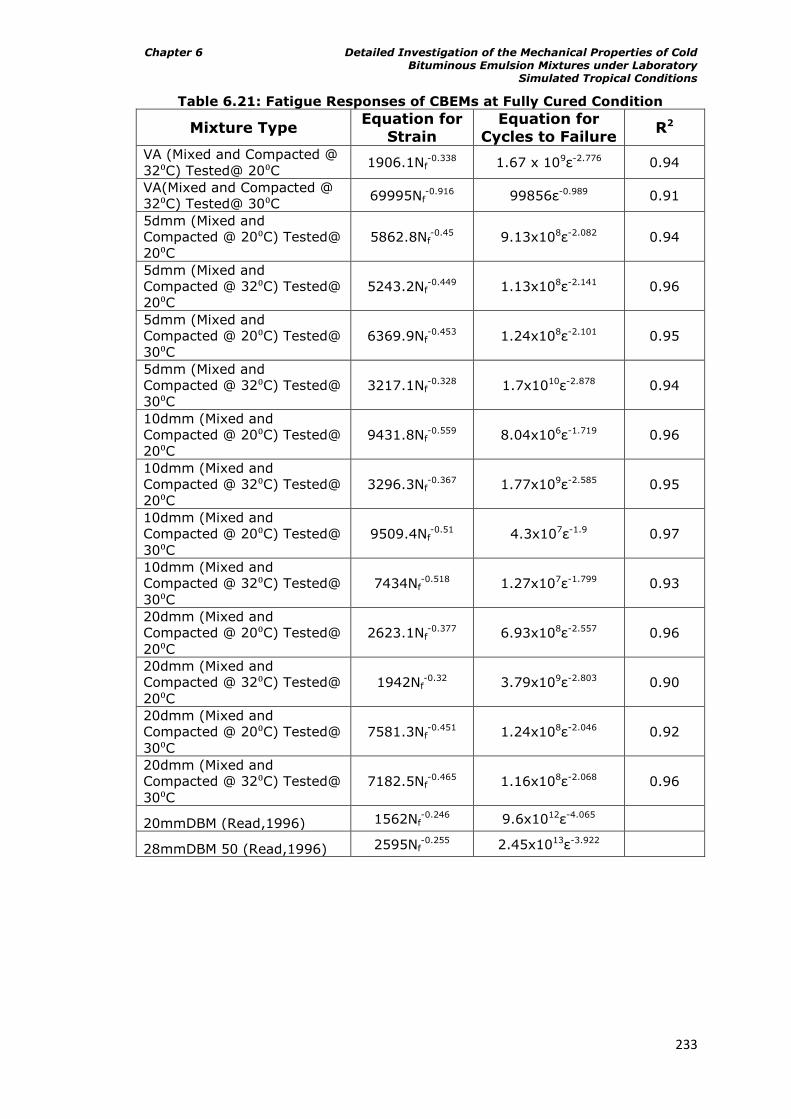
Chapter 6 Detailed Investigation of the Mechanical Properties of Cold Bituminous Emulsion Mixtures under Laboratory
Simulated Tropical Conditions
233
Table 6.21: Fatigue Responses of CBEMs at Fully Cured Condition
Mixture Type Equation for
Strain
Equation for
Cycles to Failure R2
VA (Mixed and Compacted @
32⁰C) Tested@ 20⁰C 1906.1Nf
-0.338 1.67 x 10⁹ -2.776 0.94
VA(Mixed and Compacted @
32⁰C) Tested@ 30⁰C 69995Nf
-0.916 99856 -0.989 0.91
5dmm (Mixed and
Compacted @ 20⁰C) Tested@
20⁰C
5862.8Nf-0.45 9.13x10⁸ -2.082 0.94
5dmm (Mixed and
Compacted @ 32⁰C) Tested@
20⁰C
5243.2Nf-0.449 1.13x10⁸ -2.141 0.96
5dmm (Mixed and
Compacted @ 20⁰C) Tested@
30⁰C
6369.9Nf-0.453 1.24x10⁸ -2.101 0.95
5dmm (Mixed and
Compacted @ 32⁰C) Tested@
30⁰C
3217.1Nf-0.328 1.7x10¹⁰ -2.878 0.94
10dmm (Mixed and
Compacted @ 20⁰C) Tested@
20⁰C
9431.8Nf-0.559 8.04x10⁶ -1.719 0.96
10dmm (Mixed and
Compacted @ 32⁰C) Tested@
20⁰C
3296.3Nf-0.367 1.77x10⁹ -2.585 0.95
10dmm (Mixed and
Compacted @ 20⁰C) Tested@
30⁰C
9509.4Nf-0.51 4.3x10⁷ -1.9 0.97
10dmm (Mixed and
Compacted @ 32⁰C) Tested@
30⁰C
7434Nf-0.518 1.27x10⁷ -1.799 0.93
20dmm (Mixed and
Compacted @ 20⁰C) Tested@
20⁰C
2623.1Nf-0.377 6.93x10⁸ -2.557 0.96
20dmm (Mixed and
Compacted @ 32⁰C) Tested@
20⁰C
1942Nf-0.32 3.79x10⁹ -2.803 0.90
20dmm (Mixed and
Compacted @ 20⁰C) Tested@
30⁰C
7581.3Nf-0.451 1.24x10⁸ -2.046 0.92
20dmm (Mixed and
Compacted @ 32⁰C) Tested@
30⁰C
7182.5Nf-0.465 1.16x10⁸ -2.068 0.96
20mmDBM (Read,1996) 1562Nf-0.246 9.6x10¹² -4.065
28mmDBM 50 (Read,1996) 2595Nf-0.255 2.45x10¹³ -3.922
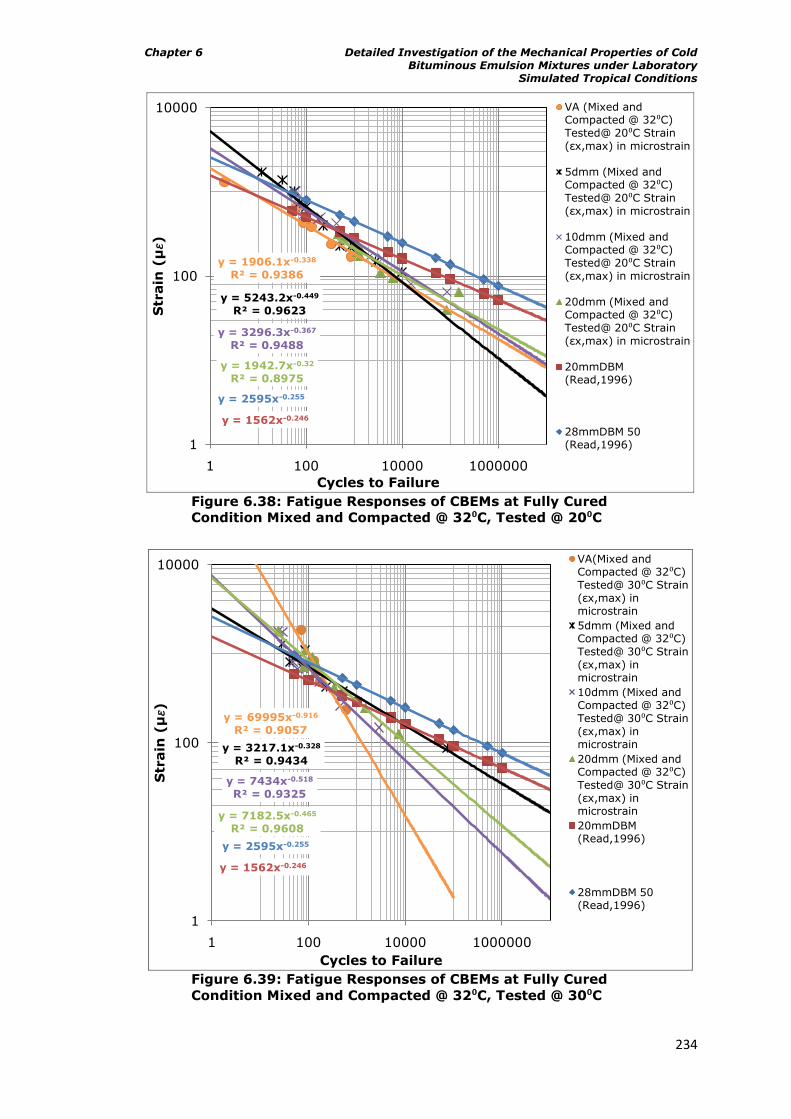
Chapter 6 Detailed Investigation of the Mechanical Properties of Cold Bituminous Emulsion Mixtures under Laboratory
Simulated Tropical Conditions
234
Figure 6.38: Fatigue Responses of CBEMs at Fully Cured
Condition Mixed and Compacted @ 32⁰C, Tested @ 20⁰C
Figure 6.39: Fatigue Responses of CBEMs at Fully Cured
Condition Mixed and Compacted @ 32⁰C, Tested @ 30⁰C
y = 1906.1x-0.338
R² = 0.9386
y = 5243.2x-0.449
R² = 0.9623
y = 3296.3x-0.367
R² = 0.9488
y = 1942.7x-0.32
R² = 0.8975
y = 1562x-0.246
y = 2595x-0.255
1
100
10000
1 100 10000 1000000
Str
ain
(μ𝜀)
Cycles to Failure
VA (Mixed and Compacted @ 32⁰C)
Tested@ 20⁰C Strain
( x,max) in microstrain
5dmm (Mixed and Compacted @ 32⁰C)
Tested@ 20⁰C Strain
( x,max) in microstrain
10dmm (Mixed and Compacted @ 32⁰C)
Tested@ 20⁰C Strain
( x,max) in microstrain
20dmm (Mixed and Compacted @ 32⁰C)
Tested@ 20⁰C Strain
( x,max) in microstrain
20mmDBM (Read,1996)
28mmDBM 50 (Read,1996)
y = 69995x-0.916
R² = 0.9057
y = 3217.1x-0.328
R² = 0.9434
y = 7434x-0.518
R² = 0.9325
y = 7182.5x-0.465
R² = 0.9608
y = 1562x-0.246
y = 2595x-0.255
1
100
10000
1 100 10000 1000000
Str
ain
(μ𝜀)
Cycles to Failure
VA(Mixed and Compacted @ 32⁰C)
Tested@ 30⁰C Strain
( x,max) in microstrain
5dmm (Mixed and Compacted @ 32⁰C)
Tested@ 30⁰C Strain
( x,max) in microstrain
10dmm (Mixed and Compacted @ 32⁰C)
Tested@ 30⁰C Strain
( x,max) in microstrain
20dmm (Mixed and Compacted @ 32⁰C)
Tested@ 30⁰C Strain
( x,max) in microstrain
20mmDBM (Read,1996)
28mmDBM 50 (Read,1996)
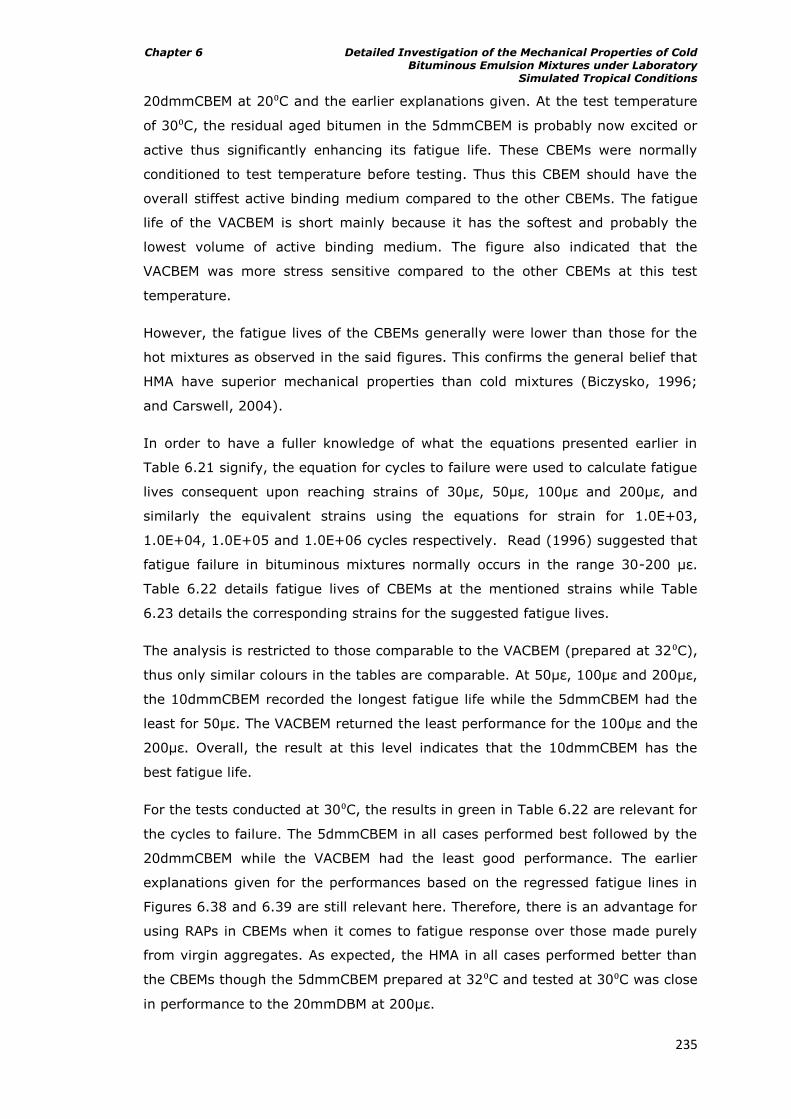
Chapter 6 Detailed Investigation of the Mechanical Properties of Cold Bituminous Emulsion Mixtures under Laboratory
Simulated Tropical Conditions
235
20dmmCBEM at 20⁰C and the earlier explanations given. At the test temperature
of 30⁰C, the residual aged bitumen in the 5dmmCBEM is probably now excited or
active thus significantly enhancing its fatigue life. These CBEMs were normally
conditioned to test temperature before testing. Thus this CBEM should have the
overall stiffest active binding medium compared to the other CBEMs. The fatigue
life of the VACBEM is short mainly because it has the softest and probably the
lowest volume of active binding medium. The figure also indicated that the
VACBEM was more stress sensitive compared to the other CBEMs at this test
temperature.
However, the fatigue lives of the CBEMs generally were lower than those for the
hot mixtures as observed in the said figures. This confirms the general belief that
HMA have superior mechanical properties than cold mixtures (Biczysko, 1996;
and Carswell, 2004).
In order to have a fuller knowledge of what the equations presented earlier in
Table 6.21 signify, the equation for cycles to failure were used to calculate fatigue
lives consequent upon reaching strains of 30μ , 50μ , 100μ and 200μ , and
similarly the equivalent strains using the equations for strain for 1.0E+03,
1.0E+04, 1.0E+05 and 1.0E+06 cycles respectively. Read (1996) suggested that
fatigue failure in bituminous mixtures normally occurs in the range 30-200 μ .
Table 6.22 details fatigue lives of CBEMs at the mentioned strains while Table
6.23 details the corresponding strains for the suggested fatigue lives.
The analysis is restricted to those comparable to the VACBEM (prepared at 32⁰C),
thus only similar colours in the tables are comparable. At 50μ , 100μ and 200μ ,
the 10dmmCBEM recorded the longest fatigue life while the 5dmmCBEM had the
least for 50μ . The VACBEM returned the least performance for the 100μ and the
200μ . Overall, the result at this level indicates that the 10dmmCBEM has the
best fatigue life.
For the tests conducted at 30⁰C, the results in green in Table 6.22 are relevant for
the cycles to failure. The 5dmmCBEM in all cases performed best followed by the
20dmmCBEM while the VACBEM had the least good performance. The earlier
explanations given for the performances based on the regressed fatigue lines in
Figures 6.38 and 6.39 are still relevant here. Therefore, there is an advantage for
using RAPs in CBEMs when it comes to fatigue response over those made purely
from virgin aggregates. As expected, the HMA in all cases performed better than
the CBEMs though the 5dmmCBEM prepared at 32⁰C and tested at 30⁰C was close
in performance to the 20mmDBM at 200μ .
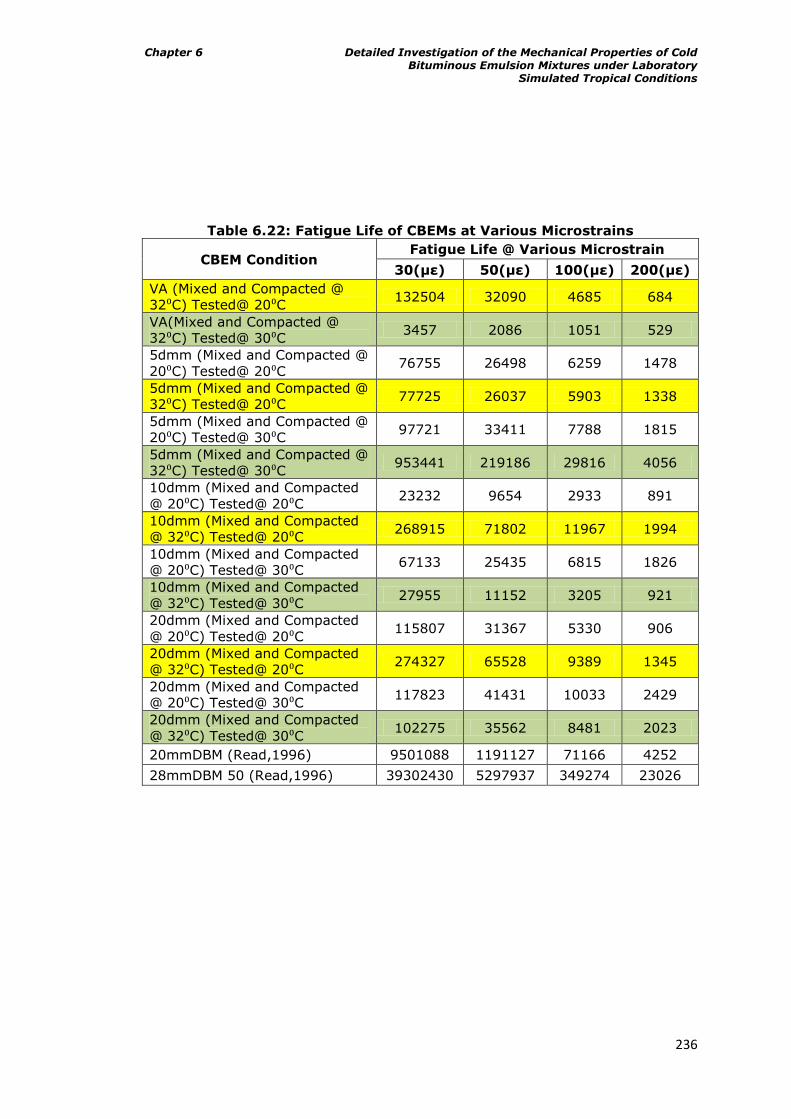
Chapter 6 Detailed Investigation of the Mechanical Properties of Cold Bituminous Emulsion Mixtures under Laboratory
Simulated Tropical Conditions
236
Table 6.22: Fatigue Life of CBEMs at Various Microstrains
CBEM Condition Fatigue Life @ Various Microstrain
30(με) 50(με) 100(με) 200(με)
VA (Mixed and Compacted @
32⁰C) Tested@ 20⁰C 132504 32090 4685 684
VA(Mixed and Compacted @
32⁰C) Tested@ 30⁰C 3457 2086 1051 529
5dmm (Mixed and Compacted @
20⁰C) Tested@ 20⁰C 76755 26498 6259 1478
5dmm (Mixed and Compacted @
32⁰C) Tested@ 20⁰C 77725 26037 5903 1338
5dmm (Mixed and Compacted @
20⁰C) Tested@ 30⁰C 97721 33411 7788 1815
5dmm (Mixed and Compacted @
32⁰C) Tested@ 30⁰C 953441 219186 29816 4056
10dmm (Mixed and Compacted
@ 20⁰C) Tested@ 20⁰C 23232 9654 2933 891
10dmm (Mixed and Compacted
@ 32⁰C) Tested@ 20⁰C 268915 71802 11967 1994
10dmm (Mixed and Compacted
@ 20⁰C) Tested@ 30⁰C 67133 25435 6815 1826
10dmm (Mixed and Compacted
@ 32⁰C) Tested@ 30⁰C 27955 11152 3205 921
20dmm (Mixed and Compacted
@ 20⁰C) Tested@ 20⁰C 115807 31367 5330 906
20dmm (Mixed and Compacted
@ 32⁰C) Tested@ 20⁰C 274327 65528 9389 1345
20dmm (Mixed and Compacted
@ 20⁰C) Tested@ 30⁰C 117823 41431 10033 2429
20dmm (Mixed and Compacted
@ 32⁰C) Tested@ 30⁰C 102275 35562 8481 2023
20mmDBM (Read,1996) 9501088 1191127 71166 4252
28mmDBM 50 (Read,1996) 39302430 5297937 349274 23026
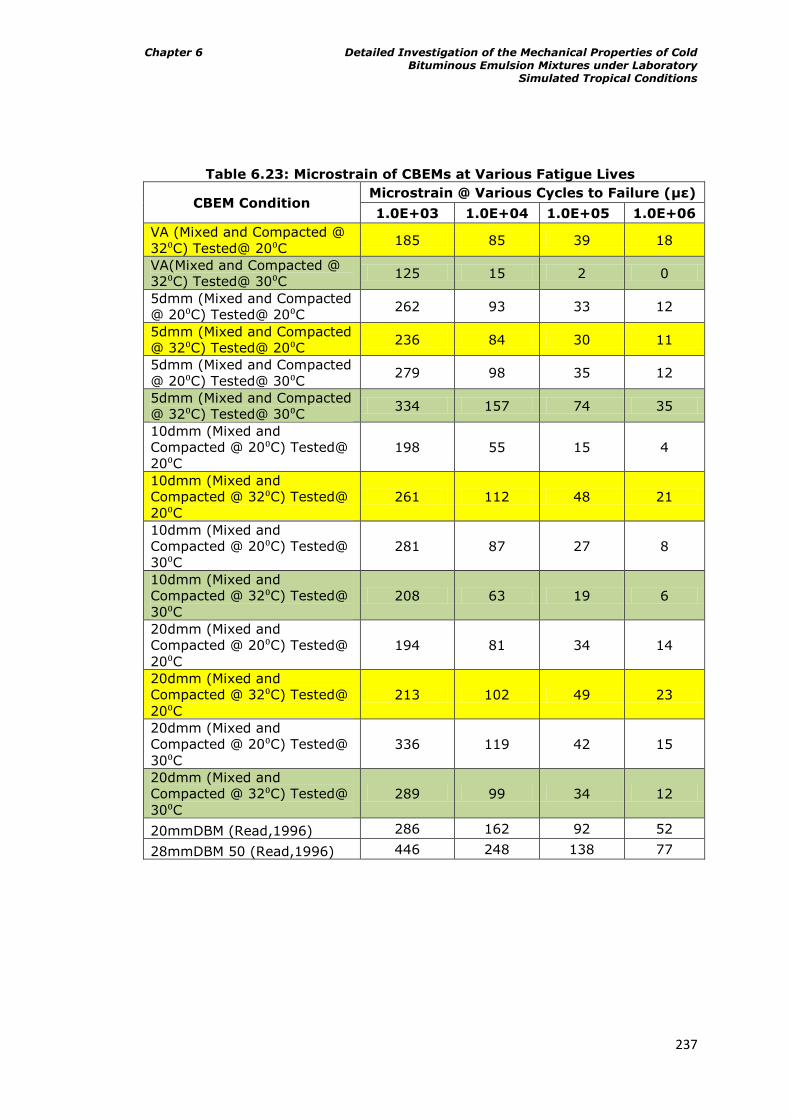
Chapter 6 Detailed Investigation of the Mechanical Properties of Cold Bituminous Emulsion Mixtures under Laboratory
Simulated Tropical Conditions
237
Table 6.23: Microstrain of CBEMs at Various Fatigue Lives
CBEM Condition Microstrain @ Various Cycles to Failure (με)
1.0E+03 1.0E+04 1.0E+05 1.0E+06
VA (Mixed and Compacted @
32⁰C) Tested@ 20⁰C 185 85 39 18
VA(Mixed and Compacted @
32⁰C) Tested@ 30⁰C 125 15 2 0
5dmm (Mixed and Compacted
@ 20⁰C) Tested@ 20⁰C 262 93 33 12
5dmm (Mixed and Compacted
@ 32⁰C) Tested@ 20⁰C 236 84 30 11
5dmm (Mixed and Compacted
@ 20⁰C) Tested@ 30⁰C 279 98 35 12
5dmm (Mixed and Compacted
@ 32⁰C) Tested@ 30⁰C 334 157 74 35
10dmm (Mixed and
Compacted @ 20⁰C) Tested@
20⁰C
198 55 15 4
10dmm (Mixed and
Compacted @ 32⁰C) Tested@
20⁰C
261 112 48 21
10dmm (Mixed and
Compacted @ 20⁰C) Tested@
30⁰C
281 87 27 8
10dmm (Mixed and
Compacted @ 32⁰C) Tested@
30⁰C
208 63 19 6
20dmm (Mixed and
Compacted @ 20⁰C) Tested@
20⁰C
194 81 34 14
20dmm (Mixed and
Compacted @ 32⁰C) Tested@
20⁰C
213 102 49 23
20dmm (Mixed and
Compacted @ 20⁰C) Tested@
30⁰C
336 119 42 15
20dmm (Mixed and
Compacted @ 32⁰C) Tested@
30⁰C
289 99 34 12
20mmDBM (Read,1996) 286 162 92 52
28mmDBM 50 (Read,1996) 446 248 138 77
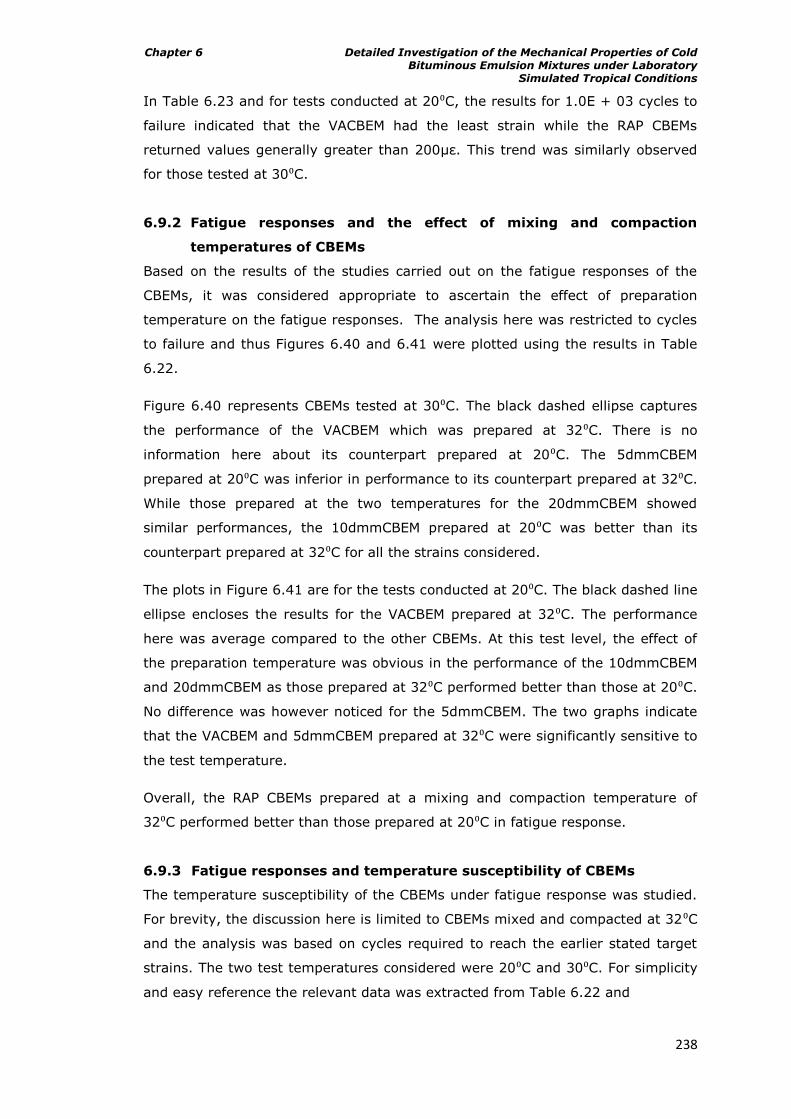
Chapter 6 Detailed Investigation of the Mechanical Properties of Cold Bituminous Emulsion Mixtures under Laboratory
Simulated Tropical Conditions
238
In Table 6.23 and for tests conducted at 20⁰C, the results for 1.0E + 03 cycles to
failure indicated that the VACBEM had the least strain while the RAP CBEMs
returned values generally greater than 200μ . This trend was similarly observed
for those tested at 30⁰C.
6.9.2 Fatigue responses and the effect of mixing and compaction
temperatures of CBEMs
Based on the results of the studies carried out on the fatigue responses of the
CBEMs, it was considered appropriate to ascertain the effect of preparation
temperature on the fatigue responses. The analysis here was restricted to cycles
to failure and thus Figures 6.40 and 6.41 were plotted using the results in Table
6.22.
Figure 6.40 represents CBEMs tested at 30⁰C. The black dashed ellipse captures
the performance of the VACBEM which was prepared at 32⁰C. There is no
information here about its counterpart prepared at 20⁰C. The 5dmmCBEM
prepared at 20⁰C was inferior in performance to its counterpart prepared at 32⁰C.
While those prepared at the two temperatures for the 20dmmCBEM showed
similar performances, the 10dmmCBEM prepared at 20⁰C was better than its
counterpart prepared at 32⁰C for all the strains considered.
The plots in Figure 6.41 are for the tests conducted at 20⁰C. The black dashed line
ellipse encloses the results for the VACBEM prepared at 32⁰C. The performance
here was average compared to the other CBEMs. At this test level, the effect of
the preparation temperature was obvious in the performance of the 10dmmCBEM
and 20dmmCBEM as those prepared at 32⁰C performed better than those at 20⁰C.
No difference was however noticed for the 5dmmCBEM. The two graphs indicate
that the VACBEM and 5dmmCBEM prepared at 32⁰C were significantly sensitive to
the test temperature.
Overall, the RAP CBEMs prepared at a mixing and compaction temperature of
32⁰C performed better than those prepared at 20⁰C in fatigue response.
6.9.3 Fatigue responses and temperature susceptibility of CBEMs
The temperature susceptibility of the CBEMs under fatigue response was studied.
For brevity, the discussion here is limited to CBEMs mixed and compacted at 32⁰C
and the analysis was based on cycles required to reach the earlier stated target
strains. The two test temperatures considered were 20⁰C and 30⁰C. For simplicity
and easy reference the relevant data was extracted from Table 6.22 and
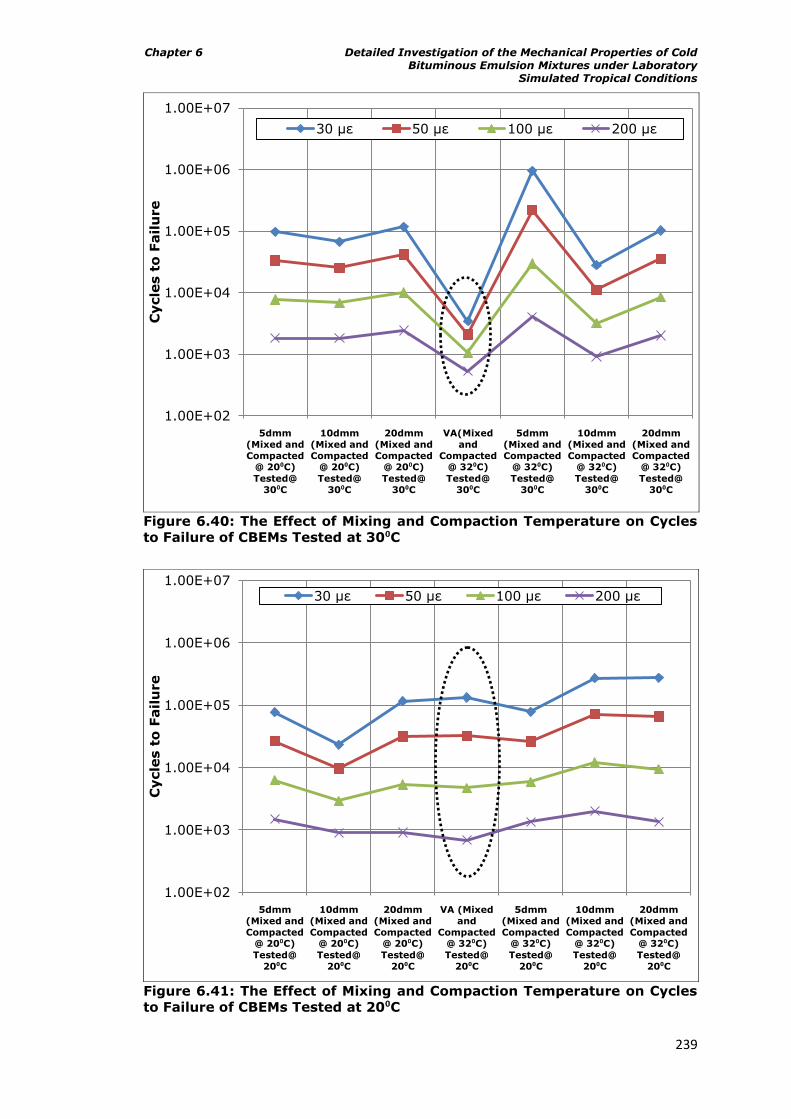
Chapter 6 Detailed Investigation of the Mechanical Properties of Cold Bituminous Emulsion Mixtures under Laboratory
Simulated Tropical Conditions
239
Figure 6.40: The Effect of Mixing and Compaction Temperature on Cycles
to Failure of CBEMs Tested at 30⁰C
Figure 6.41: The Effect of Mixing and Compaction Temperature on Cycles
to Failure of CBEMs Tested at 20⁰C
1.00E+02
1.00E+03
1.00E+04
1.00E+05
1.00E+06
1.00E+07
5dmm
(Mixed and
Compacted @ 20⁰C)
Tested@
30⁰C
10dmm
(Mixed and
Compacted @ 20⁰C)
Tested@
30⁰C
20dmm
(Mixed and
Compacted @ 20⁰C)
Tested@
30⁰C
VA(Mixed
and
Compacted @ 32⁰C)
Tested@
30⁰C
5dmm
(Mixed and
Compacted @ 32⁰C)
Tested@
30⁰C
10dmm
(Mixed and
Compacted @ 32⁰C)
Tested@
30⁰C
20dmm
(Mixed and
Compacted @ 32⁰C)
Tested@
30⁰C
Cycle
s t
o F
ailu
re
30 μ 50 μ 100 μ 200 μ
1.00E+02
1.00E+03
1.00E+04
1.00E+05
1.00E+06
1.00E+07
5dmm
(Mixed and
Compacted @ 20⁰C)
Tested@
20⁰C
10dmm
(Mixed and
Compacted @ 20⁰C)
Tested@
20⁰C
20dmm
(Mixed and
Compacted @ 20⁰C)
Tested@
20⁰C
VA (Mixed
and
Compacted @ 32⁰C)
Tested@
20⁰C
5dmm
(Mixed and
Compacted @ 32⁰C)
Tested@
20⁰C
10dmm
(Mixed and
Compacted @ 32⁰C)
Tested@
20⁰C
20dmm
(Mixed and
Compacted @ 32⁰C)
Tested@
20⁰C
Cycle
s t
o F
ailu
re
30 μ 50 μ 100 μ 200 μ
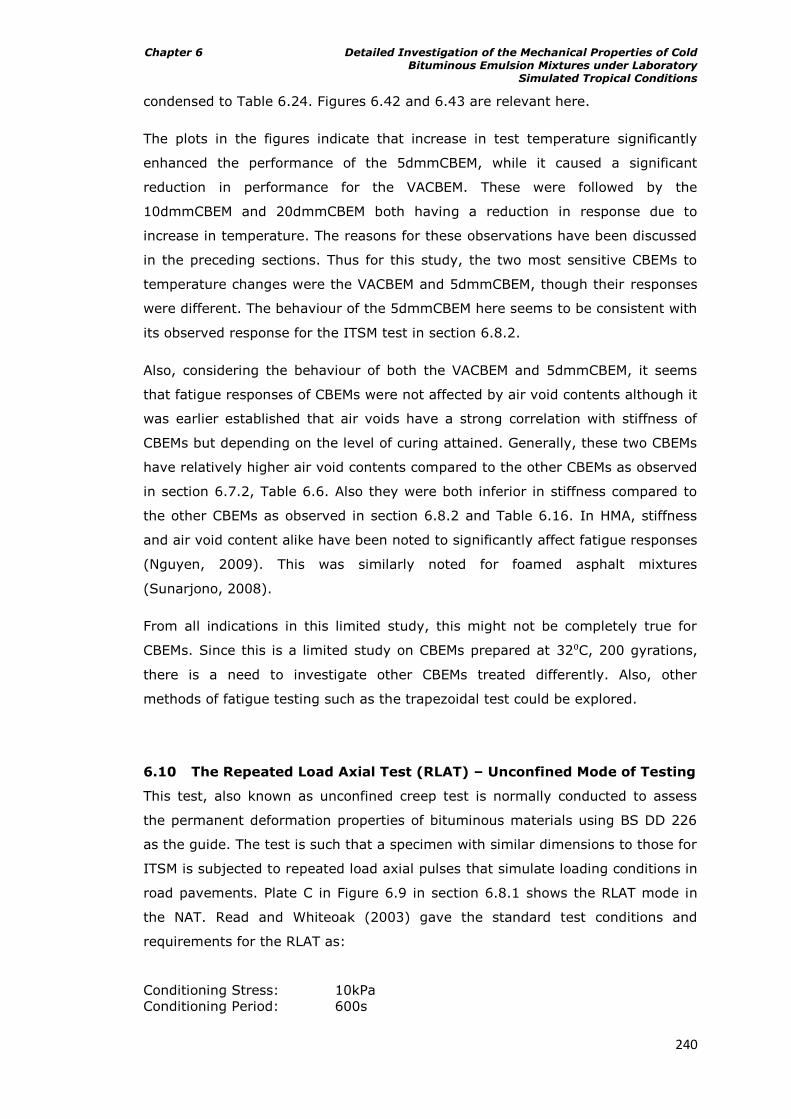
Chapter 6 Detailed Investigation of the Mechanical Properties of Cold Bituminous Emulsion Mixtures under Laboratory
Simulated Tropical Conditions
240
condensed to Table 6.24. Figures 6.42 and 6.43 are relevant here.
The plots in the figures indicate that increase in test temperature significantly
enhanced the performance of the 5dmmCBEM, while it caused a significant
reduction in performance for the VACBEM. These were followed by the
10dmmCBEM and 20dmmCBEM both having a reduction in response due to
increase in temperature. The reasons for these observations have been discussed
in the preceding sections. Thus for this study, the two most sensitive CBEMs to
temperature changes were the VACBEM and 5dmmCBEM, though their responses
were different. The behaviour of the 5dmmCBEM here seems to be consistent with
its observed response for the ITSM test in section 6.8.2.
Also, considering the behaviour of both the VACBEM and 5dmmCBEM, it seems
that fatigue responses of CBEMs were not affected by air void contents although it
was earlier established that air voids have a strong correlation with stiffness of
CBEMs but depending on the level of curing attained. Generally, these two CBEMs
have relatively higher air void contents compared to the other CBEMs as observed
in section 6.7.2, Table 6.6. Also they were both inferior in stiffness compared to
the other CBEMs as observed in section 6.8.2 and Table 6.16. In HMA, stiffness
and air void content alike have been noted to significantly affect fatigue responses
(Nguyen, 2009). This was similarly noted for foamed asphalt mixtures
(Sunarjono, 2008).
From all indications in this limited study, this might not be completely true for
CBEMs. Since this is a limited study on CBEMs prepared at 32⁰C, 200 gyrations,
there is a need to investigate other CBEMs treated differently. Also, other
methods of fatigue testing such as the trapezoidal test could be explored.
6.10 The Repeated Load Axial Test (RLAT) – Unconfined Mode of Testing
This test, also known as unconfined creep test is normally conducted to assess
the permanent deformation properties of bituminous materials using BS DD 226
as the guide. The test is such that a specimen with similar dimensions to those for
ITSM is subjected to repeated load axial pulses that simulate loading conditions in
road pavements. Plate C in Figure 6.9 in section 6.8.1 shows the RLAT mode in
the NAT. Read and Whiteoak (2003) gave the standard test conditions and
requirements for the RLAT as:
Conditioning Stress: 10kPa
Conditioning Period: 600s
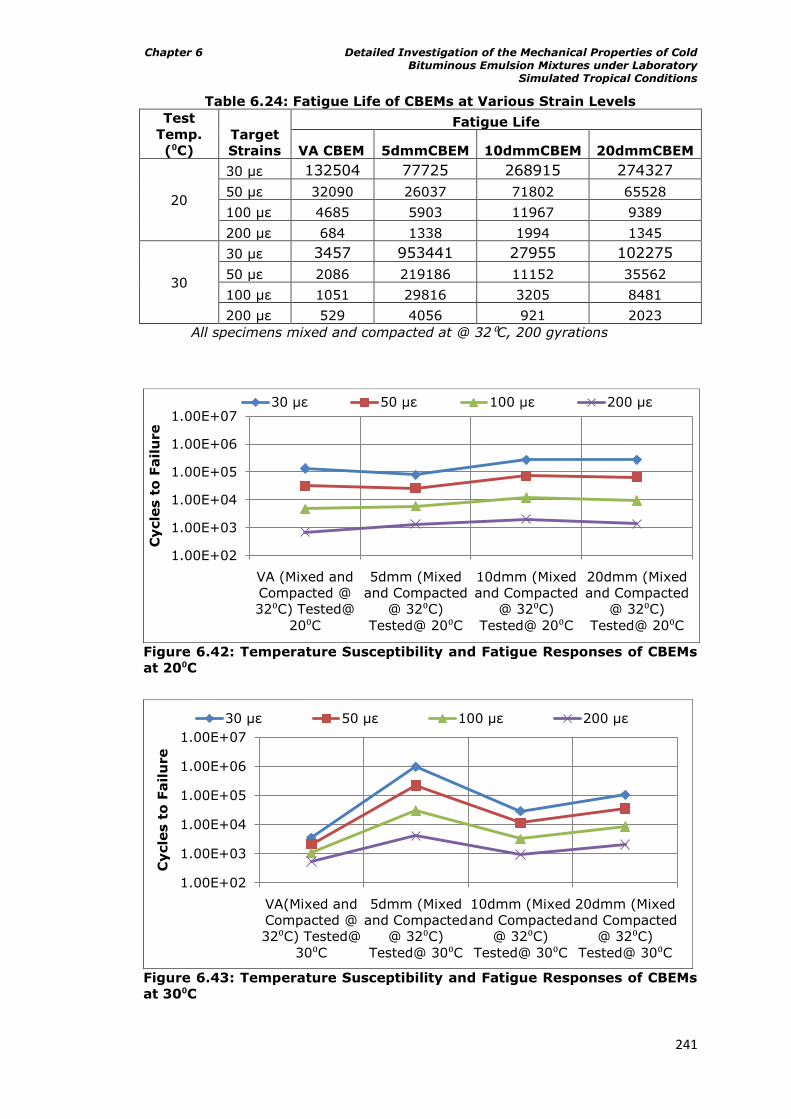
Chapter 6 Detailed Investigation of the Mechanical Properties of Cold Bituminous Emulsion Mixtures under Laboratory
Simulated Tropical Conditions
241
Table 6.24: Fatigue Life of CBEMs at Various Strain Levels
Test
Temp.
(⁰C) Target
Strains
Fatigue Life
VA CBEM 5dmmCBEM 10dmmCBEM 20dmmCBEM
20
30 μ 132504 77725 268915 274327
50 μ 32090 26037 71802 65528
100 μ 4685 5903 11967 9389
200 μ 684 1338 1994 1345
30
30 μ 3457 953441 27955 102275
50 μ 2086 219186 11152 35562
100 μ 1051 29816 3205 8481
200 μ 529 4056 921 2023
All specimens mixed and compacted at @ 32⁰C, 200 gyrations
Figure 6.42: Temperature Susceptibility and Fatigue Responses of CBEMs
at 20⁰C
Figure 6.43: Temperature Susceptibility and Fatigue Responses of CBEMs
at 30⁰C
1.00E+02
1.00E+03
1.00E+04
1.00E+05
1.00E+06
1.00E+07
VA (Mixed and
Compacted @
32⁰C) Tested@
20⁰C
5dmm (Mixed
and Compacted
@ 32⁰C)
Tested@ 20⁰C
10dmm (Mixed
and Compacted
@ 32⁰C)
Tested@ 20⁰C
20dmm (Mixed
and Compacted
@ 32⁰C)
Tested@ 20⁰C
Cycle
s t
o F
ailu
re
30 μ 50 μ 100 μ 200 μ
1.00E+02
1.00E+03
1.00E+04
1.00E+05
1.00E+06
1.00E+07
VA(Mixed and
Compacted @
32⁰C) Tested@
30⁰C
5dmm (Mixed
and Compacted
@ 32⁰C)
Tested@ 30⁰C
10dmm (Mixed
and Compacted
@ 32⁰C)
Tested@ 30⁰C
20dmm (Mixed
and Compacted
@ 32⁰C)
Tested@ 30⁰C
Cycle
s t
o F
ailu
re
30 μ 50 μ 100 μ 200 μ
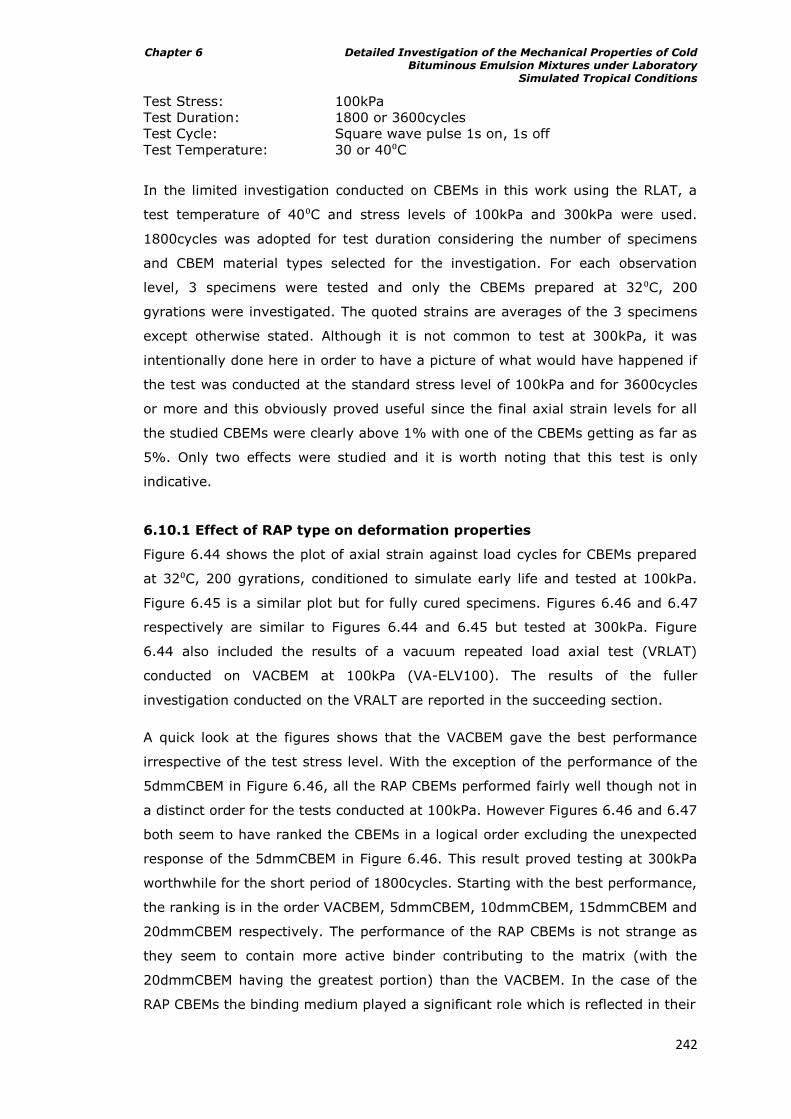
Chapter 6 Detailed Investigation of the Mechanical Properties of Cold Bituminous Emulsion Mixtures under Laboratory
Simulated Tropical Conditions
242
Test Stress: 100kPa
Test Duration: 1800 or 3600cycles
Test Cycle: Square wave pulse 1s on, 1s off
Test Temperature: 30 or 40⁰C
In the limited investigation conducted on CBEMs in this work using the RLAT, a
test temperature of 40⁰C and stress levels of 100kPa and 300kPa were used.
1800cycles was adopted for test duration considering the number of specimens
and CBEM material types selected for the investigation. For each observation
level, 3 specimens were tested and only the CBEMs prepared at 32⁰C, 200
gyrations were investigated. The quoted strains are averages of the 3 specimens
except otherwise stated. Although it is not common to test at 300kPa, it was
intentionally done here in order to have a picture of what would have happened if
the test was conducted at the standard stress level of 100kPa and for 3600cycles
or more and this obviously proved useful since the final axial strain levels for all
the studied CBEMs were clearly above 1% with one of the CBEMs getting as far as
5%. Only two effects were studied and it is worth noting that this test is only
indicative.
6.10.1 Effect of RAP type on deformation properties
Figure 6.44 shows the plot of axial strain against load cycles for CBEMs prepared
at 32⁰C, 200 gyrations, conditioned to simulate early life and tested at 100kPa.
Figure 6.45 is a similar plot but for fully cured specimens. Figures 6.46 and 6.47
respectively are similar to Figures 6.44 and 6.45 but tested at 300kPa. Figure
6.44 also included the results of a vacuum repeated load axial test (VRLAT)
conducted on VACBEM at 100kPa (VA-ELV100). The results of the fuller
investigation conducted on the VRALT are reported in the succeeding section.
A quick look at the figures shows that the VACBEM gave the best performance
irrespective of the test stress level. With the exception of the performance of the
5dmmCBEM in Figure 6.46, all the RAP CBEMs performed fairly well though not in
a distinct order for the tests conducted at 100kPa. However Figures 6.46 and 6.47
both seem to have ranked the CBEMs in a logical order excluding the unexpected
response of the 5dmmCBEM in Figure 6.46. This result proved testing at 300kPa
worthwhile for the short period of 1800cycles. Starting with the best performance,
the ranking is in the order VACBEM, 5dmmCBEM, 10dmmCBEM, 15dmmCBEM and
20dmmCBEM respectively. The performance of the RAP CBEMs is not strange as
they seem to contain more active binder contributing to the matrix (with the
20dmmCBEM having the greatest portion) than the VACBEM. In the case of the
RAP CBEMs the binding medium played a significant role which is reflected in their
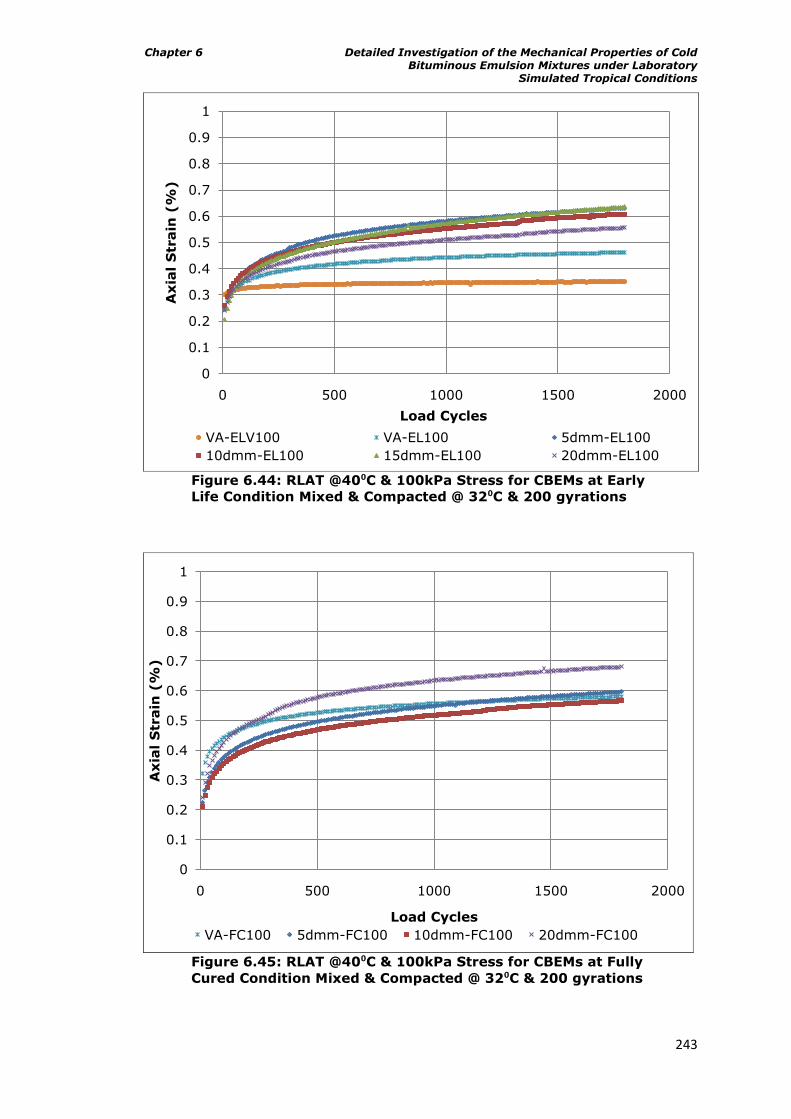
Chapter 6 Detailed Investigation of the Mechanical Properties of Cold Bituminous Emulsion Mixtures under Laboratory
Simulated Tropical Conditions
243
Figure 6.44: RLAT @40⁰C & 100kPa Stress for CBEMs at Early
Life Condition Mixed & Compacted @ 32⁰C & 200 gyrations
Figure 6.45: RLAT @40⁰C & 100kPa Stress for CBEMs at Fully
Cured Condition Mixed & Compacted @ 32⁰C & 200 gyrations
0
0.1
0.2
0.3
0.4
0.5
0.6
0.7
0.8
0.9
1
0 500 1000 1500 2000
Axia
l S
train
(%
)
Load Cycles
VA-ELV100 VA-EL100 5dmm-EL100
10dmm-EL100 15dmm-EL100 20dmm-EL100
0
0.1
0.2
0.3
0.4
0.5
0.6
0.7
0.8
0.9
1
0 500 1000 1500 2000
Axia
l S
train
(%
)
Load Cycles
VA-FC100 5dmm-FC100 10dmm-FC100 20dmm-FC100
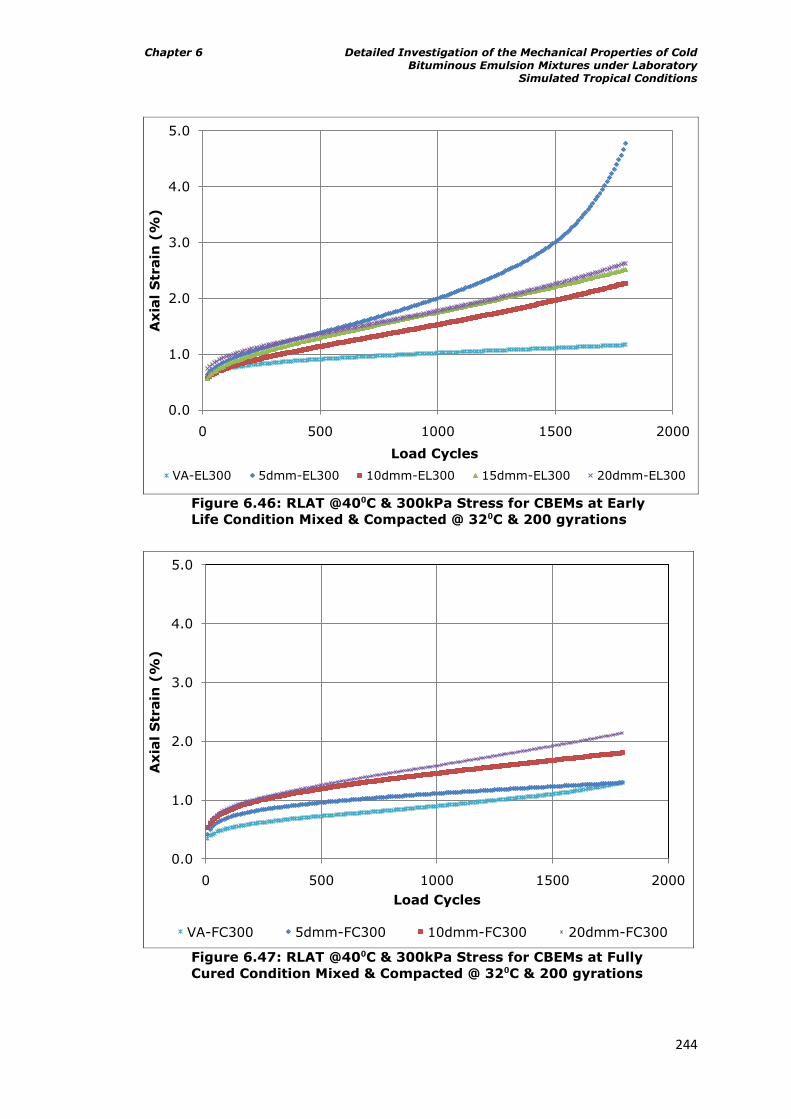
Chapter 6 Detailed Investigation of the Mechanical Properties of Cold Bituminous Emulsion Mixtures under Laboratory
Simulated Tropical Conditions
244
Figure 6.46: RLAT @40⁰C & 300kPa Stress for CBEMs at Early
Life Condition Mixed & Compacted @ 32⁰C & 200 gyrations
Figure 6.47: RLAT @40⁰C & 300kPa Stress for CBEMs at Fully
Cured Condition Mixed & Compacted @ 32⁰C & 200 gyrations
0.0
1.0
2.0
3.0
4.0
5.0
0 500 1000 1500 2000
Axia
l S
train
(%
)
Load Cycles
VA-EL300 5dmm-EL300 10dmm-EL300 15dmm-EL300 20dmm-EL300
0.0
1.0
2.0
3.0
4.0
5.0
0 500 1000 1500 2000
Axia
l S
train
(%
)
Load Cycles
VA-FC300 5dmm-FC300 10dmm-FC300 20dmm-FC300
Chapter 6 Detailed Investigation of the Mechanical Properties of Cold Bituminous Emulsion Mixtures under Laboratory
Simulated Tropical Conditions
245
performance as they are more temperature susceptible. This consequently gave a
wider room for movement within the mix. The aggregate-to-aggregate contact in
the VACBEM played the pivotal role in the resistance to deformation. In fact, the
VACBEM seem to have behaved more or less like unbound granular material at
this level compared to the RAP CBEMs. This is in consonance with the observation
made for the good performance of the VACBEM for high stress levels in fatigue
response. Oruc et al (2006) are among a host of other researchers who have
similarly found this trend for cold mixtures. From Figures 6.44 and 45, all the
materials are pretty good since strain is less than 1% (Thom, 2008).
6.10.2 The effect of curing on deformation properties of CBEMs
Further detailed analysis was conducted to properly rank performance at early life
and fully cured conditions of the CBEMs. In general, researchers have identified 3
distinct stages for full deformation tests conducted to failure (Gibb, 1996). In
Stage 1 (primary creep phase) for example, the densification of the specimen
essentially takes place. During this stage, vertical strain accumulation increases
rapidly though with a progressive decrease in the accompanying permanent
deformation. This stage is subsequently followed by Stage 2 (secondary creep
phase) which witnesses a constant strain rate. This stage mimics primary
deformation of asphalt mixture. The 3rd stage which is referred to as the tertiary
creep phase witnesses a rapid increase in vertical strain until the specimen fails
(Taherkhani, 2006; and Nguyen, 2009). As was earlier stated, the number of load
cycles applied in this test was limited, and as such in most cases the plots only
gave a representation of permanent deformation of the CBEMs in the first stage
and some part of the second stage of the creep tests, while the unexpected
behaviour of the 5dmmCBEM in Figure 6.46 spanned these three stages.
Therefore a rutting indicator analysis was conducted thus. The earlier referred
figures indicate that stage 1, the densification stage terminates at the about 1000
load cycles, most especially for the tests conducted at 100kPa stress level. It is
obvious that at this stage, vertical strain accumulation was high at the onset and
that it stabilised thereafter. At the second stage which is assumed to have started
at 1001 cycle, the vertical deformation displayed a linearly varying relationship
with loading cycles. Since stage 1 is a densification stage, it is predominated by
air void content and thus judging the rutting potential of the CBEMs on the entire
1800 cycles only could be misleading. The analysis was thus based on the
secondary stage in which air voids have little or no role to play. More importantly,
the CBEMs have assumed a more linear relationship for vertical strain with
corresponding load cycles at that stage.
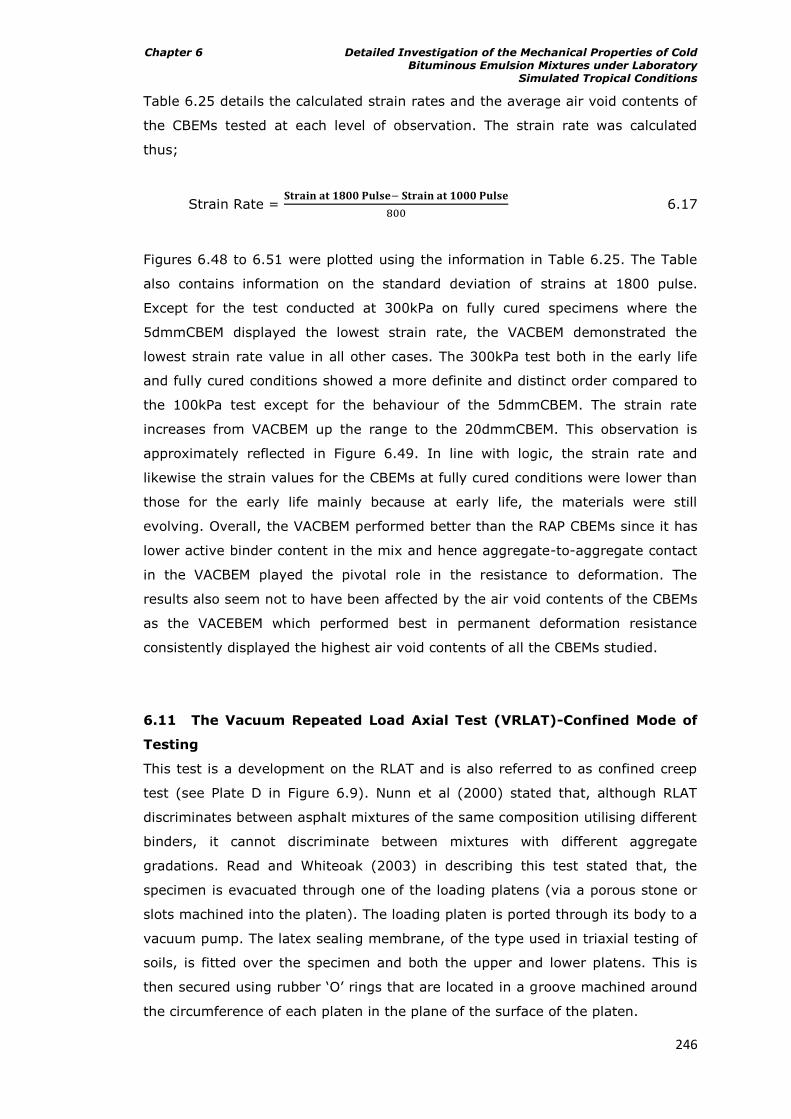
Chapter 6 Detailed Investigation of the Mechanical Properties of Cold Bituminous Emulsion Mixtures under Laboratory
Simulated Tropical Conditions
246
Table 6.25 details the calculated strain rates and the average air void contents of
the CBEMs tested at each level of observation. The strain rate was calculated
thus;
Strain Rate =
6.17
Figures 6.48 to 6.51 were plotted using the information in Table 6.25. The Table
also contains information on the standard deviation of strains at 1800 pulse.
Except for the test conducted at 300kPa on fully cured specimens where the
5dmmCBEM displayed the lowest strain rate, the VACBEM demonstrated the
lowest strain rate value in all other cases. The 300kPa test both in the early life
and fully cured conditions showed a more definite and distinct order compared to
the 100kPa test except for the behaviour of the 5dmmCBEM. The strain rate
increases from VACBEM up the range to the 20dmmCBEM. This observation is
approximately reflected in Figure 6.49. In line with logic, the strain rate and
likewise the strain values for the CBEMs at fully cured conditions were lower than
those for the early life mainly because at early life, the materials were still
evolving. Overall, the VACBEM performed better than the RAP CBEMs since it has
lower active binder content in the mix and hence aggregate-to-aggregate contact
in the VACBEM played the pivotal role in the resistance to deformation. The
results also seem not to have been affected by the air void contents of the CBEMs
as the VACEBEM which performed best in permanent deformation resistance
consistently displayed the highest air void contents of all the CBEMs studied.
6.11 The Vacuum Repeated Load Axial Test (VRLAT)-Confined Mode of
Testing
This test is a development on the RLAT and is also referred to as confined creep
test (see Plate D in Figure 6.9). Nunn et al (2000) stated that, although RLAT
discriminates between asphalt mixtures of the same composition utilising different
binders, it cannot discriminate between mixtures with different aggregate
gradations. Read and Whiteoak (2003) in describing this test stated that, the
specimen is evacuated through one of the loading platens (via a porous stone or
slots machined into the platen). The loading platen is ported through its body to a
vacuum pump. The latex sealing membrane, of the type used in triaxial testing of
soils, is fitted over the specimen and both the upper and lower platens. This is
then secured using rubber „O‟ rings that are located in a groove machined around
the circumference of each platen in the plane of the surface of the platen.
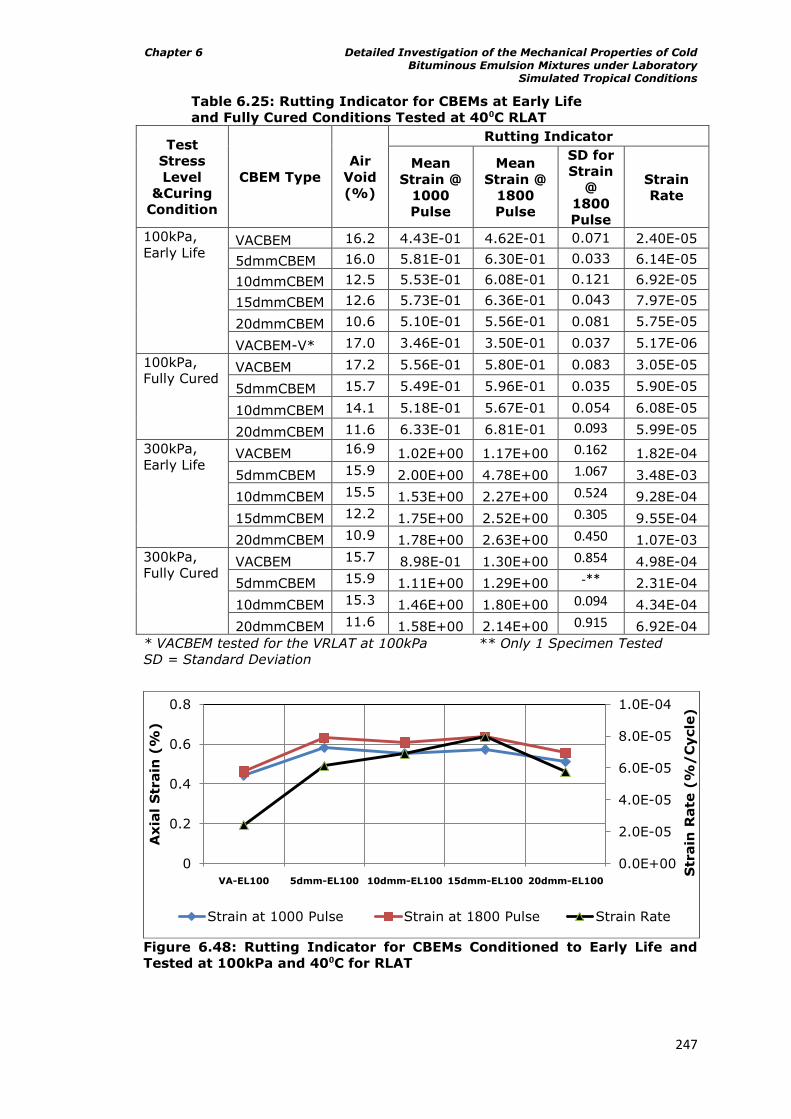
Chapter 6 Detailed Investigation of the Mechanical Properties of Cold Bituminous Emulsion Mixtures under Laboratory
Simulated Tropical Conditions
247
Table 6.25: Rutting Indicator for CBEMs at Early Life
and Fully Cured Conditions Tested at 40⁰C RLAT
Test
Stress
Level
&Curing
Condition
CBEM Type
Air
Void
(%)
Rutting Indicator
Mean
Strain @
1000
Pulse
Mean
Strain @
1800
Pulse
SD for
Strain
@
1800
Pulse
Strain
Rate
100kPa,
Early Life VACBEM 16.2 4.43E-01 4.62E-01 0.071 2.40E-05
5dmmCBEM 16.0 5.81E-01 6.30E-01 0.033 6.14E-05
10dmmCBEM 12.5 5.53E-01 6.08E-01 0.121 6.92E-05
15dmmCBEM 12.6 5.73E-01 6.36E-01 0.043 7.97E-05
20dmmCBEM 10.6 5.10E-01 5.56E-01 0.081 5.75E-05
VACBEM-V* 17.0 3.46E-01 3.50E-01 0.037 5.17E-06
100kPa,
Fully Cured VACBEM 17.2 5.56E-01 5.80E-01 0.083 3.05E-05
5dmmCBEM 15.7 5.49E-01 5.96E-01 0.035 5.90E-05
10dmmCBEM 14.1 5.18E-01 5.67E-01 0.054 6.08E-05
20dmmCBEM 11.6 6.33E-01 6.81E-01 0.093 5.99E-05
300kPa,
Early Life VACBEM 16.9 1.02E+00 1.17E+00 0.162 1.82E-04
5dmmCBEM 15.9 2.00E+00 4.78E+00 1.067 3.48E-03
10dmmCBEM 15.5 1.53E+00 2.27E+00 0.524 9.28E-04
15dmmCBEM 12.2 1.75E+00 2.52E+00 0.305 9.55E-04
20dmmCBEM 10.9 1.78E+00 2.63E+00 0.450 1.07E-03
300kPa,
Fully Cured VACBEM 15.7 8.98E-01 1.30E+00 0.854 4.98E-04
5dmmCBEM 15.9 1.11E+00 1.29E+00 -** 2.31E-04
10dmmCBEM 15.3 1.46E+00 1.80E+00 0.094 4.34E-04
20dmmCBEM 11.6 1.58E+00 2.14E+00 0.915 6.92E-04
* VACBEM tested for the VRLAT at 100kPa ** Only 1 Specimen Tested
SD = Standard Deviation
Figure 6.48: Rutting Indicator for CBEMs Conditioned to Early Life and
Tested at 100kPa and 40⁰C for RLAT
0.0E+00
2.0E-05
4.0E-05
6.0E-05
8.0E-05
1.0E-04
0
0.2
0.4
0.6
0.8
VA-EL100 5dmm-EL100 10dmm-EL100 15dmm-EL100 20dmm-EL100
Str
ain
Rate
(%
/C
ycle
)
Axia
l S
train
(%
)
Strain at 1000 Pulse Strain at 1800 Pulse Strain Rate
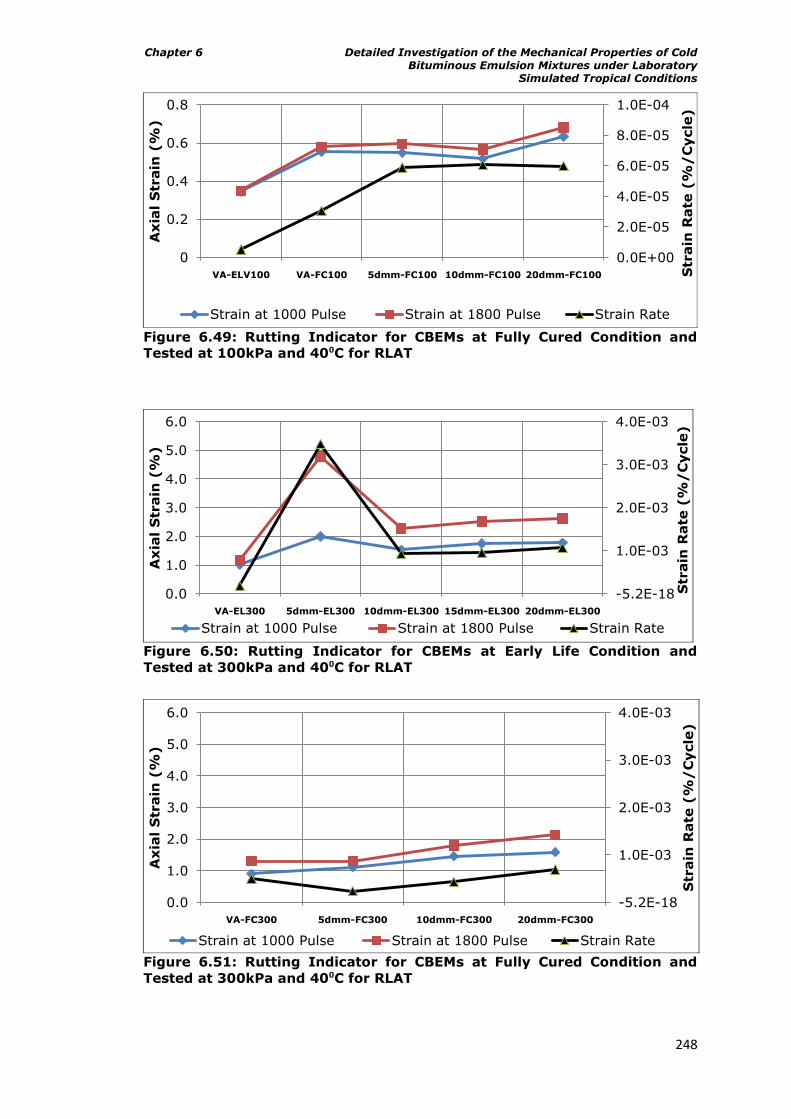
Chapter 6 Detailed Investigation of the Mechanical Properties of Cold Bituminous Emulsion Mixtures under Laboratory
Simulated Tropical Conditions
248
Figure 6.49: Rutting Indicator for CBEMs at Fully Cured Condition and
Tested at 100kPa and 40⁰C for RLAT
Figure 6.50: Rutting Indicator for CBEMs at Early Life Condition and
Tested at 300kPa and 40⁰C for RLAT
Figure 6.51: Rutting Indicator for CBEMs at Fully Cured Condition and
Tested at 300kPa and 40⁰C for RLAT
0.0E+00
2.0E-05
4.0E-05
6.0E-05
8.0E-05
1.0E-04
0
0.2
0.4
0.6
0.8
VA-ELV100 VA-FC100 5dmm-FC100 10dmm-FC100 20dmm-FC100 Str
ain
Rate
(%
/C
ycle
)
Axia
l S
train
(%
)
Strain at 1000 Pulse Strain at 1800 Pulse Strain Rate
-5.2E-18
1.0E-03
2.0E-03
3.0E-03
4.0E-03
0.0
1.0
2.0
3.0
4.0
5.0
6.0
VA-EL300 5dmm-EL300 10dmm-EL300 15dmm-EL300 20dmm-EL300
Str
ain
Rate
(%
/C
ycle
)
Axia
l S
train
(%
)
Strain at 1000 Pulse Strain at 1800 Pulse Strain Rate
-5.2E-18
1.0E-03
2.0E-03
3.0E-03
4.0E-03
0.0
1.0
2.0
3.0
4.0
5.0
6.0
VA-FC300 5dmm-FC300 10dmm-FC300 20dmm-FC300
Str
ain
Rate
(%
/C
ycle
)
Axia
l S
train
(%
)
Strain at 1000 Pulse Strain at 1800 Pulse Strain Rate
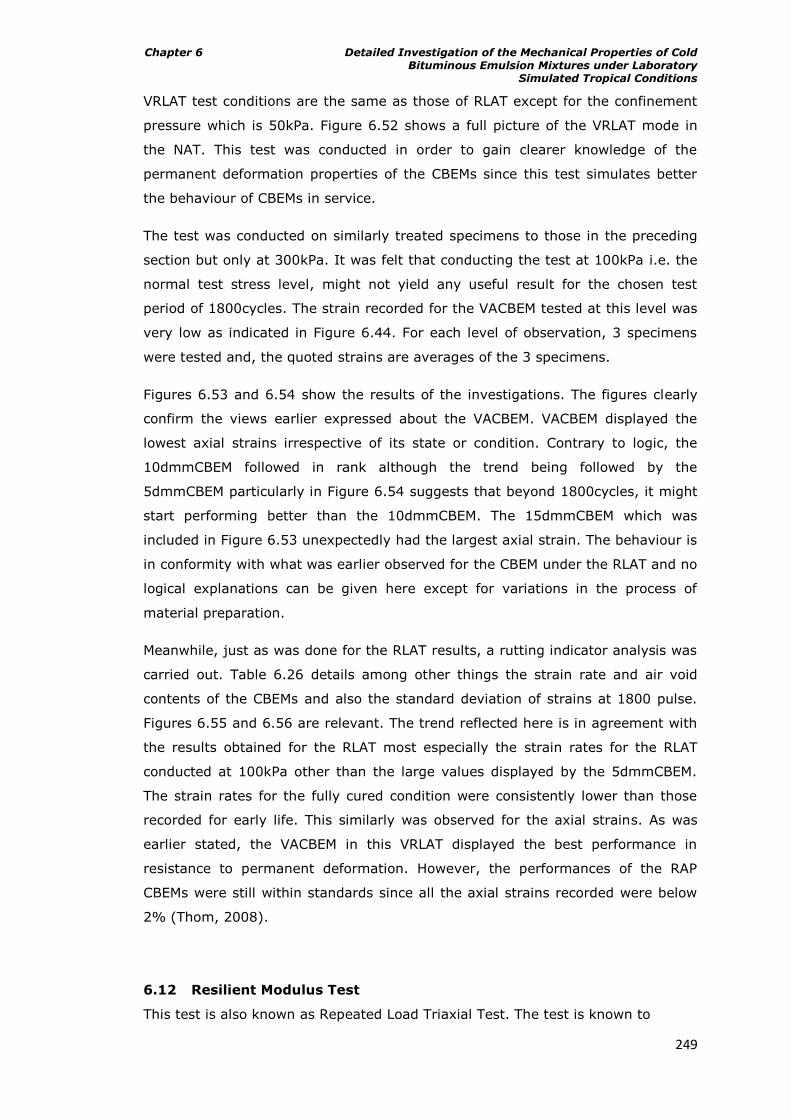
Chapter 6 Detailed Investigation of the Mechanical Properties of Cold Bituminous Emulsion Mixtures under Laboratory
Simulated Tropical Conditions
249
VRLAT test conditions are the same as those of RLAT except for the confinement
pressure which is 50kPa. Figure 6.52 shows a full picture of the VRLAT mode in
the NAT. This test was conducted in order to gain clearer knowledge of the
permanent deformation properties of the CBEMs since this test simulates better
the behaviour of CBEMs in service.
The test was conducted on similarly treated specimens to those in the preceding
section but only at 300kPa. It was felt that conducting the test at 100kPa i.e. the
normal test stress level, might not yield any useful result for the chosen test
period of 1800cycles. The strain recorded for the VACBEM tested at this level was
very low as indicated in Figure 6.44. For each level of observation, 3 specimens
were tested and, the quoted strains are averages of the 3 specimens.
Figures 6.53 and 6.54 show the results of the investigations. The figures clearly
confirm the views earlier expressed about the VACBEM. VACBEM displayed the
lowest axial strains irrespective of its state or condition. Contrary to logic, the
10dmmCBEM followed in rank although the trend being followed by the
5dmmCBEM particularly in Figure 6.54 suggests that beyond 1800cycles, it might
start performing better than the 10dmmCBEM. The 15dmmCBEM which was
included in Figure 6.53 unexpectedly had the largest axial strain. The behaviour is
in conformity with what was earlier observed for the CBEM under the RLAT and no
logical explanations can be given here except for variations in the process of
material preparation.
Meanwhile, just as was done for the RLAT results, a rutting indicator analysis was
carried out. Table 6.26 details among other things the strain rate and air void
contents of the CBEMs and also the standard deviation of strains at 1800 pulse.
Figures 6.55 and 6.56 are relevant. The trend reflected here is in agreement with
the results obtained for the RLAT most especially the strain rates for the RLAT
conducted at 100kPa other than the large values displayed by the 5dmmCBEM.
The strain rates for the fully cured condition were consistently lower than those
recorded for early life. This similarly was observed for the axial strains. As was
earlier stated, the VACBEM in this VRLAT displayed the best performance in
resistance to permanent deformation. However, the performances of the RAP
CBEMs were still within standards since all the axial strains recorded were below
2% (Thom, 2008).
6.12 Resilient Modulus Test
This test is also known as Repeated Load Triaxial Test. The test is known to
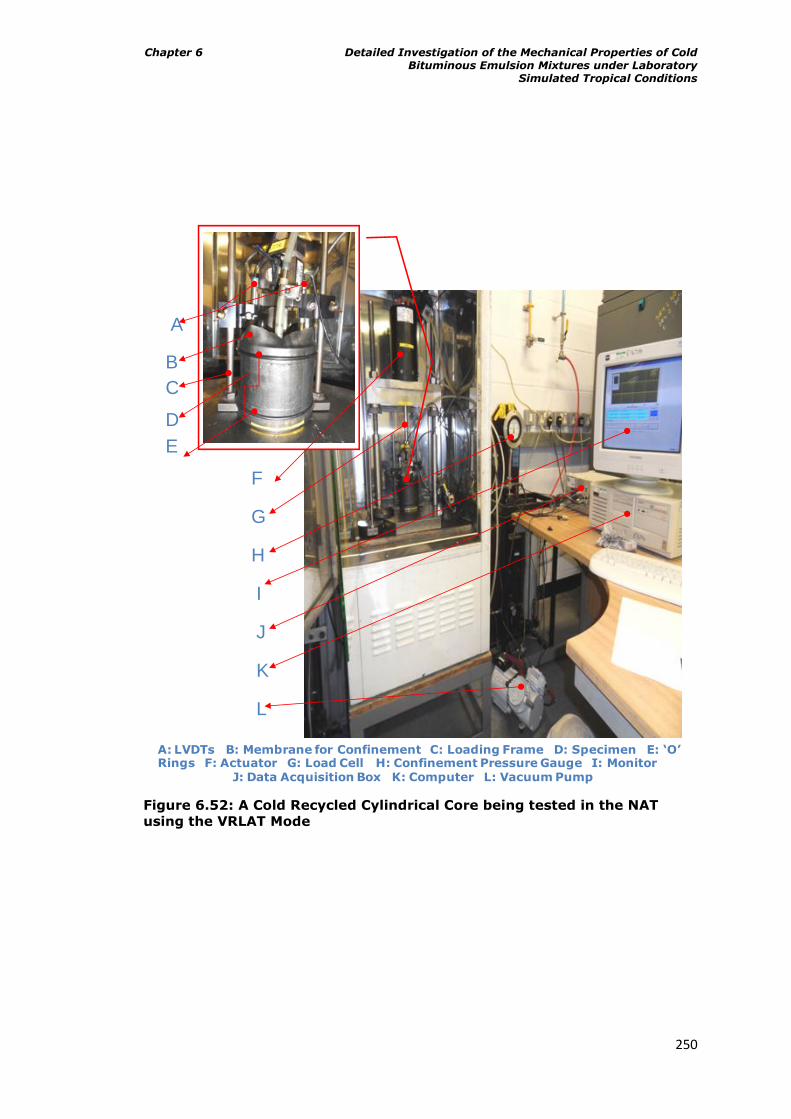
Chapter 6 Detailed Investigation of the Mechanical Properties of Cold Bituminous Emulsion Mixtures under Laboratory
Simulated Tropical Conditions
250
A: LVDTs B: Membrane for Confinement C: Loading Frame D: Specimen E: ‘O’ Rings F: Actuator G: Load Cell H: Confinement Pressure Gauge I: Monitor
J: Data Acquisition Box K: Computer L: Vacuum Pump
G
A
B
C
D
E
F
I
H
K
J
L
Figure 6.52: A Cold Recycled Cylindrical Core being tested in the NAT
using the VRLAT Mode
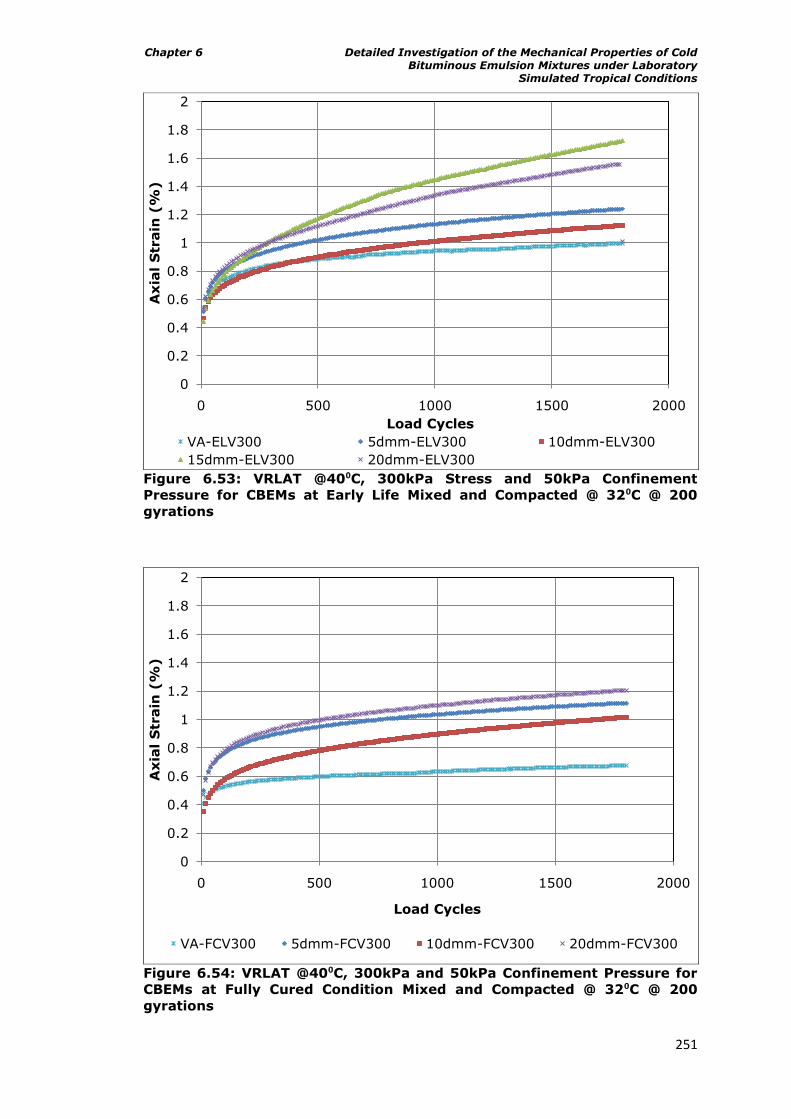
Chapter 6 Detailed Investigation of the Mechanical Properties of Cold Bituminous Emulsion Mixtures under Laboratory
Simulated Tropical Conditions
251
Figure 6.53: VRLAT @40⁰C, 300kPa Stress and 50kPa Confinement
Pressure for CBEMs at Early Life Mixed and Compacted @ 32⁰C @ 200
gyrations
Figure 6.54: VRLAT @40⁰C, 300kPa and 50kPa Confinement Pressure for
CBEMs at Fully Cured Condition Mixed and Compacted @ 32⁰C @ 200
gyrations
0
0.2
0.4
0.6
0.8
1
1.2
1.4
1.6
1.8
2
0 500 1000 1500 2000
Axia
l S
train
(%
)
Load Cycles
VA-ELV300 5dmm-ELV300 10dmm-ELV300
15dmm-ELV300 20dmm-ELV300
0
0.2
0.4
0.6
0.8
1
1.2
1.4
1.6
1.8
2
0 500 1000 1500 2000
Axia
l S
train
(%
)
Load Cycles
VA-FCV300 5dmm-FCV300 10dmm-FCV300 20dmm-FCV300
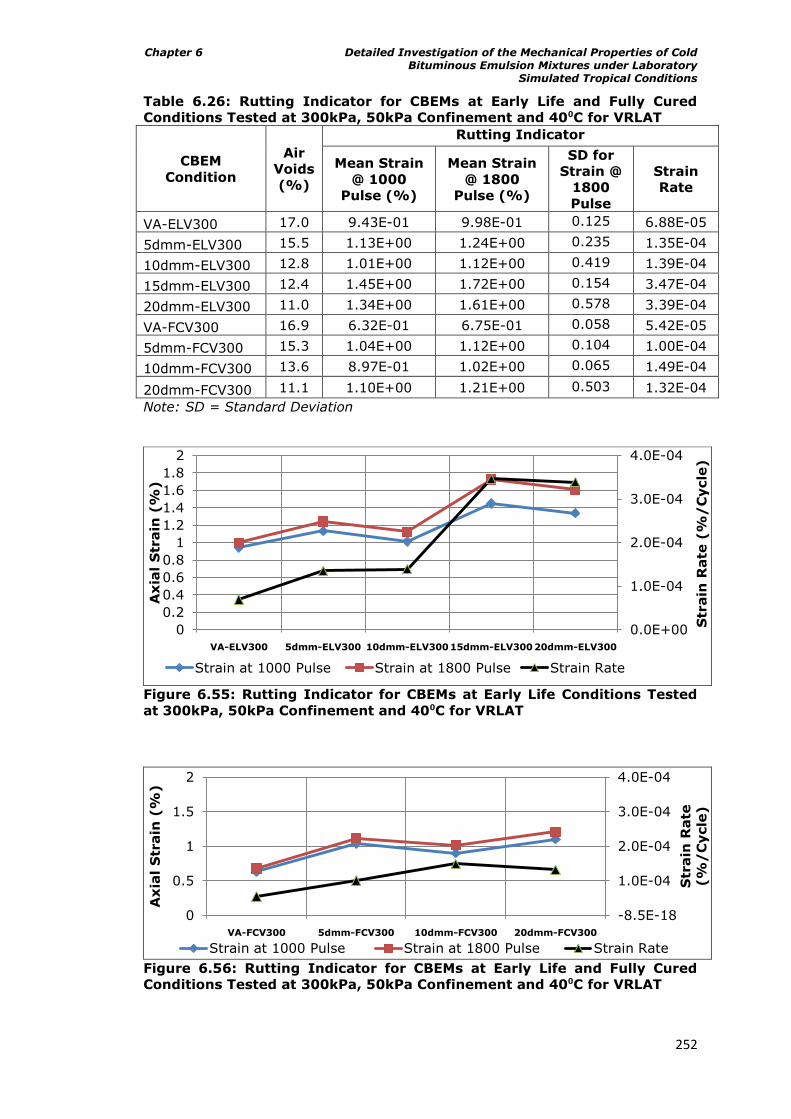
Chapter 6 Detailed Investigation of the Mechanical Properties of Cold Bituminous Emulsion Mixtures under Laboratory
Simulated Tropical Conditions
252
Table 6.26: Rutting Indicator for CBEMs at Early Life and Fully Cured
Conditions Tested at 300kPa, 50kPa Confinement and 40⁰C for VRLAT
CBEM
Condition
Air
Voids
(%)
Rutting Indicator
Mean Strain
@ 1000
Pulse (%)
Mean Strain
@ 1800
Pulse (%)
SD for
Strain @
1800
Pulse
Strain
Rate
VA-ELV300 17.0 9.43E-01 9.98E-01 0.125 6.88E-05
5dmm-ELV300 15.5 1.13E+00 1.24E+00 0.235 1.35E-04
10dmm-ELV300 12.8 1.01E+00 1.12E+00 0.419 1.39E-04
15dmm-ELV300 12.4 1.45E+00 1.72E+00 0.154 3.47E-04
20dmm-ELV300 11.0 1.34E+00 1.61E+00 0.578 3.39E-04
VA-FCV300 16.9 6.32E-01 6.75E-01 0.058 5.42E-05
5dmm-FCV300 15.3 1.04E+00 1.12E+00 0.104 1.00E-04
10dmm-FCV300 13.6 8.97E-01 1.02E+00 0.065 1.49E-04
20dmm-FCV300 11.1 1.10E+00 1.21E+00 0.503 1.32E-04
Note: SD = Standard Deviation
Figure 6.55: Rutting Indicator for CBEMs at Early Life Conditions Tested
at 300kPa, 50kPa Confinement and 40⁰C for VRLAT
Figure 6.56: Rutting Indicator for CBEMs at Early Life and Fully Cured
Conditions Tested at 300kPa, 50kPa Confinement and 40⁰C for VRLAT
0.0E+00
1.0E-04
2.0E-04
3.0E-04
4.0E-04
0
0.2
0.4
0.6
0.8
1
1.2
1.4
1.6
1.8
2
VA-ELV300 5dmm-ELV300 10dmm-ELV30015dmm-ELV300 20dmm-ELV300
Str
ain
Rate
(%
/C
ycle
)
Axia
l S
train
(%
)
Strain at 1000 Pulse Strain at 1800 Pulse Strain Rate
-8.5E-18
1.0E-04
2.0E-04
3.0E-04
4.0E-04
0
0.5
1
1.5
2
VA-FCV300 5dmm-FCV300 10dmm-FCV300 20dmm-FCV300
Str
ain
Rate
(%
/C
ycle
)
Axia
l S
train
(%
)
Strain at 1000 Pulse Strain at 1800 Pulse Strain Rate
Chapter 6 Detailed Investigation of the Mechanical Properties of Cold Bituminous Emulsion Mixtures under Laboratory
Simulated Tropical Conditions
253
simulate vehicle loading in a road pavement. Also, specimens assume a much
more realistic stress state compared to unconfined tests.
The concept of resilient modulus (MR) was initially introduced by Seed et al (1962)
for characterizing the elastic modulus response of subgrade soils in flexible
pavements. Due to its reliability in both measurement and application, resilient
modulus response of unbound granular materials was used in the American
Association of State Highway and Transportation Official (AASHTO) design guide
for pavement structures (AASHTO, 1986). For this reason and many others, Read
and Whiteoak (2003) stated that the test is extensively used in research to study
permanent deformation as well as the elastic properties of asphalt. Just like the
VRLAT, it has the advantage that both vertical and horizontal stresses can be
applied at the levels predicted in the pavement. However, Anochie-Boateng et al
(2009) in a recent review carried out to evaluate test methods for estimating
resilient modulus, observed that during the past decades, research groups and
agencies in the different countries have proposed test methods and procedures
for repeated load testing to help in establishing appropriate resilient modulus test
procedures for pavement design. In their review for example, out of the seven
different procedures mentioned, three were from South Africa alone. Also the
trend in testing for resilient modulus in the industry has since been extended to
fully bound and intermediate mixtures.
It implies thus that presently there is no universally accepted procedure for
conducting the test. Anochie-Boateng et al (2009) opined that there is a need for
improved or new procedures to better estimate resilient properties of pavement
materials. Among other things, they suggested the use of simple but correct
equipment along with reliable software for successful testing of resilient modulus.
Such would aid the migration of the test from research labs into the industry.
This test, although time consuming compared to the ITSM test was thus
embarked upon as a step towards filling the identified gap above and at the same
time gaining a better understating of the behaviour of the CBEMs studied in this
work. Although this test is also good for characterising the deformation properties
of road pavement materials, the focus here was essentially on the resilient
modulus. Though both vertical and horizontal strains induced by stresses are
normally monitored in such tests, it was only the vertical deformation that was
monitored in this investigation. This was due to limitations of the on-specimen
instrumentation considering the fact that the VRLAT mode that was used in this
investigation uses specimens that are vacuumed by using a latex membrane.
Chapter 6 Detailed Investigation of the Mechanical Properties of Cold Bituminous Emulsion Mixtures under Laboratory
Simulated Tropical Conditions
254
All the specimens used in this work were manufactured in the gyratory compactor
and were tested in a manner representative of both early life and fully cured
conditions using the Nottingham Asphalt Tester (NAT) in the Vacuum Repeated
Load Axial Test (VRLAT) mode. The digitally controlled servo-pneumatic system of
the NAT combined with a newly developed Universal Software allowed for a multi-
stage testing protocol. A haversine wave form with pulse width of 0.124s and rest
period of 1.116s was employed throughout the tests. This was specifically chosen
in order to relate the results to those obtained during the ITSM test. As earlier
mentioned, ITSM test is conducted at a rise time of 124±4ms.
It is worth noting that in order to gain knowledge of the ITSM and resilient
modulus behaviours of the specimens at the same time, the earlier described
sample size of 100±2mm diameter and 50±2 thickness was maintained.
Specimen conditioning involving 1000 cycles of 100kPa loading at a holding load
of 20kPa was adopted having been found suitable after a series of trials. This was
subsequently followed by multi-stage tests of 100 load applications each at the 8
target deviatoric stress levels of 50, 100, 200, 300, 400, 500, 600 and 700kPa. A
constant confining pressure of 50kPa was applied using an external vacuum
pump. This was adopted since there was no significant difference between 50kPa
which was better achieved using the vacuum pump and 80kPa. The tests were
conducted at 20, 30 and 40⁰C.
Meanwhile for each cycle of loading, the Universal Software was pre-programmed
to capture 500 data points for the actuator position (mm), load (kN), LVDTs (2 of)
position, vertical stress (kPa), vertical strain (μstrain), vertical deformation (mm)
and output (V). Although this will obviously give rich information for each test,
the quantity of data involved warranted limiting the data set captured to the last
ten cycles. For each cycle of loading, the corresponding, lowest point ante-peak,
the peak point and the lowest point post peak for the vertical strain were
extracted. The peak load for each cycle was similarly extracted. The resilient
strain (recoverable) is the difference between the peak point and the lowest point
post-peak, while the permanent deformation is the difference between the lowest
point ante-peak and the lowest point post-peak. These values for each cycle as
analysed were averaged and subsequently used for the determination of resilient
modulus.
Figure 6.52 shown in the preceding section details a complete set up for this
resilient modulus test. 3 specimens were tested at each level of observation and
the average of the results was reported. Figure 6.57 details the stress state in
road pavements and the definition of both permanent and resilient deformation.
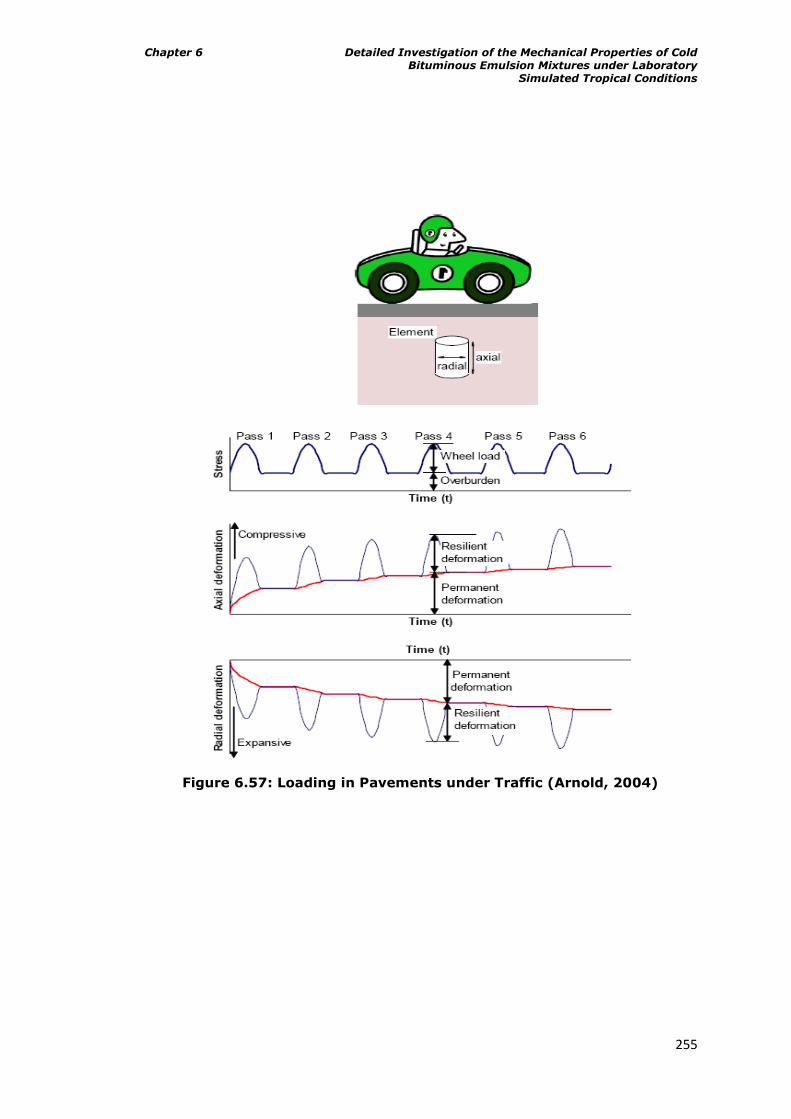
Chapter 6 Detailed Investigation of the Mechanical Properties of Cold Bituminous Emulsion Mixtures under Laboratory
Simulated Tropical Conditions
255
Figure 6.57: Loading in Pavements under Traffic (Arnold, 2004)
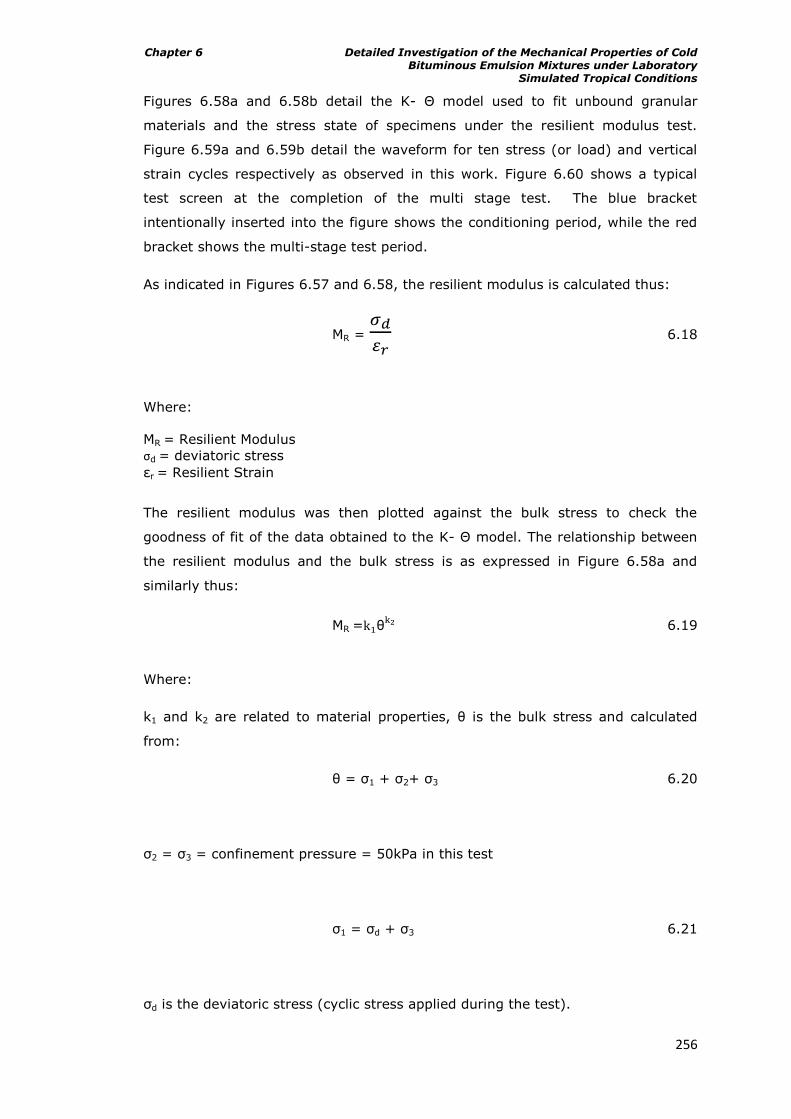
Chapter 6 Detailed Investigation of the Mechanical Properties of Cold Bituminous Emulsion Mixtures under Laboratory
Simulated Tropical Conditions
256
Figures 6.58a and 6.58b detail the K- Θ model used to fit unbound granular
materials and the stress state of specimens under the resilient modulus test.
Figure 6.59a and 6.59b detail the waveform for ten stress (or load) and vertical
strain cycles respectively as observed in this work. Figure 6.60 shows a typical
test screen at the completion of the multi stage test. The blue bracket
intentionally inserted into the figure shows the conditioning period, while the red
bracket shows the multi-stage test period.
As indicated in Figures 6.57 and 6.58, the resilient modulus is calculated thus:
MR =
6.18
Where:
MR = Resilient Modulus
σd = deviatoric stress
r = Resilient Strain
The resilient modulus was then plotted against the bulk stress to check the
goodness of fit of the data obtained to the K- Θ model. The relationship between
the resilient modulus and the bulk stress is as expressed in Figure 6.58a and
similarly thus:
MR = θ 6.19
Where:
k1 and k2 are related to material properties, θ is the bulk stress and calculated
from:
θ = σ1 + σ2+ σ3 6.20
σ2 = σ3 = confinement pressure = 50kPa in this test
σ1 = σd + σ3 6.21
σd is the deviatoric stress (cyclic stress applied during the test).
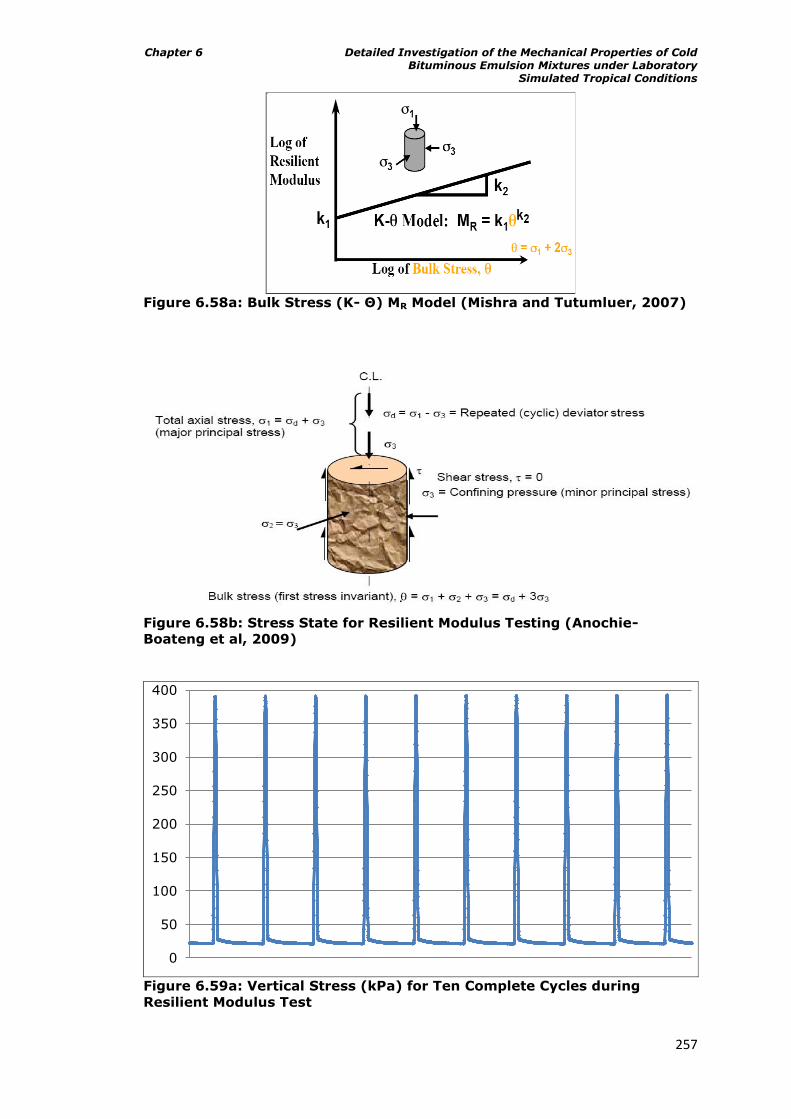
Chapter 6 Detailed Investigation of the Mechanical Properties of Cold Bituminous Emulsion Mixtures under Laboratory
Simulated Tropical Conditions
257
Figure 6.58a: Bulk Stress (K- Θ) MR Model (Mishra and Tutumluer, 2007)
Figure 6.58b: Stress State for Resilient Modulus Testing (Anochie-
Boateng et al, 2009)
Figure 6.59a: Vertical Stress (kPa) for Ten Complete Cycles during
Resilient Modulus Test
0
50
100
150
200
250
300
350
400
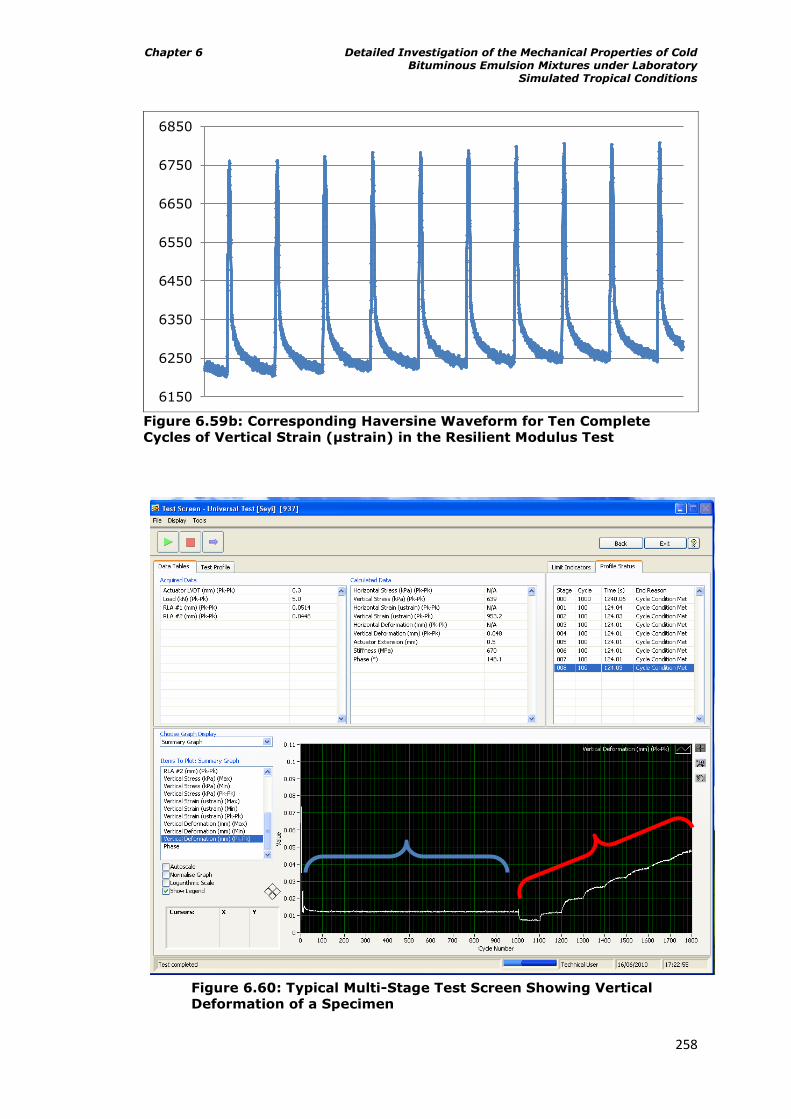
Chapter 6 Detailed Investigation of the Mechanical Properties of Cold Bituminous Emulsion Mixtures under Laboratory
Simulated Tropical Conditions
258
Figure 6.59b: Corresponding Haversine Waveform for Ten Complete
Cycles of Vertical Strain (μstrain) in the Resilient Modulus Test
Figure 6.60: Typical Multi-Stage Test Screen Showing Vertical
Deformation of a Specimen
6150
6250
6350
6450
6550
6650
6750
6850
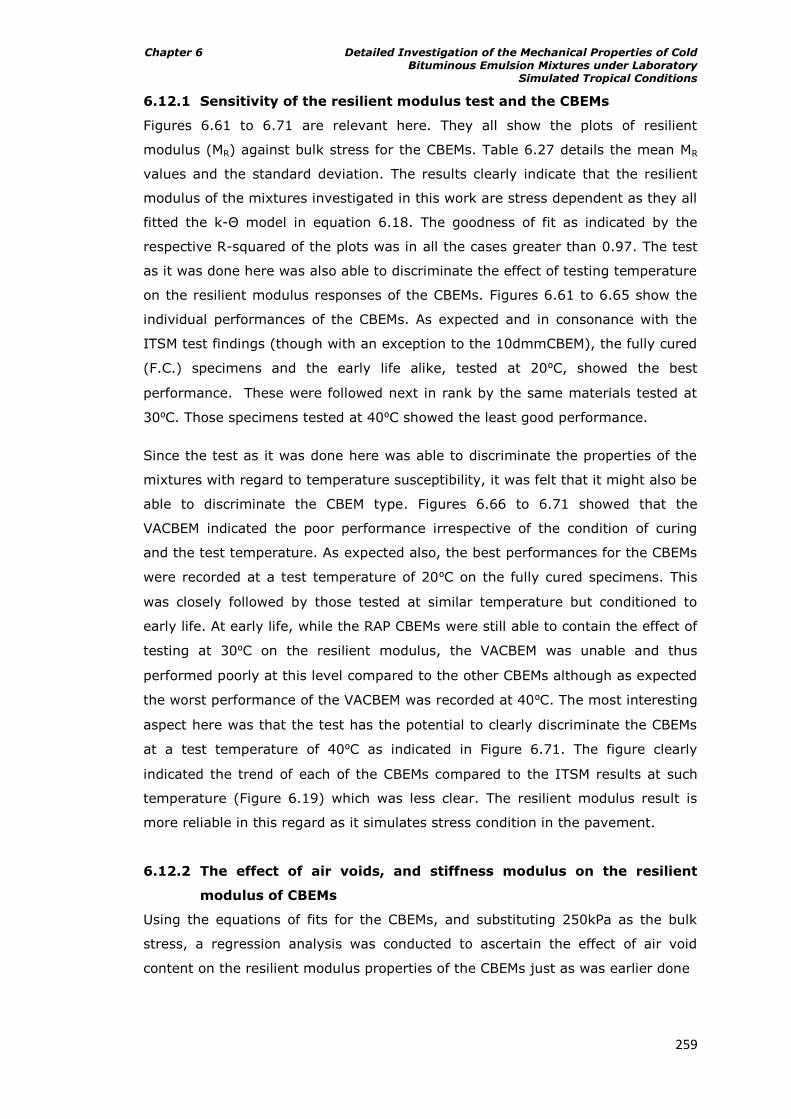
Chapter 6 Detailed Investigation of the Mechanical Properties of Cold Bituminous Emulsion Mixtures under Laboratory
Simulated Tropical Conditions
259
6.12.1 Sensitivity of the resilient modulus test and the CBEMs
Figures 6.61 to 6.71 are relevant here. They all show the plots of resilient
modulus (MR) against bulk stress for the CBEMs. Table 6.27 details the mean MR
values and the standard deviation. The results clearly indicate that the resilient
modulus of the mixtures investigated in this work are stress dependent as they all
fitted the k-Θ model in equation 6.18. The goodness of fit as indicated by the
respective R-squared of the plots was in all the cases greater than 0.97. The test
as it was done here was also able to discriminate the effect of testing temperature
on the resilient modulus responses of the CBEMs. Figures 6.61 to 6.65 show the
individual performances of the CBEMs. As expected and in consonance with the
ITSM test findings (though with an exception to the 10dmmCBEM), the fully cured
(F.C.) specimens and the early life alike, tested at 20⁰C, showed the best
performance. These were followed next in rank by the same materials tested at
30⁰C. Those specimens tested at 40⁰C showed the least good performance.
Since the test as it was done here was able to discriminate the properties of the
mixtures with regard to temperature susceptibility, it was felt that it might also be
able to discriminate the CBEM type. Figures 6.66 to 6.71 showed that the
VACBEM indicated the poor performance irrespective of the condition of curing
and the test temperature. As expected also, the best performances for the CBEMs
were recorded at a test temperature of 20⁰C on the fully cured specimens. This
was closely followed by those tested at similar temperature but conditioned to
early life. At early life, while the RAP CBEMs were still able to contain the effect of
testing at 30⁰C on the resilient modulus, the VACBEM was unable and thus
performed poorly at this level compared to the other CBEMs although as expected
the worst performance of the VACBEM was recorded at 40⁰C. The most interesting
aspect here was that the test has the potential to clearly discriminate the CBEMs
at a test temperature of 40⁰C as indicated in Figure 6.71. The figure clearly
indicated the trend of each of the CBEMs compared to the ITSM results at such
temperature (Figure 6.19) which was less clear. The resilient modulus result is
more reliable in this regard as it simulates stress condition in the pavement.
6.12.2 The effect of air voids, and stiffness modulus on the resilient
modulus of CBEMs
Using the equations of fits for the CBEMs, and substituting 250kPa as the bulk
stress, a regression analysis was conducted to ascertain the effect of air void
content on the resilient modulus properties of the CBEMs just as was earlier done
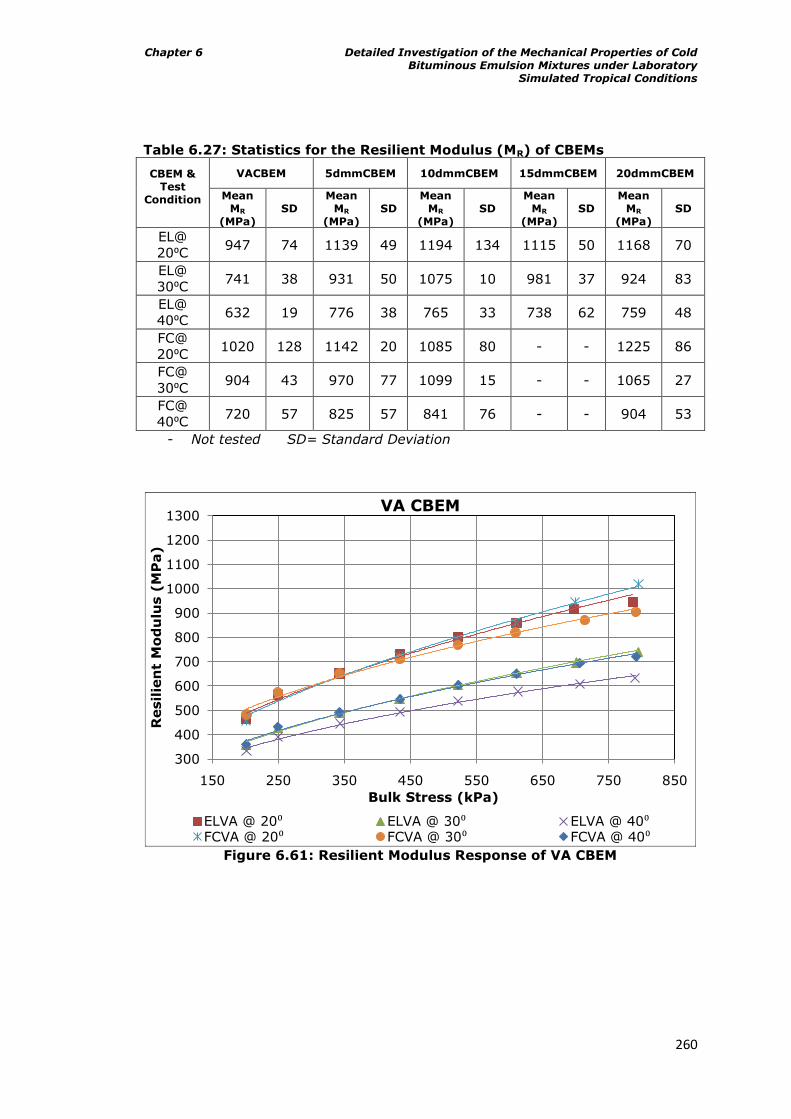
Chapter 6 Detailed Investigation of the Mechanical Properties of Cold Bituminous Emulsion Mixtures under Laboratory
Simulated Tropical Conditions
260
Table 6.27: Statistics for the Resilient Modulus (MR) of CBEMs
CBEM & Test
Condition
VACBEM 5dmmCBEM 10dmmCBEM 15dmmCBEM 20dmmCBEM
Mean MR
(MPa) SD
Mean MR
(MPa) SD
Mean MR
(MPa) SD
Mean MR
(MPa) SD
Mean MR
(MPa) SD
EL@
20⁰C 947 74 1139 49 1194 134 1115 50 1168 70
EL@
30⁰C 741 38 931 50 1075 10 981 37 924 83
EL@
40⁰C 632 19 776 38 765 33 738 62 759 48
FC@
20⁰C 1020 128 1142 20 1085 80 - - 1225 86
FC@
30⁰C 904 43 970 77 1099 15 - - 1065 27
FC@
40⁰C 720 57 825 57 841 76 - - 904 53
- Not tested SD= Standard Deviation
Figure 6.61: Resilient Modulus Response of VA CBEM
300
400
500
600
700
800
900
1000
1100
1200
1300
150 250 350 450 550 650 750 850
Resilie
nt
Mo
du
lus (
MP
a)
Bulk Stress (kPa)
VA CBEM
ELVA @ 20⁰ ELVA @ 30⁰ ELVA @ 40⁰FCVA @ 20⁰ FCVA @ 30⁰ FCVA @ 40⁰
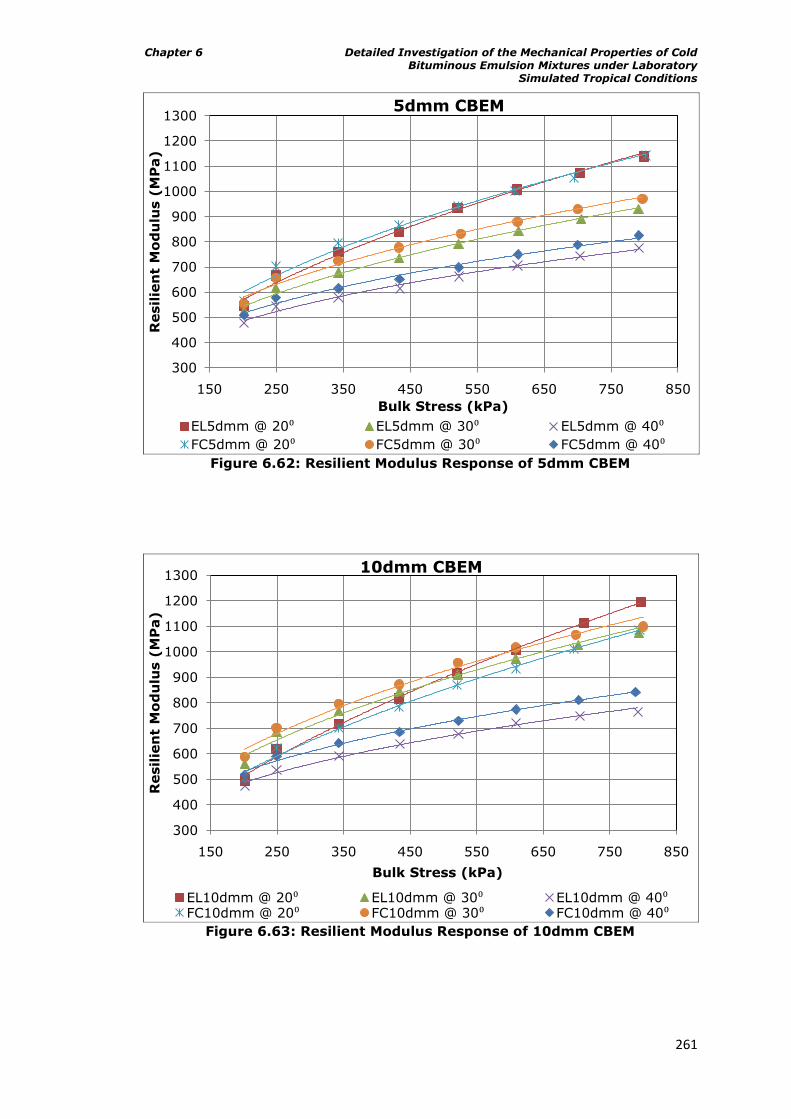
Chapter 6 Detailed Investigation of the Mechanical Properties of Cold Bituminous Emulsion Mixtures under Laboratory
Simulated Tropical Conditions
261
Figure 6.62: Resilient Modulus Response of 5dmm CBEM
Figure 6.63: Resilient Modulus Response of 10dmm CBEM
300
400
500
600
700
800
900
1000
1100
1200
1300
150 250 350 450 550 650 750 850
Resilie
nt
Mo
du
lus (
MP
a)
Bulk Stress (kPa)
5dmm CBEM
EL5dmm @ 20⁰ EL5dmm @ 30⁰ EL5dmm @ 40⁰
FC5dmm @ 20⁰ FC5dmm @ 30⁰ FC5dmm @ 40⁰
300
400
500
600
700
800
900
1000
1100
1200
1300
150 250 350 450 550 650 750 850
Resilie
nt
Mo
du
lus (
MP
a)
Bulk Stress (kPa)
10dmm CBEM
EL10dmm @ 20⁰ EL10dmm @ 30⁰ EL10dmm @ 40⁰FC10dmm @ 20⁰ FC10dmm @ 30⁰ FC10dmm @ 40⁰
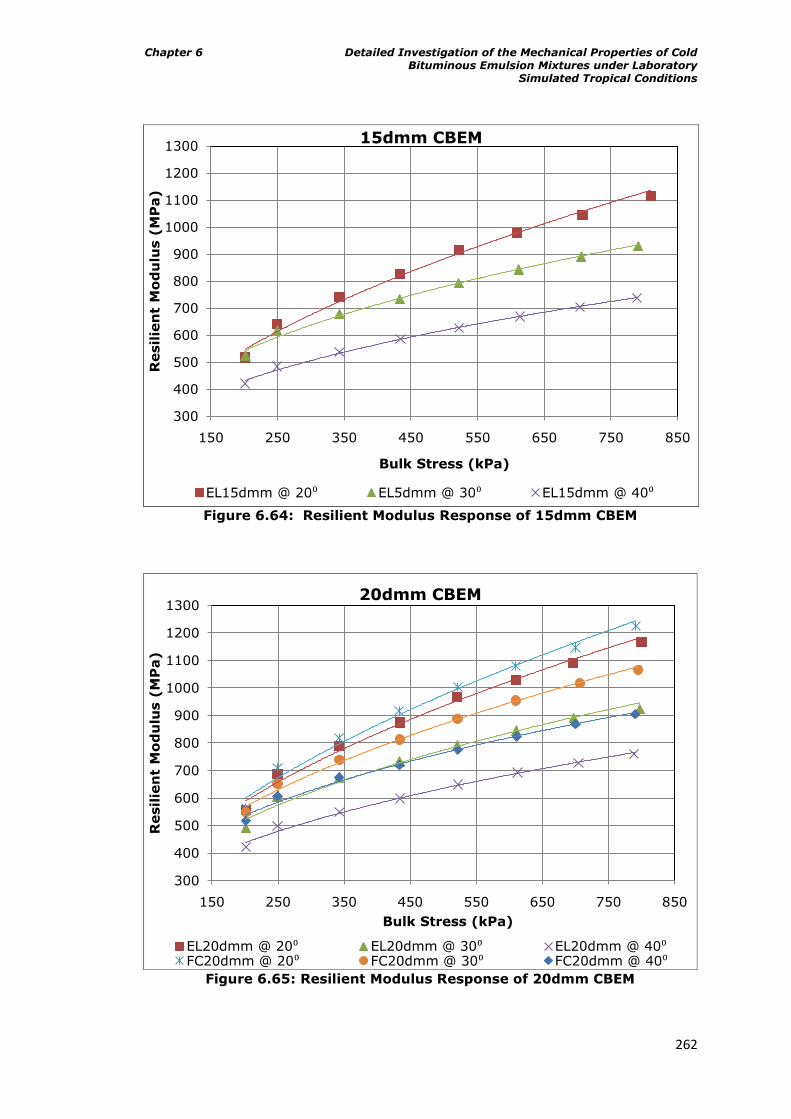
Chapter 6 Detailed Investigation of the Mechanical Properties of Cold Bituminous Emulsion Mixtures under Laboratory
Simulated Tropical Conditions
262
Figure 6.64: Resilient Modulus Response of 15dmm CBEM
Figure 6.65: Resilient Modulus Response of 20dmm CBEM
300
400
500
600
700
800
900
1000
1100
1200
1300
150 250 350 450 550 650 750 850
Resilie
nt
Mo
du
lus (
MP
a)
Bulk Stress (kPa)
15dmm CBEM
EL15dmm @ 20⁰ EL5dmm @ 30⁰ EL15dmm @ 40⁰
300
400
500
600
700
800
900
1000
1100
1200
1300
150 250 350 450 550 650 750 850
Resilie
nt
Mo
du
lus (
MP
a)
Bulk Stress (kPa)
20dmm CBEM
EL20dmm @ 20⁰ EL20dmm @ 30⁰ EL20dmm @ 40⁰FC20dmm @ 20⁰ FC20dmm @ 30⁰ FC20dmm @ 40⁰
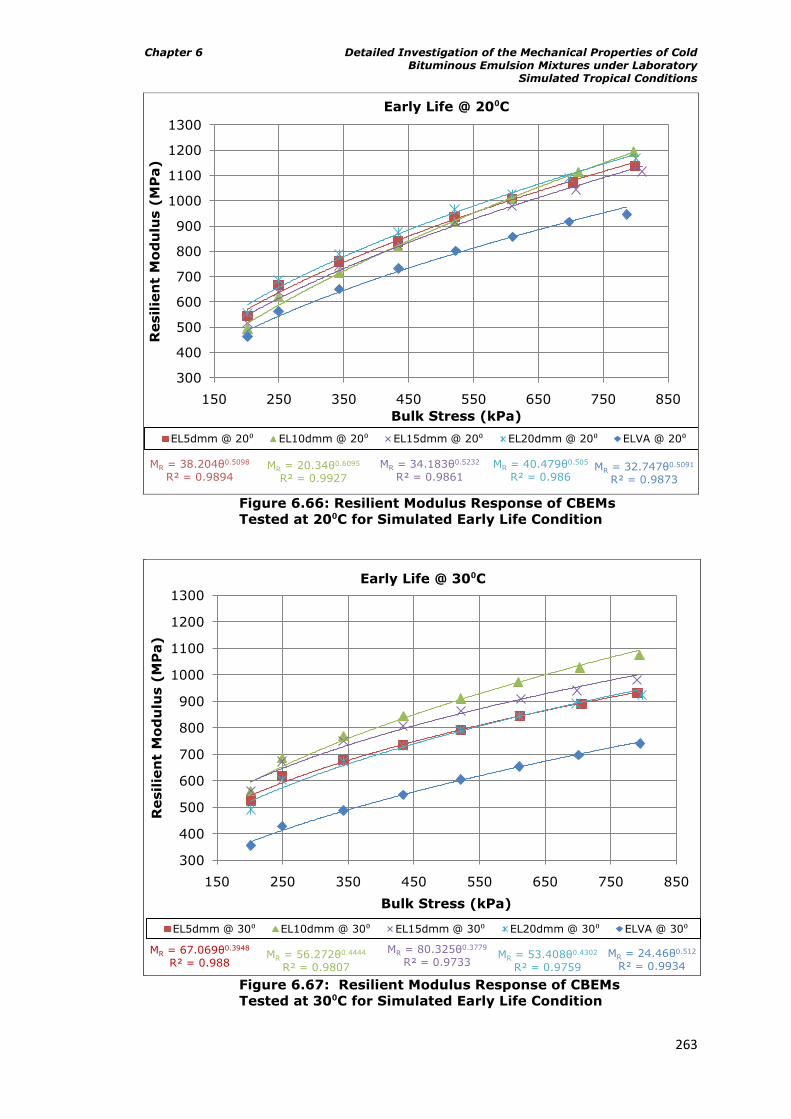
Chapter 6 Detailed Investigation of the Mechanical Properties of Cold Bituminous Emulsion Mixtures under Laboratory
Simulated Tropical Conditions
263
Figure 6.66: Resilient Modulus Response of CBEMs
Tested at 20⁰C for Simulated Early Life Condition
Figure 6.67: Resilient Modulus Response of CBEMs
Tested at 30⁰C for Simulated Early Life Condition
MR = 38.204θ0.5098
R² = 0.9894MR = 20.34θ0.6095
R² = 0.9927
MR = 34.183θ0.5232
R² = 0.9861MR = 40.479θ0.505
R² = 0.986MR = 32.747θ0.5091
R² = 0.9873
300
400
500
600
700
800
900
1000
1100
1200
1300
150 250 350 450 550 650 750 850
Resilie
nt
Mo
du
lus (
MP
a)
Bulk Stress (kPa)
Early Life @ 20⁰C
EL5dmm @ 20⁰ EL10dmm @ 20⁰ EL15dmm @ 20⁰ EL20dmm @ 20⁰ ELVA @ 20⁰
MR = 67.069θ0.3948
R² = 0.988MR = 56.272θ0.4444
R² = 0.9807
MR = 80.325θ0.3779
R² = 0.9733MR = 53.408θ0.4302
R² = 0.9759
MR = 24.46θ0.512
R² = 0.9934
300
400
500
600
700
800
900
1000
1100
1200
1300
150 250 350 450 550 650 750 850
Resilie
nt
Mo
du
lus (
MP
a)
Bulk Stress (kPa)
Early Life @ 30⁰C
EL5dmm @ 30⁰ EL10dmm @ 30⁰ EL15dmm @ 30⁰ EL20dmm @ 30⁰ ELVA @ 30⁰
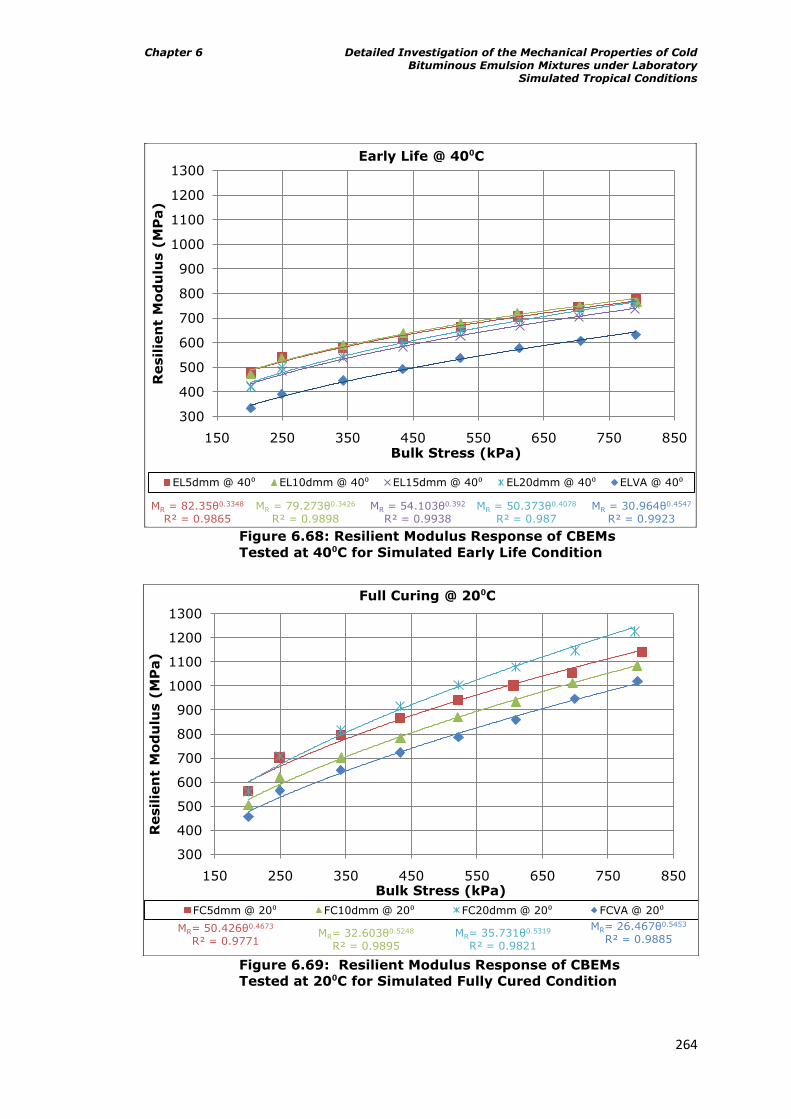
Chapter 6 Detailed Investigation of the Mechanical Properties of Cold Bituminous Emulsion Mixtures under Laboratory
Simulated Tropical Conditions
264
Figure 6.68: Resilient Modulus Response of CBEMs
Tested at 40⁰C for Simulated Early Life Condition
Figure 6.69: Resilient Modulus Response of CBEMs
Tested at 20⁰C for Simulated Fully Cured Condition
MR = 82.35θ0.3348
R² = 0.9865MR = 79.273θ0.3426
R² = 0.9898MR = 54.103θ0.392
R² = 0.9938MR = 50.373θ0.4078
R² = 0.987MR = 30.964θ0.4547
R² = 0.9923
300
400
500
600
700
800
900
1000
1100
1200
1300
150 250 350 450 550 650 750 850
Resilie
nt
Mo
du
lus (
MP
a)
Bulk Stress (kPa)
Early Life @ 40⁰C
EL5dmm @ 40⁰ EL10dmm @ 40⁰ EL15dmm @ 40⁰ EL20dmm @ 40⁰ ELVA @ 40⁰
MR= 50.426θ0.4673
R² = 0.9771MR= 32.603θ0.5248
R² = 0.9895
MR= 35.731θ0.5319
R² = 0.9821
MR= 26.467θ0.5453
R² = 0.9885
300
400
500
600
700
800
900
1000
1100
1200
1300
150 250 350 450 550 650 750 850
Resilie
nt
Mo
du
lus (
MP
a)
Bulk Stress (kPa)
Full Curing @ 20⁰C
FC5dmm @ 20⁰ FC10dmm @ 20⁰ FC20dmm @ 20⁰ FCVA @ 20⁰
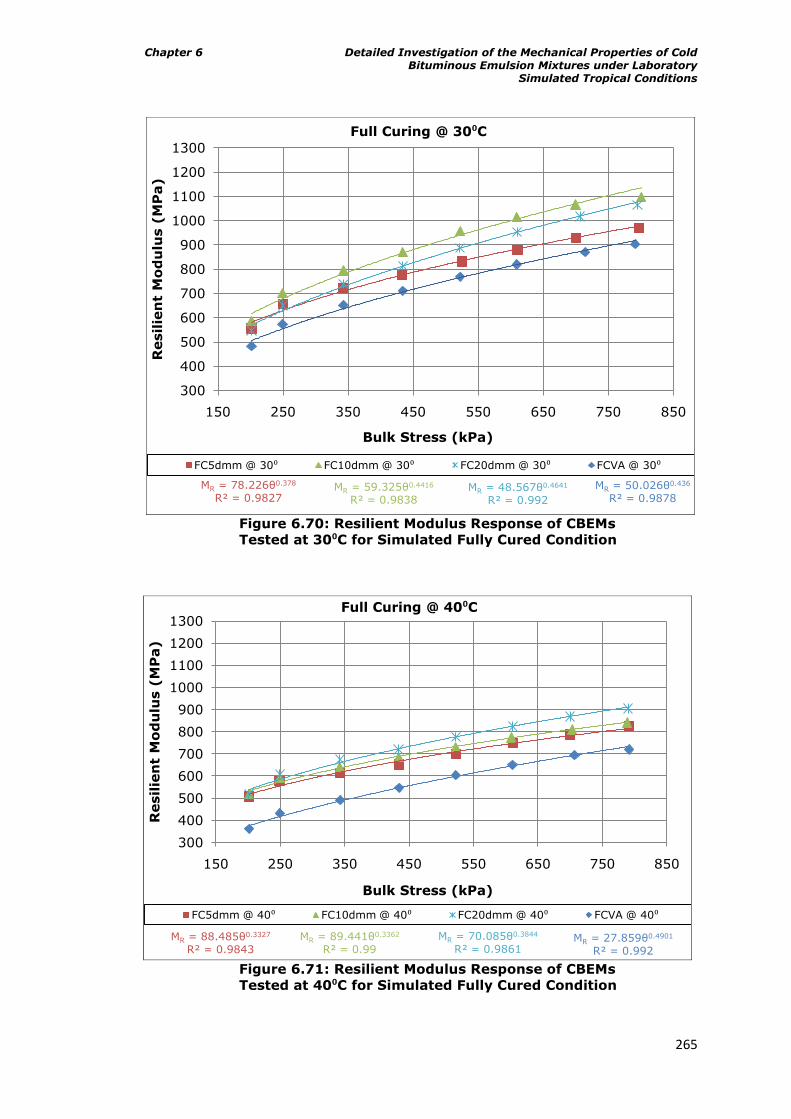
Chapter 6 Detailed Investigation of the Mechanical Properties of Cold Bituminous Emulsion Mixtures under Laboratory
Simulated Tropical Conditions
265
Figure 6.70: Resilient Modulus Response of CBEMs
Tested at 30⁰C for Simulated Fully Cured Condition
Figure 6.71: Resilient Modulus Response of CBEMs
Tested at 40⁰C for Simulated Fully Cured Condition
MR = 78.226θ0.378
R² = 0.9827MR = 59.325θ0.4416
R² = 0.9838MR = 48.567θ0.4641
R² = 0.992
MR = 50.026θ0.436
R² = 0.9878
300
400
500
600
700
800
900
1000
1100
1200
1300
150 250 350 450 550 650 750 850
Resilie
nt
Mo
du
lus (
MP
a)
Bulk Stress (kPa)
Full Curing @ 30⁰C
FC5dmm @ 30⁰ FC10dmm @ 30⁰ FC20dmm @ 30⁰ FCVA @ 30⁰
MR = 88.485θ0.3327
R² = 0.9843
MR = 89.441θ0.3362
R² = 0.99
MR = 70.085θ0.3844
R² = 0.9861MR = 27.859θ0.4901
R² = 0.992
300
400
500
600
700
800
900
1000
1100
1200
1300
150 250 350 450 550 650 750 850
Resilie
nt
Mo
du
lus (
MP
a)
Bulk Stress (kPa)
Full Curing @ 40⁰C
FC5dmm @ 40⁰ FC10dmm @ 40⁰ FC20dmm @ 40⁰ FCVA @ 40⁰
Chapter 6 Detailed Investigation of the Mechanical Properties of Cold Bituminous Emulsion Mixtures under Laboratory
Simulated Tropical Conditions
266
for ITSM.
Table 6.28 details the result of the One-Sample Kolmogorov-Smirnov (Normality)
Test for MR and Corresponding ITSM and Air Voids at Simulated Early Life and
Fully Cured Conditions of the CBEMs. The result indicated normality for all the
cases considered. Table 6.29 details the result of the multiple regression analysis
carried out on the CBEMs. It is worthy of note that in order to have a relatively
robust sample number, all specimens with similar treatments and tested at similar
temperature were regressed together. The VACBEM was treated as the reference
in the regression model while all the other CBEMs in the order, 5dmmCBEM,
10dmmCBEM, 15dmmCBEM (involved in three cases) and 20dmmCBEM were
regarded as first, second, third and fourth independent variables respectively in
the model.
A close inspection of Table 6.29 indicated that for the regression of MR vs. Air
voids, the only significance was recorded for specimens fully cured and tested at
20⁰C. Similarly, for regression of MR vs. ITSM, significance levels were recorded at
fully cured, and tested at both 20⁰C and 40⁰C. The result in Table 6.29 did not
indicate significance for all other cases. However, irrespective of these differences
which are not significant, Figure 6.72 shows the potential losses in resilient
modulus associated with 1% increase in air voids, which is logical. The trend in
Figure 6.72 demonstrates that as the CBEMs cure further, an increase in air void
makes the loss in modulus more significant. For example, in the case of the only
observation in which significance was observed here, with a unit increase in air
void content, a loss of 35MPa in resilient modulus is recorded. This trend was
similarly observed for ITSM vs. air voids in section 6.8.4 (Figures 6.35 and 6.36),
although stronger in the ITSM case than for resilient modulus.
Figure 6.73 did not indicate any trend in particular. However temperature
significantly affects the MR vs. ITSM relationship.
6.13 Summary of Results
This chapter focused on a detailed characterisation of five CBEMs as follows:
1. VACBEM- with 100% virgin binder and aggregates
2. 5dmmCBEM
3. 10dmmCBEM
4. 15dmmCBEM
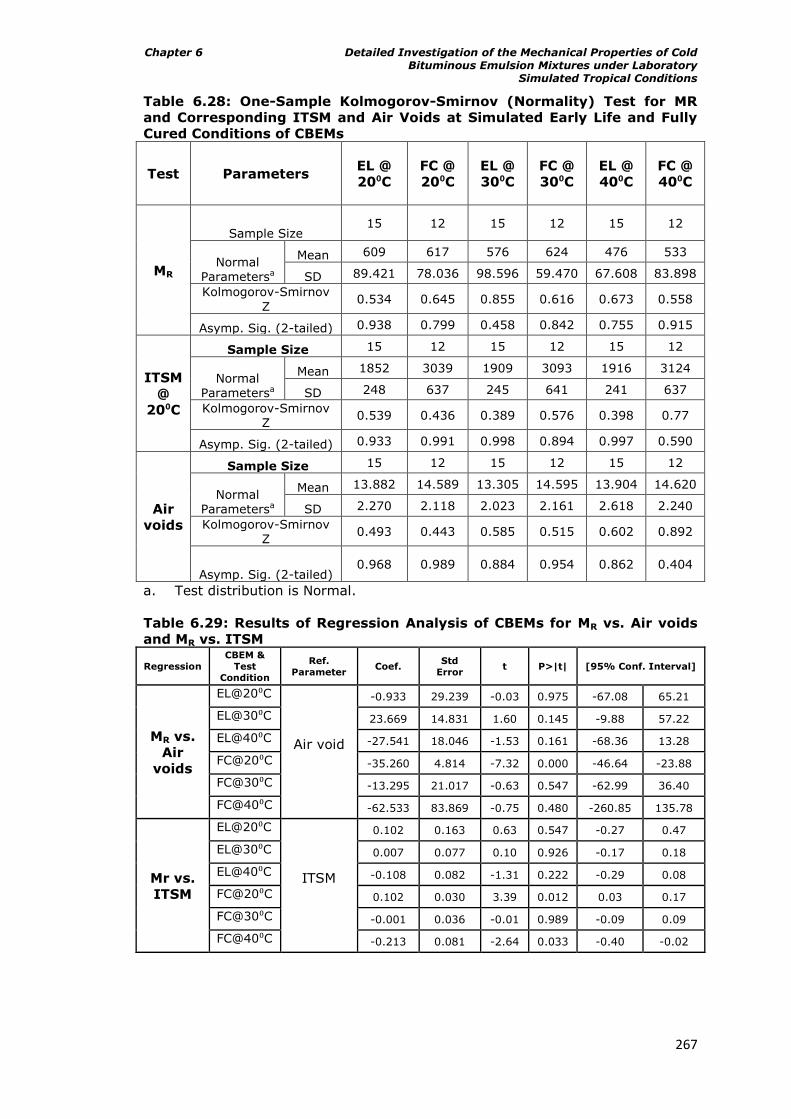
Chapter 6 Detailed Investigation of the Mechanical Properties of Cold Bituminous Emulsion Mixtures under Laboratory
Simulated Tropical Conditions
267
Table 6.28: One-Sample Kolmogorov-Smirnov (Normality) Test for MR
and Corresponding ITSM and Air Voids at Simulated Early Life and Fully
Cured Conditions of CBEMs
Test Parameters EL @
20⁰C
FC @
20⁰C
EL @
30⁰C
FC @
30⁰C
EL @
40⁰C
FC @
40⁰C
MR
Sample Size 15 12 15 12 15 12
Normal Parametersa
Mean 609 617 576 624 476 533
SD 89.421 78.036 98.596 59.470 67.608 83.898
Kolmogorov-Smirnov
Z 0.534 0.645 0.855 0.616 0.673 0.558
Asymp. Sig. (2-tailed) 0.938 0.799 0.458 0.842 0.755 0.915
ITSM
@
20⁰C
Sample Size 15 12 15 12 15 12
Normal Parametersa
Mean 1852 3039 1909 3093 1916 3124
SD 248 637 245 641 241 637
Kolmogorov-Smirnov Z
0.539 0.436 0.389 0.576 0.398 0.77
Asymp. Sig. (2-tailed) 0.933 0.991 0.998 0.894 0.997 0.590
Air
voids
Sample Size 15 12 15 12 15 12
Normal Parametersa
Mean 13.882 14.589 13.305 14.595 13.904 14.620
SD 2.270 2.118 2.023 2.161 2.618 2.240
Kolmogorov-Smirnov
Z 0.493 0.443 0.585 0.515 0.602 0.892
Asymp. Sig. (2-tailed) 0.968 0.989 0.884 0.954 0.862 0.404
a. Test distribution is Normal.
Table 6.29: Results of Regression Analysis of CBEMs for MR vs. Air voids
and MR vs. ITSM
Regression
CBEM &
Test
Condition
Ref.
Parameter Coef.
Std
Error t P>|t| [95% Conf. Interval]
MR vs.
Air
voids
EL@20⁰C
Air void
-0.933 29.239 -0.03 0.975 -67.08 65.21
EL@30⁰C 23.669 14.831 1.60 0.145 -9.88 57.22
EL@40⁰C -27.541 18.046 -1.53 0.161 -68.36 13.28
FC@20⁰C -35.260 4.814 -7.32 0.000 -46.64 -23.88
FC@30⁰C -13.295 21.017 -0.63 0.547 -62.99 36.40
FC@40⁰C -62.533 83.869 -0.75 0.480 -260.85 135.78
Mr vs.
ITSM
EL@20⁰C
ITSM
0.102 0.163 0.63 0.547 -0.27 0.47
EL@30⁰C 0.007 0.077 0.10 0.926 -0.17 0.18
EL@40⁰C -0.108 0.082 -1.31 0.222 -0.29 0.08
FC@20⁰C 0.102 0.030 3.39 0.012 0.03 0.17
FC@30⁰C -0.001 0.036 -0.01 0.989 -0.09 0.09
FC@40⁰C -0.213 0.081 -2.64 0.033 -0.40 -0.02
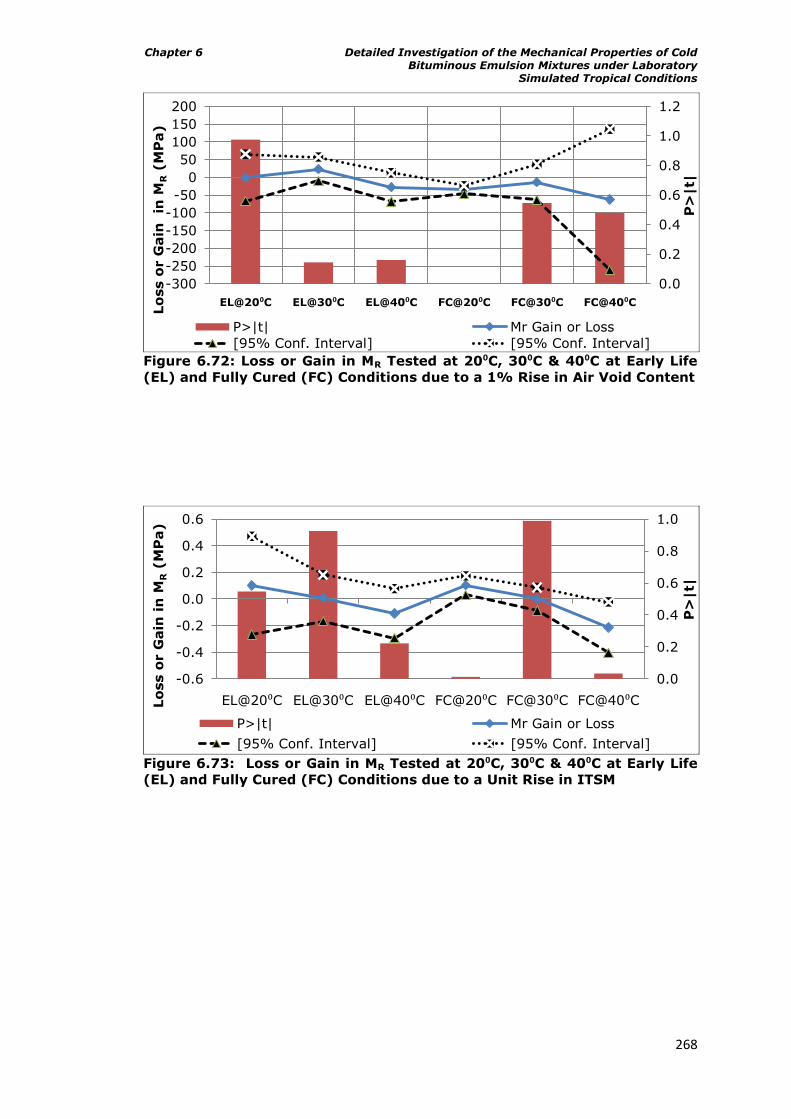
Chapter 6 Detailed Investigation of the Mechanical Properties of Cold Bituminous Emulsion Mixtures under Laboratory
Simulated Tropical Conditions
268
Figure 6.72: Loss or Gain in MR Tested at 20⁰C, 30⁰C & 40⁰C at Early Life
(EL) and Fully Cured (FC) Conditions due to a 1% Rise in Air Void Content
Figure 6.73: Loss or Gain in MR Tested at 20⁰C, 30⁰C & 40⁰C at Early Life
(EL) and Fully Cured (FC) Conditions due to a Unit Rise in ITSM
0.0
0.2
0.4
0.6
0.8
1.0
1.2
-300
-250
-200
-150
-100
-50
0
50
100
150
200
EL@20⁰C EL@30⁰C EL@40⁰C FC@20⁰C FC@30⁰C FC@40⁰C
P>
|t|
Lo
ss o
r G
ain
in
MR
(M
Pa)
P>|t| Mr Gain or Loss
[95% Conf. Interval] [95% Conf. Interval]
0.0
0.2
0.4
0.6
0.8
1.0
-0.6
-0.4
-0.2
0.0
0.2
0.4
0.6
EL@20⁰C EL@30⁰C EL@40⁰C FC@20⁰C FC@30⁰C FC@40⁰CP
>|t|
Lo
ss o
r G
ain
in
MR
(M
Pa)
P>|t| Mr Gain or Loss
[95% Conf. Interval] [95% Conf. Interval]
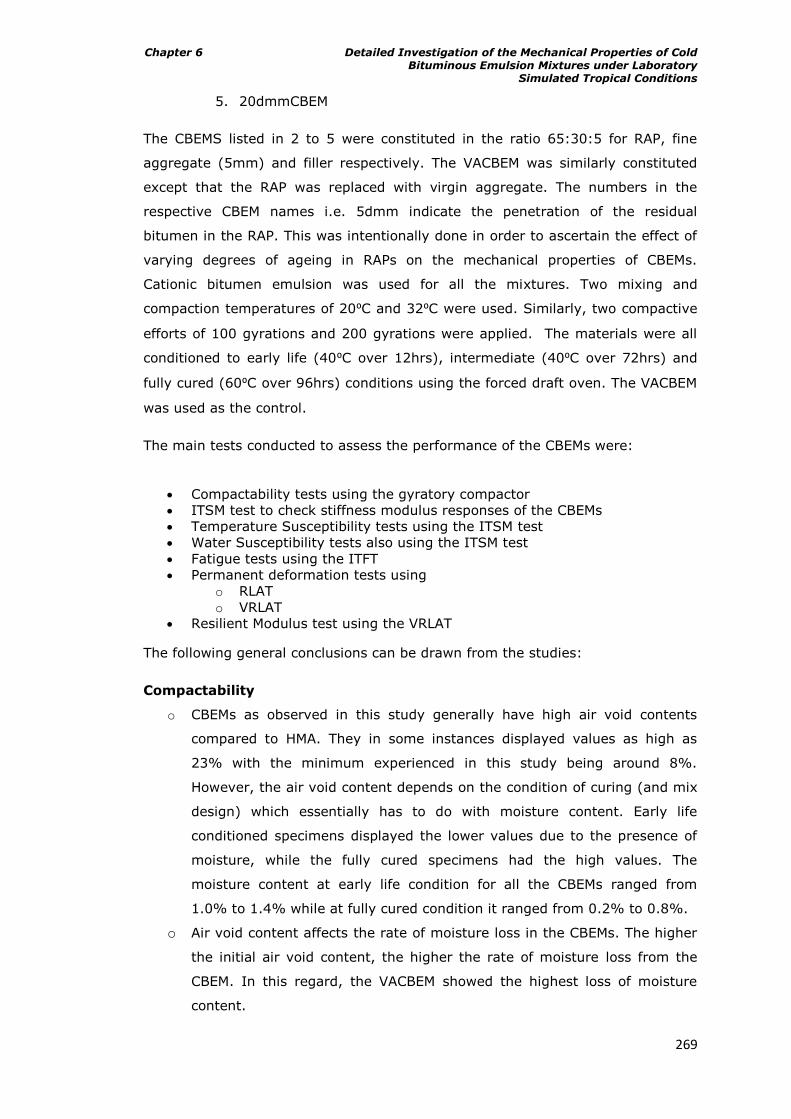
Chapter 6 Detailed Investigation of the Mechanical Properties of Cold Bituminous Emulsion Mixtures under Laboratory
Simulated Tropical Conditions
269
5. 20dmmCBEM
The CBEMS listed in 2 to 5 were constituted in the ratio 65:30:5 for RAP, fine
aggregate (5mm) and filler respectively. The VACBEM was similarly constituted
except that the RAP was replaced with virgin aggregate. The numbers in the
respective CBEM names i.e. 5dmm indicate the penetration of the residual
bitumen in the RAP. This was intentionally done in order to ascertain the effect of
varying degrees of ageing in RAPs on the mechanical properties of CBEMs.
Cationic bitumen emulsion was used for all the mixtures. Two mixing and
compaction temperatures of 20⁰C and 32⁰C were used. Similarly, two compactive
efforts of 100 gyrations and 200 gyrations were applied. The materials were all
conditioned to early life (40⁰C over 12hrs), intermediate (40⁰C over 72hrs) and
fully cured (60⁰C over 96hrs) conditions using the forced draft oven. The VACBEM
was used as the control.
The main tests conducted to assess the performance of the CBEMs were:
Compactability tests using the gyratory compactor
ITSM test to check stiffness modulus responses of the CBEMs
Temperature Susceptibility tests using the ITSM test
Water Susceptibility tests also using the ITSM test
Fatigue tests using the ITFT
Permanent deformation tests using
o RLAT
o VRLAT
Resilient Modulus test using the VRLAT
The following general conclusions can be drawn from the studies:
Compactability
o CBEMs as observed in this study generally have high air void contents
compared to HMA. They in some instances displayed values as high as
23% with the minimum experienced in this study being around 8%.
However, the air void content depends on the condition of curing (and mix
design) which essentially has to do with moisture content. Early life
conditioned specimens displayed the lower values due to the presence of
moisture, while the fully cured specimens had the high values. The
moisture content at early life condition for all the CBEMs ranged from
1.0% to 1.4% while at fully cured condition it ranged from 0.2% to 0.8%.
o Air void content affects the rate of moisture loss in the CBEMs. The higher
the initial air void content, the higher the rate of moisture loss from the
CBEM. In this regard, the VACBEM showed the highest loss of moisture
content.
Chapter 6 Detailed Investigation of the Mechanical Properties of Cold Bituminous Emulsion Mixtures under Laboratory
Simulated Tropical Conditions
270
o The better the compactability (or lower the air void content) of CBEM the
higher the tendency to retain more moisture content in the compacted
mixture. This however seemed not to have affected the stiffness properties
of the CBEMs.
o Mixing and compaction temperature is very important for achieving low air
void contents in CBEMs. Mixing and compacting CBEMs at 32⁰C gave better
results than at 20⁰C.
o Mixing and compaction temperature showed a significant effect on
compactability of CBEMs compared to compactive effort.
o At early life, the RAP CBEMs compacted better compared to the control mix
i.e. the VACBEM. The 20dmmCBEM had the best compactability.
o Also, the study showed that applying high compactive effort on CBEMs at
an operational temperature of about 20⁰C may be appropriate, this
however may amount to a waste of energy when the ambient temperature
is around 32⁰C.
o The results obtained for the fully cured condition similarly rated the RAP
CBEMs high compared to the VACBEM. The observed air void contents also
showed that the consistency and reproducibility of percentage performance
responses of CBEMs mixed and compacted at 32⁰C are uniform and
significantly better compared to those mixed and compacted at 20⁰C. The
results also confirmed that there is little difference in applying a
compactive effort of 100 gyrations and 200 gyrations whereas the
difference is significant at mixing and compaction temperatures of 32⁰C
and 20⁰C. CBEMs prepared at 32⁰C showed superior quality.
Stiffness Modulus Responses
o The stiffness modulus responses referred to as ITSM for the CBEMs
generally showed that the curing protocols used in this study sufficiently
simulated the desired conditions in a logical order as stiffness improved up
the range starting with early life, to intermediate life, and fully cured
condition.
o At early life, the ITSM test clearly ranked the CBEMs in a logical order and
the results were in agreement with findings on compactability of the
CBEMs. 5dmmCBEM had the least percentage improvement over VACBEM
of 8.8% while 20dmmCBEM had the highest of 32%. As the penetration of
the residual binder in the severely aged RAP increases, there is a
corresponding increase in ITSM. At intermediate life, all CBEMs mixed and
compacted at 32⁰C demonstrated ITSM values clearly above 2000MPa
Chapter 6 Detailed Investigation of the Mechanical Properties of Cold Bituminous Emulsion Mixtures under Laboratory
Simulated Tropical Conditions
271
irrespective of the compactive effort applied. The VACBEM performed
better in all cases than the RAP CBEMs with the exception of the
20dmmCBEM.
o At fully cured condition as simulated in this study, the VACBEM was
superior in ITSM response compared to the 5dmmCBEM. Also, there is an
indication of better performance over the 10dmmCBEM and 15dmmCBEM
by the VACBEM generally at the mixing and compaction temperature of
20⁰C irrespective of the compactive effort applied. Although the
20dmmCBEM significantly improved here compared to the intermediate life
ITSM responses, the result indicates the best response as expected at
mixing and compaction temperature of 32⁰C but at the lower compactive
effort of 100 gyrations.
o Some of the results suggest that the 10dmm, 15dmm and 20dmm RAPs
were not completely acting as black rock i.e. bitumen in RAP was
influencing the behaviour of the RAP CBEM, most especially when
constituted at 32⁰C.
o Although the VACBEM performed better than some of the RAP CBEMs at
intermediate and fully cured conditions, the very high air void contents
consistently observed for VACBEM compared to the other RAP CBEMs
obviously predisposes it to problems associated with durability in
bituminous mixtures.
Temperature Susceptibility measured by ITSM
o ITSM responses tested at 20⁰C for fully cured CBEMs mixed and compacted
at 32⁰C were generally above 2500MPa (with the exception of the
5dmmCBEM) irrespective of the compactive effort applied.
o The responses dropped to around 1500MPa for ITSM tests conducted at
30⁰C and further down to around 650MPa for test conducted at 40⁰C on the
same specimens.
o Irrespective of the CBEM type, the condition of curing and testing
temperature for ITSM, CBEMs prepared at 32⁰C consistently performed
better than those prepared at 20⁰C even at an ITSM test temperature of
40⁰C.
o The CBEM materials prepared at 32⁰C, 100 gyrations have least loss in
ITSM due to high temperature which implies just enough compactive effort
along with appropriate temperature for preparation of CBEMs.
o VACBEM as observed here shows the highest temperature susceptibility.
Chapter 6 Detailed Investigation of the Mechanical Properties of Cold Bituminous Emulsion Mixtures under Laboratory
Simulated Tropical Conditions
272
Water Susceptibility
o The RAP CBEMs performed better than the VACBEM in water susceptibility.
o In Protocol 2 where recovery was monitored after the CBEMs were
subjected to severe conditions, the VACBEM performed poorly compared to
the other CBEMs.
o The poor performance of the VACBEM could have been partly caused by its
high air void content, while the lower air voids of the other CBEMs could
have been partly responsible for their better performance. More
importantly, it is believed that the residual bitumen in the severely aged
RAPs that constitute the RAP CBEMs is possibly being rejuvenated thus
causing the RAP CBEMs to have larger volume of active binder.
Furthermore, the performance could similarly be linked to the possible
changes in the volumetrics of the RAP CBEMs as a result of the softening
of the residual bitumen in the RAP and not necessarily rejuvenation.
o A trend which indicates that as the penetration of residual bitumen in RAP
CBEMs increases, performance similarly increases was observed.
ITSM and Air voids
o There is a negative relationship between ITSM and air voids i.e. as air
voids increase, stiffness modulus reduces for CBEMs. The results here
indicate generally that as CBEMs cure, the air voids – stiffness relationship
gets stronger.
o This is particularly observed for VACBEM as a unit rise in air void content
could result in loss of ITSM as high as 240MPa for fully cured conditions.
Fatigue Response
o Fatigue lives of the CBEMs generally were lower than those for HMA.
o For the tests conducted at 30⁰C, the result for the 5dmmCBEM in all cases
was the best followed by the 20dmmCBEM while the VACBEM had the
poorest performance.
o For tests conducted at 20⁰C, the results for 1.0E + 03 cycles to failure
indicated that the VACBEM had the least strain while the RAP CBEMs
returned values generally greater than 200μ . This trend was similarly
observed for tests at 30⁰C.
o The results imply that the VACBEM has the best resistance at high stresses
compared to all the other mixtures. The 5dmmCBEM on the other hand
returned the least strain for CBEMs prepared at 32⁰C and tested at 30⁰C.
Chapter 6 Detailed Investigation of the Mechanical Properties of Cold Bituminous Emulsion Mixtures under Laboratory
Simulated Tropical Conditions
273
o Overall, the RAP CBEMs prepared at a mixing and compaction temperature
of 32⁰C performed better in fatigue than their counterparts prepared at
20⁰C.
o Also, considering the behaviour of both the VACBEM and 5dmmCBEM, it
seems that the fatigue responses of CBEMs were not affected by air void
contents although it was earlier established that air voids have a strong
correlation with stiffness of CBEMs, depending on the level of curing
attained. Generally, these two CBEMs have relatively high air void contents
compared to the other CBEMs.
Deformation Properties
o In line with logic, the strain rate and the strain values (for the RLAT and
the VRLAT) for the CBEMs at fully cured conditions were lower than those
for the early life.
o VACBEM performed better than the RAP CBEMs. The results also seem not
to have been affected by the air void contents of the CBEMs as the
VACEBEM which performed best in permanent deformation resistance
consistently displayed the highest air void contents of all the CBEMs
studied.
o The performance of the RAP CBEMs seems to indicate more active binder
contributing to the matrix (with the 20dmmCBEM having the greatest
proportion) than the VACBEM. In the case of the RAP CBEMs the binding
medium played a significant role which is reflected in their performance as
they are more susceptible to rutting.
o The VACBEM seems to have behaved more or less like unbound granular
material. Oruc et al (2006) among a host of other researchers similarly
found this trend for cold mixtures.
Resilient Modulus
o The results clearly indicate that the resilient moduli of the mixtures
investigated in this work are stress dependent as they all fitted the k-Θ
model.
o The test as it was done here was able to discriminate the properties of the
mixtures with regard to temperature susceptibility.
o As expected also, the best performances for the CBEMs were recorded at a
test temperature of 20⁰C on the fully cured specimens.
o The most interesting aspect here was that the test has the potential to
clearly discriminate the CBEMs at a test temperature of 40⁰C better than
the ITSM test.
Chapter 6 Detailed Investigation of the Mechanical Properties of Cold Bituminous Emulsion Mixtures under Laboratory
Simulated Tropical Conditions
274
o Though this needs further investigation, the results here suggest that there
seems to be a relationship between MR and Air voids, such that with a unit
increase in air void content there is a potential loss in resilient modulus
just as for ITSM.
o The results also suggest that, as the CBEMs cure further, an increase in air
void makes the loss more significant. For example, in the case of the only
observation in which significance was observed, with 1% increase in air
void content, a loss of 35MPa in resilient modulus is recorded.
o The results suggest similarly that the relationship between MR and ITSM, is
weak. The relationship seemed to have been influenced by temperature.
o The results show that the Indirect Tensile Stiffness Modulus (ITSM) is
useful for quickly ranking CBEMs (most especially for early life condition)
and whereas the resilient modulus may be more appropriate for pavement
design involving such materials since they are non-linear in their behaviour
as observed in this study.
6.14 Conclusions
The RAP CBEMs with residual binder of 10dmm or more showed improved
compactability compared to the VACBEM indicating an active role of the residual
binder, even in these heavily aged mixes. This was particularly the case at an
elevated mixing and compaction temperature of 32⁰C, typical of tropical ambient
temperatures. At this temperature, the air void content of the RAP CBEMs was
lower than that of the VACBEM, even at low compactive effort. While the VACBEM
was in some cases as stiff as the RAP CBEMs, the higher air void content and
lower active binder content led to higher levels of temperature and moisture
susceptibility for stiffnesses compared to all the RAP CBEMs, down to residual
penetration of 5dmm. This indicates an impact due to the presence of even
severely aged residual binder in addition to improved compactability. Under these
conditions, aged RAP is possibly not acting entirely as „black rock‟.
The RAP CBEMs similarly were slightly better in fatigue and resilient modulus
under the above mentioned ambient tropical conditions. Although, the VACBEM
was better in permanent deformation resistance compared to the RAP CBEMs, the
responses of the RAP CBEMs were still within standards. Furthermore, the results
of the permanent deformation test also suggest that the RAP CBEMs had more
active binder in the mix compared to the VACBEM which corroborates the earlier
claim that the severely aged RAP is possibly not entirely acting as „black rock‟.
Chapter 7 Structural Design and Modelling of Flexible Pavement Containing CBEMs
275
7 Structural Design and Modelling of
Flexible Pavement Containing CBEMs
7.1 Overview
The structural design of a flexible road pavement is required in order to estimate
its design life. This in essence will ensure that the road pavement serves its
purposes structurally and functionally in an economically viable manner within
such estimated/predicted design life.
This design task for road pavements is complex (Ebels, 2008; and Twagira, 2010)
and it is not as straightforward as obtained in other engineering structures
(Thom, 2008). In fact Thom (2008) opined that there is never a unique solution
under such circumstance. More importantly, long term characteristics of a
pavement have to be borne in mind as much as the day one performance in the
process of design. He further suggested that such design should aim to:
Protect the subgrade
Guard against deformation in the pavement layers
Guard against break up of pavement layers
Protect from environmental attack
Provide suitable surface
Ensure maintainability
As mentioned in the preceding chapter, researchers have realised that once
fatigue and rutting (cumulative deformation) which are the two classical failure
modes of pavements have been taken care of in design, then those earlier listed
design aims by Thom (2008) are conveniently met (Read and Whiteoak, 2003).
Thus, the structural design detailed in this chapter is mainly focused on fatigue
and rutting.
Although researchers have commonly agreed that such design could be done
empirically or by using mechanistic approach (Jitareekul, 2009; Ebels, 2008;
Twagira, 2010), Huang (2004) in a more elaborate manner stated that there are
five methods for executing such design. These are:
Empirical method with or without a soil strength test
Limiting shear failure method
Chapter 7 Structural Design and Modelling of Flexible Pavement Containing CBEMs
276
Limiting deflection method
Regression method based on pavement performance or road test
Mechanistic – empirical method
The mechanistic-empirical method of the listed five is particularly appealing and
has been used for the works described in this chapter mainly because of the
procedure involved. For example, Huang (2004) reported that the mechanistic-
empirical method is based on the mechanics of materials that relates an input,
such as a wheel load, to an output or pavement response such as strain or stress.
The response values are subsequently used to predict distress from laboratory-
test and field performance data. This aspect essentially makes this method
suitable since many laboratory tests have been conducted in this present work
and the results of such are useful in this regard. Huang (2004) believes that
dependence on observed values is important because theory alone has not proven
sufficient to design pavements realistically. The advantages of the mechanistic
methods therefore are the improvement in the reliability of a design, the ability to
predict the types of distress, and the feasibility to extrapolate from limited field
and laboratory data.
Similarly, following the mechanistic-empirical method described above for the
design of pavements containing the five (5) CBEMs (as a road base layer
material) examined in the preceding chapter allows for a comparative analysis to
ascertain the benefit of using RAP CBEMs or otherwise compared to the VACBEM.
Although the study here is focused mainly on the road base layer which contains
the CBEMs, Ebels (2008) suggested that the responses of interest for a full
pavement analysis are:
Horizontal tensile strain at the bottom of the HMA (surface layer)
Principal stresses in the CBEM layer (road base)
Horizontal strain at the bottom of the CBEM layer
Vertical strain on top of the subgrade.
This chapter essentially focuses on examining the effect of CBEM type on the
relevant responses (stresses and strains) using 16 pavement structures. Table 7.1
details the pavement structures. The structures have been chosen such that they
represent the common practice in the industry. Flexible pavement failure criteria
for fatigue and rutting are first discussed before briefly looking at the relevant
modelling tools and requirements. A detailed description of non-linear elastic
analysis is similarly given in this chapter. Since one of the objectives of this
chapter is to check the performance of the CBEMs, the structural analysis started
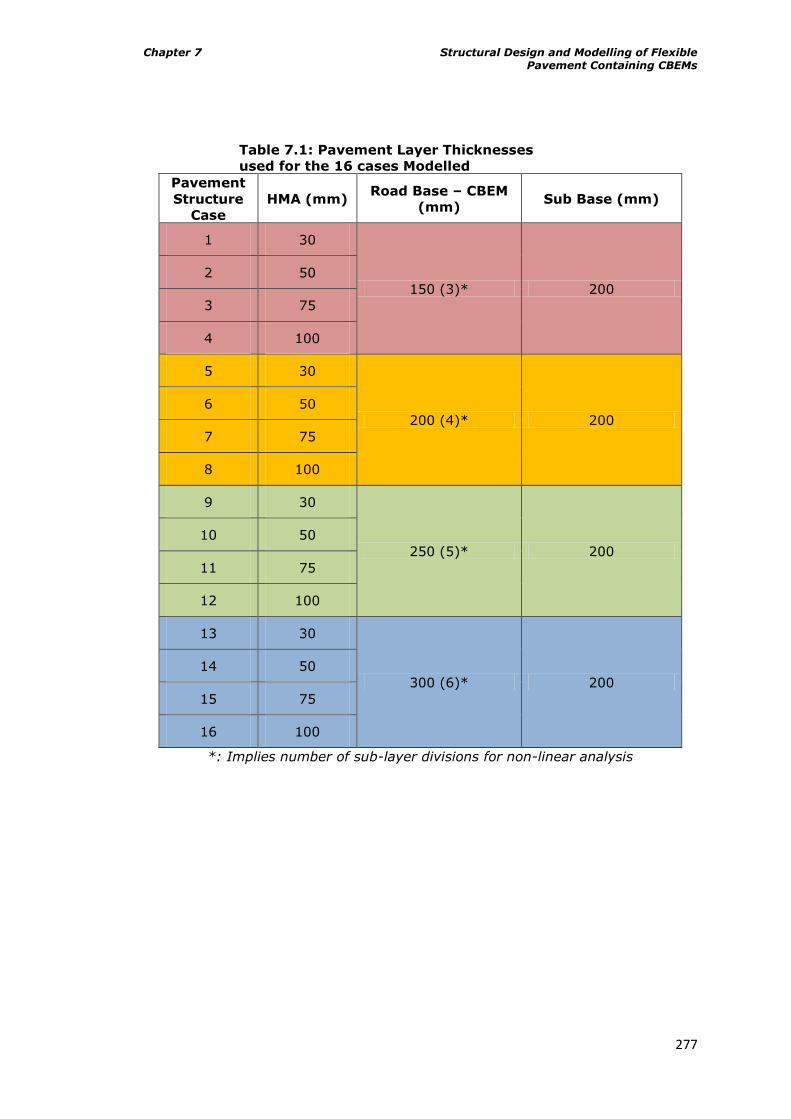
Chapter 7 Structural Design and Modelling of Flexible Pavement Containing CBEMs
277
Table 7.1: Pavement Layer Thicknesses
used for the 16 cases Modelled
Pavement
Structure
Case
HMA (mm) Road Base – CBEM
(mm) Sub Base (mm)
1 30
150 (3)* 200
2 50
3 75
4 100
5 30
200 (4)* 200
6 50
7 75
8 100
9 30
250 (5)* 200
10 50
11 75
12 100
13 30
300 (6)* 200
14 50
15 75
16 100
*: Implies number of sub-layer divisions for non-linear analysis
Chapter 7 Structural Design and Modelling of Flexible Pavement Containing CBEMs
278
by examining the stress and strain distribution in pavements containing the
CBEMs using non-linear modelling tools because the resilient modulus test results
in Chapter 6 suggested this form of behaviour. This is later extended to linear
modelling tools for a comparative analysis in order to ascertain the suitable
method of analysis for pavements containing CBEMs. Similarly, the maximum
horizontal/vertical strains within the CBEM layers and those generated at the
bottom of the layers were compared and the more suitable approach for structural
analysis was adopted. The effect of the CBEMs on the fatigue life of the surfacing
layer and as well the rutting potential of the subgrade is similarly examined and
the results are used to produce hypothetical design charts. Although CBEMs both
in the early life (EL) and fully cured (FC) condition were studied, only the FC ones
have been reported here, since fatigue tests were only conducted on the FC
CBEMs.
7.2 Flexible Pavement Failure Criterion
As earlier mentioned, researchers have established that the basic failure
mechanisms of flexible pavements are fatigue and rutting related. Therefore, a
failure criterion for a flexible pavement must be set in concert with the results
obtained for the fatigue and rutting responses of the CBEM materials in the
preceding chapter. The fatigue line equations from ITFT and the parameters
obtained from the resilient modulus test are relevant here.
In the case of fatigue failure in asphalt pavements, Thom (2008) observed that a
relationship is generally found between tensile strains in asphalts (at the bottom
of the asphalt, immediately under the load or; near the surface, just outside the
loaded area or; at the surface in the tyre tread contact zone) under traffic load
and fatigue tests conducted in the laboratory. In this regard, cracking in asphalt
pavements in-service as a result of tensile strains is deemed to be related to
failure in fatigue tests under repeated loading. Shift factors which cater for field
(in-service) effects must be introduced, i.e. establish a relationship between
laboratory and field performance, for a realistic criterion to be set. Oliveira (2006)
opined that this is very difficult to do since such depends on the type of test,
mode of loading, testing temperature and type of mixture. He observed that
laboratory fatigue tests for example use sinusoidal loading and fixed strain or
stress during one test, while in practice, the mode of loading is randomly
distributed, including rest periods and lateral distribution of loads. He stated
further that temperature variations in the asphalt layer and healing effects, due to
intermittent loading, also influence the field performance of asphalts.
Chapter 7 Structural Design and Modelling of Flexible Pavement Containing CBEMs
279
Oliveira (2006) reported that researchers in the light of the above have suggested
various shift factors but with high diversity and no generally accepted one.
Although his work focused on grouted macadam, he eventually found a shift
factor of 41.4 suitable for fatigue failure criterion for grouted macadam. In a
related work to the one described in this thesis, Jitareekul (2009) used the shift
factors of 440 (1.1 for lateral wheel load distribution, 20 for rest periods and 20
for crack propagation) and 77 suggested by Brunton (1983) for adjusting
laboratory determined fatigue lives (the fatigue lives are multiplied by the shift
factors) to suit failure and so-called critical points in the field respectively.
Meanwhile, for rutting, Yusof (2005) and Rahman (2004) among a host of other
researchers suggested that by limiting the maximum vertical strain at the top of
the sub-grade layer, a failure criterion can be established. In this regard, Brown
and Brunton (1986) suggested that:
Ncr =fr (
) 7.1
NF = fr (
) 7.2
Where:
Ncr = life to critical condition (10mm rut)
NF = life to failure (20mm rut)
Fr = a rut factor to account for the hot mixture type- 1.56 for dense
bitumen mixtures
z = Strain on top of subgrade obtained from structural analysis
However, Thom (1996) cautioned that of these criteria, subgrade strain is less
fundamentally based than asphalt tensile strain for fatigue cracking.
These shift factors for fatigue and rutting were derived for hot mixtures, however
they have been used in this work since there are no such values for cold mixtures
presently.
7.3 Modelling Tools and Requirements
For the structural design approach chosen in this work i.e. the mechanistic-
empirical approach, Brown and Brunton (1986) summarised the design process as
follows:
Specify the loading (vehicular loading),
Estimate the components (layers) and sizes (thicknesses),
Consider the materials available,
Chapter 7 Structural Design and Modelling of Flexible Pavement Containing CBEMs
280
Conduct structural analysis using theoretical principles,
Compare critical stresses, strains or deflections with allowable values
(based on the result of laboratory tests) to ascertain whether the design is
satisfactory,
Make adjustments to materials or geometry until satisfactory design is
achieved,
Consider the economic feasibility of the result.
Figure 7.1 shows the hypothetical flexible road pavement structure that was used
for the exercise described in this chapter though the main focus was on the road
base (CBEM) layer. This structure is commonly used in Nigeria and for ease of
analysis, a single wheel loading system of 40kN tyre load (80kN being the single
standard axle load), 700kPa tyre pressure and tyre contact area radius of 143mm
was used for simple symmetry of loading involved (Ebels, 2008). The single wheel
loading makes the critical horizontal position to lie directly under the wheel load.
More importantly, Twagira (2010) observed that the use of a single wheel also
leads to a slightly more conservative estimate, because the stresses under single
wheel loading are generally slightly higher than under dual wheel loading.
The results obtained under resilient modulus testing in the preceding chapter
indicated that the CBEMs are stress dependent and thus are non-linear in elastic
response. Thus, the work described in this chapter was analysed bearing in mind
that the layer of interest (road base) is non-linear in elastic behaviour. Although
some researchers (Jitareekul 2009; and Twagira, 2010) have found linear
analytical tools useful for quick analytical design of stresses and strains in such
pavements, Ebels (2008) however in a comparative analysis using both linear
(BISAR 3.0) and non-linear (KENLAYER) analytical tools on similar materials (cold
mixtures) found that it is better to use the appropriate approach for each
material. He reported that using non-linear elastic approach and dividing the cold
mix layer into sub-layers, each with a unique stiffness, results in higher stress
ratios which are better estimates than those obtained by linear elastic
calculations. This observation clearly corroborates the suggestions of Huang
(2004) on same issue. Therefore the non-linear elastic approach was adopted in
this exercise.
7.4 Non-Linear Elastic Analysis
The KENLAYER mode in the KENPAVE computer program developed by Huang
(2004) for flexible pavement design which is widely available was found useful in
this regard. Huang (2004) reported that the backbone of KENLAYER is the
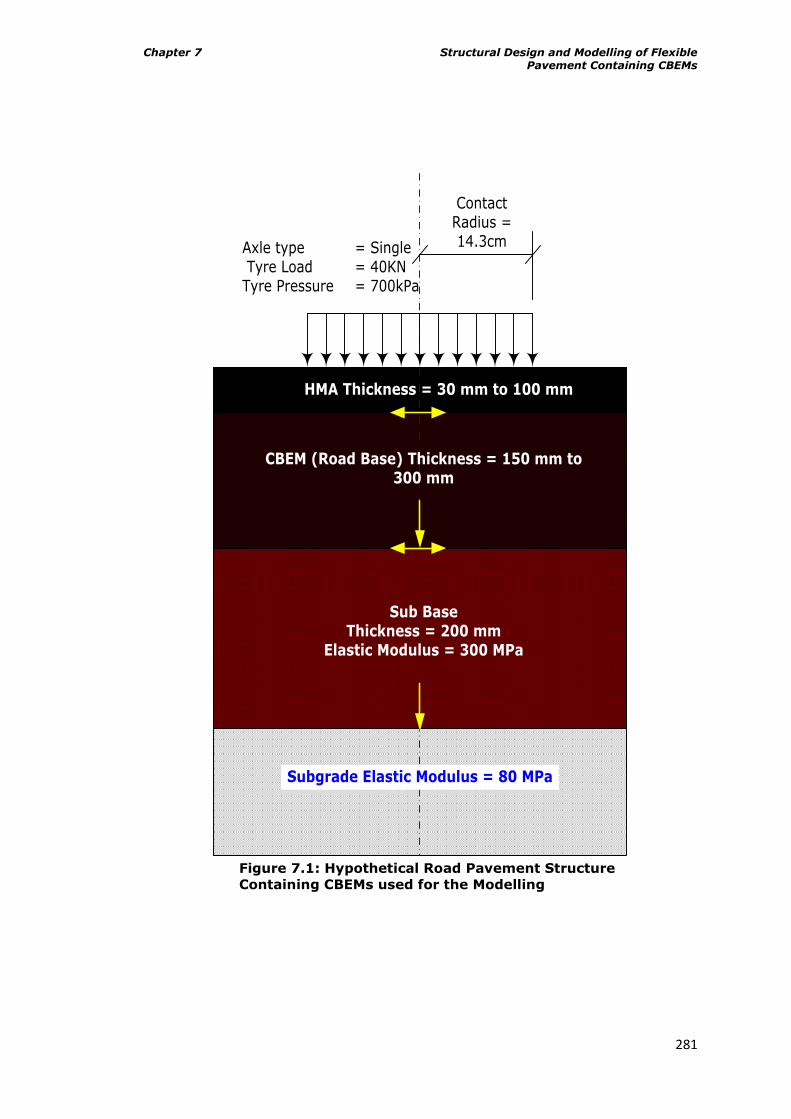
Chapter 7 Structural Design and Modelling of Flexible Pavement Containing CBEMs
281
Contact Radius = 14.3cmAxle type = Single
Tyre Load = 40KNTyre Pressure = 700kPa
HMA Thickness = 30 mm to 100 mm
CBEM (Road Base) Thickness = 150 mm to 300 mm
Sub Base Thickness = 200 mm
Elastic Modulus = 300 MPa
Subgrade Elastic Modulus = 80 MPa
Figure 7.1: Hypothetical Road Pavement Structure
Containing CBEMs used for the Modelling
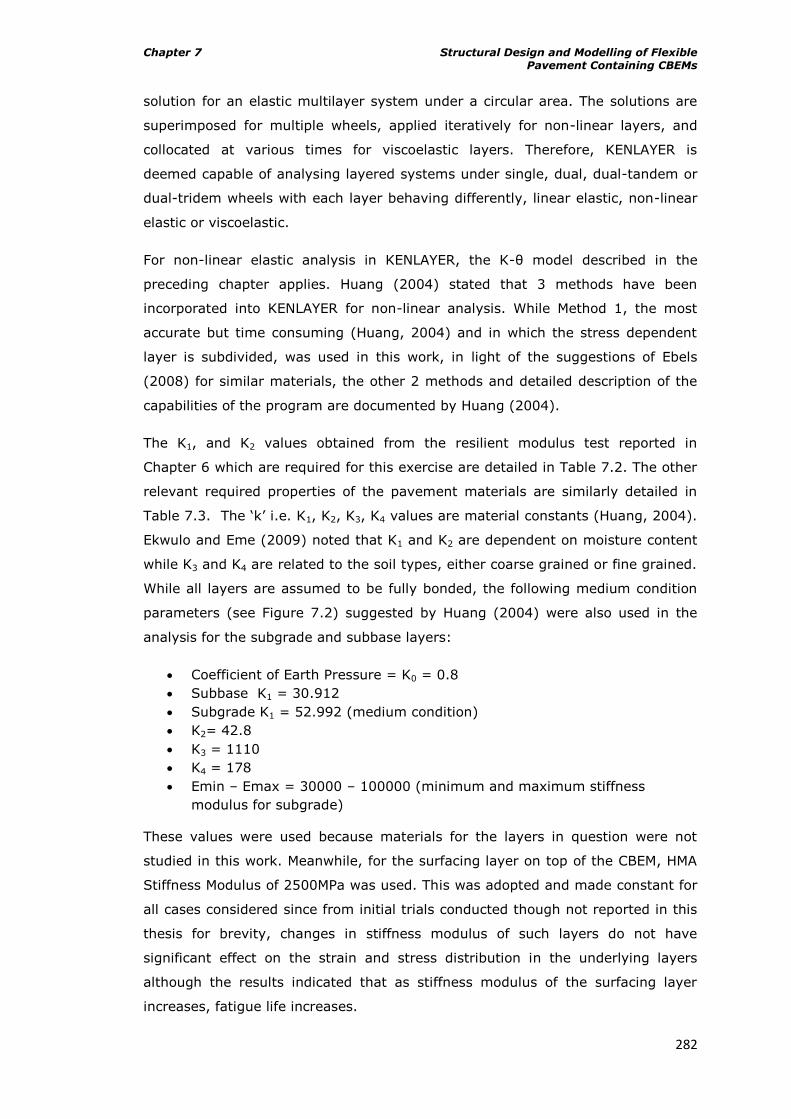
Chapter 7 Structural Design and Modelling of Flexible Pavement Containing CBEMs
282
solution for an elastic multilayer system under a circular area. The solutions are
superimposed for multiple wheels, applied iteratively for non-linear layers, and
collocated at various times for viscoelastic layers. Therefore, KENLAYER is
deemed capable of analysing layered systems under single, dual, dual-tandem or
dual-tridem wheels with each layer behaving differently, linear elastic, non-linear
elastic or viscoelastic.
For non-linear elastic analysis in KENLAYER, the K-θ model described in the
preceding chapter applies. Huang (2004) stated that 3 methods have been
incorporated into KENLAYER for non-linear analysis. While Method 1, the most
accurate but time consuming (Huang, 2004) and in which the stress dependent
layer is subdivided, was used in this work, in light of the suggestions of Ebels
(2008) for similar materials, the other 2 methods and detailed description of the
capabilities of the program are documented by Huang (2004).
The K1, and K2 values obtained from the resilient modulus test reported in
Chapter 6 which are required for this exercise are detailed in Table 7.2. The other
relevant required properties of the pavement materials are similarly detailed in
Table 7.3. The „k‟ i.e. K1, K2, K3, K4 values are material constants (Huang, 2004).
Ekwulo and Eme (2009) noted that K1 and K2 are dependent on moisture content
while K3 and K4 are related to the soil types, either coarse grained or fine grained.
While all layers are assumed to be fully bonded, the following medium condition
parameters (see Figure 7.2) suggested by Huang (2004) were also used in the
analysis for the subgrade and subbase layers:
Coefficient of Earth Pressure = K0 = 0.8
Subbase K1 = 30.912
Subgrade K1 = 52.992 (medium condition)
K2= 42.8
K3 = 1110
K4 = 178
Emin – Emax = 30000 – 100000 (minimum and maximum stiffness
modulus for subgrade)
These values were used because materials for the layers in question were not
studied in this work. Meanwhile, for the surfacing layer on top of the CBEM, HMA
Stiffness Modulus of 2500MPa was used. This was adopted and made constant for
all cases considered since from initial trials conducted though not reported in this
thesis for brevity, changes in stiffness modulus of such layers do not have
significant effect on the strain and stress distribution in the underlying layers
although the results indicated that as stiffness modulus of the surfacing layer
increases, fatigue life increases.
Chapter 7 Structural Design and Modelling of Flexible Pavement Containing CBEMs
283
Table 7.2: K1, K2 and R2 Values from
Resilient Modulus Test of CBEMs
CBEM
Type
FC @ 20⁰C FC 30⁰C
K1
(MPa)
K2 R2 K1
(MPa)
K2 R2
VA 26.467 0.5453 0.9885 50.026 0.436 0.9878
5dmm 50.426 0.4673 0.9771 78.226 0.378 0.9827
10dmm 32.603 0.5248 0.9895 59.325 0.4416 0.9838
20dmm 35.731 0.5319 0.9821 48.567 0.4641 0.992
FC: Fully Cured
Table 7.3: Pavement Layer Material Properties
Layer
Material
Density
(kg/m3)
Poisson's
Ratio
Elastic
Behaviour
HMA 2400 0.35 Linear
VA 2180 0.35 Non-Linear
5dmm 2120 0.35 Non-Linear
10dmm 2158 0.35 Non-Linear
20dmm 2224 0.35 Non-Linear
Sub base 2000 0.35 Non-Linear
Subgrade 1800 0.35 Non-Linear
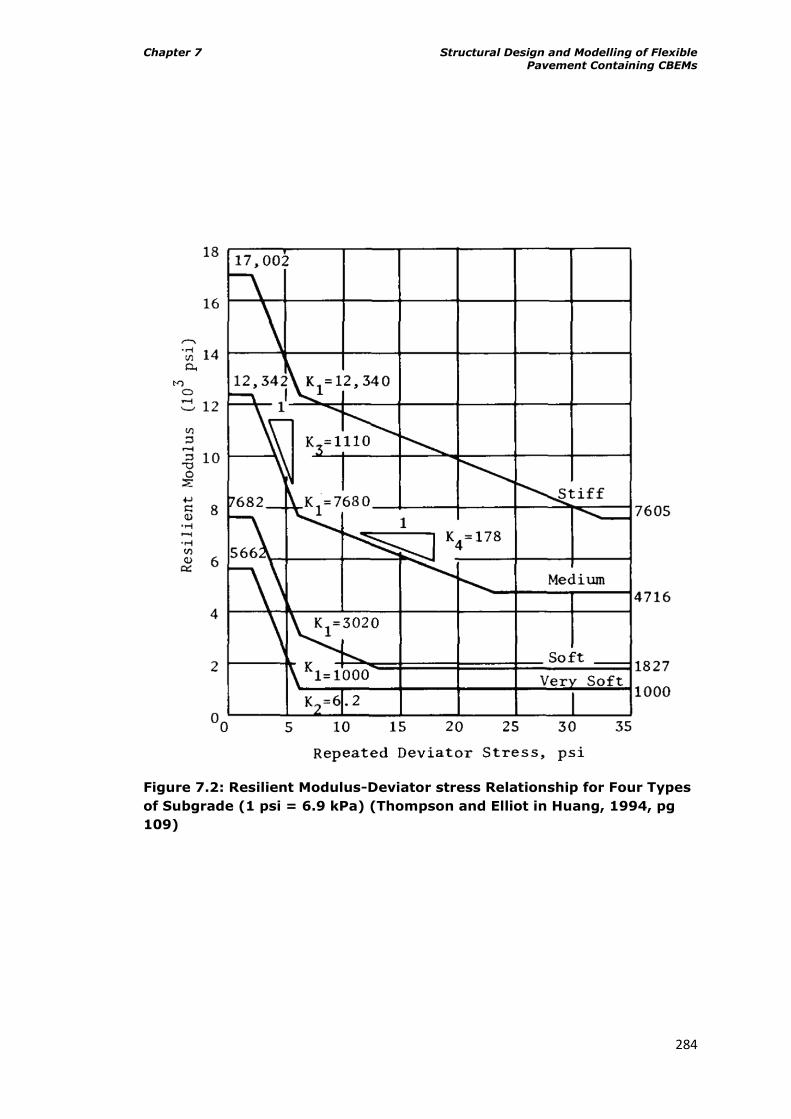
Chapter 7 Structural Design and Modelling of Flexible Pavement Containing CBEMs
284
Figure 7.2: Resilient Modulus-Deviator stress Relationship for Four Types
of Subgrade (1 psi = 6.9 kPa) (Thompson and Elliot in Huang, 1994, pg
109)
Chapter 7 Structural Design and Modelling of Flexible Pavement Containing CBEMs
285
Seeding resilient modulus (compressive modulus) values for CBEMs (non-linear
and stress dependent layer) ranged between 1000MPa and 600MPa depending on
the number of sub-layers (each sub-layer of the CBEM is 50mm thick). This
seeding value is needed because an iterative procedure is used, in which the
moduli of non-linear layers are adjusted as the stresses vary, while the moduli of
the linear layers remain the same. During each iteration, a constant set of moduli
is computed based on the stresses obtained from the previous iteration. After the
stresses due to single or multiple wheels are determined, the elastic moduli of
non-linear layers are recalculated and a new set of stresses is determined. This is
repeated until the moduli converge to a specified tolerance (Huang, 2004). The
Sub-base Modulus was taken as 300MPa (stabilised laterite of 30% CBR) and
80MPa (lateritic soil of 8% CBR) was adopted for the Subgrade Modulus since
these were observed for such layers for a typical Nigerian road by Ekwulo and
Eme (2009). The other required information such as loads and layer thicknesses
are as stated in Figure 7.1 and Table 7.1.
It is worth noting that all required entries must be made correctly as the
KENLAYER program is highly sensitive to inputs. The outputs from the analysis
are the vertical, horizontal and shear strains and stresses. Also included is
resilient modulus of each layer and vertical displacements.
It is also worth noting that although this multi-layer analysis is easy to execute
(Oliveira, 2006), researchers have found out that performance prediction from
such an approach is not as accurate as those obtained from finite element
analysis (Oliveira, 2006; Huang, 2004; Ebels, 2008; and Twagira, 2010).
However, Oliveira (2006) and Twagira (2010) both observed that finite element
analysis is difficult to implement unless users have a thorough knowledge of basic
principles.
7.5 Stress and Strain Distribution in Pavements Containing CBEMs
Using pavement structure case number 9 from Table 7.1 i.e. surfacing layer
thickness of 30mm, CBEM (road base) layer thickness of 250mm (divided into 5
equal sub-layers) and a sub-base layer of 200mm, the stress and strain
distributions through pavements containing VACBEM, 5dmmCBEM, 10dmmCBEM
and 20dmmCBEM as road base layers which were analysed using the KENLAYER
analytical tool were studied. All the CBEMs used were in a fully cured condition
but tested at 20⁰C and 30⁰C.
Chapter 7 Structural Design and Modelling of Flexible Pavement Containing CBEMs
286
Figures 7.3 to 7.6 are relevant here. Figure 7.3 shows the vertical stress
distribution in the pavements. The results of the analyses indicate that vertical
stress distribution in the CBEMs is not significantly different for all the pavement
types considered. The figure shows also that vertical stress reduces with depth.
These were also observed for the horizontal stress distribution as indicated in
Figure 7.4 though with more pronounced differences indicated in the area covered
by the red dash line circle. It is to be noted that the differences here occurred in
the CBEM layer only since all other layers have similar properties for all the
pavements considered. The figure also shows that the horizontal stress gradually
changed with depth from a relatively high negative value at the top of the
surfacing layer to a positive value on top of the subgrade. Figure 7.5 shows the
vertical strain distribution in the pavements while Figure 7.6 shows similar
distribution for the horizontal strain in the pavements. The red dash lines in the
figures show the bottom level of the CBEM layers in the hypothetical pavement
structure. The figures indicate significant differences in strains for the CBEM
layers and that the maximum horizontal and vertical strains are not at the bottom
of the CBEM layers, but very close to the middle of the CBEM layers. These
observations are consistent with those observed by Ebels (2008) for similar
materials. He observed that cold mix materials with different properties showed
significant differences in strains while stress values had little differences using the
KENLAYER analytical tool. The figures showed that the RAP CBEMs generally have
lower strain values compared to the VACBEM.
Meanwhile, as observed from the relevant figures for strains, VACBEM indicated
the highest values (worst performance) for the two temperatures while the
20dmmCBEM tested at 20⁰C indicated the lowest strain values. Materials tested at
30⁰C generally showed higher strain values compared to those tested at 20⁰C.
7.6 The Effect of Analytical Method on Stress and Strain Distributions
The effect of the applied analytical tool on the stress and strain distribution in the
pavement was briefly examined. This was done by comparing the stress and
strain distributions generated from the KENLAYER analytical tool with those
generated using the Bitumen Stress Analysis in Roads (BISAR 3.0) software which
was developed by Shell (1998).
Since in the preceding section, the analyses showed that the vertical stress
distributions for all the pavements considered were close, the corresponding
modulus values (obtained iteratively) to the stress values observed at the bottom
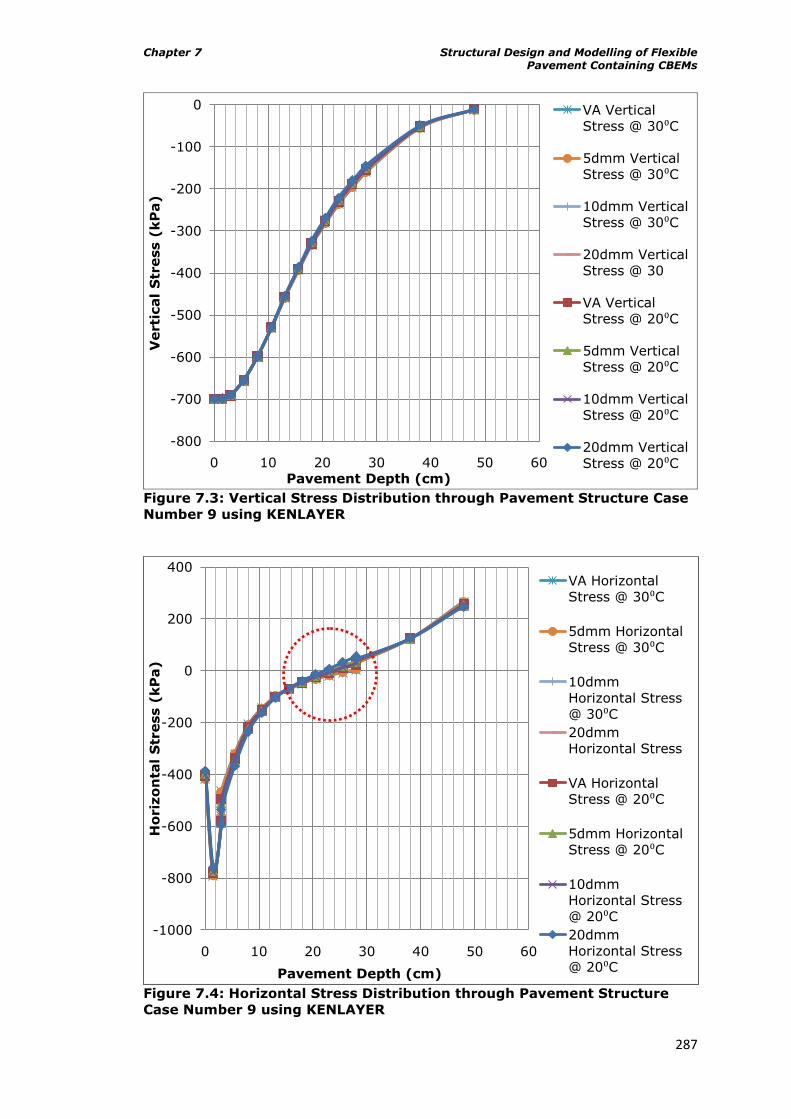
Chapter 7 Structural Design and Modelling of Flexible Pavement Containing CBEMs
287
Figure 7.3: Vertical Stress Distribution through Pavement Structure Case
Number 9 using KENLAYER
Figure 7.4: Horizontal Stress Distribution through Pavement Structure
Case Number 9 using KENLAYER
-800
-700
-600
-500
-400
-300
-200
-100
0
0 10 20 30 40 50 60
Verti
cal
Str
ess (
kP
a)
Pavement Depth (cm)
VA Vertical
Stress @ 30⁰C
5dmm Vertical
Stress @ 30⁰C
10dmm Vertical
Stress @ 30⁰C
20dmm Vertical
Stress @ 30
VA Vertical
Stress @ 20⁰C
5dmm Vertical
Stress @ 20⁰C
10dmm Vertical
Stress @ 20⁰C
20dmm Vertical
Stress @ 20⁰C
-1000
-800
-600
-400
-200
0
200
400
0 10 20 30 40 50 60
Ho
riz
on
tal
Str
ess (
kP
a)
Pavement Depth (cm)
VA Horizontal
Stress @ 30⁰C
5dmm Horizontal
Stress @ 30⁰C
10dmm
Horizontal Stress
@ 30⁰C
20dmm
Horizontal Stress
VA Horizontal
Stress @ 20⁰C
5dmm Horizontal
Stress @ 20⁰C
10dmm
Horizontal Stress
@ 20⁰C
20dmm
Horizontal Stress
@ 20⁰C
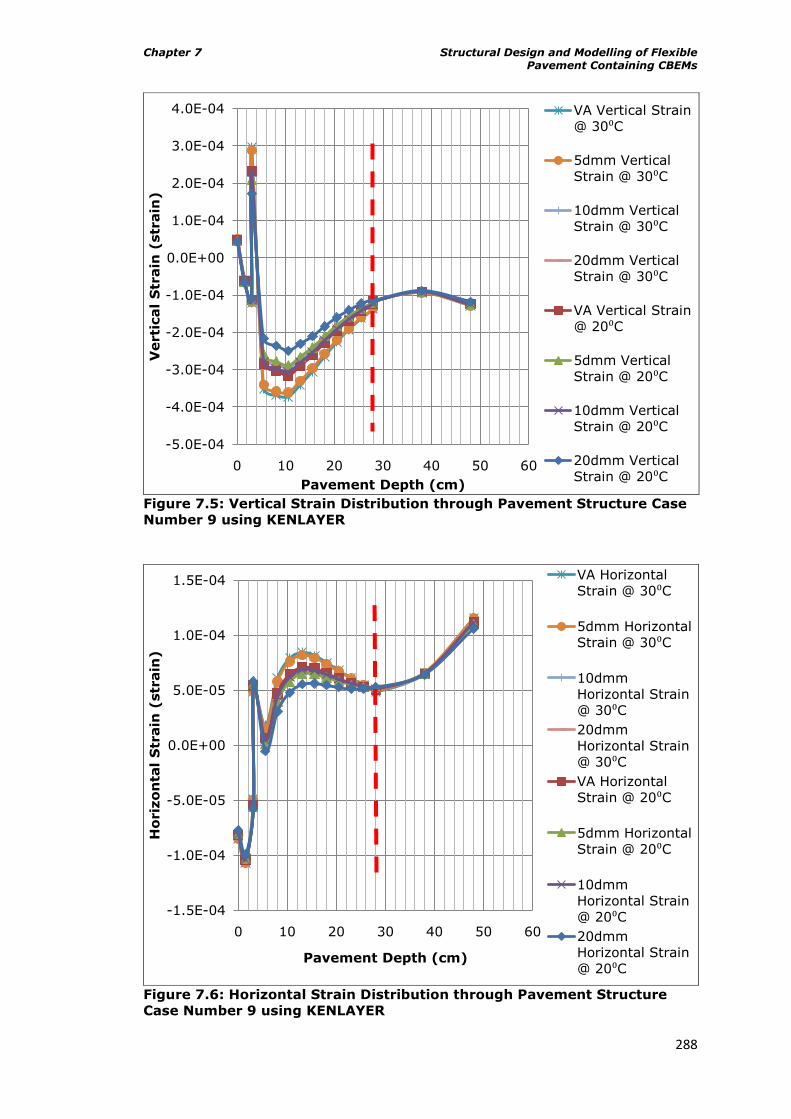
Chapter 7 Structural Design and Modelling of Flexible Pavement Containing CBEMs
288
Figure 7.5: Vertical Strain Distribution through Pavement Structure Case
Number 9 using KENLAYER
Figure 7.6: Horizontal Strain Distribution through Pavement Structure
Case Number 9 using KENLAYER
-5.0E-04
-4.0E-04
-3.0E-04
-2.0E-04
-1.0E-04
0.0E+00
1.0E-04
2.0E-04
3.0E-04
4.0E-04
0 10 20 30 40 50 60
Verti
cal
Str
ain
(str
ain
)
Pavement Depth (cm)
VA Vertical Strain
@ 30⁰C
5dmm Vertical
Strain @ 30⁰C
10dmm Vertical
Strain @ 30⁰C
20dmm Vertical
Strain @ 30⁰C
VA Vertical Strain
@ 20⁰C
5dmm Vertical
Strain @ 20⁰C
10dmm Vertical
Strain @ 20⁰C
20dmm Vertical
Strain @ 20⁰C
-1.5E-04
-1.0E-04
-5.0E-05
0.0E+00
5.0E-05
1.0E-04
1.5E-04
0 10 20 30 40 50 60
Ho
riz
on
tal
Str
ain
(str
ain
)
Pavement Depth (cm)
VA Horizontal
Strain @ 30⁰C
5dmm Horizontal
Strain @ 30⁰C
10dmm
Horizontal Strain
@ 30⁰C
20dmm
Horizontal Strain
@ 30⁰C
VA Horizontal
Strain @ 20⁰C
5dmm Horizontal
Strain @ 20⁰C
10dmm
Horizontal Strain
@ 20⁰C
20dmm
Horizontal Strain
@ 20⁰C
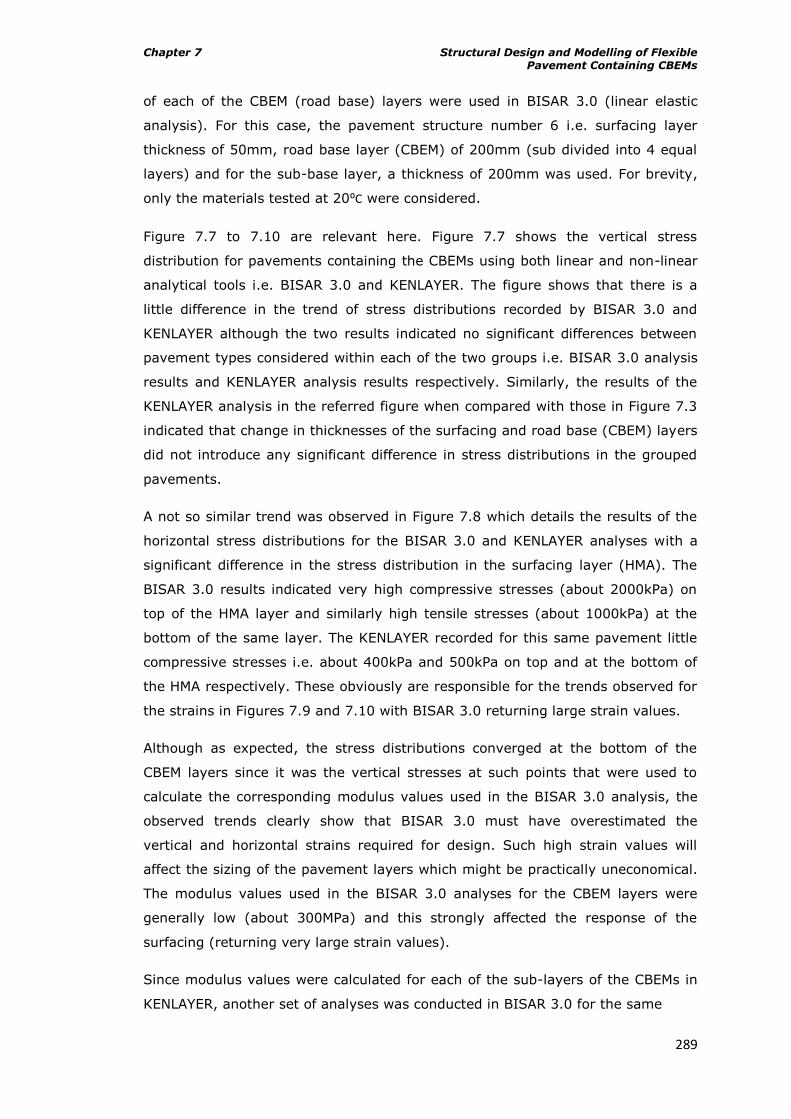
Chapter 7 Structural Design and Modelling of Flexible Pavement Containing CBEMs
289
of each of the CBEM (road base) layers were used in BISAR 3.0 (linear elastic
analysis). For this case, the pavement structure number 6 i.e. surfacing layer
thickness of 50mm, road base layer (CBEM) of 200mm (sub divided into 4 equal
layers) and for the sub-base layer, a thickness of 200mm was used. For brevity,
only the materials tested at 20⁰C were considered.
Figure 7.7 to 7.10 are relevant here. Figure 7.7 shows the vertical stress
distribution for pavements containing the CBEMs using both linear and non-linear
analytical tools i.e. BISAR 3.0 and KENLAYER. The figure shows that there is a
little difference in the trend of stress distributions recorded by BISAR 3.0 and
KENLAYER although the two results indicated no significant differences between
pavement types considered within each of the two groups i.e. BISAR 3.0 analysis
results and KENLAYER analysis results respectively. Similarly, the results of the
KENLAYER analysis in the referred figure when compared with those in Figure 7.3
indicated that change in thicknesses of the surfacing and road base (CBEM) layers
did not introduce any significant difference in stress distributions in the grouped
pavements.
A not so similar trend was observed in Figure 7.8 which details the results of the
horizontal stress distributions for the BISAR 3.0 and KENLAYER analyses with a
significant difference in the stress distribution in the surfacing layer (HMA). The
BISAR 3.0 results indicated very high compressive stresses (about 2000kPa) on
top of the HMA layer and similarly high tensile stresses (about 1000kPa) at the
bottom of the same layer. The KENLAYER recorded for this same pavement little
compressive stresses i.e. about 400kPa and 500kPa on top and at the bottom of
the HMA respectively. These obviously are responsible for the trends observed for
the strains in Figures 7.9 and 7.10 with BISAR 3.0 returning large strain values.
Although as expected, the stress distributions converged at the bottom of the
CBEM layers since it was the vertical stresses at such points that were used to
calculate the corresponding modulus values used in the BISAR 3.0 analysis, the
observed trends clearly show that BISAR 3.0 must have overestimated the
vertical and horizontal strains required for design. Such high strain values will
affect the sizing of the pavement layers which might be practically uneconomical.
The modulus values used in the BISAR 3.0 analyses for the CBEM layers were
generally low (about 300MPa) and this strongly affected the response of the
surfacing (returning very large strain values).
Since modulus values were calculated for each of the sub-layers of the CBEMs in
KENLAYER, another set of analyses was conducted in BISAR 3.0 for the same
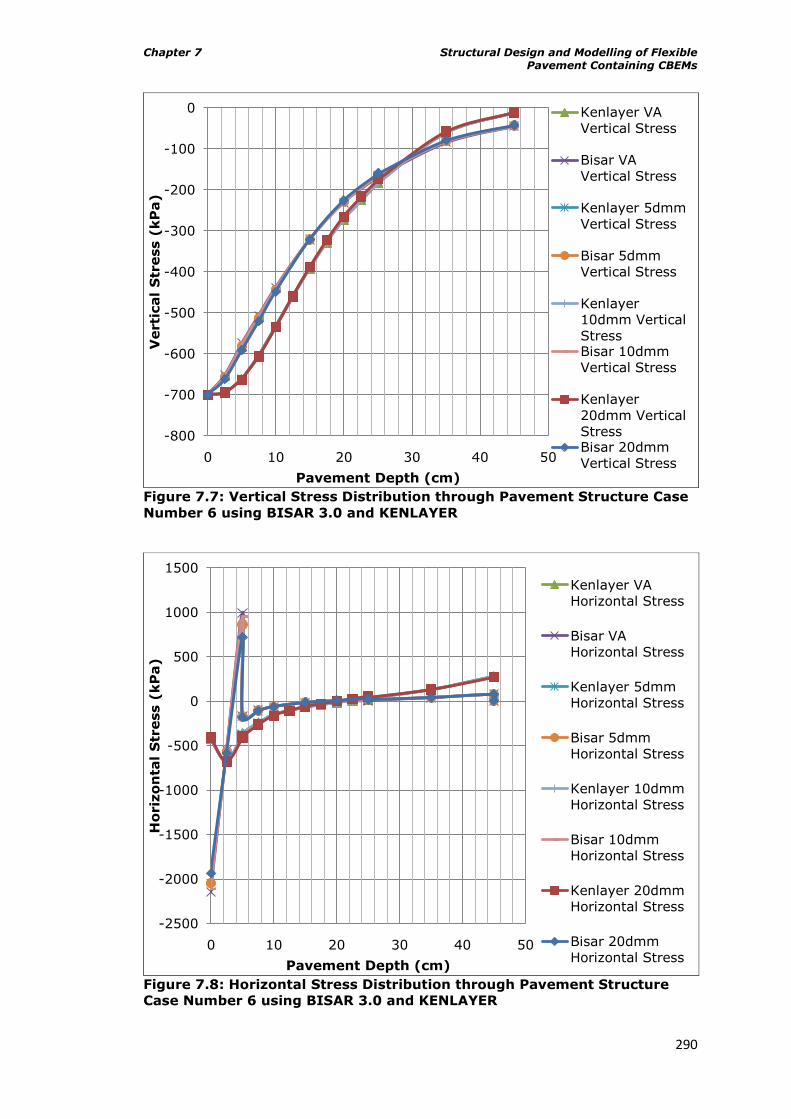
Chapter 7 Structural Design and Modelling of Flexible Pavement Containing CBEMs
290
Figure 7.7: Vertical Stress Distribution through Pavement Structure Case
Number 6 using BISAR 3.0 and KENLAYER
Figure 7.8: Horizontal Stress Distribution through Pavement Structure
Case Number 6 using BISAR 3.0 and KENLAYER
-800
-700
-600
-500
-400
-300
-200
-100
0
0 10 20 30 40 50
Verti
cal
Str
ess (
kP
a)
Pavement Depth (cm)
Kenlayer VA
Vertical Stress
Bisar VA
Vertical Stress
Kenlayer 5dmm
Vertical Stress
Bisar 5dmm
Vertical Stress
Kenlayer
10dmm Vertical
StressBisar 10dmm
Vertical Stress
Kenlayer
20dmm Vertical
StressBisar 20dmm
Vertical Stress
-2500
-2000
-1500
-1000
-500
0
500
1000
1500
0 10 20 30 40 50
Ho
riz
on
tal
Str
ess (
kP
a)
Pavement Depth (cm)
Kenlayer VA
Horizontal Stress
Bisar VA
Horizontal Stress
Kenlayer 5dmm
Horizontal Stress
Bisar 5dmm
Horizontal Stress
Kenlayer 10dmm
Horizontal Stress
Bisar 10dmm
Horizontal Stress
Kenlayer 20dmm
Horizontal Stress
Bisar 20dmm
Horizontal Stress
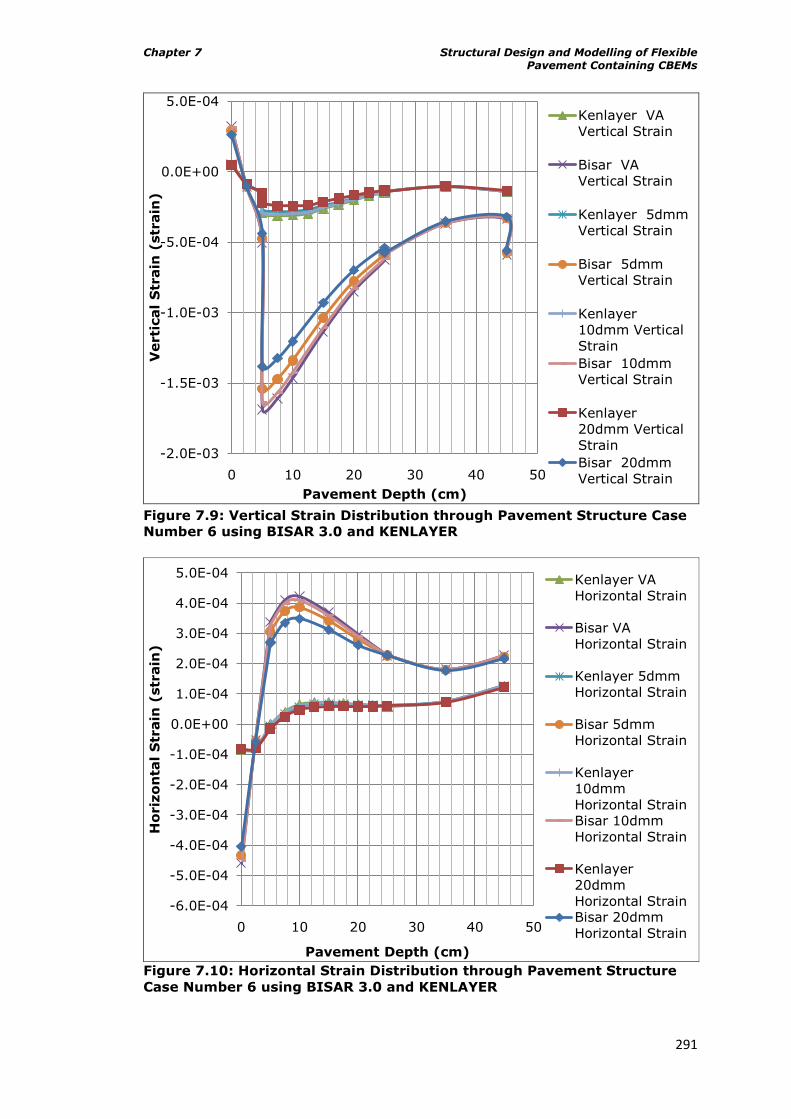
Chapter 7 Structural Design and Modelling of Flexible Pavement Containing CBEMs
291
Figure 7.9: Vertical Strain Distribution through Pavement Structure Case
Number 6 using BISAR 3.0 and KENLAYER
Figure 7.10: Horizontal Strain Distribution through Pavement Structure
Case Number 6 using BISAR 3.0 and KENLAYER
-2.0E-03
-1.5E-03
-1.0E-03
-5.0E-04
0.0E+00
5.0E-04
0 10 20 30 40 50
Verti
cal
Str
ain
(str
ain
)
Pavement Depth (cm)
Kenlayer VA
Vertical Strain
Bisar VA
Vertical Strain
Kenlayer 5dmm
Vertical Strain
Bisar 5dmm
Vertical Strain
Kenlayer
10dmm Vertical
Strain
Bisar 10dmm
Vertical Strain
Kenlayer
20dmm Vertical
Strain
Bisar 20dmm
Vertical Strain
-6.0E-04
-5.0E-04
-4.0E-04
-3.0E-04
-2.0E-04
-1.0E-04
0.0E+00
1.0E-04
2.0E-04
3.0E-04
4.0E-04
5.0E-04
0 10 20 30 40 50
Ho
riz
on
tal
Str
ain
(str
ain
)
Pavement Depth (cm)
Kenlayer VA
Horizontal Strain
Bisar VA
Horizontal Strain
Kenlayer 5dmm
Horizontal Strain
Bisar 5dmm
Horizontal Strain
Kenlayer
10dmm
Horizontal StrainBisar 10dmm
Horizontal Strain
Kenlayer
20dmm
Horizontal StrainBisar 20dmm
Horizontal Strain
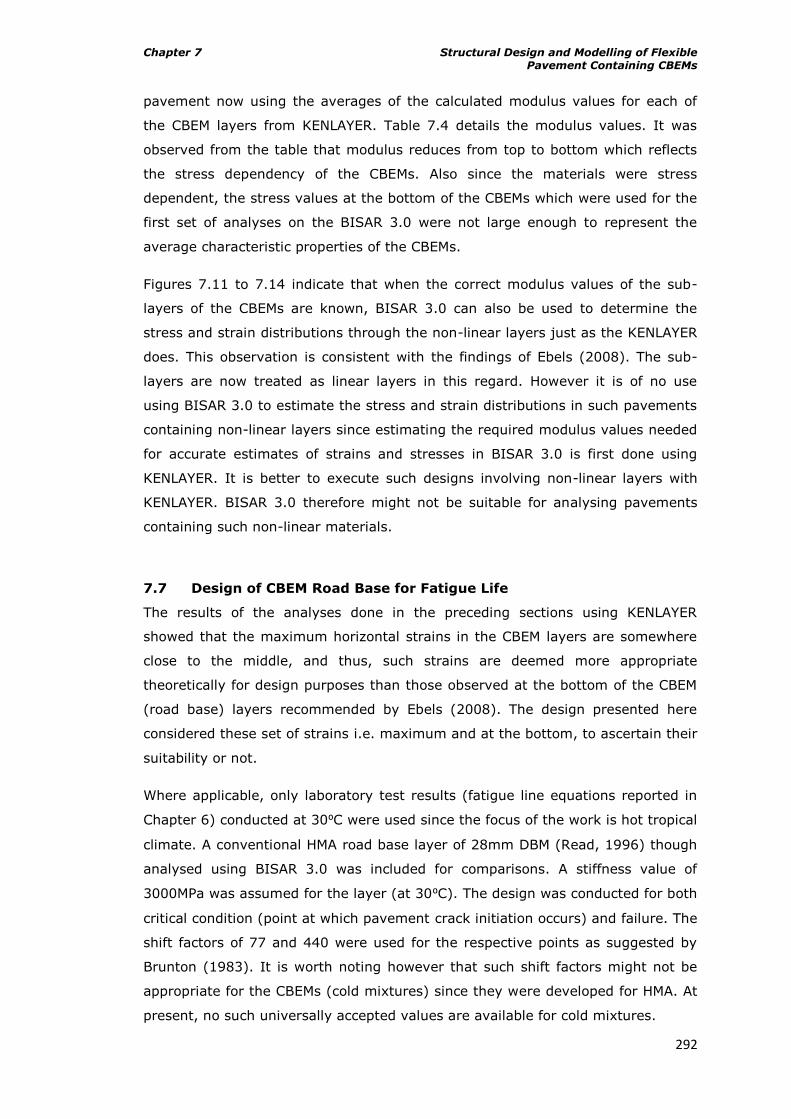
Chapter 7 Structural Design and Modelling of Flexible Pavement Containing CBEMs
292
pavement now using the averages of the calculated modulus values for each of
the CBEM layers from KENLAYER. Table 7.4 details the modulus values. It was
observed from the table that modulus reduces from top to bottom which reflects
the stress dependency of the CBEMs. Also since the materials were stress
dependent, the stress values at the bottom of the CBEMs which were used for the
first set of analyses on the BISAR 3.0 were not large enough to represent the
average characteristic properties of the CBEMs.
Figures 7.11 to 7.14 indicate that when the correct modulus values of the sub-
layers of the CBEMs are known, BISAR 3.0 can also be used to determine the
stress and strain distributions through the non-linear layers just as the KENLAYER
does. This observation is consistent with the findings of Ebels (2008). The sub-
layers are now treated as linear layers in this regard. However it is of no use
using BISAR 3.0 to estimate the stress and strain distributions in such pavements
containing non-linear layers since estimating the required modulus values needed
for accurate estimates of strains and stresses in BISAR 3.0 is first done using
KENLAYER. It is better to execute such designs involving non-linear layers with
KENLAYER. BISAR 3.0 therefore might not be suitable for analysing pavements
containing such non-linear materials.
7.7 Design of CBEM Road Base for Fatigue Life
The results of the analyses done in the preceding sections using KENLAYER
showed that the maximum horizontal strains in the CBEM layers are somewhere
close to the middle, and thus, such strains are deemed more appropriate
theoretically for design purposes than those observed at the bottom of the CBEM
(road base) layers recommended by Ebels (2008). The design presented here
considered these set of strains i.e. maximum and at the bottom, to ascertain their
suitability or not.
Where applicable, only laboratory test results (fatigue line equations reported in
Chapter 6) conducted at 30⁰C were used since the focus of the work is hot tropical
climate. A conventional HMA road base layer of 28mm DBM (Read, 1996) though
analysed using BISAR 3.0 was included for comparisons. A stiffness value of
3000MPa was assumed for the layer (at 30⁰C). The design was conducted for both
critical condition (point at which pavement crack initiation occurs) and failure. The
shift factors of 77 and 440 were used for the respective points as suggested by
Brunton (1983). It is worth noting however that such shift factors might not be
appropriate for the CBEMs (cold mixtures) since they were developed for HMA. At
present, no such universally accepted values are available for cold mixtures.
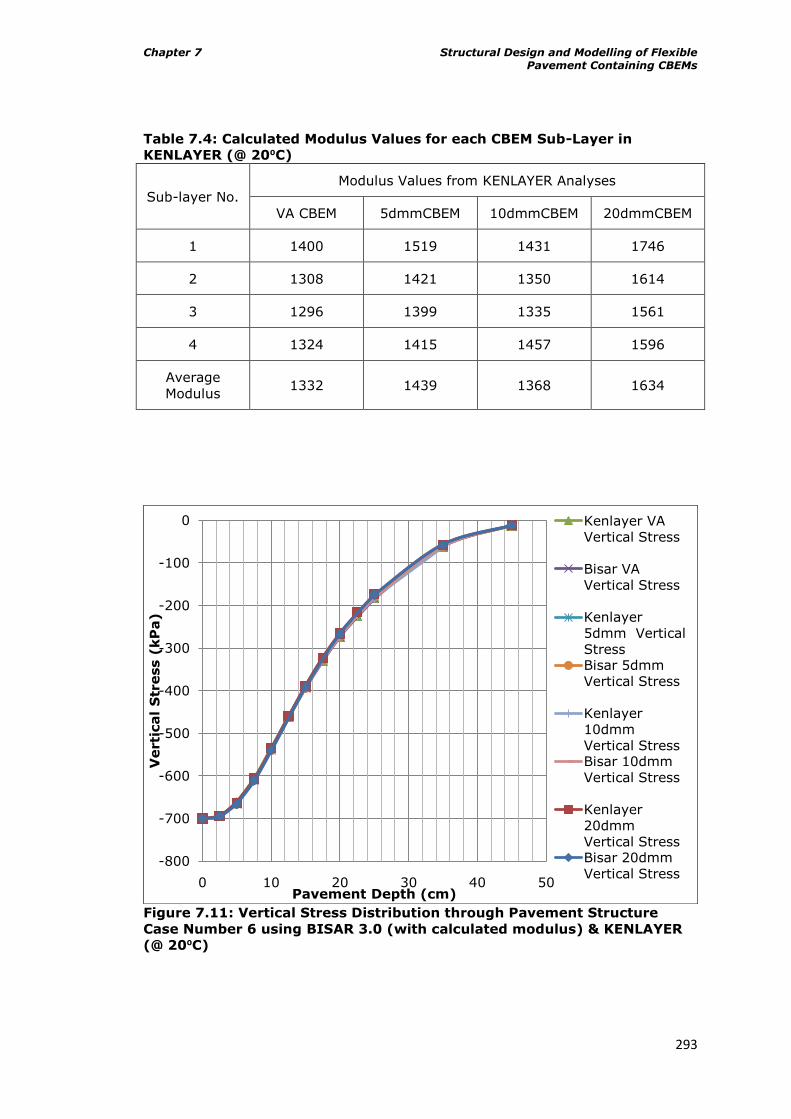
Chapter 7 Structural Design and Modelling of Flexible Pavement Containing CBEMs
293
Table 7.4: Calculated Modulus Values for each CBEM Sub-Layer in
KENLAYER (@ 20⁰C)
Sub-layer No.
Modulus Values from KENLAYER Analyses
VA CBEM 5dmmCBEM 10dmmCBEM 20dmmCBEM
1 1400 1519 1431 1746
2 1308 1421 1350 1614
3 1296 1399 1335 1561
4 1324 1415 1457 1596
Average
Modulus 1332 1439 1368 1634
Figure 7.11: Vertical Stress Distribution through Pavement Structure
Case Number 6 using BISAR 3.0 (with calculated modulus) & KENLAYER
(@ 20⁰C)
-800
-700
-600
-500
-400
-300
-200
-100
0
0 10 20 30 40 50
Verti
cal
Str
ess (
kP
a)
Pavement Depth (cm)
Kenlayer VA
Vertical Stress
Bisar VA
Vertical Stress
Kenlayer
5dmm Vertical
StressBisar 5dmm
Vertical Stress
Kenlayer
10dmm
Vertical StressBisar 10dmm
Vertical Stress
Kenlayer
20dmm
Vertical StressBisar 20dmm
Vertical Stress
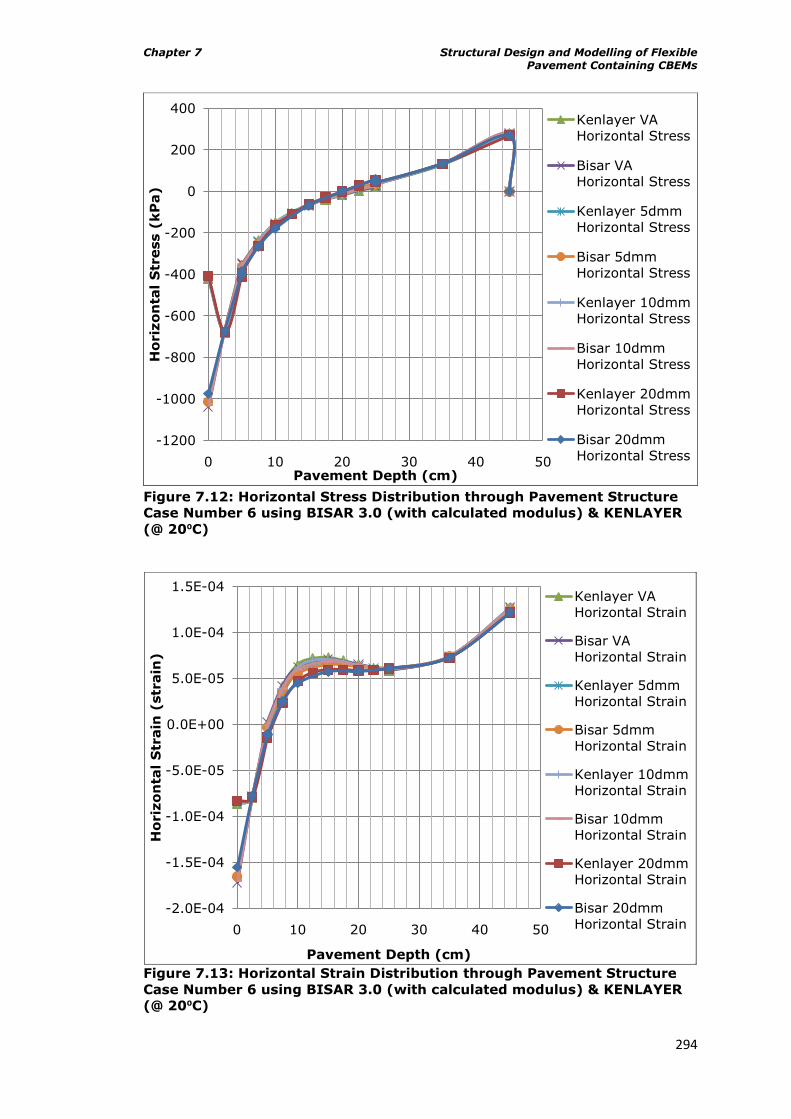
Chapter 7 Structural Design and Modelling of Flexible Pavement Containing CBEMs
294
Figure 7.12: Horizontal Stress Distribution through Pavement Structure
Case Number 6 using BISAR 3.0 (with calculated modulus) & KENLAYER
(@ 20⁰C)
Figure 7.13: Horizontal Strain Distribution through Pavement Structure
Case Number 6 using BISAR 3.0 (with calculated modulus) & KENLAYER
(@ 20⁰C)
-1200
-1000
-800
-600
-400
-200
0
200
400
0 10 20 30 40 50
Ho
riz
on
tal
Str
ess (
kP
a)
Pavement Depth (cm)
Kenlayer VA
Horizontal Stress
Bisar VA
Horizontal Stress
Kenlayer 5dmm
Horizontal Stress
Bisar 5dmm
Horizontal Stress
Kenlayer 10dmm
Horizontal Stress
Bisar 10dmm
Horizontal Stress
Kenlayer 20dmm
Horizontal Stress
Bisar 20dmm
Horizontal Stress
-2.0E-04
-1.5E-04
-1.0E-04
-5.0E-05
0.0E+00
5.0E-05
1.0E-04
1.5E-04
0 10 20 30 40 50
Ho
riz
on
tal
Str
ain
(str
ain
)
Pavement Depth (cm)
Kenlayer VA
Horizontal Strain
Bisar VA
Horizontal Strain
Kenlayer 5dmm
Horizontal Strain
Bisar 5dmm
Horizontal Strain
Kenlayer 10dmm
Horizontal Strain
Bisar 10dmm
Horizontal Strain
Kenlayer 20dmm
Horizontal Strain
Bisar 20dmm
Horizontal Strain
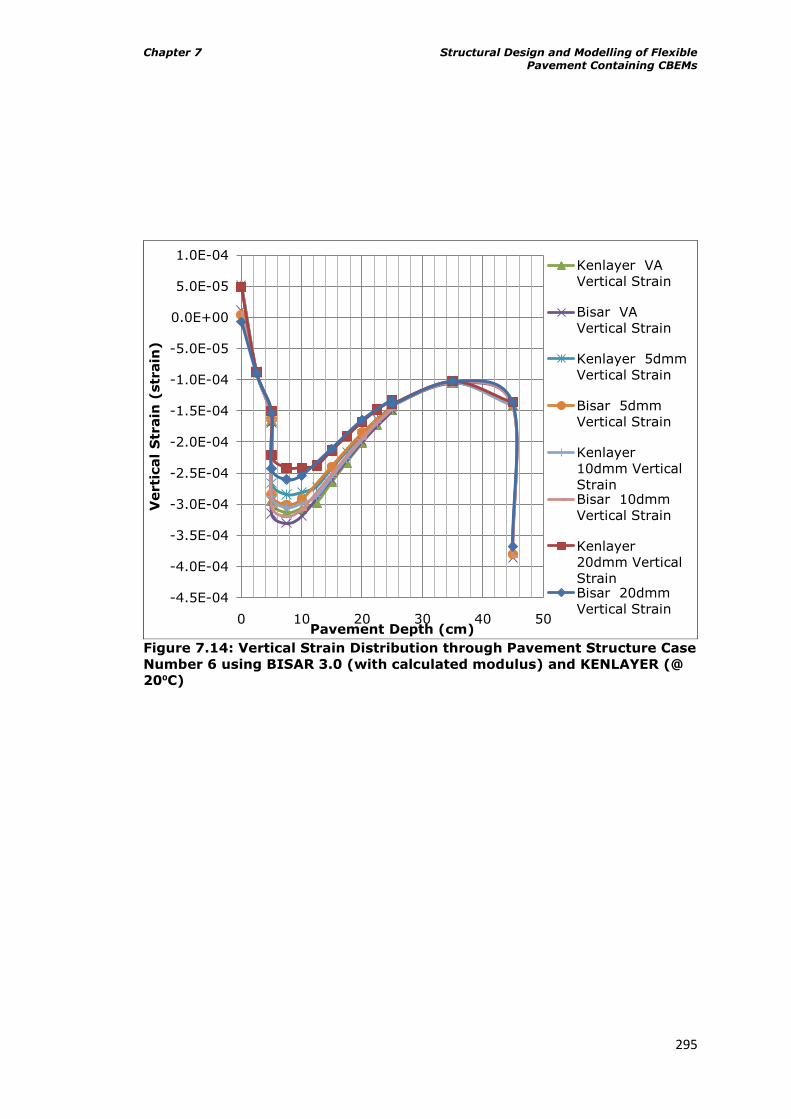
Chapter 7 Structural Design and Modelling of Flexible Pavement Containing CBEMs
295
Figure 7.14: Vertical Strain Distribution through Pavement Structure Case
Number 6 using BISAR 3.0 (with calculated modulus) and KENLAYER (@
20⁰C)
-4.5E-04
-4.0E-04
-3.5E-04
-3.0E-04
-2.5E-04
-2.0E-04
-1.5E-04
-1.0E-04
-5.0E-05
0.0E+00
5.0E-05
1.0E-04
0 10 20 30 40 50
Verti
cal
Str
ain
(str
ain
)
Pavement Depth (cm)
Kenlayer VA
Vertical Strain
Bisar VA
Vertical Strain
Kenlayer 5dmm
Vertical Strain
Bisar 5dmm
Vertical Strain
Kenlayer
10dmm Vertical
StrainBisar 10dmm
Vertical Strain
Kenlayer
20dmm Vertical
StrainBisar 20dmm
Vertical Strain
Chapter 7 Structural Design and Modelling of Flexible Pavement Containing CBEMs
296
While the 440 value for life to failure might be too high, 77 may be too low to
describe total pavement life. Considering the fact that cold mixtures are not as
good as HMA as observed in this thesis, it is believed that the appropriate value
for life to failure should be somewhere in-between these two values. Thus, the
results presented here are just estimates and can only be used with caution.
Figures 7.15a to 7.17 detail design charts based on horizontal strains at the
bottom of the CBEM layers and are the results for equivalent standard axle loads
(ESALs) to critical condition. Figures 7.18 to 7.21 show design charts based on
maximum horizontal strains in the CBEM layers and are similarly the results for
ESAL to critical condition. The surfacing layer thicknesses used were 30mm,
50mm, 75mm and 100mm. The road base layer thicknesses used were 150mm,
200mm, 250mm and 300mm.
For cases where horizontal strains at the bottom of the CBEM layers were used,
the results clearly indicate that as CBEM layer thickness increases, fatigue lives
(to critical or failure point) increase. This was similarly observed for the HMA
28mm DBM layer although with better responses in life to thickness increases.
The results also indicate that changes in the surfacing layer thickness do not
cause significant improvement to the fatigue lives of the CBEM road base layers
compared to the HMA. Of all the CBEM materials considered for the road base
layer, the 5dmmCBEM had the best performance while the VACBEM had the worst
performance. Reasons behind the performance of the 5dmmCBEM here have been
fully discussed in Chapter 6. All the RAP CBEMs and the HMA 28mm DBM had
fatigue lives clearly above 1 million ESALS applications for failure and 0.1 million
for critical condition irrespective of the layer thickness.
Except for ranking the CBEMs in the same order as observed for horizontal strains
at the bottom of the CBEM layers, the results for using maximum horizontal
strains in the CBEM layers as indicated in Figures 7.18 to 7.21 show that changes
in surfacing and CBEM layers‟ thicknesses were of no effect on the fatigue lives of
the CBEM layers. This indeed must be responsible for the earlier mentioned
recommendation of Ebels (2008) that strains at the bottom be used for such
design purposes since increase in thicknesses of the CBEM layers as earlier
observed in Figures 7.15a to 7.17 caused an increase in their fatigue lives.
Although not reported in this thesis, similar observations were noted for the
rutting lives of the CBEMs using maximum vertical strains in the CBEM layers.
However, rather than using the horizontal strains at the bottom of the CBEM layer
for fatigue design lives which are lower than the maximum which is not common
in practice, it is not advisable to use the fatigue and rutting lives of the
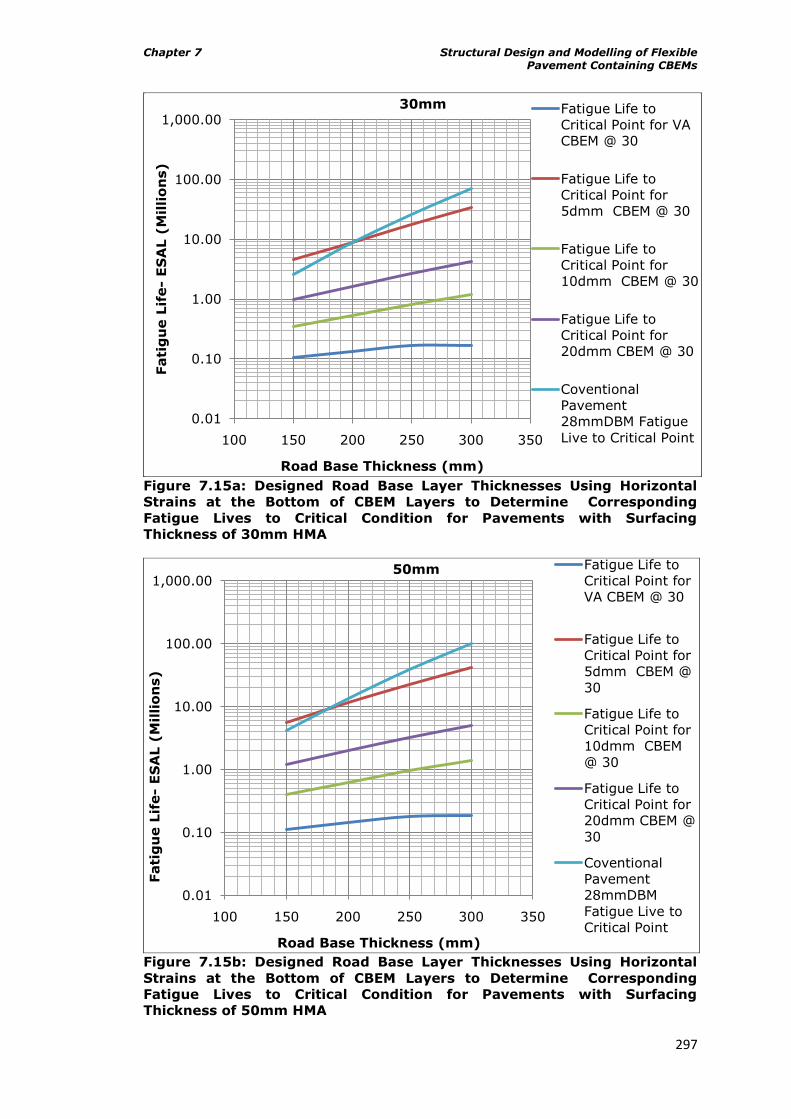
Chapter 7 Structural Design and Modelling of Flexible Pavement Containing CBEMs
297
Figure 7.15a: Designed Road Base Layer Thicknesses Using Horizontal
Strains at the Bottom of CBEM Layers to Determine Corresponding
Fatigue Lives to Critical Condition for Pavements with Surfacing
Thickness of 30mm HMA
Figure 7.15b: Designed Road Base Layer Thicknesses Using Horizontal
Strains at the Bottom of CBEM Layers to Determine Corresponding
Fatigue Lives to Critical Condition for Pavements with Surfacing
Thickness of 50mm HMA
0.01
0.10
1.00
10.00
100.00
1,000.00
100 150 200 250 300 350
Fati
gu
e L
ife-
ES
AL (
Millio
ns)
Road Base Thickness (mm)
30mm Fatigue Life to
Critical Point for VA
CBEM @ 30
Fatigue Life to
Critical Point for
5dmm CBEM @ 30
Fatigue Life to
Critical Point for
10dmm CBEM @ 30
Fatigue Life to
Critical Point for
20dmm CBEM @ 30
Coventional
Pavement
28mmDBM Fatigue
Live to Critical Point
0.01
0.10
1.00
10.00
100.00
1,000.00
100 150 200 250 300 350
Fati
gu
e L
ife-
ES
AL (
Millio
ns)
Road Base Thickness (mm)
50mm Fatigue Life to
Critical Point for
VA CBEM @ 30
Fatigue Life to
Critical Point for
5dmm CBEM @
30
Fatigue Life to
Critical Point for
10dmm CBEM
@ 30
Fatigue Life to
Critical Point for
20dmm CBEM @
30
Coventional
Pavement
28mmDBM
Fatigue Live to
Critical Point
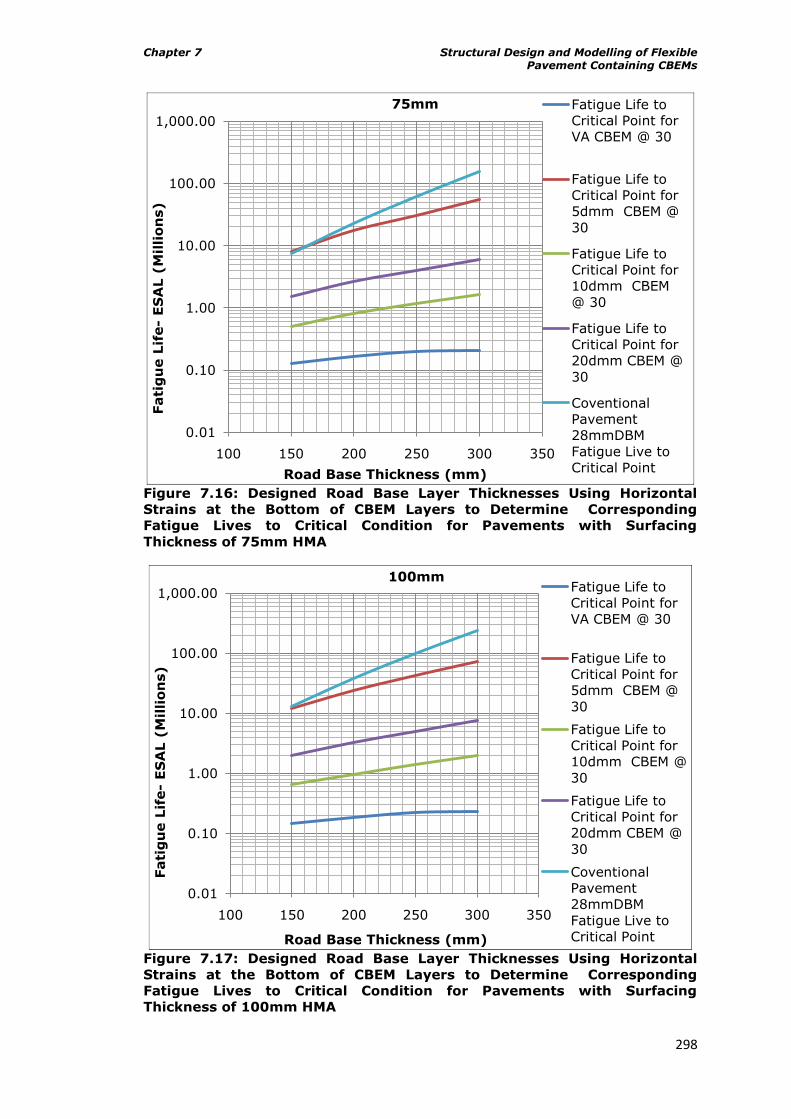
Chapter 7 Structural Design and Modelling of Flexible Pavement Containing CBEMs
298
Figure 7.16: Designed Road Base Layer Thicknesses Using Horizontal
Strains at the Bottom of CBEM Layers to Determine Corresponding
Fatigue Lives to Critical Condition for Pavements with Surfacing
Thickness of 75mm HMA
Figure 7.17: Designed Road Base Layer Thicknesses Using Horizontal
Strains at the Bottom of CBEM Layers to Determine Corresponding
Fatigue Lives to Critical Condition for Pavements with Surfacing
Thickness of 100mm HMA
0.01
0.10
1.00
10.00
100.00
1,000.00
100 150 200 250 300 350
Fati
gu
e L
ife-
ES
AL (
Millio
ns)
Road Base Thickness (mm)
75mm Fatigue Life to
Critical Point for
VA CBEM @ 30
Fatigue Life to
Critical Point for
5dmm CBEM @
30
Fatigue Life to
Critical Point for
10dmm CBEM
@ 30
Fatigue Life to
Critical Point for
20dmm CBEM @
30
Coventional
Pavement
28mmDBM
Fatigue Live to
Critical Point
0.01
0.10
1.00
10.00
100.00
1,000.00
100 150 200 250 300 350
Fati
gu
e L
ife-
ES
AL (
Millio
ns)
Road Base Thickness (mm)
100mmFatigue Life to
Critical Point for
VA CBEM @ 30
Fatigue Life to
Critical Point for
5dmm CBEM @
30
Fatigue Life to
Critical Point for
10dmm CBEM @
30
Fatigue Life to
Critical Point for
20dmm CBEM @
30
Coventional
Pavement
28mmDBM
Fatigue Live to
Critical Point
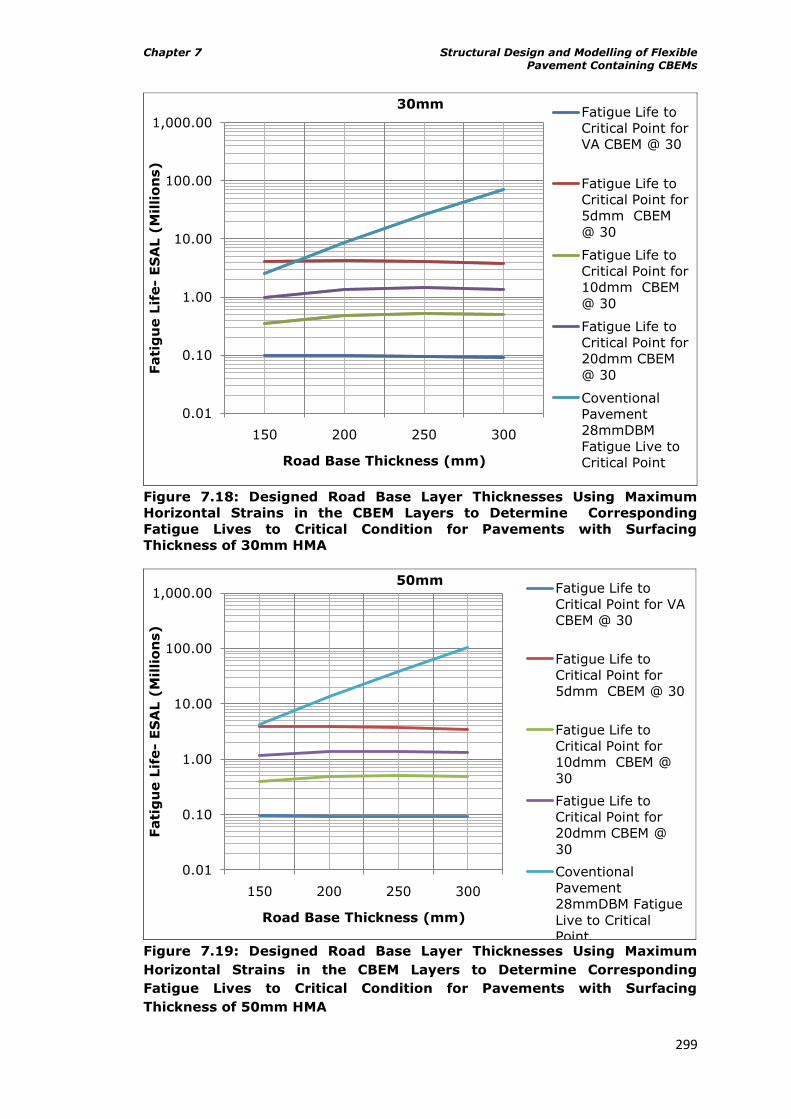
Chapter 7 Structural Design and Modelling of Flexible Pavement Containing CBEMs
299
Figure 7.18: Designed Road Base Layer Thicknesses Using Maximum
Horizontal Strains in the CBEM Layers to Determine Corresponding
Fatigue Lives to Critical Condition for Pavements with Surfacing
Thickness of 30mm HMA
Figure 7.19: Designed Road Base Layer Thicknesses Using Maximum
Horizontal Strains in the CBEM Layers to Determine Corresponding
Fatigue Lives to Critical Condition for Pavements with Surfacing
Thickness of 50mm HMA
0.01
0.10
1.00
10.00
100.00
1,000.00
150 200 250 300
Fati
gu
e L
ife-
ES
AL (
Millio
ns)
Road Base Thickness (mm)
30mmFatigue Life to
Critical Point for
VA CBEM @ 30
Fatigue Life to
Critical Point for
5dmm CBEM
@ 30
Fatigue Life to
Critical Point for
10dmm CBEM
@ 30
Fatigue Life to
Critical Point for
20dmm CBEM
@ 30
Coventional
Pavement
28mmDBM
Fatigue Live to
Critical Point
0.01
0.10
1.00
10.00
100.00
1,000.00
150 200 250 300
Fati
gu
e L
ife-
ES
AL (
Millio
ns)
Road Base Thickness (mm)
50mmFatigue Life to
Critical Point for VA
CBEM @ 30
Fatigue Life to
Critical Point for
5dmm CBEM @ 30
Fatigue Life to
Critical Point for
10dmm CBEM @
30
Fatigue Life to
Critical Point for
20dmm CBEM @
30
Coventional
Pavement
28mmDBM Fatigue
Live to Critical
Point
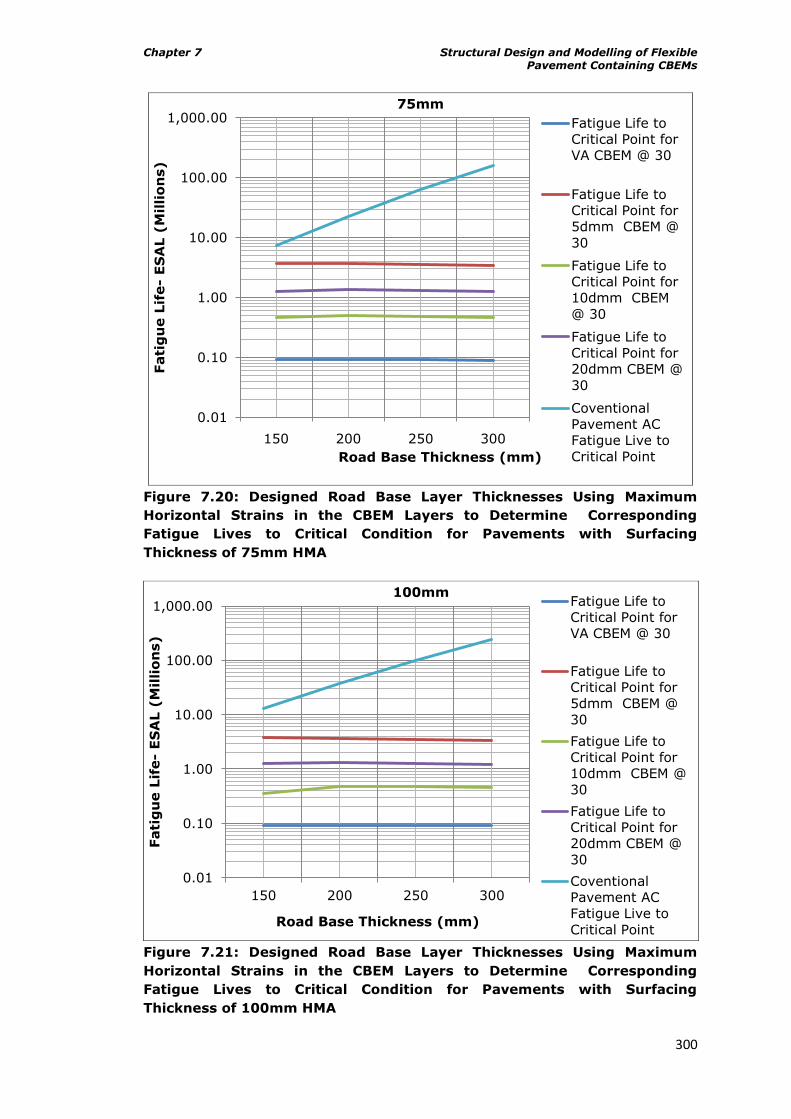
Chapter 7 Structural Design and Modelling of Flexible Pavement Containing CBEMs
300
Figure 7.20: Designed Road Base Layer Thicknesses Using Maximum
Horizontal Strains in the CBEM Layers to Determine Corresponding
Fatigue Lives to Critical Condition for Pavements with Surfacing
Thickness of 75mm HMA
Figure 7.21: Designed Road Base Layer Thicknesses Using Maximum
Horizontal Strains in the CBEM Layers to Determine Corresponding
Fatigue Lives to Critical Condition for Pavements with Surfacing
Thickness of 100mm HMA
0.01
0.10
1.00
10.00
100.00
1,000.00
150 200 250 300
Fati
gu
e L
ife-
ES
AL (
Millio
ns)
Road Base Thickness (mm)
75mm
Fatigue Life to
Critical Point for
VA CBEM @ 30
Fatigue Life to
Critical Point for
5dmm CBEM @
30
Fatigue Life to
Critical Point for
10dmm CBEM
@ 30
Fatigue Life to
Critical Point for
20dmm CBEM @
30
Coventional
Pavement AC
Fatigue Live to
Critical Point
0.01
0.10
1.00
10.00
100.00
1,000.00
150 200 250 300
Fati
gu
e L
ife-
ES
AL (
Millio
ns)
Road Base Thickness (mm)
100mmFatigue Life to
Critical Point for
VA CBEM @ 30
Fatigue Life to
Critical Point for
5dmm CBEM @
30
Fatigue Life to
Critical Point for
10dmm CBEM @
30
Fatigue Life to
Critical Point for
20dmm CBEM @
30
Coventional
Pavement AC
Fatigue Live to
Critical Point
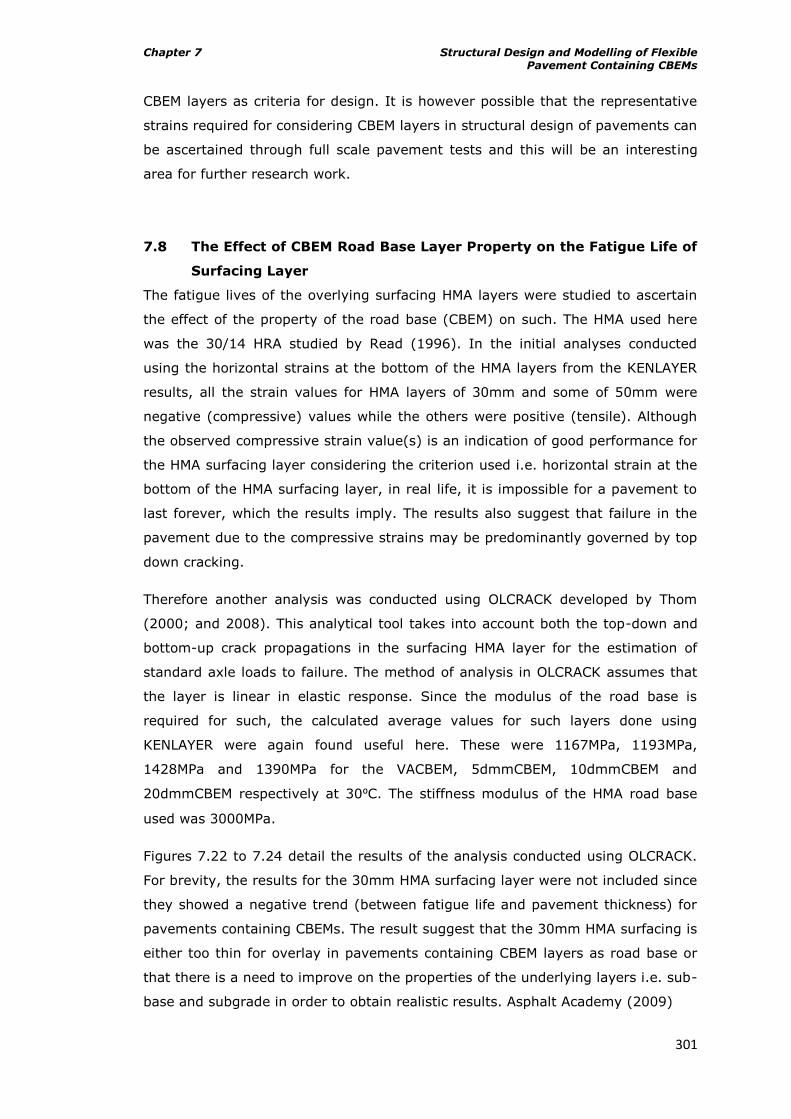
Chapter 7 Structural Design and Modelling of Flexible Pavement Containing CBEMs
301
CBEM layers as criteria for design. It is however possible that the representative
strains required for considering CBEM layers in structural design of pavements can
be ascertained through full scale pavement tests and this will be an interesting
area for further research work.
7.8 The Effect of CBEM Road Base Layer Property on the Fatigue Life of
Surfacing Layer
The fatigue lives of the overlying surfacing HMA layers were studied to ascertain
the effect of the property of the road base (CBEM) on such. The HMA used here
was the 30/14 HRA studied by Read (1996). In the initial analyses conducted
using the horizontal strains at the bottom of the HMA layers from the KENLAYER
results, all the strain values for HMA layers of 30mm and some of 50mm were
negative (compressive) values while the others were positive (tensile). Although
the observed compressive strain value(s) is an indication of good performance for
the HMA surfacing layer considering the criterion used i.e. horizontal strain at the
bottom of the HMA surfacing layer, in real life, it is impossible for a pavement to
last forever, which the results imply. The results also suggest that failure in the
pavement due to the compressive strains may be predominantly governed by top
down cracking.
Therefore another analysis was conducted using OLCRACK developed by Thom
(2000; and 2008). This analytical tool takes into account both the top-down and
bottom-up crack propagations in the surfacing HMA layer for the estimation of
standard axle loads to failure. The method of analysis in OLCRACK assumes that
the layer is linear in elastic response. Since the modulus of the road base is
required for such, the calculated average values for such layers done using
KENLAYER were again found useful here. These were 1167MPa, 1193MPa,
1428MPa and 1390MPa for the VACBEM, 5dmmCBEM, 10dmmCBEM and
20dmmCBEM respectively at 30⁰C. The stiffness modulus of the HMA road base
used was 3000MPa.
Figures 7.22 to 7.24 detail the results of the analysis conducted using OLCRACK.
For brevity, the results for the 30mm HMA surfacing layer were not included since
they showed a negative trend (between fatigue life and pavement thickness) for
pavements containing CBEMs. The result suggest that the 30mm HMA surfacing is
either too thin for overlay in pavements containing CBEM layers as road base or
that there is a need to improve on the properties of the underlying layers i.e. sub-
base and subgrade in order to obtain realistic results. Asphalt Academy (2009)
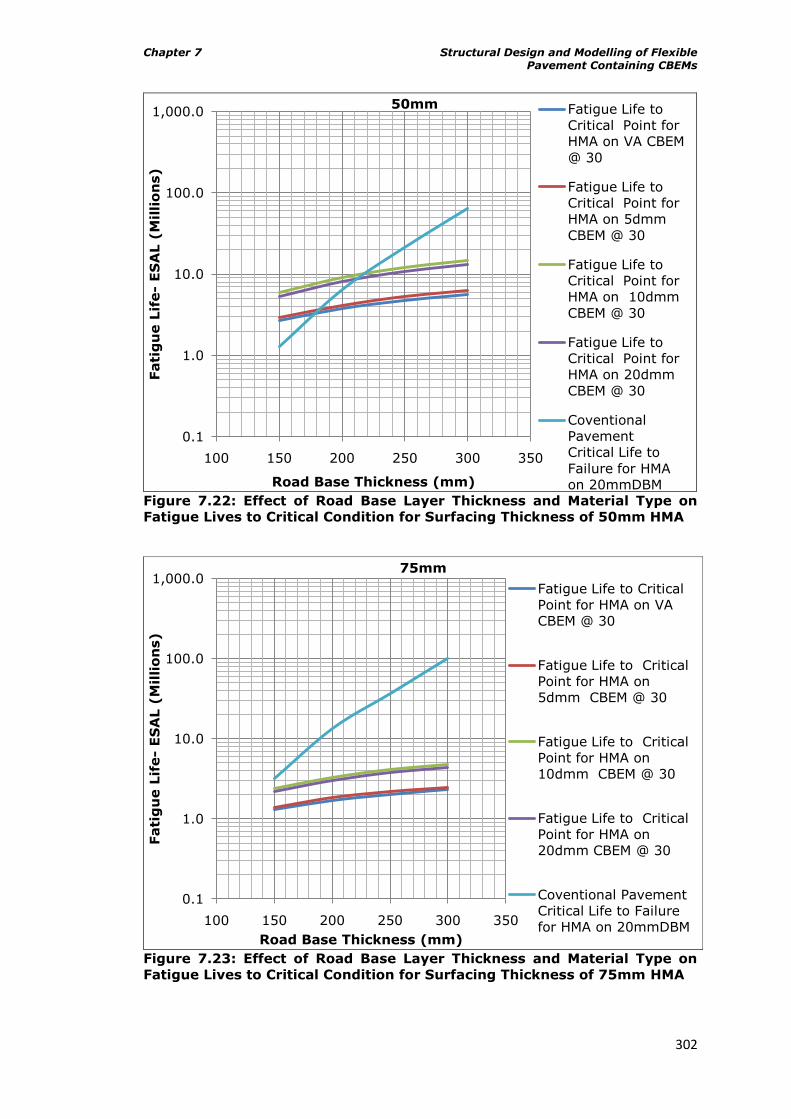
Chapter 7 Structural Design and Modelling of Flexible Pavement Containing CBEMs
302
Figure 7.22: Effect of Road Base Layer Thickness and Material Type on
Fatigue Lives to Critical Condition for Surfacing Thickness of 50mm HMA
Figure 7.23: Effect of Road Base Layer Thickness and Material Type on
Fatigue Lives to Critical Condition for Surfacing Thickness of 75mm HMA
0.1
1.0
10.0
100.0
1,000.0
100 150 200 250 300 350
Fati
gu
e L
ife-
ES
AL (
Millio
ns)
Road Base Thickness (mm)
50mm Fatigue Life to
Critical Point for
HMA on VA CBEM
@ 30
Fatigue Life to
Critical Point for
HMA on 5dmm
CBEM @ 30
Fatigue Life to
Critical Point for
HMA on 10dmm
CBEM @ 30
Fatigue Life to
Critical Point for
HMA on 20dmm
CBEM @ 30
Coventional
Pavement
Critical Life to
Failure for HMA
on 20mmDBM
0.1
1.0
10.0
100.0
1,000.0
100 150 200 250 300 350
Fati
gu
e L
ife-
ES
AL (
Millio
ns)
Road Base Thickness (mm)
75mm
Fatigue Life to Critical
Point for HMA on VA
CBEM @ 30
Fatigue Life to Critical
Point for HMA on
5dmm CBEM @ 30
Fatigue Life to Critical
Point for HMA on
10dmm CBEM @ 30
Fatigue Life to Critical
Point for HMA on
20dmm CBEM @ 30
Coventional Pavement
Critical Life to Failure
for HMA on 20mmDBM
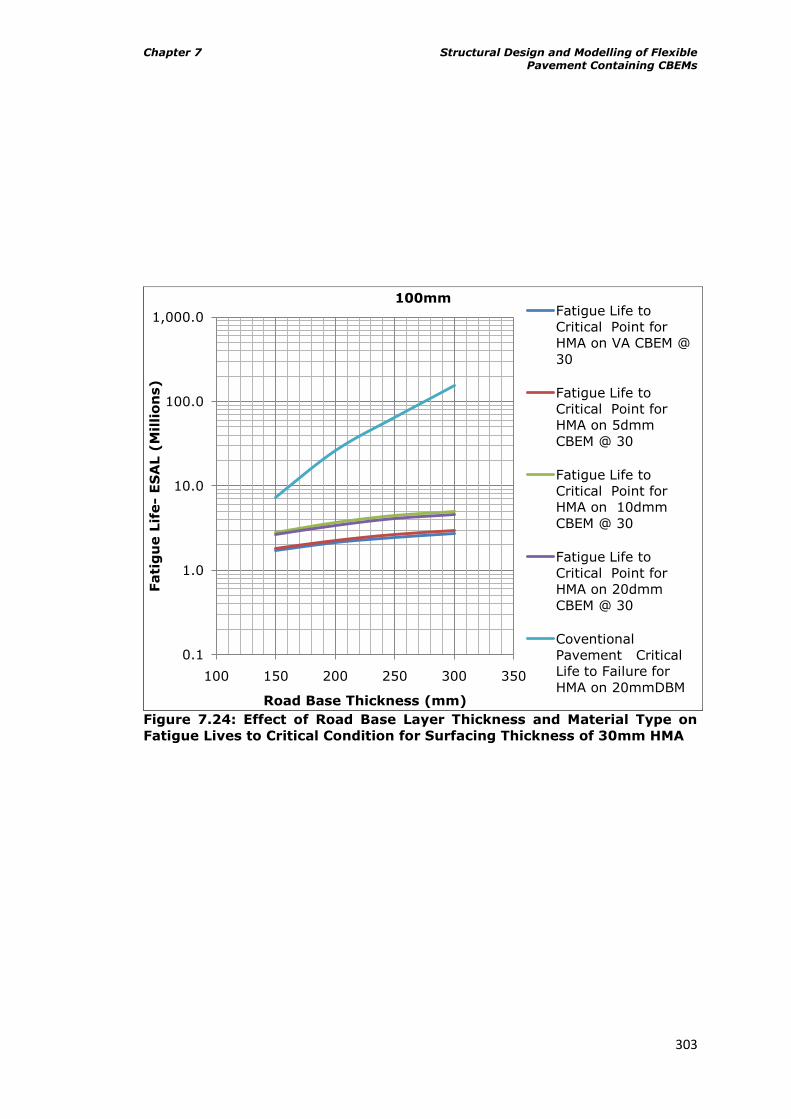
Chapter 7 Structural Design and Modelling of Flexible Pavement Containing CBEMs
303
Figure 7.24: Effect of Road Base Layer Thickness and Material Type on
Fatigue Lives to Critical Condition for Surfacing Thickness of 30mm HMA
0.1
1.0
10.0
100.0
1,000.0
100 150 200 250 300 350
Fati
gu
e L
ife-
ES
AL (
Millio
ns)
Road Base Thickness (mm)
100mmFatigue Life to
Critical Point for
HMA on VA CBEM @
30
Fatigue Life to
Critical Point for
HMA on 5dmm
CBEM @ 30
Fatigue Life to
Critical Point for
HMA on 10dmm
CBEM @ 30
Fatigue Life to
Critical Point for
HMA on 20dmm
CBEM @ 30
Coventional
Pavement Critical
Life to Failure for
HMA on 20mmDBM
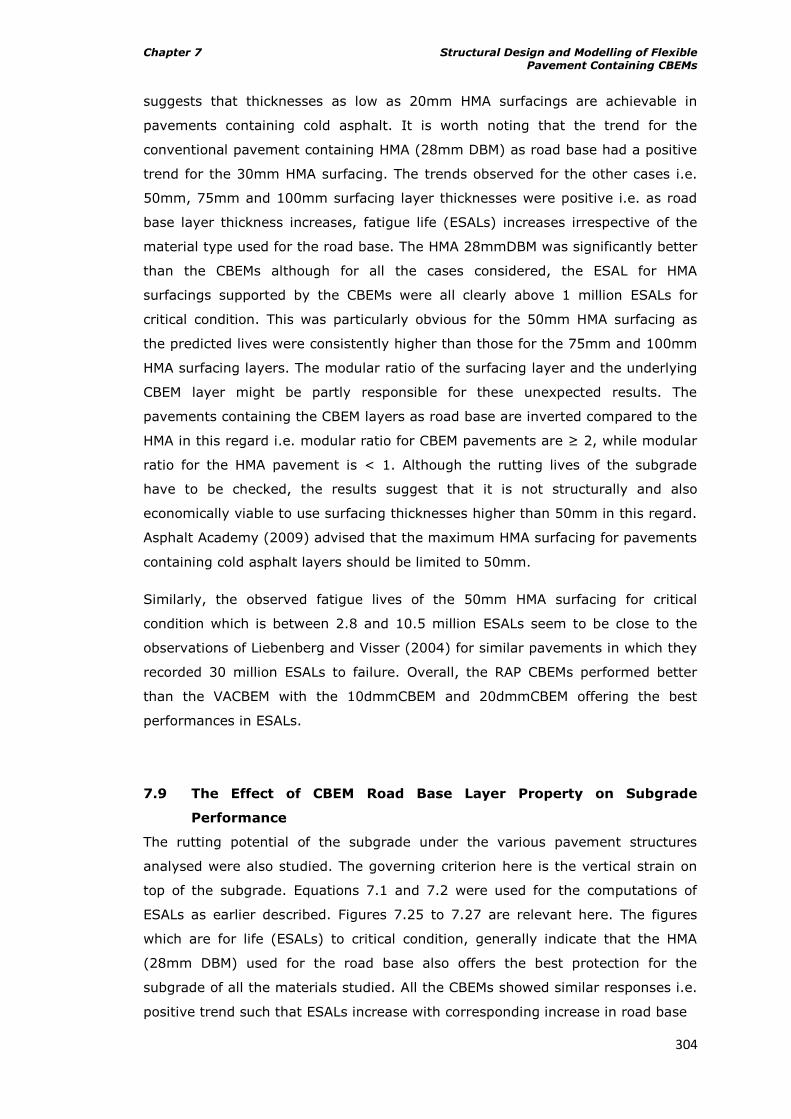
Chapter 7 Structural Design and Modelling of Flexible Pavement Containing CBEMs
304
suggests that thicknesses as low as 20mm HMA surfacings are achievable in
pavements containing cold asphalt. It is worth noting that the trend for the
conventional pavement containing HMA (28mm DBM) as road base had a positive
trend for the 30mm HMA surfacing. The trends observed for the other cases i.e.
50mm, 75mm and 100mm surfacing layer thicknesses were positive i.e. as road
base layer thickness increases, fatigue life (ESALs) increases irrespective of the
material type used for the road base. The HMA 28mmDBM was significantly better
than the CBEMs although for all the cases considered, the ESAL for HMA
surfacings supported by the CBEMs were all clearly above 1 million ESALs for
critical condition. This was particularly obvious for the 50mm HMA surfacing as
the predicted lives were consistently higher than those for the 75mm and 100mm
HMA surfacing layers. The modular ratio of the surfacing layer and the underlying
CBEM layer might be partly responsible for these unexpected results. The
pavements containing the CBEM layers as road base are inverted compared to the
HMA in this regard i.e. modular ratio for CBEM pavements are ≥ 2, while modular
ratio for the HMA pavement is < 1. Although the rutting lives of the subgrade
have to be checked, the results suggest that it is not structurally and also
economically viable to use surfacing thicknesses higher than 50mm in this regard.
Asphalt Academy (2009) advised that the maximum HMA surfacing for pavements
containing cold asphalt layers should be limited to 50mm.
Similarly, the observed fatigue lives of the 50mm HMA surfacing for critical
condition which is between 2.8 and 10.5 million ESALs seem to be close to the
observations of Liebenberg and Visser (2004) for similar pavements in which they
recorded 30 million ESALs to failure. Overall, the RAP CBEMs performed better
than the VACBEM with the 10dmmCBEM and 20dmmCBEM offering the best
performances in ESALs.
7.9 The Effect of CBEM Road Base Layer Property on Subgrade
Performance
The rutting potential of the subgrade under the various pavement structures
analysed were also studied. The governing criterion here is the vertical strain on
top of the subgrade. Equations 7.1 and 7.2 were used for the computations of
ESALs as earlier described. Figures 7.25 to 7.27 are relevant here. The figures
which are for life (ESALs) to critical condition, generally indicate that the HMA
(28mm DBM) used for the road base also offers the best protection for the
subgrade of all the materials studied. All the CBEMs showed similar responses i.e.
positive trend such that ESALs increase with corresponding increase in road base
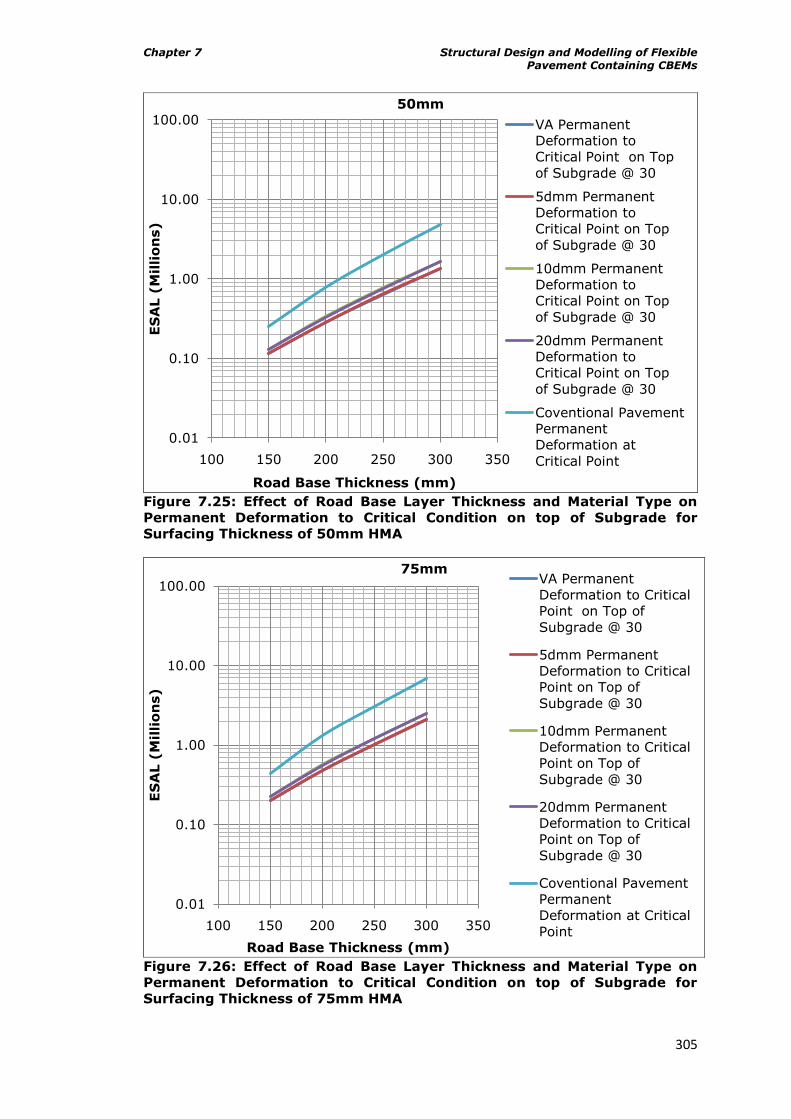
Chapter 7 Structural Design and Modelling of Flexible Pavement Containing CBEMs
305
Figure 7.25: Effect of Road Base Layer Thickness and Material Type on
Permanent Deformation to Critical Condition on top of Subgrade for
Surfacing Thickness of 50mm HMA
Figure 7.26: Effect of Road Base Layer Thickness and Material Type on
Permanent Deformation to Critical Condition on top of Subgrade for
Surfacing Thickness of 75mm HMA
0.01
0.10
1.00
10.00
100.00
100 150 200 250 300 350
ES
AL (
Millio
ns)
Road Base Thickness (mm)
50mm
VA Permanent
Deformation to
Critical Point on Top
of Subgrade @ 30
5dmm Permanent
Deformation to
Critical Point on Top
of Subgrade @ 30
10dmm Permanent
Deformation to
Critical Point on Top
of Subgrade @ 30
20dmm Permanent
Deformation to
Critical Point on Top
of Subgrade @ 30
Coventional Pavement
Permanent
Deformation at
Critical Point
0.01
0.10
1.00
10.00
100.00
100 150 200 250 300 350
ES
AL (
Millio
ns)
Road Base Thickness (mm)
75mmVA Permanent
Deformation to Critical
Point on Top of
Subgrade @ 30
5dmm Permanent
Deformation to Critical
Point on Top of
Subgrade @ 30
10dmm Permanent
Deformation to Critical
Point on Top of
Subgrade @ 30
20dmm Permanent
Deformation to Critical
Point on Top of
Subgrade @ 30
Coventional Pavement
Permanent
Deformation at Critical
Point
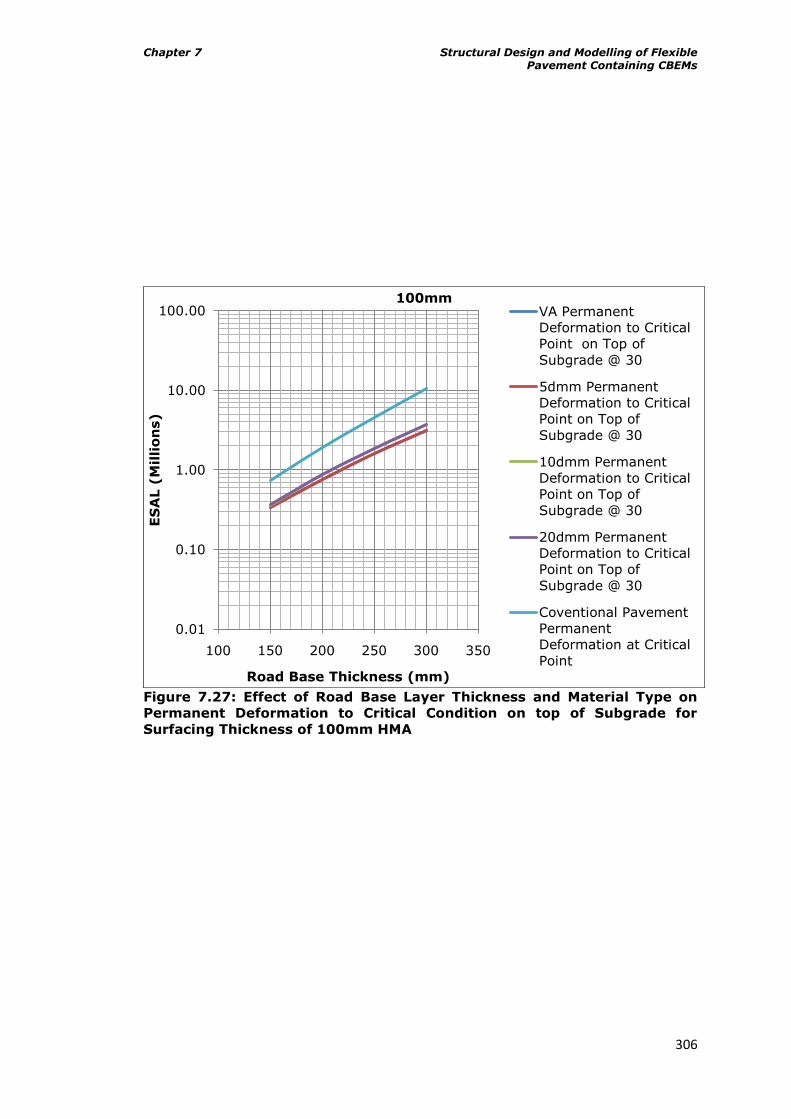
Chapter 7 Structural Design and Modelling of Flexible Pavement Containing CBEMs
306
Figure 7.27: Effect of Road Base Layer Thickness and Material Type on
Permanent Deformation to Critical Condition on top of Subgrade for
Surfacing Thickness of 100mm HMA
0.01
0.10
1.00
10.00
100.00
100 150 200 250 300 350
ES
AL (
Millio
ns)
Road Base Thickness (mm)
100mmVA Permanent
Deformation to Critical
Point on Top of
Subgrade @ 30
5dmm Permanent
Deformation to Critical
Point on Top of
Subgrade @ 30
10dmm Permanent
Deformation to Critical
Point on Top of
Subgrade @ 30
20dmm Permanent
Deformation to Critical
Point on Top of
Subgrade @ 30
Coventional Pavement
Permanent
Deformation at Critical
Point
Chapter 7 Structural Design and Modelling of Flexible Pavement Containing CBEMs
307
thickness just as was the case for the conventional pavement. Both the
20dmmCBEM and 10dmmCBEM indicated the best protection for the subgrade of
all the CBEMs studied.
The results showed that the surfacing layer had little or no significant influence on
the response of the subgrade in the limited study carried out here whereas the
road base thickness significantly influenced such responses. It is worth noting that
the ESALs to critical condition for all the cases considered here were generally low
compared to the ESALs obtained for the other parameters discussed earlier. The
subgrade life also of course depends on the stiffness properties of the sub-base
and subgrade. Although the design charts are hypothetical, they therefore
suggest that the properties of the subgrade must be improved on in order to
improve on the rutting responses of the subgrade and not necessarily the HMA
surfacing and the CBEM road base layers.
7.10 Summary
In this chapter, Structural Design and Modelling of Flexible Pavements have been
carried out. Although these examples are hypothetical in nature (sub-base and
subgrade not varied in this work), the results are good indicators for ranking the
road base materials. Along-side pavements containing CBEMs, conventional
pavements were considered for comparative analysis. The following points can be
drawn from the results obtained in this chapter:
KENLAYER though time consuming, is a good analytical tool for analysis of
flexible pavements involving non-linear elastic materials while BISAR 3.0
and OLCRACK are both good for linear elastic layers in multi-layer analysis
of flexible pavements.
Vertical stress distribution for pavements containing non-linear materials
(CBEM) is similar irrespective of material type. Strains (vertical and
horizontal) are however different.
BISAR 3.0 has the limitation that it can only give similar results for
stresses and strains as KENLAYER when the correct modulus values for
each sub-layer considered are used.
Except for ranking CBEMs, the use of maximum horizontal strains
anywhere within the CBEM layers for design purposes is not sensitive to
changes in thicknesses of the surfacing and CBEM layers. It is thus better
to focus on checking the fatigue lives of surfacing and the rutting lives of
subgrade for pavements containing CBEM layers.
Chapter 7 Structural Design and Modelling of Flexible Pavement Containing CBEMs
308
From the analysis done here and the subsequent design charts produced,
the 28mm DBM and 5dmmCBEM indicated the best fatigue lives followed
by 20dmmCBEM and 10dmmCBEM. VACBEM indicated the worst
performance.
Fatigue lives of the 50mm HMA surfacing for critical condition which is
between 2.8 and 10.5 million ESALs suggest longer lives to failure
although it is difficult to make predictions. Liebenberg and Visser (2004)
recorded 30 million ESALs to failure for similar pavements.
28mm DBM gave very good support to 30/14 HRA surfacing layer
compared to the CBEMs. A surfacing layer on HMA road base is highly
sensitive to changes in thickness of the road base compared to CBEM road
base. Such changes in HMA road bases resulted in significant increase in
ESALs.
The low stiffness values of the CBEMs did not affect their rutting resistance
since road base made of either HMA or CBEM indicated similar responses in
rutting resistance.
The analysis showed that pavements containing HMA materials as
surfacing and road base are better in performance compared to those
made with CBEMs and thus confirms the findings/views of experts in the
field.
However, with all things being equal, pavements containing 5dmmCBEM/
20dmmCBEM and probably 10dmmCBEM as road base should conveniently
accommodate about 5million ESALs before reaching the end of their
service lives. The results presented here are generally for critical
conditions, which imply failure would actually happen at larger ESALs
values than presented in the design charts produced.
The RAP CBEMs overall performed better than the VA CBEM in terms of
ESALs applications that they offer.
These RAP CBEMs would be applicable in low to medium volume traffic
scenarios as road base materials.
7.11 Conclusion
The hypothetical examples presented in this chapter showed that KENLAYER,
though time consuming, may be better than BISAR 3.0 for analysing pavements
containing CBEMs as road base layers since the materials are non linear in elastic
response. When KENLAYER seemed not to be sensitive enough in analysing the
pavements with thin surfacing layer thicknesses of 30mm for horizontal strains at
Chapter 7 Structural Design and Modelling of Flexible Pavement Containing CBEMs
309
the bottom of the surfacing layer, OLCRACK proved in this regard, though the
stiffness values calculated in the KENLAYER had to be used. However, in order for
OLCRACK to have better application in modelling pavements containing non linear
elastic layers, experimental modification reflecting the non linearity of the CBEMs
would have to be introduced to the software. OLCRACK is basically good for
estimating fatigue lives to failure for linear elastic layers in multi-layer analysis of
flexible pavements.
The fundamental design criterion arrived at in this hypothetical design exercise
was the horizontal strain at the bottom of the HMA surfacing layer for pavements
containing CBEMs as road base layer. The less fundamental design criterion was
the vertical strain on top of the subgrade. These two design criteria were chosen
since, when using them, the type and thicknesses of CBEMs were reflected in the
design ESALs. Though the result from the less fundamental criterion informs the
use of improved subbase and subgrade, the RAP CBEMs offered better protection
to the subgrade than the VACBEM. Similarly, the RAP CBEMs offered better
support to the surfacing than the VACBEM.
Other design criteria that should have complemented those earlier stated are the
fatigue and rutting lives of the CBEM layers. Common practice requires the use of
the maximum strains in the layer. Although the CBEMs seemed to have been
ranked, however, the use of such maximum strain values along with changes in
the thicknesses of the layers were of no effect on the ESALs probably because of
the modular ratio of the surfacing and CBEM layers, whereas it did for strain
values at the bottom of the CBEM layers. It is not advisable to use the fatigue and
rutting lives of the CBEM layers as design criteria for now. It is however possible
that the representative strains required for considering CBEM layers in structural
design of pavements can be ascertained through full scale pavement tests and
this will be an interesting area for further research work.
Chapter 8 Some Guidelines for the use of CBEM in Hot Tropical Climates
310
8 Some Guidelines for the use of CBEM in
Hot Tropical Climates
8.1 Overview
This chapter is deemed important to this study as it details some guidelines for
producing and using cold bituminous emulsion mixtures (CBEM) containing
severely aged reclaimed asphalt pavement (RAP) in hot tropical climate. Such
guidelines are lacking at the moment and have been identified as major barriers
preventing developing countries with hot tropical climates from integrating
recycling into their road maintenance/rehabilitation programmes. It is envisaged
that employing such methods and materials for road rehabilitation/reconstruction
would assist in stretching road funds, budgets for which in recent times have
increasingly become inadequate in such developing countries.
Although there are a number of methods for recycling RAP materials, the cold in-
plant recycling approach using bitumen emulsion has been chosen and considered
more appropriate for such countries in order to ensure good quality control of the
mixtures produced and so as not to require expensive equipments. It is by
ensuring such quality control that the full benefits of recycling can be harnessed.
This chapter essentially focuses on two fundamental issues affecting mix (job
mix), and structural design considerations for cold recycled bitumen emulsion
mixtures. These are considered germane towards achieving success for such
recycling programmes. Issues affecting construction considerations which are also
very important are well detailed by ARRA (2001), Wirtgen (2004) and Merrill et al
(2004).
8.2 Laboratory Mix Design Considerations for the Use of Cold Recycled
Bituminous Emulsion Mixtures
Mix design as earlier described in Chapter 5 of this thesis essentially entails the
formulation in the right proportions of materials (aggregate + binder + filler) that
will constitute the asphalt mixture whether cold, warm or hot mixed. While such
an exercise which involves mainly virgin materials prepared hot is straight
forward though still regarded under some circumstances as a complex material by
some researchers (Collop, 2009), the inclusion of RAP as full or partial substitute
Chapter 8 Some Guidelines for the use of CBEM in Hot Tropical Climates
311
for virgin aggregates makes the case more complex still. This is because RAP in
itself is a composite (conglomerate of aggregate and aged binder which could
even be polymer modified type) material that must be characterised and checked
for its integrity or nature before it is used in the mix. This indeed is an additional
but very important exercise most especially for developing countries where
information on the history of such reclaimed pavements might be difficult to come
by. Furthermore, it is considered important to do this even when such history is
known since RAP though depending on its nature/integrity and the percentage it
constitutes in the mix, can significantly affect/alter the overall mechanical
behaviour of the mix contrary to the desired expectations of the pavement
designer when the true nature of the RAP is not considered.
As earlier mentioned, the cold recycling ex situ (in-plant) approach chosen in this
work allows for proper assessment of RAPs before they are used. Other factors
responsible for this choice of recycling have been previously discussed in Chapter
2 of this thesis. Although factors that must be considered for pavement
recyclability have likewise been dealt with in Chapter 2 of this thesis, and
extensively in the Basic Asphalt Recycling Manual (ARRA, 2001), Wirtgen Cold
Recycling Manual (2004) and Merrill et al (2004), it is believed that this method is
applicable in both new construction and rehabilitation works. This is because cold
asphalt produced in-plant has better potential for consistency in properties
compared to the in situ approach since there is room for proper quality control.
Furthermore, cold recycling whether in situ or ex situ is almost always found
applicable where there is a major need for the improvement of structural capacity
of road pavements (ARRA, 2001), which in procedure, is closely related to new
construction.
It implies thus that once the project evaluation, economic analysis and
preliminary selection favour cold recycling, then proper pavement assessment,
structural capacity assessment, material properties assessment, traffic
assessment, constructability assessment and environmental implications as
suggested by ARRA (2001) and Wirtgen (2004) must be carried out. When all
these necessary steps have been taken, then the mix design which is the focus of
this section is conducted.
These guidelines have been produced in concert with the suggestions of ARRA
(2001), AI & AEMA (1997), Wirtgen (2004), Merrill et al (2004), Ibrahim (1998),
Thanaya (2003) and Smith and Jones (1998) just to mention a few. However they
have been done in the light of countries located in hot tropical climates. It should
also be noted that the cold asphalt materials in question here are applicable in the
Chapter 8 Some Guidelines for the use of CBEM in Hot Tropical Climates
312
construction of road base of flexible road pavements and hydraulic binders though
advantageous, have not been considered.
8.2.1 RAP Characterisation
The importance of proper RAP characterisation cannot be over emphasised
whenever RAP materials are to be used in the production of cold mixtures. This
obviously is the first step in the process of job mix design as the integrity of the
RAP is ascertained in the process. This characterisation is done by conducting a
composition analysis using relevant standards (BS598-102:2003, BSEN 933-1 and
BS598-101:2004). This will give information on the content of residual bitumen in
RAP and as well the gradation of extracted aggregates from RAP. It is advised
that the properties of the recovered bitumen be ascertained subsequently in order
to know the design approach to follow i.e. whether to treat RAP as black rock or
not. It is envisaged from the findings of this work that RAP with residual bitumen
of 5dmm penetration is active under hot tropical conditions although the extent of
the activity is difficult to quantify. A suggested method for recovering the aged
residual binder in RAP is BS EN12697-4:200. Some of the suggested tests are:
1. Physical properties of recovered bitumen from the mix
a. Penetration at 25⁰C
b. Softening point
c. Viscosity
2. If possible the stiffness properties in the form of Complex Modulus at 25⁰C
If the penetration is below 5dmm, there is no need to conduct the other tests on
the binder. The RAP should be treated as black rock i.e. as virgin aggregate.
Processing of the RAP follows i.e. crushed and screened to required sizes suitable
for a 20mm DBM as stated in ORN 31 & 19 (see Table 5.4 in Chapter 5 of this
thesis). Smith and Jones (1998) suggested that such mixes are able to give
satisfactory support to road pavements in hot tropical climates where overloading
is a problem. In order to meet the gradation requirements of 20mm DBM virgin
aggregates could be introduced to make up for the deficient sizes.
When the penetration of the residual bitumen is 5dmm and up to 20dmm, the
other tests listed above are worth conducting in order to gain a fuller
understanding of the behaviour of the residual bitumen. These are useful in
determining the proper grade of recycling additive i.e. recycling agent for the cold
recycling. However, caution must be taken in deciding on the grade of additive
(recycling agent) since the extent of possible rejuvenation or not of the residual
binder cannot be ascertained at the moment. For residual bitumen with the range
of penetration 5dmm – 20dmm, bitumen emulsion containing base bitumen of
Chapter 8 Some Guidelines for the use of CBEM in Hot Tropical Climates
313
50dmm was found suitable. Meanwhile, the determination of the gradation of the
extracted aggregate is necessary since the residual binder is considered to be
active under hot tropical conditions. It is believed that fines and fillers alike which
are trapped in residual aged bitumen begin to contribute to the properties of the
cold mixture upon the softening or possible rejuvenation of such residual aged
binder thus potentially affecting the volumetrics of the mixture. This is considered
appropriate.
The deficient sizes in the extracted aggregate from the RAP aggregates are
supplemented with virgin aggregates to suit the requirements for 20mm DBM
earlier suggested. ARRA (2001) in buttressing this cautioned that the addition of
new aggregates should not be based on the gradation of the aggregate recovered
from the RAP (RAP aggregates) alone, because coarse angular particles of
conglomerated fines can be manufactured by cold milling that are not broken
down by traffic. However, the addition of virgin aggregates can be beneficial and
justified when excess binder is present or when it is deemed desirable to increase
structural capacity of the mix. No value is given here for percentage addition of
virgin aggregates to mix since each individual project merits individual treatment.
It is similarly important to determine the particle density and water absorption
properties of both the RAP and virgin aggregates in order to make the appropriate
decision with regard to bitumen emulsion content required for the mix.
8.2.2 Considerations for the choice of bitumen emulsion
Although there are a number of recycling agents which have been successfully
used in cold recycling as discussed in Chapter 2 of this thesis, this guideline
focuses on bitumen emulsions. Factors to consider for choosing other recycling
agents have been properly addressed by ARRA (2001), Wirtgen (2004) and Merrill
et al (2004).
The choice of suitable bitumen emulsion type i.e. cationic or anionic is determined
by the aggregate type i.e. whether it is siliceous or calcareous. Cationic bitumen
emulsion is appropriate for siliceous aggregates (granite for example), and
anionic bitumen emulsion is considered appropriate for calcareous aggregates
(e.g. limestone aggregates). This is important as it strongly affects the adhesion
of the base bitumen in the emulsion to the surface of the aggregates. Medium to
slow setting emulsions are considered appropriate for hot tropical conditions so as
to guard against setting before compaction is carried out.
Chapter 8 Some Guidelines for the use of CBEM in Hot Tropical Climates
314
8.2.3 Estimation of pre-wetting water content and binder demand
Once a decision on the type of bitumen emulsion suitable for the project is taken,
the determination of the quantity of bitumen emulsion required for the mix is
next. Some important parameters are relevant here. These are pre-wetting water
content, initial emulsion content (IEC), total fluid content (TFC) and the optimum
bitumen emulsion content (OBEC) in the optimum total fluid content (OTFC).
1. The whole exercise starts by estimating the trial/initial emulsion content.
The empirical formula suggested by Asphalt Institute method (MS-14, 1989) is
considered appropriate for this thus:
P = (0.05A + 0.1B + 0.5C) x (0.7) 8.1
Where,
P= % by weight of binder demand by mass of total mixture
A= % of mineral aggregate >2.36mm
B=% of mineral aggregate <2.36 and > 0.075mm
C=% of mineral aggregate < 0.075mm
The bitumen content in the emulsion must be considered.
2. Apart from helping to activate the charges on the surface of aggregates
which enhances attraction of emulsion to the aggregates, the addition of pre-
wetting water enhances the compaction characteristics of the cold mix when
optimal values are used. Pre-wetting water is determined with due regard to the
natural moisture content of the aggregates (RAP or virgin) by determining both
the Optimum Moisture Content (OMC) and Maximum Dry Density (MDD) of the
mix using a range of moisture content (say 0-12% at convenient intervals) for the
moisture-density relationships. Though the gyratory compactor was found
suitable for this exercise other convenient methods most especially as obtained in
the modified proctor test can also be used. No specific value will be given here for
these values (OMC and MDD) since each project should be given individual
treatment.
3. Once the OMC is determined, the IEC value obtained in equation 8.1 is
used to replace the same moisture proportion in the OMC to constitute the TFC.
The difference between OMC and IEC is the pre-wetting water content. These are
simply expressed as follows:
Chapter 8 Some Guidelines for the use of CBEM in Hot Tropical Climates
315
TFC = Natural Moisture Content in Aggregates + IEC +
Pre-wetting Water Content 8.2
Further optimisation must be conducted to determine the optimum bitumen
emulsion content (OBEC) to give the optimum total fluid content (OTFC) for the
mix.
The OBEC in OTFC is determined in a similar fashion as is normally done for the
determination of OMC and MDD but now by checking the indirect tensile strength
(ITS using the Universal Testing Machine) and/or the indirect tensile stiffness
modulus (ITSM using the Nottingham Asphalt Tester - NAT) of the mixtures in dry
and wet conditions using a range of residual bitumen content (RBC). The
relationships generated in the process are the TFC – ITS and or TFC – ITSM
relationships. Meanwhile, the OBEC must be chosen giving allowance for the
absorption properties of the mix, and considering the fact that a significant
portion of the moisture will evaporate upon curing. For example, while keeping
the emulsion content constant at „P%‟ by mass of the aggregate (as empirically
determined in equation 8.1), the pre-wetting water content can be increased at
intervals of 1.0% by mass of the aggregate starting from total fluid content equal
in value to the OMC and ending at a convenient point, e.g. 10%. The procedure
followed for preparing the specimens should be such that the pre-wetting water is
first added to the dry batched mixture and then mixed using speed II on the
Hobart Mixer for 60s. The required emulsion is subsequently added and the
mixture mixed for another 60s. It is suggested that each batch of mixing should
have sufficient materials for 4 specimens. The required materials are
subsequently placed in 100mm diameter split moulds and then compacted
applying the same compactive effort. These are left in the moulds for 24hrs (in a
sealed condition) at the same ambient temperature before they are carefully
extruded.
Since the mixtures produced in the process are still very fragile even after 24hrs
curing in the mould, the produced specimens must be further cured in a forced
draft oven. Curing at 60⁰C for 96hrs is considered appropriate here for the
specimens that are tested dry to represent typical hot tropical conditions. Wet
vacuum saturated specimens at a pressure of 140mbar should be further
conditioned in water for 24hrs at 30⁰C (average maximum ambient temperature
in the tropics) and followed subsequently by further conditioning at 20⁰C (average
minimum ambient temperature in the tropics) before the ITS and ITSM tests are
conducted at 20⁰C. This procedure should fully account for the recovery potentials
of the mixture after exposure to severe conditions. Testing for ITS and ITSM at
Chapter 8 Some Guidelines for the use of CBEM in Hot Tropical Climates
316
20⁰C ranks CBEMs better than testing at 30⁰C which is the more appropriate
temperature for hot tropical conditions. The results are used to generate TFC-
ITS/ITSM, and TFC-ITSR/ITSMR relationships where the optimum total fluid
content (OTFC) is determined.
In order to determine the OBEC in the OTFC, further optimisation must be
conducted just as explained above but now keeping the OTFC constant. Ideally,
and if possible the best way of establishing this is by varying the bitumen/water
ratio in the emulsion, but since most emulsions are proprietary, varying the
emulsion/ pre-wetting water content ratio should be adopted.
4. Now that the OTFC is known, it is important to ensure that the appropriate
mixing time for the mixture is ascertained. 2-4 minutes using the sun and planet
mixer is considered adequate and similarly in a suitable Hobart mixer. For
example, in a 4-minute mixing time, the first 2minutes is used for the pre-wetting
water addition/mixing, while the remaining 2minutes is used for the bitumen
emulsion addition/mixing.
5. Further investigations must be conducted on the designed (fully optimised)
mix to ascertain its mechanical performance. The results of such will be useful for
the structural design of the layer. Of importance are the ITSM and fatigue tests. If
possible, permanent deformation and resilient modulus tests can be conducted
although not always practical. The more the traffic volume anticipated, the more
important it is to conduct these tests. With low-medium volume roads, ITSM and
fatigue tests should suffice. The durability (ageing and water susceptibility) of the
mixture must also be considered. All these will give an indication on the
performance of the mixture in service. Figure 8.1 and Table 8.1 are summarised
procedures for the cold mix design.
8.3 Structural Design of Cold Recycled Bituminous Emulsion Mix Layers
A number of methods are available for pavement structural design. These
include, catalogue design methods, structural number method, deflection based
methods and the mechanistic methods (Wirtgen, 2004). Wirtgen (2004) stated
that the use of a mechanistic pavement design method for rehabilitation works is
the most fundamentally sound approach since the method is based on
engineering principles, using the performance data developed through research
on different materials.
From the work done in this thesis, it is important to consider the non-linear elastic
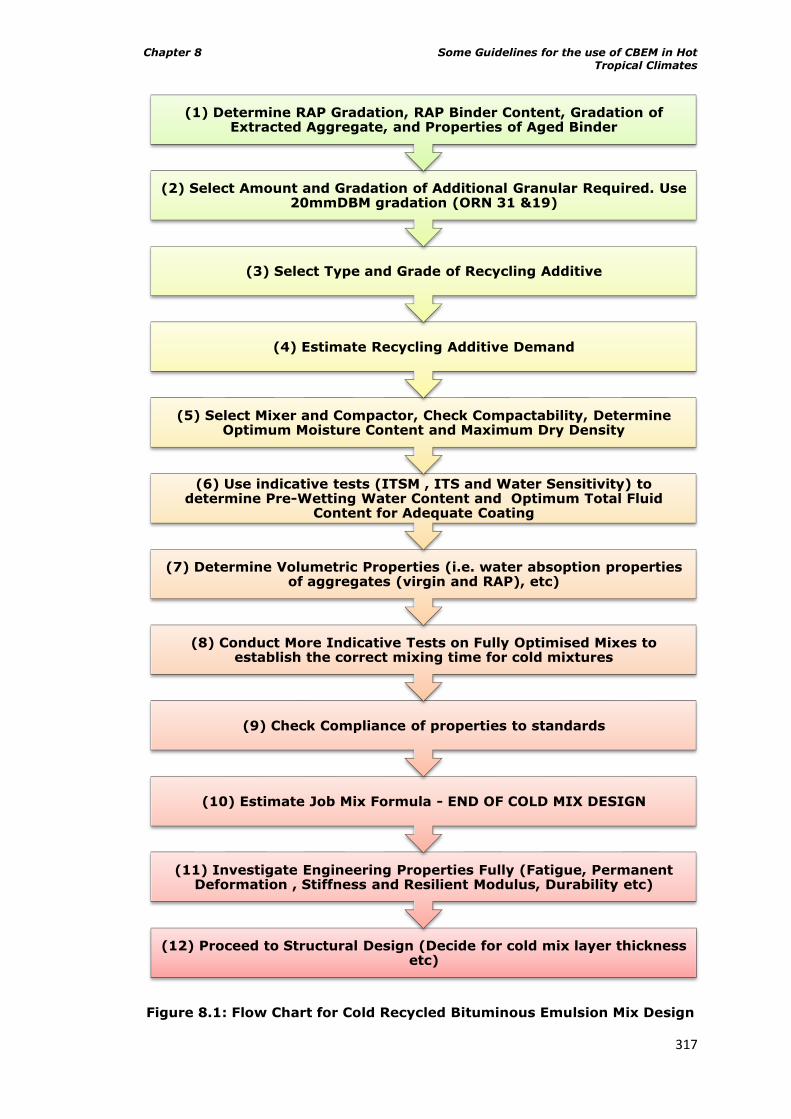
Chapter 8 Some Guidelines for the use of CBEM in Hot Tropical Climates
317
Figure 8.1: Flow Chart for Cold Recycled Bituminous Emulsion Mix Design
(12) Proceed to Structural Design (Decide for cold mix layer thickness etc)
(11) Investigate Engineering Properties Fully (Fatigue, Permanent Deformation , Stiffness and Resilient Modulus, Durability etc)
(10) Estimate Job Mix Formula - END OF COLD MIX DESIGN
(9) Check Compliance of properties to standards
(8) Conduct More Indicative Tests on Fully Optimised Mixes to establish the correct mixing time for cold mixtures
(7) Determine Volumetric Properties (i.e. water absoption properties of aggregates (virgin and RAP), etc)
(6) Use indicative tests (ITSM , ITS and Water Sensitivity) to determine Pre-Wetting Water Content and Optimum Total Fluid
Content for Adequate Coating
(5) Select Mixer and Compactor, Check Compactability, Determine Optimum Moisture Content and Maximum Dry Density
(4) Estimate Recycling Additive Demand
(3) Select Type and Grade of Recycling Additive
(2) Select Amount and Gradation of Additional Granular Required. Use 20mmDBM gradation (ORN 31 &19)
(1) Determine RAP Gradation, RAP Binder Content, Gradation of Extracted Aggregate, and Properties of Aged Binder

Chapter 8 Some Guidelines for the use of CBEM in Hot Tropical Climates
318
Table 8.1: Step by Step Approach to Cold Recycled Bituminous Emulsion
Mix Specimens Preparation
1.Materials for Cold Bituminous Emulsion Mixture (CBEM)
RAP and Virgin
Aggregates
Characterise RAP (check residual bitumen content and properties and
the gradation of extracted aggregate). Determine quantity and sizes
of virgin aggregates required to fill deficiencies. Use 20dmm DBM
gradation
Optimum Total
Fluid Content
Start by estimating trial emulsion
content. Determine the pre-
wetting water content using
moisture-density relationships.
Determine OTFC using TFC –
ITS and or TFC –ITSM
relationships.
Batching Each batch contains enough materials for 4 cores at 910g per sample
2. Mixing
Material
Conditioning
prior to mixing
- Materials (aggregate mix, bitumen emulsion in air tight
container and demineralised water) preconditioned over night at the desired mixing and compaction temperatures (32⁰C)
- Set Sun and Planet Mixer also to the desired temperature
over night (or 3hrs to the time of mixing)
- Precondition prepared moulds at the required temperature
Fluid Addition
and Mixing
Technique
- Add the prescribed amount of pre-wetting water to mix in the
mixing basin.
- Mix continuously for 60s and stop the mixer. Stir mix
manually using a spatula. Mix again for 60s
- Add the prescribed bitumen emulsion content to water pre-
wetted mix
- Mix for 60s and stop the mixer. Also stir manually to obtain
homogeneous mix. Complete operation by mixing for 60s
more. Place loose CBEM in moulds and subsequently
condition for 30minutes
3. Compaction
Moulds - Prepare 100mm diameter moulds and precondition overnight
- Upon mixing, place 900g of CBEMs in each mould
- Condition for about 30minutes
Compaction
Information
- Set angle of gyration to 1.25⁰
- Compaction pressure to 600kPa
- Target 200gyros for good compaction
- Target 100gyros for mild compaction
Specimen Size - Diameter = 100±1mm
- Height = 50±2mm (requires no cutting)
4. Curing
Stage 1 of
Curing
First 24Hrs after compaction
- Keep in mould (sealed) condition for 24hrs at ambient condition (temperature of about 20⁰)
- De-mould or extrude specimens carefully after 24hrs
- Check mass
Stage 2 of
Curing
Curing in the Forced Draft Oven After 24Hrs of Stage 1 Curing - Cure @ 40⁰C over 12hrs (Early Life)
- Cure @ 40⁰C over 72hrs (Intermediate Life)
- Cure @ 60⁰C over 96hrs (Fully Cured Condition)
5. Handling of Specimens After Curing
Storage After
Curing
If specimens are not tested immediately after curing, store in the cold store at 5⁰C until needed for testing
Conditioning
Prior to Test
- Prior to any dry test (i.e. ITSM), place specimens in the
conditioning cabinet at the desired test temperature for about
8hrs (preferably over night)
- Specimens for wet tests (for water sensitivity) should be
conditioned for 2hrs in water at the desired test temperature
before testing
Chapter 8 Some Guidelines for the use of CBEM in Hot Tropical Climates
319
behaviour of the Cold Recycled Bituminous Emulsion Mixtures (CRBEM). This
informs that the resilient modulus test results are required in this regard for the
input parameters in the mechanistic analyses. The KENLAYER computer software
developed by Huang (2004) which is commonly available is considered
appropriate in this regard for analysing the response of the non-linear layer to
load. The desired outputs from the analyses are:
Horizontal tensile strain at the bottom of the HMA (surface layer)
Vertical strain on top of the subgrade
A range of layer combination and thicknesses for surfacing layer (HMA), road base
layer (CRBEM), sub-base layer (unbound granular materials- lateritic gravel) and
subgrade layer must be tried until the desired layer combination is found that
satisfactorily meets the requirements for the desired pavement design life. This
must be economically viable compared to when the conventional pavement is
used. Experience shows that with a well designed CRBEM road base layer, and
good sub base and subgrade layers, a surfacing layer (HMA) thickness of 20mm –
50mm is achievable.
For the prediction of Equivalent Standard Axle Load applications, transfer
functions are required for realistic values. It is advised that transfer functions or
shift factors for critical conditions for fatigue and permanent deformation are used
for such estimations as follows:
Fatigue;
Values obtained when the horizontal strains from multi-layer analysis have
been substituted in fatigue life equations obtained from fatigue tests
should be multiplied by 77
Permanent Deformation;
Ncr =fr (
)
Where:
Ncr = life to critical condition (10mm rut)
Fr = a rut factor to account for the hot mixture type- 1.56 for dense
bitumen mixtures
Such shift factors are to be used with caution for the CBEMs (cold mixtures) since
they were developed for HMA. At present, no such values are available for cold
Chapter 8 Some Guidelines for the use of CBEM in Hot Tropical Climates
320
mixtures. The adopted factor of 77 may be too low to describe total pavement
life. Considering the fact that cold mixtures are not as good as HMA as observed
in this thesis, it is believed that the appropriate value for life to failure should be
somewhere in between 77 and 440 for critical and failure conditions respectively.
These shift factors are based on the Nottingham Asphalt Design method for hot
mixtures.
For the construction of pavements which contain cold recycled bituminous
emulsion mixture (CRBEM) layers, the guidelines for such given by ARRA (2001),
Wirtgen (2004) and Merrill et al (2004) are relevant. However, it is advised that
such constructions should be done in the harmattan (dry) season in hot tropical
countries such as Nigeria, and where very thick layers of road base CBEMs are
considered i.e. from 200mm to say 300mm in order to minimise the thickness of
the HMA surfacing, such a CBEM layer should not be laid in one lift but in layers
(of say 100mm thick) to allow for adequate curing. This can be done at intervals
of 12hrs for good performance in a typical hot tropical climate considering the
stiffness values observed in this limited study. It follows therefore that 12hrs after
being laid such CBEM layers can be opened to vehicular traffic. This is believed to
give room for consolidation of the CBEM layers before they are sealed with a HMA
surfacing layer.
Chapter 9 Conclusions and Recommendations for Future Research
321
9 Conclusions and Recommendations for
Future Research
9.1 Conclusions
A summary of the major findings for the research work presented in this thesis in
the form of conclusions are drawn as follows:
1. Major Conclusions from Literature Review on Flexible Pavement
Engineering and Current Practices
a. The road Network in Nigeria and throughout Sub-Sahara Africa (hot tropical
belt) is in a deplorable state due to long neglect as a result of lack of funds
for maintenance and rehabilitation. The situation can only get worse under
the present global economic recession.
b. There is urgent need to introduce alternative but sustainable methods and
materials in order to significantly cut down on costs and also stretch available
funds.
c. One out of the sustainable methods that appeals and which can be applied
without spending huge amounts on machinery is cold recycling RAPs with
bitumen emulsion. This offers a potential cut in costs in the region of 40-
60%. Cold recycling ex situ using bitumen emulsion should not pose any
problems since cutbacks which are similar in operation to emulsions have
been used in the industry for a long time and thus are easily adaptable. Such
would also ensure good quality control.
d. There is a need to develop guidelines that will assist in making provisions for
the use of such alternative sustainable methods and materials in the highway
design manual of Nigeria which is lacking at the moment.
2. Major Conclusions from Literature Review on Laboratory
Investigations on Cold Mixes
a. Ageing of bitumen whether in the short or long term is inevitable in
bituminous road pavements. Ageing in bituminous materials is evidenced by
physical hardening which could either be advantageous or otherwise in a road
pavement.
b. Laboratory protocols (accelerated) for simulating ageing of bituminous road
pavements in temperate climates have been developed. Such protocols are
useful for predicting performance in service of bituminous road pavements.
However there is a need to develop similar laboratory protocols for road
pavements in hot tropical climates.
c. Cold mixes are cost effective, energy efficient and environment friendly,
although inhibiting factors such as low early life stiffness and strength
development, high air void contents and presence of moisture in the mix are
Chapter 9 Conclusions and Recommendations for Future Research
322
still preventing such mixtures from being fully embraced in some developed
countries.
d. Most of the studies reported in literature on cold mixes have focused on
temperate climates, though with good results in most cases. There is lack of
evidence in literature on similar studies conducted in hot tropical climates and
therefore there is a need to urgently look at this area for such sustainable
materials to be found applicable in such regions.
e. There is no universally accepted method for cold mix designs (job formula)
although most of the methods which have been advanced in literature are
based on the Hveem and Marshall methods of mix design.
f. Stiffness modulus, fatigue response, deformation properties, resilient
modulus, and water susceptibility are good means for assessing the
performance of cold mixes.
g. Knowledge about the interaction between virgin binders and aged residual
binders in cold recycled mix is still ambiguous and needs further exploration.
h. RAPs are still regarded as black rocks when they are used in cold recycling.
i. The effect of cold mix preparation temperature (mixing and compacting) of
cold mixes has not been fully accounted for in literature.
3. Major Conclusions from Laboratory Ageing Protocol for Producing
Severely Aged RAPs
a. Penetration values as low as 6dmm for wearing course and 5dmm for binder
course have been reported in literature for asphalt pavements in East Africa-
typical hot tropical developing region.
b. Laboratory ageing protocols for producing RAPs are needed to reflect what
obtains in road asphalt pavements in such hot tropical developing regions of
the world.
c. Generally, as the binder used in this study (straight run paving grade binder
40/60 of Venezuelan origin with a penetration of 53dmm) ages, complex
modulus, asphaltene content and softening point values increase while
penetration values reduce irrespective of the ageing protocol i.e. either as
bulk binder ageing or mixture ageing, in line with other researchers‟ findings.
d. Ageing bituminous materials at 85⁰C over 120hrs (5days) in the forced draft
oven did not yield the severity of ageing (below 6dmm) required to study
heavily aged pavements typical of the tropics. This standard protocol (for
temperate climates) yielded a residual binder of 23dmm penetration for the
original 53dmm penetration binder used. However, it was able to age to
11dmm penetration after 840hrs (35days).
e. Ageing bituminous mixture at a higher temperature of 125⁰C in the forced
draft oven accelerates ageing, such that it only took 48hrs to reach a
penetration of 11dmm compared to 840hrs (35days) for the standard
protocol (for temperate climates), thus saving laboratory time.
f. Ageing loose bituminous mixtures in the forced draft oven accelerates ageing.
For example, ageing such mixtures at the standard (temperate climate
protocol) temperature of 85⁰C over 24hrs yielded a pen of 31dmm in this
work. Nguyen (2009) in his work in which he used compacted specimens with
similar binder reported a similar penetration level of 31dmm after 120hrs of
ageing.
Chapter 9 Conclusions and Recommendations for Future Research
323
g. Ageing asphalt mixtures at 125⁰C is comparable to the standard temperature
of 85⁰C though with minor differences in physical properties at a given
penetration.
4. Major Conclusions from Cold Mix Design of CBEMs
a. Bitumen emulsion compatibility with aggregate, pre-wetting water content
and optimum total fluid content (OTFC) are important parameters that must
be ascertained for cold bituminous emulsion mixtures (CBEMs) to achieve a
successful cold (job) mix design.
b. The Indirect Tensile Stiffness Modulus (ITSM) test proved useful alongside the
Indirect Tensile Strength (ITS) test as an indicative test for ranking CBEMs
during mix design. With ITSM (a non destructive test), materials can be
conserved as the same set of specimens tested dry can also be tested for
water susceptibility. ITS tests (destructive) are common for mix designs of
this nature.
c. Just enough mixing time for both the addition of pre-wetting water and
bitumen emulsion are recommended for CBEMs in order to ensure adequate
coating, while also ensuring at such timings that the bitumen emulsion in the
mix has not started breaking. All these together facilitate good compactability
and stiffness properties for the CBEM. Inadequate mixing time can
significantly reduce compactability and stiffness response. A 36.1% reduction
in stiffness property as a result of such inadequate timings was observed in
this study.
d. As observed in this study, limestone filler significantly reduces the water
susceptibility of CBEMs. Limestone has been known to be good at inhibiting
stripping. However, granite filler gave a better dry stiffness property
compared to limestone. Granite aggregate was adopted for subsequent
CBEMs mainly because it is often used in Nigeria which is the study area of
this work.
e. Mixing and the compaction of CBEMs at a temperature of 32⁰C gave better
results in compactability, stiffness properties and water susceptibility when
compared to those similarly done at 20⁰C. The lower viscosity value of the
bitumen emulsion at 32⁰C as observed in this work was considered partly
responsible for this. However such slightly elevated temperature simulates a
typical average maximum temperature in the tropics. Improvement in
stiffness as high as 39.5% was achieved at a mixing and compaction
temperature of 32⁰C over 20⁰C in such circumstance.
f. As observed in this study, the use of parameters of 600kPa pressure and
1.25⁰ gyration angle in the Cooper Research Gyratory Compactor enhanced
the CBEM durability especially the water susceptibility properties compared to
other higher compactive efforts such as pressure of 800kPa and gyration
angles of 1.5⁰ and 2⁰. The 600kPa pressure and 1.25⁰ gyration angle
parameters were subsequently adopted for the manufacture of all the
specimens used in this study.
g. Characterisation of the recovered binder from CBEMs cured at 40⁰C over
24hrs in the forced draft oven compared to those cured at 60⁰C over 96hrs
also in the forced draft oven, showed similar physico-chemical properties. The
results obtained from the two protocols also showed that the bitumen in the
Chapter 9 Conclusions and Recommendations for Future Research
324
mix had not significantly degraded compared to the same properties of the
CBEMs characterised prior to curing. Based on the study therefore, curing
protocols of 40⁰C over 12hrs for early life, 40⁰C over 72hrs for intermediate
life and 60⁰C over 96hrs for fully cured conditions were adopted for the
studies on the CBEMs reported in this thesis.
h. As observed in this limited work, filler type does not influence curing, though
it is recognised that the use of active fillers such as lime and Ordinary
Portland Cement (OPC) can alter this view. Such active fillers were not
considered in this work because they are expensive in Nigeria and can render
cold recycling unattractive.
5. Major Conclusions from Detailed Investigation on the Mechanical
Properties of CBEMs under Laboratory Simulated Tropical Conditions
a. CBEMs as observed in this study generally have high air void contents
compared to HMA. They in some instances displayed values as high as 23%
with the minimum experienced in this study being around 8%. However, the
air void content depends on the condition of curing which essentially has to
do with moisture content. In consonance with logic i.e. as cold mixture cures
it gains stiffness, early life conditioned specimens displayed the lower values
due to the presence of moisture, while the fully cured specimens had the high
values. The moisture content at early life condition for all the CBEMs ranged
from 1.0% to 1.4% while at fully cured condition it ranged from 0.2% to
0.8%.
b. Mixing and compaction temperature is very important for achieving low air
void contents in CBEMs. For example, mixing and compacting CBEMs at 32⁰C
gave better results than at 20⁰C.
c. The RAP CBEMs compact better compared to the control mix i.e. the VACBEM.
The 20dmmCBEM had the best compactability.
d. The results showed that the consistency and reproducibility of compactability
of CBEMs mixed and compacted at 32⁰C is uniform and significantly better
compared to those mixed and compacted at 20⁰C. The results also confirmed
that there is only a little difference between applying a compactive effort of
100gyros or 200gyros (at similar temperature) in compactability of CBEMs
when compared to the effect of mixing and compaction temperatures of 32⁰C
and 20⁰C (at similar compactive effort) in which significant difference was
observed.
e. Compactability affects the rate of moisture loss in the CBEMs. The higher the
initial air void content, the higher the rate of moisture loss from the CBEM. In
this regard, the VACBEM showed the highest loss of moisture content.
f. The better the compactability of CBEM the higher the tendency of retaining
more moisture content. This however seemed not to have affected the
stiffness properties of the CBEMs.
g. The stiffness modulus responses referred to as ITSM for the CBEMs generally
showed that the curing protocols used in this study sufficiently simulated the
desired conditions in a logical order as stiffness improved from early life to
intermediate life and fully cured condition.
h. At early life the ITSM test clearly ranked the CBEMs in a logical order and the
results were in agreement with findings on compactability of the CBEMs.
Chapter 9 Conclusions and Recommendations for Future Research
325
5dmmCBEM had the least percentage improvement at 8.8% while
20dmmCBEM had the highest at 32% compared to the VACBEM. As the
penetration of the residual binder in the severely aged RAP increases, there is
a corresponding increase in ITSM. The trend line of the ITSM however
indicates that an optimum value is very close to that for the 20dmmCBEM.
i. VACBEM as observed in this study shows the highest temperature
susceptibility.
j. The RAP CBEMs performed better than the VACBEM in water susceptibility.
k. The results suggest that the RAP CBEMs were not completely acting as black
rock most especially when constituted at 32⁰C. This view is expressed also
being mindful of the fact that the viscosity of the bitumen emulsion at 32⁰C as
observed in this work was far less than (almost by a factor of 3) that at 20⁰C.
The increase in stiffness modulus up the range from 10dmmCBEM to
15dmmCBEM and to 20dmmCBEM, with higher values than the VACBEM as
observed in this work gives a clue to this. The logic is that if the RAPs acted
as black rock, in which the residual binders in the RAPs were inactive, the
stiffness modulus of the RAP CBEMs should be similar to the value observed
for the VACBEM since all the CBEMs have been given similar treatments. More
importantly, it implies that some portion of the residual aged binder in the
respective RAPs is possibly rejuvenated or softened and this consequently
enhanced the stiffness responses of the RAP CBEMs compared to that of the
VACBEM. It is reasoned therefore that under such circumstances, the RAP
CBEMs now contain more active and in effect stiffer binder than the VACBEM
which subsequently reflected in the wet and dry stiffness modulus values of
the RAP CBEMs. Alternatively, the better stiffness performances recorded for
the RAP CBEMs over the VACBEM could also have been influenced possibly by
changes in volumetrics of the RAP CBEMs which influenced their better
compactability (compaction).
l. The poor water susceptibility performance of the VACBEM is believed to be
partly due to its high air void content, while the lower air voids of the other
CBEMs could have been partly responsible for their better performance.
m. There is a negative relationship between ITSM and air voids i.e. as air voids
increase, stiffness modulus reduces for CBEMs.
n. Fatigue lives of the CBEMs generally are lower than those for HMA.
o. Overall, the RAP CBEMs prepared at a mixing and compaction temperature of
32⁰C performed better than their counterparts prepared at 20⁰C in fatigue
response.
p. Considering the behaviour of both the VACBEM and 5dmmCBEM, it seems
that fatigue responses of CBEMs were not affected by air void contents
although it was earlier established that air voids have a strong correlation
with stiffness of CBEMs but depending on the level of curing attained.
Generally, the two referred CBEMs have relatively high air void contents
compared to the other CBEMs.
q. VACBEM performed better than the RAP CBEMs in permanent deformation
response. The results also seem not to have been affected by the air void
contents of the CBEMs as the VACEBEM which performed best in permanent
deformation resistance consistently displayed the highest air void contents of
all the CBEMs studied.
Chapter 9 Conclusions and Recommendations for Future Research
326
r. The results of the resilient modulus tests clearly indicate that the resilient
moduli of the mixtures investigated in this work are stress dependent as they
all fitted the k-Θ model.
s. The resilient modulus test as it was done in this study was able to
discriminate the properties (CBEM type) of the mixtures with regard to
temperature susceptibility.
t. The results show that the Indirect Tensile Stiffness Modulus (ITSM) is useful
for quickly ranking CBEMs and resilient modulus may be more appropriate for
pavement design involving such materials since they are non-linear in their
behaviour as observed in this study. The resilient modulus values were
generally lower than the ITSM stiffness modulus values as observed in this
work. This is consistent with the observations of Ibrahim (1998) on VACBEMs.
6. Major Conclusions from Structural Design and Modelling of Flexible
Pavement Containing CBEMs and Guidelines for the use of CBEM in
Hot Tropical Climates
a. KENLAYER is a good analytical tool for analysis of flexible pavements
containing non-linear elastic materials while BISAR 3.0 and OLCRACK are
both good for linear elastic layers in multi-layer analysis of flexible
pavements.
b. Vertical stress distribution for pavements containing non-linear materials
(CBEM) is similar irrespective of material type. Strains (vertical and
horizontal) are however different.
c. BISAR 3.0 only gives similar results for stresses and strains to KENLAYER
when the correct modulus values for each sub-layer considered are used.
d. From the analysis done here and the subsequent design charts produced, the
28mm DBM and 5dmmCBEM indicated the best fatigue lives followed by
20dmmCBEM and 10dmmCBEM. VACBEM indicated the worst performance.
e. Fatigue lives of the 50mm HMA surfacing for critical condition which is
between 2.8 and 10.5 million ESALs suggest longer lives to failure although it
is difficult to make predictions. Liebenberg and Visser (2004) recorded 30
million ESALs to failure for similar pavements.
f. 28mm DBM gave very good support to 30/14 HRA surfacing layer compared
to the CBEMs. Surfacing layer on HMA road base is highly sensitive to
changes in thickness of the road base compared to CBEM road base. Such
changes in HMA road bases resulted in significant increase in ESALs.
g. The analysis showed that pavements containing HMA materials as surfacing
and road base are better in performance compared to those made with
CBEMs and thus confirms the findings/views of experts in the field.
h. With all other things being equal, pavements containing 5dmmCBEM,
20dmmCBEM and probably 10dmmCBEM as road base should conveniently
accommodate about 5million ESALs before reaching the end of their service
lives. The results presented here are generally for critical conditions, which
imply failure would actually happen at larger ESAL values than presented in
the design charts produced.
i. The RAP CBEMs overall performed better than the VA CBEM in terms of ESAL
applications that they offer. These RAP CBEMs would be applicable in low to
medium volume traffic scenario as road base materials.
Chapter 9 Conclusions and Recommendations for Future Research
327
In conclusion, the findings generally show that severely aged RAPs with residual
bitumen of penetration values as low as 5dmm can be successfully used in the
construction of road base for low traffic volume roads in developing countries with
hot tropical climates. Cold recycling ex situ (in-plant) is recommended in this
regard. In order to achieve the desired success in recycling projects involving
such severely aged RAPs, the guidelines in Chapter Eight of this thesis are useful
but each project has to be treated individually. Due to the high air voids observed
in the CBEMs, it is advised that a surfacing layer of HMA be placed over the CBEM
layer.
9.2 Recommendations for Future Research
Although the limited study reported in this thesis has demonstrated that severely
aged RAPs stabilised with bitumen emulsion can be successfully used in road base
construction in hot tropical climates, some further investigations are deemed
necessary to validate the results. These have been compiled as recommendations
for future research as follows:
1. From the limited tests conducted in developing the laboratory ageing
protocols for the production of severely aged RAPs presented in this thesis,
the results indicated that physico-chemical and rheological properties of more
severely aged binders are independent of the mixture ageing protocol
temperature. However, this has to be ascertained further by conducting more
PAV ageing of binders beyond 35hrs i.e. the maximum used in this work up to
the point at which severely aged binders comparable in penetration values to
those obtained from severely aged mixtures are reached. The chemical and
rheological properties should be compared with those reported in this thesis
for validation. Similarly, the measurement of chemical composition should be
extended beyond asphaltene content to a full SARA (Saturates, Aromatics,
Resins, Asphaltenes) analysis, in order to further explore the relationship
between softening points, penetration values and rheological properties of the
severely aged binders in relation to the various protocols used in this thesis.
This will further ascertain whether there are significant differences or not in
the chemical composition of binders aged using the protocols described in this
thesis.
2. Due to time constraints, only one gradation type - 20mm DBM suggested by
previous researchers for road pavements in developing countries located in
hot tropical climates was experimented with in this work. This obviously
imposes the constraint of having to process and screen the RAPs in order to
conform to the requirements. Future works should explore other gradations.
Also, in the research reported in this thesis, only one aggregate proportion
ratio was used i.e. 65:35:5 for RAP : Virgin aggregate : Filler, different ratios
up to 100% use of RAP as aggregates should be experimented with in order
to fully understand the role being played by RAPs in CRBEM.
Chapter 9 Conclusions and Recommendations for Future Research
328
3. The philosophy of mix design adopted in the research work reported in this
thesis assumed severely aged RAPs to be acting as black rock in CBEMs as it
is the general belief in the industry most especially in temperate climates.
However, since it has been proven in this work that RAPs of residual binder
with penetration values as low 5dmm may possibly be active under hot
tropical conditions, future research should be aimed at quantifying the extent
of transient activeness (or level of rejuvenation if at all) of such severely aged
binders in CBEMs under hot tropical conditions. This should help in estimating
the optimum total fluid content for CBEMs in a more realistic manner.
4. There were plans to conduct two point bending fatigue tests on the CBEMs
studied in this thesis, however due to time constraints the attempt did not go
beyond the cutting of the specimens which was successfully done on fully
cured compacted CBEM slabs contrary to general expectations. Researchers
have always believed that CBEMs are too fragile to be subjected to such
cutting. Therefore future research should attempt to validate the results of
the indirect tensile fatigue tests (ITFT) conducted on the CBEMs reported in
this thesis with the results obtained from two point bending fatigue tests.
Some researchers are of the opinion that two point bending tests, in contrasts
to the ITFT give room for healing of the mixtures which is the reality onsite.
5. The resilient modulus test protocol developed in this research is worth
improving further since it is easy to conduct and requires short duration of
time. It is worth noting that the resilient modulus results obtained for the
studied CBEMs reported in this thesis using the protocol are consistent with
those obtained by previous researchers for similar materials. The test as was
conducted subjects the specimen to a range of stress levels (low to high)
which pavements are believed to be subjected to in service and it uses
specimen sizes similar to those used for indirect tensile stiffness modulus
tests (ITSM). The improvement required here should be done by
experimenting with conventional specimen sizes used for such resilient
modulus tests in future research. More importantly, the results should be
validated against the results of tests conducted on similar CBEM materials
using the conventional triaxial test protocol.
6. One of the weak points of the research work conducted on the CBEMs which
is reported in this thesis is that no field trial was conducted due to time
constraints. Similarly, only artificial RAPs were used in the study. The
geographical location of the case study (hot tropical countries) in relation to
that of the laboratory used for this study did not help matters. The results
presented therefore are essentially from laboratory investigations and would
require field trials for the validation of the laboratory results. Future
laboratory studies should similarly be extended to RAPs obtained from the
field.
7. The application of the design charts presented in this thesis is limited for a
number of reasons. For example, only one foundation type was used in the
analysis and as earlier observed, only one gradation type and a fixed ratio of
aggregates proportions (RAP, virgin and filler) were considered. Future
Chapter 9 Conclusions and Recommendations for Future Research
329
research should attempt to develop design charts that are robust enough to
account for all these parameters.
8. Since there is lack of information in the literature for road pavement
temperature profile in the tropics, some of the decisions taken with respect to
the choice of test temperature for assessing mechanical performance in this
work were based on a recognised predictive equation which might not have
given a total reflection of the conditions in the road base layer. Therefore,
future laboratory tests on CBEMs with focus on the tropics should consider
other equations (or means of determining base layer temperature profiles)
such that in addition to temperatures of 20, 30, 32 and 40⁰C that were used,
mechanical performance at lower temperatures of 15 and 10⁰C are
considered.
9. As no direct measurements of binder rejuvenation have been undertaken in
this work, future works should investigate issues such as viscosity
measurement and adhesion properties of binders which should give better
insight into the possibility of rejuvenation or not in recycled cold asphalt
mixtures.
References
330
References
AASHTO (1986) Guide for Design of Pavement Structures. American Association
of State Highway and Transportation Officials, Washington, DC.
Adebiyi, F.M., Asubiojo, O.I. and Ajayi, T.R. (2005) Multi-element Analysis of
Nigerian Bitumen by TXRF Spectrometry and the Physical Constants
Characterization of its Hydrocarbon Component. Fuel 85 (2006), Elsevier Ltd,
pp. 396-400.
Adedimila, A.S. (1986) A Comparison of the Marshall and the Indirect Tensile
Tests in relation to Asphalt Mixture Design. Technical Note 461, Transportation
Engineering Group, Proc. Instn. Civ. Engrs, Part 2, 1986, 81, Sept., ICE,
London, 461-469.
Adedimila, A.S. and Oti, D.O. (1987) Development of Acceptable Bituminous Road
Base Materials from Laterite. Technical Note 477, Transportation Engineering
Group, Proc. Instn. Civ. Engrs, Part 2, 1987, 83, June 1987, ICE, London, 453-
463.
Aderinokun, K. (2008) Nigeria Requires N300bn for Roads Standardisation.
Thisday Online, www.thisday.com/nview.php?id=113919 (Accessed:
12/06/2008).
Adeyemi, G.O. and Oyeyemi, F. (2000) Geotechnical Basis for Failure of the
Lagos-Ibadan Expressway, South-Western Nigeria. Bull Eng Geol Env. 59
Springer-Verlag, pp. 39-45.
Airey, G. D. (1997) Rheological Characteristics of Polymer Modified and Aged
Bitumens. PhD Thesis, University of Nottingham.
Airey, G. D., Choi, Y. K., Collop, A. C., Moore, A. J. V. and Elliot, R. C. (2005)
Combined Laboratory Ageing/Moisture Sensitivity Assessment of High Modulus
Base Asphalt Mixtures. Journal of the Association of Asphalt Paving
Technologists, Vol. 74, AAPT, White Bear Lake, pp. 307-341.
Airey, G.D. (2003) State of the Art Report on Ageing Test Methods for Bituminous
Pavement Materials. The International Journal of Pavement Engineering, Vol. 4
(3) September, pp165-176.
Akzo Nobel (2008) Bitumen Emulsion, Technical Bulletin. Akzo Nobel Asphalt
Applications, Stockholm.
Anochie-Boateng, J., Paige-Green, P. and Mgangira, M. (2009) Evaluation of Test
methods for Estimating Resilient Modulus of Pavement Geomaterials.
Proceedings of the 28th Southern African Transport Conference, Pretoria,
South Africa.
Arnold, G. K. (2004) Rutting of Granular Materials. PhD Thesis, University of
Nottingham.
Artamendi, I. and Khalid, H. A. (2006) Diffusion Kinetics of Bitumen into Waste
Tyre Rubber. Journal of the Association of Asphalt Paving Technologists, Vol.
75, AAPT, White Bear Lake, pp133-160.
References
331
Asphalt Academy (2009) Technical Guideline: Bitumen Stabilised Materials, A
Guideline for the Design and Construction of Bitumen Emulsion and Foamed
Bitumen Stabilised Materials. TG2, Second Edition, Asphalt Academy, Pretoria.
Asphalt Institute (1978) New Roads from Old: The Economics of In-Depth
Recycling. The Asphalt Institute, Maryland.
Asphalt Institute (1989) Asphalt Cold Mix Manual. Manual Series No. 14 (MS-14),
Third Edition, Lexington.
Asphalt Institute and Asphalt Emulsion Manufacturers Association (1997) A Basic
Asphalt Emulsion Manual. Manual Series No. 19, Third Edition, Asphalt Institute
and Asphalt Emulsion Manufacturers Association, USA.
Asphalt Recycling and Reclaiming Association (2001) Basic Asphalt Recycling
Manual. Asphalt Recycling and Reclaiming Association, USA.
Austroads (2000) Use of Recycled Materials and the Management of Roadside
Vegetation on Low Trafficked Roads. AP-R154, Austroads Incorporated,
Sydney.
Bahia, H. U., and Anderson, D. A. (1995) The SHRP binder rheological
parameters: Why are they required and how do they compare to conventional
properties? Transportation Research Record 1488, Transportation Research
Board, Washington, DC, 32–39.
Baumgardner, G. L. (2006) Asphalt Emulsion Manufacturing Today and Tomorrow,
Asphalt Emulsion Technology. Transportation Research Circular Number E-
C102, Transportation Research Board, Washington, DC.
BBC Weather (2008) Average Temperature Conditions for Ibadan, Nigeria.
http://www.bbc.co.uk/weather/world/city_guides/results.shtml?tt=TT000490
(Accessed: 10/10/08).
Bearsley, S., Forbes, A. and Haverkamp, R.G. (2004) Direct Observation of the
Asphaltene Structure in Paving-grade Bitumen using Confocal Laser Scanning
Microscopy. Journal of Microscopy, Vol. 182, Pt 1, April 1996, The Royal
Microscopical Society.
Bell, C. A., Fellin, M. J. and Wieder, A. (1994) Field Validation of Laboratory Aging
Procedures for Asphalt Aggregate Mixtures. Journal of the Association of
Asphalt Paving Technologists, Vol. 63, AAPT, White Bear Lake, pp. 45-72.
Bell, C.A. (1989) Summary Report on Aging of Asphalt-Aggregate Systems. SHR-
A/IR-89-004, Strategic Highway Report Research program, National Research
Council.
Biczysko, S. J. (1996) Performance of Cold Recycled Bituminous Material.
Performance and Durability of Bituminous Materials, (eds Cabrera, J. G. and
Dixion, J. R.), E & FN Spon, London.
Bocci, M., Virgili, A. and Colgrande, S. (2002) A study of the Mechanical
Characteristics of Cold Recycled Bituminous Concretes. Proceeding of 4th
European Symposium on Performance of Bituminous and Hydraulic Materials in
Pavement, BITMAT 4, University of Nottingham, UK, 11-12 April 2002, A.A.
Balkema Publishers, Netherlands, pp 227-235.
Bonner, D.G. (2001) Bituminous Materials in Construction Materials: Their nature
and Behaviour (eds Illston, J. M. and Domone, P.L.J.), 3rd Ed, Spon. Press
Taylor and Francis Group, London.
References
332
Brennan, M.J., Gilbin, P.M., Kavanagh, A. and Sheahan, J. (2007) Laboratory
Performance of an Emulsion-Bound Macadam Manufactured using different
Processes. Asphalt Professional No. 29, November 2007, Institute of Asphalt
Technology, 19-24.
British Standards Institution (1984) Bitumen Road Emulsions (anionic and
cationic). BS 434 Parts 1 and 2, BSI, London.
British Standards Institution (1987) Road aggregates. BS 63, BSI, London.
British Standards Institution (1990) Methods of tests for soils for civil engineering
purposes – Parts: 1-9. BS 1377: Parts 1 – 9, BSI, London.
British Standards Institution (1997) Test for geometrical properties of aggregates
- Part 1: Determination of particle sizes distribution - Sieving method. BS-EN:
933-1 (1997), BSI, London.
British Standards Institution (1999) Testing aggregates. BS 812, BSI, London.
British Standards Institution (2000) Method for determining resistance to
permanent deformation of bituminous mixtures subject to unconfined dynamic
loading. DD 226:1996 RLAT, BSI, London.
British Standards Institution (2000) Methods of test for petroleum and its
products: Bitumen and bituminous binders – Determination of needle
penetration. BS EN1426:2000, BSI, London.
British Standards Institution (2000) Methods of test for petroleum and its
products: Bitumen and bituminous binders – Determination of softening point –
Ring and ball method. BS EN1427:2000, BSI, London.
British Standards Institution (2000) Tests for mechanical and physical properties
of aggregates. Determination of particle density and water absorption,
BSEN1097-6:2000, BSI, London.
British Standards Institution (2002) Bituminous Mixture - Test Method for Hot Mix
Asphalt. Part 5: Determination of the maximum density. BSEN12697-5:2002,
BSI, London.
British Standards Institution (2002) Methods of test for petroleum and its
products: Bitumen and bituminous binders – Recovery of Binder from Bitumen
Emulsions by Evaporation. BS EN 13074:2002, BSI, London.
British Standards Institution (2003) Bituminous mixtures- Test methods for hot
mix asphalt- Part 23: Determination of the indirect tensile strength of
bituminous specimens. BS EN 12697-23-2003, BSI, London.
British Standards Institution (2003) Method for the determination of the fatigue
characteristics of bituminous mixtures using indirect tensile fatigue. DDABF-
2003 ITFT, BSI, London.
British Standards Institution (2003) Method for the indirect tensile stiffness
modulus of bituminous mixtures. DD 213: 1993 ITSM, BSI, London.
British Standards Institution (2003) Methods of test for petroleum and its
products: Bitumen and bituminous binders - Determination of viscosity of
bitumen using a rotating spindle apparatus. BS EN 13302:2003, BSI, London.
References
333
British Standards Institution (2003) Sampling and examination of bituminous
mixtures for roads and other paved areas. Part 102: Analytical test methods.
BS598-102:2003, BSI, London.
British Standards Institution (2004) Methods of test for petroleum and its
products: Bitumen and bituminous binders – Part 143: Determination of
asphaltenes (heptane insolubles) in crude petroleum and petroleum products.
BS 2000: PART 143:2004, BSI, London.
British Standards Institution (2004) Sampling and examination of bituminous
mixtures for roads and other paved areas. Methods for preparatory treatments
of samples for analysis. BS598-101:2004, BSI, London.
British Standards Institution (2005) Bituminous Mixture - Test Method for Hot Mix
Asphalt. Part 4: Bitumen Recovery: Fractionating Column. BS EN12697-4:2005
BSI, London.
British Standards Institution (2005) Bituminous mixtures- Test methods for hot
mix asphalt- Part 4: Bitumen recovery: Rotary evaporator. BS EN12697-
4:2005, BSI, London.
British Standards Institution (2005) Bituminous mixtures. Material specifications.
Part 8: Reclaimed Asphalt. BS EN 13108-8:2005, BSI, London.
British Standards Institution (2005) Methods of test for petroleum and its
products: Bitumen and bituminous binders- Long term Ageing Conditioning by
a Pressure Ageing Vessel (PAV). BS EN 14769:2005, BSI, London.
British Standards Institution (2006) Methods of test for petroleum and its
products: Bitumen and bituminous binders - Determination of complex shear
modulus and phase angle – Dynamic Shear Rheometer (DSR). BS EN
14770:2005, BSI, London.
British Standards Institution (2007) Bituminous mixtures – Test methods for hot
mix asphalt – Part 35: Laboratory mixing. BS EN12697-35:2004, BSI, London.
British Standards Institution (2007) Bituminous mixtures- Test methods for hot
mix asphalt –Part 31: Specimen preparation by gyratory compactor. BS EN
12697-31:2007, BSI, London.
British Standards Institution (2007) Methods of test for petroleum and its
products: Bitumen and bituminous binders – Part 1: Determination of the
resistance to hardening under the influence of heat and air - RTFOT method.
BS EN 12607-1:2007, BSI, London.
British Standards Institution (2008) Bituminous mixtures. Test methods for hot
mix asphalt. Determination of the water sensitivity of bituminous specimens.
BSEN12697-12:2008, BSI, London.
Brown, S. F. and Brunton, J. M. (1986) An Introduction to Analytical Design of
Bituminous Pavements. Third Edition, University of Nottingham.
Brown, S.F. (1995) Practical test Procedures for Mechanical properties of
Bituminous Materials. Proc. Instn. Civ. Engrs Transp., 1998, 111, Nov, ICE,
289-297.
Brown, S.F. and Needham, D. (2000) A Study of Cement Modified Bitumen
Emulsion Mixtures. Journal of the Association of Asphalt Paving Technologists,
Vol. 69, AAPT, White Bear Lake, pp 92-116.
References
334
Brunton, J. M. (1983) Development in the Analytical Design of Asphalt Pavements
Using Computers. PhD Thesis, University of Nottingham, Nottingham.
Bureau of Public Enterprise (2008) Nigeria Road Sector Reform.
www.bpeng.org/en/default.htm (Accessed: 12/06/2008).
Campbell, A. E. (2009) Federal Road Management for Sub-Saharan African
Nations: A Nigerian Case Study. M.Sc. Thesis, University of Waterloo,
Waterloo.
Carswell, J. (2004) SCI: The Road from Vienna: Eurobitumen/EAPA Conference
Themes. (Summary of Moderator Reports),
www.soci.org/SCI/groups/cmt/2004/reports/pdf/gs-3072.pdf (Accessed:
10/05/2008).
Carswell, J., Ellis, S. J. and Hewitt, A. (2008) Design and Specification for
Sustainable Maintenance of Roads using Cold Recycling Techniques. Review of
the Growth and Development of Recycling in Pavement Construction, World
Road Association (PIARC), Cedex, pp 169-181.
Chen, J.S., Huang, C.C. and Lin, K.Y. (2007) Engineering Characterization of
Recycled Asphalt Concrete and aged Bitumen Mixed Recycling Agent. Journal of
Material Science, Vol. 42, No. 23, December, 2007, Springer Netherlands,
http://www.springerlink.com/content/r443650h6l4737l6/ (Accessed:
10/05/2010).
Collop, A. C. (2009) Mechanical Models for Simulating Bitumen and Asphalt
behaviour. ICE Manual of Construction Materials, Institution of Civil Engineers,
www.icemanuals.com (Accessed: 10/08/2010).
Cooper, K. E. and Pell, P. S. (1974) The Effects of Mix Variables on the Fatigue
Strength of Bituminous Materials. Report 633. TRRL Laboratory, Crowthorne,
Berkshire.
Corbett, L.W. and Urban, R. (2005) Asphalt and Bitumen. Wiley-VCH Verlag
GmbH & Co. KGaA, Weinheim,
mrw.interscience.wiley.com/emrw/9783527306732/ueic/titles?filler=A
(Accessed: 10/12/2007).
CRT (2010) Servo-Pneumatic Universal Testing Machine. Cooper Research
Technology, http://www.cooper.co.uk (Accessed: 01/05/2010).
Dachlan, A.T, Zamhari, K.A., Sterling, A.B. and Toole, T. (1997) Improved
Indonesian procedure for Asphalt Design. Road Research Development Project
Published Paper PA 7, Presented at the 2nd Conference of eastern Asia Society
for Transportation Studies, Seoul, 29-31 1997.
Das, A. (2005) On Bituminous Mix Design. Department of Civil Engineering,
Indian Institute of Technology, Kanpur.
Das, A. (2008) Principles of Bituminous Pavement Design and the Recent Trends.
Department of Civil Engineering, Indian Institute of Technology, Kanpur.
de la Roche, C., Van de Ven, M., Van den Bergh, W., Gabet, T., Dubois, V. and
Grenfell, J. (2009) Development of a laboratory bituminous mixtures ageing
protocol. Advanced Testing and Characterization of Bituminous Materials, (eds
Loizos, d. Q., Partl, M., Scarpas, T. and Al-Qadi, I.), Taylor and Francis Group,
London.
References
335
Duke, D. (2010) Insight into Election Rigging and How Abacha Era Generals Held
Him Hostage. Newsdiaryonline, www.newsdiaryonline.com/duke_insight.htm
(Accessed: 08/07/2010).
Ebels, L-J. (2008) Characterisation of Material Properties and Behaviour of Cold
Bituminous Mixtures for Road Pavements. PhD Dissertation, Stellenbosch
University.
Ekwulo, E. O. and Eme, D. B. (2009) Fatigue and Rutting Strain Analysis of
Flexible Pavements Designed Using CBR Methods. African Journal of
Environmental Science and Technology, Vol. 3 (12), Lagos.
Ellis, C.I. (1979) Pavement Engineering in Developing Countries. Supplementary
Report 537, Overseas Unit, Transport and Road Research Laboratory,
Crowthorne.
Epps, J. A., Little, D. N., Holmgreen, R. J. and Terrel, R. L. (1980) Guidelines for
Recycling Pavement Materials. NCHRP 224, National Research Council,
Washington, DC.
Eyo, T.B. (2004) RETRE: A READOP Package of Commencing Pavement Recycling
and Donating Asphaltic Recycling Equipment to FERMA. READOP Series 4,
FERMA, Abuja.
Eyo, T.B. (2005) Pavement Preservation (P2) by Preventive Maintenance. READOP
Series 5, 3rd January, 2005, Federal Road Maintenance Agency, Abuja.
FERMA (2007) Maintenance and Management Strategy of Federal Road Network.
Federal Road Maintenance Agency, Abuja,
http://www.ferma.gov.ng/doc/strategy.pdf (Accessed: 20/08/2010).
FERMA (2010) Current and Projected Conditions (Due to Intervention) of the
Nigeria Road Network. Federal Road Maintenance Agency, Nigeria,
http://www.ferma.gov.ng (Accessed: 20/08/2010).
FERMA (2010a) Works Minister Calls for Road Sector Funding, Operational
Reforms. Federal Road Maintenance Agency, Nigeria, http://www.ferma.gov.ng
(Accessed: 20/08/2010).
FHWA (1997) Pavement Recycling Guidelines for State and Local Governments.
Participant‟s Reference Book, Federal Highway Administration, USA,
http://www.fhwa.dot.gov/pavement/recycling/98042/ (Accessed:
20/11/2007).
FMWH (1973) Highway Manual Part 1: Design. Federal Ministry of Works and
Housing, Lagos, pp. 1-306.01-1-306.11.
Fwa, T. F. (2003) Highway and Airport Pavement Design. The Civil Engineering
Handbook (eds Chen, W. F. and Richard Liew, J. Y.) 2nd Edition, CRC Press,
Boca Raton.
GEOPAVE (1993) Foam Bitumen Stabilised Pavements. GEOPAVE Materials
Technology Technical Note 8,
http://webapps.vicroads.vic.gov.au/VRNE/vrbscat.nsf/e5ff054ca38faf2b052568
550077d3e7/9c0d4ec7447adf53ca256c6f0019c484/$FILE/tn008.pdf
(Accessed: 20/12/2007).
Gibb, J. M. (1996) Evaluation of Resistance to Permanent Deformation in the
Design of Bituminous Paving Mixtures. PhD Thesis, School of Civil Engineering,
University of Nottingham.
References
336
Gidigasu, M.D. (1991) Characterization and Use of Tropical Gravels for Pavement
Construction in West Africa. Geotechnical and Geological Engineering, Vol. 9,
No. 3-4, September, 1991, Springer Netherlands, 219-260.
Gorondi, P. (2008) Oil Prices Near $146. Associated Press, www.ap.org (Accessed:
03/07/2008).
Haas R., Hudson, W. R., and Zaniewski, J. (1994) Modern Pavement
Management. Kriger Publishing Company, Malabar.
Hachiya, Y., Nomura, K. and Shen, J. (2003) Accelerated Aging for Asphalt
Concretes. Proceedings of the 6th International RILEM Symposium on
Performance testing and Evaluation of Bituminous Materials, Zurich, (ed. Partl,
M.N.), RILEM Publications, Bagneux, pp 133-140.
Hakim, B. and Fergusson, C. (2010) Sustainable Pavement Construction at the
Isle of Man Airport. Asphalt Professional, The Journal of the Institute of Asphalt
Technology, No. 46, November 2010, The Institute of Asphalt Technology,
Surrey.
Harun, M.H. and Morosiuk, G (1995) A Study of the Performance of Various
Bituminous Surfacings for Use on Climbing Lanes. Overseas Centre, TRL,
Crowthorne.
Hinds, S. (2007) Re-recycling Asphalt. M.Eng. Report, University of Nottingham.
Holmes, A.J. (1990) In-Depth Recycling – a Cost Effective alternative to
Traditional Pavement Reconstruction. Mun. Engr, 1990, 7, August, ICE, 185-
192.
Huang, Y. H. (1994) Pavement Analysis and Design. Prentice Hall, Englewood
Cliffs.
Huang, Y. H. (2004) Pavement Analysis and Design. Pearson Prentice Hall, Upper
Saddle River.
Hurley, G. C. and Prowell, B. D. (2006) Evaluation of Potential Processes for Use
in Warm Mix Asphalt. Journal of the Association of Asphalt Paving
Technologists, Vol. 75, AAPT, White Bear Lake, pp 41-85.
Ibrahim, H. E. and Thom, N. H. (1997) The Effect of Emulsion-Aggregate Mixture
Stiffness on both Mixture and Pavement Design. Proceedings of the Second
European Symposium on Performance and Durability of Bituminous Materials,
Leeds, pp351-367.
Ibrahim, H.E.M. (1998) Assessment and design of Emulsion Aggregate Mixtures
for Use in Pavements. Ph.D. Thesis, University of Nottingham.
Idowu, Y.A. (2000) Road Vision in the New Millennium. ASCE-Nigeria International
Group Monthly Technical presentation, Ikeja, 1-8.
Jacobson, T. (2002) Cold Recycling of Asphalt Pavement – Mix In Plant. Swedish
National Road and Transport Research Institute, Linkoping.
James, A. (2006) Overview of Asphalt Emulsions. Asphalt Emulsion Technology,
Transportation Research Circular Number E-C102, Transportation Research
Board, Washington, DC.
References
337
Jenkins, K. J. (2000) Mix Design Considerations for Cold and Half-Warm
Bituminous Mixes with Emphasis on Foamed Bitumen. PhD Thesis, University of
Stellenbosch.
Jitareekul, P. (2009) An Investigation into Cold In-Place Recycling of Asphalt
Pavements. PhD Thesis, University of Nottingham.
Jitareekul, P., Sunarjono, S., Zoorob, S.E. and Thom, N.H. (2007) Early Life
Performance of Cement and Foamed Bitumen Stabilized Reclaimed Asphalt
Pavement under Simulated Trafficking. Proceedings of Special Sessions,
Sustainable Construction Materials and Technologies, Coventry, pp. 308-321.
Johnston, C.M. and Gandy, J.J. (1964) Construction of the Maiduguri-Bama Road,
Northern Nigeria. ICE Proceedings, Vol. 29, Issue 1, September 1964, pg 1-18.
Jove, M.B. and Bock, L.D. (2003) The PARAMIX Project: Enhanced Recycling
Techniques for Asphalt Pavements.
www.cimne.com/paramix/ppt/263_Wascon.doc (Accessed: 20/11/2007).
Judycki, J. and Jaskula, P. (2003) Testing of Performance Properties of Asphalt
Mixes for Thin Wearing Courses. Proceedings of the 6th International RILEM
Symposium on Performance testing and Evaluation of Bituminous Materials,
Zurich, (ed. Partl, M.N.), RILEM Publications, Bagneux, pp 141-147.
Kandal, P.S. Khatri, M.A. (1992) Improved Rice Method for Determining
Theoretical Maximum Specific Gravity of Asphalt Paving Mixtures. NCAT Report
No. 92-3, Presented at the Annual Meeting of the Transportation Research
Board, Washington, DC.
Kandal, P.S., Lynn, C. and Parker, F. (1998) Tests for Plastic Fines in Aggregates
Related to Stripping in Asphalt Paving Mixtures. NCAT, Auburn University,
Auburn.
Karlsson, R. (2002) Investigations of Binder Rejuvenation Related to Asphalt
Recycling. PhD Thesis, Division of Highway Engineering, Royal Institute of
Technology, Stockholm.
Karlsson, R. and Isacsson, U. (2003) Application of FTIR-ATR to Characterization
of Bitumen Rejuvenator Diffusion. Journal of Materials in Civil Engineering, Vol.
15, No. 2, ASCE, pp. 157-165.
Karlsson, R. and Isacsson, U. (2006) Material-Related aspects of Asphalt
Recycling- State-of-the-art. Journal of Materials in Civil Engineering, Vol. 18,
Issue 1, ASCE, Reston, pp 81-92.
Khalid, H. A. (2003) Assessing the Potential in Fatigue of a Dense Wearing Course
Emulsified Bitumen Macadam. Proceedings of the 6th International RILEM
Symposium on Performance testing and Evaluation of Bituminous Materials,
Zurich, (ed. by Partl, M.N.), RILEM Publications, Bagneux, pp 349-356.
Khalid, H. and Eta, K. E. (1997) Structural Support Values for Emulsified Bitumen
Macadams in Highway Reinstatement. Proceedings of the Second European
Symposium on Performance and Durability of Bituminous Materials, Leeds, pp
307-336.
Kim, K. W. and Burati, J. L. (1993) Use of GPC chromatograms to characterize
aged asphalt cements. Journal of Materials Engineering in Civil Engineering,
Vol. 5, No. 1, ASCE, Reston, pp 41-52.
References
338
Kim, Y. and Lee, H.D. (2006) Development of Mix Design Procedure for Cold In-
Place Recycling with Foamed Asphalt. Journal of Materials Engineering in Civil
Engineering, Vol. 17, No. 5, January/February, 2006, ASCE.
Kim, Y., Lee, H.D., and Heitzman, M. (2007) Validation of New Mix Design
Procedure for Cold In-Place Recycling with Foamed Bitumen. Journal of
Materials Engineering in Civil Engineering, Vol. 17, No. 5, November 1, ASCE.
Kulash, D.J. (1994) Toward Performance-Based Specifications for Bitumen and
Asphalt Mixtures. Paper 10190, Proc. Instn. Civ. Engrs Transp., 1994, 105,
Aug, 187-194.
Lee, H. D. and Kim, Y. (2007) Validation of New Mix Design Process for Cold in-
Place Recycling Using Foamed Asphalt. Report No. IHRB Report TR-474, Ames,
Iowa.
Lee, H.D. (2007) Development of Mix Design process for Cold In-Place Recycling
Using Emulsion. A Proposal Presented to Iowa Highway Research Board, Phase
III.
Lee, H.D. and Kim, Y. (2006) Influences of binder and RAP Temperatures and
Foaming Water Content on Cold In-Place Recycling Mix Design using Foamed
Asphalt. Proceedings of the 2006 Airfield and Highway Pavement Specialty
Conference, April 30 - May 3, 2006, Atlanta, GA; Sponsored by the
Transportation & Development Institute of ASCE, Virginia.
Lee, T-C, Terrel, R. and Mahoney, J. (1983) Test for Efficiency of Mixing of
Recycled Asphalt Paving Mixtures. Transportation Research Record 911,
Transportation Research Board, National Research Council, Washington, DC, pp
51-66.
Leech, D. (1994) Cold Bituminous Materials for use in the structural layers of
roads. Transport Research Laboratory Project Report 75, Overseas Centre, TRL,
Crowthorne.
Lesueur, D., Potti, J. J., Southwell, C., Walter, J., Lancaster, I., Cruz, M., Delfoss,
F., Eckmann, B., Maze, M., Fiedler, J., Racek, I., Simonsson, B., Brosseaud, Y.,
Serrano, J., Ruiz, A., Kalaaji, A. and Attane, P. (2005). The SCORE Project:
Superior Cold Recycling.
Liebenberg, J. J. E. and Visser, A. T. (2004) Towards a Mechanistic Structural
Design Procedure for Emulsion-Treated Base Layers. Journal of the South
African Institution of Civil Engineering, 46 (3), pg 2-8.
Locander, R. (2009) Analysis of Using Reclaimed Asphalt Pavement (RAP) as a
Base Course Material. Report No. CDOT-2009-5, Colorado Department of
Transportation, Denver.
Loizos, A. and Papavasiliou, V. (2006) Evaluation of Foamed Asphalt Cold in-Place
Pavement Recycling Using Non-destructive Techniques. Journal of
Transportation Engineering, vol. 132, No. 12, December 1, 2006, ASCE.
Long, F. and Theyse, H. (2004) Mechanistic-Empirical Structural Design Models
for Foamed and Emulsified Bitumen Treated Materials. Proceedings of the 8th
Conference on Asphalt Pavements for Southern Africa (CAPSA’04), Sun City.
Lu, X. and Isacsson, U. (2002) Effect of Ageing on Bitumen Chemistry and
Rheology. Construction and Building Materials, 16 (2002), Elsevier Science Ltd,
pp 15-22.
References
339
Mallick, R. B. and El-Korchi, T. (2009) Pavement Engineering: Principles and
Practice. CRC Press, Boca Raton.
Mamlouk, M.S. (2006) Design of Flexible Pavements. The Handbook of Highway
Engineering, (ed. Fwa, T. F.), CRC Press, Boca Raton, pp 8-1 – 8-34.
Mastrofini, D. and Scarsella, M. (1999) The Application of Rheology to the
Evaluation of Bitumen Ageing. Fuel 79, Elsevier Science Ltd, pp1005-1015.
McDaniel, R. S., Soleymani, H., Anderson, R. M., Turner, P. and Peterson, R.
(2000) Recommended use of Reclaimed Asphalt Pavement in the Superpave
Mix Design Method. Web Document No. 30 (Project No. D9-12): Contractor‟s
Final Rep., NCHRP.
Merrill, D., Nunn, M. and Carswell, I. (2004) A Guide to the use and Specification
of Cold Recycled Materials for the Maintenance of Road Pavements. TRL Report
TRL611, TRL Limited, Crowthorne.
Milton, L. J. and Earland, M. G. (1999) Design Guide and Specification for
Structural Maintenance of Highway Pavements by Cold In-Situ Recycling. TRL
Report TRL386, Transportation Research Laboratory, Crowthorne.
Ministry of Mines and Steel Development Nigeria (2010) Nigeria: An Exciting New
Mining Destination. Ministry of Mines and Steel Development Nigeria,
http://www.mmsd.gov.ng (Accessed: 20/08/2010).
Mishra, D. and Tutumluer, E. (2007) Resilient Characterization of Compacted
Aggregate. Frozen Four Resilient Modulus Workshop, Urbana-Champaign, USA.
Montepara, A. and Giuliani, F. (2002) A Study on Design and performance of
Recycled Pavement Cold Stabilized with Cement and Bituminous Emulsion.
Proceeding of 4th European Symposium on Performance of Bituminous and
Hydraulic Materials in Pavement, BITMAT 4, University of Nottingham, UK, 11-
12 April 2002, A.A. Balkema Publishers, Netherlands, pp 213-217.
Mouillet, V., Lamontagne, J., Kister, J. and Martin, D. (2003) Development of a
New Methodology for Characterization of Polymer Modified Bitumens Ageing by
Infrared Microspectrometry Imaging. Proceedings of the 6th International
RILEM Symposium on Performance testing and Evaluation of Bituminous
Materials, Zurich, (ed. Partl, M.N.), RILEM Publications, Bagneux, pp 153-159.
Mubaraki, A. M. (2010) Predicting Deterioration for the Saudi Arabia Urban Road
Network. PhD Thesis, University of Nottingham.
Needham, D. (1996) Developments in bitumen emulsion mixtures for roads. PhD
Thesis, University of Nottingham.
Nguyen, V. H. (2009) Effects of Laboratory Mixing Methods and RAP Materials on
Performance of Hot Recycled Asphalt Mixtures. PhD Thesis, University of
Nottingham.
Nnanna, O.J. (2003) Highway Maintenance in Nigeria: Lessons from Other
Countries. Central Bank (of Nigeria) Research Department Occasional Paper
Series, CBN, Abuja.
Noureldin, A. S. and Wood, L. E. (1987) Rejuvenator Diffusion in Binder Film for
Hot-Mix Recycled Asphalt Pavement. Transportation Research Record 1115,
Transportation Research Board, National Research Council, Washington, DC, pp
51.
References
340
Nunn, M .E., Lawrence, D. and Brown, A. (2000) Deformation Resistance of
Asphalt. 2nd Eurasphalt & Eurobitume Congress Barcelona 2000, Proc.0181.uk.
O‟Flaherty, C. A. (1988) Highway Engineering. Highways 3rd Edition, Vol. 2,
Edwards Arnold, London, pp 661-669.
Oduroh, P. K. and Tuffor, Y. A. (1996) The Application of the fog seal technology
on a multiple chip seal in Ghana. Abstracts from AAPT.
Ojum, K. C. (2009) Using Cold Asphalt Emulsion Mixtures to Investigate The
Effects of Binder in Reclaimed Asphalt Pavements. M.Sc. Dissertation,
University of Nottingham.
Oliveira, J. R. M. (2006) Grouted Macadam: Material Characterisation for
Pavement Design. PhD Thesis, University of Nottingham.
Oruc, S., Celik, F. and Aksoy, A. (2006) Performance of Cement Modified Dense
Graded Cold-Mix Asphalt and Establishing Mathematical Model. Indian Journal
of Engineering & Materials Sciences, Vol. 13, December 2006, pp. 512-519.
Papagiannakis, A. T. And Masad, E. A. (2008) Pavement Design and Materials.
John Wiley and Sons, Hoboken.
Park, H. M. (2008) Univariate Analysis and Normality Test Using SAS, STATA, and
SPSS. Working Paper, The University Information Technology Services Centre
for Statistical and Mathematical Computing, Indiana University
http://www.indiana.edu/~statmath (Accessed: 20/11/2010).
Parry, T. (2009) Sustainable Construction. Lecture Notes, University of
Nottingham, Nottingham.
Pell, P. S. (1973) Characterisation of Fatigue Behaviour. Symposium on Structural
Design of Asphalt Concrete Pavements to Prevent Fatigue Cracking,
Nottingham.
Petersen, J. C. (1984) Chemical Composition of Asphalt as Related to Asphalt
Durability: State of the Art. TRR 999, Transportation Research Board,
Washington, DC, pp 13-30.
Petersen, J. C., Barbour, F. A. and Dorrence, S. M. (1974) Catalysis of Asphalt
Oxidation by Mineral aggregate Surface and Asphalt Components. Proc.
Association of Asphalt Paving Technologists, Vol. 43, pp 162-177.
Petersen, J. C., Robertson, R. E., Branthaver, J. F., Harsberger, P. M., Duvall, J.
J., Kim, S. S., Anderseon, D. A., Christiansen, D. W., Bahia, H. U., Dongre, R.,
Antle, C. E., Sharma, M. G., Button, J. W. and Glover, C. J. (1994) Binder
Characterization and Evaluation. Volume 4: Test Methods, SHRP-A-370, SHRP,
National Research Council, Washington, pp 1-16.
Petts (1994) Petts, R. C. (1994) International Road Maintenance Handbook. ODA
and TRRL, UK, pp III-1 –III-25.
PIARC (2003) Pavement Recycling Guidelines. World Road Association (PIARC),
Cedex.
PIARC (2008) Review of the Growth and Development of Recycling in Pavement
Construction. World Road Association, Cedex.
PTCA (2005) Pavement Guide Interactive. Pavement Tools Consortium,
http://training.ce.washington.edu/PGI/ (Accessed: 20/11/2007).
References
341
PW Nigeria Ltd (2007) Current Projects. http://www.pw-
limited.com/airports/index.php (Accessed: 20/12/2007).
Rahman, M. (2004) Characterisation of Dry Process Crumb Rubber Modified
Asphalt Mixtures. PhD Thesis, School of Civil Engineering, University of
Nottingham.
Read, J. M. (1996) Fatigue Cracking of Bituminous Paving Mixtures. PhD Thesis,
University of Nottingham.
Read, J. M. and Whiteoak, D. (2003) The Shell Bitumen Handbook. Fifth Edition,
Shell Bitumen, UK, Chertsey.
Research and Development Division Highways Department. (1992) Catalogue of
Road Defects. Publication No. RD/GN/015.
RILEM Report 17 (1998) Bituminous Binders and Mixes. (ed. Franken, L.), E & FN
Spon, London.
Roberts, D.V. (1997) Sustainable Development in Geotechnical Engineering.
Lecture Presented at GeoLogan ’97, Logan.
Roberts, F. L., Engelbrecht, J. C. and Kennedy, T. W. (1984) Evaluation of
Recycled Mixtures Using Foamed Asphalt. Transportation Research Record No.
968.
Roberts, F. L., Kandhal, P. S., Brown, E. R., Lee, D. Y. and Kennedy, T. W. (1991)
Hot Mix Asphalt Materials, Mixture Design, and Construction. NAPA Education
Foundation, Maryland.
Romanoschi, S.A., Heitzman, M. and Gisi, A.J. (2003) Foamed Asphalt Stabilized
Reclaimed Asphalt: A Promising Technology for Mid-Western Roads.
Proceedings of the August 2003 Mid-Continent Transportation Research
Symposium, Ames, Iowa.
Romera, R., Santamaria, A., Pena, J.J., Munoz, M.E., Barral, M. Garcia, E. and
Janez, V. (2006) Rheological Aspects of the Rejuvenation of Aged Bitumen.
Rheol Acta, Springer-Verlag, pp. 474-478.
SADLP (2010) Multiple Regression Analysis. South Africa Distance Learning
Project. University of Michigan, Ann Arbor http://saproject.psc.isr.umich.edu (Accessed: 09/08/2010).
Saleh, M.F. (2006) Experimental Investigation of Bitumen Physical Properties on
Foamability and Mechanical Properties of Foam Bitumen Stabilized Mixes. Third
Gulf Conference on Roads, (TGCR06), pp 92-98.
Santangata, F. A., Bocci, M., Grilli, A. and Cardone, F. (2009) Rehabilitation of an
Italian Highway by Cold In-Place Recycling Techniques. Advanced Testing and
Characterization of Bituminous Materials, (eds Loizos, A., Partl, Scarpas, T. and
Al-Qadi, I. L.), Taylor and Francis Group, London.
Santucci, L. E. (1977) Thickness Design Procedure for Asphalt and Emulsified
Asphalt Mixes. 4th Int. Conf. - Ann Arbor, pp 424-456.
Schiavi, I., Nunn, M., Nicholls, C. and Chambers, P. (2003) Effectiveness and
durability of Rejuvenating Agents. Proceedings of the 6th International RILEM
Symposium on Performance testing and Evaluation of Bituminous Materials,
Zurich, (ed. Partl, M.N.), RILEM Publications, Bagneux, pp148-152.
References
342
Scholz, T.V. (1995) Durability of Bituminous Paving Mixtures. PhD Thesis, School
of Civil Engineering, University of Nottingham.
Seed, H. C., Chan, C. K. and lee, C. E. (1962) Resilient Characteristics of
Subgrade Soils and Their Relation to Fatigue Failures in Asphalt Pavements.
Proc. Int. Conf. On the Structural Design of Asphalt Pavements, University of
Michigan, Ann Arbor.
Serfass, J. P., Carbonneau, X., Eckmann, B. and Triquigneaux, J. P. (2009) Design
Method for Cold and Warm Emulsion Mixtures Based on Links between
Laboratory and Field. Advanced Testing and Characterization of Bituminous
Materials, (eds Loizos, d. Q., Partl, M., Scarpas, T. and Al-Qadi, I.), Taylor and
Francis Group, London.
Serfass, J-P., Poirier, J-E., Henrat, J-P. and Carbonneau, X. (2003) Influence of
Curing on Cold Mix Mechanical Performance. Proceedings of the 6th
International RILEM Symposium on Performance testing and Evaluation of
Bituminous Materials, Zurich, (ed. Partl, M.N.), RILEM Publications, Bagneux,
pp 81-87.
Shell Global Solutions (1998) BISAR 3.0 Software and User’s Manual, Shell
International Oil Products, The Hague.
Shen, J., Amirkhanian, S. N. and Lee, S-J. (2007) HP-GPC Characterization of
Rejuvenated Aged CRM Binders. Journal of Materials in Civil Engineering, Vol.
19, No. 6, June 1, 2007, ASCE, Reston.
Sinclair, G. and Valentine, J. (1999) Road Recycling in Perth and Kinross. Proc.
Instn. Civ. Engrs Mun. Engr, 1999, 133, Dec., ICE, 165-171.
Smith, H. (1998) Recycling of Bituminous Road Materials. Transport, Issue 6 May
1998, Overseas Centre, TRL, Crowthorne.
Smith, H.R. and Edward, A.C. (2001) Recycling of Bituminous Materials. DFID
Project Report PR/INT/225/01, Project No. R6474, TRL Ltd, UK.
Smith, H.R. and Jones, C.R. (1998) Bituminous Surfacings for Heavily Trafficked
Roads in Tropical Climates. Paper 11513, Proc. Instn. Civ. Engrs Transp., 1998,
129, Feb, ICE, 28-33.
Soenen, H., Sandman, B. and Nilsson, A. (2000) Rheological and Chemical
Evaluation of the Ageing of SBS Modified Bitumen as Used in Roofing. 11th
International Congress Proceedings, International Waterproofing Association,
Nottingham.
Soleymani, H.R., Anderson, M., McDaniel, R. and Abdelrahman, M. (2000)
Investigation of the Black Rock Issue for Recycled Mixtures. Journal of the
Association of Asphalt Paving Technologists, Vol. 69, AAPT, White Bear Lake,
pp. 366-387.
Soleymani, H.R., Bahia, H.U. and Bergan, A.T. (1999) Time-Temperature of
Blended Rejuvenated Asphalt Binders. Journal of the Association of Asphalt
Paving Technologists, Vol. 68, AAPT, White Bear Lake, pp. 129.
Srivastava, A. and Rooijen, R.V. (2000) Bitumen Performance and Arid Climates.
Pavement Seminar for the Middle East and North Africa Region: Innovative
Road Rehabilitation and Recycling Technologies, New Polices and Practices in
Pavement Design and Execution, Amman.
References
343
Staple, P.R. (1997) Cold Emulsion Macadam Performance Trials for Footway
Surfacing in Leicestershire. Paper 11298, Proc. Instn. Civ. Engrs Transp., 1997,
123, Aug, 174-177.
Sterling, A.B. and Zamhari, K.A. (1997) Designing Asphalt to Last. Road Research
Development Project, Published Paper PA 8, 3rd Annual Bitumen Conference
Singapore, 25-27 June 1997, TRL and PT, Yodya Karya.
Sunarjono, M. T. (2008) The Influence of Foamed Bitumen Characteristics on
Cold-Mix Asphalt Properties. PhD Thesis, University of Nottingham.
Taherkhani, H. (2006) Experimental Characterisation of the Compressive
Permanent Deformation Behaviour in Asphaltic Mixtures. PhD Thesis, University
of Nottingham.
Tandon, V., Bai, X. and Nazarian, S. (2006) Impact of Specimen Geometry on
Dynamic Modulus Measurement Test Setup. Journal of Materials in Civil
Engineering, Vol. 18, No. 4, August 1, 2006, ASCE, Reston.
Tayebali, A.A., Tsai, B, and Monismith (1994) Stiffness of Asphalt-Aggregate
Mixes. SHRP-a-388, Strategic Highway Research Program, National Research
Council, Washington, DC.
Thanaya, I. N. A. (2003) Improving The Performance of Cold Bituminous Emulsion
Mixtures (CBEMs) Incorporating Waste Materials. PhD Thesis, School of Civil
Engineering, the University of Leeds, Leeds.
Thanaya, I. N. A. (2007a) Evaluating and Improving the Performance of Cold
Asphalt Emulsions Mixes, Civil Engineering Dimension, September 2007, Vol. 9,
No. 2, 64-69, Indonesia.
Thanaya, N.A. (2007) Review and Recommendation of Cold Asphalt Emulsion
Mixtures Design. Civil Engineering Dimension, March 2007, Vol. 9, No. 1,
Indonesia.
Thom, N. H. (2008) Principles of Pavement Engineering. Thomas Telford
Publishing Limited, London.
Thom, N. H. (1996) Flexible Pavement Design. Lecture Notes, Residential Course
on Bituminous Pavements, Department of Civil Engineering, University of
Nottingham.
Thom, N. H. (2000) A simplified Computer Model for Grid Reinforced Asphalt
Overlays. Proceedings of the 4th International RILEM Conference on Reflective
Cracking in Pavements, Ottawa, pg 37-46.
Thom, N. H. (2009) Cold-Mix Asphalt. Lecture Notes, University of Nottingham.
Traxler, R. N. (1963) Durability of Asphalt Cements. Association of Asphalt Paving
Technologists, Vol. 32, pp 44-63.
TRL and DFID (2002) Overseas Road Note 19: A guide to the design of hot mix
asphalt in tropical and subtropical countries. TRL, Crowthorne.
TRRL (1993) Overseas Road Note 31: a Guide to the Structural Design of
bitumen-Surfaced Roads in tropical and Sub-Tropical Countries. Overseas
Centre, TRL, Crowthorne.
Twagira, E. M. (2010) Influence of Durability Properties on Performance of
Bitumen Stabilized Materials. PhD Dissertation, Stellenbosch University.
References
344
Uket, O. (2007) Nigeria: FG May Introduce Asphalt Recycling for Road
Construction. Leadership, Abuja, allafrica.com/stories/200709260661.html
(Accessed: 20/11/2007).
Ulmgren, N. (2003) Gyratory Compaction- Influence of Compaction angle on
Stability and Stiffness Characteristics. Proceedings of the 6th International
RILEM Symposium on Performance testing and Evaluation of Bituminous
Materials, Zurich, (ed. Partl, M.N.), RILEM Publications, Bagneux, pp 244-249.
UNECA (2007) The Transport Situation in Africa. Fifth Session of the Committee
on Trade, Regional Cooperation and Integration, Addis Ababa.
UNECA (2009) Africa Review Report on Transport. Sixth Session of the Committee
on Food Security and Sustainable Development (CFSSD-6)/Regional
Implementation Meeting (RIM) for CSD-18, Addis Ababa.
UNESCAP (2006) Development of the Asian Highway. Transport and Tourism
Division, UNESCAP, Bangkok.
United Nations (1992) Agenda 21- The United Nations Programme of Action from
Rio. United Nations Conference on Environment and Development (UNCED),
Rio de Janeiro http://www.un.org (Accessed: 20/11/2010).
Walter, J., Attané, P., Kalaaji, A. and Lancaster, I. (2008) Regeneración del betún
en el proceso de reciclado en frío (Bitumen regeneration in cold recycling
processes). Carreteras, número 158/Mar-Abr 08, pp 27-35.
Walubita, L.F., Martin, A.E., Glover, C., Jung, S.H., Cleveland, G. and Lytton, R.L.
(2005) Fatigue Characterization of HMAC Mixtures Using Mechanistic Empirical
and Calibrated Mechanistic Approaches including the Effects of Aging, Asphalt
Concrete: simulation, Modeling, and Experimental Characterization.
Proceedings of the R. Lytton Symposium on Mechanics of Flexible Pavements,
Geotechnical Special Publication No. 146, ASCE, pp. 103-114.
Welborn, J. Y. (1979) Relationship of Asphalt cement properties to pavement
durability. NCHRP Synthesis 59, Washington, DC.
White, T. D., Haddock, J. E., Hand, A. J. T., and Fang, H. (2002) Contributions of
Pavement Structural Layers to Rutting of Hot Mix Asphalt Pavements. NCHRP
Report 468, Transportation Research Board, National Research Council,
National Academy Press, Washington, DC.
Widyatmoko, I., Elliot, R.C., Heslop, M.W. and Williams, J.T. (2002) Ageing
Characteristics of Some Low Penetration Grade Binders. 4th European
Symposium on the Performance of Bituminous and Hydraulic Materials in
Pavements, University of Nottingham.
Wirtgen (2004) Wirtgen Cold Recycling Manual. Wirtgen GMbH, Windhagen.
Wirtgen (2005) Cold Recycling Rehabilitation of a Heavily Trafficked Road.
Wirtgen GMbH, Windhagen.
Woodside, A. R., Woodward, W. D. H. and Phillips, P. (2000) Sustainable Reuse of
Highway Materials in Hot and Cold Bituminous Mixtures. Proc. Instn. Civ. Engrs
Mun. Engr, 139, Sept, pp 181-186.
Wu, J. (2009) The Influence of Mineral Aggregates and Binder Volumetrics on
Bitumen Ageing. PhD Thesis, University of Nottingham.
References
345
Wu, J., Lepercq, E. and Airey, G. D. (2007) Ageing of bitumen in bulk versus the
ageing in asphalt mixture. Advanced Testing and Characterization of Soil
Engineering Material, (eds Lois, d. Q., Partl, M., Scarpas, T. and Al-Qadi, I.),
Taylor and Francis Group, London.
Yusof, M. A. (2005) Investigating the Potential for Incorporating Tin Slag in Road
Pavements. PhD Thesis, University of Nottingham.
Zammatoro, S. (2008) From Green Dreams to Green Realities. The Nottingham
Symposium – Green Dreams, The Institution of Highways and Transportation,
Nottingham.
Zoorob, S. E. and Thanaya, I.N.A. (2002) Improving the Performance of Cold
Bituminous Emulsion Mixtures (CBEMs) Incorporating Waste Materials.
Proceeding of 4th European Symposium on Performance of Bituminous and
Hydraulic Materials in Pavement, BITMAT 4, University of Nottingham, UK, 11-
12 April 2002, A.A. Balkema Publishers, Netherlands, pp 237-249.
Zube, E. and Skog, J. (1969) Final Report on the Zaca-Wigmore Asphalt Road
Test. AAPT, Vol. 38, pp 1-38.