oil gas modeling: quiz questions - amazon web services… · · 2017-06-27module 3 – valuation...
TRANSCRIPT

www.BreakingIntoWallStreet.com
Oil & Gas Modeling: – Quiz Questions
Module 3 – Valuation and Simplified NAV Model
1. Some people argue that you SHOULD factor in the Net Value of Derivatives used for
commodity price hedging when calculating Enterprise Value (EV) for an E&P company,
since derivatives are cash‐like items. Why might you decide NOT factor them in?
a. Because derivatives are directly related to the company’s operations and we do NOT
include operational items in the EV calculation – only financing‐related items.
b. Because including derivatives in the EV calculation is effectively “double‐counting,”
since metrics such as revenue, EBIT, and EBITDAX already reflect the impact of
hedging.
c. Because you should only include derivatives related to FX rate and interest rate
hedging, i.e. ones that are more financial and less operational in nature.
d. All of the above.
e. None of the above – you always factor in the net value of all derivatives when
calculating Enterprise Value for any E&P company.
2. Which of the following metrics should be used for COMPARATIVE purposes when
analyzing sets of oil & gas comparable companies, but not for approximating actual cash
flow generated?
a. Unlevered Free Cash Flow.
b. EBITDAX.
c. EBITDA.
d. Proved Reserves.
e. Levered Free Cash Flow.
f. Daily Production.

www.BreakingIntoWallStreet.com
3. Should you use Equity Value or Enterprise Value when calculating valuation multiples
based on Proved Reserves and Daily Production?
a. Equity Value for both, since you often calculate metrics such as Proved Reserves per
Share and Daily Production per Share – both of those are on a per share basis, so it
indicates that you should use Equity Value in the multiples.
b. Either Equity Value or Enterprise Value could be used, since neither one is a
traditional financial metric – net interest expense cannot possibly show up in either
one of them.
c. Enterprise Value should be used since Proved Reserves and Daily Production are
available to ALL investors in the company – not just equity investors.
d. Enterprise Value should be used for Proved Reserves and Equity Value should be
used for Daily Production, since Proved Reserves are available to all investors but
the company’s production is only available to equity investors.

www.BreakingIntoWallStreet.com
4. For this question and the next 3 questions, please review Exhibits 3.4.01, 3.4.02, and
3.4.03 below, which depict partial versions of the 3 financial statements for EOG
Resources:
Exhibit 3.4.01 – EOG Partial Income Statement

www.BreakingIntoWallStreet.com
Exhibit 3.4.02 – EOG Balance Sheet

www.BreakingIntoWallStreet.com
Exhibit 1.04.03 – EOG Partial Cash Flow Statement

www.BreakingIntoWallStreet.com
Based on the screenshots above, which of the following items are CORRECT add‐backs or
adjustments if you’re calculating EBITDAX for EOG, starting from the Operating Income figure
on its Partial Income Statement?
a. Add back the entire Depreciation, Depletion & Amortization (DD&A) expense.
b. Add back only the Depreciation & Amortization portion of the DD&A expense.
c. Subtract the Gains on Mark‐to‐Market Commodity Derivative Contracts as shown on the
Income Statement.
d. Subtract only the non‐cash portion of the Income Statement Gains on Mark‐to‐Market
Commodity Derivative Contracts.
e. Subtract the Gains on Property Dispositions, Net.
f. Go to the cash flow statement and subtract only the non‐cash portion of the Gains on
Property Dispositions, Net.
g. Add back the Impairment Expense (listed on the IS and CFS).
h. Add back Exploration Costs.
i. Add back Dry Hole Costs.
j. Add back “Taxes Other Than Income.”
5. Based on your response above and the screenshots shown in Exhibits 3.4.01 through
3.4.03, please calculate EBITDA and EBITDAX for EOG Resources. Assume that Stock‐Based
Compensation IS added back to both numbers (it could go either way, but please assume
that it IS an add‐back here). All the numbers below are in MILLIONS, i.e. $1,540 million =
$1.54 billion.
a. TTM EBITDA = $1,045; TTM EBITDAX = $1,167.
b. TTM EBITDA = $1,405; TTM EBITDAX = $1,617.
c. TTM EBITDA = $1,450; TTM EBITDAX = $1,671.
d. TTM EBITDA = $1,540; TTM EBITDAX = $1,761.

www.BreakingIntoWallStreet.com
6. Suppose that EOG Resource’s current Diluted Equity Value is $22,289 million (i.e. $22.3
billion). Clearly, we would subtract Cash on the Balance Sheet ($686 million) and add Debt
on the Balance Sheet (~$2.8 billion total) to calculate the company’s Enterprise Value.
However, there may also be items NOT listed explicitly on the Balance Sheet that will
factor into Enterprise Value as well.
Which of the following choices represent items that WOULD factor into Enterprise Value
and which are either 1) NOT listed on EOG’s Balance Sheet, or 2) Which ARE listed but
which MAY be embedded in other line items, and are NOT already included in the Cash
and Debt numbers quoted above?
a. Net Value of Derivatives.
b. Investments in Equity Interests.
c. Preferred Stock.
d. Capital Leases.
e. Noncontrolling Interests.
f. Asset Retirement Obligation.
g. Unfunded Pension Obligations.
h. Short‐Term Marketable Securities.
i. Cash Portion of Deferred Income Taxes.

www.BreakingIntoWallStreet.com
7. As shown above, EOG’s Cash Flow from Investing in this year is negative $3.4 billion, while
its Cash Flow from Operations is $2.9 billion. What do those numbers imply about its
financing needs in future years?
a. It means the company will likely raise debt or issue equity this year, but beyond that
you cannot say much since only one (1) year of the financial statements is shown
above.
b. It implies that the company will likely need to raise substantial funding in each
subsequent year because there are no one‐time or extraordinary items that impact
the cash flow generated here.
c. Since most of the cash flow shortfall is driven by changes in Operating Working
Capital (i.e. Current Assets Excluding Cash Less Current Liabilities Excluding Debt), it
means that the company has a short‐term cash flow crunch, but won’t necessarily
need ongoing funding sources in the future.
d. We can’t say anything here because DD&A is only about 50% of CapEx, which is
unusual for an E&P company and indicates non‐standard cash flow.
8. You are valuing a small E&P company that has recently found significant oil and gas
reserves with a very high probability of recovery. However, it will take at least 2 years to
acquire all the appropriate licenses, move a drilling rig into the area, and complete all the
required infrastructure before production can begin.
Which of the valuation multiples and/or methodologies listed below would be MOST
APPROPRIATE to value a company in this situation?
a. Net Asset Valuation (NAV).
b. EV / Revenue.
c. EV / EBITDAX.
d. A “Longer‐Term” DCF that forecasts FCF over 10‐20 years rather than 5‐10 and
which uses the Gordon Growth Method for the Terminal Value.
e. EV / Proved Reserves.
f. EV / Daily Production.

www.BreakingIntoWallStreet.com
9. For this question, please consider the screenshot below, which depicts a set of public comps in the E&P sector. Key operating
and financial metrics are shown in the top area, and key valuation multiples are shown below:

www.BreakingIntoWallStreet.com
Which of the following conclusions about this set of comparable companies might you
draw, based on the screenshot shown above?
a. Contrary to what you normally expect, there appears to be almost no correlation
between EBITDAX growth and EV / EBITDAX multiples.
b. XTO Energy seems undervalued compared to the rest of the comps right now, since
its operational metrics are in‐line with the medians of the set but it trades below the
median valuation multiples.
c. It seems like there is some correlation between the % oil produced and the reserves
and production‐based multiples.
d. One reason the multiples do not trend in a clear way with the operating metrics is
that some of the companies have made acquisitions that distort the figures.
e. There appears to be a strong correlation between the Reserve Life Ratio and all the
valuation multiples, as you normally expect.
f. There’s also a clear correlation between the size of the Proved Reserves and the
Daily Production volumes, and the respective valuation multiples for both of those.
10. Which of the following statements are TRUE regarding why a traditional DCF does not
always work well for an E&P company?
a. Because the change in working capital is NOT meaningful for energy companies, so it
is NOT possible to determine Free Cash Flow using traditional methods.
b. Because a DCF for an E&P company will be even more reliant on Terminal Value than
a DCF for a normal company.
c. Because E&P companies have high CapEx requirements, which reduces Free Cash
Flow and may result in a negative FCF in many years.
d. Because fluctuating commodity prices make it difficult to run the analysis and
determine a reasonable terminal period growth rate.
e. Because it is very difficult to determine the proper discount rate to use, given the
uncertainty that comes with searching for new oil/gas fields.

www.BreakingIntoWallStreet.com
11. Which of the following statements are TRUE regarding the KEY DIFFERENCES in a DCF
analysis for an E&P company?
a. Unlike with normal companies, in E&P you can use an industry‐standard discount
rate of 10% rather than calculating WACC.
b. To calculate Unlevered FCF for an E&P company, you need to add‐back additional
non‐cash expenses that are specific to the sector.
c. The Terminal Value calculation for an E&P company can be based on a multiple of
Proved Reserves or Daily Production, in addition to the more standard metrics.
d. You would create sensitivity tables based on commodity prices rather than revenue
growth rates or EBITDA margins.
e. When you go from Enterprise Value to Equity Value, you will include slightly
different Balance Sheet adjustments than in the standard analysis.
12. What items might you add back or subtract when calculating Unlevered Free Cash Flow
for an E&P company that you would NOT add back for a normal company?
a. Depreciation, Depletion, and Amortization (DD&A) instead of normal D&A.
b. Gains and Losses on Asset Sales.
c. Non‐Cash Derivative Gains / (Losses).
d. Taxes Other Than Income.
e. Stock‐Based Compensation.
f. Accretion of Discount in Asset Retirement Obligation.
g. Goodwill Impairment.
h. Impairment of Natural Gas and Oil Properties.
i. Proceeds from the Sale of Natural Gas and Oil Properties.
www.BreakingIntoWallStreet.com
13. Why is the Net Asset Value (NAV) model, arguably, more conceptually sound than the DCF
model when you are valuing E&P companies?
a. Because it is more conservative and does NOT assume indefinite future growth like
the DCF analysis does.
b. Because the NAV model uses a more realistic discount rate than the DCF analysis.
c. Because the NAV model assumes that the company will eventually run out of
resources, after an initial growth period, and values its cash flows on the basis of
that assumption.
d. Because natural resource companies are Balance Sheet‐centric and the NAV model
values such companies at the asset‐level rather than the corporate‐level.
e. Because the NAV model assumes a higher growth rate in After‐Tax Cash Flows than
the Free Cash Flow growth rate assumed in in a DCF analysis.
14. If the NAV valuation is very far out of line with the public comps and other
methodologies, which of the following answer choices represent SOUND ways to adjust it
downward so that it can still be compared to other methodologies, but also so that the
NAV produces a lower relative value?
a. Adjust downward the annual Production Levels in the initial years of the model.
b. Adjust downward the commodity prices in each different scenario.
c. Increase the long‐term production decline rate, but only in years after the initial
period of the model.
d. Increase the discount rate for the NAV model.
e. If you’re not already doing so, apply risking to non‐Proved Reserves so that the value
of cash flows derived from Probable and Possible Reserves is less than 100%.

www.BreakingIntoWallStreet.com
15. Which of the following statements is TRUE regarding a NAV model that produces a much
higher or lower value than what is shown in a company’s PV‐10 in its filings?
a. It is an indication of a mistake, most likely because you did NOT use the industry‐
standard oil & gas discount rate.
b. It is an indication of a mistake, most likely because you assumed too high of an
Annual Production growth rate in the first few years.
c. It is an indication of a mistake, most likely because you forgot to include the value of
undeveloped land and non‐E&P related segments.
d. None of the above – it is not necessarily indicative of a mistake since commodity
price swings can cause this to happen, and you can’t even determine what caused
the discrepancy without knowing the PV‐10 assumptions.

www.BreakingIntoWallStreet.com
16. Suppose that you’re building a NAV model where you want to factor in 5 different reserve
types – Proved Developed Producing (PDP), Proved Developed Nonproducing (PDNP),
Proved Undeveloped (PUD), Probable (PROB), and Possible (POSS). The company also
produces oil and gas in 3 different regions of the US, and so you want to split the model
by region as well.
Which of the following answer choices represent how this model would be DIFFERENT from
a simpler NAV model that groups all reserve types and regions together?
a. You would most likely assume different success probabilities (“reserve credits”) for
PDP, PDNP, and PUD reserves – you have to discount anything that is not yet
producing or developed, after all.
b. You would use different reserve credit levels for Probable and Possible reserves, but
not for the Proved Reserves since there’s an extremely high probability they can be
recovered.
c. You would have to assume that some CapEx is spent constructing the wells for the
PUD, PROB, and POSS reserves over time, but that the PDP and PDNP wells can start
producing relatively quickly (or continue producing in the case of PDP).
d. You would assume different commodity prices for each region and each reserve
type, since oil and gas can be sold for different amounts in different parts of the
world.
e. You might assume different reserve credits for PROB and POSS reserves depending
on the region as well.
f. You might assume different production growth curves, decline rates, and initial
production levels in different regions.

www.BreakingIntoWallStreet.com
17. For this question and the next 4 questions, please consider the Net Asset Value (NAV)
Model shown in the screenshots below for Occidental Petroleum [OXY]. Exhibit 3.17.01
shows the key model assumptions, Exhibit 3.17.02 shows the cash flow projections, and
Exhibit 3.17.03 shows the NAV per share calculation at the end.
Exhibit 3.17.01 – NAV Assumptions

www.BreakingIntoWallStreet.com
Exhibit 3.17.02 – NAV Cash Flow Projections
Oil Natural Gas Liquids Natural Gas Revenue ($ in Millions) Production & Development Expenses: Cash Flows ($ in Millions)
Beginning Annual Avg. Beginning Annual Avg. Beginning Annual Avg. Total Total
Reserves Production Price Reserves Production Price Reserves Production Price Natural Total Annual Production Production Development Pre‐Tax Cash After‐Tax
(MMBbls) (MMBbls) $ / Bbl (MMBbls) (MMBbls) $ / Bbl (Bcf) (Bcf) $ / Mcf Oil & NGL Gas Revenue MMBOE Per BOE Expenses Expenses Cash Flows Tax Rate Cash Flows
Year 1 2,008 167 75.00$ 280 31 45.00$ 5,323 469 3.00$ 13,955$ 1,408$ 15,363$ 277 25.00$ 6,921$ 3,551$ 4,892$ 30.0% 3,424$
Year 2 1,841 169 75.00 249 33 45.00 4,854 483 3.00 14,151 1,450 15,602 282 25.00 7,060 3,551 4,990 30.0% 3,493
Year 3 1,672 171 75.00 216 35 45.00 4,370 498 3.00 14,352 1,494 15,846 288 25.00 7,204 3,551 5,091 30.0% 3,563
Year 4 1,501 172 75.00 181 36 45.00 3,872 513 3.00 14,558 1,539 16,096 294 25.00 7,352 3,551 5,193 30.0% 3,635
Year 5 1,329 174 75.00 145 38 45.00 3,359 528 3.00 14,769 1,585 16,353 300 25.00 7,505 3,551 5,298 30.0% 3,708
Year 6 1,155 172 75.00 107 37 45.00 2,831 518 3.00 14,604 1,553 16,157 296 25.00 7,398 ‐ 8,759 30.0% 6,131
Year 7 982 171 75.00 70 37 45.00 2,313 507 3.00 14,441 1,522 15,963 292 25.00 7,293 ‐ 8,670 30.0% 6,069
Year 8 812 169 75.00 33 33 45.00 1,806 497 3.00 14,156 1,492 15,647 285 25.00 7,121 ‐ 8,526 30.0% 5,968
Year 9 643 167 75.00 ‐ ‐ 45.00 1,309 487 3.00 12,541 1,462 14,003 248 25.00 6,211 ‐ 7,792 30.0% 5,455
Year 10 476 159 75.00 ‐ ‐ 45.00 822 463 3.00 11,914 1,389 13,303 236 25.00 5,900 ‐ 7,403 30.0% 5,182
Year 11 317 151 75.00 ‐ ‐ 45.00 359 359 3.00 11,318 1,076 12,395 211 25.00 5,268 ‐ 7,127 30.0% 4,989
Year 12 166 143 75.00 ‐ ‐ 45.00 ‐ ‐ 3.00 10,752 ‐ 10,752 143 25.00 3,584 ‐ 7,168 30.0% 5,018
Year 13 23 23 75.00 ‐ ‐ 45.00 ‐ ‐ 3.00 1,689 ‐ 1,689 23 25.00 563 ‐ 1,126 30.0% 788
Year 14 ‐ ‐ 75.00 ‐ ‐ 45.00 ‐ ‐ 3.00 ‐ ‐ ‐ ‐ 25.00 ‐ ‐ ‐ 30.0% ‐
Year 15 ‐ ‐ 75.00 ‐ ‐ 45.00 ‐ ‐ 3.00 ‐ ‐ ‐ ‐ 25.00 ‐ ‐ ‐ 30.0% ‐
Year 16 ‐ ‐ 75.00 ‐ ‐ 45.00 ‐ ‐ 3.00 ‐ ‐ ‐ ‐ 25.00 ‐ ‐ ‐ 30.0% ‐
Year 17 ‐ ‐ 75.00 ‐ ‐ 45.00 ‐ ‐ 3.00 ‐ ‐ ‐ ‐ 25.00 ‐ ‐ ‐ 30.0% ‐
Year 18 ‐ ‐ 75.00 ‐ ‐ 45.00 ‐ ‐ 3.00 ‐ ‐ ‐ ‐ 25.00 ‐ ‐ ‐ 30.0% ‐
Year 19 ‐ ‐ 75.00 ‐ ‐ 45.00 ‐ ‐ 3.00 ‐ ‐ ‐ ‐ 25.00 ‐ ‐ ‐ 30.0% ‐
Year 20 ‐ ‐ 75.00 ‐ ‐ 45.00 ‐ ‐ 3.00 ‐ ‐ ‐ ‐ 25.00 ‐ ‐ ‐ 30.0% ‐
Present Value of Cash Flows from Proved Reserves: 30,709$
www.BreakingIntoWallStreet.com
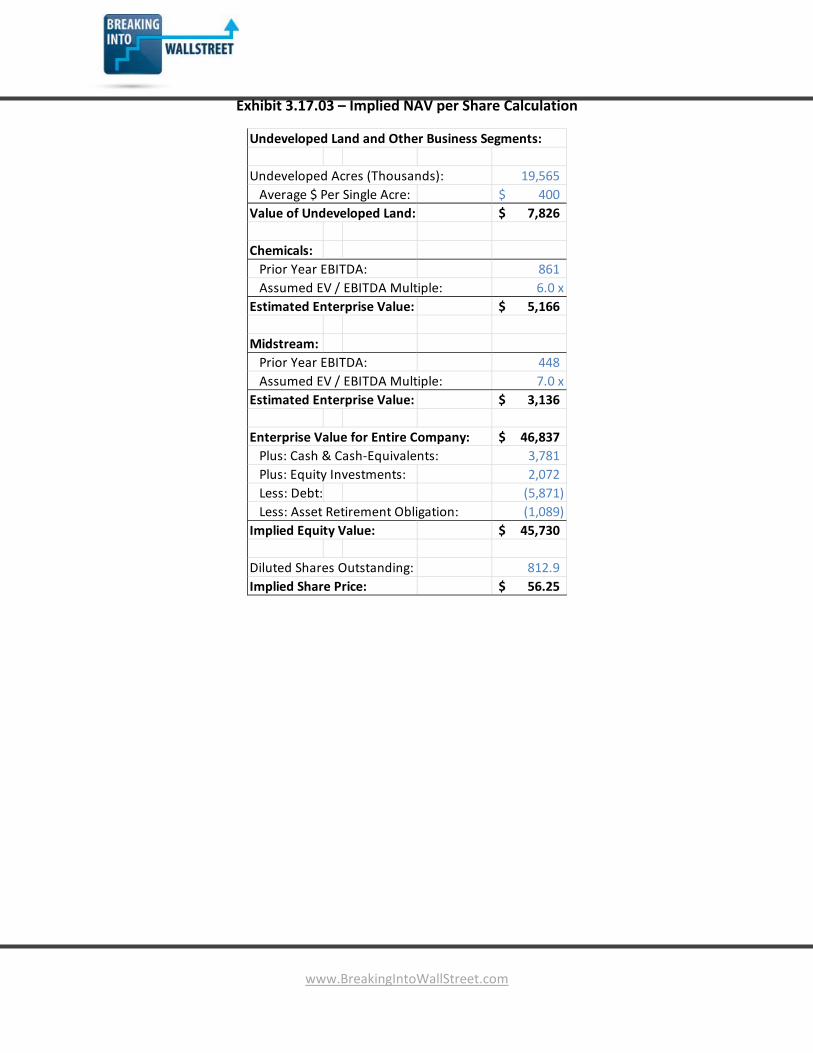
Exhibit 3.17.03 – Implied NAV per Share Calculation
Undeveloped Land and Other Business Segments:
Undeveloped Acres (Thousands): 19,565
Average $ Per Single Acre: 400$
Value of Undeveloped Land: 7,826$
Chemicals:
Prior Year EBITDA: 861
Assumed EV / EBITDA Multiple: 6.0 x
Estimated Enterprise Value: 5,166$
Midstream:
Prior Year EBITDA: 448
Assumed EV / EBITDA Multiple: 7.0 x
Estimated Enterprise Value: 3,136$
Enterprise Value for Entire Company: 46,837$
Plus: Cash & Cash‐Equivalents: 3,781
Plus: Equity Investments: 2,072
Less: Debt: (5,871)
Less: Asset Retirement Obligation: (1,089)
Implied Equity Value: 45,730$
Diluted Shares Outstanding: 812.9
Implied Share Price: 56.25$

www.BreakingIntoWallStreet.com
In a simple NAV model, you often assume that production declines until the reserves are
depleted entirely. In Exhibit 3.17.01 above, we’re assuming a slight INCREASE in
production across all natural resource segments in the first few years. If that is true, what
other conditions must be TRUE in the model?
a. You must assume lower commodity prices to offset the increase in annual
production.
b. You must assume a higher cash tax rate when calculating After‐Tax Cash Flows since
the increased annual production will reduce the Deferred Income Taxes.
c. In addition to projecting cash flows from PDP and PDNP reserves, you must also
project cash flows from PUD reserves.
d. This assumption means that you need to change the reserve types and include
Probable and Possible Reserves in addition to just Proved Reserves.
e. You must assume some amount of Development Expenses since it is NOT possible to
increase annual production without drilling and developing more wells.
f. None of the above – you can assume an increase in annual production in the
beginning years WITHOUT anything else above necessarily being true.
18. If we were to change the commodity price deck assumptions and assume different prices
each year, where’s the most logical place to do that?
a. You should only do this in Year 1, and only if current commodity prices differ
significantly from your assumptions.
b. Years 1 through 3, since you might have more visibility into potential short‐term
price changes.
c. Only beyond Year 5 – assuming different prices earlier on might distort the model
results too much since production levels are higher in earlier years.
d. The question premise is false because you should NEVER assume different
commodity prices in any year in a NAV model – the entire point of the model is to
avoid making these types of guesstimates.

www.BreakingIntoWallStreet.com
19. In Exhibit 3.17.02 above under Natural Gas Liquids, Annual Production in Year 2 is 33
MMBbls (Note: Please see the cell circled in red in the exhibit above). Which of the
answer choices below gives the CORRECT FORMULA for that cell, and which one correctly
explains why we need it?
a. =MIN(Beginning Reserves Yr. 2, Annual Production Yr. 1 * (1 + Natural Gas Liquid
Production Growth Rate)).
b. =MAX(MIN(Beginning Reserves Yr. 2, Annual Production Yr. 1 * (1 + Natural Gas
Liquid Production Growth Rate)), 0).
c. We are using a MIN formula to make sure that the annual production never drops
below 0.
d. We are using a MIN formula to make sure that we never produce more than the
total amount of remaining reserves.
e. We are using a MAX formula to make sure that the annual production never drops
below 0.
f. We are using a MAX formula to make sure that we never produce more than the
total amount of remaining reserves.
20. In Exhibit 3.17.03 above, we add the value of Undeveloped Land, based on the average
dollar per acre value, as well as the value of the Chemicals and Midstream segments.
Which of the following choices represent ALTERNATE ways to factor in the value from
these segments?
a. Similar to what you did for the E&P segment, you could use a NAV analysis for the
Midstream segment instead of applying an EV / EBITDA multiple.
b. You could run a DCF analysis for the Midstream segment and for the Chemicals
segments and add the implied values from that analysis.
c. You could assume that a certain percentage of the Undeveloped Land will contain
reserves, split the reserves into different types, and run a NAV model for each
reserve category (assuming that brand new wells are drilled).
d. None of the above – what’s shown in Exhibit 3.17.03 is the most acceptable way of
factoring in the values from these other segments.

www.BreakingIntoWallStreet.com
21. What is one possible PROBLEM with factoring in the value of Undeveloped Land the way
we have here, vis‐à‐vis the assumptions and cash flow projections in Exhibits 3.17.01 and
3.17.02 above this one?
a. There is no problem – Undeveloped Land is completely separate from anything we
assumed in the cash flow projections.
b. Some of this Undeveloped Land may actually be included in the PUD Reserves, so we
may need to adjust downward the value contributed by Undeveloped Land, or
exclude from the analysis cash flows derived from those reserves.
c. Although Undeveloped Land may be included in the company’s reserves, there’s no
problem here because Undeveloped Land could only contain Probable and Possible
Reserves – and in the NAV model we’re ignoring those.
d. If we factor in Undeveloped Land, we should NOT also be assuming Development
Expenses (CapEx) in the cash flow projections.
22. In which of the following geographies would you MOST likely use a discount rate higher
than the O&G industry standard of 10%?
a. USA.
b. Canada.
c. Russia.
d. Venezuela.