oil & gas marketing companies -...
TRANSCRIPT
BRP - 009
Day Break
Monday, 26 February 2018
Page | 1
Oil & Gas – Marketing Companies
PSO: Analyst Briefing Takeaway 2QFY18
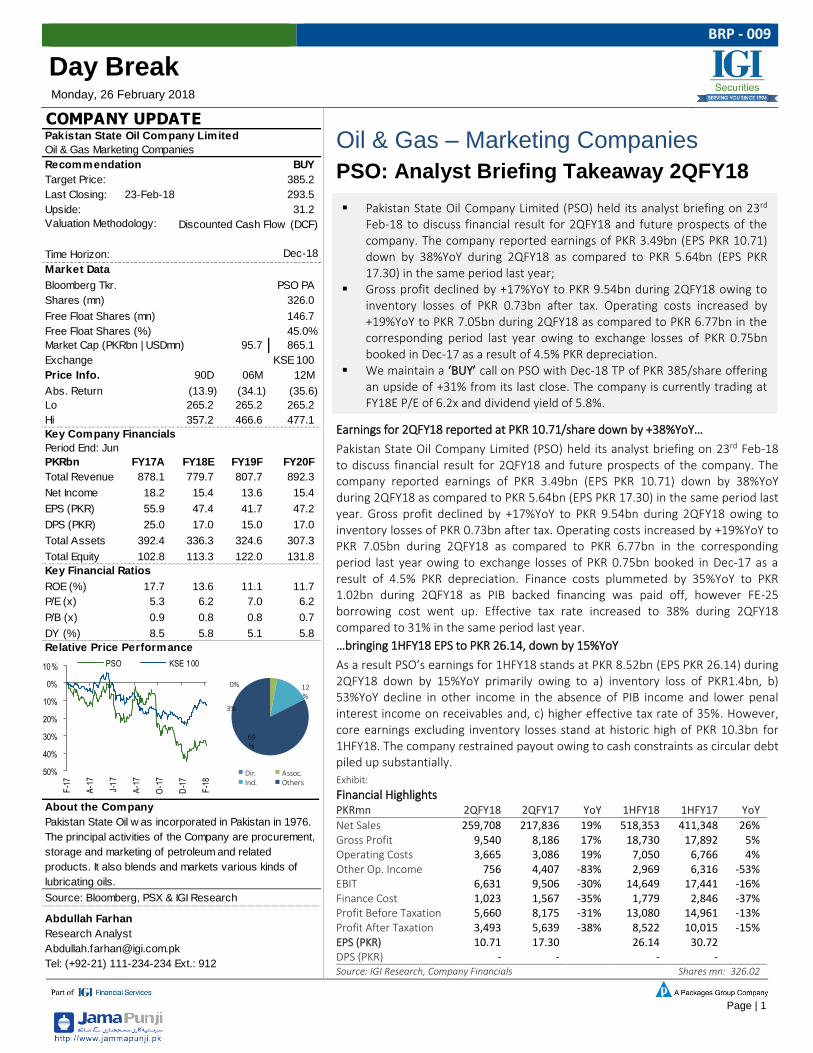
Earnings for 2QFY18 reported at PKR 10.71/share down by +38%YoY…
Pakistan State Oil Company Limited (PSO) held its analyst briefing on 23rd Feb-18 to discuss financial result for 2QFY18 and future prospects of the company. The company reported earnings of PKR 3.49bn (EPS PKR 10.71) down by 38%YoY during 2QFY18 as compared to PKR 5.64bn (EPS PKR 17.30) in the same period last year. Gross profit declined by +17%YoY to PKR 9.54bn during 2QFY18 owing to inventory losses of PKR 0.73bn after tax. Operating costs increased by +19%YoY to PKR 7.05bn during 2QFY18 as compared to PKR 6.77bn in the corresponding period last year owing to exchange losses of PKR 0.75bn booked in Dec‐17 as a result of 4.5% PKR depreciation. Finance costs plummeted by 35%YoY to PKR 1.02bn during 2QFY18 as PIB backed financing was paid off, however FE-25 borrowing cost went up. Effective tax rate increased to 38% during 2QFY18 compared to 31% in the same period last year.
…bringing 1HFY18 EPS to PKR 26.14, down by 15%YoY
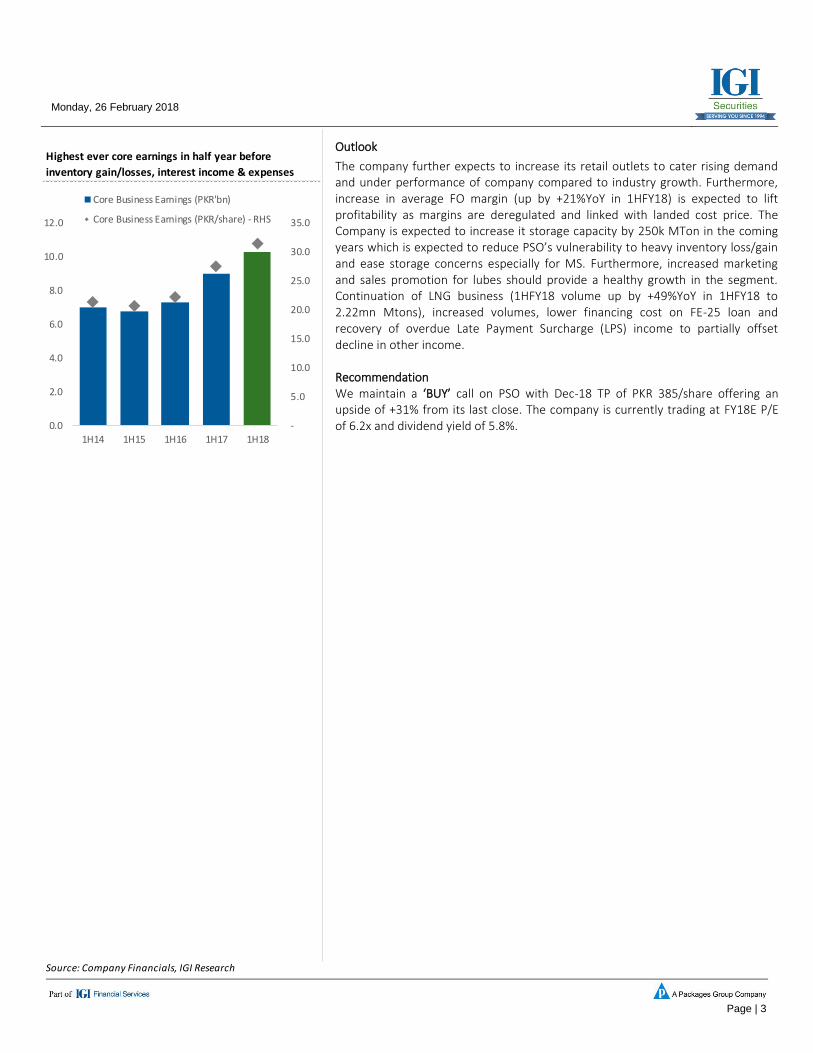
As a result PSO’s earnings for 1HFY18 stands at PKR 8.52bn (EPS PKR 26.14) during 2QFY18 down by 15%YoY primarily owing to a) inventory loss of PKR1.4bn, b) 53%YoY decline in other income in the absence of PIB income and lower penal interest income on receivables and, c) higher effective tax rate of 35%. However, core earnings excluding inventory losses stand at historic high of PKR 10.3bn for 1HFY18. The company restrained payout owing to cash constraints as circular debt piled up substantially.
Exhibit:
Financial Highlights
PKRmn 2QFY18 2QFY17 YoY 1HFY18 1HFY17 YoY
Net Sales 259,708 217,836 19% 518,353 411,348 26% Gross Profit 9,540 8,186 17% 18,730 17,892 5% Operating Costs 3,665 3,086 19% 7,050 6,766 4% Other Op. Income 756 4,407 -83% 2,969 6,316 -53% EBIT 6,631 9,506 -30% 14,649 17,441 -16% Finance Cost 1,023 1,567 -35% 1,779 2,846 -37% Profit Before Taxation 5,660 8,175 -31% 13,080 14,961 -13% Profit After Taxation 3,493 5,639 -38% 8,522 10,015 -15% EPS (PKR) 10.71 17.30
26.14 30.72
DPS (PKR) - -
- -
Source: IGI Research, Company Financials Shares mn: 326.02
Pakistan State Oil Company Limited (PSO) held its analyst briefing on 23rd Feb-18 to discuss financial result for 2QFY18 and future prospects of the company. The company reported earnings of PKR 3.49bn (EPS PKR 10.71) down by 38%YoY during 2QFY18 as compared to PKR 5.64bn (EPS PKR 17.30) in the same period last year;
Gross profit declined by +17%YoY to PKR 9.54bn during 2QFY18 owing to inventory losses of PKR 0.73bn after tax. Operating costs increased by +19%YoY to PKR 7.05bn during 2QFY18 as compared to PKR 6.77bn in the corresponding period last year owing to exchange losses of PKR 0.75bn booked in Dec‐17 as a result of 4.5% PKR depreciation.
We maintain a ‘BUY’ call on PSO with Dec-18 TP of PKR 385/share offering an upside of +31% from its last close. The company is currently trading at FY18E P/E of 6.2x and dividend yield of 5.8%.
COMPANY UPDATE
Recommendation BUY
385.2
Last Closing: 293.5
Upside: 31.2
Time Horizon:
Bloomberg Tkr. PSO PA
Shares (mn)
Free Float Shares (mn) 146.7
Free Float Shares (%) 45.0%
Market Cap (PKRbn | USDmn) 95.7 865.1
Exchange KSE 100
Price Info. 90D 06M 12M
Abs. Return (13.9) (34.1) (35.6)
Lo 265.2 265.2 265.2
Hi 357.2 466.6 477.1
PKRbn FY17A FY18E FY19F FY20F
Total Revenue 878.1 779.7 807.7 892.3
Net Income 18.2 15.4 13.6 15.4
EPS (PKR) 55.9 47.4 41.7 47.2
DPS (PKR) 25.0 17.0 15.0 17.0
Total Assets 392.4 336.3 324.6 307.3
Total Equity 102.8 113.3 122.0 131.8
ROE (%) 17.7 13.6 11.1 11.7
P/E (x) 5.3 6.2 7.0 6.2
P/B (x) 0.9 0.8 0.8 0.7
DY (%) 8.5 5.8 5.1 5.8
About the Company
Source: Bloomberg, PSX & IGI Research
Abdullah Farhan
Research Analyst
Tel: (+92-21) 111-234-234 Ext.: 912
Key Company Financials
Market Data
Valuation Methodology: Discounted Cash Flow (DCF)
Period End: Jun
Target Price:
Pakistan State Oil w as incorporated in Pakistan in 1976.
The principal activities of the Company are procurement,
storage and marketing of petroleum and related
products. It also blends and markets various kinds of
lubricating oils.
326.0
23-Feb-18
Dec-18
Pakistan State Oil Company Limited
Oil & Gas Marketing Companies
Relative Price Performance
Key Financial Ratios
-50%
-40%
-30%
-20%
-10%
0%
10%
F-1
7
A-1
7
J-1
7
A-1
7
O-1
7
D-1
7
F-1
8
PSO KSE 100
0%
3%
12%
69%
Dir. Assoc.Ind. Others
Monday, 26 February 2018
Page | 2
Major highlights of analyst briefing as stated by the management
Key takeaway of the analyst briefing included:
Exchange losses booked were lower than expected as the Company was able to partially pass forex losses on to customers through increase in FO prices as fuel component is pass through item for power sector and write off against previous un-booked exchange gains. Exchange loss was only incurred on MS and HSD during this quarter;
Receivables dropped to PKR 65bn as at Sep-17 as PIB backed borrowing were paid off however as at Dec-17 short term borrowings have jumped up to PKR 118bn due to rising circular debt
Despite increasing oil price in 2QFY18 the Company incurred PKR 0.73bn inventory loss as other OMCs withheld inventories to benefit from inventory gains and as a result PSO has to fulfill country’s fuel requirement on GoP’s directives so that pumps don’t run dry leading to inventory losses as inventory levels drop significantly;
Payout restrained owing to cash constraints during 2QFY18 as circular debt piled up significantly;
The Company is currently offloading 3 shipments of FO ordered in Nov-17 which were deferred and company has not incurred heavy demurrage charges on it. The cost of fuel for these shipments will be priced based on cost incurred in Nov-17;
Refinery procurement level stood at 39% in 1HFY18;
Management’s business outlook included:
Company is actively pursuing GoP and some of the outstanding receivables are expected to be settled in near term. If amount is settled the company may increase payout during 3QFY18/4QFY18.
Management expects PSO’s FO sales to remain at 2mn Mtons post FY19 owing to KE which is utilizing FO for power generation and other cash based customers, however summer demand will be key to monitor.
HSD deregulation is yet to be implemented due to delays in notification and as a result OMC and dealer margins have not been increased.
LNG business is likely to stay with PSO for some time until notified by GoP to switch to Pakistan LNG terminals.
Cash flows are not expected to deteriorate drastically during summer.
Management will not primarily focus on enhancing capacity of PRL but rather focus on up-gradation so that quantity of FO refined is reduced down to 7% from current 35-40% and enhance quantity of MS and HSD.
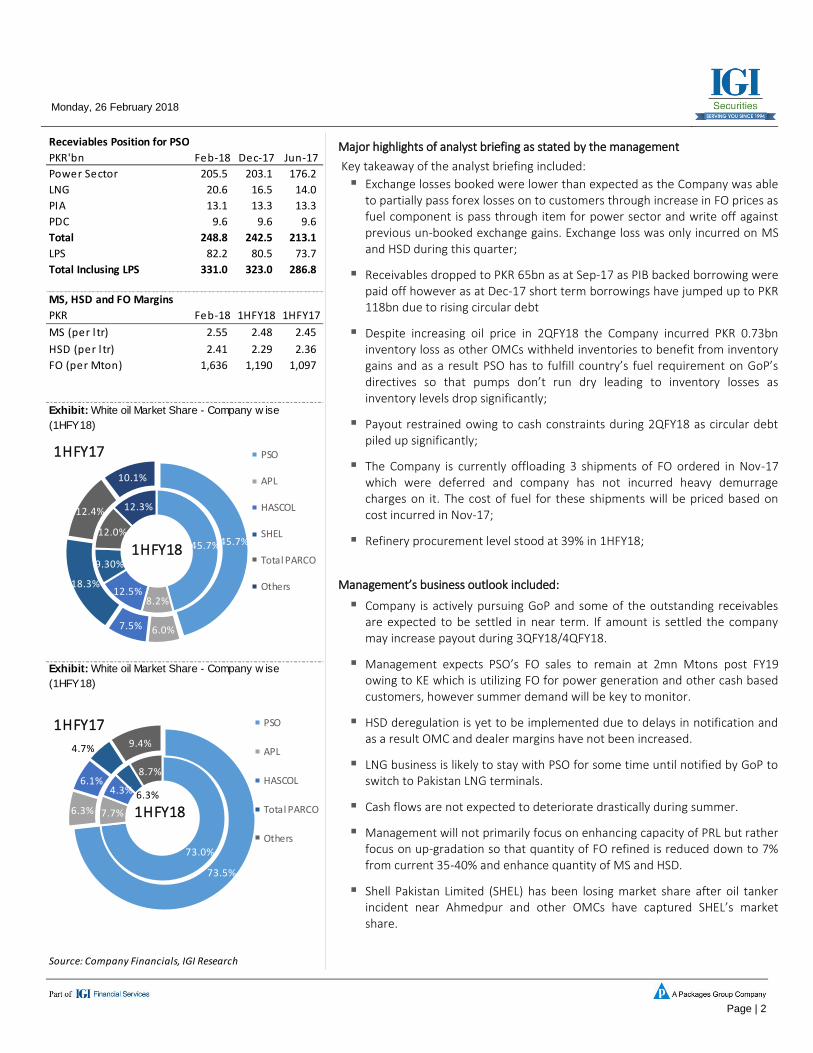
Shell Pakistan Limited (SHEL) has been losing market share after oil tanker incident near Ahmedpur and other OMCs have captured SHEL’s market share.
Receviables Position for PSO
PKR'bn Feb-18 Dec-17 Jun-17
Power Sector 205.5 203.1 176.2
LNG 20.6 16.5 14.0
PIA 13.1 13.3 13.3
PDC 9.6 9.6 9.6
Total 248.8 242.5 213.1
LPS 82.2 80.5 73.7
Total Inclusing LPS 331.0 323.0 286.8
PKR Feb-18 1HFY18 1HFY17
MS (per l tr) 2.55 2.48 2.45
HSD (per l tr) 2.41 2.29 2.36
FO (per Mton) 1,636 1,190 1,097
Source: Company Financials, IGI Research
MS, HSD and FO Margins
Exhibit: White oil Market Share - Company w ise
(1HFY18)
Exhibit: White oil Market Share - Company w ise
(1HFY18)
1HFY17
1HFY17
45.7%
8.2%12.5%
9.30%
12.0%
12.3%
45.7%
6.0%7.5%
18.3%
12.4%
10.1%
PSO
APL
HASCOL
SHEL
Total PARCO
Others
1HFY18
73.0%
7.7%
6.3%4.3%
8.7%
73.5%
6.3%
6.1%
4.7% 9.4%
PSO
APL
HASCOL
Total PARCO
Others
1HFY18
Monday, 26 February 2018
Page | 3
Outlook
The company further expects to increase its retail outlets to cater rising demand and under performance of company compared to industry growth. Furthermore, increase in average FO margin (up by +21%YoY in 1HFY18) is expected to lift profitability as margins are deregulated and linked with landed cost price. The Company is expected to increase it storage capacity by 250k MTon in the coming years which is expected to reduce PSO’s vulnerability to heavy inventory loss/gain and ease storage concerns especially for MS. Furthermore, increased marketing and sales promotion for lubes should provide a healthy growth in the segment. Continuation of LNG business (1HFY18 volume up by +49%YoY in 1HFY18 to 2.22mn Mtons), increased volumes, lower financing cost on FE-25 loan and recovery of overdue Late Payment Surcharge (LPS) income to partially offset decline in other income. Recommendation We maintain a ‘BUY’ call on PSO with Dec-18 TP of PKR 385/share offering an upside of +31% from its last close. The company is currently trading at FY18E P/E of 6.2x and dividend yield of 5.8%.
Source: Company Financials, IGI Research
Highest ever core earnings in half year before
inventory gain/losses, interest income & expenses
-
5.0
10.0
15.0
20.0
25.0
30.0
35.0
0.0
2.0
4.0
6.0
8.0
10.0
12.0
1H14 1H15 1H16 1H17 1H18
Core Business Earnings (PKR'bn)
Core Business Earnings (PKR/share) - RHS
BRP - 009
Important Disclaimer and Disclosures Research Analyst(s) Certification: The Research Analyst(s) hereby certify that the views about the company/companies
and the security/securities discussed in this report accurately reflect his or her or their personal views and that he/she has
not received and will not receive direct or indirect compensation in exchange for expressing specific recommendations or
views in this report. The analyst(s) is principally responsible for the preparation of this research report and that he/she or
his/her close family/relative does not own 1% or more of a class of common equity securities of the following
company/companies covered in this report.
Disclaimer: The information and opinions contained herein are prepared by IGI Finex Securities Limited and is for
information purposes only. Whilst every effort has been made to ensure that all the information (including any
recommendations or opinions expressed) contained in this document (the information) is not misleading or unreliable, IGI
Finex Securities Limited makes no representation as to the accuracy or completeness of the information. Neither, IGI Finex
Securities Limited nor any director, officer or employee of IGI Finex Securities Limited shall in any manner be liable or
responsible for any loss that may be occasioned as consequence of a party relying on the information. This document
takes no account of the investment objectives, financial situation and particular needs of investors, who shall seek further
professional advice before making any investment decision. This document and the information may not be reproduced,
distributed or published by any recipient for any purpose. This report is not directed or intended for distribution to, or use by
any person or entity not a client of IGI Finex Securities Limited, else directed for distribution.
Rating system: IGI Finex Securities employs three tier ratings system, depending upon expected total return (return is
defined as capital gain exclusive of tax) of the security in stated time period, as follows:
Recommendation Rating System
Buy If target price on aforementioned security(ies) is more than 10%, from its last closing price(s)
Hold If target price on aforementioned security(ies) is in between -10% and 10%, from its last closing price(s)
Sell If target price on aforementioned security(ies) is less than -10%, from its last closing price(s)
Time Horizon: Dec – 2018
Valuation Methodology: The analyst(s) has used following valuation methodology to arrive at the target price of the said security (ies): DCF (Discounted Cash Flow)
Risk: Investment in securities are subject to economic risk, market risk, interest rate risks, currency risks, credit risks,
political and geopolitical risks. The performance of company(ies) covered herein mightunfavorably be affected by multiple
factors including, business, economic, and political conditions. Hence, there is no assurance or guarantee that estimates,
recommendation, opinion, etc. given about the security(ies)/company(ies) in the report will be achieved.
Basic Definitions and Terminologies used: Target Price: A price target is the projected price level of a financial security
stated by an investment analyst or advisor. It represents a security's price that, if achieved, results in a trader recognizing
the best possible outcome for his investment. Market Cap.: Market capitalization is calculated by multiplying a company's
shares outstanding by current trading price. ROE: Return on equity is the amount of net income returned as a percentage
of shareholders’ equity. P/E: Price to Earnings ratio of a company's share price to its per-share earnings. P/B: Price to
Book ratio used to compare a stock's market value to its book value. DY: The dividend yield is dividend per share, divided
by the price per share.
IGI Finex Securities Limited
Research Analyst(s)
Research Identity Number: BRP009
© Copyright 2017 IGI Finex Securities Limited
BRP - 009
© Copyright 2017 IGI Finex Securities Limited
www.jamapunji.pk
Contact Details
Research TeamSaad Khan Head of Research Tel: (+92-21) 111-234-234 Ext: 810 [email protected]
Abdullah Farhan Senior Analyst Tel: (+92-21) 111-234-234 Ext: 912 [email protected]
Syed Daniyal Adil Research Analyst Tel: (+92-21) 111-234-234 Ext: 973 [email protected]
Suleman Ashraf Research Analyst Tel: (+92-21) 111-234-234 Ext: 957 [email protected]
Muhammad Saad Research Analyst Tel: (+92-21) 111-234-234 Ext: 816 [email protected]
Tanweer Kabeer Research/Fund Select Tel: (+92-21) 111-234-234 Ext: 966 [email protected]
Umesh Solanki Database Manager Tel: (+92-21) 111-234-234 Ext: 974 [email protected]
Equity SalesFaisal Jawed Khan Head of Equities Tel: (+92-21) 35301779 [email protected]
Zaeem Haider Khan Regional Head (North) Tel: (+92-42) 35777863-70 [email protected]
Muhammad Naveed Regional Manager (Islamabad & Upper North) Tel: (+92-51) 2604861-62 [email protected]
Ejaz Rana Regional Manager (Faisalabad) Tel: (+92-41) 2540843-45 [email protected]
Asif Saleem Branch Manager (RY Khan) Tel: (+92-68) 5871652-56 [email protected]
Mehtab Ali Branch Manager (Multan) Tel: (+92-61) 4512003 [email protected]
Zeeshan Kayani Branch Manager (Abbottabad) Tel: (+92-992) 408243-44 [email protected]
Ihsan Mohammad Branch Manager (Peshawar) Tel: (92-91) 5253035 [email protected]
IGI Finex Securities Limited Lahore Office Islamabad OfficeTrading Rights Enti tlement Certi ficate (TREC) Holder of 5-F.C.C. Ground Floor, Syed Maratib Al i Road, Mezzanine Floor, Office 5, 6 & 7, Kashmir Plaza,
Pakis tan Stock Exchange Limited | Gulberg II , Lahore Block- B, Jinnah Avenue, Blue Area, Is lamabad
Corporate member of Pakis tan Mercanti le Exchange Limited Tel : (+92-42) 35777863-70, 35876075-76 Tel : (+92-51) 2604861-2, 2604864, 2273439
Fax: (+92-42) 35763542 Fax: (+92-51) 2273861
Faisalabad Office Rahim Yar Khan Office
Head Office Room #: 515-516, 5th Floor, State Li fe Plot # 12, Basement of Khal id Market,
Suite No 701-713, 7th Floor, The Forum, G-20, Bui lding, 2- Liaqat Road, Fa isa labad Model Town, Town Hal l Road, Rahim Yar Khan
Khayaban-e-Jami Block-09, Cl i fton, Karachi -75600 Tel : (+92-41) 2540843-45 Tel : (+92-68) 5871653-6, 5871652
UAN: (+92-21) 111-444-001 | (+92-21) 111-234-234 Fax: (+92-41) 2540815 Fax: (+92-68) 5871651
Fax: (+92-21) 35309169, 35301780 Multan Office Abbottabad OfficeWebsite: www.igisecuri ties .com.pk Mezzanine Floor, Abdal i Tower, Ground Floor, Al Fatah Shoppinig Center , Opp. Radio
Stock Exchange Office Abdal i Road, Multan Station, Mansehra Road, Abbottabad
Room # 719, 7th Floor, PSX Bui lding, Stock Exchange Road, Karachi . Tel : (92-992) 408243 - 44 Tel : (+92-99) 2408243 - 44
Tel : (+92-21) 32429613-4, 32462651-2 , Fax: (+92-21) 32429607 Peshawar Office Sialkot Office2nd Floor, The Mal l Tower, Suite No. 10 & 11, 1st Floor, Soni Square,
35 The Mal l Peshawar Cantt. Mubarik Pura, Sia lkot.
Tel : (92-91) 5253035, 5278448 Tel : (+92-52) 3258437, 3258762