oi.ii~ci::s ss ior~
TRANSCRIPT
HI STORY 0:" THE i'\l rml·SOTA :~[:'\OI.II~CI::S COi''!i'lJ ss IOr~ corPER··NT CKEL STUDY
On \)anurn'y 27) 1972) the (~oveY'nor requested the format'ion of an Inter-
Agency Task Force on base metal mining impacts in r~innesota. This executive
initiative resulted in a comprehens'ive 1'2Vir.Vl of state mineral policy,
regulatory powers of th0. state) mineral potential, metal markets, mining
methods and processes of benificiation, reduction and refining, potential
environmental impacts, potential economic impacts, and attitudes of state
residents toward economic development and environmental protection in northern
Hinnt::sota. The Task Force repol~t released in ~)D.nuary 1973 did provide the
first comprehensive dis~ussion of the issues that would b~ involved in a coppel'-
nick\~l d0"t~1,)plllent decision. HO\'iever)"it \..'a~; not the' Chill'ge of the Task Force
to conduct a deta.iled ('dialysis of olw'jt'onmenti',l Clnd socia-economic impacts.
Accordinqly) during the 1973 session of the'Legis'!atul'e, the 1'1'ii!!!p.sota
Resources CGil'Cnission (l,me) ilppropr'iatr.d $"IOOsOOO to the 1'1innesota State P'li'im'i:JQ
A~jellcy for a copper,otrickel study. Chapter 720; sec. 43; Subdivisi01l 9;
SUbpal'i1grafJh f of t.he l.cMS of t1inncsota for 1973 states:
The Depurtment of Natural Resources) the University ofHinllesota and the State Pliilln'irlg r'.r'c::lcy Iii 11 I'cpril"L tothe leTisli';tun} Gil the (;(OIIO:I1;C nE:::·ds ti')d rn}~lPrn; l'ell1tE:dto the develop;i,ent of u COi,pc~i""llicl;'21 ;"luusUy 'i"l :"'inlwsct;(.tand the environmental impact of the various developmentproposals.
This in'itiativc by the Legislature, which wc:.s in part based on the Task
Force report and its recomnen~ati0ns) represented legislative recognition thJt
a detaih'd analysis of buse ii1ctn'l rll'irl'ing impacts should be conducted pt'ior to the
intl'oduction of such an industry in Minnesota. Such anticipatory action by thr
Legislature Sl!99C'sLed their cone-un (that the Slilt:,; be ilblc to avoid ot' 1ll'ill'inri7,c
This document is made available electronically by the Minnesota Legislative Reference Library as part of an ongoing digital archiving project. http://www.leg.state.mn.us/lrl/lrl.asp
the initiative clearly signals the legitimate intent of the legislature to be
involved in this natural resource decision. ,Anticipatory planning for major
development decisions has not been a frequent occurren6e at either the federal,
state or local levels of government. Consequently, the action taken on the
copper-nickel issue by both the Governor and Legi~lature of this State is in a
sense historic and clearly what is necessary for wise use of the State's natural
resources. '
On January 31, 1974 a Cu-Ni study proposa'l was submitted to and approved
by the MRC. That proposal outlined four components of the study. The components
are: a socia-economic assessment, an environmental assessment, the design of
a regi ona1 monitori ng program, and a technology assessment.
, In addition to the four major components thr~e additional studies were
initiated in the work program: (1) an anulysis of world supply and demand for
copper nickel (2) a study of bedrock geology, mineral potential and mineral
leases in the Arrowhead region of Minnesota and (3) the development of Cu-Mi
mining models which illustrate the inputs and outputs of alternative mining and
refining technologies.
The enclosed documont is a summJry of the findings of the socio-economic
assessment and the international supply and demand for copper-nickel.
Unfortunately summary statements are too br'ief to reflect all the findings of
studies such as this. Persons interested in methods, data collection techniques
and analytic assumptions are encouraged to read the technical reports.
The proposed niirring of copper·nickel ores hi the ArtO'v':head HQ~rion has the
potential for s'jgnificant 'influence all the ruture socia-economic character'istics
-3-
of that area. Npw industrial activity 'is accompo.lliecl by iller-eased employment,
ljopulation, and governmental revenue. I\t the sam!! time, hOl'lever, mining
development may entail costs for the provision of governmental services or
costs in terms of environmental harm. 1\ myriad of policy choices for governmental
action is available for balacing costs against benefits of mining activity.
What is needed is a means for ,evaluating the alternative choices to detennine
the relative magnitudes of the fo~se~ble impacts as a foundation for rational
decision making.
This assessment is intended to provide some essentials of that foundation. ,
Its purpose is the identification of cause-effect relationships between copper
nickel mining development alld selected socia-economic characteristics in the
Arrol'lhead Regi on. It is intended to present some methodol ogi cal approaches and
plausible answers to the following questions:
-How wi 11 mi ni ng cleve1opment i,lffect future regi ona1 employment?unemployment? population?
-What revenues may the state expect from different levels ofcopper-nickel development?
-Hhat kind of capHal expend'itllres \'1111 be necessary to provideservices for future human and industrial needs?
The analysis proceeds by using available data to suggest what may be
reasonably expected impacts of alternative level~ of copper-nickel development.
The analysis is also applied to an optional scheme of development consisting of
the introduction of new public administration jobs to the Arrowhead region. This
var"iation allows the decis"ion-makers to compare mining development l'.Jith other!
non-mining types of regionul development strategies.
The analysis has.focused on the Arrowhead regional economic system arid its
development prospects. The reason for this rcgio~al perspective is that copper-
nickel mining d(~velopll1ent does not occur 'in a vacuum, but rather int.eracts \vith
other development cOnlmittmcnts and opportun'it'les such as taconite mining
expansion> recreation industry grodth, and service and trade employment gY'owth.
FINDINGS: INTERNATIONAL SUPPLY AND DEMAND COPPER AND NICKEL
The Market for Copper
Although the availability of substitute materials and technologies suggest
that demand should be relatively sensitive to price, the importance of copper
in the worl'd market reduces that sens iti vity to some extent. In the long-run>
however, because of substitution,copper demand'will probably be more sensitive
to price than it has been in the past.
Mineral "reserves" arc defined as those deposits that al'e profitably mined
at current pl'ices. Thus, the extent of world copper "rescl~ves" depends upon the
stat~ of the minin~ art as well as the price of copper. Despite the resulting
dynamic nature of reserves> it is important to note that U.S. domestic reserves.
represent close to one qual'ter of the world total. Communist nations possess
only very small reserves.
The nations most impol'tant for mineral supply assessment are those with the
largest reserves. The political and economic environments of these nations
have great potential impact upon reliability and/or availab'ility of suppl·ies.
The U.S. is largely self-sufficient in copper, producing 21% while consuming
26% of ~he world total. Reserves of 24% of the world total closely approximate
its historical consumption share.
Chile has the second most abundant reserves> with 16%. It accounts for about
10% of world production l almost all of which it exports. Although the Chilean
government under Salvador Allende effected large scale expropriation of foreign
investments l recent. trends by the present gover:nmcnt i ndi catL~ return to more
mal~ket-Ol'''i en ted economi cs. Although ,the copp~r indus try has been na ti ona 1i zed l
di verti ng some market pOYler to the gov()I'nI110nt ~ tho I1P\~ gov(!\'nlllerit lids not
chosen to ut"ilize that posHion for political ends.
The U.S.S.R., which has about onc-tellth of the world's reserves, onc-sev0nth
of the world's production, consumes about 13% of world suppliesi Thus, the
U.S.S.R. is largely self-sufficient~ and non-competing with the U.S. in world
markets.
Canada produces about 11% of world total from deposits representing 4% of world
copper reserves. Consumption is small) allowing Canada to be a large exporter
to both Japan and the U.S. There does not seem to be much danger that
Canadian supplies to the U.S. will be curtailed.
Zambia, Zaire, and Peru are other large-reserve nations, with world shares
of 8%, 7% and G% respectively. All three l1utions have experienced nation[:'liziJ.t"ion
of their copper industries to some extent, but n~tional development goals have
undercut the abil ity of any of these governments to Vii e1d signifi cant I'JOl'l d
market power.
Chile, Zumbia, Peru and Zail'e have joined together in an organization of
copper-exporting countries~ CIPEC. The fo~r nations have an aggregate of 37% of
world reserves and a combined 1973 production of 29% of global mine output; they
consume less thiln 1% of world l'efined cu;)pcr. DcspHc! thc~ bi:\IIding togetll~r
of these nat'ions, it does not appear l'ikely that they vl111 cOllmland sufficient
market power to duplicate the highly effective cartel-embargo actions of OPEC, the
oil producing group. The CIPEC nations have wrested some market power from the
formerly dominant multinutional corporations, but indications ar0 that they
have been unable to assert this power to their own advantage. CIPEC has suffered
from a lack of coordinated power and from a lack of trade indellendence necessary
for clout. The result has been a ba'iunciriu of the market povlcr betvlecn th() CJPEC
group and the r~NC's--malcing for II relo.t·ivc'ly hen lTiJde in copper. This baliJncing
-6-
of market powers 'is expected to cont:inuc l and thus, the danger to consumer nations
of a copper-embargo seems rather remote.
A1thou~h the coppel~ industry has traditionally been highly integrated and
concentrated l a number of trends have developed over the past 10-15 years to
dilute the strength of the natural oligopoly. Large market shares have be~n
placed in the hands of nationalist governments. For other reasons, these
nations have been unable to assert their market power, and it appears they will
not be able to do so in the future.
The availability of copper supply depends on many additional factors l such
as technological advances l price, recycling effo~ts, and population. On
balance l there seems to be little danger of supply shortage in the foreseeable
future, either from ma0ket imperfections or from technolo~ical road blocks. In 1971,
world reserves had a 53 year supply lifetime at 1971 production levels.
Given the willingness of consumers to Pay the expected higher real costs of
extraction and recycling, world copper resources should not be exhausted in
50 years, but rather, should continue to remain available and plentiful for
centuries.
Copper prices should reflect closely the real costs of'production, since the
balancing of interests should keep the copper market near free-market operat'iOI1.
Simple extrapolation of past trends indicates that copper prices should increase
about 250% by the end of the century~ Perhaps more realistically, the price
(adjusted for inflation) will increase 4 to 5 times 1970 levels. In the first
case, the average annual increase would be about 3% while in the latter case, the
annual real increase would be about 5.5%. These annual increases should be
valuable in making decisions about timing for any development of domestic copper
mining activities.
It is expected that the U.S. willcont"illll(~ its pr(~Sl'llt shard of w()rld
consumpti on for the re'S t of the century. Incrcas i n9 domos Vic dependence upon
foreign sources of copper does not appear to be a worrisome situation. The
U.S. does not face dangers of copper depcndellce similar to those found in the case
of oil.
The Market for Nickel
Despite the importance of nickel as an alloying material in steel, and hence
its importance in military applications, there are alternative materials
available to replace nickel in essentially all of its uses. Althougfl these
substitutes suggest nickel demand sensitivity to price, the importance of the
metal and the cost of alternatives operate to make consumption less dependent
on price. In the long run, the demand for nickel, like that for copper, will
be more sensitive to price.
U.S. nickel "reserves l' , a,s estimated 'in 1970, represent a relative'ly
insignificant portion of the world total. The U.S. produces virtually none of
the nickel it uses. Present domestic production involves one small mine in
Oregon. Most U.S. domestic needs are met by extensive CDnadian resourCf.'S.
The 1970 "reserve" cla,to. must be qUJ-lifh:d. Imptovcmcnts in exp1orDtory,
recovery, ancl processing technologies accounted for a five-fold expansion of
"resel'ves" in the decade 1960-1970. It 'is assumed that further rapid developments
will take place. Additional identif"ied resources are likely to become "reserves"
in the future. Resource d'istl"ibut'ion sug~Josts that the 1970 reserve allocution
among nations is subject to some error. Nickel resources of the U.S. I mostly
because of the huge Duluth Gabbro formation, are considerably more significant
. ,
v'is-a-vis the rest of the vJOrld' tlwn vlouhl b(~ expected from the 1970 "reserve" di1tO.
If identHicd r(;sources ar(~ examil1(~d, the U.S. deposits, 'including those hi
Minnesota, represent about 17% of world totul. If Minnesota is excluded, U.S.
i denti n ed resources represe.nt abnu t 2% of \'101'1 d total. Thus, Mi nnesota IS
position in the world nickel 1l1iJ.I'ket is very important.
It is important to note that world nickel resources are vast. Even under
the conservative 1970 reserve estimates, world consumption at 1970 levels could
not be satisfied fl'om primary SOUl'ces for 120 years. Under more liberal
interpretations of nickel supplies, this lifetime could be extended to about
200 years. If recycling is taken into account, these est'imates expand considerably.
Recovery of secondary materi al s has been expandi ng, from about 8% of consu!llpti on
in 1960, to about 22% in 1972. In-use nickel represents a very substantial
domestic resource.
Cuba possesses almost one quarter of identified global nickel resources,
although its production accounts for only 5% of world output. The U.S.S.R. also
possesses 5i gnifi cant ni eke1 depos its. Together, the Communi st nati ons contro"
about 1/3 of world resources. Traditional chilly relationships between the
U.S. and these nations have frustrated trade, but at the same time, have
prevented U.S. dependence.
New Caledonia possesses substantial nickel reserves, perhaps up to 22~ of
world total. New Caledonia is a French overseas territory that accounts f~r
about 15% of world production. Most of this nickel is shipped to Japan.
French and Japanese influence seem to dominate there, so that New Caledoniall,
nickel, although increasing, has not yet become a major American source of
supply.
Canadian nickel represents the most impol'tant source of U.S. supply.. .
Canada possesses up to 20% of world nickel endowments, and 37% of this is( "
exported to the U.S. It is expected that the exrort-oriented n'ickel 'Indus:Lry of
Canada vlill continucto be the pl~'imary supplier of Amerieun n'ickcl needs for thp.

~9-
foreseeable fuiure. C~nadian mine production in 1973 was nca~ly 1.5 tim~s the
total consumption of nickel in all of North and South ~"erican during that same
year.
Indonesia, the Phillipines, and Australia possess approximately equal
resource shares, from 5 to 10 percent of world totals. The market thus
breaks down as follows: Communists control about 1/3 of world resources,
developing nations possess another t~ird, and the last third is distributed
among developed Western nations.
Thi s di vi si on of market power is one r'eason \'Jhy an OPEC-type o\"gani zati on
in nickel is extremely unlikely. Another is that collusion is not compatible
with economic development goals of the nickel-rich nations. Third, no group,
seems likely to amass market power sufficient to allow collusive action for
political or economic purposes. A cartel or embargo is extremely improbable.
The n'ickel industry, like that of cappel', is characterized by concentration,
a high degree of vertical integration, and barriers to entry. The concentration
in the nickel industty is high: one firm, INCa, has ovet one half of the wor"ld
market, and the top five firms control together about 85%. in terms of
production capacity, concentration is even grenter. The market strength of
the large nickel producers is likely to continue in the foreseeable future.
The natural producer oligopoly seems secure, and although some excess, or non
economic profHs may be generated, unusually 'large barriers to entry make this
the most economically practical and efficient means of production.
Supply availability of nickel, like copper, depends on technological
advances and pr-i ces. The most sa l"j ent feature of supply avail abi 1ity is the
truly enormous resourtc endownment. If the Duluth Gabbro deposits are inclurlcd l
domestic supply lifetime is almost 100 years. Without the Minnesota deposits,
domest"ic supply is "lowered to about 10 years.
-10-
Like those of nickel, copper pt'ices should reflc!ct the real costs of
production and recycling; the ma'in difference is that some oligopolistic
profits will tend to keep nickel prices above real costs by a steady margin.
INCO maintains strong price leadership. A sudden demand insensitivity to
price, such as occasioned by war, could translate into inflation of nickel prices,
but the seemingly secure nature of supply channels would operate to maintain
supplies. 1970 Bureau of t~ines predictions suggest that real prices of nickel
will rise by only 15% during the next quarter century. Perhaps it is more
rea1is ti c to assume that pri ces wi 11 double by then. In either case, the
average annual increase will be relat'ive'ly slight, less than 2~%.
It is li~ely that the U.S. will maintain a dominant place in the consumption
of ~ickel. Its consumption share should remain stable or'decrease only slightly.
The extent of the U.S. domestic nickel supply depends primarily upon the
oxp1oitnbi 1ity, both economi c aile! politi ca1, of the Mi nnesota depos its. If they
are explo"itable, u.s. domestic supply becClmes'significant vis-a-vis the rest
of the world. If not, the U.S. has a very small domestic endowment.
There does not seem to be a significant th~eat of supply curtailment by
economic nationalists. Foreign supplies seem secure at prices dictated in an
oligopolistic nickel market.
FINDINGS: SOCIAL SERVICE INVENTORY
£QJL~lation Distr-ibtlti9n
Examination of population changes between 1960 and 1970 reveals concentrations
of people in two major locations: 1) the iron range and 2) the port cities.
It also reveals a general decrease in the populations of the municipaliti0s as
well as the region while the state population has increased considerably dllring
the same period.
-11-
In contrast to t.he other municipalities) l3abbit and Hoyt Lakes have
experienced population increuses in the base period. These relative unomalies
are accounted for by taconite expansion: the deve10pment of the Reserve
mini.ng pit at Babbit and the Erie mining operation at Hoyt Lakes.
Service Centers
A description of the regional service infrastructure is ~ided greatly by
the identification and description of service centers. Information has been
organized and evaluated through a classification scheme, proposed and employed
by the Upper Midwest Council, which allows comparison of functions and identification
of relationships among trade centers.
This classification scheme was utilized in the preparation of Map 2, which
identifies centers by availability of services or the extent of retail sales.
The criteria used in the classification are pres~nted next to the map for easy
reference.
Service centers correspond to areas of population density, The Ilregional
serv'j ce centers II and the "community servi ce centers, II those pos sess i ng a
great variety of services, are scattered along the iron range and on Lake
Superior. The result of the service center concentration is that considerable
land areas are great distances from even II par tial conven'ience centers" (those.. '
with relatiely few servi~es). Some of the more sophisticated services are
greatly removed, in time as well as distance, from many locations in the region.
Housing
Like population, the houting services are clustered along the length of
the iron range and near Duluth-Superior. The data shows variations in the
compositiorl of the vacancies, but in most cases the inhabitable vacancies are
considerably less than the numher of total vacancies; that is, there is a
~12-
substantial portion of the vacant hous'ing \'1Il'ich is not on the market aI' is
substandard in tel'ms of plumbing.
The summary conclusion is that the current housing supply in the Arrav/head
region could not absorb any major population increase. Approximately half of
the municipalities in the region cannot prOVide short-notice occupancy fol'
significant increases ;n population.
Sewer and Water Facilities
The status and availabil'ity of ·sevler and water faci'lities are essential to
an assessment of regional service cap~bilities since such facilities are
primary adjuncts to housing and industrial development. It is useful to
consider, as a proxy for facility status, the short-term capital improvement
needs of the region for sewer and water. Those needs illustrate present
service insufficiencies while providing a context for assessments of adequacy in
terms of future development projections.
The geographical distribution of sewer and water facilities is shown in
Map 5. Only municipalities with popu~ti~ns of 1,000 or more are included and all
have facilities for both sewer and water. It should be noted that the map
does not distinguish places by number of .people or size of ~he area (except for
the Western Lake Superior Sanitary District) serviced by the facilities.
Map 6 illustrates the short term water and sewer needs of each of these
systems. Dollar requirements are p~oportional to the area of the semi
circles. The SOUIAce data are presented in Table IV.
The source of infonnation for municipalities with populations of less than
5.500 vIas the Are~wi de C~ol1\pr~hen~J v~1-l a.'l. for Ji~_ter' ~-"_~jevJer prepared by the
Arrowhead I~egional Development COIl(mlission~ '1972,. For laY'ger lTIunicipalities,
information vJaS obtained from the L~~.jciJ!.-i3~LJJ.e.~d~_1:.i2>_t...:1JJD·i.~.cal .. 19JJiJ~roJ(':.~t
List of the Pollution Contra" Agency. Informati'on regardinu \'Jater needs was not
-13-
available for cities within the Westerll Lake Superior Sanitary District and the
Areawide Planning Jurisdictions. It should be noted> therefore> that omissions
from the tabulated data and from Map 6 reflect a l~ck of information rather than
any lack of need.
The indicated "needs" are based upon computations utilizing criteria
outlined in the source documents. It should be noted that al~hough dollar
requirements are indicative of major r'epair and construction needs, they can
be somewhat deceptive. Throughout the region municipal water and sewer system
improvements are required. In view of the region1s need for municipal water..
and sewage system improvement and given the fact that many of the Minnesota
PollUti on Control Agency pri oritized proj ects have been de 1ayed due to funds
impoundment, many municipalities would likely experience water and sewage
problems if any additional residential and commercial development took place
prior to the projects' completion date. In addition to municipal water and
sevldge problems, nearly 40 percent of the houscdlolds in the l"eg'ion, large'ly
rural, have on-site sewage systems or some other private system such as a
priVy or holding tank. Since the rural areas of the region--most of Aitkin
and Koochiching Counties and the northern half of St. Louis, Lake and Cook
Counties--have severe soil limitations for on-site sewage systems> a major
health and environmental problem exists for the higher density rural portions
of the region.
If municipal water and sewer systems cannot accommodate population increases,
the alterntive will be on-site sewage systems. Such is an alternative that does
not appear desirable unless major soil reclamation, special design or intensive
mai ntenance can be l"equi red anc prov,i dcd.
The conclusion to be drawn is that municipal systenl improvements should precede
uny developlIlent and expans'ion which Vlould st'imulatc local or regional populotion groy/th.
·,14-
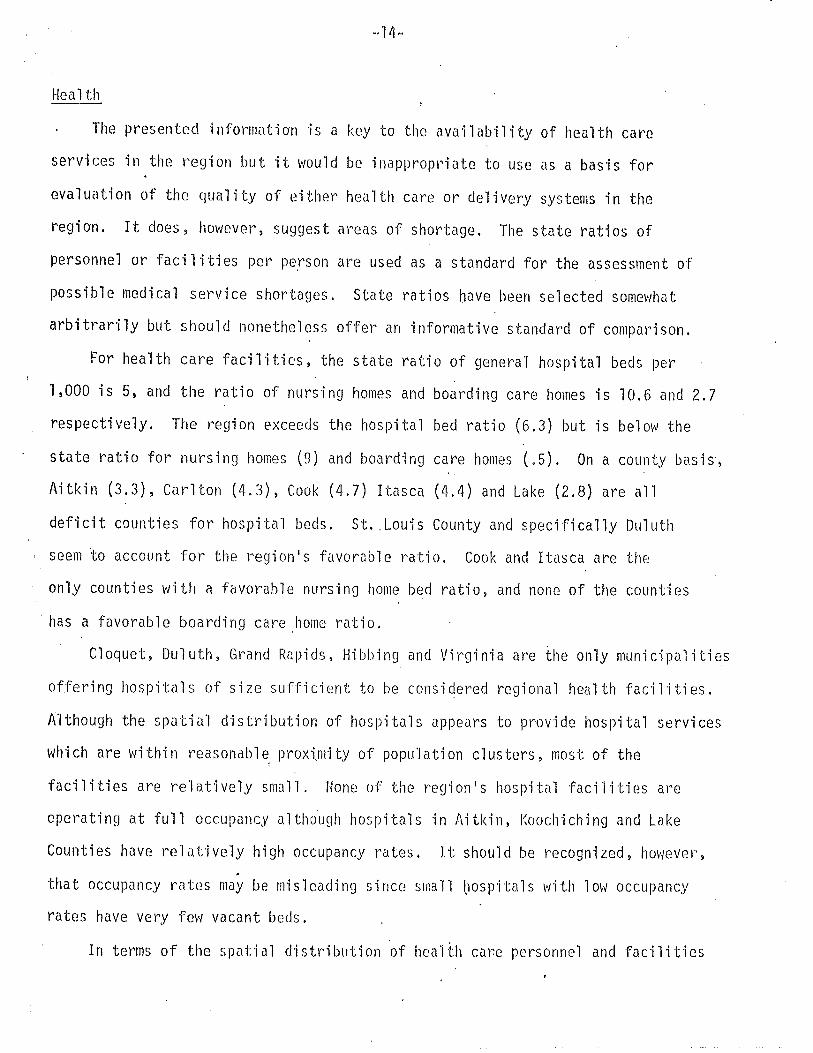
Health
The presented informatiO'n is a key to the ava'ilability of health care
services in the region but it would be inappropriate to use as a basis for
evaluation of the quality of either health care Ol~ de'livery systems in the
region. It does, however, suggest areas of shortage. The state ratios of
personnel or facilities per person are used as a standard for the assessment of
possible medical service shortages. State ratios have been selected somewhat
arbitrarily but should nonetheless offer an informative standard of comparison.
For health care facilities, the state ratio of general hospital beds per
1,000 is 5, and the ratio of nursing homes and boarding care homes is 10.6 and 2.7
respectively. The region exceeds the hospital bed ratio (6.3) but is below the
state ratio for nursing homes (9) and board'ing care homes (.5). On a county basis',
Aitkin (3.3), Carlton (4.3), Cook (4.7) Itasca (4.4) and Lake (2.8) are all
defi cit counti es for hospitcl'l beds. St., Loui s County and speci fi ca lly Dul uth
seem to account for the region's favorable ratio. Cook and Itasca are the
only counties with a favorable nursing home bed ratio, and none of the counties
has a favorable boarding care ,home ratio.
Cloquet, Duluth, Grand Rapids, Hibbing and Virginia are ~he only municipalities
offering hospitals of size sufficient to be consi~ered regional health facilities.
Although the spatial distribution of hospitals appears to provide hospital services
which are within reasonable, proxi,mity of popu'lation clusters, most of the
facilities are relatively small. Hone of the region's hospital facilities are
operating at full occupancy alth~ugh hospitals in Aitkin, Koochiching and Lake
Counties have relatively high occupancy rates. It should be recognized, however,,
that occupancy rates may be misleading since slnall bospitals with low occupancy
rates have very fel'! vacant beds.
In terms of the spatial d'istribution of heal'th care personnel and facilities
- Hi-
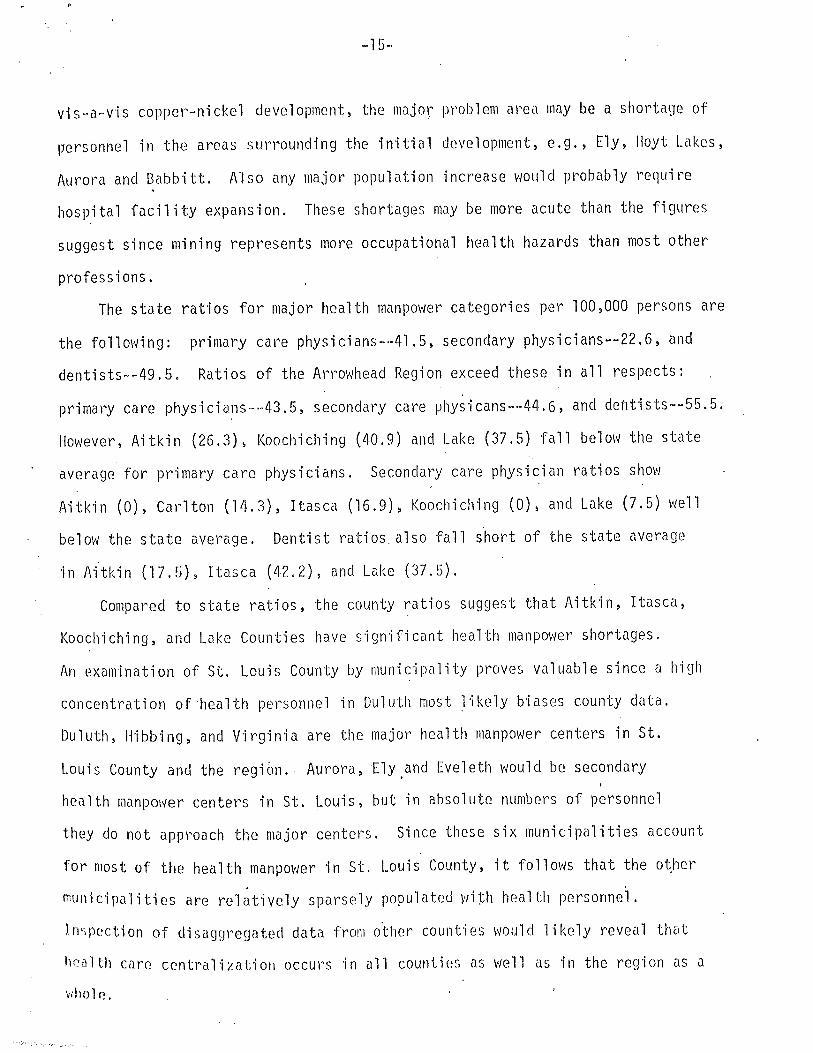
vis-a-vis coppcl~-nickcl development, the major problem at'eilmilY be a shortage of
personnel in the areas surrounding the initial development, e.g., Ely, Hoyt Lakes,
Aurora and Babbitt. Also any major population increase would probably require
hospital facil'ity expansion. These shortages may be more acute than the figures
suggest since mining represents more occupational health hazards than most other
professions.
The state ratios for major health manpower categories per 100,000 persons are
the following: primary care physicians--41.5, secondary physicians--22.6, and
dentists--49.5. Ratios of the Arrowhead Region exceed these in all respects:
primal'y care physicians-·-43.5, secondary care lJhysicans--44.6, and defltists--55.5.
However, Aitkin (26.3), I<oochiching (40.9) and Lake (37.5) fall belO\'l the state
average for primary car'e physicians. Secondary care physician ratios shoYI
Aitkin (0), Cal'lton (1L1,.3) , Itasca (16.9), Koochiching (0), and Lake (7.5) well
below the state average. Dentist ratios, also fall short of the state average
in Aitkin (17.5), Itasca (42.2), and Lake (37.5).
Compared to state ratios, the county ratios suggest that Aitkin, Itasca,
Koochi chi ng, and Lake Counti es have S'j gnHi cant health manpoV/er shortages.
An examination of St. Louis County by municip(llity proves val'uable since u high
concentration of health personnel in Duluth most likely biases county data.
DUluth) Hibbing, and Virginia are the major health manpower centers in St.
Loui s County and the l~egi on. Aurora, Ely. and Evel eth woul d be secondary
health manpower centers in St. Louis) but in absolute numbers of personnel
they do not approach the major centers. Since these six municipalities account
for most of the health manpower in St. Louis County, it follows that the o~her
municipalities are rel~tivelY sparsely populated with health personne~.
Inspection of disaggregated data from o'ther count'ies would likely reveal that
health care centralization occurs in an counLh~~ as well as in the reg'ion as a
\ihol(~.
-16-
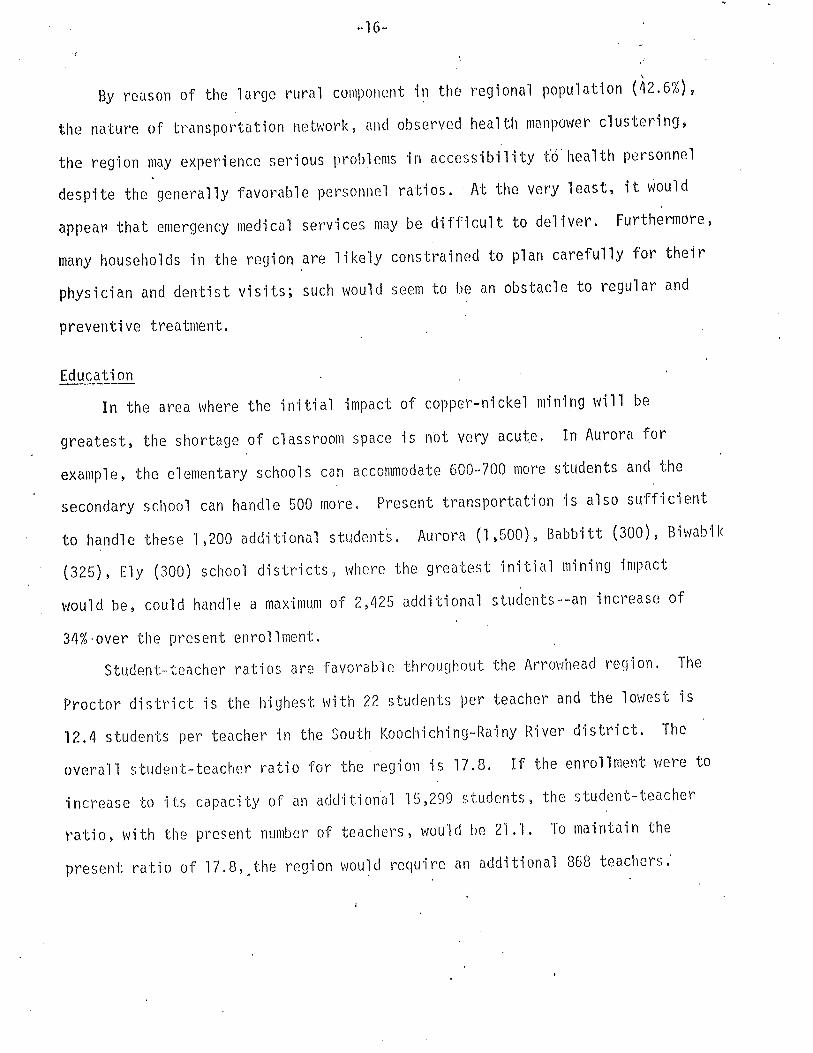
By reason of the large rural component i~1 the l'egional population (42.6%),
the nature of tl'ansportation netvwrk, and observed health munpower clustering,
the region may experience serious problems -in accessibility fo'health personnel
despite the generally favorable personnel ratios. At the very least, it would
appear that emergency medi ca1 servi CBS may be diff-i cult to del i ver. Furthermore,
many households in the region are likely constrained to plan carefully for their
physician and dentist visits; such would seem to be an obstacle to regular and
preventive treatment.
Education
In the area where the initial impact of copper-nickel mining will be
greatest, the shortage of classroom space is not very acute. In Aurora for
example, the elementary schools can accommodate 600-700 more students and the
secondary school can handl e 500 more, Present transportat-j on is also suffi ci ent
to handle these 1,200 additional student~. Aurora (1,500), Babbitt (300), Biwabik
(325), Ely (300) school districts, where the greatest initial mining impact
would be, could handle a maximum of 2,425 additional students--an increase of
34%-over the present enrollment.
Student-teacher ratios are favorable throughout the Arrowhead region. The
Proctor district is the highest VJith 22 students per teacher and the 10\'Jest is
12,4 students per teacher in the South Koochiching-Rainy River district. The
overall student-teacher ratio for the region is 17,8. If the enrollment were to
increase to its capacity of an additional 15,299 students, the student-teacher
ratio, with the present number of teachers, would be 21.1. To maintain the
present ratio of l7.8"
the reg"ion would requilAe an udditional 868 teacheY's.'
.-17-
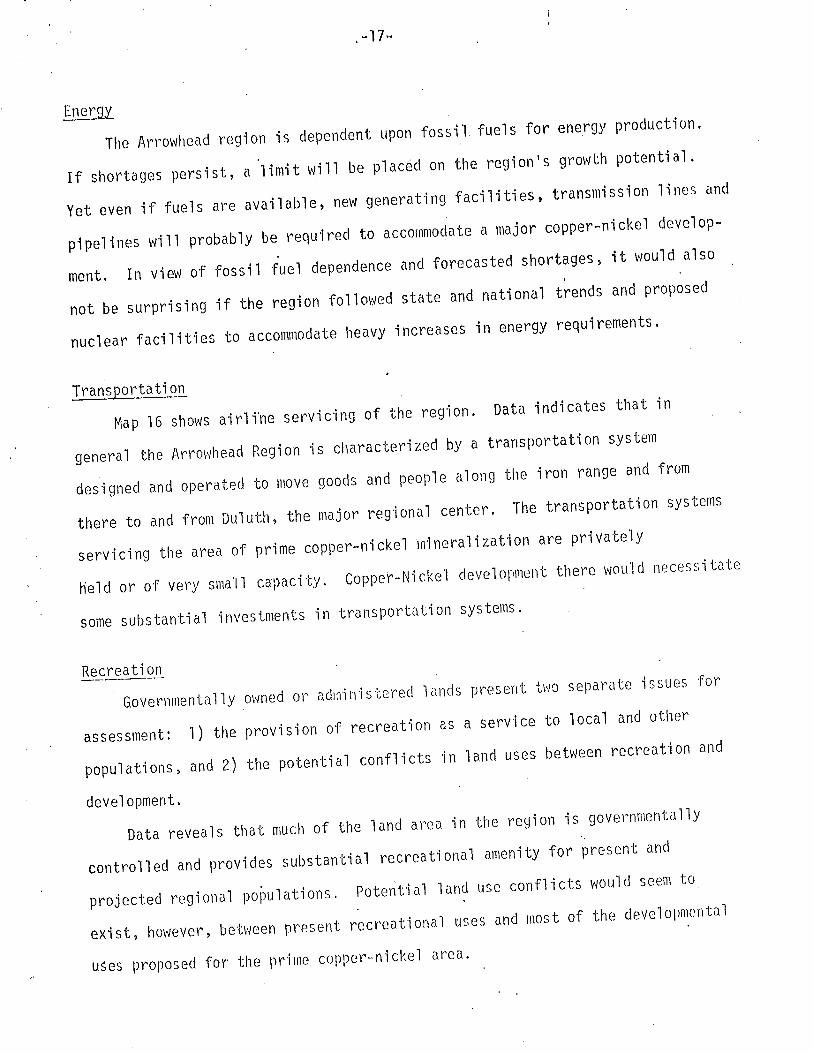
~nergy
The Anowhcad region is dependent upon fossil fuels for energy production.
If shortages persist, a limit will be placed on the region's growth potential.
Yet even if fuels are available, new generating facilities, transmission lines and
pipelines will probably be required to accommodate a major copper-nickel develop
ment. In view of fossil fuel dependence and forecasted shortages, it v/ould also
not be surprising if the region followed state and national trends and proposed
nuclear facilities to accommodate heavy increases in energy requirements.
Transportation
Map 16 shows airli~e servicing of the region. Data indicates that in
general the ArrO\'1head Region is characterized by a transportation system
designed and operated to move goods and people along the iron range and from
there to and from Duluth, the major regional center. The transportation systems
servicing the area of prime copper-nickel lnineralization are privately
held or of ve\'y sman capacity. Copper-Nickel development there v.JOuld necessitate
some substantial investments in transportation systems.
Recreation
Governmenta lly ovmed or adl:ri I'd stered 1D.nds presen t b'1o separate issues for
assessment: 1) the provision of recreation as a service to local and other
populations, and 2) the potential conflicts in land uses between recreation and
development.
Data reveals that much of the land area in the region is governmentally
controlled and provides substantial recreational amenity for present and
projected regional po~ulations. Pote~tial land use conflicts would seem to
exist, hO\'Jever, betv/een present recreational uses and most of the developmental
USes proposed for the prime copper-nickel urea.
,-18-
•~.
FINDINGS: ALTERNATIVE COPPER-NICKEL DEVELOPMENT AND GROWll1 PATTERNS
Becallse no copper-njckel development proposal with engineering specifications
has been completed~ eleven possible development conditions or schen~s have
been examined. These alternate developments use different assumptions
regarding growth rates and degrees of development regulation. Degrees of
regulation are expressed in terms which apply mainly to copper-nickel min-ing'
activity. The four types of regulation are defined as follows:
Moratorium: This assumes that no copper-nickel development takes place,
either because development is uneconomical or frustrated by governmental
regulation.
Rate, Location, Scale: This assumes somewhat less regulation than a
complete moratorium. The rate of development, or the location (such as
preclusion of mining north of the Laurentian Divide) or scale of mining
operations is here assumed to be restricted by governmental action. In the
k~own growth situation, this regulation is tantamount to moratorium.
Type RegJ:llati on: Such represents the case \'I'here a cartai t1 type of
mining activity~ particularly smelting, is not allowed in the region. It is
assumed that elimination of smelting would effectvely half the employlnent of
any 9i ven mi 11"1 ng deve1opment.
t~arket Model: The case of no regulation; market forces operate so that
mining activity occurs in the region as suggested by proposals made by INCa and
other potential copper-nickel producers.
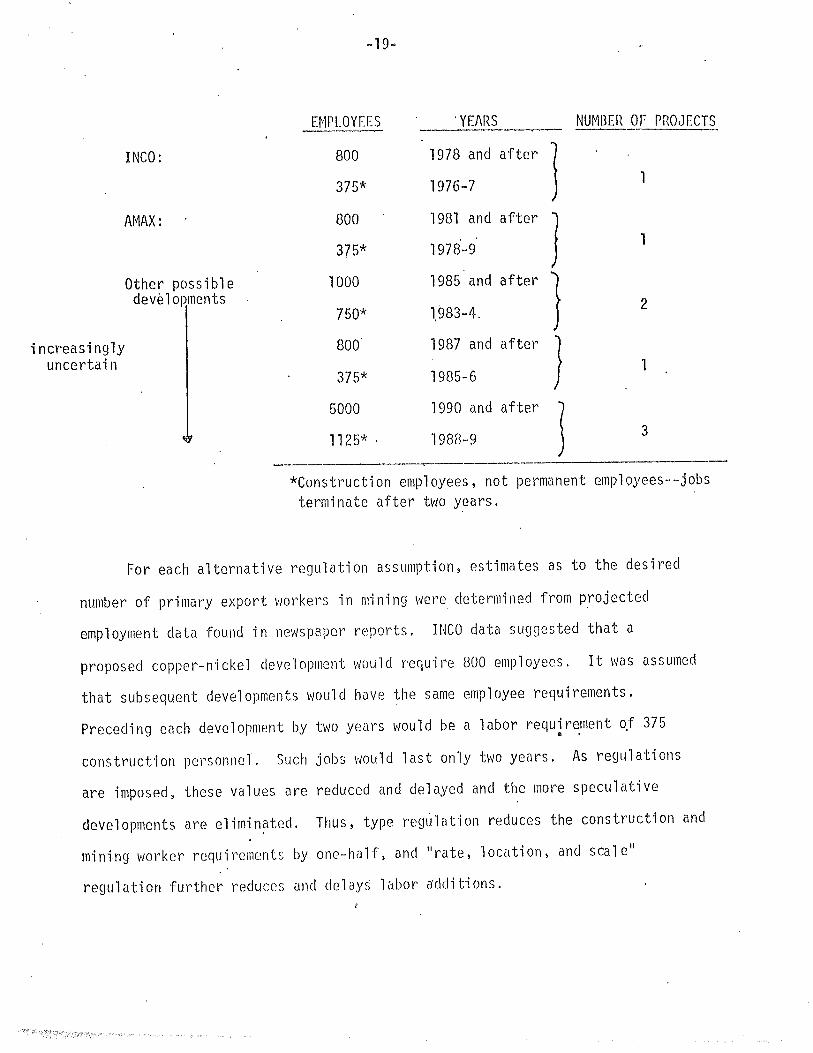
E~1PLOYEES 'YEARS NUMl3EI~ OF rROJECTS-~~--
INCO: 800 1978 and after )375* 1976-7 1
AMAX: 800 1981 and after ]375* 1978-9 1
Other possible 1000 1985 and after }develop.ments2750* 1,983-4.
increasingly 800' 1987 and after ]uncertain 1375* 1985-6
5000 1990 and after
J1125* , 1988-9 3
*Construction employees, not permanent employees--jobsterminate after two years.
For each alternative regulation assu~ption, estimates as to the desired
number of primal'Y export vlOI'kers in mining Itlere determined from projected
employment data found in newspaper reports. INCa data suggested that a
proposed copper-nickel development would require 800 employees. It was assumed
that subsequent developments would have the same employee requirements.
Preceding each development by two years would be a labor requirement ~f 375. .construction pel'sonnel. Such jobs vJOuld last only tVJO years. As regulations
are imposed, these values are reduced and delayed and the more speculative
developments are eliminated. Thus, type reg0lation reduces the construction and
mini,ng worker requirements by one-half, and II ra te, location, and seal ell
regulat'ion further reduces and delays labor a'dditions.
-20-
F~Jr each gl'OI\lth philosophy, the \'/OI'keI'5 in th(~ export part of retreatibn
\'Jere assumed to grOl'1 at different rates. The rnte Vias denoted by a Ilrecreat·ion
grmvth factOI'll and assigned values of 1%, 3% and 6% per year' for the knm'll1,
moderate and rapid gro\\lth philosophies 1'0spect'ivcly. The original number of
workers in 1970 was 4441.
The following pages show the simulated regional responses to each of the
alternate development schemes depicted in Table 1. Results are presented on a
uniform format which includes the development assumptions, regional economic
and demographic projections, projected state and local direct and indirect
revenues, and a service facility assessment.
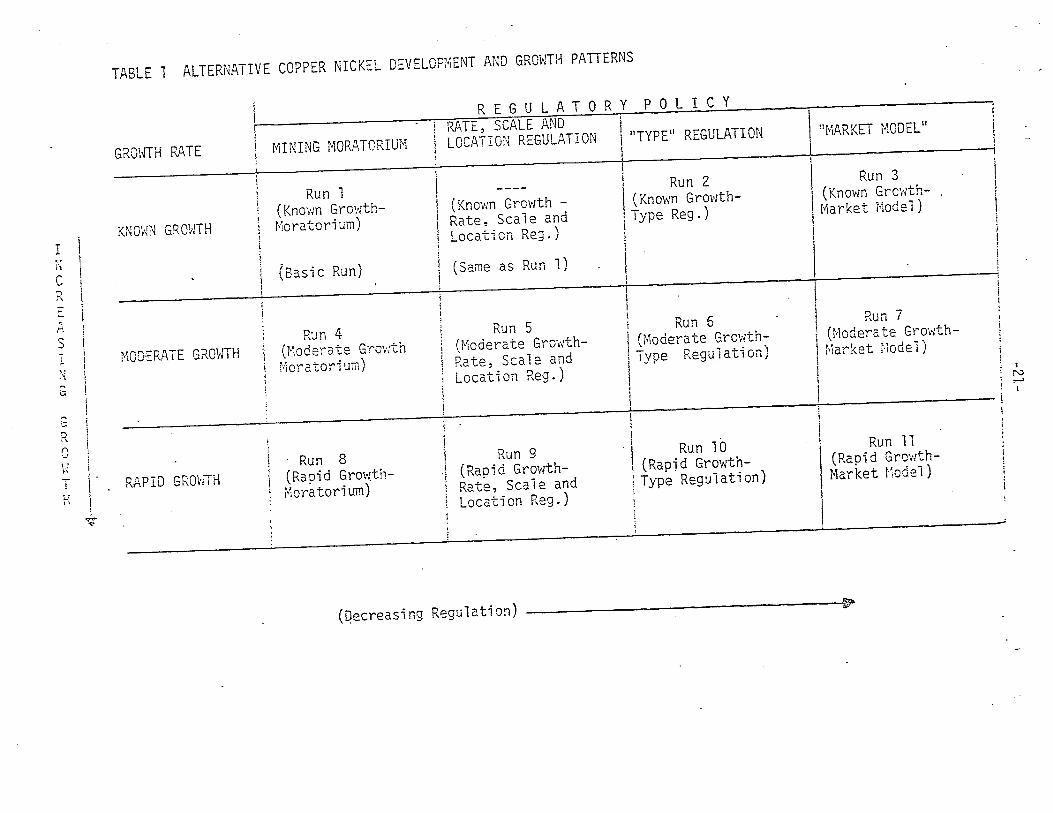
TABLE 1 ALTERNATIVE COPPER NICKEL DEVELOPMENT AND GROWTH PATTERNS
GROHTH RATE
I REGULATORY POLICY
I RATE, SCALE AND j
! MINING MORATORIUfvl LOCATION REGULATION I"TYPP REGULATION lJ~lARKET r~ODEl"
;I
I\i Run 6 I Run 7
! (Moderate Growth- 'I' U'loderate Gt~o\'ith-
i Type Regulation) ~'larket i'loden
1 I,
1
I'Ti't
CR...::.,sIiiiG
C;'-'
Rn'.1
~,! iI
i II
H I
\~
?
KNmlN GRO'ATH
r''iOV£RATE GROWTH
RAPID GROHTH
Run 1(Known Growthi'1oratorium)
(Basic Run)
R:m 4(Moderate Grov:thMoratorium)
, Run 8(Rapi d Grm1thiVloratori um)
(Knol'In GrowthRate, Scale andLocation Re].)
(Same as Run 1)
Run 5(Moderate GrowthRate, Scale andlocation Reg.)
Run 9(Rapid GrowthRate, Scale andL ...... D )
ocat..l0n "eg.
I
i Run 2I(Known Grovlth! Type Reg.)t
II
I ." Run 10
(Rapjd Growth-\ Type RegUlation)j1
Run 3(Known Grc~'/th
r~arket 11odel)
Run 11(Rapid GrowthMarket node1)
trv.,...
1
(Qecreasing Regulation)~
-22-
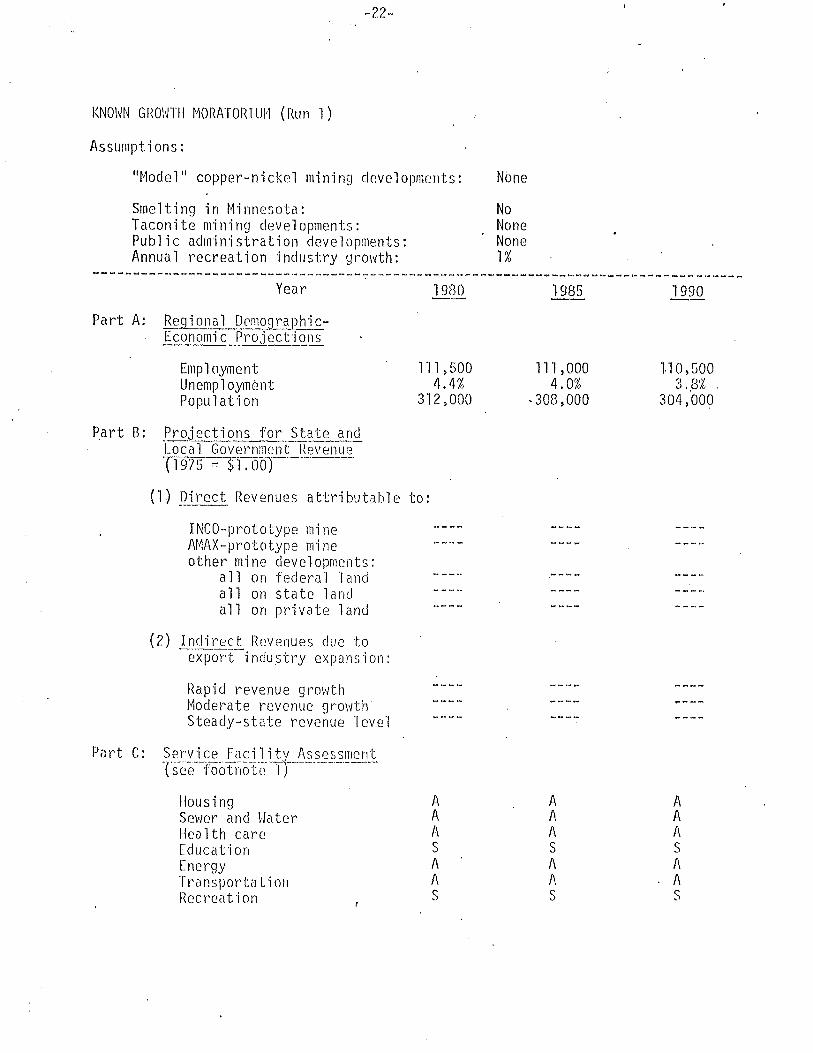
KNOI~N GRO\HIl t~OI(ATOIU lJl't (Ru n 1)
Assumptions:
IIModel" copper-nickel mining dr.ve1oplllents: None
Smelting in Minnesota: NoTaconite mining developments: NonePublic administration developments: NoneAnnual recreation industry growth: 1%
----------------------------'------7-'~---~----~--------~--------------~-~----------Year
Part A: Reg'j ana l_pemographi cEconomic Projections
Employment.UnemploymentPopulation
19(10
1n >5004.4%
312,000
1985
111,0004.0%
-308,000
1990
II 0, SOO3 _.8% '
304,000
Part B: Projections for State andLoc'ar-G·overn:np.nt Revenli~11975 == $1. ooT-----
(1) Direct Revenues attributable to:
INCO-prototype mineAMAX-prototype mineother mine developments:
all on federal landall on state landall on private land
(2) Indirect Revenues due to-export-i ndustry expans i on:
Part c:
Rapid revenue growthModerate revenue growthSteady-state revenue level
.S(,~rvi ce Fa~J}_i tL.~.~.~!?5...?~,cn:~see footnote -')
HousingSel'ler and I-laterHealth careEducationEnergyTransportationRoc rea t 'j on
AAASAAS
AAASA1\S
AAASAAS
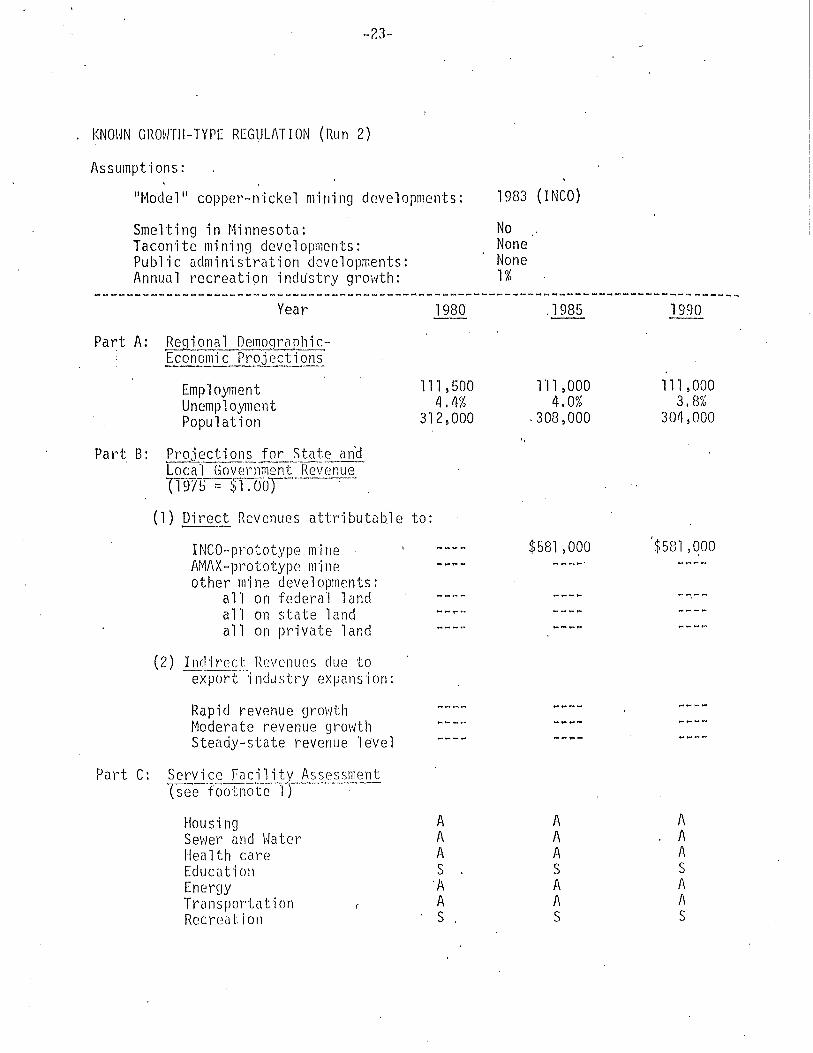
~23-
KNOWN GROWTH-TYPE REGULATION (Run 2)
Assumptions:
"Model ll copper-nickel min'ing developments:
Smelting in Minnesota:Taconite mining developments:Public administration developments:Annual recreation indtistry growth:
1983 (INCO)
NoNoneNone1%
------------------------------------------~--------------------~------------------Year
Part A: Regional DemographicEconomic Projection~
EmploymentUnemploymentPopulation
Pal't B: Projection,~1Q.~_tatLan'9.Local Government Revenue(1975 =: ~TJjoT-----'-
1980
111,5004.4%
312,000
.1985
I'll ,0004.0%
.308,000
1990
111,0003. 8~;
30(1, 000
(1) Direct Revenues attributable to:--- .
INCO-prototype mineAMAX-prototype mineother mine developments:
allan federal landallan state landallan private land
(2) Indirect Revenues due toexporf"i nclustry expans'ion:
Rapid revenue growthModerate revenue growthSteady-state revenue level
$581 ,000 '$581,qoo
Housi ngSe\'ler und \}aterHea lth careEducatiollEnergyTransportationRecreat.ion
AAAS
'/\AS
AAASA1\S
AAASA1\S

-2~-
KNO\1N GROHTII-MI\RKET ~10DEL. (Run 3)
Assumptions:
"Model" copper-nickel min'ing dr.velopments:
Smelting in Minnesota:Taconite mining developments:Public administration developments:Annual recreation industry growth:
1978 (INCO)
YesNoneNone1%
------~---------------~------------_.~---~---~---~---- ---- -Year 1980 -1985-----------;990-----
Part A: R~ion(\l DC'mQS!rap.~ic-Economic Projections. ---
EmploymentUnemploymentPopulation
Part B: Projections for State an'dL()c-aTGov'ei~I" rnellT-Re"Jenue-fi-gT5--;'liToOj------,--
112,5004.0%
314,QOO
112,5003.8%
.310,000
112,5003. 6~~
303,000
(1) Oh'C'ciRevenues attributab'le to:
INCa-prototype mineAMAX-prototype mineother mine developments:
all on federal landallan state landallan private land
(2) Indirect Revenues due to-e-xporf--'j ndu stry expans ion:
$806,000 $80G,000... _.-",,:
$806,000
Rapid revenue grovlth $3,560,000 $4,460,000 $11 ,400 ~ 000t~oderate revenue growth 3,160,000 3,560,000 7,680,000Steady-state revenue 1evel 2,3~O,00O 2,340,000 4,680~OOO
Pal~t c: Sel'vice FElcility Assessmentlse6---'F6-6 t fl'c-it pTr--··---·----
Housing A A ASevier and \4ater A A Aflea 1th ca.re A A AEduciltion S S S
Ener9Y A, A ATransport.ation 1\ A ARccrc~o t i on S S S
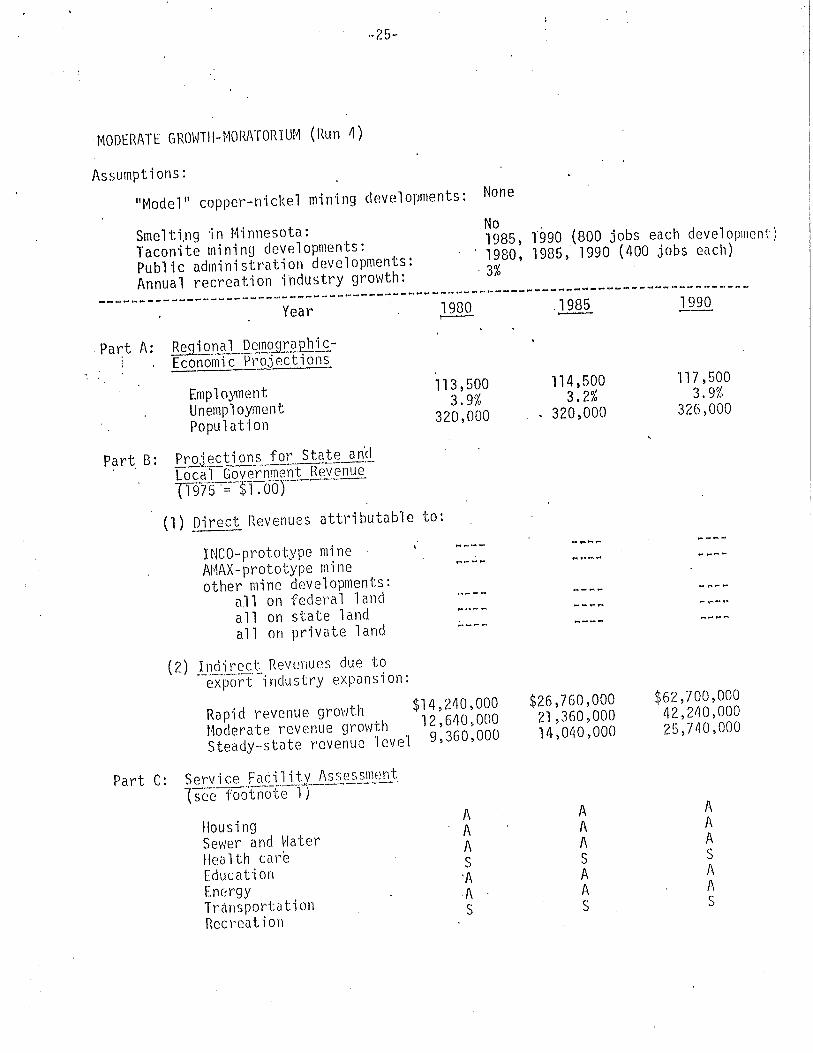
-25-
.MODERATE GROWTI1-MORATORIU1~ (Run 4)
Assumptions:
"Model ll copper-nickel mining developments: None
Smelting in Minnesota:Taconite mining developments:Public administration developments:Annual recreation ihdustry growth:
No1985, 1990 (800 jobs each development)1980, 1985, 1990 (400 jobs each)
. 3%
------------------------------------------------------ ----------------~-----------
Year 1980 ,,1.985 1990
. Part A: Regi ona1 .DemoJ1raphi c-Economic Projections
113,5003.9%
320,000
EmploymentUnemploymentPopulation
Part B: ProJecti ons for State an'c!Local Government RevenueTf§75 '';-Sl-:DoY---
(1) Direct Revenues attributable to:
INCa-prototype mine .AMAX-prototype mineother mine developments:
a.ll on feder'a 1 1andallan state landall on private land
(2) Indirect Revenuos due to--eX\:l0rt' -i ndu stry expilns ion:
114,5003.2%
. 320,000
117 ,5003.9%
326,000
Rapid revenue growthModerate revenue growthSteady··st<lte revenue 1eve1
Part C: Service Facility Assessment(see foci'tnoter'r -'
$14,240,00012,640,0009,360,000
$26,760,00021,360,00014,040,000
$62,700,00042,240,00025,740,000
Housing A A A
SevIer and Hater A A A
Ilea lth care A A A
Educa t-i on S S S
Energy'A A A
Transportation A A A
RecreationS S S
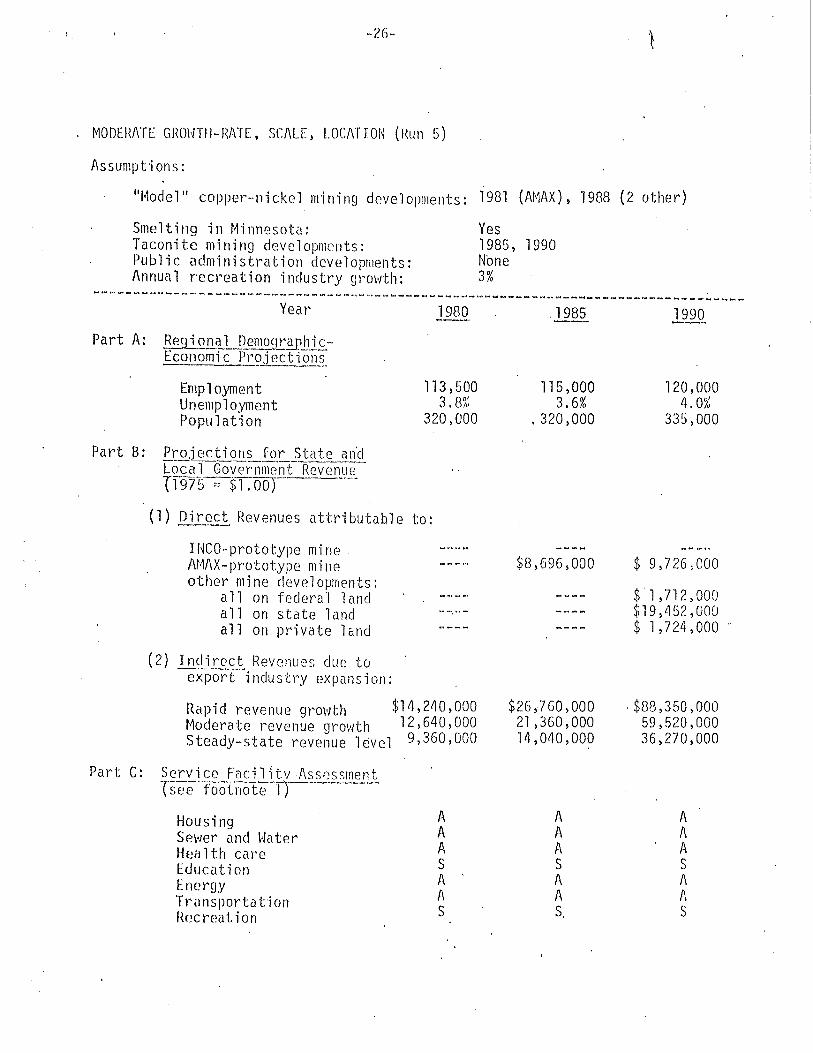
-26··
MODERATE GRO\oJTH-HATE, SCALE, LOCATION (J{un 5)
Assumptions:
"Model" copper-nickel m'ining developments: 1981 (AMAX), 1988 (2 other)
Smelting in Minnesota:Taconite mining developments:Public administration developlllents:Annual recreation industry growth:
Yes1985, 1990None3%
-----------------------y~;;.----------------i980-----------;98S-----------'99Q-----
Part A: .Regional Demo9--'CEJ?hicEconomic PrQjection~
113,500EmploymentUnemp1oymentPopu 1at ion
Part B: Projections for State an'dLaca 1 Gover'nrn(~nt RevenueTf975-~01~oOT----""""'-
(1) Direct Revenues attributable to:
3. 8~~
115,0003.6%
.320,000
120,0004.0%
335,000
............ -
INCa-prototype mineAMAX-prototype mineother mine developments:
all on federal landallan state l"andall on private land
(2) .!Jlc!.t.recJ:. Revenues due toexport industry expansion:
Rapid revenue growth $14,240,000Moderate revenue growth 12 l 640,OOOSteady-state revenue l~vel 9 l 360,OOO
Part C: Service FacilltvAss0ssment"('see -f:oolnotcn--~'-----
$26,-760,00021 l360,00014,040,000
$ 9l726~OOO
$ 1J12) 000$19,452,000$ 1,724,000
. $88,350 lOOO59 l 520,OOO36,270 l 000
HousingSevier and ~'li.1ter
Health careEducutionEnergyTrll nspol'ta t ionHecreat ion
AAASAAS
AAASAAS.
AAASAPIS

.. 7.7 ~
MODERATE GROWTH-TYPE REGULATION (Run G)
Assumptions:
"l~odel" copper-nickel mining developments: 1983 (INcaL 1986 (M1AX)
Smelting in Minnesota:Taconite mining developments:Public administration developments:Annual recreation industry growth:
Year
Part A: ~i ana1 Derm:>.9.r.~J)hi c·'Economic Projections
1980
No1985~ 1990None3%
.1985 1990
113~500
3.9%320~OOO
EmploymentUnemploymentPopulation
Part B: Projections fOl~ State an'dLocaTGO\~eilt-R'ev enue'1T9~75 "' $'1.00;----
(1) pi~ect Revenues attributaq1e to:
INCO-prototype mineAW\X-prototypc m'ineother mine developments:
allan federal landallan state landallan private land
(2) ]ndir~~t Revenues due to-'ex-pol·:-t-i ndu str'Y expans 'j on:
Rapid revenue growth $14 l 240 l 000Moderate revenue growth l2 l 640 l 000Steady-state revenue level 9 l 360,OOO
Part C: Service Facility Assessment'Csee'f'oofi-;ofe'T}-'-~--
, 114 ~500
3.3%.320 l 000
$58LOOO
$26,760,00021 ~360,OOO
14~040~OOO
117 ~500
4.0%328,000
$ smlooo$ 9 l 501 l 000
$68 l 400 l 00046 l 080 l 00028)080 l 000
HousingSewer and HaterHei1lth careEducationenergyTransportiJ.tionRecreation
AAASAA.S
AAAS1\AS
AAIISXXS

-w··
.MODERATE GI"\OHTfI-MI\RKET ~1DDEL (Run 7)
Assumpt 'j ons:
"14odel" copper-nickel mining developments: 1978 (INeoL 1981 (AMAX), 1985 (1 other
Smelting in Minnesota:Taconite mining developments:Public administration developments:Annual recreation industry growth:
Yes1985, 1990None3%
_______________________ ~ ~ M~ •• _
Year 1980,1985 ---------i99~----~
Part A: ~nal Demoqraphic-Econo'ii'iTC:py:QJ-e-ctlon's
114,5003.7%
320,000
$581 l 000
EmploymentUnemploymentPopulation
Part B: Project'ions for State andLocaTGovernment Revenue-TT§7s :;: $'1.00) ----
(1) Direc~ Revenues attributab,le to:
INCO-prototype mineAMAX-prototype mineother mine developments:
allan federal landallan state landall on private land
(2) Indirrct Rev~nues due to--export--i ndu stry expans ion:
Rapid revenue growth $1~,240,OOO
Moderate revenue growth 12,640,000Steady-state revenue level 9,360,000
117,5003.8%
.32,2,000
$ 581 lOOO8,471,000
581,0008,471,000
637,000
$31,220,00024,920,00016,380,000
121 ,0004.0%
336 1 000
$ 581 ,0009,501,000
581 ,OCO9,50"' lOCO
63/,000
$'91,200,00061,440,00037,440,000
Part c:
HousingSev.Jer and I-Iat.erHea lth careEducationEnenLYTransportationRecreation
AAASA1\S
AAASXXS
AAASXXS
, -29-
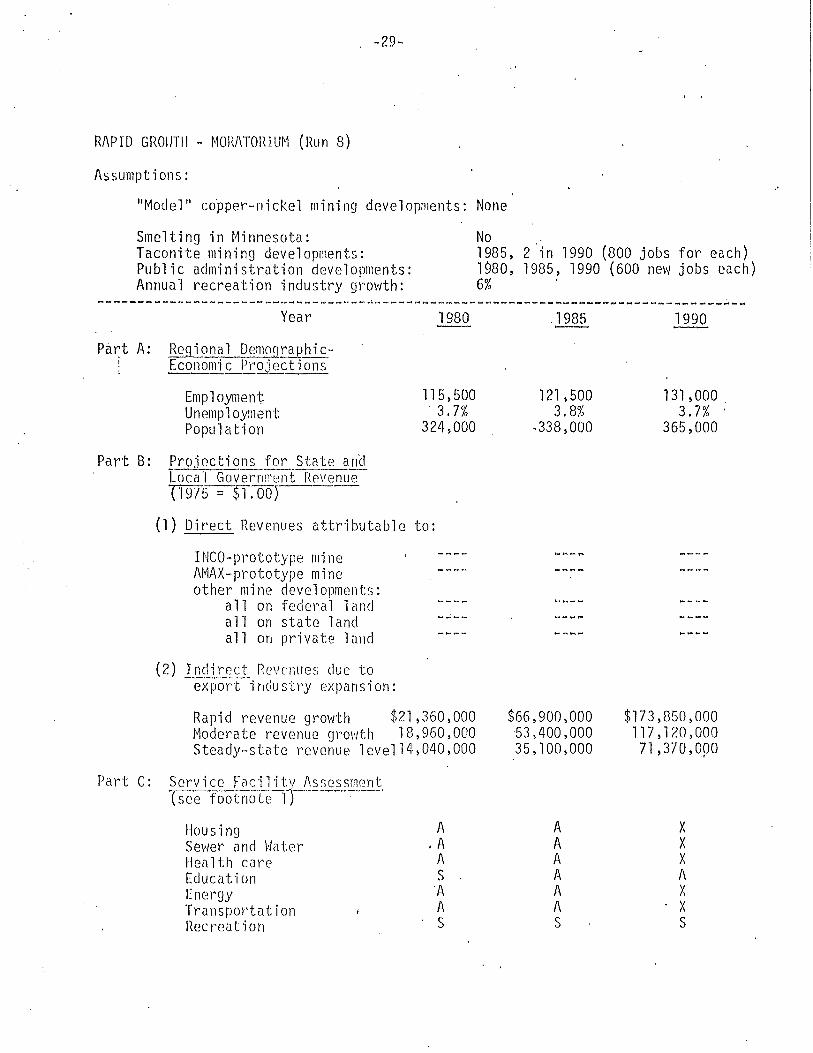
RAPID GROIJTlI - ~lOl{ATOrHUM (Run 8)
Assumptions:
"Model" copper-nickel min'ing developments: None
Smelting in Minnesota:Taconite mining developments:Public administration developments:Annual recreation industry growth:
No1985~ 2 in 1990 (800 jobs for each)1980~ 1985~ 1990 (600 new jobs each)6%
____________ ~ ~ __ d ~ _
Year
Part A: .!k,qiona1 DemQ.9r,~_phi cEconomic Projections
1980 ,1985 1990
l15~500
3.7%324~000
EmploymentUnemp1oymentPopulation
Part B: Projections for Sti'lte anclloea'i GovernfTl<:!n fl'{e\lenue(1975 '" $1. 00)
(1) Direct Revenues attributable to:
INCO-prototype nli neAMAX-prototype mineother mine developments:
all on federal landallan state landallan private land
(2) Indirect Revenues due to'-exp·orC·i nelu stry expans'j on:
Rapid revenue growth $21~360~000r~oderate revenue grol'lth 18 ~ 960 ~OOO
Steady-state revenue level14~040~000
121 ~ 5003.8%
,338~OOO
$66~900~OOO53~400,000
35~100~000
131,0003.7% '
365,000
$173~850~OOO
117 ~ 120, 00071 ~370,OPO
Part C: Service Facilitv Assessmentrc;cefootno1er)·--~----'
HousingSewer and I·JaterHoa lth ctlreEducat-jonEnergyTra ns po~'ta t ionI<ccrcation
A.A
1\S
'AAS
AAAAAAS
xXXAXXS
-30-
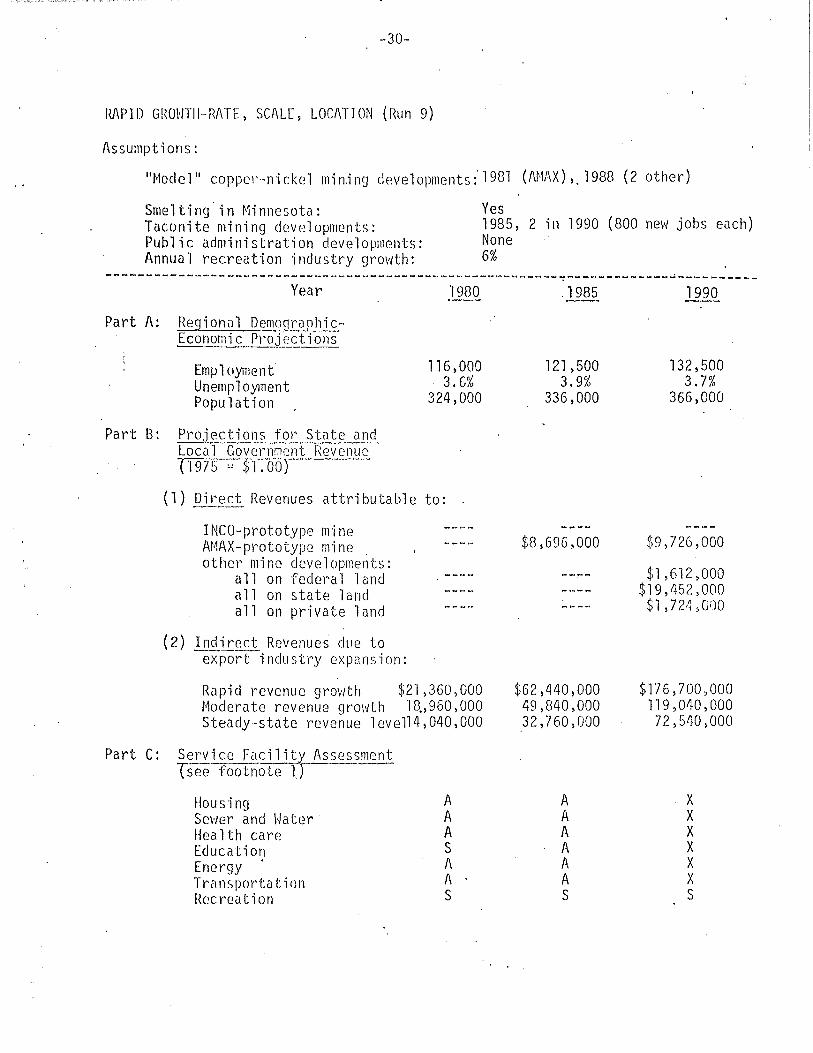
RI\PID GROI'JTII~RATE, SCAle, LOCATION (Run 9)
Assumptions:
IIMoclel 11 coppel'-n'ickel min,ing dpvelopments:'1981 (M1AX),,1988 (2 other)
Smelting in Minnesota:Taconite mining developments:Public administration developments:Annual recreation industry growth:
Yes1985, 2 in 1990 (800 new jobs euch)None6%______________________________________________________ ___ ~---~4---------~----------
Year
Part A: Reg,i on~emC!9raphi c,Economic Projections
1980 ,1985 1990
116,0003.6%
324,000
EmploymentUnemrloymentPopulation
Part B: Projections for State andLOCa 1 Governm(;ntRevenue-('1975 = $"1. Oe)r-·-
(1) Direct Revenues attributable to: '
INCa-prototype mineAMAX-prototype mine ,other mine developments:
all on federal landall on state landall on private land
(2) Indirect Revenues due toexport-inclustl~y expansion:
121 ,5003.9%
336,000
$8,696,000
132,5003.7%
366,000
$9,726, 000
$'1,612,000$19,452,000
$1,72·1$000
Rapid revenue grovlth $21,360,000Moderate revenue growth 1Q,960,OOOSteady-state revenue 1evel14,040,000
Part c: Servi ce Facil ity AssessmentTseefootnote lr-----
Hou S'j ngSewer and WaterHoa lth careEducationEnergy .TransportationRec rell t i on
AAASA1\S
$62,440,00049,840,00032,760,000
AA1\AAAS
$176,700,000119 ,040, 00072,540,000
xXXXXXS
-31-
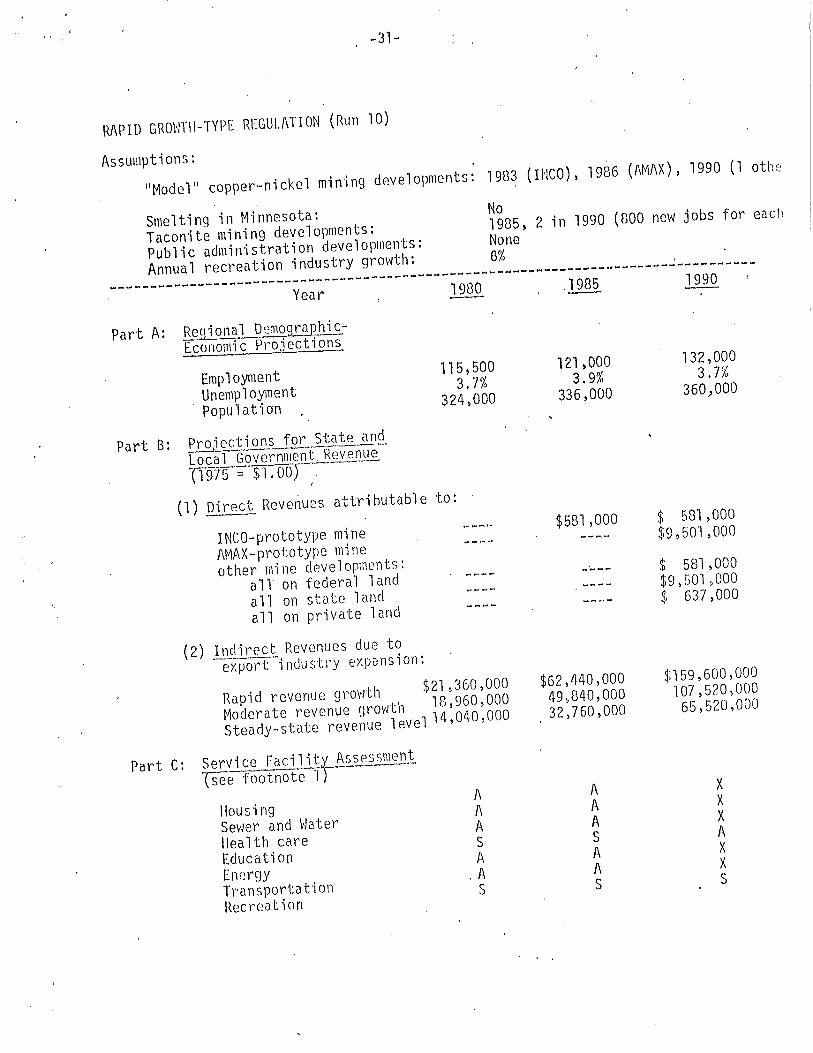
RAPID GROHTII··TYPE REGULATION (Run 10)
Assumptions:
IIModel" copper-nickel min'ing developments: 1983 (INCO), 1986 (AMI\X), 1990 (1 othe
Smelting in Minnesota:Taconite mining developments:Public udmilristration developments:
Annual recreation industry growth:
No1985, 2 in 1990 (800 new jobs for each
None6%
----------------------------------
-------------------- ~---~---_ .._-----------------
Year
Part A: Regional D'2n109r.i!.PhicEconomic Projections
1980 .1985
115,5003.7%
324,000EmploymentUnemployment
. Population
Part 8: Projections for State andLocalG"overnl1lent. Revenue'-'-erg? 5 == $'j •ooT--~'-'--
I
(1) Direct Reve~ues attributable to: '
121,0003.9%
336,000
132,0003.7'!0
360,000
INCO-prototype mineAMAX-prototype mineother mine developments:
all on federal landallan state landallan private land
(2) Indirect Revenues due to-e-iport -i ndu stry exp0ns i on:
Rapid revenue growth $21,360,000
Moderate revenue growth 18,960,000
Steady-state reve~ue level 14,040,000
Service Faci1itX-0,ss0;ssmeDi""(See footnote 'I)Part C:
HousingSeVIer and \'JaterIlea lth cClreEducationEnergyTransportationRecre<1t'ion
AAASA
,f\
S
$581,000
$62,440,00049)840,00032,760,000
AAASA1\S
$ 581 ,000$9,501,000
$ 581 ,000$9)501)000$ 637,000
$159,600,000107,520,00065,520,000
xXXAXXS
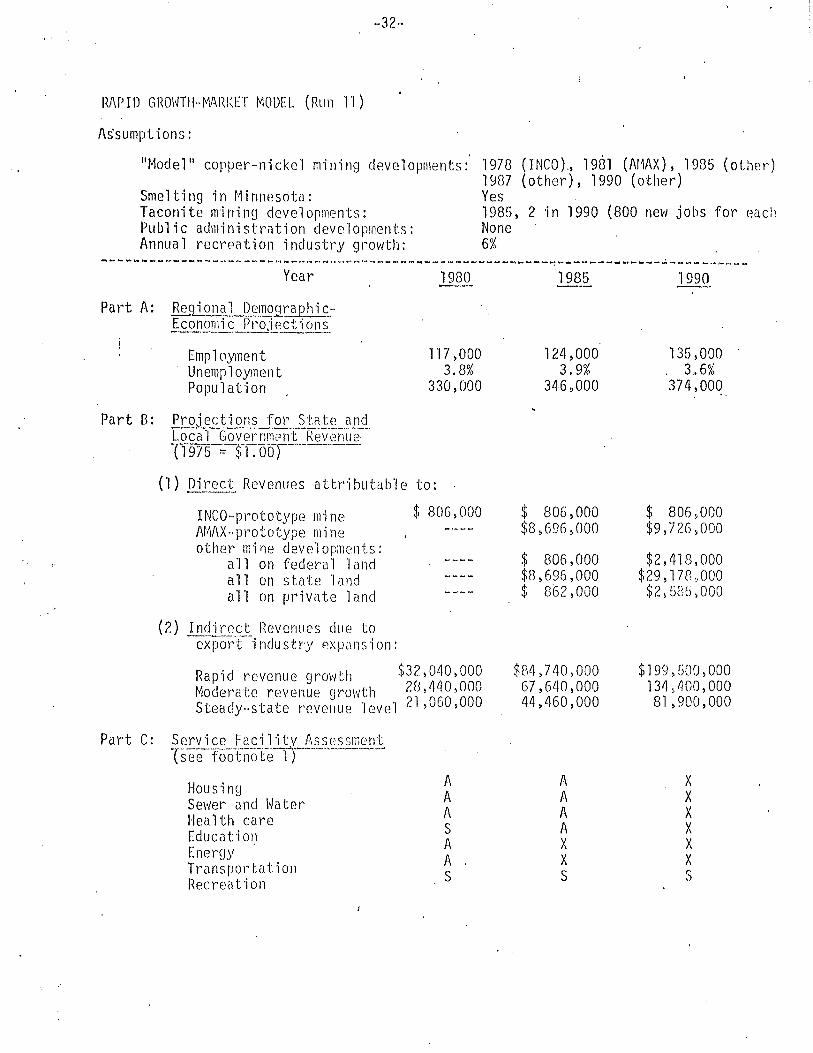
RAPID GHO\ffH··~1ARI<ET MODEL (Run 1'1)
As'sumpt ions:
"Model" copper··nickel mining dp.ve1oplllents:'
Smelting in Minnesota:Taconite mining developments:Public administriltion developments:Annual recreation industry growth:
1978 (INCO).~ 1981 (Ar1AX)~ 1985 (other)1987 (other), 1990 (other)Yes1985, 2 in 1990 (800 neVI jobs for eachNone .6%
--------~------~------~--~---~~-_.~------~~--~-~-~--------~-------------~--~--~----Year 1980 1985 1990
Part A: ~qi ont0..J)_emq.9.~hi cEconomi<=: Projections
EmploymentUnemploYlnentPopUlation
Part B: Projections for State andLoc'a"'IGovel:'nlT1i?nt Rev'eniJe.{1975---;-Sl-:-obT-'"
117 >0003.8%
330,000
l24~000
3.9%346,000
135,000. 3.• 6%374>000. '.
$ 806,000
(1) Direct Revenues attributable to:--- .INCa-prototype mineAMAX-prototype mineother mi i)e deve1op;nents:
all on federal landallan state landallan private land
(2) Indirr.ct l1evcnues due to-exl:JOr't--indushy 0.xpunsion:
Rapid revenue growth $32>040,000Moderate revenue growth 28,440>000Steacly.. state revenue level 21 >060,000
Part C: Service Facilitv AssessmentTsee ·tooTnoTe-n----"-~---··
$ 806,000$8,696,000
$ 806~000
$8>696~000$ 862>000
$84,740>00067,640,00044~460,OOO
$ 806,000$9>726,000
$2,418,000$29> 178,,000$2,586,000
$199,GOO,000134,400,00081,900,000
Housing A A X
Se\ver and \~atf;rA A X
Hea lth care A A X
Educution S A X
Energy A X X
Trllnsrortatioll A X X
Recrc<ltion S S S
1\ ::: popu1 ati on gl'ovlth betvleen-2% and 5% in 5 yearperi od. ' .
S = over 2% decline in 5 years.X ::: over 5% growth in 5 years.
(No direct Impact)
- ;l3,"
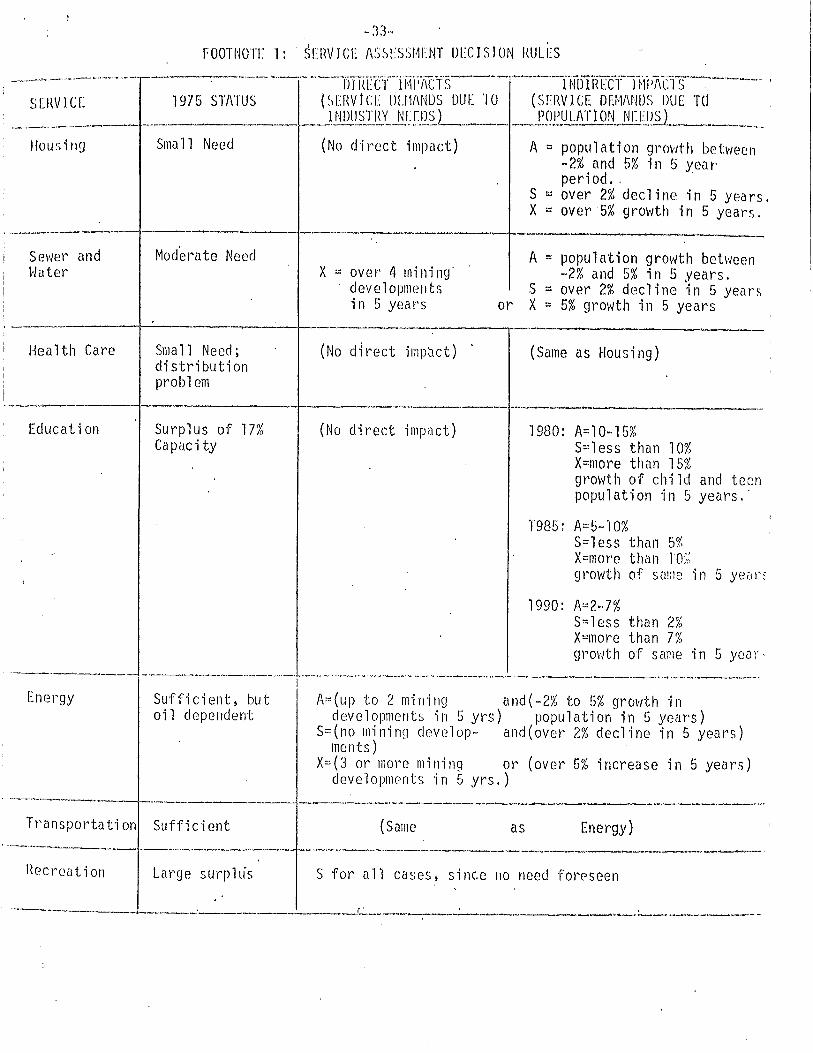
FOOTNOTE 1: . 5E1WICE I\SSlS)r~ENT DECISION RULES
---~_ ...~--~ .._......- c--.--------.-.-. "--"-"-lJTTW(;Y"il',1i';i\Cts-~--""'--TNiffir[CfJhi)7\trs-'---,SERVICE 1975 STATUS Ul[RVtCE lJIJlI\NDS DUE TO (SERVICE DfJ-1MH)S DUE Td
__. ._---.---------J--J NDl!~~!Jly__~J.: [1)5) •__f~gtULAT1QJi.~gl!5L_. ~_ ...lIou sing Sma 11 Need
_________-1 -+- . .__ ---,_.-.----.-------
Sevier andI-later
Mod'era te NeedX ::: over 4 rni l1i ng'
deve1opmentsin 5 years
A= population growth between-2% and 5% in 5 years.
S ::: over 2% decline in 5 yearsor X::: 5% growth in 5 years
liea lth Care Sma 11 Need;distributionproblem
(No direct imp~ct) (Same as Housing)
._--------------Education Surplus of 17%
Capac i ty(No direct impact) 1980: 1\=10-15%
S~:l ess than 10%X:::rnore than 15~£
growth of child and teenpopulation in 5 years,'
1985: I\=S-lO%S=less than 5%X=l11ore than 1'0::;growth of Su!l1e ; n 5 yeal'~
1990: 1\:.:2-7%S=l ess than 27;X=more tho.n 7%growth of same in 5 year-
Energy
.__._------ -- _·_-_··_-_·_-----·-I·--·---_·_~-_··- "'--""----'----'--'---~---'--"- ._._.Sufficient, but A:::(up to 2 m1n111g al1d(-2% to 5% gro\'lth inoil dependent developments in 5 yrs) population in 5 years)
S=(no mining develop- and (over 2% decline in 5 years)ments)
X=(3 or more m1n1n9 or (over 5% increase in 5 years)d(~velopments 'in 5 yrs,)
.._-_._.------I---------·-..........jl-·-----_·~_·_--_·_-~---Transportation Sufficient (Same as Energy)
.._-_._-----+-_._._--_.__.__.._----_.._.._.-.._-------~-------.-,---------_.Hecl'eution Large surplLis S for a11 cuses, since 110 need fOI'<?seen
'- -l-.. . . ._f· ~ . . _