· preliminary official statement dated, january 13, 2017 moody’s: aa1 s&p: aa new issue...
TRANSCRIPT

PRELIMINARY OFFICIAL STATEMENT DATED, JANUARY 13, 2017
MOODY’S: Aa1
S&P: AA
NEW ISSUE BOOK-ENTRY ONLY
In the opinion of Bond Counsel, under existing statutes and court decisions, assuming
continuing compliance with certain conditions imposed by applicable federal tax law as described
herein, interest on the Bonds is excluded from the gross income of the owners thereof for federal
income tax purposes. Interest on the Bonds will not be treated as a preference item in calculating the
alternative minimum tax imposed under the Internal Revenue Code of 1986, as amended, with respect
to individuals and corporations. It should be noted, however, that for the purpose of computing the
alternative minimum tax imposed on corporations (as defined for federal income tax purposes), such
interest is taken into account in determining adjusted current earnings. The interest on the Bonds is
excluded from gross income for state of Oklahoma income tax purposes. See "TAX EXEMPTION"
herein.
$33,355,000
CITY OF TULSA, OKLAHOMA GENERAL OBLIGATION REFUNDING BONDS OF 2017, SERIES A
Dated: March 17, 2017 Due: December 1, as shown
Interest on the Bonds is payable on each June 1 and December 1, commencing June 1, 2017. The Bonds
will be issued and registered in the name of Cede & Co., as nominee of the Depository Trust Company, New
York, New York ("DTC"), to which all payments of principal and interest will be made. Purchasers will acquire
beneficial interests in the Bonds, in principal amounts of $5,000 and integral multiples thereof, by book-entry
only. Purchasers of the Bonds will not receive physical delivery of bond certificates. The Bonds will not be
transferable or exchangeable, except for transfers to another nominee of DTC or otherwise as described herein.
See "DESCRIPTION OF THE BONDS — Book-Entry-Only System" herein. The Bonds are not subject to
optional redemption prior to maturity.
Principal Maturity Interest
Amount December 1, Rate Yield Cusip
10,985,000 2019
11,110,000 2020
11,260,000 2021
(Accrued interest to be added to prices of all Bonds)
The Bonds are offered when, as and if issued, subject to the approval of legality by Hilborne and
Weidman, a professional corporation, Tulsa, Oklahoma, Bond Counsel. Certain legal matters will be passed
upon by the Attorney General of the State of Oklahoma. Certain legal matters for the City of Tulsa, Oklahoma
(‘City’) will be passed upon by the City Attorney David O’Meilia. Delivery of the Bonds is anticipated to occur
in New York, New York, on or about March 17,2017.
Th
is P
reli
min
ary
Off
icia
l S
tate
me
nt
an
d t
he i
nfo
rmati
on
co
nta
ine
d h
ere
in a
re s
ub
ject
to
co
mp
leti
on
or
am
en
dm
en
t.
Th
ese
se
curi
tie
s m
ay
no
t b
e s
old
no
r m
ay
off
ers
to
bu
y b
e a
cce
pte
d p
rio
r to
th
e t
ime t
he
Off
icia
l S
tate
me
nt
is d
eli
ve
red
in
fin
al
form
. U
nd
er
no
cir
cum
stan
ces
sha
ll t
his
Pre
lim
ina
ry O
ffic
ial
Sta
tem
en
t co
nst
itu
te a
n o
ffe
r to
se
ll o
r a
so
lici
tati
on
of
an
off
er
to b
uy
no
r sh
all
th
ere
be
an
y s
ale
of
these
secu
riti
es
in a
ny
ju
risd
icti
on
in
wh
ich
su
ch o
ffer,
so
lici
tati
on
or
sale
wo
uld
be
un
law
ful
pri
or
to r
eg
istr
ati
on
or
qu
ali
fica
tio
n u
nd
er
the
se
curi
tie
s la
ws
of
such
ju
risd
icti
on
.

i
CITY OF TULSA
LIST OF PRINCIPAL OFFICIALS
MAYOR
G.T. Bynum
COUNCIL MEMBERS
Vanessa Hall-Harper District 1
Jeannie Cue District 2
David Patrick District 3
Blake Ewing District 4
Karen Gilbert District 5
Connie Dodson District 6
Anna America District 7
Phil Lakin, Jr. District 8
Ben Kimbro District 9
CHIEF OF STAFF
Jack Blair
DIRECTOR OF FINANCE
Michael P. Kier, CPFO
CITY AUDITOR
Cathy Criswell

ii
This Preliminary Official Statement does not constitute an offer to sell or a
solicitation of an offer to buy nor shall there be any sale of the Bonds to any person in any
jurisdiction in which it is unlawful to make such offer, solicitation or sale. No dealer, broker,
salesman or other person has been authorized to give any information or to make any
representation other than contained in this Preliminary Official Statement. If given or made,
such information or representation must not be relied upon.
The Bonds will not be registered under the Securities Act of 1933, as amended, and
the City does not intend to list the Bonds on any stock or other securities exchange. The
Securities and Exchange Commission has not passed upon the accuracy or adequacy of this
Preliminary Official Statement. With respect to the various states in which the Bonds may be
offered, no attorney general, state official, state agency or bureau or other state or local
governmental entity has passed upon the accuracy or adequacy of this Preliminary Official
Statement or passed upon or endorsed the merits of this offering of the Bonds.
The information set forth herein has been obtained from the City, public officials,
official records, and other sources which are believed to be reliable, but is not guaranteed as
to accuracy or completeness, and is not to be construed as a representation by any of such
sources as to information from any other source. The information and expressions of opinion
herein are subject to change without notice, and neither the delivery of this Preliminary
Official Statement nor any sale made hereunder shall under any circumstances create any
implication that there has been no change in the affairs of the City since the date hereof.
Any statements, contained in this Preliminary Official Statement including matters of
opinion, estimations or projections, whether or not expressly so stated, are intended as such
and not as representations of facts. This Preliminary Official Statement shall not be construed
as a contract or agreement between the City and the purchasers or holders of any of the
Bonds.
iii
Table of Contents INTRODUCTION .................................................................................................................................................. 1
DESCRIPTION OF THE BONDS ......................................................................................................................... 1
General ............................................................................................................................................................... 1
Book-Entry Only System ................................................................................................................................... 1
Payment and Security for the Bonds .................................................................................................................. 3
Tax Levy and Collection Procedures ................................................................................................................. 4
No Redemption Prior to Maturity....................................................................................................................... 4
Transfer and Record Date ................................................................................................................................... 4
ESTIMATED SOURCES AND USES OF FUNDS .............................................................................................. 5
PLAN OF REFUNDING ........................................................................................................................................ 5
THE CITY OF TULSA .......................................................................................................................................... 5
Governmental Structure and General Information ............................................................................................. 5
Principle Government Services .......................................................................................................................... 6
Economic and Demographic Characteristics of the City .................................................................................... 6
FINANCIAL MANAGEMENT AND CONTROL ................................................................................................ 7
Accounting and Reporting Practices .................................................................................................................. 7
Government-Wide Highlights ............................................................................................................................ 8
Fund Financial Statements ................................................................................................................................. 8
Changes in Net Position ..................................................................................................................................... 8
General Fund Budget and Actual Year Ended June 30, 2016 .......................................................................... 10
Sales Tax Revenue History .............................................................................................................................. 11
CITY INDEBTEDNESS ...................................................................................................................................... 11
Authorization .................................................................................................................................................... 11
General Long-Term Liabilities ......................................................................................................................... 12
Subsequent Maturities General Obligation Debt .............................................................................................. 13
Debt Ratios ....................................................................................................................................................... 13
Direct and Overlapping Debt ........................................................................................................................... 14
Tax Collections ................................................................................................................................................ 15
Property Tax Base ............................................................................................................................................ 16
Principal Taxpayers .......................................................................................................................................... 17
Public Trusts and Authorities ........................................................................................................................... 18
Multi-Beneficiary Trusts-Joint Venture ........................................................................................................... 19
Other Obligations ............................................................................................................................................. 20
Municipal Employees’ Retirement Plan ........................................................................................................... 20
Oklahoma Firefighters’ Pension and Retirement System ................................................................................. 21
Oklahoma Police Pension and Retirement System ........................................................................................... 22
ABSENCE OF MATERIAL LITIGATION ......................................................................................................... 22
INCONTESTABILITY ........................................................................................................................................ 22
LEGAL MATTERS ............................................................................................................................................. 22
TAX EXEMPTION .............................................................................................................................................. 22
INDEPENDENT AUDITORS ............................................................................................................................. 23
CREDIT RATINGS ............................................................................................................................................. 23
CERTIFICATE WITH RESPECT TO PRELIMINARY OFFICIAL STATMENT ............................................ 23
CONTINUING DISCLOSURE ............................................................................................................................ 23
DEEMED FINAL ................................................................................................................................................. 24
MISCELLANEOUS ............................................................................................................................................. 24
Appendix A—Basic Financial Statements of The City of Tulsa for The Year Ended June 30, 2016
Appendix B—Additional Demographic and Economic Information Regarding the City
Appendix C—Form of Opinion of Bond Counsel
Appendix D—Form of Continuing Disclosure Certificate

1
PRELIMINARY OFFICIAL STATEMENT
$33,355,000
THE CITY OF TULSA, OKLAHOMA GENERAL OBLIGATION REFUNDING BONDS OF 2017, SERIES A
INTRODUCTION
The City of Tulsa, Oklahoma (the "City") is issuing its General Obligation Refunding Bonds of 2017,
Series A (the "Bonds") for the purpose of refunding certain outstanding general obligation bonds of the City
initially issued to fund certain capital improvements to be owned by the City, as more particularly described in
"PLAN OF FINANCING" herein. The Bonds are being issued in accordance with the provisions of Article X,
Section 27 of the Oklahoma Constitution as well as the laws of the State of Oklahoma supplementary and
amendatory thereto. The Bonds constitute direct and general obligations of the City, payable from ad valorem
taxes levied against all taxable property, excepting homestead exemptions, located therein without limitation as
to rate or amount.
Tulsa, the second largest city in the state of Oklahoma, is located in the northeastern part of the state
and is the business, financial, employment and cultural center of the metropolitan area and northeastern
Oklahoma. The population of the City, as reflected in the 2010 census, was 391,906, and the population of the
Tulsa MSA (comprised of Tulsa, Osage, Creek, Rogers, Wagoner, Pawnee and Okmulgee Counties) was
937,478.
The City has previously issued $51,800,000 General Obligation Bonds, Series 2009, in accordance
with Article X, Section 27, of the Oklahoma Constitution. The General Obligation Bonds of 2009 (“Prior
Bonds”) were used to fund streets, sanitary sewer, and flood control. The proceeds of the Bonds, will be used to
currently refund the outstanding principal of the Prior Bonds and pay the Cost of Issuance of the Bonds. See
“PLAN OF REFUNDING”.
DESCRIPTION OF THE BONDS General
The Bonds will be dated March 17, 2017, and will mature in the amounts and on the dates set forth on
the cover page of this Preliminary Official Statement. The Bonds will bear interest from March 17, 2017, at the
rates set forth on the cover page hereof, payable on each June 1 and December 1, commencing June 1, 2017.
Interest on the Bonds shall be computed on the basis of a 360-day year, consisting of twelve (12) thirty (30) day
months.
Book-Entry Only System
THE INFORMATION IN THIS SECTION, “BOOK-ENTRY-ONLY SYSTEM”, HAS
BEEN FURNISHED BY THE DEPOSITORY TRUST COMPANY. NO REPRESENTATION IS
MADE BY THE CITY AS TO THE COMPLETENESS OR ACCURACY OF SUCH
INFORMATION OR AS TO THE ABSENCE OF MATERIAL ADVERSE CHANGES IN SUCH
INFORMATION SUBSEQUENT TO THE DATE HEREOF. NO ATTEMPT HAS BEEN MADE
BY THE CITY TO DETERMINE WHETHER DTC IS OR WILL BE FINANCIALLY OR
OTHERWISE CAPABLE OF FULFILLING ITS OBLIGATIONS. THE CITY SHALL HAVE NO
RESPONSIBILITY OR OBLIGATION TO DTC PARTICIPANTS, INDIRECT PARTICIPANTS
OR THE PERSONS FOR WHICH THEY ACT AS NOMINEES WITH RESPECT TO THE
BONDS, OR FOR ANY PRINCIPAL, PREMIUM, IF ANY OR INTEREST PAYMENT
THEREOF.
The Depository Trust Company (“DTC”), New York, New York, will act as securities depository for
the Bonds. The Bonds will be issued as fully-registered bonds in the name of Cede & Co.,(DTC’s partnership
nominee) or such other name as may be requested by an authorized representative of DTC. One fully
registered Bond certificate will be issued for each maturity of the Bonds in the aggregate principal
2
amount of such maturity, and will be deposited with DTC at the office of the Trustee on behalf of DTC utilizing
the DTC FAST system of registration.
DTC, the world’s largest depository, is a limited-purpose trust company organized under the New
York Banking Law, a “banking organization” within the meaning of the New York Banking Law, a member of
the Federal Reserve System, a “clearing corporation” within the meaning of the New York Uniform
Commercial Code, and a “clearing agency” registered pursuant to the provisions of Section 17A of the
Securities Exchange Act of 1934. DTC holds and provides asset servicing for over 2 million issues of U.S. and
non-U.S. equity issues, corporate and municipal debt issues, and money market instruments from over 85
countries that DTC’s participants (“Direct Participants”) deposit with DTC. DTC also facilitates the post-trade
settlement among Direct Participants of sales and other securities transactions in deposited securities through
electronic computerized book-entry transfers and pledges between Direct Participant’ accounts. This eliminates
the need for physical movement of securities certificates. Direct Participants include U.S. and non-U.S.
securities brokers and dealers, banks, trust companies, clearing corporations, and certain other organizations.
DTC is a wholly-owned subsidiary of The Depository Trust & Clearing Corporation (“DTCC”). DTCC, in turn,
is owned by a number of Direct Participants of DTC and Members of the National Securities Clearing
Corporation, Government Securities Clearing Corporation, MBS Clearing Corporation, and Emerging Markets
Clearing Corporation, (NSCC, GSCC, MBSCC and EMCC, also subsidiaries of DTCC), as well as by the New
York Stock Exchange, Inc., the American Stock Exchange, Inc. and the National Association of Securities
Dealers, Inc. Access to the DTC system is also available to others, such as both U.S. and non-U.S. securities
brokers and dealers, banks, and trust companies and clearing corporations that clear through or maintain a
custodial relationship with a Direct Participant, either directly or indirectly (“Indirect Participants”). DTC has
Standard & Poors’s highest rating: AAA. The DTC Rules applicable to its Participants are on file with the
Securities and Exchange Commission. More information about DTC can be found at www.dtcc.com
Purchases of the Bonds under the DTC system must be made by or through Direct Participants, which
will receive a credit for the Bonds on DTC’s records. The ownership interest of each actual purchaser of each
Bond (“Beneficial Owner”) is in turn to be recorded on the Direct and Indirect Participants’ records. Beneficial
Owners will not receive written confirmation from DTC of their purchases. Beneficial Owners are, however,
expected to receive written confirmation providing details of the transactions, as well as periodic statements of
their holdings, from the Direct or Indirect Participants through which the Beneficial Owner entered into the
transaction. Transfers of ownership interests in the Bonds are to be accomplished by entries made on the books
of Participants acting on behalf of Beneficial Owners. Beneficial Owners will not receive certificates
representing their ownership interests in the Bonds, except in the event that use of the book-entry system for the
Bonds is discontinued.
To facilitate subsequent transfers, all Bonds deposited by Participants with DTC (or the Trustee on
behalf of DTC utilizing the DTC FAST system of registration) are registered in the name of DTC’s partnership
nominee, Cede & Co., or such other name as may be requested by an authorized representative of DTC. The
deposit of Bonds with DTC (or the Paying Agent on behalf of DTC utilizing the DTC FAST system of
registration) and their registration in the name of Cede & Co. or such other DTC nominee do not effect any
change in beneficial ownership. DTC has no knowledge of the actual Beneficial Owners of the Bonds; DTC’s
records reflect only the identity of the direct Participants to whose accounts such Bonds are credited, which may
or may not be the Beneficial Owners. The Participants will remain responsible for keeping account of their
holders on behalf of their customers.
Conveyance of notices and other communications by DTC to Direct Participants, by Direct
Participants to Indirect Participants, and by Direct Participants and Indirect Participants to Beneficial Owners
will be governed by arrangements among them, subject to any statutory or regulatory requirements as may be in
effect from time to time.
Redemption notices shall be sent to DTC. If less than all of a series of bonds within an issue are being
redeemed, DTC’s practice is to determine by lot the amount of the interest of each Direct Participant in such
issue to be redeemed.
Neither DTC nor Cede & Co. (nor any other DTC nominee), will consent or vote with respect to the
Bonds unless authorized by a Direct Participant in accordance with DTC’s Procedures. Under its usual
procedures, DTC mails an Omnibus Proxy to the City as soon as possible after the record date. The Omnibus
Proxy assigns Cede & Co.’s consenting or voting rights to those Direct Participants to whose accounts the
Bonds are credited on the record date (identified in a listing attached to the Omnibus Proxy).

3
Principal and interest payments on the Bonds will be made to Cede & Co., or such other nominee as
may be requested by an authorized representative of DTC. DTC’s practice is to credit Direct Participants’
accounts upon DTC’s receipt of funds and corresponding detail information from the City or BancFirst.,
Oklahoma City, Oklahoma, as the paying agent (“Paying Agent”) on the payable date in accordance with their
respective holding shown on DTC’s records. Payments by Participants to Beneficial Owners will be governed
by standing instructions and customary practices, as is the case with securities held for the accounts of
customers in bearer form or registered in “street name”, and will be the responsibility of such Participant and
not of DTC, the Paying Agent, or the City, subject to any statutory or regulatory requirements as may be in
effect from time to time. Payment of principal and interest on the Bonds to Cede & Co. (or such other nominee
as may be requested by and authorized representative of DTC) is the responsibility of the City or the Paying
Agent, disbursement of such payments to Direct Participants shall be the responsibility of DTC, and
disbursements of such payment to the Beneficial Owners shall be the responsibility of Direct and Indirect
Participants.
DTC may discontinue providing its services as securities depository with respect to the Bonds at any
time by giving reasonable notice to the City or the Paying Agent. Under such circumstances, in the event that a
successor securities depository is not obtained, The Bond certificates are required to be printed and delivered.
The City may decide to discontinue use of the system of book-entry transfers through DTC (or a
successor securities depository). In that event, The Bond certificates will be printed and delivered.
The City and the Paying Agent, so long as Cede & Co., as nominee of DTC, is the registered owner of
the Bonds, will recognize DTC or its nominee as the Owner of the Bond or Bonds for all purposes, including
notices and voting. The Paying Agent, so long as Cede & Co., as nominee of DTC, is the registered owner of
the Bonds, will send any notice to bondholders only to DTC. Any failure of DTC to advise any Participant, or
of any Participant to notify the Beneficial Owner, of any such notice and its content or effect will not affect the
validity or sufficiency of the proceedings premised on such notice.
The City and the Paying Agent have no responsibility or liability for any aspects of the records relating
to or payments made on account of beneficial ownership, or for maintaining, supervising or reviewing any
records relating to beneficial ownership of the Bonds.
The City cannot and does not give any assurances that DTC, Participants or others will distribute
payments of the principal of or interest on the Bonds paid to DTC or its nominee as the registered owner, or any
redemption or other notices, to the Beneficial Owners, or that they will do so on a timely basis, or that DTC will
service and act in the manner described in this Official Statement. Payment of and Security for the Bonds
The Bonds are payable from ad valorem taxes on the taxable property within the City including real,
business personal and public service property. Such property is currently assessed by the County Assessor at an
average rate of 11.0% of estimated market value. Pursuant to Oklahoma statutes, the County Assessor is
required to reassess both the business personal property and the real property within the County annually.
The ad valorem tax rates are set by determining the actual dollars of revenues required for payment of
principal and interest payments on indebtedness and judicial judgments. Such total amount may be reduced by
any surplus from the prior year and any contribution made into the Sinking Fund. To the resulting net
requirements, a reserve for delinquent taxes, in an amount of not less than 5% nor more than 20% of the net
required tax collection, is added to the required collections. Such final total requirement is then divided by the
total net assessed valuation of all real, business personal, and public service property in order to determine the
appropriate tax rate for each property owner.

4
Tax Levy and Collection Procedures
The Oklahoma Constitution requires that the City make annually an ad valorem tax levy for a Sinking
Fund which shall, with cash and investments in such fund, be sufficient to pay, first, interest on bonded
indebtedness as it falls due; second, the principal of bonded indebtedness as it falls due; and third, such
judgments as the City may by law, be required to pay.
After the Mayor computes the levy requirements for the Sinking Fund, and pursuant to direction from
the City Council, copies of the Sinking Fund estimates are submitted to the County Excise Board to determine
the ad valorem tax levy appropriations. This submission is required by July 20 of each year. The estimates are
for the purposes of determining ad valorem taxes required to fund the Sinking Fund. The amounts contained in
the estimate of needs are verified by the County Excise Board and upon verification, the levies contained
therein are ordered to be certified to the County Assessor in order that the County Assessor may extend said
levies upon the tax rolls for the year for which the estimate of needs is being submitted. The County Excise
Board further certifies that the appropriations contained in the estimate of needs and the mill rate levies are
within the limitations provided by law.
Cities and counties in Oklahoma are limited to a combined total of ten (10.3) mills from ad valorem
taxes for operating purposes. Since 1977, the Tulsa County Excise Board has not approved any millage for the
City for operating purposes since the ten (10.3) mills have gone to Tulsa County for its operating fund. For
purposes of the General Obligation bond debt service, however, there is no limitation as to the mill levy for debt
issued under Sections 26 or 27 of Article X of the Oklahoma Constitution. State statutes make it mandatory for
any unit of local government to annually provide for a tax sufficient to pay the principal and interest as they
become due on any outstanding debt.
The County Assessor is required to file a tax roll report on or before September 1, each year with the
County Treasurer indicating the net assessed valuation for each municipality within the County. This report
includes the assessed valuation for all real, business personal and public service property (public service
property assessed valuations are determined by the Oklahoma Tax Commission). The County Treasurer must
begin collecting taxes by November 1. Half of the taxes are payable before January 1, and the second half
become payable before March 1. Ad valorem taxes not paid before March 1 are considered delinquent.
Each unit of government receives its proportionate share of tax receipts from the County Clerk, based
on their individual mill levies, in the month following the collection of the same.
No Redemption Prior to Maturity
The Bonds shall not be subject to redemption prior to maturity.
Transfer and Record Date
No person shall be entitled to any right or benefit in the Bonds unless the name of such person is
registered by the Paying Agent as the Registrar of the City on the Registration Record. The Bonds shall be
transferable only upon delivery of the Bonds to the Registrar, duly endorsed or accompanied by a written
instrument of transfer in form satisfactory to the Paying Agent, duly executed by the Registered Holder hereof
or his attorney duly authorized in writing, and such transfer registered on the Registration Record. The
Registrar shall not be required to make such transfer after the fifteenth (15) day preceding any interest payment
date (the “Record Date”) until after said interest payment date.

5
ESTIMATED SOURCES AND USES OF FUNDS
The proceeds to be received from the sale of Series 2017A Bonds (excluding accrued interest), together
with other available funds, are estimated to be applied as follows:
Sources of Funds:
Proceeds of the Series 2017A Bonds -$
Transfer From City Sinking Fund - Total Sources of Funds -$
Uses of Funds:
Escrow Fund Deposit for Payment of Series 2009 Bonds -$
Transfer to Sinking Fund -
Series 2017A Costs of Issuance - Total Uses of Funds -$
PLAN OF REFUNDING
The Bonds are being issued to provide funds for the current refunding of the Prior Bonds. The unpaid
aggregate principal amount of the Prior Bonds is $35,300,000. The City will deposit a portion of the proceeds of
the Bonds along with moneys from its Sinking Fund into the City of Tulsa, Oklahoma, General Obligation
Refunding Bonds of 2017, Series A Special Escrow Fund (the “Series 2017A Escrow Fund”), to be held by
BOKF, National Association, Tulsa, Oklahoma, as Escrow Agent under the City of Tulsa, Oklahoma, General
Obligation Refunding Bonds of 2017, Series A Special Escrow Fund Agreement, (“Escrow Agreement”) dated
as of March 17, 2017. The moneys in the Series 2017A Escrow Fund will be sufficient to pay principal and
interest of the Prior Bonds upon their redemption on June 1, 2017. Upon the creation of the Series 2017A
Escrow Fund, the Prior Bonds will continue to be considered general obligations of the City but will not be
deemed outstanding for purposes of determining compliance with debt limitation. The Prior Bonds will be
secured solely by the moneys and investments held for them under the Escrow Agreement. See
“VERIFICATION”.
THE CITY OF TULSA
Governmental Structure and General Information
Tulsa has grown dramatically since its incorporation in 1898. A town site survey in 1900 indicated a
population of 1,390. The population of the Tulsa MSA (comprised of Creek, Okmulgee, Osage, Pawnee,
Rogers, Tulsa and Wagoner counties), as reflected in the 2010 census is 937,478.
The City was governed under a Commission form of government from 1909 until May 1990, at which
time City government changed to a Mayor-Council form under a voter-approved Charter change. The Mayor,
elected every four years, serves as the chief executive of the City and is responsible for all administration of city
departments and preparing and submitting an annual budget to the City Council pursuant to the City Charter and
the Oklahoma Municipal Budget Act. The City Council consists of nine members, elected for two year terms
and by geographic districts, and serves as the legislative branch under the direction of a Chairman, elected by
and from its nine members. The City Auditor, elected biennially, and the Mayor are the only two officials
elected at large.
The City Council has the authority to establish procedures for the appropriation of funds and
amendment of City budgets. Annual budget requests are prepared by each department and agency of the City
desiring public funds. These requests are submitted to the Department of Finance and reviewed by the Mayor
and his/her management team. The Mayor’s proposed annual budget is submitted to the City Council on or
before May 1 for its review. State law requires the annual budget to be adopted no later than seven days before
the start of the new fiscal year on July 1. The City Council may increase, reduce or omit any item, subject to the
veto power of the Mayor. A veto by the Mayor can be overridden by a two-thirds super-majority of the City

6
Council. Budget expenditures cannot exceed estimated revenues and fund balance available for appropriation,
and it is unlawful for the City to create or authorize a deficit in any fund. Unencumbered appropriation balances
lapse at the end of the year.
Downtown Tulsa is the business, financial, governmental and cultural center for the metropolitan area.
It contains half of the region’s office space and is the site of the Tulsa Performing Arts Center, Cox Business
Center and an 18,000 seat all-purpose arena, Bank of Oklahoma Center, which opened in September 2008.
Additionally, ONEOK Field was completed and opened for use in April 2010. The nearly 8,000 seat stadium is
home to Tulsa’s AA baseball affiliate.
Tulsa County Independent School District No. 1, the second largest school district in Oklahoma, serves
most of the area within the city limits. Other school districts serving parts of Tulsa include: Broken Arrow,
Bixby, Jenks, Union and Owasso. The Tulsa Technology Center, which serves high school students not going
to college, has been recognized as one of the best job training programs in the country. Both of the state’s
major universities, the University of Oklahoma and Oklahoma State University, have branch campuses in Tulsa.
Tulsa is also home of the largest community college in the state, Tulsa Community College. Long standing
private universities, the University of Tulsa and Oral Roberts University, also offer a wide variety of graduate
and post graduate degrees.
As in many cities across the country, medical service is becoming an important component of the
region’s economic base. Tulsa is the region’s medical center with five major hospital facilities. There are also
special facilities catering to patients with special needs. Two of the local hospitals are affiliated with the OU
and OSU medical schools.
Tulsa has numerous points of interest and cultural institutions. There are 130 parks including Mohawk
Park, the sixth largest municipal park in the United States and the site of two golf courses, a nature center and
the Tulsa Zoo. Woodward Park is the site of a nationally recognized municipal rose garden. Cultural institutions
include: Philbrook Museum, the city owned Thomas Gilcrease Institute of American History and Art, and
nationally recognized opera and ballet companies. Tulsa is the home of professional baseball, hockey,
basketball and arena football, as well as a full complement of NCAA Division I college athletics including:
football, basketball, golf, baseball, soccer, and tennis.
Tulsa also offers a wide range of shipping options: rail, water, truck, and air. The completion of the
McClellen-Kerr Arkansas River Navigation System in 1970 made Tulsa the westernmost inland port on the
Inland Waterway System.
Principal Government Services
Among the basic municipal services the City provides are; police and fire protection, airport facilities,
parks, street construction and maintenance, mass transit, convention and performing arts centers, parking
facilities, water and sewer systems, refuse collection and disposal, recycling, neighborhood revitalization and
land use regulation. The City does not provide educational, hospital, or welfare services. Sales and use taxes,
and user fees, provide most of the revenue for the City’s annual operating budget.
Historically, the City and public trusts established for the City’s benefit, have financed capital projects
with: earmarked sales tax revenues, General Obligation bonds, revenue bonds backed by user fees and federal
and state grants.
Economic and Demographic Characteristics of the City
The Tulsa Metropolitan Statistical Area (TMSA) comprises 25.1 percent of the state’s population and
30.3 percent of the state’s economy (TMSA share equals $49.3 billion in 2009 constant dollars). Almost all
leading indicators continued to perform well in the Tulsa Metropolitan Statistical Area in 2016. The area
population increased 0.8 percent in 2015, and although not all data is available yet, it has been forecast by
Experian Group to have increased another 0.7 percent in 2016. This would bring the total population to
982,521. Historically, the TMSA has grown by about 1 percent annually since the formation of the statistical
area in 1993.
Tulsa continues to maintain per capita incomes that exceed both the state and national averages. The
Metro Area has had a median annual growth of 5.1 percent since its formation in 1993, while the state and

7
U.S. have had rates of 4.3 percent and 3.5 percent respectively. At the same time, the Tulsa area has a distinctly
lower cost of living (14 percent in 2015) which on an ACCRA adjusted basis gives area residents an advantage
of nearly $10,000 on a per capita basis over the national average.
The area labor force gained 15,100 new participants in 2016. This was an increase of 3.3 percent over
the previous year. Wage and Salary employment reported its sixth consecutive year of growth, increasing 0.4
percent over FY15, and ended the fiscal year at a seasonally adjusted total of 443,600. The greatest relative
growth was sustained in the Trade sector, which increased 2.5 percent over the previous fiscal year, and at a
median annual rate of 1.2 percent over the previous 10 years. The larger Total Employment survey reported an
increase of 3.1 percent over the previous year to total 454,300 in FY15. As Total Employment grew at a slower
rate than the labor force, the metro jobless rate grew in FY15 to a seasonally adjusted 4.6 percent, an increase of
0.2 points from FY14 (4.4 percent). After 5 years of growth, retail sales in the TMSA remained essentially flat
in CY14, and then fell by 2.7 percent in CY15. However, Tulsa’s share of the metro retail trade grew 0.6
percent in CY16. The Oklahoma State University Center for Applied Economic Research has forecast retail
sales to increase at an annualized rate of 3.6 percent, employment to grow at 1.3 percent, and per capita
personal income to grow at 4.9 percent over the coming 4 years.
Gross Metro Product (GMP) for the area was estimated to have grown slightly at 0.6 percent over the
previous year; but is forecast to resume growth at an annualized rate of 2.8 percent through CY20. Barge
freight reported lower, but steady traffic during the previous year. Annual totals dropped significantly in CY16,
but are now rebounding with some vigor due to the completion of a major dock improvement which had closed
multiple channels previously. Annual total barge freight increased 27.3 percent in FY16. Considering the
growth forecast in both employment and GMP, it is expected that although the pace is stabilizing, the local
economy will continue to experience slight improvement and continued stability for the near future. The local
gas and mining industry retrenched early in this cycle, so it is possible that Tulsa has been somewhat hedged
against the stalling oil economy. Even as the oil economy contracts, it is apparent that overall employment
within the metro is continuing to grow, as demonstrated by the continued growth in employment and labor force
participation; as well as the area’s low unemployment rate.
Considering the growth forecast in both employment and GMP, it is expected that although the pace
may be slowing, the local economy will continue to experience modest improvement and continued stability.
For details on the economic and demographic characteristics of the City and the metropolitan area, see
APPENDIX B hereto.
FINANCIAL MANAGEMENT AND CONTROLS
Accounting and Reporting Practices
The accounting and reporting policies of the City conform to generally accepted accounting principles
for state and local governments. Generally accepted accounting principles for municipalities are defined as
those principles promulgated by the Governmental Accounting Standards Board ("GASB").
In accordance with GASB Statement 39, "The Financial Reporting Entity," the City, for financial
reporting purposes, includes all funds, account groups, agencies, boards, commissions and other authorities for
which the City is financially accountable.
The City's financial statements are prepared in conformity with generally accepted accounting
principles. For primary government activities (General, Special Revenue, Capital Projects, and Debt Service),
revenues are recognized when measurable and available to finance current expenditures. Expenditures are
recognized when a liability is incurred. The City's business type activities (Enterprise and Internal Service) are
accounted for on the accrual basis. Revenues are recognized when earned and expenses when incurred.
In developing the City's accounting system, consideration is given to the adequacy of internal
accounting controls. Internal accounting controls are designed to provide reasonable assurance regarding the
safeguarding of assets against loss from unauthorized use and the reliability of financial records for preparing
financial statements and maintaining accountability for assets.
Estimated purchase orders and contract amounts are encumbered prior to issuance to a vendor

8
or the signing of a contract. Purchase orders and contracts which result in an overrun of encumbered balances
are not issued or approved unless additional appropriations are made available. Open encumbrances are
reported as reservations of fund balances for governmental activities.
The City has been awarded a Certificate of Achievement for Excellence in Financial Reporting by the
Government Finance Officers Association of the United States and Canada (GFOA) for its Comprehensive
Annual Financial Report (CAFR) for the year ended June 30, 2015 and for each of the previous 34 years. The
June 30, 2016 CAFR has been submitted for review by the GFOA. The Certificate of Achievement for
Excellence in Financial Reporting is the highest form of recognition in the area of governmental accounting and
financial reporting, and its attainment represents a significant accomplishment by a government and its
management.
In order to be awarded a Certificate of Achievement, a government must publish an easily readable and
efficiently organized CAFR, the content of which conforms to program standards. Such reports must satisfy
both generally accepted accounting principles and applicable legal requirements.
Eligible CAFRs are evaluated by an impartial special review committee composed of government
finance officers, independent certified public accountants, educators, and others with particular expertise in
governmental accounting and financial reporting. The basic financial statements of the City as of and for the
year ended June 30, 2016, are included in Appendix A which should be read in its entirety. The CAFR may be
obtained from the City Controller, 175 E 2nd
St, Suite 575, Tulsa, OK 74103.
Government-Wide Highlights
The government-wide statements report information about the City as a whole using accounting
methods similar to those used by private-sector companies. The statement of net assets includes all of the
government’s assets and liabilities. All of the current year’s revenues and expenses are accounted for in the
statement of activities regardless of when cash is received or paid.
The two government-wide statements report the City’s net assets and how they have changed. Net
assets—the difference between the City’s assets and liabilities—is one way to measure the City’s financial
health, or position.
Fund Financial Statements
The fund financial statements provide more detailed information about the City’s most significant funds-
not the City as a whole. Funds are grouping of related accounts that the City uses to keep track of specific
sources of funding.
The General Fund is the general operating fund of the City. It is used to account for all financial resources
except those required to be accounted for in another fund.
Changes in Net Position
The City’s total revenues increased 12.85% to $597.8 million in 2016. Sales taxes, the largest revenue
category, increased to $234.9 million in 2016 from $231.9 million in 2015. Property taxes increased to $74.8
million in 2016 from $64.7 million in 2015, satisfying debt service requirements on recent general obligation
bond issues. Program revenue generated $164.2 million, consisting of charges for services, federal and state
grants, and other contributions, up from $147.1 million in 2015.

9
CITY OF TULSA
2016 2015 2014 2013 2012
Expe ns e s :
Go vernmenta l ac tivities :
Genera l go vernment 64,141$ 46,755$ 42,853$ 50,697$ 46,345$
P ublic s a fe ty and pro tec tio n 200,726 186,385 199,749 221,872 204,822
P ublic wo rks and trans po rta tio n 75,400 69,523 64,381 54,848 56,650
Culture and recrea tio n 24,124 22,638 24,629 25,372 20,858
So c ia l and eco no mic 38,629 31,409 27,845 32,071 24,089
Inte res t o n lo ng-te rm debt 11,864 12,285 12,250 13,097 12,724
To ta l go vernmenta l ac tivities expens es 414,884 368,995 371,707 397,957 365,488
Bus ines s -type ac tivities :
S to rmwater 30,084 25,877 25,721 26,004 27,729
One Techno lo gy Center 9,982 10,643 9,927 11,488 10,435
Arena & Co nventio n 24,910 25,507 23,815 23,993 22,823
Tuls a S tadium Trus t 3,330 3,500 4,028 3,733 3,603
Go lf Co urs es 3,288 2,917 3,183 3,544 3,696
To ta l bus ines s -type ac tivities 71,594 68,444 66,674 68,762 68,286
To ta l primary go vernment 486,478 437,439 438,381 466,719 433,774
P ro g ra m R e v e nue s :
Go vernmenta l ac tivities :
Charges fo r s e rvices
Genera l go vernment 25,492 9,664 10,279 14,789 14,421
P ublic s a fe ty and pro tec tio n 24,359 25,264 23,918 24,693 21,553
P ublic wo rks and trans po rta tio n 11,250 13,693 14,045 13,792 12,761
Culture and recrea tio n 4,814 5,006 4,754 4,516 4,148
So c ia l and eco no mic 1,913 1,626 1,155 2,037 1,850
Opera ting grants and co ntributio ns 29,486 32,364 35,063 35,742 29,629
Capita l grants and co ntributio ns 6,308 4,694 3,784 34,169 36,144
To ta l go vernmenta l ac tivities pro gram revenues 103,623 92,311 92,998 129,738 120,506
Bus ines s -type ac tivities :
Charges fo r s e rvices
Sto rmwater 27,674 25,099 23,625 24,101 23,604
One Techno lo gy Center 8,986 9,183 9,176 10,253 9,401
Arena & Co nventio n 15,633 16,514 13,953 12,634 12,012
Tuls a S tadium Trus t 281 276 334 299 246
Go lf Co urs es 2,828 2,420 2,700 2,558 2,574
Opera ting grants and co ntributio ns - - - 3 308
Capita l grants and co ntributio ns 4,689 1,291 2,360 1,277 1,072
To ta l bus ines s -type ac tivities pro gram revenues 60,091 54,783 52,148 51,125 49,217
To ta l primary go vernment pro gram revenues 163,714$ 147,094$ 145,146$ 180,863$ 169,723$
N e t (e xpe ns e ) re v e nue :
Go vernmenta l ac tivities (311,261) (276,684) (278,709) (268,219) (244,982)
Bus ines s -type ac tivities (11,503) (13,661) (14,526) (17,637) (19,069)
To ta l primary go vernment ne t expens e (322,764)$ (290,345)$ (293,235)$ (285,856)$ (264,051)$
Ge ne ra l R e v e nue s a nd Othe r C ha ng e s in N e t P o s it io n:
Taxes
Sales tax 234,912 231,997 231,108 227,905 219,240
P ro perty tax 73,450 64,667 59,659 58,445 58,955
Franchis e tax 22,620 24,039 24,053 22,588 22,427
Us e tax 23,640 24,104 24,776 22,393 21,522
Ho te l / mo te l tax 7,483 7,552 7,050 6,676 6,120
Unres tric ted grants and co ntributio ns 6,814 6,037 7,894 22,154 23,305
P ayments fro m co mpo nent units 14,631 14,100 14,710 4,282 690
Inves tment earnings 7,910 6,469 7,072 (2,343) 2,888
Mis ce llaneo us 4,749 2,734 2,253 9,812 4,586
Trans fers (5,479) (5,644) (15,060) (18,092) (16,814)
To ta l go vernmenta l ac tivities 390,730 376,055 363,515 353,820 342,919
Bus ines s -type ac tivities :
Inves tment earnings and o ther 1,109 937 3,193 (1) 316
Trans fers & capita l co ntributio ns 5,479 5,644 15,060 18,092 16,814
To ta l bus ines s -type ac tivities 6,588 6,581 18,253 18,091 17,130
To ta l primary go vernment 397,318$ 382,636$ 381,768$ 371,911$ 360,049$
C ha ng e s in N e t P o s it io n:
Go vernmenta l ac tivities 79,469 99,371 84,806 85,601 97,937
Bus ines s -type ac tivities (4,915) (7,080) 3,727 454 (1,939)
To ta l primary go vernment 74,554$ 92,291$ 88,533$ 86,055$ 95,998$
(amo unts expres s ed in tho us ands )
C ITY OF TULS A
C HA N GES IN N ET P OS ITION
La s t F iv e Ye a rs
(accrua l bas is o f acco unting)

10
General Fund Budget and Actual Year Ended June 30, 2016
The General Fund is summarized below.
GENERAL FUND
Original Final
Revenues
Taxes 204,877$ 200,447$ 198,552$ (1,895)$
Licenses and permits 8,121 8,121 8,398 277
Intergovernmental 8,128 8,128 8,411 283
Charges for service 21,146 21,146 17,508 (3,638)
Fines and forfeitures 9,900 9,900 7,878 (2,022)
Investment income 2,479 2,479 3,035 556
Payments from component unit 13,545 13,545 14,049 504
Miscellaneous 1,932 1,932 3,523 1,591
Total revenues 270,128 265,698 261,354 (4,344)
Expenditures
Current
General government 42,647 39,892 38,928 964
Public works and transportation 21,258 20,625 17,087 3,538
Social and economic development 12,260 11,872 11,690 182
Public safety and protection 169,021 172,359 171,085 1,274
Culture and recreation 22,060 21,012 20,878 134
Payments to component units 7,619 7,238 7,238 -
Total expenditures 274,865 272,998 266,906 6,092
Excess (deficiency) of revenues
over expenditures (4,737) (7,300) (5,552) 1,748
Other financing sources (uses)
Transfers in 2,203 2,203 3,348 1,145
Transfers out (5,717) (5,717) (5,717) -
Total other financing uses (3,514) (3,514) (2,369) 1,145
Net change in fund balances (8,251) (10,814) (7,921) 2,893
Fund balances, beginning of year 36,109 36,109 36,109 -
Fund balances, end of year 27,858$ 25,295$ 28,188$ 2,893$
Reconciliation to GAAP basis - basis differences:
Reserve for encumbrances 5,020
Reserve for advances 567
Reserve for land inventory 44
Receivables 29,184
Non-budgetary payables (1,279)
Unearned revenue (175)
Decrease in fair value of investments 532
Fund balance - GAAP basis 62,081$
Variance
Budgeted Amounts
Actual Amounts
Budgetary Basis
CITY O F TULSA
STATEMENT O F REVENUES, EXPENDITURES, AND CHANGES IN FUND BALANCES- BUDGET AND ACTUAL
(BUDGETARY BASIS)
Year ended June 30, 2016
(amounts expressed in thousands)

11
Sales Tax Revenue History
The City's most significant source of General Governmental Revenues is the sales tax. Sales tax collections in
2016 represented 65% of all such governmental revenues received by the City (exclusive of business-type
activities). The City's sales tax is a 3.1% tax, of which 1.1% is a special tax dedicated to capital improvements.
On November 13, 2013, a new authorization of $563.7 million (Improve Our Tulsa package) in street
improvement projects. The capital improvements sales tax will remain in effect until June 30, 2021, or until
$563.7 million has been funded. On April 5th, 2016, voters approved an authorization of $510.6 million (Tulsa
Vision package) in economic development projects within the City, to be funded by a 0.305% sales tax
beginning January 1, 2017 and continuing until December 30, 2031. Furthermore, as part of this authorization,
voters approved an additional 0.5% increase in sales tax, beginning July 1, 2021 and lasting until June 30, 2025,
which will coincide with the ending of the 1.1% sales tax authorized in the Improve Our Tulsa package.
Sales tax revenues increased from 2007 to 2016 at an average growth rate of 2.128%.
CITY INDEBTEDNESS
The Constitution of Oklahoma provides that without approval of the voters, the City is prohibited from
becoming indebted in any year in an amount exceeding the income and revenue to be received for such year.
General Obligation bonds have been approved by the voters and issued by the City for various municipal
improvements. These bonds are backed by the full faith and credit of the City.
Authorization
Political subdivisions in the State of Oklahoma must have authorization from the voters of such
political subdivision in order to become indebted in any year in an amount in excess of the income and revenue
provided for such year. All existing general obligation indebtedness has been issued under Article X, Sections
26 or 27 of the Oklahoma Constitution.
Article X, Section 26 Political subdivisions issuing bonds under such section may issue obligations in
a total amount such that the total aggregate net indebtedness shall not exceed 10 percent of the net assessed
valuation of the taxable property therein, providing that three-fifths of the voters voting at an election held for
such purpose shall vote to approve the issuance of such obligations.
Article X, Section 27 Cities or towns issuing bonds under such subsection shall use the proceeds for
the purpose of purchasing or constructing public utilities or for repairing the same, to be owned exclusively by
such city or town, or for the purpose of constructing, reconstructing, improving or repairing streets and bridges.
Provided that a majority of the voters of the city or town voting at an election to be held for such purpose shall
vote to approve the issuance of such obligations. There is not a limit on the amount of General Obligation
bonds which may be issued pursuant to Section 27.
$150$160$170$180$190$200$210$220$230
2007 2008 2009 2010 2011 2012 2013 2014 2015 2016
Sales Tax Revenues ($ in MM)

12
General Long-Term Liabilities
Long-term liability activity for year ended June 30, 2016:
General Obligation bonds are recorded in the Government-wide Financial Statements except those
applicable to sewer operations which are recorded as Component Unit debt. Funds used to meet the City's
general obligation debt are derived from two sources: ad valorem taxes and sewer revenues. Ad valorem taxes,
the primary source of funds, amounted to $71,219,000; these taxes were derived from a levy of $22.79 per
$1,000 of assessed property valuation in 2016.
Beginning
Balance Additions Reductions Ending Balance
Due Within
One Year
PRIMARY GOVERNMENT
Governmental activities:
General obligation bonds 452,850$ 80,133$ (67,607)$ 465,376$ 52,053$
Revenue bonds 6,980 - (1,340) 5,640 1,365
Other long-term liabilities 295,571 198,344 (47,143) 446,772 31,848
Premium on debt issuance - GO bonds 15,443 3,858 (3,974) 15,327 -
Premium on debt issuance - Revenue bonds 401 - (133) 268 -
Total governmental activities 771,245 282,335 (120,197) 933,383 85,266
Business-type activities:
Revenue bonds 98,905 - (3,065) 95,840 3,260
Unamortized discount--revenue bonds (119) - 6 (113) -
Unamortized premium--revenue bonds 21 - (1) 20 -
Compensated absences 702 937 (936) 703 504
Other post-employment benefits 1,166 60 - 1,226 -
Pension liability 6,795 22,071 - 28,866 -
Contract obligation 66 - (66) -
Total business-type activities 107,536 23,068 (4,062) 126,542 3,764
Total primary government 878,781$ 305,403$ (124,259)$ 1,059,925$ 89,030$
COMPONENT UNITS
Revenue bonds:
TAIT 176,370 - (9,425) 166,945 7,820
TMUA 141,110 27,450 (9,810) 158,750 10,460
TPA 14,470 - (1,750) 12,720 1,790
Premium on debt issuance - TMUA 2,570 1,173 (415) 3,328 -
Premium on debt issuance - TAIT 7,457 - (439) 7,018 -
Premium on debt issuance - TPA 559 - (93) 466 -
341,923 28,623 (21,885) 348,661 20,070
General obligation bonds 29,610 5,587 (10,633) 24,564 6,627
Premium on debt issuance - TMUA 808 441 (310) 939 -
30,418 6,028 (10,943) 25,503 6,627
Promissory notes 248,547 11,971 (17,851) 242,667 15,436
Unamortized bond discount - TMUA (90) - 13 (77) -
Premium on debt issuance - TMUA 8,488 - (505) 7,983 -
256,945 11,971 (18,343) 250,573 15,436
Capital lease 3,982 - (194) 3,788 200
Watermain extension contracts 3,801 - (437) 3,364 366
Claims and judgments - Airport 860 (143) 717 158
Compensated absences 5,802 3,897 (3,975) 5,724 2,999
Other post-employment benefits 6,669 67 (24) 6,712 -
Pension liability 52,139 143,197 195,336 -
Total component units 702,539$ 193,783$ (55,944)$ 840,378$ 45,856$

13
Subsequent Maturities General Obligation Debt
At June 30, 2016, the City had outstanding General Obligation Bonds of $480,703,000. Principal and
interest requirements for such outstanding debt are as follows:
(amounts expressed in thousands)
Debt Ratios
The following table sets forth information with respect to the approximate ratio of the City's net
general bonded debt to certain financial and economic factors:
Certain General Obligation bonds issued to fund sewer projects are repayable 50% from component
unit revenues and 50% from ad valorem revenues. The portions of these issues, net of any reserves that are
repayable from ad valorem revenues, are included in the amount of net bonded debt per capita.
Year Principal Interest Principal Interest
2017 52,053 15,779 6,627 884
2018 54,420 13,722 4,550 619
2019 51,210 11,596 3,810 436
2020 44,083 9,605 1,807 284
2021 36,082 8,132 1,798 225
2022-2026 109,861 27,938 5,164 517
2027-2031 66,242 14,270 808 49
2032-2036 39,765 5,229 - -
2037-2041 11,660 941 - -
465,376$ 107,212$ 24,564$ 3,014$
General O bligation
Primary Government Component Units
Percentage
of Personal
Year Income
2016 480,703$ 5,908$ -$ 486,611$ 95,747$ 582,358$ 2.79% 1,446$
2015 468,293 7,381 - 475,674 98,807 574,481 2.77% 1,435
2014 447,465 8,856 - 456,321 103,316 559,637 2.81% 1,407
2013 439,032 10,335 - 449,367 107,390 556,757 2.92% 1,429
2012 426,659 11,821 407 438,887 104,324 543,211 2.85% 1,375
2011 407,858 14,255 796 422,909 106,402 529,311 3.03% 1,314
2010 351,105 27,911 1,165 380,181 90,354 470,535 2.98% 1,221
2009 291,245 41,030 1,519 333,794 92,558 426,352 2.78% 1,139
2008 255,817 53,270 1,862 310,949 95,081 406,030 2.35% 1,035
2007 234,224 75,225 2,189 311,638 2,425 314,063 2.01% 803
3. Population and personal income data is also reported on Schedule of Demographics and Economic Statistics.
1. Outstanding debt balances are reported net of related discounts and premiums.
Government
Primary
Total
Capita
PerRevenue
Bonds, Net
Governmental
Activities
Business
Type Activities
Debt
2. Bonded debt reported above agree to their respective categories in Note 11, Long-
Term Liabilities. Bonded debt along with other long-term liabilities are aggregated and
reported as Long-Term Liabilities on the face of the financial statements.
Notes:
Internal Service Funds
Governmental Activities Debt
General
Obligation
Bonds, Net
Revenue
Bonds, Net
Notes
Payable
Total
(amounts expressed in thousands, except per capita)
CITY OF TULSA
RATIOS OF OUTSTANDING DEBT BY TYPE
Current and Past Nine Years

14
Direct and Overlapping Debt
The proportionate share of the net debt of overlapping governments located wholly or partially within
the limits of the City as of June 30, 2016, was $764,876,000. This debt is borne by taxable real and business
personal property owners within the City.
Estimated Estimated
Percentage Share
Net General Applicable to Applicable to
Governmental Unit Bonded Debt City of Tulsa (2)
City of Tulsa
Debt repaid with property taxes:
Independent School Districts of Tulsa County:
No. 1 Tulsa 178,000$ 92.2% 164,111$
No. 3 Broken Arrow 75,574 10.5% 7,922
No. 4 Bixby 32,350 9.8% 3,161
No. 5 Jenks 72,916 73.1% 53,301
No. 9 Union 73,160 76.1% 55,647
No. 11 Owasso 28,755 0.1% 30
284,173
City direct debt 480,703$ 100.0% 480,703
Total direct and overlapping debt 764,876$
Notes: (1) Net general bonded debt
(2)
Source: Tulsa County Assessor's Office
CITY OF TULSA
COMPUTATION OF DIRECT AND OVERLAPPING DEBT
June 30, 2016
(amounts expressed in thousands)
Ratio of assessed valuation of property within the overlapping unit to assessed
valuation of property within the City of Tulsa
OVERLAPPING
General Sinking County County
Year Fund Fund Schools County Library Health Total Total
2016 -$ 22.79$ 93.49$ 10.33$ 5.32$ 2.58$ 111.72$ 134.51$
2015 - 21.46 93.53 10.33 5.32 2.58 111.76 133.22
2014 - 20.24 89.45 10.33 5.32 2.58 107.68 127.92
2013 - 20.16 89.19 10.34 5.32 2.58 107.43 127.59
2012 - 20.01 89.33 10.34 5.32 2.58 107.57 127.58
2011 - 16.98 88.44 10.31 5.32 2.58 106.65 123.63
2010 - 14.15 89.49 10.31 5.32 2.58 107.70 121.85
2009 - 14.08 88.31 10.31 5.32 2.58 106.52 120.60
2008 - 13.48 88.31 10.31 5.32 2.58 106.52 120.00
2007 - 12.67 87.47 10.31 5.32 2.58 105.68 118.35
Source: Tulsa County Assessor
DIRECT
CITY OF TULSA
PROPERTY TAX RATES - DIRECT AND OVERLAPPING GOVERNMENTS
(Per $1,000 of Net Assessed Valuation)
Last Ten Years
(amounts expressed in thousands)

15
Tax Collections
Set forth below is the tax collection record of the City for the past ten years:
Source: City of Tulsa
2016 75,781$ 74,030$ 97.7% 11,352$ 15.0% 2,146$ 76,176$ 100.5%
2015 69,329 66,943 96.6% 11,747 16.9% 1,845 68,788 99.2%
2014 64,050 62,019 96.8% 11,206 17.5% 1,659 63,678 99.4%
2013 63,687 61,641 96.8% 10,834 17.0% 1,546 63,187 99.2%
2012 62,334 60,219 96.6% 10,334 16.6% 1,736 61,955 99.4%
2011 53,163 50,945 95.8% 9,955 18.7% 1,323 52,268 98.3%
2010 43,557 41,887 96.2% 9,060 20.8% 1,079 42,966 98.6%
2009 41,663 40,014 96.0% 8,469 20.3% 877 40,891 98.1%
2008 38,098 36,305 95.3% 7,697 20.2% 1,766 38,071 99.9%
2007 34,420 33,018 95.9% 7,387 21.5% 275 33,293 96.7%
CITY OF TULSA
Current and Past Nine Years
(amounts expressed in thousands)
PROPERTY TAX LEVIES AND COLLECTIONS
Year
Delinquent
Tax
Collections
Total
Collections
Percent of
Total
Collections
to Tax Levy
Delinquent
Percent of
Levy
Current Tax
Collections
Delinquent
Taxes
Receivable
Total Tax
Levy
Percent of
Levy
Collected

16
Property Tax Base
The net assessed valuation of the City's property tax base value increased from $1.56 billion in 1986 to
$3.439 billion in 2016. The net assessed valuation of the City's property tax base increased by 6.47% in 2016
over 2015. Net assessed valuation is comprised of three components: real property, personal property and
public service property. Net changes from 2015 to 2016 are as follows: real property increased 6.53%,
personal property increased 4.13%, and public service property increased 12.37%. Real property and personal
property are valued by the Tulsa County Assessor and public service property is valued by the State of
Oklahoma.
Net Assessed Percentage
Valuation Change From
Year ($ in 000's) Previous Year
2016 $3,439,724 6.47%
2015 $3,230,606 2.09%
2014 3,164,534 0.19%
2013 3,158,480 1.38%
2012 3,115,456 -0.47%
2011 3,130,174 1.67%
2010 3,078,866 4.05%
2009 2,959,096 4.76%
2008 2,824,670 3.93%
2007 2,717,965 4.60%
2006 2,598,320 3.44%
2005 2,511,861 2.05%
2004 2,461,392 0.65%
2003 2,445,574 7.60%
2002 2,259,672 5.67%
2001 2,131,775 6.25%
2000 2,006,377 7.84%
1999 1,860,436 4.01%
1998 1,788,628 3.93%
1997 1,720,961 5.95%
1996 1,624,365 5.27%
1995 1,543,110 0.06%
1994 1,542,157 0.97%
1993 1,527,256 -3.16%
1992 1,577,136 3.53%
1991 1,523,369 -2.42%
1990 1,561,114 2.78%
1989 1,518,861 -3.32%
1988 1,571,098 -2.75%
1987 1,615,599 3.72%
1986 1,557,712 5.13%
Net Assessed Value
Taxable Property Within the City of Tulsa
1986-2016

17
The City has five Tax Increment Finance Districts (TIF) and one Tax Incentive District. The Brady
TIF, formed in 1994, the Tulsa Technology TIF, formed in 1999, the North Peoria TIF, formed in 2002, the
Blue Dome TIF, formed in 2003, and the Tulsa Hills TIF formed in 2006 all have a lifespan of 15 years, with
the exception of the Brady TIF which was extended 10 years in 2008 to the maximum allowable lifespan of 25
years. All are available to receive revenues from Ad Valorem and Sales Tax increments.
In July 2008 the Tulsa Stadium Improvement District (TSID) was created with assessments beginning
July 1, 2009 to create a funding mechanism for the construction of a multi-purpose recreational facility with a
primary purpose as a ballpark, together with its maintenance and other improvements and services. The current
boundary consists of all tracts and parcels of real property lying within the City’s Inner Dispersal Loop (IDL).
District revenue also supports enhancement and redevelopment of downtown property and will increase the
economic benefit derived from the downtown infrastructure and BOK Center investments. The services portion
of the assessment will increase annually based on the Consumer Price Index with a 4% annual cap. Properties
owned by the U.S. government, religious organizations used primarily for religious purposes, and residences
with homestead exemptions are excluded from the assessments.
The Whittier Square Improvement District (WSID) was created to provide enhanced street, alley and
sidewalk cleaning, parking lot maintenance and landscaping maintenance at a service level higher than normal
City standards. The increased services help ensure a more pleasing and convenient business environment for
customers, property owners and businesses in the area. The City provides approximately 50% of the revenue
required to provide these services with a transfer from the General Fund. The City has contracted with a non-
profit corporation, Whittier Square Improvement District, Inc., which was formed by owners of the properties to
collectively manage the daily affairs of the district and oversee the service providers.
Principal Taxpayers
The principal ad valorem taxpayers in the City at June 30, 2016, are shown below. No single employer
within the City represents more than 2.50% of the City's ad valorem tax base.
Rank Taxpayer
Taxable Assessed
Valuation
Percentage of
Assessed
Valuation
1 PUBLIC SERVICE CO OF OKLA $52,008,354 1.51%
2 AHS/VTR HILLCREST/TULSA HOLDINGS $35,844,186 1.04%
3 OKLAHOMA NATURAL GAS CO $24,485,484 0.71%
4 A T & T COMPANIES/SERVICES $24,364,375 0.71%
5 WAL MART STORES $19,461,609 0.57%
6 QUIK TRIP CORP $17,098,102 0.50%
7 WARREN FOUNDATION $15,591,994 0.45%
8 WILLIAMS COMPANIES $15,382,768 0.45%
9 WEIDNER APARTMENT HOMES $15,050,313 0.44%
10 WOODLAND HILLS MALL $14,478,026 0.42%
11 HELMERICH & PAYNE $14,309,742 0.42%
12 LEVEL 3 COMMS LLC $8,736,265 0.25%
13 ST JOHNS HOSPITAL $8,375,031 0.24%
14 COX COMMUNICATIONS $8,104,493 0.24%
15 KANBAR PROP MGMT LLC $7,122,375 0.21%
$280,413,117 8.16%
Source: Tulsa County Assessor
CITY O F TULSA
PRINCIPAL PRO PERTY TAXPAYERS
June 30, 2016

18
Public Trusts and Authorities
The following trusts and authorities are included with the City for financial reporting purposes:
Metropolitan Tulsa Transit Authority—MTTA provides public transportation systems and facilities
that primarily benefit City residents. MTTA cannot incur indebtedness in excess of $100,000 within any year.
As of June 30, 2016, MTTA had no outstanding debt.
Tulsa Airports Fund—The Tulsa International and Richard L. Jones, Jr. Airports have been combined
with the Tulsa Airports Improvements Trust ("TAIT") and are included in the Airports fund. The Tulsa Airport
Authority ("TAA") is responsible for operating the City's airports. The purpose of TAIT is to fund airport
improvements through the issuance of revenue bonds. All improvements are leased by TAIT to TAA and
become the property of the City upon termination of the lease. The City is designated as the sole beneficiary of
the Trust. TAIT has outstanding bonded indebtedness in the amount of $166,945,000, as of June 30, 2016, all of
which are payable from airport facility user fees. TAA and TAIT trustees are appointed by the Mayor and
approved by the City Council.
Tulsa Metropolitan Utility Authority—The City is the sole beneficiary of TMUA which operates and
maintains its water and wastewater utility properties. As of June 30, 2016, the outstanding indebtedness of
TMUA including general obligation debt, revenue bonds and promissory notes, was $426,920,000. TMUA
trustees are appointed by the Mayor and approved by the City Council.
Tulsa Public Facilities Authority—TPFA promotes the acquisition, construction and operation of
various facilities and public improvements in and for the City, which is the sole beneficiary of TPFA. TPFA
issues its revenue bonds for such purposes, and the City enters into various agreements with TPFA including
certain leases of assets from TPFA for amounts equal to debt service on the particular bond issue. The five
trustees of TPFA are the Mayor and four mayoral appointees approved by the City Council. As of June 30,
2016, the outstanding bonded indebtedness of TPFA was $79,305,000.
Tulsa Authority for the Recovery of Energy—TARE was created for the benefit of the City to provide
for the collection, removal, transportation, and disposal of solid waste. TARE trustees are appointed by the
Mayor and approved by the City Council. TARE had no outstanding debt as of June 30, 2016.
Tulsa Parking Authority—TPA was created as a public trust to construct and manage various parking
facilities within the City. The City of Tulsa is its sole beneficiary. The City maintains the accounts of TPA, as
well as its cash and investments. As of June 30, 2016, TPA had an aggregate of $12,720,000 in bonded
indebtedness outstanding. TPA trustees are the Mayor and four mayoral appointees.
Tulsa Development Authority—TDA is a public authority created to finance urban renewal,
rehabilitation, and redevelopment. The City staffs TDA and maintains its accounts. The primary source of
funding for TDA is from City of Tulsa Community Development Block Grant funds. TDA Commissioners are
appointed by the Mayor and approved by the City Council. TDA had no outstanding debt as of June 30, 2016.
Tulsa Performing Arts Center Trust—TPACT is a public trust formed for the purpose of expanding
performing arts in the City. TPACT has a 15-member board appointed by the Mayor and confirmed by the City
Council. TPACT had no outstanding indebtedness at June 30, 2016.
Tulsa Industrial Authority—TIA is a public trust created to provide for the issuance of industrial
development bonds upon approval by the City Council, and to lend the proceeds of such issuance to third party
organizations. The bonds do not constitute debt of the City and are collateralized solely by the revenues of the
borrowing organizations upon whose behalf the bonds are issued. The Mayor of the City is ex-officio trustee and
seven additional trustees are appointed by the Mayor and approved by the City Council.
Tulsa Stadium Trust—TST is a public trust created to acquire, construct, own, operate and maintain a
baseball stadium in downtown Tulsa and related amenities and facilities, and to incur indebtedness. Debt
issuance requires the approval of two-thirds of the Tulsa City Council. The City is sole beneficiary of the TST.
The Mayor of the City is ex-officio trustee and eight additional trustees are appointed by the Mayor and
approved by the City Council. As of June 30, 2016, TST had an aggregate of $22,175,000 in outstanding
indebtedness.
19
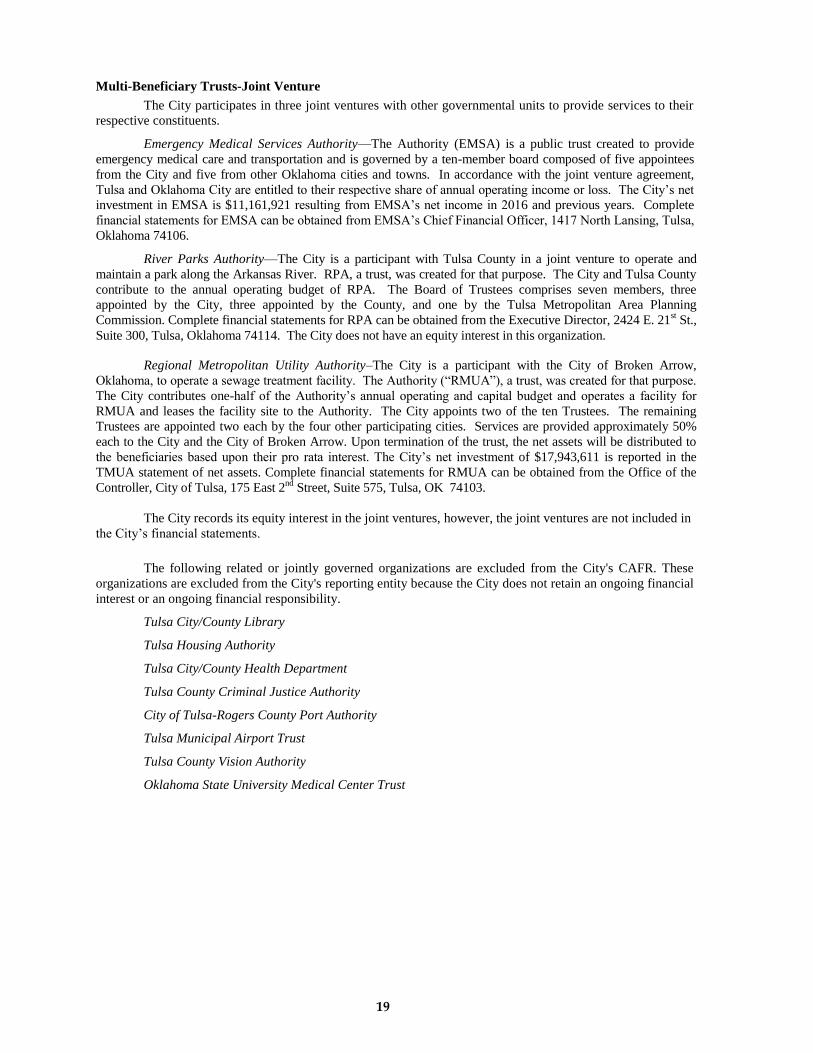
Multi-Beneficiary Trusts-Joint Venture
The City participates in three joint ventures with other governmental units to provide services to their
respective constituents.
Emergency Medical Services Authority—The Authority (EMSA) is a public trust created to provide
emergency medical care and transportation and is governed by a ten-member board composed of five appointees
from the City and five from other Oklahoma cities and towns. In accordance with the joint venture agreement,
Tulsa and Oklahoma City are entitled to their respective share of annual operating income or loss. The City’s net
investment in EMSA is $11,161,921 resulting from EMSA’s net income in 2016 and previous years. Complete
financial statements for EMSA can be obtained from EMSA’s Chief Financial Officer, 1417 North Lansing, Tulsa,
Oklahoma 74106.
River Parks Authority—The City is a participant with Tulsa County in a joint venture to operate and
maintain a park along the Arkansas River. RPA, a trust, was created for that purpose. The City and Tulsa County
contribute to the annual operating budget of RPA. The Board of Trustees comprises seven members, three
appointed by the City, three appointed by the County, and one by the Tulsa Metropolitan Area Planning
Commission. Complete financial statements for RPA can be obtained from the Executive Director, 2424 E. 21st St.,
Suite 300, Tulsa, Oklahoma 74114. The City does not have an equity interest in this organization.
Regional Metropolitan Utility Authority–The City is a participant with the City of Broken Arrow,
Oklahoma, to operate a sewage treatment facility. The Authority (“RMUA”), a trust, was created for that purpose.
The City contributes one-half of the Authority’s annual operating and capital budget and operates a facility for
RMUA and leases the facility site to the Authority. The City appoints two of the ten Trustees. The remaining
Trustees are appointed two each by the four other participating cities. Services are provided approximately 50%
each to the City and the City of Broken Arrow. Upon termination of the trust, the net assets will be distributed to
the beneficiaries based upon their pro rata interest. The City’s net investment of $17,943,611 is reported in the
TMUA statement of net assets. Complete financial statements for RMUA can be obtained from the Office of the
Controller, City of Tulsa, 175 East 2nd
Street, Suite 575, Tulsa, OK 74103.
The City records its equity interest in the joint ventures, however, the joint ventures are not included in
the City’s financial statements.
The following related or jointly governed organizations are excluded from the City's CAFR. These
organizations are excluded from the City's reporting entity because the City does not retain an ongoing financial
interest or an ongoing financial responsibility.
Tulsa City/County Library
Tulsa Housing Authority
Tulsa City/County Health Department
Tulsa County Criminal Justice Authority
City of Tulsa-Rogers County Port Authority
Tulsa Municipal Airport Trust
Tulsa County Vision Authority
Oklahoma State University Medical Center Trust

20
Other Obligations
Long-term installment judgments payable to employees and dependents, which are indeterminable as
to total amount at the time of judgment, are paid as they become due. These judgments totaled $6,722,000 as of
June 30, 2016, and are recorded at their net present value of $5,120,000 in the Employee Insurance Service
Fund.
The City records an estimated liability for workers' compensation claims against the City. Claims
liabilities are based on estimates of the ultimate cost of reported claims (including future claim adjustment
expenses) plus an estimate for claims which have been incurred but not reported based on historical experience.
The estimated liability at June 30, 2016, was $18,542,222.
Retirement Plans—Each qualified employee is included in one of the three retirement plans in which
the City participates. These are the Municipal Employees Retirement Plan, Oklahoma Firefighters Pension and
Retirement System, and Oklahoma Police Pension and Retirement System. The City does not maintain the
accounting records, hold the investments or administer the firefighter or police retirement funds. The police and
firefighter plans are statewide systems administered by the State of Oklahoma. The municipal employees’ plan
is administered by a separate board of trustees and the assets are held in custody by a local bank.
A summary of significant data for each of the retirement plans follows:
Municipal Employees’ Retirement Plan
The City contributes to the Municipal Employees’ Retirement Plan ("Plan") which is a cost sharing
multiple-employer defined benefit pension plan. The Plan was established by the City in accordance with the
City Charter and state statutes, and is a component unit of the City's financial reporting entity, reported as a
Pension Trust Fund.
Non-uniformed, full-time employees of the participating employers are eligible to participate in the
Plan on the first day of the month following the first day of their employment, and become 100% vested after
five years of employment. Employees contribute 6.5% of covered payroll, while the participating employers
contribute the remaining amounts necessary to fund the Plan, using the actuarial basis specified by City
ordinance.
The Net Pension Liability (NPL) is based upon a standardized measure established by the
Governmental Accounting Standards Board in Statement No. 67.
The actuarial assumptions and methods used to determine the NPL are as follows:
Valuation date January 1, 2016
Actuarial cost method Entry Age Normal
Amortization method Level percent, 30 year closed period beginning January 1, 2016
Remaining amortization periods 30 years open
Asset valuation method 5 year smoothed FMV
Investment rate of return 7.50%
Projected salary increases* 4.00-11.75%
*includes inflation at 3.00%
Cost-of-living adjustments None

21
(in thousands) June 30, 2016
Total pension liability $ 629,218
Plan fiduciary net position $ (412,905)
Net pension liability $ 216,313
Plan fiduciary net position as a percentage
of
the total pension liability
65.62%
Covered-employee payroll
$103,629
Plans’ net pension liability as a percentage
of
Covered-employee payroll
208.74%
The net pension liability was allocated to the participating employers as follows:
Percentage NPL
City of Tulsa (Governmental activities) 42.8244% $ 92,635
Business type activities 5.8605% 12,667
Trusts & Authorities reported in City of Tulsa 38.1173% 82,453
Organizations outside City of Tulsa reporting 13.1978% 28,548
100.0000% $ 216,303
Oklahoma Firefighters’ Pension and Retirement System
Uniformed members of the City's Fire Department participate in the Oklahoma Firefighters’ Pension
and Retirement System, a system administered by the State of Oklahoma. In conformity with state law, the plan
does not purport to be an actuarially funded plan; however, benefits are guaranteed by the State of Oklahoma.
The contributions to the plan are established by the State, and the City is required to contribute 14% of covered
payroll. Each firefighter contributes 9% of covered payroll. City contributions to the system of $6,511,000 for
the year ended June 30, 2016 were paid by the General Fund.
2016
15.7228%
$ 166,883
$ 46,505
358.85%
68.30%Plan fiduciary net position as a percentage of the total pension
City’s proportion of the net pension liability
City’s proportionate share of the net pension liability
City’s covered-employee payroll
City’s proportionate share of the net pension liability as a percentage

22
Oklahoma Police Pension and Retirement System
Uniformed members of the City's Police Department participate in the Oklahoma Police Pension and
Retirement System, a system administered by the State of Oklahoma. In conformity with state law, the plan
does not purport to be an actuarially funded plan; however, benefits are guaranteed by the State of Oklahoma.
Contributions to the plan are established by the State, and the City is required to contribute 13% of covered
payroll. Each police officer contributes 8% of covered payroll. City contributions to the system of $7,001,000
for the year ended June 30, 2016 were paid by the General Fund.
For more information relating to the plans see Appendix A - Notes to Basic Financial Statements - Note 9 from
the City of Tulsa Comprehensive Annual Financial Report dated June 30, 2016 attached hereto.
ABSENCE OF MATERIAL LITIGATION
No litigation is pending (a) seeking to restrain or enjoin the issuance or delivery of the Bonds or the
application of the Bond proceeds as contemplated in the Preliminary Official Statement, (b) contesting or
affecting any authority for or the validity of the Bonds, (c) contesting the power of the City to issue the Bonds
or the power of the City to offer and sell them, (d) affecting the power of the City to levy and collect taxes to
pay the Bonds, or (e) contesting the corporate existence or boundaries of the City.
INCONTESTABILITY
Thirty days after the issuance of an opinion of the Attorney General of the State of Oklahoma as ex-
officio Bond Commissioner of the State, the Bonds shall be incontestable for any cause whatsoever.
LEGAL MATTERS
Legal matters incidental to the authorization and issuance of the Bonds are subject to the approval of
Hilborne & Weidman, a professional corporation, Bond Counsel. Certain legal matters will be passed upon by
the Attorney General of the State of Oklahoma. Certain legal matters for the City will be passed upon by the
City Attorney.
TAX EXEMPTION
The Internal Revenue Code of 1986, as amended (the "Code"), establishes certain requirements that
must be met subsequent to the issuance and delivery of the Bonds in order that interest on the Bonds be and
remain excludable from gross income for federal income tax purposes under Section 103 of the Code. The
Arbitrage and Use of Proceeds Certificate of the City, which will be delivered concurrently with the delivery of
the Bonds, will contain provisions and procedures relating to compliance with the requirements of the Code.
The City, in executing its Arbitrage and Use of Proceeds Certificate, will certify to the effect that it will comply
with the provisions and procedures set forth therein and that it will do and perform all acts and things necessary
or desirable to assure that interest paid on the Bonds is excludable from gross income under Section 103 of the
Code. Noncompliance by the City with such provisions and procedures may require inclusion in gross income
of interest on the Bonds retroactive to the date of issuance of the Bonds, regardless of when such
noncompliance occurs.
Prospective purchasers of the Bonds should be aware that (a) Section 265 of the Code denies a
deduction for interest on indebtedness incurred or continued to purchase or carry the Bonds or, in the case
2016
17.8728%
$ 728
$ 53,854
1.35%
99.80%
City’s proportionate share of the net pension liability (asset)
City’s covered-employee payroll
City’s proportionate share of the net pension liability (asset)
Plan fiduciary net position as a percentage of the total
City’s proportion of the net pension liability (asset)

23
of a financial institution, that portion of a holder's interest expense allocated to interest on the Bonds (other than
"qualified obligations"), and that the Bonds are not qualified obligations for this purpose, (b) with respect to
insurance companies subject to the tax imposed by Section 831 of the Code, Section 832 (b)(5)(B)(i) reduces
the deduction for loss reserves by 15 percent of the sum of certain items, including interest on the Bonds, (c)
interest on the Bonds earned by some corporations could be subject to the environmental tax imposed by
Section 59A of the Code, (d) interest on the Bonds earned by certain foreign corporations doing business in the
United States could be subject to a branch profits tax imposed by Section 884 of the Code, (e) passive
investment income including interest on the Bonds may be subject to federal income taxation under Section
1375 of the Code for Subchapter S corporations that have Subchapter C earnings and profits at the close of the
taxable year if greater than 25 percent of the gross receipts of such Subchapter S corporation is passive
investment income and (f) Section 86 of the Code requires recipients of certain Social Security and certain
Railroad Retirement benefits to take into account in determining gross income, receipts or accruals of interest
on the Bonds.
Assuming that the City complies with the provisions and procedures set forth in the Arbitrage and Use
of Proceeds Certificate, in the opinion of Hilborne & Weidman, Bond Counsel, a form of which is attached
hereto as Appendix D, under existing statutes and court decisions, interest on the Bonds is excludable from the
gross income of the recipients thereof pursuant to Section 103 of the Code for federal income tax purposes, and
interest on the Bonds is not treated as a preference item in calculating alternative minimum taxable income of
individuals or corporations. The interest on the Bonds are exempt for State of Oklahoma income taxation
purposes.
INDEPENDENT AUDITORS
The basic financial statements of the City as of June 30, 2016 and for the year then ended, included in
Appendix A of this Official Statement, have been audited by RSM US LLP, independent auditors, as stated in
their report included in Appendix A.
CREDIT RATINGS
The Bonds have been rated Aa1 by Moody's Investors Service ("Moody's") and AA by Standard &
Poor's Corporation ("Standard & Poor's"). The ratings assigned by Moody's and Standard & Poor's express
only the view of each respective rating agency. The explanation of the significance of each rating may be
obtained from Moody's and Standard & Poor's, respectively. There is no assurance that any rating will continue
for any period of time or that it will not be revised or withdrawn. Any revision or withdrawal of rating may have
an effect on the market price of the Bonds.
CERTIFICATE WITH RESPECT TO PRELIMINARY OFFICIAL
STATEMENT
At the time of original delivery of and payment for the Bonds, the City will deliver a certificate of the
Director of Finance addressed to the Purchaser to the effect that each has examined this Preliminary Official
Statement (including the Appendices) and the financial and other data concerning the City contained herein and
that, to the best of their knowledge and belief: (a) this Preliminary Official Statement, both as of its date and as
of the date of delivery of the Bonds, does not contain any untrue statement of material fact or omit to state a
material fact necessary to make the statements herein, in the light of the circumstances under which they were
made, not misleading and (b) between the date of this Preliminary Official Statement and the date of delivery of
the Bonds there has been no material change in the affairs (financial or other), financial condition or results of
operations of the City except as set forth in or contemplated by this Preliminary Official Statement.
CONTINUING DISCLOSURE AND OTHER AGREEMENTS OF THE ISSUER
The City has covenanted for the benefit of the Bondholders to provide certain financial information
and operating data relating to the City by not later than December 31 in each year commencing December 31,
2017 (the "Annual Report"), and to provide notices of the occurrence of certain enumerated events, if deemed
by the City to be material. The Annual Report and the notices of material events will be filed by the City with
the Municipal Securities Rulemaking Board. The specific nature of the information to be contained in the
Annual Report or the notices of material events is summarized below under the caption "Appendix E – Form of
Continuing Disclosure Certificate." The City has covenanted to provide the final Official Statement to the
purchaser within seven business days after final agreement to purchase, offer, or sell the Bonds in an offering
and in sufficient time to accompany any confirmation that request payment from any customer. The City has
not defaulted or failed to comply with any material continuing disclosure obligations or events on any

24
previous undertakings within the last five years. These covenants have been made in order to assist the
Underwriters in complying with S.E.C. Rule 15c2-12.
DEEMED FINAL
THE CITY HAS CERTIFIED THAT THIS PRELIMINARY OFFICIAL STATEMENT WAS
DEEMED FINAL AS OF ITS DATE FOR PURPOSES OF RULE 15c2-12(b), EXCEPT FOR THE
INFORMATION NOT REQUIRIED TO BE INCLUDED THEREIN UNDER RULE 15c2-12(b).
Concurrently with the delivery of the Bonds, the City will furnish a certificate executed on behalf of the City by
the undersigned to the effect that this Preliminary Official Statement, as of the date of the Preliminary Official
Statement and as of the date of delivery of the Bonds, does not contain any untrue statement of a material fact or
omit to state any material fact necessary to make to the statements herein, in light of the circumstances under
which they were made, not misleading.
MISCELLANEOUS
All quotations from and summaries and explanation of law herein do not purport to be complete and
reference is made to said laws for full and complete statements of their provisions.
This Preliminary Official Statement is not to be construed as a contract or agreement between the City
and the purchasers or holder of any of the Bonds. Any statements made in this Preliminary Official Statement
involving matters of opinion are intended merely as opinion and not as representation of fact. The information
and expressions of opinion herein are subject to change without notice and neither the delivery of this
Preliminary Official Statement nor any sale made thereunder shall, under any circumstances, create any
implication that there has been no change in the affairs of the City, or its agencies and authorities, since the date
hereof.
/s/ G.T. BYNUM
Mayor, City of Tulsa, Oklahoma

Appendix A
Basic Financial Statements of The City of Tulsa for The Year Ended June 30, 2016

CITY OF TULSA COMPREHENSIVE ANNUAL FINANCIAL REPORT
Year ended June 30, 2016
TABLE OF CONTENTS
PageINTRODUCTORY SECTION
Letter of Transmittal i List of Principal Officials vii
Organizational Chart viii Certificate of Achievement ix FINANCIAL SECTION
Independent Auditor’s Report A-1
Management’s Discussion and Analysis MDA-1
Basic Financial Statements
Government-wide Financial Statements: Statement of Net Position 1 Statement of Activities 2 Fund Financial Statements: Governmental Funds: Balance Sheet 3 Statement of Revenues, Expenditures and Changes in Fund Balances 4 Reconciliation of the Statement of Revenues, Expenditures and Changes in 5 Fund Balances of Governmental Funds to the Statement of Activities
Proprietary Funds: Statement of Net Position 6 Statement of Revenues, Expenses and Changes in Net Position 7 Statement of Cash Flows 8 Fiduciary Funds: Statement of Fiduciary Net Position 9 Statement of Changes in Fiduciary Net Position 10 Discretely Presented Component Units: Statement of Net Position 11 Statement of Activities 12 Notes to Basic Financial Statements FN-1
Required Supplementary Information Defined Benefit Pension Trusts: Schedule of Changes in the Net Pension Liability – MERP RSI-1 Schedule of City’s Proportionate Share - MERP RSI-2 Schedule of City’s Contributions – MERP RSI-3 Schedule of Investment Returns - MERP RSI-4 Schedule of Actuarial Valuation, Methods and Assumptions – MERP RSI-4 Schedule of City’s Proportionate Share - Oklahoma Firefighters RSI-5 Schedule of City’s Contributions - Oklahoma Firefighters RSI-6 Schedule of City’s Proportionate Share - OPPRS RSI-7 Schedule of City’s Contributions - OPPRS RSI-8 Other Post-Employment Benefits: Schedule of Funding Progress RSI-9

CITY OF TULSA COMPREHENSIVE ANNUAL FINANCIAL REPORT
Year ended June 30, 2016
TABLE OF CONTENTS
PageFINANCIAL SECTION (continued)
General Fund Schedule of Revenues, Expenditures and Changes in Fund Balances – RSI-10 Budget and Actual, Budgetary Basis and related notes
Supplemental Combining and Individual Fund Financial Statements and Schedules
Governmental Funds Subsection: Nonmajor Governmental Funds: Combining Balance Sheet C-1 Combining Statement of Revenues, Expenditures and Changes in Fund Balances C-2 Budget and Actual Schedules - Budgetary Basis: General Fund:
Schedule of Revenues – Budgetary Level of Control C-3 Schedule of Expenditures and Encumbrances – Budgetary Level of Control C-5
E-911 Operating Fund C-10 Economic Development Fund C-11 Tulsa Stadium Improvement District Fund C-12 Medical Services Program C-13 Internal Service Funds: Combining Statement of Net Position C-14 Combining Statement of Revenues, Expenses and Changes in Net Position C-15 Combining Statement of Cash Flows C-16 Fiduciary Funds: Agency Funds Combining Statement of Changes in Assets and Liabilities C-17 Component Units: Discretely Presented Nonmajor Component Units: Statement of Net Position C-18 Statement of Revenues, Expenses and Changes in Net Position C-19 Combining Fund Financial Statements of Tulsa Metropolitan Utility Authority: Statement of Net Position C-20 Statement of Revenues, Expenses and Changes in Net Position C-21 Statement of Revenues Expenses and Changes in Net Position C-22 Capital Assets Used in the Operation of Governmental Funds: Comparative Schedules by Source C-23 Schedule of Changes by Function and Activity C-24 Schedule by Function and Activity C-25
STATISTICAL SECTION (Unaudited) Financial Trend Information: Net Position by Component S-1 Changes in Net Position S-2 Governmental Activities - Tax Revenues by Source S-3 Program Revenue by Function / Program S-4 Fund Balances of Governmental Funds S-5 Changes in Fund Balances of Governmental Funds S-6
CITY OF TULSA COMPREHENSIVE ANNUAL FINANCIAL REPORT
Year ended June 30, 2016
TABLE OF CONTENTS
PageSTATISTICAL SECTION (Unaudited - continued) Revenue Capacity Information: General Governmental Tax Revenues by Source S-7 Principal Sales Tax Remitters S-8 Direct and Overlapping Sales Tax Rates S-9 Assessed and Estimated Actual Value of Taxable Property S-10 Property Tax Rates - Direct and Overlapping Governments S-11 Property Tax Levies and Collections S-12
Debt Capacity Information: Ratios of Outstanding Debt by Type S-13 Ratios of Net General Bonded Debt to Assessed Values and Net Bonded Debt per Capita S-14 Computation of Direct and Overlapping Debt S-15 Computation of Legal Debt Margin S-16 Pledged Revenue Bond Coverage- One Technology Center – Lease Revenue Bonds S-17 Pledged Revenue Bond Coverage- Arena and Convention – 2008 Capital Improvement S-18 Pledged Revenue Bond Coverage- Tulsa Stadium Trust – Improvement District Bonds S-19 Pledged Revenue Bond Coverage- TPFA – 2012 Capital Improvement Bonds S-20 Demographic and Economic Information: Demographic and Economic Statistics S-21 Principal Employers S-22 Operating Information: Number of City Employees S-23 Operating Indicators by Function / Program S-24 Tulsa Metropolitan Utility Authority – Water and Sewer Rates S-28 Appendix of Abbreviations S-29


DEPARTMENT OF FINANCEOFFICE OF THE DIRECTOR OF FINANCE
OFFICE OF THE CONTROLLER175 E. Second Street, Suite 575
Tulsa, Oklahoma 74103
i
December 7, 2016
Honorable Mayor, City Auditor, City Council and Citizens of the City of Tulsa: City of Tulsa, Oklahoma
We are pleased to submit to you the Comprehensive Annual Financial Report (CAFR) of the City of Tulsa, Oklahoma (the City) for the year ended June 30, 2016. The CAFR is provided to give detailed information about the financial position and activities of the City. City management is responsible for both the accuracy of the presented data and the completeness and fairness of presentations, including all disclosures. We believe the data, as presented, is accurate in all material respects and are presented in a manner which fairly sets forth the financial position and results of operations of the City. The CAFR has been prepared in accordance with accounting principles generally accepted in the United States (U.S. GAAP) as promulgated by the Governmental Accounting Standards Board (GASB), the standard-setting body for governmental accounting and financial reporting and based upon a comprehensive framework of internal control which are established for this purpose. The objective of a system of internal controls is to provide reasonable, rather than absolute, assurance that the financial statements are free of any material misstatements. Under Oklahoma state law, municipalities are to publish a complete set of audited financial statements. This report fulfills that requirement for the year ended June 30, 2016. To the best of our knowledge and belief, the enclosed report is accurate in all material respects and is organized in a manner designed to fairly present the financial position and results of operations of the City as measured by the financial activity of its various funds. The accompanying disclosures are necessary to enable the reader to gain the full understanding of the City’s financial affairs. Independent Auditor’s Report
The basic financial statements and related notes have been audited by RSM US LLP, an independent firm of Certified Public Accountants. RSM US LLP concluded that there was a reasonable basis to render an unmodified opinion on the financial statements of each opinion unit that collectively comprise the City’s basic financial statements, concluding that the basic financial statements are fairly presented in conformity with U.S. GAAP. The independent auditor’s report can be found on page A-1 of the Financial Section of this CAFR. Grant awards were audited under the provisions of Title 2 U.S. Code of Federal Regulations (CFR) Part 200, Uniform Administrative Requirements, Cost Principles, and Audit Requirements for Federal Awards (Uniform Guidance), and the Compliance report was issued separately.
Management’s Discussion and Analysis (MD&A)
Management’s discussion and analysis immediately follows the independent auditor’s report and provides a narrative introduction, overview, and analysis of the basic financial statements. MD&A complements this letter of transmittal and should be read in conjunction with it.

ii
PROFILE OF THE CITY OF TULSA The City encompasses an area of approximately 201.5 square miles located in northeastern Oklahoma, at the edge of the foothills of the Ozarks, along the Arkansas River. The northeastern part of Oklahoma is often called “Green Country” due to its wooded terrain in the rolling Ozark foothills. With an elevation of 700 feet above sea level and its temperate climate, the City experiences continually changing weather conditions during all four seasons of the year. The average daily temperature is 61 degrees and the average annual rainfall is 39 inches. Incorporated on January 8, 1898 and following the discovery in 1901 of oil in the nearby town of Red Fork, Tulsa grew quickly, reaching a population of 7,298 by statehood in 1907. Tulsa’s current population is 403,085 people, representing a 0.11% increase over 2015. Tulsa, the hub and seat of Tulsa County, is the second largest city in Oklahoma, providing commerce, industrial, transportation and financial services for a metropolitan area of 982,521 people. Under a Mayor-Council form of government, the Mayor, serving as the chief executive of the City, is responsible for City operations. The City Council, the legislative branch of the government, consists of nine members, each representing a distinct geographic district. The City Auditor is responsible for the City’s Internal Audit Department. The Mayor and City Auditor are elected at large. Services The City provides a full range of basic municipal services, including police and fire protection, street construction, parks, neighborhood revitalization and land use regulation, and other infrastructure, recreational activities, and cultural events. The following services are provided through an array of legally separate entities incorporated into this report as component units: Service Entity
Water and sewer systems Tulsa Metropolitan Utility Authority Refuse collection and disposal Tulsa Authority for Recovery of Energy Airport Tulsa Airports Improvement Trust Parking Tulsa Parking Authority Urban redevelopment Tulsa Development Authority Public transportation Metropolitan Tulsa Transit Authority Performing Arts Tulsa Performing Arts Center Trust Economic development Tulsa Industrial Authority Commercial leasing Tulsa Public Facilities Authority Arena and convention Tulsa Public Facilities Authority Sporting events venue Tulsa Stadium Trust Budgetary Process and Controls The Mayor prepares the annual proposed budget and presents it on or before April 30th to the City Council. The Council reviews, refines, changes, and adopts it according to the policies and priorities it wishes to see implemented. Governmental funds with legally adopted annually budgets are the General Fund and the Sales Tax Fund (a capital projects fund).

iii
The City maintains a system of budgetary controls with the objective of maintaining compliance with the City Charter and the Oklahoma Municipal Budget Act. The legal level of budgetary control is the level at which expenditures cannot exceed appropriations. The level of control is by department and category of expenditure within a fund and also by project for capital funds. Expenditures categories are personal services, materials and supplies, other services, debt service, and capital outlay. Expenditures are cash outlays plus encumbrances and encumbrances outstanding at year-end are carried forward to be included in appropriations for the following year.
The Local Economy and Factors Affecting Economic Conditions
The Tulsa Metropolitan Statistical Area (TMSA) comprises 25.1% of the state’s population and 30.3% of the state’s economy ($48.8 billion in 2010 constant dollars).
Tulsa has a diverse economy including aerospace manufacturing and aviation, health care, energy, machinery and electrical equipment manufacturing and transportation, and distribution and logistics. The Tulsa Metropolitan Chamber of Commerce reported that several of these sectors have large concentrations of employment in the TMSA relative to the rest of the United States. As concentrations go:
Aerospace parts manufacturing is 2.4 times more, Oil and gas production and machinery manufacturing is 8.4 times more, Pump and compressor manufacturing is 20.5 times more, Fabricated metal product manufacturing is 2.5 times more, Heat-exchanger manufacturing sub-cluster being 43.2 times more than at the U.S. level.
Many of these sectors are positioned to grow within the metro area as the cost of doing business and cost of living are 14% and 9% below the national average respectively. Tulsa has one of the shortest average commute times in the nation. Tulsa is home to some of the nation’s larger companies including QuikTrip, ONEOK, and The Williams Companies. Tulsa received several national recognitions in 2015. The Brookings Institute recognized Tulsa as the top performer among US metros for Growth and Inclusion (economic growth as an outcome of regional planning). Site Selection Group, and Independent Location Advisory firm, recognized Tulsa for producing more manufacturing graduates than any other US city in 2015; as well as reported Tulsa to be the 3rd best US city for new and expanded facilities among Tier II cities. Finally, the New York Times recently featured Tulsa on their global list of ‘Top 50 Places to See’ in 2015. The Bureau of Labor Statistics reported the unemployment rate for the City at June 30, 2016 decreased from 5.3% in the previous year to 4.5%. The state and national unemployment rates for this same time period increased from 4.4% to 5.0%. Bond Ratings In their report dated February 2016, Moody’s Investors Service assigned and affirmed the City of Tulsa an Aa1 rating. Standard and Poor’s assigned and affirmed an AA rating to the City’s general obligation bonds in their report dated February 2016. Long-term Financial Planning The City of Tulsa utilizes these primary planning tools to assist policy makers in addressing near and long term operating and infrastructure challenges: A Five-Year Financial Forecast and the Capital Improvements Plan (CIP).

iv
-The Annual Five-Year Financial Forecast is prepared to provide policy makers with the most current information needed to make judgments about the major financial policy issues facing the City of Tulsa. It is not a detailed line-item spending plan, service delivery plan, or budget for the next five years, but an examination of how issues will affect Tulsa's financial condition. It has been designed to meet the following objectives:
1. Provide the Mayor and City Council with information about potential financial changes; 2. Provide an updated financial base by which different financing options can be judged; and 3. Provide elected officials information about the long-term impacts of current and anticipated
financial policies.
As with any multi-year analysis, it is based on assumptions about the future. Of particular importance to a study of this type is the performance of the national and local economies, since tax revenues and demands for services are directly related to private sector economic activity.
- In 1977, Tulsa's governing body adopted a Capital Improvement Plan (CIP) process which outlined a program to build, in an orderly manner, a large backlog of capital projects. Since then, the City has annually updated the five-year CIP schedule. Building on this tradition, the City updated the CIP development process in 2010. The new policy requires departmental justification of expansion projects based on the projects potential return on investment (ROI), its potential leverage and linkages to other projects, and its contribution to the City’s strategic initiatives. Additionally, all replacement and rehabilitation projects have been ranked and placed in tiers based on their contribution to public safety, asset preservation, and core service provision. Virtually all of the financing has been provided by four sources: General Obligation (GO) bonds, dedicated sales tax, user fees (pay as you go and a source to repay revenue bonds), and state and federal financial assistance. Local voters have continually validated this approach as 75% of all GO bond and sales tax proposals have been approved since the elected officials adopted the formal Capital Improvements Planning process. Financial Policies
The City follows a comprehensive set of Financial Policies to ensure the City’s financial resources are managed prudently. Policies are shaped by state law and approved by the City Council through the budget adoption process. These financial policies govern the City’s budgeting and financial planning, capital planning, revenue, investment, debt management, and procurement. Descriptions of these policies are available in the City’s annual budget publication which may be obtained from the City’s website, www.cityoftulsa.org.
Such policies, as shaped by state law and Government Finance Officers Association of the United States and Canada (GFOA) Best Practices, advise that total resources will be sufficient to support current operating expenses. Additionally, the City has established and shall maintain an operating reserve in the General Fund to provide for revenue shortfalls or to meet unexpected increases in service delivery costs. The reserve is set annually and was set at 6.39% of the General Fund appropriated expenditures for 2016.
The City created an Economic Stabilization Reserve in 2012. In an emergency situation, upon meeting certain triggers, the City may draw on this pool of reserves in the event of declining revenues. The balance of the reserve was $2 million in 2016.
Major Initiatives (with a Significant Impact on Revenue or Expenditure Trends) The City initiated or completed several projects which provide enhancements for the general public, as well as the potential to create significant impact on revenue and expenditure trends in the future.

v
In April 2016, Tulsa voters approved three separate ballot proposals related to Public Safety, Streets and Transit, and Economic Development. The three initiatives repurposed an expiring economic development tax of 0.6% (Vision 2025), which had previously been levied by Tulsa County.
As part of this vote, citizens approved a limited-purpose, permanent sales tax for the purpose of providing expanded revenue support for the public safety functions. With this funding, the City will be capable of employing 160 additional police officers, 65 additional firefighters, and 16 additional E-911 employees. This initiative will increase the effectiveness of the City’s Public Safety service.
Tulsa voters approved a limited-purpose, permanent sales tax for the
purpose of providing expanded revenue support of street maintenance, traffic and public transportation functions. This funding will allow for the expansion of 24 street maintenance personnel, as well as necessary materials to perform street repairs. Additionally, this levy will fund various transit related infrastructure projects such as Rapid Bus Transit services along Peoria, renovating the Boston Bridge.
Voters approved a limited-purpose, temporary sales tax for the
purpose of providing revenue for the support of economic development projects. Major focal points of the initiative are the Arkansas River, Gilcrease Museum, Cox Business Center, Tulsa Zoo, and a number of other community driven economic development projects. Improvements to the Arkansas River call for two low water dams which will form a major component of the vision for future development.
Awards
The GFOA awarded a Certificate of Achievement for Excellence in Financial Reporting to the City of Tulsa for its comprehensive annual financial report for the year ended June 30, 2015. This was the 34th consecutive year that the City of Tulsa has achieved this prestigious award. In order to be awarded a Certificate of Achievement, a government must publish an easily readable and efficiently organized comprehensive annual financial report. This report must satisfy both generally accepted accounting principles and applicable legal requirements. A Certificate of Achievement is valid for a period of one year only. We believe that our current comprehensive annual financial report continues to meet the Certificate of Achievement Program’s requirements and we are submitting it to the GFOA to determine its eligibility for another certificate. The City also received the GFOA’s Distinguished Budget Presentation Award for its 2016 annual budget document dated June 18, 2015. This was the 21st consecutive year for the City of Tulsa. To qualify for the Distinguished Budget Presentation Award, the City’s budget document had to be judged proficient as a policy document, a financial plan, an operations guide, and a communications device. Acknowledgements The preparation of this report could not have been accomplished without the dedicated services of the entire staff of the Finance Department Accounting Division. Other departments and offices of the City contributed directly or indirectly to the preparation of this report; the Budget Division and the Treasury Division as well as other staff and departments throughout the City. We express our appreciation to all who assisted in this effort.


vii
CITY OF TULSA, LIST OF PRINCIPAL OFFICIALS
As of June 30, 2016
MAYOR
Dewey F. Bartlett, Jr.
CITY COUNCIL MEMBERS
Jack R. Henderson .............................................................................................................................. District 1Jeannie Cue........................................................................................................................................... District 2David Patrick......................................................................................................................................... District 3Blake Ewing ........................................................................................................................................... District 4Karen Gilbert ........................................................................................................................................ District 5Connie Dodson.................................................................................................................................... District 6Anna America ....................................................................................................................................... District 7Phil Lakin, Jr. ......................................................................................................................................... District 8G.T. Bynum, Mayor-Elect ................................................................................................................. District 9
CHIEF OF STAFF Jarred Brejcha
DIRECTOR OF FINANCE Michael P. Kier, CPFO
CITY AUDITOR Cathy Criswell

Inte
rnal
Aud
it
May
or
Adm
inist
rativ
e an
d Su
ppor
t Ser
vice
s
City
Cou
ncil
Publ
ic S
afet
y Co
mm
unic
atio
ns 9
11
Fina
nce
Info
rmat
ion
Tech
nolo
gy
Hum
an R
esou
rces
Hum
an R
ight
s
Asse
t Man
agem
ent
Lega
l
Cultu
ral D
evel
opm
ent
and
Recr
eatio
n
Park
& R
ecre
atio
n
Perf
orm
ing
Arts
Cen
ter
Publ
ic S
afet
y &
Pr
otec
tion
Fire
Cust
omer
Car
e Ce
nter
Mun
icip
al C
ourt
s
Polic
e
Publ
ic W
orks
and
Tr
ansp
orta
tion
Engi
neer
ing
Serv
ices
MTT
A Au
thor
ity
Stre
ets a
nd P
ublic
Fa
cilit
ies
Soci
al a
nd E
cono
mic
De
velo
pmen
t
Wor
king
In
Nei
ghbo
rhoo
ds
Econ
omic
De
velo
pmen
t Co
mm
issio
n
v 3
as o
f 11/
12/2
013
Com
mun
icat
ions
BOK
& C
onve
ntio
n Ce
nter
s Pl
anni
ng a
nd
Econ
omic
De
velo
pmen
t
May
or�s
Offi
ceCh
ief o
f Sta
ff
O R
G A
N I
Z A
T I O
N C
H A
R T
Dire
ctor
of
Com
mun
icat
ions
City
Aud
itor
Citiz
ens
City
Man
ager
Wat
er &
Sew
er
viii

ix


Management’s Responsibility for the Financial Statements
Auditor’s Responsibility

Opinions
Other Matters
Required Supplementary Information
Other Information


CITY OF TULSAMANAGEMENT’S DISCUSSION AND ANALYSIS June 30, 2016
MDA - 1
As management of the City of Tulsa, Oklahoma (the City), we offer readers of the City’s financial statements this narrative overview and analysis of the financial activities of the City for the fiscal year ended June 30, 2016. We encourage readers to consider the information presented here in conjunction with our letter of transmittal in the Introductory Section of this report and the City’s financial statements, which follow this management’s discussion and analysis. All amounts, unless otherwise indicated, are expressed in thousands of dollars and references to a year, such as 2016, contain an implied reference to the fiscal year, such as “fiscal year 2016.” Financial Highlights
The assets and deferred outflows of resources of the City exceeded its liabilities and deferred inflows of resources at year end by $1,908,557 . Included as a component of net position is unrestricted net position with a deficit of $170,157. This deficit results primarily from the net pension liability. The City’s total net position increased $74,554. Expenses increased $49,039 compared to last year while experiencing of an overall increase of $31,302 in revenues from the prior year.
At the close of the current year, the City’s governmental funds reported combined fund balances of $525,223, an increase of $15,175 in comparison with the prior year. Approximately 10% of this amount ($53,942) is available for spending at the government’s discretion .
Unrestricted fund balance (the total of the and components of
) for the general fund was $54,252, or approximately 19% of total general fund expenditures.
The City’s long-term liabilities increased by $46,660 during the current year due to the issuance of general obligation debt of $80,133 for capital improvements offset by debt service payments of $70,672 and a net increase in the pension liability of $41,388.
Overview of the Financial Statements This discussion and analysis is intended to serve as an introduction to the City’s basic financial statements, comprising the following three components:
1. Government-wide financial statements 2. Fund financial statements 3. Notes to the financial statements
CITY OF TULSAMANAGEMENT’S DISCUSSION AND ANALYSIS June 30, 2016
MDA - 2
Government-Wide Financial Statements
are designed to provide readers with a broad overview of the City’s finances, similar to private-sector business. The presents information on all of the City’s assets and deferred outflows of resources and liabilities and deferred inflows of resources, with the difference being reported as . Over time, increases or decreases in net position can serve as a useful indicator of whether the financial position of the City is improving or deteriorating. The presents information showing how the government’s net position changed during the year. All changes in net position are reported as soon as the underlying event giving rise to the change occurs, regardless of the timing of the cash flows. Thus, revenues and expenses reported in this statement for some items will only result in cash flows in future fiscal periods (for example, uncollected taxes and earned but unused vacation leave). The government-wide financial statements of the City are divided into three categories:
Most of the City’s basic governmental services are included here, such
as public safety and protection, social and economic, public works and transportation, culture and recreation, and administrative and support functions. Sales, use, and property taxes, charges for services, and state and federal grants finance most of these activities.
- The City charges fees to customers to help it cover the costs of certain
services it provides. BOK Center and Cox Business Center, One Technology Center, Golf Courses, Tulsa Stadium Trust and Stormwater Management operations are included here.
- The City includes eight other entities in its report— Tulsa Metropolitan Utility Authority, Tulsa Authority for Recovery of Energy, Tulsa Airports, and the Other Component Units comprising of the Tulsa Development Authority, Metropolitan Tulsa Transit Authority, Tulsa Industrial Authority, Tulsa Parking Authority, and the Tulsa Performing Arts Center Trust. Although legally separate, these “component units” are important because the City is financially accountable for them.
Fund Financial Statements A is a grouping of related accounts that is used to maintain control over resources that have been segregated for specific activities or objectives. The City uses fund accounting to ensure and demonstrate compliance with finance-related legal requirements, state law and bond covenants. The fund financial statements provide the reader with information about the City’s most significant funds - not the City as a whole.

CITY OF TULSAMANAGEMENT’S DISCUSSION AND ANALYSIS June 30, 2016
MDA - 3
Fund Financial Statements, continued The funds of the City are divided into three categories:
– Most of the City’s basic services are included in governmental funds, which focus on (1) how cash and other financial assets that can readily be converted to cash flow in and out and (2) the balances left at year-end that are available for spending. Consequently, the governmental funds statements provide a detailed short-term view that helps one determine whether there are more or fewer financial resources that can be spent in the near future to finance the City’s programs. Because this information does not encompass the additional long-term focus of the government-wide statements, we provide additional information at the bottom of the governmental funds statement that explains the relationships (or differences) between them.
– Services for which the City charges customers a fee are generally reported in
proprietary funds. Proprietary funds, like the government-wide statements, provide both long and short-term financial information.
(one type of proprietary fund) are used to report the same functions presented as business type activities in the government-wide financial statements, but with additional detailed information, such as cash flows.
(the other type of proprietary fund) are used to report activities that
provide supplies and services for the City’s other programs and activities.
The City is the trustee, or fiduciary, for its employees’ and other participating entities’ pension plan. Fiduciary activities are reported in a statement of fiduciary net position and a statement of changes in fiduciary net position. We exclude these activities from the City’s government-wide financial statements because the City cannot use these assets to finance its operations.
Notes to the Financial Statements
The notes to the financial statements provide additional information that is essential to a full understanding of the data provided in the government-wide and fund financial statements. The notes to the financial statements begin on page FN-1.

CITY OF TULSAMANAGEMENT’S DISCUSSION AND ANALYSIS June 30, 2016
MDA - 4
Other Information
- In addition to the basic financial statements and accompanying notes, this report presents ten schedules of following the notes.
Municipal Employees’ Retirement Plan (MERP) - Schedule of Changes in Net Pension Liability Schedule of City’s Proportionate Share Schedule of City’s Contributions Schedule of Investment Returns Schedule of Actuarial Valuation, Methods and Assumptions
Oklahoma Firefighters Pension and Retirement System-
Schedule of City’s Proportionate Share Schedule of City’s Contributions
Oklahoma Police Pension and Retirement System-
Schedule of City’s proportionate Share Schedule of City’s Contributions
General Fund – Schedule of Revenues, Expenditures, and Changes in Fund Balances - Budget and Actual (Budgetary Basis)
- Combining and Individual Fund
Financial Statements, which include nonmajor governmental funds, internal service funds, fiduciary funds, and nonmajor discretely presented component units are presented immediately following the RSI. This section also includes budget to actual schedules for certain special revenue funds and additional General Fund budgetary schedules. Government-Wide Financial Analysis
As of June 30, 2016, the City’s net position was $1,909 million. Total assets and deferred outflows increased $84 million or 3% while liabilities and deferred inflows of resources increased $9 million or 1%. The net position of Governmental activities increased 6% to $1,365 million in 2016 from $1,285 million in 2015. Net position of the Business-type activities was $544 million in 2016 down 1% from $549 million in 2015.

CITY OF TULSAMANAGEMENT’S DISCUSSION AND ANALYSIS June 30, 2016
MDA - 5
Government-Wide Financial Analysis, continued
2016 2015 2016 2015 2016 2015
Current and other assets 680,469$ 687,449$ 83,927$ 74,780$ 764,396$ 762,229$
Capital assets 1,601,163 1,535,030 584,108 596,206 2,185,271 2,131,236
Total assets 2,281,632 2,222,479 668,035 670,986 2,949,667 2,893,465
Deferred outflows of resources 49,372 25,580 5,311 1,659 54,683 27,239
2,331,004 2,248,059 673,346 672,645 3,004,350 2,920,704
Current and other liabilities 119,890 119,653 20,744 14,699 140,634 134,352
Long-term liabilities 730,686 690,219 106,589 105,245 837,275 795,464
Total liabilities 850,576 809,872 127,333 119,944 977,909 929,816
Deferred inflows of resources 115,861 153,089 2,023 3,796 117,884 156,885
966,437 962,961 129,356 123,740 1,095,793 1,086,701
Net position:
Net investment in capital
assets 1,288,414 1,235,482 504,926 514,764 1,793,340 1,750,246
Restricted 273,642 262,022 11,732 11,939 285,374 273,961
Unrestricted (197,489) (212,406) 27,332 22,202 (170,157) (190,204)
1,364,567$ 1,285,098$ 543,990$ 548,905$ 1,908,557$ 1,834,003$
Activities
Business-type
Activities Total
Governmental
The largest portion of the City’s net position (94%) reflects its investment in capital assets, less any outstanding debt that was used to acquire those assets. The City uses capital assets to provide services to its citizens. Accordingly, these assets are not available for future spending. Although the city’s investment in capital assets is reported net of related debt, it should be noted that the resources used to repay this debt must be provided from other sources, since the capital assets cannot be used to liquidate these liabilities.
Net position category: 2016 2015Net investment in capital assets 94% 95%Restricted 15% 15%Unrestricted -9% -10%
100% 100%
Percent of Total

CITY OF TULSAMANAGEMENT’S DISCUSSION AND ANALYSIS June 30, 2016
MDA - 6
Government-Wide Financial Analysis, continued
The City’s net position increased $74,554 compared to the prior year increase of $92,291. The Governmental activities and Business-type activities had an increase and decrease of $79,469 and $4,915 respectively.
The City’s total revenues increased 5.9% to $561 million in 2016. Program revenue generated $163.7 million, consisting of charges for services, federal and state grants, and capital grants/contributions, up from $147.1 million in 2015. Charges for services within governmental activities increased due to a $12.5 million increase in general government services fees. Sales taxes, the largest revenue category, increased slightly to $234.9 million in 2016 from $231.9 million in 2015. The increase is a result of stable economic conditions and a decrease in the state’s administrative charge for collecting sales tax. Property tax revenue increased to $73.5 million in 2016 from $64.7 million in 2015. Expenses for the primary government increased 11.2% or $49 million to $486 million. The City’s expenses cover a range of services, including public safety, public works, culture and recreation, and social and economic programs. Significant changes include:
General government expenses increased $17.4 million (37%). The increase is primarily attributed to increases of $3.1 million increase in pension expense and $16.7 million in employee insurance offset by a $7.4 million decreases in judgements expenses. Public safety and protection expenses totaled $200.7 million, an increase of $14.3 million (7.7%). The pension expense related to public safety employees decreased $2.6 million and all other public safety personnel services increased $7.1. Public Works and Transportation expenses increased $5.9 million (8.5%) primarily from a $4.7 million increase in capital outlay from the sales tax funds. Social and economic development expenses increased $7.2 million (23%), primarily from a $4.8 million increase in capital spending, $0.5 million increase in pension expense and a $0.9 million increase in Tulsa Stadium Improvement District assessments paid to the Tulsa Stadium Trust.

CITY OF TULSAMANAGEMENT’S DISCUSSION AND ANALYSIS June 30, 2016
MDA - 7
Government-Wide Financial Analysis, continued
2016 2015 2016 2015 2016 2015
Revenues:
Program revenues:
Charges for services 67,829$ 55,253$ 55,402$ 53,492$ 123,231$ 108,745$
Operating grants/contributions 29,486 32,364 - - 29,486 32,364
Capital grants/contributions 6,308 4,694 4,689 1,291 10,997 5,985
General revenues:
Sales taxes 234,912 231,997 - - 234,912 231,997
Property taxes 73,450 64,667 - - 73,450 64,667
Franchise 22,620 24,039 - - 22,620 24,039
Use tax 23,640 24,104 - - 23,640 24,104
Hotel/Motel taxes 7,483 7,552 - - 7,483 7,552
Intergovernmental revenue 6,814 6,037 - - 6,814 6,037
Other 27,290 23,303 1,109 937 28,399 24,240
499,832 474,010 61,200 55,720 561,032 529,730
Expenses:
General government 64,141 46,755 - - 64,141 46,755
Public safety & protection 200,726 186,385 - - 200,726 186,385
Public works & transportation 75,400 69,523 - - 75,400 69,523
Culture & recreation 24,124 22,638 - - 24,124 22,638
Social & economic development 38,629 31,409 - - 38,629 31,409
Interest on long-term debt 11,864 12,285 - - 11,864 12,285
Stormwater - - 30,084 25,877 30,084 25,877
One Technology Center - - 9,982 10,643 9,982 10,643
Arena & Convention - - 24,910 25,507 24,910 25,507
Tulsa Stadium Trust - - 3,330 3,500 3,330 3,500
Golf courses - - 3,288 2,917 3,288 2,917
414,884 368,995 71,594 68,444 486,478 437,439
Changes before transfers 84,948 105,015 (10,394) (12,724) 74,554 92,291
Transfers (5,479) (5,644) 5,479 5,644 - - Change in Net position 79,469 99,371 (4,915) (7,080) 74,554 92,291
Net position, beginning 1,285,098 1,185,727 548,905 555,985 1,834,003 1,741,712
Net position, ending 1,364,567$ 1,285,098$ 543,990$ 548,905$ 1,908,557$ 1,834,003$
Governmental
Activities
Business-type
Activities Total
Changes in Net Position

CITY OF TULSAMANAGEMENT’S DISCUSSION AND ANALYSIS June 30, 2016
MDA - 8
Government-Wide Financial Analysis, continued
The City provides various services to the citizens. The costs of these services generally are only partially supported by direct revenues ( . The chart below illustrates the cost of delivering services in the City’s governmental activities by comparing the service cost to program revenue.
Program Program
Expenses Revenues Net Cost
General government 64,141$ 25,493$ (38,648)$
Public safety and protection 200,726 47,860 (152,866)
Public works & transportation 75,400 17,558 (57,842)
Culture & recreation 24,124 4,814 (19,310)
Social & economic development 38,629 7,898 (30,731)
Interest on debt 11,864 - (11,864)
414,884$ 103,623$ (311,261)$
The net cost indicates the financial burden of each of these functions.
The cost of all activities this year was $414.9 million. A portion of the costs were paid by those who directly benefited from the programs ($67.8 million), or by other governments and organizations that subsidized certain programs with grants and contributions ($35.8 million). The remaining costs are covered by general revenues. Sales tax makes up the majority of general revenues or 59% in 2016. The City’s sales tax rate is 3.1%, of which 1.1% is a special tax dedicated for capital improvements. Property taxes fund general obligation debt issued for capital improvements and judgment payments.
2016Percent of
Total 2015Percent of
TotalSales taxes 234,912$ 59% 231,997$ 61%Property taxes 73,450 19% 64,667 17%Franchise tax 22,620 6% 24,039 6%Use tax 23,640 6% 24,104 6%Hotel/Motel taxes and Other 41,587 10% 36,892 10%
396,209$ 100% 381,699$ 100%
General Revenues
The City also provides services that generally require a charge for the service. These expenses are reported in the business-type activities. The chart below illustrates the cost of those services and the related charges for services along with any related grants and contributions ( ).

CITY OF TULSAMANAGEMENT’S DISCUSSION AND ANALYSIS June 30, 2016
MDA - 9
Government-Wide Financial Analysis, continued Program Program
Business-type activities: Expenses Revenues Net Cost
Arena & Convention 24,910$ 15,633$ (9,277)$
One Technology Center 9,982 8,986 (996)
Golf Courses 3,288 2,828 (460)
Tulsa Stadium Trust 3,330 281 (3,049)
Stormwater 30,084 32,363 2,279
71,594$ 60,091$ (11,503)$
While program revenues are intended to support the business type activities, transfers from the City augment these activities. The business-type activities received $5,479 in transfers from the Governmental activities of the City. These transfers included:
Capital transfers of $2,051 for Stormwater Management improvements funded by the City’s Bond, Sales tax and grant funds were offset by transfers of $1,653 to the General Fund for payments in lieu of taxes; $2,562 to fund Arena and Convention Center debt service and operations of which $2,540 was provided by City hotel/motel taxes; $2,215 of special assessment taxes used in connection with the ballpark located downtown.
Governmental Funds Financial Analysis Governmental Funds reported a fund balance of $525.2 million, up $15.1 million or 3% from 2015. Approximately 10% of the fund balance is unassigned fund balance, which is available for appropriating at the City’s discretion. Other categories of fund balance include non-spendable, indicating it is not in spendable form such as inventories and advances to others, restricted, committed or assigned for particular purpose. The General Fund is the main operating fund of the City and its fund balance decreased to $62 million in 2016 from $65.5 million in 2015. Of this amount $54.3 million represents unassigned fund balance and approximates 19% of General Fund expenditures compared to $54.8 million and 19%, in 2015. The fund balance represents approximately 21% of expenditures compared to 23% in 2015. The change in fund balance can be attributed to the following:
The General Fund’s fund balance decreased $3.4 million to $62 million, as expenditures increased 3.3% while revenues decreased 0.1%. Tax revenues increased only $0.3 million due to modest economic conditions and development activity. Investment income increased $1.6 million attributed to the increased returns on the City’s investments. Public safety expenditures increased due to increased personnel service costs.

CITY OF TULSAMANAGEMENT’S DISCUSSION AND ANALYSIS June 30, 2016
MDA - 10
Governmental Funds Financial Analysis, continued The remaining Governmental Funds’ fund balance increased $18 million, or 4% to $463.2 million. The majority of fund balance is restricted (99.1%).
The Debt Service Fund’s fund balance increased $8.5 million or 14.9% to $65.7 million primarily from an increase of $8 million in revenue from property taxes. The fund balance of the Debt service fund is restricted for debt service payments. Capital expenditures in the Bond fund increased 56.3% or $21.1 million from the prior year, while proceeds from debt issued decreased $13 million or 22.8%. The remaining fund balance of $166.7 million is restricted for capital improvements. The Sales Tax Fund’s fund balance increased $8.6 million or 4.2% over 2015. Sales tax collections increased $0.7 million due moderate economic conditions and investment income increased $1 million due to increased returns on the City’s investments. Payments to component units increased $4.7 million while transfers out decreased $1.5 million. The fund balance of $211.4 million in the sales tax fund is restricted for capital improvements.
Proprietary Funds Financial Analysis Proprietary funds reported a combined net position of $544 million compared to $548.9 million in the prior year.
The Stormwater Management fund incurred an operating loss of $2.2 million while receiving $2.1 million in transfers for capital improvements and $4.7 million in capital contributions resulting in an increase of $3.3 million in net position. The fund’s net position of $331.6 million is primarily (95%) invested in capital assets.
One Technology Center fund contributed lease revenue of $9.0 million, a decline of $0.2 million from the prior year. The overall net position decreased $0.3 million to a $5.5 million deficit; largely as a result of decreased operating expenses (primarily leasing commissions) offset by a decrease in investment income.
The Arena and Convention Center fund contributed revenue of $15.6 million, a decrease of $0.9 million over the previous year, due to a decrease of premier events attracted to the BOK Center while expenses decreased $0.5 million resulting from a decrease in events. The $8.6 million operating loss is partially offset by transfers in of $2.6 million. The overall net position decreased $6.7 million for the year, ending at approximately $188 million.

CITY OF TULSAMANAGEMENT’S DISCUSSION AND ANALYSIS June 30, 2016
MDA - 11
Budgetary Highlights The General Fund is the only major fund requiring an annually adopted budget. General Fund Budgetary Highlights The original 2016 General Fund budget adopted by the Mayor and City Council totaled $274.6 million. The budget was balanced with revenue estimates of $272.3 million and $2.3 million of unassigned fund balance and was 4.2% more than the 2015 original budget. Taking into consideration the 2015 carry over encumbrances and budget amendments, the total authorized expenditure amount was $278.7 million for 2016.
Original Amended Budgetary Basis
Budget Budget Actual Variance
2016 2015 2016 2015 2016 2015 2016 2015
Revenues:
Taxes 204,877$ 194,038$ 200,447$ 196,622$ 198,552$ 197,711$ (1,895)$ 1,089$
Licenses and permits 8,121 7,995 8,121 7,995 8,398 8,423 277 428
Intergovernmental 8,128 8,115 8,128 8,128 8,411 8,360 283 232
Charges for service 21,146 21,146 21,146 21,146 17,508 19,890 (3,638) (1,256)
Fines and forfeitures 9,900 9,900 9,900 9,900 7,878 8,818 (2,022) (1,082)
Investment income 2,479 2,479 2,479 2,479 3,035 2,591 556 112
Payments from component unit 13,545 13,545 13,545 13,545 14,049 13,502 504 (43)
Miscellaneous 1,932 1,894 1,932 1,897 3,523 3,594 1,591 1,697
Transfers In 2,203 2,203 2,203 2,203 3,348 2,227 1,145 24
272,331$ 261,315$ 267,901$ 263,915$ 264,702$ 265,116$ (3,199)$ 1,201$
Expenses:
General government 42,647$ 37,941$ 39,892$ 36,660$ 38,928$ 35,056$ (964)$ (1,604)$
Public works and transportation 21,258 24,187 20,625 23,717 17,087 22,394 (3,538) (1,323)
Social and economic development 12,260 11,962 11,872 11,213 11,690 11,039 (182) (174)
Public safety and protection 169,021 159,975 172,359 164,669 171,085 162,740 (1,274) (1,929)
Culture and recreation 22,060 20,894 21,012 21,033 20,878 20,870 (134) (163)
Payments to component units 7,619 7,449 7,238 7,440 7,238 7,440 - -
Transfers out 5,717 5,572 5,717 5,922 5,717 5,922 - -
280,582$ 267,980$ 278,715$ 270,654$ 272,623$ 265,461$ (6,092)$ (5,193)$
2016 budgetary basis actual revenues of $264.7 million fell short of the amended estimate by $3.2 million or 1.2%. Franchise Tax revenues below the estimate were the largest contributor to the variance in tax revenues. Franchise Taxes were $2.0 million and Fines and Forfeitures were $1.1 million below the estimate. These two revenue sources account for the majority of the variance between budgeted and actual revenue. 2016 budgetary basis actual expenditures were $272.6 million and were $6.0 million under the authorized expenditure amount. The 2016 amended budget reflects the total authorized expenditure amount and reflects amendments that reduced the budget by $1.9 million, appropriations for carry over encumbrances of $5.9 million and the original budget of $274.6 million.

CITY OF TULSAMANAGEMENT’S DISCUSSION AND ANALYSIS June 30, 2016
MDA - 12
General Fund Budgetary Highlights, continued The 2016 General Fund budget was amended three times during the year. The largest amendment of $4.0 million reflected an adjustment for revenues below expectations. The remaining amendments addressed compensation issues not anticipated in the Original Budget. A labor contract that settled after the budget was adopted combined with higher than anticipated public safety overtime supported a need for a $2.0 million budget increase. There were no major service level increases in 2016, policy makers were constrained due to revenue receipts below expectations and increased costs related to the labor contract settlement. Capital Assets and Debt Administration Capital Assets - At the end of 2016 the City had invested $2.2 billion in a broad range of capital assets, including police and fire equipment, buildings, park facilities, roads, and bridges. This amount represents a net increase (after additions, deductions, and depreciation) of $54 million, or 2.5% during the year (see Note 7 to the financial statements for additional detailed information regarding capital assets). Street improvements funded by the Fix Our Streets bond package and the Third Penny Sales Tax Program contributed to the large increase in Infrastructure.
2016 2015 2016 2015 2016 2015
Land 527$ 528$ 95$ 95$ 622$ 623$
Works of Art - - 1 - 1 -
Buildings and improvements 146 123 457 470 603 593
Equipment 68 72 21 25 89 97
Infrastructure 680 659 - - 680 659
Construction in progress 180 153 10 6 190 159
1,601$ 1,535$ 584$ 596$ 2,185$ 2,131$
(dollar amounts expressed in millions)Capital Assets, net of depreciation
TotalBusiness-type ActivitiesGovernmental Activities

CITY OF TULSAMANAGEMENT’S DISCUSSION AND ANALYSIS June 30, 2016
MDA - 13
Capital Assets and Debt Administration, continued Long-term Liabilities At year end, the City had $582 million in general obligation and revenue bonds outstanding, an increase of 1.4% from last year, as shown below. More detailed information about the City’s long-term liabilities is presented in Note 11 to the basic financial statements.
2016 2015 2016 2015 2016 2015
General obligation bonds 481$ 468$ -$ -$ 481$ 468$
Revenue bonds 6 7 96 99 102 106
Other long-term liabilities 329 296 15 9 344 305
815$ 771$ 110$ 108$ 925$ 879$
Long-term Liabilities
(dollar amounts expressed in millions)
Governmental Activities Business-type Activities Total
General obligation bonds – In April 2016, the City issued General Obligation bonds totaling $58.8 million which includes $1.8 million for premium on debt issuance. The proceeds are to be used for street improvements and will be repaid 100% from the debt service fund.
Other long-term liabilities – The City’s net pension liability increased $5.9 million in 2016 to $12,677.
Economic Factors and Next Year’s Budget and Rates The original 2017 budget was $767.9 million – a 1.1% increase from the original 2016 budget. The operating budget was $642.6 million and the capital Improvement budget was $125.3 million. The operating budget decreased by 0.8% and the capital budget increased by 12.0% from 2016. Development of the budget begins with a review of the economy. All labor figures have recovered from losses sustained in the previous recession, and are stable at historic highs. The area labor force gained 15,100 new jobs in 2016 and resulted in an increase of 3.3% over the previous year. Wage and salary employment reported its sixth consecutive year of growth, increasing 0.4% over 2015, and ended the fiscal year at a seasonally adjusted total of 443,600. The greatest relative growth was sustained in the service sector, which increased 2.5% over the previous fiscal year, and at a median annual rate of 1.2% over the previous ten years. The larger Total Employment survey reported an increase of 3.1% over the previous year to total a seasonally adjusted 454,300 in 2015. As Total Employment grew at a slower rate than the labor force, the metro unemployment rate grew in 2015 to a seasonally adjusted 4.6%, an increase of 0.2 points from 2014 (4.4%). After five years of growth, retail sales in the Tulsa Metropolitan Statistical Area remained essentially flat in calendar year 2014, and then fell by 2.7% in calendar year 2015. However, Tulsa’s share of the metro retail trade grew 0.6% in calendar year 2016. The Oklahoma State University Center for Applied Economic Research forecasts retail sales to increase at an annualized rate of 3.6%, employment to increase 1.3%, and per capita personal income to increase 4.9% over the next 4 years.
CITY OF TULSAMANAGEMENT’S DISCUSSION AND ANALYSIS June 30, 2016
MDA - 14
Economic Factors and Next Year’s Budget and Rates, continued Gross Metro Product (GMP) was 0.6% over the previous year; but is forecast to resume annualized growth of 2.8% through calendar year 2020. Barge freight reported lower traffic in 2016. Traffic totals dropped significantly in calendar year 2016, but are rebounding due to the completion of a major dock renovation which restricted traffic during construction. The local economy is expected to continue to improve based on the conservative growth forecast in both employment and GMP. The 2017 budget reflects increases for water and sewer rates. A water rate increase of 7% and a sewer rate increase of 9%, to address capital needs and debt service in 2017. Contacting the City’s Financial Management
Questions about this report or requests for additional information should be directed to: City of Tulsa Office of the Controller 175 East 2nd Street, Suite 575 Tulsa, Oklahoma 74103


1
Primary GovernmentGovernmental Business-type Component
Activities Activities Total UnitsASSETS
Current assets:Cash, cash equivalents and investments 526,685$ 42,505$ 569,190$ 166,992$ Cash and cash equivalents - restricted 398 11,908 12,306 40,891 Investments - - - 2,788 Investments - restricted - - - 200 Receivables, net 116,335 5,147 121,482 39,772 Prepaid expenses 300 594 894 - Internal balances 2,413 (2,413) - - Inventories 842 356 1,198 3,911 Other current assets - - - 2,060
Total current assets 646,973 58,097 705,070 256,614
Noncurrent assets:Cash and cash equivalents - restricted 32 13,412 13,444 103,539 Receivables, net - 10,839 10,839 17,178 Investments - - - 3,169 Investments - restricted 1,078 1,578 2,656 28,988 Advances to primary government - - - 139 Advances to component units 4,778 - 4,778 - Land held for resale, net 2,356 - 2,356 661 Other assets 14,090 1 14,091 415 Equity interest in joint ventures 11,162 - 11,162 17,944 Nondepreciable capital assets 707,451 106,238 813,689 299,780 Capital assets, net 893,712 477,870 1,371,582 1,391,522
Total noncurrent assets 1,634,659 609,938 2,244,597 1,863,335 Total assets 2,281,632 668,035 2,949,667 2,119,949
DEFERRED OUTFLOWS OF RESOURCESPension related items 48,166 5,311 53,477 31,915 Deferred charge on refunding 1,206 - 1,206 8,997
Total deferred inflows of resources 49,372 5,311 54,683 40,912
LIABILITIESCurrent liabilities:
Accounts payable and accrued liabilities 34,624 5,051 39,675 28,700 Unearned revenue - 10,787 10,787 876 Advances from primary government - - - 1,372 Current portion of long-term liabilities 85,266 3,764 89,030 45,856 Refundable deposits payable from restricted assets - - - 10,732
Total current liabilities 119,890 19,602 139,492 87,536
Noncurrent liabilities:Advances from primary government - - - 3,406 Advances from component units 139 - 139 - Unearned revenue 725 1,134 1,859 - Deposits subject to refund - 8 8 562 Long-term liabilities 729,822 106,589 836,411 689,229
Total noncurrent liabilities 730,686 107,731 838,417 693,197 Total liabilities 850,576 127,333 977,909 780,733
DEFERRED INFLOWS OF RESOURCESProperty tax revenue 69,427 - 69,427 4,688 Pension related items 46,434 2,023 48,457 13,818 Gain on refunding - - - 116
Total deferred inflows of resources 115,861 2,023 117,884 18,622
NET POSITIONNet investment in capital assets 1,288,414 504,926 1,793,340 1,178,437 Restricted for:
Economic stabilization reserve 2,000 - 2,000 - Debt service 43,629 736 44,365 16,437 Capital projects 218,526 9,907 228,433 16,667
Federal and state grants 6,366 - 6,366 - Economic development 2,361 - 2,361 - Other purposes 760 1,089 1,849 23,461
Unrestricted (197,489) 27,332 (170,157) 126,504 Total net position 1,364,567$ 543,990$ 1,908,557$ 1,361,506$
The notes to the financial statements are an integral part of this statement.
CITY OF TULSA STATEMENT OF NET POSITION
June 30, 2016(amounts expressed in thousands)

CITY
OF
TULS
A
STA
TEM
ENT
OF
ACT
IVIT
IES
Year
end
ed J
une
30, 2
016
(am
ount
s ex
pres
sed
in t
hous
ands
)
Prog
ram
Rev
enue
sN
et (E
xpen
ses)
Rev
enue
s an
d Ch
ange
s in
Net
Pos
ition
Char
ges
for
Ope
ratin
gCa
pita
lPr
imar
y G
over
nmen
tSe
rvic
esG
rant
s an
dG
rant
s an
dG
over
nmen
tal
Busi
ness
-typ
eFu
nctio
ns/P
rogr
ams
Expe
nses
and
Fine
sCo
ntrib
utio
nsCo
ntrib
utio
nsAc
tiviti
esAc
tiviti
esTo
tal
Prim
ary
gove
rnm
ent:
Gov
ernm
enta
l act
iviti
es:
Gen
eral
gov
ernm
ent
64,1
41$
25
,493
$
-
$
-$
(3
8,64
8)$
-
$
(38,
648)
$
-$
Publ
ic s
afet
y an
d pr
otec
tion
200,
726
24,3
59
23,5
01
-
(1
52,8
66)
-
(152
,866
)
-
Publ
ic w
orks
and
tran
spor
tatio
n75
,400
11,2
50
-
6,
308
(57,
842)
-
(5
7,84
2)
-
Cu
lture
and
recr
eatio
n24
,124
4,81
4
-
-
(1
9,31
0)
-
(19,
310)
-
Soci
al a
nd e
cono
mic
dev
elop
men
t38
,629
1,91
3
5,
985
-
(3
0,73
1)
-
(30,
731)
-
Inte
rest
on
long
-ter
m d
ebt
11,8
64
-
-
-
(11,
864)
-
(1
1,86
4)
-
To
tal g
over
nmen
tal a
ctiv
ities
414,
884
67,8
29
29,4
86
6,30
8
(3
11,2
61)
-
(311
,261
)
-
Busi
ness
-typ
e ac
tiviti
es:
Stor
mw
ater
30,0
84
27
,674
-
4,68
9
-
2,
279
2,27
9
-
One
Tec
hnol
ogy
Cent
er9,
982
8,
986
-
-
-
(996
)
(9
96)
-
Ar
ena
& C
onve
ntio
n24
,910
15,6
33
-
-
-
(9,2
77)
(9
,277
)
-
Tu
lsa
Stad
ium
Tru
st3,
330
28
1
-
-
-
(3,0
49)
(3
,049
)
-
G
olf C
ours
es3,
288
2,82
8
-
-
-
(4
60)
(460
)
-
Tota
l bus
ines
s-ty
pe a
ctiv
ities
71,5
94
55
,402
-
4,68
9
-
(1
1,50
3)
(11,
503)
-
Tota
l prim
ary
gove
rnm
ent
486,
478
$
123,
231
$
29,4
86$
10,9
97$
(311
,261
)
(11,
503)
(3
22,7
64)
-
Co
mpo
nent
uni
ts:
Clea
n w
ater
and
was
te w
ater
sys
tem
s17
2,93
3
21
1,30
7
-
16,2
17
-
-
-
54
,591
Refu
se c
olle
ctio
n an
d di
spos
al24
,751
26,5
99
-
-
-
-
-
1,
848
Ai
rpor
t ser
vice
s46
,345
32,3
05
8,62
2
4,
096
-
-
-
(1
,322
)
O
ther
com
pone
nt u
nits
32,1
85
13
,642
6,
995
3,66
0
-
-
-
(7,8
88)
Com
pone
nt U
nits
276,
214
$
283,
853
$
15,6
17$
23,9
73$
47,2
29
Gen
eral
reve
nues
:Ta
xes:
Sa
les
tax
234,
912
-
23
4,91
2
49
2
Pr
oper
ty ta
x73
,450
-
73
,450
4,03
7
Fr
anch
ise
tax
22,6
20
-
22,6
20
-
Use
tax
23,6
40
-
23,6
40
-
Hot
el/M
otel
tax
7,48
3
-
7,
483
-
In
terg
over
nmen
tal r
even
ue, u
nres
tric
ted
6,81
4
-
6,
814
-
Fu
ndin
g fr
om p
rimar
y go
vern
men
t-
-
-
7,18
3
Paym
ents
in li
eu o
f tax
es14
,631
-
14
,631
-
Unr
estr
icte
d in
vest
men
t ear
ning
s7,
910
1,
055
8,96
5
2,86
0
Mis
cella
neou
s 4,
430
-
4,43
0
220
Gai
n on
dis
posa
l of c
apita
l ass
ets
319
54
373
79
Tr
ansf
ers
(5,4
79)
5,
479
-
-
Tota
l gen
eral
reve
nues
and
tran
sfer
s39
0,73
0
6,
588
397,
318
14,8
71
Ch
ange
in N
et p
ositi
on79
,469
(4,9
15)
74
,554
62,1
00
N
et p
ositi
on--
begi
nnin
g of
yea
r1,
285,
098
54
8,90
5
1,
834,
003
1,
299,
406
N
et p
ositi
on--
end
of y
ear
1,36
4,56
7$
543,
990
$
1,90
8,55
7$
1,36
1,50
6$
The
note
s to
the
fina
ncia
l sta
tem
ents
are
an
inte
gral
par
t of
thi
s st
atem
ent.
Com
pone
nt
Uni
ts
2

3
ee 10/8/16 JL 9/19/16 kr 10/11/16 kr 10/11/16Other Total
Debt Governmental GovernmentalGeneral Service Bond Sales Tax Funds Funds
AssetsCash and cash equivalents 43,714$ 65,114$ 173,474$ 210,144$ 18,798$ 511,244$ Receivables, net 29,184 70,036 - 11,845 4,216 115,281 Due from other funds 164 - - - - 164 Land held for resale 44 - - - - 44 Advances to other funds 241 - - - - 241 Advances to component units 326 - - - - 326
Total assets 73,673$ 135,150$ 173,474$ 221,989$ 23,014$ 627,300$
LiabilitiesAccounts payable and accrued liabilities 11,325 - 6,714 10,554 1,246 29,839 Unearned revenue 175 - - - 550 725 Due to other funds - - - - 164 164 Advances from other funds - - - - 95 95 Advances from component units 127 - 12 - - 139
Total liabilities 11,627 - 6,726 10,554 2,055 30,962
Deferred inflows of resourcesUnavailable revenue - property taxes - 69,427 - - - 69,427 Unavailable revenue - special assessments - - - - 72 72 Unavailable revenue - intergovernmental - - - - 1,616 1,616
Total unavailable revenue - 69,427 - - 1,688 71,115
Fund balancesNonspendable 611 - - - - 611 Restricted 2,000 65,723 166,748 211,435 14,890 460,796 Committed - - - - 4,691 4,691 Assigned 5,183 - - - - 5,183 Unassigned 54,252 - - - (310) 53,942
Total fund balances 62,046 65,723 166,748 211,435 19,271 525,223 Total liabilities, deferred inflows and fund balances 73,673$ 135,150$ 173,474$ 221,989$ 23,014$ 627,300$
Amounts reported for governmental activities in the statement of net position are different because:1,591,319
9,908
2,413 Land held for resale 2,356 Facility use lease asset 14,090 Deferred pension outflows 46,246 Investment in joint venture is not reported in the funds 11,162 Deferred charge on debt refunding 1,206
(3,807) Deferred pension inflows (45,528) Unavailable revenue - intergovernmental 1,616 Unavailable revenue - special assessments 72 Long-term liabilities are not due and payable in the current period, and therefore, are not reported in the funds
The detail of the individual long-term liabilities is as follows:General obligation debt (465,376) Unamortized bond premium (15,327) Compensated absences (29,186) Other post employment benefits liability (7,597) Net pension liability (254,567) Judgments (18,287) Payable to other governments (1,369)
Governmental activities net position 1,364,567$
The notes to the financial statements are an integral part of this statement.
Capital assets used in governmental activities are not financial resources and therefore are not reported in the fundsInternal service funds are used by management to charge costs of equipment management, employee insurance and office services.
The assets and liabilities of the internal service funds are included in governmental activities in the statement of net position
Internal balances due to elimination of internal service fundsAssets, liabilities and deferred outflows and inflows included in governmental activities statement of net position but not in governmental funds:
Accrued interest payable
(amounts expressed in thousands)
CITY OF TULSABALANCE SHEET
GOVERNMENTAL FUNDSJune 30, 2016

4
ee 10/28/16 JL 9/19/16 kr 10/11/16 kr10/11/16Other Total
Debt Governmental GovernmentalGeneral Service Bond Sales Tax Funds Funds
RevenuesSales tax 151,577$ -$ -$ 83,335$ -$ 234,912$ Property tax - 73,450 - - - 73,450 Franchise tax 22,040 - - - 580 22,620 Use tax 23,640 - - - - 23,640 Hotel/motel tax 150 - - - 7,333 7,483 Special assessment tax - - - - 3,525 3,525 Charges for services 17,866 - - - 10,542 28,408 Intergovernmental revenues 29,686 - - - 10,073 39,759 Fines and forfeitures 7,878 - - - 199 8,077 Investment income 4,905 - - 2,954 115 7,974 Licenses, permits and fees 8,397 - - - - 8,397 Program income from grants - - - - 1,337 1,337 Payments in lieu of taxes 14,383 - - - - 14,383 Miscellaneous 2,827 - 1,225 229 132 4,413
Total revenues 283,349 73,450 1,225 86,518 33,836 478,378
ExpendituresCurrent:
General government 37,028 - - - 77 37,105 Public safety and protection 192,815 - - - 9,979 202,794 Public works and transportation 20,911 - 113 - 14 21,038 Culture and recreation 20,169 - - - 621 20,790 Social and economic development 11,850 - - 5,000 13,745 30,595 Capital and operating funding to component units 7,238 - - 8,362 - 15,600
Capital outlay - - 58,653 59,639 4,078 122,370 Debt service - 68,950 - - - 68,950
Total expenditures 290,011 68,950 58,766 73,001 28,514 519,242
Excess (deficiency) of revenuesover expenditures (6,662) 4,500 (57,541) 13,517 5,322 (40,864)
Other financing sources (uses)Transfers in 2,303 163 - - 2,655 5,121 Transfers out (305) - (502) (4,935) (5,420) (11,162) Proceeds from sale of capital assets 1,222 - - - - 1,222 Bond issuance - - 57,000 - - 57,000 Refunding bonds issued - 23,133 - - - 23,133 Premium on bonds issued - 3,858 - - - 3,858 Payment to refunded bond escrow agent - (23,133) - - - (23,133)
Total other financing sources (uses) 3,220 4,021 56,498 (4,935) (2,765) 56,039
Net change in fund balances (3,442) 8,521 (1,043) 8,582 2,557 15,175 Fund balances, beginning of year 65,488 57,202 167,791 202,853 16,714 510,048 Fund balances, end of year 62,046$ 65,723$ 166,748$ 211,435$ 19,271$ 525,223$
The notes to the financial statements are an integral part of this statement.
(amounts expressed in thousands)
CITY OF TULSASTATEMENT OF REVENUES, EXPENDITURES AND CHANGES IN FUND BALANCES
GOVERNMENTAL FUNDSYear ended June 30, 2016

5
Amounts reported for governmental activities in the statement of activities are different because:
Net change in fund balances - total governmental funds 15,175$
Governmental funds report capital outlays as expenditures. However, in the statement of activities thecost of those assets is allocated over their estimated useful lives and reported as depreciation expense:
Capital outlays 114,177 Capital contributions 4,219 Depreciation expense (52,166)
66,230
The effect of miscellaneous transactions involving capital assets:Gain on disposal of capital assets 714 Proceeds from sale of capital assets (903)
(189)
The issuance of long-term debt provides current financial resources to governmental funds, while the repayment of principal of long-term debt consumes current financial resources:
Bond issuance (57,000) Premium on bond issuance (2,032) Refunding bonds issued (23,133) Deferred loss on debt refunding 452 Premium on refunding bonds issued (1,826) Payment to bond escrow 22,601 Payment of bond principal 45,006
(15,932)
Some expenses reported in the statement of activities do not require the use of current financialresources and, therefore, are not reported as expenditures in governmental funds:
Accrued interest expense (92) Amortization of premium on bond issuance 3,974 Amortization of deferred gain on debt refunding (200) Increase in other post employment benefit expense 238 Decrease in compensated absences expense (348) Decrease in liability to other governments 343 Increase in tort claims and judgments expense (7,158) Amortization of facility use lease (368)
(3,611)
Net pension liability is not due and payable in the current period, and accordingly is notreported as a fund liability. Deferred outflows (inflows) of resouces related to pensionsare not financial resources, and therefore, are not reported in the governmental funds.
Net pension liability (39,563) Deferred outflows of resources related to pensions 46,270 Deferred inflows of resources related to pensions 12,178
18,885
Some revenues reported in the statement of activities do not provide current financial resources in governmental funds:
Loss from investment in joint venture (239) (239)
Some revenues which are unavailable in the governmental funds represent accrual based revenue in the entity-wide statements:
Intergovernmental revenue 820 Special assessment revenue (2)
818
The net revenue of internal service funds is reported within governmental activities:Change in net position of internal service funds (1,921) Internal balances resulting from the elimination of internal service fund revenues 253
(1,668)
Change in net position - statement of activities 79,469$
The notes to the financial statements are an integral part of this statement.
CITY OF TULSA RECONCILIATION OF THE STATEMENT OF REVENUES, EXPENDITURES, AND
CHANGES IN FUND BALANCES OF GOVERNMENTAL FUNDSTO THE STATEMENT OF ACTIVITIES
Year ended June 30, 2016(amounts expressed in thousands)

6
CITY OF TULSASTATEMENT OF NET POSITION
PROPRIETARY FUNDSJune 30, 2016
(amounts expressed in thousands)
JL 10/17/16 st 11/16/16 st 11/16/16 st 10-25-16 st 9/27/16Governmental
Activities -One Arena & Tulsa Nonmajor - Internal
Stormwater Technology Convention Stadium Golf ServiceManagement Center Center Trust Courses Total Funds
ASSETSCurrent assets:
Cash and cash equivalents 15,255$ 4,956$ 16,127$ 5,627$ 540$ 42,505$ 15,441$ Cash and cash equivalents, restricted - 1,149 8,210 2,549 - 11,908 398 Receivables, net 3,091 1,106 949 - 1 5,147 1,054 Advances to component units - - - - - - 1,372 Prepaid expenses - - 572 - 22 594 300 Inventories, net - - 300 - 56 356 798
18,346 7,211 26,158 8,176 619 60,510 19,363
Noncurrent assets:Cash and cash equivalents, restricted 8,385 3,388 36 1,603 - 13,412 32 Investments - restricted - - 1,578 - - 1,578 1,078 Receivables, net 23 10,816 - - - 10,839 - Advances to component units - - - - - - 3,080 Other - - - 1 - 1 - Nondepreciable capital assets 87,901 3,182 9,509 2,841 2,805 106,238 4,791 Depreciable capital assets, net 228,510 35,700 174,877 33,914 4,869 477,870 5,053
324,819 53,086 186,000 38,359 7,674 609,938 14,034 Total assets 343,165 60,297 212,158 46,535 8,293 670,448 33,397
DEFERRED OUTFLOWS OF RESOURCESPension related items 4,921 390 - - - 5,311 1,920 Total deferred outflow of resources 4,921 390 - - - 5,311 1,920
LIABILITIES Current liabilities:
Accounts payable and accrued liabilities 1,165 901 2,679 83 223 5,051 978 Unearned revenue - 134 10,653 - - 10,787 - Workers compensation claims - - - - - - 6,399 Current portion of long-term liabilities 480 1,509 1,190 585 - 3,764 1,646
1,645 2,544 14,522 668 223 19,602 9,023
Noncurrent liabilities:Unearned revenue - - 1,134 - - 1,134 - Workers compensation claims - - - - - - 4,419 Advances from other funds - - - - - - 146 Deposits subject to refund - 8 - - - 8 - Long-term liabilities 13,007 63,502 8,470 21,610 - 106,589 10,915
13,007 63,510 9,604 21,610 - 107,731 15,480 Total liabilities 14,652 66,054 24,126 22,278 223 127,333 24,503
DEFERRED INFLOW OF RESOURCESPension related items 1,862 161 - - - 2,023 906 Total deferred outflow of resources 1,862 161 - - - 2,023 906
NET POSITION (DEFICIT)Net investment in capital assets 316,411 (11,663) 176,341 16,163 7,674 504,926 9,844 Restricted for:
Debt service - 736 - - - 736 - Capital projects 8,408 1,499 - - - 9,907 - Other purposes - - - 1,089 - 1,089 -
Unrestricted 6,753 3,900 11,691 7,005 396 29,745 64 Total net position (deficit) 331,572$ (5,528)$ 188,032$ 24,257$ 8,070$ 546,403 9,908$
Adjustment to reflect the consolidationof internal service fund activities related to enterprise funds (2,413)
Net position of business-type activities 543,990$
The notes to the financial statements are an integral part of this statement.
Enterprise FundsBusiness-type Activities

7
CITY OF TULSASTATEMENT OF REVENUES, EXPENSES, AND CHANGES IN NET POSITION
PROPRIETARY FUNDSYear ended June 30, 2016
(amounts expressed in thousands)
JL 10/17/16 st 11/16/16 st 11/16/16 st 10-25-16 st 9/27/16Governmental
Activities -One Arena & Tulsa Nonmajor - Internal
Stormwater Technology Convention Stadium Golf ServiceManagement Center Center Trust Courses Total Funds
Operating revenuesCharges for services 26,986$ 8,986$ 15,633$ 183$ 2,824$ 54,612$ 14,245$ Insurance premiums - - - - - - 23,640 Workers compensation premiums - - - - - - 5,773 Other 688 - - 98 4 790 153
27,674 8,986 15,633 281 2,828 55,402 43,811
Operating expensesSalaries and wages 9,642 846 - - - 10,488 4,541 Materials and supplies 1,008 152 - - 216 1,376 6,794 Other services and charges 9,694 4,410 13,404 329 2,763 30,600 3,261 Workers compensation claims - - - - - - 7,583 Insurance claims and premiums - - - - - - 23,898 Depreciation and amortization 9,493 1,224 10,870 1,969 309 23,865 409
29,837 6,632 24,274 2,298 3,288 66,329 46,486
Operating income (loss) (2,163) 2,354 (8,641) (2,017) (460) (10,927) (2,675)
Nonoperating revenues (expenses)Investment income 328 658 57 8 4 1,055 175 Interest expense - (3,344) (636) (1,029) - (5,009) - Gain on disposal of capital assets 54 (3) - - 3 54 17 Other, net - - - (3) - (3) -
382 (2,689) (579) (1,024) 7 (3,903) 192
Income (loss) before capital contributionsand transfers (1,781) (335) (9,220) (3,041) (453) (14,830) (2,483)
Capital contributions 4,689 - - - - 4,689 - Transfers in 2,051 17 2,562 2,215 287 7,132 562 Transfers out (1,653) - - - - (1,653) -
5,087 17 2,562 2,215 287 10,168 562
Change in net position 3,306 (318) (6,658) (826) (166) (4,662) (1,921)
328,266 (5,210) 194,690 25,083 8,236 11,829 Net position (deficit) - end of year 331,572$ (5,528)$ 188,032$ 24,257$ 8,070$ 9,908$
Adjustment to reflect the consolidationof internal service fund activities related to enterprise funds (253)
Change in net position of business-type activities (4,915)$
The notes to the financial statements are an integral part of this statement.
Enterprise FundsBusiness-type Activities
Net position (deficit) - beginning of year

8
OOBcd 12/16/15 st 11/16/16 st 11/16/16 cd 11/28/16 st 9/27/16
GovernmentalActivities -
One Arena & Tulsa Nonmajor - InternalStormwater Technology Convention Stadium Golf Service
Management Center Center Trust Courses Total Funds
Cash flows from operating activities:Receipts from customers 27,277$ 9,000$ 20,811$ 282$ 2,829$ 60,199$ 45,543$ Payments to suppliers (10,731) (4,842) (13,306) (581) (2,961) (32,421) (42,481) Payments to employees (9,248) (789) - - - (10,037) (4,520)
Net cash provided (used) by operating activities 7,298 3,369 7,505 (299) (132) 17,741 (1,458)
Cash flows from noncapital financing activities:Transfers from other funds - - 2,540 - 150 2,690 - Transfers to other funds (1,653) - - - - (1,653) -
Net cash provided (used) by financing activities (1,653) - 2,540 - 150 1,037 -
Cash flows from capital and related financing activities:Acquisition and construction of capital assets (6,279) (273) (542) (192) (119) (7,405) (501) Principal paid on debt - (1,400) (1,095) (570) - (3,065) - Interest paid on debt - (3,339) (652) (1,035) - (5,026) - Proceeds from sale of capital assets 69 - - - 3 72 17 Proceeds from financing activities - 1,200 - - - 1,200 - Transfers from other funds 2,051 17 22 2,215 137 4,442 562
(4,159) (3,795) (2,267) 418 21 (9,782) 78
Cash flows from investing activities:Interest received 302 43 52 8 4 409 165 Proceeds from sale or maturities of investments - 742 - - - 742 -
Net cash provided by investing activities 302 785 52 8 4 1,151 165
Net increase (decrease) in cash and cash equivalents 1,788 359 7,830 127 43 10,147 (1,215) Cash and cash equivalents, beginning 21,852 9,134 16,543 9,652 497 57,678 17,086
Cash and cash equivalents, end of year 23,640$ 9,493$ 24,373$ 9,779$ 540$ 67,825$ 15,871$
Reconciliation of cash and cash equivalentsto the Statement of Net Position:
Cash and cash equivalents 15,255 4,956 16,127 5,627 540 42,505 15,441 Cash and cash equivalents - restricted 8,385 4,537 8,246 4,152 - 25,320 430
Total cash and cash equivalents 23,640$ 9,493$ 24,373$ 9,779$ 540$ 67,825$ 15,871$
Reconciliation of operating income (loss) to net cashprovided (used) by operating activities
Operating income (loss) (2,163) 2,354 (8,641) (2,017) (460) (10,927) (2,675) Adjustment to reconcile operating income (loss) to net cash provided (used) by operating activities:Depreciation and amortization 9,493 1,224 10,870 1,969 309 23,865 409 (Increase) decrease in accounts receivable and other assets (379) 12 (172) - (9) (548) 1,430 (Increase) decrease in deferred outflows of resources (4,071) (354) - - - (4,425) (1,413) Increase (decrease) in accounts payable and other liabilities 5,347 205 5,448 (251) 28 10,777 1,719 Increase (decrease) in deferred inflows of resources (929) (72) - - - (1,001) (928)
Net cash provided (used) by operating activities 7,298$ 3,369$ 7,505$ (299)$ (132)$ 17,741$ (1,458)$
NON-CASH TRANSACTIONS:Capital contributions 4,689$ -$ -$ -$ -$ 4,689$ -$
-$ 25$ 4$ -$ -$ 29$ 45$
The notes to the financial statements are an integral part of this statement.
Enterprise Funds
CITY OF TULSASTATEMENT OF CASH FLOWS
PROPRIETARY FUNDSYear ended June 30, 2016
(amounts expressed in thousands)
Business-type Activities
Net cash provided (used) by capital and related financing activities
Appreciation (decrease) of fair value of investments

9
CITY OF TULSASTATEMENT OF FIDUCIARY NET POSITION
FIDUCIARY FUNDSJune 30, 2016
(amounts expressed in thousands)
clb 10/26/2016 ee 9/2/15Municipal Employees Retirement
PlanAgency Funds
ASSETS Cash and cash equivalents 5,854$ 5,577$ Contributions receivable 1,160 - Investment income receivable 326 - Investments: US Government obligations 40,989 - Corporate bonds 17,424 - Municipal bonds 97 - Preferred stock 581 - Common stock 23,369 - Foreign obligations 3,126 - Mutual funds 302,961 - Timber 17,526 -
Total assets 413,413 5,577
LIABILITIES Accounts payable and accrued liabilities 508 2,604 Deposits payable - 2,973 Total liabilities 508 5,577$
NET POSITION RESTRICTED FOR PENSIONS 412,905$
The notes to the financial statements are an integral part of this statement.

10
cmb 8/31/16Municipal Employees Retirement
Plan
ADDITIONSContributions: Employer 14,016$ Plan members 7,533
21,549 Investment Income: Net appreciation in fair value of investments 3,606 Interest 1,814 Dividends 1,329
6,749 Less: investment expense (1,227) Net investment income 5,522 Total additions 27,071
DEDUCTIONSBenefits 35,147 Refunds of contributions 1,179 Administrative expense 374 Total deductions 36,700
Net decrease in fiduciary net position (9,629)
NET POSITION RESTRICTED FOR PENSIONSBeginning of year 422,534
End of year 412,905$
The notes to the financial statements are an integral part of this statement.
(amounts expressed in thousands)
CITY OF TULSASTATEMENT OF CHANGES IN FIDUCIARY NET POSITION
FIDUCIARY FUNDSYear ended June 30, 2016

CITY OF TULSASTATEMENT OF NET POSITION
DISCRETELY PRESENTED COMPONENT UNITSJune 30, 2016
(amounts expressed in thousands)
cd 11/09/16 st 9/27/16 cmb 11/14/16
Tulsa TulsaMetropolitan Authority Other Total
Utility for Recovery Tulsa Component ComponentAuthority of Energy Airports Units Units
ASSETS Current assets:
Cash and cash equivalents 121,240$ 16,419$ 14,783$ 14,550$ 166,992$ Cash and cash equivalents - restricted 25,100 - 2,016 13,775 40,891 Investments - - - 2,788 2,788 Investments - restricted - - 200 - 200 Receivables, net 32,077 3,209 2,028 2,458 39,772 Inventories 1,770 - 1,480 661 3,911 Other current assets - - 415 1,645 2,060
180,187 19,628 20,922 35,877 256,614
Noncurrent assets:Cash and cash equivalents - restricted 85,530 - 14,141 3,868 103,539 Investments - - 2,355 814 3,169 Investments - restricted 10,409 - 18,579 - 28,988 Advances to primary government 12 - 127 - 139 Receivables, net 12 - 687 16,479 17,178 Land held for resale, net - - - 661 661 Equity interest in joint ventures 17,944 - - - 17,944 Other noncurrent assets - - 415 - 415 Nondepreciable capital assets 99,282 - 188,951 11,547 299,780 Depreciable capital assets, net 1,121,722 10,647 211,007 48,146 1,391,522
1,334,911 10,647 436,262 81,515 1,863,335Total assets 1,515,098 30,275 457,184 117,392 2,119,949
DEFERRED OUTFLOW OF RESOURCESDeferred charge on refunding 2,212 - 6,309 476 8,997 Pension related amounts 20,795 1,811 4,848 4,461 31,915 Total deferred outflow of resources 23,007 1,811 11,157 4,937 40,912
LIABILITIES Current liabilities:
Accounts payable and accrued liabilities 19,393 1,446 5,922 1,939 28,700Unearned revenue - - 477 399 876Current portion of long-term liabilities 35,689 188 8,100 1,879 45,856Advances from primary government - 1,372 - - 1,372 Deposits subject to refund - restricted 10,692 - 40 - 10,732
65,774 3,006 14,539 4,217 87,536
Noncurrent liabilities:Advances from primary government - 3,080 - 326 3,406Deposits subject to refund - - - 562 562 Long-term liabilities, net 479,643 5,697 179,900 23,989 689,229
479,643 8,777 179,900 24,877 693,197Total liabilities 545,417 11,783 194,439 29,094 780,733
DEFERRED INFLOW OF RESOURCESProperty tax revenue 3,535 - - 1,153 4,688 Pension related amounts 9,881 831 2,049 1,057 13,818 Deferred gain on refunding 116 - - - 116 Total deferred inflow of resources 13,532 831 2,049 2,210 18,622
NET POSITIONNet investment in capital assets 867,665 6,195 254,788 49,789 1,178,437Restricted for:
Debt service 13,494 - 667 2,276 16,437Capital projects - - 2,513 14,154 16,667Other purposes - - 6,104 17,357 23,461
Unrestricted 97,997 13,277 7,781 7,449 126,504Total net position 979,156$ 19,472$ 271,853$ 91,025$ 1,361,506$
The notes to the financial statements are an integral part of this statement.11

CITY
OF
TULS
AST
ATE
MEN
T O
F A
CTIV
ITIE
SD
ISCR
ETEL
Y PR
ESEN
TED
CO
MPO
NEN
T U
NIT
SYe
ar e
nded
Jun
e 30
, 201
6(a
mou
nts
expr
esse
d in
tho
usan
ds)
Net
(Exp
ense
) Rev
enue
and
Prog
ram
Rev
enue
s C
hang
es in
Net
Pos
ition
Ope
ratin
gCa
pita
l
Func
tions
/Pro
gram
sEx
pens
esCh
arge
s fo
r Se
rvic
esG
rant
s an
d Co
ntrib
utio
nsG
rant
s an
d Co
ntrib
utio
nsO
ther
Tota
lCl
ean
wat
er a
nd w
aste
wat
er s
yste
ms
172,
933
$
21
1,30
7$
-
$
16,2
17$
54
,591
$
-$
-$
-
$
54,5
91$
Re
fuse
col
lect
ion
and
disp
osal
24,7
5126
,599
-
-
-
1,
848
-
-
1,84
8
Ai
rpor
t ser
vice
s46
,345
32,3
05
8,62
2
4,09
6
-
-
(1,3
22)
-
(1,3
22)
Oth
er32
,185
13
,642
6,
995
3,
660
-
-
-
(7,8
88)
(7
,888
)
27
6,21
4$
283,
853
$
15,6
17$
23
,973
$
54,5
91
1,
848
(1,3
22)
(7
,888
)
47,2
29
Gen
eral
reve
nues
:Ta
xes:
Sa
les
taxe
s-
-
-
492
492
Prop
erty
taxe
s2,
729
-
-
1,30
8
4,
037
Fund
ing
from
prim
ary
gove
rnm
ent
-
-
-
7,
183
7,18
3
In
vest
men
t ear
ning
s
1,
750
21
4
506
390
2,86
0
M
isce
llane
ous
-
-
-
22
0
22
0
Gai
n on
dis
posa
l of c
apita
l ass
ets
79
-
-
-
79
To
tal g
ener
al re
venu
es4,
558
21
4
506
9,59
3
14
,871
Chan
ge in
net
pos
ition
59,1
49
2,
062
(816
)
1,
705
62,1
00
N
et p
ositi
on, b
egin
ning
of y
ear
920,
007
17,4
10
27
2,66
9
89
,320
1,
299,
406
Net
pos
ition
, end
of y
ear
979,
156
$
19,4
72$
27
1,85
3$
91
,025
$
1,
361,
506
$
The
note
s to
the
fina
ncia
l sta
tem
ents
are
an
inte
gral
par
t of
thi
s st
atem
ent.
Tuls
a M
etro
polit
an
Util
ity
Auth
ority
Tuls
a Au
thor
ity f
or
Reco
very
of
Ener
gyTu
lsa
Airp
orts
12

CITY OF TULSANOTES TO BASIC FINANCIAL STATEMENTS June 30, 2016 (dollar amounts expressed in thousands)
FN - 1
The City of Tulsa, Oklahoma (the “City”), is an Oklahoma municipal corporation governed by an elected mayor and nine-member council. The financial statements of the City are prepared in accordance with Generally Accepted Accounting Principles in the United States of America (“U.S. GAAP”) as promulgated by the Governmental Accounting Standards Board (“GASB”), the standard-setting body for governmental accounting and financial reporting. Governmental accounting standards require reasonable separation between the primary government (including its blended component units) and its discretely presented component units, both in the financial statements and in the related notes and required supplementary information. Because the discretely presented component units, although legally separate, have been and are operated as if each is part of the primary government, there are limited instances where special note reference or separation will be required. If no separate note reference or categorization is made, the user should assume that information presented is equally applicable. New Pronouncements - The City implemented the following GASB Statement effective for the year ended June 30, 2016: GASB Statement No. 72 –
This Statement addresses accounting and financial reporting issues related to fair value measurements. The definition of fair value is the price that would be received to sell an asset or paid to transfer a liability in an orderly transaction between market participants at the measurement date. This Statement provides guidance for determining a fair value measurement for financial reporting purposes. This Statement also provides guidance for applying fair value to certain investments and disclosures related to all fair value measurements.
A. REPORTING ENTITY The accompanying financial statements present the government and its component units, entities for which the City is considered to be financially accountable. A blended component unit, although a legally separate entity, is, in substance, part of the City’s operations and so data from the blended component unit is combined with data of the City, the primary government. An entity is reported as a blended component unit when it meets one of the following criteria as defined by GASB:
Substantively the same governing body and a financial benefit or burden; substantively the same governing body and operational responsibility; Almost exclusive service or benefit to the primary government; Total debt of the component unit repayable almost entirely from resources of primary government. When none of these criteria are met, the entity is presented as a discretely presented component unit. A discretely presented component unit, on the other hand, is reported in a separate column in the combined financial statements to emphasize that it is legally separate from the City. 1. Blended Component Units The Tulsa Public Facilities Authority (“TPFA”) - Trustees of TPFA are appointed by the Mayor and approved by the City Council. Although it is legally separate from the City, TPFA is reported as if it were part of the primary government because its primary purposes are to issue revenue bonds to finance major capital improvements and manage certain properties on behalf of the City. Financing activities of this fund are included as an internal service fund and enterprise activities are included as enterprise funds.
Tulsa Stadium Trust (“TST”) – A public trust created to acquire, construct, own, operate and maintain a baseball stadium in downtown Tulsa and related amenities and facilities, and to incur indebtedness. Debt issuance requires the approval of two-thirds of the Tulsa City Council. The City is the sole beneficiary of the TST. The Mayor of the City is ex-officio trustee and eight additional trustees are appointed by the Mayor and approved by the City Council. The City is obligated for the debt of TST through the collection of special assessments. The activity of TST is reported as a major enterprise fund.
2. Discretely Presented Component Units
Major discretely presented component units: Tulsa Metropolitan Utility Authority (“TMUA”) - A public trust created to provide for a clean water utility systemand a wastewater utility system. Trustees are appointed by the Mayor and confirmed by the City Council. The City is the sole beneficiary of the trust and will receive all trust properties and resulting revenues upon retirement of all trust indebtedness. The City provides staffing for the operations of TMUA and acts as a collection agent by collecting TMUA’s utility revenues as a part of the City’s utility billing system.

CITY OF TULSANOTES TO BASIC FINANCIAL STATEMENTS June 30, 2016 (dollar amounts expressed in thousands)
FN - 2
Tulsa Authority for Recovery of Energy (“TARE”) - A public trust created to provide a system of collection, transportation and disposal of solid waste. Trustees are appointed by the Mayor and confirmed by the City Council. The City provides staffing for the operations of TARE and acts as a collection agent by collecting TARE utility revenues as a part of the City’s utility billing system.
Tulsa Airports - Tulsa Airports Improvement Trust (“TAIT”) was created to operate, maintain and finance capital improvements at the City’s two airports, Tulsa International and Richard L. Jones, Jr. Airports, and to finance capital improvements. Trustees are appointed by the Mayor and confirmed by the City Council. The City is the sole beneficiary of the trust.
Other discretely presented component units: Tulsa Development Authority (“TDA”) - A public authority created to finance urban renewal, rehabilitation and redevelopment. Commissioners of TDA are appointed by the Mayor and confirmed by the City Council. The Cityapproves urban renewal plans.
Metropolitan Tulsa Transit Authority (“MTTA”) - A public trust created to provide public transportation systems and facilities. The Mayor appoints trustees of MTTA. The City is the sole beneficiary and finances a significant portion of the annual operations. MTTA cannot incur indebtedness in excess of $100 within a year without the City’s approval.
Tulsa Industrial Authority (“TIA”) - A public trust created to provide for the issuance of industrial development bonds upon approval by the City Council, and to lend the proceeds of such issuance to third party organizations. The bonds do not constitute debt of the City and are collateralized solely by the revenues of the borrowing organizations upon whose behalf the bonds are issued. The Mayor is an ex-officio trustee and seven additional trustees are appointed by the Mayor and confirmed by the City Council.
Tulsa Parking Authority (“TPA”) - A public trust created by the City to construct and manage various parking facilities within the City. Trustees of TPA consist of the Mayor and four trustees who are appointed by the Mayor and confirmed by the City Council. The City provides certain resources to TPA. The City is the sole beneficiary of TPA and will receive the remaining assets of TPA upon termination.
Tulsa Performing Arts Center Trust (“TPACT”) - A public trust created to assist the City in operating the Tulsa Performing Arts Center and to sponsor events promoting
the use of the Tulsa Performing Arts Center. Trustees are appointed by the Mayor and confirmed by the City Council. The City is the sole beneficiary of the Trust.
Separate financial statements for the individual component units are available upon request to the Office of the Controller, 175 East 2nd Street, Suite 575, Tulsa, OK 74103. B. JOINT VENTURES AND RELATED
ORGANIZATIONS 1. Joint Ventures A joint venture is a legal entity or other organization that results from a contractual agreement and that is owned, operated, or governed by two or more participants as a separate and specific activity subject to their joint control and in which the participants retain (a) an ongoing financial interest or (b) an ongoing financial responsibility. The City participates in the following joint ventures: Emergency Medical Services Authority (“EMSA”) - EMSA is a public trust created to provide emergency medical care and transportation and is governed by a ten-member board composed of five appointees from the City and five from other Oklahoma cities and towns. In accordance with the joint venture agreement, Tulsa and Oklahoma City are entitled to their respective share of annual operating income or loss. The City’s equity interest in EMSA is $11,162. Complete financial statements for EMSA can be obtained from EMSA’s Chief Financial Officer, 1417 North Lansing, Tulsa, Oklahoma 74106.
River Parks Authority (“RPA”) – The City is a participant with Tulsa County (“County”) in a joint venture to operate and maintain a park along the Arkansas River. RPA, a public trust, was created for that purpose. The City and the County contribute to the annual operating budget of RPA. The Board of Trustees comprises seven members, three appointed by the City, three appointed by the County, and one by the Tulsa Metropolitan Area Planning Commission. The City and the County have no equity interest in the joint venture; therefore, no equity interest is reflected in the City’s financial Statements. Complete financial statements for RPA can be obtained from the Executive Director, 2424 E. 21st St., Suite 300, Tulsa Oklahoma 74114. Regional Metropolitan Utility Authority (“RMUA”) – The City is a participant with the Cities of Broken Arrow, Jenks, Bixby, and Owasso, Oklahoma, to operate a sewage treatment facility. Only the City and the City of Broken

CITY OF TULSANOTES TO BASIC FINANCIAL STATEMENTS June 30, 2016 (dollar amounts expressed in thousands)
FN - 3
Arrow, Oklahoma currently hold an equity interest in RMUA. The City contributes approximately one-half of the Authority’s annual operating and capital budget, and operates a facility for RMUA and leases the facility site to the Authority. The City appoints two of the ten trustees. The remaining trustees are appointed two each by the four other participating cities. RMUA’s treatment plant provides services to the City of Tulsa and the City of Broken Arrow at approximately equal amounts. Upon termination of the trust, the net position will be distributed to the beneficiaries based upon their pro rata interest. The City’s equity interest of $17,944 is reported in TMUA’s statement of net position. Complete financial statements for RMUA can be obtained from the Office of the Controller, 175 East 2nd Street, Suite 575, Tulsa, OK 74103. 2. Related Organizations The City’s officials are also responsible for appointing the board members of other organizations; however, the City’s accountability for those organizations does not extend beyond the making of appointments.
The following organizations are related organizations that are excluded from the reporting entity:
Tulsa Housing Authority (“THA”) - Commissioners of the Authority are appointed by the Mayor, however, the City does not provide funding, has no obligation for the debt issued by THA and cannot impose its will.
City of Tulsa/Rogers County Port Authority (“TRCPA”) - The City appoints six of the nine Board members of TRCPA. The City does not provide any funding to TRCPA.
Tulsa City-County Health Department (“TCCHD”) - The City appoints five of the nine TCCHD Board members. The City does not provide any funding to the TCCHD.
Tulsa City-County Library (“TCCL”) - The Tulsa City-County Library Board is composed of eleven members, of which the City appoints six. The City does not provide any funding to the TCCL.
Tulsa Municipal Airport Trust ("TMAT") - The Mayor is an ex-officio trustee and the additional four trustees are approved by the City Council. The City does not provide any funding to TMAT and has no obligation for the debt issued by TMAT.
3. Jointly Governed Organizations
The following organizations are jointly governed organizations that are excluded from the City’s reporting
entity. These organizations are not a joint venture because the City does not retain an on-going financial interest or an on-going financial responsibility. The City, in conjunction with the County and other municipalities, has created the following organizations: Tulsa County Criminal Justice Authority (“TCCJA”) --The TCCJA was created for the purpose of acquiring a site and constructing, furnishing, equipping, operating, maintaining, remodeling and repairing a county jail and other detention facilities owned or operated by the County. TCCJA is administered by a seven person Board of Trustees comprising three Tulsa County Commissioners, the Mayor of the City of Tulsa (“ex-officio trustees”), and the mayors of three additional cities situated in whole or in part within the limits of Tulsa County. The City does not provide any funding to the TCCJA.
Tulsa County Vision 2025 Authority (“TCVA”) – The TCVA was created for the purpose of determining the use of County sales tax receipts in excess of capital improvements costs generally known as Vision 2025 projects throughout Tulsa County. TCVA is administered by a seven person Board of Trustees composed of three Tulsa County Commissioners, the Mayor of the City of Tulsa (“ex-officio trustees”), and the Mayors of three additional cities situated in whole or in part within the limits of Tulsa County. The City does not provide any funding to the TCVA.
C. GOVERNMENT-WIDE FINANCIAL STATEMENTS AND FUND FINANCIAL STATEMENTS
Government-wide financial statements and fund financial statements categorize activities as either governmental activities or business-type activities. In the government-wide statement of net position, both the governmental and business-type activities columns (a) are presented on a consolidated basis by column, and (b) are reflected, on a full accrual, economic resource basis, which incorporates long-term assets and receivables as well as long-term debt and obligations. The government-wide statement of activities reflects both the gross and net cost per functional category (public safety, public works, etc.), which are otherwise being supported by general government revenues (property taxes, sales and use taxes, certain intergovernmental revenues, etc.). The statement of activities reports gross expenses and related program revenues and operating and capital grants.

CITY OF TULSANOTES TO BASIC FINANCIAL STATEMENTS June 30, 2016 (dollar amounts expressed in thousands)
FN - 4
The program revenues must be directly associated with the function or a business-type activity. Program revenues include revenues from fines and forfeitures, licenses and permits fees, special assessment taxes, and charges for services. The operating grants include operating-specific and discretionary (either operating or capital) grants while the capital grants column reflects capital-specific grants. The net costs (by function or business-type activity) are normally covered by general revenues (sales taxes, franchise taxes, property taxes, intergovernmental revenues, interest income, etc.). This government-wide focus is more on the sustainability of the City as an entity and the change in aggregate financial position resulting from the activities of the fiscal period. Non-current assets and liabilities are reported in the governmental activities column in the government-wide statement of net position and are not reflected in the governmental funds balance sheet. In the fund financial statements the emphasis is on the major funds in either the governmental or business-type categories. Nonmajor funds (by category) or fund type are summarized into a single column. The enterprise fund statements will match the business-type activity column presented in the government-wide statements, other than the internal balances from the allocation of a portion of the internal service funds to business-type activities. The governmental funds financial statements are presented on a current financial resource and modified accrual basis of accounting. This presentation is deemed most appropriate to (a) demonstrate legal and covenant compliance, (b) demonstrate the source and use of liquid resources, and (c) demonstrate how the City’s actual experience conforms to the budget or fiscal plan. Since the governmental fund statements are presented on a different measurement focus and basis of accounting than the government-wide statements’ governmental column, a reconciliation is presented either on the fund statement or on the page following each statement which briefly explains the adjustments necessary to transform the fund-based financial statements into the governmental column of the government-wide presentation.
Internal service funds of a government (which traditionally provide services primarily to other funds of the government) are presented in the summary form as part of the proprietary fund financial statements. Since the principal users of the internal services are the City’s governmental activities, financial statements of internal service funds are consolidated into the governmental column when presented at the government-wide level. To the extent possible, the costs of these services are reflected in the appropriate functional activity (public safety, public works, etc.). The City’s fiduciary funds are presented in the fund financial statements by type (pension and agency). Since by definition these assets are being held for the benefit of a third party (other local governments, private parties, pension participants, etc.) and cannot be used to address activities or obligations of the City, these funds are not incorporated into the government-wide statements. D. BASIS OF PRESENTATION The financial transactions of the City are recorded in individual funds. The various funds are reported by generic classification within the financial statements. Major governmental and proprietary funds are determined based on relative size. Qualitative factors may provide influence in determining a fund be reported as major that would otherwise be classified as nonmajor. The General Fund is always considered major. Major discretely presented components are determined similarly, but no specific thresholds exist. Nonmajor funds are combined into a single column in the fund financial statements. Proprietary funds distinguish operating revenues and expenses from non-operating items. Operating revenues and expenses generally result from providing services and producing and delivering goods in connection with a proprietary fund’s principal on-going activity. Operating expenses include cost of sales and service, administrative expenses, and depreciation on capital assets. All revenues and expenses not meeting this definition are reported as non-operating revenues and expenses.

CITY OF TULSANOTES TO BASIC FINANCIAL STATEMENTS June 30, 2016 (dollar amounts expressed in thousands)
FN - 5
1. Governmental Funds – The City reports the following major governmental funds:
General Fund is the general operating fund of the City. It is used to account for all financial resources except those required to be accounted for in another fund. Debt Service Fund accounts for the accumulation of resources for the payment of general long-term debt and judgments. The City levies annually an ad valorem tax restricted for the retirement of general obligation bonds and judgments along with their associated interest.
Bond Fund accounts for capital improvements that are financed by the City’s general obligation bond issues, excluding those accounted for in proprietary funds (Capital projects fund).
Sales Tax Fund accounts for those capital improvements that are financed by a one-cent sales tax (Capital projects fund).
2. Proprietary Funds are accounted for on the flow of economic resources measurement focus and use the accrual basis of accounting. Under this method, revenues are recorded when earned and expenses are recorded at the time liabilities are incurred. The City reports the following proprietary funds:
Enterprise Funds are used to report activities for which a fee is charged to external users for goods and services. In the entity-wide financial statements, these enterprise funds are combined into a single, aggregated presentation as business-type activities. The City reports the following major enterprise funds: Stormwater Management Fund accounts for a special stormwater utility fee and other revenue dedicated to improving the City’s stormwater drainage system.
One Technology Center Fund, a blended TPFA fund, accounts for the operation of the One Technology Center, a 15-story building in downtown Tulsa. The building is occupied by the City of Tulsa and other commercial tenants. Arena and Convention Centers Fund, a blended TPFA fund, accounts for the operation of the Arena and Convention Center; both are sports and entertainment facilities in downtown Tulsa.
Tulsa Stadium Trust, a blended component unit, created to acquire, construct, own, operate and maintain a baseball stadium in downtown Tulsa and related amenities and facilities, and to incur indebtedness.
Internal Service Funds accounts for employee health benefits, risk management services, vehicle and equipment services, print services and financing.
Employee Insurance Fund accounts for the collection and payment of health, dental, life and long term disability insurance premiums as well as workers’ compensation medical claims and administrative expenses. Equipment Management Fund accounts for the maintenance and repair of licensed motor vehicles and fees charged to other departments. Office Services Fund accounts for office supplies and reproduction services and fees charged to user departments. Tulsa Public Facilities Authority issues debt and the proceeds may be loaned to the City or to other component units.
3. Fiduciary Funds – The pension trust fund accounts for the general municipal employees’ retirement trust. The agency fund accounts for monies held on behalf of others.
Pension Trust Fund accounts for the activities of the Municipal Employees Retirement Plan (MERP), which accumulates resources for pension benefit payments to qualified retirees. MERP is a cost-sharing multiple-employer defined benefit pension trust. Agency Funds account for resources held by the City in a purely custodial capacity (assets equal liabilities) and include Municipal Court Bonds, Escrow Fund, Police Property Room, Payroll Withholdings, Unclaimed Property and PAC Ticket Office Escrow.
E. BASIS OF ACCOUNTING Basis of accounting refers to the point at which revenues or expenditures/expenses are recognized in the accounts and reported in the financial statements. It relates to the timing of the measurements made, regardless of the measurement focus applied.

CITY OF TULSANOTES TO BASIC FINANCIAL STATEMENTS June 30, 2016 (dollar amounts expressed in thousands)
FN - 6
The government-wide financial statements and the proprietary, fiduciary and component unit fund financial statements are presented on an accrual basis of accounting. The governmental funds in the fund financial statements are presented on a modified accrual basis. Accrual – Revenues are recognized when earned and expenses are recognized when incurred. Modified Accrual – All governmental funds are accounted for using the modified accrual basis of accounting. Under the modified accrual basis of accounting, revenues are recorded when susceptible to accrual; i.e., both measurable and available. “Measurable” means the amount of the transaction can be determined. "Available" means collectible within the current period or soon enough thereafter to be used to pay liabilities of the current period. The City defined the length of time used for “available” for purposes of revenue recognition in the governmental fund financial statements to be 60 days. Expenditures are generally recognized under the modified accrual basis of accounting when the related liability is incurred. The exceptions to this general rule are long-term liabilities and related interest, if any, are recognized when due. In applying the “susceptible to accrual” concept to intergovernmental revenues the provider should recognize liabilities and expenses and the recipient should recognize receivables and revenue when the applicable eligibility requirements, including time requirements, are met. Resources transmitted before the eligibility requirements are met should, under most circumstances, be reported as advances by the provider and as unearned revenue by the recipient. Fair Value Measurements – Fair value is the price that would be received to sell an asset or paid to transfer a liability in an orderly transaction between market participants at the measurement date. Fair value is a market-based measurement, not an entity-specific measurement. For some assets and liabilities, observable market transactions or market information might be available; for others, it might not be available. However, the objective of a fair value measurement in both cases is the same—that is, to determine the price at which an orderly transaction to sell the asset or to transfer the liability would take place between the market and participants at the measurement date under current
market conditions. Fair value is an exit price at the measurement date from the perspective of a market participant that controls the asset or is obligated for the liability. F. ASSETS, LIABILITIES AND NET POSITION
1. Cash and Cash Equivalents The City Charter requires all cash belonging to the City to be placed in the custody of the City Treasurer. Certain component units participate in the City’s pooled cash for non-restricted cash and investments. A “Pooled Cash” concept is used in maintaining the cash and investment accounts in the accounting records. Under this method, all cash is pooled for investment purposes and each fund and participating component unit have equity in the pooled amount. All amounts included in the pooled cash and investment accounts are reported as cash and cash equivalents in the fund financial statements because the City and participating component units are able to withdraw cash at any time without prior notice or penalty. In the government-wide financial statements, the pooled cash and investment accounts are reported as cash, cash equivalents and investments. For purposes of the statement of cash flows, the City, considers cash and cash equivalents (including restricted cash and cash equivalents) to be currency on hand, demand deposits with banks, amounts included in pooled cash and investment accounts and liquid investments held outside the pooled fund with a maturity of three months or less when purchased. 2. Investments Investments are stated at fair value. The change in the fair value of investments is as follows:
Governmental activities 1,608$
Business-type activities 161
Net increase in fair value 1,769$

CITY OF TULSANOTES TO BASIC FINANCIAL STATEMENTS June 30, 2016 (dollar amounts expressed in thousands)
FN - 7
3. Accounts Receivable and Taxes Receivable Accounts receivable and taxes receivable are shown at net realizable value. The allowance for general government accounts receivable is derived from the age of the individual receivable with age categories ranging from 30 days past due to three years past due. Uncollectible percentages by revenue category are derived using historical write-off experience and range from 1% to 62%, as well as consideration of current expectations and economic considerations. In the current year $1,834 of accounts receivable were written-off. The allowance for utility services accounts receivable reported in the component units and enterprise funds is derived from the age of the individual receivable. An allowance is established at one-half of the active accounts over 90 days from date of billing plus 100% of the closed accounts over 90 days from date of billing, based on historical experience as well as current expectations. 4. Inventories Parts and supplies inventories - are stated at cost (specific identification or first-in, first-out basis), which is not in excess of market. Inventories consist primarily of materials and supplies held for consumption. The cost is recorded as an expense at the time individual inventory items are used. Land held for resale - Land acquired for rehabilitation and held for resale by the City is recorded at the lower of cost or net realizable value (specific identification basis). The cost of land acquired and held for resale by the City at year end amounted to $2,400 and was carried at the lower of cost or net realizable value of $2,400. $44 of the land is considered current and included in inventories on the Statement of Net Position, and is also reported in the governmental funds as it is considered a current financial resource. The remaining $2,356 is noncurrent. 5. Internal Balances Amounts reported in the fund financial statements as interfund receivables and payables are eliminated in the entity-wide governmental and business-type activities columns of the statement of net position, except for the net residual amounts due between governmental and business-type activities, which are presented as internal balances. Within the governmental fund financial statements, advances to other funds are equally offset by a Nonspendable fund balance that indicates they do not constitute available spendable resources.
Due To/Due From – Amounts which are due within one year and owed to one fund or component unit by another are reported as due to other funds or component units.
Advances To/From Other Funds – Amounts which are not due within one year and owed to one fund or component unit by another are reported as advances to/from other funds or component units. 6. Laboratory Facility Use Lease The City is a party to an agreement with the Oklahoma Board of Regents whereby the City leases from the Oklahoma Board of Regents office and laboratory facilities for a term of 50 years. The lease terms call for the City to pay a proportionate share of the design and construction costs of the facility and, in turn, the City has the right to use the facilities until the expiration of the lease on June 30, 2058. The lease costs are amortized over the life of the lease. The lease with a carrying value of $14,090, net of amortization, is reflected in other assets on the Government-wide Statement of Net Position. 7. Capital Assets
Capital assets purchased or acquired are carried at historical cost or estimated historical cost. Contributed assets are recorded at acquisition cost as of the date of the contribution. Additions, improvements and other capital outlays that significantly extend the useful life of an asset are capitalized whereas costs incurred for repairs and maintenance are expensed as incurred. Depreciation or amortization of capital assets is calculated using the straight-line basis over the following estimated useful lives:
Estimated Service Life
Buildings 20-50 years 5$ Land improvements 20-30 years 5 Equipment 2-50 years 5 Water & sewer lines 33-100 years 5 Intangible assets Indefinite 5 Streets 25 years 100 Bridges 50 years 100
Capitalization Threshold

CITY OF TULSANOTES TO BASIC FINANCIAL STATEMENTS June 30, 2016 (dollar amounts expressed in thousands)
FN - 8
The City owns a collection of art housed in the Gilcrease Museum. The collection is not capitalized because it meets all the following conditions:
The collection is held for reasons other than financial gain. The collection is protected, kept unencumbered, cared for, and preserved. The collection is subject to an organizational policy requiring that the proceeds from sales of collection items be used to acquire other items for collections.
8. Interest Capitalization Interest is capitalized in proprietary funds and discretely presented component units on assets acquired with tax-exempt debt. Interest incurred during the construction phase of capital assets is included as part of the capitalized value of the assets constructed. Component units capitalized net interest cost in the amount of $3,316 related to tax exempt financing for capital construction projects during the year. 9. Privately Funded Public Improvements Watermain Extension Contracts - TMUA contracts with various developers for the construction of watermains to provide water service to areas under development. Upon completion, the new watermains become an extension of the City’s existing water distribution system. The contract with the developers provides that the developers initially pay for all construction costs. Repayments to the developers are generally limited to 40% of the collected revenues generated by the respective watermain extension, not to exceed the total cost as defined in the contract.
The contracts are payable over a ten-year period, andare non-interest bearing. TMUA has no liability after the ten-year period if the respective revenues generated are insufficient to cover the developers’ costs. Historically, revenues generated within the ten-year period have been sufficient to permit recovery of the total costs incurred for the respective watermain extensions.
The liability for watermain extension contracts is $3,364 as of year end. Annual payments of $366 are due in accordance with these contracts. Water and Sewer Line Extensions – Contributions from area developers to TMUA during the year totaled $10,035.
10. Restricted Assets Certain debt proceeds as well as certain resources set aside for their repayment, are classified as restricted assets in the statements of net position because their use is limited by applicable bond covenants. Stormwater fees in lieu of detention are paid by developers in lieu of constructing on-site detention facilities. The in lieu fees are collected and spent on a regional basis as a more effective method of stormwater management. These funds are restricted because their use is restricted by City Ordinance to stormwater drainage basin improvements. 11. Bond Premiums and Discounts In the governmental funds, bond premiums and discounts are treated as other financing sources or uses in the year of issuance. In proprietary funds, bond premiums and discounts are capitalized and amortized over the term of the bonds using the effective interest method. Bond premiums and discounts are presented as additions and reductions of the face amount of the revenue bonds payable. As part of the reconciliation and presentation at the government-wide level premiums and discounts in the governmental funds are adjusted and reflected similarly to proprietary funds. 12. Encumbrances – Budgetary Statements Encumbrance accounting, under which purchase orders, contracts and other commitments for the expenditure of monies are recorded in order to reserve that portion of the applicable appropriation, is employed as an extension of formal budgetary integration in the funds. Other commitments include encumbrances that have been established for future planned expenditures where the purpose is known but a specific contract with a vendor has not yet been finalized.

CITY OF TULSANOTES TO BASIC FINANCIAL STATEMENTS June 30, 2016 (dollar amounts expressed in thousands)
FN - 9
13. Fund Balances Fund balances for governmental funds are reported in classifications that comprise a hierarchy based primarily on the extent to which the City is bound to honorconstraints on the specific purposes for which amounts in those funds can be spent. The categories and their purposes are:
Nonspendable fund balance includes amounts that cannot be spent because they are either (a) not in spendable form or (b) legally or contractually required to be maintained intact.
Restricted fund balance The portion of fund balance which is constrained for specific purposes which are externally imposed by bond covenants, grants, providers, or amounts constrained due to constitutional provisions or enabling legislation.
Committed fund balance The committed portion of fund balance can only be used for the specific purposes imposed by ordinance. An ordinance is formal action of the City’s highest level of decision-making authority, which is enacted by a majority vote of the City Council and approved by the Mayor. Once adopted, the commitment remains in place until a similar action is taken to modify or rescind the commitment.
Assigned fund balance The assigned portion of fund balance is constrained by the City’s intent to use for specific purposes, but are neither restricted nor committed. Assigned fund balance includes resources that will be used to liquidate encumbrances related to purchase orders and contracts payable from assigned resources. The ordinance containing the annual budget, approved by City Council and the Mayor, includes the authority to carryover encumbered amounts from prior year appropriations.
Unassigned fund balance – The unassigned portion of fund balance is not otherwise restricted, committed, or assigned to specific purposes. The General Fund is the only fund that reports a positive unassigned fund balance. In other governmental funds, if expenditures incurred for a specific purpose exceed the amounts restricted, committed, or assigned to those purposes, they may report a negative unassigned fund balance.
Spending Policy of Governmental Funds - The City receives inflows from revenue and other financing sources from numerous sources for use in the General Fund and other governmental funds. These Funds will expend those resources on multiple purposes of the local government. The intention of this spending policy is to identify the expenditure order of resource categories for the governmental funds.
When both restricted and unrestricted resources are available in the governmental funds, the following spending policy will apply:
1st - Restricted 2nd - Committed 3rd - Assigned 4th - Unassigned
Minimum Fund Balance Policy – The City has a minimum fund balance policy which applies to the General Fund, where by an operating reserve is set and maintained at 6.39% of General Fund revenues. This operating reserve is set forth in the ordinance adopting the City’s annual budget. 14. Net Position In the government-wide and proprietary fund financial statements, equity (Net Position) is displayed in three components as follows:
– This consists of capital assets, net of accumulated depreciation plus deferred inflows/outflows of resources less the outstanding balances of any bonds, notes, or other borrowings attributable to the acquisition, construction, or improvement of those assets.
– This consists of net position that is legally restricted by outside parties or by law through constitutional provisions or enabling legislation. Net position restricted by enabling legislation is $218,752. When both restricted and unrestricted resources are available for use, it is the City’s policy to use restricted resources first, then unrestricted resources as they are needed.
– This consists of net position that does not meet the definition of “restricted” or “net investment in capital assets.”

CITY OF TULSANOTES TO BASIC FINANCIAL STATEMENTS June 30, 2016 (dollar amounts expressed in thousands)
FN - 10
15. Stabilization Arrangement
The City Charter established a stabilization arrangement. This stabilization arrangement provides that if the City Treasurer projects that total General Fund revenues for the upcoming budget year will exceed the total General Fund revenues for the current budget year by more than four percent (4%), the budget submitted by the Mayor and approved by the City Council shall allocate fifty percent (50%) of the excess General Fund revenues to the Economic Stabilization Reserve. If the City Treasurer projects that total General Fund revenues for the upcoming budget year will either (a) be less than the current budget year's total General Fund revenues, or (b) be less than the highest of any other previous year's total General Fund revenues, the budget submitted by the Mayor and approved by the Council may appropriate up to fifty percent (50%) of the current balance in the Economic Stabilization Reserve, but no more than the shortfall in total General Fund revenues as determined above, to be used for any lawful municipal purpose in the upcoming budget year. For purposes of calculating any shortfall: 1. If the trigger for withdrawal from the Reserve is not met in the current budget year, the City Treasurer shall calculate the shortfall for the upcoming budget year by subtracting the total projected General Fund revenues for the upcoming budget year from the total projected General Fund revenues for the current budget year. 2. If the trigger for withdrawal from the Economic Stabilization Reserve is met in the current budget year, the shortfall shall be calculated by subtracting the total projected General Fund revenues for the upcoming budget year from the highest of any previous year's total General Fund revenues. The balance in the Economic Stabilization Reserve is $2,000. G. DEFERRED OUTFLOWS OF RESOURCES AND
DEFERRED INFLOWS OF RESOURCES Deferred outflows of resources - In addition to assets, the statement of net position reports in a separate section, deferred outflows of resources. This separate financial statement element, deferred outflows of resources, represents a consumption of net position that applies to a future period(s) and so will not be recognized as an outflow of resources (expense/expenditure) until then. The City reports two items in this category. The first
is for pension items related to the recording of the net pension liability. The second is the deferred charge on refunding reported in the government-wide statement of net position. A deferred charge on refunding results from the difference in the carrying value of refunded debt and its reacquisition price. This amount is deferred and amortized over the shorter of the life of the refunded or refunding debt. Deferred inflows of resources - In addition to liabilities, the financial statements include a separate section for deferred inflows of resources. This separate financial statement element, deferred inflows of resources, represents an acquisition of net position in government-wide financial statements and an acquisition of fund balance in governmental funds, that applies to a future period(s) and so will not be recognized as an inflow of resources (revenue) until that time. The City reports three types of unavailable revenue items, which arise under a modified accrual basis of accounting and qualify for reporting as deferred inflows. Accordingly, these items are reported in the governmental funds balance sheet. The governmental funds report unavailable revenues from three sources: property taxes, special assessments and federal and/or state grant revenues. These amounts are deferred and recognized as an inflow of resources in the period that the amounts become available. In the City’s government-wide statements only the property tax revenues remain as a deferred inflow under the full accrual basis of accounting and will become an inflow in the year for which they are levied. The government-wide Statement of Net Position reports two additional deferred inflows not reported under the modified accrual basis. First is for pension items related to the recording of the net pension liability. The second item, deferred gain on refunding, results from the refunding of debt. H. REVENUES, EXPENSES AND EXPENDITURES Identification of Major Revenue Sources Susceptible to Accrual - In the Governmental Funds, property taxes, sales taxes, franchise taxes, licenses, intergovernmental grants, and interest associated with the current fiscal period are all considered to be susceptible to accrual and have been recognized as revenues of the current fiscal period. All other revenue items are considered to be measurable and available only when the government receives cash. Expenditures are recognized when the related fund liability is incurred except for the following, which are

CITY OF TULSANOTES TO BASIC FINANCIAL STATEMENTS June 30, 2016 (dollar amounts expressed in thousands)
FN - 11
permitted by generally accepted accounting principles: General obligation long-term debt principal and interest, judgments, compensated absences, pension and other benefits, and other long-term liabilities are reported only when due in the governmental funds. 1. Sales Tax Revenue The City levies a 3.10% sales tax which is collected monthly by the State of Oklahoma and remitted to the City. The General Fund receives 2% for operations and the remaining 1.10% is placed into Sales Tax Funds and is restricted for capital improvements. The tax is collected by the merchants and remitted to the State. The City receives its tax receipts from the State by the 10th of each month. Vendors owing an average of $2.5 or more per month to the State are required to remit actual taxes collected plus an estimate of tax collections for the first 15 days of the following month with remittance due by the 20th of that same month. All other vendors are required to remit the actual amount collected (without any estimated tax collections) by the 20th of the following month. Sales tax revenue is recognized in the period when the underlying exchange transaction occurs and the resources are available. 2. Property Tax Revenue Oklahoma statutes require that the City make a property tax levy for a sinking fund (Debt Service Fund) which shall, with cash and investments in the fund, be sufficient to pay all the bonded indebtedness, interest and one-third of all outstanding judgments coming due in the following fiscal year. On or before August 27th of each year, the City submits its sinking fund requirements to the County Excise Board who determines the property tax levy. The County Assessor is required to file a tax roll report on or before October 1st each year with the County Treasurer indicating the net assessed valuation for all real and public service property. The Oklahoma Tax Commission determines property assessed valuations. The assessment ratio in Tulsa County averages 11% of market value. Property tax is levied each October 1st on the assessed valuation of non-exempt real property located in the City as of the preceding January 1st, the lien date. Property taxes are due on November 1st following the levy date, although they may be paid in two equal installments (if the first installment is paid prior to January 1st, the second installment is not delinquent until
April 1st). Property taxes are collected by the County Treasurers of Tulsa, Wagoner and Osage Counties, Oklahoma, and are remitted to the City. Property tax receivables are recorded on the lien date, although the related revenue is reported as a deferred inflow of resources and will not be recognized as revenue until the year for which it is levied. 3. Arena Revenues – Naming Rights, Sponsorships Revenues derived from naming rights and sponsorships are recognized over the life of the agreement, generally 3 to 20 years. Unearned revenue is recorded for amounts received to the extent they exceed amounts earned. Naming rights and sponsorship revenue of $2,080 has been recognized in the current year. 4. Grant Revenue The City is a recipient of grant revenues and recognizes revenues, net of estimated uncollectible amounts, when all applicable eligibility requirements are met. Resources received before eligibility requirements are met are reported as unearned revenues. Some grants and contributions consist of capital assets or resources that are restricted for capital purposes – to purchase, construct, or renovate capital assets associated with a specific program. These are reported separately from grants and contributions that may be used either for operating expenses or for capital expenditures of the program at the discretion of the City. 5. Commercial Lease Revenue TPFA owns a building in downtown Tulsa known as the One Technology Center. The building contains approximately 630,000 square feet of office space. The City leases approximately 230,000 square feet and 257,000 square feet is available for commercial leasing. Additionally, 143,000 square feet of space is leased under a capital lease through 2029. Lease revenue recognized in the current year from private business leasing was $3,080. 6. Investment Income
Investment income from pooled cash and investments is allocated monthly based on the percentage of a fund’s average daily equity in pooled cash and investments to the total average daily pooled equity in pooled cash and investments. Investment earnings and losses from the special revenue, agency, debt service, and bond funds are reported as investment earnings of the general fund and totaled $2,700 for the current year.

CITY OF TULSANOTES TO BASIC FINANCIAL STATEMENTS June 30, 2016 (dollar amounts expressed in thousands)
FN - 12
7. Unearned Revenue
Unearned revenue represents payments and/or revenue received but not yet recognized since it has not been earned. Unearned revenue is composed primarily of money received for sponsorships and Federal and/or State grants in advance of services to be provided. 8. Interfund Transactions Interfund transactions are loans, services provided, reimbursements or transfers. Loans are reported as receivables and payables as appropriate and are subject to elimination upon consolidation. Services, deemed to be reasonably equivalent in value, are reported as revenues and expenditures/expenses. Reimbursements are when one fund incurs a cost, charges the appropriate benefiting fund and reduces its related cost as a reimbursement. All other interfund transactions are reported as transfers. Transfers within governmental activities or within business-type activities are eliminated upon consolidation in the government-wide statements. 9. Payments Between the Primary Government and Component Units Resource flows (except those that affect the statement of net position/balance sheet only, such as loans and repayments) between a primary government and its discretely presented component units are reported as external transactions—that is, as revenues and expenses. Resource flows between the primary government and blended component units are classified as internal activity and capital contributions in the financial statements. Payments to component units are primarily subsidized funding for capital construction projects financed with sales tax revenues for the benefit of the component units. In addition, the City pays an operating subsidy to MTTA for bus and other transportation services. The General Fund receives payments in lieu of taxes from TMUA and TARE and reports these payments as revenue. These amounts are not reasonably equivalent in value to the services provided. TMUA and TARE report these payments as expenses in their statement of activities. Below is a summary of significant transactions between the Primary Government and discretely presented component units:
Payment From To Purpose
7,183$ General Fund MTTA Operating subsidy
6,049 Sales Tax Fund TMUA For capital acquisitions
273 Sales Tax Fund MTTA For capital acquisitions
2,040 Sales Tax Fund TDA For capital acquisitions
12,436 TMUA General Fund Payments in lieu of taxes
1,613 TARE General Fund Payments in lieu of taxes
10. Compensated Absences
Vacation and sick leave is granted to all regular and part-time employees. The City’s policy permits employees to accumulate earned but unused vacation and sick benefits. The annual amount of vacation time accrued varies from 14 to 26 days depending upon years of service. The maximum amount of vacation time that may be accumulated is twice the amount which may be earned in one calendar year. The liability for sick leave consists of unpaid, accumulated annual and sick leave balances. The liability has been calculated using the vesting method, in which leave amounts for both employees who currently are eligible to receive separation payments and other employees who are expected to become eligible in the future to receive such payments upon separation are included. The liability for such leave is reported as incurred in the government-wide and proprietary fund financial statements. A liability for those amounts is recorded in the governmental funds only if the liability has matured as a result of employee resignations or retirements.
11. Post-Employment Benefits
Postemployment benefits are part of an exchange of salaries and benefits for employee services rendered. Of the total benefits offered to attract and retain qualified employees, some benefits, including salaries and active-employee healthcare, are taken while the employees are in active service, whereas other benefits, including retirement and postemployment healthcare, are taken after the employees’ services have ended. Nevertheless, both types of benefits constitute compensation for employee services. Pension and other postemployment benefit costs are accounted for on an accrual basis, charging expenses in the period incurred, with a corresponding liability for benefits to be paid in future periods along with deferred outflows of resources and deferred inflows of resources for pensions.

CITY OF TULSANOTES TO BASIC FINANCIAL STATEMENTS June 30, 2016 (dollar amounts expressed in thousands)
FN - 13
12. Operating Subsidies and Grants Subsidies and grants to proprietary funds, which finance either capital or current operations, are recorded as transfers. 13. Judgments Judgments (tort and workers’ compensation liabilities) rendered against the City are funded through subsequent property tax levies over a three-year period beginning with the first year following the judgment. These judgments are reported in the debt service fund. During the intervening time period from the time the judgment is rendered until the judgment is ultimately funded by the debt service fund, the City is permitted by state statutes to use funds available from a fund other than the debt service fund to pay the judgment creditor in full and effectively acquire in exchange, the judgment creditor’s rights to the future cash flows and interest earnings on those cash flows.
Under state statutes, three conditions must be met related to the judgments for the City to invest in its judgments:
1. A judgment is rendered, 2. By a court of record and, 3. The judgment is against the City
Under the City’s investment policy, the City uses available funds from its pooled cash and investments portfolio to purchase judgments as investments, just as it purchases treasury instruments and other permissible investments within its cash and investments portfolio. Accordingly, the City does not record interfund activity related to the above transactions.
I. USE OF ESTIMATES The preparation of financial statements in conformity with U.S. GAAP requires management to make estimates and assumptions that affect the amounts reported in the financial statements and accompanying footnotes. Actual results could differ from those estimates.

CITY OF TULSANOTES TO BASIC FINANCIAL STATEMENTS June 30, 2016 (dollar amounts expressed in thousands)
FN - 14
1. Net Position/Fund Balance Deficit
One Technology Center – This enterprise fund has a deficit net position of $5,528 resulting from operating income levels insufficient to cover costs. It is the City’s intent to secure additional revenues and manage expenses to manage the deficit.
Vision 2025 Capital Projects Fund – This nonmajor capital projects fund has a deficit fund balance of $165. The City will identify other funds that can be appropriately assigned in order to eliminate the deficit.

CITY OF TULSA NOTES TO BASIC FINANCIAL STATEMENTS June 30, 2016(dollar amounts expressed in thousands)
FN - 15
Custodial Credit Risk—City of Tulsa Policy:
Deposits - The City’s investment policy requires that demand deposits be collateralized at least by 110% of the amount that is not federally insured. An irrevocable letter of credit issued to the City, by the Federal Home Loan Bank of Topeka (FHLB), serves as collateral for the City’s cash deposits. Securities pledged as collateral are held by a third party. Joint custody safekeeping receipts are held in the name of the depository institution, but pledged to the City. The security cannot be released, substituted or sold without the City’s approval and release of the security. Certificates of deposit are, according to the City’s investment policy, to be collateralized at least by 102% of the amount that is not federally insured. As of June 30, 2016, the City had no deposits exposed to custodial credit risk. Investments - The City’s investment policy requires that securities be registered in the name of the City. All safekeeping receipts for investment instruments are held in accounts in the City’s name and all securities are registered in the City’s name. State statutes and City ordinances govern the City’s investment policies. Permissible investments include direct obligations of the U.S. Government and agency securities, municipal bonds, money market funds, certificates of deposit and savings accounts, repurchase agreements, judgments, and bank or guaranteed investment contracts. Collateral is required for demand deposits, certificates of deposit and repurchase agreements at 102% of all amounts not covered by federal deposit insurance. Obligations that may be pledged as collateral are obligations of the United States and its agencies and obligations of the State and its subdivisions. Interest Rate Risk - Investments are made based upon prevailing market conditions at the time of the transaction with the intent to hold the instrument until maturity. If the yield of the portfolio can be improved upon by the sale of an investment, prior to its maturity,
with the reinvestment of the proceeds, then this provision is also allowed. In accordance with its investment policy, the City manages its interest rate risk by limiting the weighted average maturity of its investment portfolio to three (3) years or less. No security, at the time of purchase, shall have a maturity exceeding five (5) years, with the exception that GNMA mortgage backed pass-throughsecurities, as a group shall, at time of purchase, have an average life not to exceed five (5) years. Credit Risk - The City’s investment policy prohibits purchasing any investments rated below AA at the time of purchase. Concentration of Credit Risk - While the City may choose to maintain one-hundred percent (100%) of its investment portfolio in U. S. Treasury bills, notes, and bonds, at no time will the portfolio be composed of more than seventy percent (70%) related federal agencies. The agencies in which the City invests are outlined in Section 7.0 of the City’s investment policy. The policy requires diversification among authorized investment broker/dealers, with not more than fifty percent (50%) of the City’s investment portfolio invested through any one financial institution or broker/dealer. Investment Policy - Repurchase agreements under 14 days are limited to thirty percent (30%) of the investment portfolio. Money market funds, collateralized repurchase agreements over 14 days, certificates of deposit and demand deposits are all limited to not exceed twenty percent (20%) of the investment portfolio. Prime bankers acceptances are limited to five percent (5%) of the investment portfolio. The City invests in various investment securities. Investment securities are exposed to various risks such as interest rate, market and credit risks. Due to the level of risk associated with certain investment securities, it is at least reasonably possible that changes in the values of investment securities will occur in the near term and those changes could materially affect the investment amounts reported in the accompanying financial statements of the City and its component units.
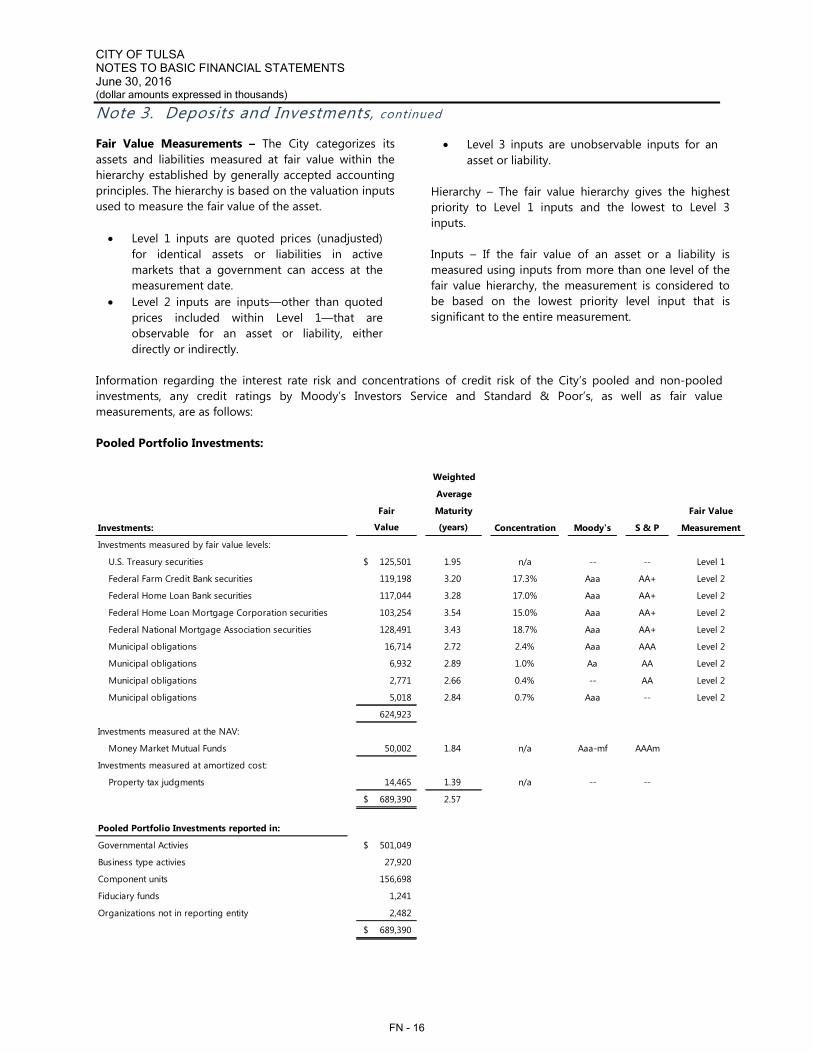
CITY OF TULSA NOTES TO BASIC FINANCIAL STATEMENTS June 30, 2016(dollar amounts expressed in thousands)
FN - 16
Fair Value Measurements – The City categorizes its assets and liabilities measured at fair value within the hierarchy established by generally accepted accounting principles. The hierarchy is based on the valuation inputs used to measure the fair value of the asset.
Level 1 inputs are quoted prices (unadjusted) for identical assets or liabilities in active markets that a government can access at the measurement date. Level 2 inputs are inputs—other than quoted prices included within Level 1—that are observable for an asset or liability, either directly or indirectly.
Level 3 inputs are unobservable inputs for an asset or liability.
Hierarchy – The fair value hierarchy gives the highest priority to Level 1 inputs and the lowest to Level 3 inputs. Inputs – If the fair value of an asset or a liability is measured using inputs from more than one level of the fair value hierarchy, the measurement is considered to be based on the lowest priority level input that is significant to the entire measurement.
Information regarding the interest rate risk and concentrations of credit risk of the City’s pooled and non-pooled investments, any credit ratings by Moody’s Investors Service and Standard & Poor’s, as well as fair value measurements, are as follows: Pooled Portfolio Investments:
Weighted
Average
Fair Maturity Fair Value
Investments: Value (years) Concentration Moody's S & P Measurement
Investments measured by fair value levels:
U.S. Treasury securities 125,501$ 1.95 n/a -- -- Level 1
Federal Farm Credit Bank securities 119,198 3.20 17.3% Aaa AA+ Level 2
Federal Home Loan Bank securities 117,044 3.28 17.0% Aaa AA+ Level 2
Federal Home Loan Mortgage Corporation securities 103,254 3.54 15.0% Aaa AA+ Level 2
Federal National Mortgage Association securities 128,491 3.43 18.7% Aaa AA+ Level 2
Municipal obligations 16,714 2.72 2.4% Aaa AAA Level 2
Municipal obligations 6,932 2.89 1.0% Aa AA Level 2
Municipal obligations 2,771 2.66 0.4% -- AA Level 2
Municipal obligations 5,018 2.84 0.7% Aaa -- Level 2
624,923
Investments measured at the NAV:
Money Market Mutual Funds 50,002 1.84 n/a Aaa-mf AAAm
Investments measured at amortized cost:
Property tax judgments 14,465 1.39 n/a -- --
689,390$ 2.57
Pooled Portfolio Investments reported in:
Governmental Activies 501,049$
Business type activies 27,920
Component units 156,698
Fiduciary funds 1,241
Organizations not in reporting entity 2,482
689,390$

CITY OF TULSA NOTES TO BASIC FINANCIAL STATEMENTS June 30, 2016(dollar amounts expressed in thousands)
FN - 17
Non- Pooled Investments – Primary Government:
WeightedAverageMaturity Fair Value
Fair Value (years) Concentration Moody's S & P Measurement
Federal Home Loan Bank securities 1,078$ 1.69 100.0% Aaa AA+ Level 2
Federal Home Loan Bank securities 1,578$ 1.69 25.7% Aaa AA+ Level 2
Internal Service Funds
Proprietary Funds
Non- Pooled Investments – Fiduciary Funds:
Custodial Credit Risk. Custodial credit risk is the risk that, in the event of the failure of the counterparty, the Municipal Employees Retirement Plan (“MERP”) will not be able to recover the value of its investments that are in the possession of the counterparty. Investment securities are exposed to custodial credit risk if they are both uninsured and are not registered in the name of the MERP, and are held by the counterparty or the counterparty’s trust department but not in the name of MERP. MERP has no exposure to custodial credit risk because all of MERP’s investments that are evidenced by securities are registered in MERP’s name.
Credit Risk. Fixed income securities are subject to credit risk. Credit quality rating is one method of assessing the ability of the issuer to meet its obligation. MERP’s investment policy requires that at the time of purchase all fixed income portfolios are to be invested primarily in high quality securities but also allows up to 10% of the portfolio to be invested in below grade securities rated lower than BBB- (by Standard & Poor’s and Fitch) or BBB3 (by Moody’s) and emerging markets bonds.

CITY OF TULSANOTES TO BASIC FINANCIAL STATEMENTS June 30, 2016 (dollar amounts expressed in thousands)
FN - 18
The credit ratings of debt securities held by MERP are as follows:
Not Rated or
Rating Not
Investment Type AAA/Aaa AA/Aa A/A BBB/Baa Available Total
U.S. agency obligations 4,590$ -$ -$ -$ -$ 4,590$
Government mortgage backed securities 11,943 - - - - 11,943
Corporate bonds 190 2,035 - 6,858 3,781 12,864
Asset backed securities 1,197 93 - 839 - 2,129
Commercial mortgage backed securities 582 161 24 - 1,664 2,431
Municipal obligation 97 - - - - 97
Foreign obligations - 260 1,538 1,328 - 3,126
18,599$ 2,549$ 1,562$ 9,025$ 5,445$ 37,180$
Rated
Standard & Poors/Moody's
Concentration of Credit Risk. MERP’s investment guidelines do not specifically address concentration of credit risk. The asset allocation guidelines for fixed income investments at June 30, 2016 were 24% strategic with a lower limit of 20% and an upper limit of 28%.
Interest Rate Risk. Interest rate risk is the risk that changes in interest rates will adversely affect the fair value of an investment. While all investments are subject to market changes, securities invested in index funds are more sensitive to market risk. Although MERP’s investment policy does not specifically address the duration of fixed-income securities, MERP’s management does monitor interest rate risk by monitoring the performance of each investment manager. MERP’s investments with associated maturities:
WeightedAverage
Fair Maturity Fair ValueValue (years) Measurement
Investments measured by fair value levels:
U.S. Treasury securities 24,456$ 7.60 Level 1
Federal Home Loan Mortgage Corp securities 4,590 22.68 Level 2
Federal National Mortgage Association securities 7,325 24.61 Level 2
Government National Mortgage Association securities 4,618 3.14 Level 2
Mutual funds 58,686 n/a Level 1
Corporate obligations 17,424 9.49 Level 2
Municipal obligations 97 7.17 Level 2
Foreign obligations 3,126 5.05 Level 2
Common Stock 23,369 n/a Level 1
Preferred Stock 581 n/a Level 2
Investments measured by fair value levels: 144,272
Investments measured at the NAV:
Mutual funds 213,795 n/a
Real Estate funds 30,480 n/a
Timber 17,526 n/a
Investments measured at the NAV: 261,801 14.87
406,073$

CITY OF TULSANOTES TO BASIC FINANCIAL STATEMENTS June 30, 2016 (dollar amounts expressed in thousands)
FN - 19
Non- Pooled Investments – Fiduciary Funds:
MERP invests in two real estate funds. These funds make strategic property acquisition primarily in the U.S. As part of the valuation process, independent appraisers value properties on an annual basis (at a minimum). The funds are valued at NAV monthly. The funds allow withdrawals once per quarter subject to “available cash” as determined by a pool trustee within 45 days advance written notice.
MERP invests in a timber partnership. The partnershipseeks to gain income through acquisition, holding and distribution of timberland primarily in the U.S. The term of the partnership is ten years with options to extend. MERP receives income distributions. In general, redemption in this investment won’t occur until the partnership has ended. MERP invests in multiple funds for both equity and fixed income investments seeking to achieve positive returns utilizing experienced portfolio managers. These investments are valued at NAV at least monthly. The funds allow for withdraw at the most recent valued date or end of the month with some funds requiring 30 days notice. For the City and MERP, the following fair value techniques were utilized in measuring the fair value of its investments: U.S. Treasury securities, corporate equities and mutual funds: These investments are reported at fair value based on quoted market prices obtained from exchanges. Corporate obligations and fixed income securities: These investments are reported at fair value based on evaluation using market sources and integrating relative credit information, observed market movements, and sector news into the evaluated pricing applications and models.
U.S. Government securities: U.S. Government securities are reported at fair value based on bullet (non-call) spread scale for each issuer for maturities going out to forty years. These spreads represent credit risk and are obtained from the new issue market, secondary trading, and dealer quotes. An Option Adjusted Spread (OAS) model is incorporated to adjust spreads of issues that have early redemption features. Final spreads are added to a U.S. Treasury curve. A cash discounting yield/price routine calculates prices from final yields to accommodate odd coupon payment dates typical of medium-term notes. Mortgage-backed securities: Mortgage-backed securities are reported at fair value via model using various inputs such as but not limited to daily cash flow, snapshots of the TBA market and the U.S. Treasury market, floating rate Indices such as LIBOR, CMT and Prime as a benchmark yield, spread over index, periodic and life caps, next coupon adjustment date, and convertibility of the bond. Municipal bonds: Municipal bonds are reported at fair value based on trades, bid price or spread, two-sided markets, quotes, benchmark curves including but not limited to treasury benchmarks and LIBOR and swap curves, market data feeds such as MSRB, financial statements, discount rate, capital rates, and trustee reports. Preferred stock: Preferred stock is reported at fair value by calculating the appropriate spread over a comparable U.S. Treasury security for each issue. These spreads represent the amount of additional yield required to account for the risks inherent with preferred stocks, including credit, refunding and liquidity. Evaluators obtain benchmark quotes on liquid issues, follow both the listed and new issue market, and focus on changing market conditions. The City has no assets reported at fair value on a nonrecurring basis and no other investments meeting the fair value disclosure requirements of Governmental Accounting Standards Board (GASB) Statement No. 7.

CITY OF TULSANOTES TO BASIC FINANCIAL STATEMENTS June 30, 2016 (dollar amounts expressed in thousands)
FN - 20
Receivables for the City’s individual major funds, aggregate nonmajor funds, internal service funds, and component units, including applicable allowances for uncollectible accounts, are as follows:
Nonmajor Total Internal Total
General Debt Sales Governmental Governmental Service Governmental
Fund Service Tax Funds Funds Funds Activities
Current receivables, net:
Interest receivable 829$ -$ 570$ 42$ 1,441$ 38$ 1,479$
Taxes receivable 26,512 70,036 11,264 945 108,757 - 108,757
Accounts receivable 5,678 - 11 864 6,553 1,026 7,579
Due from other governments - - - 2,401 2,401 - 2,401
33,019 70,036 11,845 4,252 119,152 1,064 120,216
Less: Allowance for uncollectibles (3,835) - - (36) (3,871) (10) (3,881)
29,184$ 70,036$ 11,845$ 4,216$ 115,281$ 1,054$ 116,335$
Governmental Funds
One Arena & Total Stormwater Technology Convention Golf Business-type
Management Center Center Courses ActivitiesCurrent receivables, net:
Interest receivable 42$ 13$ 13$ 1$ 69$ Utility receivable 3,100 - - - 3,100 Accounts receivable, gross - 451 941 - 1,392 Capital lease receivable - 642 - - 642
3,142 1,106 954 1 5,203 Less: Allowance for uncollectibles (51) - (5) - (56)
3,091$ 1,106$ 949$ 1$ 5,147$ Noncurrent receivables, net:
Capital lease receivable - 10,816 - - 10,816 Interest receivable 23 - - - 23
23$ 10,816$ -$ -$ 10,839$
Business-type Activities Enterprise Funds
TPFA Capital Lease - On August 28, 2013, the TPFA entered into an amended lease agreement (agreement) with a tenant of OTC effective July 1, 2013 for 143,242 square feet of commercial office space at One Technology Center (“OTC”). The agreement extended the term of the lease to June 30, 2029. Lease payments will total $2,207 annually except for fiscal year 2016 which was $2,127. The tenant
assigned the lease to an affiliated company. Throughout the term of the lease, $1,200 of the total annual lease payments will be applied to the lease and the remainder will be apportioned to operating expense reimbursement. The affiliated company will have the option to purchase the occupied space for one dollar at June 30, 2029. TPFA will account for the lease agreement as a capital lease.
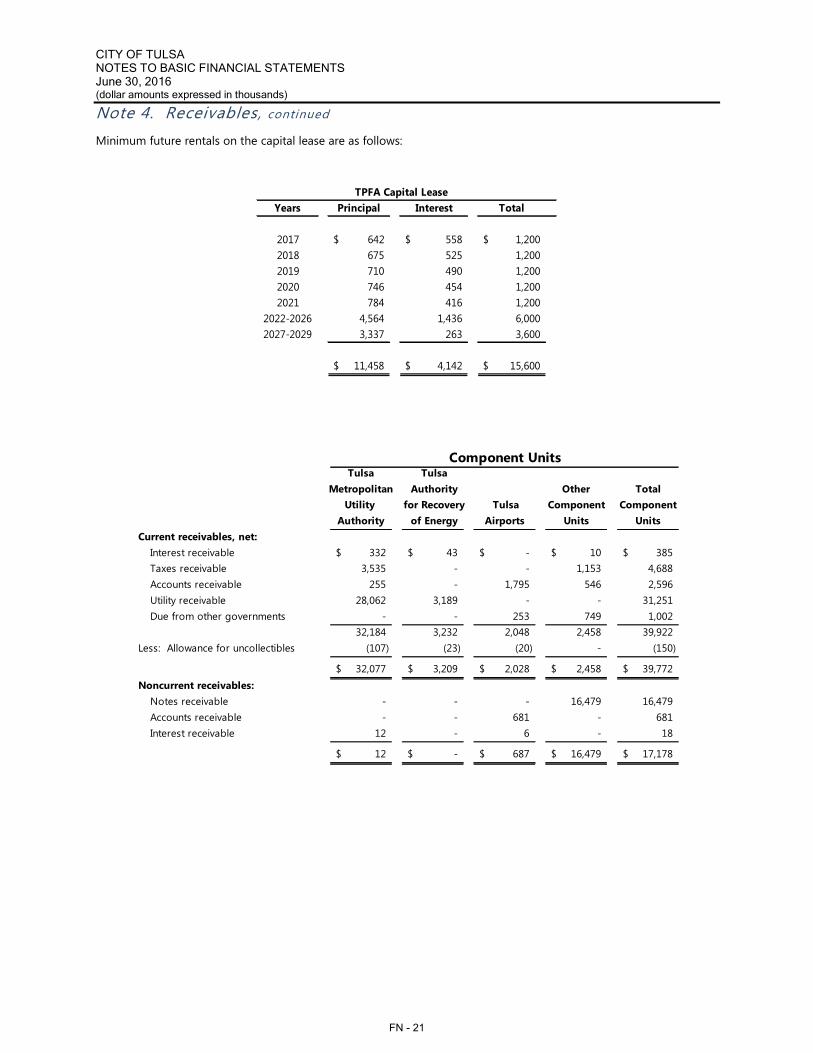
CITY OF TULSA NOTES TO BASIC FINANCIAL STATEMENTS June 30, 2016(dollar amounts expressed in thousands)
FN - 21
Minimum future rentals on the capital lease are as follows:
Years Principal Interest Total
2017 642$ 558$ 1,200$ 2018 675 525 1,200 2019 710 490 1,200 2020 746 454 1,200 2021 784 416 1,200
2022-2026 4,564 1,436 6,000 2027-2029 3,337 263 3,600
11,458$ 4,142$ 15,600$
TPFA Capital Lease
Tulsa TulsaMetropolitan Authority Other Total
Utility for Recovery Tulsa Component ComponentAuthority of Energy Airports Units Units
Current receivables, net:Interest receivable 332$ 43$ -$ 10$ 385$ Taxes receivable 3,535 - - 1,153 4,688 Accounts receivable 255 - 1,795 546 2,596 Utility receivable 28,062 3,189 - - 31,251 Due from other governments - - 253 749 1,002
32,184 3,232 2,048 2,458 39,922 Less: Allowance for uncollectibles (107) (23) (20) - (150)
32,077$ 3,209$ 2,028$ 2,458$ 39,772$ Noncurrent receivables:
Notes receivable - - - 16,479 16,479 Accounts receivable - - 681 - 681 Interest receivable 12 - 6 - 18
12$ -$ 687$ 16,479$ 17,178$
Component Units

CITY OF TULSA NOTES TO BASIC FINANCIAL STATEMENTS June 30, 2016(dollar amounts expressed in thousands)
FN - 22
Payables for the City’s individual major funds, aggregate nonmajor governmental funds, internal service funds, enterprise funds, and component units are as follows:
Internal Total TotalSales Service Wide Governmental
General Bond Tax Funds Total Funds Funds Statements Activities
Accounts payable 2,494$ 6,714$ 10,554$ 1,166$ 20,928$ 701$ 21,629$ -$ 21,629$ Accrued payroll 8,831 - - 80 8,911 221 9,132 - 9,132 Accrued interest - - - - - 56 56 3,807 3,863
11,325$ 6,714$ 10,554$ 1,246$ 29,839$ 978$ 30,817$ 3,807$ 34,624$
NonmajorGovernmental Governmental
Governmental FundsAdjustments
toGovernment
One Arena & Tulsa Stormwater Technology Convention Stadium Golf
Management Center Center Trust Courses Total
Accounts payable 887$ 421$ 2,532$ 2$ 223$ 4,065$ Accrued payroll 278 67 - - - 345 Accrued interest - 413 147 81 - 641
1,165$ 901$ 2,679$ 83$ 223$ 5,051$
Business-type Activities - Enterprise Funds
Tulsa TulsaMetropolitan Authority Other Total
Utility for Recovery Tulsa Component ComponentAuthority of Energy Airports Units Units
Accounts payable 13,743$ 1,294$ 5,118$ 1,445$ 21,600$ Accrued payroll 1,624 152 - 285 2,061 Accrued interest 4,026 - 804 209 5,039
19,393$ 1,446$ 5,922$ 1,939$ 28,700$
Component Units

CITY OF TULSA NOTES TO BASIC FINANCIAL STATEMENTS June 30, 2016(dollar amounts expressed in thousands)
FN - 23
Primary government interfund receivables and payables consist of the following:
Amount Due From Other Funds Due To Other Funds Purpose
164$ General Fund Vision 2025 Capital Projects To finance capital projects
Advances To Other Funds Advances From Other Funds Purpose
95 General Fund Federal and State Grants To advance fund grants
146 General Fund Office Services To provide cash flow
241$
Advances To Primary Government
Advances From Component Units Purpose
127 Tulsa Airports General FundPayment in advance - Fire Department services
12 TMUA Bond To subsidize capital improvements
139$
Advances To Component Units
Advances From Primary Government Purpose
326 General Fund MTTA To provide cash flow
4,452 TPFA Internal Service Fund TARE To subsidize capital improvements
4,778$

CITY OF TULSA NOTES TO BASIC FINANCIAL STATEMENTS June 30, 2016(dollar amounts expressed in thousands)
FN - 24
Primary government interfund transfers for the year ended consist of the following amounts:
Transfers From
Sales Nonmajor Stormwater
General Bond Tax Governmental Management
Total Fund Fund Fund Funds Fund
Governmental Funds:
Major Funds:
General Fund 2,303$ -$ -$ -$ 650$ 1,653$
Debt Service 163 - 163 - - -
Nonmajor Funds 2,655 155 - 2,500 - -
Total Governmental Funds 5,121 155 163 2,500 650 1,653
Internal Service Funds 562 - - 562 - -
Enterprise Funds:
Stormwater Management Fund 2,051 - 339 1,697 15 -
One Technology Center 17 - - 17 - -
Arena & Convention Center 2,562 - - 22 2,540 -
Tulsa Stadium Trust 2,215 - - - 2,215 -
Golf Courses Fund 287 150 - 137 - -
Total Enterprise Funds 7,132 150 339 1,873 4,770 -
Total Primary Government 12,815$ 305$ 502$ 4,935$ 5,420$ 1,653$
Transfers To
Transfers - in
Governmental Funds 5,121$ Governmental Funds 11,162$
Internal Service Funds 562 Internal Service Funds -
Enterprise Funds 7,132 Enterprise Funds 1,653
Total Primary Government 12,815$ Total Primary Government 12,815$
Transfers - out
1. Purpose of Transfers The above transfers occur principally to fund operations and finance capital asset acquisitions. Transfers are used to: (1) move revenues from the fund that State statutes or City ordinances requires to collect them to the fund that State statutes or City ordinances requires to expend them; (2) move receipts restricted to debt service from the funds collecting the receipts to the Debt Service Fund as debt service payments become due; and (3) use unrestricted revenues collected in the General Fund to finance various programs accounted for in other funds in accordance with budgetary authorizations.
2. Eliminations Interfund transfers are reported in the governmental activities and business-type activities fund financial statements. In the government-wide statements, interfund transfers are eliminated within the governmental activities column and within the business-type activities column.

CITY OF TULSA NOTES TO BASIC FINANCIAL STATEMENTS June 30, 2016(dollar amounts expressed in thousands)
FN - 25
Capital asset activity for the year ended is as follows:
Beginning Balance Additions Reductions
Ending Balance
GOVERNMENTAL ACTIVITIES:
Nondepreciable capital assets:
Land 39,223$ -$ (80)$ 39,143$
Land - Infrastructure use 488,427 - - 488,427
Construction in progress:
General government 42,809 15,137 (30,395) 27,551
Infrastructure 110,103 99,785 (57,558) 152,330
Total construction in progress 152,912 114,922 (87,953) 179,881
Total nondepreciable capital assets 680,562 114,922 (88,033) 707,451
Depreciable capital assets:
Land improvements 76,357 8,219 - 84,576
Buildings 174,765 20,375 (540) 194,600
Equipment 188,589 7,194 (4,324) 191,459
Street network 3,155,320 56,143 - 3,211,463
Bridge network 39,424 - - 39,424
Total depreciable capital assets 3,634,455 91,931 (4,864) 3,721,522
Total capital assets 4,315,017 206,853 (92,897) 4,428,973
Accumulated depreciation:
Land improvements (52,563) (1,363) - (53,926)
Buildings (75,552) (4,105) 460 (79,197)
Equipment (116,474) (11,437) 4,294 (123,617)
Street network (2,528,140) (34,003) - (2,562,143)
Bridge network (7,258) (1,669) - (8,927)
Total accumulated depreciation (2,779,987) (52,577) 4,754 (2,827,810)
Total depreciable capital assets, net 854,468 39,354 (110) 893,712
Governmental activities capital assets, net 1,535,030$ 154,276$ (88,143)$ 1,601,163$

CITY OF TULSA NOTES TO BASIC FINANCIAL STATEMENTS June 30, 2016(dollar amounts expressed in thousands)
FN - 26
Beginning Balance Additions Reductions
EndingBalance
Land 94,903$ 456$ -$ 95,359$
Works of Art 653 - - 653
Construction in progress 6,009 6,310 (2,093) 10,226
Total nondepreciable assets 101,565 6,766 (2,093) 106,238
Land improvements 370,287 5,701 - 375,988
Buildings 288,846 821 (5) 289,662
Equipment 59,408 592 (605) 59,395
Total depreciable capital assets 718,541 7,114 (610) 725,045
Total capital assets 820,106 13,880 (2,703) 831,283
Land improvements (107,858) (10,250) - (118,108)
Buildings (81,183) (9,281) 1 (90,463)
Equipment (34,859) (4,334) 589 (38,604)
Total accumulated depreciation (223,900) (23,865) 590 (247,175)
Total depreciable capital assets, net 494,641 (16,751) (20) 477,870
596,206$ (9,985)$ (2,113)$ 584,108$
DISCRETELY PRESENTED COMPONENT UNITS:
Nondepreciable capital assets:
Land, easements and other 188,982 1,049 (172) 189,859
Water rights 9,593 1 - 9,594
Construction in progress 145,711 67,664 (113,048) 100,327
Total nondepreciable capital assets 344,286 68,714 (113,220) 299,780
Depreciable capital assets:
Land improvements and water and sewer lines 1,852,980 99,660 (120) 1,952,520
Buildings 332,520 28,629 (1,757) 359,392
Equipment 140,209 7,287 (4,355) 143,141
Total depreciable capital assets 2,325,709 135,576 (6,232) 2,455,053
Total capital assets 2,669,995 204,290 (119,452) 2,754,833
Accumulated depreciation:
Land improvements and water and sewer lines (743,336) (38,316) 120 (781,532)
Buildings (189,628) (9,133) 1,750 (197,011)
Equipment (78,879) (10,588) 4,377 (84,988)
Total accumulated depreciation (1,011,843) (58,037) 6,247 (1,063,531)
Total depreciable capital assets, net 1,313,866 77,539 15 1,391,522
Component unit capital assets, net 1,658,152$ 146,253$ (113,205)$ 1,691,302$
Depreciable capital assets:
Business-type activities capital assets, net
Accumulated depreciation:
BUSINESS-TYPE ACTIVITIES:Nondepreciable capital assets:
Depreciation expense is charged to functional activities as follows:
Governmental Activities Business-type Activities Component Units
General government 173$ Stormwater Management 9,493$ TMUA 37,144$
Public safety and protection 9,808 One Technology Center 1,224 TARE 1,792
Public works and transportation 39,573 Arena & Convention Center 10,870 Tulsa Airports 14,071
Social and economic development 182 Tulsa Stadium Trust 1,969 Other 5,030
Culture and recreation 2,841 Golf Courses 309 58,037$
52,577$ 23,865$

CITY OF TULSA NOTES TO BASIC FINANCIAL STATEMENTS June 30, 2016(dollar amounts expressed in thousands)
FN - 27
The City is exposed to various risk of loss related to the following: workers’ compensation; torts including errors and omissions; theft of, damage to and destruction of assets; and natural disasters. The City purchases commercial insurance for general liability and property damage as well as employee health and dental. There have been no significant reductions in insurance coverage in the current year or in the three prior years.
Judgments against the City for workers’ compensation and torts are recovered through property taxes. As judgments are paid they are included in property tax levies over the following three years. Property tax revenue and expenditures for judgments as paid are included in the Debt Service Fund. The City records a liability in the entity wide statements for judgments. The City self-insures for medical and injury leave related to workers’ compensation claims not included in a judgment. These claims are paid from the City’s Employee Insurance Fund and funded by charges to the City’s other funds and component units, and is based primarily upon the contributing funds’ claims experience.
Liabilities for judgments and workers’ compensation claims are reported when it is probable that a loss has occurred and the amount of the loss can be reasonably estimated. The liability also includes an amount for claims that have been incurred but not reported (IBNR). The result of the process to estimate the claims liability is not an exact amount as it depends on many complex factors, such as inflation, changes in legal doctrines, economic and social factors, and trends in damage awards. Accordingly, claims are reevaluated periodically to consider the effect of these factors. The estimate of the claims liability also includes amounts for incremental claim adjustment expense related to specific claims and other claim adjustment expense regardless of whether allocated to specific claims. Estimated recoveries, for example salvage or subrogation, are another component of the liability estimate.
Changes in the balances of claims liability, including judgments, during the past two years are as follows:
Workers' Compensation Liability 2016 2015
Claims liability at beginning of year 20,306$ 19,599$
Current year claims and changes in estimates 3,242 5,909
Claims payments (5,006) (5,202)
Claims liability at end of year 18,542 20,306
Tort Claims Liability
Claims liability at beginning of year 11,129 4,297
Current year claims and changes in estimates 8,965 8,531
Claims payments (9,531) (1,699)
Claims liability at end of year 10,563 11,129
Total claims liability 29,105$ 31,435$

CITY OF TULSA NOTES TO BASIC FINANCIAL STATEMENTS June 30, 2016(dollar amounts expressed in thousands)
FN - 28
Each qualified employee is included in one of the three pension plans in which the City participates. The three plans are:
Municipal Employees’ Retirement Plan (“MERP”) Oklahoma Firefighters Pension FundOklahoma Police Pension and Retirement System
Plan information is as follows. Unless otherwise described, amounts relate to the primary government of the City and exclude discretely presented component units.
Below is a summary of amounts reported by the City:
MERP Firefighters OPPRS TotalNet Pension Liability 105,312$ 166,883$ 728$ 272,923$ Deferred Outflows of Resources 36,668 9,808 7,001 53,477 Deferred Inflows of Resources 18,610 21,940 7,907 48,457
Pension Expense 7,509 12,387 2,504 22,400
A. MUNICIPAL EMPLOYEES’ RETIREMENT PLAN
1. Plan Description - MERP is a cost-sharing multiple-employer defined benefit pension trust. MERP covers full-time non-sworn employees of the City, its component units and employees of four other governmental organizations. The Plan was established by the City in accordance with the City Charter and State statutes, and provides retirement, disability and death benefits to plan members. Management of the Plan is vested in the Board of Trustees consisting of seven members – two elected by active plan members, one elected by retirees, two mayoral appointments and the Director of Finance and the Director of Human Resources who serve as ex-officio members. The Plan does not issue a stand-alone financial report and is not included in the report of a public employee retirement system or a report of another entity. 2. Summary of Significant Accounting Policies Basis of Accounting – The MERP financial statements are prepared on the accrual basis of accounting.
Employer and employee contributions are recognized when due and a formal commitment to provide the contributions is made. Benefits and refunds are recognized when due and payable in accordance with the terms of the plan.
Method Used to Value Investments – Investment income is recognized when earned. Investments are reported at fair value in accordance with the fair value techniques disclosed in Note 3. Realized gains and losses on sales and exchanges are recognized on the transaction date. Changes in fair value are reported as investment income. 3. Benefits and Refunds Paid - Any member whose years of continuous employment, when added to the member’s age equals or exceeds 80, may retire without a reduction in the monthly benefit. The amount of retirement benefit is established by City ordinance and is equal to 2.35% of final average earnings of highest 30 months within last five years of service, up to covered compensation, times years of service. Pension provisions include death benefits for the surviving spouse. The system does not provide a monthly income for disabled members; however, under certain conditions, employees who become disabled may be eligible to receive their full retirement at age 65 even though they were unable to work up to the retirement age. Benefits vest at 100% after five years of service. 4. Membership data (for MERP):
Active members 2,402
Retirees and beneficiaries
currently receiving benefits 1,900
Inactive members entitled to but
not yet receiving benefits 290
4,592
5. Contributions - The contribution requirements of active members and the participating employers are established by City ordinance. Plan members are required to contribute 6.5% of covered compensation to the Plan. The City is required to contribute the remaining amounts necessary to fund the system, which was 11.5% of covered compensation for 2016. During the year the City contributed $6,439 in employer contributions.

CITY OF TULSA NOTES TO BASIC FINANCIAL STATEMENTS June 30, 2016(dollar amounts expressed in thousands)
FN - 29
6. Investments - The Board of Trustees established an investment policy guiding the allocation of invested assets. This policy may be amended by the Board of Trustees. Plan assets are managed on a total return basis with a long-term objective of achieving and maintaining a fully funded status for the benefits provided through the Plan. 7. Asset Allocation - Following is the Plans’ asset allocation policy, and the long-term expected geometric real rate of return for each major asset class:
Asset ClassTarget Allocation
Long-term Expected Real Rate of Return
Fixed income 24% 1.16%
Domestic equity 36% 6.19%
International equity 24% 6.59%
Real estate 8% 4.24%
Commodities 3% 0.50%
Timber 4% 4.25%Cash 1% 0.11%
There are no investments in any one organization representing 5% or more of MERP’s net position. There are no investments in, loans to, or leases with related parties. For the year ended, the annual money-weighted rate of return on MERP investments, net of investment expense, was 1.7%. The money-weighted rate of return expresses investment performance, net of investment expense, adjusted for the changing amounts actually invested. 8. Net Pension Liability (for MERP):
$ 629,218 (412,905)
Net pension liability 216,313$
Plan fiduciary net position as a percentage of the total pension liability 65.6%
Total pension liability
Plan fiduciary net position
The total pension liability was determined using an actuarial valuation date of January 1, 2016 rolled forward from the valuation date to the fiscal year ending June 30, 2016 using generally accepted actuarial principals and methods.
Proportionate share and net pension liability reported in:
Governmental activities 42.8244% 92,635$
Business type activities 5.8605% 12,677
Component units 38.1173% 82,453
Organizations not in reporting entity 13.1978% 28,548
100.0000% 216,313$
9. Actuarial Assumptions - The total pension liability was determined by an actuarial valuation as of the date below.
Valuation date January 1, 2016
Investment rate of return* 7.50%
Projected salary increases* 4.00% - 11.75%
* Includes inflation at 3.00%Mortality rates RP-2014 Combined Healthy
Mortality Tables with Blue Collar adjustments. The actuary assumptions used were based on the results of an actuarial experience study for the five-year period ending December 31, 2015. 10. Discount Rate (for MERP) - A discount rate of 7.5% was used to measure the total estimated pension liability. This discount rate was based on an expected rate of return on pension plan investments of 7.5%. The projection of cash flows used to determine this discount rate assumed that MERP member contributions will be made at the current contribution rate and that employer contributions will be made as specified in MERP’s funding policy. Beginning July 1, 2017, and all future years, it is assumed that the employer contribution rate will increase to 14.85% of payroll, which is the actuarially determined contributions rate. Based on these assumptions, MERP’s fiduciary net position and future contributions were sufficient to finance all the future benefit payments of the current active and inactive plan members. Therefore, the long-term expected rate of return on pension plan investments was applied to all periods of the projected benefit payments to determine the total pension liability. Regarding the sensitivity of the net pension liability to changes in the discount rate, the following presents the Plan’s estimated net pension liability, calculated using a discount rate of 7.5% as well as what the Plan’s net pension liability would be if it were calculated using a discount rate that is one percentage point lower and higher.

CITY OF TULSA NOTES TO BASIC FINANCIAL STATEMENTS June 30, 2016(dollar amounts expressed in thousands)
FN - 30
1% Decrease
Discount Rate
1% Increase
6.50% 7.50% 8.50%
Plan 290,717$ 216,313$ 153,969$
Primary Government 141,535$ 105,312$ 74,960$
11. Pension Expense, Deferred Outflows of Resources and Deferred Inflows of Resources Related to Pension The primary government’s pension expense for the year was $7,509. At June 30, 2016, the primary government’s deferred outflows of resources and deferred inflows of resources were as follows:
Deferred Outflows of Resources
Deferred Inflows of Resources
Differences between expected and actual plan experience 1,124$ 2,726$
Assumption Change 23,038 14,084
Net difference between projected and actual earnings on pension plan investments 10,704 - Changes in proportion and differences between employer contributions and proportionate share of contributions 1,802 1,800
36,668$ 18,610$
In 2016, amounts reported as changes in assumptions resulted primarily from the changes in the mortality table and discount rate from 7.75% to 7.50%. Amounts reported as deferred outflows of resources and deferred inflows of resources will be recognized in pension expense as follows:
Year ended June 30th
2017 678$
2018 678
2019 10,755
2020 5,947
18,058$
B. OKLAHOMA FIREFIGHTERS PENSION AND RETIREMENT SYSTEM The Firefighters Plan is a statewide retirement system for firefighters, and is administered by the State of Oklahoma. The City is neither involved in the administration of the Firefighters System nor does it maintain the accounting records or hold Plan investments.
Unless otherwise indicated, information in this note related to the Firefighters Pension and Retirement systems are provided as of July 1, 2015, the most recent actuarial valuation.
1. Plan Description - Sworn firefighters of the City are provided with pensions through the Oklahoma Firefighters Pension Retirement System (Firefighters System)—a cost-sharing multiple-employer defined benefit pension plan administered by the Oklahoma Firefighters Pension Plan established by Oklahoma Statutes for both paid and volunteer firefighters of participating municipalities and protection districts. Firefighters System provides retirement and death benefits which are established by State statute to plan members and beneficiaries. Firefighters System issues a publicly available financial report that includes financial statements and required supplementary information. The report is located at http://www.ok.gov/fprs/Financials/index.html.
2. Benefits provided - In general, the Firefighters System provides defined retirement benefits based on members’ final average compensation, age, and term of service. In addition, the retirement program provides for benefits upon disability and to survivors upon death of eligible members. Benefits are established and amended by State statute. The normal retirement date is the date upon which the participant completes 20 years of credited service, regardless of age for participants who entered the plan prior to November 1, 2013. For participants entering the plan after November 1, 2013 normal retirement is upon completion of 22 years of services and at least age 50. Normal benefits equal 50% of final average compensation for participants entering prior to November 1, 2013 and 55% of final average compensation for participants entering after November 1, 2013. 3. Contributions - The Oklahoma Legislature sets the required contribution rate based on payroll and is not determined by actuary calculations. The City’s contractually required contribution rate for the year ended June 30, 2016, was 14% of annual payroll, employee participants were required to contribute 9%. Contributions to the pension plan from the City were $6,511 for the year ended June 30, 2016. The State of Oklahoma, a non-employer contributing agency, contributes 36% of taxes received

CITY OF TULSA NOTES TO BASIC FINANCIAL STATEMENTS June 30, 2016(dollar amounts expressed in thousands)
FN - 31
from the tax on premiums collected by insurance companies operating in Oklahoma. The State of Oklahoma contributed $14,345 to the Firefighters System on behalf of the City for the year ended June 30, 2016. 4. Pension Liabilities, Pension Expense, and Deferred Outflows of Resources and Deferred Inflows of Resources Related to Pensions - At June 30, 2016, the City reported a liability of $166,883 for its proportionate share of the net pension liability. The net pension liability was measured as of June 30, 2015, and the total pension liability used to calculate the net pension liability was determined by an actuarial valuation as of that date. The City’s proportion of the net pension liability was based on the City’s share of contributions to the pension plan relative to the contributions of all participating governments. At June 30, 2015, the City’s proportion was 15.7228%. For the year ended June 30, 2016, the City recognized pension expense of $12,387. At June 30, 2016, the City reported deferred outflows of resources and deferred inflows of resources related to pensions from the following sources:
Outflows of
Resources
Deferred Inflows of Resources
Differences between expected and actual Plan experience 3,297$ -$ Net difference between projected and actual earnings on pension plan investments - 12,440
Changes in proportion and differences between employer contributions and proportionate share of contributions - 9,500 City contributions subsequent to the measurement date 6,511 -
9,808$ 21,940$
$6,511 reported as deferred outflows of resources related to pensions resulting from City contributions subsequent to the measurement date will be recognized as a reduction of the net pension liability in the year ended June 30, 2017. The remaining amount of deferred outflows of resources are being amortized over a closed period equal to the average of the expected service lives of all participants as of the beginning of the associated measurement period, which was 6.31 to 6.37 years. The deferred inflow related to the difference between projected and actual
investment earnings is being amortized over a closed 5-year period beginning in the current year. Amounts reported as deferred outflows of resources (other than contributions) and deferred inflows of resources related to pensions will be recognized in pension expense (gain) as follows:
Year
Amortization of Deferred
Outflows2017 (5,681)$ 2018 (5,681) 2019 (5,681) 2020 438 2021 (1,493) Thereafter (545)
(18,643)$
5. Actuarial assumptions - The total pension liability was determined by an actuarial valuation as of June 30, 2015, using the following actuarial assumptions, applied to all periods included in the measurement: Investment rate of return* 7.5% compounded annually,
net of investment expenseProjected salary increases* 3.5% - 9.0%* Includes inflation at 3.00%
Mortality rates were based on the RP-2000 Combined Healthy Blue Collar adjustments, as appropriate, with adjustments for generational mortality improvements based on Scale AA for healthy lives and no mortality improvements for disabled lives.
The actuarial assumptions used in the June 30, 2015 valuation were based on the results of an actuarial experience study for the five-year period ending June 30, 2012.
The long-term expected rate of return on pension plan investments was determined using a building-block method in which best-estimate ranges of expected future real rates of return (expected returns, net of pension plan investment expense and inflation) are developed for each major asset class. These ranges are combined to produce the long-term expected rate of return by weighting the expected future real rates of return by the target asset allocation percentage and by adding expected inflation. The target allocation and best estimates of arithmetic real rates of return for each major asset class are summarized in the following tables:

CITY OF TULSA NOTES TO BASIC FINANCIAL STATEMENTS June 30, 2016(dollar amounts expressed in thousands)
FN - 32
Target Allocation
62%20%18%
100%
Asset ClassEquitiesFixed incomeReal estate and other
Long-Term Expected
Real Rate of Return
8.02%9.94%5.13%7.47%6.25%Other investments
Asset Class
Domestic equityInternational equityFixed incomeReal estate
6. Discount Rate - The discount rate used to measure the total pension liability was 7.50%. The projection of cash flows used to determine the discount rate assumed that employee contributions will be made at the current contribution rate and that contributions from cities will be made at contractually required rates, determined by Oklahoma Statutes. Projected cash flows also assume the State of Oklahoma will continue contributing 14% of the insurance premium, as established by Oklahoma statute. Based on those assumptions, the pension plan’s fiduciary net position was projected to be available to make all projected future benefit payments of current active and inactive employees. Therefore, the long-term expected rate of return on pension plan investments was applied to all periods of projected benefit payments to determine the total pension liability. 7. Sensitivity of the City’s proportionate share of the net pension liability to changes in the discount rate – The following presents the City’s proportionate share of the net pension liability calculated using the discount rate of 7.50%, as well as what the City’s proportionate share of the net pension liability would be if it were calculated using a discount rate that is 1-percentage-point lower (6.50%) or 1-percentage-point higher (8.50%) than the current rate:
1% Decrease
(6.5%)
Current Discount
Rate (7.5%)
1% Increase (8.5%)
City's proportionate share of the net pension liability 216,680$ 166,883$ 125,118$
Detailed information about the pension plan’s fiduciary net position is available in the separately issued Firefighters System financial report; which can be located at http://www.ok.gov/fprs/.
C. OKLAHOMA POLICE PENSION AND RETIREMENT SYSTEM
1. Plan Description - Sworn police officers of the City are provided with pensions through the Oklahoma Police Pension and Retirement System (OPPRS)—a cost-sharing multiple-employer defined benefit pension plan administered by the Oklahoma Police Pension Plan established by Oklahoma Statutes for police officers of an Oklahoma municipality or state agency. OPPERS provides retirement and death benefits which are established by State statute to plan members and beneficiaries. OPPRS issues a publicly available financial report that includes financial statements and required supplementary information. The report is located at http://www.ok.gov/opprs/Financials/index.html.
2. Benefits - In general OPPRS provides defined retirement benefits based on members’ final average compensation, age, and term of service. In addition, the retirement program provides for benefits upon disability and to survivors upon death of eligible members. Benefits are established and amended by State statute. The normal retirement date is the date upon which the participant completes 20 years of credited service, regardless of age. 3. Contributions - The Oklahoma Legislature sets the required contribution rate based on payroll and is not determined by actuary calculations. The City’s contractually required contribution rate for the year ended June 30, 2016, was 13% of annual payroll, employee participants were required to contribute 8%. The State of Oklahoma, a non-employer contributing agency, contributes 14% of taxes received from the tax on premiums collected by insurance companies operating in Oklahoma. Contributions to the pension plan from the City were $7,001 for the year ended June 30, 2016. The State of Oklahoma contributed $6,343 to the Police System on behalf of the City for the year ended June 30, 2016. 4. Pension Liabilities, Pension Expense, and Deferred Outflows of Resources and Deferred Inflows of Resources Related to Pensions - At June 30, 2016, the City reported a liability of $728 for its proportionate share of the net pension liability. The net pension liability was measured as of June 30, 2015, and the total pension liability used to calculate the net pension liability was determined by an actuarial valuation as of that date. The City’s proportion of the net pension liability was based on

CITY OF TULSA NOTES TO BASIC FINANCIAL STATEMENTS June 30, 2016(dollar amounts expressed in thousands)
FN - 33
of the City’s share of contributions to the pension plan relative to the contributions of all participating governments. At June 30, 2015, the City’s proportion was 17.8728%. For the year ended June 30, 2016, the City recognized pension expense of $2,504. At June 30, 2016, the City reported deferred outflows of resources and deferred inflows of resources related to pensions from the following sources:
Deferred Outflows
of Resources
Deferred Inflows of Resources
Differences between expected and actual Plan experience -$ 4,030$
Net difference between projected and actual earnings on pension plan investments - 2,804
Changes in proportion and differences between employer contributions and proportionate share of contributions - 1,073 City contributions subsequent to the measurement date 7,001 -
7,001$ 7,907$
$7,001 reported as deferred outflows of resources related to pensions resulting from City contributions subsequent to the measurement date will be recognized as a reduction of the net pension liability in the year ended June 30, 2017. The remaining amount of deferred inflows of resources are being amortized over a closed period equal to the average of the expected service lives of all participants as of the beginning of the associated measurement period, which was 5.77 to 5.83 years. The deferred inflows related to the difference between projected and actual investment earnings are being amortized over a closed 5-year period beginning in the current year. Amounts reported as deferred outflows of resources (other than contributions) and deferred inflows of resources related to pensions will be recognized in pension expense (gain) as follows:
2017 (3,203)$ 2018 (3,203) 2019 (3,203) 2020 2,180 2021 (529) Thereafter 51
(7,907)$
Year
5. Actuarial assumptions - The total pension liability was determined by an actuarial valuation as of June 30, 2015, using the following actuarial assumptions:
Investment rate of return* 7.5% compounded annually,
net of investment expense
Projected salary increases* 4.5% - 17.0%
* Includes inflation at 3.00%
Mortality rates were based on the RP-2000 Blue Collar Healthy Combined Table with age set back 4 years with fully generational improvements based on Scale AA for active employees (pre-retirement). Active employees (post-retirement and nondisabled pensioners) use the same table with no age set backs. Disability pensioners use the same table with age set forward 4 years.
The actuarial assumptions used in the June 30, 2015 valuation were based on the results of an actuarial experience study for the five-year period ending June 30, 2012. The long-term expected rate of return on pension plan investments was determined using a building-block method in which best-estimate ranges of expected future real rates of return (expected returns, net of pension plan investment expense and inflation) are developed for each major asset class. These ranges are combined to produce the long-term expected rate of return by weighting the expected future real rates of return by the target asset allocation percentage and by adding expected inflation. The target allocation and best estimates of arithmetic real rates of return for each major asset class are summarized in the following tables:
Target Allocation
60%25%15%
100%
Fixed IncomeReal Estate and other investments
Asset Class
Equities

CITY OF TULSA NOTES TO BASIC FINANCIAL STATEMENTS June 30, 2016(dollar amounts expressed in thousands)
FN - 34
Long-Term Expected
Real Rate of Return
4.87%7.68%5.80%2.24%5.47%2.96%
Fixed IncomeReal EstateCommodities
Asset Class
Domestic EquityInternational equityPrivate equity/debt
6. Discount rate - The discount rate used to measure the total pension liability was 7.50%. The projection of cash flows used to determine the discount rate assumed that employee contributions will be made at the current contribution rate and that contributions from cities will be made at contractually required rates, determined by the Oklahoma Statutes. Projected cash flows also assume the State of Oklahoma will continue contributing 14% of the insurance premium, established by Oklahoma statutes. Based on those assumptions, the pension plan’s fiduciary net position was projected to be available to make all projected future benefit payments of current active and inactive employees. Therefore, the long-term expected rate of return on pension plan investments was applied to all periods of projected benefit payments to determine the total pension liability. 7. Sensitivity of the City’s proportionate share of the net pension liability (asset) to changes in the discount rate - The following presents the City’s proportionate share of the net pension liability (asset) calculated using the discount rate of 7.50%, as well as what the City’s proportionate share of the net pension liability (asset) would be if it were calculated using a discount rate that is 1-percentage-point lower (6.50%) or 1-percentage-point higher (8.50%) than the current rate:
1% Decrease
(6.5%)
Current Discount
Rate (7.5%)
1% Increase (8.5%)
City's proportionate share of the net pension liability (asset) 43,788$ 728$ (35,574)$
Detailed information about the pension plan’s fiduciary net position is available in the separately issued OPPRS financial report; which can be located at http://www.ok.gov/opprs/Financials/index.html.
D. DEFERRED COMPENSATION PLAN
The City offers a deferred compensation plan created in accordance with Internal Revenue Code Section 457 (“the Plan”).
The Plan, available to all City employees, permits them to defer a portion of their current salary to future years. Each participant may direct the Plan to invest his or her account balance in one or more of several investment funds. The Plan offers a variety of investment options that will provide participants with a reasonable opportunity to build diversified portfolios.
The compensation deferred is available to the employees upon termination, retirement, death, or unforeseeable emergency.
The Plan is administered by the Deferred Compensation Board of Trustees (“Board”), created by Executive Order of the Mayor. The Board has full power and authority to adopt investment policies and to select and monitor the funds made available to participants. The Board also has the authority to establish rules and regulations for the administration of the plan and advises the Mayor on employment of investment providers.
The Plan is not reported in the City’s financial statements because the assets are held in trust by an independent trustee for the benefit of the participating employees.
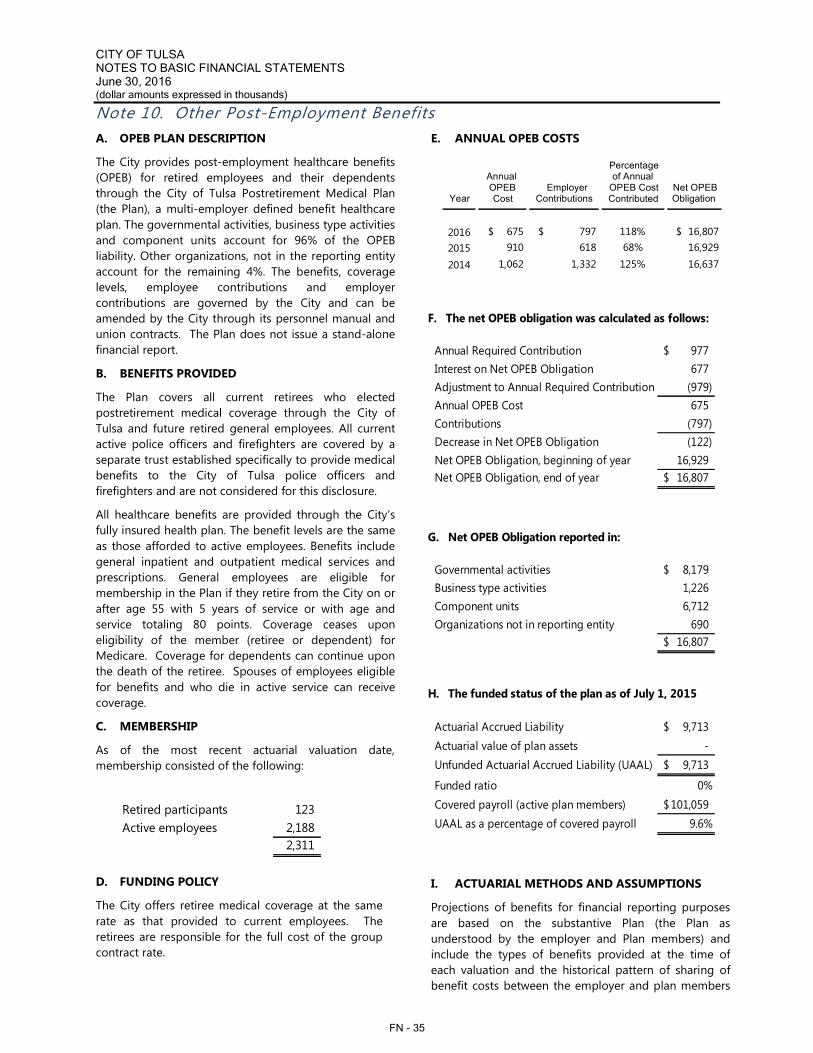
CITY OF TULSA NOTES TO BASIC FINANCIAL STATEMENTS June 30, 2016(dollar amounts expressed in thousands)
FN - 35
A. OPEB PLAN DESCRIPTION
The City provides post-employment healthcare benefits (OPEB) for retired employees and their dependents through the City of Tulsa Postretirement Medical Plan (the Plan), a multi-employer defined benefit healthcare plan. The governmental activities, business type activities and component units account for 96% of the OPEB liability. Other organizations, not in the reporting entity account for the remaining 4%. The benefits, coverage levels, employee contributions and employer contributions are governed by the City and can be amended by the City through its personnel manual and union contracts. The Plan does not issue a stand-alone financial report.
B. BENEFITS PROVIDED
The Plan covers all current retirees who elected postretirement medical coverage through the City of Tulsa and future retired general employees. All current active police officers and firefighters are covered by a separate trust established specifically to provide medical benefits to the City of Tulsa police officers and firefighters and are not considered for this disclosure.
All healthcare benefits are provided through the City’s fully insured health plan. The benefit levels are the same as those afforded to active employees. Benefits include general inpatient and outpatient medical services and prescriptions. General employees are eligible for membership in the Plan if they retire from the City on or after age 55 with 5 years of service or with age and service totaling 80 points. Coverage ceases upon eligibility of the member (retiree or dependent) for Medicare. Coverage for dependents can continue uponthe death of the retiree. Spouses of employees eligible for benefits and who die in active service can receive coverage.
C. MEMBERSHIP
As of the most recent actuarial valuation date, membership consisted of the following:
Retired participants 123 Active employees 2,188
2,311
D. FUNDING POLICY
The City offers retiree medical coverage at the same rate as that provided to current employees. The retirees are responsible for the full cost of the group contract rate.
E. ANNUAL OPEB COSTS
Year
AnnualOPEBCost
EmployerContributions
Percentageof Annual
OPEB Cost Contributed
Net OPEB Obligation
2016 $ 675 $ 797 118% $ 16,807 2015 910 618 68% 16,929
2014 1,062 1,332 125% 16,637
F. The net OPEB obligation was calculated as follows:
Annual Required Contribution 977$ Interest on Net OPEB Obligation 677 Adjustment to Annual Required Contribution (979) Annual OPEB Cost 675 Contributions (797) Decrease in Net OPEB Obligation (122) Net OPEB Obligation, beginning of year 16,929 Net OPEB Obligation, end of year 16,807$
G. Net OPEB Obligation reported in:
Governmental activities 8,179$ Business type activities 1,226 Component units 6,712 Organizations not in reporting entity 690
16,807$
H. The funded status of the plan as of July 1, 2015
Actuarial Accrued Liability 9,713$ Actuarial value of plan assets - Unfunded Actuarial Accrued Liability (UAAL) 9,713$
Funded ratio 0%Covered payroll (active plan members) 101,059$ UAAL as a percentage of covered payroll 9.6%
I. ACTUARIAL METHODS AND ASSUMPTIONS
Projections of benefits for financial reporting purposes are based on the substantive Plan (the Plan as understood by the employer and Plan members) and include the types of benefits provided at the time of each valuation and the historical pattern of sharing of benefit costs between the employer and plan members

CITY OF TULSA NOTES TO BASIC FINANCIAL STATEMENTS June 30, 2016(dollar amounts expressed in thousands)
FN - 36
to that point. The actuarial methods and assumptions used include techniques that are designed to reduce short-term volatility in actuarial accrued liabilities and the actuarial value of assets, consistent with the long-term perspective of the calculations.
Actuarial valuations of an ongoing plan involve estimates of the value of reported amounts and assumptions about the probability of occurrence of events far into the future. Examples include assumptions about future employment, mortality and the healthcare
cost trend. Amounts determined regarding the funded status of the plan and the annual required contributions of the employer are subject to continual revision as actual results are compared with past expectations and new estimates are made about the future. The schedule of funding progress, presented as required supplementary information following the notes to financial statements, presents multi-year trend information that shows whether the actuarial value of plan assets is increasing or decreasing over time relative to the actuarial accrued liabilities for benefits.
Valuation date July 1, 2015
Actuarial cost method Entry Age Normal
Amortization method Level dollar
Remaining amortization periods 30 years open
Discount rate 4.0%
Inflation rate 3.0%
Initial annual healthcare cost trend rate 8.5%
Annual reduction of healthcare cost trend rate 0.5%
Ultimate annual healthcare cost trend rate 5%
Actuarial Methods and Assumptions

CITY OF TULSA NOTES TO BASIC FINANCIAL STATEMENTS June 30, 2016(dollar amounts expressed in thousands)
FN - 37
A. LONG-TERM LIABILITIES
A summary of long-term liability activity is as follows (detailed information is available on the following pages):
Beginning Balance Additions Reductions Ending Balance
Due Within One Year
PRIMARY GOVERNMENT
Governmental activities:
General obligation bonds 452,850$ 80,133$ (67,607)$ 465,376$ 52,053$
Revenue bonds 6,980 - (1,340) 5,640 1,365
Other long-term liabilities 295,571 80,049 (47,143) 328,477 31,848
Premium on debt issuance - GO bonds 15,443 3,858 (3,974) 15,327 -
Premium on debt issuance - Revenue bonds 401 - (133) 268 -
Total governmental activities 771,245 164,040 (120,197) 815,088 85,266
Business-type activities:
Revenue bonds 98,905 - (3,065) 95,840 3,260
Unamortized discount--revenue bonds (119) - 6 (113) -
Unamortized premium--revenue bonds 21 - (1) 20 -
Compensated absences 702 937 (936) 703 504
Other post-employment benefits 1,166 60 - 1,226 -
Pension liability 6,795 6,008 (126) 12,677 -
Contract obligation 66 - (66) - -
Total business-type activities 107,536 7,005 (4,188) 110,353 3,764
Total primary government 878,781$ 171,045$ (124,385)$ 925,441$ 89,030$
COMPONENT UNITS
Revenue bonds:
TAIT 176,370$ $ - (9,425)$ 166,945$ 7,820$
TMUA 141,110 27,450 (9,810) 158,750 10,460
TPA 14,470 - (1,750) 12,720 1,790
Premium on debt issuance - TMUA 2,570 1,173 (415) 3,328 -
Premium on debt issuance - TAIT 7,457 - (439) 7,018 -
Unamortized bond discount - TAIT (613) - 47 (566) -
Premium on debt issuance - TPA 559 - (93) 466 -
341,923 28,623 (21,885) 348,661 20,070
General obligation bonds - TMUA 29,610 5,587 (10,633) 24,564 6,627
Premium on debt issuance - TMUA 808 441 (310) 939 -
30,418 6,028 (10,943) 25,503 6,627
Promissory notes - TMUA 248,547 11,971 (17,851) 242,667 15,436
Unamortized bond discount - TMUA (90) - 14 (76) -
Premium on debt issuance - TMUA 8,488 - (505) 7,983 -
256,945 11,971 (18,342) 250,574 15,436
Capital lease 3,982 - (194) 3,788 200
Watermain extension contracts 3,801 - (437) 3,364 366
Claims and judgments - Airport 860 - (143) 717 158
Compensated absences 5,802 3,897 (3,975) 5,724 2,999
Other post-employment benefits 6,669 67 (24) 6,712 -
Pension liability 52,139 38,556 (653) 90,042 -
Total component units 702,539$ 89,142$ (56,596)$ 735,085$ 45,856$

CITY OF TULSA NOTES TO BASIC FINANCIAL STATEMENTS June 30, 2016(dollar amounts expressed in thousands)
FN - 38
The City issues general obligation bonds to provide funds for the acquisition and construction of major capital facilities and for improvements to the waste water utility system, an operation of TMUA, a component unit. The bonds are direct obligations and pledge the full faith and credit of the City.
General obligation bonds issued for governmental activity purposes are liquidated by the Debt Service Fund. General obligation bonds issued for a component unit’s activity is liquidated by the component unit.
The General Fund is typically used to liquidate other governmental long-term liabilities for pension, compensated absences, and other post-employment benefits. The Debt Service Fund is used to liquidate general obligation bonds and judgments.
Revenue bonds issued for governmental activities are liquidated by the TPFA internal service fund from lease and loan repayments.
Revenue bonds, promissory notes and other long term liabilities of business-type activities or by component units are repaid from those activities or component units.
B. PRIMARY GOVERNMENT The Constitution of Oklahoma prohibits the City from becoming indebted for any amount exceeding the revenue to be received for any fiscal year, without the approval of the voters. General obligation bonds have been approved by the voters and issued by the City for various municipal improvements. These bonds are to be fully paid, generally within 20 years from the date of issue, and are backed by the full faith and credit of the City. General Obligation Bond Refunding - On April 28, 2016, the City issued $28,720 in Series 2016A General Obligation Refunding Bonds. The proceeds of the issue along with $3,636 of other City resources were used to currently refund the City’s Series 2008 General Obligation Bonds. The transaction will reduce debt service payments by approximately $6,805 over the next 3 years and result in an economic gain (difference between the present values of the debt service payments on the old and new debt) of approximately $3,221. The refunding resulted in a deferred loss of $561 which will be amortized over the life of the new bonds.

CITY OF TULSA NOTES TO BASIC FINANCIAL STATEMENTS June 30, 2016(dollar amounts expressed in thousands)
FN - 39
Primary government long-term liability activity is as follows:
Issue Maturity Interest Beginning Ending Due WithinAmount Date Rate Balance Additions Reductions Balance One Year
Governmental activitiesGeneral obligation bonds: Series 2004-A, Refunding 28,021$ 2016 5.0% 2,486$ -$ (2,486)$ -$ -$ Series 2008 35,851 2028 4.0-4.75% 24,494 - (24,494) - - Series 2009 48,454 2029 3.0-4.25% 35,593 - (2,572) 33,021 2,572 Series 2009B 70,000 2019 5.0% 38,800 - (7,800) 31,000 7,800 Series 2009A, Refunding 9,153 2019 3.5-4.0% 3,877 - (988) 2,889 969 Series 2009B, Refunding 14,405 2021 3.5-5.0% 7,509 - (1,298) 6,211 1,271 Series 2010 70,000 2020 0.05 46,600 - (7,800) 38,800 7,800 Series 2011 50,000 2031 3.0-3.50% 44,700 - (2,650) 42,050 2,650 Series 2011A, Refunding 21,105 2022 2.50-4.25% 12,625 - (1,965) 10,660 1,910 Series 2013A, Refunding 23,746 2025 2.50% 19,093 - (2,214) 16,879 2,141 Series 2013 45,000 2023 4.0% 40,000 - (5,000) 35,000 5,000 Series 2014 50,000 2034 3.0-4.0% 50,000 - (2,660) 47,340 2,630 Series 2014A, Refunding 15,875 2026 2.0-3.0% 15,875 - (1,680) 14,195 1,626 Series 2015 70,000 2040 2.0-3.25% 70,000 - - 70,000 2,955 Series 2015A, Refunding 41,198 2027 2.0-2.5% 41,198 - (4,000) 37,198 3,869 Series 2016 57,000 2036 3.0% - 57,000 - 57,000 - Series 2016A, Refunding 23,133 2019 5.0% - 23,133 - 23,133 8,860
452,850 80,133 (67,607) 465,376 52,053
Premium on debt issuance 15,443 3,858 (3,974) 15,327 -
468,293 83,991 (71,581) 480,703 52,053
Revenue bonds: Capital Improvements - 2012 10,900$ 2020 3.0-4.0% 6,980 - (1,340) 5,640 1,365 Premium on debt issuance 401 - (133) 268 -
7,381 - (1,473) 5,908 1,365 Other long-term liabilities: Compensated absences 29,273 21,043 (20,738) 29,578 21,205 Other post-employment benefits 8,411 23 (255) 8,179 - Pension liability 224,740 46,776 (11,270) 260,246 - Claims and judgments 31,435 12,207 (14,537) 29,105 10,300 Due to other governments 1,712 - (343) 1,369 343
295,571 80,049 (47,143) 328,477 31,848
Total governmental activities 771,245$ 164,040$ (120,197)$ 815,088$ 85,266$
Business-type activitiesRevenue bonds: Lease Rev Bonds 2007A 34,620$ 2037 4.625-5.25% 34,620$ -$ -$ 34,620$ -$ Lease Rev Bonds 2007B 33,130 2029 5.58 - 6.60% 23,925 - - 23,925 - Capital Improvements - 2008 16,000 2027 6.07% 10,755 - (1,095) 9,660 1,190 Capital Improvements - 2012, Refunding 9,480 2018 1.25% 6,860 - (1,400) 5,460 1,485 Improvement District - 2013, Tax-exempt 19,355 2038 4.26% 18,890 - (475) 18,415 490 Improvement District - 2013, Taxable 3,950 2038 5.24% 3,855 - (95) 3,760 95
98,905 - (3,065) 95,840 3,260
Unamortized discount (119) - 6 (113) - Unamortized premium 21 - (1) 20 -
98,807 - (3,060) 95,747 3,260 Other long-term liabilities: Compensated absences 702 937 (936) 703 504 Other post-employment benefits 1,166 60 - 1,226 - Pension liability 6,795 6,008 (126) 12,677 - Contract obligation 66 - (66) - -
Total business-type activities 107,536$ 7,005$ (4,188)$ 110,353$ 3,764$

CITY OF TULSA NOTES TO BASIC FINANCIAL STATEMENTS June 30, 2016(dollar amounts expressed in thousands)
FN - 40
Summary of general obligation bonds outstanding and allocation between primary government and component units, at year end:
Ending Primary Component
General Obligation Series Balance Government Units
Series 2009 (6.4604247% Sewer) 35,300$ 33,021$ 2,279$
Series 2009B 31,000 31,000 -
Series 2009A, Refunding (37.668% Sewer) 4,635 2,889 1,746
Series 2009B, Refunding (30.5625% Sewer) 8,945 6,211 2,734
Series 2010 38,800 38,800 -
Series 2011 42,050 42,050 -
Series 2011A, Refunding 10,660 10,660 -
Series 2012A, Refunding (100% Sewer) 1,955 - 1,955
Series 2013A Refunding (26.438% Sewer) 22,945 16,879 6,066
Series 2013 35,000 35,000 -
Series 2014 47,340 47,340 -
Series 2014A, Refunding (2.6354839% Sewer) 14,580 14,195 385
Series 2015 70,000 70,000 -
Series 2015A, Refunding (9.2949512% Sewer) 41,010 37,198 3,812
Series 2016 57,000 57,000 -
Series 2016A Refunding (19.45405530% Sewer) 28,720 23,133 5,587
489,940$ 465,376$ 24,564$
C. COMPONENT UNITS
1. Revenue Bonds
Revenue bonds outstanding include debt issued by component units of the City. The debt of these component units does not constitute debt of the City and is payable solely from resources of the authorities or trusts. Revenue bonds are collateralized primarily by the trust estates and revenues derived there from.
Various bond indentures, loan agreements, and pledge and security agreements contain significant limitations and restrictions for annual debt requirements and flow of monies through various restricted accounts.
2. Promissory Notes
TMUA’s outstanding loans with the Oklahoma Water Resources Board are collateralized by a first lien and security interest in the TMUA’s wastewater treatment system and the revenues derived there from and generally requires semi-annual principal and interest payments.
3. TMUA Line of Credit
On July 10, 2013 TMUA approved a $10,000 line of credit agreement with a banking institution. The agreement is for an initial two year term and renewable in two year increments thereafter. In October 2016, TMUA approved the first amendment to the agreement, extending the maturity date to October 22, 2017. The applicable interest rate is the 30 day LIBOR plus 1.75%. There have been no draws under the agreement.
4. Conduit Debt – Tulsa International Airport
To pay the costs of certain modifications, rehabilitation, and reconstruction to special facilities located at the Tulsa International Airport, the Airport issued a series of Special Facility Revenue Bonds. At June 30, 2016, Special Facility Revenue Bonds outstanding aggregated $10,120.
The outstanding amounts are special limited obligations of the Airport, payable solely from and collateralized by

CITY OF TULSA NOTES TO BASIC FINANCIAL STATEMENTS June 30, 2016(dollar amounts expressed in thousands)
FN - 41
a pledge of rentals to be received from a lease agreement between the Airport and Biz Jet International. The bonds do not constitute a debt or pledge of the faith and credit of the Airport or the City, and accordingly, neither the assets nor the debt are reported in the accompanying financial statements.
5. Tulsa Industrial Authority
Notes and bonds issued by the Tulsa Industrial Authority are utilized by industrial, commercial and other
organizations to promote economic development within and near the territorial limits of the City of Tulsa.
TIA loans the proceeds from the notes and bonds to organizations or enters into lease-purchase agreements for the facilities. The notes and bonds issued by TIA are special and limited obligations payable solely out of revenues from the loan agreements and security provided by the loan agreements. At June 30, 2016, the aggregate outstanding principal balances due on these notes and bonds are approximately $134,000.

CITY OF TULSA NOTES TO BASIC FINANCIAL STATEMENTS June 30, 2016(dollar amounts expressed in thousands)
FN - 42
Component Units long-term liability activity is as follows:
Authorized Maturity Interest Beginning Ending Due Within
Amount Date Rate Balance Additions Reductions Balance One YearREVENUE BONDS:Tulsa Airports Improvement Trust
Series 2004-B 2,200$ 2017 4.95% 400$ -$ (200)$ 200$ 200$ Series 2009-D 56,615 2031 2.726-7.759% 49,020 - (840) 48,180 650 Series 2010-A 5,770 2021 4.57-5.0% 3,860 - (580) 3,280 605 Series 2010-B 8,215 2021 6.0-6.50% 5,040 - (725) 4,315 765 Series 2010-C 13,520 2025 4.0-5.25% 7,705 - (1,515) 6,190 1,520 Series 2013-A 33,665 2043 5.0-5.25% 33,665 - - 33,665 600 Series 2013-B 3,275 2043 1.389-5.087% 3,045 - (235) 2,810 240 Series 2015-A 44,045 2045 2.0-5.0% 43,755 - (1,650) 42,105 1,510 Series 2015-B 6,670 2018 2.0-4.0% 5,025 - (1,665) 3,360 1,640 Series 2015-C 895 2045 2.0-4.25% 895 - (20) 875 20 Series 2015-D 24,395 2028 2.0-5.0% 23,960 - (1,995) 21,965 70
176,370 - (9,425) 166,945 7,820
Premium on debt issuance 7,457 - (439) 7,018 - Unamortized discount (613) - 47 (566) -
183,214 - (9,817) 173,397 7,820 Tulsa Metropolitan Utility Authority
Series 2009 21,500$ 2029 3.0-4.75% 17,270$ -$ (810)$ 16,460$ 840$ Series 2010 14,510 2030 2.5-4.0% 12,825 - (590) 12,235 610 Series 2011 24,100 2031 3.0-4.375% 20,675 - (875) 19,800 900 Series 2012 Refunding 12,685 2025 2.0-2.65% 9,795 - (970) 8,825 975 Series 2013 Refunding 61,280 2025 2.5-3.0% 52,780 - (4,400) 48,380 4,480 Series 2014 17,825 2034 2.0-3.50% 17,825 - (660) 17,165 665 Series 2015 9,940 2027 2.0-3.0% 9,940 - (1,505) 8,435 670 Series 2016A 16,565 2031 3.0-3.25% - 16,565 - 16,565 900 Series 2016B 10,885 2036 2.0-3.50% - 10,885 - 10,885 420
141,110 27,450 (9,810) 158,750 10,460
Premium on debt issuance 2,570 1,173 (415) 3,328 -
143,680 28,623 (10,225) 162,078 10,460 Tulsa Parking Authority
Series 2012 - Refunding 17,860$ 2028 2.0-4.0% 14,470 - (1,750) 12,720 1,790
Premium on debt issuance 559 - (93) 466 -
15,029 - (1,843) 13,186 1,790
341,923$ 28,623$ (21,885)$ 348,661$ 20,070$
Continued

CITY OF TULSA NOTES TO BASIC FINANCIAL STATEMENTS June 30, 2016(dollar amounts expressed in thousands)
FN - 43
Component Units long-term liability activity, continued
Issue Maturity Interest Beginning Ending Due WithinDescription Amount Date Rate Balance Additions Reductions Balance One Year
PROMISSORY NOTES:
Tulsa Metropolitan Utility Authority
Series 1997-A, Sanitary Sewer 4,035$ 2016 0.50% 309$ -$ (206)$ 103$ 103$
Series 1998-B, Sanitary Sewer 4,392 2017 0.50% 573 - (229) 344 229
Series 2001-B, Sanitary Sewer 4,996 2020 0.50% 1,315 - (263) 1,052 263
Series 2002-D, Sanitary Sewer 6,813 2021 0.50% 2,271 - (349) 1,922 349
Series 2004-B, Sanitary Sewer 1,560 2023 0.50% 680 - (80) 600 80
Series 2005-B, Sanitary Sewer 7,900 2027 0.50-2.74% 5,252 - (349) 4,903 360
Series 2005-C, Sanitary Sewer 1,203 2025 0.50% 631 - (60) 571 60
Series 2006-A, Sanitary Sewer 3,130 2027 0.50-2.74% 2,027 - (134) 1,893 139
Series 2006-B, Sanitary Sewer 835 2016 1.51% 105 - (105) - -
Series 2006-C, Sanitary Sewer 17,825 2029 0.50-2.77% 13,170 - (729) 12,441 753
Series 2006, Sanitary Sewer 52,585 2025 4.145-5.145% 35,430 - (2,545) 32,885 2,650
Series 2007-A, Sanitary Sewer 5,131 2026 0.50% 3,026 - (263) 2,763 263
Series 2007-B, Sanitary Sewer 8,365 2026 4.020-4.645% 5,880 - (384) 5,496 402
Series 2009-A, Sanitary Sewer 11,320 2032 3.22% 8,309 - (566) 7,743 566
Series 2009-B, Sanitary Sewer 7,350 2032 2.91% 4,644 - (213) 4,431 221
Series 2010-A, Sanitary Sewer 27,757 2032 2.89% 20,522 3,080 (1,388) 22,214 1,388
Series 2010-B, Sanitary Sewer 29,380 2030 3.145-5.145% 25,045 - (1,160) 23,885 1,195
Series 2011 A, Sanitary Sewer 23,480 2033 3.11% 19,828 1,487 (1,174) 20,141 1,174
Series 2011-B, Sanitary Sewer 14,275 2031 2.145-5.145% 12,750 - (535) 12,215 555
Series 2011 C, Sanitary Sewer 16,700 2034 2.55% 15,032 - (835) 14,197 835
Series 2012A, Sanitary Sewer 4,347 2034 2.43% 1,450 1,980 (217) 3,213 217
Series 2012-B. Sanitary Sewer 11,355 2032 2.145-3.395% 10,260 - (445) 9,815 455
Series 2012C, Sanitary Sewer 2,450 2017 2.145-4.145% 1,490 - (490) 1,000 495
Series 2013A, Sanitary Sewer 9,850 2035 2.24% 922 3,336 - 4,258 493
Series 2013B, Sanitary Sewer 27,605 2033 2.645-5.145% 26,250 - (960) 25,290 985
Series 2014A (ORF-14-0002-CW) 2,910 2035 2.58% 522 1,875 (73) 2,324 146
Series 2014B (FAP-14-0001-L) 10,180 2033 2.145-4.06% 9,955 - (415) 9,540 420
Series 2014C (FAP-14-0004-L) 17,735 2034 2.145-5.145% 17,735 - (520) 17,215 640
Series 2015A (ORF-16-0001-CW) 28,330 2038 2.46% - 213 - 213 -
Series 2009C (ORF-09-0007-DW) 5,225 2031 3.32% 3,164 - (3,164) - -
248,547 11,971 (17,851) 242,667 15,436
Premium on debt issuance-TMUA 8,488 - (505) 7,983 -
Unamortized discount-TMUA (90) - 14 (76) -
256,945$ 11,971$ (18,342)$ 250,574$ 15,436$
GENERAL OBLIGATION BONDS:
Tulsa Metropolitan Utility Authority
Series 2004-A, Refunding 949$ 2016 5.0% 84$ -$ (84)$ -$ -$
Series 2008, Sanitary Sewer 8,659 2028 4.0-4.75% 5,916 - (5,916) - -
Series 2009, Sanitary Sewer 3,346 2029 3.0-4.25% 2,457 - (178) 2,279 178
Series 2009A Refunding, Sanitary Sewer 5,532 2019 3.5-4.0% 2,343 - (597) 1,746 586
Series 2009B Refunding, Sanitary Sewer 6,340 2021 4.0-5.0% 3,306 - (572) 2,734 559
Series 2012A Refunding, Sanitary Sewer 10,575 2017 4.0% 3,990 - (2,035) 1,955 1,955
Series 2013A Refunding, Sanitary Sewer 8,534 2025 2.50% 6,862 - (796) 6,066 769
Series 2014A Refunding, Sanitary Sewer 430 2026 2.0-3.0% 430 - (45) 385 44
Series 2015A Refunding, Sanitary Sewer 4,222 2027 2.0-2.5% 4,222 - (410) 3,812 396
Series 2016A Refunding, Sanitary Sewer 5,587 2019 5.00% - 5,587 - 5,587 2,140
29,610 5,587 (10,633) 24,564 6,627
Premium on debt issuance-TMUA 808 441 (310) 939 -
30,418$ 6,028$ (10,943)$ 25,503$ 6,627$

CITY OF TULSA NOTES TO BASIC FINANCIAL STATEMENTS June 30, 2016(dollar amounts expressed in thousands)
FN - 44
Principal and Interest Payments in Subsequent Years:
Year Principal Interest Principal Interest Principal Interest
2017 52,053$ 15,779$ 4,625$ 5,147$ 56,678$ 20,926$ 2018 54,420 13,722 4,475 4,977 58,895 18,699 2019 51,210 11,596 5,230 4,818 56,440 16,414 2020 44,083 9,605 4,690 4,617 48,773 14,222 2021 36,082 8,132 3,430 4,369 39,512 12,501 2022-2026 109,861 27,938 18,275 18,733 128,136 46,671 2027-2031 66,242 14,270 21,400 12,762 87,642 27,032 2032-2036 39,765 5,229 25,595 6,930 65,360 12,159 2037-2041 11,660 941 13,760 820 25,420 1,761
465,376$ 107,212$ 101,480$ 63,173$ 566,856$ 170,385$
Year Principal Interest Principal Interest Principal Interest Principal Interest
2017 6,627$ 884$ 20,070$ 14,894$ 15,436$ 8,760$ 42,133$ 24,538$ 2018 4,550 619 20,085 14,229 15,736 8,295 40,371 23,143 2019 3,810 436 20,645 13,555 15,209 7,786 39,664 21,777 2020 1,807 284 20,270 12,828 15,574 7,270 37,651 20,382 2021 1,798 225 20,335 11,743 15,676 6,749 37,809 18,717 2022-2026 5,164 517 107,920 48,230 82,452 24,648 195,536 73,395 2027-2031 808 49 82,645 25,050 61,271 10,563 144,724 35,662 2032-2036 - - 20,985 9,624 21,313 1,381 42,298 11,005 2037-2041 - - 15,125 5,238 - - 15,125 5,238 2042-2045 - - 10,335 1,128 - - 10,335 1,128
24,564$ 3,014$ 338,415$ 156,519$ 242,667$ 75,452$ 605,646$ 234,985$
General Obligation Revenue Bonds Total
Primary Government
TotalComponent Units
General Obligation Revenue Bonds Promissory Notes
D. APPLICABILITY OF FEDERAL ARBITRAGE REGULATIONS Debt issuances of the City and various Authorities issued after the Tax Reform Act of 1986 are subject to the federal arbitrage regulations. The arbitrage rebate regulations require that all earnings from the investment of gross proceeds of a bond issue in excess of the amount that could have been earned, had the yield on
the investment been equal to the yield on the bonds, be remitted to the federal government. These rules carry strict penalties for noncompliance, including taxability of interest retroactive to the date of the issue. City management believes the City is in compliance with these rules and regulations.

CITY OF TULSA NOTES TO BASIC FINANCIAL STATEMENTS June 30, 2016(dollar amounts expressed in thousands)
FN - 45
E. DEFEASED DEBT
Certain outstanding general obligation and revenue bonds of the City and its component units have been defeased by placing the proceeds of refunding bondsand cash received from a tenant in irrevocable escrow accounts held and managed by bank trustees, and invested in U. S. Treasury obligations, the principal and interest on which would provide amounts sufficient to
pay the principal and interest on the defeased bonds in accordance with the schedule of remaining payments due. Accordingly, the escrow accounts and the defeased bonds are not included in the financial statements of the City or its component units. The defeased bonds outstanding and considered extinguished are as follows:
___________Tulsa Airports Improvement Trust____________ 1997B Revenue Bonds $ 2,450
2000A Revenue Bonds $ 3,525

CITY OF TULSA NOTES TO BASIC FINANCIAL STATEMENTS June 30, 2016(dollar amounts expressed in thousands)
FN - 46
The details for the City’s Governmental Funds fund balances are:
Other Total
General Debt Service Bond Sales Tax Funds FundsFund balances:
Nonspendable:Not in spendable form:Advances to other funds 567$ -$ -$ -$ -$ 567$
Land held for sale 44 - - - - 44 611 - - - - 611
Restricted for:Economic stabilization reserve 2,000 - - - - 2,000 Debt service - 65,723 - - - 65,723 Capital projects - - 166,748 211,435 7,091 385,274 Federal and state grants - - - - 4,750 4,750 E-911 operations - - - - 288 288 Economic development - - - - 1,608 1,608 Tulsa Stadium district improvements - - - - 681 681 Law enforcement training - - - - 18 18 Juvenile crime - - - - 5 5 Other governmental purposes - - - - 449 449
2,000 65,723 166,748 211,435 14,890 460,796 Committed:
Medical services program - - - - 3,227 3,227 Operation of Air Force Plant 3 facility - - - - 1,420 1,420 Whittier Square district improvements - - - - 44 44
- - - - 4,691 4,691 Assigned to:
Budgetary resources - subsequent year 5,183 - - - - 5,183 Unassigned 54,252 - - - (310) 53,942
62,046$ 65,723$ 166,748$ 211,435$ 19,271$ 525,223$
The purpose of governmental funds and their revenue sources are listed below:
Major Governmental Funds Revenue sources Purpose
Debt Service Property tax To pay debt service on General Obligation bonds and Judgments
Bond Proceeds from bond issuances Capital Improvements
Sales Tax Sales taxes Capital Improvements
GovernmentalGovernmental

CITY OF TULSA NOTES TO BASIC FINANCIAL STATEMENTS June 30, 2016(dollar amounts expressed in thousands)
FN - 47
1. Revenues Pledged in Connection with Proprietary Fund Debt
Lease Revenue Bonds 2007A&B – TPFA has pledged future gross lease revenues derived from the operation of the OTC facility, including money received from the City pursuant to the lease and other funds, to repay approximately $77,230 in revenue bonds. Proceeds from the bonds provided financing for the acquisition and improvement of the facilities. The bonds are payable from new and existing leases and other revenues and are payable through 2038. Annual principal and interest payments on the bonds required 59% of gross revenues. The total principal and interest remaining to be paid on the bonds is $108,509. Principal and interest paid on the bonds amounted to $4,739. Total gross revenues were $8,061.
Capital Improvements 2008 - TPFA has pledged future sponsorship and naming rights revenues derived from the operation of the BOK Arena to repay approximately $16,000 in capital improvement bonds. Proceeds from the bonds provided financing for the acquisition, construction, furnishing and equipping of capital improvements and additions to the BOK Arena. The bonds are payable from new and existing sponsorship and naming rights revenues and are payable through 2027. Annual principal and interest payments on the bonds required 84% of gross revenues. The total principal and interest remaining to be paid on the bonds is $13,147. Principal and interest paid for the year was $1,748. Total gross sponsorship and naming rights revenues were $2,080.
Capital Improvements 2012 - TPFA has entered into a projects agreement with TARE to provide financing for the acquisition and delivery of trash carts and other capital improvements for use in the operations of TARE’s system for solid waste management providing collection and disposal of residential solid waste. In return TARE has pledged future revenues to repay $10,900 in capital improvement bonds issued payable through 2020. Total principal and interest remaining to be paid on the bonds is $6,210. Principal and interest paid for the year was $1,608. Total solid waste collection and disposal revenue was $26,599.
Improvement District Series 2013 – TST has pledged future gross revenues derived from operations of the baseball stadium and related facilities to repay approximately $22,175 in revenue bonds. Proceeds from the bonds provided financing for construction of the baseball stadium and related facilities. The bonds are payable from gross revenues along with property tax assessments of the Tulsa Stadium Improvement District
received from the City and are payable through 2039. Annual principal and interest payments on the bonds required 64% of total gross revenues. The total principal and interest remaining to be paid on the bonds is $36,787. Principal and interest required to be paid for the year was $1,602 exclusive of any additional amounts paid. Total gross revenues were $282 and property tax assessments received from the City were $2,215.
2. Revenues Pledged in Connection with Component Unit Debt
TMUA - TMUA has pledged future water and wastewater customer revenues, net of specified operating expenses, to repay $158,750 in water and wastewater system revenue bonds and $242,667 in wastewater promissory notes. Proceeds from the bonds and promissory notes provided financing for the construction of various water and wastewater capital projects. The bonds and promissory notes are payable solely from water and wastewater net revenues and are payable through 2038. Annual principal and interest payments on the bonds required 25% and 34% of water and wastewater net revenues, respectively. The total principal and interest remaining to be paid on the bonds and promissory notes is $185,453 and $332,897 for water and wastewater, respectively. Combined principal and interest paid for the year were $17,406 and $23,622, for water and wastewater respectively. Total net revenues were $57,416 and $81,038, respectively.
Airports - TAIT has pledged future revenues derived from the operation of the Airports to repay approximately $199,265 in revenue bonds. Proceeds from the bonds provided financing for various airport capital projects and debt refundings. The bonds are payable solely from gross revenues and are payable through 2045. Annual principal and interest payments on the bonds required 42% of gross revenues. The total principal and interest remaining to be paid on the bonds is $279,668. Principal and interest paid for the year was $19,417. Total gross revenues were $45,529.
TPA - TPA has pledged future gross revenues derived from the operation of the parking facilities to repay approximately $17,860 in revenue bonds. Proceeds from the bonds provided financing for various parking facilities and debt refundings. The bonds are payable solely from gross revenues and are payable through 2028. Annual principal and interest payments on the bonds required 28% of gross revenues. The total principal and interest remaining to be paid on the bonds is $15,037. Principal and interest paid for the year were $1,750 and $436, respectively. Total gross revenues were $7,925.

CITY OF TULSA NOTES TO BASIC FINANCIAL STATEMENTS June 30, 2016(dollar amounts expressed in thousands)
FN - 48
Operating Leases
The City has entered into a number of operating leases. These leases contain cancellation provisions and are subject to annual appropriations. Lease expenditures were $444 for all types of leases for the primary government and $611 for its component units.
Capital Leases
On December 2, 1984, TMUA entered a contract with the United States of America to utilize the water storage in Oologah Lake as a source of a municipal and industrial water supply.
The lease terms call for annual payment of principal and interest along with operations and maintenance costs, which is subject to adjustment based upon the consumer price index. The lease carries an interest rate of 3.23% and matures in 2031.
Minimum lease payments under the lease are as follows:
Operating
Principal Interest Expense Total
2017 200$ 122$ 301$ 623$ 2018 206 116 301 623 2019 213 109 301 623 2020 220 102 301 623 2021 227 95 301 623 2022-2026 1,253 361 1,507 3,121 2027-2031 1,469 145 1,507 3,121
3,788$ 1,050$ 4,519$ 9,357$
.

CITY OF TULSA NOTES TO BASIC FINANCIAL STATEMENTS June 30, 2016(dollar amounts expressed in thousands)
FN - 49
Other Litigation: The City is a party to numerous legal proceedings, many of which normally occur in governmental operations. Such litigation includes, but is not limited to, claims assessed against the City for property damages and personal injury, employment related matters, civil rights matters, alleged breaches of contract, condemnation proceedings and other alleged violations of city, state and federal laws. Management believes that the resolution of these matters will not have a material adverse effect on the financial condition of the City government. Resulting judgments, if any, will likely be paid from ad valorem taxes to be received over a three year period.
Federal Grants: In the normal course of operations, the City receives grant funds from various federal and state agencies. The grant programs are subject to audit by agents of the granting authority, the purpose of which is to insure compliance with conditions precedent to the granting of funds. Any liability for reimbursement which may arise as the result of audits of grant funds is not believed to be material.
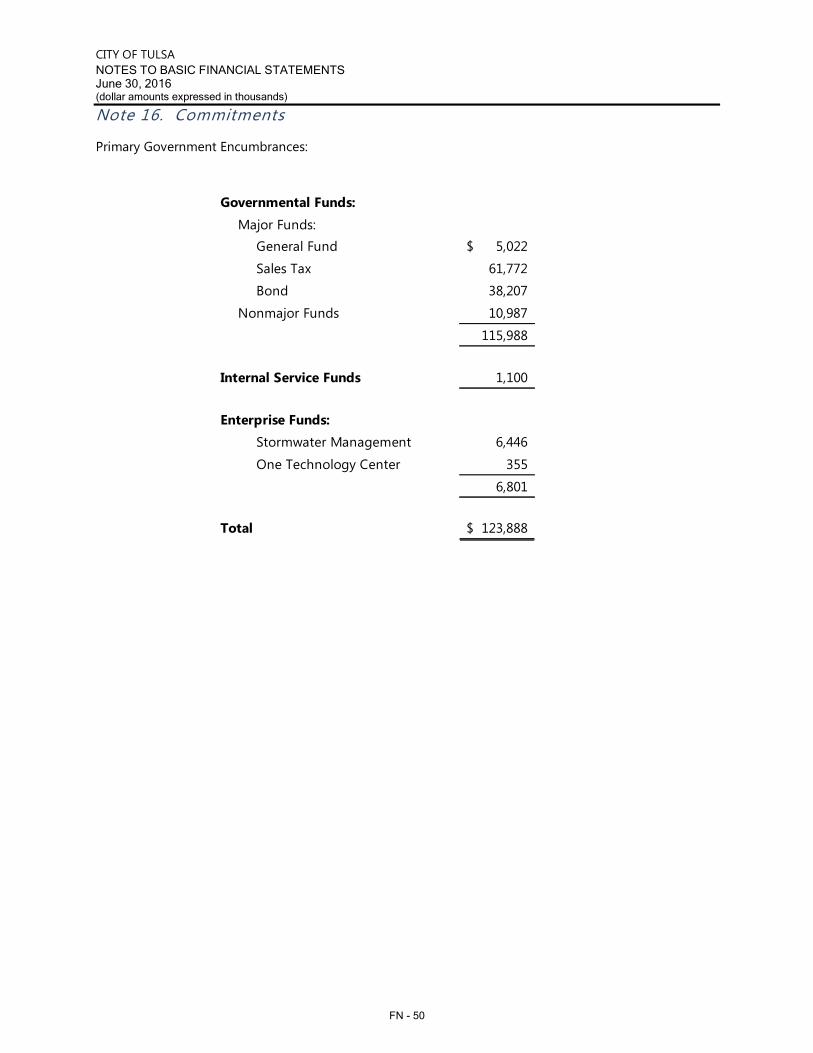
CITY OF TULSANOTES TO BASIC FINANCIAL STATEMENTS June 30, 2016(dollar amounts expressed in thousands)
FN - 50
Primary Government Encumbrances:
Governmental Funds:
Major Funds:General Fund 5,022$
Sales Tax 61,772
Bond 38,207
Nonmajor Funds 10,987
115,988
Internal Service Funds 1,100
Enterprise Funds:
Stormwater Management 6,446
One Technology Center 355
6,801
Total 123,888$

CITY OF TULSANOTES TO BASIC FINANCIAL STATEMENTS June 30, 2016(dollar amounts expressed in thousands)
FN - 51
The City has evaluated events or transactions for potential recognition or disclosure in these financial statements that occurred subsequent to June 30, 2016through December 7, 2016, the date these financial statements were available to be issued.
General Obligation Bonds, Series 2017 – On or around March 2017, the City plans to issue $78,000 in Series 2017 General Obligation Bonds. This issuance is for the purpose of constructing, reconstructing, improving and repairing streets and bridges.
General Obligation Refunding Bonds, Series 2017A – On or around March 2017, the City plans to issue $33,355 in Series 2017A General Obligation Refunding Bonds. The proceeds will currently refund the City’s Series 2009 General Obligation bonds.
TMUA Revenue Bonds Refunding Series 2016C – On July 7, 2016 the Authority issued the Series 2016C Revenue Bonds in the amount of $34,810. The bonds mature in 2025 and require annual principal payments and semiannual interest payments at a rate of 5.0%. Proceeds will be used to refund the 2006 promissory note in the amount of $32,885 and the 2007B promissory note in the amount of $5,496.
TMUA Revenue Bonds Refunding Series 2017A – On November 16, 2016 the Authority approved the issuance of the Series 2017A Refunding Bonds in the principal amount of $27,765. Proceeds will be used to refund the Series 2009 Revenue Bonds in the amount of $16,460and the 2010 Revenue Bonds in the amount of $11,935.
TPFA 2008 Capital Improvement Bonds – On October 5, 2016 Moody’s Investment Service downgraded their rating on the Authority’s Series 2008 Capital Improvement bonds to Aa3 from Aa2, with the outlook remaining stable. The downgrade is a result of a nationwide change in Moody’s methodology and classification of the BOK Arena activities as not related to a core governmental service.

CITY OF TULSANOTES TO BASIC FINANCIAL STATEMENTS June 30, 2016(dollar amounts expressed in thousands)
FN - 52
The Governmental Accounting Standards Board (GASB) has issued several statements not yet effective and not yet implemented by the City. The City plans to implement all applicable standards by the required dates.
GASB Statement No. 75 – Accounting and Financial Reporting for Postemployment Benefits Other Than Pensions – Issued in June 2016, will be effective for the City beginning with its fiscal year ending June 30, 2018. This Statement replaces the requirements of GASB Statement No. 45, Accounting and Financial Reporting by Employers for Postemployment Benefits Other Than Pensions and requires governments to report a liability on the face of the financial statements for the OPEB they provide and outlines the reporting requirements by governments for defined benefit OPEB plans administered through a trust, cost-sharing OPEB plans administered through a trust and OPEB not provided through a trust. This Statement also requires governments to present more extensive note disclosures and required supplementary information about their OPEB liabilities. GASB Statement No. 77 – Tax Abatement Disclosures - Issued in August 2016, will be effective for the City beginning with its fiscal year ending June 30, 2017. This statement requires governments to disclose information about their own tax abatements separately from information about tax abatements
that are entered into by other governments and which reduce the reporting government’s tax revenues. The disclosures about the government’s own tax abatement agreements includes the purpose of the tax abatement program, the tax being abated, the amount of tax being abated, the provisions of recapturing abated taxes, the types of commitments made by tax abatement recipients, and other commitments made by government in tax abatement agreements. GASB Statement No. 82 – Pension Issues- An Amendment of GASB Statements No. 67, No. 68, and No. 73 - Issued in March 2016, will be effective for the City beginning with its fiscal year ending June 30, 2018. This statement clarified that a deviation, as the term used in Actuarial Standards of Practice is not considered to be in conformity with the requirements of Statement 67, Statement 68, or Statement 73 for the selection of assumptions used in determining the total pension liability and related measures.
Prior to the issues of this Statement, Statements 67 and 68 required presentation of covered employee payroll, which is the payroll of employees that are provided pensions through the pension plan, and ratios that use that measure, in schedules of required supplementary information. This Statement amends Statement 67 and 68 to instead require the presentation of covered payroll, defined as the payroll on which contributions to a pension plan are based and ratios that use that measure.

CITY OF TULSAREQUIRED SUPPLEMENTARY INFORMATION June 30, 2016 (dollar amounts expressed in thousands)
RSI - 1
2016 2015 2014
Total pension liability:
Service cost $ 12,203 $ 12,561 $ 15,518
Interest 41,536 40,928 38,247
Changes of benefit terms - (788) -
Differences between expected and actual experience 2,979 (8,598) (1,581)
Changes of assumptions 61,038 - (71,058)
Benefit payments, including refunds of member contributions (36,326) (35,842) (33,472)
Net change in total pension liability 81,430 8,261 (52,346)
Total pension liability—beginning 547,788 539,527 591,873 Total pension liability—ending (a) $ 629,218 $ 547,788 $ 539,527
Plan fiduciary net position:
Contributions—employer $ 14,016 $ 12,886 $ 12,003
Contributions—member 7,533 7,182 6,677
Net investment income 5,523 10,797 61,164
Benefit payments, including refunds of member contributions (36,326) (35,842) (33,472)
Administrative expense (375) (295) (313)
Net change in plan fiduciary net position (9,629) (5,272) 46,059
Plan fiduciary net position—beginning 422,534 427,806 381,747 Plan fiduciary net position—ending (b) $ 412,905 $ 422,534 $ 427,806
Plan's net pension liability—ending (a) – (b) $ 216,313 $ 125,254 $ 111,721
Notes: Information for years prior to 2014 is not available. Changes of assumptions- In 2016, amounts reported as changes of assumptions resulted primarily from the change in the mortality table from the 1994 Group Annuity Tables, set forward 2 year for males and 1 year for females to the RP-2014 Combined Healthy Mortality Tables with Blue Collar adjustments and generational mortality improvements with Scale MP-2015 from the table’s base year of 2014. Additionally, the discount rate changed from 7.75% to 7.5%. Changes of assumptions- In 2014, amounts reported as changes of assumptions resulted primarily from the change in the discount rate from 6.56% to 7.75%.

CITY OF TULSAREQUIRED SUPPLEMENTARY INFORMATIONJune 30, 2016 (dollar amounts expressed in thousands)
RSI - 2
Year
Primary Government Proportion of Net Pension
Liability
Primary Government
Proportionate Share of Net
Pension Liability
Primary Government
Covered Payroll
Primary Government
Proportionate Share of Net
Pension Liability as a Percentage of its Covered-
Employee Payroll
Plan Fiduciary net Position as a
Percentage of Total Pension
Liability
2016 48.6849% 105,312$ 55,991$ 188% 65.6%
2015 47.7731% 59,838 54,059 111% 77.1%
2014 48.8840% 54,614 52,162 105% 79.3%
Note: Information for years prior to 2014 is not available.

CITY OF TULSAREQUIRED SUPPLEMENTARY INFORMATIONJune 30, 2016 (dollar amounts expressed in thousands)
RSI - 3
Year
Primary Government Contractually
Required Contribution
Primary Government
Actual Contributions
Contribution Deficiency
(Excess)
Primary Government
Covered Payroll
Contributions as a
Percentage of Covered Payroll
2016 6,439$ 6,439$ -$ 55,991$ 11.5%2015 6,217 6,217 - 54,059 11.5%2014 5,216 5,520 (304) 52,162 10.6%2013 5,707 7,061 (1,354) 57,070 12.4%2012 4,988 6,886 (1,898) 53,638 12.8%2011 3,289 3,289 - 52,204 6.3%2010 3,732 3,732 - 59,235 6.3%2009 3,795 3,795 - 60,236 6.3%2008 3,904 3,904 - 61,963 6.3%
Note: Information for years prior to 2008 is not available.

CITY OF TULSAREQUIRED SUPPLEMENTARY INFORMATIONJune 30, 2016 (dollar amounts expressed in thousands)
RSI - 4
2016 2015 2014 2013
1.7% 2.7% 16.9% 11.8%
Annual Money-weighted Rate of Return, Net of Investment Expense
(Information for prior years is not available)
Valuation date January 1, 2016
Actuarial cost method Entry Age Normal
Amortization method Level percent, 30 year closed period beginning January 1, 2016
Remaining amortization periods 30 years
Asset valuation method 5 year smoothed FMV
Investment rate of return 7.50%
Projected salary increases 4.00%-11.75%
Inflation 3.00%
Cost-of-living adjustments None
Mortality RP-2014 Combined Healthy Mortality Tables with Blue Collar adjustments
Generational mortality improvements with Scale
MP-2015 from the table's base year of 2014
Actuarial Valuation, Methods and Assumptions

CITY OF TULSAREQUIRED SUPPLEMENTARY INFORMATIONJune 30, 2016 (dollar amounts expressed in thousands)
RSI - 5
Year
City's Proportion
of Net Pension Liability
City's Proportionate Share of Net
Pension Liability
City's Covered Payroll
City's Proportionate Share of Net
Pension Liability as a
Percentage of its Covered-Employee
Payroll
Plan Fiduciary Net Position as a Percentage
of Total Pension Liability
2016 15.7228% 166,883$ 46,505$ 358.85% 68.3%2015 16.6964% 171,697 42,958 370.92% 68.1%
Note:Information for years prior to 2015 is not available.

CITY OF TULSAREQUIRED SUPPLEMENTARY INFORMATIONJune 30, 2016 (dollar amounts expressed in thousands)
RSI - 6
Contractually Required
Contribution
Contributions in Relation to
the Contractually
Required Contribution
Contribution Deficiency
(Excess)
City’s Covered-Employee
Payroll
Contributions as a
Percentage of Covered-Employee
Payroll
2016 6,511$ 6,511$ -$ 46,505$ 14%2015 6,014 6,014 - 42,958 14%2014 5,995 5,995 - 45,889 13%2013 5,661 5,661 - 43,543 13%2012 5,456 5,456 - 41,968 13%2011 5,092 5,092 - 39,170 13%2010 5,306 5,306 - 40,814 13%2009 5,477 5,477 - 42,127 13%2008 5,265 5,265 - 40,503 13%2007 4,971 4,971 - 38,239 13%

CITY OF TULSAREQUIRED SUPPLEMENTARY INFORMATIONJune 30, 2016 (dollar amounts expressed in thousands)
RSI - 7
Year
City's Proportion of Net Pension
Liability (Asset)
City's Proportionate Share of Net
Pension Liability (Asset)
City's Covered Payroll
City's Proportionate Share of Net
Pension Liability
(Asset) as a Percentage of its Covered-Employee
Payroll
Plan Fiduciary
Net Position as a
Percentage of Total Pension Liability (Asset)
2016 17.8728% 728$ 53,854$ 1.35% 99.8%
2015 19.1732% (6,455) 50,332 -12.82% 101.5%
Note:Information for years prior to 2015 is not available.

CITY OF TULSAREQUIRED SUPPLEMENTARY INFORMATIONJune 30, 2016 (dollar amounts expressed in thousands)
RSI - 8
Contractually Required
Contribution
Contributions in Relation to
the Contractually
Required Contribution
Contribution Deficiency
(Excess)
City’s Covered-Employee
Payroll
Contributions as a
Percentage of Covered-Employee
Payroll
2016 7,001$ 7,001$ -$ 53,854$ 13%2015 6,543 6,543 - 50,332 13%2014 6,594 6,594 - 50,720 13%2013 6,595 6,595 - 50,727 13%2012 6,135 6,135 - 47,189 13%2011 5,961 5,961 - 45,855 13%2010 6,112 6,112 - 47,018 13%2009 6,585 6,585 - 50,653 13%2008 6,429 6,429 - 49,452 13%2007 6,000 6,000 - 46,152 13%

CITY OF TULSAREQUIRED SUPPLEMENTARY INFORMATIONJune 30, 2016 (dollar amounts expressed in thousands)
RSI - 9
Actuarial UAAL as aActuarial Accrued Unfunded Percentage
Actuarial Value of Liability (AAL) AAL Funded Covered of CoveredValuation Assets Entry Age (UAAL) Ratio Payroll Payroll
Date (a) (b) (b-a) (a/b) ( c ) ((b-a)/c)
7/1/15 -$ 9,713$ 9,713$ 0.0% 101,059$ 9.6%7/1/14 - 12,180 12,180 0.0% 100,176 12.2%7/1/13 - 14,216 14,216 0.0% 105,553 13.5%
Schedule of Funding Progress

CITY OF TULSA Required Supplementary Information Year ended June 30, 2016 (dollar amounts expressed in thousands)
RSI - 10
ActualAmounts
BudgetaryOriginal Final Basis
RevenuesTaxes 204,877$ 200,447$ 198,552$ (1,895)$ Licenses and permits 8,121 8,121 8,398 277 Intergovernmental 8,128 8,128 8,411 283 Charges for service 21,146 21,146 17,508 (3,638) Fines and forfeitures 9,900 9,900 7,878 (2,022) Investment income 2,479 2,479 3,035 556 Payments from component unit 13,545 13,545 14,049 504 Miscellaneous 1,932 1,932 3,523 1,591
Total revenues 270,128 265,698 261,354 (4,344)
ExpendituresCurrent
General government 42,647 39,892 38,928 964 Public works and transportation 21,258 20,625 17,087 3,538 Social and economic development 12,260 11,872 11,690 182 Public safety and protection 169,021 172,359 171,085 1,274 Culture and recreation 22,060 21,012 20,878 134 Payments to component units 7,619 7,238 7,238 -
Total expenditures 274,865 272,998 266,906 6,092 Excess (deficiency) of revenuesover expenditures (4,737) (7,300) (5,552) 1,748
Other financing sources (uses)Transfers in 2,203 2,203 3,348 1,145 Transfers out (5,717) (5,717) (5,717) -
Total other financing uses (3,514) (3,514) (2,369) 1,145 Net change in fund balances (8,251) (10,814) (7,921) 2,893
Fund balances, beginning of year 36,109 36,109 36,109 - Fund balances, end of year 27,858$ 25,295$ 28,188 2,893$
Reconciliation to GAAP basis - basis differences:Reserve for encumbrances 5,020 Reserve for advances 567 Reserve for land inventory 44 Receivables 29,184 Non-budgetary payables (1,314) Unearned revenue (175) Decrease in fair value of investments 532
Fund balance - GAAP basis 62,046$
Budgeted AmountsVariance

CITY OF TULSA Required Supplementary Information Year ended June 30, 2016 (dollar amounts expressed in thousands)
RSI - 11
Budgetary Process - City Charter and the Oklahoma Municipal Budget Act (Act) require the Mayor to prepare and submit an annual budget to the City Council for adoption in the form or an ordinance. An annual budget is adopted for the General Fund. There are no major Special Revenue Funds with a legally adopted annual budget.
Budget Policy - Under the Municipal Budgetary Act, it is unlawful for the City to create or authorize creation of a deficit in any fund that is subject to the Act. Transfers of available budgetary balances appropriated for one purpose may be transferred for another purpose with the following levels of approval:
The Budget and Planning Division Manager may approve budget amendments affecting accounts within the same expenditure account group, department, fund and project.
The Mayor has the authority to approve budget amendments of less than $100 from one expenditure account group to another expenditure account group or from one project to another project with the same department and fund.
The City Council has the authority to approve budget amendments from one department to another department and transfers in excess of $100 between account groups within a department.
Generally, appropriations lapse at the end of the fiscal year with the exception of multi-year project appropriations, unexpended grant appropriations and encumbered appropriations. Encumbered appropriations carry over from one year to the next. Budgetary Basis of Accounting - The City’s policy is to prepare the governmental fund type annual budgets on a cash basis, which is modified to include encumbrances as the equivalent of expenditures. Estimated revenues are prepared on a cash basis and may include any available amounts in fund balance. Legal Level of Budgetary Control - Excess of Expenditures over Appropriations - Expenditures cannot exceed appropriations at the legal level of budgetary control. The level at which expenditures cannot exceed appropriations is by department and category of expenditure within a fund. Expenditure categories at this level are personal services, materials and supplies, other services, debt service, and capital outlay. There were no expenditures in excess of appropriations and the legal level of budgetary control. Budgeting and Budgetary Control - The accounting principles employed by the City in its budgetary accounting and reporting system are designed to enhance budgetary control. Certain of these principles differ from those used to present financial statements in accordance with U.S. generally accepted accounting principles. The significant differences are the exclusion of accrued and deferred revenues and accrued expenditures and transfers out from the budgetary-basis statement. Encumbrances - Encumbrance accounting, under which purchase orders, contracts and other commitments for the expenditure of moneys are recorded in order to reserve that portion of the applicable appropriations, is employed as an extension of formal budgetary integration in the funds. Budgetary Amounts – Original and Final - The original budget includes that adopted by ordinance including provision for encumbered amounts carried over from the prior year. The final budget amounts include the original budget along with amendments.

Appendix B
Additional Demographic and Economic Information Regarding the City

2016
2015
2014
2013
2012
2011
2010
2009
2008
2007
Gov
ernm
enta
l act
ivit
ies:
Net
inve
stm
ent i
n ca
pita
l ass
ets
1,28
8,41
4$
1,
235,
482
$
1,16
7,49
5$
1,
111,
600
$
1,10
4,67
9$
98
9,91
8$
967,
462
$
95
1,46
6$
952,
282
$
1,
032,
890
$
Rest
ricte
d27
3,64
2
262,
022
26
3,30
3
239,
504
24
4,25
7
160,
049
12
1,16
1
132,
695
14
8,55
3
123,
475
U
nres
tric
ted
(197
,489
)
(212
,406
)
53,0
45
47
,933
59,6
43
65
,532
53,0
12
38
,170
5,16
8
33,8
89
1,36
4,56
7$
1,
285,
098
$
1,48
3,84
3$
1,
399,
037
$
1,40
8,57
9$
1,
215,
499
$
1,14
1,63
5$
1,
122,
331
$
1,10
6,00
3$
1,
190,
254
$
Busi
ness
-typ
e ac
tivi
ties
:N
et in
vest
men
t in
capi
tal a
sset
s50
4,92
6
514,
764
53
1,78
9
528,
912
53
5,42
4
541,
280
51
6,14
8
498,
405
45
7,01
2
257,
841
Re
stric
ted
11,7
32
11
,939
14,3
98
16
,925
11,8
75
8,
936
11
,185
9,48
2
13,5
82
9,
528
U
nres
tric
ted
27,3
32
22
,202
19,2
89
18
,077
16,0
86
15
,183
12,0
73
14
,881
9,03
3
4,52
6
543,
990
$
54
8,90
5$
565,
476
$
56
3,91
4$
563,
385
$
56
5,39
9$
539,
406
$
52
2,76
8$
479,
627
$
27
1,89
5$
Prim
ary
gove
rnm
ent:
Net
inve
stm
ent i
n ca
pita
l ass
ets
1,79
3,34
0
1,
750,
246
1,69
9,28
4
1,
640,
512
1,64
0,10
3
1,
531,
198
1,48
3,61
0
1,
449,
871
1,40
9,29
4
1,
290,
731
Rest
ricte
d28
5,37
4
273,
961
27
7,70
1
256,
429
25
6,13
2
168,
985
13
2,34
6
142,
177
16
2,13
5
133,
003
U
nres
tric
ted
(170
,157
)
(190
,204
)
72,3
34
66
,010
75,7
29
80
,715
65,0
85
53
,051
14,2
01
38
,415
1,90
8,55
7$
1,
834,
003
$
2,04
9,31
9$
1,
962,
951
$
1,97
1,96
4$
1,
780,
898
$
1,68
1,04
1$
1,
645,
099
$
1,58
5,63
0$
1,
462,
149
$
Res
tate
men
ts o
f pr
ior
year
s20
15 -
Jun
e 30
, 201
5 g
over
nmen
tal a
ctiv
ities
and
bus
ines
s-ty
pe a
ctiv
ities
wer
e re
stat
ed $
298,
116
and
$9,4
91 re
spec
tivel
y as
a re
sult
of th
e ad
optio
n of
GAS
B St
atem
ent N
o. 6
8.Pr
ior y
ears
wer
e no
t res
tate
d.
2013
- J
une
30, 2
013
bus
ines
s-ty
pe a
ctiv
ities
wer
e re
stat
ed $
2,16
5 to
cor
rect
an
erro
r in
the
trea
tmen
t of i
nitia
l dire
ct c
osts
of o
pera
ting
leas
es.
Prio
r yea
rs w
ere
not r
esta
ted.
2011
- J
une
30, 2
011
gove
rnm
enta
l act
iviti
es a
nd b
usin
ess-
type
act
iviti
es w
ere
rest
ated
$72
8 an
d $1
,288
resp
ectiv
ely
as a
resu
lt of
the
adop
tion
of G
ASB
Stat
emen
t No.
65.
Prio
r yea
rs w
ere
not r
esta
ted.
2009
- J
une
30, 2
009
gove
rnm
enta
l act
iviti
es a
nd b
usin
ess-
type
act
iviti
es w
ere
rest
ated
$43
,441
and
$3,
011
resp
ectiv
ely
to c
orre
ct e
rror
s in
cap
ital a
sset
dep
reci
atio
n.
CITY
OF
TULS
AN
ET P
OSI
TIO
N B
Y CO
MPO
NEN
TCu
rren
t an
d Pa
st N
ine
Year
s(a
ccru
al b
asis
of a
ccou
ntin
g)(a
mou
nts
expr
esse
d in
thou
sand
s)
S - 1

2016
2015
2014
2013
2012
2011
2010
2009
2008
2007
Expe
nses
:G
over
nmen
tal a
ctiv
ities
:G
ener
al g
over
nmen
t64
,141
$
46
,755
$
42
,853
$
50
,697
$
46
,345
$
39
,654
$
45
,311
$
42
,257
$
46
,795
$
44
,407
$
Pu
blic
saf
ety
and
prot
ectio
n20
0,72
6
186,
385
19
9,74
9
221,
872
20
4,82
2
182,
971
17
3,33
9
183,
862
19
3,29
3
166,
374
Pu
blic
wor
ks a
nd tr
ansp
orta
tion
75,4
00
69,5
23
64,3
81
54,8
48
56,6
50
54,0
29
83,2
95
87,3
18
90,8
55
116,
374
Cu
lture
and
recr
eatio
n24
,124
22
,638
24
,629
25
,372
20
,858
20
,419
17
,749
21
,752
25
,460
27
,841
So
cial
and
eco
nom
ic38
,629
31
,409
27
,845
32
,071
24
,089
21
,894
31
,310
28
,325
28
,346
25
,776
In
tere
st o
n lo
ng-t
erm
deb
t11
,864
12
,285
12
,250
13
,097
12
,724
12
,624
10
,910
12
,560
14
,134
11
,046
T
otal
gov
ernm
enta
l act
iviti
es e
xpen
ses
414,
884
36
8,99
5
371,
707
39
7,95
7
365,
488
33
1,59
1
361,
914
37
6,07
4
398,
883
39
1,81
8
Busi
ness
-typ
e ac
tiviti
es:
Stor
mw
ater
30,0
84
25,8
77
25,7
21
26,0
04
27,7
29
26,0
50
24,8
59
23,7
43
21,7
44
19,8
62
One
Tec
hnol
ogy
Cent
er9,
982
10,6
43
9,92
7
11
,488
10
,435
9,
884
9,43
1
9,
993
6,52
7
-
Ar
ena
& C
onve
ntio
n24
,910
25
,507
23
,815
23
,993
22
,823
22
,480
22
,182
17
,434
6,
044
-
Tuls
a St
adiu
m T
rust
3,33
0
3,
500
4,02
8
3,
733
3,60
3
3,
768
-
-
-
-
Gol
f Cou
rses
3,28
8
2,
917
3,18
3
3,
544
3,69
6
3,
316
3,50
3
3,
615
3,24
6
2,
470
Tota
l bus
ines
s-ty
pe a
ctiv
ities
71,5
94
68,4
44
66,6
74
68,7
62
68,2
86
65,4
98
59,9
75
54,7
85
37,5
61
22,3
32
Tota
l prim
ary
gove
rnm
ent
486,
478
43
7,43
9
438,
381
46
6,71
9
433,
774
39
7,08
9
421,
889
43
0,85
9
436,
444
41
4,15
0
Prog
ram
Rev
enue
s:G
over
nmen
tal a
ctiv
ities
:Ch
arge
s fo
r ser
vice
sG
ener
al g
over
nmen
t25
,493
9,
664
10,2
79
14,7
89
14,4
21
15,4
16
12,6
47
12,9
96
12,3
46
16,2
50
Publ
ic s
afet
y an
d pr
otec
tion
24,3
59
25,2
64
23,9
18
24,6
93
21,5
53
16,8
15
20,2
89
22,6
74
25,0
90
18,2
75
Publ
ic w
orks
and
tran
spor
tatio
n11
,250
13
,693
14
,045
13
,792
12
,761
10
,421
9,
054
14,9
08
14,2
35
9,04
0
Cu
lture
and
recr
eatio
n4,
814
5,00
6
4,
754
4,51
6
4,
148
4,88
7
5,
638
3,79
7
3,
903
4,54
5
So
cial
and
eco
nom
ic1,
913
1,62
6
1,
155
2,03
7
1,
850
543
53
0
1,37
5
2,
246
3,22
8
O
pera
ting
gran
ts a
nd c
ontr
ibut
ions
29,4
86
32,3
64
35,0
63
35,7
42
29,6
29
27,8
16
32,2
62
25,9
44
39,7
00
33,1
72
Capi
tal g
rant
s an
d co
ntrib
utio
ns6,
308
4,69
4
3,
784
34,1
69
36,1
44
9,92
4
12
,185
11
,560
24
,891
57
,665
To
tal g
over
nmen
tal a
ctiv
ities
pro
gram
reve
nues
103,
623
92
,311
92
,998
12
9,73
8
120,
506
85
,822
92
,605
93
,254
12
2,41
1
142,
175
Bu
sine
ss-t
ype
activ
ities
:Ch
arge
s fo
r ser
vice
sSt
orm
wat
er27
,674
25
,099
23
,625
24
,101
23
,604
23
,231
22
,007
21
,424
19
,296
17
,742
O
ne T
echn
olog
y Ce
nter
8,98
6
9,
183
9,17
6
10
,253
9,
401
8,56
0
6,
637
5,78
7
2,
478
-
Aren
a &
Con
vent
ion
15,6
33
16,5
14
13,9
53
12,6
34
12,0
12
12,3
00
12,1
30
10,2
81
1,12
8
-
Tu
lsa
Stad
ium
Tru
st28
1
276
33
4
299
24
6
163
16
,286
-
-
-
G
olf C
ours
es2,
828
2,42
0
2,
700
2,55
8
2,
574
2,02
4
2,
733
2,71
3
1,
683
1,08
4
O
pera
ting
gran
ts a
nd c
ontr
ibut
ions
-
-
-
3
30
8
-
79
-
-
-
Ca
pita
l gra
nts
and
cont
ribut
ions
4,68
9
1,
291
2,36
0
1,
277
1,07
2
3,
319
10,7
35
36,8
39
113,
759
11
,082
To
tal b
usin
ess-
type
act
iviti
es p
rogr
am re
venu
es60
,091
54
,783
52
,148
51
,125
49
,217
49
,597
70
,607
77
,044
13
8,34
4
29,9
08
Tota
l prim
ary
gove
rnm
ent p
rogr
am re
venu
es16
3,71
4$
147,
094
$
14
5,14
6$
180,
863
$
16
9,72
3$
135,
419
$
16
3,21
2$
170,
298
$
26
0,75
5$
172,
083
$
Net
(exp
ense
) rev
enue
:G
over
nmen
tal a
ctiv
ities
(311
,261
)(2
76,6
84)
(278
,709
)(2
68,2
19)
264,
051
(245
,769
)(2
69,3
09)
(282
,820
)(2
76,4
72)
(249
,643
)Bu
sine
ss-t
ype
activ
ities
(11,
503)
(13,
661)
(14,
526)
(17,
637)
(17,
205)
(15,
901)
(5,6
54)
22,2
5910
0,78
37,
576
Tota
l prim
ary
gove
rnm
ent n
et e
xpen
se(3
22,7
64)
$
(290
,345
)$
(2
93,2
35)
$
(285
,856
)$
(2
62,3
43)
$
(261
,670
)$
(2
74,9
63)
$
(260
,561
)$
(1
75,6
89)
$
(242
,067
)$
Gen
eral
Rev
enue
s an
d O
ther
Cha
nges
in N
et P
osit
ion:
Taxe
s Sale
s ta
x23
4,91
223
1,99
723
1,10
822
7,90
521
9,24
019
9,38
419
3,50
520
7,28
921
0,63
320
1,71
7Pr
oper
ty ta
x73
,450
64,6
6759
,659
58,4
4558
,955
49,3
1541
,989
39,0
9034
,475
29,1
82Fr
anch
ise
tax
22,6
2024
,039
24,0
5322
,588
22,4
2727
,225
26,1
4425
,871
23,2
1122
,213
Use
tax
23,6
4024
,104
24,7
7622
,393
21,5
2217
,927
15,6
2218
,422
18,5
0118
,346
Hot
el /
mot
el ta
x7,
483
7,55
27,
050
6,67
66,
120
5,68
35,
821
6,32
76,
819
6,13
4U
nres
tric
ted
gran
ts a
nd c
ontr
ibut
ions
6,81
46,
037
7,89
422
,154
23,3
0522
,698
15,8
6021
,224
20,3
9620
,765
Paym
ents
from
com
pone
nt u
nits
14,6
3114
,100
14,7
104,
282
690
7613
1,80
82,
008
181
In
vest
men
t ear
ning
s7,
910
6,46
9
7,
072
(2,3
43)
2,88
8
7,
513
9,56
6
19
,570
24
,151
18
,971
M
isce
llane
ous
4,74
9
2,
734
2,25
3
9,
812
4,58
6
2,
490
1,70
5
3,
788
5,24
6
2,
014
Tran
sfer
s(5
,479
)
(5
,644
)(1
5,06
0)
(18,
092)
(1
6,81
4)
(11,
950)
(2
1,61
2)
(22,
248)
(1
05,8
51)
(4,2
92)
Tota
l gov
ernm
enta
l act
iviti
es39
0,73
0
376,
055
36
3,51
5
353,
820
34
2,91
9
320,
361
28
8,61
3
321,
141
23
9,58
9
315,
231
Bu
sine
ss-t
ype
activ
ities
:In
vest
men
t ear
ning
s an
d ot
her
1,10
9
93
7
3,19
3
(1
)
31
6
611
69
1
1,29
0
1,
209
633
Tr
ansf
ers
& c
apita
l con
trib
utio
ns5,
479
5,64
4
15
,060
18
,092
16
,814
11
,950
23
,619
22
,248
10
5,85
1
4,29
2
To
tal b
usin
ess-
type
act
iviti
es6,
588
6,58
1
18
,253
18
,091
17
,130
12
,561
24
,310
23
,538
10
7,06
0
4,92
5
To
tal p
rimar
y go
vern
men
t39
7,31
8$
382,
636
$
38
1,76
8$
371,
911
$
36
0,04
9$
332,
922
$
31
2,92
3$
344,
679
$
34
6,64
9$
320,
156
$
Chan
ges
in N
et P
osit
ion:
Gov
ernm
enta
l act
iviti
es79
,469
99
,371
84
,806
85
,601
97
,937
74
,592
19
,304
38
,321
(3
6,88
3)
65,5
89
Busi
ness
-typ
e ac
tiviti
es(4
,915
)
(7
,080
)
3,
727
454
(1
,939
)
(3
,340
)
18
,656
45
,797
20
7,84
3
12,5
01
Tota
l prim
ary
gove
rnm
ent
74,5
54$
92,2
91$
88,5
33$
86,0
55$
95,9
98$
71,2
52$
37,9
60$
84,1
18$
170,
960
$
78
,090
$
Curr
ent
and
Past
Nin
e Ye
ars
(acc
rual
bas
is o
f acc
ount
ing)
(am
ount
s ex
pres
sed
in th
ousa
nds)
CITY
OF
TULS
ACH
AN
GES
IN N
ET P
OSI
TIO
N
S - 2

Year
Sale
s Ta
xPr
oper
ty
Tax
Fran
chis
e Ta
xU
se T
ax
Hot
el /
M
otel
Ta
xTo
tal
2016
234,
912
$
73,4
50$
22
,620
$
23,6
40$
7,
483
$
362,
105
$
2015
231,
997
64,6
67
24
,039
24,1
04
7,
552
352,
359
2014
231,
108
59,6
59
24
,053
24,7
76
7,
050
346,
646
2013
227,
905
58,4
45
22
,588
22,3
93
6,
676
338,
007
2012
223,
988
58,9
55
21
,857
21,5
22
6,
120
332,
442
2011
199,
384
49,3
15
27
,225
17,9
27
5,
683
299,
534
2010
193,
505
41,9
89
26
,144
15,6
22
5,
821
283,
081
2009
207,
289
39,0
90
25
,871
18,4
22
6,
327
296,
999
2008
210,
633
34,4
75
23
,211
18,5
01
6,
819
293,
639
2007
201,
717
29,1
82
22
,213
18,3
46
6,
134
277,
592
(am
ount
s ex
pres
sed
in th
ousa
nds)
CITY
OF
TULS
AG
OV
ERN
MEN
TAL
ACT
IVIT
IES
- TA
X R
EVEN
UES
BY
SOU
RCE
Curr
ent
and
Past
Nin
e Ye
ars
(acc
rual
bas
is o
f acc
ount
ing)
S - 3

CITY
OF
TULS
APR
OG
RAM
REV
ENU
E BY
FU
NCT
ION
/ P
RO
GR
AM
Curr
ent
and
Past
Nin
e Ye
ars
(acc
rual
bas
is o
f acc
ount
ing)
(am
ount
s ex
pres
sed
in th
ousa
nds)
Func
tion
/Pro
gram
:20
1620
1520
1420
1320
1220
1120
1020
0920
0820
07G
over
nmen
tal a
ctiv
ities
:
Gen
eral
gov
ernm
ent
25,4
93$
9,66
4$
10
,478
$
14
,789
$
14
,421
$
15
,416
$
13
,380
$
13
,240
$
12
,368
$
16
,250
$
Pub
lic s
afet
y an
d pr
otec
tion
47,8
60
50,8
24
47,8
74
47,7
27
52,3
84
37,3
11
37,9
73
39,4
54
49,0
18
37,4
59
P
ublic
wor
ks a
nd tr
ansp
orta
tion
17,5
58
18,3
87
17,4
76
46,5
02
42,8
22
16,4
75
20,0
24
25,3
97
43,5
24
64,3
17
C
ultu
re a
nd re
crea
tion
4,81
4
5,
006
4,75
4
4,
516
4,14
8
5,
122
5,96
0
3,
801
3,94
3
4,
545
S
ocia
l and
eco
nom
ic7,
898
8,43
0
12
,416
16
,204
7,
675
11,4
98
15,2
68
11,3
62
13,5
58
19,6
04
Tot
al g
over
nmen
tal a
ctiv
ities
103,
623
92,3
11
92,9
98
129,
738
121,
450
85,8
22
92,6
05
93,2
54
122,
411
142,
175
Busi
ness
-typ
e ac
tiviti
es:
St
orm
wat
er32
,363
26
,390
25
,806
25
,353
24
,676
24
,824
25
,078
33
,057
20
,657
28
,824
One
Tec
hnol
ogy
Cent
er8,
986
9,18
3
9,
176
10,2
53
9,40
1
8,
560
6,63
7
5,
787
2,47
8
-
Ar
ena
& C
onve
ntio
n15
,633
16
,514
13
,993
12
,659
12
,012
12
,856
19
,871
35
,487
11
3,52
6
-
Tu
lsa
Stad
ium
Tru
st28
1
276
33
4
302
55
4
918
16
,286
-
-
-
Tu
lsa
Gol
f Cou
rses
2,82
8
2,
420
2,83
9
2,
558
2,57
4
2,
439
2,73
5
2,
713
1,68
3
1,
084
Tot
al b
usin
ess-
type
act
iviti
es60
,091
54
,783
52
,148
51
,125
49
,217
49
,597
70
,607
77
,044
13
8,34
4
29
,908
To
tal p
rimar
y go
vern
men
t16
3,71
4$
14
7,09
4$
14
5,14
6$
18
0,86
3$
17
0,66
7$
13
5,41
9$
16
3,21
2$
17
0,29
8$
26
0,75
5$
17
2,08
3$
Not
e:
With
the
adop
tion
of G
ASB
No.
61,
The
Fin
anci
al R
epor
ting
Entit
y, O
mni
bus,
in th
e ye
ar e
ndin
g Ju
ne 3
0 20
10, t
he T
ulsa
Sta
dium
Tr
ust i
s re
port
ed a
s a
blen
ded
com
pone
nt u
nit.
Prio
r to
2010
, the
Tul
sa S
tadi
um T
rust
was
repo
rted
as
a di
scre
tely
pre
sent
ed
com
pone
nt u
nit o
f the
City
.
S - 4

2016
2015
2014
2013
2012
2011
2010
2009
2008
2007
Gen
eral
Fun
d:G
ener
al F
und:
Non
spen
dabl
e61
1$
611
$
61
1$
745
$
60
6$
1,05
5$
Re
serv
ed7,
730
$
8,87
6$
13
,273
$
9,
668
$
Rest
ricte
d2,
000
2,00
0
2,
000
2,00
0
-
-
U
nres
erve
d47
,045
41
,647
37
,759
43
,778
As
sign
ed5,
183
8,04
7
6,
889
13,5
04
20,9
89
13,8
07
54,7
75$
50,5
23$
51,0
32$
53,4
46$
Una
ssig
ned
54,2
52
54,8
30
50,2
64
41,5
28
49,5
40
52,2
55
62,0
46$
65,4
88$
59,7
64$
57,7
77$
71,1
35$
67,1
17$
Oth
er G
over
nmen
tal F
unds
:O
ther
Gov
ernm
enta
l Fun
ds:
Non
spen
dabl
e-
-
-
-
-
-
Re
serv
ed22
9,88
0
22
4,63
3
22
1,99
7
22
9,49
6
Re
stric
ted
458,
796
441,
787
403,
806
383,
576
388,
231
325,
181
Unr
eser
ved
Com
mitt
ed4,
691
3,09
4
1,
698
1,76
1
1,
095
1,13
5
Sp
ecia
l rev
enue
fund
s15
,572
9,
552
9,41
2
12
,842
As
sign
ed-
-
-
718
71
8
3,97
7
D
ebt s
ervi
ce fu
nds
12,4
12
4,01
4
3,
948
3,43
9
U
nass
igne
d(3
10)
(321
)
(4
56)
(512
)
(1
45)
(261
)
Ca
pita
l pro
ject
s fu
nds
1,96
6
1,
692
1,09
5
83
2
463,
177
$
444,
560
$
405,
048
$
385,
543
$
389,
899
$
330,
032
$
259,
830
$
239,
891
$
236,
452
$
246,
609
$
Not
e: G
ASB
Stat
emen
t No.
54
chan
ged
the
repo
rtin
g of
fund
bal
ance
s by
est
ablis
hing
fund
bal
ance
cla
ssifi
catio
ns th
at c
ompr
ise
a hi
erar
chy
base
d pr
imar
ily o
n th
e ex
tent
to
whi
ch a
gov
ernm
ent i
s bo
und
to o
bser
ve c
onst
rain
ts im
pose
d up
on th
e us
e of
the
reso
urce
s re
port
ed in
gov
ernm
enta
l fun
ds.
The
City
ado
pted
GAS
B St
atem
ent N
o. 5
4 fo
r the
ye
ar e
ndin
g Ju
ne 3
0, 2
011.
Inf
orm
atio
n fo
r prio
r yea
rs is
una
vaila
ble.
(am
ount
s ex
pres
sed
in th
ousa
nds)
CITY
OF
TULS
AFU
ND
BA
LAN
CES
OF
GO
VER
NM
ENTA
L FU
ND
SCu
rren
t an
d Pa
st N
ine
Year
s(m
odifi
ed a
ccru
al b
asis
of a
ccou
ntin
g)
S - 5

2016
2015
2014
2013
2012
2011
2010
2009
2008
2007
Rev
enue
s S
ales
tax
234,
912
$
23
1,99
7$
23
1,10
8$
22
7,90
5$
22
3,98
8$
19
9,38
4$
19
3,50
5$
20
7,28
9$
21
0,63
3$
20
1,71
6$
P
rope
rty
tax
73,4
50
63,2
29
57,4
78
56,0
96
54,1
24
44,6
90
34,4
57
33,2
87
30,8
38
22,2
13
Fra
nchi
se ta
x22
,620
24
,039
24
,053
22
,588
21
,857
27
,225
26
,144
25
,871
23
,211
26
,322
U
se ta
x23
,640
24
,104
24
,776
22
,393
21
,522
17
,927
15
,622
18
,422
18
,501
18
,346
H
otel
/mot
el ta
x7,
483
7,55
2
7,05
0
6,67
6
6,12
0
5,68
3
5,82
1
6,32
7
6,81
9
6,13
4
Spe
cial
ass
essm
ent t
ax3,
525
3,41
2
3,59
5
3,34
4
3,16
4
3,16
9
3,27
5
855
910
869
Cha
rges
for s
ervi
ces
28,4
08
30,9
27
30,4
12
45,4
50
45,5
53
35,9
18
40,3
85
42,3
53
39,5
54
35,1
23
Int
ergo
vern
men
tal r
even
ues
39,7
59
43,4
25
47,7
94
53,8
91
39,5
98
42,2
61
51,7
76
50,7
61
71,1
34
98,5
39
Fin
es a
nd fo
rfei
ture
s8,
077
8,92
3
9,56
5
10,5
67
11,7
18
10,8
75
8,25
7
8,76
3
12,0
01
10,3
50
Inv
estm
ent i
ncom
e7,
974
5,42
3
7,00
2
363
5,22
2
6,14
0
8,66
3
12,9
13
18,9
11
15,2
79
Lic
ense
s, pe
rmits
and
fees
8,39
7
8,
421
7,
801
7,
137
6,
832
5,
922
5,
175
6,
191
6,
745
5,
823
P
rogr
am in
com
e fr
om g
rant
s1,
337
1,39
7
1,14
6
1,96
2
1,76
3
440
530
793
1,60
6
3,22
8
Pay
men
ts fr
om c
ompo
nent
uni
ts14
,383
13
,506
13
,566
70
1
66
8
57
13
1,
808
2,
008
18
1
M
isce
llane
ous
4,41
3
2,
659
2,
253
9,
778
3,
033
2,
492
2,
794
3,
787
5,
935
2,
664
T
otal
reve
nues
478,
378
46
9,01
4
46
7,59
9
46
8,85
1
44
5,16
2
40
2,18
3
39
6,41
7
41
9,42
0
44
8,80
6
44
6,78
7
Expe
ndit
ures
Cur
rent
:
Gen
eral
gov
ernm
ent
37,1
05
36,7
73
37,8
57
43,3
89
27,4
43
21,6
38
20,8
19
20,8
26
19,7
81
17,3
76
P
ublic
saf
ety
and
prot
ectio
n20
2,79
4
194,
430
190,
069
186,
552
187,
513
171,
552
174,
401
188,
475
193,
595
174,
293
P
ublic
wor
ks a
nd tr
ansp
orta
tion
21,0
38
24,1
86
24,9
83
25,8
57
29,0
39
31,5
57
31,4
12
32,1
74
35,0
64
30,0
72
C
ultu
re a
nd re
crea
tion
20,7
90
20,8
67
21,5
84
21,1
12
14,9
48
14,3
85
15,3
62
19,4
73
22,7
53
25,3
85
S
ocia
l and
eco
nom
ic d
evel
opm
ent
30,5
95
28,6
73
28,3
19
32,9
86
31,0
66
20,2
15
28,9
91
25,6
11
26,8
97
25,2
59
Pay
men
ts to
com
pone
nt u
nits
15,6
00
13,3
67
9,71
9
11,1
11
9,56
2
10,3
54
16,5
35
23,4
80
21,9
70
31,8
99
Cap
ital o
utla
y12
2,37
0
104,
128
111,
597
114,
238
96,0
57
79,6
80
105,
904
102,
681
122,
328
142,
399
Deb
t ser
vice
:
Prin
cipa
l52
,975
52
,832
41
,953
38
,347
31
,173
24
,581
18
,860
17
,354
20
,481
17
,392
Inte
rest
15,9
75
17,5
16
16,7
27
16,1
50
17,3
35
15,8
87
14,4
33
12,2
51
10,1
72
7,43
6
Tot
al e
xpen
ditu
res
519,
242
49
2,77
2
48
2,80
8
48
9,74
2
44
4,13
6
38
9,84
9
42
6,71
7
44
2,32
5
47
3,04
1
47
1,51
1
E
xces
s (d
efic
ienc
y) o
f
rev
enue
s ov
er (u
nder
) exp
endi
ture
s(4
0,86
4)
(23,
758)
(15,
649)
(20,
891)
1,02
6
12,3
34
(30,
300)
(22,
905)
(24,
235)
(24,
724)
Oth
er f
inan
cing
sou
rces
(use
s) T
rans
fers
in5,
121
4,49
5
1,70
6
3,65
7
2,57
0
3,94
1
25,7
58
12,7
61
13,5
90
20,0
83
Tra
nsfe
rs o
ut(1
1,16
2)
(10,
638)
(17,
349)
(22,
047)
(17,
887)
(16,
565)
(47,
650)
(35,
395)
(37,
777)
(29,
163)
Sal
e of
cap
ital a
sset
s1,
222
905
1,46
8
1,17
3
664
1,69
1
821
-
-
-
B
ond
issu
ance
57,0
00
70,0
00
50,0
00
45,0
00
44,9
27
70,0
00
70,0
00
48,4
53
35,8
51
65,9
34
Ref
undi
ng b
ond
issu
ance
23,1
33
57,0
73
-
23
,746
-
21,5
46
23,5
58
-
-
-
P
rem
ium
on
bond
issu
ance
3,85
8
2,
804
1,
316
7,
341
64
7
11
,143
12
,017
16
-
418
Pay
men
t to
bond
esc
row
age
nt(2
3,13
3)
(57,
073)
-
(2
3,74
6)
-
(21,
546)
(30,
013)
-
-
-
Tot
al o
ther
fina
ncin
g so
urce
s (u
ses)
56,0
39
67,5
66
37,1
41
35,1
24
30,9
21
70,2
10
54,4
91
25,8
35
11,6
64
57,2
72
Net
cha
nges
in fu
nd b
alan
ces
15,1
75
43,8
08
21,4
92
14,2
33
31,9
47
82,5
44
24,1
91
2,93
0
(12,
571)
32,5
48
Fun
d ba
lanc
e, b
egin
ning
510,
048
46
4,81
2
44
3,32
0
42
9,08
7
42
9,08
7
31
4,60
5
29
0,41
4
28
7,48
4
30
0,05
5
26
8,13
2
C
umul
ativ
e ef
fect
of c
hang
e in
acc
tg. p
rinci
ple
-
-
-
-
-
-
-
-
-
(6
25)
Fun
d ba
lanc
e, e
ndin
g52
5,22
3$
508,
620
$
464,
812
$
443,
320
$
461,
034
$
397,
149
$
314,
605
$
290,
414
$
287,
484
$
300,
055
$
Deb
t ser
vice
as
a pe
rcen
tage
of n
onca
pita
lex
pend
iture
s17
.02%
17.9
4%15
.04%
14.4
5%13
.92%
12.8
6%9.
59%
8.72
%8.
74%
7.54
%
(am
ount
s ex
pres
sed
in th
ousa
nds)
CITY
OF
TULS
ACH
AN
GES
IN F
UN
D B
ALA
NCE
S O
F G
OV
ERN
MEN
TAL
FUN
DS
Curr
ent a
nd P
ast N
ine
Year
s(m
odif
ied
accr
ual b
asis
of
acco
unti
ng)
S - 6

Year
Sale
s Ta
xPr
oper
ty
Tax
Fran
chis
e Ta
xU
se T
axH
otel
/Mot
el
Tax
Tota
l
2016
234,
912
$
73,4
50$
22
,620
$
23,6
40$
7,
483
$
362,
105
$
2015
231,
997
63,2
29
24
,039
24,1
04
7,
552
350,
921
2014
231,
108
57,4
78
24
,053
24,7
76
7,
050
344,
465
2013
227,
905
56,0
96
22
,588
22,3
93
6,
676
335,
658
2012
223,
988
54,1
24
21
,857
21,5
22
6,
120
327,
611
2011
199,
384
44,6
90
27
,225
17,9
27
5,
683
294,
909
2010
193,
505
34,4
57
26
,144
15,6
22
5,
821
275,
549
2009
207,
289
33,2
87
25
,871
18,4
22
6,
327
291,
196
2008
208,
435
33,2
87
23
,999
18,3
48
6,
807
290,
876
2007
201,
716
26,3
22
22
,213
18,3
46
6,
134
274,
731
(am
ount
s ex
pres
sed
in th
ousa
nds)
CITY
OF
TULS
AG
ENER
AL
GO
VER
NM
ENTA
L TA
X RE
VEN
UES
BY
SOU
RCE
Curr
ent
and
Past
Nin
e Ye
ars
(mod
ified
acc
rual
bas
is o
f acc
ount
ing)
S - 7

SIC
Code
Sale
s Ta
x Re
mitt
erAm
ount
Re
mitt
edRe
venu
e Ba
seSI
CCo
deSa
les
Tax
Rem
itter
Amou
nt
Rem
itted
Reve
nue
Base
53G
ener
al M
erch
andi
se S
tore
s $
34,
355
$
1,10
8,24
2 14
.56%
53G
ener
al M
erch
andi
se S
tore
s $
32,
397
$
1,07
9,90
0 16
.02%
58Ea
ting
and
Drin
king
Pla
ces
31,3
141,
010,
137
13.2
7%58
Eatin
g an
d D
rinki
ng P
lace
s22
,876
762,
533
11.3
1%59
Mis
cella
neou
s Re
tail
23,2
9975
1,57
69.
87%
59M
isce
llane
ous
Reta
il22
,149
738,
300
10.9
5%54
Food
Sto
res
17,9
8658
0,18
77.
62%
49El
ectr
ic, G
as, a
nd S
anita
ry S
ervi
ces
17,2
1157
3,70
08.
51%
57Fu
rnitu
re a
nd E
quip
men
t16
,248
524,
131
6.89
%54
Food
Sto
res
16,5
1655
0,53
38.
17%
49El
ectr
ic, G
as, a
nd S
anita
ry S
ervi
ces
16,1
6552
1,46
26.
85%
57Fu
rnitu
re a
nd H
ome
Furn
ishi
ng S
tore
s13
,570
452,
333
6.71
%50
Who
lesa
le T
rade
-Dur
able
Goo
ds16
,083
518,
796
6.82
%52
Build
ing
Mat
eria
ls &
Gar
den
Supp
lies
12,4
4341
4,76
76.
15%
52Bu
ildin
g M
ater
ials
& G
arde
n Su
pplie
s15
,645
504,
677
6.63
%50
Who
lesa
le T
rade
-Dur
able
Goo
ds12
,432
414,
400
6.15
%56
Appa
rel a
nd A
cces
sory
Sto
res
10,6
1434
2,37
44.
50%
56Ap
pare
l and
Acc
esso
ry S
tore
s9,
398
313,
267
4.65
%48
Com
mun
icat
ion
9,11
129
3,90
73.
86%
48Co
mm
unic
atio
n9,
216
307,
200
4.56
%
$
190
,820
$
6,
155,
488
80.8
6% $
1
68,2
08
$
5,60
6,93
3 83
.16%
Sour
ce:
Okl
ahom
a Ta
x Co
mm
issi
on
2016
Perc
enta
ge o
f Tot
al
Reve
nue
Base
Perc
enta
ge o
f Tot
al
Reve
nue
BaseCI
TY O
F TU
LSA
PRIN
CIPA
L SA
LES
TAX
REM
ITTE
RS
(am
ount
s ex
pres
sed
in t
hous
ands
)Ju
ne 3
0, 2
016
2007
S - 8

Year
City
of T
ulsa
Tuls
a Co
unty
Stat
e of
O
klah
oma
2016
3.10
0%0.
917%
4.50
0%20
153.
100%
0.91
7%4.
500%
2014
3.16
7%0.
850%
4.50
0%20
133.
167%
0.85
0%4.
500%
2012
3.16
7%0.
850%
4.50
0%20
113.
000%
1.01
7%4.
500%
2010
3.00
0%1.
017%
4.50
0%20
093.
000%
1.01
7%4.
500%
2008
3.00
0%1.
017%
4.50
0%20
073.
000%
1.01
7%4.
500%
Sour
ce:
Okl
ahom
a Ta
x Co
mm
issi
on
CITY
OF
TULS
AD
IREC
T A
ND
OV
ERLA
PPIN
G S
ALE
S TA
X RA
TES
Curr
ent
and
Past
Nin
e Ye
ars
S - 9

Es
timat
edN
etTa
x Ra
teEs
timat
edN
etTa
x Ra
te
Est
imat
edN
etTa
x Ra
teEs
timat
edN
etTa
x Ra
teAs
sess
ed to
Actu
alAs
sess
edPe
rAc
tual
Asse
ssed
Per
A
ctua
lAs
sess
edPe
rAc
tual
Asse
ssed
Per
Estim
ated
Year
Valu
eVa
lue
$1,0
00Va
lue
Valu
e$1
,000
Va
lue
Valu
e$1
,000
Valu
eVa
lue
$1,0
00Ac
tual
Val
ue
2016
25,2
23,0
50$
2,77
4,81
3$
22.7
94,
147,
160
$
41
4,71
6$
22.7
942
7,59
6$
135,
890
$
22.7
929
,797
,806
$
3,
325,
419
$
22
.79
11.2
%20
1524
,472
,298
2,
692,
222
21
.46
4,03
0,01
0
403,
001
21
.46
426,
001
13
5,38
3
21
.46
28,9
28,3
09
3,23
0,60
6
21.4
611
.2%
2014
23,8
99,1
10
2,62
9,16
5
20.2
43,
793,
290
37
9,32
9
20.2
449
1,00
1
156,
040
20.2
428
,183
,401
3,
164,
534
20
.24
11.2
%20
1323
,572
,306
2,
593,
213
20
.16
3,67
3,95
0
367,
395
20
.16
622,
631
19
7,87
2
20
.16
27,8
68,8
87
3,15
8,48
0
20.1
611
.3%
2012
23,2
57,4
83
2,55
8,57
9
20.0
13,
612,
420
36
1,24
2
20.0
161
5,59
2
195,
635
20.0
127
,485
,495
3,
115,
456
20
.01
11.3
%20
1122
,980
,865
2,
528,
148
16
.98
3,83
6,90
0
383,
690
16
.98
687,
020
21
8,33
5
16
.98
27,5
04,7
85
3,13
0,17
3
16.9
811
.4%
2010
22,4
55,5
54
2,47
0,35
8
14.1
53,
991,
610
39
9,16
1
14.1
565
8,73
8
209,
347
14.1
527
,105
,902
3,
078,
866
14
.15
11.4
%20
0921
,699
,539
2,
387,
188
14
.08
3,85
7,01
0
385,
701
14
.08
585,
925
18
6,20
7
14
.08
26,1
42,4
74
2,95
9,09
6
14.0
811
.3%
2008
20,6
31,4
46
2,26
9,68
6
13.4
83,
617,
470
36
1,74
7
13.4
860
8,04
6
193,
237
13.4
824
,856
,962
2,
824,
670
13
.48
11.4
%20
0719
,558
,898
2,
151,
694
12
.67
3,50
4,62
0
350,
462
12
.67
679,
072
21
5,80
9
12
.67
23,7
42,5
90
2,71
7,96
5
12.6
711
.4%
Sou
rce:
Tul
sa C
ount
y A
sses
sor's
Offi
ce
CITY
OF
TULS
AA
SSES
SED
AN
D E
STIM
ATE
D A
CTU
AL
VA
LUE
OF
TAXA
BLE
PRO
PERT
YCu
rren
t an
d Pa
st N
ine
Year
s(a
mou
nts
expr
esse
d in
thou
sand
s)
Real
Pro
pert
yPe
rson
al P
rope
rty
Publ
ic S
ervi
ce P
rope
rty
TOTA
L
S - 10

Dir
ect
&G
ener
alSi
nkin
gCo
unty
Coun
tyO
verl
appi
ngYe
arFu
ndFu
ndSc
hool
s C
ount
yLi
brar
yH
ealth
Tota
l Co
mbi
ned
2016
-$
22.7
9$
93
.50
$
10.3
2$
5.
32$
2.58
$
11
1.72
$
134.
51$
2015
-
21.4
6
93
.53
10.3
3
5.
32
2.58
11
1.76
133.
22
2014
-
20.2
4
89
.45
10.3
3
5.
32
2.58
10
7.68
127.
92
2013
-
20.1
6
89
.19
10.3
4
5.
32
2.58
10
7.43
127.
59
2012
-
20.0
1
89
.33
10.3
4
5.
32
2.58
10
7.57
127.
58
2011
-
16.9
8
88
.44
10.3
1
5.
32
2.58
10
6.65
123.
63
2010
-
14.1
5
89
.49
10.3
1
5.
32
2.58
10
7.70
121.
85
2009
-
14.0
8
88
.31
10.3
1
5.
32
2.58
10
6.52
120.
60
2008
-
13.4
8
88
.31
10.3
1
5.
32
2.58
10
6.52
120.
00
2007
-
12.6
7
87
.47
10.3
1
5.
32
2.58
10
5.68
118.
35
Sour
ce:
Tuls
a Co
unty
Ass
esso
r's O
ffice
Dir
ect
Ove
rlap
ping
CITY
OF
TULS
A
PRO
PER
TY T
AX
RATE
S -
DIR
ECT
AN
D O
VER
LAPP
ING
GO
VER
NM
ENTS
(Per
$1,
000
of N
et A
sses
sed
Val
uati
on)
Curr
ent
and
Past
Nin
e Ye
ars
S - 11

2016
75,7
81$
74,0
30$
97.7
%11
,352
$
15
.0%
-$
74,0
30$
97.7
%20
1569
,329
66
,943
96
.6%
11,7
47
16.9
%2,
061
69,0
04
99.5
%20
1464
,050
62
,019
96
.8%
11,2
06
17.5
%84
6
62,8
65
98.2
%20
1363
,687
61
,641
96
.8%
10,8
34
17.0
%1,
129
63,1
87
99.2
%20
1262
,334
60
,219
96
.6%
10,3
34
16.6
%1,
641
61,8
60
99.2
%20
1153
,163
50
,945
95
.8%
9,95
5
18.7
%1,
947
52,2
68
98.3
%20
1043
,557
41
,887
96
.2%
9,06
0
20.8
%1,
409
43,2
96
99.4
%20
0941
,663
40
,014
96
.0%
8,46
9
20.3
%1,
474
41,4
88
99.6
%20
0838
,098
36
,305
95
.3%
7,69
7
20.2
%1,
583
38,0
71
99.9
%20
0734
,420
33
,018
95
.9%
7,38
7
21.5
%1,
006
34,0
24
98.9
%
CITY
OF
TULS
A
Curr
ent
and
Past
Nin
e Ye
ars
(am
ount
s ex
pres
sed
in th
ousa
nds)
PRO
PER
TY T
AX
LEV
IES
AN
D C
OLL
ECTI
ON
S
Year
Del
inqu
ent
Tax
Colle
ctio
nsTo
tal
Colle
ctio
ns
Perc
ent o
f To
tal
Colle
ctio
ns to
Ta
x Le
vyD
elin
quen
t Pe
rcen
t of L
evy
Curr
ent T
ax
Colle
ctio
ns
Del
inqu
ent
Taxe
s Re
ceiv
able
Tota
l Tax
Le
vy
Perc
ent o
f Le
vy
Colle
cted
S - 12

Perc
enta
geof
Per
sona
lYe
arIn
com
e
2016
480,
703
$
5,
908
$
-
$
486,
611
$
95,7
47$
58
2,35
8$
2.
79%
1,44
6$
20
1546
8,29
3
7,38
1
-
47
5,67
4
98
,807
574,
481
2.77
%1,
435
20
1444
7,46
5
8,85
6
-
45
6,32
1
10
3,31
6
559,
637
2.81
%1,
407
20
1343
9,03
2
10,3
35
-
449,
367
107,
390
55
6,75
7
2.
92%
1,42
9
2012
426,
659
11
,821
407
438,
887
104,
324
54
3,21
1
2.
85%
1,37
5
2011
407,
858
14
,255
796
422,
909
106,
402
52
9,31
1
3.
03%
1,31
4
2010
351,
105
27
,911
1,16
5
380,
181
90,3
54
47
0,53
5
2.
98%
1,22
1
2009
291,
245
41
,030
1,51
9
333,
794
92,5
58
42
6,35
2
2.
78%
1,13
9
2008
255,
817
53
,270
1,86
2
310,
949
95,0
81
40
6,03
0
2.
35%
1,03
5
2007
234,
224
75
,225
2,18
9
311,
638
2,42
5
31
4,06
3
2.
01%
803
L
iabi
litie
s on
the
face
of t
he fi
naci
al s
tate
men
ts.
2. B
onde
d de
bt re
port
ed a
bove
agr
ee to
thei
r res
pect
ive
cate
gorie
s in
Not
e 11
, Lon
g-Te
rm L
iabi
litie
s.
Bon
ded
debt
alo
ng w
ith o
ther
long
-ter
m li
abili
ties
are
aggr
egat
ed a
nd re
port
ed a
s Lo
ng-T
erm
CITY
OF
TULS
ARA
TIO
S O
F O
UTS
TAN
DIN
G D
EBT
BY T
YPE
Curr
ent
and
Past
Nin
e Ye
ars
Busi
ness
Type
Act
iviti
esD
ebt
Not
es:
Inte
rnal
Ser
vice
Fun
dsG
over
nmen
tal A
ctiv
ities
Deb
tG
ener
alO
blig
atio
nBo
nds,
Net
(am
ount
s ex
pres
sed
in t
hous
ands
, exc
ept
per
capi
ta)
1. O
utst
andi
ng d
ebt b
alan
ces
are
repo
rted
net
of r
elat
ed d
isco
unts
and
pre
miu
ms.
Gov
ernm
ent
Prim
ary
Tota
l
Capi
taPe
rRe
venu
eBo
nds,
Net
Gov
ernm
enta
lAc
tiviti
esRe
venu
eBo
nds,
Net
Not
esPa
yabl
e
Tota
l
S - 13

N
et
As
sess
edPr
oper
tyYe
arVa
lue
2016
402,
662
3,32
5,41
9$
48
0,70
3$
14.4
6%1,
194
$
2015
400,
436
3,23
0,60
6
46
8,29
3
14.5
0%1,
169
2014
397,
737
3,16
4,53
4
44
7,46
5
14.1
4%1,
125
2013
397,
139
3,15
8,48
0
43
9,03
2
13.9
0%1,
105
2012
393,
831
3,11
5,45
6
42
6,65
9
13.6
9%1,
083
2011
391,
831
3,13
0,17
3
40
7,85
8
13.0
3%1,
041
2010
391,
956
3,07
8,86
6
35
1,10
5
11.4
0%89
6
2009
392,
080
2,95
9,09
6
29
1,24
5
9.84
%74
3
2008
392,
205
2,82
4,69
0
25
5,81
7
9.06
%65
2
2007
382,
000
2,71
7,96
5
23
4,22
4
8.62
%61
3
Not
es:
2. G
ener
al b
onde
d de
bt re
port
ed b
y th
e go
vern
men
tal a
ctiv
ities
, sta
tem
ent o
f net
pos
ition
.
Gen
eral
Net
N
et B
onde
dD
ebt P
erCa
pita
Bond
ed
Ratio
of N
et
Bond
ed D
ebt
To A
sses
sed
CITY
OF
TULS
ARA
TIO
S O
F N
ET G
ENER
AL
BON
DED
DEB
T TO
ASS
ESSE
D V
ALU
ES A
ND
NET
BO
ND
ED D
EBT
PER
CAPI
TA
Curr
ent
and
Past
Nin
e Ye
ars
(am
ount
s ex
pres
sed
in th
ousa
nds)
Popu
latio
n
Deb
t(In
dol
lars
)Va
lue
1. S
ourc
e: N
et A
sses
sed
Valu
e: T
ulsa
Cou
nty
Asse
ssor
's O
ffice
S - 14

Es
timat
edEs
timat
ed
Perc
enta
geSh
are
Net
Gen
eral
Ap
plic
able
toAp
plic
able
toG
over
nmen
tal U
nit
Bond
ed D
ebt
Ci
ty o
f Tul
sa
City
of T
ulsa
Deb
t re
paid
wit
h pr
oper
ty t
axes
:
Inde
pend
ent S
choo
l Dis
tric
ts:
No.
1 T
ulsa
17
8,00
0$
92.2
%16
4,11
1$
No.
3 B
roke
n Ar
row
75
,574
10.5
%7,
922
No.
4 B
ixby
32,3
50
9.
8%3,
161
No.
5 J
enks
72,9
16
73
.1%
53,3
01
N
o. 9
Uni
on73
,160
76.1
%55
,647
No.
11
Ow
asso
28,7
55
0.
1%30
284,
173
City
dir
ect
debt
480,
703
$
10
0.0%
480,
703
To
tal d
irec
t an
d ov
erla
ppin
g de
bt76
4,87
6$
Not
es:
1. S
ourc
e: T
ulsa
Cou
nty
Asse
ssor
's O
ffice
2.
Rat
io o
f ass
esse
d va
luat
ion
of p
rope
rty
with
in th
e ov
erla
ppin
g un
it to
ass
esse
d va
luat
ion
of p
rope
rty
with
in th
e Ci
ty o
f Tul
sa
CITY
OF
TULS
ACO
MPU
TATI
ON
OF
DIR
ECT
AN
D O
VER
LAPP
ING
DEB
TJu
ne 3
0, 2
016
(am
ount
s ex
pres
sed
in t
hous
ands
)
S - 15

2016
2015
2014
2013
2012
2011
2010
2009
2008
2007
Deb
t lim
it 1-2
332,
542
$
323,
061
$
316,
453
$
315,
848
$
311,
546
$
313,
017
$
307,
877
$
295,
910
$
282,
469
$
271,
797
$
Tota
l net
deb
t sub
ject
to li
mit
3-
-
-
-
-
-
-
-
-
-
Lega
l deb
t mar
gin
332,
542
$
323,
061
$
316,
453
$
311,
546
$
311,
546
$
313,
017
$
307,
877
$
295,
910
$
282,
469
$
271,
797
$
Tota
l net
deb
t app
licab
le to
the
limit
as a
per
cent
age
of d
ebt l
imit
0.00
%0.
00%
0.00
%0.
00%
0.00
%0.
00%
0.00
%0.
00%
0.00
%0.
00%
Sour
ce:
1. T
ulsa
Cou
nty
Asse
ssor
's O
ffice
- N
et A
sses
sed
Valu
atio
n
2. A
rtic
le 1
0, S
ectio
n 26
, Okl
ahom
a Co
nstit
utio
n -
10%
of N
et A
sses
sed
Valu
atio
n
3. A
rtic
le 1
0, S
ectio
n 27
, Okl
ahom
a Co
nstit
utio
n -
debt
sub
ject
to li
mit
(am
ount
s ex
pres
sed
in th
ousa
nds)
CITY
OF
TULS
ACO
MPU
TATI
ON
OF
LEG
AL
DEB
T M
AR
GIN
Curr
ent
and
Past
Nin
e Ye
ars
S - 16

Net
Rev
enue
Gro
ssD
irect
Avai
labl
e fo
rYe
arRe
venu
e Ex
pens
es
Deb
t Ser
vice
Prin
cipa
lIn
tere
stTo
tal
Cove
rage
2016
9,66
0$
5,
700
$
3,96
0$
1,40
0$
3,
339
$
4,73
9$
0.
84
2015
9,85
3
6,
066
3,78
7
1,34
0
3,
356
4,69
6
0.
81
2014
12,0
65
5,24
4
6,
821
1,
280
3,37
2
4,
652
1.47
20
1310
,930
5,
978
4,95
2
-
3,
645
3,64
5
1.
36
2012
9,46
6
4,
999
4,46
7
-
3,
734
3,73
4
1.
20
2011
9,82
0
4,
354
5,46
6
-
3,
734
3,73
4
1.
46
2010
8,67
8
4,
226
4,45
2
-
3,
734
3,73
4
1.
19
2009
7,00
5
5,
147
1,85
8
600
3,74
7
4,
347
0.43
20
087,
602
2,58
9
5,
013
-
1,59
7
1,
597
3.14
Not
es:
2. G
ross
reve
nues
incl
udes
leas
e re
venu
es d
eriv
ed fo
rm th
e op
erat
ion
of th
e O
TC fa
cilit
y al
ong
with
oth
er re
venu
es o
f the
fund
3. D
irect
exp
ense
s in
clud
e al
l exp
ense
s of
the
OTC
fund
exc
ept f
or d
epre
ciat
ion
and
inte
rest
exp
ense
.
Deb
t Ser
vice
Req
uire
men
ts
CITY
OF
TULS
APL
EDG
ED-R
EVEN
UE
BON
D C
OV
ERA
GE
ON
E TE
CHN
OLO
GY
CEN
TER
- L
EASE
REV
ENU
E BO
ND
SCu
rren
t an
d Pa
st E
ight
Yea
rs(a
mou
nts
expr
esse
d in
thou
sand
s)
i
nclu
ding
inve
stm
ent i
ncom
e, tr
ansf
ers
and
gain
s on
cap
ital a
sset
dis
posi
tion.
1. T
he b
onds
wer
e is
sued
in 2
008
and
repa
ymen
t is
the
resp
onsi
bilit
y of
TPF
A's
One
Tec
hnol
ogy
Cent
er fu
nd.
S - 17

Gro
ssYe
arRe
venu
e Pr
inci
pal
Inte
rest
Tota
lCo
vera
ge
2016
2,08
0$
1,
095
$
65
3$
1,
748
$
1.
19
2015
2,08
0
1,00
0
713
1,71
3
1.21
20
142,
080
91
5
76
9
1,
684
1.
24
2013
2,09
0
835
820
1,65
5
1.26
20
122,
090
72
5
85
2
1,
577
1.
33
2011
2,14
0
680
881
1,56
1
1.37
20
102,
276
64
0
90
5
1,
545
1.
47
2009
1,56
3
450
867
1,31
7
1.19
C
onve
ntio
n fu
nd.
Not
es:
2. G
ross
reve
nue
incl
udes
reve
nues
der
ived
from
the
Aren
a sp
onso
rshi
p an
d na
min
g.
Deb
t Ser
vice
Req
uire
men
ts
CITY
OF
TULS
APL
EDG
ED-R
EVEN
UE
BON
D C
OV
ERA
GE
ARE
NA
AN
D C
ON
VEN
TIO
N -
200
8 CA
PITA
L IM
PRO
VEM
ENT
BON
DS
Curr
ent
and
Past
Sev
en Y
ears
(am
ount
s ex
pres
sed
in th
ousa
nds)
1. T
he b
onds
wer
e is
sued
in 2
009
and
repa
ymen
t is
the
resp
onsi
bilit
y of
TPF
A's
Aren
a an
d
S - 18

Net
Rev
enue
Gro
ssD
irect
Avai
labl
e fo
rYe
arRe
venu
eEx
pens
esD
ebt S
ervi
cePr
inci
pal
Inte
rest
Tota
lCo
vera
ge
2016
2,50
5$
332
$
2,
173
$
57
0$
1,
032
$
1,
602
$
1.
36
20
152,
491
51
6
1,97
5
560
1,02
8
1,58
8
1.24
2014
2,68
9
919
1,
770
38
3
1,
946
2,
329
0.
76
20
132,
439
40
4
2,03
5
360
1,25
3
1,61
3
1.26
2012
2,66
3
427
2,
236
33
9
1,
217
1,
556
1.
44
20
113,
042
67
8
2,36
4
5,31
9
1,17
4
6,49
3
0.36
2010
18,3
03
73
3
17,5
70
28
9
14
1
43
0
40
.86
1. B
onds
wer
e is
sued
in 2
010
and
refu
nded
in 2
013.
Rep
aym
ent o
f deb
t is
the
resp
onsi
bilit
y of
the
Tuls
a St
adiu
m T
rust
.N
otes
:
2. G
ross
reve
nue
incl
udes
reve
nues
der
ived
from
the
oper
atio
n of
the
ballp
ark
and
tran
sfer
s fro
m th
e Tu
lsa
Stad
ium
3. D
irect
exp
ense
s in
clud
e al
l exp
ense
s of
the
Tuls
a St
adiu
m T
rust
exc
ept f
or d
epre
ciat
ion
and
inte
rest
exp
ense
.
Deb
t Ser
vice
Req
uire
men
ts
CITY
OF
TULS
APL
EDG
ED-R
EVEN
UE
BON
D C
OV
ERA
GE
TULS
A S
TAD
IUM
TR
UST
- IM
PRO
VEM
ENT
DIS
TRIC
T BO
ND
SCu
rren
t an
d Pa
st S
ix Y
ears
(am
ount
s ex
pres
sed
in th
ousa
nds)
a
sset
dis
posi
tion.
I
mpr
ovem
ent D
istr
ict a
long
with
oth
er re
venu
es o
f the
fund
incl
udin
g in
vest
men
t inc
ome
and
gain
s on
cap
ital
S - 19

Net
Rev
enue
Gro
ssD
irect
Avai
labl
e fo
rYe
arRe
venu
e Ex
pens
es
Deb
t Ser
vice
Prin
cipa
lIn
tere
stTo
tal
Cove
rage
2016
26,8
28$
24
,329
$
2,49
9$
1,34
0$
266
$
1,60
6$
1.56
2015
26,4
92
22
,906
3,58
6
1,32
0
305
1,62
5
2.21
2014
26,7
20
22
,051
4,66
9
1,30
5
345
1,65
0
2.83
2013
23,7
92
23
,735
57
1,
295
37
2
1,
667
0.
03
Not
es:
2. G
ross
reve
nue
incl
udes
reve
nue
deriv
ed fo
rm th
e op
erat
ion
of T
ARE
alon
g w
ith o
ther
reve
nues
of t
he T
PFA
Capi
tal
3. D
irect
exp
ense
s in
clud
e al
l exp
ense
s of
TAR
E ex
cept
for d
epre
ciat
ion
and
inte
rest
exp
ense
.
Deb
t Ser
vice
Req
uire
men
ts
CITY
OF
TULS
APL
EDG
ED-R
EVEN
UE
BON
D C
OV
ERA
GE
TPFA
- 2
012
CAPI
TAL
IMPR
OV
EMEN
T BO
ND
SCu
rren
t an
d Pa
st T
hree
Yea
rs(a
mou
nts
expr
esse
d in
thou
sand
s)
I
mpr
ovem
ents
fund
incl
udin
g in
vest
men
t inc
ome
and
gain
s on
cap
ital a
sset
dis
posi
tion.
1. B
onds
wer
e is
sued
in 2
013
and
repa
ymen
t is
the
resp
onsi
bilit
y of
TPF
A's
Fina
ncin
g fu
nd a
nd T
ARE.
S - 20

Year
MSA
Per
Ca
pita
Pe
rson
al
Inco
me
Med
ian
Age
Perc
ent o
f H
igh
Scho
ol
Gra
duat
esU
nem
ploy
men
t Ra
te20
16 4
03,0
85
$ 5
0,88
1 $
51,7
86
34.9
86.8
%4.
5%20
15 4
02,6
62
5
0,24
7
51,5
00
34.8
86.7
%4.
2%20
14 4
00,4
36
4
8,19
9
49,8
07
34.8
86.7
%5.
0%20
13 3
98,2
22
4
5,93
5
47,8
57
34.8
86.7
%5.
4%20
12 3
96,0
21
4
5,78
7
48,0
95
34.8
86.7
%5.
8%20
11 3
93,8
31
4
1,84
6 44
,316
34
.886
.7%
6.7%
2010
391
,831
37,
723
40,2
39
34.8
86.8
%7.
5%20
09 3
91,9
56
3
6,30
0 39
,075
34
.886
.5%
5.1%
2008
392
,080
40,
645
44,1
53
34.8
86.2
%3.
7%20
07 3
92,2
05
3
6,34
2 39
,839
34
.886
.0%
4.0%
Sour
ces:
Popu
latio
n: 2
000
& 2
010
Cens
us
Fo
reca
st (2
016)
: Ex
trap
olat
ion
usin
g 15
yea
r Exp
eria
n se
ries,
and
2016
Gro
wth
Pro
ject
ion
Pers
onal
Inco
me:
Bur
eau
of E
cono
mic
Ana
lysi
s Ju
ne 2
012
Fore
cast
(201
5/20
16):
OSU
Cen
ter f
or A
pplie
d Ec
onom
ic R
esea
rch,
Tul
sa R
egio
nal C
ham
ber
Per C
apita
Per
sona
l Inc
ome:
Bur
eau
of E
cono
mic
Ana
lysi
s to
201
1
Fo
reca
st (2
015/
2016
): O
SU C
AER,
Tul
sa R
egio
nal C
ham
ber
Med
ian
Age:
200
0 &
201
0 Ce
nsus
Fore
cast
(201
6):
Extr
apol
atio
n us
ing
15 y
ear E
xper
ian
serie
s, an
d 20
16 G
row
th P
roje
ctio
nPe
rcen
t of H
igh
Scho
ol G
radu
ates
: Tu
lsa
Met
ro C
ham
ber -
as
repo
rted
by
Expe
rian
Fore
cast
(201
6):
Extr
apol
atio
n us
ing
11 y
ear E
xper
ian
serie
s, an
d 20
16 G
row
th P
roje
ctio
nU
nem
ploy
men
t Rat
e: B
urea
u of
Lab
or S
tatis
tics
(12
mon
th m
ovin
g av
erag
e cl
osin
g Ju
ne 3
0, 2
016)
CITY
OF
TULS
AD
EMO
GRA
PHIC
AN
D E
CON
OM
IC S
TATI
STIC
SCu
rren
t an
d Pa
st N
ine
Year
s
MSA
Cur
rent
Pe
rson
al
Inco
me
(in
mill
ions
)Po
pula
tion
S - 21

2016
2007
Empl
oyer
Empl
oyee
sRa
nk
Perc
enta
ge o
f To
tal M
SA
Empl
oym
ent
Empl
oyee
sRa
nk
Perc
enta
ge o
f To
tal M
SA
Empl
oym
ent
Sain
t Fra
ncis
Hea
lthca
re S
yste
m9,
500
12.
14%
4,50
03
1.03
%
Wal
-Mar
t/Sa
m's
Club
8,00
02
1.80
%-
-N
ATu
lsa
Publ
ic S
choo
ls8,
000
31.
80%
6,50
02
1.49
%
Amer
ican
Airl
ines
6,
500
41.
46%
8,00
01
1.84
%
St. J
ohn
Hea
lth S
yste
m6,
500
51.
46%
4,50
05
1.03
%
Hill
cres
t Hea
lthca
re S
yste
m6,
500
61.
46%
2,00
010
0.46
%
City
of T
ulsa
3,50
07
0.79
%4,
500
41.
03%
Reas
or's
(all
Tulsa
are
a lo
catio
ns)
3,50
08
0.79
%-
-N
ACh
erok
ee H
ard
Rock
Hot
el a
nd C
asin
o3,
500
90.
79%
--
NA
Qui
kTrip
3,50
010
0.79
%-
-N
A59
,000
13
.27%
30,0
00
6.88
%
Not
es:
1. S
ourc
e: T
ulsa
Met
ro C
ham
ber a
nd O
klah
oma
Stat
e D
epar
tmen
t of C
omm
erce
C
ham
ber S
ourc
es:
Dire
ct C
onta
ct w
ith C
ompa
nies
, D&
B M
illio
n D
olla
r Dat
abas
e: G
loba
l Rea
ch,
R
efer
ence
USA
& T
ulsa
Wor
ld a
rtic
les
2. E
mpl
oyer
hea
dcou
nt s
urve
y in
clud
es re
gula
r ful
l-tim
e an
d pa
rt-t
ime
empl
oyee
s.3.
Tot
al e
mpl
oym
ent f
or a
ll lo
catio
ns o
f the
com
pany
in th
e Tu
lsa M
SA a
rea.
4. E
mpl
oyee
cou
nts
are
cate
goriz
ed in
incr
emen
ts o
f 500
. Th
e nu
mbe
r of e
mpl
oyee
s sh
own
for e
ach
empl
oyer
is th
e pe
ak v
alue
of e
ach
incr
emen
t.
Chan
ge f
orm
at t
o th
at u
sed
in f
/s a
nd n
otesCI
TY O
F TU
LSA
PRIN
CIPA
L EM
PLO
YERS
Curr
ent
Year
and
Nin
e Ye
ars
Ago
S - 22
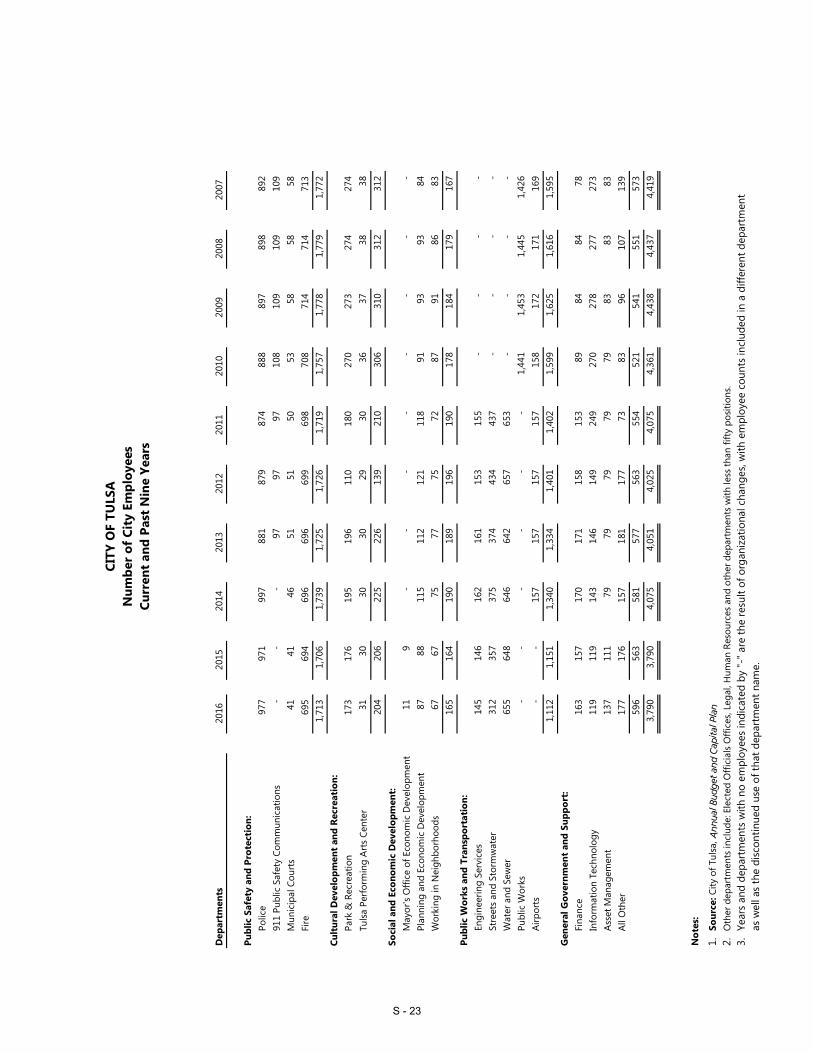
db9/
8/20
14D
epar
tmen
ts20
1620
1520
1420
1320
1220
1120
1020
0920
0820
07
Publ
ic S
afet
y an
d Pr
otec
tion
:Po
lice
977
971
997
881
879
874
888
897
898
892
911
Publ
ic S
afet
y Co
mm
unic
atio
ns-
-
-
97
97
97
108
109
109
109
Mun
icip
al C
ourt
s41
41
46
51
51
50
53
58
58
58
Fi
re69
5
69
4
69
6
69
6
69
9
69
8
70
8
71
4
71
4
71
3
1,
713
1,
706
1,
739
1,
725
1,
726
1,
719
1,
757
1,
778
1,
779
1,
772
Cu
ltur
al D
evel
opm
ent
and
Rec
reat
ion:
Park
& R
ecre
atio
n17
3
17
6
19
5
19
6
11
0
18
0
27
0
27
3
27
4
27
4
Tu
lsa
Perf
orm
ing
Art
s Ce
nter
31
30
30
30
29
30
36
37
38
38
204
206
225
226
139
210
306
310
312
312
Soci
al a
nd E
cono
mic
Dev
elop
men
t:M
ayor
's O
ffice
of E
cono
mic
Dev
elop
men
t11
9
-
-
-
-
-
-
-
-
Plan
ning
and
Eco
nom
ic D
evel
opm
ent
87
88
115
112
121
118
91
93
93
84
Wor
king
in N
eigh
borh
oods
67
67
75
77
75
72
87
91
86
83
165
164
190
189
196
190
178
184
179
167
Publ
ic W
orks
and
Tra
nspo
rtat
ion:
Engi
neer
ing
Serv
ices
145
146
162
161
153
155
-
-
-
-
Stre
ets
and
Stor
mw
ater
312
357
375
374
434
437
-
-
-
-
Wat
er a
nd S
ewer
655
648
646
642
657
653
-
-
-
-
Publ
ic W
orks
-
-
-
-
-
-
1,44
1
1,45
3
1,44
5
1,42
6
Airp
orts
-
-
157
157
157
157
158
172
171
169
1,11
2
1,15
1
1,34
0
1,33
4
1,40
1
1,40
2
1,59
9
1,62
5
1,61
6
1,59
5
Gen
eral
Gov
ernm
ent
and
Supp
ort:
Fina
nce
163
157
170
171
158
153
89
84
84
78
Info
rmat
ion
Tech
nolo
gy11
9
11
9
14
3
14
6
14
9
24
9
27
0
27
8
27
7
27
3
As
set M
anag
emen
t13
7
11
1
79
79
79
79
79
83
83
83
Al
l Oth
er17
7
17
6
15
7
18
1
17
7
73
83
96
10
7
13
9
59
6
56
3
58
1
57
7
56
3
55
4
52
1
54
1
55
1
57
3
3,
790
3,
790
4,
075
4,
051
4,
025
4,
075
4,
361
4,
438
4,
437
4,
419
Not
es:
1.So
urce
: City
of T
ulsa
, Ann
ual B
udge
t and
Cap
ital P
lan
2.O
ther
dep
artm
ents
incl
ude:
Ele
cted
Offi
cial
s O
ffice
s, Le
gal,
Hum
an R
esou
rces
and
oth
er d
epar
tmen
ts w
ith le
ss th
an fi
fty
posi
tions
.3.
Year
s an
d de
part
men
ts w
ith n
o em
ploy
ees
indi
cate
d by
"-"
are
the
resu
lt of
org
aniz
atio
nal c
hang
es, w
ith e
mpl
oyee
cou
nts
incl
uded
in a
diff
eren
t dep
artm
ent
as w
ell a
s th
e di
scon
tinue
d us
e of
that
dep
artm
ent n
ame.
CITY
OF
TULS
AN
umbe
r of
Cit
y Em
ploy
ees
Curr
ent
and
Past
Nin
e Ye
ars
S - 23

Func
tion
/Pro
gram
2016
2015
2014
2013
2012
2011
Publ
ic S
afet
y &
Pro
tect
ion
Mun
icip
al C
ourt
1.
Perc
ent o
f adu
lt of
fend
ers
who
suc
cess
fully
com
plet
e pr
obat
ion
orde
r.-
73%
70%
70%
New
Mea
sure
New
Mea
sure
2.
Perc
ent o
f juv
enile
offe
nder
s w
ho s
ucce
ssfu
lly c
ompl
ete
prob
atio
n or
der.
-73
%70
%70
%N
ew M
easu
reN
ew M
easu
re3
.Pe
cent
of r
educ
tion
of o
utst
andi
ng a
ctiv
e w
arra
nts
-5%
New
Mea
sure
New
Mea
sure
New
Mea
sure
New
Mea
sure
Polic
e1
.Pe
rcen
t red
uctio
n in
Par
t One
crim
es o
ver p
revi
ous
year
.12
% d
ecre
ase
3.6%
dec
reas
e5%
dec
reas
e3%
dec
reas
e6.
75%
dec
reas
e5%
incr
ease
2.
Perc
ent r
educ
tion
in fa
talit
y/hi
gh in
jury
col
lisio
ns o
ver p
revi
ous
year
.20
% d
ecre
ase
13.9
% d
ecre
ase
15.4
% d
ecre
ase
3% d
ecre
ase
15.4
% d
ecre
ase
8% d
ecre
ase
3.
Perc
ent r
educ
tion
in n
umbe
r of b
ackl
ogge
d fo
rens
ic c
ases
ove
r pre
viou
s ye
ar.
-37
% d
ecre
ase
37%
dec
reas
e10
% d
ecre
ase
9% d
ecre
ase
43%
incr
ease
4.
Perc
ent i
ncre
ase
of c
alls
resp
onde
d to
in th
ree
min
utes
or l
ess.
0% in
crea
se0.
3% in
crea
se13
.54%
dec
reas
e5%
incr
ease
3.37
% d
ecre
ase
6% in
crea
se5
.Pe
rcen
t of P
SAP
calls
ans
wer
eed
with
in 1
0 se
cond
s.-
85%
85%
90%
88%
-6
.Pe
rcen
t of e
mer
genc
y ca
lls a
nsw
ered
with
in 2
0 se
cond
s.-
89%
89%
95%
92%
-Fi
re1
.Pe
rcen
t of a
rriv
al o
n sc
ene
from
rece
ipt o
f cal
l with
in s
ix m
inut
es85
%86
%86
%90
%87
%89
%2
.Pe
rcen
t of r
educ
tion
of fi
refig
hter
inju
ries
from
pre
viou
s ye
ar.
5%33
%32
%5%
11%
9% in
crea
se
Cult
ure
and
Recr
eati
onPa
rks
1.
Num
ber o
f Mas
ter P
lan
Citiz
en A
dvis
ory
new
slet
ters
cre
ated
per
yea
r.-
-4
4N
ew M
easu
reN
ew M
easu
re2
.Pe
rcen
t of N
atio
nal A
ccre
dita
tion
Stan
dard
s ac
hiev
ed b
y Ju
ne 3
0, 2
015.
--
117
128
New
Mea
sure
New
Mea
sure
3.
Num
ber o
f spe
cial
ized
wel
lnes
s pr
ogra
ms
with
a m
inim
um o
f 15
part
icip
ants
impl
emen
ted
per y
ear.
--
9085
New
Mea
sure
New
Mea
sure
Gilc
reas
e M
useu
m1
.N
umbe
r of s
choo
l-age
d ch
ildre
n re
ceiv
ing
serv
ices
per
yea
r.15
,504
35,3
2617
,000
25,0
0017
,695
25,0
002
.N
umbe
r of v
isito
rs a
ttra
cted
ann
ually
.38
,537
81,3
8478
,144
100,
000
113,
561
85,7
00Pe
rfor
min
g Ar
ts C
ente
r1
.N
umbe
r of p
erfo
rman
ces
per y
ear.
485
505
506
500
524
554
2.
Dol
lar a
mou
nt o
f gro
ss ti
cket
sal
es.
$7 m
illio
n$7
.9 m
illio
n$1
0.6
mill
ion
$7 m
illio
n$1
0.8
mill
ion
$7 m
illio
nBO
K Ar
ena
and
Conv
entio
n Ce
nter
1.
Num
ber o
f pai
d at
tend
ance
to e
vent
cen
ters
per
yea
r.95
0,00
01,
126,
758
921,
535
550,
000
894,
092
849,
052
2.
Gro
ss ti
cket
sal
es p
er y
ear
$21,
000,
000
$25,
212,
936
$19,
132,
173
$15,
000,
000
$19,
601,
157
$16,
101,
011
3.
Num
ber o
f att
ende
d ev
ents
sch
edul
ed a
nd s
ervi
ced
annu
ally
.55
060
052
747
650
858
9
Cont
inue
d
CITY
OF
TULS
ASe
lect
ed O
pera
ting
Indi
cato
rs b
y Fu
ncti
on/P
rogr
amCu
rren
t an
d Pa
st F
ive
Year
s
S - 24

Func
tion
/Pro
gram
2016
2015
2014
2013
2012
2011
Con
tinue
d
Soci
al &
Eco
nom
ic D
evel
opm
ent
May
or's
Offi
ce o
f Eco
nom
ic D
evel
opm
ent
1.
Perc
ent i
ncre
ase
in fu
ture
hot
el ro
om n
ight
s.-
8%7%
5%6.
5%N
ew M
easu
reW
orki
ng In
Nei
ghbo
rhoo
ds1
.Av
erag
e nu
mbe
r of h
ousi
ng re
habi
litat
ions
per
mon
th.
2723
2023
2020
2.
Aver
age
num
ber o
f hou
sing
dem
oliti
ons
per m
onth
.25
3223
3223
213
.N
umbe
r of n
eigh
borh
oods
that
hav
e un
derg
one
a m
appi
ng p
roce
ss p
er y
ear.
33
44
4N
ew M
easu
re4
.N
umbe
r of n
eigh
borh
oods
cle
an-u
p in
itiat
ive
per y
ear.
2013
1218
1212
585
.Av
erag
e nu
mbe
r of v
olun
tary
com
plia
nce
of c
ode
viol
atio
ns p
er m
onth
.10
0011
0088
211
0088
2N
ew M
easu
re6
.Pe
rcen
t red
uctio
n of
ani
mal
s eu
than
ized
at T
ulsa
Ani
mal
Wel
fare
(TAW
).13
% re
duct
ion
12%
redu
ctio
n18
.6%
12
% re
duct
ion
8.6%
redu
ctio
nN
ew M
easu
re7
.Pe
rcen
t inc
reas
e of
live
exi
ts o
f ani
mal
s fr
om T
AW.
8% in
crea
se12
% in
crea
se1.
6% in
crea
se12
% in
crea
se1.
6% in
crea
seN
ew M
easu
re8
.Pe
rcen
t red
uctio
n of
ani
mal
inta
ke a
t TAW
.5%
redu
ctio
n5%
redu
ctio
n8.
6% re
duct
ion
New
Mea
sure
New
Mea
sure
New
Mea
sure
Plan
ning
and
Eco
nom
ic D
evel
opm
ent
1.
Num
ber o
f sm
all a
rea
plan
s cr
eate
d or
upd
ated
by
6/30
/16.
34
23
0N
ew M
easu
re2
.Av
erag
e nu
mbe
r of w
orki
ng d
ays
for p
lans
revi
ew.
89
810
107
3.
Aver
age
num
ber o
f cal
enda
r day
s to
issu
e pe
rmits
for c
omm
erci
al p
roje
cts
unde
r $1
mill
ion.
4341
3730
3034
4.
Num
ber o
f His
toric
Pre
serv
atio
n Se
ctio
n 10
6 ap
plic
atio
ns p
roce
ssed
ann
ually
.33
026
0N
ew M
easu
reN
ew M
easu
reN
ew M
easu
reN
ew M
easu
re5
.N
umbe
r of p
erm
its g
rant
ed fo
r His
toric
Pre
serv
atio
n w
ork
unde
r Cer
tific
ate
of
Appr
opria
tene
ss p
roce
ssed
ann
ually
.70
60N
ew M
easu
reN
ew M
easu
reN
ew M
easu
reN
ew M
easu
re
Con
tinue
d
CITY
OF
TULS
ASe
lect
ed O
pera
ting
Indi
cato
rs b
y Fu
ncti
on/P
rogr
amCu
rren
t an
d Pa
st F
ive
Year
s
S - 25

Func
tion
/Pro
gram
2016
2015
2014
2013
2012
2011
Con
tinue
d
Publ
ic W
orks
& T
rans
port
atio
nEn
gine
erin
g Se
rvic
es1
.Pe
rcen
t of c
apita
l pro
ject
s de
sign
ed, r
ight
-of-
way
eas
emen
ts a
cqui
red
and
utili
ties
relo
cate
d w
ithin
sch
edul
ed ti
me
fram
es.
45%
62%
62%
80%
62%
83%
2.
Perc
ent o
f cap
ital p
roje
cts
cons
truc
ted
with
in s
ched
uled
tim
e fr
ames
.98
%85
%93
%90
%93
%96
%3
.Pe
rcen
t of c
apita
l pro
ject
s co
mpl
eted
with
in a
ppro
pria
ted
budg
ets.
100%
100%
100%
95%
100%
100%
4.
Chan
ge o
rder
per
cent
for c
apita
l pro
ject
s (S
tate
sta
tute
: Pro
ject
s va
lued
at:
a) $
1,00
0,00
0 or
less
: 15%
max
imum
; b) A
bove
$1,
000,
000:
10%
max
imum
.7.
0%4.
0%0.
5%7.
0%2.
4%2.
0%
5.
Perc
ent o
f bid
adv
ertis
emen
ts p
oste
d an
d up
date
d in
all
loca
tions
.10
0%10
0%95
%95
%96
%98
%St
reet
s an
d St
orm
wat
er1
.Av
erag
e nu
mbe
r of h
ours
it ta
kes
to re
spon
d to
em
erge
ncy
stre
et re
pair
requ
ests
.39
min
utes
34 m
inut
es25
min
utes
1N
ew M
easu
reN
ew M
easu
re2
.Pe
rcen
t of c
ompl
ianc
e w
ith C
ity g
rass
hei
ght o
rdin
ance
.N
/A10
0%10
0%10
0%N
ew M
easu
reN
ew M
easu
re3
.Pe
rcen
t red
uctio
n in
trav
el ti
me
in m
odifi
ed a
nd u
pdat
ed tr
affic
sig
nal a
reas
.-
20%
20%
10%
New
Mea
sure
New
Mea
sure
4.
Aver
age
num
ber o
f hou
rs it
take
s to
resp
ond
to s
torm
wat
er e
mer
genc
ies.
53 m
inut
es32
min
utes
32 m
inut
es1
New
Mea
sure
New
Mea
sure
5.
Perc
ent o
f ver
ified
mis
sed
colle
ctio
ns o
f ref
use
and
recy
clin
g se
rvic
es.
2.6%
2.6%
1.0%
0.2%
New
Mea
sure
New
Mea
sure
Wat
er a
nd S
ewer
1.
Perc
ent o
f cus
tom
er s
ervi
ce d
eman
d fo
r tre
ated
wat
er.
100%
100%
100%
98%
100%
New
Mea
sure
2.
Aver
age
num
ber o
f ins
tanc
es o
f non
com
plia
nce
with
Okl
ahom
a Po
lluta
nt D
isch
arge
El
imin
atio
n Sy
stem
for a
ll w
aste
wat
er tr
eatm
ent p
lant
s pe
r qua
rter
.-
-0.
755
1.25
New
Mea
sure
3.
Aver
age
num
ber h
ours
for w
ater
off
per c
usto
mer
dur
ing
emer
genc
y re
pairs
.5.
335.
114.
915
4.91
New
Mea
sure
4.
Perc
ent o
f on-
site
resp
onse
s to
san
itary
sew
er s
topp
age
and
over
flow
cal
ls w
ithin
two
hour
s.97
.0%
98.0
%99
.7%
95%
99.7
%N
ew M
easu
re
Met
ropo
litan
Tul
sa T
rans
it Au
thor
ity1
.N
umbe
r of f
ixed
rout
e co
mpl
aint
s pe
r 10k
boa
rdin
gs4.
34.
22.
74
2.7
42
.N
umbe
r of l
ift p
rogr
am c
ompl
aint
s pe
r 10k
boa
rdin
gs.
1923
.421
.823
21.8
233
.N
umbe
r of f
ixed
rout
e pa
ssen
gers
per
hou
r.-
18.3
18.3
1717
.615
4.
Num
ber o
f lift
pro
gram
pas
seng
ers
per h
our.
2.07
2.07
2.1
22.
12
Con
tinue
d
CITY
OF
TULS
ASe
lect
ed O
pera
ting
Indi
cato
rs b
y Fu
ncti
on/P
rogr
amCu
rren
t an
d Pa
st F
ive
Year
s
S - 26

Func
tion
/Pro
gram
2016
2015
2014
2013
2012
2011
Con
tinue
d
Adm
inis
trat
ive
and
Supp
ort
Serv
ices
Elec
ted
Offi
cial
s1
.Pe
rcen
t of a
ccep
tanc
e ra
te fo
r rec
omm
enda
tions
.90
%90
%90
%90
%90
%10
0%2
.Pe
rcen
t of i
mpl
emen
tatio
n ra
te fo
r rec
omm
enda
tions
.87
%86
%87
%90
%88
%86
%3
.Q
ualit
y ra
nkin
g on
a 1
-4 s
cale
.3.
33.
33.
53.
33.
5N
ew M
easu
reH
uman
Rig
hts
Dep
artm
ent
1.
Perc
ent o
f dis
crim
inat
ion
com
plai
nts
with
reco
mm
ende
d re
solu
tions
with
in 6
0 da
ys.
100%
100%
100%
100%
100%
New
Mea
sure
2.
Perc
ent o
f con
trac
ted
City
of T
ulsa
pro
ject
s th
at m
eet u
tiliz
atio
n go
als.
--
75%
75%
50%
New
Mea
sure
3.
Perc
ent o
f HU
D g
rant
s su
b-re
cipi
ents
who
hav
e re
ceiv
ed tr
aini
ng a
nd/o
r as
sist
ance
per
yea
r.-
0%75
%80
%40
%N
ew M
easu
re
Lega
l Dep
artm
ent
1.
Perc
ent o
f rev
iew
s fo
r pro
secu
tions
com
plet
ed w
ithin
two
wor
king
day
s.10
0%10
0%10
0%10
0%10
0%10
0%2
.Pe
rcen
t of c
ontr
acts
com
plet
ed w
ithin
ten
busi
ness
day
s.10
0%93
%98
%90
%98
%91
%H
uman
Res
ourc
es D
epar
tmen
t1
.Pe
rcen
t of i
nter
nal n
on-s
wor
n va
canc
ies
fille
d w
ithin
45
days
of c
losi
ng d
ate.
93%
95%
95%
80%
95%
94%
2.
Perc
ent o
f ext
erna
l non
-sw
orn
vaca
ncie
s fil
led
with
in 4
5 da
ys o
f clo
sing
dat
e.83
%79
%89
%80
%92
%89
%3
.Pe
rcen
t of r
epor
ted
inju
ry c
laim
s cl
osed
with
in 9
0 da
ys o
f sub
mis
sion
.77
%76
%76
%65
%76
%74
%Fi
nanc
e D
epar
tmen
t1
.Ba
sis
poin
ts o
ver t
he tr
easu
ry b
ill ra
te.
111
8690
2510
811
52
.Ci
ty's
Stan
dard
and
Poo
r bon
d ra
ting.
AAAA
AAAA
AAAA
3.
City
's M
oody
's In
vest
or S
ervi
ce b
ond
ratin
g.Aa
¹Aa
¹Aa
¹Aa
¹Aa
¹AA
¹4
.Av
erag
e pe
rcen
t of G
ener
al F
und
emer
genc
y op
erat
ing
rese
rve.
111.
3%8.
0%12
.0%
6.3%
89.0
%6.
0%5
.Co
llect
ion
rate
per
cent
of r
even
ue b
illed
for U
tiliti
es S
ervi
ces.
99.0
%99
.4%
99.3
%99
.3%
99.3
%99
.9%
Info
rmat
ion
Tech
nolo
gy1
.An
nual
and
qua
rter
ly c
usto
mer
ser
vice
ratin
g (1
-5).
4.9
4.9
4.9
4.0
4.8
4.9
2.
Perc
ent o
f IT
serv
ice
ticke
ts o
pen
past
30
days
.1%
2%2%
1%2%
New
Mea
sure
3.
Firs
t con
tact
reso
lutio
n ra
te.
50%
47%
47%
35%
43%
41%
Cust
omer
Car
e1
.Pe
rcen
t of c
alls
ans
wer
ed w
ithin
45
seco
nds.
62%
56%
48%
85%
48%
New
Mea
sure
2.
Aver
age
call
aban
donm
ent p
erce
ntag
e.11
%16
%18
%<
8%18
%N
ew M
easu
re3
.Cu
stom
er s
ervi
ce q
ualit
y sc
ore
perc
ent f
or re
cord
ed a
nd m
onito
red
calls
.92
%94
%94
%90
%N
/AN
ew M
easu
reCo
mm
unic
atio
ns D
epar
tmen
t1
.N
umbe
r of m
edia
trai
ning
s pe
rfor
med
for f
ield
sup
ervi
sors
per
yea
r.6
3N
ew M
easu
reN
ew M
easu
reN
ew M
easu
reN
ew M
easu
reEq
uipm
ent M
anag
emen
t Dep
artm
ent
1.
Perc
ent o
f des
igna
ted
fleet
ava
ilabi
lity.
92%
93%
94%
93%
95%
86%
2.
Perc
ent o
f par
king
met
ers
that
are
ope
ratio
nal p
er y
ear.
95%
85%
New
Mea
sure
New
Mea
sure
New
Mea
sure
95%
3.
Perc
ent o
f dire
ct la
bor h
ours
ded
icat
ed to
par
king
met
er e
nfor
cem
ent p
er y
ear.
99%
100%
New
Mea
sure
New
Mea
sure
New
Mea
sure
New
Mea
sure
Not
e: D
ata
not a
vaila
ble
is in
dica
ted
by a
"-"
.
Sour
ce: C
ity o
f Tul
sa
CITY
OF
TULS
ASe
lect
ed O
pera
ting
Indi
cato
rs b
y Fu
ncti
on/P
rogr
amCu
rren
t an
d Pa
st F
ive
Year
s
S - 27

Mon
thly
Rate
per
Mon
thly
Rate
per
Base
1,00
0Ba
se1,
000
Year
Rate
Gal
lons
Rate
Gal
lons
2016
5.51
$
3.
64$
5.88
$
6.
15$
2015
5.15
3.
40
5.39
5.
64
2014
4.81
3.
18
4.91
5.
14
2013
4.50
2.
97
4.50
4.
71
2012
4.50
2.
75
4.50
4.
27
2011
4.50
2.
53
4.50
3.
92
2010
4.20
2.
37
4.50
3.
56
2009
4.08
2.
31
4.08
3.
23
2008
4.00
2.
17
4.08
3.
05
2007
4.00
2.
17
4.04
2.
87
CITY
OF
TULS
A
Wat
erSe
wer
TULS
A M
ETR
OPO
LITA
N U
TILI
TY A
UTH
ORI
TYW
ATE
R A
ND
SEW
ER R
ATE
SCu
rren
t an
d Pa
st N
ine
Year
s(R
esid
entia
l - In
side
City
Lim
its)
S - 28

Appendix C
Form of Opinion of Bond Counsel

HILBORNE & WEIDMANA PROFESSIONAL CORPORATION
ATTORNEYS AND COUNSELORS
2405 EAST 57TH STREET
TULSA, OKLAHOMA 74105-7548TELEPHONE:
(918) 749-0111TELECOPER:
(918) 749-0335
March 17, 2017
We have examined into the validity of "General Obligation Refunding Bonds of 2017, Series A" (the"Bonds") of the City of Tulsa, Oklahoma (the "City"), in the principal amount of $33,355,000.00, datedMarch 17, 2017. The Bonds are due serially as follows:$10,985,000.00 due December 1, 2019,$11,110,000.00 due December 1, 2020, and $11,260,000.00 due December 1, 2021, bear interest from dateuntil paid, payable on the 1st day of June and December of each year, beginning June 1, 2017, at thefollowing annual rates: $10,985,000.00 due December 1, 2019: %; $11,110,000.00 dueDecember 1, 2020: %; and $11,260,000.00 due December 1, 2021: %.
We have not been engaged or undertaken to review the accuracy, completeness or sufficiency of theOfficial Statement or other offering material relating to the Bonds and we express no opinion relating thereto.
We have examined (a) originals or certified copies of the proceedings relating to the issuance of theBonds as contained in a Transcript of Proceedings had in connection therewith, and (b) an executed Bondof said issue with the Certificate of the Attorney General as Bond Commissioner of the State of Oklahoma,required by Title 62, Oklahoma Statutes 2011, Sections 13 and 14, thereon. In addition, we have examinedsuch other documents and instruments as we have deemed necessary to express the opinions hereinafter setforth. As to questions of fact material to our opinion we have relied upon the Transcript of Proceedings andother certifications of public officials furnished to us without undertaking to verify the same by independentinvestigation.
Based upon the foregoing, we are of the opinion that, under existing law:
1. The Bonds are valid and binding general obligations of the City.
2. The interest on the Bonds is excluded from gross income for federal income taxpurposes and is not an item of tax preference for purposes of the federal alternative minimum taximposed on individuals and corporations; it should be noted, however, that for the purpose ofcomputing the alternative minimum tax imposed on corporations (as defined for federal income taxpurposes), such interest is taken into account in determining adjusted current earnings; it should benoted, however, that for the purpose of computing the alternative minimum tax imposed oncorporations (as defined for federal income tax purposes), such interest is taken into account indetermining adjusted current earnings. The opinions set forth in the preceding sentence are subjectto the condition that the City comply with all requirements of the Internal Revenue Code of 1986(the "Code") that must be satisfied subsequent to the issuance of the Bonds in order that interest
24037.68

thereon be, or continue to be, excluded from gross income for federal income tax purposes. The Cityhas covenanted to comply with all such requirements. Failure to comply with certain of suchrequirements may cause the inclusion of interest on the Bonds in gross income for federal incometax purposes to be retroactive to the date of issuance of the Bonds.
3. The interest on the Bonds is excluded from gross income for state of Oklahomaincome taxation purposes.
We express no opinion regarding other federal tax consequences arising with respect to the Bonds.
It is to be understood that the rights of the holders of the Bonds and the enforceability thereof maybe subject to bankruptcy, insolvency, reorganization, moratorium and other similar laws affecting creditors'rights heretofore or hereafter enacted to the extent constitutionally applicable and that their enforcement mayalso be subject to the exercise of judicial discretion in appropriate cases.
Respectfully submitted,
224037.68

Appendix D
Form of Continuing Disclosure Certificate

CONTINUING DISCLOSURE CERTIFICATE
This Continuing Disclosure Certificate (the “Certificate”) dated as of March 17, 2017, is executedand delivered by the City of Tulsa, Oklahoma (the “Issuer”) in connection with the issuance of the Issuer’s$33,355,000.00 General Obligation Refunding Bonds of 2017, Series A (the “Bonds”). Capitalized termsused in this Certificate shall have the respective meanings specified in Article IV hereof. The Issuercovenants and agrees as follows:
ARTICLE IThe Undertaking
Section 1.1. Purpose. This Certificate is being executed and delivered solely to assist theUnderwriter in complying with subsection (b)(5) of the Rule.
Section 1.2. Annual Financial Information. (a) The Issuer shall provide Annual FinancialInformation with respect to each fiscal year of the Issuer, commencing with fiscal year ending June 30, 2017,by no later than 6 months after the end of the respective fiscal year, to the MSRB.
(b) The Issuer shall provide, in a timely manner, notice of any failure to provide the AnnualFinancial Information by the date specified in subsection (a) above to the MSRB.
Section 1.3. Audited Financial Statements. If not provided as part of the Annual FinancialInformation by the date required by Section 1.2(a) hereof, the Issuer shall provide Audited FinancialStatements, when and if available, to the MSRB.
Section 1.4. Listed Event Notices. (a) If a Listed Event occurs, the Issuer shall provide, within10 business days of the occurrence of the applicable event, notice of such Listed Event to the MSRB on theMSRB’s Internet Web Site. Provided that any event under (ii), (vii), (viii), (x), (xiv) or (xv) of the definitionof Listed Event must be filed only if the event is material. Notwithstanding the foregoing, notice of a ListedEvent described in subsections (viii) and (ix) need not be given under this section any earlier than the notice(if any) of the underlying event is given to holders of affected Bonds pursuant to the Bond Documents..
(b) Any notice of a defeasance of Bonds shall state whether the Bonds have been escrowed tomaturity or to an earlier redemption date and the timing of such maturity or redemption.
Section 1.5 Nothing in this Certificate shall be deemed to prevent the Issuer from disseminatingany other information, using the means of dissemination set forth in this Certificate or any other means ofcommunication, or including any other information in any Annual Financial Information or notice of ListedEvent hereunder, in addition to that which is required by this Certificate. If the Issuer chooses to do so, theIssuer shall have no obligation under this Certificate to update such additional information or include it inany future Annual Financial Information or notice of a Listed Event hereunder.
Section 1.6. Suspension of Obligations. Anything herein to the contrary notwithstanding,the obligations to file Annual Financial Information, Audited Financial Statements, Listed Event Notices andadditional information pursuant to Sections 1.2, 1.3, 1.4 and 1.5 hereof may be suspended for so long as theBonds are eligible for exception from the requirements of the Rule pursuant to Section 15c2-12(d)(1)(iii)thereof, provided that notice of such suspension is filed promptly to the extent and in the manner thatotherwise would be required for Annual Financial Information, Audited Financial Statements, Listed EventNotices and such additional information.
124037.33a

Section 1.7. Additional Disclosure Obligations. The Issuer acknowledges and understands thatother state and federal laws, including but not limited to the Securities Act of 1933 and Rule 10b-5promulgated under the Securities Exchange Act of 1934, may apply to the Issuer and that, under somecircumstances, compliance with this Certificate without additional disclosures or other action may not fullydischarge all duties and obligations of the Issuer under such laws.
ARTICLE IIOperating Rules
Section 2.1. Reference to Other Filed Documents. It shall be sufficient for purposes of Section1.2 hereof if the Issuer provides Annual Financial Information (but not Listed Event notices) by specificreference to documents either (i) available to the public on the MSRB Internet Web Site or (ii) filed with theSEC.
Section 2.2. Submission of Information. Annual Financial Information may be set forth orprovided in one document or a set of documents, and at one time or in part from time to time.
Section 2.3. Dissemination Agents. The Issuer may from time to time designate an agent to acton its behalf in providing or filing notices, documents and information as required of the Issuer under thisCertificate, and revoke or modify any such designation.
Section 2.4. Transmission of Information and Notices. Unless otherwise required by lawall notices, documents and information provided to the MSRB shall be provided in an electronic format asprescribed by the MSRB (presently the MSRB Internet Web Site), and shall be accompanied by identifyinginformation as prescribed by the MSRB.
Section 2.5. Fiscal Year. The Issuer’s current fiscal year is July 1 – June 30, and the Issuer shallpromptly provide notice of each change in its fiscal year to the MSRB.
(b) Annual Financial Information shall be provided at least annually notwithstanding any fiscalyear longer than 12 calendar months.
ARTICLE IIIEffective Date, Termination, Amendment and Enforcement
Section 3.1. Effective Date, Termination. (a) This Certificate shall be effective upon theissuance of the Bonds.
(b) The Issuer’s obligations under this Certificate shall terminate upon a legal defeasance, priorredemption or payment in full of all of the Bonds.
(c) This Certificate, or any provision hereof, shall be null and void in the event that (1) the Issuerobtains an opinion of Counsel, addressed to the Issuer to the effect that those portions of the Rule whichrequire this Certificate, or such provision, as the case may be, do not or no longer apply to the Bonds,whether because such portions of the Rule are invalid, have been repealed, or otherwise, as shall be specifiedin such opinion, and (2) the Issuer delivers a copy of such opinion within one Business Day after receipt bythe Issuer to the MSRB.
Section 3.2. Amendment. (a) This Certificate may be amended, without the consent of theholders of the Bonds (except to the extent required under clause (4)(ii) below), if all of the followingconditions are satisfied: (1) such amendment is made in connection with a change in circumstances that
2

arises from a change in legal (including regulatory) requirements, a change in law (including rules orregulations) or in interpretations thereof, or a change in the identity, nature or status of the Issuer or the typeof business conducted thereby, (2) this Certificate as so amended would have complied with the requirementsof the Rule as of the date of this Certificate, after taking into account any amendments or interpretations ofthe Rule, as well as any change in circumstances, (3) the Issuer shall have obtained an opinion of Counsel,addressed to the Issuer to the same effect as set forth in clause (2) above, (4) either (i) the Issuer shall haveobtained an opinion of Counsel or a determination by a person, in each case unaffiliated with the Issuer (suchas bond counsel), and addressed to the Issuer, to the effect that the amendment does not materially impairthe interests of the holders of the Bonds or (ii) the holders of the Bonds consent to the amendment to thisCertificate, and (5) the Issuer shall have delivered copies of such opinion(s) and amendment to the MSRBwithin one Business Day after receipt by the Issuer.
(b) In addition to subsection (a) above, this Certificate may be amended without the consent ofthe holders of the Bonds, if all of the following conditions are satisfied: (1) an amendment to the Rule isadopted, or a new or modified official interpretation of the Rule is issued, after the effective date of thisCertificate which is applicable to this Certificate, (2) the Issuer shall have obtained an opinion of Counsel,addressed to the Issuer, to the effect that performance by the Issuer under this Certificate as so amended willnot result in a violation of the Rule and (3) the Issuer shall have delivered copies of such opinion andamendment to the MSRB within one Business Day after receipt by the Issuer.
(c) This Certificate may be amended without the consent of the holders of the Bonds, to amendthe information and dates specified in Section 1.5(a) hereof.
(d) This Certificate may be amended without the consent of the holders of the Bonds, if all ofthe following conditions are satisfied: (1) the Issuer shall have obtained an opinion of Counsel, addressedto the Issuer, to the effect that the amendment is permitted by rule, order or other official pronouncement,or is consistent with any interpretive advice or no-action positions of staff of the SEC, and (2) the Issuer shallhave delivered copies of such opinion and amendment to the MSRB within one Business Day after receiptby the Issuer.
(e) To the extent any amendment to this Certificate results in a change in the type of financialinformation or operating data provided pursuant to this Certificate, the first Annual Financial Informationprovided thereafter shall include a narrative explanation of the reasons for the amendment and the impactof the change in the type of operating data or financial information being provided.
(f) If an amendment is made pursuant to Section 3.2 (a) hereof to the accounting principles tobe followed by the Issuer in preparing its financial statements, the Annual Financial Information for the fiscalyear in which the change is made shall present a comparison between the financial statements or informationprepared on the basis of the new accounting principles and those prepared on the basis of the formeraccounting principles. Such comparison shall include a qualitative and, to the extent reasonably feasible,quantitative discussion of the differences in the accounting principles and the impact of the change in theaccounting principles on the presentation of the financial information.
Section 3.3. Benefit; Third-Party Beneficiaries; Enforcement. (a) The provisions of thisCertificate shall constitute a contract with and inure solely to the benefit of the holders from time to time ofthe Bonds, except that (i) beneficial owners of Bonds shall be third-party beneficiaries of this Certificate. The provisions of this Certificate shall create no rights in any person or entity except as provided in thissubsection (a) and in subsection (b) of this Section.
(b) The obligations of the Issuer to comply with the provisions of this Certificate shall beenforceable by any holder of Outstanding Bonds. The holders’ rights to enforce the provisions of thisCertificate shall be limited solely to a right, by action in mandamus or for specific performance, to compel
3

performance of the Issuer’s obligations under this Certificate. In consideration of the third-party beneficiarystatus of beneficial owners of Bonds pursuant to subsection (a) of this Section, beneficial owners shall bedeemed to be holders of Bonds for purposes of this subsection (b).
c) Any failure by the Issuer to perform in accordance with this Certificate shall not constitutea default under the Bonds.
(d) This Certificate shall be construed and interpreted in accordance with the laws of the State,and any suits and actions arising out of this Certificate shall be instituted in a court of competent jurisdictionin the State; provided, however, that to the extent this Certificate addresses matters of federal securities laws,including the Rule, this Certificate shall be construed in accordance with such federal securities laws andofficial interpretations thereof.
ARTICLE IVDefinitions
Section 4.1. Definitions. The following terms used in this Certificate shall have the followingrespective meanings:
(1) “Annual Financial Information” means, collectively, (i) updated versions of the followingfinancial information and operating data contained in the Official Statement, for each fiscal year of theIssuer, as follows:
The financial information and operating data set forth in Appendix A and Appendix B of the OfficialStatement; and (ii) the information regarding amendments to this Certificate required pursuant to Sections3.2(e) and (f) of this Certificate. Annual Financial Information shall include Audited Financial Statements,if available, or Unaudited Financial Statements.
The descriptions contained in Section 4.1(1)(i) hereof of financial information and operating dataconstituting Annual Financial Information are of general categories of financial information and operatingdata. When such descriptions include information that no longer can be generated because the operationsto which it related have been materially changed or discontinued, a statement to that effect shall be providedin lieu of such information. Any Annual Financial Information containing modified financial informationor operating data shall explain, in narrative form, the reasons for the modification and the impact of themodification on the type of financial information or operating data being provided.
(2) “Audited Financial Statements” means the annual financial statements, if any, of the Issuer,audited by such auditor as shall then be required or permitted by State law. Audited Financial Statementsshall be prepared in accordance with GAAP; provided, however, that pursuant to Sections 3.2(a) and (f)hereof, the Issuer may from time to time, if required by Federal or State legal requirements, modify theaccounting principles to be followed in preparing its financial statements. The notice of any suchmodification required by Section 3.2(a) hereof shall include a reference to the specific Federal or State lawor regulation describing such accounting principles, or other description thereof.
(3) “Counsel” means Hilborne & Weidman, A Professional Corporation, Tulsa, Oklahoma orother nationally recognized bond counsel or counsel expert in federal securities laws.
(4) “GAAP” means generally accepted accounting principles as prescribed from time to timefor governmental units by the Governmental Accounting Standards Board, or any successor to the duties orresponsibilities thereof.
4

(5) “Internet Web Site” means the MSRB’s Electronic Municipal Market Access (EMMA)system, presently at http://emma.msrb.org.
(6) “Listed Event” means any of the following events with respect to the Bonds whether relatingto the Issuer or otherwise:
(i) principal and interest payment delinquencies;(ii) non-payment related defaults;(iii) unscheduled draws on debt service reserves reflecting financial difficulties;(iv) unscheduled draws on credit enhancements reflecting financial difficulties;(v) substitution of credit or liquidity providers, or their failure to perform;(vi) adverse tax opinions, the issuance by the IRS of proposed or final determinations of
taxability, notices of Proposed Issue (IRS Form 5701-TEB), or other material notices ordeterminations with respect to the tax status of the security, or other events affecting the taxstatus of the security (including Build America Bonds);
(vii) modifications to rights of Bondholders;(viii) bond calls;(ix) defeasances;(x) release, substitution or sale of property securing repayment of the Bonds;(xi) rating changes;(xii) tender offers;(xiii) bankruptcy, insolvency, receivership or similar event of the obligated group;(xiv) consummation of a merger, consolidation, or acquisition involving an obligated person, or
the sale of all or substantially all the assets of the obligated person, other than in theordinary course of business, the entry of a definitive agreement to undertake such an actionor the termination of a definitive agreement relating to such actions, other than pursuant toits terms; and
(xv) appointment of a successor or additional trustee or the change of name of a trustee.
(7) “MSRB” means the Municipal Securities Rulemaking Board established pursuant to Section15B(b)(1) of the Securities Exchange Act of 1934, or any successor thereto or to the functions of the MSRBcontemplated by this Certificate.
(8) “Official Statement” means the Official Statement dated , 2017 of theIssuer relating to the Bonds.
(9) “Rule” means Rule 15c2-12 promulgated by the SEC under the Securities Exchange Act of1934 (17 CFR Part 240, §240.15c2-12), as amended, as in effect on the date of this Certificate, including anyofficial interpretations thereof issued either before or after the effective date of this Certificate which areapplicable to this Certificate.
(10) “SEC” means the United States Securities and Exchange Commission.
(11) “Unaudited Financial Statements” means the same as Audited Financial Statements, exceptthat they shall not have been audited.
ARTICLE VMiscellaneous
Section 5.1 Counterparts. This Certificate may be executed in several counterparts, each ofwhich shall be an original and all of which shall constitute but one and the same instrument.
5

Date: March 17, 2017.
CITY OF TULSA, OKLAHOMA
ATTEST: Mayor
City Clerk
(SEAL)
6