office of planning, institutional research, & assessment …
TRANSCRIPT
OFFICE OF PLANNING, INSTITUTIONAL RESEARCH, & ASSESSMENT P.O. Box 248285
Coral Gables, FL 33124-2923 (305) 284-FACT
www.miami.edu/factbook

To Our Readers: The information presented in the Fall Fact Book represents the most current benchmark data available. Please note that students who have not completed financial registration by the benchmark date will not appear in the enrollment counts. Copies of this Fact Book have been mailed to deans, associate/assistant deans, department chairs, and other senior administrators. Fact Books are posted online (www.miami.edu/factbook) and are also available in the Richter Library’s Special Collection’s Division.

TABLE OF CONTENTS
Glossary ........................................................................................................................................ i
University of Miami Mission Statement .................................................................................... iii
An Introduction to the University of Miami .............................................................................. iii
Organization Chart ..................................................................................................................... xx
Student Enrollments:
Headcount by Class and School ............................................................................................. 1
FTE, Full-Time, Part-Time, Credit Load ............................................................................. 10
Entering Student Classifications (Undergraduate & Graduate/Professional) ...................... 17
Admissions Data .................................................................................................................. 20
Headcount by Major............................................................................................................. 22
Headcount by Minor ............................................................................................................ 44
Gender Distribution.............................................................................................................. 48
Racial/Ethnic Distribution.................................................................................................... 51
Geographic Origins .............................................................................................................. 59
Headcount by State or Country ............................................................................................ 70
Student Classifications by World Region ............................................................................ 78
Religious Affiliations ........................................................................................................... 82
Age Ranges .......................................................................................................................... 84
Residence of Students .......................................................................................................... 88
Credit Hours:
Credits Taught by School (Five-Year Trends) ..................................................................... 90
Crossover Patterns ............................................................................................................... 95
Credit Hours for Each Home School of Majors by Teaching School .................................. 98
Credits Taught by Department ........................................................................................... 102
Retention & Graduation Rates ................................................................................................. 110
Degrees Granted ....................................................................................................................... 112
Alumni ..................................................................................................................................... 119
Faculty and Other Employees .................................................................................................. 120
Library Statistics ...................................................................................................................... 142
Tuition, Fees, Room and Board, Expenses .............................................................................. 143
Research Funding ..................................................................................................................... 144
Financial Highlights & Endowment ........................................................................................ 150
i
GLOSSARY Academic Year - Fall and spring semesters and subsequent first and second summer sessions. Associated Faculty - All faculty with professorial titles prefixed by “Voluntary,” “Adjunct,” “Visiting,” or “Affiliated,” and all Lecturers. CIP Codes - The Classification of Instructional Programs developed by the National Center for Education Statistics “to create a standard terminology to guide the reporting of data.” Continuing Studies, Graduate School, & Joint Programs - Includes joint-degree, Continuing Studies, and study-abroad programs (non-UM students studying abroad and foreign students studying at UM through the Office of International Education and Exchange Programs). Degree Program - An academic program leading to a degree. Degree Student - One enrolled in a degree program. Doctoral-Research/Scholarship – A Ph.D. or other doctor's degree that requires advanced work beyond the master’s level, including the preparation and defense of a dissertation based on original research, or the planning and execution of an original project demonstrating substantial artistic or scholarly achievement. Some examples of this type of degree include Ed.D. and D.M.A. Doctoral-Professional Practice – A doctor’s degree that is conferred upon completion of a program providing the knowledge and skills for the recognition, credential, or license required for professional practice. The degree is awarded after a period of study such that the total time to the degree, including both pre-professional and professional preparation, equals at least six full-time equivalent academic years. Some of these degrees were formerly classified as “first-professional” and include: law (J.D.), medicine (M.D.), physical therapy (D.P.T.), and practical nursing (D.N.P.). DUG - Degree undergraduate (student). Educator Faculty - Consists of i) Instructors and ii) those faculty with professorial titles engaged primarily in professional practice and in teaching associated with that practice. Educator faculty shall not hold tenured or tenure-earning appointments. Entering Students - Includes new freshmen, new transfers, and entering graduate/professional students. Fall-to-Fall Retention Rate - The percent of full-time students enrolled at benchmark in one fall who re-enroll or graduate by benchmark of the next fall. FTE - Full-time equivalent. For a full-time student, the FTE is equal to 1.0. For a part-time student, the FTE is equal to the student’s credit load divided by his/her appropriate full-time load (see below). Full-Time Load - For fall and spring semesters: 12 semester hours for all undergraduates, 9 for graduate students, 6 for executive M.B.A. students and M.S.P.M. students, 11 for all Law School students, and 8 or more for clinical medical students. A doctoral student taking any dissertation credit or a master’s student taking any thesis credit is considered full-time, regardless of the number of dissertation or thesis hours taken. A student taking a course flagged as full-time is considered full-time, regardless of his/her total credit load. Graduate (Programs) - All post-baccalaureate work, including law school and clinical medicine.
Graduation Rate - Based on the IPEDS GRS methodology; cohort is degree-seeking students who enrolled for the first time in college either in the fall or in one of the two preceding summer sessions and who were
ii
enrolled full-time in that fall. Graduation rates are the percent of the cohort who earned a degree by time indicated (time to degree is through August 31st of degree year). Headcount - The number of financially registered students, as of benchmark, regardless of their individual credit load. Home School - Primary UM school or college of student International Programs - Courses taught outside the U.S. under the auspices of the University of Miami. Librarian Faculty - Consists of those faculty serving in the libraries of the University who hold the rank of Librarian Professor, Librarian Associate Professor, or Librarian Assistant Professor and who perform normal professional duties in the libraries, but are not required to undertake scholarly research. Librarian faculty shall not hold tenured or tenure-earning appointments. NDUG - Non-degree undergraduate (student). New Freshman - A matriculating degree undergraduate without prior college experience. (See the current University of Miami Bulletin for minor exceptions concerning prior experience.) New Transfer - A matriculating degree undergraduate with prior college experience. Part-Time Load - Any semester credit-hour load less than full-time. Readmitted Student - One who returns to UM after an absence of at least one semester (excluding summer sessions). Regular Faculty - Consists of all faculty having tenured or tenure-earning appointments who hold the rank of Professor, Associate Professor, or Assistant Professor. Research Faculty - Consists of those faculty whose major function is to conduct research in the academic units of the University and who hold the rank of Research Professor, Research Associate Professor, or Research Assistant Professor. Research faculty shall not hold tenured or tenure-earning appointments. Rosenstiel School - Rosenstiel School of Marine and Atmospheric Science. Teaching School – UM school or college of instructor University Faculty - Consists of the President, the Executive Vice President and Provost, the academic deans, the Regular, Research, Librarian, and Educator Faculty.
iii
THE UNIVERSITY OF MIAMI MISSION STATEMENT
The University of Miami’s mission is to educate and nurture students, to create knowledge, and to provide service to our community and beyond. Committed to excellence and proud of the diversity of our University family, we strive to develop future leaders of our nation and the world.
AN INTRODUCTION TO THE UNIVERSITY OF MIAMI History: Although many people over a period of years played a role in the establishment of the University of Miami, it was William Jennings Bryan who first promoted the need and stimulated a community planning effort for a university to serve the growing Miami area. In 1925 the University received its charter and in the following year enrolled its first students. On March 18, 1926, Bowman Foster Ashe was named executive secretary and subsequently president of the University by the Board of Regents. The cornerstone of the Merrick Building, which was to house classrooms and administrative offices, was laid on February 4, 1926, on land donated by George E. Merrick, founder of Coral Gables. Merrick also donated $5 million to be matched by other sources. When Merrick’s donation could not be matched, the work that had begun on the Merrick Building ceased and a decision was made to convert the partially constructed Anastasia Hotel into temporary quarters for the University. In the rush to finish the Anastasia Building before the announced opening of the University in October, cardboard-covered partitions were used to separate rooms, leading to the name “Cardboard College.” Construction of the Merrick Building would not resume until 1949, 23 years after it started. In September, just before the first classes were to begin, the monster hurricane of 1926 swept through South Florida, causing destruction that left the University further in debt. In spite of tremendous adversity, the University managed to open its doors on October 15, 1926, offering programs in the liberal arts and music to 560 students. The School of Law was added in 1928 and the Schools of Business and Education were created in 1929. The Florida depression that followed the collapse of the real estate market and the national depression that started in 1929 added further financial burdens that brought the survival of the University into question. President Ashe had to resort to borrowing on his personal insurance policy to pay faculty salaries. Still in debt, the University filed a petition for bankruptcy in 1932. Determined to keep the University going, President Ashe and others formed a new corporation, The University of Miami, Inc., and in 1934, at an auction, bought back the University’s property for $15,758.84. The 1940s were a time of great change at the University. During World War II, President Ashe arranged to have university facilities available for training U.S. Army and British Royal Air Force personnel. In addition, the war gave the University reason to expand its facilities. The Graduate School was created in 1941 and the Marine Laboratory was formally established in 1943. In 1947, shortly after the war ended, the School of Engineering was founded, and the University began the excavation of Lake Osceola. Growth continued at the University in the 1950s. The School of Medicine, the first to be accredited in the state of Florida, was founded in March of 1952. After President Ashe fell ill and subsequently died in December of 1952, Jay F. W. Pearson was named the second president of UM in January of 1953. President Pearson served in that capacity until 1962. During his tenure, the first computer on the UM campus was installed in the Engineering Building and the Board of Trustees removed all racial barriers from admission policies. Henry King Stanford became the University’s third president on April 18, 1962. The Department of Nursing, which originated as a department in the College of Arts and Sciences, became the School of
iv
Nursing in 1968. Also in 1968, with a gift from The Rosenstiel Foundation, the University obtained a deed for 9.7 acres of land on Virginia Key. Shortly after these events, in 1969 the Institute of Marine Science (formerly the Marine Laboratory) became a school and several months later was renamed the Rosenstiel School of Marine and Atmospheric Science. Although continuing education classes had been offered since 1926, the University formally founded the School of Continuing Studies in 1974. Edward T. Foote II was inaugurated as the University’s fourth president in 1981. Under his leadership, the University was selected to shelter a chapter of Phi Beta Kappa, the nation’s oldest and most prestigious honor society. Three additional schools were also founded in the eighties: Architecture (1983), the Graduate School of International Studies (1983), and the School of Communication (1985). In 1997, the Graduate School of International Studies was reorganized to offer undergraduate degree programs and was renamed the School of International Studies. President Foote also led a capital campaign that raised over $500 million, at the time the third largest campaign in American higher education.
Donna E. Shalala became the University’s fifth president in 2001. At the time of her inauguration, the University celebrated its 75th anniversary. In 2002, the School of International Studies was disestablished and combined with the College of Arts and Sciences. The following year, the School of Continuing Studies was disestablished and its responsibilities were moved into the Division of Enrollments and Continuing Studies. In October 2003, the University announced Momentum, The Campaign for the University of Miami, a billion-dollar effort to accelerate progress, empower learning and discovery, and intensify our impact on people in our city, across the country, and around the world. In January 2006 the goal was increased to $1.25 billion, and by the close of the campaign raised $1.4 billion. In 2007, the University purchased Cedars Medical Center, a 560-bed facility located in the Miami Health District just across from the Miller School of Medicine. The facility is now known as the University of Miami Hospital. In 2012, the University announced the launch of Momentum2: The Breakthrough Campaign for the University of Miami, which will raise a towering $1.6 billion by the year 2016, transforming the face of a the University yet again with new buildings and labs, scholarships for students who might not otherwise be able to attend college, and a brand-new group of talented and ambitious researchers and scholars with the knowledge to not only study global problems, but also solve them. Overview: The University is a private not-for-profit institution and has been classified by the Carnegie Commission as a Very High Research University. The University’s 11 colleges and schools offer the following areas of study: 110 undergraduate, 103 master’s, and 62 doctoral (58 research/scholarship and 4 professional practice). Campuses: Five UM campuses incorporate 196 University-owned buildings totaling 11.0 million gross square feet on over 500 acres of land. Coral Gables: The Main campus, located on 239-acres in suburban Coral Gables, houses two colleges and seven schools with 122 buildings totaling 5.4 million gross square feet. Several new facilities have opened on the Coral Gables campus – most recently the Student Activities Center, the Schwartz Center for Athletic Excellence, and the Cox Science Annex. Future projects include a new addition to the Foster Music Building at the Frost School of Music. Several other new facilities are in the early planning stages for other colleges and schools.
Medical Campus: The Leonard M. Miller School of Medicine campus consists of approximately 72-acres of owned and leased land within the 153-acre University of Miami/Jackson Memorial Medical Center complex. The medical center includes three University-owned hospitals that make up UHealth - University of Miami Health System: University of Miami Hospital, Sylvester Comprehensive Cancer Center/UMHC (University of Miami Hospital & Clinics), and Bascom Palmer Eye Institute. Bascom Palmer was ranked the number one eye hospital in the country for the tenth year in a row in the 22nd annual survey of “America’s Best Hospitals” published in U.S. News & World Report in July 2012. Six

v
additional specialties were rated high-performing. Six pediatric specialties made the list of “America’s Best Children’s Hospitals.” Our primary affiliated hospitals on the medical campus include Jackson Memorial Hospital, Holtz Children’s Hospital and the Miami VA Healthcare System. Miller School of Medicine faculty conduct more than 2,000 research projects in basic science and clinical care in 1.7 million square feet of research facilities. The UM Life Science & Technology Park opened R+D Building One, a 252,000 square foot facility that is bringing together academia and industry for collaboration in bioscience research and innovation. Rosenstiel School Campus: The Rosenstiel School of Marine & Atmospheric Science is one of the leading oceanographic research and education institutions in the nation. Located on an 18-acre waterfront campus on Virginia Key in Biscayne Bay, the School’s main campus is part of a 65-acre marine research and education park that includes two U.S. Department of Commerce National Oceanic and Atmospheric Administration (NOAA) research laboratories and the MAST Academy, the Miami-Dade County magnet high school for marine science and technology. The Rosenstiel School operates CSTARS (Center for Southeastern Tropical Advanced Remote Sensing) located on Richmond Campus in south Miami-Dade County, which conducts research with remotely sensed data received from earth-orbiting satellite systems. The School also oversees a subtropical island field station on a private 63-acre plot in Broad Key, Florida, and the operation of an archeological field research and education facility on 112 acres at Little Salt Springs, located in North Port, Florida. A new 86,000 SF Marine Technology and Life Sciences Seawater Building is under construction at the campus. This facility includes a 78,000 SF Marine Life Science Center and an 8,000 SF wind-wave storm surge facility (SUSTAIN). It will house office and laboratory spaces. South Campus: The south campus, located ten miles southwest of Coral Gables, opened in 1986 on a 106-acre site. Its five buildings provide 60,831 gross square feet for the purpose of conducting research and development projects. In 1997 an additional 30 acres were acquired, bringing the total area of the south campus to 136 acres.
Richmond Campus: The Richmond campus, established in 2001, is a 76-acre site near south campus. Research facilities for the Rosenstiel School's Center for Southeastern Tropical Advanced Remote Sensing (CSTARS) and Richmond Satellite Operations Center (RSOC) are located on a portion of the new campus. Presidents: Bowman Foster Ashe (1926-1952) Jay F.W. Pearson (1953-1962) Henry King Stanford (1962-1981) Edward T. Foote II (1981-2001) Donna E. Shalala (2001- ) Accreditation: Institutional membership is maintained with the Commission on Colleges of the Southern Association of Colleges and Schools. In addition, the University of Miami holds accreditation from 21 other professional agencies that recognize specific programs: Accreditation Commission for Midwifery Education
Accreditation Council for Graduate Medical Education American Alliance of Museums American Bar Association
American Medical Association Council and the Association of American Medical Colleges, Liaison Committee on Medical Education American Music Therapy Association
American Psychological Association
vi
Association to Advance Collegiate Schools of Business – International Association for Management Education and Accounting
Commission on Accreditation of Athletic Training Education Commission on Accreditation of Healthcare Management Education Commission on Accreditation of Medical Physics Education Programs, Inc. Commission on Accreditation in Physical Therapist Education
Commission on Collegiate Nursing Education Commission on Dental Accreditation
Commission on English Language Program Accreditation Council on Accreditation of Nurse Anesthesia Educational Programs
Council on Education for Public Health Engineering Accreditation Commission of the Accreditation Board for Engineering and
Technology Florida Department of Education
National Architectural Accrediting Board, Inc. National Association of Schools of Music Faculty and Academic Life: Of the full-time regular faculty, 97 percent hold a doctorate or other terminal degree, and 91 percent of all full-time faculty have a terminal degree. Of the full-time tenure-track faculty who are eligible for tenure, 79 percent are tenured. The student-to-faculty ratio is approximately 11 to 1. Over 50 percent of classes for degree undergraduates have 16 or fewer students; over 75 percent have 27 or fewer students. Freshman Dual Honors Programs: UM offers dual-degree honors programs, combining undergraduate and graduate study in exercise physiology, Latin American studies, law, marine geology, medicine, and biochemistry & molecular biology. For more information on these programs please visit our website at: www.miami.edu/dualdegree New Freshman Standings: Over half of new freshmen graduated in the top 5% of their high school class, while over 70% graduated in the top 10% of their high school class. Mean SAT was 1325. Honors Program and Honors Societies: Over 1,430 students participate in the Honors Program. The following 52 academic honor societies have chapters at the University: Alpha Epsilon Delta (Pre-Med) Omicron Delta Kappa (General scholarship/
Leadership) Alpha Epsilon Lambda (General Scholarship) Order of Omega (Leadership) Alpha Epsilon Rho (Broadcasting) Order of the Coif (Law) Alpha Eta Mu Beta (Biomedical Engineering) Phi Alpha Delta (Pre-Legal) Alpha Kappa Delta (Sociology) Phi Alpha Theta (History) Alpha Lambda Delta (Freshman General Scholarship)
Phi Beta Kappa (General Scholarship)
Alpha Omega Alpha (Medicine) Phi Kappa Phi (General Scholarship) Alpha Phi Sigma (Criminology) Phi Lambda Pi (General Scholarship) Alpha Pi Mu (Industrial Engineering) Phi Sigma Tau (Philosophy) Alpha Rho Chi (Architecture) Pi Delta Phi (French) Beta Alpha Psi (Accounting) Pi Kappa Lambda (Music and Music Education)

vii
Beta Beta Beta (Biology) Pi Sigma Alpha (Political Science) Beta Gama Sigma (Business) Pi Tau Sigma (Mechanical Engineering) Chi Epsilon (Civil Engineering) Psi Chi (Psychology) Chi Epsilon Pi (Meteorology) Rho Lambda (Leadership) Eta Kappa Nu (Electrical/Computer Engineering) Rho Rho Rho (Marine Science) Eta Sigma Phi (Classics) Sigma Alpha Iota (Music) Gamma Sigma Alpha (Academic - Greek) Sigma Delta Pi (Spanish) Golden Key National Honor Society (General Scholarship)
Sigma Gamma Epsilon (Geological Sciences)
Honors Students' Association (General Scholarship)
Sigma Tau Delta (International English)
Iota Tau Alpha (Athletic Training) Sigma Theta Tau (Nursing) Iron Arrow (General Scholarship/Leadership) Tau Beta Pi (Engineering ) Kappa Tau Alpha (Communication) Tau Beta Sigma (Music) Mortar Board (General Scholarship/Leadership) Tau Sigma Delta (Architecture) National Society of Collegiate Scholars (General Scholarship)
Theta Alpha Kappa (Religious Studies)
Omicron Delta Epsilon (Economics) Phi Beta Delta (International Scholarship) Greek Fraternities and Sororities: More than 1700 degree undergraduate students are members of the Greek Life community, including upper-class new members. Because the University defers membership in a sorority or fraternity for first-year students until after the student has earned at least 12 hours of academic credit, first-year students are not included in this count. The following 32 fraternities and sororities have chapters at the University: Fraternities: Sororities:
Alpha Epsilon Pi Alpha Delta Pi Alpha Phi Alpha Alpha Kappa Alpha
Beta Theta Pi Chi Omega Delta Epsilon Psi Delta Delta Delta Delta Lambda Phi Delta Gamma Kappa Alpha Psi Delta Phi Epsilon Kappa Sigma Delta Phi Omega Lambda Chi Alpha Delta Sigma Theta
Lambda Theta Phi Kappa Kappa Gamma Omega Psi Phi Lambda Theta Alpha Phi Delta Theta Sigma Delta Tau Pi Kappa Phi Sigma Gamma Rho Sigma Alpha Epsilon Sigma Lambda Gamma Sigma Alpha Mu Zeta Tau Alpha
Sigma Chi Sigma Lambda Beta Sigma Phi Epsilon Zeta Beta Tau
Study Abroad: UM semesters on location in Prague, Rome, the Galapagos, Cusco, Cape Town, and Manipal, India; exchange-partner universities in over 33 countries; and UM faculty-led programs during intersession, spring break, and summer.
viii
Post Baccalaureate Plans:
34% of May 2013 graduating seniors reported plans to attend graduate school this fall.
Alumni: UM alumni live in all 50 states and in 154 foreign countries; over 89,900 reside in Florida, including over 49,600 in Miami-Dade County. There are just over 184,000 alumni in UM’s history. Sports: The Hurricanes compete in Division I of the National Collegiate Athletic Association with seven men’s and 10 women’s sports. In 2004 UM became a member of the Atlantic Coast Conference (ACC) after having previously been a member of the Big East Conference.
Men’s competition includes baseball (1982, 1985, 1999, 2001 NCAA champions), basketball (NCAA appearances in 1998-1999, 2000, 2008, 2013; Sweet 16 in 2002, 2008, 2013), cross country, football (1983, 1987, 1989, 1991, 2001 national champions), tennis (1943-1945, 1987 NCAA singles champions; 1945 and 1970 NCAA doubles champions; 26 NCAA appearances since 1977 including Sweet 16 in 2009), indoor track and field (1998 NCAA individual champion; 2006 ACC individual champion), and outdoor track and field (1996 NCAA individual champion; 2006 ACC individual champions). Women’s competition includes basketball (14 postseason appearances), cross country, golf (1970, 1972, 1977-1978, 1984 national team champions; 1959, 1965, 1972, 1983 national individual champions), rowing, soccer (NCAA appearances in 2007-2008, 2011-2012), swimming and diving (1975 and 1976 national team champions; 1974-1978, 1989, 1999-2000, 2008 and 2011 national individual champions; 2005-2006 and 2012 ACC individual champions), tennis (1977, 1986 national doubles champions; NCAA Elite 8 in 2004, 2007, 2009-2013; NCAA individual singles runner-up in 2006 and 2009; 2007 individual singles champion), indoor track and field (1992, 1995, 2005, 2007-2009 NCAA individual champions; 2005 and 2006 ACC Champions, and third at 2005 NCAA Championship), outdoor track and field (1993-1995, 1999, and 2004-2006 NCAA individual champions; 2005 and 2006 ACC Champions and 7th at 2006 NCAA Meet), and volleyball (2002 NCAA Sweet 16, 2009-2010 and 2012 NCAA tournament). Computing Facilities: The University of Miami (UM) computing facilities host enterprise and departmental systems in support of academic, clinical, and research initiatives, including email, web hosting, distributed file systems, wireless and remote Internet access, and high-performance computing systems. There are over 60 computer labs located in the residential colleges, libraries, schools, and colleges. The University provides pervasive indoor and outdoor coverage for faculty, students, and staff throughout the Coral Gables, Miller School (Medical), and Rosenstiel campuses for network access to University resources, Internet and Internet2 access. UM’s interactive online information source for personalized University-related information, myUM and CaneLink (student information system), includes course registration, grades, financial aid and billing, parking, dining, and more. UM’s network infrastructure supports over 45,000 devices connected to the wired network, and over 15,000 wireless devices (including guests) on a daily basis.
The Center for Computational Science has a High Performance Computing (HPC) core. The core has a university-wide mission to provide the University’s academic community with comprehensive HPC resources ranging from hardware infrastructure to expertise in designing and implementing HPC solutions. It has been in continuous operation for the past five years and currently supports 11,000 compute cores, 1,200+ users, over 220 TFlops of total computational power, and more than 3 Petabytes of disk storage. Its flagship system, Pegasus2, is in the top 20 academic systems in the US. Along with the 5,500 Intel Xeon Sandy Bridge cores, Pegasus2 also features 40 Xeon Phi coprocessor units making it one of the few heterogeneous Xeon Phi/Xeon Sandy Bridge systems successfully benchmarked in 2013.

ix
Pegasus2 was successfully benchmarked at 110 TFLops sustainable compute power, giving it an efficiency rating of close to 75%.
Along with our computational power CCS also supports a large scale “big data” infrastructure built as a four-tier solution: (1) high performance scratch for high throughput or large scale parallel processing; (2) mid-range performance utilized mainly for presentation and visualization; (3) lower performance disk for disk mirroring and TSM backup; and (4) low performance tape-based disaster recovery used for critical data with long retention times.
Development: In FY 13, contributions reached $180.7 million in total private cash, gifts, and grants; and in FY 12, UM ranked 39th among the research, doctoral, masters, liberal arts, and specialized private and public universities reporting to the Council for Aid to Education. Budget: The budget for 2013-14 is $2.7 billion, with $1.8 billion projected for the medical campus. At the end of the FY 13 the endowment for the University was $777.9 million. Degree Programs: Bachelor of Architecture (B.Arch.) Bachelor of Arts (A.B.) Bachelor of Arts in Marine Affairs (B.A.M.A.) Bachelor of Arts in Music (B.A.M.) Bachelor of Business Administration (B.B.A.) Bachelor of Fine Arts (B.F.A.) Bachelor of General Studies (B.G.S.) Bachelor of Liberal Arts (B.L.A.) Bachelor of Music (B.M.) Bachelor of Science (B.S.) Bachelor of Science in Aerospace Engineering (B.S.A.S.E.) Bachelor of Science in Architectural Engineering (B.S.A.E.) Bachelor of Science in Biomedical Engineering (B.S.B.E.) Bachelor of Science in Business Administration (B.S.B.A.) Bachelor of Science in Civil Engineering (B.S.C.E.) Bachelor of Science in Communication (B.S.C.) Bachelor of Science in Computer Engineering (B.S.Cp.E.) Bachelor of Science in Education (B.S.Ed.) Bachelor of Science in Electrical Engineering (B.S.E.E.) Bachelor of Science in Engineering Science (B.S.E.S.) Bachelor of Science in Environmental Engineering (B.S.En.E.) Bachelor of Science in Health Science (B.S.H.S.)
Bachelor of Science in Industrial Engineering (B.S.I.E.) Bachelor of Science in Marine and Atmospheric Science (B.S.M.A.S.)
Bachelor of Science in Mechanical Engineering (B.S.M.E.) Bachelor of Science in Nursing (B.S.N.) Bachelor of Science in Public Health (B.S.P.H.) Artist Diploma (A.D.) Master of Accounting (M.A.C.C.)
Master of Architecture (M.Arch.) Master of Arts (M.A.)
x
Master of Arts in Liberal Studies (M.A.L.S.) Master of Business Administration (M.B.A.) Master of Fine Arts (M.F.A.) Master of Laws in Inter-American Law (LL.M.A.) Master of Laws in Comparative Law (LL.M.C.L.) Master of Laws in Estate Planning (LL.M.E.) Master of Laws in International Law (LL.M.I.) Master of Laws in Ocean and Coastal Law (LL.M.O.) Master of Laws in Real Property Development (LL.M.P.) Master of Laws in Taxation (LL.M.T.)
Master of Laws in Taxation of Cross-Border Investment Master of Music (M.M.) Master of Professional Science (M.P.S.) Master of Public Administration (M.P.A.) Master of Public Health (M.P.H.) Master of Real Estate Development & Urbanism (M.R.E.D.U.) Master of Science (M.S.) Master of Science in Architecture (M.S.A.) Master of Science in Architectural Engineering (M.S.A.E.) Master of Science in Biomedical Engineering (M.S.B.E.) Master of Science in Civil Engineering (M.S.C.E.) Master of Science in Education (M.S.Ed.) Master of Science in Electrical and Computer Engineering (M.S.E.C.E.) Master of Science in Industrial Engineering (M.S.I.E.) Master of Science in Mechanical Engineering (M.S.M.E.) Master of Science in Music Engineering Technology (M.S.M.E.T.) Master of Science in Nursing (M.S.N.) Master of Science in Public Health (M.S.P.H.) Master of Science in Taxation (M.S.Tax.) Master of Urban Design (M.U.D.)
Specialist in Education (Ed.S.)
Doctor of Education (E.D.D.)
Doctor of Medicine (M.D.) Doctor of Musical Arts (D.M.A.) Doctor of Philosophy (Ph.D.) Doctor of Philosophy/Doctor of Medicine (Ph.D./M.D.) Doctor of Physical Therapy (D.P.T.) Doctor of Nursing Practice (D.N.P.) Juris Doctor (J.D.) Schools and Colleges: School of Architecture: The School of Architecture, founded in 1983, offers accredited professional undergraduate and graduate degrees in architecture and several post-professional graduate degrees. Programs include the professional Bachelor of Architecture (B.Arch) and Master of Architecture (M.Arch), the post-professional Master of Science in Architecture (M.S.Arch), the Master of Urban Design (M.U.D), and the Master of Real Estate Development and Urbanism (M.R.E.D.U.), an interdisciplinary one-year graduate program that draws on the real-life experience of developers-in-residence and faculty support from the School of Business Administration and School of Law, as well as the School of Architecture. Six-year joint degree programs include the Bachelor of Science in Architectural Engineering and Master of Architecture (B.S.A.E./M.Arch) and the Bachelor of Architecture and Master of Business Administration (B.Arch/M.B.A.).

xi
Curriculum areas of focus include new urbanism, classical and traditional architecture; contemporary modernism; health and the built environment, with health care design studios and courses and a continuing research partnership with faculty in the Miller School of Medicine; tropical and subtropical coastal design, building on faculty experience in locations such as Santo Domingo, Mumbai, Cape Town, and Barranquilla.
The Design-Build Studio is an upper-level opportunity for students to collaboratively design and
build a small structure. The Center for Urban and Community Design (CUCD), the School’s outreach program, provides students with hands-on experience in community improvement nationally and internationally. More than half of enrolled students participate in study-abroad programs in Europe, Asia, the Caribbean basin, and Latin America. The School sponsors fall and spring semester programs in Rome, providing an intensive experience in design, theory, and history of architecture and travel within Italy.
Facilities at the School of Architecture include studio workspace for each student, an architecture
reference library linked to university-wide resources, the New Urbanism Archive, a computer laboratory, a digital fabrication laboratory, a model shop, and the Jorge M. Perez Architecture Center housing lecture and exhibit facilities.
College of Arts and Sciences: Founded at the University’s inception in 1926 and housed in 25 buildings located throughout the Coral Gables campus, the College of Arts and Sciences enrolls over 4,300 undergraduate and over 650 graduate students in 20 departments and ten interdisciplinary programs. Sixteen departments offer graduate degrees in the fine arts, natural sciences, humanities, and social sciences. Several of the majors available to undergraduates in the College are offered in partnership with other schools at the University, including economics, offered in cooperation with the School of Business, microbiology and biochemistry with the Miller School of Medicine, and legal studies with the School of Law. Incoming new freshmen who meet specific academic criteria may be granted simultaneous admission into the undergraduate degree program of the College of Arts and Sciences and into the graduate degree programs in medicine, law or Latin American studies. Among the almost 440 full-time faculty—who teach courses to all undergraduate students at the University—are award-winning teachers and research scholars, recognized nationally and internationally in their disciplines. The faculty of the College of Arts and Sciences include editors of prominent journals, fellows of numerous professional societies, prize-winning creative writers, and members of important government research review and advisory boards. The College also provides numerous community outreach activities, including student musical theatre and drama productions at the Jerry Herman Ring Theatre and Alvin Sherman Family Stage; student, faculty, and visiting artist exhibitions in the College of Arts and Sciences Gallery and the Project Space in the design district of downtown Miami; lectures and other educational programs sponsored by the Center for the Humanities; volunteer activities in the public schools, hospitals and community clinics for developmentally disabled children; technology workshops for Miami-Dade public school teachers sponsored by the Department of Modern Languages Laboratory; and a series of programs, hosted by several departments and funded by various federal agencies and private foundations, to enhance the diversity of students pursuing scientific careers through research opportunities for pre-college and undergraduate students; and career development opportunities for high-school and community-college faculty.
School of Business Administration: The School of Business Administration was founded in 1929
and is accredited by AACSB International (the Association to Advance Collegiate Schools of Business). The School offers degrees at the bachelor’s, master’s and doctoral levels, as well as non-degree executive education programs. In addition to the full-time master’s programs, the School offers several Executive M.B.A. (EMBA) programs, with classes held on weekends and/or evenings, as well as The Executive M.B.A. for the Americas program, which blends on-campus sessions with distance learning. Now in its 41st year, the EMBA program is offered both on the main campus in Coral Gables and off–campus in San Juan, Puerto Rico. The School reflects the richness of a culturally diverse international community and is dedicated to developing ideas and leaders that will meet the most pressing challenges facing global business and society in the 21st century. The School continues to build on its outstanding faculty, strengthen its global perspective, engage with the community, and capitalize on distinct areas of excellence to enhance its position as a premier school of business.

xii
School of Communication: The School of Communication (SoC), founded in 1985, prepares students to navigate the ever-changing information and entertainment arenas with creativity, skill, and social responsibility for success in a technological and global society. The School currently enrolls almost 1,100 undergraduates and almost 170 graduate students with a full-time faculty of 63 scholars and professionals. Major undergraduate programs of study in the School include electronic media, journalism, advertising, public relations, motion pictures, media management, and communication studies. Graduate programs of study at the master’s level include communication studies with specialties in health communication and intercultural communication; public relations; journalism; interactive media; and motion pictures. In addition, the SoC offers a doctoral program in communication focusing on research and action for positive change.
Its broad range of student facilities include a motion picture sound stage, HD television and radio studios, broadcast uplink and downlink capability, all digital post-production facilities, advanced multimedia labs, a news bureau, HD video conferencing facilities, an audio production lab, a state-of-the-art motion picture theater, a moving images archive with over 3,000 classic films and television programs, and a nationally recognized debate team.
Our students interact closely with faculty members who are Pulitzer Prize, Emmy, and Academy
Award winners who have worked for top television news networks, newspapers, web sites, ad agencies, public relations firms and magazines. The School’s dean, Gregory J. Shepherd, is a renowned communication theorist and author.
The School of Communication has career development resources and services that provide
excellent opportunities for students to secure professional internships while they are in school and professional positions when they graduate. School of Education and Human Development: The mission of the School of Education and Human Development (SOEHD) is to produce knowledge and to prepare the next generation of leaders, researchers, and agents of change and well-being in education and the community. SOEHD seeks to be a center of excellence in the study, promotion and integration of educational, psychological, and physical well-being in multicultural communities.
Founded in 1929, the SOEHD houses the departments of Educational and Psychological Studies, Kinesiology and Sport Sciences, and Teaching and Learning. The SOEHD also houses the Dunspaugh-Dalton Community and Educational Well-Being Research Center.
The Department of Educational and Psychological Studies (EPS) offers an undergraduate degree in human and social development. The Department also offers graduate degree programs in five areas: research, measurement, and evaluation; higher education; community and social change; community well-being and counseling psychology. The research, measurement, and evaluation program offers an M.S.Ed. and a Ph.D. degree. The community and social change program offers an M.S.Ed. The higher education program offers an M.S.Ed. and a doctoral degree in Higher Education Leadership (Ed.D.). The Community Well-Being program offers a Ph.D degree. The Department’s Ph.D. program in counseling psychology is accredited by the American Psychological Association (APA). The counseling master’s degree (M.S.Ed.) specialties lead to professional licensure in Mental Health Counseling and Marriage and Family Therapy in Florida; and the doctoral Counseling Psychology program leads to licensure as a psychologist. The Department also offers certificate programs in Latino Mental Health, Enrollment Management, and Student Life and Development.
The Department of Kinesiology and Sport Sciences (KIN) offers undergraduate majors in exercise physiology, athletic training, and sport administration. The undergraduate athletic training major is nationally accredited by the Commission on Accreditation of Athletic Training Education (CAATE). Undergraduate minors are offered in sports medicine, exercise physiology, and sport administration. Master’s degree programs are offered in exercise physiology, with a related track in strength and
xiii
conditioning/fitness entrepreneurship, and sport administration. The Department offers a certificate in women’s health and a Ph.D. program in exercise physiology.
The Department of Teaching and Learning (TAL) offers undergraduate majors in elementary education/special and secondary education (including English, social sciences, biology, chemistry and mathematics). The major in secondary education requires a second major in a teachable subject. The major in elementary and special education includes eligibility for endorsement in ESOL and Reading. All teacher preparation programs offered by TAL are approved by the Florida Department of Education for teacher certification in their respective fields. The Department also offers a minor in education that fulfills the state’s Professional Training Option for secondary teachers within an alternative certification track. Master’s and Educational Specialist degree programs are offered in Early Childhood Special Education and in Math, Science, and Technology Education; and an M.S.Ed. is offered in Education and Social Change. The Department’s research doctoral program offers specializations in Language and Literacy Learning in Multilingual Settings, Mathematics/Science Education, and Special Education.
The Dunspaugh-Dalton Community and Educational Well-Being Research Center (CEW) is committed to individual, interpersonal, institutional, and community well-being. The CEW promotes the educational, psychological, physical, and social determinants of well-being by training leaders in these areas and by building capacity in the community for risk prevention and transformational practices. The CEW, which maintains approximately 30 community partnerships and 10 institutional partnerships, provides research and methodological services, operates a CEW press, and provides training programs, lectures, and symposia relating to the mission of the SOEHD.
Structured professional internships, professional development schools, on-campus labs, and integrated field studies provide students in all majors with outstanding experiential learning opportunities. College of Engineering: Founded in 1947, the College of Engineering comprises five departments that offer degrees in aerospace, architectural, biomedical, civil, computer, electrical, environmental, industrial, and mechanical engineering as well as engineering science. The College of Engineering offers five-year B.S./M.S. degree programs for our undergraduates, as well as traditional master’s and doctoral degrees in a number of disciplines, with several specializations in each field of study. Consistent with the tradition of collaboration among the University of Miami schools and colleges, engineering students participate in a number of interdisciplinary programs, including partnerships between the biomedical engineering program and the School of Medicine (premedical concentration); the architectural engineering program and the School of Architecture; the audio engineering program and the School of Music; and the industrial engineering program and the School of Business Administration. Consisting of over 1050 undergraduate students and over 250 graduate students, the College boasts an impressively diverse student body, consisting of students from 45 different countries including 29% Hispanic and 7% Black. Females represent 28% of the students (compared to an 18% national average, according to the most recent statistics from the American Society for Engineering Education). Engineering students enjoy active participation in a number of honor societies and professional organizations including National Society of Black Engineers, Society of Women Engineers, and Society of Professional Hispanic Engineers, among others. The College also offers ViAComp, a Virtual Academic Computing platform that provides students free remote access to educational software programs anytime and anywhere they can open an Internet connection, including an iPhone.
The College of Engineering’s programs and activities are focused to achieve the following
educational and research objectives: Educational • Ensure Career Success Through Critical Thinking: Core Values; Learning-By-Doing;
Research, Discovery & Innovation; Life-Long Learning • Respond to Industry Needs: Goods Pre-Production; Services Co-Production; From Mass
Production to Mass Customization • Employ A Technology-Enhanced Learning Approach: Laptop Access to ViAComp (Cloud
Computing); CAD/CAM; Prototyping

xiv
• Underscore Continuing Education: Web-Based Courses and Curricula; Career-Long Learning Partnerships
Research • Healthcare and Technobiology: Technology As Applied to Biomedical Problems and Health
Service Systems; Bionics; Bio/Nanomaterials; Imaging • Informatics and Risk (Traditionally, Modeling & Analysis): Sensors; Data Mining; Evidence-
Based Decision Making; Risk Analysis; Bioinformatics; Financial Services • Sustainable Systems: Sustainable Construction; Green Environment; Fuel Cells; Renewable
Energy; Nuclear Energy; Clean Water (Net-Zero Project) The College is home to several research centers such as the Biomechanics Research Group,
Manufacturing Research Institute, Perry Ellis International Logistics Research Institute, and the Industrial Assessment Center. The College is also associated with other University of Miami entities, including Oceans and Human Health, Diabetes Research Institute, Juvenile Diabetes Research Foundation, Miami Project to Cure Paralysis, Biomedical Nanotechnology Institute, Stem Cell Institute, Bascom Palmer Eye Institute, Center for Aging, South Florida Veterans Affairs Foundation for Research and Education, Consortium for Advanced Research on Hydrocarbon Transport in the Environment, and the Life Science and Technology Park.
Our 90 faculty members include several National Science Foundation early career awardees and
three members of the prestigious U. S. National Academy of Engineering.
Frost School of Music: The Frost School of Music, founded in 1926, is one of the largest schools of its kind in a private institution and one of the most comprehensive in all of higher learning. With over 85 full-time and over 25 part-time faculty, an undergraduate student body of over 400 undergraduate students, and 240 graduate students, the School awards the Bachelor of Music degree with majors in 10 areas and the Bachelor of Science in Music Engineering. The Bachelor of Arts in music degree is a non-professional degree designed for talented musicians who wish to pursue a broad liberal arts education. The Artist Diploma is offered at the graduate level in three areas. The Master of Music is offered with majors in 18 areas. The Master of Arts is offered in the world’s first Arts Presenting & Live Entertainment Management Program. The Master of Science degree is offered in music engineering technology. The Doctor of Philosophy degree is offered in music education, and the Doctor of Musical Arts degree is offered in five areas. A joint degree program with the School of Law offers a Doctor of Jurisprudence and a Master of Music in Music Business and Entertainment Industries. We currently also offer the JD/MA joint degree in Law and Arts Presenting & Live Entertainment Management. The Frost School offers four undergraduate minors, including The Bruce Hornsby Creative American Music Program, a minor in songwriting. The Henry Mancini Institute is housed within the School, and offers intensive performing and learning experiences across a broad spectrum of musical genres including film, world, jazz and pop-inflected musical styles. The School’s facilities include the Maurice Gusman Concert Hall, The L. Austin Weeks Center for Recording and Performance, which contains the Victor E. Clarke Recital Hall and a state of the art recording studio (one of two professional quality studios in the School), the 28,000 square-foot Austin and Marta Weeks Music Library and Technology Center, containing six music technology labs, and an array of other rehearsal and teaching facilities. Many of the School’s faculty have gained international recognition in their respective fields. Several of the School’s premier performing ensembles have won national awards and engage in touring within and outside the United States. The School has exchange programs with the Sibelius Academy in Helsinki, Finland; Bucks New University in Buckinghamshire, England; the Western Australian Academy of Performing Arts at Edith Cowan University in Perth, Australia; and a five-week summer opera program in Salzburg, Austria. During the academic year the School presents more than 300 forums, student and faculty recitals, concerts, lectures, master classes, and guest artist performances.
As a major educational and cultural resource for South Florida, the Frost School maintains a substantive philosophical and proactive commitment to serving a variety of constituencies by way of its numerous outreach programs, including Festival Miami; Grammy in the Schools: Careers in Music; The Ress Family Hospital Performance Project; Honor Band and Honor Choir; Dance Preparatory; Music
xv
Preparatory, which includes Piano and String Academy; UM MusicTime; and summer music camps for children and students from 2 months to 19 years old. Frost MusicReach is an outreach program that pairs freshman music majors with at-risk seventh graders for four years of substantive and consistent mentoring. The School of Music has active student chapters of a number of professional music organizations.
Graduate School: The University of Miami offers a comprehensive range of student-centered graduate programs with a vibrant multicultural, multinational student body. The University first approved courses for graduate work in 1941. In the late 1950s the University initiated study to award the doctorate, and the first degrees at this level were approved in 1959. Currently, graduate student enrollment (excluding M.D. and law students) stands over 3450. The University and its over 160 master’s and doctoral programs are fully accredited by the Southern Association of Colleges and Schools, as well as by a number of other independent accrediting agencies. The faculty of the Graduate School currently consists of nearly 1,300 members within the University. The Graduate School sets all policies for graduate education and oversees the quality of graduate programs. Its operation is conducted by the Graduate Council and its standing Graduate Faculty Committees. The mission of the Graduate School is to lead the university in establishing a mission for graduate education. The Graduate School promotes scholarship and research to support individuals, departments, and programs in the pursuit of excellence. The Graduate School provides guidance to foster innovation, multidisciplinary/interdisciplinary activities while maintaining high ethical and academic standards in graduate studies. Law School: Founded in 1926, the University of Miami School of Law presently enrolls over 1,300 candidates for either J.D., LL.M. or dual degrees, and has over 19,000 alumni worldwide. The J.D. program enrolls over 1170 students from more than 126 colleges and universities throughout the United States. Of the entering J.D. students, 45 percent are women, 39 percent are members of minority groups, and 45 percent are from outside Florida. Close to 50 percent speak more than one language.
The School offers graduate programs in International Law (specializations in Inter-American Law, International Arbitration, International Law, and U.S. and Transnational Law for Foreign Lawyers), Ocean and Coastal Law, Taxation, Estate Planning, and Real Property Development, the latter offered online as well as on-campus. The graduate program in International Law and its four different specializations enroll over 45 foreign lawyers from nearly 20 nations. The School also offers several joint degree programs. It is the only law school to offer a J.D./Master’s in Music Business, in addition to J.D./M.B.A., J.D./M.P.S. in Marine Affairs, J.D./M.P.H. in Public Health, J.D./M.A. in Law and Communications, J.D./M.D., J.D./M.P.A. in Public Administration, J.D./LL.M. in Tax, International Law, Ocean and Coastal Law, or Real Property Development, and a J.D./M.B.A./LL.M. in Tax.
The School’s renowned faculty includes nearly 100 full-time professors and over 100
distinguished lawyers and judges who serve as adjunct professors. In addition to its extensive curriculum, the School offers numerous domestic and international externship programs and foreign exchange programs in Belgium, Brazil, China, France, Germany, Ireland, Israel, Spain, and Switzerland. The School’s award-winning clinics, currently ten focusing on different areas of the law, offer exceptional training grounds and give students practical, hands-on lawyering while also helping needy and under-represented individuals. The School is also home to Law Without Walls® (LWOW), an innovative academic model that brings together students, faculty, practitioners, and entrepreneurs from around the country and the world to explore innovation in legal education and practice. The Law Library is one of the country’s leading legal research libraries, with close to 630,000 volumes and volume equivalents. Taxation and estate planning, law of the sea and international economic law are among the special subject strengths represented in the collection. Foreign law collections focus on regions of Latin American and the Caribbean as well as the European Union.
The School is regularly ranked among the top law schools by Hispanic Business Magazine and
U.S. News and World Report for Tax Programs, and its alumni are regularly featured in Super Lawyers magazine. In 2013, nearly 1,500 Miami Law graduates were recognized as Super Lawyers and Rising Stars by Super Lawyers magazine, which rates lawyers in more than 70 practice areas. 902 Miami Law graduates were ranked as Super Lawyers and 571 were recognized as Rising Stars. The School is accredited by the

xvi
American Bar Association, is a member of the Association of American Law Schools, and has a chapter of the national law student honorary society, the Order of the Coif. Medical School: The University of Miami Leonard M. Miller School of Medicine has grown rapidly in both size and reputation, earning international acclaim for research, clinical care, and biomedical innovations. The school has more than 1,400 full-time clinical and basic science faculty members and an additional 1,460 professionals from the community serving as voluntary faculty in various departments. Along with the M.D. degree, the school offers two specialized B.S./M.D. programs, a combined M.D./Ph.D. program, an M.D./M.B.A. program, a 4-year M.D./M.P.H. program and 4-year M.D./M.S. in Genomic Medicine, a newly created M.D./J.D. program, graduate degrees in ten areas, postdoctoral programs, and continuing medical education courses. Located north of downtown Miami near the Civic Center in the Miami Health District, the school’s campus consists of approximately 72 acres of owned and leased land within the 153-acre University of Miami/Jackson Memorial Medical Center complex. Each year the University of Miami Health System’s more than 900 faculty physicians have more than one million scheduled patient encounters in primary care and 100 medical specialties and sub-specialties.
University of Miami Hospital is the flagship hospital of UHealth - University of Miami Health System and the only university-owned and operated teaching hospital in Florida. The University also owns two other hospitals: Sylvester Comprehensive Cancer Center/UMHC (University of Miami Hospital & Clinics) and Bascom Palmer Eye Institute. For the tenth year in a row, Bascom Palmer was named the number one eye hospital in the country by U.S. News & World Report in its annual “America’s Best Hospitals” issue. Six additional specialties were rated high-performing. Six pediatric specialties made the list of “America’s Best Children’s Hospitals.” In addition to the three University-owned hospitals, there are also three primary hospitals affiliated with UHealth: Jackson Memorial Hospital, the primary teaching hospital for the medical school; Holtz Children’s Hospital; and the Miami VA Healthcare System. There are also more than 30 outpatient clinics across Miami-Dade, Broward, Palm Beach, and Collier counties, including multi-disciplinary clinics at UHealth at Kendall and UHealth at Plantation.
The Miller School has been designated a Center for AIDS Research (CFAR), the only such center in Florida, and is leading the University’s prestigious Clinical and Translational Science Institute (CTSI), awarded by the NIH. Other clinical and research programs include the John P. Hussman Institute for Human Genomics, the Interdisciplinary Stem Cell Institute, the Dr. John T. Macdonald Foundation Biomedical Nanotechnology Institute, the Miami Transplant Institute, The Miami Project to Cure Paralysis, the Diabetes Research Institute, the Mailman Center for Child Development, and many more. Also located in the medical complex is the Louis Calder Memorial Library, the largest medical resource library in South Florida. Fully accredited by the Liaison Committee on Medical Education of the Association of American Medical Colleges, the Miller School of Medicine is committed to graduating first-rate physicians and leads the nation in establishing innovative curriculum and admissions policies. Among the many student activities that reflect the commitment to community service are the various health fairs put on by the Mitchell Wolfson, Sr., Department of Community Service (DOCS) Program. The students and volunteer physicians coordinate events in numerous medically underserved communities each year, in addition to coordinating two weekly volunteer clinics in Miami. School of Nursing and Health Studies: The University of Miami School of Nursing and Health Studies continue to raise the bar in global healthcare education. For over 65 years, the School has continually proven itself to be an innovator and this year is no exception. The school provides diverse educational opportunities for the next generation of health care professionals. The undergraduate curriculum includes degree tracks for a Bachelor of Science in Nursing, a Bachelor of Science in Health Science, a minor in Public Health or the Bachelor of Science in Public Health – the first fulltime undergraduate public health program in South Florida. In addition to the traditional BSN, we offer an

xvii
Accelerated BSN program for individuals who hold undergraduate degrees in fields other than nursing and an online RN-to-BSN program for Registered Nurses (RN). The School’s curriculum also includes graduate programs: : the Master of Science in Nursing (MSN) in adult-gerontology acute care nurse practitioner, adult-gerontology primary care nurse practitioner, family nurse practitioner, and nursing education tracks. At the doctoral level, the school offers the Doctor of Philosophy and the Doctor of Nursing Practice (DNP) program, the latter in either the post master’s track (offered executive style) or the new BSN-DNP, nurse anesthesia (CRNA) track, which is the first anesthesia doctoral degree for BSN-prepared nurses in the state of Florida.
The school has recently expanded its commitment toward international collaboration, offering students international exchange experiences in partnership with hospitals and universities in Taiwan, Spain, Chile, Mexico, Haiti, Australia, Brazil and the Dominican Republic. The School is also a -designated Pan American Health Organization /World Health Organization Nursing Collaborating Centre, one of just 11 in the United States. We also house the University of Miami Center of Excellence for Hispanic Health Disparities Research (El Centro), which advances the research and development of culturally tailored interventions for health conditions that disproportionally affect the minority population in South Florida.
The mission of the School of Nursing and Health Studies is to educate students and support faculty committed to excellence in nursing and health science. With state board passing rates well above the national average, our School’s graduates clearly demonstrate unsurpassed level of academic and clinical preparation.
The school is home to the International Academy for Clinical Simulation and Research, one of the nation’s first simulation centers designed exclusively for nursing and health science education, featuring state-of-the art classrooms and research facilities. With a seven-bed adult laboratory, a seven-bed pediatric laboratory, a micro-simulation computer laboratory, an operating room, and an intensive care unit, the center serves to strengthen students’ clinical and critical thinking skills before they interact with real patients. Simulation is fully integrated into the School’s curriculum, enabling our students to work on the most lifelike human simulators available before they ever touch a real patient. Our “patients” act just like the real ones – they can talk or make noises, have babies or have heart attacks, exhibit vital signs, and perform most human bodily functions. Our students give rave reviews to their simulation training as a teaching mechanism that allows them to learn and build confidence without putting patients at risk, to connect didactic learning to real-life situations, and to practice their professional communication skills with each other.
Due to the increasing number of enrolled students, the school has outgrown this facility and plans are currently underway to build one of the nation’s first education-based Simulation Hospitals. This 5-story, 39,000 square foot facility – a key priority of the University of Miami’s Momentum2 campaign -- will replicate the true flow of activity in a clinical practice and hospital and provide an educational setting for our students, taking “patient” (i.e., “simulator”) through all the facets of a real hospital -- from the Emergency Department to the operating room to patient rooms, to discharge. Our hospital will cover the life span of the patient (from newborn to geriatric stage), and will have human actors playing the friends and family of the “patients.” It will also include a palliative care unit and an apartment setting, allowing for hospice and home health scenarios, as well as incorporate a variety of interprofessional healthcare personnel, including nurses, physicians, and other health care professionals, who will work in teams to improve patient safety outcomes.. When our graduates enter the real world of nursing care, the environment will seem very familiar. The School invites all who believe in the transformative power of quality healthcare to partner with us to build our shared future.
The School’s extensive network of over 250 clinical partners provides nursing students with
opportunities for hands-on experience and mentorship at local hospitals, primary healthcare centers, community based organizations, health departments, and a range of social service agencies. Public health students participate in a field practicum designed to engage them in the study and practice of preventing disease and promoting wellness in local and global communities. The richness and diversity of the school’s practice settings contribute to unique learning experiences for our students.
xviii
Rosenstiel School of Marine & Atmospheric Science: The Rosenstiel School of Marine &
Atmospheric Science is one of the leading oceanographic research and education institutions in the nation. Known originally as the University’s marine laboratory, it was founded in 1943. It evolved into the Institute for Marine Science in 1961, and eight years later became the Rosenstiel School of Marine & Atmospheric Science (RSMAS) within the University of Miami.
The Virginia Key campus has grown to include modern research and teaching facilities, a
dedicated academic library, and an internationally recognized Marine Invertebrate Museum. The newest addition is a sea-water complex consisting of two buildings: (1) A worldwide unique air-sea interaction system capable of simulating the impact of a hurricane Force 5 on waves and structures, and (2) a state-of-the-art life science building that will be host to our unique Aplaysia Culture Center as well as our marine biomedicine and coral reef programs. RSMAS also operates a state-of-the-art 96-foot catamaran research vessel, the F.G. Walton Smith, and pioneered the first-ever marine and atmospheric laboratory aboard a cruise ship, Royal Caribbean Cruise Lines’ Explorer of the Seas.
CSTARS (Center for Southeastern Tropical Advanced Remote Sensing), located on the Richmond
campus in south Miami-Dade county was launched in 2003, and conducts research with remotely sensed data received from earth-orbiting satellite systems. This state-of-the-art real-time reception and analysis facility provides data for environmental monitoring from 16 commercial satellites, available 24/7. The predictive power concentrated on this 78-acre campus is helping to provide vital, life-saving information regarding earthquakes, hurricanes, typhoons, freak waves and other natural and manmade disasters, including in the past two years monitoring of the earthquakes in Haiti and Chile, and the Deepwater Horizon oil spill.
In 2010, RSMAS was gifted Broad Key, a 63-acre island located on the reef about 30 miles south-
west of Virginia Key, which is being transformed into an Experimental Station for the school. That island, only accessible by boat and helicopter, can accommodate comfortably groups of 20-25 for overnight stays and offers scientists and students a very unique environment for research and teaching programs.
As the only subtropical institute of its kind in the continental United States, the RSMAS school’s
more than 100 faculty members, almost 300 graduate students, almost 400 undergraduate students and over 250 research and administrative support staff comprise a robust academic community. Through excellence in applied and basic marine and atmospheric research and linking these results to policy, RSMAS sheds light on today’s most pressing environmental issues. Scientists and students at RSMAS study a wide range of important topics, many of which relate to the environment and humanity’s growing impacts on the natural world. They are at the forefront of research on subjects such as ocean and atmospheric circulation and how they affect the movement of pollutants, climate change, fisheries, coral reefs, sea level rise, oceans and human health, marine policy, and the development of hurricanes and other severe weather events.
Through course work and research, RSMAS students obtain graduate degrees in applied marine
physics, marine affairs and policy, marine and atmospheric chemistry, marine biology and fisheries, marine geology and geophysics, and meteorology and physical oceanography. The division of marine affairs and policy at RSMAS and the University of Miami School of Law offer a joint degree in law and marine affairs. Upon completion of this program, a student earns a Juris Doctor degree from the School of Law and a Master of Arts degree in marine affairs and policy from RSMAS. The division of marine affairs and policy also offers an interdisciplinary Master of Science degree with an integrated track in science and policy, providing students with a strong science background the opportunity to build careers in marine resource management.
The Rosenstiel School offers undergraduate coursework in Marine Science, Meteorology, and
Marine Affairs programs. Students may study toward the following degrees: Bachelor of Arts (B.A.) degree in marine affairs and policy, Bachelor of Science (B.S.) degrees in marine science/biology, marine science/chemistry, marine science/geology, marine science/physics, and meteorology. There are two options leading to a B.S. in meteorology: a double-major in meteorology and applied mathematics or a meteorology major with a math minor and one additional minor selected from chemistry, physics, computer
xix
science, or biology. In addition to the traditional bachelor’s degree programs, students may also elect a five-year B.A./Master of Arts (M.A.) in marine affairs and policy and a five-year B.S./Master of Science (M.S.) in geological sciences/marine geology. Undergraduate students in these programs have opportunities to participate in research projects at RSMAS, working alongside world-class scientists in laboratories and in the field.
The Rosenstiel School launched a Masters of Professional Science in 2011 for students who seek
advanced academic training in career tracks relating to marine and atmospheric science. Designed for students who major in the sciences as undergraduates, this interdisciplinary curriculum is structured to allow students to expand applied scientific knowledge, as well as their professional skills. Degrees can be earned in as little as 12 months in one of several focus areas: aquaculture; broadcast meteorology; coastal management; computational meteorology and oceanography; fisheries management; marine mammal science; oceans and human health; tropical marine ecosystems; weather, climate and society; and weather forecasting.
The Leonard and Jayne Abess Center for Ecosystem Science and Policy builds upon the
University of Miami’s dynamic programs in marine biology, geography, epidemiology, urban planning, ecology, and environmental law, offering an innovative interdisciplinary curriculum for students to explore emerging environmental science and policy issues. Established in 2002, the Abess Center involves graduate and undergraduate students in problem-oriented learning, and affords them the opportunity for substantial field experience. In 2010, the Abess Center inaugurated the R.J. Dunlap Marine Conservation Program in collaboration with RSMAS, which focuses on advancing ocean research through hands-on field and virtual learning experiences for high school and university students, while fostering initiatives that bridge the critical gap between hard science and ecosystem policy.
Cutting-edge research and education at RSMAS is supported through grants from government
agencies and private organizations, as well as innovative partnerships and individual donations. Graduate students are an integral part of the research effort, and research programs, many of which are multidisciplinary in nature, provide a dynamic environment for collaboration among professors and students.
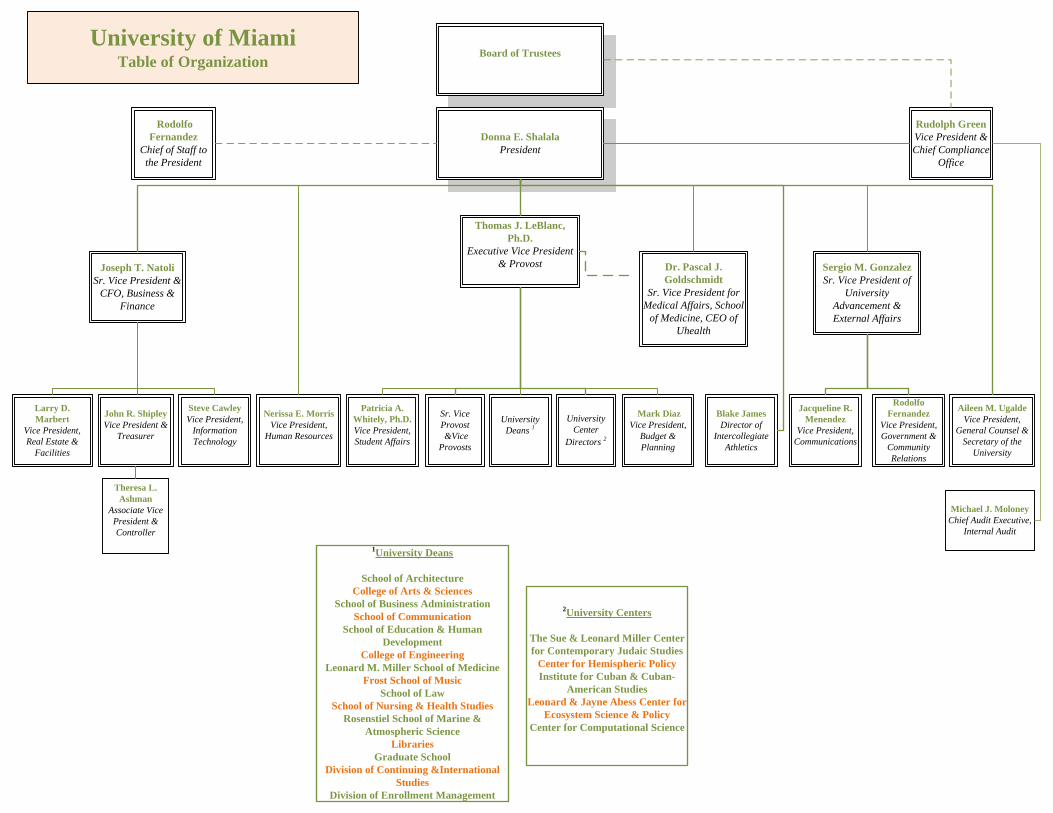
Board of TrusteesUniversity of Miami
Table of Organization
Rodolfo Fernandez
Chief of Staff to the President
Donna E. ShalalaPresident
Sergio M. GonzalezSr. Vice President of
University Advancement & External Affairs
Thomas J. LeBlanc, Ph.D.
Executive Vice President & ProvostJoseph T. Natoli
Sr. Vice President & CFO, Business &
Finance
Larry D. Marbert
Vice President, Real Estate &
Facilities
Nerissa E. MorrisVice President,
Human Resources
Rodolfo Fernandez
Vice President, Government &
Community Relations
Jacqueline R. Menendez
Vice President, Communications
Sr. Vice Provost&Vice
Provosts
Patricia A. Whitely, Ph.D.Vice President, Student Affairs
Theresa L. Ashman
Associate Vice President & Controller
Steve CawleyVice President,
Information Technology
John R. ShipleyVice President &
Treasurer
Dr. Pascal J. Goldschmidt
Sr. Vice President for Medical Affairs, School
of Medicine, CEO of Uhealth
University Deans 1
University Center
Directors 2
Aileen M. UgaldeVice President,
General Counsel & Secretary of the
University
Blake JamesDirector of
Intercollegiate Athletics
Michael J. MoloneyChief Audit Executive,
Internal Audit
1University Deans
School of ArchitectureCollege of Arts & Sciences
School of Business AdministrationSchool of Communication
School of Education & Human Development
College of EngineeringLeonard M. Miller School of Medicine
Frost School of MusicSchool of Law
School of Nursing & Health StudiesRosenstiel School of Marine &
Atmospheric ScienceLibraries
Graduate SchoolDivision of Continuing &International
StudiesDivision of Enrollment Management
2University Centers
The Sue & Leonard Miller Center for Contemporary Judaic Studies
Center for Hemispheric PolicyInstitute for Cuban & Cuban-
American StudiesLeonard & Jayne Abess Center for
Ecosystem Science & PolicyCenter for Computational Science
Mark DiazVice President,
Budget & Planning
Rudolph GreenVice President & Chief Compliance
Office


College/School Degree NDUG Total Graduate Total
Architecture 259 0 259 70 329Arts and Sciences 4,392 11 4,403 657 5,060Business 2,166 0 2,166 601 2,767Communication 1,087 0 1,087 169 1,256Education & Human Dev 540 0 540 332 872Engineering 1,082 0 1,082 258 1,340Frost School of Music 407 1 408 243 651Law 0 0 0 1,307 1,307Miller School of Medicine 0 0 0 1,328 1,328Nursing & Health Studies 534 0 534 243 777Rosenstiel School 392 0 392 295 687Cont Std/Grad Sch/Joint Pgms 185 324 509 52 561TOTAL 11,044 336 11,380 5,555 16,935
College/School Degree NDUG Total Gradute Total
Architecture 2% 0% 2% 1% 2%Arts and Sciences 40% 3% 39% 12% 30%Business 20% 0% 19% 11% 16%Communication 10% 0% 10% 3% 7%Education & Human Dev 5% 0% 5% 6% 5%Engineering 10% 0% 10% 5% 8%Frost School of Music 4% 0% 4% 4% 4%Law 0% 0% 0% 24% 8%Miller School of Medicine 0% 0% 0% 24% 8%Nursing & Health Studies 5% 0% 5% 4% 5%Rosenstiel School 4% 0% 3% 5% 4%Cont Std/Grad Sch/Joint Pgms 2% 96% 4% 1% 3%TOTAL 100% 100% 100% 100% 100%
Note: Graduate students include M.D., J.D., and other graduate students.Source: PeopleSoft
PERCENTAGE WITHIN LEVEL
UNDERGRADUATE
ALL STUDENTS BY LEVELFall Semester, 2013
UNDERGRADUATE
HEADCOUNTS
Fact Book 1 Fall 2013
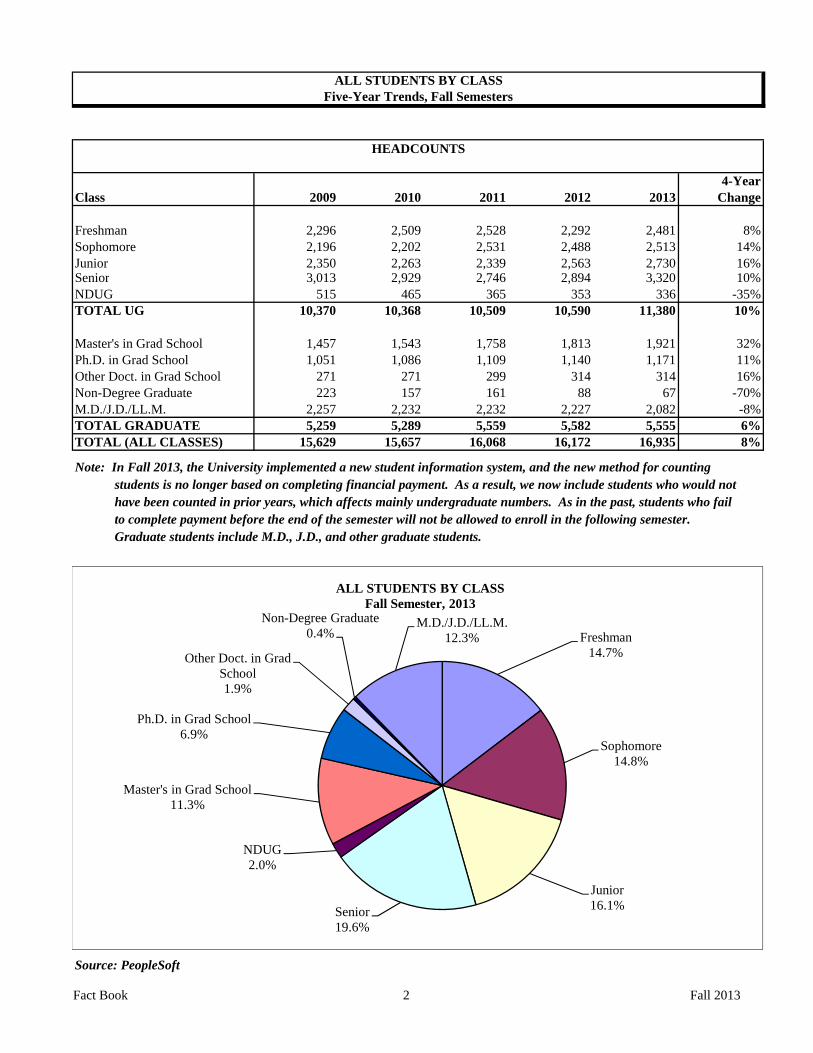
4-YearClass 2009 2010 2011 2012 2013 Change
Freshman 2,296 2,509 2,528 2,292 2,481 8%Sophomore 2,196 2,202 2,531 2,488 2,513 14%Junior 2,350 2,263 2,339 2,563 2,730 16%Senior 3,013 2,929 2,746 2,894 3,320 10%NDUG 515 465 365 353 336 -35%TOTAL UG 10,370 10,368 10,509 10,590 11,380 10%
Master's in Grad School 1,457 1,543 1,758 1,813 1,921 32%Ph.D. in Grad School 1,051 1,086 1,109 1,140 1,171 11%Other Doct. in Grad School 271 271 299 314 314 16%Non-Degree Graduate 223 157 161 88 67 -70%M.D./J.D./LL.M. 2,257 2,232 2,232 2,227 2,082 -8%TOTAL GRADUATE 5,259 5,289 5,559 5,582 5,555 6%TOTAL (ALL CLASSES) 15,629 15,657 16,068 16,172 16,935 8%
Note: In Fall 2013, the University implemented a new student information system, and the new method for counting students is no longer based on completing financial payment. As a result, we now include students who would not have been counted in prior years, which affects mainly undergraduate numbers. As in the past, students who fail to complete payment before the end of the semester will not be allowed to enroll in the following semester. Graduate students include M.D., J.D., and other graduate students.
Source: PeopleSoft
Five-Year Trends, Fall Semesters
HEADCOUNTS
ALL STUDENTS BY CLASS
Freshman14.7%
Sophomore14.8%
Junior16.1%Senior
19.6%
NDUG2.0%
Master's in Grad School11.3%
Ph.D. in Grad School6.9%
Other Doct. in Grad School1.9%
Non-Degree Graduate0.4%
M.D./J.D./LL.M.12.3%
ALL STUDENTS BY CLASSFall Semester, 2013
Fact Book 2 Fall 2013
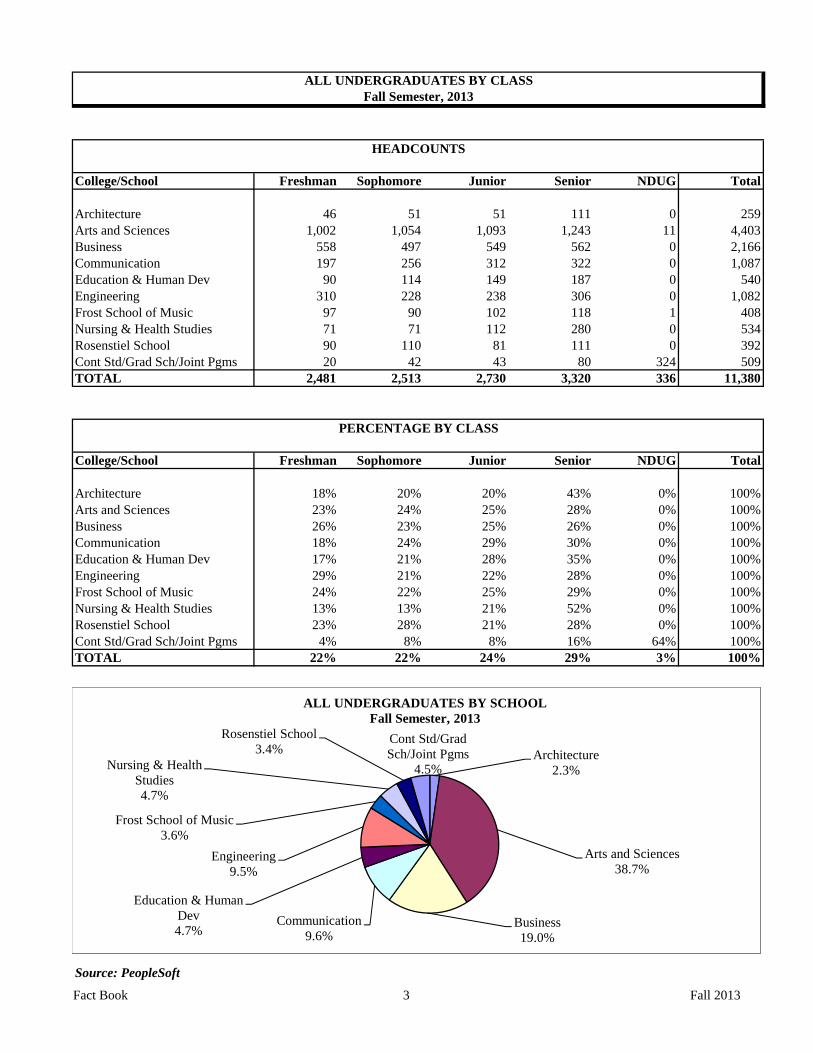
College/School Freshman Sophomore Junior Senior NDUG Total
Architecture 46 51 51 111 0 259Arts and Sciences 1,002 1,054 1,093 1,243 11 4,403Business 558 497 549 562 0 2,166Communication 197 256 312 322 0 1,087Education & Human Dev 90 114 149 187 0 540Engineering 310 228 238 306 0 1,082Frost School of Music 97 90 102 118 1 408Nursing & Health Studies 71 71 112 280 0 534Rosenstiel School 90 110 81 111 0 392Cont Std/Grad Sch/Joint Pgms 20 42 43 80 324 509TOTAL 2,481 2,513 2,730 3,320 336 11,380
College/School Freshman Sophomore Junior Senior NDUG Total
Architecture 18% 20% 20% 43% 0% 100%Arts and Sciences 23% 24% 25% 28% 0% 100%Business 26% 23% 25% 26% 0% 100%Communication 18% 24% 29% 30% 0% 100%Education & Human Dev 17% 21% 28% 35% 0% 100%Engineering 29% 21% 22% 28% 0% 100%Frost School of Music 24% 22% 25% 29% 0% 100%Nursing & Health Studies 13% 13% 21% 52% 0% 100%Rosenstiel School 23% 28% 21% 28% 0% 100%Cont Std/Grad Sch/Joint Pgms 4% 8% 8% 16% 64% 100%TOTAL 22% 22% 24% 29% 3% 100%
Source: PeopleSoft
ALL UNDERGRADUATES BY CLASSFall Semester, 2013
HEADCOUNTS
PERCENTAGE BY CLASS
Architecture2.3%
Arts and Sciences38.7%
Business19.0%
Communication9.6%
Education & Human Dev4.7%
Engineering9.5%
Frost School of Music3.6%
Nursing & Health Studies4.7%
Rosenstiel School3.4%
Cont Std/Grad Sch/Joint Pgms
4.5%
ALL UNDERGRADUATES BY SCHOOLFall Semester, 2013
Fact Book 3 Fall 2013

4-YearCollege/School 2009 2010 2011 2012 2013 Change
Architecture 287 279 239 255 259 -10%Arts and Sciences 3,912 4,028 4,130 4,025 4,392 12%Business 1,962 1,816 1,935 1,934 2,166 10%Communication 1,158 1,094 1,030 1,041 1,087 -6%Education & Human Dev 439 458 499 539 540 23%Engineering 790 841 914 930 1,082 37%Frost School of Music 417 398 403 422 407 -2%Nursing & Health Studies 433 475 427 526 534 23%Rosenstiel School 250 313 368 393 392 57%Cont Std/Grad Sch/Joint Pgms 207 201 199 172 185 -11%TOTAL 9,855 9,903 10,144 10,237 11,044 12%
College/School 2009 2010 2011 2012 2013
Architecture 3% 3% 2% 2% 2%Arts and Sciences 40% 41% 41% 39% 40%Business 20% 18% 19% 19% 20%Communication 12% 11% 10% 10% 10%Education & Human Dev 4% 5% 5% 5% 5%Engineering 8% 8% 9% 9% 10%Frost School of Music 4% 4% 4% 4% 4%Nursing & Health Studies 4% 5% 4% 5% 5%Rosenstiel School 3% 3% 4% 4% 4%Cont Std/Grad Sch/Joint Pgms 2% 2% 2% 2% 2%TOTAL 100% 100% 100% 100% 100%
Note: In Fall 2013, the University implemented a new student information system, and the new method for counting students is no longer based on completing financial payment. As a result, we now include students who would not have been counted in prior years, which affects mainly undergraduate numbers. As in the past, students who fail to complete payment before the end of the semester will not be allowed to enroll in the following semester.Source: PeopleSoft
HEADCOUNTS
PERCENTAGE BY SCHOOL
DEGREE UNDERGRADUATES BY SCHOOLFive-Year Trends, Fall Semesters
Fact Book 4 Fall 2013
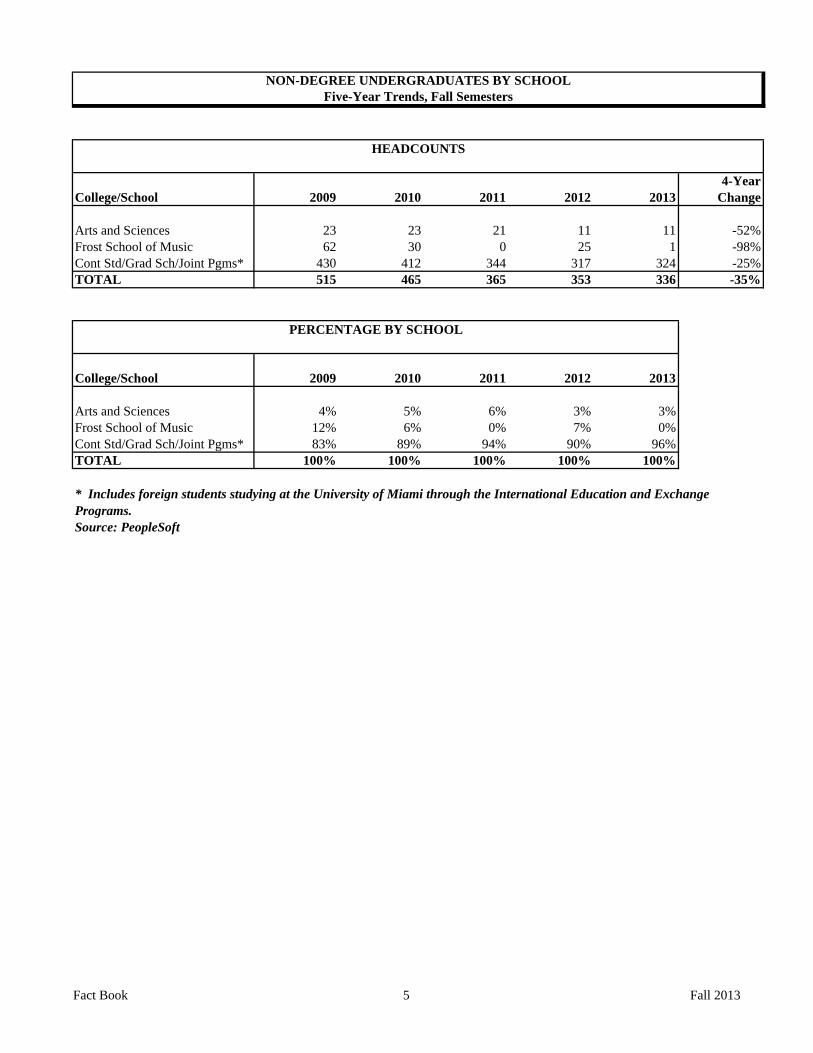
4-YearCollege/School 2009 2010 2011 2012 2013 Change
Arts and Sciences 23 23 21 11 11 -52%Frost School of Music 62 30 0 25 1 -98%Cont Std/Grad Sch/Joint Pgms* 430 412 344 317 324 -25%TOTAL 515 465 365 353 336 -35%
College/School 2009 2010 2011 2012 2013
Arts and Sciences 4% 5% 6% 3% 3%Frost School of Music 12% 6% 0% 7% 0%Cont Std/Grad Sch/Joint Pgms* 83% 89% 94% 90% 96%TOTAL 100% 100% 100% 100% 100%
Source: PeopleSoft
PERCENTAGE BY SCHOOL
HEADCOUNTS
* Includes foreign students studying at the University of Miami through the International Education and Exchange Programs.
NON-DEGREE UNDERGRADUATES BY SCHOOLFive-Year Trends, Fall Semesters
Fact Book 5 Fall 2013
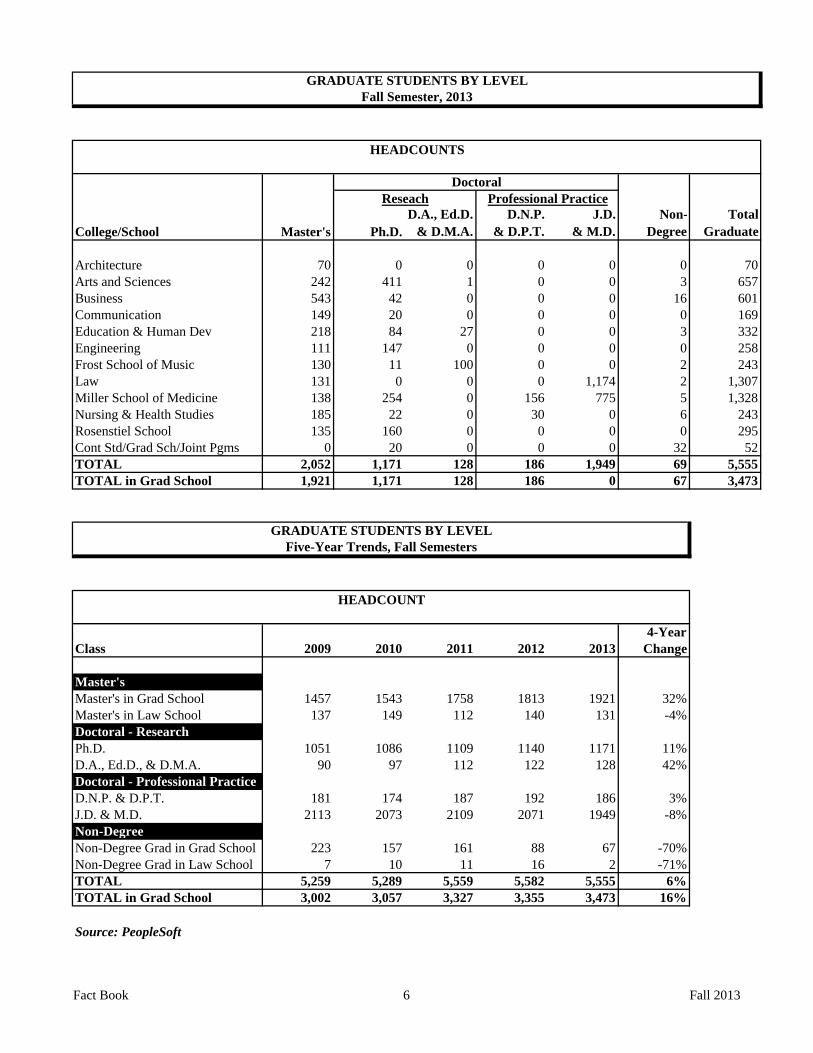
Doctoral
College/School Master's Ph.D.D.A., Ed.D.
& D.M.A.D.N.P.
& D.P.T.J.D.
& M.D.Non-
DegreeTotal
Graduate
Architecture 70 0 0 0 0 0 70Arts and Sciences 242 411 1 0 0 3 657Business 543 42 0 0 0 16 601Communication 149 20 0 0 0 0 169Education & Human Dev 218 84 27 0 0 3 332Engineering 111 147 0 0 0 0 258Frost School of Music 130 11 100 0 0 2 243Law 131 0 0 0 1,174 2 1,307Miller School of Medicine 138 254 0 156 775 5 1,328Nursing & Health Studies 185 22 0 30 0 6 243Rosenstiel School 135 160 0 0 0 0 295Cont Std/Grad Sch/Joint Pgms 0 20 0 0 0 32 52TOTAL 2,052 1,171 128 186 1,949 69 5,555TOTAL in Grad School 1,921 1,171 128 186 0 67 3,473
4-YearClass 2009 2010 2011 2012 2013 Change
Master'sMaster's in Grad School 1457 1543 1758 1813 1921 32%Master's in Law School 137 149 112 140 131 -4%Doctoral - ResearchPh.D. 1051 1086 1109 1140 1171 11%D.A., Ed.D., & D.M.A. 90 97 112 122 128 42%Doctoral - Professional PracticeD.N.P. & D.P.T. 181 174 187 192 186 3%J.D. & M.D. 2113 2073 2109 2071 1949 -8%Non-DegreeNon-Degree Grad in Grad School 223 157 161 88 67 -70%Non-Degree Grad in Law School 7 10 11 16 2 -71%TOTAL 5,259 5,289 5,559 5,582 5,555 6%TOTAL in Grad School 3,002 3,057 3,327 3,355 3,473 16%
Source: PeopleSoft
HEADCOUNT
Fall Semester, 2013
HEADCOUNTS
GRADUATE STUDENTS BY LEVEL
Reseach Professional Practice
GRADUATE STUDENTS BY LEVELFive-Year Trends, Fall Semesters
Fact Book 6 Fall 2013
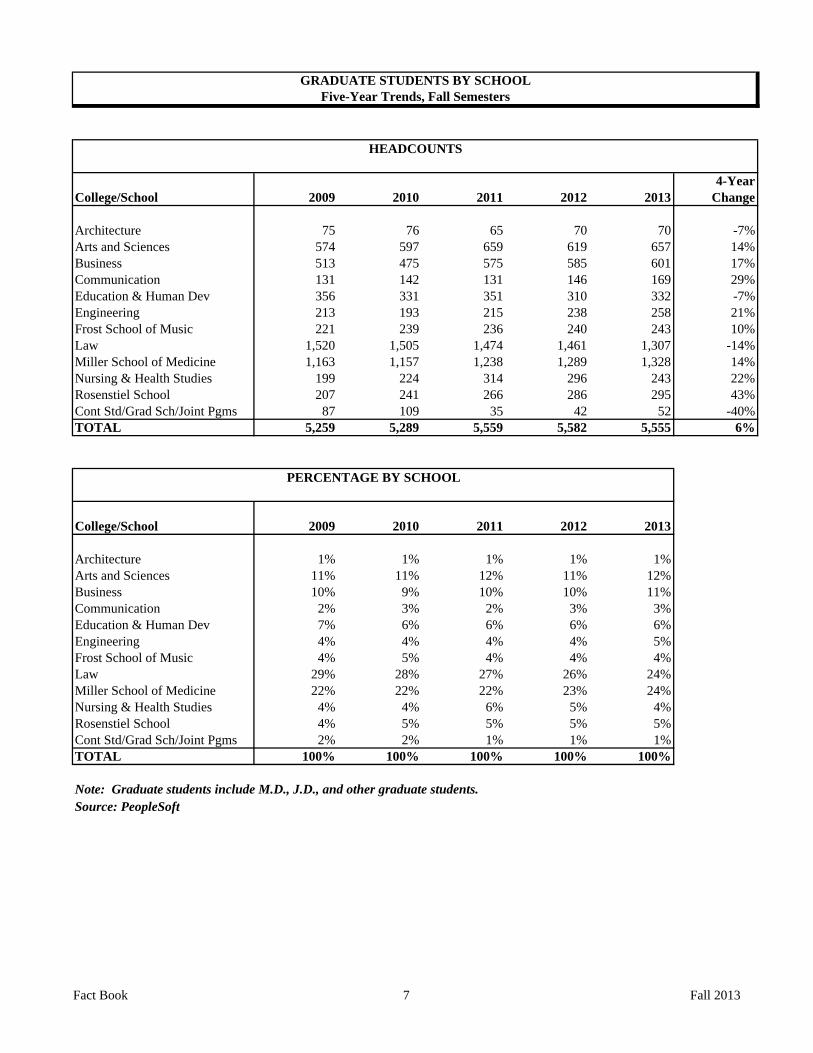
4-YearCollege/School 2009 2010 2011 2012 2013 Change
Architecture 75 76 65 70 70 -7%Arts and Sciences 574 597 659 619 657 14%Business 513 475 575 585 601 17%Communication 131 142 131 146 169 29%Education & Human Dev 356 331 351 310 332 -7%Engineering 213 193 215 238 258 21%Frost School of Music 221 239 236 240 243 10%Law 1,520 1,505 1,474 1,461 1,307 -14%Miller School of Medicine 1,163 1,157 1,238 1,289 1,328 14%Nursing & Health Studies 199 224 314 296 243 22%Rosenstiel School 207 241 266 286 295 43%Cont Std/Grad Sch/Joint Pgms 87 109 35 42 52 -40%TOTAL 5,259 5,289 5,559 5,582 5,555 6%
College/School 2009 2010 2011 2012 2013
Architecture 1% 1% 1% 1% 1%Arts and Sciences 11% 11% 12% 11% 12%Business 10% 9% 10% 10% 11%Communication 2% 3% 2% 3% 3%Education & Human Dev 7% 6% 6% 6% 6%Engineering 4% 4% 4% 4% 5%Frost School of Music 4% 5% 4% 4% 4%Law 29% 28% 27% 26% 24%Miller School of Medicine 22% 22% 22% 23% 24%Nursing & Health Studies 4% 4% 6% 5% 4%Rosenstiel School 4% 5% 5% 5% 5%Cont Std/Grad Sch/Joint Pgms 2% 2% 1% 1% 1%TOTAL 100% 100% 100% 100% 100%
Note: Graduate students include M.D., J.D., and other graduate students.Source: PeopleSoft
GRADUATE STUDENTS BY SCHOOLFive-Year Trends, Fall Semesters
HEADCOUNTS
PERCENTAGE BY SCHOOL
Fact Book 7 Fall 2013
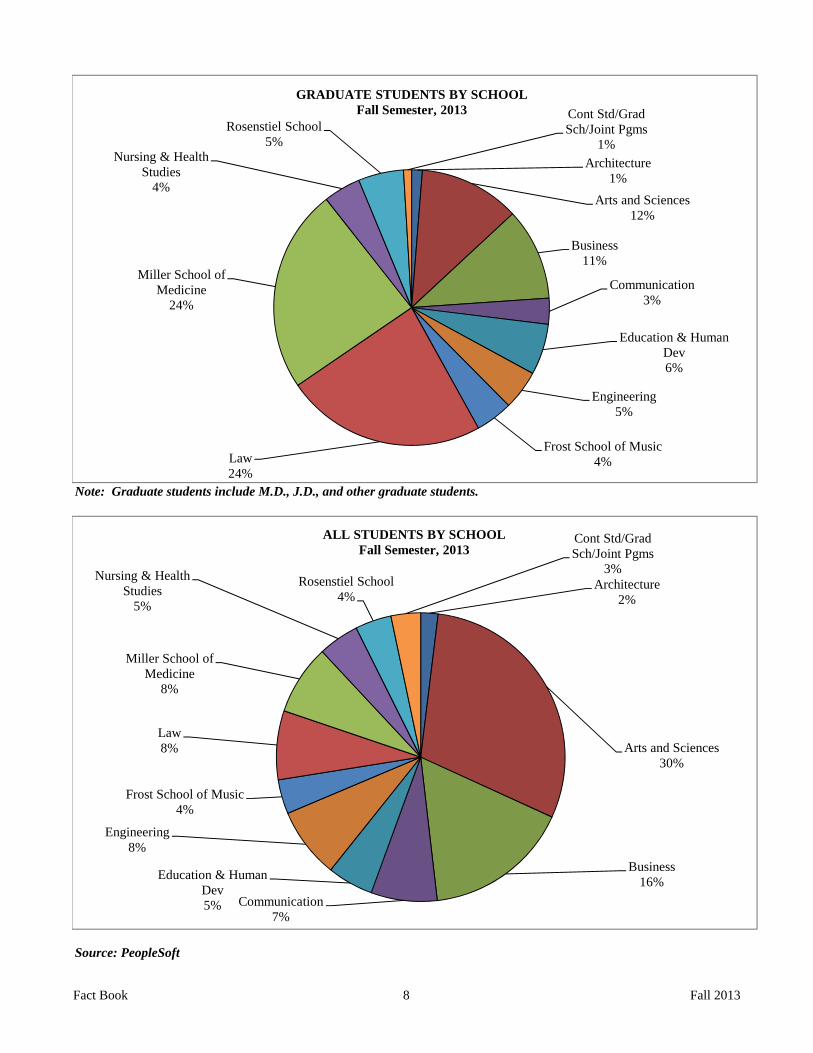
Note: Graduate students include M.D., J.D., and other graduate students.
Source: PeopleSoft
Architecture1%
Arts and Sciences12%
Business11%
Communication3%
Education & Human Dev6%
Engineering5%
Frost School of Music4%Law
24%
Miller School of Medicine
24%
Nursing & Health Studies
4%
Rosenstiel School5%
Cont Std/Grad Sch/Joint Pgms
1%
GRADUATE STUDENTS BY SCHOOLFall Semester, 2013
Architecture2%
Arts and Sciences30%
Business16%
Communication7%
Education & Human Dev5%
Engineering8%
Frost School of Music4%
Law8%
Miller School of Medicine
8%
Nursing & Health Studies
5%
Rosenstiel School4%
Cont Std/Grad Sch/Joint Pgms
3%
ALL STUDENTS BY SCHOOLFall Semester, 2013
Fact Book 8 Fall 2013

4-YearCollege/School 2009 2010 2011 2012 2013 Change
Architecture 362 355 304 325 329 -9%Arts and Sciences 4,509 4,648 4,810 4,655 5,060 12%Business 2,475 2,291 2,510 2,519 2,767 12%Communication 1,289 1,236 1,161 1,187 1,256 -3%Education & Human Dev 795 789 850 849 872 10%Engineering 1,003 1,034 1,129 1,168 1,340 34%Frost School of Music 700 667 639 687 651 -7%Law 1,520 1,505 1,474 1,461 1,307 -14%Miller School of Medicine 1,163 1,157 1,238 1,289 1,328 14%Nursing & Health Studies 632 699 741 822 777 23%Rosenstiel School 457 554 634 679 687 50%Cont Std/Grad Sch/Joint Pgms 724 722 578 531 561 -23%TOTAL 15,629 15,657 16,068 16,172 16,935 8%
College/School 2009 2010 2011 2012 2013
Architecture 2% 2% 2% 2% 2%Arts and Sciences 29% 30% 30% 29% 30%Business 16% 15% 16% 16% 16%Communication 8% 8% 7% 7% 7%Education & Human Dev 5% 5% 5% 5% 5%Engineering 6% 7% 7% 7% 8%Frost School of Music 4% 4% 4% 4% 4%Law 10% 10% 9% 9% 8%Miller School of Medicine 7% 7% 8% 8% 8%Nursing & Health Studies 4% 4% 5% 5% 5%Rosenstiel School 3% 4% 4% 4% 4%Cont Std/Grad Sch/Joint Pgms 5% 5% 4% 3% 3%TOTAL 100% 100% 100% 100% 100%
Note: In Fall 2013, the University implemented a new student information system, and the new method for counting students is no longer based on completing financial payment. As a result, we now include students who would not have been counted in prior years, which affects mainly undergraduate numbers. As in the past, students who fail to complete payment before the end of the semester will not be allowed to enroll in the following semester.Source: PeopleSoft
PERCENTAGE BY SCHOOL
ALL STUDENTS BY SCHOOLFive-Year Trends, Fall Semesters
HEADCOUNTS
Fact Book 9 Fall 2013

College/School Degree NDUG Total Graduate Total
Architecture 258.3 0.0 258.3 67.1 325.4Arts and Sciences 4301.5 4.6 4306.1 611.2 4917.3Business 2140.7 0.0 2140.7 582.3 2723.1Communication 1069.1 0.0 1069.1 157.6 1226.6Education & Human Dev 535.4 0.0 535.4 290.0 825.4Engineering 1071.6 0.0 1071.6 248.9 1320.5Frost School of Music 404.6 0.1 404.7 239.4 644.1Law 0.0 0.0 0.0 1268.4 1268.4Medicine-Clinical 0.0 0.0 0.0 772.5 772.5Medicine-Graduate 0.0 0.0 0.0 531.7 531.7Nursing & Health Studies 522.9 0.0 522.9 214.3 737.3Rosenstiel School 387.8 0.0 387.8 290.4 678.3Cont Std/Grad Sch/Joint Pgms 89.7 205.7 295.4 36.8 332.2TOTAL 10781.6 210.4 10992.0 5310.6 16302.6
Note: Students taking 700-level courses are considered full-time (FTE = 1.0). Totals may differ because of rounding.
4-YearClass 2009 2010 2011 2012 2013 Change
Freshman 2215.9 2472.5 2490.9 2265.8 2456.0 11%Sophomore 2153.2 2168.2 2492.1 2457.4 2471.8 15%Junior 2294.3 2214.8 2282.3 2519.0 2676.2 17%Senior 2884.1 2798.2 2621.6 2765.0 3177.6 10%NDUG 290.4 315.0 266.9 262.4 210.4 -28%TOTAL UG 9837.8 9968.7 10153.8 10269.7 10992.0 12%
Master's in Grad School 1320.0 1404.1 1605.8 1659.7 1762.2 34%Ph.D. in Grad School 1043.4 1075.7 1102.7 1131.6 1161.0 11%Other Doct. in Grad School 268.9 258.1 296.9 311.0 310.1 15%Non-Degree Grad 152.3 82.3 76.2 49.8 36.4 -76%M.D./J.D./LL.M. 2231.6 2202.2 2197.6 2191.5 2040.9 -9%TOTAL GRADUATE 5016.3 5022.4 5279.2 5343.5 5310.6 6%TOTAL (ALL CLASSES) 14854.1 14991.1 15432.9 15613.1 16302.6 10%
Note: In Fall 2013, the University implemented a new student information system, and the new method for counting students is no longer based on completing financial payment. As a result, we now include students who would not have been counted in prior years, which affects mainly undergraduate numbers. As in the past, students who fail to complete payment before the end of the semester will not be allowed to enroll in the following semester. Students taking 700-level courses are considered full-time (FTE = 1.0). Totals may differ because of rounding. Graduate students include M.D., J.D., and other graduate students.Source: PeopleSoft
FULL-TIME EQUIVALENCEFall Semester, 2013
FTE
UNDERGRADUATE
FULL-TIME EQUIVALENCE BY CLASSFive-Year Trends, Fall Semesters
FTE
Fact Book 10 Fall 2013

4-YearCollege/School 2009 2010 2011 2012 2013 Change
Architecture 285.5 277.5 238.3 254.0 258.3 -10%Arts and Sciences 3817.0 3954.4 4045.9 3949.2 4301.5 13%Business 1909.0 1793.4 1911.8 1913.8 2140.8 12%Communication 1147.0 1084.0 1020.3 1030.5 1069.1 -7%Education & Human Dev 432.4 448.6 494.8 531.7 535.4 24%Engineering 774.0 833.3 900.6 918.1 1071.6 38%Frost School of Music 413.9 395.9 400.3 418.0 404.6 -2%Nursing & Health Studies 426.0 461.5 415.5 518.0 522.9 23%Rosenstiel School 248.8 310.5 365.8 391.2 387.8 56%Cont Std/Grad Sch/Joint Pgms 93.8 94.5 93.6 82.8 89.7 -4%TOTAL 9547.4 9653.7 9886.8 10007.3 10781.6 13%
Note: In Fall 2013, the University implemented a new student information system, and the new method for counting students is no longer based on completing financial payment. As a result, we now include students who would not have been counted in prior years, which affects mainly undergraduate numbers. As in the past, students who fail to complete payment before the end of the semester will not be allowed to enroll in the following semester. Totals may differ because of rounding.Source: PeopleSoft
4-YearCollege/School 2009 2010 2011 2012 2013 Change
Arts and Sciences 15.9 16.3 15.8 8.3 4.6 -71%Frost School of Music 5.2 2.5 0.0 2.1 0.1 -98%Cont Std/Grad Sch/Joint Pgms 269.3 296.2 251.1 252.0 205.8 -24%TOTAL 290.4 315.0 266.9 262.4 210.4 -28%
Note: Totals may differ because of rounding.Source: PeopleSoft
Five-Year Trends, Fall Semesters
FULL-TIME EQUIVALENCE OF DEGREE UNDERGRADUATES BY SCHOOLFive-Year Trends, Fall Semesters
FTE
FULL-TIME EQUIVALENCE OF NON-DEGREE UNDERGRADUATES BY SCHOOL
FTE
Fact Book 11 Fall 2013
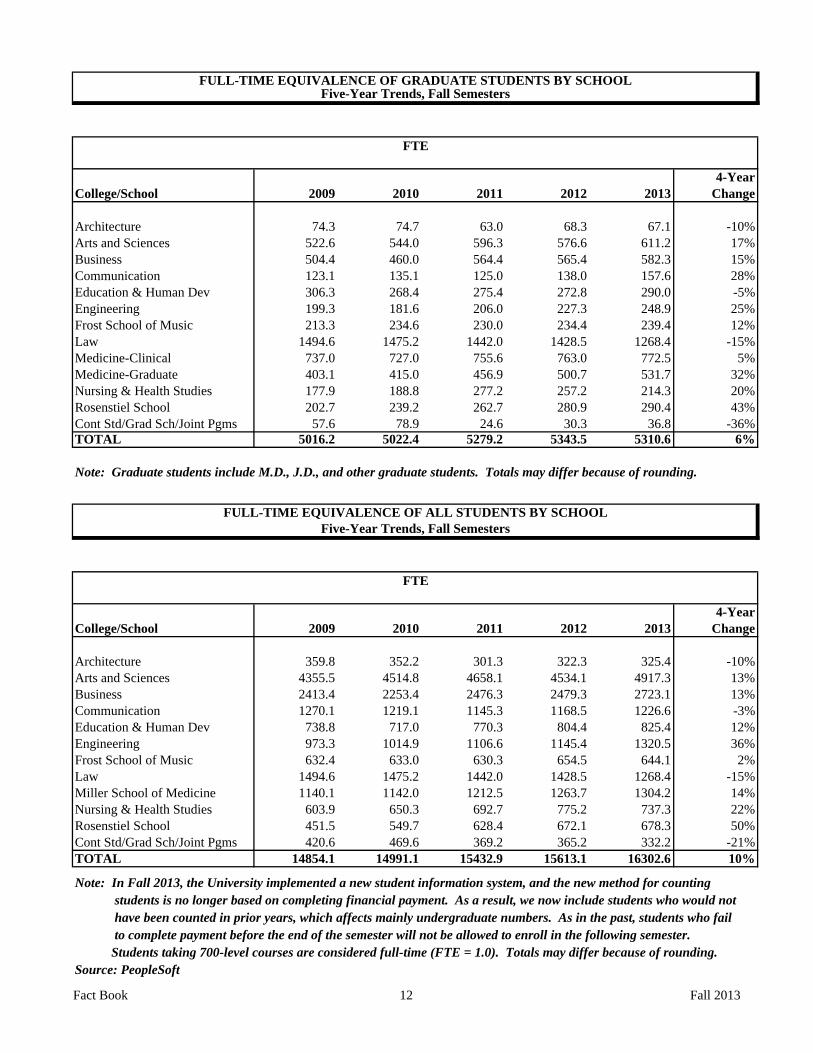
4-YearCollege/School 2009 2010 2011 2012 2013 Change
Architecture 74.3 74.7 63.0 68.3 67.1 -10%Arts and Sciences 522.6 544.0 596.3 576.6 611.2 17%Business 504.4 460.0 564.4 565.4 582.3 15%Communication 123.1 135.1 125.0 138.0 157.6 28%Education & Human Dev 306.3 268.4 275.4 272.8 290.0 -5%Engineering 199.3 181.6 206.0 227.3 248.9 25%Frost School of Music 213.3 234.6 230.0 234.4 239.4 12%Law 1494.6 1475.2 1442.0 1428.5 1268.4 -15%Medicine-Clinical 737.0 727.0 755.6 763.0 772.5 5%Medicine-Graduate 403.1 415.0 456.9 500.7 531.7 32%Nursing & Health Studies 177.9 188.8 277.2 257.2 214.3 20%Rosenstiel School 202.7 239.2 262.7 280.9 290.4 43%Cont Std/Grad Sch/Joint Pgms 57.6 78.9 24.6 30.3 36.8 -36%TOTAL 5016.2 5022.4 5279.2 5343.5 5310.6 6%
Note: Graduate students include M.D., J.D., and other graduate students. Totals may differ because of rounding.
4-YearCollege/School 2009 2010 2011 2012 2013 Change
Architecture 359.8 352.2 301.3 322.3 325.4 -10%Arts and Sciences 4355.5 4514.8 4658.1 4534.1 4917.3 13%Business 2413.4 2253.4 2476.3 2479.3 2723.1 13%Communication 1270.1 1219.1 1145.3 1168.5 1226.6 -3%Education & Human Dev 738.8 717.0 770.3 804.4 825.4 12%Engineering 973.3 1014.9 1106.6 1145.4 1320.5 36%Frost School of Music 632.4 633.0 630.3 654.5 644.1 2%Law 1494.6 1475.2 1442.0 1428.5 1268.4 -15%Miller School of Medicine 1140.1 1142.0 1212.5 1263.7 1304.2 14%Nursing & Health Studies 603.9 650.3 692.7 775.2 737.3 22%Rosenstiel School 451.5 549.7 628.4 672.1 678.3 50%Cont Std/Grad Sch/Joint Pgms 420.6 469.6 369.2 365.2 332.2 -21%TOTAL 14854.1 14991.1 15432.9 15613.1 16302.6 10%
Note: In Fall 2013, the University implemented a new student information system, and the new method for counting students is no longer based on completing financial payment. As a result, we now include students who would not have been counted in prior years, which affects mainly undergraduate numbers. As in the past, students who fail to complete payment before the end of the semester will not be allowed to enroll in the following semester. Students taking 700-level courses are considered full-time (FTE = 1.0). Totals may differ because of rounding.Source: PeopleSoft
Five-Year Trends, Fall Semesters
FTE
FULL-TIME EQUIVALENCE OF GRADUATE STUDENTS BY SCHOOLFive-Year Trends, Fall Semesters
FTE
FULL-TIME EQUIVALENCE OF ALL STUDENTS BY SCHOOL
Fact Book 12 Fall 2013
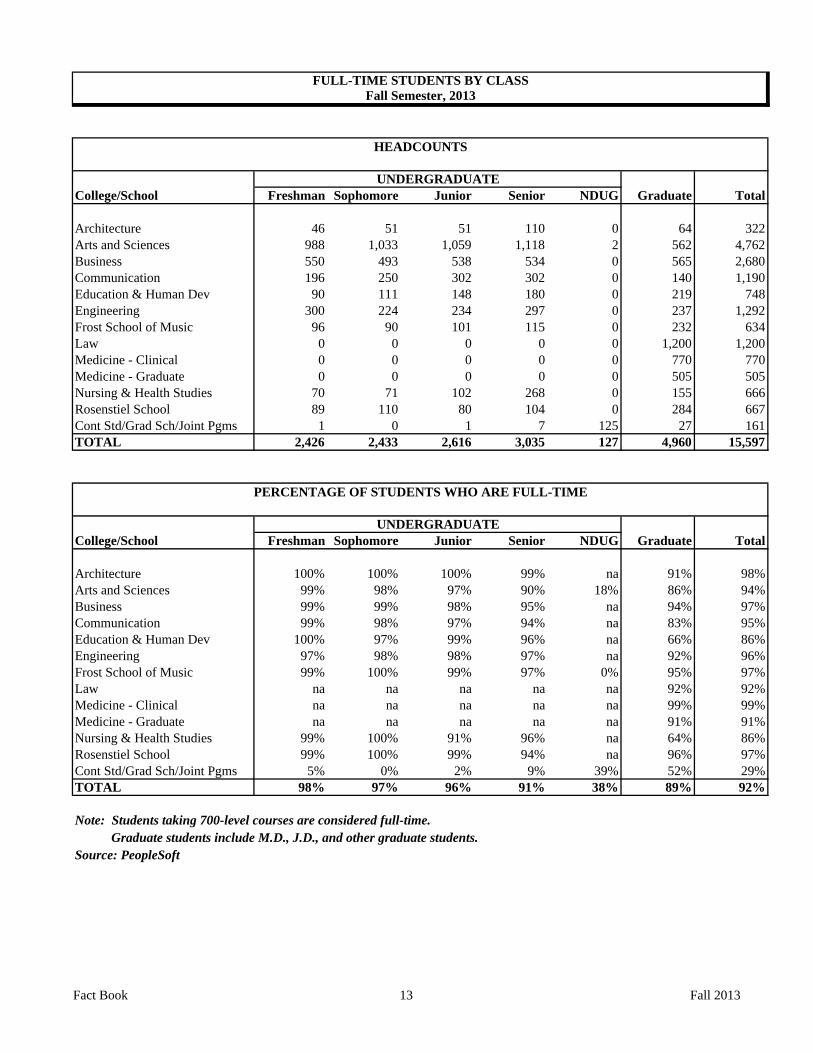
College/School Freshman Sophomore Junior Senior NDUG Graduate Total
Architecture 46 51 51 110 0 64 322Arts and Sciences 988 1,033 1,059 1,118 2 562 4,762Business 550 493 538 534 0 565 2,680Communication 196 250 302 302 0 140 1,190Education & Human Dev 90 111 148 180 0 219 748Engineering 300 224 234 297 0 237 1,292Frost School of Music 96 90 101 115 0 232 634Law 0 0 0 0 0 1,200 1,200Medicine - Clinical 0 0 0 0 0 770 770Medicine - Graduate 0 0 0 0 0 505 505Nursing & Health Studies 70 71 102 268 0 155 666Rosenstiel School 89 110 80 104 0 284 667Cont Std/Grad Sch/Joint Pgms 1 0 1 7 125 27 161TOTAL 2,426 2,433 2,616 3,035 127 4,960 15,597
College/School Freshman Sophomore Junior Senior NDUG Graduate Total
Architecture 100% 100% 100% 99% na 91% 98%Arts and Sciences 99% 98% 97% 90% 18% 86% 94%Business 99% 99% 98% 95% na 94% 97%Communication 99% 98% 97% 94% na 83% 95%Education & Human Dev 100% 97% 99% 96% na 66% 86%Engineering 97% 98% 98% 97% na 92% 96%Frost School of Music 99% 100% 99% 97% 0% 95% 97%Law na na na na na 92% 92%Medicine - Clinical na na na na na 99% 99%Medicine - Graduate na na na na na 91% 91%Nursing & Health Studies 99% 100% 91% 96% na 64% 86%Rosenstiel School 99% 100% 99% 94% na 96% 97%Cont Std/Grad Sch/Joint Pgms 5% 0% 2% 9% 39% 52% 29%TOTAL 98% 97% 96% 91% 38% 89% 92%
Note: Students taking 700-level courses are considered full-time. Graduate students include M.D., J.D., and other graduate students.Source: PeopleSoft
PERCENTAGE OF STUDENTS WHO ARE FULL-TIME
FULL-TIME STUDENTS BY CLASSFall Semester, 2013
UNDERGRADUATE
HEADCOUNTS
UNDERGRADUATE
Fact Book 13 Fall 2013

College/School Freshman Sophomore Junior Senior NDUG Graduate Total
Architecture 0 0 0 1 0 6 7Arts and Sciences 14 21 34 125 9 95 298Business 8 4 11 28 0 36 87Communication 1 6 10 20 0 29 66Education & Human Dev 0 3 1 7 0 113 124Engineering 10 4 4 9 0 21 48Frost School of Music 1 0 1 3 1 11 17Law 0 0 0 0 0 107 107Medicine - Clinical 0 0 0 0 0 5 5Medicine - Graduate 0 0 0 0 0 48 48Nursing & Health Studies 1 0 10 12 0 88 111Rosenstiel School 1 0 1 7 0 11 20Cont Std/Grad Sch/Joint Pgms 19 42 42 73 199 25 400TOTAL 55 80 114 285 209 595 1,338
College/School Freshman Sophomore Junior Senior NDUG Graduate Total
Architecture 0% 0% 0% 1% na 9% 2%Arts and Sciences 1% 2% 3% 10% 82% 14% 6%Business 1% 1% 2% 5% na 6% 3%Communication 1% 2% 3% 6% na 17% 5%Education & Human Dev 0% 3% 1% 4% na 34% 14%Engineering 3% 2% 2% 3% na 8% 4%Frost School of Music 1% 0% 1% 3% 100% 5% 3%Law na na na na na 8% 8%Medicine - Clinical na na na na na 1% 1%Medicine - Graduate na na na na na 9% 9%Nursing & Health Studies 1% 0% 9% 4% na 36% 14%Rosenstiel School 1% 0% 1% 6% na 4% 3%Cont Std/Grad Sch/Joint Pgms 95% 100% 98% 91% 61% 48% 71%TOTAL 2% 3% 4% 9% 62% 11% 8%
Note: Graduate students include M.D., J.D., and other graduate students.Source: PeopleSoft
UNDERGRADUATE
PERCENTAGE OF STUDENTS WHO ARE PART-TIME
HEADCOUNTS
PART-TIME STUDENTS BY CLASSFall Semester, 2013
UNDERGRADUATE
Fact Book 14 Fall 2013

Class 2009 2010 2011 2012 2013
New Freshman 5% 1% 2% 1% 1%New Transfer 8% 7% 9% 4% 8%Readmit 44% 51% 39% 50% 30%Continuing DUG 6% 6% 6% 5% 5%TOTAL DUG 6% 5% 5% 5% 5%
Freshman 6% 3% 3% 2% 2%Sophomore 4% 3% 3% 2% 3%Junior 5% 4% 5% 4% 4%Senior 8% 9% 9% 9% 9%NDUG 64% 49% 45% 38% 62%TOTAL UG 9% 7% 6% 6% 7%
Master's in Grad School 21% 22% 22% 21% 21%Ph.D. in Grad School 2% 2% 1% 2% 2%Other Doct. in Grad School 1% 7% 1% 2% 4%Non-Degree Graduate 51% 94% 94% 89% 78%M.D./J.D./L.L.M. 3% 4% 5% 4% 5%TOTAL GRADUATE 9% 12% 12% 10% 11%TOTAL (ALL CLASSES)* 9% 9% 8% 7% 8%
* Includes Total UG and Total GraduateNote: Graduate students include M.D., J.D., and other graduate students.Source: PeopleSoft
PERCENTAGE OF STUDENTS WHO ARE PART-TIME BY CLASSFive-Year Trends, Fall Semesters
PERCENTAGE OF STUDENTS WHO ARE PART-TIME
Fact Book 15 Fall 2013
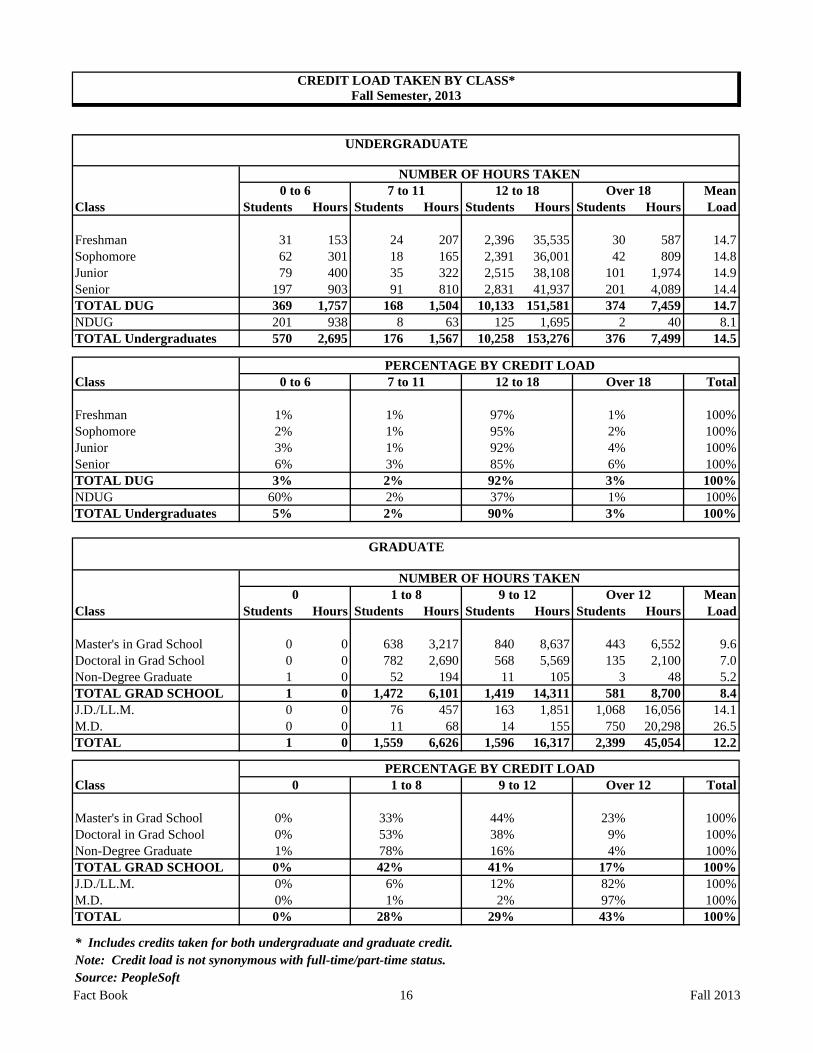
MeanClass Students Hours Students Hours Students Hours Students Hours Load
Freshman 31 153 24 207 2,396 35,535 30 587 14.7Sophomore 62 301 18 165 2,391 36,001 42 809 14.8Junior 79 400 35 322 2,515 38,108 101 1,974 14.9Senior 197 903 91 810 2,831 41,937 201 4,089 14.4TOTAL DUG 369 1,757 168 1,504 10,133 151,581 374 7,459 14.7NDUG 201 938 8 63 125 1,695 2 40 8.1TOTAL Undergraduates 570 2,695 176 1,567 10,258 153,276 376 7,499 14.5
Class Total
Freshman 1% 1% 97% 1% 100%Sophomore 2% 1% 95% 2% 100%Junior 3% 1% 92% 4% 100%Senior 6% 3% 85% 6% 100%TOTAL DUG 3% 2% 92% 3% 100%NDUG 60% 2% 37% 1% 100%TOTAL Undergraduates 5% 2% 90% 3% 100%
MeanClass Students Hours Students Hours Students Hours Students Hours Load
Master's in Grad School 0 0 638 3,217 840 8,637 443 6,552 9.6Doctoral in Grad School 0 0 782 2,690 568 5,569 135 2,100 7.0Non-Degree Graduate 1 0 52 194 11 105 3 48 5.2TOTAL GRAD SCHOOL 1 0 1,472 6,101 1,419 14,311 581 8,700 8.4J.D./LL.M. 0 0 76 457 163 1,851 1,068 16,056 14.1M.D. 0 0 11 68 14 155 750 20,298 26.5TOTAL 1 0 1,559 6,626 1,596 16,317 2,399 45,054 12.2
Class Total
Master's in Grad School 0% 33% 44% 23% 100%Doctoral in Grad School 0% 53% 38% 9% 100%Non-Degree Graduate 1% 78% 16% 4% 100%TOTAL GRAD SCHOOL 0% 42% 41% 17% 100%J.D./LL.M. 0% 6% 12% 82% 100%M.D. 0% 1% 2% 97% 100%TOTAL 0% 28% 29% 43% 100%
* Includes credits taken for both undergraduate and graduate credit. Note: Credit load is not synonymous with full-time/part-time status.Source: PeopleSoft
0 1 to 8 9 to 12 Over 12
NUMBER OF HOURS TAKEN
0 1 to 8 9 to 12 Over 12
PERCENTAGE BY CREDIT LOAD
UNDERGRADUATE
CREDIT LOAD TAKEN BY CLASS*Fall Semester, 2013
GRADUATE
NUMBER OF HOURS TAKEN
PERCENTAGE BY CREDIT LOAD0 to 6
0 to 6 7 to 11 12 to 18 Over 18
7 to 11 12 to 18 Over 18
Fact Book 16 Fall 2013
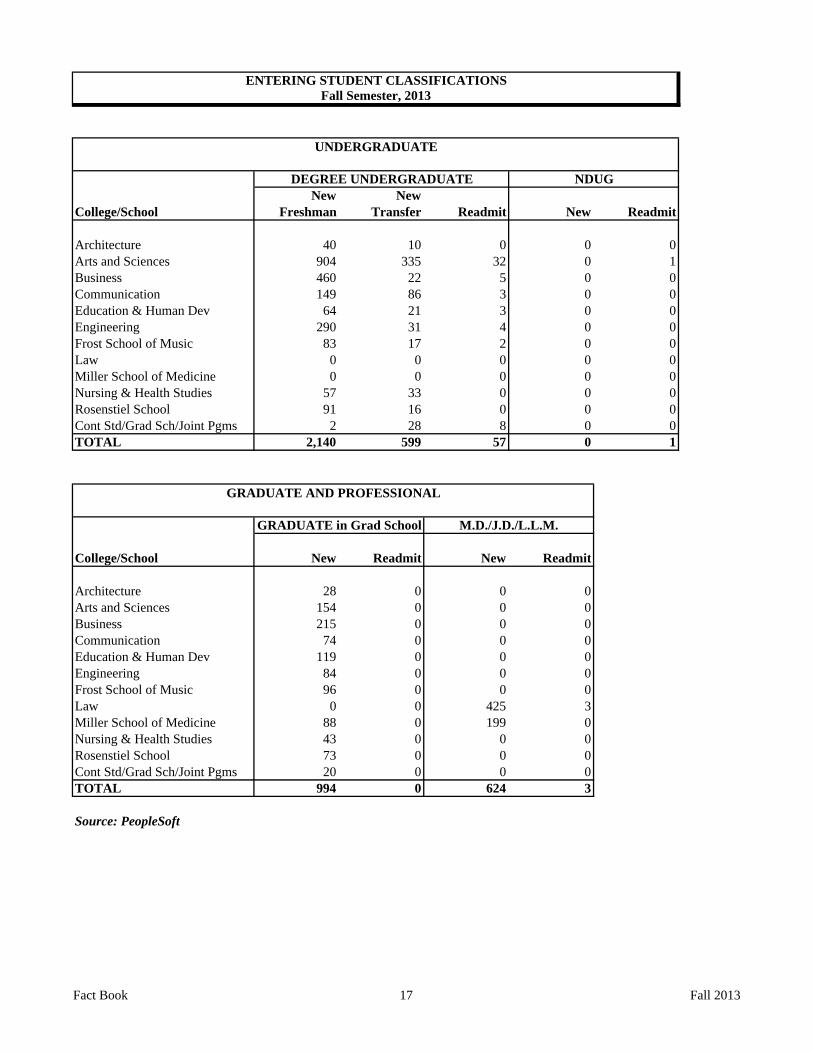
New NewCollege/School Freshman Transfer Readmit New Readmit
Architecture 40 10 0 0 0Arts and Sciences 904 335 32 0 1Business 460 22 5 0 0Communication 149 86 3 0 0Education & Human Dev 64 21 3 0 0Engineering 290 31 4 0 0Frost School of Music 83 17 2 0 0Law 0 0 0 0 0Miller School of Medicine 0 0 0 0 0Nursing & Health Studies 57 33 0 0 0Rosenstiel School 91 16 0 0 0Cont Std/Grad Sch/Joint Pgms 2 28 8 0 0TOTAL 2,140 599 57 0 1
College/School New Readmit New Readmit
Architecture 28 0 0 0Arts and Sciences 154 0 0 0Business 215 0 0 0Communication 74 0 0 0Education & Human Dev 119 0 0 0Engineering 84 0 0 0Frost School of Music 96 0 0 0Law 0 0 425 3Miller School of Medicine 88 0 199 0Nursing & Health Studies 43 0 0 0Rosenstiel School 73 0 0 0Cont Std/Grad Sch/Joint Pgms 20 0 0 0TOTAL 994 0 624 3
Source: PeopleSoft
DEGREE UNDERGRADUATE NDUG
UNDERGRADUATE
ENTERING STUDENT CLASSIFICATIONSFall Semester, 2013
GRADUATE in Grad School M.D./J.D./L.L.M.
GRADUATE AND PROFESSIONAL
Fact Book 17 Fall 2013
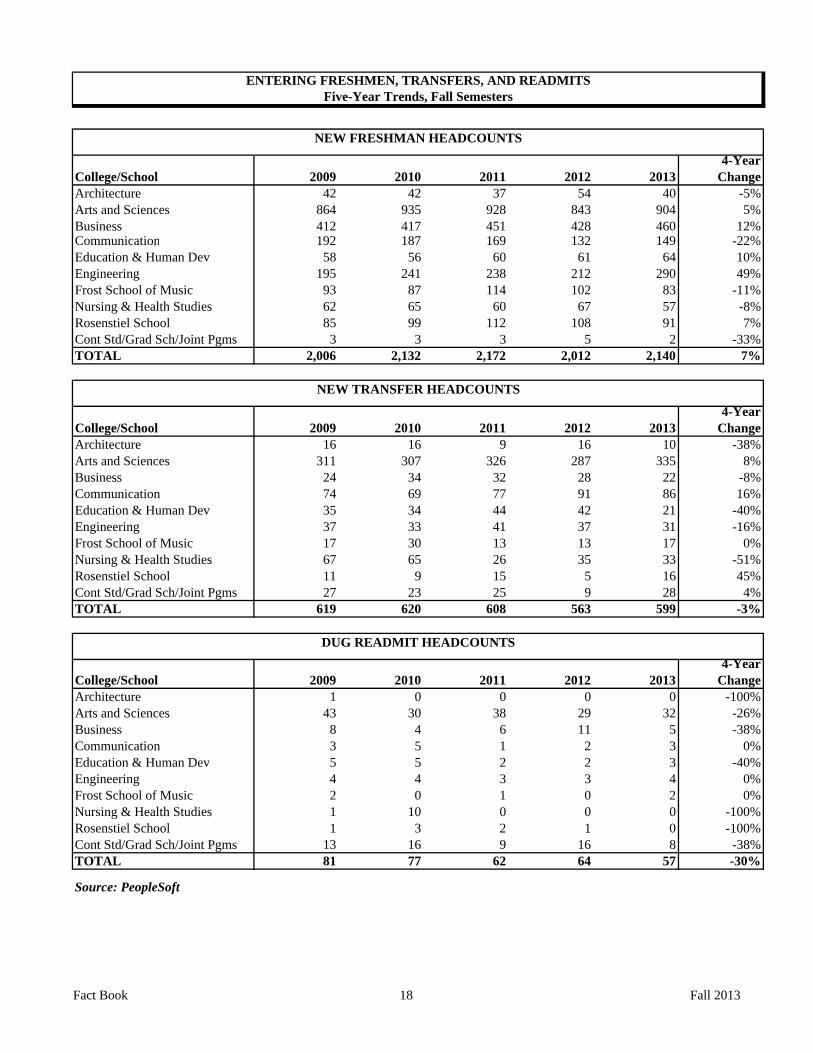
4-YearCollege/School 2009 2010 2011 2012 2013 ChangeArchitecture 42 42 37 54 40 -5%Arts and Sciences 864 935 928 843 904 5%Business 412 417 451 428 460 12%Communication 192 187 169 132 149 -22%Education & Human Dev 58 56 60 61 64 10%Engineering 195 241 238 212 290 49%Frost School of Music 93 87 114 102 83 -11%Nursing & Health Studies 62 65 60 67 57 -8%Rosenstiel School 85 99 112 108 91 7%Cont Std/Grad Sch/Joint Pgms 3 3 3 5 2 -33%TOTAL 2,006 2,132 2,172 2,012 2,140 7%
4-YearCollege/School 2009 2010 2011 2012 2013 ChangeArchitecture 16 16 9 16 10 -38%Arts and Sciences 311 307 326 287 335 8%Business 24 34 32 28 22 -8%Communication 74 69 77 91 86 16%Education & Human Dev 35 34 44 42 21 -40%Engineering 37 33 41 37 31 -16%Frost School of Music 17 30 13 13 17 0%Nursing & Health Studies 67 65 26 35 33 -51%Rosenstiel School 11 9 15 5 16 45%Cont Std/Grad Sch/Joint Pgms 27 23 25 9 28 4%TOTAL 619 620 608 563 599 -3%
4-YearCollege/School 2009 2010 2011 2012 2013 ChangeArchitecture 1 0 0 0 0 -100%Arts and Sciences 43 30 38 29 32 -26%Business 8 4 6 11 5 -38%Communication 3 5 1 2 3 0%Education & Human Dev 5 5 2 2 3 -40%Engineering 4 4 3 3 4 0%Frost School of Music 2 0 1 0 2 0%Nursing & Health Studies 1 10 0 0 0 -100%Rosenstiel School 1 3 2 1 0 -100%Cont Std/Grad Sch/Joint Pgms 13 16 9 16 8 -38%TOTAL 81 77 62 64 57 -30%
Source: PeopleSoft
NEW TRANSFER HEADCOUNTS
DUG READMIT HEADCOUNTS
ENTERING FRESHMEN, TRANSFERS, AND READMITSFive-Year Trends, Fall Semesters
NEW FRESHMAN HEADCOUNTS
Fact Book 18 Fall 2013

4-YearCollege/School 2009 2010 2011 2012 2013 Change
Architecture 41 31 37 33 28 -32%Arts and Sciences 144 157 154 147 154 7%Business 114 142 126 185 215 89%Communication 69 67 58 62 74 7%Education & Human Dev 196 166 171 121 119 -39%Engineering 50 42 63 59 84 68%Frost School of Music 98 87 86 113 96 -2%Law 677 634 553 591 425 -37%Miller School of Medicine 265 223 319 353 287 8%Nursing & Health Studies 91 94 164 104 43 -53%Rosenstiel School 41 79 67 77 73 78%Cont Std/Grad Sch/Joint Pgms 50 63 26 31 20 -60%TOTAL 1,836 1,785 1,824 1,876 1,618 -12%
Note: Graduate students include M.D., J.D., and other graduate students.Source: PeopleSoft
HEADCOUNTS
ENTERING GRADUATE STUDENTSFive-Year Trends, Fall Semesters
Fact Book 19 Fall 2013

4-Year2009 2010 2011 2012 2013 Change
Applied 21,845 25,899 27,747 27,757 28,907 32%Accepted 9,700 10,157 10,635 11,020 11,691 21%Enrolled 2,006 2,132 2,172 2,012 2,140 7%Accept Rate 44% 39% 38% 40% 40% -4%Yield Rate 21% 21% 20% 18% 18% -2%
4-Year2009 2010 2011 2012 2013 Change
Applied 3,698 4,637 3,047 2,645 2,727 -26%Accepted 1,449 1,637 1,729 1,558 1,591 10%Enrolled 619 620 608 563 599 -3%Accept Rate 39% 35% 57% 59% 58% 19%Yield Rate 43% 38% 35% 36% 38% -5%
Note: First-time students who began their studies during the prior summer were included in fall data.Source: Student Admission System
ADMISSIONS DATAFive-Year Trends, Fall Semester
New Freshmen
New Transfers
Fact Book 20 Fall 2013

4-YearOfficial SAT* 2009 2010 2011 2012 2013 ChangeOfficial SAT (for external reporting)**Average SAT Combined 1275 1295 1315 1325 1325 50SAT Verbal 75th Percentile 680 680 690 700 700 20SAT Verbal 25th Percentile 570 590 600 600 600 30SAT Math 75th Percentile 700 700 710 720 720 20SAT Math 25th Percentile 600 620 630 630 630 30Official SAT Combined (for internal use)Mean Official SAT Combined 1273 1293 1319 1316 1317 4475th Percentile 1360 1370 1390 1400 1390 30Median 1280 1300 1320 1330 1320 4025th Percentile 1190 1230 1250 1240 1240 50Number Included in Computation 1,170 1,215 1,124 1,055 1,049 n.a.Percent of New Freshmen Reporting 58% 57% 52% 52% 49% n.a.
4-YearOfficial ACT* 2009 2010 2011 2012 2013 Change
Mean of Official ACT 28.9 29.5 29.5 29.7 30.1 1.275th Percentile 31 32 32 32 32 1.0Median 29 30 30 30 30 1.025th Percentile 27 28 28 28 28 1.0Number Included in Computation 666 785 841 764 884 n.a.Percent of New Freshmen Reporting 33% 37% 39% 38% 41% n.a.
4-YearHigh School Percentile* 2009 2010 2011 2012 2013 Change
Mean High School Percentile 88.5 89.1 90.7 89.4 90.7 2.2
Top 5% 41% 46% 51% 48% 51% 10%Next 5% 22% 22% 21% 21% 21% -1%2nd Decile 18% 18% 15% 17% 18% 0%3rd Decile 11% 6% 8% 6% 5% -6%4th Decile 4% 3% 2% 3% 1% -3%Below 4th Decile 4% 5% 3% 5% 4% 0%Number Included in Computation 674 772 686 634 603 n.a.Percent of New Freshmen Reporting 34% 36% 32% 32% 28% n.a.
Note: "Official SAT" excludes scores for students who performed better on their ACT. "Official ACT" excludes scores for students who perfom better on their SAT.
Test Scores
High School Performance
ADMISSIONS DATA - OFFICIAL SAT, ACT, AND HIGH SCHOOL PERCENTILEFive-Year Trends, Fall Semester
* Data in this table are based on the CDS methodology, which reports data for all first-time students who began their studies in the reported fall plus those starting in the prior summer.** Official SAT (for external reporting) is the SAT reported to the Federal Government, U.S. News and World Report, and other external entities. The Average SAT Combined is computed by summing 4 SAT scores (SAT Verbal 25th and 75th Percentiles and SAT Math 25th and 75th Percentiles) and dividing the total by 2.
Fact Book 21 Fall 2013

Major CIP TOTALCode Major Name Code Fr So Jr Sr DUG NDUG UG
ARCHITECTURE
ARCH Architecture 04.0201 46 51 51 111 259 0 259TOTAL 46 51 51 111 259 0 259
ARTS AND SCIENCES
AFRS Africana Studies 05.0201 0 1 3 2 6 0 6AMRS American Studies 05.0102 0 2 2 0 4 0 4ANTH Anthropology 45.0201 4 14 14 25 57 0 57ARTH Art History 50.0703 4 6 15 14 39 0 39ARTT Art 50.0701 2 9 7 12 30 0 30ARTTC Ceramics 50.0711 0 0 1 0 1 0 1ARTTG Graphic Design 50.0409 0 0 0 7 7 0 7ARTTO Photography 50.0605 0 0 3 1 4 0 4ARTTP Painting 50.0708 0 1 3 2 6 0 6ARTTS Studio Art 50.0702 6 12 19 34 71 0 71ARTTU Sculpture 50.0709 0 0 0 1 1 0 1ASNDG Arts & Sciences Non-degree 24.0101 0 0 0 0 0 3 3BCHM Biochemistry 26.0202 42 30 37 50 159 0 159BCHN Biochemistry and Nutrition 26.0299 3 2 3 0 8 0 8BIOL Biology 26.0101 171 184 173 201 729 0 729CHEM Chemistry 40.0501 20 38 26 40 124 0 124CLAS Classics 16.1200 0 2 5 14 21 0 21COMP Computer Science 11.0701 20 29 34 63 146 0 146CRIM Criminology 45.0401 16 19 23 27 85 0 85CSAS Post Baccalaureate-Alumni 24.0101 0 0 0 0 0 1 1ECOA Economics 45.0601 73 140 160 138 511 0 511ENGL English 23.0101 16 32 66 79 193 0 193ENSC Environmental Science 14.1401 0 1 0 0 1 0 1ESYS Ecosystem Science and Policy 03.0201 9 16 15 33 73 0 73EXPHAS Exercise Physiology 31.0505 0 0 2 0 2 0 2FLAS Fellows in Latin American Studies 05.0107 0 1 2 3 6 0 6FREN French 16.0901 0 1 10 5 16 0 16GEOG Geography 45.0701 0 3 8 8 19 0 19GEOL Geology 40.0601 1 0 0 2 3 0 3GERM German 16.0501 0 2 0 3 5 0 5GSCI Geological Sciences 40.0601 1 5 8 14 28 0 28HIST History 54.0101 8 12 29 42 91 0 91INTL International Studies 45.0901 33 53 89 104 279 0 279LATI Latin American Studies 05.0107 1 2 3 2 8 0 8LIBL Liberal Arts 24.0102 0 6 11 14 31 0 31MATH Mathematics 27.0101 31 33 44 74 182 0 182MICR Microbiology and Immunology 26.0508 26 30 59 71 186 0 186MODN Modern Languages and Literature 16.0101 0 0 0 1 1 0 1NEUN Neuroscience/Neurobiology 26.1501 0 0 0 28 28 0 28
UNDERGRADUATE HEADCOUNTS BY MAJOR FOR EACH SCHOOLFall Semester, 2013
UNDERGRADUATE
Fact Book 22 Fall 2013
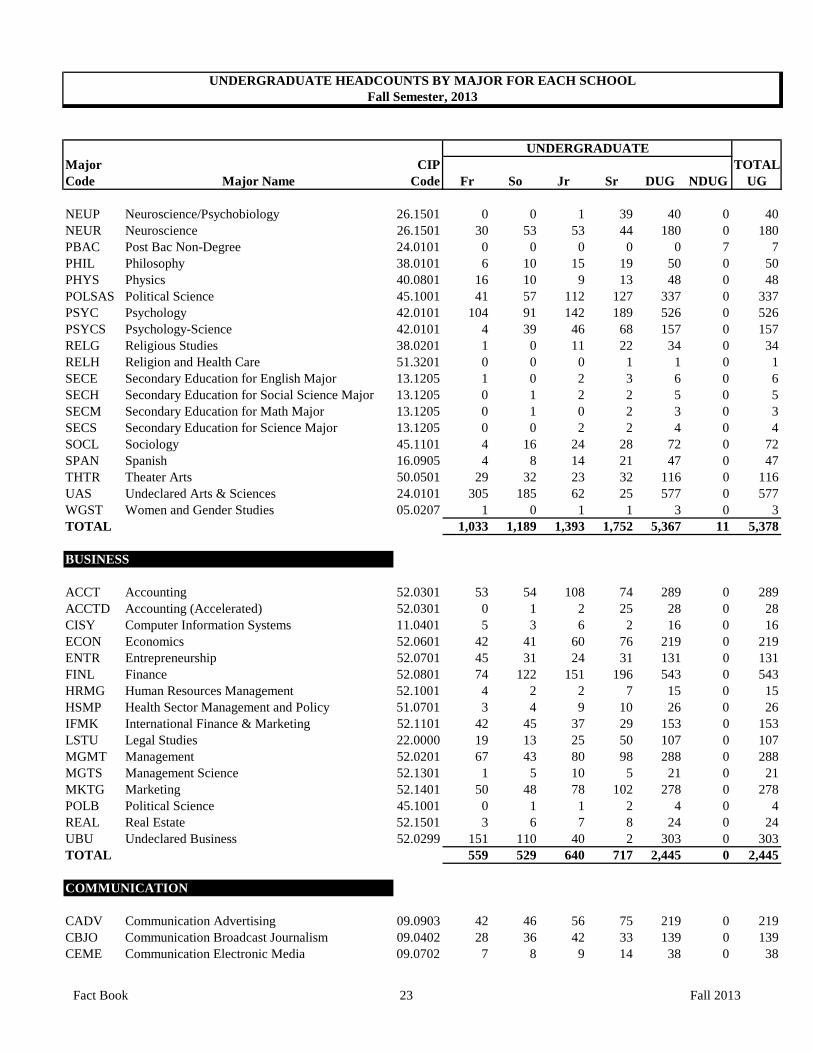
Major CIP TOTALCode Major Name Code Fr So Jr Sr DUG NDUG UG
UNDERGRADUATE HEADCOUNTS BY MAJOR FOR EACH SCHOOLFall Semester, 2013
UNDERGRADUATE
NEUP Neuroscience/Psychobiology 26.1501 0 0 1 39 40 0 40NEUR Neuroscience 26.1501 30 53 53 44 180 0 180PBAC Post Bac Non-Degree 24.0101 0 0 0 0 0 7 7PHIL Philosophy 38.0101 6 10 15 19 50 0 50PHYS Physics 40.0801 16 10 9 13 48 0 48POLSAS Political Science 45.1001 41 57 112 127 337 0 337PSYC Psychology 42.0101 104 91 142 189 526 0 526PSYCS Psychology-Science 42.0101 4 39 46 68 157 0 157RELG Religious Studies 38.0201 1 0 11 22 34 0 34RELH Religion and Health Care 51.3201 0 0 0 1 1 0 1SECE Secondary Education for English Major 13.1205 1 0 2 3 6 0 6SECH Secondary Education for Social Science Major 13.1205 0 1 2 2 5 0 5SECM Secondary Education for Math Major 13.1205 0 1 0 2 3 0 3SECS Secondary Education for Science Major 13.1205 0 0 2 2 4 0 4SOCL Sociology 45.1101 4 16 24 28 72 0 72SPAN Spanish 16.0905 4 8 14 21 47 0 47THTR Theater Arts 50.0501 29 32 23 32 116 0 116UAS Undeclared Arts & Sciences 24.0101 305 185 62 25 577 0 577WGST Women and Gender Studies 05.0207 1 0 1 1 3 0 3TOTAL 1,033 1,189 1,393 1,752 5,367 11 5,378
BUSINESS
ACCT Accounting 52.0301 53 54 108 74 289 0 289ACCTD Accounting (Accelerated) 52.0301 0 1 2 25 28 0 28CISY Computer Information Systems 11.0401 5 3 6 2 16 0 16ECON Economics 52.0601 42 41 60 76 219 0 219ENTR Entrepreneurship 52.0701 45 31 24 31 131 0 131FINL Finance 52.0801 74 122 151 196 543 0 543HRMG Human Resources Management 52.1001 4 2 2 7 15 0 15HSMP Health Sector Management and Policy 51.0701 3 4 9 10 26 0 26IFMK International Finance & Marketing 52.1101 42 45 37 29 153 0 153LSTU Legal Studies 22.0000 19 13 25 50 107 0 107MGMT Management 52.0201 67 43 80 98 288 0 288MGTS Management Science 52.1301 1 5 10 5 21 0 21MKTG Marketing 52.1401 50 48 78 102 278 0 278POLB Political Science 45.1001 0 1 1 2 4 0 4REAL Real Estate 52.1501 3 6 7 8 24 0 24UBU Undeclared Business 52.0299 151 110 40 2 303 0 303TOTAL 559 529 640 717 2,445 0 2,445
COMMUNICATION
CADV Communication Advertising 09.0903 42 46 56 75 219 0 219CBJO Communication Broadcast Journalism 09.0402 28 36 42 33 139 0 139CEME Communication Electronic Media 09.0702 7 8 9 14 38 0 38
Fact Book 23 Fall 2013
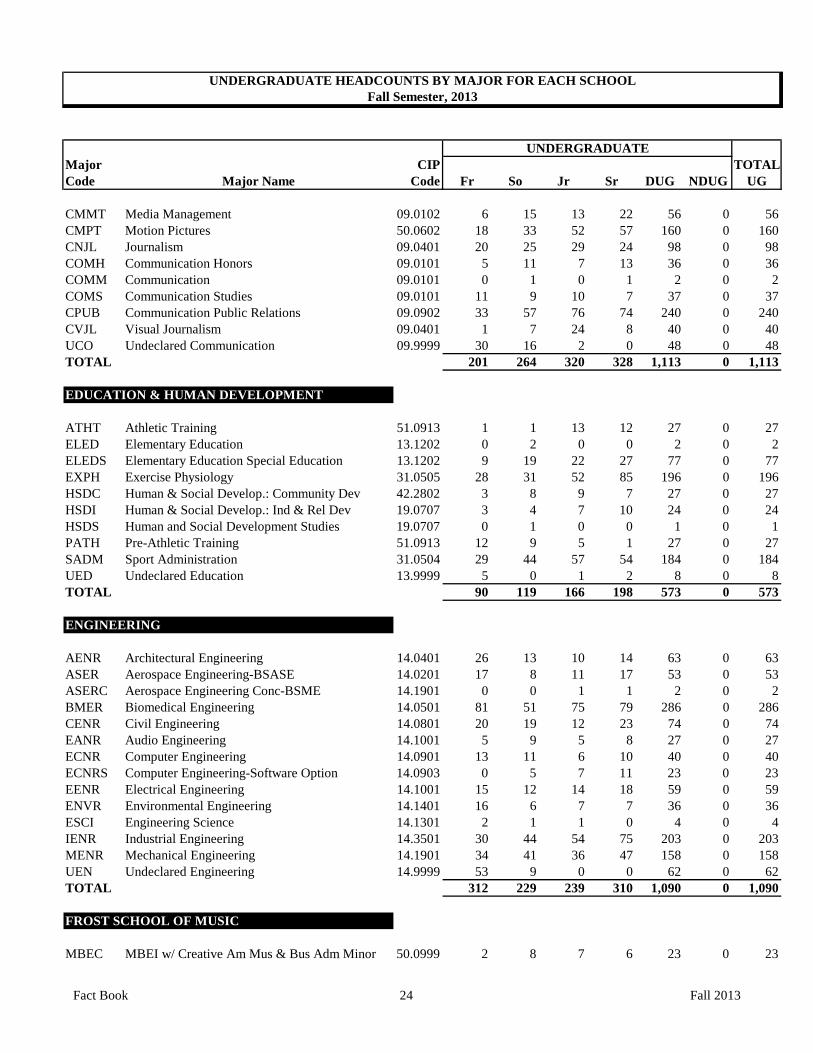
Major CIP TOTALCode Major Name Code Fr So Jr Sr DUG NDUG UG
UNDERGRADUATE HEADCOUNTS BY MAJOR FOR EACH SCHOOLFall Semester, 2013
UNDERGRADUATE
CMMT Media Management 09.0102 6 15 13 22 56 0 56CMPT Motion Pictures 50.0602 18 33 52 57 160 0 160CNJL Journalism 09.0401 20 25 29 24 98 0 98COMH Communication Honors 09.0101 5 11 7 13 36 0 36COMM Communication 09.0101 0 1 0 1 2 0 2COMS Communication Studies 09.0101 11 9 10 7 37 0 37CPUB Communication Public Relations 09.0902 33 57 76 74 240 0 240CVJL Visual Journalism 09.0401 1 7 24 8 40 0 40UCO Undeclared Communication 09.9999 30 16 2 0 48 0 48TOTAL 201 264 320 328 1,113 0 1,113
EDUCATION & HUMAN DEVELOPMENT
ATHT Athletic Training 51.0913 1 1 13 12 27 0 27ELED Elementary Education 13.1202 0 2 0 0 2 0 2ELEDS Elementary Education Special Education 13.1202 9 19 22 27 77 0 77EXPH Exercise Physiology 31.0505 28 31 52 85 196 0 196HSDC Human & Social Develop.: Community Dev 42.2802 3 8 9 7 27 0 27HSDI Human & Social Develop.: Ind & Rel Dev 19.0707 3 4 7 10 24 0 24HSDS Human and Social Development Studies 19.0707 0 1 0 0 1 0 1PATH Pre-Athletic Training 51.0913 12 9 5 1 27 0 27SADM Sport Administration 31.0504 29 44 57 54 184 0 184UED Undeclared Education 13.9999 5 0 1 2 8 0 8TOTAL 90 119 166 198 573 0 573
ENGINEERING
AENR Architectural Engineering 14.0401 26 13 10 14 63 0 63ASER Aerospace Engineering-BSASE 14.0201 17 8 11 17 53 0 53ASERC Aerospace Engineering Conc-BSME 14.1901 0 0 1 1 2 0 2BMER Biomedical Engineering 14.0501 81 51 75 79 286 0 286CENR Civil Engineering 14.0801 20 19 12 23 74 0 74EANR Audio Engineering 14.1001 5 9 5 8 27 0 27ECNR Computer Engineering 14.0901 13 11 6 10 40 0 40ECNRS Computer Engineering-Software Option 14.0903 0 5 7 11 23 0 23EENR Electrical Engineering 14.1001 15 12 14 18 59 0 59ENVR Environmental Engineering 14.1401 16 6 7 7 36 0 36ESCI Engineering Science 14.1301 2 1 1 0 4 0 4IENR Industrial Engineering 14.3501 30 44 54 75 203 0 203MENR Mechanical Engineering 14.1901 34 41 36 47 158 0 158UEN Undeclared Engineering 14.9999 53 9 0 0 62 0 62TOTAL 312 229 239 310 1,090 0 1,090
FROST SCHOOL OF MUSIC
MBEC MBEI w/ Creative Am Mus & Bus Adm Minor 50.0999 2 8 7 6 23 0 23
Fact Book 24 Fall 2013
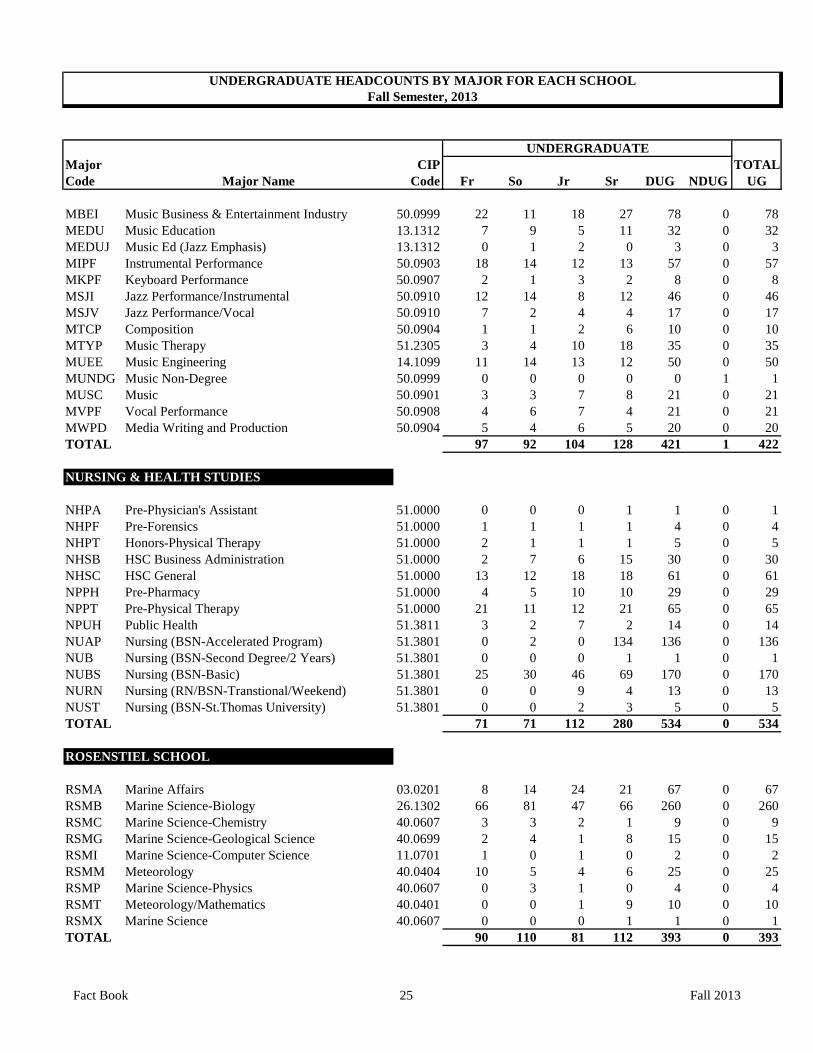
Major CIP TOTALCode Major Name Code Fr So Jr Sr DUG NDUG UG
UNDERGRADUATE HEADCOUNTS BY MAJOR FOR EACH SCHOOLFall Semester, 2013
UNDERGRADUATE
MBEI Music Business & Entertainment Industry 50.0999 22 11 18 27 78 0 78MEDU Music Education 13.1312 7 9 5 11 32 0 32MEDUJ Music Ed (Jazz Emphasis) 13.1312 0 1 2 0 3 0 3MIPF Instrumental Performance 50.0903 18 14 12 13 57 0 57MKPF Keyboard Performance 50.0907 2 1 3 2 8 0 8MSJI Jazz Performance/Instrumental 50.0910 12 14 8 12 46 0 46MSJV Jazz Performance/Vocal 50.0910 7 2 4 4 17 0 17MTCP Composition 50.0904 1 1 2 6 10 0 10MTYP Music Therapy 51.2305 3 4 10 18 35 0 35MUEE Music Engineering 14.1099 11 14 13 12 50 0 50MUNDG Music Non-Degree 50.0999 0 0 0 0 0 1 1MUSC Music 50.0901 3 3 7 8 21 0 21MVPF Vocal Performance 50.0908 4 6 7 4 21 0 21MWPD Media Writing and Production 50.0904 5 4 6 5 20 0 20TOTAL 97 92 104 128 421 1 422
NURSING & HEALTH STUDIES
NHPA Pre-Physician's Assistant 51.0000 0 0 0 1 1 0 1NHPF Pre-Forensics 51.0000 1 1 1 1 4 0 4NHPT Honors-Physical Therapy 51.0000 2 1 1 1 5 0 5NHSB HSC Business Administration 51.0000 2 7 6 15 30 0 30NHSC HSC General 51.0000 13 12 18 18 61 0 61NPPH Pre-Pharmacy 51.0000 4 5 10 10 29 0 29NPPT Pre-Physical Therapy 51.0000 21 11 12 21 65 0 65NPUH Public Health 51.3811 3 2 7 2 14 0 14NUAP Nursing (BSN-Accelerated Program) 51.3801 0 2 0 134 136 0 136NUB Nursing (BSN-Second Degree/2 Years) 51.3801 0 0 0 1 1 0 1NUBS Nursing (BSN-Basic) 51.3801 25 30 46 69 170 0 170NURN Nursing (RN/BSN-Transtional/Weekend) 51.3801 0 0 9 4 13 0 13NUST Nursing (BSN-St.Thomas University) 51.3801 0 0 2 3 5 0 5TOTAL 71 71 112 280 534 0 534
ROSENSTIEL SCHOOL
RSMA Marine Affairs 03.0201 8 14 24 21 67 0 67RSMB Marine Science-Biology 26.1302 66 81 47 66 260 0 260RSMC Marine Science-Chemistry 40.0607 3 3 2 1 9 0 9RSMG Marine Science-Geological Science 40.0699 2 4 1 8 15 0 15RSMI Marine Science-Computer Science 11.0701 1 0 1 0 2 0 2RSMM Meteorology 40.0404 10 5 4 6 25 0 25RSMP Marine Science-Physics 40.0607 0 3 1 0 4 0 4RSMT Meteorology/Mathematics 40.0401 0 0 1 9 10 0 10RSMX Marine Science 40.0607 0 0 0 1 1 0 1TOTAL 90 110 81 112 393 0 393
Fact Book 25 Fall 2013
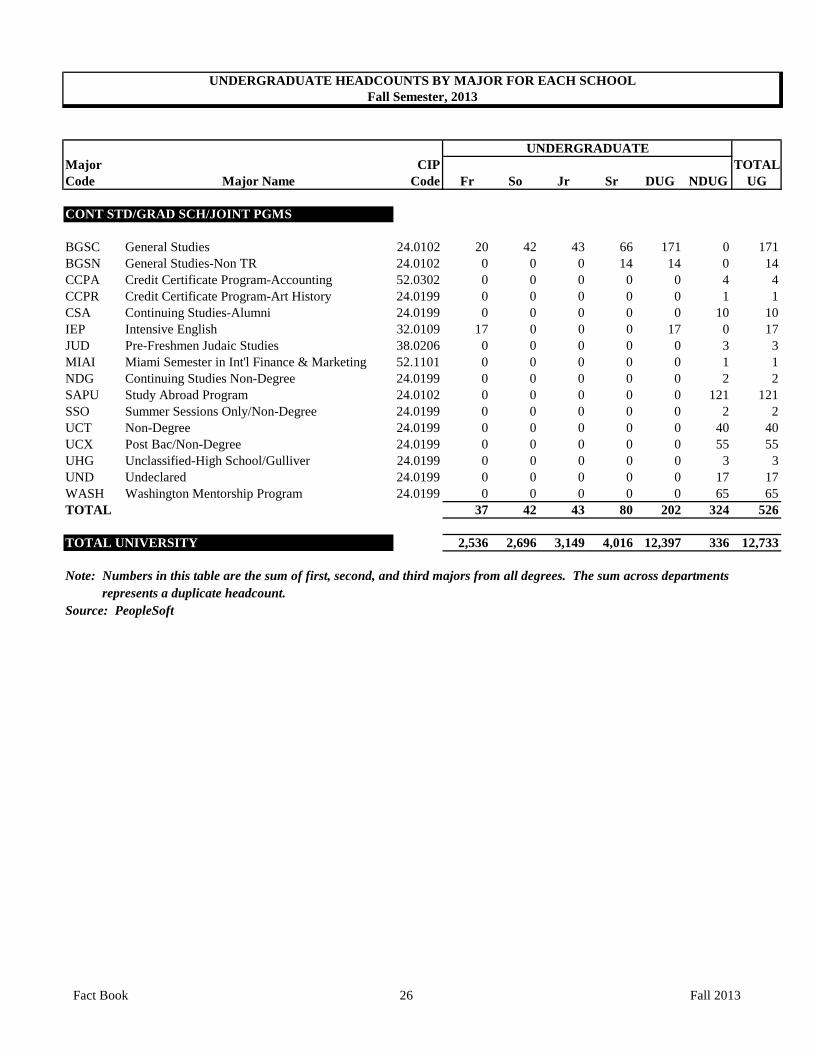
Major CIP TOTALCode Major Name Code Fr So Jr Sr DUG NDUG UG
UNDERGRADUATE HEADCOUNTS BY MAJOR FOR EACH SCHOOLFall Semester, 2013
UNDERGRADUATE
CONT STD/GRAD SCH/JOINT PGMS
BGSC General Studies 24.0102 20 42 43 66 171 0 171BGSN General Studies-Non TR 24.0102 0 0 0 14 14 0 14CCPA Credit Certificate Program-Accounting 52.0302 0 0 0 0 0 4 4CCPR Credit Certificate Program-Art History 24.0199 0 0 0 0 0 1 1CSA Continuing Studies-Alumni 24.0199 0 0 0 0 0 10 10IEP Intensive English 32.0109 17 0 0 0 17 0 17JUD Pre-Freshmen Judaic Studies 38.0206 0 0 0 0 0 3 3MIAI Miami Semester in Int'l Finance & Marketing 52.1101 0 0 0 0 0 1 1NDG Continuing Studies Non-Degree 24.0199 0 0 0 0 0 2 2SAPU Study Abroad Program 24.0102 0 0 0 0 0 121 121SSO Summer Sessions Only/Non-Degree 24.0199 0 0 0 0 0 2 2UCT Non-Degree 24.0199 0 0 0 0 0 40 40UCX Post Bac/Non-Degree 24.0199 0 0 0 0 0 55 55UHG Unclassified-High School/Gulliver 24.0199 0 0 0 0 0 3 3UND Undeclared 24.0199 0 0 0 0 0 17 17WASH Washington Mentorship Program 24.0199 0 0 0 0 0 65 65TOTAL 37 42 43 80 202 324 526
TOTAL UNIVERSITY 2,536 2,696 3,149 4,016 12,397 336 12,733
Note: Numbers in this table are the sum of first, second, and third majors from all degrees. The sum across departments represents a duplicate headcount.Source: PeopleSoft
Fact Book 26 Fall 2013

Major CIP Other Doc-Prof Non-deg TOTALCode Major Name Code Masters Ph.D. Rsch Doc Practice Grad Grad
ARCHITECTURE
ARCH Architecture 04.0201 58 0 0 0 0 58ARCHR Master of Science-ARC Studies/Research 04.9999 2 0 0 0 0 2ARRE Real Estate Develop & Urbanism 04.0301 10 0 0 0 0 10TOTAL 70 0 0 0 0 70
ARTS AND SCIENCES
ARTT Art 50.0701 19 0 0 0 0 19BIOL Biology 26.0101 0 35 0 0 0 35CHEM Chemistry 40.0501 2 53 0 0 0 55COMP Computer Science 11.0701 6 13 0 0 0 19CWRT Creative Writing 23.1302 12 0 0 0 0 12ENGL English 23.0101 1 37 0 0 0 38FLAS Fellows in Latin American Studies 05.0107 1 0 0 0 0 1GEOG Geography 45.0701 4 0 0 0 0 4GISG Graduate Geospatial Technology 45.0799 0 0 0 0 3 3HIST History 54.0101 1 17 0 0 0 18IADM International Administration 45.0901 48 0 0 0 0 48INTL International Studies 45.0901 17 42 0 0 0 59LATI Latin American Studies 05.0107 13 0 0 0 0 13LIBLST Liberal Studies 24.0101 64 0 0 0 0 64MATH Mathematics 27.0101 6 26 1 0 0 33PADH MPA/MPH Degree 44.0401 1 0 0 0 0 1PADM Public Administration 44.0401 46 0 0 0 0 46PHIL Philosophy 38.0101 0 28 0 0 0 28PHYS Physics 40.0801 0 26 0 0 0 26PSYC Psychology 42.0101 0 81 0 0 0 81ROMF Romance Studies, French 16.0901 0 10 0 0 0 10ROMS Romance Studies, Spanish 16.0905 0 21 0 0 0 21SOCL Sociology 45.1101 1 22 0 0 0 23TOTAL 242 411 1 0 3 657
BUSINESS
ACCT Accounting 52.0301 87 0 0 0 1 88AOMB Add on MBA-MSPM 52.0201 1 0 0 0 0 1BACC Ph.D.-Business Administration (Accounting) 52.0201 0 18 0 0 0 18BADT Business Administration-Temporary 52.0201 2 0 0 0 0 2BUAD Business Administration 52.0201 0 15 0 0 0 15BUSA Master of Business Administration 52.0201 171 0 0 0 0 171BUSAE Executive MBA 52.0201 2 0 0 0 0 2BUSAR MBA-Accel MBA in Real Estate 52.0201 1 0 0 0 0 1ECON Economics 52.0601 0 8 0 0 0 8EMBA Executive MBA 52.0201 39 0 0 0 0 39GBCT Graduate Business Certificate 52.0101 0 0 0 0 15 15
GRADUATE
GRADUATE HEADCOUNTS BY MAJOR FOR EACH SCHOOLFall Semester, 2013
Fact Book 27 Fall 2013

Major CIP Other Doc-Prof Non-deg TOTALCode Major Name Code Masters Ph.D. Rsch Doc Practice Grad Grad
GRADUATE
GRADUATE HEADCOUNTS BY MAJOR FOR EACH SCHOOLFall Semester, 2013
HLTH Executive MBA-Health Administration 51.0701 53 0 0 0 0 53IDS Interdisciplinary Studies 30.9999 0 1 0 0 0 1JDMB Law JD/MBA Program 22.0101 0 0 0 16 0 16MDMBA Medical School (MD/MBA 5th yr) 51.1201 0 0 0 4 0 4OFPT Executive MBA-Puerto Rico 52.0201 17 0 0 0 0 17PROF Professional Management 52.0201 32 0 0 0 0 32TAXT Master of Science in Taxation 52.1601 24 0 0 0 0 24WRKP MBA-Working Professionals 52.0201 114 0 0 0 0 114TOTAL 543 42 0 20 16 621
COMMUNICATION
CBJO Communication Broadcast Journalism 09.0402 8 0 0 0 0 8CFLM Film Master of Fine Arts 50.0601 23 0 0 0 0 23CFP Motion Picture Production 50.0602 12 0 0 0 0 12CFS Motion Picture Screenwriting 50.0601 9 0 0 0 0 9CNJL Journalism 09.0401 14 0 0 0 0 14COMM Communication 09.0101 0 20 0 0 0 20COMS Communication Studies 09.0101 28 0 0 0 0 28CPD Motion Picture Producing 50.0602 4 0 0 0 0 4CPUB Communication Public Relations 09.0902 38 0 0 0 0 38IMFA Interactive Media 50.0411 13 0 0 0 0 13TOTAL 149 20 0 0 0 169
EDUCATION & HUMAN DEVELOPMENT
CNSF Counseling Marriage & Family Therapy 51.1505 14 0 0 0 0 14CNSM Counseling Mental Health 51.1508 25 0 0 0 0 25CNSP Counseling Psychology 42.2803 0 35 0 0 0 35CNSR Counseling and Research 51.1508 2 0 0 0 0 2CSCH Community and Social Change 42.2802 29 0 0 0 0 29CWBE Community Well-Being 42.2802 0 2 0 0 0 2ECSE Early Childhood/Special Education 13.1015 31 0 0 0 0 31EREP Education Research/Exercise Physiology 26.0908 0 1 0 0 0 1ERME Research, Measurement, and Evaluation 13.0601 3 2 0 0 0 5ESOC Education and Social Change 13.1206 26 0 0 0 0 26EXPH Exercise Physiology 26.0908 12 20 0 0 0 32EXSC Exercise Physiology-Strength & Conditioning 26.0908 25 0 0 0 0 25HEEC Certificate in Enrollment Management 13.0406 0 0 0 0 1 1HEEM Higher Education/Enrollment Management 13.0406 6 0 0 0 0 6HELD Higher Education Leadership 13.0406 0 0 27 0 0 27HESC Higher Ed/Stud Life/Develop Certificate 13.0406 0 0 0 0 1 1HESD Higher Education/Student Life & Development 13.0406 19 0 0 0 0 19SADM Sport Administration 31.0504 26 0 0 0 0 26TALP Teaching and Learning 13.0404 0 24 0 0 0 24WKSP Workshop 13.0101 0 0 0 0 1 1TOTAL 218 84 27 0 3 332
Fact Book 28 Fall 2013

Major CIP Other Doc-Prof Non-deg TOTALCode Major Name Code Masters Ph.D. Rsch Doc Practice Grad Grad
GRADUATE
GRADUATE HEADCOUNTS BY MAJOR FOR EACH SCHOOLFall Semester, 2013
ENGINEERING
AENR Architectural Engineering 14.0401 1 0 0 0 0 1BMER Biomedical Engineering 14.0501 39 37 0 0 0 76CENR Civil Engineering 14.0801 14 18 0 0 0 32ECER Electrical and Computer Engineering 14.1001 15 46 0 0 0 61ERGO Ergonomics 15.1501 0 2 0 0 0 2IENR Industrial Engineering 14.3501 24 23 0 0 0 47MENR Mechanical Engineering 14.1901 8 22 0 0 0 30MTECEN Management of Technology 15.1501 9 0 0 0 0 9OEST Occupational Ergonomics & Safety 15.1501 1 0 0 0 0 1TOTAL 111 148 0 0 0 259
LAW
CBTD Taxation of Cross-Border Investment 22.0211 1 0 0 0 0 1EPLW Estate Planning 22.0299 17 0 0 0 0 17INTLW International Law 22.0209 62 0 0 0 0 62JDCO Law JD/MA Program 22.0101 0 0 0 4 0 4JDIB Law JD/LLM International Law-Arbitration 22.0101 0 0 0 1 0 1JDMA Law JD/MA in Marine Affairs 22.0101 0 0 0 3 0 3JDMB Law JD/MBA Program 22.0101 0 0 0 20 0 20JDMM Law JD/MM Program 22.0101 0 0 0 31 0 31JDMP Law JD/MPH Program 22.0101 0 0 0 3 0 3JDMT JD/MBA/LLM in Tax (Triple Degree) 22.0101 0 0 0 1 0 1JDOC Law JD/LLM Ocean & Coastal Program 22.0101 0 0 0 1 0 1JDPA Law JD/MPA Program 22.0101 0 0 0 4 0 4JDRE Law JD/LLM Real Estate Program 22.0101 0 0 0 1 0 1JDRP Law JD/LLM Real Property Program 22.0101 0 0 0 3 0 3JDSC JD/MSED Law, Comm, Social Change 22.0101 0 0 0 1 0 1JDTX Law JD/LLM Tax Program 22.0101 0 0 0 21 0 21LAW Law Non-degree 22.0101 0 0 0 0 2 2LAWJ Law 22.0101 0 0 0 1,080 0 1,080OCLW Ocean and Coastal Law 22.0207 4 0 0 0 0 4RELW Real Property 22.0299 14 0 0 0 0 14RPDL Real Property (Distance Learning) 22.0299 14 0 0 0 0 14TAXL Tax 22.0211 19 0 0 0 0 19TOTAL 131 0 0 1,174 2 1,307
MILLER SCHOOL OF MEDICINE
BCHMG Biochemistry and Molecular Biology 26.0202 0 32 0 0 0 32BSTS Biostatistics 26.1102 1 9 0 0 0 10CABL Cancer Biology 26.0911 0 34 0 0 0 34CTIN Clinical and Translational Investigation 51.1401 2 0 0 0 0 2EPID Epidemiology 26.1309 134 16 0 0 3 153
Fact Book 29 Fall 2013
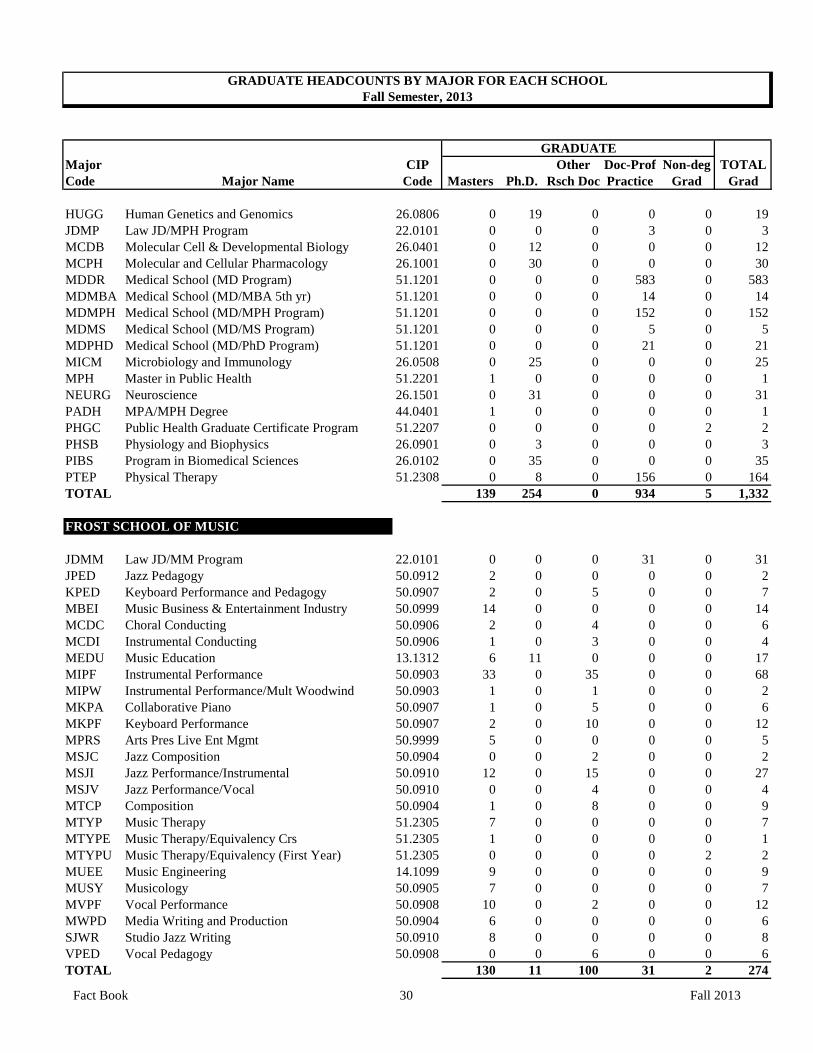
Major CIP Other Doc-Prof Non-deg TOTALCode Major Name Code Masters Ph.D. Rsch Doc Practice Grad Grad
GRADUATE
GRADUATE HEADCOUNTS BY MAJOR FOR EACH SCHOOLFall Semester, 2013
HUGG Human Genetics and Genomics 26.0806 0 19 0 0 0 19JDMP Law JD/MPH Program 22.0101 0 0 0 3 0 3MCDB Molecular Cell & Developmental Biology 26.0401 0 12 0 0 0 12MCPH Molecular and Cellular Pharmacology 26.1001 0 30 0 0 0 30MDDR Medical School (MD Program) 51.1201 0 0 0 583 0 583MDMBA Medical School (MD/MBA 5th yr) 51.1201 0 0 0 14 0 14MDMPH Medical School (MD/MPH Program) 51.1201 0 0 0 152 0 152MDMS Medical School (MD/MS Program) 51.1201 0 0 0 5 0 5MDPHD Medical School (MD/PhD Program) 51.1201 0 0 0 21 0 21MICM Microbiology and Immunology 26.0508 0 25 0 0 0 25MPH Master in Public Health 51.2201 1 0 0 0 0 1NEURG Neuroscience 26.1501 0 31 0 0 0 31PADH MPA/MPH Degree 44.0401 1 0 0 0 0 1PHGC Public Health Graduate Certificate Program 51.2207 0 0 0 0 2 2PHSB Physiology and Biophysics 26.0901 0 3 0 0 0 3PIBS Program in Biomedical Sciences 26.0102 0 35 0 0 0 35PTEP Physical Therapy 51.2308 0 8 0 156 0 164TOTAL 139 254 0 934 5 1,332
FROST SCHOOL OF MUSIC
JDMM Law JD/MM Program 22.0101 0 0 0 31 0 31JPED Jazz Pedagogy 50.0912 2 0 0 0 0 2KPED Keyboard Performance and Pedagogy 50.0907 2 0 5 0 0 7MBEI Music Business & Entertainment Industry 50.0999 14 0 0 0 0 14MCDC Choral Conducting 50.0906 2 0 4 0 0 6MCDI Instrumental Conducting 50.0906 1 0 3 0 0 4MEDU Music Education 13.1312 6 11 0 0 0 17MIPF Instrumental Performance 50.0903 33 0 35 0 0 68MIPW Instrumental Performance/Mult Woodwind 50.0903 1 0 1 0 0 2MKPA Collaborative Piano 50.0907 1 0 5 0 0 6MKPF Keyboard Performance 50.0907 2 0 10 0 0 12MPRS Arts Pres Live Ent Mgmt 50.9999 5 0 0 0 0 5MSJC Jazz Composition 50.0904 0 0 2 0 0 2MSJI Jazz Performance/Instrumental 50.0910 12 0 15 0 0 27MSJV Jazz Performance/Vocal 50.0910 0 0 4 0 0 4MTCP Composition 50.0904 1 0 8 0 0 9MTYP Music Therapy 51.2305 7 0 0 0 0 7MTYPE Music Therapy/Equivalency Crs 51.2305 1 0 0 0 0 1MTYPU Music Therapy/Equivalency (First Year) 51.2305 0 0 0 0 2 2MUEE Music Engineering 14.1099 9 0 0 0 0 9MUSY Musicology 50.0905 7 0 0 0 0 7MVPF Vocal Performance 50.0908 10 0 2 0 0 12MWPD Media Writing and Production 50.0904 6 0 0 0 0 6SJWR Studio Jazz Writing 50.0910 8 0 0 0 0 8VPED Vocal Pedagogy 50.0908 0 0 6 0 0 6TOTAL 130 11 100 31 2 274
Fact Book 30 Fall 2013
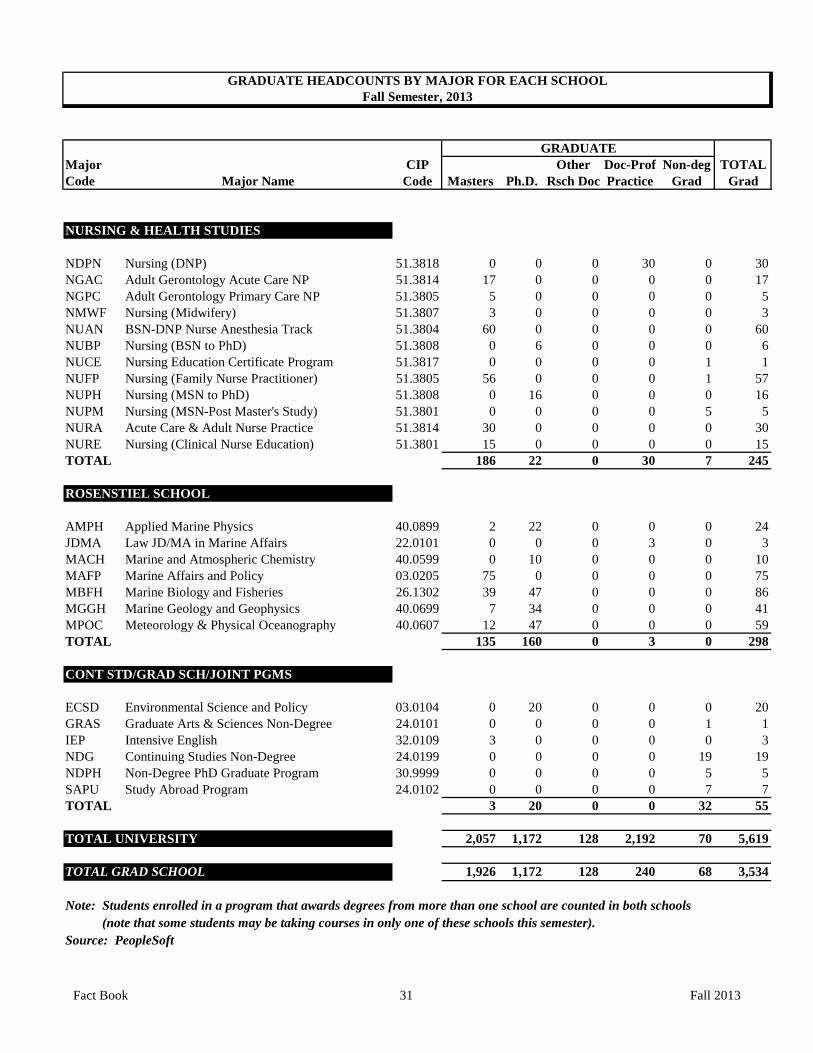
Major CIP Other Doc-Prof Non-deg TOTALCode Major Name Code Masters Ph.D. Rsch Doc Practice Grad Grad
GRADUATE
GRADUATE HEADCOUNTS BY MAJOR FOR EACH SCHOOLFall Semester, 2013
NURSING & HEALTH STUDIES
NDPN Nursing (DNP) 51.3818 0 0 0 30 0 30NGAC Adult Gerontology Acute Care NP 51.3814 17 0 0 0 0 17NGPC Adult Gerontology Primary Care NP 51.3805 5 0 0 0 0 5NMWF Nursing (Midwifery) 51.3807 3 0 0 0 0 3NUAN BSN-DNP Nurse Anesthesia Track 51.3804 60 0 0 0 0 60NUBP Nursing (BSN to PhD) 51.3808 0 6 0 0 0 6NUCE Nursing Education Certificate Program 51.3817 0 0 0 0 1 1NUFP Nursing (Family Nurse Practitioner) 51.3805 56 0 0 0 1 57NUPH Nursing (MSN to PhD) 51.3808 0 16 0 0 0 16NUPM Nursing (MSN-Post Master's Study) 51.3801 0 0 0 0 5 5NURA Acute Care & Adult Nurse Practice 51.3814 30 0 0 0 0 30NURE Nursing (Clinical Nurse Education) 51.3801 15 0 0 0 0 15TOTAL 186 22 0 30 7 245
ROSENSTIEL SCHOOL
AMPH Applied Marine Physics 40.0899 2 22 0 0 0 24JDMA Law JD/MA in Marine Affairs 22.0101 0 0 0 3 0 3MACH Marine and Atmospheric Chemistry 40.0599 0 10 0 0 0 10MAFP Marine Affairs and Policy 03.0205 75 0 0 0 0 75MBFH Marine Biology and Fisheries 26.1302 39 47 0 0 0 86MGGH Marine Geology and Geophysics 40.0699 7 34 0 0 0 41MPOC Meteorology & Physical Oceanography 40.0607 12 47 0 0 0 59TOTAL 135 160 0 3 0 298
CONT STD/GRAD SCH/JOINT PGMS
ECSD Environmental Science and Policy 03.0104 0 20 0 0 0 20GRAS Graduate Arts & Sciences Non-Degree 24.0101 0 0 0 0 1 1IEP Intensive English 32.0109 3 0 0 0 0 3NDG Continuing Studies Non-Degree 24.0199 0 0 0 0 19 19NDPH Non-Degree PhD Graduate Program 30.9999 0 0 0 0 5 5SAPU Study Abroad Program 24.0102 0 0 0 0 7 7TOTAL 3 20 0 0 32 55
TOTAL UNIVERSITY 2,057 1,172 128 2,192 70 5,619
TOTAL GRAD SCHOOL 1,926 1,172 128 240 68 3,534
Note: Students enrolled in a program that awards degrees from more than one school are counted in both schools (note that some students may be taking courses in only one of these schools this semester).Source: PeopleSoft
Fact Book 31 Fall 2013
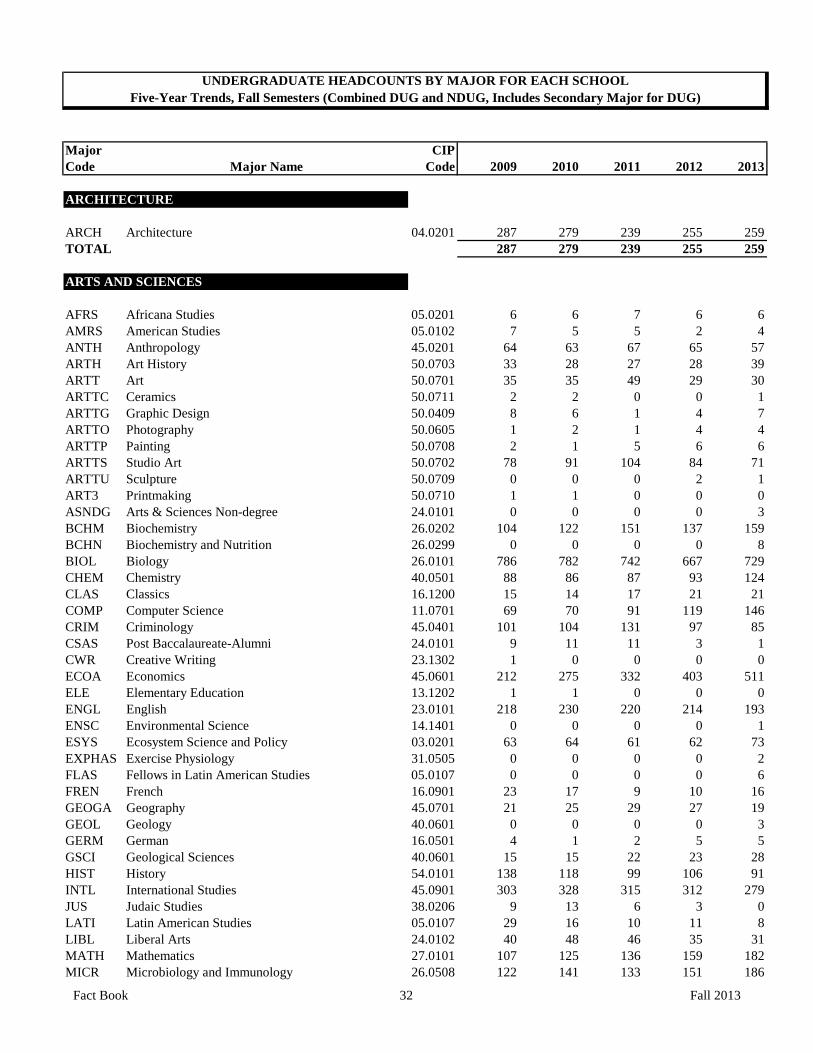
Major CIPCode Major Name Code 2009 2010 2011 2012 2013
ARCHITECTURE
ARCH Architecture 04.0201 287 279 239 255 259TOTAL 287 279 239 255 259
ARTS AND SCIENCES
AFRS Africana Studies 05.0201 6 6 7 6 6AMRS American Studies 05.0102 7 5 5 2 4ANTH Anthropology 45.0201 64 63 67 65 57ARTH Art History 50.0703 33 28 27 28 39ARTT Art 50.0701 35 35 49 29 30ARTTC Ceramics 50.0711 2 2 0 0 1ARTTG Graphic Design 50.0409 8 6 1 4 7ARTTO Photography 50.0605 1 2 1 4 4ARTTP Painting 50.0708 2 1 5 6 6ARTTS Studio Art 50.0702 78 91 104 84 71ARTTU Sculpture 50.0709 0 0 0 2 1ART3 Printmaking 50.0710 1 1 0 0 0ASNDG Arts & Sciences Non-degree 24.0101 0 0 0 0 3BCHM Biochemistry 26.0202 104 122 151 137 159BCHN Biochemistry and Nutrition 26.0299 0 0 0 0 8BIOL Biology 26.0101 786 782 742 667 729CHEM Chemistry 40.0501 88 86 87 93 124CLAS Classics 16.1200 15 14 17 21 21COMP Computer Science 11.0701 69 70 91 119 146CRIM Criminology 45.0401 101 104 131 97 85CSAS Post Baccalaureate-Alumni 24.0101 9 11 11 3 1CWR Creative Writing 23.1302 1 0 0 0 0ECOA Economics 45.0601 212 275 332 403 511ELE Elementary Education 13.1202 1 1 0 0 0ENGL English 23.0101 218 230 220 214 193ENSC Environmental Science 14.1401 0 0 0 0 1ESYS Ecosystem Science and Policy 03.0201 63 64 61 62 73EXPHAS Exercise Physiology 31.0505 0 0 0 0 2FLAS Fellows in Latin American Studies 05.0107 0 0 0 0 6FREN French 16.0901 23 17 9 10 16GEOGA Geography 45.0701 21 25 29 27 19GEOL Geology 40.0601 0 0 0 0 3GERM German 16.0501 4 1 2 5 5GSCI Geological Sciences 40.0601 15 15 22 23 28HIST History 54.0101 138 118 99 106 91INTL International Studies 45.0901 303 328 315 312 279JUS Judaic Studies 38.0206 9 13 6 3 0LATI Latin American Studies 05.0107 29 16 10 11 8LIBL Liberal Arts 24.0102 40 48 46 35 31MATH Mathematics 27.0101 107 125 136 159 182MICR Microbiology and Immunology 26.0508 122 141 133 151 186
UNDERGRADUATE HEADCOUNTS BY MAJOR FOR EACH SCHOOLFive-Year Trends, Fall Semesters (Combined DUG and NDUG, Includes Secondary Major for DUG)
Fact Book 32 Fall 2013
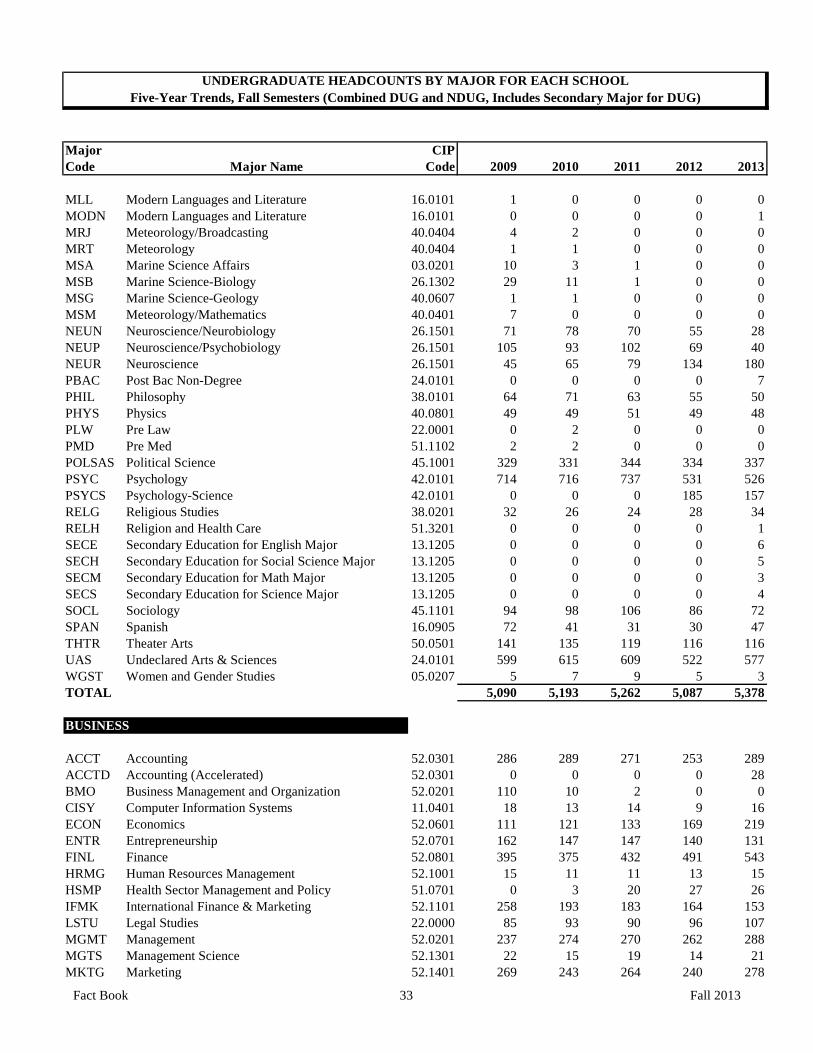
Major CIPCode Major Name Code 2009 2010 2011 2012 2013
UNDERGRADUATE HEADCOUNTS BY MAJOR FOR EACH SCHOOLFive-Year Trends, Fall Semesters (Combined DUG and NDUG, Includes Secondary Major for DUG)
MLL Modern Languages and Literature 16.0101 1 0 0 0 0MODN Modern Languages and Literature 16.0101 0 0 0 0 1MRJ Meteorology/Broadcasting 40.0404 4 2 0 0 0MRT Meteorology 40.0404 1 1 0 0 0MSA Marine Science Affairs 03.0201 10 3 1 0 0MSB Marine Science-Biology 26.1302 29 11 1 0 0MSG Marine Science-Geology 40.0607 1 1 0 0 0MSM Meteorology/Mathematics 40.0401 7 0 0 0 0NEUN Neuroscience/Neurobiology 26.1501 71 78 70 55 28NEUP Neuroscience/Psychobiology 26.1501 105 93 102 69 40NEUR Neuroscience 26.1501 45 65 79 134 180PBAC Post Bac Non-Degree 24.0101 0 0 0 0 7PHIL Philosophy 38.0101 64 71 63 55 50PHYS Physics 40.0801 49 49 51 49 48PLW Pre Law 22.0001 0 2 0 0 0PMD Pre Med 51.1102 2 2 0 0 0POLSAS Political Science 45.1001 329 331 344 334 337PSYC Psychology 42.0101 714 716 737 531 526PSYCS Psychology-Science 42.0101 0 0 0 185 157RELG Religious Studies 38.0201 32 26 24 28 34RELH Religion and Health Care 51.3201 0 0 0 0 1SECE Secondary Education for English Major 13.1205 0 0 0 0 6SECH Secondary Education for Social Science Major 13.1205 0 0 0 0 5SECM Secondary Education for Math Major 13.1205 0 0 0 0 3SECS Secondary Education for Science Major 13.1205 0 0 0 0 4SOCL Sociology 45.1101 94 98 106 86 72SPAN Spanish 16.0905 72 41 31 30 47THTR Theater Arts 50.0501 141 135 119 116 116UAS Undeclared Arts & Sciences 24.0101 599 615 609 522 577WGST Women and Gender Studies 05.0207 5 7 9 5 3TOTAL 5,090 5,193 5,262 5,087 5,378
BUSINESS
ACCT Accounting 52.0301 286 289 271 253 289ACCTD Accounting (Accelerated) 52.0301 0 0 0 0 28BMO Business Management and Organization 52.0201 110 10 2 0 0CISY Computer Information Systems 11.0401 18 13 14 9 16ECON Economics 52.0601 111 121 133 169 219ENTR Entrepreneurship 52.0701 162 147 147 140 131FINL Finance 52.0801 395 375 432 491 543HRMG Human Resources Management 52.1001 15 11 11 13 15HSMP Health Sector Management and Policy 51.0701 0 3 20 27 26IFMK International Finance & Marketing 52.1101 258 193 183 164 153LSTU Legal Studies 22.0000 85 93 90 96 107MGMT Management 52.0201 237 274 270 262 288MGTS Management Science 52.1301 22 15 19 14 21MKTG Marketing 52.1401 269 243 264 240 278
Fact Book 33 Fall 2013
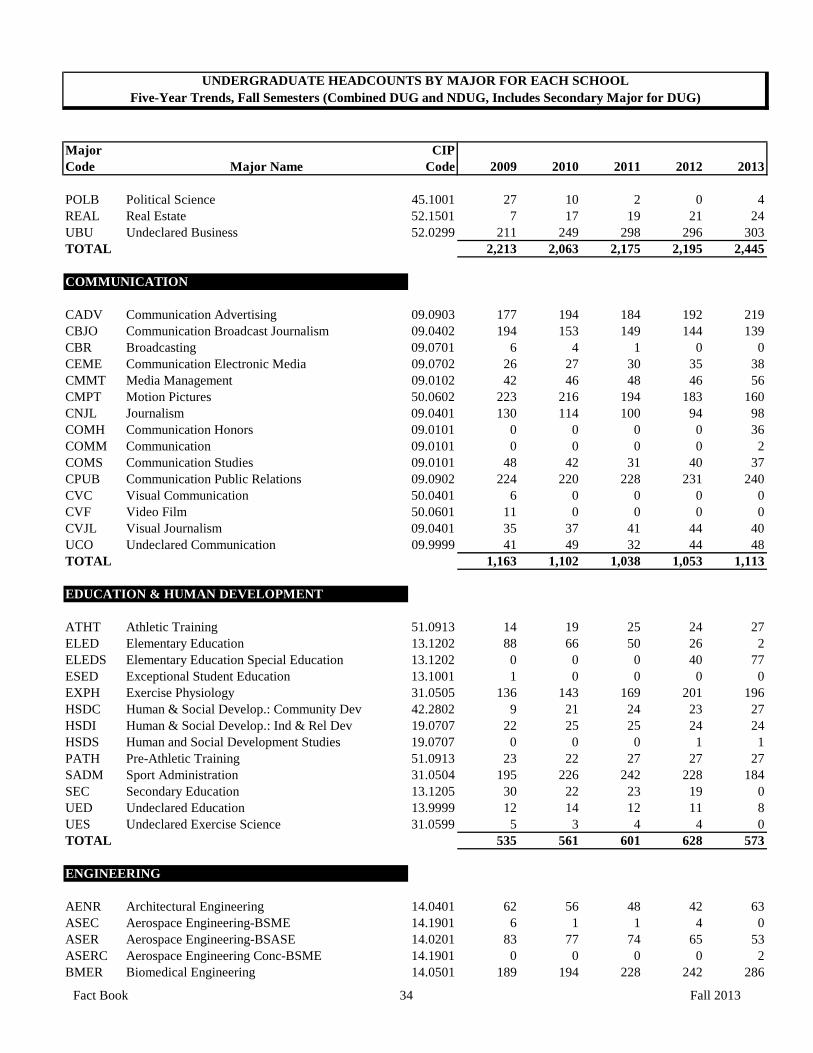
Major CIPCode Major Name Code 2009 2010 2011 2012 2013
UNDERGRADUATE HEADCOUNTS BY MAJOR FOR EACH SCHOOLFive-Year Trends, Fall Semesters (Combined DUG and NDUG, Includes Secondary Major for DUG)
POLB Political Science 45.1001 27 10 2 0 4REAL Real Estate 52.1501 7 17 19 21 24UBU Undeclared Business 52.0299 211 249 298 296 303TOTAL 2,213 2,063 2,175 2,195 2,445
COMMUNICATION
CADV Communication Advertising 09.0903 177 194 184 192 219CBJO Communication Broadcast Journalism 09.0402 194 153 149 144 139CBR Broadcasting 09.0701 6 4 1 0 0CEME Communication Electronic Media 09.0702 26 27 30 35 38CMMT Media Management 09.0102 42 46 48 46 56CMPT Motion Pictures 50.0602 223 216 194 183 160CNJL Journalism 09.0401 130 114 100 94 98COMH Communication Honors 09.0101 0 0 0 0 36COMM Communication 09.0101 0 0 0 0 2COMS Communication Studies 09.0101 48 42 31 40 37CPUB Communication Public Relations 09.0902 224 220 228 231 240CVC Visual Communication 50.0401 6 0 0 0 0CVF Video Film 50.0601 11 0 0 0 0CVJL Visual Journalism 09.0401 35 37 41 44 40UCO Undeclared Communication 09.9999 41 49 32 44 48TOTAL 1,163 1,102 1,038 1,053 1,113
EDUCATION & HUMAN DEVELOPMENT
ATHT Athletic Training 51.0913 14 19 25 24 27ELED Elementary Education 13.1202 88 66 50 26 2ELEDS Elementary Education Special Education 13.1202 0 0 0 40 77ESED Exceptional Student Education 13.1001 1 0 0 0 0EXPH Exercise Physiology 31.0505 136 143 169 201 196HSDC Human & Social Develop.: Community Dev 42.2802 9 21 24 23 27HSDI Human & Social Develop.: Ind & Rel Dev 19.0707 22 25 25 24 24HSDS Human and Social Development Studies 19.0707 0 0 0 1 1PATH Pre-Athletic Training 51.0913 23 22 27 27 27SADM Sport Administration 31.0504 195 226 242 228 184SEC Secondary Education 13.1205 30 22 23 19 0UED Undeclared Education 13.9999 12 14 12 11 8UES Undeclared Exercise Science 31.0599 5 3 4 4 0TOTAL 535 561 601 628 573
ENGINEERING
AENR Architectural Engineering 14.0401 62 56 48 42 63ASEC Aerospace Engineering-BSME 14.1901 6 1 1 4 0ASER Aerospace Engineering-BSASE 14.0201 83 77 74 65 53ASERC Aerospace Engineering Conc-BSME 14.1901 0 0 0 0 2BMER Biomedical Engineering 14.0501 189 194 228 242 286
Fact Book 34 Fall 2013
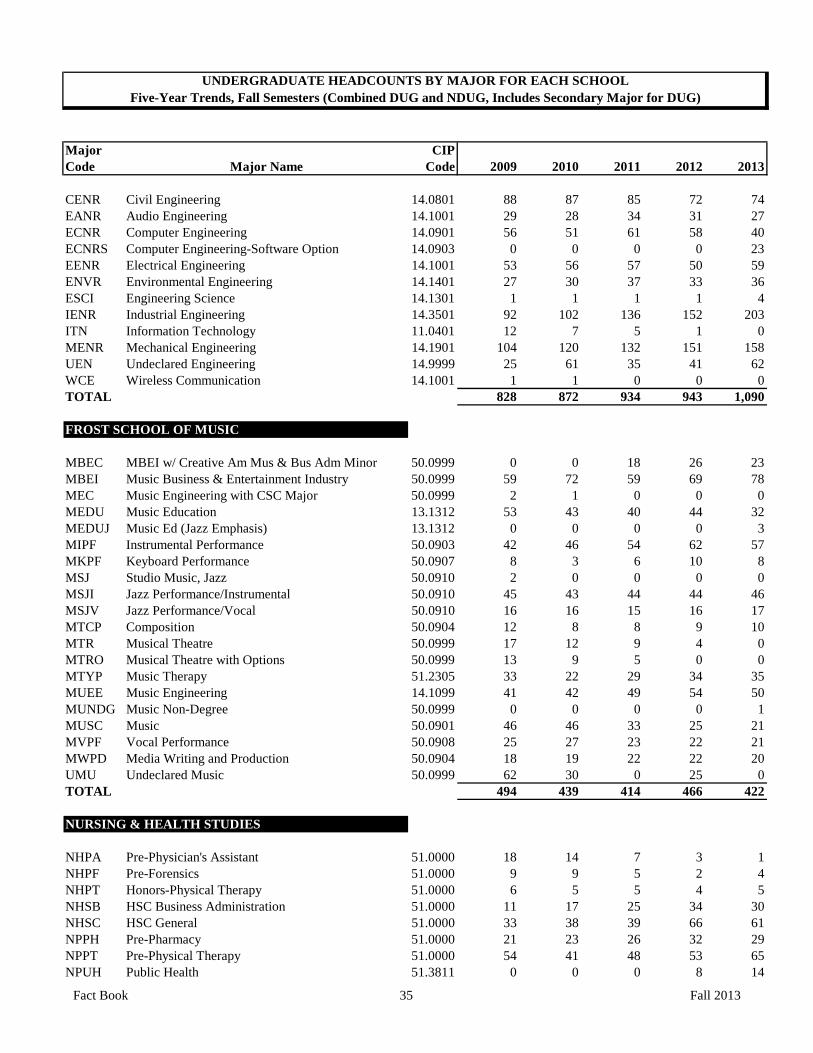
Major CIPCode Major Name Code 2009 2010 2011 2012 2013
UNDERGRADUATE HEADCOUNTS BY MAJOR FOR EACH SCHOOLFive-Year Trends, Fall Semesters (Combined DUG and NDUG, Includes Secondary Major for DUG)
CENR Civil Engineering 14.0801 88 87 85 72 74EANR Audio Engineering 14.1001 29 28 34 31 27ECNR Computer Engineering 14.0901 56 51 61 58 40ECNRS Computer Engineering-Software Option 14.0903 0 0 0 0 23EENR Electrical Engineering 14.1001 53 56 57 50 59ENVR Environmental Engineering 14.1401 27 30 37 33 36ESCI Engineering Science 14.1301 1 1 1 1 4IENR Industrial Engineering 14.3501 92 102 136 152 203ITN Information Technology 11.0401 12 7 5 1 0MENR Mechanical Engineering 14.1901 104 120 132 151 158UEN Undeclared Engineering 14.9999 25 61 35 41 62WCE Wireless Communication 14.1001 1 1 0 0 0TOTAL 828 872 934 943 1,090
FROST SCHOOL OF MUSIC
MBEC MBEI w/ Creative Am Mus & Bus Adm Minor 50.0999 0 0 18 26 23MBEI Music Business & Entertainment Industry 50.0999 59 72 59 69 78MEC Music Engineering with CSC Major 50.0999 2 1 0 0 0MEDU Music Education 13.1312 53 43 40 44 32MEDUJ Music Ed (Jazz Emphasis) 13.1312 0 0 0 0 3MIPF Instrumental Performance 50.0903 42 46 54 62 57MKPF Keyboard Performance 50.0907 8 3 6 10 8MSJ Studio Music, Jazz 50.0910 2 0 0 0 0MSJI Jazz Performance/Instrumental 50.0910 45 43 44 44 46MSJV Jazz Performance/Vocal 50.0910 16 16 15 16 17MTCP Composition 50.0904 12 8 8 9 10MTR Musical Theatre 50.0999 17 12 9 4 0MTRO Musical Theatre with Options 50.0999 13 9 5 0 0MTYP Music Therapy 51.2305 33 22 29 34 35MUEE Music Engineering 14.1099 41 42 49 54 50MUNDG Music Non-Degree 50.0999 0 0 0 0 1MUSC Music 50.0901 46 46 33 25 21MVPF Vocal Performance 50.0908 25 27 23 22 21MWPD Media Writing and Production 50.0904 18 19 22 22 20UMU Undeclared Music 50.0999 62 30 0 25 0TOTAL 494 439 414 466 422
NURSING & HEALTH STUDIES
NHPA Pre-Physician's Assistant 51.0000 18 14 7 3 1NHPF Pre-Forensics 51.0000 9 9 5 2 4NHPT Honors-Physical Therapy 51.0000 6 5 5 4 5NHSB HSC Business Administration 51.0000 11 17 25 34 30NHSC HSC General 51.0000 33 38 39 66 61NPPH Pre-Pharmacy 51.0000 21 23 26 32 29NPPT Pre-Physical Therapy 51.0000 54 41 48 53 65NPUH Public Health 51.3811 0 0 0 8 14
Fact Book 35 Fall 2013

Major CIPCode Major Name Code 2009 2010 2011 2012 2013
UNDERGRADUATE HEADCOUNTS BY MAJOR FOR EACH SCHOOLFive-Year Trends, Fall Semesters (Combined DUG and NDUG, Includes Secondary Major for DUG)
NUA Nursing 51.1601 0 0 0 74 0NUAP Nursing (BSN-Accelerated Program) 51.3801 104 134 76 72 136NUB Nursing (BSN-Second Degree/2 Years) 51.3801 0 0 0 0 1NUBS Nursing (BSN-Basic) 51.3801 160 164 170 157 170NUB2 Nursing (BSN-Second Degree/2 Years) 51.3801 3 5 10 3 0NUFM BSN (Florida Memorial Univ) 51.3801 2 4 3 1 0NURN Nursing (RN/BSN-Transtional/Weekend) 51.3801 2 11 2 8 13NUST Nursing (BSN-St.Thomas University) 51.3801 10 10 11 9 5TOTAL 433 475 427 526 534
ROSENSTIEL SCHOOL
RSM Marine Science-General 26.9999 0 0 0 2 0RSMA Marine Affairs 03.0201 48 56 63 70 67RSMB Marine Science-Biology 26.1302 173 214 257 263 260RSMC Marine Science-Chemistry 40.0607 1 2 4 9 9RSMG Marine Science-Geological Science 40.0699 5 9 11 14 15RSMI Marine Science-Computer Science 11.0701 0 0 1 2 2RSMM Meteorology 40.0404 18 24 20 20 25RSMP Marine Science-Physics 40.0607 1 2 1 3 4RSMT Meteorology/Mathematics 40.0401 5 9 13 14 10RSMX Marine Science 40.0607 0 0 0 0 1TOTAL 251 316 370 397 393
CONT STD/GRAD SCH/JOINT PGMS
BGSC General Studies 24.0102 207 201 199 142 171BGSN General Studies-Non TR 24.0102 0 0 0 30 14BWOB Brazil Without Borders 24.0199 0 0 0 5 0CCPA Credit Certificate Program-Accounting 52.0302 6 2 3 3 4CCPB Credit Certificate Program-General Business 52.0201 1 0 1 0 0CCPC Credit Certificate Program-Computer Inf System 11.0401 7 1 1 0 0CCPH Credit Certificate Program-Human Resources 52.1001 2 1 0 0 0CCPI Credit Certificate Program-Intl Business 52.1101 1 1 1 0 0CCPR Credit Certificate Program-Art History 24.0199 0 0 0 0 1CCPR Credit Certificate Program-Art History 50.0703 1 0 1 0 0CSA Continuing Studies-Alumni 24.0199 5 7 7 9 10CSNDG Continuing Studies Non-degree 24.0199 0 0 0 0 2IEP Intensive English 32.0109 0 0 0 0 17IMG Img Academies-Bradenton Campus 32.0109 48 44 0 0 0JUD Pre-Freshmen Judaic Studies 38.0206 0 0 0 1 3MIAE Miami Semester in Audio Engineering 14.1001 0 1 0 0 0MIAI Miami Semester in Int'l Finance & Marketing 52.1101 0 0 0 0 1SAPU Study Abroad Program 24.0102 167 206 187 154 121SSO Summer Sessions Only/Non-Degree 24.0199 0 0 0 0 2UCT Non-Degree 24.0199 51 40 39 27 40UCX Post Bac/Non-Degree 24.0199 92 70 72 41 55UHG Unclassified-High School/Gulliver 24.0199 4 4 1 1 3
Fact Book 36 Fall 2013
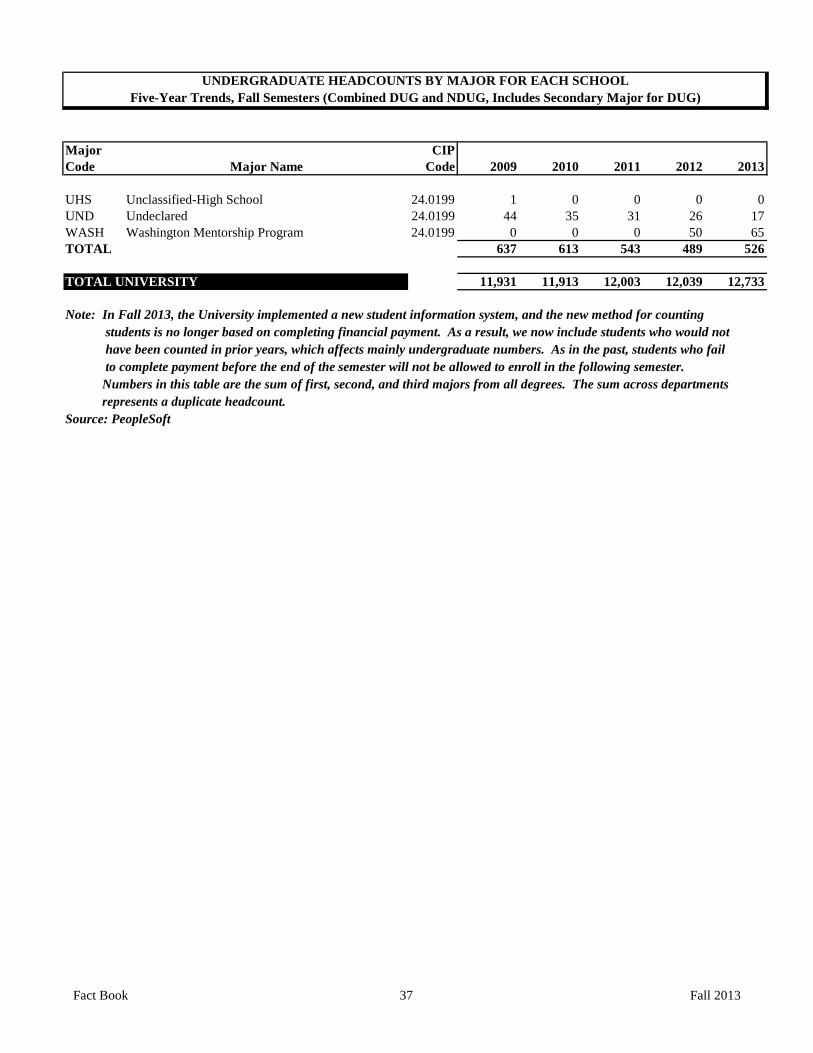
Major CIPCode Major Name Code 2009 2010 2011 2012 2013
UNDERGRADUATE HEADCOUNTS BY MAJOR FOR EACH SCHOOLFive-Year Trends, Fall Semesters (Combined DUG and NDUG, Includes Secondary Major for DUG)
UHS Unclassified-High School 24.0199 1 0 0 0 0UND Undeclared 24.0199 44 35 31 26 17WASH Washington Mentorship Program 24.0199 0 0 0 50 65TOTAL 637 613 543 489 526
TOTAL UNIVERSITY 11,931 11,913 12,003 12,039 12,733
Note: In Fall 2013, the University implemented a new student information system, and the new method for counting students is no longer based on completing financial payment. As a result, we now include students who would not have been counted in prior years, which affects mainly undergraduate numbers. As in the past, students who fail to complete payment before the end of the semester will not be allowed to enroll in the following semester. Numbers in this table are the sum of first, second, and third majors from all degrees. The sum across departments represents a duplicate headcount.Source: PeopleSoft
Fact Book 37 Fall 2013
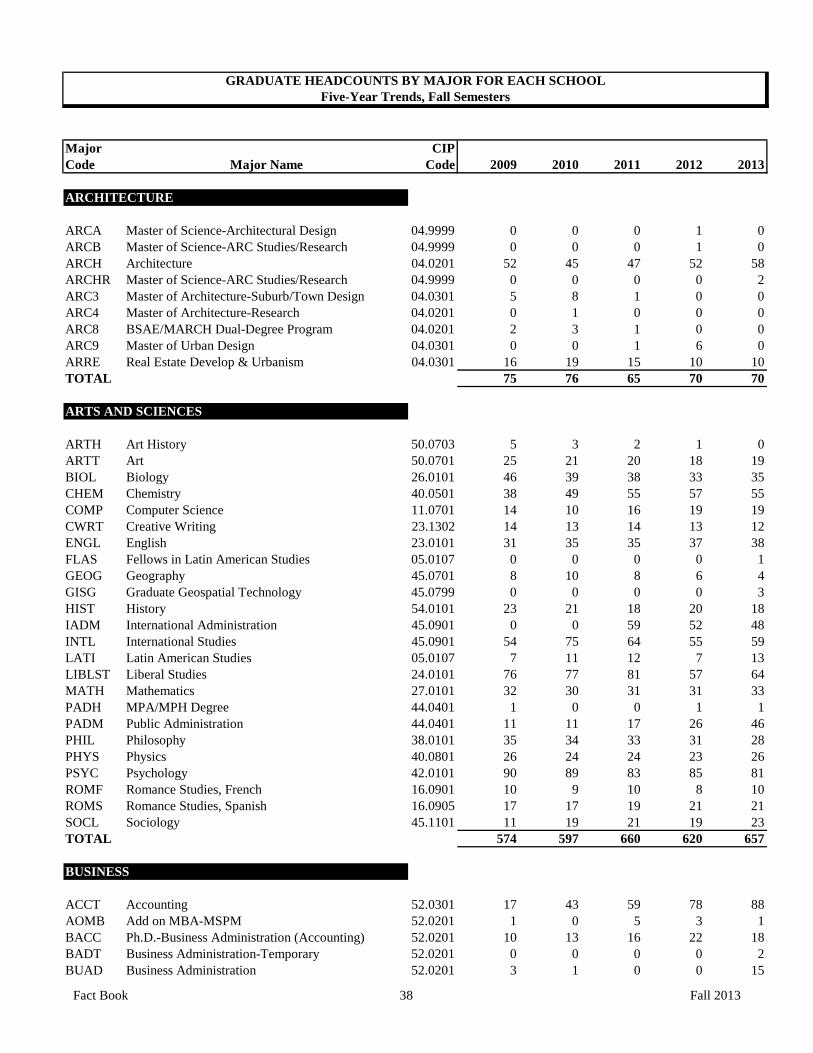
Major CIPCode Major Name Code 2009 2010 2011 2012 2013
ARCHITECTURE
ARCA Master of Science-Architectural Design 04.9999 0 0 0 1 0ARCB Master of Science-ARC Studies/Research 04.9999 0 0 0 1 0ARCH Architecture 04.0201 52 45 47 52 58ARCHR Master of Science-ARC Studies/Research 04.9999 0 0 0 0 2ARC3 Master of Architecture-Suburb/Town Design 04.0301 5 8 1 0 0ARC4 Master of Architecture-Research 04.0201 0 1 0 0 0ARC8 BSAE/MARCH Dual-Degree Program 04.0201 2 3 1 0 0ARC9 Master of Urban Design 04.0301 0 0 1 6 0ARRE Real Estate Develop & Urbanism 04.0301 16 19 15 10 10TOTAL 75 76 65 70 70
ARTS AND SCIENCES
ARTH Art History 50.0703 5 3 2 1 0ARTT Art 50.0701 25 21 20 18 19BIOL Biology 26.0101 46 39 38 33 35CHEM Chemistry 40.0501 38 49 55 57 55COMP Computer Science 11.0701 14 10 16 19 19CWRT Creative Writing 23.1302 14 13 14 13 12ENGL English 23.0101 31 35 35 37 38FLAS Fellows in Latin American Studies 05.0107 0 0 0 0 1GEOG Geography 45.0701 8 10 8 6 4GISG Graduate Geospatial Technology 45.0799 0 0 0 0 3HIST History 54.0101 23 21 18 20 18IADM International Administration 45.0901 0 0 59 52 48INTL International Studies 45.0901 54 75 64 55 59LATI Latin American Studies 05.0107 7 11 12 7 13LIBLST Liberal Studies 24.0101 76 77 81 57 64MATH Mathematics 27.0101 32 30 31 31 33PADH MPA/MPH Degree 44.0401 1 0 0 1 1PADM Public Administration 44.0401 11 11 17 26 46PHIL Philosophy 38.0101 35 34 33 31 28PHYS Physics 40.0801 26 24 24 23 26PSYC Psychology 42.0101 90 89 83 85 81ROMF Romance Studies, French 16.0901 10 9 10 8 10ROMS Romance Studies, Spanish 16.0905 17 17 19 21 21SOCL Sociology 45.1101 11 19 21 19 23TOTAL 574 597 660 620 657
BUSINESS
ACCT Accounting 52.0301 17 43 59 78 88AOMB Add on MBA-MSPM 52.0201 1 0 5 3 1BACC Ph.D.-Business Administration (Accounting) 52.0201 10 13 16 22 18BADT Business Administration-Temporary 52.0201 0 0 0 0 2BUAD Business Administration 52.0201 3 1 0 0 15
GRADUATE HEADCOUNTS BY MAJOR FOR EACH SCHOOLFive-Year Trends, Fall Semesters
Fact Book 38 Fall 2013
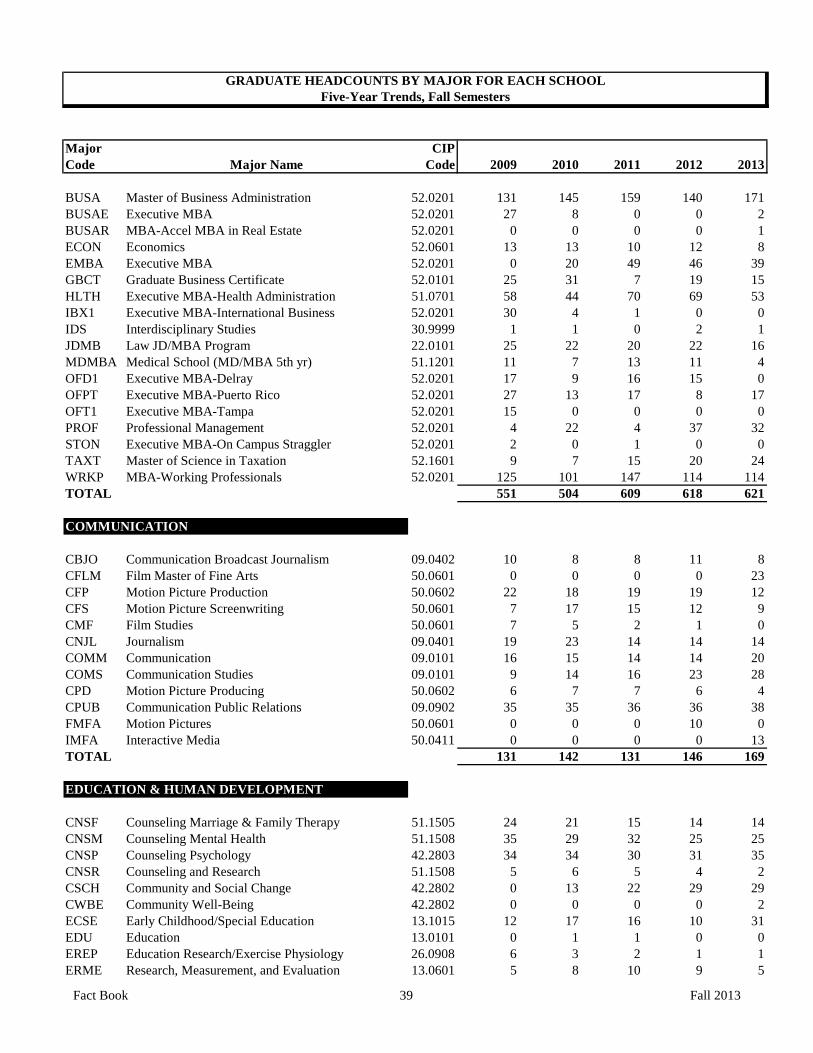
Major CIPCode Major Name Code 2009 2010 2011 2012 2013
GRADUATE HEADCOUNTS BY MAJOR FOR EACH SCHOOLFive-Year Trends, Fall Semesters
BUSA Master of Business Administration 52.0201 131 145 159 140 171BUSAE Executive MBA 52.0201 27 8 0 0 2BUSAR MBA-Accel MBA in Real Estate 52.0201 0 0 0 0 1ECON Economics 52.0601 13 13 10 12 8EMBA Executive MBA 52.0201 0 20 49 46 39GBCT Graduate Business Certificate 52.0101 25 31 7 19 15HLTH Executive MBA-Health Administration 51.0701 58 44 70 69 53IBX1 Executive MBA-International Business 52.0201 30 4 1 0 0IDS Interdisciplinary Studies 30.9999 1 1 0 2 1JDMB Law JD/MBA Program 22.0101 25 22 20 22 16MDMBA Medical School (MD/MBA 5th yr) 51.1201 11 7 13 11 4OFD1 Executive MBA-Delray 52.0201 17 9 16 15 0OFPT Executive MBA-Puerto Rico 52.0201 27 13 17 8 17OFT1 Executive MBA-Tampa 52.0201 15 0 0 0 0PROF Professional Management 52.0201 4 22 4 37 32STON Executive MBA-On Campus Straggler 52.0201 2 0 1 0 0TAXT Master of Science in Taxation 52.1601 9 7 15 20 24WRKP MBA-Working Professionals 52.0201 125 101 147 114 114TOTAL 551 504 609 618 621
COMMUNICATION
CBJO Communication Broadcast Journalism 09.0402 10 8 8 11 8CFLM Film Master of Fine Arts 50.0601 0 0 0 0 23CFP Motion Picture Production 50.0602 22 18 19 19 12CFS Motion Picture Screenwriting 50.0601 7 17 15 12 9CMF Film Studies 50.0601 7 5 2 1 0CNJL Journalism 09.0401 19 23 14 14 14COMM Communication 09.0101 16 15 14 14 20COMS Communication Studies 09.0101 9 14 16 23 28CPD Motion Picture Producing 50.0602 6 7 7 6 4CPUB Communication Public Relations 09.0902 35 35 36 36 38FMFA Motion Pictures 50.0601 0 0 0 10 0IMFA Interactive Media 50.0411 0 0 0 0 13TOTAL 131 142 131 146 169
EDUCATION & HUMAN DEVELOPMENT
CNSF Counseling Marriage & Family Therapy 51.1505 24 21 15 14 14CNSM Counseling Mental Health 51.1508 35 29 32 25 25CNSP Counseling Psychology 42.2803 34 34 30 31 35CNSR Counseling and Research 51.1508 5 6 5 4 2CSCH Community and Social Change 42.2802 0 13 22 29 29CWBE Community Well-Being 42.2802 0 0 0 0 2ECSE Early Childhood/Special Education 13.1015 12 17 16 10 31EDU Education 13.0101 0 1 1 0 0EREP Education Research/Exercise Physiology 26.0908 6 3 2 1 1ERME Research, Measurement, and Evaluation 13.0601 5 8 10 9 5
Fact Book 39 Fall 2013

Major CIPCode Major Name Code 2009 2010 2011 2012 2013
GRADUATE HEADCOUNTS BY MAJOR FOR EACH SCHOOLFive-Year Trends, Fall Semesters
ESEM Except Student Ed/Pre-K Disabilities 13.1015 1 0 0 0 0ESOC Education and Social Change 13.1206 0 29 16 39 26EXPH Exercise Physiology 26.0908 16 30 28 30 32EXSC Exercise Physiology-Strength & Conditioning 26.0908 0 3 8 20 25HEEC Certificate in Enrollment Management 13.0406 1 2 1 0 1HEEM Higher Education/Enrollment Management 13.0406 8 7 6 6 6HELD Higher Education Leadership 13.0406 7 7 24 30 27HESC Higher Ed/Stud Life/Develop Certificate 13.0406 2 3 0 1 1HESD Higher Education/Student Life & Development 13.0406 11 12 8 15 19PTOG Professional Training Option Certificate 13.0101 3 1 0 0 0SADM Sport Administration 31.0504 31 27 29 24 26SMD Sports Medicine 26.0908 3 3 5 2 0SPEC Miami Spec Workshop 13.9999 16 0 0 0 0TALP Teaching and Learning 13.0404 30 26 19 20 24TCM1 Math Science Technology Resource Teacher 13.1311 1 0 0 0 0TFAW Teach for America Workshop 13.1206 76 22 74 0 0WKSP Workshop 13.0101 29 27 0 0 1WOHC Women's Health Certificate 13.1327 0 0 0 1 0TOTAL 356 331 351 311 332
ENGINEERING
AENR Architectural Engineering 14.0401 2 0 4 1 1BMER Biomedical Engineering 14.0501 52 53 62 77 76CENR Civil Engineering 14.0801 29 23 20 23 32ECER Electrical and Computer Engineering 14.1001 38 40 40 48 61ERGO Ergonomics 15.1501 4 3 3 3 2EVH Environmental Health and Safety 14.1401 0 0 0 1 0IDS Interdisciplinary Studies 30.9999 1 0 2 0 0IENR Industrial Engineering 14.3501 51 38 43 47 47MENR Mechanical Engineering 14.1901 22 23 31 28 30MTECEN Management of Technology 15.1501 14 13 11 11 9OEST Occupational Ergonomics & Safety 15.1501 0 0 0 0 1PMC Project Management Certificate 15.1501 2 1 0 0 0TOTAL 215 194 216 239 259
LAW
CBTD Taxation of Cross-Border Investment 22.0211 0 0 0 0 1CML Comparative Law 22.0202 12 3 0 0 0EPLW Estate Planning 22.0299 26 22 22 20 17IAM Inter-American Law 22.0209 1 0 0 0 0INTLW International Law 22.0209 44 74 52 66 62JDCO Law JD/MA Program 22.0101 0 0 15 10 4JDIB Law JD/LLM International Law-Arbitration 22.0101 0 0 0 0 1JDIL Law JD/LLM International Law Program 22.0101 0 0 4 0 0JDMA Law JD/MA in Marine Affairs 22.0101 1 2 1 3 3JDMB Law JD/MBA Program 22.0101 27 25 23 23 20
Fact Book 40 Fall 2013

Major CIPCode Major Name Code 2009 2010 2011 2012 2013
GRADUATE HEADCOUNTS BY MAJOR FOR EACH SCHOOLFive-Year Trends, Fall Semesters
JDMM Law JD/MM Program 22.0101 0 10 56 51 31JDMP Law JD/MPH Program 22.0101 0 0 3 4 3JDMT JD/MBA/LLM in Tax (Triple Degree) 22.0101 0 0 0 0 1JDOC Law JD/LLM Ocean & Coastal Program 22.0101 0 0 0 0 1JDPA Law JD/MPA Program 22.0101 0 0 0 0 4JDRE Law JD/LLM Real Estate Program 22.0101 0 0 7 3 1JDRP Law JD/LLM Real Property Program 22.0101 1 1 0 0 3JDSC JD/MSED Law, Comm, Social Change 22.0101 0 0 0 0 1JDTX Law JD/LLM Tax Program 22.0101 13 3 25 15 21LAW Law Non-degree 22.0101 0 0 0 0 2LAWJ Law 22.0101 1,343 1,313 1,227 1,211 1,080OCLW Ocean and Coastal Law 22.0207 2 4 1 1 4RELW Real Property 22.0299 27 24 19 25 14RPDL Real Property (Distance Learning) 22.0299 0 0 0 0 14TAXL Tax 22.0211 23 24 19 29 19TOTAL 1,520 1,505 1,474 1,461 1,307
MILLER SCHOOL OF MEDICINE
BCHM Biochemistry 26.0202 34 26 30 29 0BCHMG Biochemistry and Molecular Biology 26.0202 0 0 0 0 32BSTS Biostatistics 26.1102 0 0 1 7 10CABL Cancer Biology 26.0911 24 34 36 39 34CTIN Clinical and Translational Investigation 51.1401 0 0 0 7 2EPID Epidemiology 26.1309 61 67 97 124 153HUGG Human Genetics and Genomics 26.0806 2 7 13 17 19IBMS Interdisciplinary Biomedical Studies 26.9999 11 2 1 0 0IDS Interdisciplinary Studies 30.9999 1 1 1 0 0JDMP Law JD/MPH Program 22.0101 0 0 3 4 3MCDB Molecular Cell & Developmental Biology 26.0401 17 16 15 10 12MCPH Molecular and Cellular Pharmacology 26.1001 25 21 25 25 30MDDR Medical School (MD Program) 51.1201 584 571 580 579 583MDMBA Medical School (MD/MBA 5th yr) 51.1201 11 17 20 24 14MDMPH Medical School (MD/MPH Program) 51.1201 0 0 52 99 152MDMS Medical School (MD/MS Program) 51.1201 0 0 0 0 5MDPB Post-Baccalaureate 26.9999 0 0 1 1 0MDPHD Medical School (MD/PhD Program) 51.1201 15 19 17 22 21MDRF Medical School (MD Program/FAU Campus) 51.1201 127 120 87 41 0MDRH Medical School (MD/MPH Program) 51.1201 0 0 2 1 0MICM Microbiology and Immunology 26.0508 24 21 26 26 25MPH Master in Public Health 51.2201 0 0 0 1 1NEURG Neuroscience 26.1501 27 26 25 31 31PADH MPA/MPH Degree 44.0401 1 0 0 1 1PHGC Public Health Graduate Certificate Program 51.2207 0 1 1 0 2PHSB Physiology and Biophysics 26.0901 8 6 4 5 3PIBS Program in Biomedical Sciences 26.0102 38 42 49 44 35PTEP Physical Therapy 51.2308 154 160 155 157 164TOTAL 1,164 1,157 1,241 1,294 1,332
Fact Book 41 Fall 2013
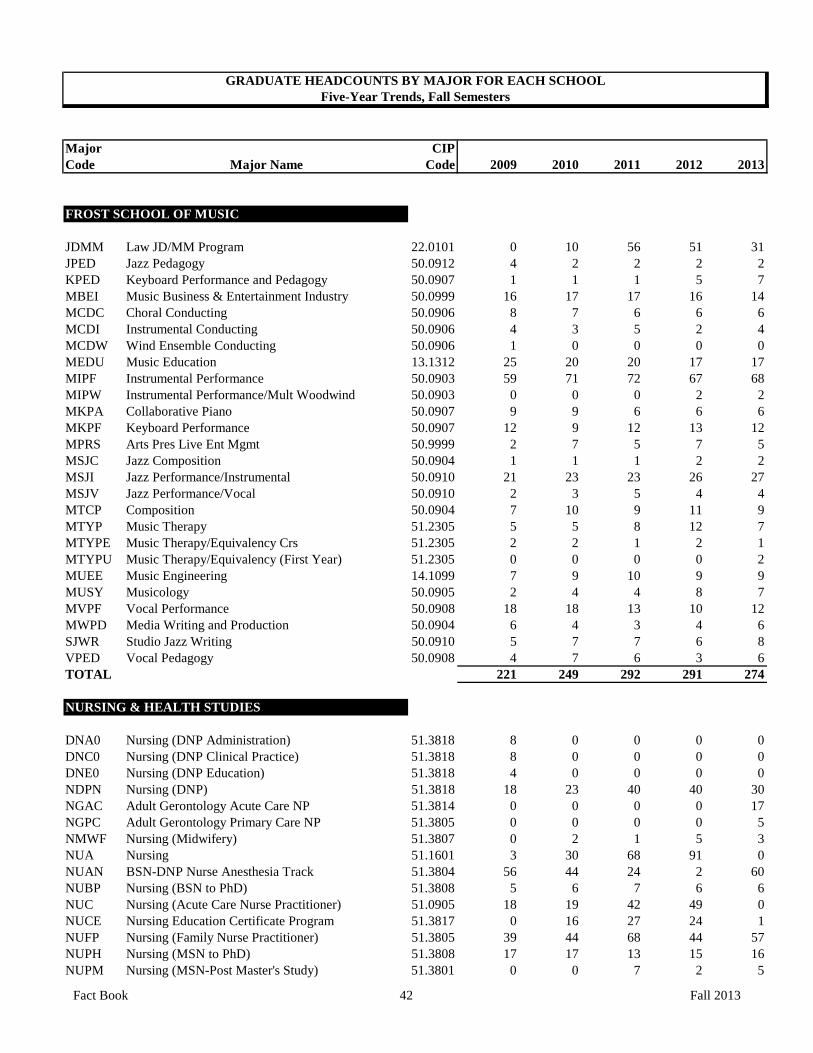
Major CIPCode Major Name Code 2009 2010 2011 2012 2013
GRADUATE HEADCOUNTS BY MAJOR FOR EACH SCHOOLFive-Year Trends, Fall Semesters
FROST SCHOOL OF MUSIC
JDMM Law JD/MM Program 22.0101 0 10 56 51 31JPED Jazz Pedagogy 50.0912 4 2 2 2 2KPED Keyboard Performance and Pedagogy 50.0907 1 1 1 5 7MBEI Music Business & Entertainment Industry 50.0999 16 17 17 16 14MCDC Choral Conducting 50.0906 8 7 6 6 6MCDI Instrumental Conducting 50.0906 4 3 5 2 4MCDW Wind Ensemble Conducting 50.0906 1 0 0 0 0MEDU Music Education 13.1312 25 20 20 17 17MIPF Instrumental Performance 50.0903 59 71 72 67 68MIPW Instrumental Performance/Mult Woodwind 50.0903 0 0 0 2 2MKPA Collaborative Piano 50.0907 9 9 6 6 6MKPF Keyboard Performance 50.0907 12 9 12 13 12MPRS Arts Pres Live Ent Mgmt 50.9999 2 7 5 7 5MSJC Jazz Composition 50.0904 1 1 1 2 2MSJI Jazz Performance/Instrumental 50.0910 21 23 23 26 27MSJV Jazz Performance/Vocal 50.0910 2 3 5 4 4MTCP Composition 50.0904 7 10 9 11 9MTYP Music Therapy 51.2305 5 5 8 12 7MTYPE Music Therapy/Equivalency Crs 51.2305 2 2 1 2 1MTYPU Music Therapy/Equivalency (First Year) 51.2305 0 0 0 0 2MUEE Music Engineering 14.1099 7 9 10 9 9MUSY Musicology 50.0905 2 4 4 8 7MVPF Vocal Performance 50.0908 18 18 13 10 12MWPD Media Writing and Production 50.0904 6 4 3 4 6SJWR Studio Jazz Writing 50.0910 5 7 7 6 8VPED Vocal Pedagogy 50.0908 4 7 6 3 6TOTAL 221 249 292 291 274
NURSING & HEALTH STUDIES
DNA0 Nursing (DNP Administration) 51.3818 8 0 0 0 0DNC0 Nursing (DNP Clinical Practice) 51.3818 8 0 0 0 0DNE0 Nursing (DNP Education) 51.3818 4 0 0 0 0NDPN Nursing (DNP) 51.3818 18 23 40 40 30NGAC Adult Gerontology Acute Care NP 51.3814 0 0 0 0 17NGPC Adult Gerontology Primary Care NP 51.3805 0 0 0 0 5NMWF Nursing (Midwifery) 51.3807 0 2 1 5 3NUA Nursing 51.1601 3 30 68 91 0NUAN BSN-DNP Nurse Anesthesia Track 51.3804 56 44 24 2 60NUBP Nursing (BSN to PhD) 51.3808 5 6 7 6 6NUC Nursing (Acute Care Nurse Practitioner) 51.0905 18 19 42 49 0NUCE Nursing Education Certificate Program 51.3817 0 16 27 24 1NUFP Nursing (Family Nurse Practitioner) 51.3805 39 44 68 44 57NUPH Nursing (MSN to PhD) 51.3808 17 17 13 15 16NUPM Nursing (MSN-Post Master's Study) 51.3801 0 0 7 2 5
Fact Book 42 Fall 2013
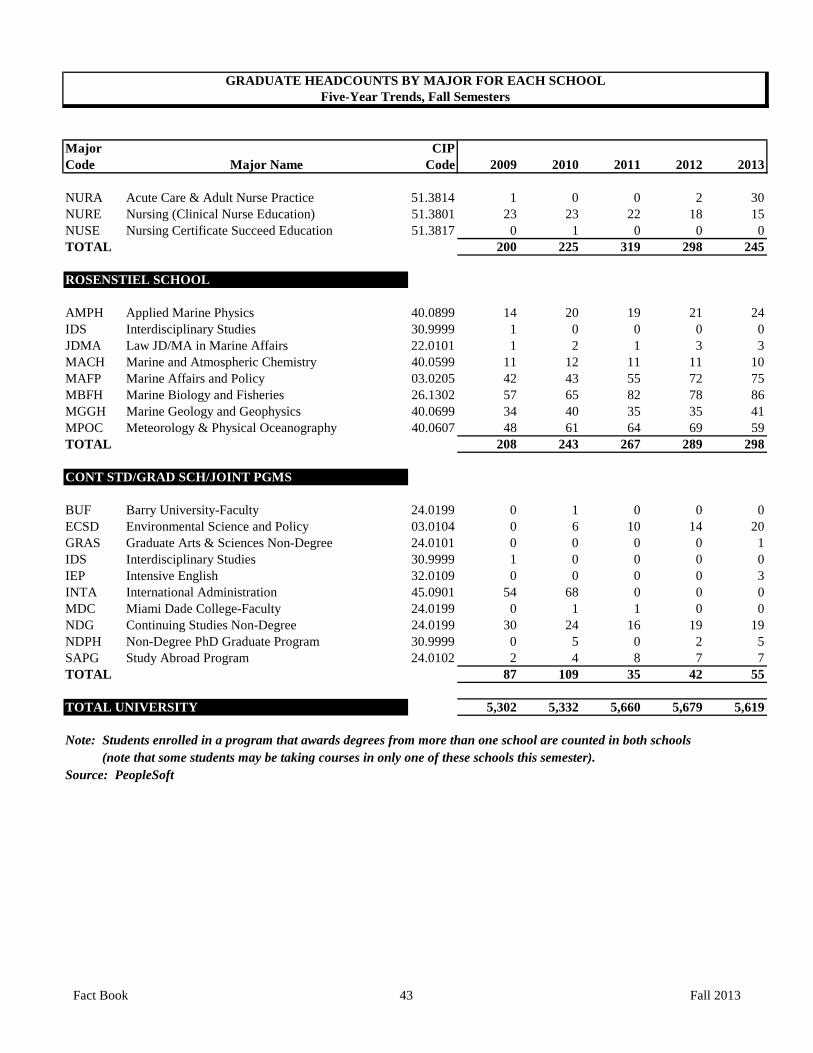
Major CIPCode Major Name Code 2009 2010 2011 2012 2013
GRADUATE HEADCOUNTS BY MAJOR FOR EACH SCHOOLFive-Year Trends, Fall Semesters
NURA Acute Care & Adult Nurse Practice 51.3814 1 0 0 2 30NURE Nursing (Clinical Nurse Education) 51.3801 23 23 22 18 15NUSE Nursing Certificate Succeed Education 51.3817 0 1 0 0 0TOTAL 200 225 319 298 245
ROSENSTIEL SCHOOL
AMPH Applied Marine Physics 40.0899 14 20 19 21 24IDS Interdisciplinary Studies 30.9999 1 0 0 0 0JDMA Law JD/MA in Marine Affairs 22.0101 1 2 1 3 3MACH Marine and Atmospheric Chemistry 40.0599 11 12 11 11 10MAFP Marine Affairs and Policy 03.0205 42 43 55 72 75MBFH Marine Biology and Fisheries 26.1302 57 65 82 78 86MGGH Marine Geology and Geophysics 40.0699 34 40 35 35 41MPOC Meteorology & Physical Oceanography 40.0607 48 61 64 69 59TOTAL 208 243 267 289 298
CONT STD/GRAD SCH/JOINT PGMS
BUF Barry University-Faculty 24.0199 0 1 0 0 0ECSD Environmental Science and Policy 03.0104 0 6 10 14 20GRAS Graduate Arts & Sciences Non-Degree 24.0101 0 0 0 0 1IDS Interdisciplinary Studies 30.9999 1 0 0 0 0IEP Intensive English 32.0109 0 0 0 0 3INTA International Administration 45.0901 54 68 0 0 0MDC Miami Dade College-Faculty 24.0199 0 1 1 0 0NDG Continuing Studies Non-Degree 24.0199 30 24 16 19 19NDPH Non-Degree PhD Graduate Program 30.9999 0 5 0 2 5SAPG Study Abroad Program 24.0102 2 4 8 7 7TOTAL 87 109 35 42 55
TOTAL UNIVERSITY 5,302 5,332 5,660 5,679 5,619
Note: Students enrolled in a program that awards degrees from more than one school are counted in both schools (note that some students may be taking courses in only one of these schools this semester).Source: PeopleSoft
Fact Book 43 Fall 2013
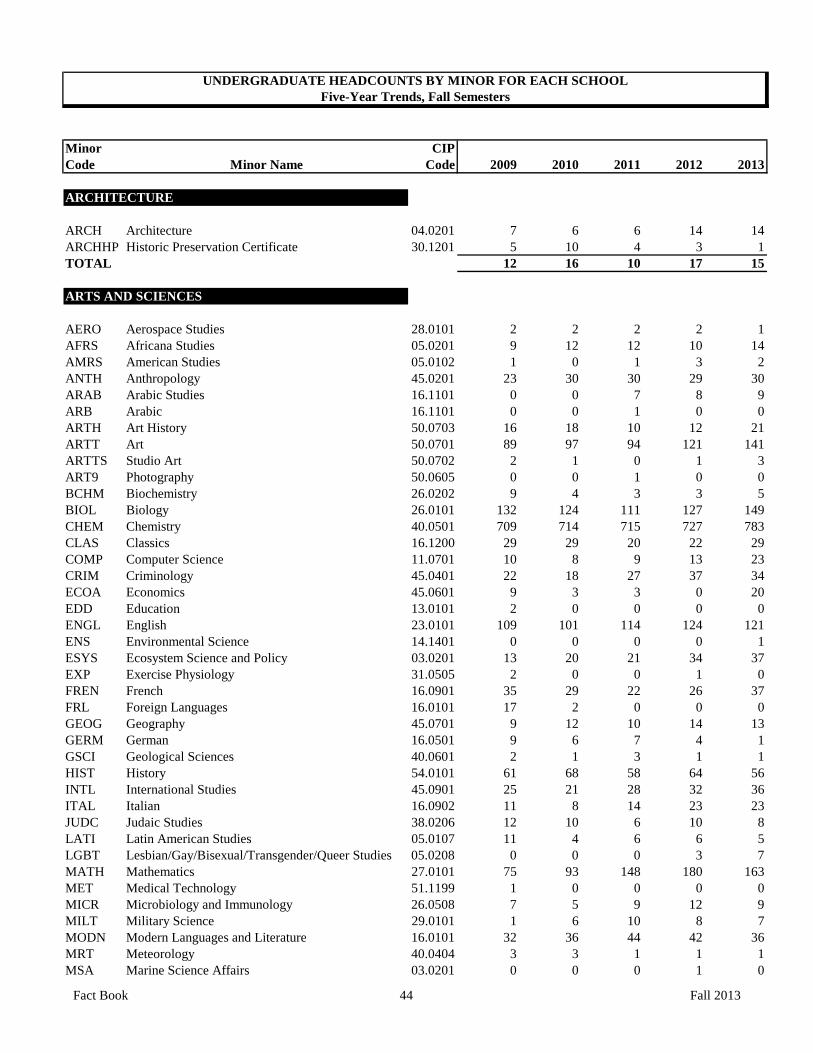
Minor CIPCode Minor Name Code 2009 2010 2011 2012 2013
ARCHITECTURE
ARCH Architecture 04.0201 7 6 6 14 14ARCHHP Historic Preservation Certificate 30.1201 5 10 4 3 1TOTAL 12 16 10 17 15
ARTS AND SCIENCES
AERO Aerospace Studies 28.0101 2 2 2 2 1AFRS Africana Studies 05.0201 9 12 12 10 14AMRS American Studies 05.0102 1 0 1 3 2ANTH Anthropology 45.0201 23 30 30 29 30ARAB Arabic Studies 16.1101 0 0 7 8 9ARB Arabic 16.1101 0 0 1 0 0ARTH Art History 50.0703 16 18 10 12 21ARTT Art 50.0701 89 97 94 121 141ARTTS Studio Art 50.0702 2 1 0 1 3ART9 Photography 50.0605 0 0 1 0 0BCHM Biochemistry 26.0202 9 4 3 3 5BIOL Biology 26.0101 132 124 111 127 149CHEM Chemistry 40.0501 709 714 715 727 783CLAS Classics 16.1200 29 29 20 22 29COMP Computer Science 11.0701 10 8 9 13 23CRIM Criminology 45.0401 22 18 27 37 34ECOA Economics 45.0601 9 3 3 0 20EDD Education 13.0101 2 0 0 0 0ENGL English 23.0101 109 101 114 124 121ENS Environmental Science 14.1401 0 0 0 0 1ESYS Ecosystem Science and Policy 03.0201 13 20 21 34 37EXP Exercise Physiology 31.0505 2 0 0 1 0FREN French 16.0901 35 29 22 26 37FRL Foreign Languages 16.0101 17 2 0 0 0GEOG Geography 45.0701 9 12 10 14 13GERM German 16.0501 9 6 7 4 1GSCI Geological Sciences 40.0601 2 1 3 1 1HIST History 54.0101 61 68 58 64 56INTL International Studies 45.0901 25 21 28 32 36ITAL Italian 16.0902 11 8 14 23 23JUDC Judaic Studies 38.0206 12 10 6 10 8LATI Latin American Studies 05.0107 11 4 6 6 5LGBT Lesbian/Gay/Bisexual/Transgender/Queer Studies 05.0208 0 0 0 3 7MATH Mathematics 27.0101 75 93 148 180 163MET Medical Technology 51.1199 1 0 0 0 0MICR Microbiology and Immunology 26.0508 7 5 9 12 9MILT Military Science 29.0101 1 6 10 8 7MODN Modern Languages and Literature 16.0101 32 36 44 42 36MRT Meteorology 40.0404 3 3 1 1 1MSA Marine Science Affairs 03.0201 0 0 0 1 0
UNDERGRADUATE HEADCOUNTS BY MINOR FOR EACH SCHOOLFive-Year Trends, Fall Semesters
Fact Book 44 Fall 2013

Minor CIPCode Minor Name Code 2009 2010 2011 2012 2013
UNDERGRADUATE HEADCOUNTS BY MINOR FOR EACH SCHOOLFive-Year Trends, Fall Semesters
MSC Marine Science 40.0607 5 4 2 2 2MUSA Music 50.0901 8 6 5 2 0PHIL Philosophy 38.0101 60 59 56 71 55PHYS Physics 40.0801 5 14 14 13 8PMD Pre Med 51.1102 0 1 0 0 0POL Political Science 45.1001 53 59 64 73 86PORT Portuguese 16.0904 5 2 3 6 5PSYC Psychology 42.0101 224 241 275 322 308RELG Religious Studies 38.0201 32 19 32 55 52RELH Religion and Health Care 51.3201 0 0 0 2 4SME Sports Medicine 51.9999 2 2 2 1 0SOCL Sociology 45.1101 53 61 81 78 75SPAN Spanish 16.0905 164 110 103 116 126THTR Theater Arts 50.0501 22 30 29 32 42URBS Urban Studies 45.1201 19 21 11 15 13WGST Women and Gender Studies 05.0207 7 10 9 12 14TOTAL 2,158 2,124 2,233 2,501 2,616
BUSINESS
ACCT Accounting 52.0301 37 45 47 39 71BMO Business Management & Organization 52.0201 13 0 0 0 0BSLW Business Law 22.0000 98 90 97 93 96BUAD Business Administration 52.0201 255 252 286 335 348CISY Computer Information Systems 11.0401 6 12 14 8 17ECON Economics 52.0601 52 62 62 87 81ENTR Entrepreneurship 52.0701 2 13 18 28 43FINL Finance 52.0801 78 82 89 95 100HSMP Health Sector Management and Policy 51.0701 17 23 23 29 28IBUSB International Business 52.1101 10 6 18 16 13LST Legal Studies 22.0000 0 1 1 0 0MGMT Management 52.0201 20 33 34 46 55MGTSB Management Science 52.1301 0 5 2 1 3MKTG Marketing 52.1401 108 98 117 194 248POLB Political Science 45.1001 13 6 5 2 0TOTAL 709 728 813 973 1,103
COMMUNICATION
CADV Communication Advertising 09.0903 26 20 25 40 40CBJO Communication Broadcast Journalism 09.0402 0 0 0 1 13CBR Electronic Media 09.0701 1 0 0 0 0CEME Communication Electronic Media 09.0702 3 3 4 5 10CMMT Media Management 09.0102 0 0 0 0 4CMPT Motion Pictures 50.0602 28 17 24 32 41CNJL Journalism 09.0401 4 4 9 8 17COMM Communication 09.0101 4 5 7 8 9COMS Communication Studies 09.0101 17 15 15 14 16
Fact Book 45 Fall 2013

Minor CIPCode Minor Name Code 2009 2010 2011 2012 2013
UNDERGRADUATE HEADCOUNTS BY MINOR FOR EACH SCHOOLFive-Year Trends, Fall Semesters
CPUB Communication Public Relations 09.0902 12 17 28 31 47CVJL Visual Journalism 09.0401 7 5 10 10 19TOTAL 102 86 122 149 216
EDUCATION & HUMAN DEVELOPMENT
EDUC Education 13.0101 13 25 21 20 27EPS Family and Human Services 19.0707 2 1 0 0 0EXPH Exercise Physiology 26.0908 23 28 36 30 36HSDI Human & Soc Development: Ind & Rel Dev 19.0707 0 0 0 0 3HSDM Family and Human Services 19.0707 25 29 30 34 32LDRP Leadership 13.0401 3 6 2 1 1PTOE Professional Training Option - Sec English 13.1305 5 2 4 5 5PTOH Professional Training Option - Sec Soc Sci 13.1317 6 3 4 1 4PTOL Professional Training Option - Language 13.1306 0 0 0 2 1PTOM Professional Training Option - Sec Math 13.1311 5 6 6 7 3PTOO Professional Training Option - Sec Other 13.1399 9 6 6 3 1PTOS Professional Training Option - Sec Science 13.1316 9 8 4 5 7SADM Sport Administration 31.0504 89 105 101 108 129SECD Secondary Education 13.1205 0 3 0 0 1SMED Sports Medicine 26.0908 71 71 49 53 64TOTAL 260 293 263 269 314
ENGINEERING
AENR Architectural Engineering 14.0401 6 9 8 3 4CENR Civil Engineering 14.0801 1 1 0 1 1ECNR Computer Engineering 14.0901 12 11 6 10 7EENR Electrical Engineering 14.1001 13 12 5 15 6ENV Environmental Engineering 14.1401 0 0 1 0 0IENR Industrial Engineering 14.3501 1 1 0 3 3MENR Mechanical Engineering 14.1901 1 0 3 2 6TOTAL 34 34 23 34 27
LAW
INT International Law 22.0209 0 1 0 0 0TOTAL 0 1 0 0 0
FROST SCHOOL OF MUSIC
CAMU Creative American Music 50.0999 13 17 29 15 9DANC Dance 50.0301 17 16 17 13 14MBEI Music Business & Entertainment Industry 50.0999 65 66 67 89 121MMI Music Industry 50.0999 1 1 0 0 0MSJI Jazz Performance/instrumental 50.0910 0 0 1 1 1MTCP Composition 50.0904 1 2 4 3 3MUE Music Engineering 14.1099 0 0 1 0 0
Fact Book 46 Fall 2013

Minor CIPCode Minor Name Code 2009 2010 2011 2012 2013
UNDERGRADUATE HEADCOUNTS BY MINOR FOR EACH SCHOOLFive-Year Trends, Fall Semesters
MUSCA Music 50.0901 6 20 13 14 17TOTAL 103 122 132 135 165
NURSING & HEALTH STUDIES
NPUH Public Health 51.3811 0 2 30 53 66NUPH Nursing (MSN To PhD) 51.3808 0 0 0 3 0TOTAL 0 2 30 56 66
ROSENSTIEL SCHOOL
RSMM Meteorology 40.0404 0 0 0 0 1RSMS Marine Science 40.0607 0 2 9 9 7TOTAL 0 2 9 9 8
TOTAL UNIVERSITY 3,378 3,408 3,635 4,143 4,530
Note: In Fall 2013, the University implemented a new student information system, and the new method for counting students is no longer based on completing financial payment. As a result, we now include students who would not have been counted in prior years, which affects mainly undergraduate numbers. As in the past, students who fail to complete payment before the end of the semester will not be allowed to enroll in the following semester. Numbers in this table are the sum of first, second, and third minors from all degrees. The sum across departments represents a duplicate headcount.Source: PeopleSoft
Fact Book 47 Fall 2013

TotalCollege/School Number Percent Number Percent Number
Architecture 119 46% 140 54% 259Arts and Sciences 2,034 46% 2,369 54% 4,403Business 1,356 63% 810 37% 2,166Communication 313 29% 774 71% 1,087Education & Human Dev 247 46% 293 54% 540Frost School of Music 259 63% 149 37% 408Engineering 774 72% 308 28% 1,082Nursing & Health Studies 97 18% 437 82% 534Rosenstiel School 142 36% 250 64% 392Cont Std/Grad Sch/Joint Pgms 192 38% 317 62% 509TOTAL 5,533 49% 5,847 51% 11,380
Note: Includes non-degree undergraduates.
TotalCollege/School Number Percent Number Percent Number
Architecture 37 53% 33 47% 70Arts and Sciences 299 46% 358 54% 657Business 354 59% 247 41% 601Communication 59 35% 110 65% 169Education & Human Dev 101 30% 231 70% 332Engineering 187 72% 71 28% 258Frost School of Music 142 58% 101 42% 243Law 721 55% 586 45% 1,307Medicine - Clinical 394 51% 381 49% 775Medicine - Graduate 224 41% 329 59% 553Nursing & Health Studies 57 23% 186 77% 243Rosenstiel School 140 47% 155 53% 295Cont Std/Grad Sch/Joint Pgms 20 38% 32 62% 52TOTAL 2,735 49% 2,820 51% 5,555
Source: PeopleSoft
GENDER OF STUDENTSFall Semester, 2013
UNDERGRADUATE
Men Women
GRADUATE
Men Women
Fact Book 48 Fall 2013
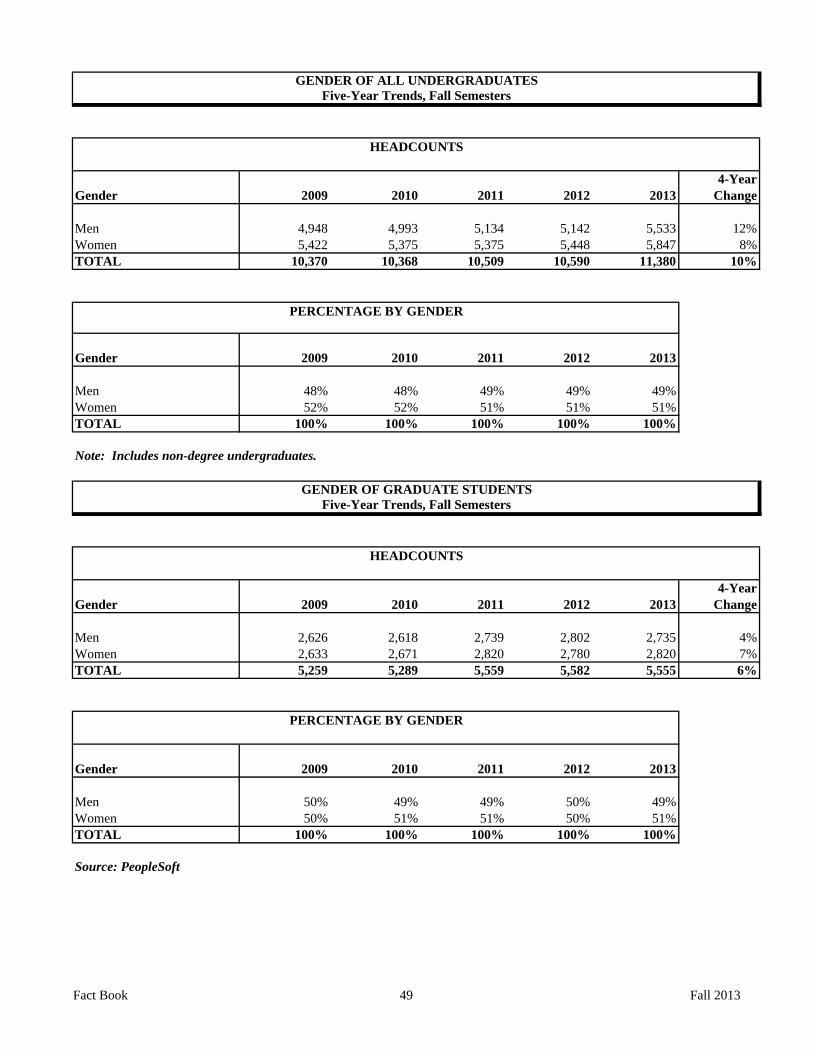
4-YearGender 2009 2010 2011 2012 2013 Change
Men 4,948 4,993 5,134 5,142 5,533 12%Women 5,422 5,375 5,375 5,448 5,847 8%TOTAL 10,370 10,368 10,509 10,590 11,380 10%
Gender 2009 2010 2011 2012 2013
Men 48% 48% 49% 49% 49%Women 52% 52% 51% 51% 51%TOTAL 100% 100% 100% 100% 100%
Note: Includes non-degree undergraduates.
4-YearGender 2009 2010 2011 2012 2013 Change
Men 2,626 2,618 2,739 2,802 2,735 4%Women 2,633 2,671 2,820 2,780 2,820 7%TOTAL 5,259 5,289 5,559 5,582 5,555 6%
Gender 2009 2010 2011 2012 2013
Men 50% 49% 49% 50% 49%Women 50% 51% 51% 50% 51%TOTAL 100% 100% 100% 100% 100%
Source: PeopleSoft
Five-Year Trends, Fall Semesters
HEADCOUNTS
HEADCOUNTS
PERCENTAGE BY GENDER
PERCENTAGE BY GENDER
GENDER OF GRADUATE STUDENTSFive-Year Trends, Fall Semesters
GENDER OF ALL UNDERGRADUATES
Fact Book 49 Fall 2013

TotalClass Number Percent Number Percent Number
Freshman 1,242 50% 1,239 50% 2,481Sophomore 1,259 50% 1,254 50% 2,513Junior 1,370 50% 1,360 50% 2,730Senior 1,522 46% 1,798 54% 3,320Total DUG 5,393 49% 5,651 51% 11,044
NDUG 140 42% 196 58% 336Total UG 5,533 49% 5,847 51% 11,380
Graduate School 1,620 47% 1,853 53% 3,473M.D./J.D./LL.M. 1,115 54% 967 46% 2,082Total Graduate 2,735 49% 2,820 51% 5,555TOTAL 8,268 49% 8,667 51% 16,935
Source: PeopleSoft
GENDER OF ALL STUDENTS BY CLASSFall Semester, 2013
Men Women
40%
45%
50%
55%
60%
2009 2010 2011 2012 2013
Perc
ent o
f Stu
dent
s
PERCENTAGE WHO ARE WOMENFive-Year Trends, Fall Semesters
Undergraduate Graduate
Fact Book 50 Fall 2013

4-YearRace/Ethnic 2009 2010 2011 2012 2013 Change
White 988 1,137 1,097 995 1,066 8%Hispanic or Latino 383 464 421 375 360 -6%Black 155 137 135 188 181 17%Asian/Pacific Islander 289 210 275 274 275 -5%American Indian 6 3 3 1 2 -67%2 or More Races 23 56 71 58 62 170%Unknown 162 125 170 121 194 20%TOTAL 2,006 2,132 2,172 2,012 2,140 7%
Race/Ethnic 2009 2010 2011 2012 2013
White 54% 57% 55% 53% 55%Hispanic or Latino 21% 23% 21% 20% 18%Black 8% 7% 7% 10% 9%Asian/Pacific Islander 16% 10% 14% 14% 14%American Indian 0% 0% 0% 0% 0%2 or More Races 1% 3% 4% 3% 3%TOTAL 100% 100% 100% 100% 100%
Note: Beginning in Fall 2010, new race/ethnic categories were used, reflecting a change that allowed students to indicate more than one race/ethnic category. Prior-year percentages were adjusted to be as comparable as possible. Students (including international students) have been categorized by their self-reported race/ethnicity. Percentages have been adjusted to exclude unknown race/ethnicity.Source: PeopleSoft
HEADCOUNTS
ADJUSTED PERCENTAGE BY ETHNICITY
Five-Year Trends, Fall SemestersRACIAL AND ETHNIC DISTRIBUTION OF ENTERING FRESHMEN
Fact Book 51 Fall 2013
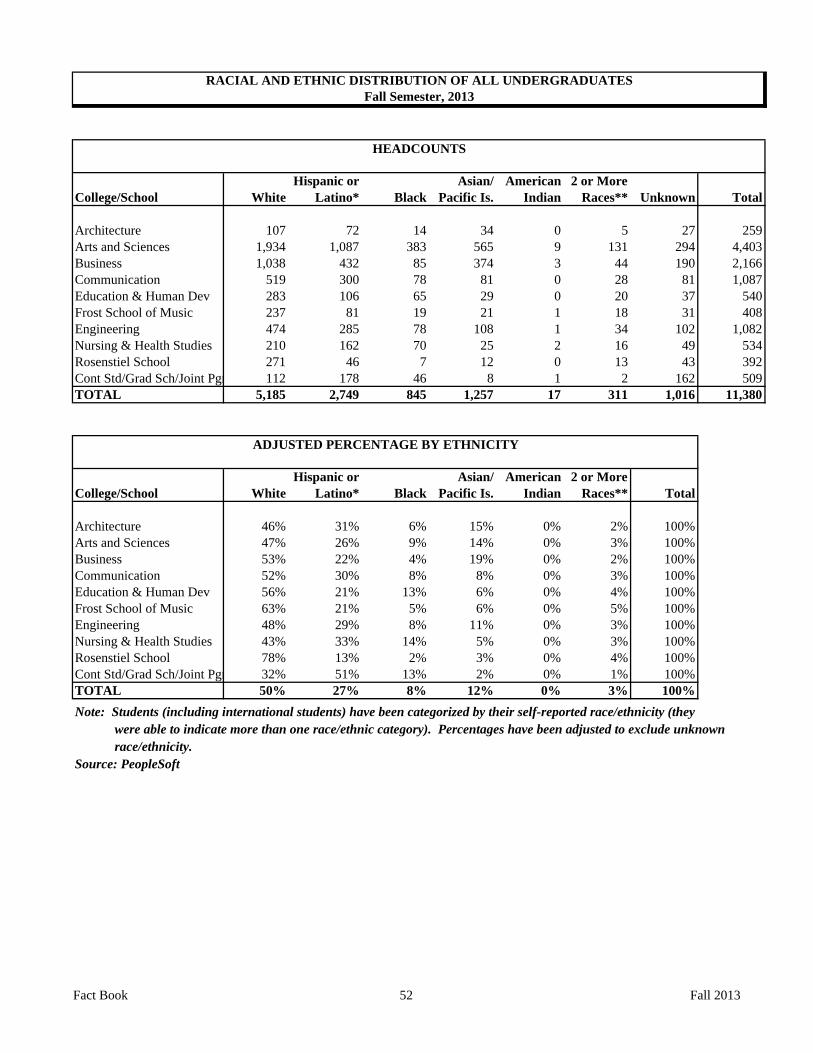
Hispanic or Asian/ American 2 or MoreCollege/School White Latino* Black Pacific Is. Indian Races** Unknown Total
Architecture 107 72 14 34 0 5 27 259Arts and Sciences 1,934 1,087 383 565 9 131 294 4,403Business 1,038 432 85 374 3 44 190 2,166Communication 519 300 78 81 0 28 81 1,087Education & Human Dev 283 106 65 29 0 20 37 540Frost School of Music 237 81 19 21 1 18 31 408Engineering 474 285 78 108 1 34 102 1,082Nursing & Health Studies 210 162 70 25 2 16 49 534Rosenstiel School 271 46 7 12 0 13 43 392Cont Std/Grad Sch/Joint Pgm 112 178 46 8 1 2 162 509TOTAL 5,185 2,749 845 1,257 17 311 1,016 11,380
Hispanic or Asian/ American 2 or MoreCollege/School White Latino* Black Pacific Is. Indian Races** Total
Architecture 46% 31% 6% 15% 0% 2% 100%Arts and Sciences 47% 26% 9% 14% 0% 3% 100%Business 53% 22% 4% 19% 0% 2% 100%Communication 52% 30% 8% 8% 0% 3% 100%Education & Human Dev 56% 21% 13% 6% 0% 4% 100%Frost School of Music 63% 21% 5% 6% 0% 5% 100%Engineering 48% 29% 8% 11% 0% 3% 100%Nursing & Health Studies 43% 33% 14% 5% 0% 3% 100%Rosenstiel School 78% 13% 2% 3% 0% 4% 100%Cont Std/Grad Sch/Joint Pgm 32% 51% 13% 2% 0% 1% 100%TOTAL 50% 27% 8% 12% 0% 3% 100%Note: Students (including international students) have been categorized by their self-reported race/ethnicity (they were able to indicate more than one race/ethnic category). Percentages have been adjusted to exclude unknown race/ethnicity. Source: PeopleSoft
HEADCOUNTS
ADJUSTED PERCENTAGE BY ETHNICITY
RACIAL AND ETHNIC DISTRIBUTION OF ALL UNDERGRADUATESFall Semester, 2013
Fact Book 52 Fall 2013
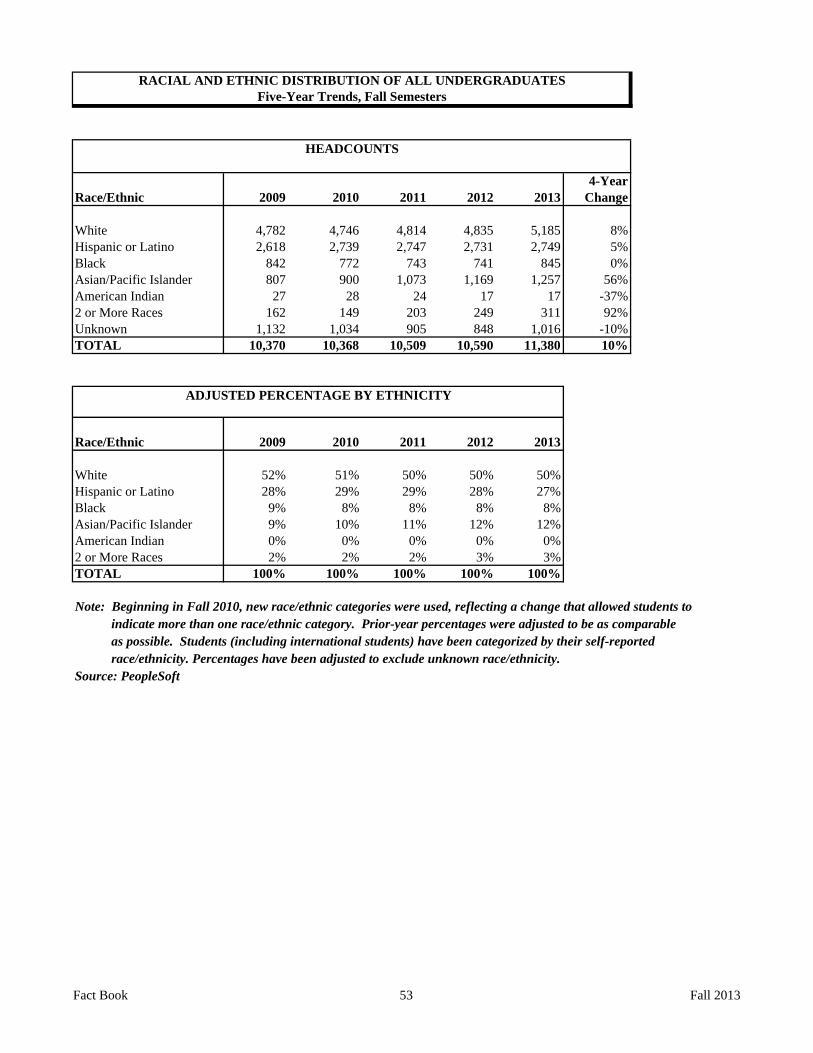
4-YearRace/Ethnic 2009 2010 2011 2012 2013 Change
White 4,782 4,746 4,814 4,835 5,185 8%Hispanic or Latino 2,618 2,739 2,747 2,731 2,749 5%Black 842 772 743 741 845 0%Asian/Pacific Islander 807 900 1,073 1,169 1,257 56%American Indian 27 28 24 17 17 -37%2 or More Races 162 149 203 249 311 92%Unknown 1,132 1,034 905 848 1,016 -10%TOTAL 10,370 10,368 10,509 10,590 11,380 10%
Race/Ethnic 2009 2010 2011 2012 2013
White 52% 51% 50% 50% 50%Hispanic or Latino 28% 29% 29% 28% 27%Black 9% 8% 8% 8% 8%Asian/Pacific Islander 9% 10% 11% 12% 12%American Indian 0% 0% 0% 0% 0%2 or More Races 2% 2% 2% 3% 3%TOTAL 100% 100% 100% 100% 100%
Note: Beginning in Fall 2010, new race/ethnic categories were used, reflecting a change that allowed students to indicate more than one race/ethnic category. Prior-year percentages were adjusted to be as comparable as possible. Students (including international students) have been categorized by their self-reported race/ethnicity. Percentages have been adjusted to exclude unknown race/ethnicity.Source: PeopleSoft
HEADCOUNTS
ADJUSTED PERCENTAGE BY ETHNICITY
RACIAL AND ETHNIC DISTRIBUTION OF ALL UNDERGRADUATESFive-Year Trends, Fall Semesters
Fact Book 53 Fall 2013
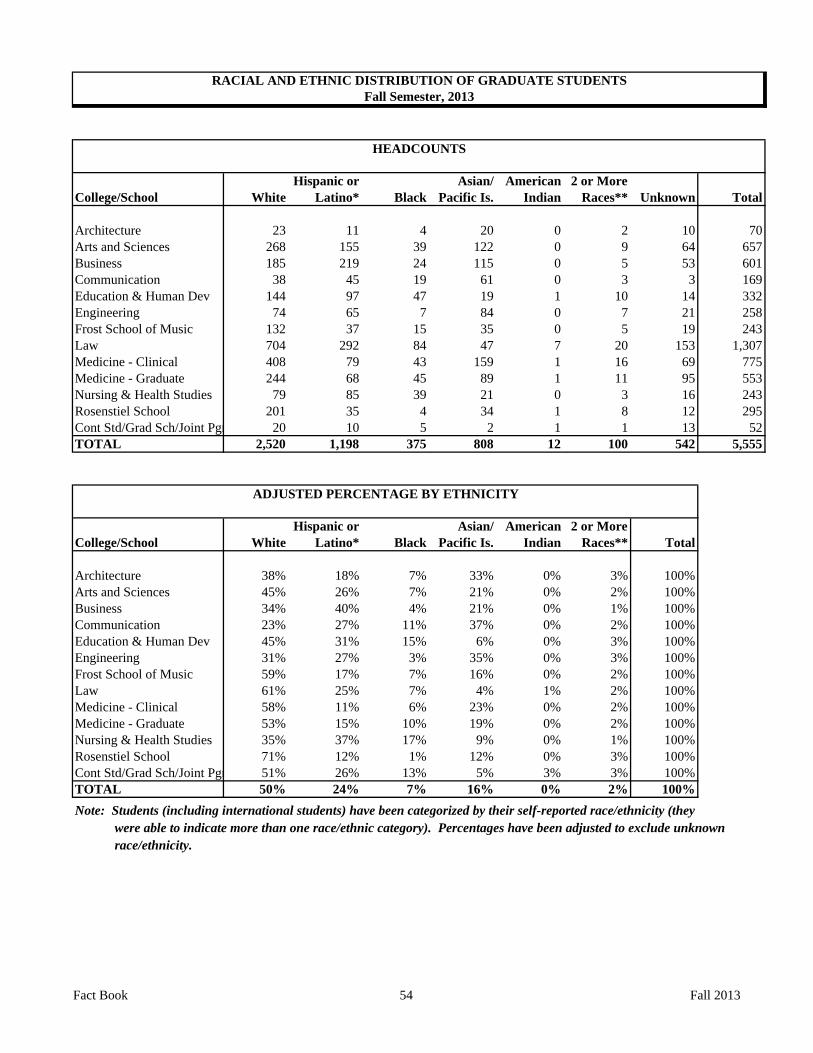
Hispanic or Asian/ American 2 or MoreCollege/School White Latino* Black Pacific Is. Indian Races** Unknown Total
Architecture 23 11 4 20 0 2 10 70Arts and Sciences 268 155 39 122 0 9 64 657Business 185 219 24 115 0 5 53 601Communication 38 45 19 61 0 3 3 169Education & Human Dev 144 97 47 19 1 10 14 332Engineering 74 65 7 84 0 7 21 258Frost School of Music 132 37 15 35 0 5 19 243Law 704 292 84 47 7 20 153 1,307Medicine - Clinical 408 79 43 159 1 16 69 775Medicine - Graduate 244 68 45 89 1 11 95 553Nursing & Health Studies 79 85 39 21 0 3 16 243Rosenstiel School 201 35 4 34 1 8 12 295Cont Std/Grad Sch/Joint Pgm 20 10 5 2 1 1 13 52TOTAL 2,520 1,198 375 808 12 100 542 5,555
Hispanic or Asian/ American 2 or MoreCollege/School White Latino* Black Pacific Is. Indian Races** Total
Architecture 38% 18% 7% 33% 0% 3% 100%Arts and Sciences 45% 26% 7% 21% 0% 2% 100%Business 34% 40% 4% 21% 0% 1% 100%Communication 23% 27% 11% 37% 0% 2% 100%Education & Human Dev 45% 31% 15% 6% 0% 3% 100%Engineering 31% 27% 3% 35% 0% 3% 100%Frost School of Music 59% 17% 7% 16% 0% 2% 100%Law 61% 25% 7% 4% 1% 2% 100%Medicine - Clinical 58% 11% 6% 23% 0% 2% 100%Medicine - Graduate 53% 15% 10% 19% 0% 2% 100%Nursing & Health Studies 35% 37% 17% 9% 0% 1% 100%Rosenstiel School 71% 12% 1% 12% 0% 3% 100%Cont Std/Grad Sch/Joint Pgm 51% 26% 13% 5% 3% 3% 100%TOTAL 50% 24% 7% 16% 0% 2% 100%Note: Students (including international students) have been categorized by their self-reported race/ethnicity (they were able to indicate more than one race/ethnic category). Percentages have been adjusted to exclude unknown race/ethnicity.
HEADCOUNTS
ADJUSTED PERCENTAGE BY ETHNICITY
RACIAL AND ETHNIC DISTRIBUTION OF GRADUATE STUDENTSFall Semester, 2013
Fact Book 54 Fall 2013

4-YearRace/Ethnic 2009 2010 2011 2012 2013 Change
White 2,596 2,610 2,691 2,616 2,520 -3%Hispanic or Latino 1,016 1,056 1,214 1,286 1,198 18%Black 361 367 375 356 375 4%Asian/Pacific Islander 614 651 708 748 808 32%American Indian 9 10 13 14 12 33%2 or More Races 68 48 69 93 100 47%Unknown 595 547 489 469 542 -9%TOTAL 5,259 5,289 5,559 5,582 5,555 6%
Race/Ethnic 2009 2010 2011 2012 2013
White 56% 55% 53% 51% 50%Hispanic or Latino 22% 22% 24% 25% 24%Black 8% 8% 7% 7% 7%Asian/Pacific Islander 13% 14% 14% 15% 16%American Indian 0% 0% 0% 0% 0%2 or More Races 1% 1% 1% 2% 2%TOTAL 100% 100% 100% 100% 100%
Note: Beginning in Fall 2010, new race/ethnic categories were used, reflecting a change that allowed students to indicate more than one race/ethnic category. Prior-year percentages were adjusted to be as comparable as possible. Students (including international students) have been categorized by their self-reported race/ethnicity. Percentages have been adjusted to exclude unknown race/ethnicity.Source: PeopleSoft
RACIAL AND ETHNIC DISTRIBUTION OF ALL GRADUATE STUDENTSFive-Year Trends, Fall Semesters
HEADCOUNTS
ADJUSTED PERCENTAGE BY ETHNICITY
Fact Book 55 Fall 2013

Hispanic or Asian/ American 2 or MoreCollege/School White Latino* Black Pacific Is. Indian Races** Unknown TotalArchitecture 130 83 18 54 0 7 37 329Arts and Sciences 2,202 1,242 422 687 9 140 358 5,060Business 1,223 651 109 489 3 49 243 2,767Communication 557 345 97 142 0 31 84 1,256Education & Human Dev 427 203 112 48 1 30 51 872Engineering 548 350 85 192 1 41 123 1,340Frost School of Music 369 118 34 56 1 23 50 651Law 704 292 84 47 7 20 153 1,307Miller School of Medicine 652 147 88 248 2 27 164 1,328Nursing & Health Studies 289 247 109 46 2 19 65 777Rosenstiel School 472 81 11 46 1 21 55 687Cont Std/Grad Sch/Joint Pgm 132 188 51 10 2 3 175 561TOTAL 7,705 3,947 1,220 2,065 29 411 1,558 16,935
Hispanic or Asian/ American 2 or MoreCollege/School White Latino* Black Pacific Is. Indian Races** Total
Architecture 45% 28% 6% 18% 0% 2% 100%Arts and Sciences 47% 26% 9% 15% 0% 3% 100%Business 48% 26% 4% 19% 0% 2% 100%Communication 48% 29% 8% 12% 0% 3% 100%Education & Human Dev 52% 25% 14% 6% 0% 4% 100%Engineering 45% 29% 7% 16% 0% 3% 100%Frost School of Music 61% 20% 6% 9% 0% 4% 100%Law 61% 25% 7% 4% 1% 2% 100%Miller School of Medicine 56% 13% 8% 21% 0% 2% 100%Nursing & Health Studies 41% 35% 15% 6% 0% 3% 100%Rosenstiel School 75% 13% 2% 7% 0% 3% 100%Cont Std/Grad Sch/Joint Pgm 34% 49% 13% 3% 1% 1% 100%TOTAL 50% 26% 8% 13% 0% 3% 100%
Note: Students (including international students) have been categorized by their self-reported race/ethnicity (they were able to indicate more than one race/ethnic category). Percentages have been adjusted to exclude unknown race/ethnicity. Source: PeopleSoft
HEADCOUNTS
ADJUSTED PERCENTAGE BY ETHNICITY
RACIAL AND ETHNIC DISTRIBUTION OF ALL STUDENTSFall Semester, 2013
Fact Book 56 Fall 2013
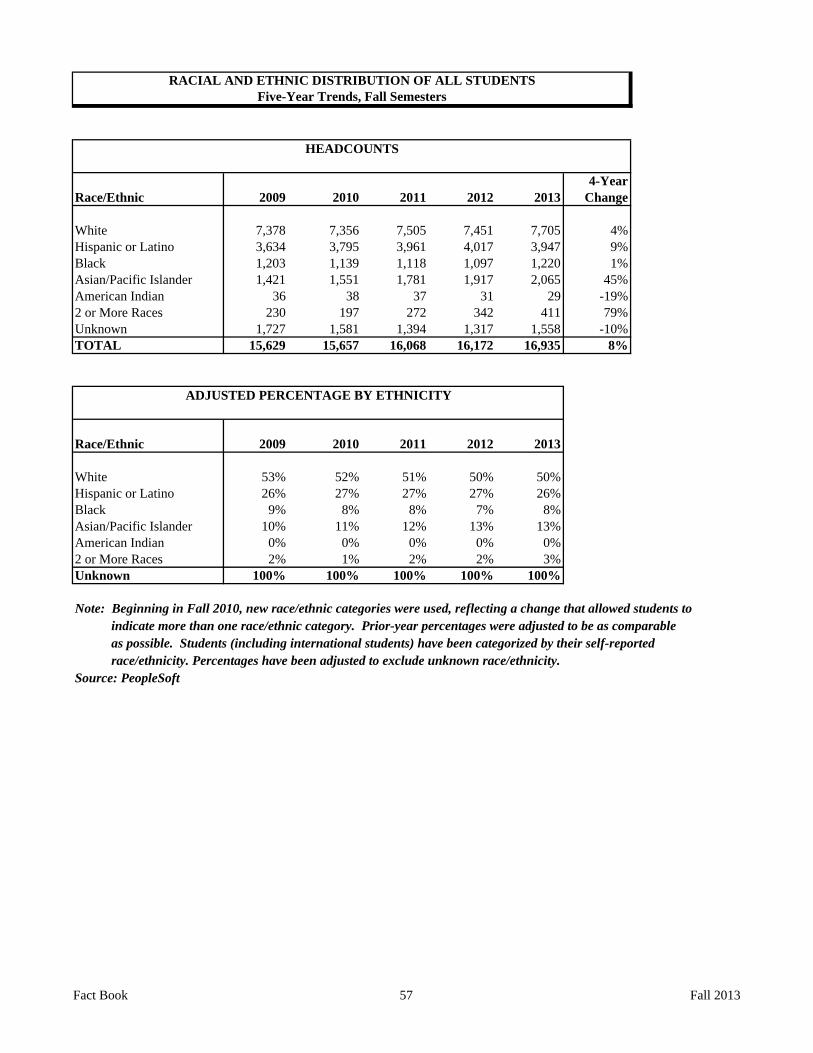
4-YearRace/Ethnic 2009 2010 2011 2012 2013 Change
White 7,378 7,356 7,505 7,451 7,705 4%Hispanic or Latino 3,634 3,795 3,961 4,017 3,947 9%Black 1,203 1,139 1,118 1,097 1,220 1%Asian/Pacific Islander 1,421 1,551 1,781 1,917 2,065 45%American Indian 36 38 37 31 29 -19%2 or More Races 230 197 272 342 411 79%Unknown 1,727 1,581 1,394 1,317 1,558 -10%TOTAL 15,629 15,657 16,068 16,172 16,935 8%
Race/Ethnic 2009 2010 2011 2012 2013
White 53% 52% 51% 50% 50%Hispanic or Latino 26% 27% 27% 27% 26%Black 9% 8% 8% 7% 8%Asian/Pacific Islander 10% 11% 12% 13% 13%American Indian 0% 0% 0% 0% 0%2 or More Races 2% 1% 2% 2% 3%Unknown 100% 100% 100% 100% 100%
Note: Beginning in Fall 2010, new race/ethnic categories were used, reflecting a change that allowed students to indicate more than one race/ethnic category. Prior-year percentages were adjusted to be as comparable as possible. Students (including international students) have been categorized by their self-reported race/ethnicity. Percentages have been adjusted to exclude unknown race/ethnicity.Source: PeopleSoft
HEADCOUNTS
ADJUSTED PERCENTAGE BY ETHNICITY
RACIAL AND ETHNIC DISTRIBUTION OF ALL STUDENTSFive-Year Trends, Fall Semesters
Fact Book 57 Fall 2013
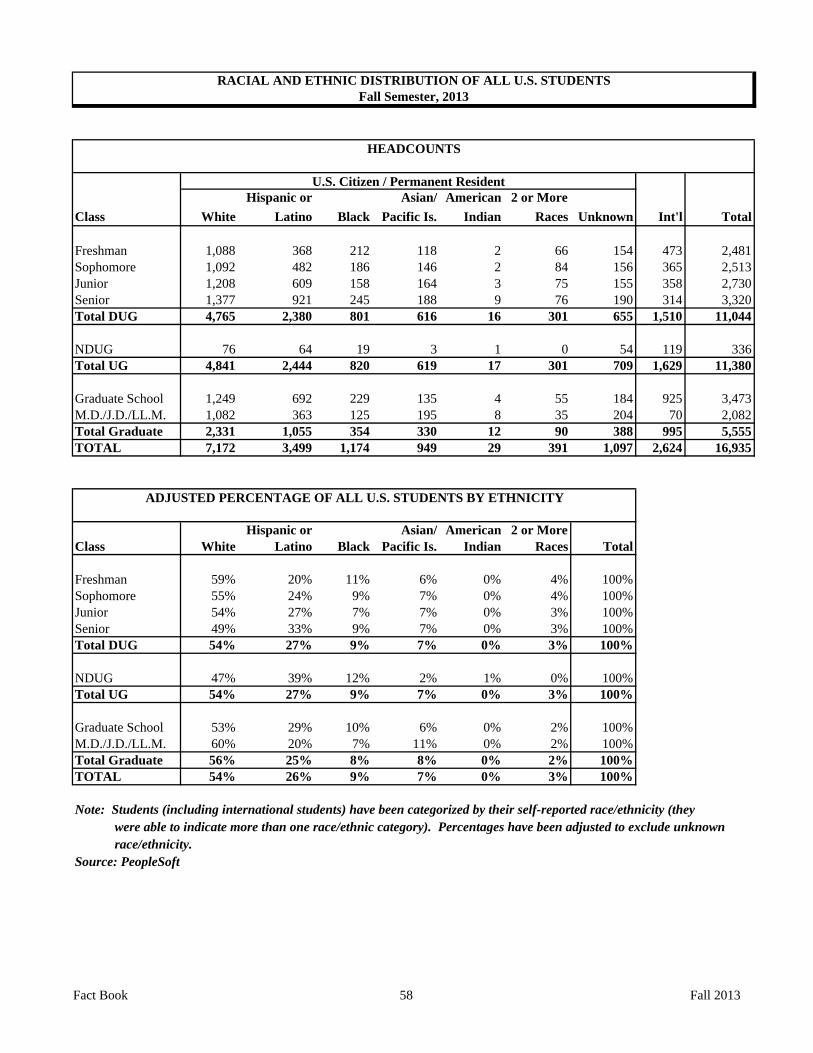
Hispanic or Asian/ American 2 or MoreClass White Latino Black Pacific Is. Indian Races Unknown Int'l Total
Freshman 1,088 368 212 118 2 66 154 473 2,481Sophomore 1,092 482 186 146 2 84 156 365 2,513Junior 1,208 609 158 164 3 75 155 358 2,730Senior 1,377 921 245 188 9 76 190 314 3,320Total DUG 4,765 2,380 801 616 16 301 655 1,510 11,044
NDUG 76 64 19 3 1 0 54 119 336Total UG 4,841 2,444 820 619 17 301 709 1,629 11,380
Graduate School 1,249 692 229 135 4 55 184 925 3,473M.D./J.D./LL.M. 1,082 363 125 195 8 35 204 70 2,082Total Graduate 2,331 1,055 354 330 12 90 388 995 5,555TOTAL 7,172 3,499 1,174 949 29 391 1,097 2,624 16,935
Hispanic or Asian/ American 2 or MoreClass White Latino Black Pacific Is. Indian Races Total
Freshman 59% 20% 11% 6% 0% 4% 100%Sophomore 55% 24% 9% 7% 0% 4% 100%Junior 54% 27% 7% 7% 0% 3% 100%Senior 49% 33% 9% 7% 0% 3% 100%Total DUG 54% 27% 9% 7% 0% 3% 100%
NDUG 47% 39% 12% 2% 1% 0% 100%Total UG 54% 27% 9% 7% 0% 3% 100%
Graduate School 53% 29% 10% 6% 0% 2% 100%M.D./J.D./LL.M. 60% 20% 7% 11% 0% 2% 100%Total Graduate 56% 25% 8% 8% 0% 2% 100%TOTAL 54% 26% 9% 7% 0% 3% 100%
Note: Students (including international students) have been categorized by their self-reported race/ethnicity (they were able to indicate more than one race/ethnic category). Percentages have been adjusted to exclude unknown race/ethnicity. Source: PeopleSoft
HEADCOUNTS
U.S. Citizen / Permanent Resident
ADJUSTED PERCENTAGE OF ALL U.S. STUDENTS BY ETHNICITY
RACIAL AND ETHNIC DISTRIBUTION OF ALL U.S. STUDENTSFall Semester, 2013
Fact Book 58 Fall 2013
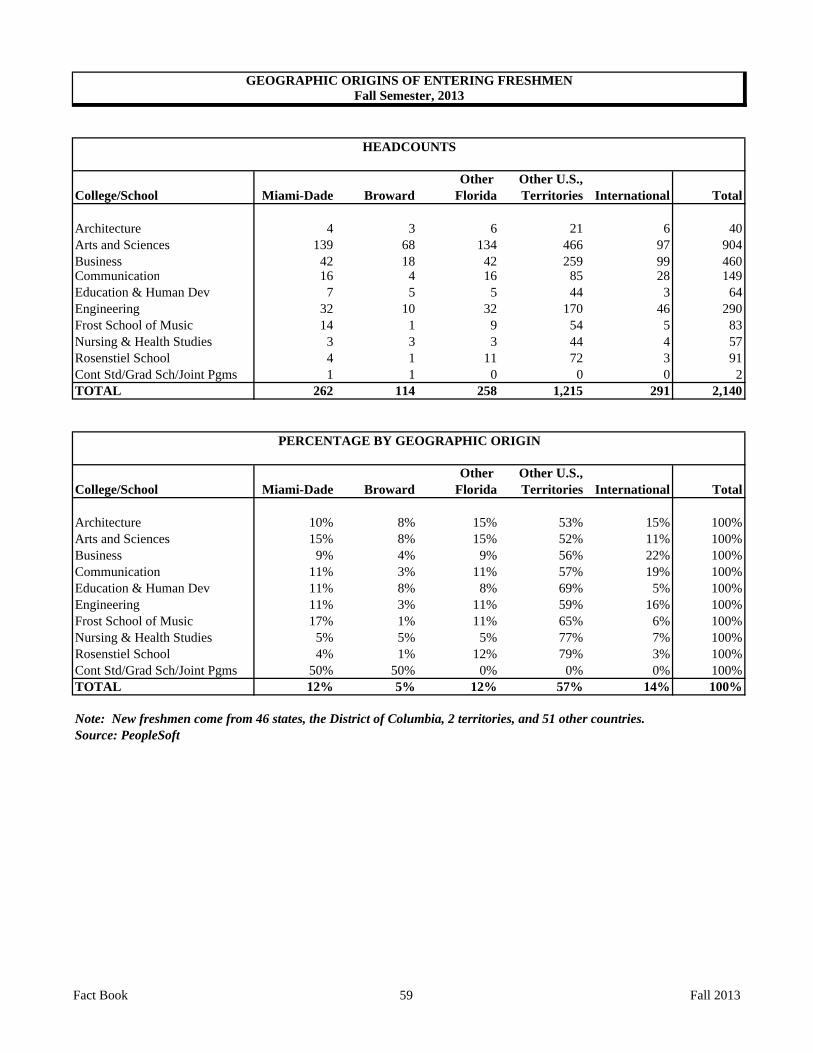
Other Other U.S.,College/School Miami-Dade Broward Florida Territories International Total
Architecture 4 3 6 21 6 40Arts and Sciences 139 68 134 466 97 904Business 42 18 42 259 99 460Communication 16 4 16 85 28 149Education & Human Dev 7 5 5 44 3 64Engineering 32 10 32 170 46 290Frost School of Music 14 1 9 54 5 83Nursing & Health Studies 3 3 3 44 4 57Rosenstiel School 4 1 11 72 3 91Cont Std/Grad Sch/Joint Pgms 1 1 0 0 0 2TOTAL 262 114 258 1,215 291 2,140
Other Other U.S.,College/School Miami-Dade Broward Florida Territories International Total
Architecture 10% 8% 15% 53% 15% 100%Arts and Sciences 15% 8% 15% 52% 11% 100%Business 9% 4% 9% 56% 22% 100%Communication 11% 3% 11% 57% 19% 100%Education & Human Dev 11% 8% 8% 69% 5% 100%Engineering 11% 3% 11% 59% 16% 100%Frost School of Music 17% 1% 11% 65% 6% 100%Nursing & Health Studies 5% 5% 5% 77% 7% 100%Rosenstiel School 4% 1% 12% 79% 3% 100%Cont Std/Grad Sch/Joint Pgms 50% 50% 0% 0% 0% 100%TOTAL 12% 5% 12% 57% 14% 100%
Note: New freshmen come from 46 states, the District of Columbia, 2 territories, and 51 other countries.Source: PeopleSoft
GEOGRAPHIC ORIGINS OF ENTERING FRESHMENFall Semester, 2013
HEADCOUNTS
PERCENTAGE BY GEOGRAPHIC ORIGIN
Fact Book 59 Fall 2013
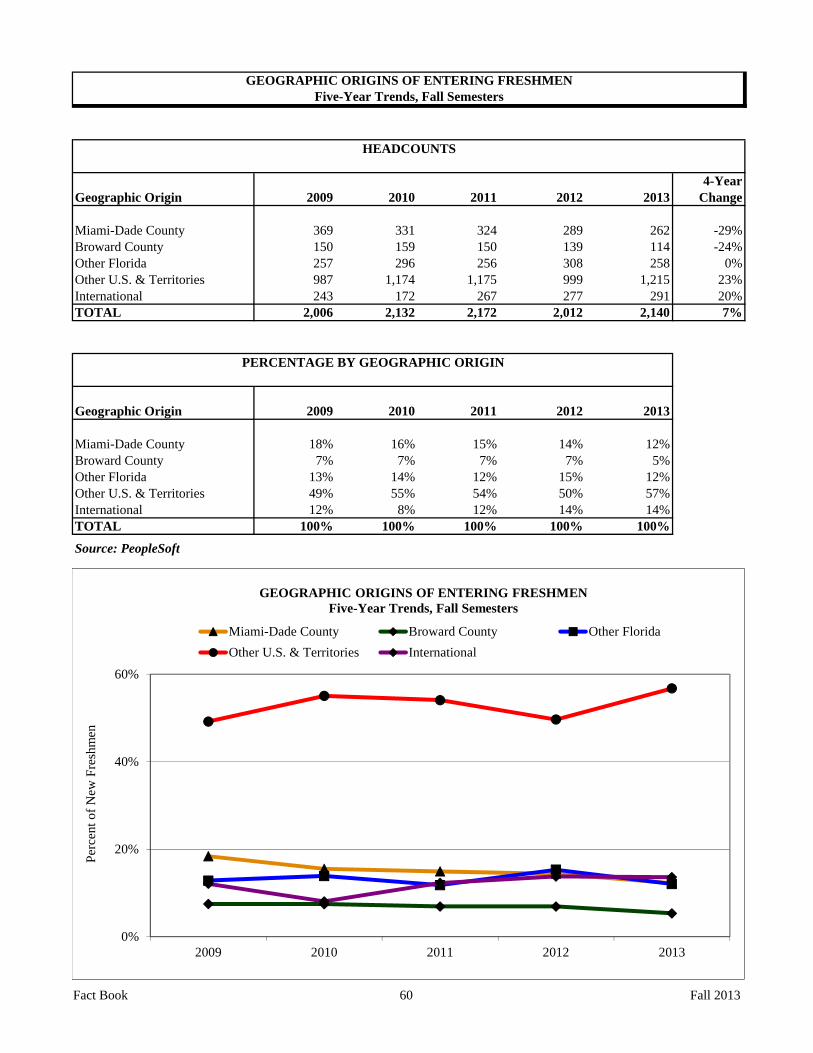
4-YearGeographic Origin 2009 2010 2011 2012 2013 Change
Miami-Dade County 369 331 324 289 262 -29%Broward County 150 159 150 139 114 -24%Other Florida 257 296 256 308 258 0%Other U.S. & Territories 987 1,174 1,175 999 1,215 23%International 243 172 267 277 291 20%TOTAL 2,006 2,132 2,172 2,012 2,140 7%
Geographic Origin 2009 2010 2011 2012 2013
Miami-Dade County 18% 16% 15% 14% 12%Broward County 7% 7% 7% 7% 5%Other Florida 13% 14% 12% 15% 12%Other U.S. & Territories 49% 55% 54% 50% 57%International 12% 8% 12% 14% 14%TOTAL 100% 100% 100% 100% 100%
Source: PeopleSoft
HEADCOUNTS
PERCENTAGE BY GEOGRAPHIC ORIGIN
Five-Year Trends, Fall SemestersGEOGRAPHIC ORIGINS OF ENTERING FRESHMEN
0%
20%
40%
60%
2009 2010 2011 2012 2013
Perc
ent o
f New
Fre
shm
en
GEOGRAPHIC ORIGINS OF ENTERING FRESHMENFive-Year Trends, Fall Semesters
Miami-Dade County Broward County Other FloridaOther U.S. & Territories International
Fact Book 60 Fall 2013
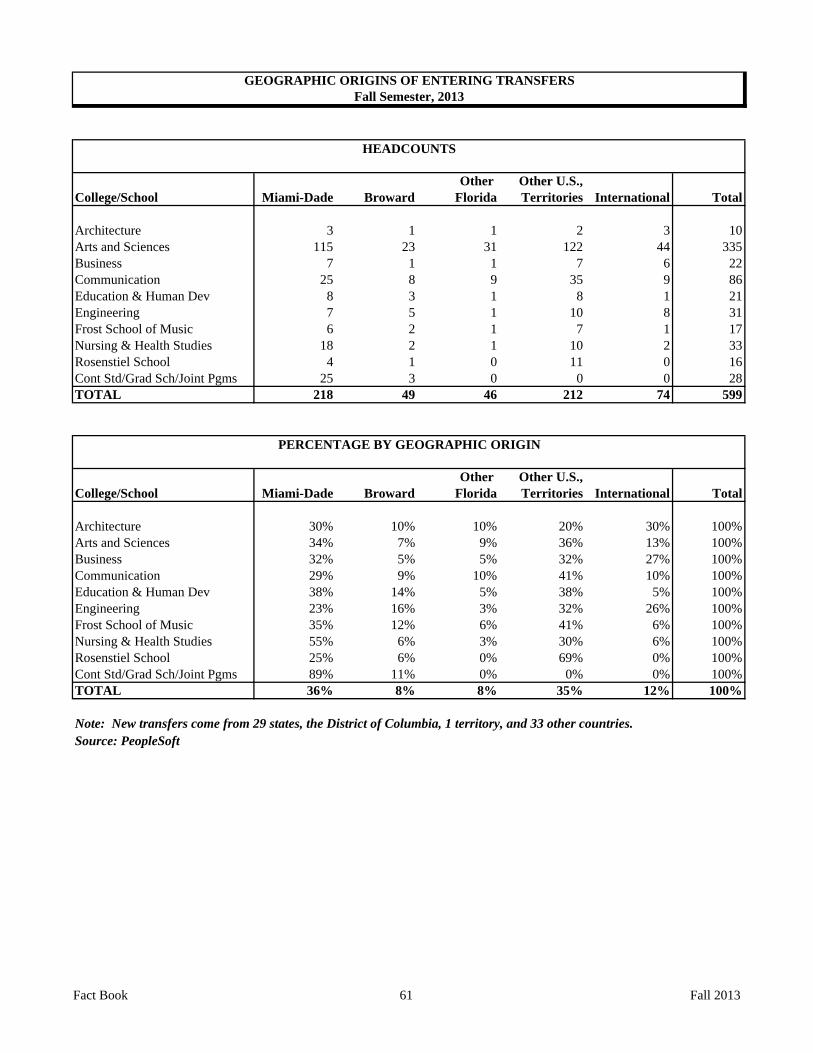
Other Other U.S.,College/School Miami-Dade Broward Florida Territories International Total
Architecture 3 1 1 2 3 10Arts and Sciences 115 23 31 122 44 335Business 7 1 1 7 6 22Communication 25 8 9 35 9 86Education & Human Dev 8 3 1 8 1 21Engineering 7 5 1 10 8 31Frost School of Music 6 2 1 7 1 17Nursing & Health Studies 18 2 1 10 2 33Rosenstiel School 4 1 0 11 0 16Cont Std/Grad Sch/Joint Pgms 25 3 0 0 0 28TOTAL 218 49 46 212 74 599
Other Other U.S.,College/School Miami-Dade Broward Florida Territories International Total
Architecture 30% 10% 10% 20% 30% 100%Arts and Sciences 34% 7% 9% 36% 13% 100%Business 32% 5% 5% 32% 27% 100%Communication 29% 9% 10% 41% 10% 100%Education & Human Dev 38% 14% 5% 38% 5% 100%Engineering 23% 16% 3% 32% 26% 100%Frost School of Music 35% 12% 6% 41% 6% 100%Nursing & Health Studies 55% 6% 3% 30% 6% 100%Rosenstiel School 25% 6% 0% 69% 0% 100%Cont Std/Grad Sch/Joint Pgms 89% 11% 0% 0% 0% 100%TOTAL 36% 8% 8% 35% 12% 100%
Note: New transfers come from 29 states, the District of Columbia, 1 territory, and 33 other countries.Source: PeopleSoft
PERCENTAGE BY GEOGRAPHIC ORIGIN
GEOGRAPHIC ORIGINS OF ENTERING TRANSFERSFall Semester, 2013
HEADCOUNTS
Fact Book 61 Fall 2013
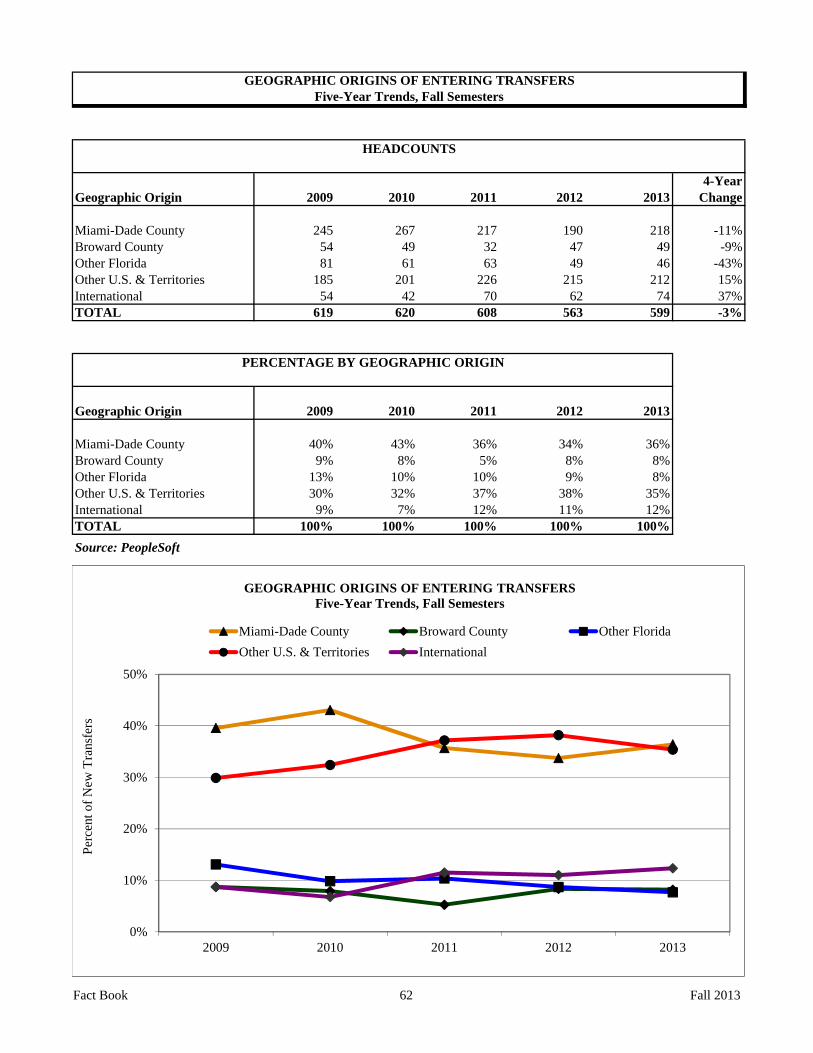
4-YearGeographic Origin 2009 2010 2011 2012 2013 Change
Miami-Dade County 245 267 217 190 218 -11%Broward County 54 49 32 47 49 -9%Other Florida 81 61 63 49 46 -43%Other U.S. & Territories 185 201 226 215 212 15%International 54 42 70 62 74 37%TOTAL 619 620 608 563 599 -3%
Geographic Origin 2009 2010 2011 2012 2013
Miami-Dade County 40% 43% 36% 34% 36%Broward County 9% 8% 5% 8% 8%Other Florida 13% 10% 10% 9% 8%Other U.S. & Territories 30% 32% 37% 38% 35%International 9% 7% 12% 11% 12%TOTAL 100% 100% 100% 100% 100%Source: PeopleSoft
INTERNATIONAL PROGRAMS
Five-Year Trends, Fall Semesters
HEADCOUNTS
PERCENTAGE BY GEOGRAPHIC ORIGIN
GEOGRAPHIC ORIGINS OF ENTERING TRANSFERS
0%
10%
20%
30%
40%
50%
2009 2010 2011 2012 2013
Perc
ent o
f New
Tra
nsfe
rs
GEOGRAPHIC ORIGINS OF ENTERING TRANSFERSFive-Year Trends, Fall Semesters
Miami-Dade County Broward County Other FloridaOther U.S. & Territories International
Fact Book 62 Fall 2013

Other Other U.S.,College/School Miami-Dade Broward Florida Territories International Total
Architecture 46 11 25 107 70 259Arts and Sciences 1,003 381 655 1,914 450 4,403Business 262 121 209 1,024 550 2,166Communication 216 56 96 561 158 1,087Education & Human Dev 100 48 57 309 26 540Engineering 207 90 105 465 215 1,082Frost School of Music 81 8 47 253 19 408Nursing & Health Studies 167 53 70 232 12 534Rosenstiel School 26 10 34 312 10 392Cont Std/Grad Sch/Joint Pgms 272 27 14 77 119 509TOTAL 2,380 805 1,312 5,254 1,629 11,380
Other Other U.S.,College/School Miami-Dade Broward Florida Territories International Total
Architecture 18% 4% 10% 41% 27% 100%Arts and Sciences 23% 9% 15% 43% 10% 100%Business 12% 6% 10% 47% 25% 100%Communication 20% 5% 9% 52% 15% 100%Education & Human Dev 19% 9% 11% 57% 5% 100%Engineering 19% 8% 10% 43% 20% 100%Frost School of Music 20% 2% 12% 62% 5% 100%Nursing & Health Studies 31% 10% 13% 43% 2% 100%Rosenstiel School 7% 3% 9% 80% 3% 100%Cont Std/Grad Sch/Joint Pgms 53% 5% 3% 15% 23% 100%TOTAL 21% 7% 12% 46% 14% 100%
Source: PeopleSoft
Fall Semester, 2013
HEADCOUNTS
PERCENTAGE BY GEOGRAPHIC ORIGIN
Note: Undergraduate students come from 50 states, the District of Columbia, 3 territories, and 105 other countries.
GEOGRAPHIC ORIGINS OF ALL UNDERGRADUATES
Fact Book 63 Fall 2013
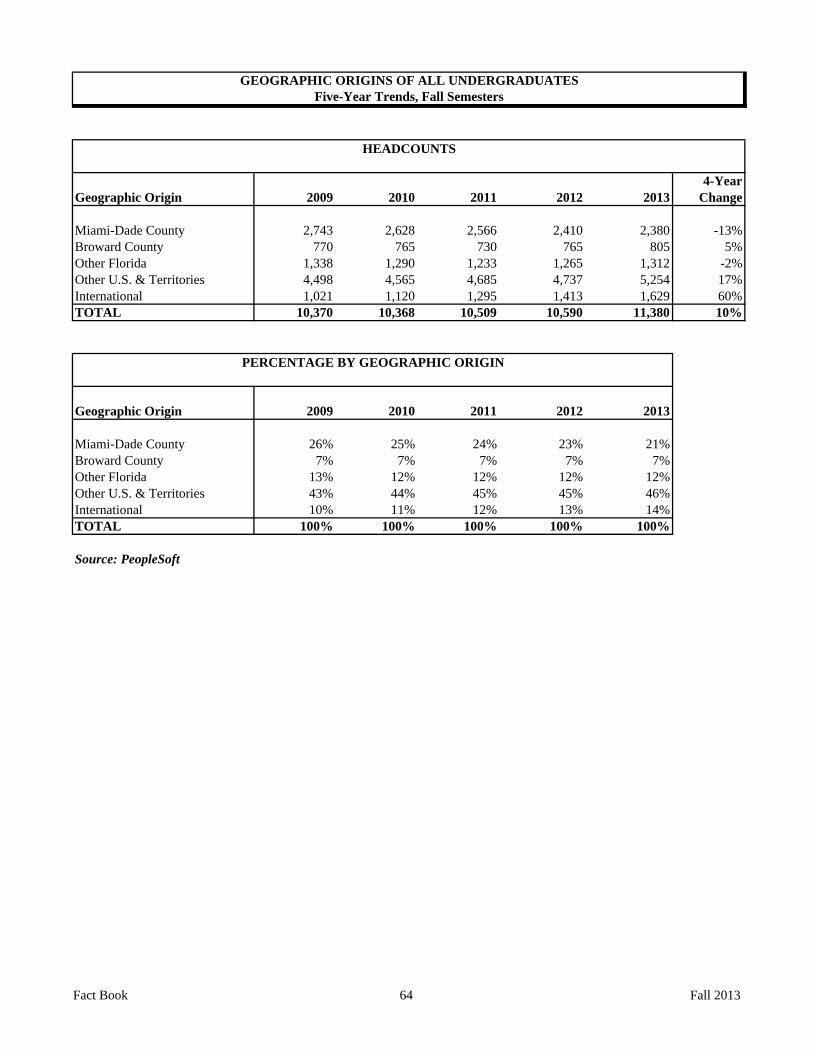
4-YearGeographic Origin 2009 2010 2011 2012 2013 Change
Miami-Dade County 2,743 2,628 2,566 2,410 2,380 -13%Broward County 770 765 730 765 805 5%Other Florida 1,338 1,290 1,233 1,265 1,312 -2%Other U.S. & Territories 4,498 4,565 4,685 4,737 5,254 17%International 1,021 1,120 1,295 1,413 1,629 60%TOTAL 10,370 10,368 10,509 10,590 11,380 10%
Geographic Origin 2009 2010 2011 2012 2013
Miami-Dade County 26% 25% 24% 23% 21%Broward County 7% 7% 7% 7% 7%Other Florida 13% 12% 12% 12% 12%Other U.S. & Territories 43% 44% 45% 45% 46%International 10% 11% 12% 13% 14%TOTAL 100% 100% 100% 100% 100%
Source: PeopleSoft
PERCENTAGE BY GEOGRAPHIC ORIGIN
GEOGRAPHIC ORIGINS OF ALL UNDERGRADUATESFive-Year Trends, Fall Semesters
HEADCOUNTS
Fact Book 64 Fall 2013
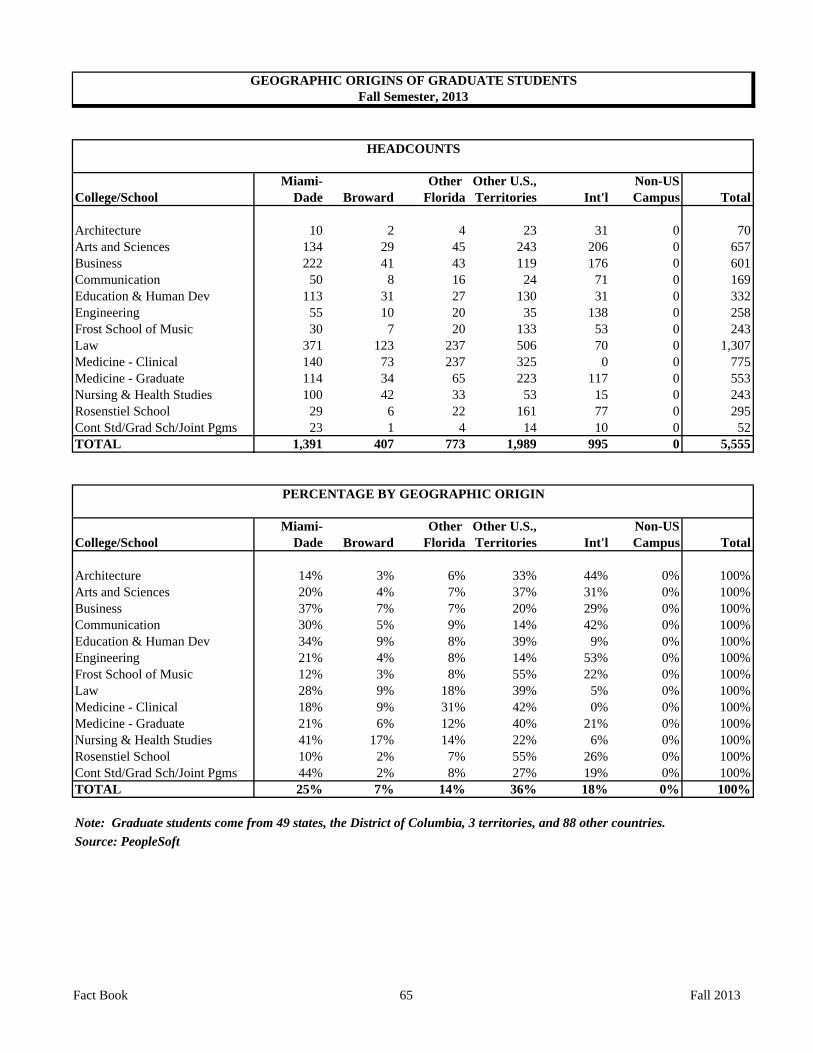
Miami- Other Other U.S., Non-USCollege/School Dade Broward Florida Territories Int'l Campus Total
Architecture 10 2 4 23 31 0 70Arts and Sciences 134 29 45 243 206 0 657Business 222 41 43 119 176 0 601Communication 50 8 16 24 71 0 169Education & Human Dev 113 31 27 130 31 0 332Engineering 55 10 20 35 138 0 258Frost School of Music 30 7 20 133 53 0 243Law 371 123 237 506 70 0 1,307Medicine - Clinical 140 73 237 325 0 0 775Medicine - Graduate 114 34 65 223 117 0 553Nursing & Health Studies 100 42 33 53 15 0 243Rosenstiel School 29 6 22 161 77 0 295Cont Std/Grad Sch/Joint Pgms 23 1 4 14 10 0 52TOTAL 1,391 407 773 1,989 995 0 5,555
Miami- Other Other U.S., Non-USCollege/School Dade Broward Florida Territories Int'l Campus Total
Architecture 14% 3% 6% 33% 44% 0% 100%Arts and Sciences 20% 4% 7% 37% 31% 0% 100%Business 37% 7% 7% 20% 29% 0% 100%Communication 30% 5% 9% 14% 42% 0% 100%Education & Human Dev 34% 9% 8% 39% 9% 0% 100%Engineering 21% 4% 8% 14% 53% 0% 100%Frost School of Music 12% 3% 8% 55% 22% 0% 100%Law 28% 9% 18% 39% 5% 0% 100%Medicine - Clinical 18% 9% 31% 42% 0% 0% 100%Medicine - Graduate 21% 6% 12% 40% 21% 0% 100%Nursing & Health Studies 41% 17% 14% 22% 6% 0% 100%Rosenstiel School 10% 2% 7% 55% 26% 0% 100%Cont Std/Grad Sch/Joint Pgms 44% 2% 8% 27% 19% 0% 100%TOTAL 25% 7% 14% 36% 18% 0% 100%
Source: PeopleSoft
Note: Graduate students come from 49 states, the District of Columbia, 3 territories, and 88 other countries.
GEOGRAPHIC ORIGINS OF GRADUATE STUDENTSFall Semester, 2013
HEADCOUNTS
PERCENTAGE BY GEOGRAPHIC ORIGIN
Fact Book 65 Fall 2013

4-YearGeographic Origin 2009 2010 2011 2012 2013 Change
Miami-Dade County 1,416 1,372 1,437 1,416 1,391 -2%Broward County 412 429 460 431 407 -1%Other Florida 840 837 899 848 773 -8%Other U.S. & Territories 1,939 1,946 1,973 1,981 1,989 3%International 652 705 790 906 995 53%Non-US Campus 0 0 0 0 0 naTOTAL 5,259 5,289 5,559 5,582 5,555 6%
Geographic Origin 2009 2010 2011 2012 2013
Miami-Dade County 27% 26% 26% 25% 25%Broward County 8% 8% 8% 8% 7%Other Florida 16% 16% 16% 15% 14%Other U.S. & Territories 37% 37% 35% 35% 36%International 12% 13% 14% 16% 18%Non-US Campus 0% 0% 0% 0% 0%TOTAL 100% 100% 100% 100% 100%
Source: PeopleSoft
GEOGRAPHIC ORIGINS OF GRADUATE STUDENTSFive-Year Trends, Fall Semesters
HEADCOUNTS
PERCENTAGE BY GEOGRAPHIC ORIGIN
Fact Book 66 Fall 2013
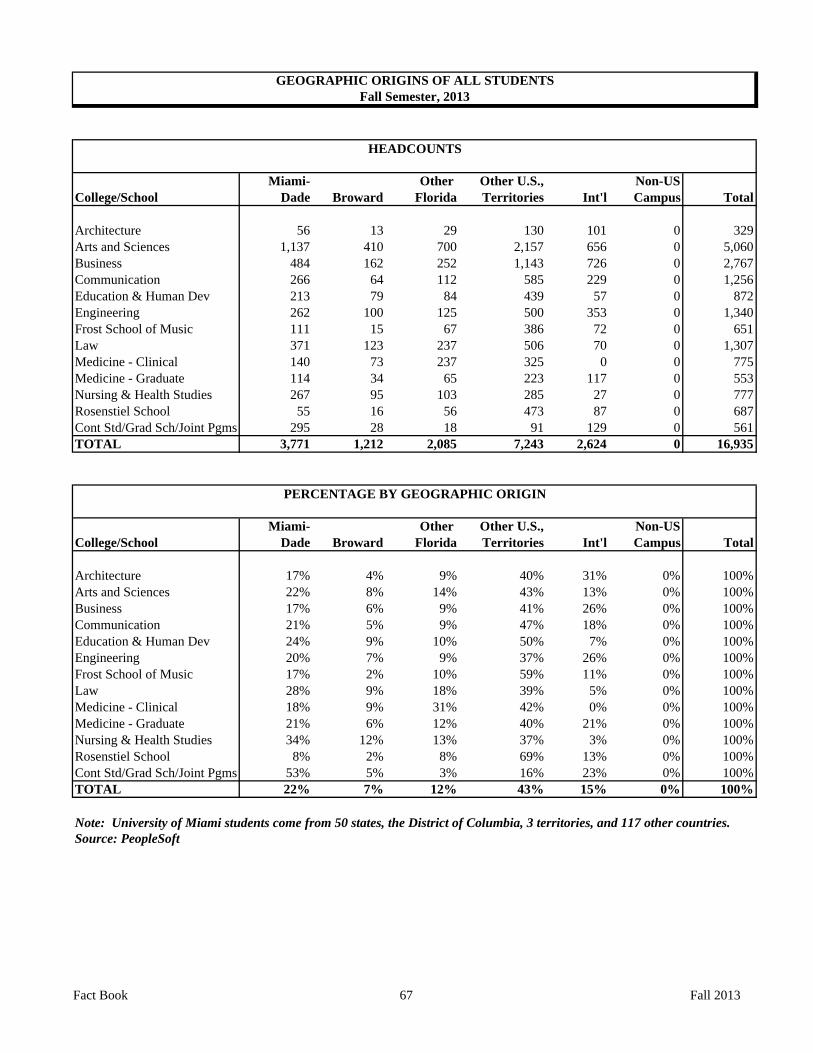
Miami- Other Other U.S., Non-USCollege/School Dade Broward Florida Territories Int'l Campus Total
Architecture 56 13 29 130 101 0 329Arts and Sciences 1,137 410 700 2,157 656 0 5,060Business 484 162 252 1,143 726 0 2,767Communication 266 64 112 585 229 0 1,256Education & Human Dev 213 79 84 439 57 0 872Engineering 262 100 125 500 353 0 1,340Frost School of Music 111 15 67 386 72 0 651Law 371 123 237 506 70 0 1,307Medicine - Clinical 140 73 237 325 0 0 775Medicine - Graduate 114 34 65 223 117 0 553Nursing & Health Studies 267 95 103 285 27 0 777Rosenstiel School 55 16 56 473 87 0 687Cont Std/Grad Sch/Joint Pgms 295 28 18 91 129 0 561TOTAL 3,771 1,212 2,085 7,243 2,624 0 16,935
Miami- Other Other U.S., Non-USCollege/School Dade Broward Florida Territories Int'l Campus Total
Architecture 17% 4% 9% 40% 31% 0% 100%Arts and Sciences 22% 8% 14% 43% 13% 0% 100%Business 17% 6% 9% 41% 26% 0% 100%Communication 21% 5% 9% 47% 18% 0% 100%Education & Human Dev 24% 9% 10% 50% 7% 0% 100%Engineering 20% 7% 9% 37% 26% 0% 100%Frost School of Music 17% 2% 10% 59% 11% 0% 100%Law 28% 9% 18% 39% 5% 0% 100%Medicine - Clinical 18% 9% 31% 42% 0% 0% 100%Medicine - Graduate 21% 6% 12% 40% 21% 0% 100%Nursing & Health Studies 34% 12% 13% 37% 3% 0% 100%Rosenstiel School 8% 2% 8% 69% 13% 0% 100%Cont Std/Grad Sch/Joint Pgms 53% 5% 3% 16% 23% 0% 100%TOTAL 22% 7% 12% 43% 15% 0% 100%
Note: University of Miami students come from 50 states, the District of Columbia, 3 territories, and 117 other countries.Source: PeopleSoft
GEOGRAPHIC ORIGINS OF ALL STUDENTSFall Semester, 2013
HEADCOUNTS
PERCENTAGE BY GEOGRAPHIC ORIGIN
Fact Book 67 Fall 2013

Miami- Other Other U.S., Non-USClass Dade Broward Florida Territories Int'l Campus Total
Freshman 307 98 244 1,359 473 0 2,481Sophomore 464 170 313 1,201 365 0 2,513Junior 560 219 319 1,274 358 0 2,730Senior 935 307 423 1,341 314 0 3,320Total DUG 2,266 794 1,299 5,175 1,510 0 11,044
NDUG 114 11 13 79 119 0 336Total UG 2,380 805 1,312 5,254 1,629 0 11,380
Graduate School 880 211 299 1,158 925 0 3,473M.D./J.D./LL.M. 511 196 474 831 70 0 2,082Total Graduate 1,391 407 773 1,989 995 0 5,555TOTAL 3,771 1,212 2,085 7,243 2,624 0 16,935
Miami- Other Other U.S.,Class Dade Broward Florida Territories Int'l Total Total
Freshman 12% 4% 10% 55% 19% 100% 100%Sophomore 18% 7% 12% 48% 15% 100% 100%Junior 21% 8% 12% 47% 13% 100% 100%Senior 28% 9% 13% 40% 9% 100% 100%Total DUG 21% 7% 12% 47% 14% 100% 100%
NDUG 34% 3% 4% 24% 35% 100% 100%Total UG 21% 7% 12% 46% 14% 100% 100%
Graduate School 25% 6% 9% 33% 27% 100% 100%M.D./J.D./LL.M. 25% 9% 23% 40% 3% 100% 100%Total Graduate 25% 7% 14% 36% 18% 100% 100%TOTAL 22% 7% 12% 43% 15% 100% 100%
Source: PeopleSoft
HEADCOUNTS
PERCENTAGE BY GEOGRAPHIC ORIGIN
GEOGRAPHIC ORIGIN OF ALL STUDENTS BY CLASSFall Semester, 2013
Fact Book 68 Fall 2013
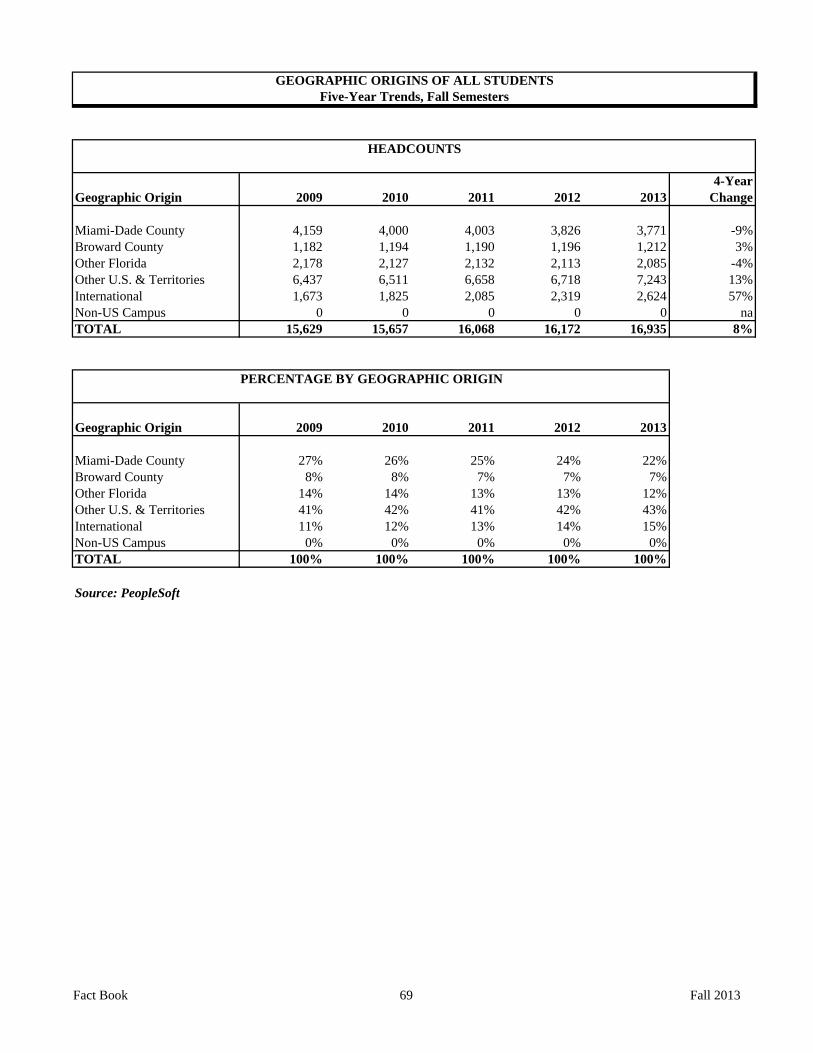
4-YearGeographic Origin 2009 2010 2011 2012 2013 Change
Miami-Dade County 4,159 4,000 4,003 3,826 3,771 -9%Broward County 1,182 1,194 1,190 1,196 1,212 3%Other Florida 2,178 2,127 2,132 2,113 2,085 -4%Other U.S. & Territories 6,437 6,511 6,658 6,718 7,243 13%International 1,673 1,825 2,085 2,319 2,624 57%Non-US Campus 0 0 0 0 0 naTOTAL 15,629 15,657 16,068 16,172 16,935 8%
Geographic Origin 2009 2010 2011 2012 2013
Miami-Dade County 27% 26% 25% 24% 22%Broward County 8% 8% 7% 7% 7%Other Florida 14% 14% 13% 13% 12%Other U.S. & Territories 41% 42% 41% 42% 43%International 11% 12% 13% 14% 15%Non-US Campus 0% 0% 0% 0% 0%TOTAL 100% 100% 100% 100% 100%
Source: PeopleSoft
GEOGRAPHIC ORIGINS OF ALL STUDENTSFive-Year Trends, Fall Semesters
HEADCOUNTS
PERCENTAGE BY GEOGRAPHIC ORIGIN
Fact Book 69 Fall 2013

New New TotalState/Country Freshmen Transfers DUG NDUG Graduate Total
NEW ENGLAND
Connecticut 40 13 208 0 42 250Maine 4 1 22 0 5 27Massachusetts 58 13 296 7 92 395New Hampshire 12 1 32 0 11 43Rhode Island 9 1 37 1 12 50Vermont 0 1 12 0 3 15TOTAL 123 30 607 8 165 780
MIDDLE STATES
Delaware 11 0 21 0 6 27District of Columbia 4 1 14 0 18 32Maryland 72 11 273 5 83 361New Jersey 148 29 622 6 127 755New York 194 41 819 19 239 1,077Pennsylvania 61 6 282 7 111 400TOTAL 490 88 2,031 37 584 2,652
SOUTHERN
Alabama 6 0 16 0 23 39Florida 634 313 4,359 138 2,571 7,068Georgia 51 5 169 0 95 264Kentucky 6 0 18 0 20 38Louisiana 3 1 28 0 19 47Mississippi 2 0 8 0 3 11North Carolina 17 4 73 0 64 137South Carolina 5 0 22 0 25 47Tennessee 20 0 76 0 30 106Virginia 37 13 195 3 71 269TOTAL 781 336 4,964 141 2,921 8,026
MIDWESTERN
Illinois 112 14 377 5 92 474Indiana 11 2 29 1 29 59Iowa 2 0 12 2 13 27Kansas 2 0 23 0 11 34Michigan 19 7 103 1 50 154Minnesota 10 3 49 0 26 75Missouri 29 2 107 1 35 143Nebraska 3 0 12 0 3 15North Dakota 1 0 2 0 0 2Ohio 37 3 117 2 56 175South Dakota 0 0 2 0 3 5
UNDERGRADUATE
HEADCOUNTS BY STATE OR COUNTRY AND BY WORLD REGIONFall Semester, 2013
Fact Book 70 Fall 2013

New New TotalState/Country Freshmen Transfers DUG NDUG Graduate Total
UNDERGRADUATE
HEADCOUNTS BY STATE OR COUNTRY AND BY WORLD REGIONFall Semester, 2013
West Virginia 2 0 7 0 3 10Wisconsin 9 3 32 1 17 50TOTAL 237 34 872 13 338 1,223
WESTERN
Alaska 0 0 3 0 2 5Arizona 2 2 22 0 21 43California 70 15 367 8 200 575Colorado 15 0 80 1 28 109Hawaii 15 1 62 0 7 69Idaho 2 0 6 0 4 10Montana 1 0 3 0 2 5Nevada 3 1 14 0 5 19Oregon 3 0 12 0 18 30Utah 4 0 11 1 20 32Washington 5 2 26 1 22 49Wyoming 1 0 2 0 2 4TOTAL 121 21 608 11 331 950
SOUTHWESTERN
Arkansas 0 0 4 0 9 13New Mexico 1 0 12 1 8 21Oklahoma 1 1 9 0 6 15Texas 42 10 172 1 96 269TOTAL 44 11 197 2 119 318
U. S. TERRITORIES
Guam 0 0 1 0 1 2Puerto Rico 6 3 28 0 36 64Virgin Islands 1 0 13 0 3 16TOTAL 7 3 42 0 40 82
US LIVING ABROAD
US Students Living Abroad 46 2 213 5 62 280TOTAL 46 2 213 5 62 280
NORTH AMERICA
Canada 7 1 36 0 41 77Mexico 1 1 20 2 16 38TOTAL 8 2 56 2 57 115
Fact Book 71 Fall 2013

New New TotalState/Country Freshmen Transfers DUG NDUG Graduate Total
UNDERGRADUATE
HEADCOUNTS BY STATE OR COUNTRY AND BY WORLD REGIONFall Semester, 2013
CARIBBEAN
Bahamas 0 1 4 0 1 5Barbados 0 0 1 0 0 1Cayman Islands 0 0 1 0 0 1Dominica 0 1 1 0 1 2Dominican Republic 1 1 8 0 3 11Haiti 1 1 2 0 0 2Jamaica 0 2 8 0 4 12Leeward Islands 0 0 0 2 3 5Trinidad & Tobago 2 0 10 0 9 19Windward Islands 0 0 0 0 1 1TOTAL 4 6 35 2 22 59
CENTRAL AMERICA
Belize 0 0 1 1 0 2Costa Rica 0 0 1 0 4 5El Salvador 0 0 1 0 0 1Guatemala 0 1 7 0 2 9Honduras 1 0 4 0 4 8Nicaragua 0 0 0 0 1 1Panama 5 0 14 0 3 17TOTAL 6 1 28 1 14 43
SOUTH AMERICA
Argentina 2 1 8 1 12 21Bolivia 1 1 7 0 3 10Brazil 19 2 52 9 20 81Chile 0 0 1 0 5 6Colombia 7 3 31 2 38 71Ecuador 4 1 17 0 16 33Guyana 0 1 1 0 0 1Peru 1 0 4 0 4 8Suriname 0 0 1 0 0 1Uruguay 2 0 9 0 0 9Venezuela 17 17 167 0 31 198TOTAL 53 26 298 12 129 439
EUROPE
Albania 0 0 0 0 1 1Armenia 0 0 0 0 1 1Austria 0 0 2 3 2 7Belgium 1 0 3 2 6 11Bulgaria 0 0 2 0 1 3
Fact Book 72 Fall 2013

New New TotalState/Country Freshmen Transfers DUG NDUG Graduate Total
UNDERGRADUATE
HEADCOUNTS BY STATE OR COUNTRY AND BY WORLD REGIONFall Semester, 2013
Czech Republic 1 0 2 1 3 6Denmark 0 0 0 1 1 2Estonia 0 0 1 0 0 1Finland 0 0 1 2 0 3France 6 0 22 7 13 42Germany 4 0 16 7 16 39Greece 1 0 1 0 4 5Hungary 0 0 1 0 0 1Iceland 0 0 0 1 2 3Ireland, Eire 1 0 1 4 1 6Italy 8 1 44 2 16 62Kazakhstan 0 0 4 0 3 7Latvia 0 0 2 0 1 3Lithuania 0 0 1 0 1 2Macedonia 1 0 1 0 1 2Moldova 0 0 0 0 4 4Monaco 0 0 1 0 0 1Netherlands 1 1 6 1 1 8Norway 0 0 3 0 0 3Poland 0 0 1 0 1 2Portugal 0 0 4 0 2 6Romania 0 0 2 0 0 2Russia 2 3 15 0 16 31Serbia 1 0 1 0 2 3Slovakia 0 0 1 0 1 2Slovenia 0 0 1 0 1 2Spain 2 2 22 12 8 42Sweden 4 0 8 2 1 11Switzerland 1 0 6 1 5 12Turkmenistan 0 0 0 0 1 1Ukraine 2 0 4 0 4 8United Kingdom 9 0 27 24 7 58Uzbekistan 0 0 1 0 1 2TOTAL 45 7 207 70 128 405
MIDDLE EAST
Bahrain 0 0 1 0 0 1Cyprus 0 0 0 0 1 1Egypt 1 0 5 0 8 13Iran 0 1 1 0 22 23Israel 0 0 3 0 1 4Jordan 0 0 4 0 1 5Kuwait 15 5 63 0 4 67Lebanon 0 0 2 0 4 6Oman 0 0 1 0 0 1Qatar 0 0 3 0 0 3
Fact Book 73 Fall 2013
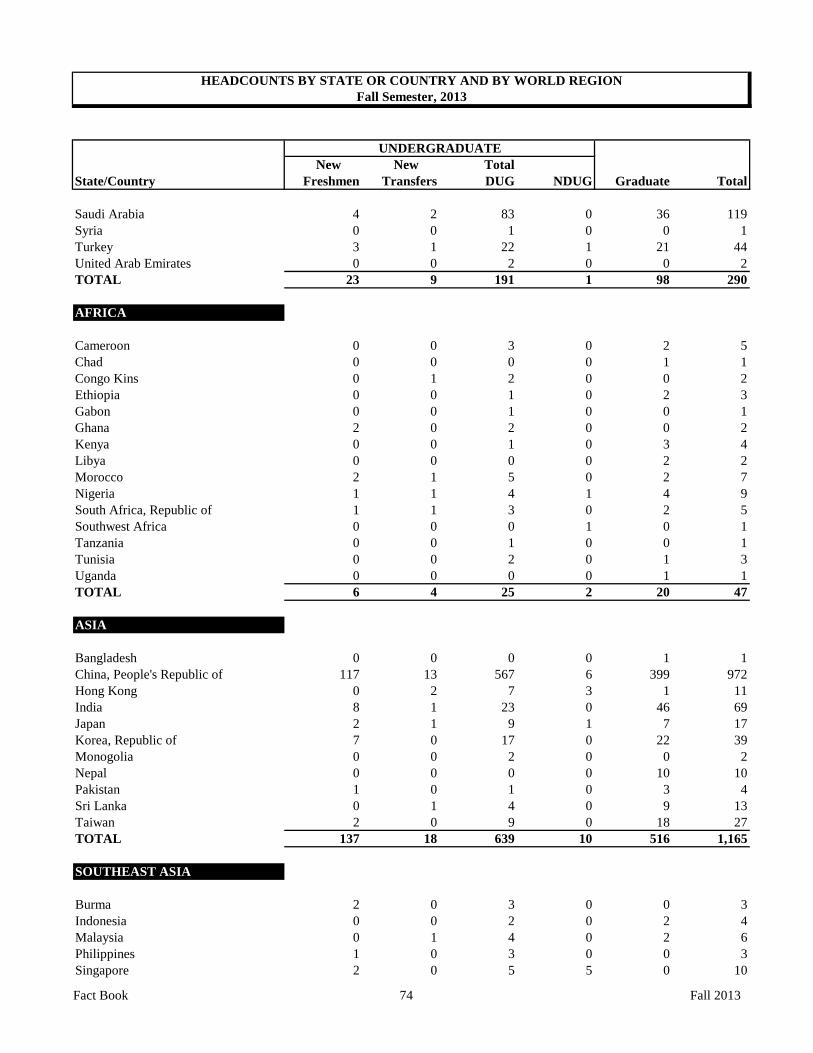
New New TotalState/Country Freshmen Transfers DUG NDUG Graduate Total
UNDERGRADUATE
HEADCOUNTS BY STATE OR COUNTRY AND BY WORLD REGIONFall Semester, 2013
Saudi Arabia 4 2 83 0 36 119Syria 0 0 1 0 0 1Turkey 3 1 22 1 21 44United Arab Emirates 0 0 2 0 0 2TOTAL 23 9 191 1 98 290
AFRICA
Cameroon 0 0 3 0 2 5Chad 0 0 0 0 1 1Congo Kins 0 1 2 0 0 2Ethiopia 0 0 1 0 2 3Gabon 0 0 1 0 0 1Ghana 2 0 2 0 0 2Kenya 0 0 1 0 3 4Libya 0 0 0 0 2 2Morocco 2 1 5 0 2 7Nigeria 1 1 4 1 4 9South Africa, Republic of 1 1 3 0 2 5Southwest Africa 0 0 0 1 0 1Tanzania 0 0 1 0 0 1Tunisia 0 0 2 0 1 3Uganda 0 0 0 0 1 1TOTAL 6 4 25 2 20 47
ASIA
Bangladesh 0 0 0 0 1 1China, People's Republic of 117 13 567 6 399 972Hong Kong 0 2 7 3 1 11India 8 1 23 0 46 69Japan 2 1 9 1 7 17Korea, Republic of 7 0 17 0 22 39Monogolia 0 0 2 0 0 2Nepal 0 0 0 0 10 10Pakistan 1 0 1 0 3 4Sri Lanka 0 1 4 0 9 13Taiwan 2 0 9 0 18 27TOTAL 137 18 639 10 516 1,165
SOUTHEAST ASIA
Burma 2 0 3 0 0 3Indonesia 0 0 2 0 2 4Malaysia 0 1 4 0 2 6Philippines 1 0 3 0 0 3Singapore 2 0 5 5 0 10
Fact Book 74 Fall 2013
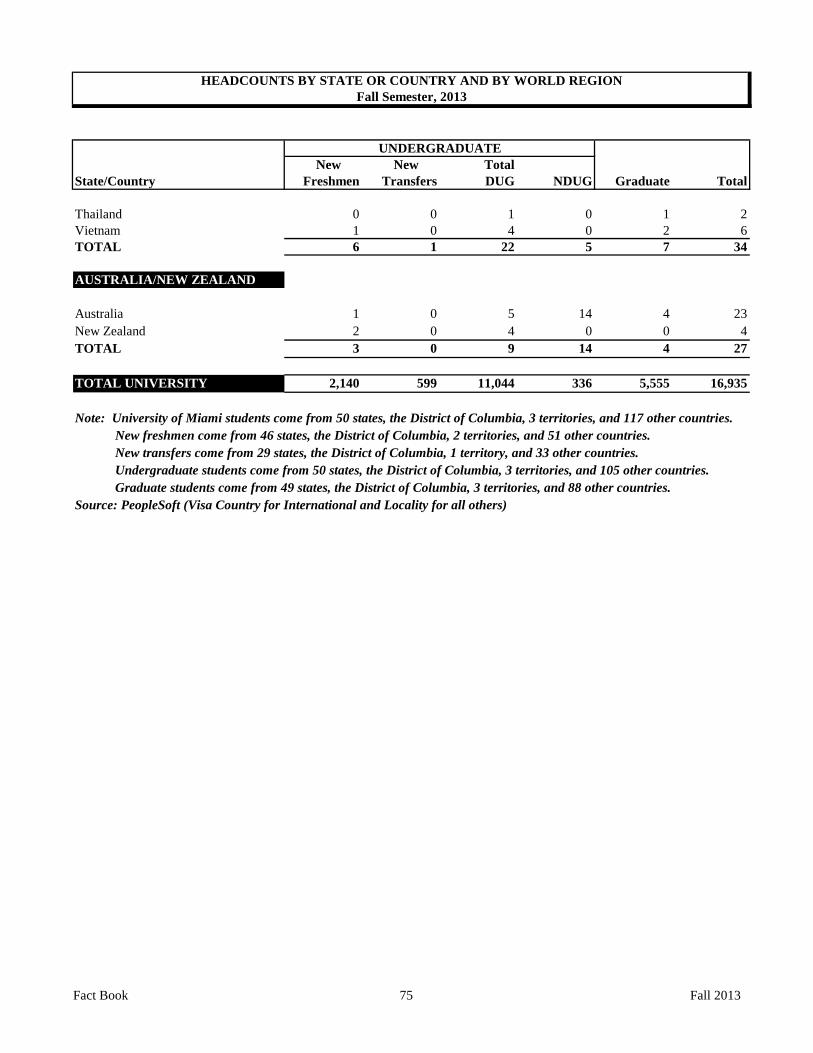
New New TotalState/Country Freshmen Transfers DUG NDUG Graduate Total
UNDERGRADUATE
HEADCOUNTS BY STATE OR COUNTRY AND BY WORLD REGIONFall Semester, 2013
Thailand 0 0 1 0 1 2Vietnam 1 0 4 0 2 6TOTAL 6 1 22 5 7 34
AUSTRALIA/NEW ZEALAND
Australia 1 0 5 14 4 23New Zealand 2 0 4 0 0 4TOTAL 3 0 9 14 4 27
TOTAL UNIVERSITY 2,140 599 11,044 336 5,555 16,935
Note: University of Miami students come from 50 states, the District of Columbia, 3 territories, and 117 other countries. New freshmen come from 46 states, the District of Columbia, 2 territories, and 51 other countries. New transfers come from 29 states, the District of Columbia, 1 territory, and 33 other countries. Undergraduate students come from 50 states, the District of Columbia, 3 territories, and 105 other countries. Graduate students come from 49 states, the District of Columbia, 3 territories, and 88 other countries.Source: PeopleSoft (Visa Country for International and Locality for all others)
Fact Book 75 Fall 2013

DISTRIBUTION OF NEW FRESHMEN IN THE U.S.Fall Semester, 2013
DISTRIBUTION OF ALL UNDERGRADUATES IN THE U.S.Fall Semester, 2013
Fact Book 76 Fall 2013
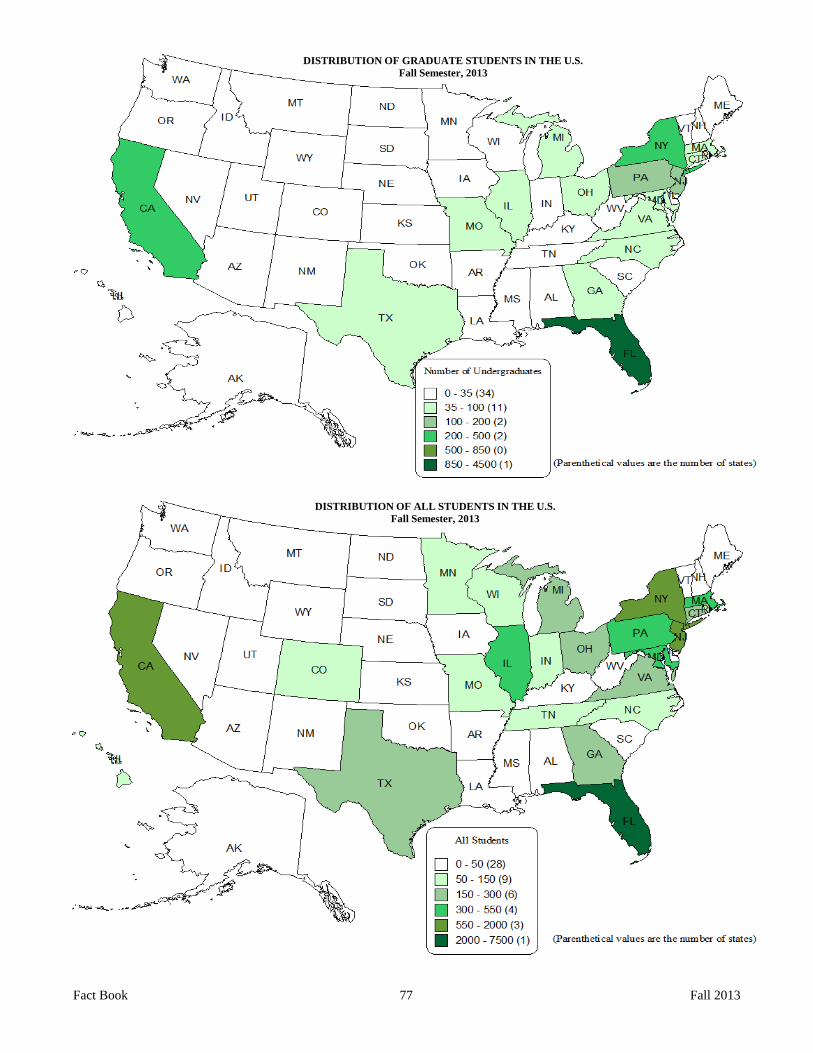
DISTRIBUTION OF ALL STUDENTS IN THE U.S.Fall Semester, 2013
DISTRIBUTION OF GRADUATE STUDENTS IN THE U.S.Fall Semester, 2013
Fact Book 77 Fall 2013

4-YearRegion 2009 2010 2011 2012 2013 ChangeFlorida 776 786 730 736 634 -18%New England States 130 156 125 107 123 -5%Middle States 398 471 438 351 490 23%Southern States (excluding FL) 110 153 144 119 147 34%Midwestern States 161 177 236 191 237 47%Western States 73 129 131 141 121 66%Southwestern States 57 38 52 39 44 -23%Territories (U.S.) 13 14 10 7 7 -46%U.S. Living Abroad 45 36 39 44 46 2%North America (excluding U.S.) 6 9 11 11 8 33%Caribbean 11 6 5 10 4 -64%Central America 2 3 0 3 6 200%South America 21 32 42 40 53 152%Europe 30 26 38 39 45 50%Middle East 18 14 29 33 23 28%Africa 5 2 7 6 6 20%Asia 146 76 128 128 137 -6%Southeast Asia 2 4 6 6 6 200%Australia/New Zealand 2 0 1 1 3 50%TOTAL 2,006 2,132 2,172 2,012 2,140 7%
Region 2009 2010 2011 2012 2013Florida 39% 37% 34% 37% 30%New England States 6% 7% 6% 5% 6%Middle States 20% 22% 20% 17% 23%Southern States (excluding FL) 5% 7% 7% 6% 7%Midwestern States 8% 8% 11% 9% 11%Western States 4% 6% 6% 7% 6%Southwestern States 3% 2% 2% 2% 2%Territories (U.S.) 1% 1% 0% 0% 0%U.S. Living Abroad 2% 2% 2% 2% 2%North America (excluding U.S.) 0% 0% 1% 1% 0%Caribbean 1% 0% 0% 0% 0%Central America 0% 0% 0% 0% 0%South America 1% 2% 2% 2% 2%Europe 1% 1% 2% 2% 2%Middle East 1% 1% 1% 2% 1%Africa 0% 0% 0% 0% 0%Asia 7% 4% 6% 6% 6%Southeast Asia 0% 0% 0% 0% 0%Australia/New Zealand 0% 0% 0% 0% 0%TOTAL 100% 100% 100% 100% 100%Source: PeopleSoft
NEW FRESHMEN BY WORLD REGIONFive-Year Trends, Fall Semesters
HEADCOUNTS
PERCENTAGE BY WORLD REGION
Fact Book 78 Fall 2013

4-YearRegion 2009 2010 2011 2012 2013 ChangeFlorida 4,851 4,683 4,529 4,440 4,497 -7%New England States 604 621 616 592 615 2%Middle States 1,878 1,864 1,872 1,846 2,068 10%Southern States (excluding FL) 506 531 539 540 608 20%Midwestern States 707 688 729 782 885 25%Western States 365 445 497 557 619 70%Southwestern States 228 199 207 191 199 -13%Territories (U.S.) 42 49 48 43 42 0%U.S. Living Abroad 168 168 177 186 218 30%North America (excluding U.S.) 63 62 62 63 58 -8%Caribbean 78 56 44 45 37 -53%Central America 13 12 11 15 29 123%South America 161 175 209 224 310 93%Europe 253 263 269 268 277 9%Middle East 124 125 137 141 192 55%Africa 17 17 15 21 27 59%Asia 276 354 494 586 649 135%Southeast Asia 10 13 17 22 27 170%Pacific Islands 0 1 0 0 0 naAustralia/New Zealand 26 42 37 28 23 -12%TOTAL 10,370 10,368 10,509 10,590 11,380 10%
Region 2009 2010 2011 2012 2013Florida 47% 45% 43% 42% 40%New England States 6% 6% 6% 6% 5%Middle States 18% 18% 18% 17% 18%Southern States (excluding FL) 5% 5% 5% 5% 5%Midwestern States 7% 7% 7% 7% 8%Western States 4% 4% 5% 5% 5%Southwestern States 2% 2% 2% 2% 2%Territories (U.S.) 0% 0% 0% 0% 0%U.S. Living Abroad 2% 2% 2% 2% 2%North America (excluding U.S.) 1% 1% 1% 1% 1%Caribbean 1% 1% 0% 0% 0%Central America 0% 0% 0% 0% 0%South America 2% 2% 2% 2% 3%Europe 2% 3% 3% 3% 2%Middle East 1% 1% 1% 1% 2%Africa 0% 0% 0% 0% 0%Asia 3% 3% 5% 6% 6%Southeast Asia 0% 0% 0% 0% 0%Pacific Islands 0% 0% 0% 0% 0%Australia/New Zealand 0% 0% 0% 0% 0%TOTAL 100% 100% 100% 100% 100%Source: PeopleSoft
HEADCOUNTS
PERCENTAGE BY WORLD REGION
Five-Year Trends, Fall SemestersALL UNDERGRADUATES BY WORLD REGION
Fact Book 79 Fall 2013
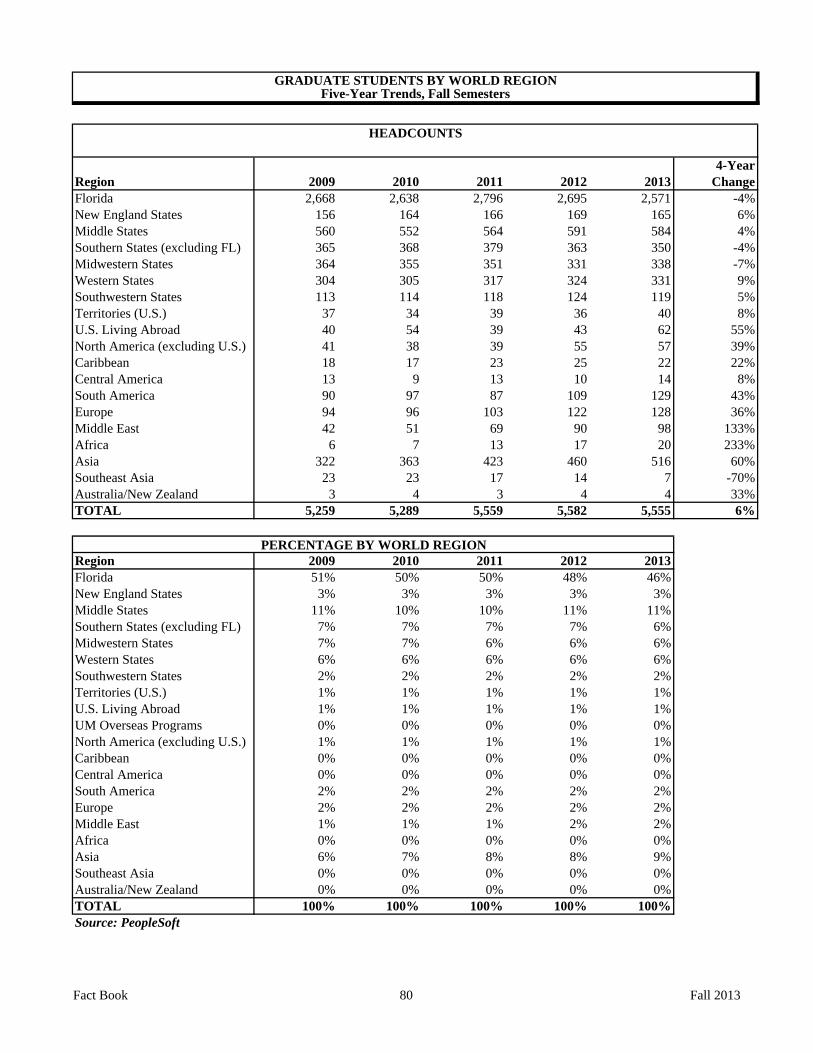
4-YearRegion 2009 2010 2011 2012 2013 ChangeFlorida 2,668 2,638 2,796 2,695 2,571 -4%New England States 156 164 166 169 165 6%Middle States 560 552 564 591 584 4%Southern States (excluding FL) 365 368 379 363 350 -4%Midwestern States 364 355 351 331 338 -7%Western States 304 305 317 324 331 9%Southwestern States 113 114 118 124 119 5%Territories (U.S.) 37 34 39 36 40 8%U.S. Living Abroad 40 54 39 43 62 55%North America (excluding U.S.) 41 38 39 55 57 39%Caribbean 18 17 23 25 22 22%Central America 13 9 13 10 14 8%South America 90 97 87 109 129 43%Europe 94 96 103 122 128 36%Middle East 42 51 69 90 98 133%Africa 6 7 13 17 20 233%Asia 322 363 423 460 516 60%Southeast Asia 23 23 17 14 7 -70%Australia/New Zealand 3 4 3 4 4 33%TOTAL 5,259 5,289 5,559 5,582 5,555 6%
Region 2009 2010 2011 2012 2013Florida 51% 50% 50% 48% 46%New England States 3% 3% 3% 3% 3%Middle States 11% 10% 10% 11% 11%Southern States (excluding FL) 7% 7% 7% 7% 6%Midwestern States 7% 7% 6% 6% 6%Western States 6% 6% 6% 6% 6%Southwestern States 2% 2% 2% 2% 2%Territories (U.S.) 1% 1% 1% 1% 1%U.S. Living Abroad 1% 1% 1% 1% 1%UM Overseas Programs 0% 0% 0% 0% 0%North America (excluding U.S.) 1% 1% 1% 1% 1%Caribbean 0% 0% 0% 0% 0%Central America 0% 0% 0% 0% 0%South America 2% 2% 2% 2% 2%Europe 2% 2% 2% 2% 2%Middle East 1% 1% 1% 2% 2%Africa 0% 0% 0% 0% 0%Asia 6% 7% 8% 8% 9%Southeast Asia 0% 0% 0% 0% 0%Australia/New Zealand 0% 0% 0% 0% 0%TOTAL 100% 100% 100% 100% 100%Source: PeopleSoft
GRADUATE STUDENTS BY WORLD REGIONFive-Year Trends, Fall Semesters
HEADCOUNTS
PERCENTAGE BY WORLD REGION
Fact Book 80 Fall 2013
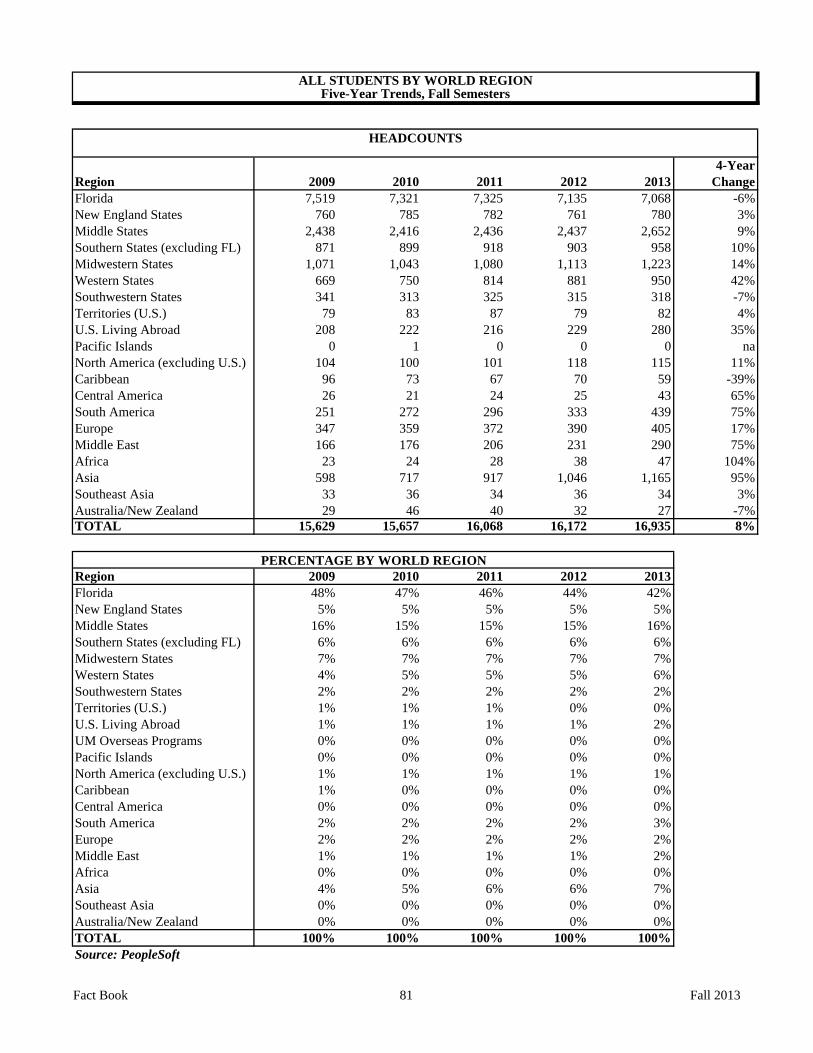
4-YearRegion 2009 2010 2011 2012 2013 ChangeFlorida 7,519 7,321 7,325 7,135 7,068 -6%New England States 760 785 782 761 780 3%Middle States 2,438 2,416 2,436 2,437 2,652 9%Southern States (excluding FL) 871 899 918 903 958 10%Midwestern States 1,071 1,043 1,080 1,113 1,223 14%Western States 669 750 814 881 950 42%Southwestern States 341 313 325 315 318 -7%Territories (U.S.) 79 83 87 79 82 4%U.S. Living Abroad 208 222 216 229 280 35%Pacific Islands 0 1 0 0 0 naNorth America (excluding U.S.) 104 100 101 118 115 11%Caribbean 96 73 67 70 59 -39%Central America 26 21 24 25 43 65%South America 251 272 296 333 439 75%Europe 347 359 372 390 405 17%Middle East 166 176 206 231 290 75%Africa 23 24 28 38 47 104%Asia 598 717 917 1,046 1,165 95%Southeast Asia 33 36 34 36 34 3%Australia/New Zealand 29 46 40 32 27 -7%TOTAL 15,629 15,657 16,068 16,172 16,935 8%
Region 2009 2010 2011 2012 2013Florida 48% 47% 46% 44% 42%New England States 5% 5% 5% 5% 5%Middle States 16% 15% 15% 15% 16%Southern States (excluding FL) 6% 6% 6% 6% 6%Midwestern States 7% 7% 7% 7% 7%Western States 4% 5% 5% 5% 6%Southwestern States 2% 2% 2% 2% 2%Territories (U.S.) 1% 1% 1% 0% 0%U.S. Living Abroad 1% 1% 1% 1% 2%UM Overseas Programs 0% 0% 0% 0% 0%Pacific Islands 0% 0% 0% 0% 0%North America (excluding U.S.) 1% 1% 1% 1% 1%Caribbean 1% 0% 0% 0% 0%Central America 0% 0% 0% 0% 0%South America 2% 2% 2% 2% 3%Europe 2% 2% 2% 2% 2%Middle East 1% 1% 1% 1% 2%Africa 0% 0% 0% 0% 0%Asia 4% 5% 6% 6% 7%Southeast Asia 0% 0% 0% 0% 0%Australia/New Zealand 0% 0% 0% 0% 0%TOTAL 100% 100% 100% 100% 100%Source: PeopleSoft
PERCENTAGE BY WORLD REGION
ALL STUDENTS BY WORLD REGIONFive-Year Trends, Fall Semesters
HEADCOUNTS
Fact Book 81 Fall 2013

Class Catholic Hindu Jewish Muslim Protestant Other Unknown Total
Freshman 115 5 53 17 121 37 2,133 2,481Sophomore 297 25 105 42 370 77 1,597 2,513Junior 377 35 137 32 471 98 1,580 2,730Senior 533 22 175 40 651 177 1,722 3,320NDUG 12 0 1 1 13 4 305 336TOTAL UG 1,334 87 471 132 1,626 393 7,337 11,380
Master's in Grad School 172 2 34 18 224 63 1,408 1,921Doctoral in Grad School 127 27 29 17 272 113 900 1,485Non-Degree Graduate 4 0 0 0 5 1 57 67MD/JD/LLM 159 30 102 15 247 53 1,476 2,082TOTAL GRADUATE 462 59 165 50 748 230 3,841 5,555TOTAL (ALL CLASSES) 1,796 146 636 182 2,374 623 11,178 16,935
Class Catholic Hindu Jewish Muslim Protestant Other Total
Freshman 33% 1% 15% 5% 35% 11% 100%Sophomore 32% 3% 11% 5% 40% 8% 100%Junior 33% 3% 12% 3% 41% 9% 100%Senior 33% 1% 11% 3% 41% 11% 100%NDUG 39% 0% 3% 3% 42% 13% 100%TOTAL UG 33% 2% 12% 3% 40% 10% 100%
Master's in Grad School 34% 0% 7% 4% 44% 12% 100%Doctoral in Grad School 22% 5% 5% 3% 46% 19% 100%Non-Degree Graduate 40% 0% 0% 0% 50% 10% 100%MD/JD/LLM 26% 5% 17% 2% 41% 9% 100%TOTAL GRADUATE 27% 3% 10% 3% 44% 13% 100%TOTAL (ALL CLASSES) 31% 3% 11% 3% 41% 11% 100%
Note: Adjusted percentages exclude unknowns.Source: PeopleSoft
HEADCOUNTS
RELIGIOUS AFFILIATIONS OF STUDENTS BY CLASSFall Semester, 2013
ADJUSTED PERCENTAGES BY RELIGION
Fact Book 82 Fall 2013
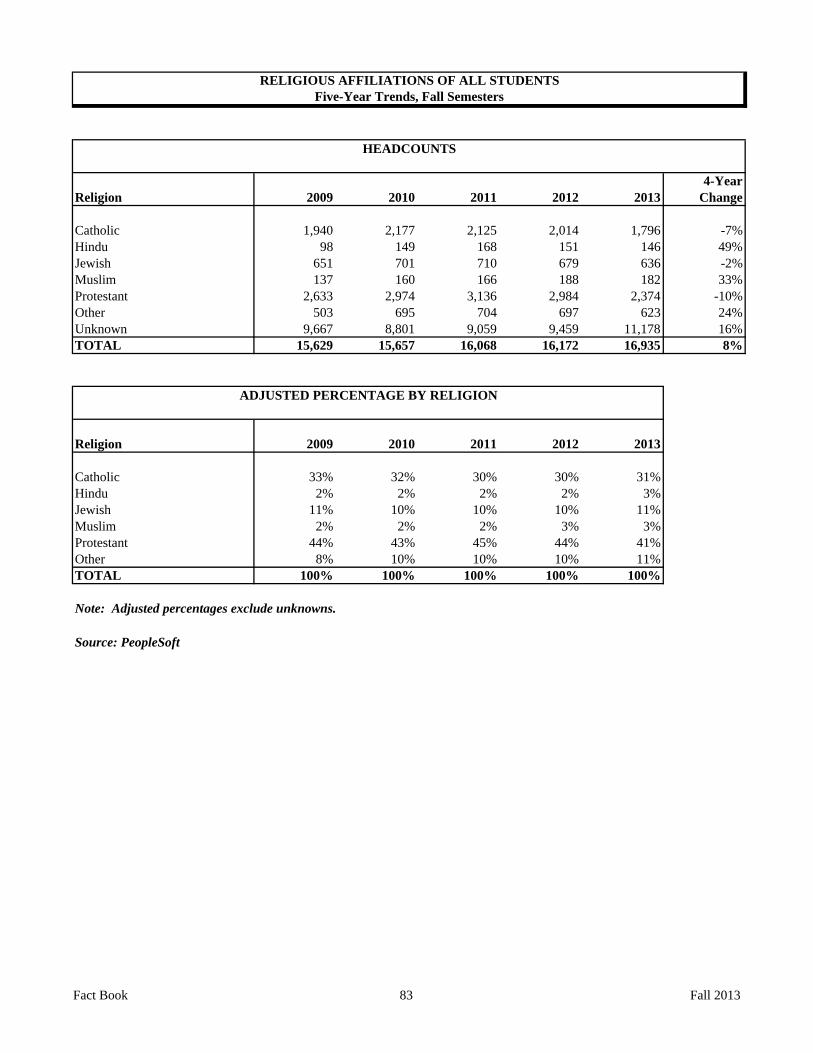
4-YearReligion 2009 2010 2011 2012 2013 Change
Catholic 1,940 2,177 2,125 2,014 1,796 -7%Hindu 98 149 168 151 146 49%Jewish 651 701 710 679 636 -2%Muslim 137 160 166 188 182 33%Protestant 2,633 2,974 3,136 2,984 2,374 -10%Other 503 695 704 697 623 24%Unknown 9,667 8,801 9,059 9,459 11,178 16%TOTAL 15,629 15,657 16,068 16,172 16,935 8%
Religion 2009 2010 2011 2012 2013
Catholic 33% 32% 30% 30% 31%Hindu 2% 2% 2% 2% 3%Jewish 11% 10% 10% 10% 11%Muslim 2% 2% 2% 3% 3%Protestant 44% 43% 45% 44% 41%Other 8% 10% 10% 10% 11%TOTAL 100% 100% 100% 100% 100%
Note: Adjusted percentages exclude unknowns.
Source: PeopleSoft
RELIGIOUS AFFILIATIONS OF ALL STUDENTSFive-Year Trends, Fall Semesters
HEADCOUNTS
ADJUSTED PERCENTAGE BY RELIGION
Fact Book 83 Fall 2013
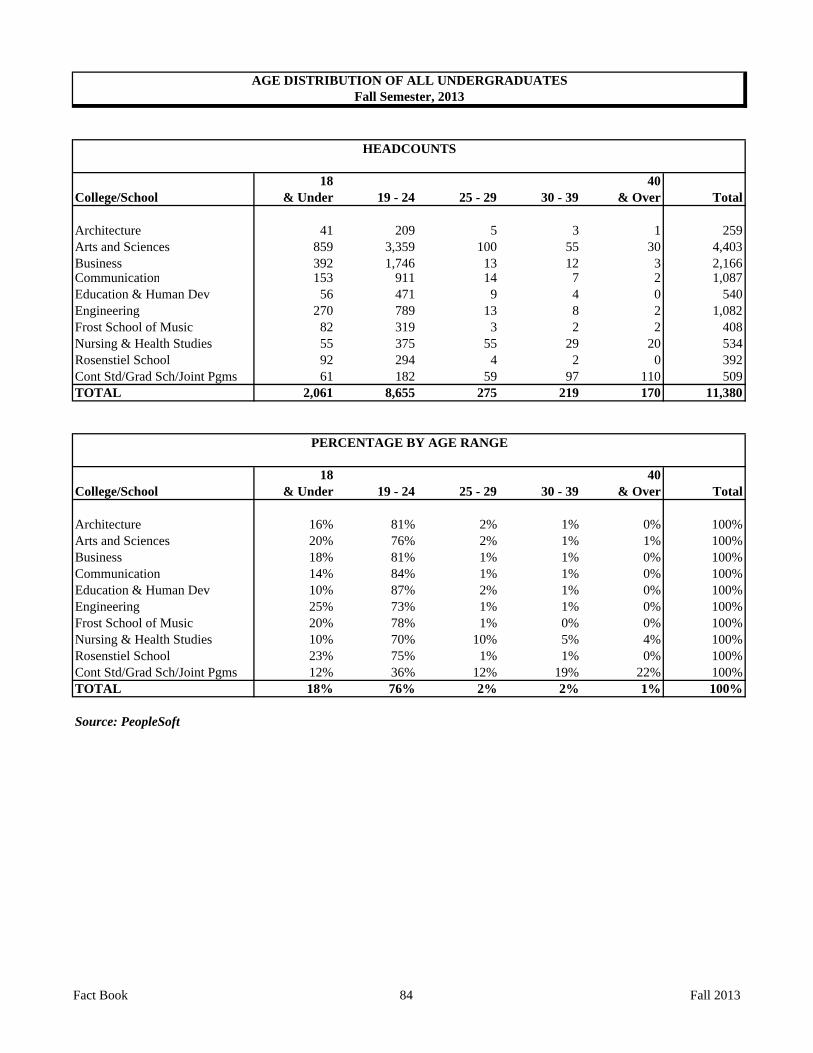
18 40College/School & Under 19 - 24 25 - 29 30 - 39 & Over Total
Architecture 41 209 5 3 1 259Arts and Sciences 859 3,359 100 55 30 4,403Business 392 1,746 13 12 3 2,166Communication 153 911 14 7 2 1,087Education & Human Dev 56 471 9 4 0 540Engineering 270 789 13 8 2 1,082Frost School of Music 82 319 3 2 2 408Nursing & Health Studies 55 375 55 29 20 534Rosenstiel School 92 294 4 2 0 392Cont Std/Grad Sch/Joint Pgms 61 182 59 97 110 509TOTAL 2,061 8,655 275 219 170 11,380
18 40College/School & Under 19 - 24 25 - 29 30 - 39 & Over Total
Architecture 16% 81% 2% 1% 0% 100%Arts and Sciences 20% 76% 2% 1% 1% 100%Business 18% 81% 1% 1% 0% 100%Communication 14% 84% 1% 1% 0% 100%Education & Human Dev 10% 87% 2% 1% 0% 100%Engineering 25% 73% 1% 1% 0% 100%Frost School of Music 20% 78% 1% 0% 0% 100%Nursing & Health Studies 10% 70% 10% 5% 4% 100%Rosenstiel School 23% 75% 1% 1% 0% 100%Cont Std/Grad Sch/Joint Pgms 12% 36% 12% 19% 22% 100%TOTAL 18% 76% 2% 2% 1% 100%
Source: PeopleSoft
AGE DISTRIBUTION OF ALL UNDERGRADUATESFall Semester, 2013
HEADCOUNTS
PERCENTAGE BY AGE RANGE
Fact Book 84 Fall 2013
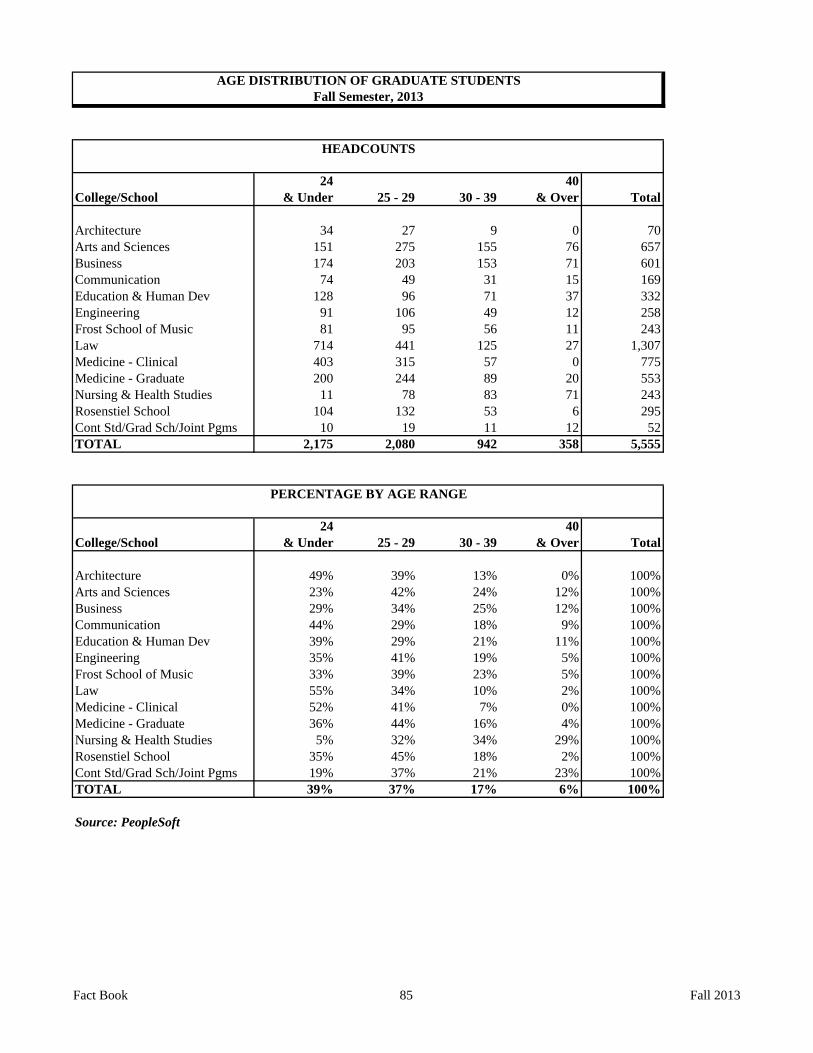
24 40College/School & Under 25 - 29 30 - 39 & Over Total
Architecture 34 27 9 0 70Arts and Sciences 151 275 155 76 657Business 174 203 153 71 601Communication 74 49 31 15 169Education & Human Dev 128 96 71 37 332Engineering 91 106 49 12 258Frost School of Music 81 95 56 11 243Law 714 441 125 27 1,307Medicine - Clinical 403 315 57 0 775Medicine - Graduate 200 244 89 20 553Nursing & Health Studies 11 78 83 71 243Rosenstiel School 104 132 53 6 295Cont Std/Grad Sch/Joint Pgms 10 19 11 12 52TOTAL 2,175 2,080 942 358 5,555
24 40College/School & Under 25 - 29 30 - 39 & Over Total
Architecture 49% 39% 13% 0% 100%Arts and Sciences 23% 42% 24% 12% 100%Business 29% 34% 25% 12% 100%Communication 44% 29% 18% 9% 100%Education & Human Dev 39% 29% 21% 11% 100%Engineering 35% 41% 19% 5% 100%Frost School of Music 33% 39% 23% 5% 100%Law 55% 34% 10% 2% 100%Medicine - Clinical 52% 41% 7% 0% 100%Medicine - Graduate 36% 44% 16% 4% 100%Nursing & Health Studies 5% 32% 34% 29% 100%Rosenstiel School 35% 45% 18% 2% 100%Cont Std/Grad Sch/Joint Pgms 19% 37% 21% 23% 100%TOTAL 39% 37% 17% 6% 100%
Source: PeopleSoft
AGE DISTRIBUTION OF GRADUATE STUDENTSFall Semester, 2013
HEADCOUNTS
PERCENTAGE BY AGE RANGE
Fact Book 85 Fall 2013
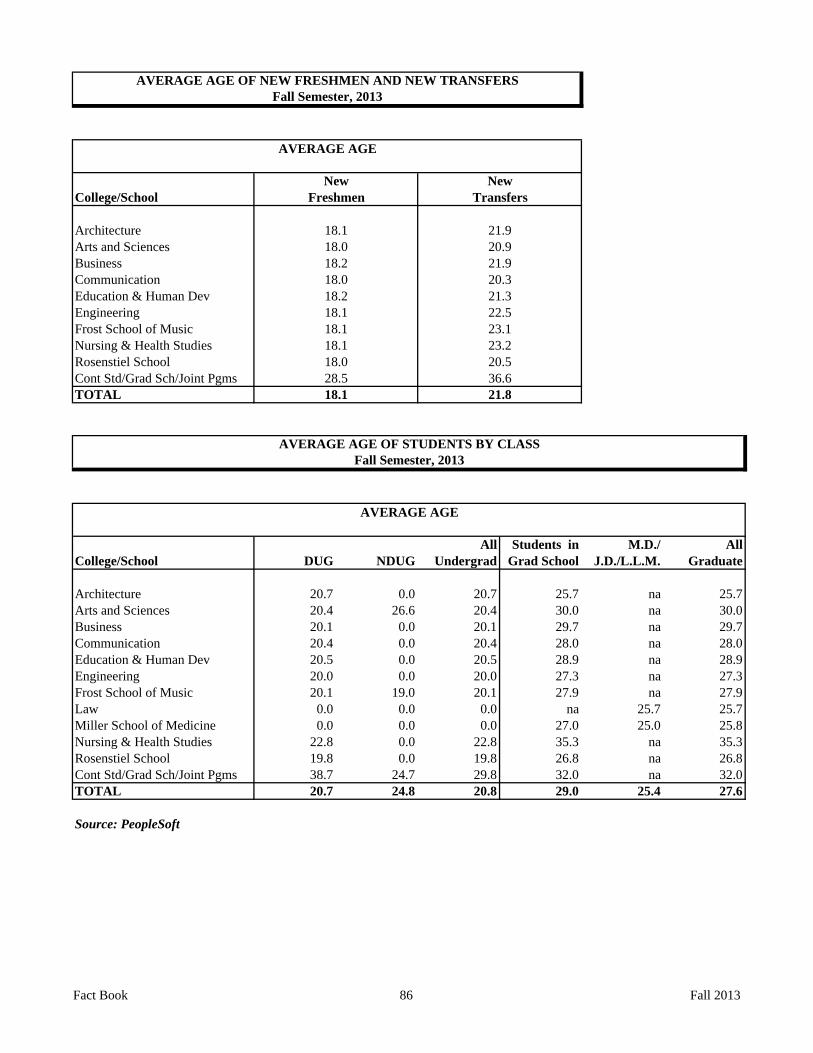
College/School
ArchitectureArts and SciencesBusinessCommunicationEducation & Human DevEngineeringFrost School of MusicNursing & Health StudiesRosenstiel SchoolCont Std/Grad Sch/Joint PgmsTOTAL
All Students in M.D./ AllCollege/School DUG NDUG Undergrad Grad School J.D./L.L.M. Graduate
Architecture 20.7 0.0 20.7 25.7 na 25.7Arts and Sciences 20.4 26.6 20.4 30.0 na 30.0Business 20.1 0.0 20.1 29.7 na 29.7Communication 20.4 0.0 20.4 28.0 na 28.0Education & Human Dev 20.5 0.0 20.5 28.9 na 28.9Engineering 20.0 0.0 20.0 27.3 na 27.3Frost School of Music 20.1 19.0 20.1 27.9 na 27.9Law 0.0 0.0 0.0 na 25.7 25.7Miller School of Medicine 0.0 0.0 0.0 27.0 25.0 25.8Nursing & Health Studies 22.8 0.0 22.8 35.3 na 35.3Rosenstiel School 19.8 0.0 19.8 26.8 na 26.8Cont Std/Grad Sch/Joint Pgms 38.7 24.7 29.8 32.0 na 32.0TOTAL 20.7 24.8 20.8 29.0 25.4 27.6
Source: PeopleSoft
AVERAGE AGE OF NEW FRESHMEN AND NEW TRANSFERSFall Semester, 2013
21.9
AVERAGE AGE
18.1
18.0 20.3
21.8
AVERAGE AGE OF STUDENTS BY CLASSFall Semester, 2013
28.5 36.6
21.318.1
18.0 20.9
18.1
AVERAGE AGE
NewFreshmen
NewTransfers
18.1 21.9
18.0
18.2
22.523.123.2
18.2
18.1
20.5
Fact Book 86 Fall 2013
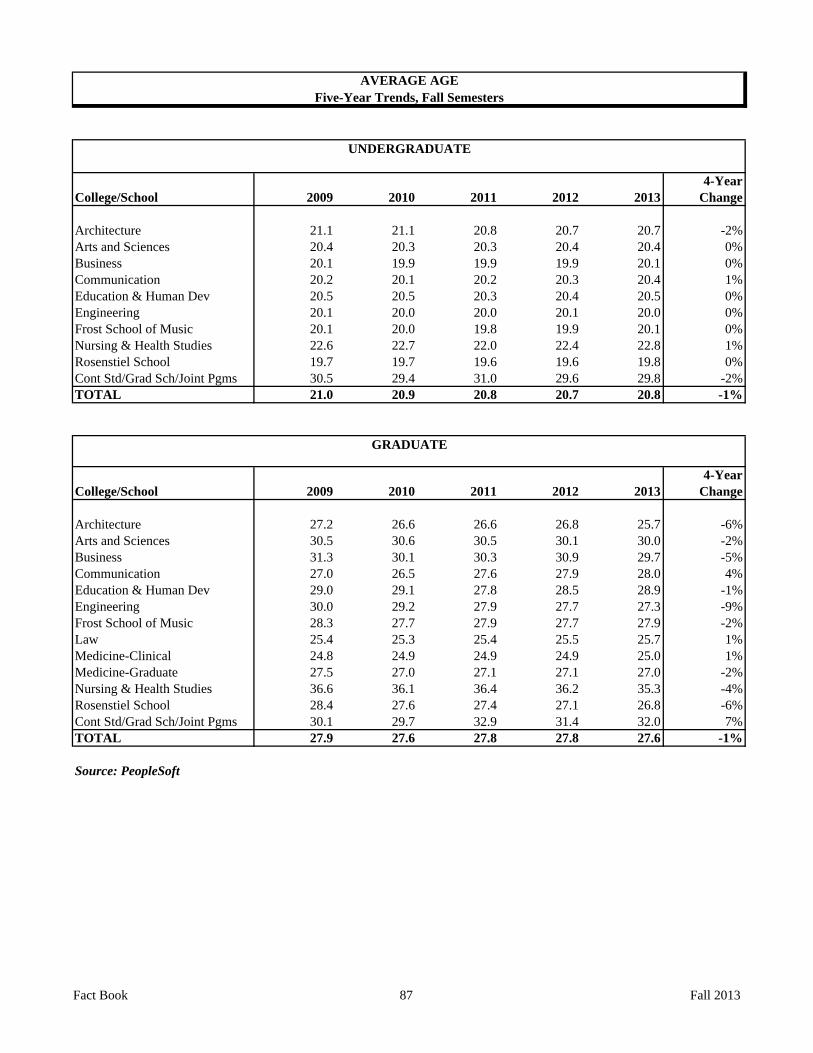
UNDERGRADUATE
4-YearCollege/School 2009 2010 2011 2012 2013 Change
Architecture 21.1 21.1 20.8 20.7 20.7 -2%Arts and Sciences 20.4 20.3 20.3 20.4 20.4 0%Business 20.1 19.9 19.9 19.9 20.1 0%Communication 20.2 20.1 20.2 20.3 20.4 1%Education & Human Dev 20.5 20.5 20.3 20.4 20.5 0%Engineering 20.1 20.0 20.0 20.1 20.0 0%Frost School of Music 20.1 20.0 19.8 19.9 20.1 0%Nursing & Health Studies 22.6 22.7 22.0 22.4 22.8 1%Rosenstiel School 19.7 19.7 19.6 19.6 19.8 0%Cont Std/Grad Sch/Joint Pgms 30.5 29.4 31.0 29.6 29.8 -2%TOTAL 21.0 20.9 20.8 20.7 20.8 -1%
GRADUATE
4-YearCollege/School 2009 2010 2011 2012 2013 Change
Architecture 27.2 26.6 26.6 26.8 25.7 -6%Arts and Sciences 30.5 30.6 30.5 30.1 30.0 -2%Business 31.3 30.1 30.3 30.9 29.7 -5%Communication 27.0 26.5 27.6 27.9 28.0 4%Education & Human Dev 29.0 29.1 27.8 28.5 28.9 -1%Engineering 30.0 29.2 27.9 27.7 27.3 -9%Frost School of Music 28.3 27.7 27.9 27.7 27.9 -2%Law 25.4 25.3 25.4 25.5 25.7 1%Medicine-Clinical 24.8 24.9 24.9 24.9 25.0 1%Medicine-Graduate 27.5 27.0 27.1 27.1 27.0 -2%Nursing & Health Studies 36.6 36.1 36.4 36.2 35.3 -4%Rosenstiel School 28.4 27.6 27.4 27.1 26.8 -6%Cont Std/Grad Sch/Joint Pgms 30.1 29.7 32.9 31.4 32.0 7%TOTAL 27.9 27.6 27.8 27.8 27.6 -1%
Source: PeopleSoft
Five-Year Trends, Fall SemestersAVERAGE AGE
Fact Book 87 Fall 2013
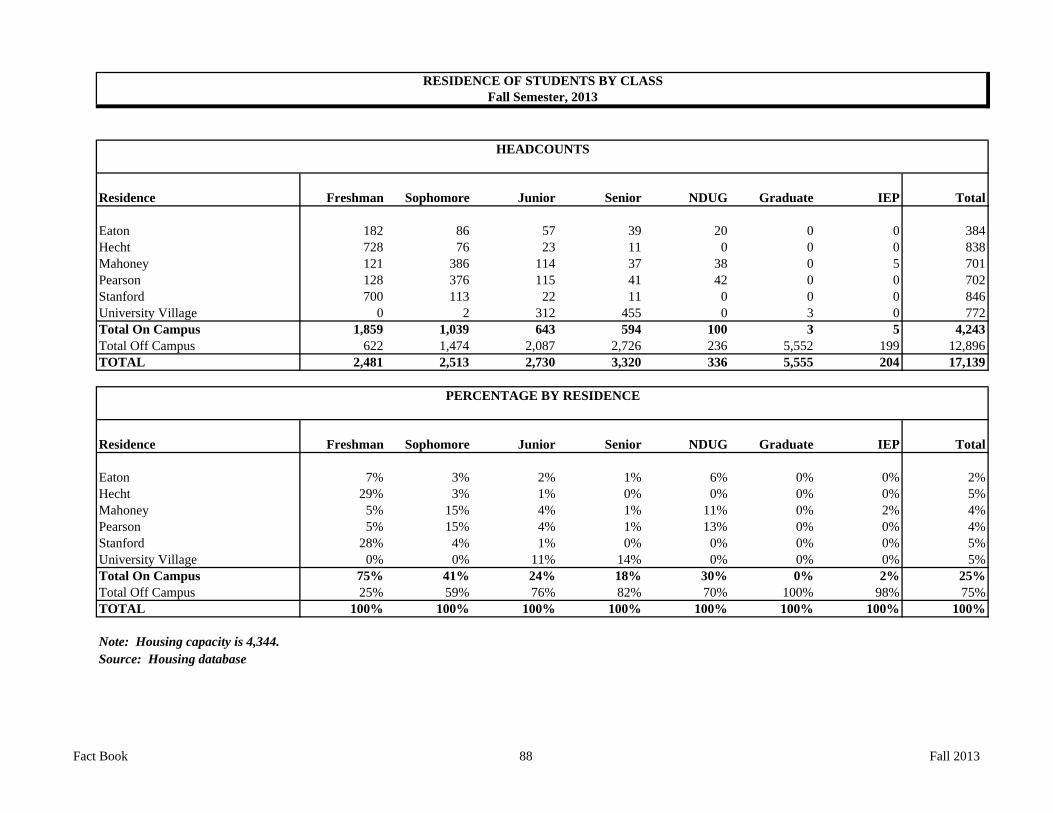
Residence Freshman Sophomore Junior Senior NDUG Graduate IEP Total
Eaton 182 86 57 39 20 0 0 384Hecht 728 76 23 11 0 0 0 838Mahoney 121 386 114 37 38 0 5 701Pearson 128 376 115 41 42 0 0 702Stanford 700 113 22 11 0 0 0 846University Village 0 2 312 455 0 3 0 772Total On Campus 1,859 1,039 643 594 100 3 5 4,243Total Off Campus 622 1,474 2,087 2,726 236 5,552 199 12,896TOTAL 2,481 2,513 2,730 3,320 336 5,555 204 17,139
Residence Freshman Sophomore Junior Senior NDUG Graduate IEP Total
Eaton 7% 3% 2% 1% 6% 0% 0% 2%Hecht 29% 3% 1% 0% 0% 0% 0% 5%Mahoney 5% 15% 4% 1% 11% 0% 2% 4%Pearson 5% 15% 4% 1% 13% 0% 0% 4%Stanford 28% 4% 1% 0% 0% 0% 0% 5%University Village 0% 0% 11% 14% 0% 0% 0% 5%Total On Campus 75% 41% 24% 18% 30% 0% 2% 25%Total Off Campus 25% 59% 76% 82% 70% 100% 98% 75%TOTAL 100% 100% 100% 100% 100% 100% 100% 100%
Note: Housing capacity is 4,344.Source: Housing database
RESIDENCE OF STUDENTS BY CLASS
HEADCOUNTS
PERCENTAGE BY RESIDENCE
Fall Semester, 2013
Fact Book 88 Fall 2013
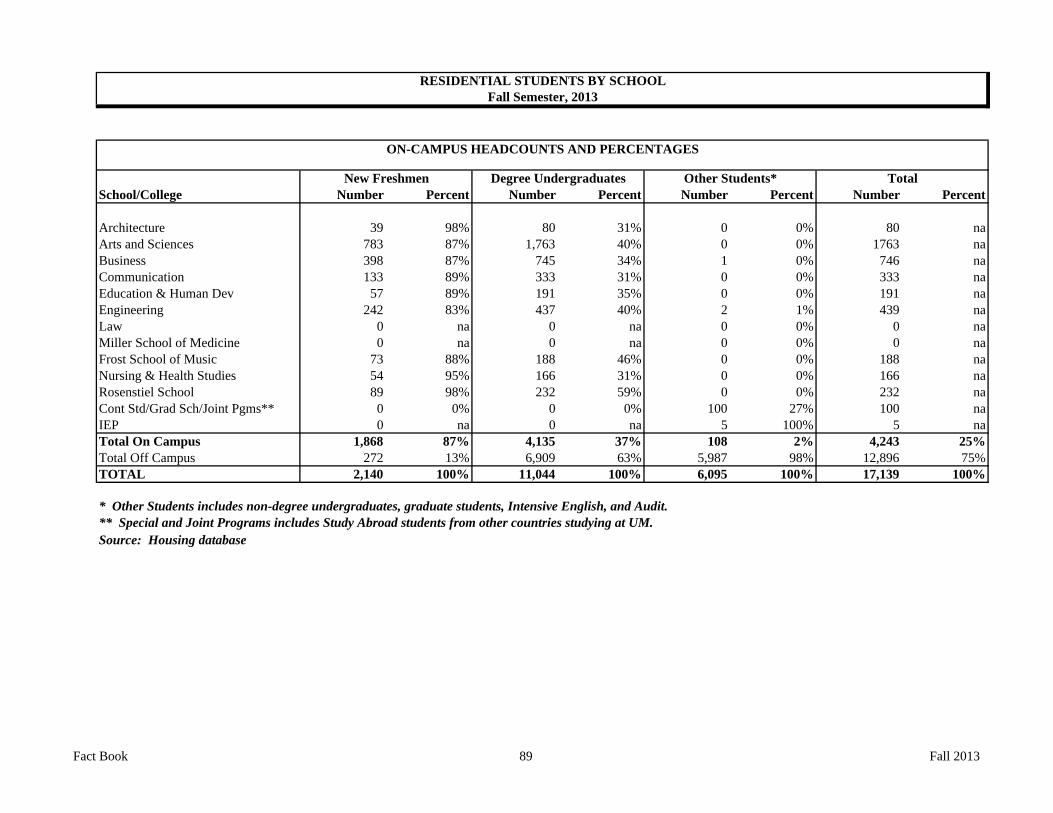
New Freshmen Degree Undergraduates Other Students* TotalSchool/College Number Percent Number Percent Number Percent Number Percent
Architecture 39 98% 80 31% 0 0% 80 naArts and Sciences 783 87% 1,763 40% 0 0% 1763 naBusiness 398 87% 745 34% 1 0% 746 naCommunication 133 89% 333 31% 0 0% 333 naEducation & Human Dev 57 89% 191 35% 0 0% 191 naEngineering 242 83% 437 40% 2 1% 439 naLaw 0 na 0 na 0 0% 0 naMiller School of Medicine 0 na 0 na 0 0% 0 naFrost School of Music 73 88% 188 46% 0 0% 188 naNursing & Health Studies 54 95% 166 31% 0 0% 166 naRosenstiel School 89 98% 232 59% 0 0% 232 naCont Std/Grad Sch/Joint Pgms** 0 0% 0 0% 100 27% 100 naIEP 0 na 0 na 5 100% 5 naTotal On Campus 1,868 87% 4,135 37% 108 2% 4,243 25%Total Off Campus 272 13% 6,909 63% 5,987 98% 12,896 75%TOTAL 2,140 100% 11,044 100% 6,095 100% 17,139 100%
* Other Students includes non-degree undergraduates, graduate students, Intensive English, and Audit.** Special and Joint Programs includes Study Abroad students from other countries studying at UM.Source: Housing database
ON-CAMPUS HEADCOUNTS AND PERCENTAGES
RESIDENTIAL STUDENTS BY SCHOOLFall Semester, 2013
Fact Book 89 Fall 2013
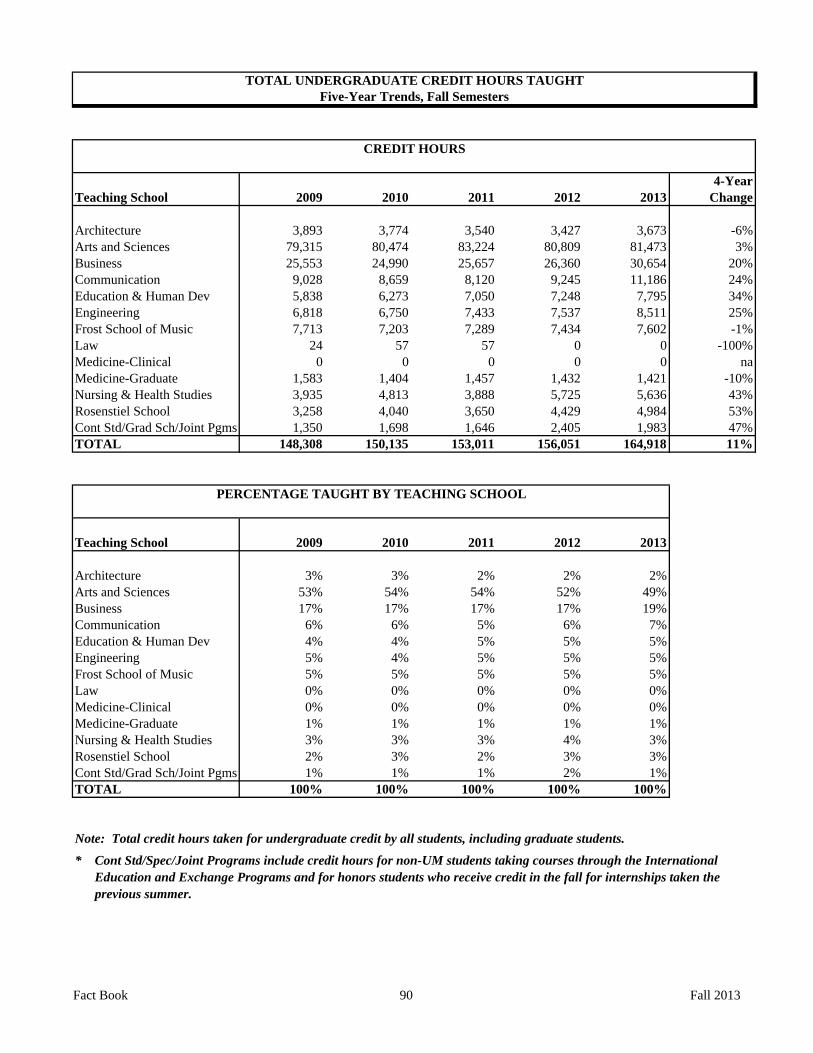
4-YearTeaching School 2009 2010 2011 2012 2013 Change
Architecture 3,893 3,774 3,540 3,427 3,673 -6%Arts and Sciences 79,315 80,474 83,224 80,809 81,473 3%Business 25,553 24,990 25,657 26,360 30,654 20%Communication 9,028 8,659 8,120 9,245 11,186 24%Education & Human Dev 5,838 6,273 7,050 7,248 7,795 34%Engineering 6,818 6,750 7,433 7,537 8,511 25%Frost School of Music 7,713 7,203 7,289 7,434 7,602 -1%Law 24 57 57 0 0 -100%Medicine-Clinical 0 0 0 0 0 naMedicine-Graduate 1,583 1,404 1,457 1,432 1,421 -10%Nursing & Health Studies 3,935 4,813 3,888 5,725 5,636 43%Rosenstiel School 3,258 4,040 3,650 4,429 4,984 53%Cont Std/Grad Sch/Joint Pgms* 1,350 1,698 1,646 2,405 1,983 47%TOTAL 148,308 150,135 153,011 156,051 164,918 11%
Teaching School 2009 2010 2011 2012 2013
Architecture 3% 3% 2% 2% 2%Arts and Sciences 53% 54% 54% 52% 49%Business 17% 17% 17% 17% 19%Communication 6% 6% 5% 6% 7%Education & Human Dev 4% 4% 5% 5% 5%Engineering 5% 4% 5% 5% 5%Frost School of Music 5% 5% 5% 5% 5%Law 0% 0% 0% 0% 0%Medicine-Clinical 0% 0% 0% 0% 0%Medicine-Graduate 1% 1% 1% 1% 1%Nursing & Health Studies 3% 3% 3% 4% 3%Rosenstiel School 2% 3% 2% 3% 3%Cont Std/Grad Sch/Joint Pgms* 1% 1% 1% 2% 1%TOTAL 100% 100% 100% 100% 100%
* Cont Std/Spec/Joint Programs include credit hours for non-UM students taking courses through the International Education and Exchange Programs and for honors students who receive credit in the fall for internships taken the previous summer.
TOTAL UNDERGRADUATE CREDIT HOURS TAUGHTFive-Year Trends, Fall Semesters
CREDIT HOURS
PERCENTAGE TAUGHT BY TEACHING SCHOOL
Note: Total credit hours taken for undergraduate credit by all students, including graduate students.
Fact Book 90 Fall 2013

4-YearTeaching School 2009 2010 2011 2012 2013 Change
Architecture 999 970 850 970 1,006 1%Arts and Sciences 4,153 4,335 4,282 4,467 4,561 10%Business 4,623 5,093 6,014 5,875 6,963 51%Communication 1,015 1,165 1,119 1,132 1,362 34%Education & Human Dev 2,461 2,339 2,490 2,415 2,466 0%Engineering 1,156 1,064 1,515 1,629 1,848 60%Frost School of Music 1,694 1,977 1,959 2,118 2,143 27%Law 22,040 21,466 20,558 20,142 17,963 -18%Medicine-Clinical 18,826 19,342 19,274 19,259 19,714 5%Medicine-Graduate 3,385 3,840 4,028 4,775 5,861 73%Nursing & Health Studies 1,590 2,103 2,934 2,879 2,323 46%Rosenstiel School 927 1,286 1,643 1,747 1,917 107%Cont Std/Grad Sch/Joint Pgms 4 9 174 144 32 700%TOTAL 62,873 64,989 66,840 67,552 68,159 8%
PROFESSIONAL ONLY na
Teaching School 2009 2010 2011 2012 2013
Architecture 2% 1% 1% 1% 1%Arts and Sciences 7% 7% 6% 7% 7%Business 7% 8% 9% 9% 10%Communication 2% 2% 2% 2% 2%Education & Human Dev 4% 4% 4% 4% 4%Engineering 2% 2% 2% 2% 3%Frost School of Music 3% 3% 3% 3% 3%Law 35% 33% 31% 30% 26%Medicine-Clinical 30% 30% 29% 29% 29%Medicine-Graduate 5% 6% 6% 7% 9%Nursing & Health Studies 3% 3% 4% 4% 3%Rosenstiel School 1% 2% 2% 3% 3%Cont Std/Grad Sch/Joint Pgms 0% 0% 0% 0% 0%TOTAL 100% 100% 100% 100% 100%
undergraduate students. Graduate research credits were increased from 0 to 1.
TOTAL GRADUATE CREDIT HOURS TAUGHTFive-Year Trends, Fall Semesters
CREDIT HOURS
PERCENTAGE TAUGHT BY TEACHING SCHOOL
Note: Total credit hours taken for graduate and professional credit by all students, including
Fact Book 91 Fall 2013
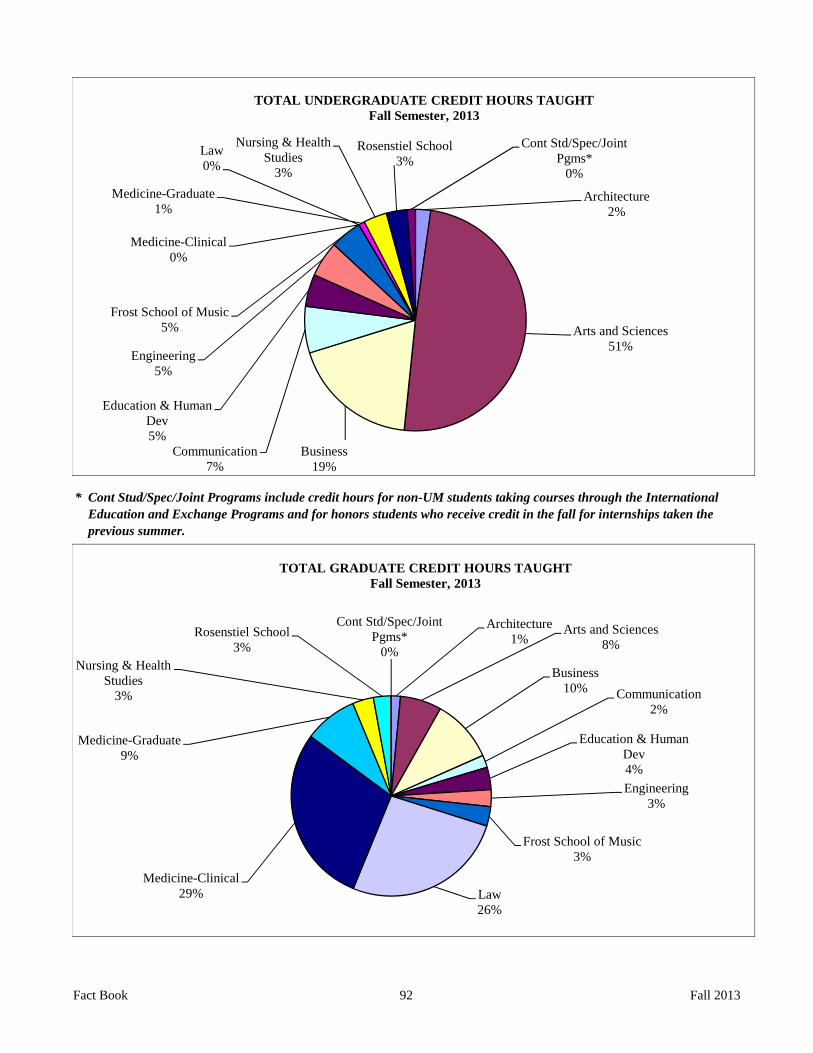
* Cont Stud/Spec/Joint Programs include credit hours for non-UM students taking courses through the International Education and Exchange Programs and for honors students who receive credit in the fall for internships taken the previous summer.
Architecture2%
Arts and Sciences51%
Business19%
Communication7%
Education & Human Dev5%
Engineering5%
Frost School of Music5%
Law0%
Medicine-Clinical0%
Medicine-Graduate1%
Nursing & Health Studies
3%
Rosenstiel School3%
Cont Std/Spec/Joint Pgms*
0%
TOTAL UNDERGRADUATE CREDIT HOURS TAUGHTFall Semester, 2013
Architecture1%
Arts and Sciences8%
Business10% Communication
2%
Education & Human Dev4%Engineering
3%
Frost School of Music3%
Law26%
Medicine-Clinical29%
Medicine-Graduate9%
Nursing & Health Studies
3%
Rosenstiel School3%
Cont Std/Spec/Joint Pgms*
0%
TOTAL GRADUATE CREDIT HOURS TAUGHTFall Semester, 2013
Fact Book 92 Fall 2013

4-YearTeaching School 2009 2010 2011 2012 2013 Change
Architecture 4,892 4,744 4,390 4,397 4,679 -4%Arts and Sciences 83,468 84,809 87,506 85,276 86,034 3%Business 30,176 30,083 31,671 32,235 37,617 25%Communication 10,043 9,824 9,239 10,377 12,548 25%Education & Human Dev 8,299 8,612 9,540 9,663 10,261 24%Engineering 7,974 7,814 8,948 9,166 10,359 30%Frost School of Music 9,407 9,180 9,248 9,552 9,745 4%Law 22,064 21,523 20,615 20,142 17,963 -19%Medicine-Clinical 18,826 19,342 19,274 19,259 19,714 5%Medicine-Graduate 4,968 5,244 5,485 6,207 7,282 47%Nursing & Health Studies 5,525 6,916 6,822 8,604 7,959 44%Rosenstiel School 4,185 5,326 5,293 6,176 6,901 65%Cont Std/Spec/Joint Pgms* 1,354 1,707 1,820 2,549 2,015 49%TOTAL 211,181 215,124 219,851 223,603 233,077 10%
Teaching School 2009 2010 2011 2012 2013
Architecture 2% 2% 2% 2% 2%Arts and Sciences 40% 39% 40% 38% 37%Business 14% 14% 14% 14% 16%Communication 5% 5% 4% 5% 5%Education & Human Dev 4% 4% 4% 4% 4%Engineering 4% 4% 4% 4% 4%Frost School of Music 4% 4% 4% 4% 4%Law 10% 10% 9% 9% 8%Medicine-Clinical 9% 9% 9% 9% 8%Medicine-Graduate 2% 2% 2% 3% 3%Nursing & Health Studies 3% 3% 3% 4% 3%Rosenstiel School 2% 2% 2% 3% 3%Cont Std/Spec/Joint Pgms* 1% 1% 1% 1% 1%TOTAL 100% 100% 100% 100% 100%
TOTAL CREDIT HOURS TAUGHTFive-Year Trends, Fall Semesters
* Cont Std/Spec/Joint Pgms include credit hours for non-UM students taking courses through the International Education and Exchange Programs and other special programs.
CREDIT HOURS
PERCENTAGE TAUGHT BY TEACHING SCHOOL
Note: Total credit hours taken by all students for undergraduate and graduate credit. Graduate research credits were increased from 0 to 1.
Fact Book 93 Fall 2013

* Cont Stud/Spec/Joint Programs include credit hours for non-UM students taking courses through the International Education and Exchange Programs and other special programs.
Architecture2%
Arts and Sciences37%
Business16%Communication
5%
Education & Human Dev4%
Engineering5%
Frost School of Music4%
Law8%
Medicine-Clinical9%
Medicine-Graduate3%
Nursing & Health Studies
3%
Rosenstiel School3%
Cont Std/Spec/Joint Pgms*
0%
TOTAL CREDIT HOURS TAUGHTFall Semester, 2013
0
40,000
80,000
120,000
160,000
200,000
2009 2010 2011 2012 2013
Cre
dit H
ours
Tau
ght
TOTAL CREDIT HOURS TAUGHTFive-Year Trends, Fall Semesters
Undergraduate Graduate
Fact Book 94 Fall 2013
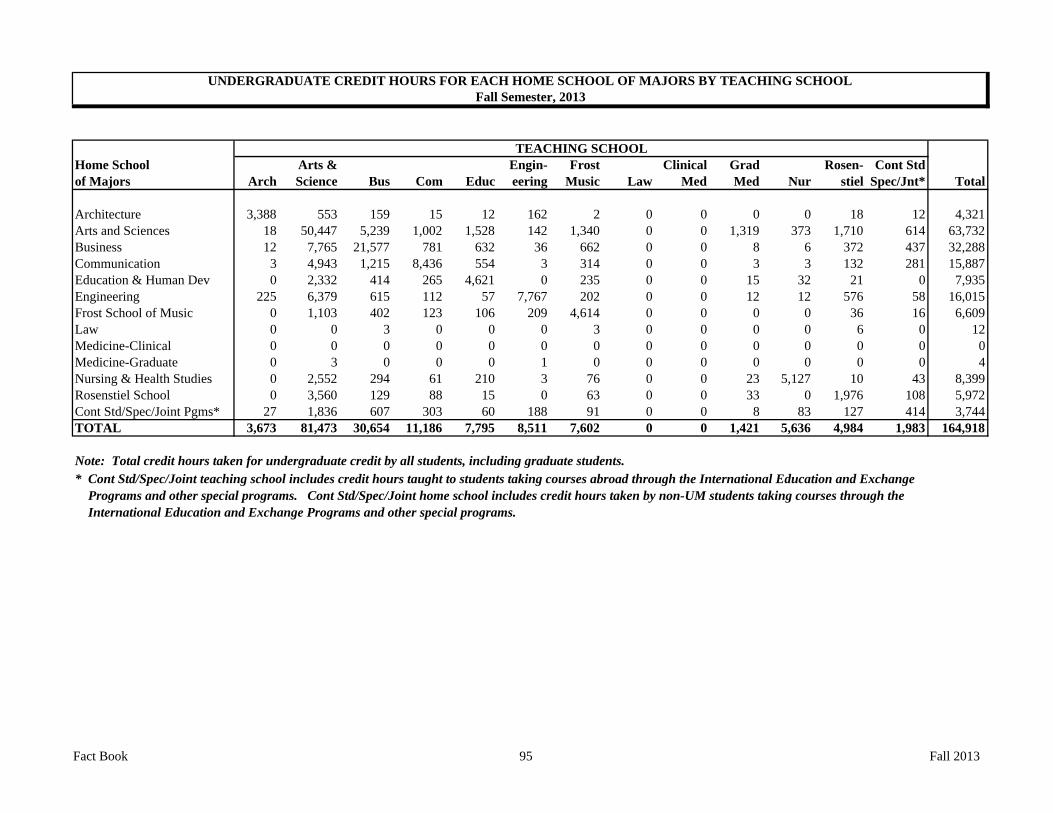
Home School Arts & Engin- Frost Clinical Grad Rosen- Cont Stdof Majors Arch Science Bus Com Educ eering Music Law Med Med Nur stiel Spec/Jnt* Total
Architecture 3,388 553 159 15 12 162 2 0 0 0 0 18 12 4,321Arts and Sciences 18 50,447 5,239 1,002 1,528 142 1,340 0 0 1,319 373 1,710 614 63,732Business 12 7,765 21,577 781 632 36 662 0 0 8 6 372 437 32,288Communication 3 4,943 1,215 8,436 554 3 314 0 0 3 3 132 281 15,887Education & Human Dev 0 2,332 414 265 4,621 0 235 0 0 15 32 21 0 7,935Engineering 225 6,379 615 112 57 7,767 202 0 0 12 12 576 58 16,015Frost School of Music 0 1,103 402 123 106 209 4,614 0 0 0 0 36 16 6,609Law 0 0 3 0 0 0 3 0 0 0 0 6 0 12Medicine-Clinical 0 0 0 0 0 0 0 0 0 0 0 0 0 0Medicine-Graduate 0 3 0 0 0 1 0 0 0 0 0 0 0 4Nursing & Health Studies 0 2,552 294 61 210 3 76 0 0 23 5,127 10 43 8,399Rosenstiel School 0 3,560 129 88 15 0 63 0 0 33 0 1,976 108 5,972Cont Std/Spec/Joint Pgms* 27 1,836 607 303 60 188 91 0 0 8 83 127 414 3,744TOTAL 3,673 81,473 30,654 11,186 7,795 8,511 7,602 0 0 1,421 5,636 4,984 1,983 164,918
Note: Total credit hours taken for undergraduate credit by all students, including graduate students.
UNDERGRADUATE CREDIT HOURS FOR EACH HOME SCHOOL OF MAJORS BY TEACHING SCHOOLFall Semester, 2013
* Cont Std/Spec/Joint teaching school includes credit hours taught to students taking courses abroad through the International Education and Exchange Programs and other special programs. Cont Std/Spec/Joint home school includes credit hours taken by non-UM students taking courses through the International Education and Exchange Programs and other special programs.
TEACHING SCHOOL
Fact Book 95 Fall 2013
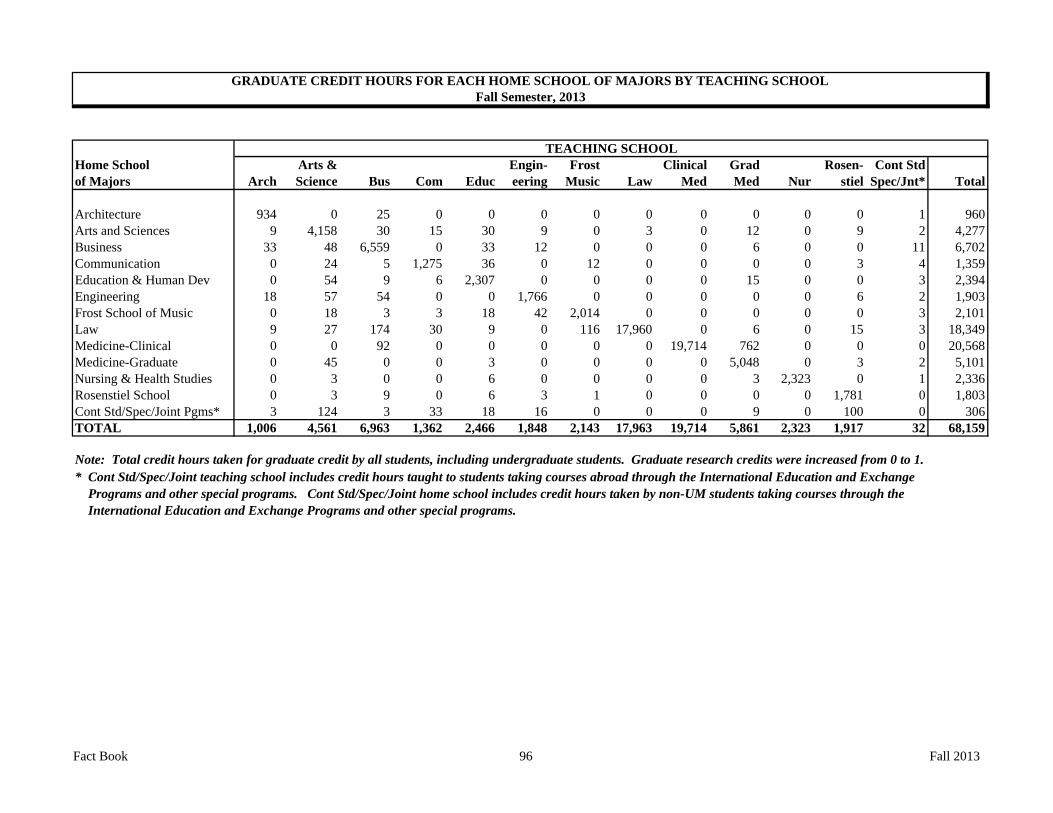
Home School Arts & Engin- Frost Clinical Grad Rosen- Cont Stdof Majors Arch Science Bus Com Educ eering Music Law Med Med Nur stiel Spec/Jnt* Total
Architecture 934 0 25 0 0 0 0 0 0 0 0 0 1 960Arts and Sciences 9 4,158 30 15 30 9 0 3 0 12 0 9 2 4,277Business 33 48 6,559 0 33 12 0 0 0 6 0 0 11 6,702Communication 0 24 5 1,275 36 0 12 0 0 0 0 3 4 1,359Education & Human Dev 0 54 9 6 2,307 0 0 0 0 15 0 0 3 2,394Engineering 18 57 54 0 0 1,766 0 0 0 0 0 6 2 1,903Frost School of Music 0 18 3 3 18 42 2,014 0 0 0 0 0 3 2,101Law 9 27 174 30 9 0 116 17,960 0 6 0 15 3 18,349Medicine-Clinical 0 0 92 0 0 0 0 0 19,714 762 0 0 0 20,568Medicine-Graduate 0 45 0 0 3 0 0 0 0 5,048 0 3 2 5,101Nursing & Health Studies 0 3 0 0 6 0 0 0 0 3 2,323 0 1 2,336Rosenstiel School 0 3 9 0 6 3 1 0 0 0 0 1,781 0 1,803Cont Std/Spec/Joint Pgms* 3 124 3 33 18 16 0 0 0 9 0 100 0 306TOTAL 1,006 4,561 6,963 1,362 2,466 1,848 2,143 17,963 19,714 5,861 2,323 1,917 32 68,159
TEACHING SCHOOL
Note: Total credit hours taken for graduate credit by all students, including undergraduate students. Graduate research credits were increased from 0 to 1.
Fall Semester, 2013
* Cont Std/Spec/Joint teaching school includes credit hours taught to students taking courses abroad through the International Education and Exchange Programs and other special programs. Cont Std/Spec/Joint home school includes credit hours taken by non-UM students taking courses through the International Education and Exchange Programs and other special programs.
GRADUATE CREDIT HOURS FOR EACH HOME SCHOOL OF MAJORS BY TEACHING SCHOOL
Fact Book 96 Fall 2013
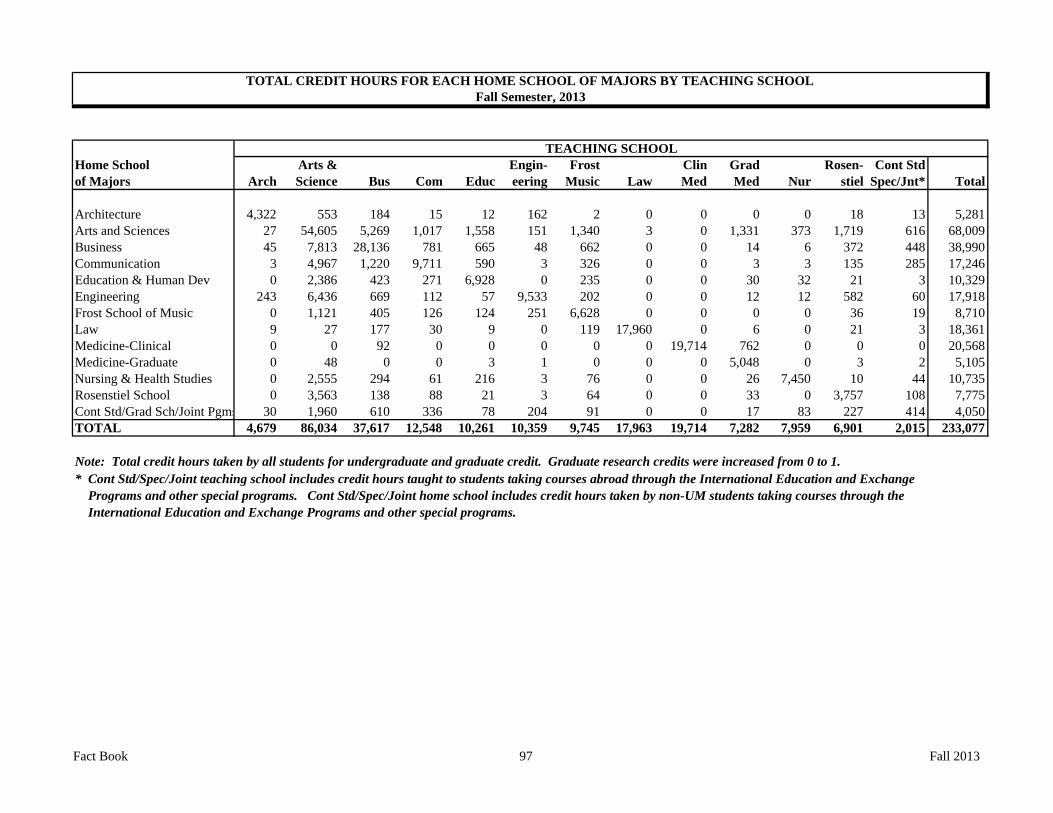
Home School Arts & Engin- Frost Clin Grad Rosen- Cont Stdof Majors Arch Science Bus Com Educ eering Music Law Med Med Nur stiel Spec/Jnt* Total
Architecture 4,322 553 184 15 12 162 2 0 0 0 0 18 13 5,281Arts and Sciences 27 54,605 5,269 1,017 1,558 151 1,340 3 0 1,331 373 1,719 616 68,009Business 45 7,813 28,136 781 665 48 662 0 0 14 6 372 448 38,990Communication 3 4,967 1,220 9,711 590 3 326 0 0 3 3 135 285 17,246Education & Human Dev 0 2,386 423 271 6,928 0 235 0 0 30 32 21 3 10,329Engineering 243 6,436 669 112 57 9,533 202 0 0 12 12 582 60 17,918Frost School of Music 0 1,121 405 126 124 251 6,628 0 0 0 0 36 19 8,710Law 9 27 177 30 9 0 119 17,960 0 6 0 21 3 18,361Medicine-Clinical 0 0 92 0 0 0 0 0 19,714 762 0 0 0 20,568Medicine-Graduate 0 48 0 0 3 1 0 0 0 5,048 0 3 2 5,105Nursing & Health Studies 0 2,555 294 61 216 3 76 0 0 26 7,450 10 44 10,735Rosenstiel School 0 3,563 138 88 21 3 64 0 0 33 0 3,757 108 7,775Cont Std/Grad Sch/Joint Pgms 30 1,960 610 336 78 204 91 0 0 17 83 227 414 4,050TOTAL 4,679 86,034 37,617 12,548 10,261 10,359 9,745 17,963 19,714 7,282 7,959 6,901 2,015 233,077
Note: Total credit hours taken by all students for undergraduate and graduate credit. Graduate research credits were increased from 0 to 1.
Fall Semester, 2013
TEACHING SCHOOL
* Cont Std/Spec/Joint teaching school includes credit hours taught to students taking courses abroad through the International Education and Exchange Programs and other special programs. Cont Std/Spec/Joint home school includes credit hours taken by non-UM students taking courses through the International Education and Exchange Programs and other special programs.
TOTAL CREDIT HOURS FOR EACH HOME SCHOOL OF MAJORS BY TEACHING SCHOOL
Fact Book 97 Fall 2013
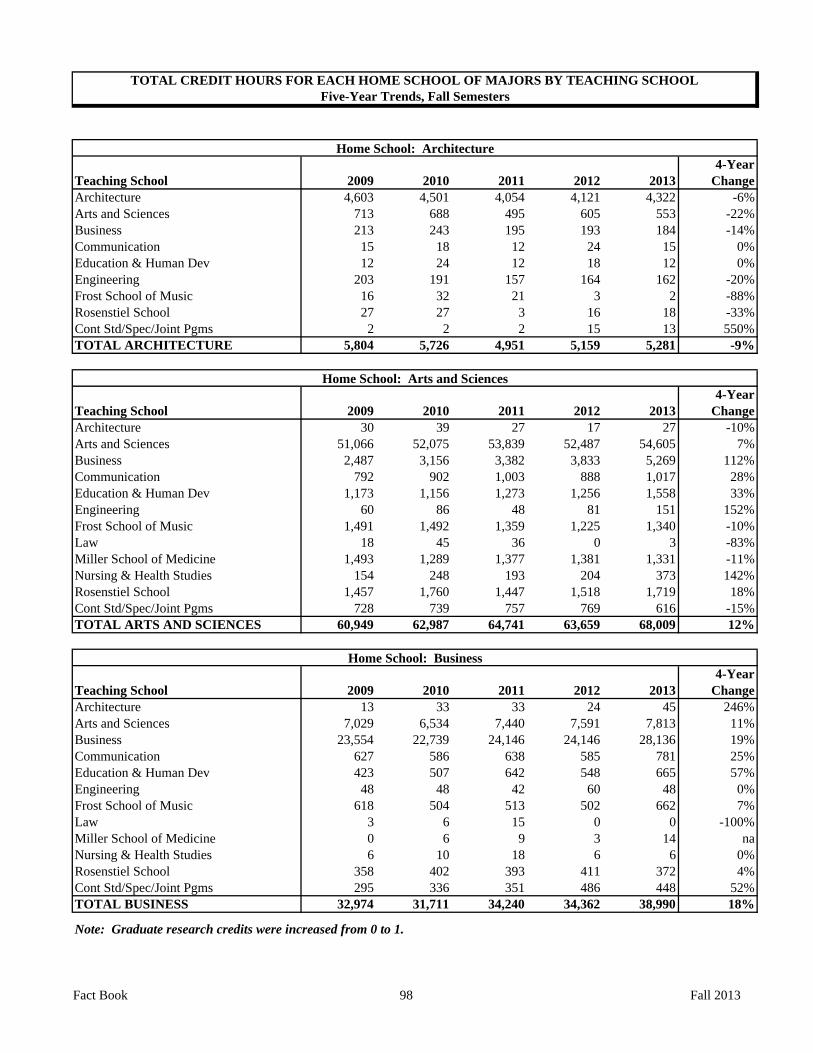
4-YearTeaching School 2009 2010 2011 2012 2013 ChangeArchitecture 4,603 4,501 4,054 4,121 4,322 -6%Arts and Sciences 713 688 495 605 553 -22%Business 213 243 195 193 184 -14%Communication 15 18 12 24 15 0%Education & Human Dev 12 24 12 18 12 0%Engineering 203 191 157 164 162 -20%Frost School of Music 16 32 21 3 2 -88%Rosenstiel School 27 27 3 16 18 -33%Cont Std/Spec/Joint Pgms 2 2 2 15 13 550%TOTAL ARCHITECTURE 5,804 5,726 4,951 5,159 5,281 -9%
4-YearTeaching School 2009 2010 2011 2012 2013 ChangeArchitecture 30 39 27 17 27 -10%Arts and Sciences 51,066 52,075 53,839 52,487 54,605 7%Business 2,487 3,156 3,382 3,833 5,269 112%Communication 792 902 1,003 888 1,017 28%Education & Human Dev 1,173 1,156 1,273 1,256 1,558 33%Engineering 60 86 48 81 151 152%Frost School of Music 1,491 1,492 1,359 1,225 1,340 -10%Law 18 45 36 0 3 -83%Miller School of Medicine 1,493 1,289 1,377 1,381 1,331 -11%Nursing & Health Studies 154 248 193 204 373 142%Rosenstiel School 1,457 1,760 1,447 1,518 1,719 18%Cont Std/Spec/Joint Pgms 728 739 757 769 616 -15%TOTAL ARTS AND SCIENCES 60,949 62,987 64,741 63,659 68,009 12%
4-YearTeaching School 2009 2010 2011 2012 2013 ChangeArchitecture 13 33 33 24 45 246%Arts and Sciences 7,029 6,534 7,440 7,591 7,813 11%Business 23,554 22,739 24,146 24,146 28,136 19%Communication 627 586 638 585 781 25%Education & Human Dev 423 507 642 548 665 57%Engineering 48 48 42 60 48 0%Frost School of Music 618 504 513 502 662 7%Law 3 6 15 0 0 -100%Miller School of Medicine 0 6 9 3 14 naNursing & Health Studies 6 10 18 6 6 0%Rosenstiel School 358 402 393 411 372 4%Cont Std/Spec/Joint Pgms 295 336 351 486 448 52%TOTAL BUSINESS 32,974 31,711 34,240 34,362 38,990 18%
Note: Graduate research credits were increased from 0 to 1.
TOTAL CREDIT HOURS FOR EACH HOME SCHOOL OF MAJORS BY TEACHING SCHOOL
Home School: Architecture
Home School: Arts and Sciences
Home School: Business
Five-Year Trends, Fall Semesters
Fact Book 98 Fall 2013
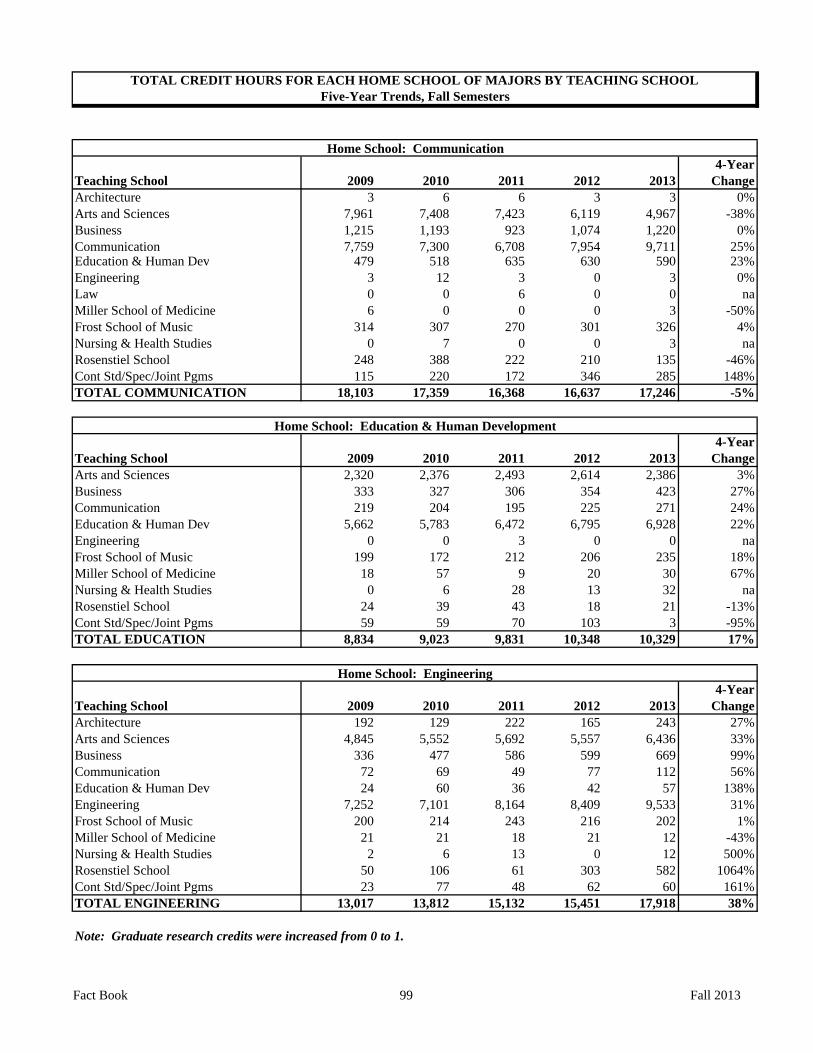
TOTAL CREDIT HOURS FOR EACH HOME SCHOOL OF MAJORS BY TEACHING SCHOOLFive-Year Trends, Fall Semesters
4-YearTeaching School 2009 2010 2011 2012 2013 ChangeArchitecture 3 6 6 3 3 0%Arts and Sciences 7,961 7,408 7,423 6,119 4,967 -38%Business 1,215 1,193 923 1,074 1,220 0%Communication 7,759 7,300 6,708 7,954 9,711 25%Education & Human Dev 479 518 635 630 590 23%Engineering 3 12 3 0 3 0%Law 0 0 6 0 0 naMiller School of Medicine 6 0 0 0 3 -50%Frost School of Music 314 307 270 301 326 4%Nursing & Health Studies 0 7 0 0 3 naRosenstiel School 248 388 222 210 135 -46%Cont Std/Spec/Joint Pgms 115 220 172 346 285 148%TOTAL COMMUNICATION 18,103 17,359 16,368 16,637 17,246 -5%
4-YearTeaching School 2009 2010 2011 2012 2013 ChangeArts and Sciences 2,320 2,376 2,493 2,614 2,386 3%Business 333 327 306 354 423 27%Communication 219 204 195 225 271 24%Education & Human Dev 5,662 5,783 6,472 6,795 6,928 22%Engineering 0 0 3 0 0 naFrost School of Music 199 172 212 206 235 18%Miller School of Medicine 18 57 9 20 30 67%Nursing & Health Studies 0 6 28 13 32 naRosenstiel School 24 39 43 18 21 -13%Cont Std/Spec/Joint Pgms 59 59 70 103 3 -95%TOTAL EDUCATION 8,834 9,023 9,831 10,348 10,329 17%
4-YearTeaching School 2009 2010 2011 2012 2013 ChangeArchitecture 192 129 222 165 243 27%Arts and Sciences 4,845 5,552 5,692 5,557 6,436 33%Business 336 477 586 599 669 99%Communication 72 69 49 77 112 56%Education & Human Dev 24 60 36 42 57 138%Engineering 7,252 7,101 8,164 8,409 9,533 31%Frost School of Music 200 214 243 216 202 1%Miller School of Medicine 21 21 18 21 12 -43%Nursing & Health Studies 2 6 13 0 12 500%Rosenstiel School 50 106 61 303 582 1064%Cont Std/Spec/Joint Pgms 23 77 48 62 60 161%TOTAL ENGINEERING 13,017 13,812 15,132 15,451 17,918 38%
Note: Graduate research credits were increased from 0 to 1.
Home School: Communication
Home School: Education & Human Development
Home School: Engineering
Fact Book 99 Fall 2013

TOTAL CREDIT HOURS FOR EACH HOME SCHOOL OF MAJORS BY TEACHING SCHOOLFive-Year Trends, Fall Semesters
4-YearTeaching School 2009 2010 2011 2012 2013 ChangeArchitecture 3 9 12 0 0 -100%Arts and Sciences 1,504 1,431 1,355 1,245 1,121 -25%Business 299 255 327 354 405 35%Communication 117 150 147 126 126 8%Education & Human Dev 152 172 138 132 124 -18%Engineering 174 137 188 208 251 44%Law 0 3 0 0 0 naMiller School of Medicine 6 6 0 0 0 -100%Frost School of Music 6,323 6,172 6,262 6,722 6,628 5%Nursing & Health Studies 0 3 0 0 0 naRosenstiel School 52 67 30 53 36 -31%Cont Std/Spec/Joint Pgms 39 16 44 32 19 -51%TOTAL MUSIC 8,669 8,421 8,503 8,872 8,710 0%
4-YearTeaching School 2009 2010 2011 2012 2013 ChangeArchitecture 0 3 3 6 9 naArts and Sciences 9 27 12 41 27 200%Business 241 207 218 238 177 -27%Communication 0 3 7 39 30 naEducation & Human Dev 0 0 3 9 9 naLaw 22,040 21,460 20,558 20,142 17,960 -19%Miller School of Medicine 0 0 12 9 6 naFrost School of Music 3 54 114 198 119 3867%Rosenstiel School 6 15 0 25 21 250%Cont Std/Grad Sch/Joint Pgms 0 63 139 97 3 naTOTAL LAW 22,299 21,832 21,066 20,804 18,361 -18%
4-YearTeaching School 2009 2010 2011 2012 2013 ChangeArts and Sciences 16 9 15 45 48 200%Business 168 150 294 256 92 -45%Education & Human Dev 24 0 12 3 3 -88%Engineering 3 0 0 0 1 -67%Medicine-Clinical 18,826 19,342 19,274 19,259 19,714 5%Medicine-Graduate 3,339 3,761 3,980 4,707 5,810 74%Rosenstiel School 0 0 0 0 3 naCont Std/Grad Sch/Joint Pgms 0 0 0 3 2 naTOTAL MEDICINE 22,376 23,262 23,575 24,273 25,673 15%
Note: Graduate research credits were increased from 0 to 1.
Home School: Medicine
Home School: Law
Home School: Frost Music
Fact Book 100 Fall 2013

TOTAL CREDIT HOURS FOR EACH HOME SCHOOL OF MAJORS BY TEACHING SCHOOLFive-Year Trends, Fall Semesters
4-YearTeaching School 2009 2010 2011 2012 2013 ChangeArts and Sciences 2,358 2,297 2,456 2,622 2,555 8%Business 138 177 123 243 294 113%Communication 30 21 15 57 61 103%Education & Human Dev 210 137 123 123 216 3%Miller School of Medicine 27 15 38 32 26 -4%Frost School of Music 93 59 87 51 76 -18%Nursing & Health Studies 5,313 6,558 6,531 8,368 7,450 40%Rosenstiel School 4 6 23 9 10 150%Cont Std/Spec/Joint Pgms 57 75 83 66 44 -23%TOTAL NURSING 8,230 9,345 9,482 11,571 10,735 30%
4-YearTeaching School 2009 2010 2011 2012 2013 ChangeArts and Sciences 2,667 3,380 3,978 3,979 3,563 34%Business 126 135 154 143 138 10%Communication 42 33 48 39 88 110%Education & Human Dev 12 18 30 44 21 75%Engineering 6 9 3 6 3 -50%Frost School of Music 46 74 92 80 64 39%Law 3 6 0 0 0 -100%Miller School of Medicine 6 19 6 15 33 450%Nursing & Health Studies 4 3 4 0 0 -100%Rosenstiel School 1,869 2,335 2,901 3,395 3,757 101%Cont Std/Spec/Joint Pgms 14 49 89 67 108 671%TOTAL ROSENSTIEL 4,795 6,061 7,305 7,768 7,775 62%
4-YearTeaching School 2009 2010 2011 2012 2013 ChangeArchitecture 48 24 33 61 30 -38%Arts and Sciences 2,980 3,032 2,308 2,371 1,960 -34%Business 1,066 1,024 1,017 802 610 -43%Communication 370 538 417 363 336 -9%Education & Human Dev 128 237 164 63 78 -39%Engineering 225 230 337 238 204 -9%Frost School of Music 104 100 75 48 91 -13%Law 0 3 0 0 0 naMiller School of Medicine 52 70 36 19 17 -67%Nursing & Health Studies 46 75 35 13 83 80%Rosenstiel School 90 181 170 218 227 152%Cont Std/Spec/Joint Pgms 22 71 65 503 414 1782%TOTAL SPECIAL & JOINT PROGS 5,131 5,585 4,657 4,699 4,050 -21%
TOTAL UNIVERSITY 211,181 215,124 219,851 223,603 233,077 10%
Note: Graduate research credits were increased from 0 to 1.
Home School: Continuing Studies, Special & Joint Programs
Home School: Nursing
Home School: Rosenstiel School of Marine and Atmospheric Science
Fact Book 101 Fall 2013
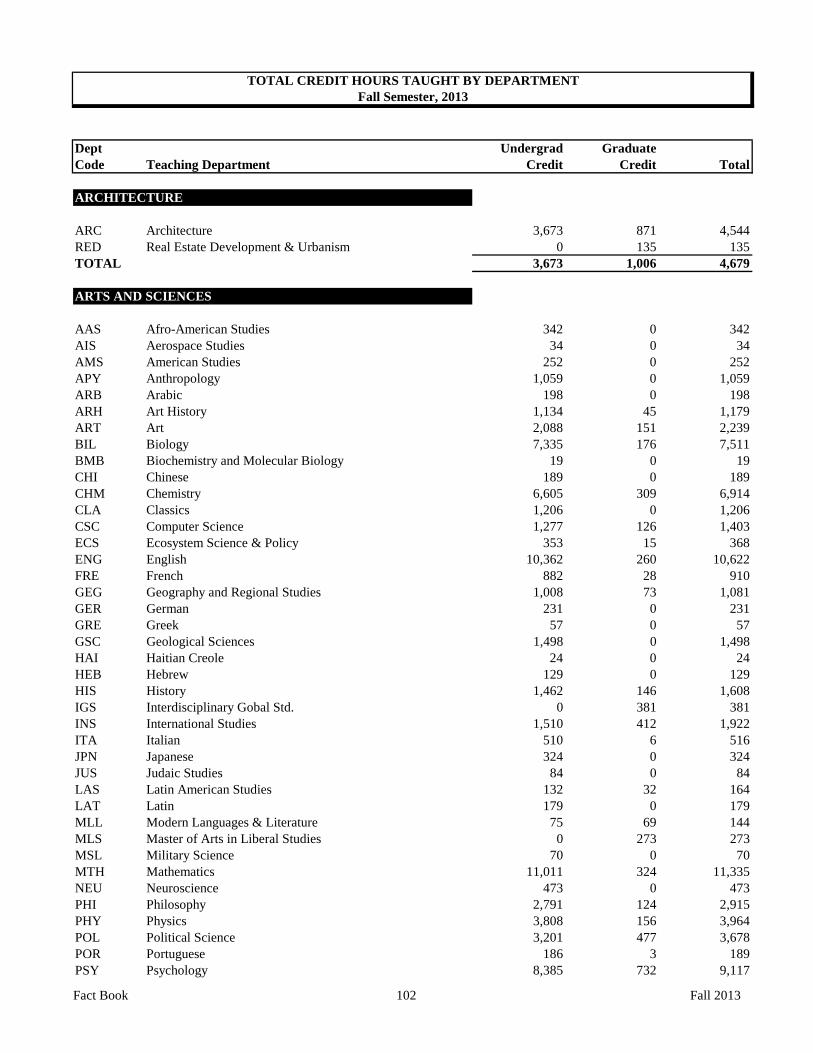
Dept Undergrad GraduateCode Teaching Department Credit Credit Total
ARCHITECTURE
ARC Architecture 3,673 871 4,544RED Real Estate Development & Urbanism 0 135 135TOTAL 3,673 1,006 4,679
ARTS AND SCIENCES
AAS Afro-American Studies 342 0 342AIS Aerospace Studies 34 0 34AMS American Studies 252 0 252APY Anthropology 1,059 0 1,059ARB Arabic 198 0 198ARH Art History 1,134 45 1,179ART Art 2,088 151 2,239BIL Biology 7,335 176 7,511BMB Biochemistry and Molecular Biology 19 0 19CHI Chinese 189 0 189CHM Chemistry 6,605 309 6,914CLA Classics 1,206 0 1,206CSC Computer Science 1,277 126 1,403ECS Ecosystem Science & Policy 353 15 368ENG English 10,362 260 10,622FRE French 882 28 910GEG Geography and Regional Studies 1,008 73 1,081GER German 231 0 231GRE Greek 57 0 57GSC Geological Sciences 1,498 0 1,498HAI Haitian Creole 24 0 24HEB Hebrew 129 0 129HIS History 1,462 146 1,608IGS Interdisciplinary Gobal Std. 0 381 381INS International Studies 1,510 412 1,922ITA Italian 510 6 516JPN Japanese 324 0 324JUS Judaic Studies 84 0 84LAS Latin American Studies 132 32 164LAT Latin 179 0 179MLL Modern Languages & Literature 75 69 144MLS Master of Arts in Liberal Studies 0 273 273MSL Military Science 70 0 70MTH Mathematics 11,011 324 11,335NEU Neuroscience 473 0 473PHI Philosophy 2,791 124 2,915PHY Physics 3,808 156 3,964POL Political Science 3,201 477 3,678POR Portuguese 186 3 189PSY Psychology 8,385 732 9,117
TOTAL CREDIT HOURS TAUGHT BY DEPARTMENTFall Semester, 2013
Fact Book 102 Fall 2013

Dept Undergrad GraduateCode Teaching Department Credit Credit Total
TOTAL CREDIT HOURS TAUGHT BY DEPARTMENTFall Semester, 2013
REL Religious Studies 2,398 0 2,398SOC Sociology 2,463 167 2,630SPA Spanish 3,421 76 3,497THA Theatre Arts 2,051 0 2,051URB Urban Studies 60 0 60WGS Womens and Gender Studies 597 0 597TOTAL 81,473 4,561 86,034
BUSINESS
ACC Accounting 3,844 1,644 5,488BSL Business Law 2,160 460 2,620BUS Business 222 293 515CIS Computer Information Systems 2,099 252 2,351ECO Economics 6,804 578 7,382FIN Finance 3,578 806 4,384MAS Management Science 2,643 904 3,547MGT Management 5,788 1,553 7,341MKT Marketing 3,516 473 3,989TOTAL 30,654 6,963 37,617
COMMUNICATION
CAD Advertising Communication 1,904 0 1,904CEM Communications Electronic Media 960 60 1,020CMP Motion Pictures 2,403 539 2,942CNJ News Journalism 1,170 63 1,233COM Communication 1,170 311 1,481COS Communication Studies 1,579 44 1,623CPR Public Relations 1,433 237 1,670CVJ Visual Journalism 567 108 675TOTAL 11,186 1,362 12,548
EDUCATION & HUMAN DEVELOPMENT
EPS Education and Psychological Studies 737 1,323 2,060KIN Kinesiology and Sports Sciences 5,380 739 6,119TAL Teaching and Learning 1,678 404 2,082TOTAL 7,795 2,466 10,261
ENGINEERING
BME Biomedical Engineering 1,530 560 2,090CAE Civil, Architectural & Environmental Engineering 1,322 205 1,527EEN Electrical and Computer Engineering 1,865 313 2,178IEN Industrial Engineering 2,196 567 2,763MAE Mechanical and Aerospace Engineering 1,598 203 1,801TOTAL 8,511 1,848 10,359
Fact Book 103 Fall 2013
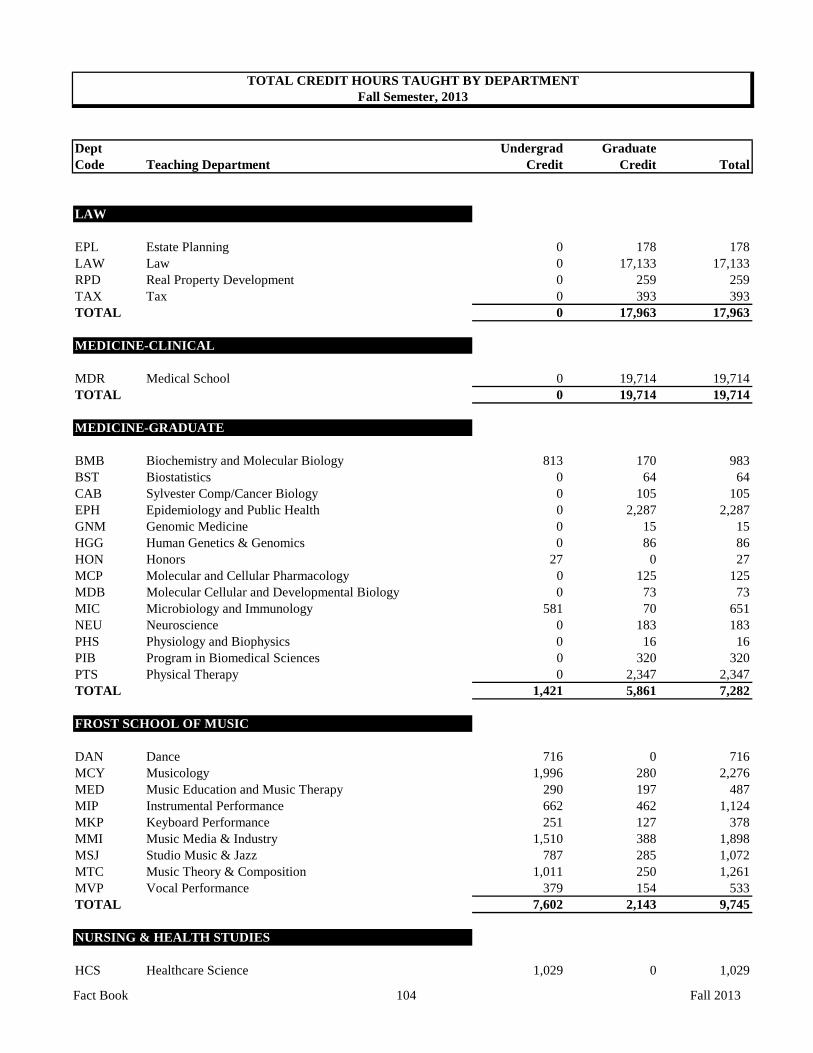
Dept Undergrad GraduateCode Teaching Department Credit Credit Total
TOTAL CREDIT HOURS TAUGHT BY DEPARTMENTFall Semester, 2013
LAW
EPL Estate Planning 0 178 178LAW Law 0 17,133 17,133RPD Real Property Development 0 259 259TAX Tax 0 393 393TOTAL 0 17,963 17,963
MEDICINE-CLINICAL
MDR Medical School 0 19,714 19,714TOTAL 0 19,714 19,714
MEDICINE-GRADUATE
BMB Biochemistry and Molecular Biology 813 170 983BST Biostatistics 0 64 64CAB Sylvester Comp/Cancer Biology 0 105 105EPH Epidemiology and Public Health 0 2,287 2,287GNM Genomic Medicine 0 15 15HGG Human Genetics & Genomics 0 86 86HON Honors 27 0 27MCP Molecular and Cellular Pharmacology 0 125 125MDB Molecular Cellular and Developmental Biology 0 73 73MIC Microbiology and Immunology 581 70 651NEU Neuroscience 0 183 183PHS Physiology and Biophysics 0 16 16PIB Program in Biomedical Sciences 0 320 320PTS Physical Therapy 0 2,347 2,347TOTAL 1,421 5,861 7,282
FROST SCHOOL OF MUSIC
DAN Dance 716 0 716MCY Musicology 1,996 280 2,276MED Music Education and Music Therapy 290 197 487MIP Instrumental Performance 662 462 1,124MKP Keyboard Performance 251 127 378MMI Music Media & Industry 1,510 388 1,898MSJ Studio Music & Jazz 787 285 1,072MTC Music Theory & Composition 1,011 250 1,261MVP Vocal Performance 379 154 533TOTAL 7,602 2,143 9,745
NURSING & HEALTH STUDIES
HCS Healthcare Science 1,029 0 1,029
Fact Book 104 Fall 2013

Dept Undergrad GraduateCode Teaching Department Credit Credit Total
TOTAL CREDIT HOURS TAUGHT BY DEPARTMENTFall Semester, 2013
NUR Nursing 4,607 2,323 6,930TOTAL 5,636 2,323 7,959
ROSENSTIEL SCHOOL
AMP Applied Marine Physics 0 95 95ATM Atmospheric Science 24 0 24BIL Biology 1,045 0 1,045BSL Business Law 81 0 81CHM Chemistry 258 0 258ECS Ecosystem Science & Policy 430 74 504LAS Latin American Studies 6 0 6LAW Law 0 3 3MAC Marine Atmospheric Chemistry 0 51 51MAF Marine Affairs and Policy 21 485 506MBF Marine Biology and Fisheries 18 477 495MGG Marine Geology and Geophysics 0 218 218MPO Meteorology & Physical Oceanography 36 323 359MSC Marine Science 2,639 0 2,639PHY Physics 315 0 315PSC Physical Sciences 99 0 99RSM Rosenstiel School, General 12 191 203TOTAL 4,984 1,917 6,901
CONT STD/GRAD SCH/JOINT PGMS
IND Independent Learning Initiative 0 0 0RST Research Training 0 0 0SAP Study Abroad Program 1,949 3 1,952UMI University Internship 34 29 63UMX University of Miami Experience 0 0 0TOTAL 1,983 32 2,015
TOTAL UNIVERSITY 164,918 68,159 233,077
Note: Graduate research credits were increased from 0 to 1.
Fact Book 105 Fall 2013
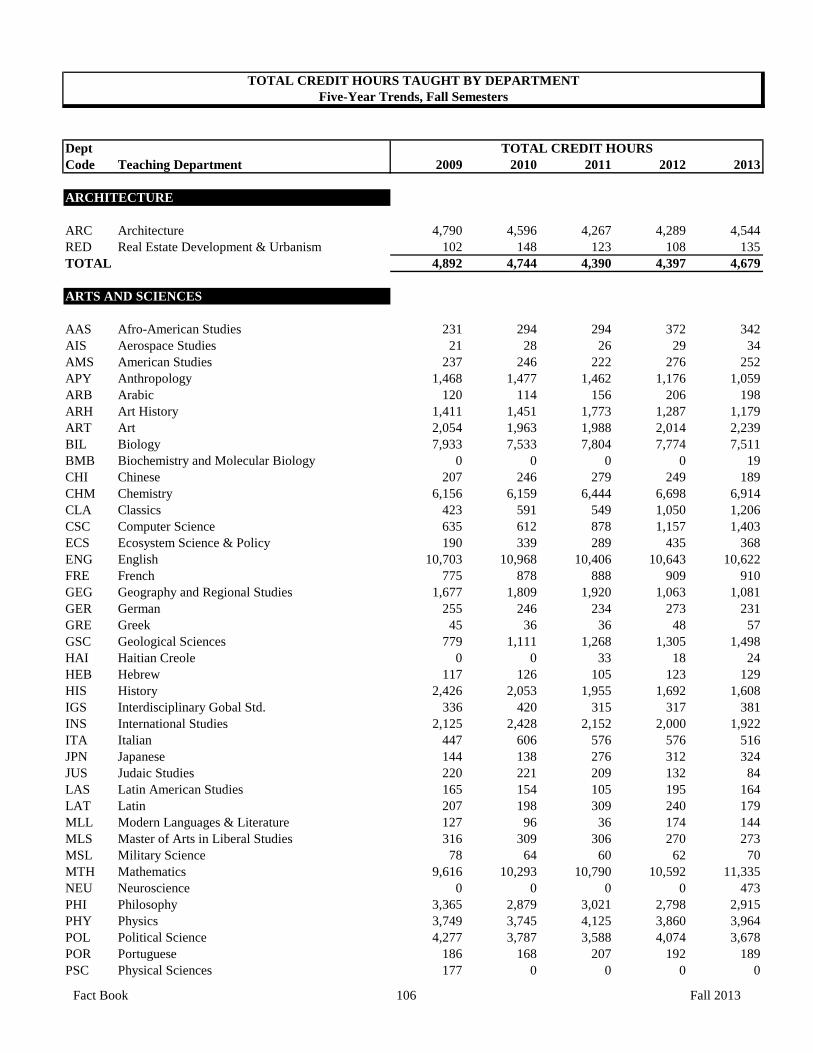
DeptCode Teaching Department 2009 2010 2011 2012 2013
ARCHITECTURE
ARC Architecture 4,790 4,596 4,267 4,289 4,544RED Real Estate Development & Urbanism 102 148 123 108 135TOTAL 4,892 4,744 4,390 4,397 4,679
ARTS AND SCIENCES
AAS Afro-American Studies 231 294 294 372 342AIS Aerospace Studies 21 28 26 29 34AMS American Studies 237 246 222 276 252APY Anthropology 1,468 1,477 1,462 1,176 1,059ARB Arabic 120 114 156 206 198ARH Art History 1,411 1,451 1,773 1,287 1,179ART Art 2,054 1,963 1,988 2,014 2,239BIL Biology 7,933 7,533 7,804 7,774 7,511BMB Biochemistry and Molecular Biology 0 0 0 0 19CHI Chinese 207 246 279 249 189CHM Chemistry 6,156 6,159 6,444 6,698 6,914CLA Classics 423 591 549 1,050 1,206CSC Computer Science 635 612 878 1,157 1,403ECS Ecosystem Science & Policy 190 339 289 435 368ENG English 10,703 10,968 10,406 10,643 10,622FRE French 775 878 888 909 910GEG Geography and Regional Studies 1,677 1,809 1,920 1,063 1,081GER German 255 246 234 273 231GRE Greek 45 36 36 48 57GSC Geological Sciences 779 1,111 1,268 1,305 1,498HAI Haitian Creole 0 0 33 18 24HEB Hebrew 117 126 105 123 129HIS History 2,426 2,053 1,955 1,692 1,608IGS Interdisciplinary Gobal Std. 336 420 315 317 381INS International Studies 2,125 2,428 2,152 2,000 1,922ITA Italian 447 606 576 576 516JPN Japanese 144 138 276 312 324JUS Judaic Studies 220 221 209 132 84LAS Latin American Studies 165 154 105 195 164LAT Latin 207 198 309 240 179MLL Modern Languages & Literature 127 96 36 174 144MLS Master of Arts in Liberal Studies 316 309 306 270 273MSL Military Science 78 64 60 62 70MTH Mathematics 9,616 10,293 10,790 10,592 11,335NEU Neuroscience 0 0 0 0 473PHI Philosophy 3,365 2,879 3,021 2,798 2,915PHY Physics 3,749 3,745 4,125 3,860 3,964POL Political Science 4,277 3,787 3,588 4,074 3,678POR Portuguese 186 168 207 192 189PSC Physical Sciences 177 0 0 0 0
TOTAL CREDIT HOURS TAUGHT BY DEPARTMENTFive-Year Trends, Fall Semesters
TOTAL CREDIT HOURS
Fact Book 106 Fall 2013
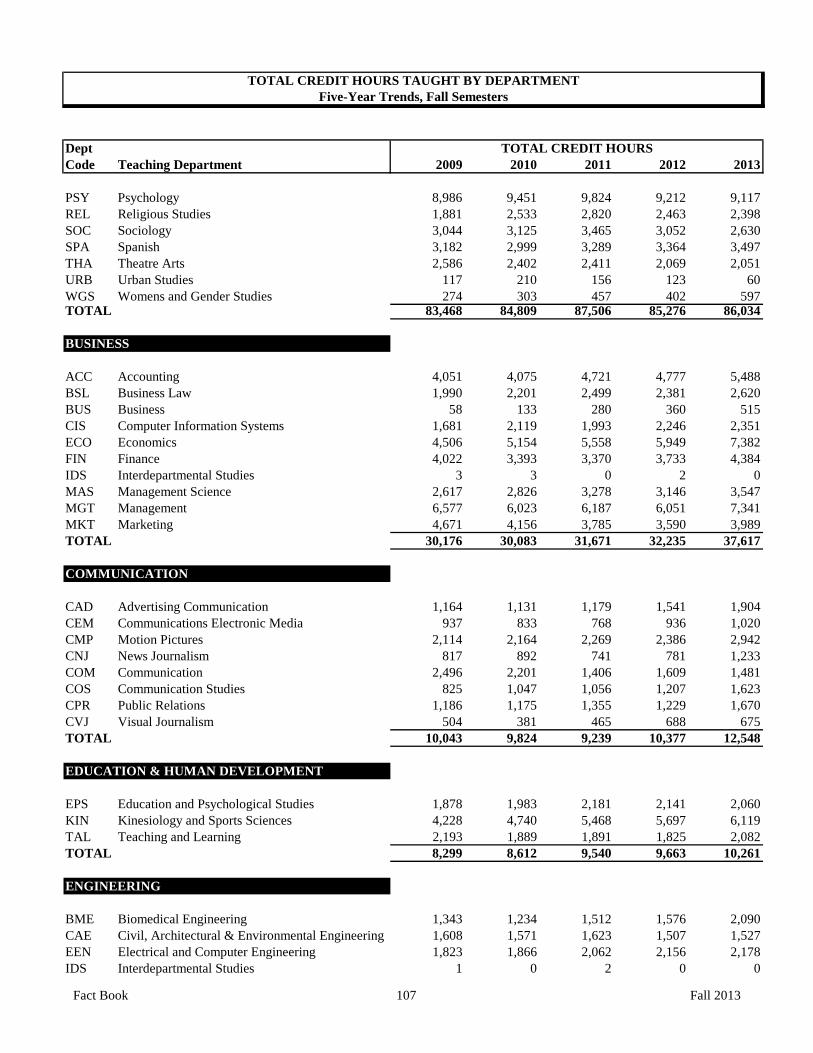
DeptCode Teaching Department 2009 2010 2011 2012 2013
TOTAL CREDIT HOURS TAUGHT BY DEPARTMENTFive-Year Trends, Fall Semesters
TOTAL CREDIT HOURS
PSY Psychology 8,986 9,451 9,824 9,212 9,117REL Religious Studies 1,881 2,533 2,820 2,463 2,398SOC Sociology 3,044 3,125 3,465 3,052 2,630SPA Spanish 3,182 2,999 3,289 3,364 3,497THA Theatre Arts 2,586 2,402 2,411 2,069 2,051URB Urban Studies 117 210 156 123 60WGS Womens and Gender Studies 274 303 457 402 597TOTAL 83,468 84,809 87,506 85,276 86,034
BUSINESS
ACC Accounting 4,051 4,075 4,721 4,777 5,488BSL Business Law 1,990 2,201 2,499 2,381 2,620BUS Business 58 133 280 360 515CIS Computer Information Systems 1,681 2,119 1,993 2,246 2,351ECO Economics 4,506 5,154 5,558 5,949 7,382FIN Finance 4,022 3,393 3,370 3,733 4,384IDS Interdepartmental Studies 3 3 0 2 0MAS Management Science 2,617 2,826 3,278 3,146 3,547MGT Management 6,577 6,023 6,187 6,051 7,341MKT Marketing 4,671 4,156 3,785 3,590 3,989TOTAL 30,176 30,083 31,671 32,235 37,617
COMMUNICATION
CAD Advertising Communication 1,164 1,131 1,179 1,541 1,904CEM Communications Electronic Media 937 833 768 936 1,020CMP Motion Pictures 2,114 2,164 2,269 2,386 2,942CNJ News Journalism 817 892 741 781 1,233COM Communication 2,496 2,201 1,406 1,609 1,481COS Communication Studies 825 1,047 1,056 1,207 1,623CPR Public Relations 1,186 1,175 1,355 1,229 1,670CVJ Visual Journalism 504 381 465 688 675TOTAL 10,043 9,824 9,239 10,377 12,548
EDUCATION & HUMAN DEVELOPMENT
EPS Education and Psychological Studies 1,878 1,983 2,181 2,141 2,060KIN Kinesiology and Sports Sciences 4,228 4,740 5,468 5,697 6,119TAL Teaching and Learning 2,193 1,889 1,891 1,825 2,082TOTAL 8,299 8,612 9,540 9,663 10,261
ENGINEERING
BME Biomedical Engineering 1,343 1,234 1,512 1,576 2,090CAE Civil, Architectural & Environmental Engineering 1,608 1,571 1,623 1,507 1,527EEN Electrical and Computer Engineering 1,823 1,866 2,062 2,156 2,178IDS Interdepartmental Studies 1 0 2 0 0
Fact Book 107 Fall 2013
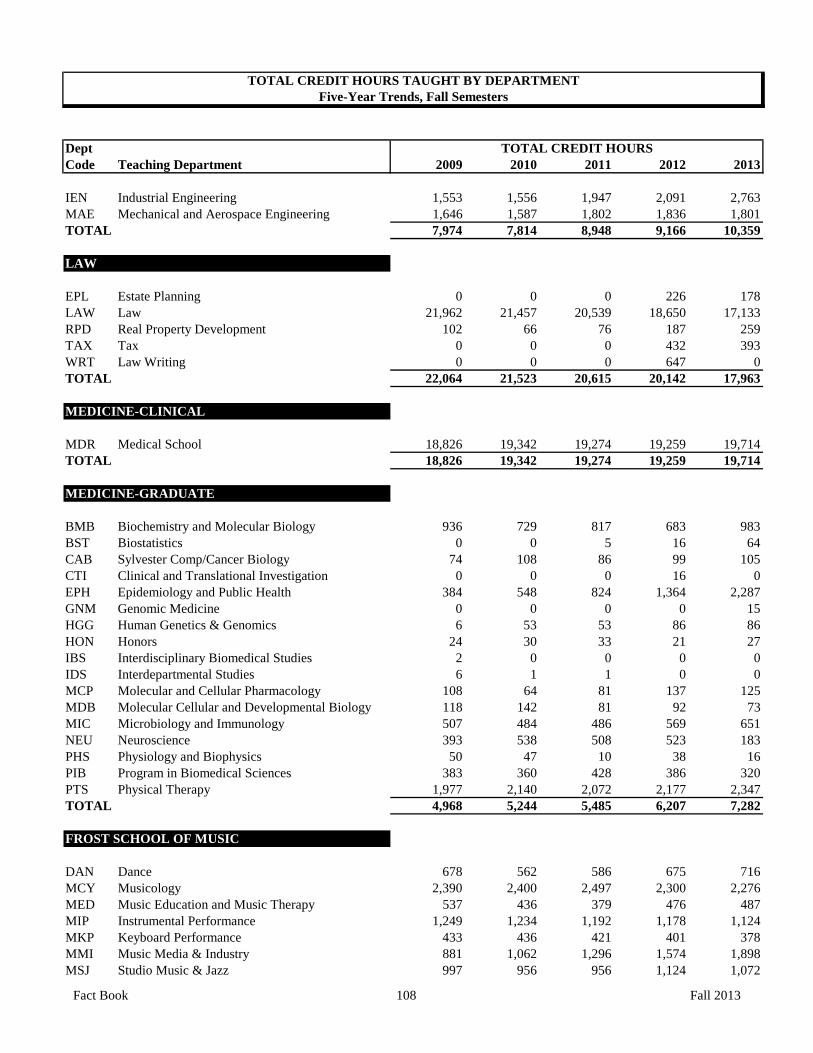
DeptCode Teaching Department 2009 2010 2011 2012 2013
TOTAL CREDIT HOURS TAUGHT BY DEPARTMENTFive-Year Trends, Fall Semesters
TOTAL CREDIT HOURS
IEN Industrial Engineering 1,553 1,556 1,947 2,091 2,763MAE Mechanical and Aerospace Engineering 1,646 1,587 1,802 1,836 1,801TOTAL 7,974 7,814 8,948 9,166 10,359
LAW
EPL Estate Planning 0 0 0 226 178LAW Law 21,962 21,457 20,539 18,650 17,133RPD Real Property Development 102 66 76 187 259TAX Tax 0 0 0 432 393WRT Law Writing 0 0 0 647 0TOTAL 22,064 21,523 20,615 20,142 17,963
MEDICINE-CLINICAL
MDR Medical School 18,826 19,342 19,274 19,259 19,714TOTAL 18,826 19,342 19,274 19,259 19,714
MEDICINE-GRADUATE
BMB Biochemistry and Molecular Biology 936 729 817 683 983BST Biostatistics 0 0 5 16 64CAB Sylvester Comp/Cancer Biology 74 108 86 99 105CTI Clinical and Translational Investigation 0 0 0 16 0EPH Epidemiology and Public Health 384 548 824 1,364 2,287GNM Genomic Medicine 0 0 0 0 15HGG Human Genetics & Genomics 6 53 53 86 86HON Honors 24 30 33 21 27IBS Interdisciplinary Biomedical Studies 2 0 0 0 0IDS Interdepartmental Studies 6 1 1 0 0MCP Molecular and Cellular Pharmacology 108 64 81 137 125MDB Molecular Cellular and Developmental Biology 118 142 81 92 73MIC Microbiology and Immunology 507 484 486 569 651NEU Neuroscience 393 538 508 523 183PHS Physiology and Biophysics 50 47 10 38 16PIB Program in Biomedical Sciences 383 360 428 386 320PTS Physical Therapy 1,977 2,140 2,072 2,177 2,347TOTAL 4,968 5,244 5,485 6,207 7,282
FROST SCHOOL OF MUSIC
DAN Dance 678 562 586 675 716MCY Musicology 2,390 2,400 2,497 2,300 2,276MED Music Education and Music Therapy 537 436 379 476 487MIP Instrumental Performance 1,249 1,234 1,192 1,178 1,124MKP Keyboard Performance 433 436 421 401 378MMI Music Media & Industry 881 1,062 1,296 1,574 1,898MSJ Studio Music & Jazz 997 956 956 1,124 1,072
Fact Book 108 Fall 2013

DeptCode Teaching Department 2009 2010 2011 2012 2013
TOTAL CREDIT HOURS TAUGHT BY DEPARTMENTFive-Year Trends, Fall Semesters
TOTAL CREDIT HOURS
MTC Music Theory & Composition 1,372 1,319 1,309 1,280 1,261MVP Vocal Performance 870 775 612 544 533TOTAL 9,407 9,180 9,248 9,552 9,745
NURSING & HEALTH STUDIES
HCS Healthcare Science 355 607 707 693 1,029NUR Nursing 5,170 6,309 6,115 7,911 6,930TOTAL 5,525 6,916 6,822 8,604 7,959
ROSENSTIEL SCHOOL
AMP Applied Marine Physics 60 94 68 101 95APY Anthropology 57 63 90 9 0ATM Atmospheric Science 0 0 0 24 24BIL Biology 491 648 714 737 1,045BSL Business Law 72 69 63 102 81CAE Civil, Architectural & Environmental Engineering 0 78 7 0 0CHM Chemistry 72 75 75 72 258ECS Ecosystem Science & Policy 458 552 424 529 504GEG Geography and Regional Studies 0 15 0 0 0GSC Geological Sciences 212 20 0 3 0HON Honors 0 0 0 1 0IDS Interdepartmental Studies 1 0 0 0 0INS International Studies 0 0 3 0 0LAS Latin American Studies 24 6 6 18 6LAW Law 0 0 0 3 3MAC Marine Atmospheric Chemistry 30 42 41 42 51MAF Marine Affairs and Policy 255 363 436 492 506MBF Marine Biology and Fisheries 305 344 493 416 495MGG Marine Geology and Geophysics 127 164 153 180 218MPO Meteorology & Physical Oceanography 251 339 451 412 359MSC Marine Science 1,770 2,199 1,974 2,275 2,639PHY Physics 0 0 0 318 315PSC Physical Sciences 0 204 174 252 99RSM Rosenstiel School, General 0 51 121 190 203TOTAL 4,185 5,326 5,293 6,176 6,901
CONT STD/GRAD SCH/JOINT PGMS
IND Independent Learning Initiative 0 0 0 0 0RST Research Training 0 0 0 9 0SAP Study Abroad Program 856 1,151 1,288 2,000 1,952UMI University Internship 11 28 34 49 63UMX University of Miami Experience 487 528 498 491 0TOTAL 1,354 1,707 1,820 2,549 2,015
TOTAL UNIVERSITY 211,181 215,124 219,851 223,603 233,077
Note: Graduate research credits were increased from 0 to 1.
Fact Book 109 Fall 2013
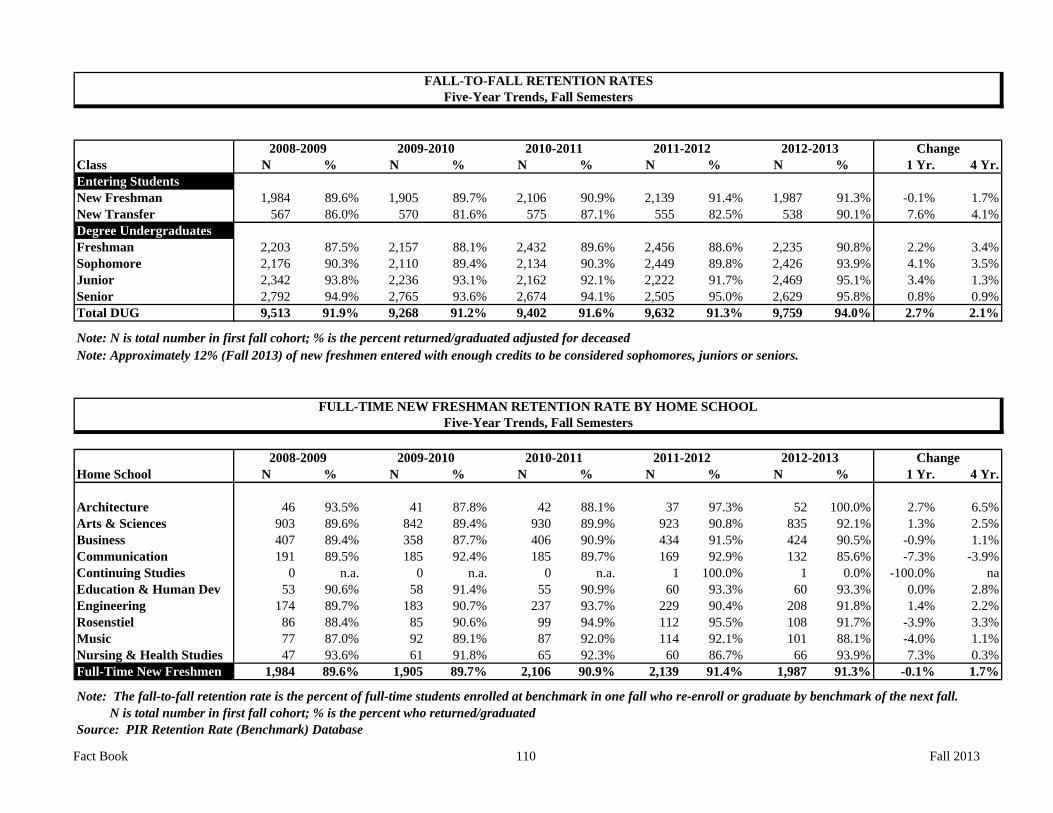
N % N % N % N % N % 1 Yr. 4 Yr.Entering StudentsNew Freshman 1,984 89.6% 1,905 89.7% 2,106 90.9% 2,139 91.4% 1,987 91.3% -0.1% 1.7%New Transfer 567 86.0% 570 81.6% 575 87.1% 555 82.5% 538 90.1% 7.6% 4.1%Degree UndergraduatesFreshman 2,203 87.5% 2,157 88.1% 2,432 89.6% 2,456 88.6% 2,235 90.8% 2.2% 3.4%Sophomore 2,176 90.3% 2,110 89.4% 2,134 90.3% 2,449 89.8% 2,426 93.9% 4.1% 3.5%Junior 2,342 93.8% 2,236 93.1% 2,162 92.1% 2,222 91.7% 2,469 95.1% 3.4% 1.3%Senior 2,792 94.9% 2,765 93.6% 2,674 94.1% 2,505 95.0% 2,629 95.8% 0.8% 0.9%Total DUG 9,513 91.9% 9,268 91.2% 9,402 91.6% 9,632 91.3% 9,759 94.0% 2.7% 2.1%
Note: N is total number in first fall cohort; % is the percent returned/graduated adjusted for deceasedNote: Approximately 12% (Fall 2013) of new freshmen entered with enough credits to be considered sophomores, juniors or seniors.
N % N % N % N % N % 1 Yr. 4 Yr.
Architecture 46 93.5% 41 87.8% 42 88.1% 37 97.3% 52 100.0% 2.7% 6.5%Arts & Sciences 903 89.6% 842 89.4% 930 89.9% 923 90.8% 835 92.1% 1.3% 2.5%Business 407 89.4% 358 87.7% 406 90.9% 434 91.5% 424 90.5% -0.9% 1.1%Communication 191 89.5% 185 92.4% 185 89.7% 169 92.9% 132 85.6% -7.3% -3.9%Continuing Studies 0 n.a. 0 n.a. 0 n.a. 1 100.0% 1 0.0% -100.0% naEducation & Human Dev 53 90.6% 58 91.4% 55 90.9% 60 93.3% 60 93.3% 0.0% 2.8%Engineering 174 89.7% 183 90.7% 237 93.7% 229 90.4% 208 91.8% 1.4% 2.2%Rosenstiel 86 88.4% 85 90.6% 99 94.9% 112 95.5% 108 91.7% -3.9% 3.3%Music 77 87.0% 92 89.1% 87 92.0% 114 92.1% 101 88.1% -4.0% 1.1%Nursing & Health Studies 47 93.6% 61 91.8% 65 92.3% 60 86.7% 66 93.9% 7.3% 0.3%Full-Time New Freshmen 1,984 89.6% 1,905 89.7% 2,106 90.9% 2,139 91.4% 1,987 91.3% -0.1% 1.7%
Source: PIR Retention Rate (Benchmark) Database
Note: The fall-to-fall retention rate is the percent of full-time students enrolled at benchmark in one fall who re-enroll or graduate by benchmark of the next fall. N is total number in first fall cohort; % is the percent who returned/graduated
FULL-TIME NEW FRESHMAN RETENTION RATE BY HOME SCHOOLFive-Year Trends, Fall Semesters
Home School2008-2009 2009-2010 2010-2011 2011-2012 2012-2013 Change
FALL-TO-FALL RETENTION RATESFive-Year Trends, Fall Semesters
Class2008-2009 2009-2010 2010-2011 2011-2012 2012-2013 Change
Fact Book 110 Fall 2013

Time to Degree 2003 2004 2005 2006 2007 2008** 2009**
4 years or less 66.5% 68.2% 65.5% 69.5% 70.8% 68.1% 66.9%5 years or less 78.3% 78.9% 76.4% 79.3% 80.7% 78.2% na6 years or less 79.5% 80.2% 77.9% 80.5% 81.7% na naNumber in cohort 2,066 2,025 2,258 2,046 1,977 1,983 1,903
** Preliminary, unofficialSource: U.S. Department of Eduation Graduation Rate Survey
GRADUATION RATESTrend Data
GRADUATION RATES
Cohort Year*
* Graduation rates are based on the U.S. Department of Education's methodology: Cohort is degree-seeking students who enrolled for the first time in college either in the fall or in one of the two preceding summer sessions and who were enrolled full-time in that fall. Graduation rates are the percentage of the cohort who earned a degree in the time indicated (time to degree is through August 31st of degree year). Deceased students are excluded.
Fact Book 111 Fall 2013
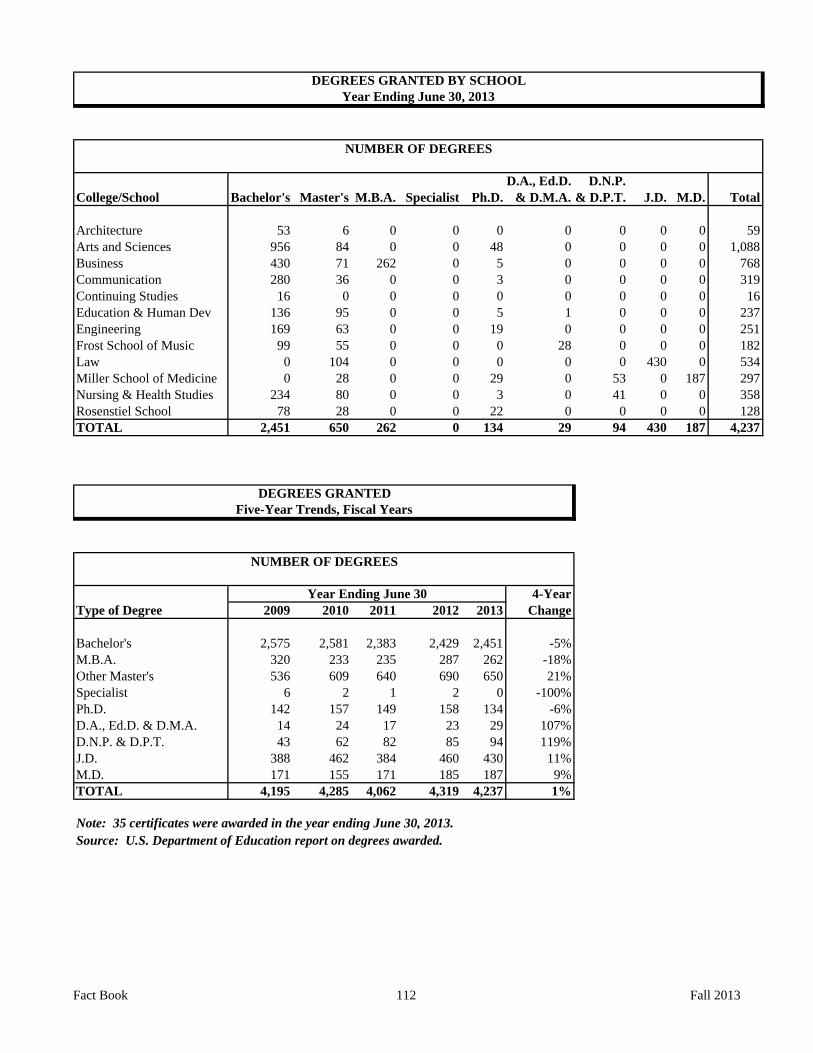
D.A., Ed.D. D.N.P.College/School Bachelor's Master's M.B.A. Specialist Ph.D. & D.M.A. & D.P.T. J.D. M.D. Total
Architecture 53 6 0 0 0 0 0 0 0 59Arts and Sciences 956 84 0 0 48 0 0 0 0 1,088Business 430 71 262 0 5 0 0 0 0 768Communication 280 36 0 0 3 0 0 0 0 319Continuing Studies 16 0 0 0 0 0 0 0 0 16Education & Human Dev 136 95 0 0 5 1 0 0 0 237Engineering 169 63 0 0 19 0 0 0 0 251Frost School of Music 99 55 0 0 0 28 0 0 0 182Law 0 104 0 0 0 0 0 430 0 534Miller School of Medicine 0 28 0 0 29 0 53 0 187 297Nursing & Health Studies 234 80 0 0 3 0 41 0 0 358Rosenstiel School 78 28 0 0 22 0 0 0 0 128TOTAL 2,451 650 262 0 134 29 94 430 187 4,237
4-YearType of Degree 2009 2010 2011 2012 2013 Change
Bachelor's 2,575 2,581 2,383 2,429 2,451 -5%M.B.A. 320 233 235 287 262 -18%Other Master's 536 609 640 690 650 21%Specialist 6 2 1 2 0 -100%Ph.D. 142 157 149 158 134 -6%D.A., Ed.D. & D.M.A. 14 24 17 23 29 107%D.N.P. & D.P.T. 43 62 82 85 94 119%J.D. 388 462 384 460 430 11%M.D. 171 155 171 185 187 9%TOTAL 4,195 4,285 4,062 4,319 4,237 1%
Note: 35 certificates were awarded in the year ending June 30, 2013.Source: U.S. Department of Education report on degrees awarded.
NUMBER OF DEGREES
DEGREES GRANTED BY SCHOOLYear Ending June 30, 2013
Year Ending June 30
DEGREES GRANTEDFive-Year Trends, Fiscal Years
NUMBER OF DEGREES
Fact Book 112 Fall 2013

Major CIP Masters/ Doc - Doc - Prof.Code Major Name Code Bachelors Specialist Research Practice TOTAL
ARCHITECTURE
ARC Architecture 04.0201 53 5 0 0 58REDU Real Estate Development & Urbanism 04.0301 0 1 0 0 1TOTAL 53 6 0 0 59
ARTS AND SCIENCES
AFS Africana Studies 05.0201 1 0 0 0 1APY Anthropology 45.0201 16 0 0 0 16ART Art 50.0701 10 4 0 0 14ARTH Art History 50.0703 5 0 0 0 5ARTS Studio Art 50.0702 11 0 0 0 11BCH Biochemistry 26.0202 15 0 0 0 15BIL Biology 26.0101 147 1 4 0 152BLAR Liberal Arts 24.0102 22 0 0 0 22CHM Chemistry 40.0501 11 1 8 0 20CLA Classics 16.1200 3 0 0 0 3CRI Criminology 45.0401 27 0 0 0 27CSC Computer Science 11.0701 16 3 0 0 19CWR Creative Writing 23.1302 0 4 0 0 4ECOA Economics 45.0601 80 0 0 0 80ECS Ecosystem Science and Policy 03.0201 14 0 0 0 14ENG English 23.0101 38 4 2 0 44FRE French 16.0901 2 0 0 0 2GEG Geography 45.0701 6 1 0 0 7GSC Geological Sciences 40.0601 6 0 0 0 6HIS History 54.0101 21 1 5 0 27INA International Administration 45.0901 0 10 0 0 10INTA International Administration 45.0901 0 1 0 0 1ITS International Studies 45.0901 60 4 5 0 69LAS Latin American Studies 05.0107 1 2 0 0 3LIS Liberal Studies 24.0101 0 20 0 0 20MIC Microbiology 26.0508 34 0 0 0 34MSB Marine Science-Biology 26.1302 1 0 0 0 1MTH Mathematics 27.0101 25 5 2 0 32NEU Neuroscience 26.1501 1 0 0 0 1NEUB Neuroscience/Neurobiology 26.1501 25 0 0 0 25NEUP Neuroscience/Psychobiology 26.1501 33 0 0 0 33PAD Public Administration 44.0401 0 8 0 0 8PHI Philosophy 38.0101 15 0 3 0 18PHY Physics 40.0801 5 1 2 0 8POL Political Science 45.1001 79 0 0 0 79PSY Psychology 42.0101 155 14 15 0 184PSYS Psychology-Science 42.0101 28 0 0 0 28REL Religious Studies 38.0201 1 0 0 0 1RSF Romance Studies, French 16.0901 0 0 2 0 2SOC Sociology 45.1101 25 0 0 0 25
DEGREES GRANTED BY MAJORYear Ending June 30, 2013
Fact Book 113 Fall 2013

Major CIP Masters/ Doc - Doc - Prof.Code Major Name Code Bachelors Specialist Research Practice TOTAL
DEGREES GRANTED BY MAJORYear Ending June 30, 2013
SPA Spanish 16.0905 2 0 0 0 2THA Theater Arts 50.0501 13 0 0 0 13WGS Women and Gender Studies 05.0207 2 0 0 0 2TOTAL 956 84 48 0 1,088
BUSINESS
ACC Accounting 52.0301 72 49 0 0 121AOMB Add on MBA-MSPM 52.0201 0 5 0 0 5BMO Business Management and Organization 52.0201 1 0 0 0 1BUS PhD-Business Administration 52.0201 0 0 1 0 1ECO Economics 52.0601 32 0 3 0 35EMB Executive MBA 52.0201 0 18 0 0 18ENT Entrepreneurship 52.0701 26 0 0 0 26ENTS Entrepreneurship 52.0701 4 0 0 0 4FIN Finance 52.0801 119 0 0 0 119GMB Global Executive MBA 52.0201 0 16 0 0 16HRM Human Resources Management 52.1001 2 0 0 0 2HSMP Health Sector Management and Policy 51.0701 13 0 0 0 13IDS Interdisciplinary Studies 30.9999 0 0 1 0 1IFM International Finance & Marketing 52.1101 26 0 0 0 26LST Legal Studies 22.0000 13 0 0 0 13MASS Management Science 52.1301 2 0 0 0 2MBA Master of Business Administration 52.0201 0 108 0 0 108MGT Management 52.0201 63 0 0 0 63MKT Marketing 52.1401 55 0 0 0 55MST Master of Science in Taxation 52.1601 0 22 0 0 22MWP1 MBA-Working Professionals 52.0201 0 59 0 0 59OFD Executive MBA-Delray 52.0201 0 12 0 0 12OFT Executive MBA-Tampa 52.0201 0 1 0 0 1REA Real Estate 52.1501 2 0 0 0 2SHA Executive MBA-Health Administration 51.0701 0 38 0 0 38STON Executive MBA-On Campus Straggler 52.0201 0 5 0 0 5TOTAL 430 333 5 0 768
COMMUNICATION
CAD Communication Advertising 09.0903 63 0 0 0 63CBJ Communication Broadcast Journalism 09.0402 32 0 0 0 32CEM Communication Electronic Media 09.0702 14 0 0 0 14CFP Motion Picture Production 50.0602 0 6 0 0 6CFS Motion Picture Screenwriting 50.0601 0 4 0 0 4CMC Communication Studies 09.0101 0 8 0 0 8CMF Film Studies 50.0601 0 1 0 0 1CMG Broadcast Journalism 09.0701 0 3 0 0 3CMJ Journalism 09.0401 0 3 0 0 3CMM Media Management 09.0102 13 0 0 0 13CMP Communication Motion Pictures 50.0602 48 0 0 0 48
Fact Book 114 Fall 2013

Major CIP Masters/ Doc - Doc - Prof.Code Major Name Code Bachelors Specialist Research Practice TOTAL
DEGREES GRANTED BY MAJORYear Ending June 30, 2013
CMR Public Relations 09.0902 0 10 0 0 10CNJ Communication News Journalism 09.0401 31 0 0 0 31COM Communication 09.0101 0 0 3 0 3COS Communication Studies 09.0101 12 0 0 0 12CPD Motion Picture Producing 50.0602 0 1 0 0 1CPR Communication Public Relations 09.0902 56 0 0 0 56CVJ Visual Journalism 09.0401 11 0 0 0 11TOTAL 280 36 3 0 319
CONTINUING STUDIES
BGSC General Studies 24.0102 12 0 0 0 12BGSN General Studies-Non TR 24.0102 4 0 0 0 4TOTAL 16 0 0 0 16
EDUCATION & HUMAN DEVELOPMENT
ATHT Athletic Training 51.0913 13 0 0 0 13CMFT Counseling Marriage & Family Therapy 51.1505 0 6 0 0 6CMHC Counseling Mental Health 51.1508 0 12 0 0 12CPSP Counseling Psychology 42.2803 0 0 3 0 3CRES Counseling and Research 51.1508 0 1 0 0 1CSCH Community and Social Change 42.2802 0 13 0 0 13ECSE Early Childhood/Special Education 13.1015 0 1 0 0 1EDU Education 13.0101 0 1 0 0 1EESP Elementary Education Special Education 13.1202 6 0 0 0 6ELED Elementary Education 13.1202 5 0 0 0 5ERME Research, Measurement, and Evaluation 13.0601 0 1 0 0 1EXP Exercise Physiology 26.0908 50 6 0 0 56EXSC Exercise Physiology-Strength & Conditioning 26.0908 0 14 0 0 14HEEM Higher Education/Enrollment Management 13.0406 0 2 0 0 2HEL Higher Education Leadership 13.0406 0 0 1 0 1HSDC Human & Social Develop.: Community Dev 42.2802 7 0 0 0 7HSDI Human & Social Develop.: Ind & Rel Dev 19.0707 5 0 0 0 5REM6 Reading 13.1315 0 1 0 0 1SCE1 Education and Social Change 13.1206 0 16 0 0 16SMD Sports Medicine 26.0908 0 1 0 0 1SPAD Sport Administration 31.0504 50 20 0 0 70TAL Teaching and Learning 13.0404 0 0 2 0 2TOTAL 136 95 6 0 237
ENGINEERING
AEN Architectural Engineering 14.0401 7 0 0 0 7ASE Aerospace Engineering-BSASE 14.0201 17 0 0 0 17ASEC Aerospace Engineering-BSME 14.1901 3 0 0 0 3BME Biomedical Engineering 14.0501 38 22 4 0 64CEN Civil Engineering 14.0801 13 9 6 0 28
Fact Book 115 Fall 2013
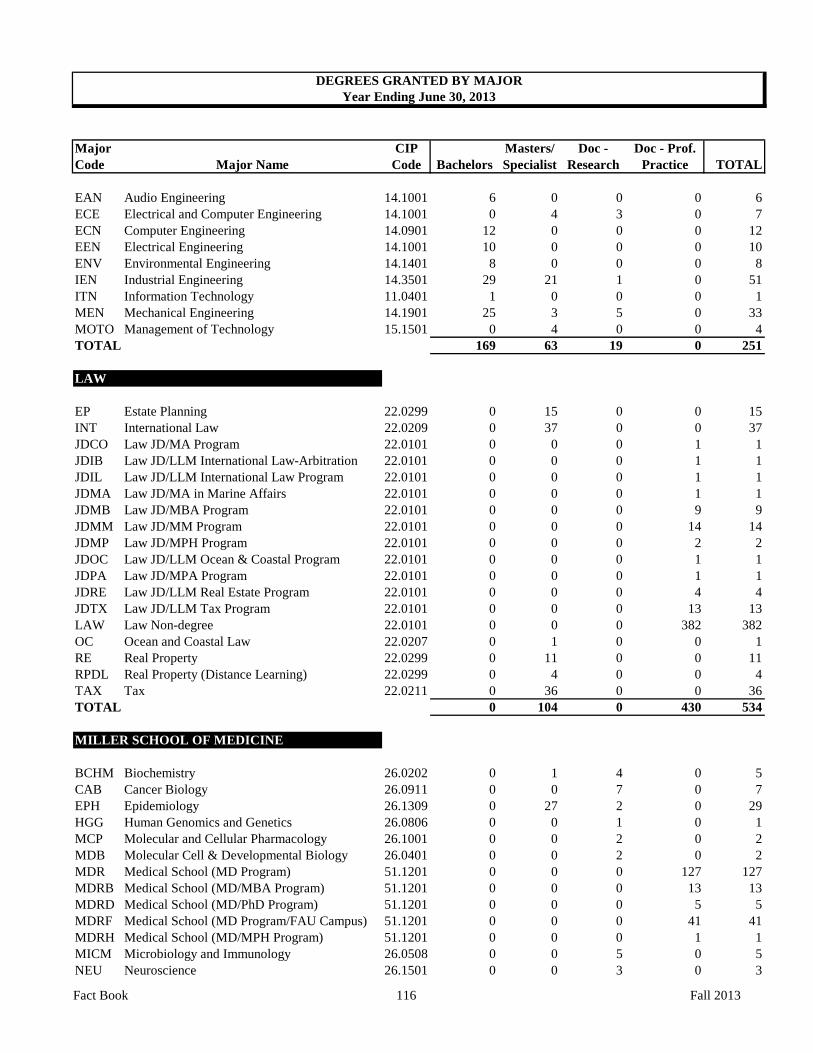
Major CIP Masters/ Doc - Doc - Prof.Code Major Name Code Bachelors Specialist Research Practice TOTAL
DEGREES GRANTED BY MAJORYear Ending June 30, 2013
EAN Audio Engineering 14.1001 6 0 0 0 6ECE Electrical and Computer Engineering 14.1001 0 4 3 0 7ECN Computer Engineering 14.0901 12 0 0 0 12EEN Electrical Engineering 14.1001 10 0 0 0 10ENV Environmental Engineering 14.1401 8 0 0 0 8IEN Industrial Engineering 14.3501 29 21 1 0 51ITN Information Technology 11.0401 1 0 0 0 1MEN Mechanical Engineering 14.1901 25 3 5 0 33MOTO Management of Technology 15.1501 0 4 0 0 4TOTAL 169 63 19 0 251
LAW
EP Estate Planning 22.0299 0 15 0 0 15INT International Law 22.0209 0 37 0 0 37JDCO Law JD/MA Program 22.0101 0 0 0 1 1JDIB Law JD/LLM International Law-Arbitration 22.0101 0 0 0 1 1JDIL Law JD/LLM International Law Program 22.0101 0 0 0 1 1JDMA Law JD/MA in Marine Affairs 22.0101 0 0 0 1 1JDMB Law JD/MBA Program 22.0101 0 0 0 9 9JDMM Law JD/MM Program 22.0101 0 0 0 14 14JDMP Law JD/MPH Program 22.0101 0 0 0 2 2JDOC Law JD/LLM Ocean & Coastal Program 22.0101 0 0 0 1 1JDPA Law JD/MPA Program 22.0101 0 0 0 1 1JDRE Law JD/LLM Real Estate Program 22.0101 0 0 0 4 4JDTX Law JD/LLM Tax Program 22.0101 0 0 0 13 13LAW Law Non-degree 22.0101 0 0 0 382 382OC Ocean and Coastal Law 22.0207 0 1 0 0 1RE Real Property 22.0299 0 11 0 0 11RPDL Real Property (Distance Learning) 22.0299 0 4 0 0 4TAX Tax 22.0211 0 36 0 0 36TOTAL 0 104 0 430 534
MILLER SCHOOL OF MEDICINE
BCHM Biochemistry 26.0202 0 1 4 0 5CAB Cancer Biology 26.0911 0 0 7 0 7EPH Epidemiology 26.1309 0 27 2 0 29HGG Human Genomics and Genetics 26.0806 0 0 1 0 1MCP Molecular and Cellular Pharmacology 26.1001 0 0 2 0 2MDB Molecular Cell & Developmental Biology 26.0401 0 0 2 0 2MDR Medical School (MD Program) 51.1201 0 0 0 127 127MDRB Medical School (MD/MBA Program) 51.1201 0 0 0 13 13MDRD Medical School (MD/PhD Program) 51.1201 0 0 0 5 5MDRF Medical School (MD Program/FAU Campus) 51.1201 0 0 0 41 41MDRH Medical School (MD/MPH Program) 51.1201 0 0 0 1 1MICM Microbiology and Immunology 26.0508 0 0 5 0 5NEU Neuroscience 26.1501 0 0 3 0 3
Fact Book 116 Fall 2013
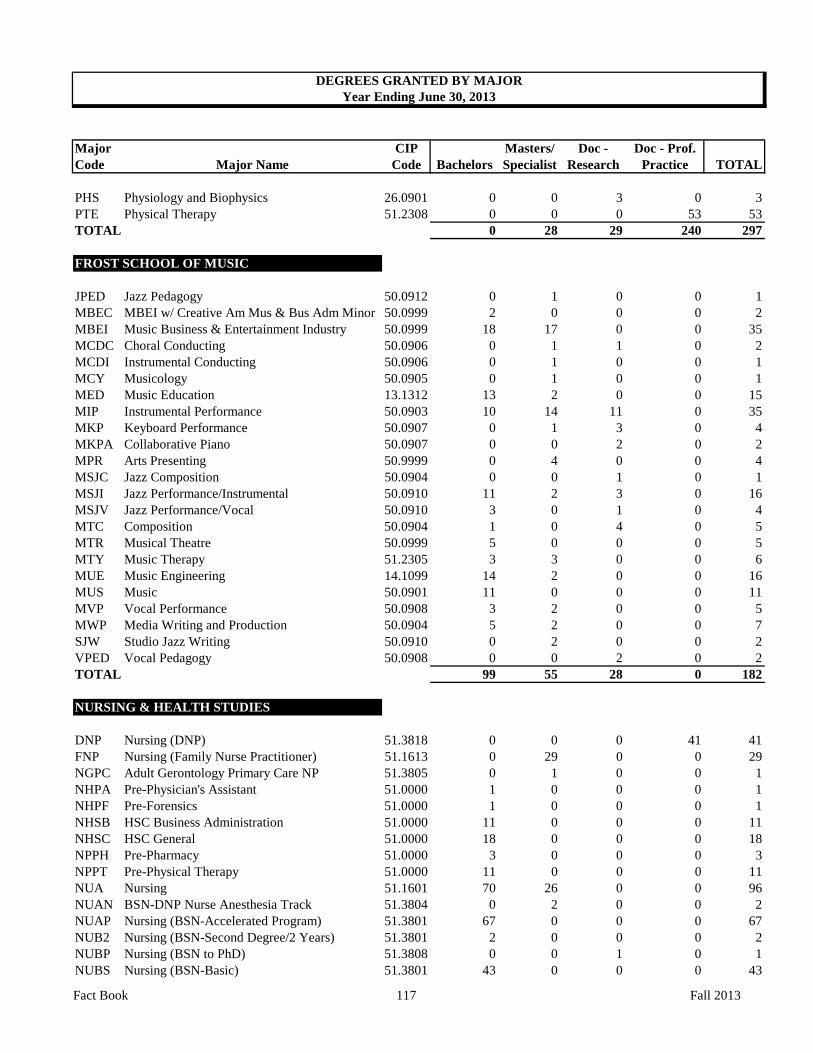
Major CIP Masters/ Doc - Doc - Prof.Code Major Name Code Bachelors Specialist Research Practice TOTAL
DEGREES GRANTED BY MAJORYear Ending June 30, 2013
PHS Physiology and Biophysics 26.0901 0 0 3 0 3PTE Physical Therapy 51.2308 0 0 0 53 53TOTAL 0 28 29 240 297
FROST SCHOOL OF MUSIC
JPED Jazz Pedagogy 50.0912 0 1 0 0 1MBEC MBEI w/ Creative Am Mus & Bus Adm Minor 50.0999 2 0 0 0 2MBEI Music Business & Entertainment Industry 50.0999 18 17 0 0 35MCDC Choral Conducting 50.0906 0 1 1 0 2MCDI Instrumental Conducting 50.0906 0 1 0 0 1MCY Musicology 50.0905 0 1 0 0 1MED Music Education 13.1312 13 2 0 0 15MIP Instrumental Performance 50.0903 10 14 11 0 35MKP Keyboard Performance 50.0907 0 1 3 0 4MKPA Collaborative Piano 50.0907 0 0 2 0 2MPR Arts Presenting 50.9999 0 4 0 0 4MSJC Jazz Composition 50.0904 0 0 1 0 1MSJI Jazz Performance/Instrumental 50.0910 11 2 3 0 16MSJV Jazz Performance/Vocal 50.0910 3 0 1 0 4MTC Composition 50.0904 1 0 4 0 5MTR Musical Theatre 50.0999 5 0 0 0 5MTY Music Therapy 51.2305 3 3 0 0 6MUE Music Engineering 14.1099 14 2 0 0 16MUS Music 50.0901 11 0 0 0 11MVP Vocal Performance 50.0908 3 2 0 0 5MWP Media Writing and Production 50.0904 5 2 0 0 7SJW Studio Jazz Writing 50.0910 0 2 0 0 2VPED Vocal Pedagogy 50.0908 0 0 2 0 2TOTAL 99 55 28 0 182
NURSING & HEALTH STUDIES
DNP Nursing (DNP) 51.3818 0 0 0 41 41FNP Nursing (Family Nurse Practitioner) 51.1613 0 29 0 0 29NGPC Adult Gerontology Primary Care NP 51.3805 0 1 0 0 1NHPA Pre-Physician's Assistant 51.0000 1 0 0 0 1NHPF Pre-Forensics 51.0000 1 0 0 0 1NHSB HSC Business Administration 51.0000 11 0 0 0 11NHSC HSC General 51.0000 18 0 0 0 18NPPH Pre-Pharmacy 51.0000 3 0 0 0 3NPPT Pre-Physical Therapy 51.0000 11 0 0 0 11NUA Nursing 51.1601 70 26 0 0 96NUAN BSN-DNP Nurse Anesthesia Track 51.3804 0 2 0 0 2NUAP Nursing (BSN-Accelerated Program) 51.3801 67 0 0 0 67NUB2 Nursing (BSN-Second Degree/2 Years) 51.3801 2 0 0 0 2NUBP Nursing (BSN to PhD) 51.3808 0 0 1 0 1NUBS Nursing (BSN-Basic) 51.3801 43 0 0 0 43
Fact Book 117 Fall 2013
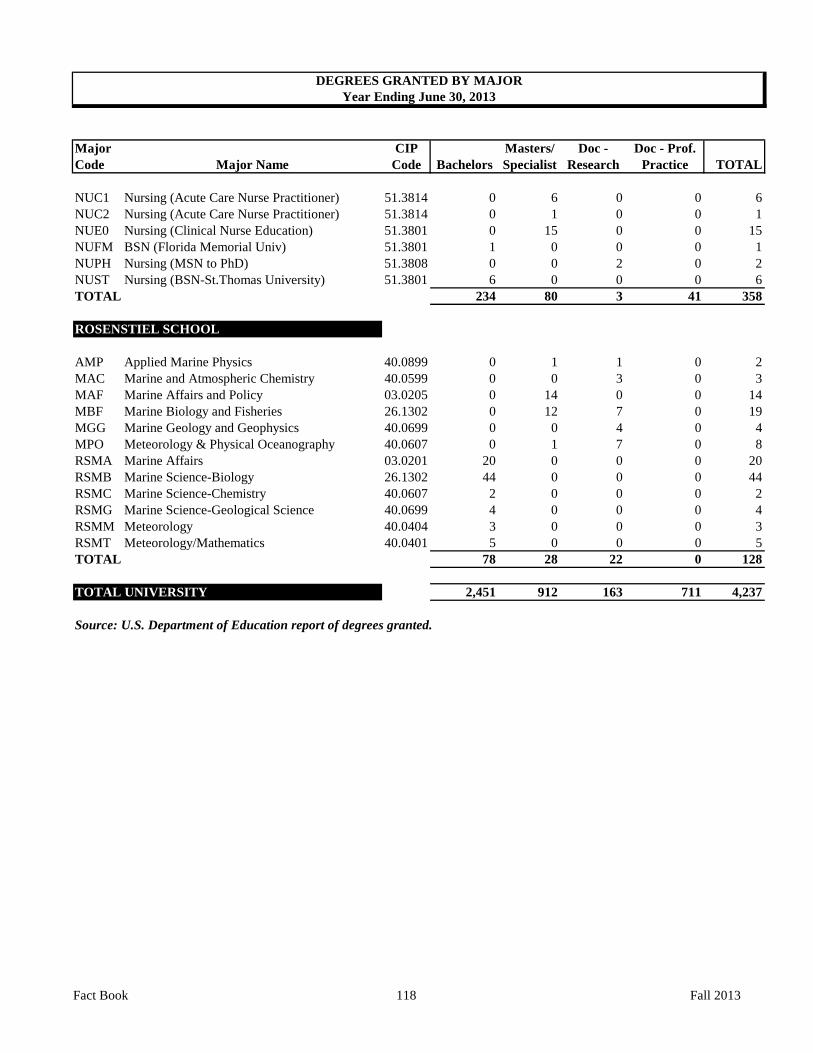
Major CIP Masters/ Doc - Doc - Prof.Code Major Name Code Bachelors Specialist Research Practice TOTAL
DEGREES GRANTED BY MAJORYear Ending June 30, 2013
NUC1 Nursing (Acute Care Nurse Practitioner) 51.3814 0 6 0 0 6NUC2 Nursing (Acute Care Nurse Practitioner) 51.3814 0 1 0 0 1NUE0 Nursing (Clinical Nurse Education) 51.3801 0 15 0 0 15NUFM BSN (Florida Memorial Univ) 51.3801 1 0 0 0 1NUPH Nursing (MSN to PhD) 51.3808 0 0 2 0 2NUST Nursing (BSN-St.Thomas University) 51.3801 6 0 0 0 6TOTAL 234 80 3 41 358
ROSENSTIEL SCHOOL
AMP Applied Marine Physics 40.0899 0 1 1 0 2MAC Marine and Atmospheric Chemistry 40.0599 0 0 3 0 3MAF Marine Affairs and Policy 03.0205 0 14 0 0 14MBF Marine Biology and Fisheries 26.1302 0 12 7 0 19MGG Marine Geology and Geophysics 40.0699 0 0 4 0 4MPO Meteorology & Physical Oceanography 40.0607 0 1 7 0 8RSMA Marine Affairs 03.0201 20 0 0 0 20RSMB Marine Science-Biology 26.1302 44 0 0 0 44RSMC Marine Science-Chemistry 40.0607 2 0 0 0 2RSMG Marine Science-Geological Science 40.0699 4 0 0 0 4RSMM Meteorology 40.0404 3 0 0 0 3RSMT Meteorology/Mathematics 40.0401 5 0 0 0 5TOTAL 78 28 22 0 128
TOTAL UNIVERSITY 2,451 912 163 711 4,237
Source: U.S. Department of Education report of degrees granted.
Fact Book 118 Fall 2013

Preferred College/School/Division Headcounts
Architecture 2,943Arts and Sciences 42,739Business Administration 38,685Communication 9,339Continuing Studies 475Education & Human Development 15,639Engineering 9,784Graduate School 730International Studies 426Law 19,522Medicine 7,387Phillip and Patricia Frost School of Music 6,000Nursing & Health Studies 5,156Rosenstiel School of Marine & Atmospheric Science 1,436No Preference 3,643TOTAL 163,904
Note: Numbers do not include deceased.
Source: Raiser's Edge BI Report All Alumni as of September 28, 2013
Alumni Participation Rate FY2009 FY2010 FY2011 FY2012 FY2013
Overall Alumni Participation Rate 17% 17% 17% 16% 15%Undergraduate Alumni Participation Rate 18% 18% 17% 16% 15%
Source: Alumni Relations
NUMBER OF ALUMNI
ALUMNI GIVING
ALUMNIFall Semester, 2013
Fact Book 119 Fall 2013
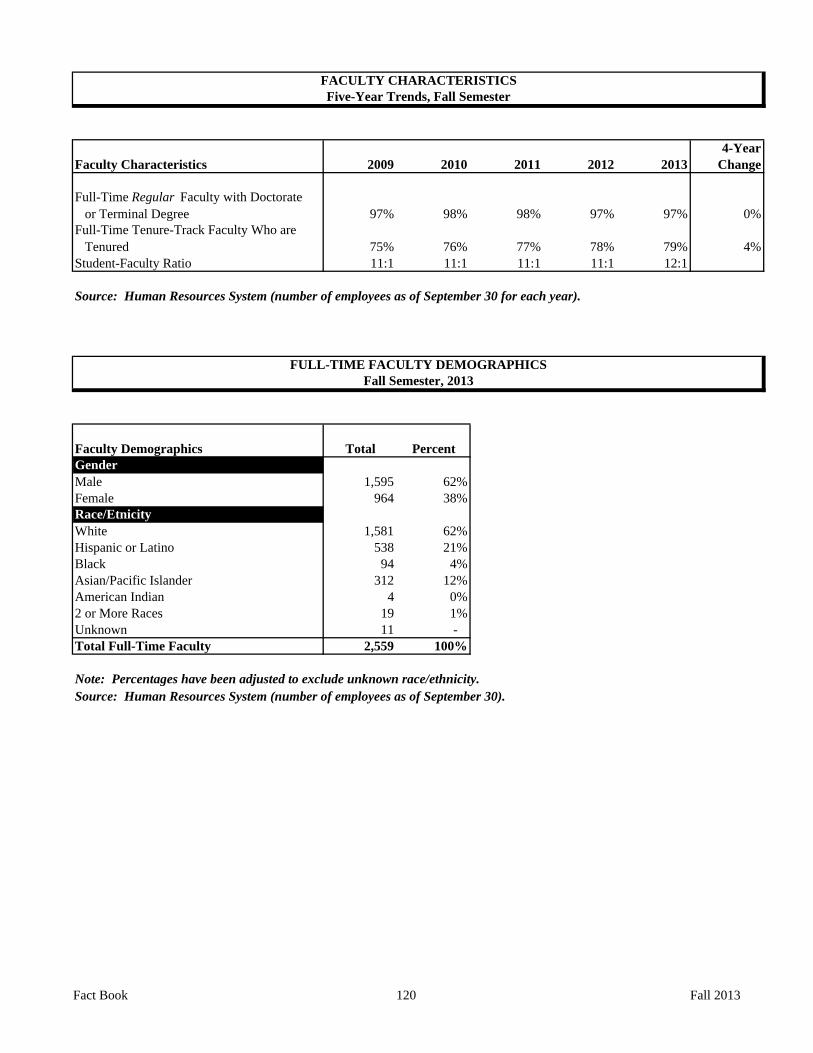
4-YearFaculty Characteristics 2009 2010 2011 2012 2013 Change
Full-Time Regular Faculty with Doctorate or Terminal Degree 97% 98% 98% 97% 97% 0%Full-Time Tenure-Track Faculty Who are Tenured 75% 76% 77% 78% 79% 4%Student-Faculty Ratio 11:1 11:1 11:1 11:1 12:1
Source: Human Resources System (number of employees as of September 30 for each year).
Faculty Demographics Total PercentGenderMale 1,595 62%Female 964 38%Race/EtnicityWhite 1,581 62%Hispanic or Latino 538 21% Black 94 4%Asian/Pacific Islander 312 12%American Indian 4 0%2 or More Races 19 1%Unknown 11 - Total Full-Time Faculty 2,559 100%
Note: Percentages have been adjusted to exclude unknown race/ethnicity.Source: Human Resources System (number of employees as of September 30).
FACULTY CHARACTERISTICSFive-Year Trends, Fall Semester
FULL-TIME FACULTY DEMOGRAPHICSFall Semester, 2013
Fact Book 120 Fall 2013
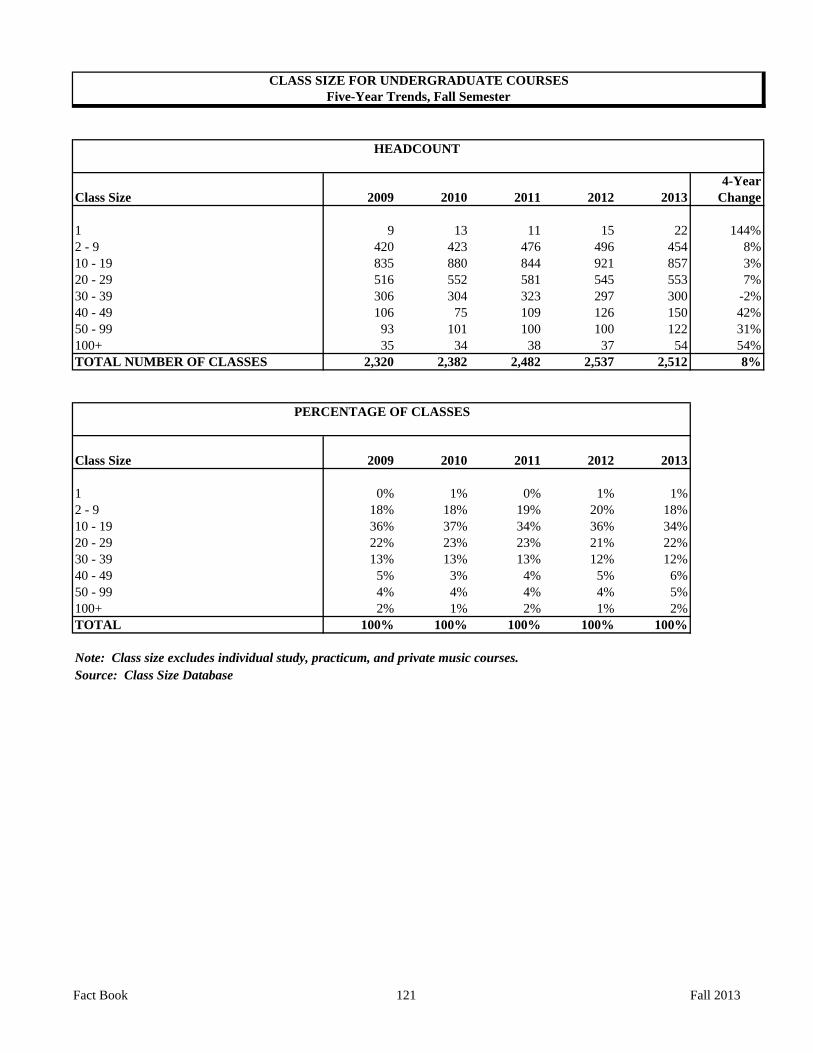
4-YearClass Size 2009 2010 2011 2012 2013 Change
1 9 13 11 15 22 144%2 - 9 420 423 476 496 454 8%10 - 19 835 880 844 921 857 3%20 - 29 516 552 581 545 553 7%30 - 39 306 304 323 297 300 -2%40 - 49 106 75 109 126 150 42%50 - 99 93 101 100 100 122 31%100+ 35 34 38 37 54 54%TOTAL NUMBER OF CLASSES 2,320 2,382 2,482 2,537 2,512 8%
Class Size 2009 2010 2011 2012 2013
1 0% 1% 0% 1% 1%2 - 9 18% 18% 19% 20% 18%10 - 19 36% 37% 34% 36% 34%20 - 29 22% 23% 23% 21% 22%30 - 39 13% 13% 13% 12% 12%40 - 49 5% 3% 4% 5% 6%50 - 99 4% 4% 4% 4% 5%100+ 2% 1% 2% 1% 2%TOTAL 100% 100% 100% 100% 100%
Note: Class size excludes individual study, practicum, and private music courses.Source: Class Size Database
CLASS SIZE FOR UNDERGRADUATE COURSESFive-Year Trends, Fall Semester
HEADCOUNT
PERCENTAGE OF CLASSES
Fact Book 121 Fall 2013
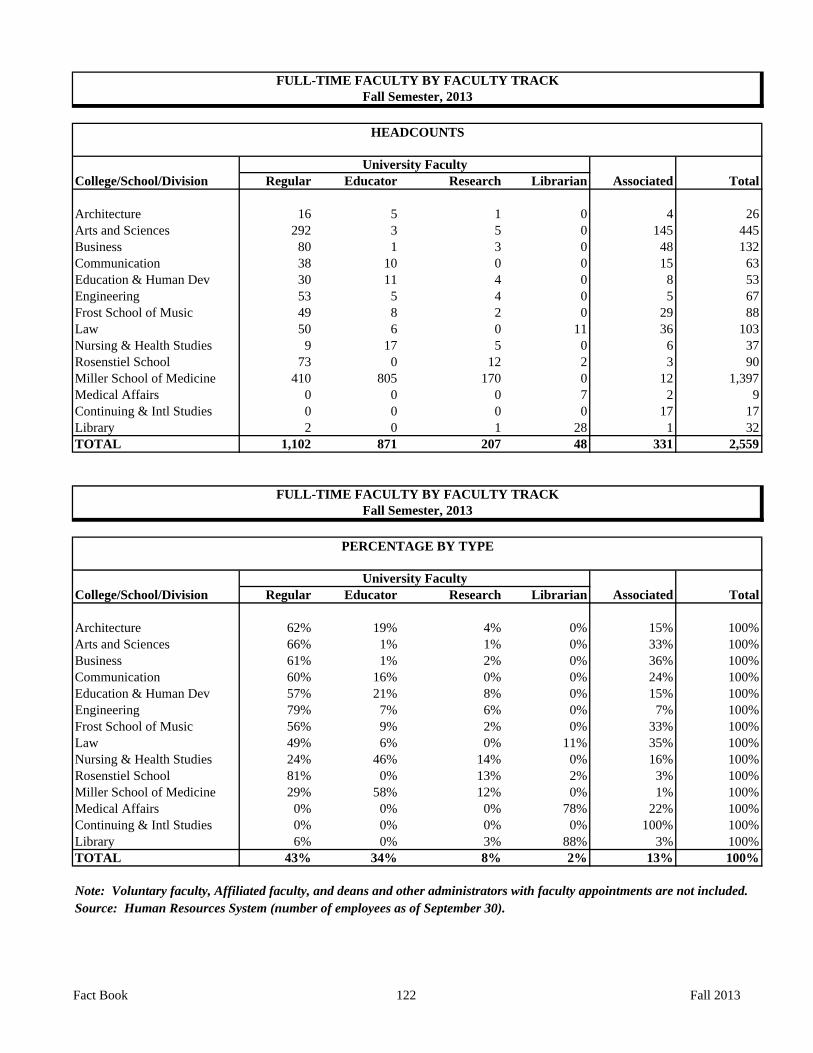
University FacultyCollege/School/Division Regular Educator Research Librarian Associated Total
Architecture 16 5 1 0 4 26Arts and Sciences 292 3 5 0 145 445Business 80 1 3 0 48 132Communication 38 10 0 0 15 63Education & Human Dev 30 11 4 0 8 53Engineering 53 5 4 0 5 67Frost School of Music 49 8 2 0 29 88Law 50 6 0 11 36 103Nursing & Health Studies 9 17 5 0 6 37Rosenstiel School 73 0 12 2 3 90Miller School of Medicine 410 805 170 0 12 1,397Medical Affairs 0 0 0 7 2 9Continuing & Intl Studies 0 0 0 0 17 17Library 2 0 1 28 1 32TOTAL 1,102 871 207 48 331 2,559
University FacultyCollege/School/Division Regular Educator Research Librarian Associated Total
Architecture 62% 19% 4% 0% 15% 100%Arts and Sciences 66% 1% 1% 0% 33% 100%Business 61% 1% 2% 0% 36% 100%Communication 60% 16% 0% 0% 24% 100%Education & Human Dev 57% 21% 8% 0% 15% 100%Engineering 79% 7% 6% 0% 7% 100%Frost School of Music 56% 9% 2% 0% 33% 100%Law 49% 6% 0% 11% 35% 100%Nursing & Health Studies 24% 46% 14% 0% 16% 100%Rosenstiel School 81% 0% 13% 2% 3% 100%Miller School of Medicine 29% 58% 12% 0% 1% 100%Medical Affairs 0% 0% 0% 78% 22% 100%Continuing & Intl Studies 0% 0% 0% 0% 100% 100%Library 6% 0% 3% 88% 3% 100%TOTAL 43% 34% 8% 2% 13% 100%
Note: Voluntary faculty, Affiliated faculty, and deans and other administrators with faculty appointments are not included.Source: Human Resources System (number of employees as of September 30).
FULL-TIME FACULTY BY FACULTY TRACKFall Semester, 2013
HEADCOUNTS
FULL-TIME FACULTY BY FACULTY TRACKFall Semester, 2013
PERCENTAGE BY TYPE
Fact Book 122 Fall 2013
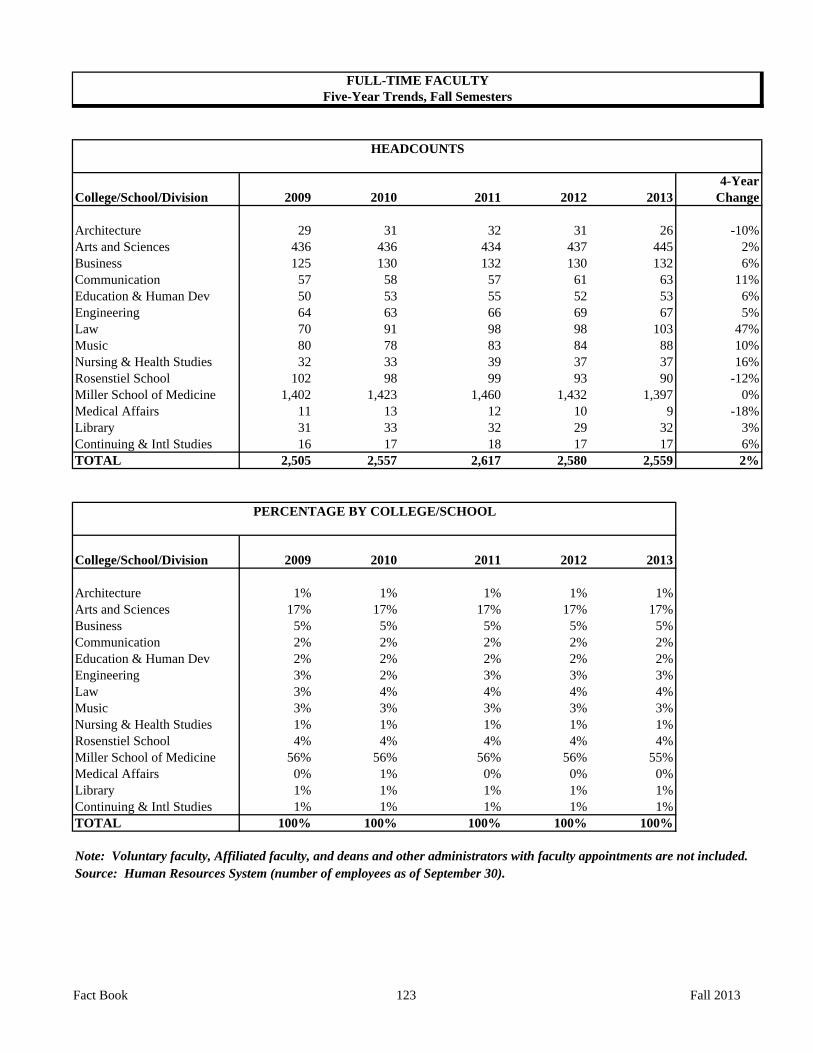
4-YearCollege/School/Division 2009 2010 2011 2012 2013 Change
Architecture 29 31 32 31 26 -10%Arts and Sciences 436 436 434 437 445 2%Business 125 130 132 130 132 6%Communication 57 58 57 61 63 11%Education & Human Dev 50 53 55 52 53 6%Engineering 64 63 66 69 67 5%Law 70 91 98 98 103 47%Music 80 78 83 84 88 10%Nursing & Health Studies 32 33 39 37 37 16%Rosenstiel School 102 98 99 93 90 -12%Miller School of Medicine 1,402 1,423 1,460 1,432 1,397 0%Medical Affairs 11 13 12 10 9 -18%Library 31 33 32 29 32 3%Continuing & Intl Studies 16 17 18 17 17 6%TOTAL 2,505 2,557 2,617 2,580 2,559 2%
College/School/Division 2009 2010 2011 2012 2013
Architecture 1% 1% 1% 1% 1%Arts and Sciences 17% 17% 17% 17% 17%Business 5% 5% 5% 5% 5%Communication 2% 2% 2% 2% 2%Education & Human Dev 2% 2% 2% 2% 2%Engineering 3% 2% 3% 3% 3%Law 3% 4% 4% 4% 4%Music 3% 3% 3% 3% 3%Nursing & Health Studies 1% 1% 1% 1% 1%Rosenstiel School 4% 4% 4% 4% 4%Miller School of Medicine 56% 56% 56% 56% 55%Medical Affairs 0% 1% 0% 0% 0%Library 1% 1% 1% 1% 1%Continuing & Intl Studies 1% 1% 1% 1% 1%TOTAL 100% 100% 100% 100% 100%
Note: Voluntary faculty, Affiliated faculty, and deans and other administrators with faculty appointments are not included.Source: Human Resources System (number of employees as of September 30).
HEADCOUNTS
PERCENTAGE BY COLLEGE/SCHOOL
FULL-TIME FACULTYFive-Year Trends, Fall Semesters
Fact Book 123 Fall 2013

4-YearCollege/School/Division 2009 2010 2011 2012 2013 Change
Architecture 27 37 35 35 37 37%Arts and Sciences 62 66 75 82 69 11%Business 20 22 25 22 22 10%Communication 20 28 23 21 27 35%Education & Human Dev 32 39 39 34 34 6%Engineering 14 15 19 15 16 14%Law 112 57 78 77 77 -31%Music 37 45 41 34 27 -27%Nursing & Health Studies 10 18 13 26 31 210%Rosenstiel School 7 7 8 15 9 29%Miller School of Medicine 48 51 53 51 54 13%Library 0 0 0 0 0 naUndergraduate Affairs 20 21 0 0 0 -100%Continuing & Intl Studies 37 64 41 37 52 41%President/Provost 0 0 17 0 0 naUniversity Advancement 0 0 0 0 0 naTOTAL 446 470 467 449 455 2%
College/School/Division 2009 2010 2011 2012 2013
Architecture 6% 8% 7% 8% 8%Arts and Sciences 14% 14% 16% 18% 15%Business 4% 5% 5% 5% 5%Communication 4% 6% 5% 5% 6%Education & Human Dev 7% 8% 8% 8% 7%Engineering 3% 3% 4% 3% 4%Law 25% 12% 17% 17% 17%Music 8% 10% 9% 8% 6%Nursing & Health Studies 2% 4% 3% 6% 7%Miller School of Medicine 2% 1% 2% 3% 2%Miller School of Medicine 11% 11% 11% 11% 12%Library 0% 0% 0% 0% 0%Undergraduate Affairs 4% 4% 0% 0% 0%Continuing & Intl Studies 8% 14% 9% 8% 11%President/Provost 0% 0% 4% 0% 0%University Advancement 0% 0% 0% 0% 0%TOTAL 100% 100% 100% 100% 100%
Source: Human Resources System (number of employees as of September 30 for each year).
HEADCOUNTS
PART-TIME FACULTYFive-Year Trends, Fall Semesters
Note: Full-time faculty who have teaching overloads in different departments and administrators who teach are counted as part-time in those departments in addition to their full-time assignment.
PERCENTAGE BY COLLEGE/SCHOOL
Fact Book 124 Fall 2013
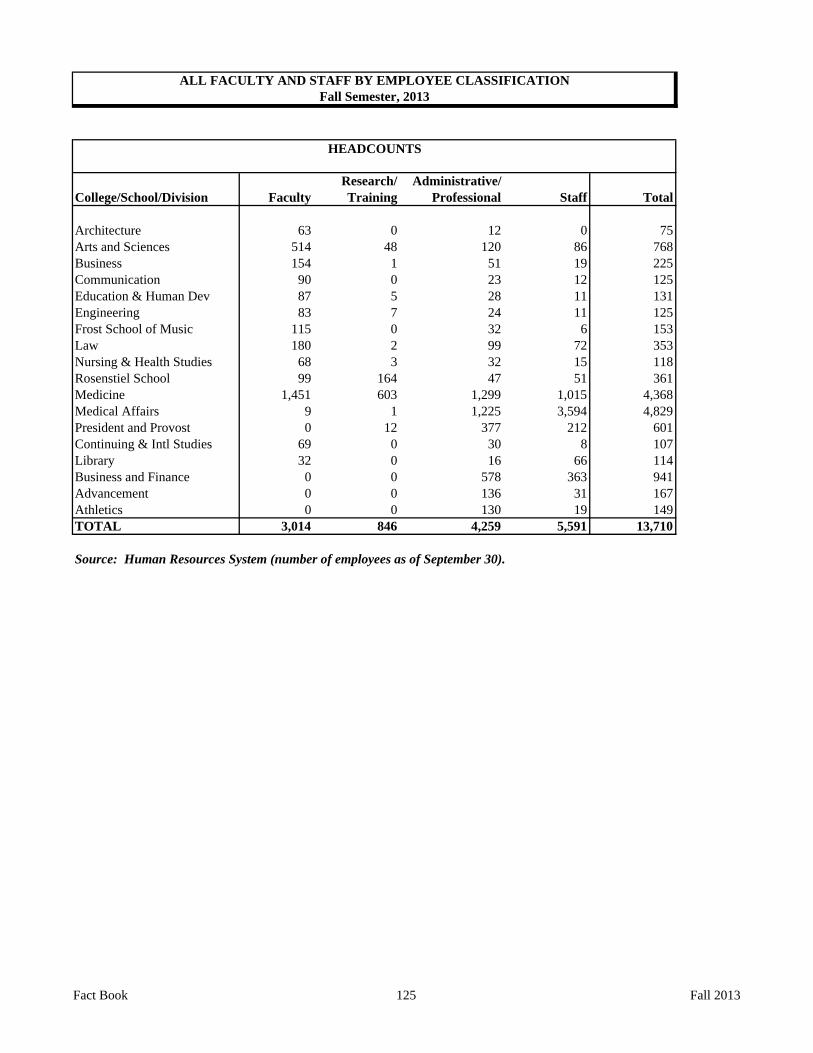
Research/ Administrative/College/School/Division Faculty Training Professional Staff Total
Architecture 63 0 12 0 75Arts and Sciences 514 48 120 86 768Business 154 1 51 19 225Communication 90 0 23 12 125Education & Human Dev 87 5 28 11 131Engineering 83 7 24 11 125Frost School of Music 115 0 32 6 153Law 180 2 99 72 353Nursing & Health Studies 68 3 32 15 118Rosenstiel School 99 164 47 51 361Medicine 1,451 603 1,299 1,015 4,368Medical Affairs 9 1 1,225 3,594 4,829President and Provost 0 12 377 212 601Continuing & Intl Studies 69 0 30 8 107Library 32 0 16 66 114Business and Finance 0 0 578 363 941Advancement 0 0 136 31 167Athletics 0 0 130 19 149TOTAL 3,014 846 4,259 5,591 13,710
Source: Human Resources System (number of employees as of September 30).
Fall Semester, 2013
HEADCOUNTS
ALL FACULTY AND STAFF BY EMPLOYEE CLASSIFICATION
Fact Book 125 Fall 2013

Research/ Administrative/College/School/Division Faculty Training Professional Staff Total
Architecture 26 0 11 0 37Arts and Sciences 445 43 117 63 668Business 132 1 50 19 202Communication 63 0 22 12 97Education & Human Dev 53 4 28 10 95Engineering 67 5 24 11 107Frost School of Music 88 0 23 6 117Law 103 2 96 70 271Nursing & Health Studies 37 1 31 13 82Rosenstiel School 90 154 47 49 340Medicine 1,397 583 1,271 968 4,219Medical Affairs 9 1 1,221 3,512 4,743President and Provost 0 12 370 202 584Continuing & Intl Studies 17 0 29 8 54Library 32 0 16 63 111Business and Finance 0 0 574 359 933Advancement 0 0 136 30 166Athletics 0 0 127 16 143TOTAL 2,559 806 4,193 5,411 12,969
Source: Human Resources System (number of employees as of September 30).
FULL-TIME FACULTY AND STAFF BY EMPLOYEE CLASSIFICATIONFall Semester, 2013
HEADCOUNTS
Fact Book 126 Fall 2013

Research/ Administrative/College/School/Division Faculty Training Professional Staff Total
Architecture 37 0 1 0 38Arts and Sciences 69 5 3 23 100Business 22 0 1 0 23Communication 27 0 1 0 28Education & Human Dev 34 1 0 1 36Engineering 16 2 0 0 18Frost School of Music 27 0 9 0 36Law 77 0 3 2 82Nursing & Health Studies 31 2 1 2 36Rosenstiel School 9 10 0 2 21Medicine 54 20 28 47 149Medical Affairs 0 0 4 82 86President and Provost 0 0 7 10 17Continuing & Intl Studies 52 0 1 0 53Library 0 0 0 3 3Business and Finance 0 0 4 4 8Advancement 0 0 0 1 1Athletics 0 0 3 3 6TOTAL 455 40 66 180 741
Source: Human Resources System (number of employees as of September 30).
Note: Full-time faculty who have teaching overloads in different departments and administrators who teach are counted as part-time in those departments in addition to their full-time assignment.
PART-TIME FACULTY AND STAFF BY EMPLOYEE CLASSIFICATIONFall Semester, 2013
HEADCOUNTS
Fact Book 127 Fall 2013

Research/ Administrative/College/School/Division Faculty Training Professional Staff Total
Architecture 41.3 0.0 11.8 0.0 53.1Arts and Sciences 470.4 45.2 118.6 76.4 710.5Business 141.2 1.0 50.5 19.0 211.7Communication 72.3 0.0 22.5 12.0 106.8Education & Human Dev 63.5 4.8 28.0 10.4 106.7Engineering 71.6 6.0 24.0 11.0 112.6Frost School of Music 96.2 0.0 26.6 6.0 128.8Law 120.4 2.0 97.8 71.5 291.6Nursing & Health Studies 46.2 2.0 31.5 13.8 93.5Rosenstiel School 94.9 159.0 47.0 49.8 350.7Medicine 1,429.0 596.2 1,288.9 996.7 4,310.8Medical Affairs 9.0 1.0 1,223.6 3,531.7 4,765.3President and Provost 0.0 12.0 375.0 207.2 594.2Continuing & Intl Studies 35.3 0.0 29.7 8.0 73.0Library 32.0 0.0 16.0 64.6 112.6Business and Finance 0.0 0.0 577.0 361.6 938.6Advancement 0.0 0.0 136.0 30.6 166.6Athletics 0.0 0.0 127.7 17.6 145.3TOTAL 2,723.2 829.2 4,232.0 5,488.0 13,272.4
Source: Human Resources System (number of employees as of September 30).
FULL-TIME EQUIVALENCE OF FACULTY AND STAFF BY EMPLOYEE CLASSIFICATIONFall Semester, 2013
FTE
Fact Book 128 Fall 2013
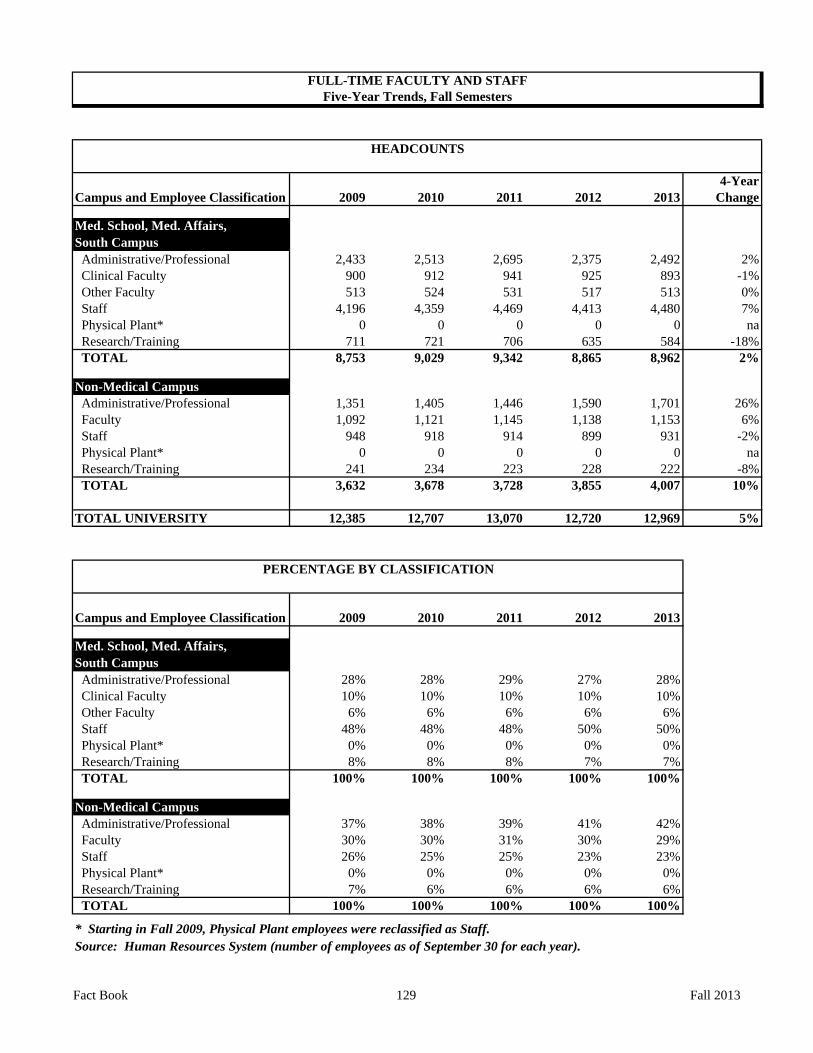
4-YearCampus and Employee Classification 2009 2010 2011 2012 2013 Change
Med. School, Med. Affairs, South Campus Administrative/Professional 2,433 2,513 2,695 2,375 2,492 2% Clinical Faculty 900 912 941 925 893 -1% Other Faculty 513 524 531 517 513 0% Staff 4,196 4,359 4,469 4,413 4,480 7% Physical Plant* 0 0 0 0 0 na Research/Training 711 721 706 635 584 -18% TOTAL 8,753 9,029 9,342 8,865 8,962 2%
Non-Medical Campus Administrative/Professional 1,351 1,405 1,446 1,590 1,701 26% Faculty 1,092 1,121 1,145 1,138 1,153 6% Staff 948 918 914 899 931 -2% Physical Plant* 0 0 0 0 0 na Research/Training 241 234 223 228 222 -8% TOTAL 3,632 3,678 3,728 3,855 4,007 10%
TOTAL UNIVERSITY 12,385 12,707 13,070 12,720 12,969 5%
Campus and Employee Classification 2009 2010 2011 2012 2013
Med. School, Med. Affairs, South Campus Administrative/Professional 28% 28% 29% 27% 28% Clinical Faculty 10% 10% 10% 10% 10% Other Faculty 6% 6% 6% 6% 6% Staff 48% 48% 48% 50% 50% Physical Plant* 0% 0% 0% 0% 0% Research/Training 8% 8% 8% 7% 7% TOTAL 100% 100% 100% 100% 100%
Non-Medical Campus Administrative/Professional 37% 38% 39% 41% 42% Faculty 30% 30% 31% 30% 29% Staff 26% 25% 25% 23% 23% Physical Plant* 0% 0% 0% 0% 0% Research/Training 7% 6% 6% 6% 6% TOTAL 100% 100% 100% 100% 100%
* Starting in Fall 2009, Physical Plant employees were reclassified as Staff.Source: Human Resources System (number of employees as of September 30 for each year).
FULL-TIME FACULTY AND STAFFFive-Year Trends, Fall Semesters
HEADCOUNTS
PERCENTAGE BY CLASSIFICATION
Fact Book 129 Fall 2013
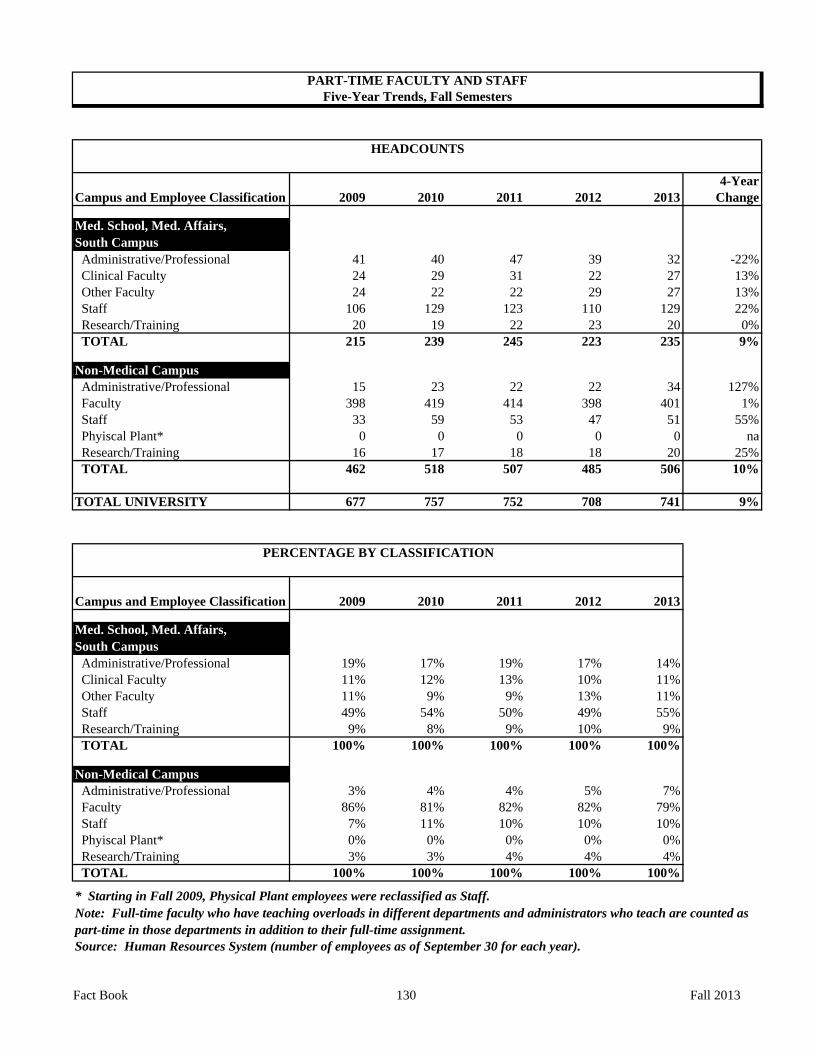
4-YearCampus and Employee Classification 2009 2010 2011 2012 2013 Change
Med. School, Med. Affairs, South Campus Administrative/Professional 41 40 47 39 32 -22% Clinical Faculty 24 29 31 22 27 13% Other Faculty 24 22 22 29 27 13% Staff 106 129 123 110 129 22% Research/Training 20 19 22 23 20 0% TOTAL 215 239 245 223 235 9%
Non-Medical Campus Administrative/Professional 15 23 22 22 34 127% Faculty 398 419 414 398 401 1% Staff 33 59 53 47 51 55% Phyiscal Plant* 0 0 0 0 0 na Research/Training 16 17 18 18 20 25% TOTAL 462 518 507 485 506 10%
TOTAL UNIVERSITY 677 757 752 708 741 9%
Campus and Employee Classification 2009 2010 2011 2012 2013
Med. School, Med. Affairs, South Campus Administrative/Professional 19% 17% 19% 17% 14% Clinical Faculty 11% 12% 13% 10% 11% Other Faculty 11% 9% 9% 13% 11% Staff 49% 54% 50% 49% 55% Research/Training 9% 8% 9% 10% 9% TOTAL 100% 100% 100% 100% 100%
Non-Medical Campus Administrative/Professional 3% 4% 4% 5% 7% Faculty 86% 81% 82% 82% 79% Staff 7% 11% 10% 10% 10% Phyiscal Plant* 0% 0% 0% 0% 0% Research/Training 3% 3% 4% 4% 4% TOTAL 100% 100% 100% 100% 100%
* Starting in Fall 2009, Physical Plant employees were reclassified as Staff.
Source: Human Resources System (number of employees as of September 30 for each year).
PART-TIME FACULTY AND STAFFFive-Year Trends, Fall Semesters
HEADCOUNTS
PERCENTAGE BY CLASSIFICATION
Note: Full-time faculty who have teaching overloads in different departments and administrators who teach are counted as part-time in those departments in addition to their full-time assignment.
Fact Book 130 Fall 2013
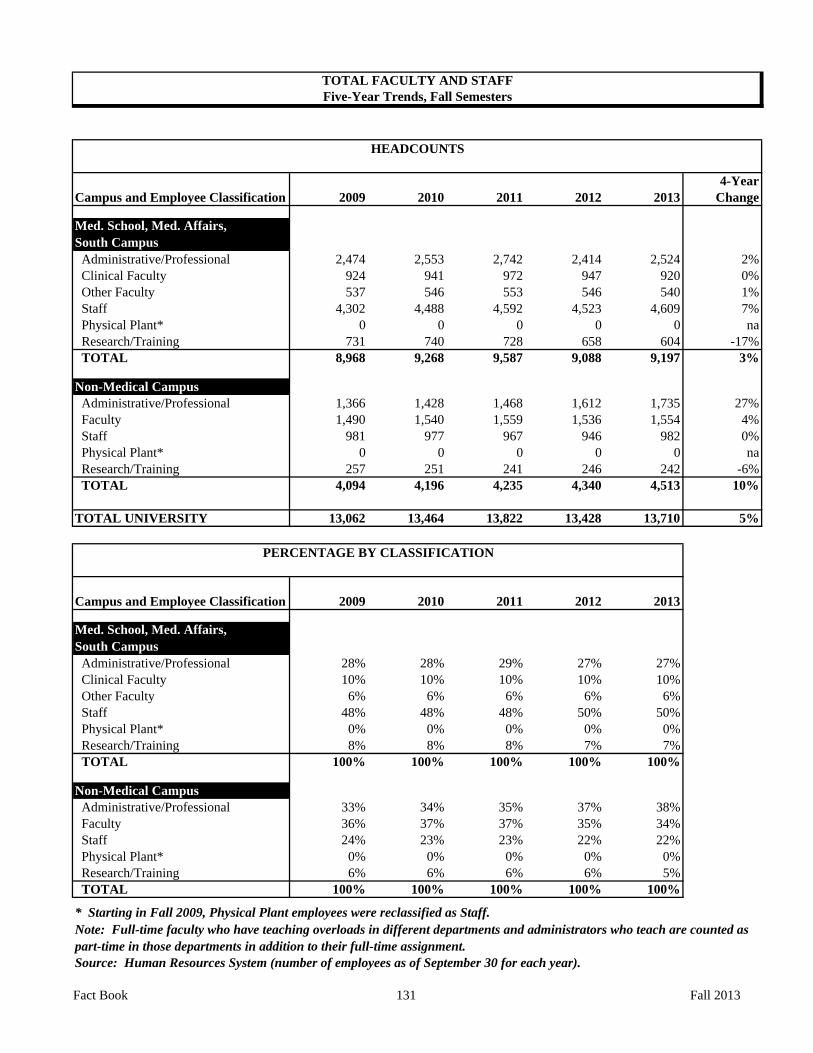
4-YearCampus and Employee Classification 2009 2010 2011 2012 2013 Change Med. School, Med. Affairs, South Campus Administrative/Professional 2,474 2,553 2,742 2,414 2,524 2% Clinical Faculty 924 941 972 947 920 0% Other Faculty 537 546 553 546 540 1% Staff 4,302 4,488 4,592 4,523 4,609 7% Physical Plant* 0 0 0 0 0 na Research/Training 731 740 728 658 604 -17% TOTAL 8,968 9,268 9,587 9,088 9,197 3% Non-Medical Campus Administrative/Professional 1,366 1,428 1,468 1,612 1,735 27% Faculty 1,490 1,540 1,559 1,536 1,554 4% Staff 981 977 967 946 982 0% Physical Plant* 0 0 0 0 0 na Research/Training 257 251 241 246 242 -6% TOTAL 4,094 4,196 4,235 4,340 4,513 10%
TOTAL UNIVERSITY 13,062 13,464 13,822 13,428 13,710 5%
Campus and Employee Classification 2009 2010 2011 2012 2013
Med. School, Med. Affairs, South Campus Administrative/Professional 28% 28% 29% 27% 27% Clinical Faculty 10% 10% 10% 10% 10% Other Faculty 6% 6% 6% 6% 6% Staff 48% 48% 48% 50% 50% Physical Plant* 0% 0% 0% 0% 0% Research/Training 8% 8% 8% 7% 7% TOTAL 100% 100% 100% 100% 100%
Non-Medical Campus Administrative/Professional 33% 34% 35% 37% 38% Faculty 36% 37% 37% 35% 34% Staff 24% 23% 23% 22% 22% Physical Plant* 0% 0% 0% 0% 0% Research/Training 6% 6% 6% 6% 5% TOTAL 100% 100% 100% 100% 100%
* Starting in Fall 2009, Physical Plant employees were reclassified as Staff.
Source: Human Resources System (number of employees as of September 30 for each year).
Note: Full-time faculty who have teaching overloads in different departments and administrators who teach are counted as part-time in those departments in addition to their full-time assignment.
TOTAL FACULTY AND STAFFFive-Year Trends, Fall Semesters
HEADCOUNTS
PERCENTAGE BY CLASSIFICATION
Fact Book 131 Fall 2013
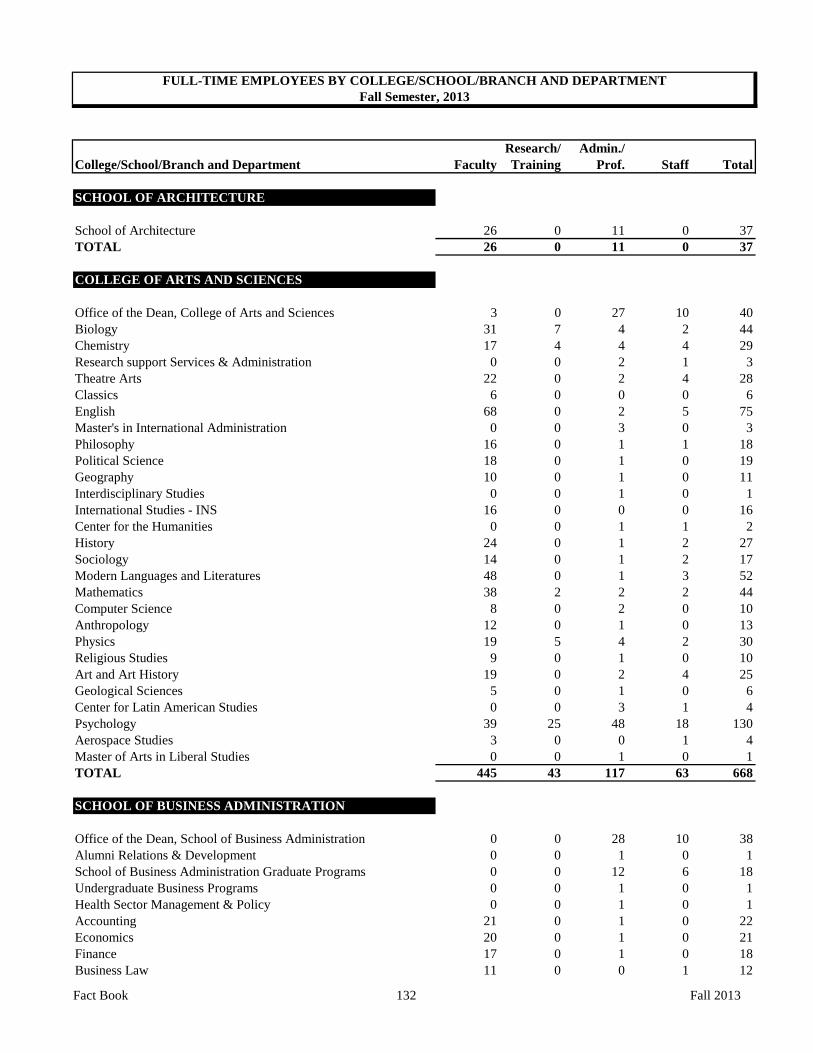
Research/ Admin./College/School/Branch and Department Faculty Training Prof. Staff Total
SCHOOL OF ARCHITECTURE
School of Architecture 26 0 11 0 37TOTAL 26 0 11 0 37
COLLEGE OF ARTS AND SCIENCES
Office of the Dean, College of Arts and Sciences 3 0 27 10 40Biology 31 7 4 2 44Chemistry 17 4 4 4 29Research support Services & Administration 0 0 2 1 3Theatre Arts 22 0 2 4 28Classics 6 0 0 0 6English 68 0 2 5 75Master's in International Administration 0 0 3 0 3Philosophy 16 0 1 1 18Political Science 18 0 1 0 19Geography 10 0 1 0 11Interdisciplinary Studies 0 0 1 0 1International Studies - INS 16 0 0 0 16Center for the Humanities 0 0 1 1 2History 24 0 1 2 27Sociology 14 0 1 2 17Modern Languages and Literatures 48 0 1 3 52Mathematics 38 2 2 2 44Computer Science 8 0 2 0 10Anthropology 12 0 1 0 13Physics 19 5 4 2 30Religious Studies 9 0 1 0 10Art and Art History 19 0 2 4 25Geological Sciences 5 0 1 0 6Center for Latin American Studies 0 0 3 1 4Psychology 39 25 48 18 130Aerospace Studies 3 0 0 1 4Master of Arts in Liberal Studies 0 0 1 0 1TOTAL 445 43 117 63 668
SCHOOL OF BUSINESS ADMINISTRATION
Office of the Dean, School of Business Administration 0 0 28 10 38Alumni Relations & Development 0 0 1 0 1School of Business Administration Graduate Programs 0 0 12 6 18Undergraduate Business Programs 0 0 1 0 1Health Sector Management & Policy 0 0 1 0 1Accounting 21 0 1 0 22Economics 20 0 1 0 21Finance 17 0 1 0 18Business Law 11 0 0 1 12
FULL-TIME EMPLOYEES BY COLLEGE/SCHOOL/BRANCH AND DEPARTMENTFall Semester, 2013
Fact Book 132 Fall 2013
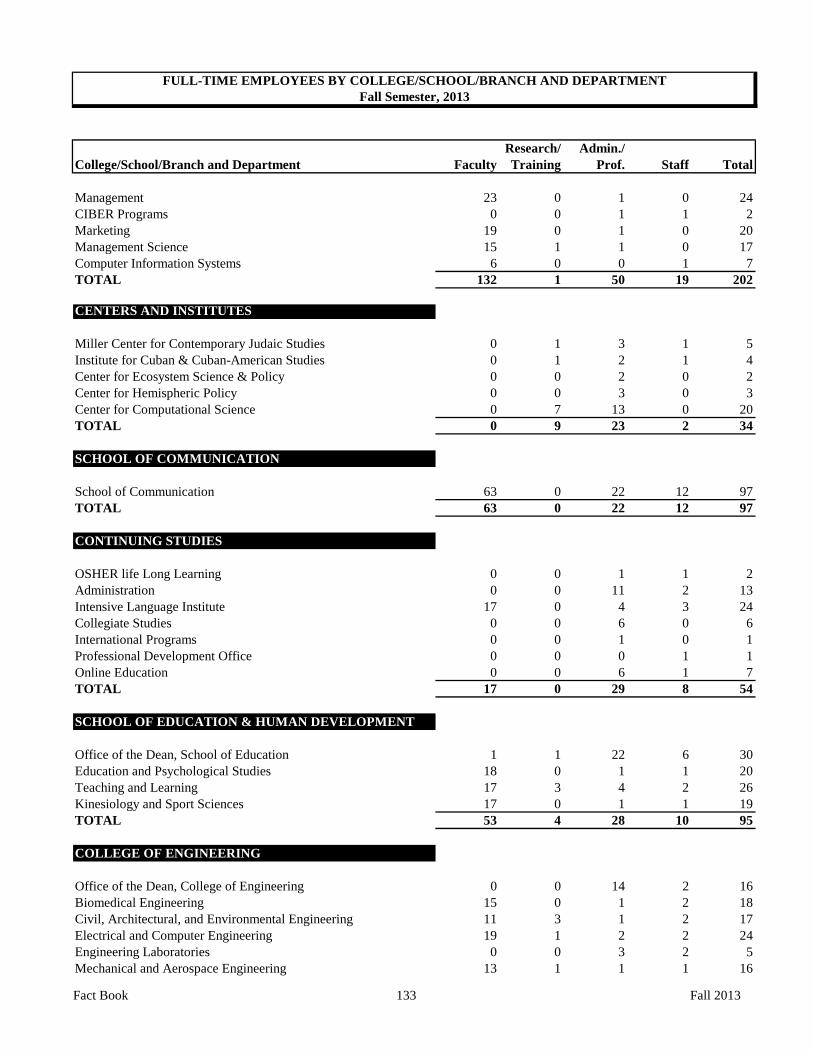
Research/ Admin./College/School/Branch and Department Faculty Training Prof. Staff Total
FULL-TIME EMPLOYEES BY COLLEGE/SCHOOL/BRANCH AND DEPARTMENTFall Semester, 2013
Management 23 0 1 0 24CIBER Programs 0 0 1 1 2Marketing 19 0 1 0 20Management Science 15 1 1 0 17Computer Information Systems 6 0 0 1 7TOTAL 132 1 50 19 202
CENTERS AND INSTITUTES
Miller Center for Contemporary Judaic Studies 0 1 3 1 5Institute for Cuban & Cuban-American Studies 0 1 2 1 4Center for Ecosystem Science & Policy 0 0 2 0 2Center for Hemispheric Policy 0 0 3 0 3Center for Computational Science 0 7 13 0 20TOTAL 0 9 23 2 34
SCHOOL OF COMMUNICATION
School of Communication 63 0 22 12 97TOTAL 63 0 22 12 97
CONTINUING STUDIES
OSHER life Long Learning 0 0 1 1 2Administration 0 0 11 2 13Intensive Language Institute 17 0 4 3 24Collegiate Studies 0 0 6 0 6International Programs 0 0 1 0 1Professional Development Office 0 0 0 1 1Online Education 0 0 6 1 7TOTAL 17 0 29 8 54
SCHOOL OF EDUCATION & HUMAN DEVELOPMENT
Office of the Dean, School of Education 1 1 22 6 30Education and Psychological Studies 18 0 1 1 20Teaching and Learning 17 3 4 2 26Kinesiology and Sport Sciences 17 0 1 1 19TOTAL 53 4 28 10 95
COLLEGE OF ENGINEERING
Office of the Dean, College of Engineering 0 0 14 2 16Biomedical Engineering 15 0 1 2 18Civil, Architectural, and Environmental Engineering 11 3 1 2 17Electrical and Computer Engineering 19 1 2 2 24Engineering Laboratories 0 0 3 2 5Mechanical and Aerospace Engineering 13 1 1 1 16
Fact Book 133 Fall 2013
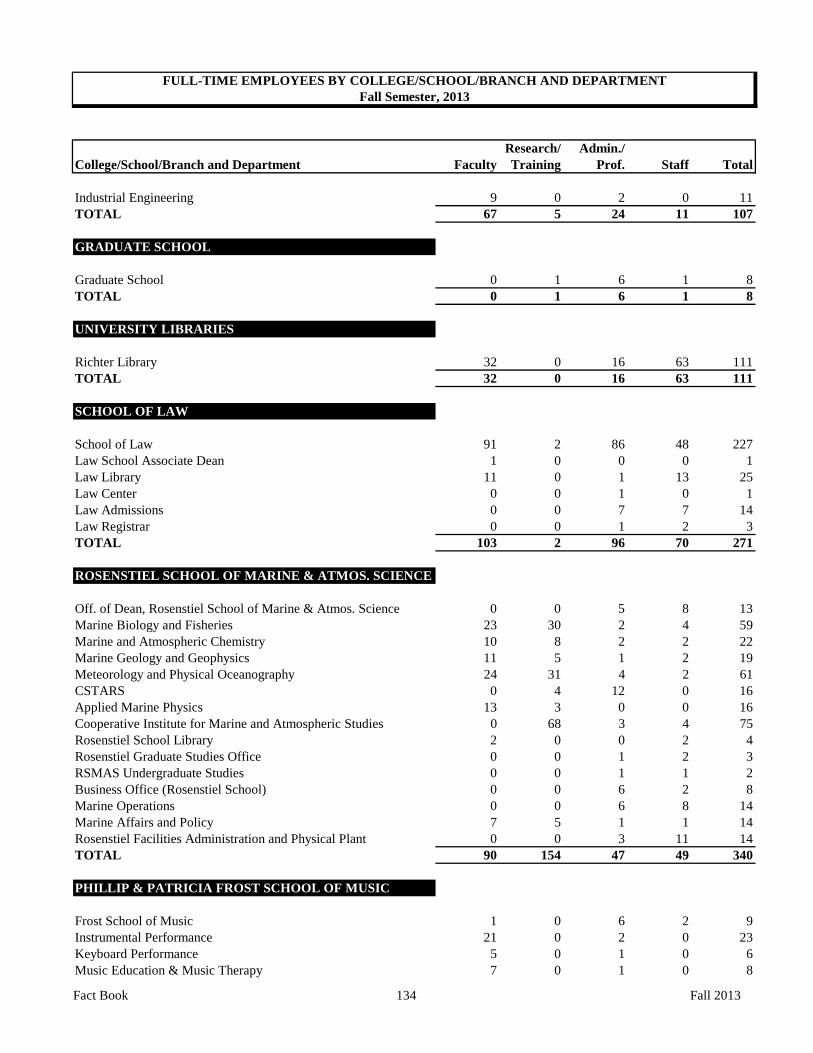
Research/ Admin./College/School/Branch and Department Faculty Training Prof. Staff Total
FULL-TIME EMPLOYEES BY COLLEGE/SCHOOL/BRANCH AND DEPARTMENTFall Semester, 2013
Industrial Engineering 9 0 2 0 11TOTAL 67 5 24 11 107
GRADUATE SCHOOL
Graduate School 0 1 6 1 8TOTAL 0 1 6 1 8
UNIVERSITY LIBRARIES
Richter Library 32 0 16 63 111TOTAL 32 0 16 63 111
SCHOOL OF LAW
School of Law 91 2 86 48 227Law School Associate Dean 1 0 0 0 1Law Library 11 0 1 13 25Law Center 0 0 1 0 1Law Admissions 0 0 7 7 14Law Registrar 0 0 1 2 3TOTAL 103 2 96 70 271
ROSENSTIEL SCHOOL OF MARINE & ATMOS. SCIENCE
Off. of Dean, Rosenstiel School of Marine & Atmos. Science 0 0 5 8 13Marine Biology and Fisheries 23 30 2 4 59Marine and Atmospheric Chemistry 10 8 2 2 22Marine Geology and Geophysics 11 5 1 2 19Meteorology and Physical Oceanography 24 31 4 2 61CSTARS 0 4 12 0 16Applied Marine Physics 13 3 0 0 16Cooperative Institute for Marine and Atmospheric Studies 0 68 3 4 75Rosenstiel School Library 2 0 0 2 4Rosenstiel Graduate Studies Office 0 0 1 2 3RSMAS Undergraduate Studies 0 0 1 1 2Business Office (Rosenstiel School) 0 0 6 2 8Marine Operations 0 0 6 8 14Marine Affairs and Policy 7 5 1 1 14Rosenstiel Facilities Administration and Physical Plant 0 0 3 11 14TOTAL 90 154 47 49 340
PHILLIP & PATRICIA FROST SCHOOL OF MUSIC
Frost School of Music 1 0 6 2 9Instrumental Performance 21 0 2 0 23Keyboard Performance 5 0 1 0 6Music Education & Music Therapy 7 0 1 0 8
Fact Book 134 Fall 2013

Research/ Admin./College/School/Branch and Department Faculty Training Prof. Staff Total
FULL-TIME EMPLOYEES BY COLLEGE/SCHOOL/BRANCH AND DEPARTMENTFall Semester, 2013
Music Media & Industry 10 0 1 0 11Musicology 5 0 0 0 5Studio Music & Jazz 14 0 0 0 14Theory & Composition 9 0 0 0 9Vocal Performance 16 0 1 0 17Admissions 0 0 2 1 3Graduate Studies 0 0 1 0 1Development and Special Events 0 0 3 0 3Concert Hall Operations 0 0 4 3 7Community Outreach and HMI 0 0 1 0 1TOTAL 88 0 23 6 117
SCHOOL OF NURSING & HEALTH STUDIES
School of Nursing & Health Studies 37 1 31 13 82TOTAL 37 1 31 13 82
MEDICAL AFFAIRS
Medical Development 0 0 27 0 27University of Miami Medical Group Administration 0 0 21 0 21Faculty and Professional Affairs 0 0 5 1 6Office of Communications 0 0 6 0 6Medical Human Resources 0 0 43 1 44Medical Wellness and Recreation 0 0 8 4 12Department of Telehealth 0 0 3 0 3Office of Associate Dean for Community Affairs 0 0 9 9 18International Medical Affairs Institute 0 0 11 6 17Medical Research Enterprise Program Support 0 0 56 0 56Clinical Research Center & Regulation Support 0 0 9 1 10School of Medicine Marketing 0 0 5 0 5UM at FAU 0 0 4 14 18Office of Graduate & Postdoctoral Study 0 0 9 0 9Supply Chain 0 0 5 0 5Clinical Information Management Systems 0 0 7 0 7Gorden Center for Research in Medical Education 0 0 10 6 16Research and Innovative Medicine 0 0 9 0 9Business Information Management Systems 0 0 19 0 19Technical Support 0 0 21 0 21Continuing Medical Education 0 0 3 3 6System Training 0 0 9 0 9Corporate Services Administration 0 0 4 0 4Strategic Operations 0 0 38 0 38Clinical Access 0 0 65 348 413UM Innovation & Special Programs 0 0 2 0 2Certified Registered Nurse Anesthetists 0 0 1 33 34Revenue Cycle/Central Business Office 0 0 30 161 191Chief Medical Systems integration Office 0 0 0 1 1
Fact Book 135 Fall 2013
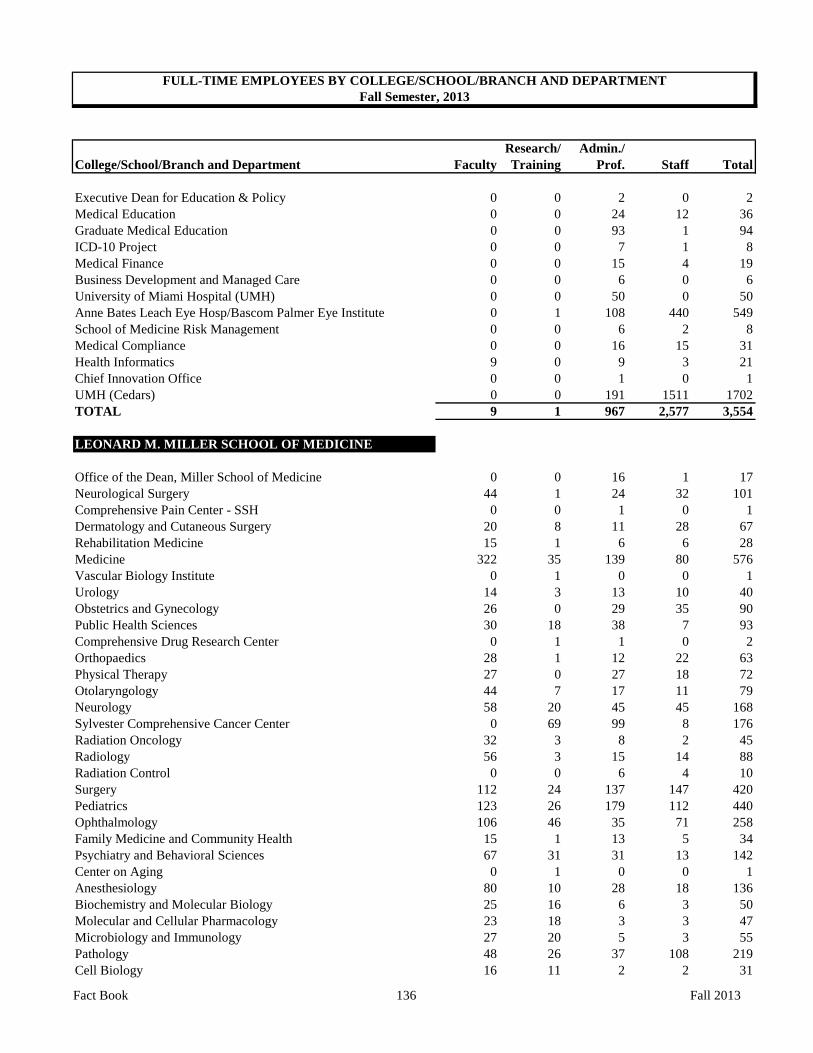
Research/ Admin./College/School/Branch and Department Faculty Training Prof. Staff Total
FULL-TIME EMPLOYEES BY COLLEGE/SCHOOL/BRANCH AND DEPARTMENTFall Semester, 2013
Executive Dean for Education & Policy 0 0 2 0 2Medical Education 0 0 24 12 36Graduate Medical Education 0 0 93 1 94ICD-10 Project 0 0 7 1 8Medical Finance 0 0 15 4 19Business Development and Managed Care 0 0 6 0 6University of Miami Hospital (UMH) 0 0 50 0 50Anne Bates Leach Eye Hosp/Bascom Palmer Eye Institute 0 1 108 440 549School of Medicine Risk Management 0 0 6 2 8Medical Compliance 0 0 16 15 31Health Informatics 9 0 9 3 21Chief Innovation Office 0 0 1 0 1UMH (Cedars) 0 0 191 1511 1702TOTAL 9 1 967 2,577 3,554
LEONARD M. MILLER SCHOOL OF MEDICINE
Office of the Dean, Miller School of Medicine 0 0 16 1 17Neurological Surgery 44 1 24 32 101Comprehensive Pain Center - SSH 0 0 1 0 1Dermatology and Cutaneous Surgery 20 8 11 28 67Rehabilitation Medicine 15 1 6 6 28Medicine 322 35 139 80 576Vascular Biology Institute 0 1 0 0 1Urology 14 3 13 10 40Obstetrics and Gynecology 26 0 29 35 90Public Health Sciences 30 18 38 7 93Comprehensive Drug Research Center 0 1 1 0 2Orthopaedics 28 1 12 22 63Physical Therapy 27 0 27 18 72Otolaryngology 44 7 17 11 79Neurology 58 20 45 45 168Sylvester Comprehensive Cancer Center 0 69 99 8 176Radiation Oncology 32 3 8 2 45Radiology 56 3 15 14 88Radiation Control 0 0 6 4 10Surgery 112 24 137 147 420Pediatrics 123 26 179 112 440Ophthalmology 106 46 35 71 258Family Medicine and Community Health 15 1 13 5 34Psychiatry and Behavioral Sciences 67 31 31 13 142Center on Aging 0 1 0 0 1Anesthesiology 80 10 28 18 136Biochemistry and Molecular Biology 25 16 6 3 50Molecular and Cellular Pharmacology 23 18 3 3 47Microbiology and Immunology 27 20 5 3 55Pathology 48 26 37 108 219Cell Biology 16 11 2 2 31
Fact Book 136 Fall 2013
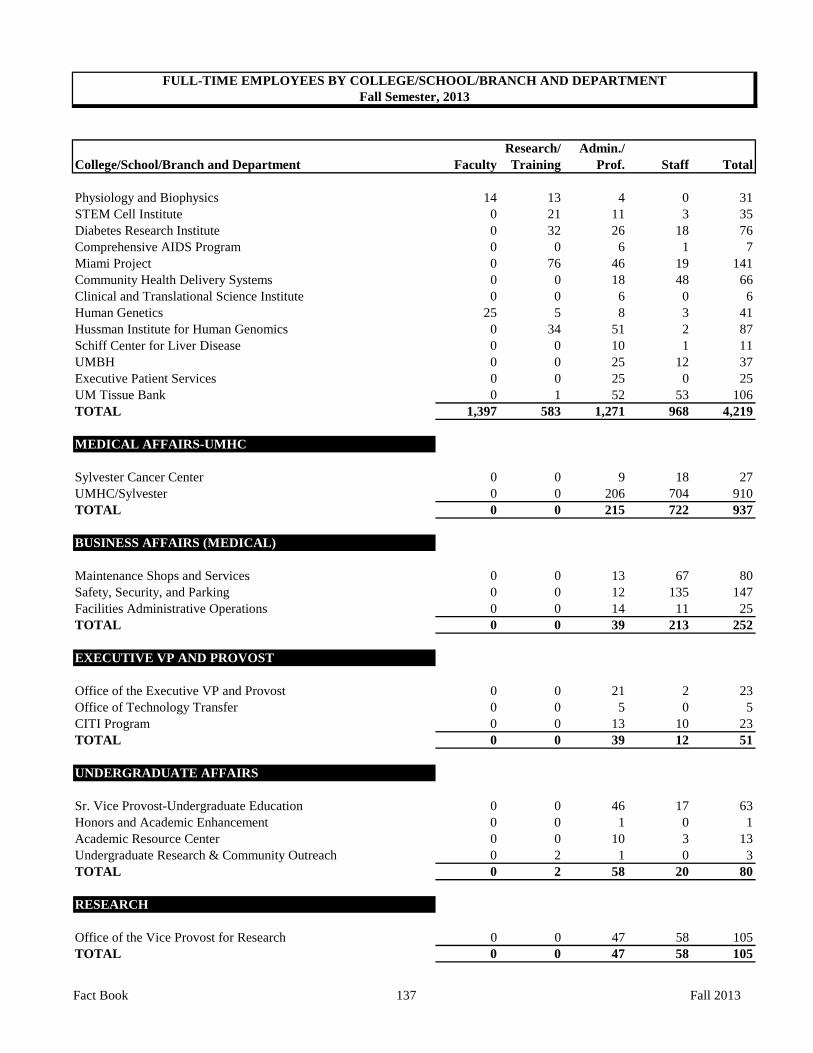
Research/ Admin./College/School/Branch and Department Faculty Training Prof. Staff Total
FULL-TIME EMPLOYEES BY COLLEGE/SCHOOL/BRANCH AND DEPARTMENTFall Semester, 2013
Physiology and Biophysics 14 13 4 0 31STEM Cell Institute 0 21 11 3 35Diabetes Research Institute 0 32 26 18 76Comprehensive AIDS Program 0 0 6 1 7Miami Project 0 76 46 19 141Community Health Delivery Systems 0 0 18 48 66Clinical and Translational Science Institute 0 0 6 0 6Human Genetics 25 5 8 3 41Hussman Institute for Human Genomics 0 34 51 2 87Schiff Center for Liver Disease 0 0 10 1 11UMBH 0 0 25 12 37Executive Patient Services 0 0 25 0 25UM Tissue Bank 0 1 52 53 106TOTAL 1,397 583 1,271 968 4,219
MEDICAL AFFAIRS-UMHC
Sylvester Cancer Center 0 0 9 18 27UMHC/Sylvester 0 0 206 704 910TOTAL 0 0 215 722 937
BUSINESS AFFAIRS (MEDICAL)
Maintenance Shops and Services 0 0 13 67 80Safety, Security, and Parking 0 0 12 135 147Facilities Administrative Operations 0 0 14 11 25TOTAL 0 0 39 213 252
EXECUTIVE VP AND PROVOST
Office of the Executive VP and Provost 0 0 21 2 23Office of Technology Transfer 0 0 5 0 5CITI Program 0 0 13 10 23TOTAL 0 0 39 12 51
UNDERGRADUATE AFFAIRS
Sr. Vice Provost-Undergraduate Education 0 0 46 17 63Honors and Academic Enhancement 0 0 1 0 1Academic Resource Center 0 0 10 3 13Undergraduate Research & Community Outreach 0 2 1 0 3TOTAL 0 2 58 20 80
RESEARCH
Office of the Vice Provost for Research 0 0 47 58 105TOTAL 0 0 47 58 105
Fact Book 137 Fall 2013

Research/ Admin./College/School/Branch and Department Faculty Training Prof. Staff Total
FULL-TIME EMPLOYEES BY COLLEGE/SCHOOL/BRANCH AND DEPARTMENTFall Semester, 2013
LOWE ART MUSEUM
Lowe Art Museum 0 0 8 5 13TOTAL 0 0 8 5 13
BUDGET OFFICE
Budget 0 0 14 3 17TOTAL 0 0 14 3 17
AUXILIARIES STUDENT RELATED
Wellness & Recreation 0 0 13 7 20University Center 0 0 7 4 11Student Activities Center 0 0 2 5 7Student Health Service 0 0 9 11 20Counseling Center 0 0 10 2 12Housing & Residential Life 0 0 18 8 26University Village Apartments 0 0 1 1 2TOTAL 0 0 60 38 98
STUDENT AFFAIRS
Office of the Vice President for Student Affairs 0 0 9 2 11Office of the Dean of Students 0 0 8 1 9Orientation 0 0 2 0 2Student Activities & Organizations 0 0 3 1 4Commuter Student Involvement 0 0 0 1 1Volunteer Service & Leadership Development 0 0 3 0 3University Rathskeller, Inc. 0 0 2 0 2Student Media 0 0 0 1 1TOTAL 0 0 27 6 33
ENROLLMENTS
Office of the VP of Enrollment Management 0 0 7 1 8Office of Admission 0 0 18 19 37Office of International Admission 0 0 5 4 9Office of Financial Assistance Services 0 0 15 10 25Office of Student Employment 0 0 2 4 6Technical Operations 0 0 3 4 7Market Research 0 0 3 0 3TOTAL 0 0 53 42 95
PRESIDENT
Office of the President 0 0 9 7 16Executive Payroll 0 0 2 0 2
Fact Book 138 Fall 2013
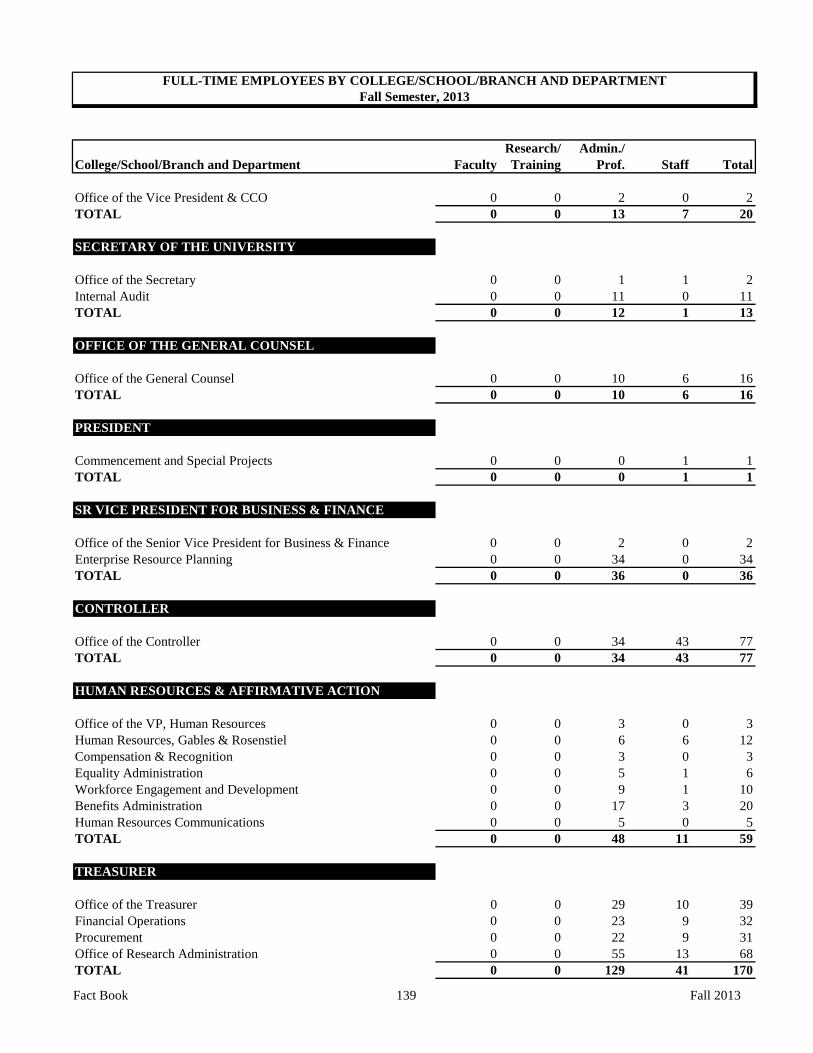
Research/ Admin./College/School/Branch and Department Faculty Training Prof. Staff Total
FULL-TIME EMPLOYEES BY COLLEGE/SCHOOL/BRANCH AND DEPARTMENTFall Semester, 2013
Office of the Vice President & CCO 0 0 2 0 2TOTAL 0 0 13 7 20
SECRETARY OF THE UNIVERSITY
Office of the Secretary 0 0 1 1 2Internal Audit 0 0 11 0 11TOTAL 0 0 12 1 13
OFFICE OF THE GENERAL COUNSEL
Office of the General Counsel 0 0 10 6 16TOTAL 0 0 10 6 16
PRESIDENT
Commencement and Special Projects 0 0 0 1 1TOTAL 0 0 0 1 1
SR VICE PRESIDENT FOR BUSINESS & FINANCE
Office of the Senior Vice President for Business & Finance 0 0 2 0 2Enterprise Resource Planning 0 0 34 0 34TOTAL 0 0 36 0 36
CONTROLLER
Office of the Controller 0 0 34 43 77TOTAL 0 0 34 43 77
HUMAN RESOURCES & AFFIRMATIVE ACTION
Office of the VP, Human Resources 0 0 3 0 3Human Resources, Gables & Rosenstiel 0 0 6 6 12Compensation & Recognition 0 0 3 0 3Equality Administration 0 0 5 1 6Workforce Engagement and Development 0 0 9 1 10Benefits Administration 0 0 17 3 20Human Resources Communications 0 0 5 0 5TOTAL 0 0 48 11 59
TREASURER
Office of the Treasurer 0 0 29 10 39Financial Operations 0 0 23 9 32Procurement 0 0 22 9 31Office of Research Administration 0 0 55 13 68TOTAL 0 0 129 41 170
Fact Book 139 Fall 2013
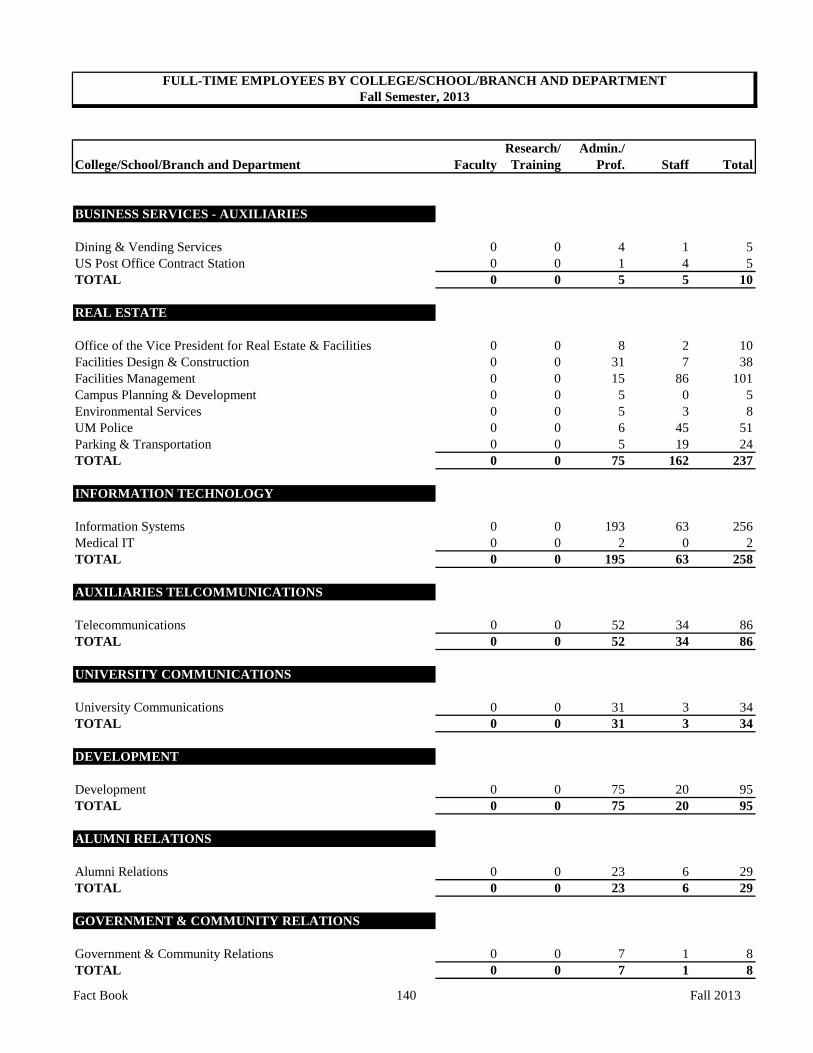
Research/ Admin./College/School/Branch and Department Faculty Training Prof. Staff Total
FULL-TIME EMPLOYEES BY COLLEGE/SCHOOL/BRANCH AND DEPARTMENTFall Semester, 2013
BUSINESS SERVICES - AUXILIARIES
Dining & Vending Services 0 0 4 1 5US Post Office Contract Station 0 0 1 4 5TOTAL 0 0 5 5 10
REAL ESTATE
Office of the Vice President for Real Estate & Facilities 0 0 8 2 10Facilities Design & Construction 0 0 31 7 38Facilities Management 0 0 15 86 101Campus Planning & Development 0 0 5 0 5Environmental Services 0 0 5 3 8UM Police 0 0 6 45 51Parking & Transportation 0 0 5 19 24TOTAL 0 0 75 162 237
INFORMATION TECHNOLOGY
Information Systems 0 0 193 63 256Medical IT 0 0 2 0 2TOTAL 0 0 195 63 258
AUXILIARIES TELCOMMUNICATIONS
Telecommunications 0 0 52 34 86TOTAL 0 0 52 34 86
UNIVERSITY COMMUNICATIONS
University Communications 0 0 31 3 34TOTAL 0 0 31 3 34
DEVELOPMENT
Development 0 0 75 20 95TOTAL 0 0 75 20 95
ALUMNI RELATIONS
Alumni Relations 0 0 23 6 29TOTAL 0 0 23 6 29
GOVERNMENT & COMMUNITY RELATIONS
Government & Community Relations 0 0 7 1 8TOTAL 0 0 7 1 8
Fact Book 140 Fall 2013
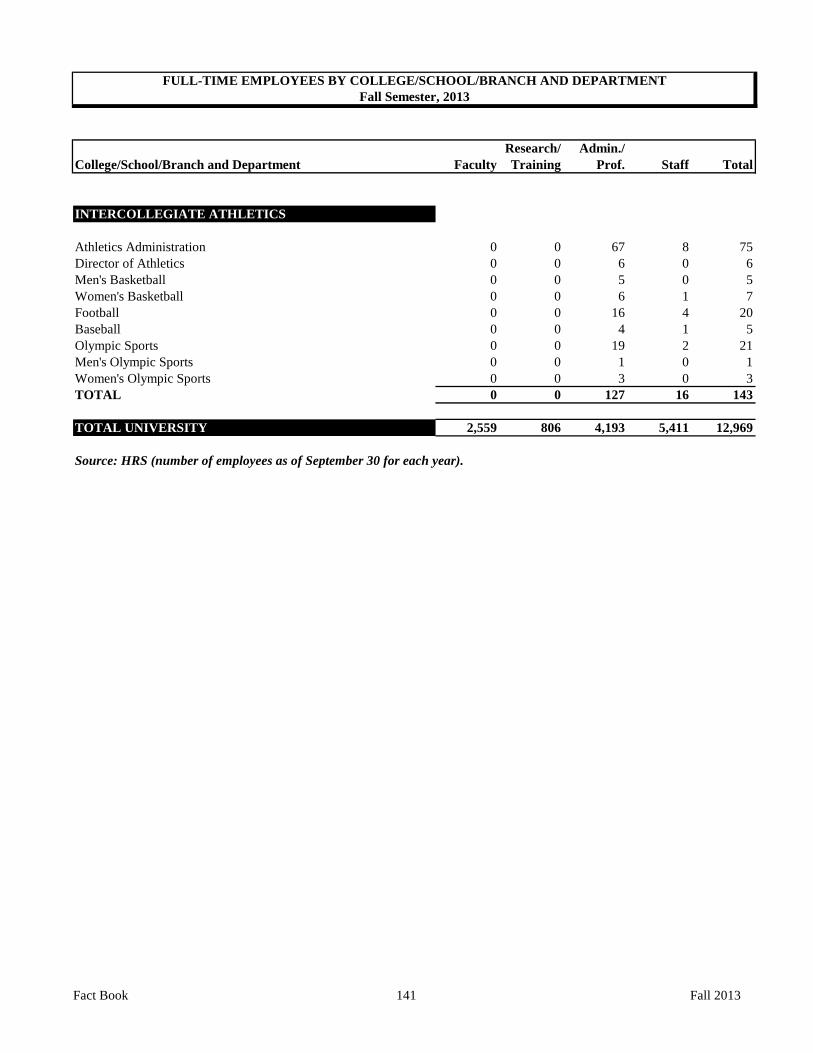
Research/ Admin./College/School/Branch and Department Faculty Training Prof. Staff Total
FULL-TIME EMPLOYEES BY COLLEGE/SCHOOL/BRANCH AND DEPARTMENTFall Semester, 2013
INTERCOLLEGIATE ATHLETICS
Athletics Administration 0 0 67 8 75Director of Athletics 0 0 6 0 6Men's Basketball 0 0 5 0 5Women's Basketball 0 0 6 1 7Football 0 0 16 4 20Baseball 0 0 4 1 5Olympic Sports 0 0 19 2 21Men's Olympic Sports 0 0 1 0 1Women's Olympic Sports 0 0 3 0 3TOTAL 0 0 127 16 143
TOTAL UNIVERSITY 2,559 806 4,193 5,411 12,969
Source: HRS (number of employees as of September 30 for each year).
Fact Book 141 Fall 2013

STATISTICS
Fiscal Year Ending 4-YearType of Statistic 2009 2010 2011 2012 2013 Change
General Volumes1 3,265,503 3,300,370 3,348,622 3,435,248 3,490,655 7% Microforms 3,993,799 4,030,606 4,065,784 4,103,603 4,146,111 4% Current Serials2 74,775 76,869 80,858 87,125 92,958 24% Inter-Library Loans 41,524 34,202 34,438 32,384 30,096 -28% Inter-Library Borrows 13,738 13,807 13,969 11,048 11,052 -20%
Electronic ResourcesE-Books3 542,380 550,974 561,549 630,756 656,893 21%E-Journals4 64,281 67,604 70,906 75,521 90,550 41%
Source: Richter Library
SELECTED STATISTICS FOR THE UNIVERSITY LIBRARIESFive Year Trends, Fiscal Years
Note: Data are for all University libraries, including the Richter Library and libraries in the Schools of Architecture, Business, Law, Medicine, Music, and the Rosenstiel School.
1 Includes both print and electronic book titles.2 Includes both print and electronic journal titles. 3 E-books are electronic publications, including reference books, multi-volume sets, monographs and other non-serial books that are digitally converted for electronic distribution, primarily over the World Wide Web.4 E-journals are full-text serial publications either wholly received in electronic format or the electronic equivalent of the print version.
Fact Book 142 Fall 2013
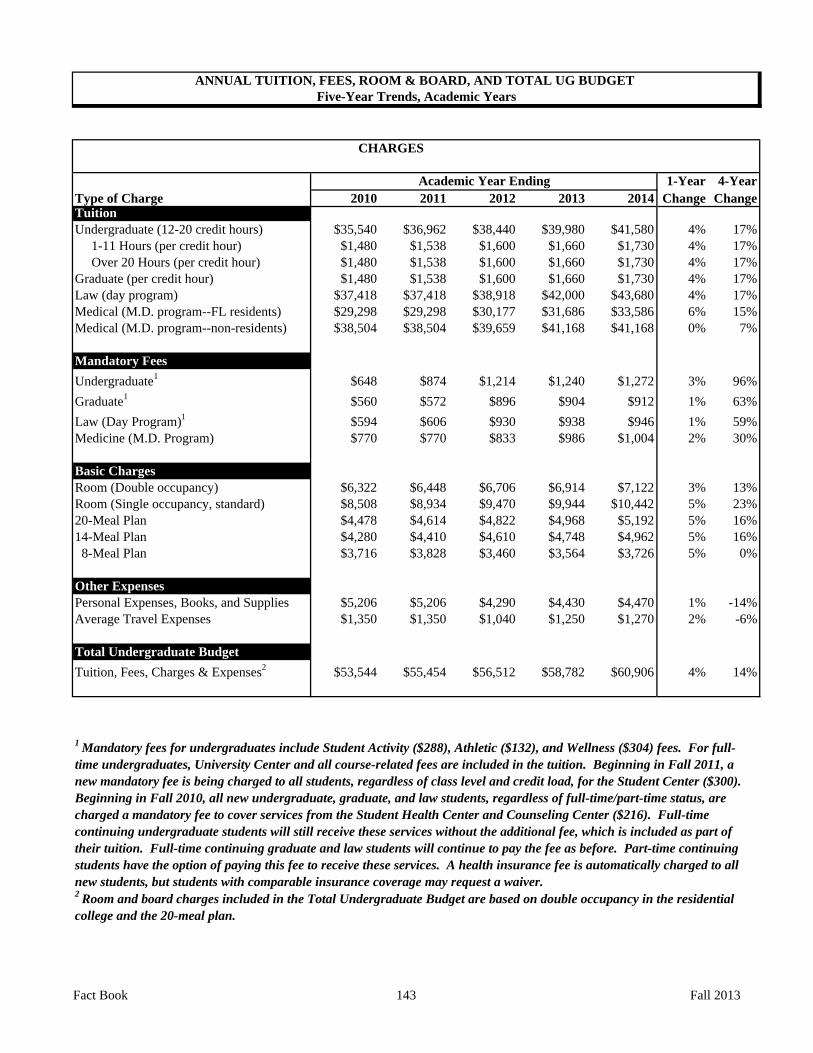
CHARGES
Academic Year Ending 1-Year 4-YearType of Charge 2010 2011 2012 2013 2014 Change ChangeTuition Undergraduate (12-20 credit hours) $35,540 $36,962 $38,440 $39,980 $41,580 4% 17% 1-11 Hours (per credit hour) $1,480 $1,538 $1,600 $1,660 $1,730 4% 17% Over 20 Hours (per credit hour) $1,480 $1,538 $1,600 $1,660 $1,730 4% 17%Graduate (per credit hour) $1,480 $1,538 $1,600 $1,660 $1,730 4% 17%Law (day program) $37,418 $37,418 $38,918 $42,000 $43,680 4% 17%Medical (M.D. program--FL residents) $29,298 $29,298 $30,177 $31,686 $33,586 6% 15%Medical (M.D. program--non-residents) $38,504 $38,504 $39,659 $41,168 $41,168 0% 7%
Mandatory Fees Undergraduate1 $648 $874 $1,214 $1,240 $1,272 3% 96%Graduate1 $560 $572 $896 $904 $912 1% 63%Law (Day Program)1 $594 $606 $930 $938 $946 1% 59%Medicine (M.D. Program) $770 $770 $833 $986 $1,004 2% 30%
Basic Charges Room (Double occupancy) $6,322 $6,448 $6,706 $6,914 $7,122 3% 13%Room (Single occupancy, standard) $8,508 $8,934 $9,470 $9,944 $10,442 5% 23%20-Meal Plan $4,478 $4,614 $4,822 $4,968 $5,192 5% 16%14-Meal Plan $4,280 $4,410 $4,610 $4,748 $4,962 5% 16% 8-Meal Plan $3,716 $3,828 $3,460 $3,564 $3,726 5% 0%
Other ExpensesPersonal Expenses, Books, and Supplies $5,206 $5,206 $4,290 $4,430 $4,470 1% -14%Average Travel Expenses $1,350 $1,350 $1,040 $1,250 $1,270 2% -6%
Total Undergraduate BudgetTuition, Fees, Charges & Expenses2 $53,544 $55,454 $56,512 $58,782 $60,906 4% 14%
2 Room and board charges included in the Total Undergraduate Budget are based on double occupancy in the residential college and the 20-meal plan.
ANNUAL TUITION, FEES, ROOM & BOARD, AND TOTAL UG BUDGET Five-Year Trends, Academic Years
1 Mandatory fees for undergraduates include Student Activity ($288), Athletic ($132), and Wellness ($304) fees. For full-time undergraduates, University Center and all course-related fees are included in the tuition. Beginning in Fall 2011, a new mandatory fee is being charged to all students, regardless of class level and credit load, for the Student Center ($300). Beginning in Fall 2010, all new undergraduate, graduate, and law students, regardless of full-time/part-time status, are charged a mandatory fee to cover services from the Student Health Center and Counseling Center ($216). Full-time continuing undergraduate students will still receive these services without the additional fee, which is included as part of their tuition. Full-time continuing graduate and law students will continue to pay the fee as before. Part-time continuing students have the option of paying this fee to receive these services. A health insurance fee is automatically charged to all new students, but students with comparable insurance coverage may request a waiver.
Fact Book 143 Fall 2013

RANK AND AMOUNT (IN THOUSANDS)
Fiscal Year Ending
2008 2009 2010 2011 2012
Federally Financed Research & Development Expenditures (NSF Survey of R&D) Rank among Universities & Colleges 64 62 61 61 59Dollar Amount in Thousands $168,036 $174,074 $197,824 $225,352 $224,172
Total Research & Development Expenditures (NSF Survey of R&D) Rank among Universities & Colleges 68 69 74 69 61Dollar Amount in Thousands $244,067 $250,339 $280,671 $323,486 $365,301
NIH Funding for Medical Research (Blue Ridge Institute for Medical Research)
Rank among U.S. Medical Schools 46 44 41 39 38Dollar Amount of Awards in Thousands $91,126 $96,854 $104,692 $111,683 $117,552
Research Funding from Survey by National Science Foundation (NSF) of R&D Expenditures and National Institutes of Health (NIH) from Blue Ridge Institute for Medical Research
RESEARCH FUNDINGFive Year Trends, Fiscal Years
Sources: National Science Foundation Survey of Research and Development Expenditures at Universities and Colleges; Blue Ridge Institute for Medical Research
* Prior to FY 2010 NSF determined its ranks for Federally Funded Research & Development (R&D) expenditures using only Science & Engineering (S&E) expenditures, but in FY 2010 non-S&E expenditures were also included. Furthermore, in FY 2010 NSF revised reporting procedures to require separate survey responses from each geographically separate institution campus headed by a president or chancellor, but did not provide any corresponding ranks for earlier years. UM's ranks for prior years were estimated by assuming that the eight "separate university campuses" ranked above UM in FY 2010 were also above UM in earlier years.** The total cost given in the awards above is the sum of the direct and indirect costs for each fiscal year, and not for the life of the project.
Fact Book 144 Fall 2013
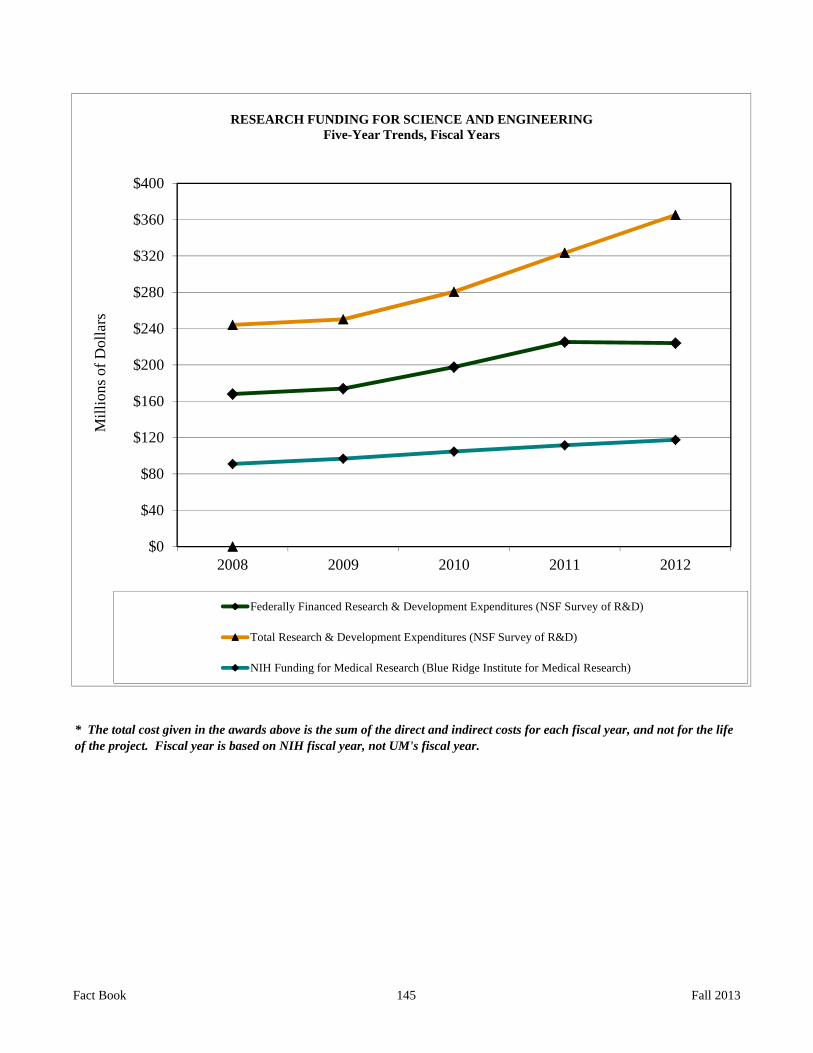
* The total cost given in the awards above is the sum of the direct and indirect costs for each fiscal year, and not for the life of the project. Fiscal year is based on NIH fiscal year, not UM's fiscal year.
$0
$40
$80
$120
$160
$200
$240
$280
$320
$360
$400
2008 2009 2010 2011 2012
Mill
ions
of D
olla
rsRESEARCH FUNDING FOR SCIENCE AND ENGINEERING
Five-Year Trends, Fiscal Years
Federally Financed Research & Development Expenditures (NSF Survey of R&D)
Total Research & Development Expenditures (NSF Survey of R&D)
NIH Funding for Medical Research (Blue Ridge Institute for Medical Research)
Fact Book 145 Fall 2013
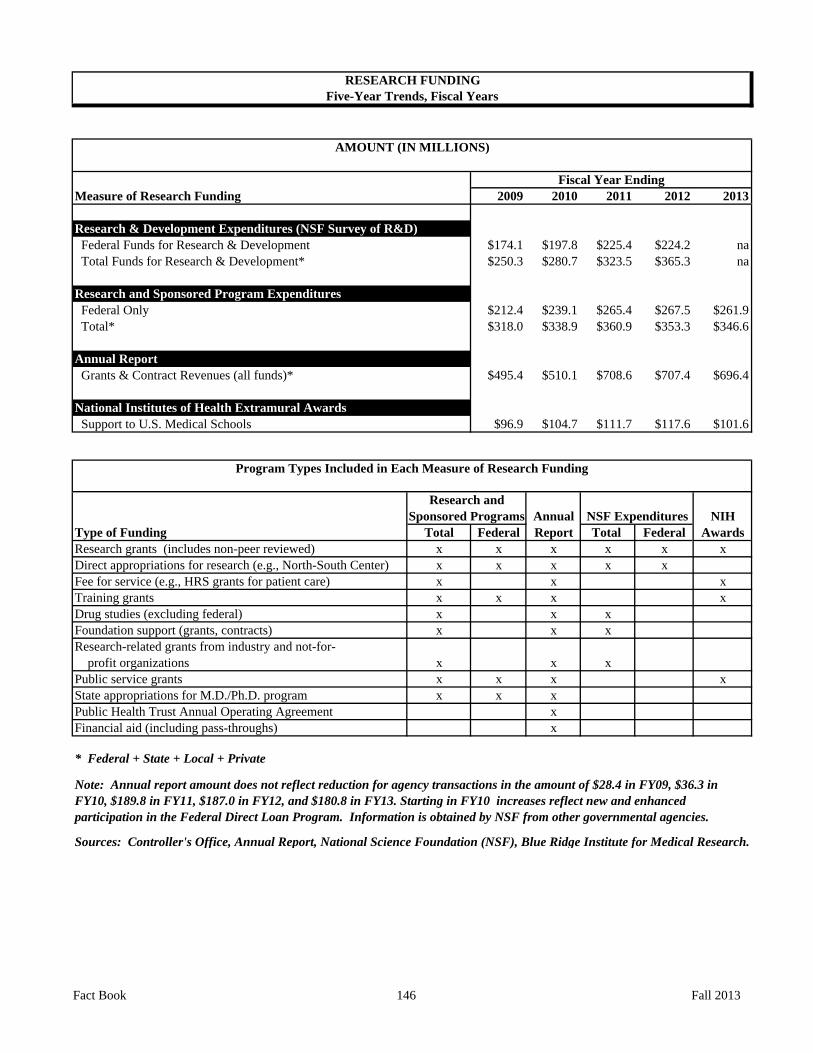
AMOUNT (IN MILLIONS)
Fiscal Year EndingMeasure of Research Funding 2009 2010 2011 2012 2013
Research & Development Expenditures (NSF Survey of R&D) Federal Funds for Research & Development $174.1 $197.8 $225.4 $224.2 na Total Funds for Research & Development* $250.3 $280.7 $323.5 $365.3 na
Research and Sponsored Program Expenditures Federal Only $212.4 $239.1 $265.4 $267.5 $261.9 Total* $318.0 $338.9 $360.9 $353.3 $346.6
Annual Report Grants & Contract Revenues (all funds)* $495.4 $510.1 $708.6 $707.4 $696.4
National Institutes of Health Extramural Awards Support to U.S. Medical Schools $96.9 $104.7 $111.7 $117.6 $101.6
Program Types Included in Each Measure of Research Funding
Annual NSF Expenditures NIHType of Funding Total Federal Report Total Federal AwardsResearch grants (includes non-peer reviewed) x x x x x xDirect appropriations for research (e.g., North-South Center) x x x x xFee for service (e.g., HRS grants for patient care) x x xTraining grants x x x xDrug studies (excluding federal) x x xFoundation support (grants, contracts) x x xResearch-related grants from industry and not-for- profit organizations x x xPublic service grants x x x xState appropriations for M.D./Ph.D. program x x xPublic Health Trust Annual Operating Agreement xFinancial aid (including pass-throughs) x
* Federal + State + Local + Private
Sources: Controller's Office, Annual Report, National Science Foundation (NSF), Blue Ridge Institute for Medical Research.
Note: Annual report amount does not reflect reduction for agency transactions in the amount of $28.4 in FY09, $36.3 in FY10, $189.8 in FY11, $187.0 in FY12, and $180.8 in FY13. Starting in FY10 increases reflect new and enhanced participation in the Federal Direct Loan Program. Information is obtained by NSF from other governmental agencies.
Research andSponsored Programs
RESEARCH FUNDINGFive-Year Trends, Fiscal Years
Fact Book 146 Fall 2013

SUMMARY OF EXPENDITURES
Federal* Non-Federal* All SourcesSchool/Department/Campus Indirect Total Indirect Total Indirect Total
Architecture $0 $29,925 $0 $12,433 $0 $42,358Arts and Sciences $3,549,035 $14,822,348 $230,332 $4,047,432 $3,779,367 $18,869,780Business Administration $133,442 $480,249 $0 $0 $133,442 $480,249Communication $6 $66 $16,815 $369,418 $16,821 $369,484Education & Human Development $370,545 $3,138,014 $14,608 $213,961 $385,153 $3,351,975Engineering $1,016,768 $4,527,366 $33,854 $332,237 $1,050,622 $4,859,603Graduate School $1,047 $586,130 $0 $161,939 $1,047 $748,069Instit. for Cuban & Cuban-Amer. Stud. $0 $0 $0 $90,564 $0 $90,564Music $0 $0 $76,053 $691,048 $76,053 $691,048Nursing & Health Studies $620,773 $2,405,092 $0 $385,435 $620,773 $2,790,527Law $0 $0 $0 $140,919 $0 $140,919Other Academic Affairs $26,300 $13,099,928 $0 $1,360,940 $26,300 $14,460,868Lowe Art Museum $0 $0 $0 $193,281 $0 $193,281Business and Finance $0 $0 $0 $0 $0 $0Ctr for Computational Science Admn $224,236 $656,490 $1,343 $4,029 $225,579 $660,519Total Coral Gables Campus $5,942,152 $39,745,608 $373,005 $8,003,636 $6,315,157 $47,749,244
Total Rosenstiel School $9,990,929 $49,731,441 $976,576 $7,017,918 $10,967,505 $56,749,359
Total Medical School $43,165,638 $172,459,047 $6,846,593 $69,606,667 $50,012,231 $242,065,714
TOTAL ALL CAMPUSES $59,098,719 $261,936,096 $8,196,174 $84,628,221 $67,294,893 $346,564,317
* State and local pass-throughs from the federal government are included in the federal category.Note: Totals exclude financial aid
Source: Controller's Office.
RESEARCH AND SPONSORED PROGRAM EXPENDITURES BY SCHOOL/COLLEGEFiscal Year Ending May 31, 2013
Fact Book 147 Fall 2013
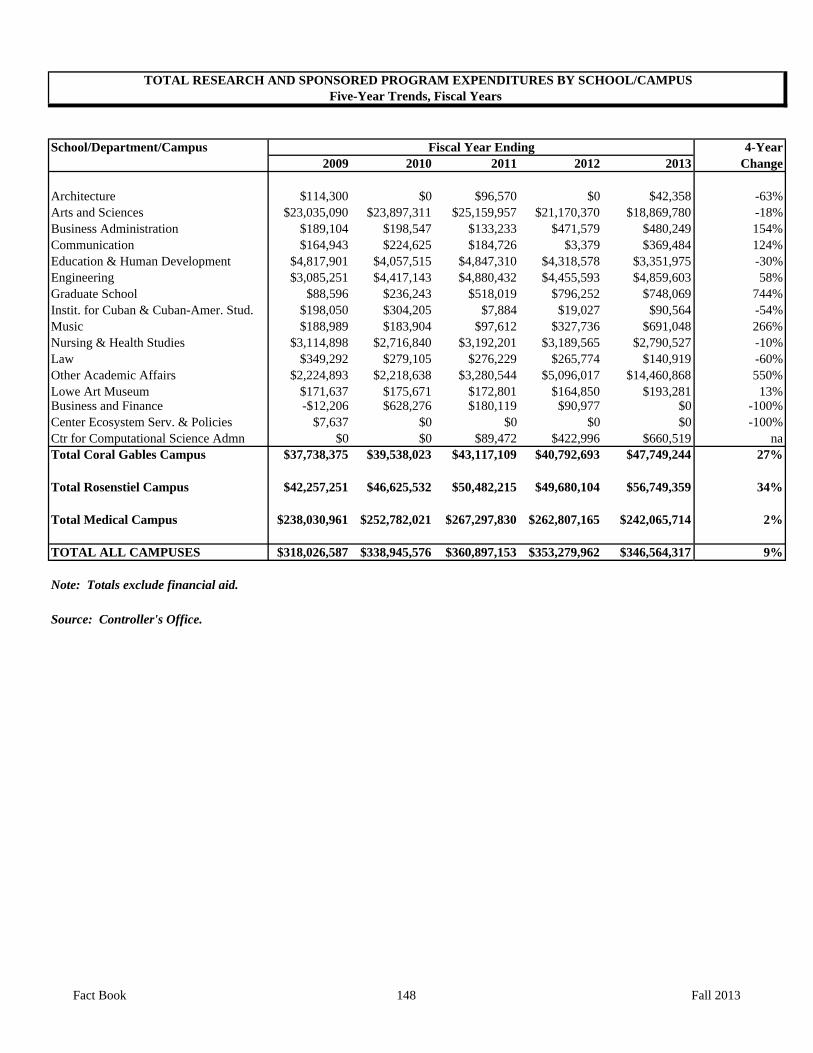
School/Department/Campus Fiscal Year Ending 4-Year2009 2010 2011 2012 2013 Change
Architecture $114,300 $0 $96,570 $0 $42,358 -63%Arts and Sciences $23,035,090 $23,897,311 $25,159,957 $21,170,370 $18,869,780 -18%Business Administration $189,104 $198,547 $133,233 $471,579 $480,249 154%Communication $164,943 $224,625 $184,726 $3,379 $369,484 124%Education & Human Development $4,817,901 $4,057,515 $4,847,310 $4,318,578 $3,351,975 -30%Engineering $3,085,251 $4,417,143 $4,880,432 $4,455,593 $4,859,603 58%Graduate School $88,596 $236,243 $518,019 $796,252 $748,069 744%Instit. for Cuban & Cuban-Amer. Stud. $198,050 $304,205 $7,884 $19,027 $90,564 -54%Music $188,989 $183,904 $97,612 $327,736 $691,048 266%Nursing & Health Studies $3,114,898 $2,716,840 $3,192,201 $3,189,565 $2,790,527 -10%Law $349,292 $279,105 $276,229 $265,774 $140,919 -60%Other Academic Affairs $2,224,893 $2,218,638 $3,280,544 $5,096,017 $14,460,868 550%Lowe Art Museum $171,637 $175,671 $172,801 $164,850 $193,281 13%Business and Finance -$12,206 $628,276 $180,119 $90,977 $0 -100%Center Ecosystem Serv. & Policies $7,637 $0 $0 $0 $0 -100%Ctr for Computational Science Admn $0 $0 $89,472 $422,996 $660,519 naTotal Coral Gables Campus $37,738,375 $39,538,023 $43,117,109 $40,792,693 $47,749,244 27%
Total Rosenstiel Campus $42,257,251 $46,625,532 $50,482,215 $49,680,104 $56,749,359 34%
Total Medical Campus $238,030,961 $252,782,021 $267,297,830 $262,807,165 $242,065,714 2%
TOTAL ALL CAMPUSES $318,026,587 $338,945,576 $360,897,153 $353,279,962 $346,564,317 9%
Note: Totals exclude financial aid. Source: Controller's Office.
TOTAL RESEARCH AND SPONSORED PROGRAM EXPENDITURES BY SCHOOL/CAMPUSFive-Year Trends, Fiscal Years
Fact Book 148 Fall 2013
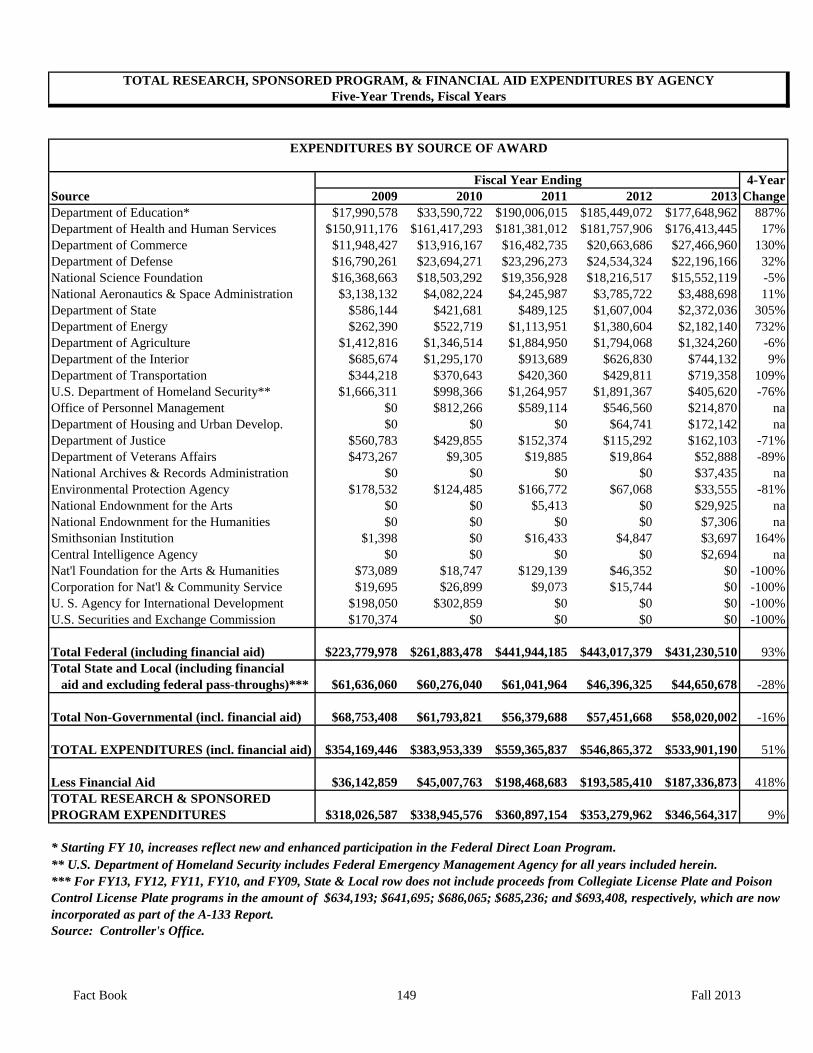
Fiscal Year Ending 4-YearSource 2009 2010 2011 2012 2013 ChangeDepartment of Education* $17,990,578 $33,590,722 $190,006,015 $185,449,072 $177,648,962 887%Department of Health and Human Services $150,911,176 $161,417,293 $181,381,012 $181,757,906 $176,413,445 17%Department of Commerce $11,948,427 $13,916,167 $16,482,735 $20,663,686 $27,466,960 130%Department of Defense $16,790,261 $23,694,271 $23,296,273 $24,534,324 $22,196,166 32%National Science Foundation $16,368,663 $18,503,292 $19,356,928 $18,216,517 $15,552,119 -5%National Aeronautics & Space Administration $3,138,132 $4,082,224 $4,245,987 $3,785,722 $3,488,698 11%Department of State $586,144 $421,681 $489,125 $1,607,004 $2,372,036 305%Department of Energy $262,390 $522,719 $1,113,951 $1,380,604 $2,182,140 732%Department of Agriculture $1,412,816 $1,346,514 $1,884,950 $1,794,068 $1,324,260 -6%Department of the Interior $685,674 $1,295,170 $913,689 $626,830 $744,132 9%Department of Transportation $344,218 $370,643 $420,360 $429,811 $719,358 109%U.S. Department of Homeland Security** $1,666,311 $998,366 $1,264,957 $1,891,367 $405,620 -76%Office of Personnel Management $0 $812,266 $589,114 $546,560 $214,870 naDepartment of Housing and Urban Develop. $0 $0 $0 $64,741 $172,142 naDepartment of Justice $560,783 $429,855 $152,374 $115,292 $162,103 -71%Department of Veterans Affairs $473,267 $9,305 $19,885 $19,864 $52,888 -89%National Archives & Records Administration $0 $0 $0 $0 $37,435 naEnvironmental Protection Agency $178,532 $124,485 $166,772 $67,068 $33,555 -81%National Endownment for the Arts $0 $0 $5,413 $0 $29,925 naNational Endownment for the Humanities $0 $0 $0 $0 $7,306 naSmithsonian Institution $1,398 $0 $16,433 $4,847 $3,697 164%Central Intelligence Agency $0 $0 $0 $0 $2,694 naNat'l Foundation for the Arts & Humanities $73,089 $18,747 $129,139 $46,352 $0 -100%Corporation for Nat'l & Community Service $19,695 $26,899 $9,073 $15,744 $0 -100%U. S. Agency for International Development $198,050 $302,859 $0 $0 $0 -100%U.S. Securities and Exchange Commission $170,374 $0 $0 $0 $0 -100%
Total Federal (including financial aid) $223,779,978 $261,883,478 $441,944,185 $443,017,379 $431,230,510 93%Total State and Local (including financial aid and excluding federal pass-throughs)*** $61,636,060 $60,276,040 $61,041,964 $46,396,325 $44,650,678 -28%
Total Non-Governmental (incl. financial aid) $68,753,408 $61,793,821 $56,379,688 $57,451,668 $58,020,002 -16%
TOTAL EXPENDITURES (incl. financial aid) $354,169,446 $383,953,339 $559,365,837 $546,865,372 $533,901,190 51%
Less Financial Aid $36,142,859 $45,007,763 $198,468,683 $193,585,410 $187,336,873 418%TOTAL RESEARCH & SPONSOREDPROGRAM EXPENDITURES $318,026,587 $338,945,576 $360,897,154 $353,279,962 $346,564,317 9%
Source: Controller's Office.
EXPENDITURES BY SOURCE OF AWARD
TOTAL RESEARCH, SPONSORED PROGRAM, & FINANCIAL AID EXPENDITURES BY AGENCYFive-Year Trends, Fiscal Years
*** For FY13, FY12, FY11, FY10, and FY09, State & Local row does not include proceeds from Collegiate License Plate and Poison Control License Plate programs in the amount of $634,193; $641,695; $686,065; $685,236; and $693,408, respectively, which are now incorporated as part of the A-133 Report.
* Starting FY 10, increases reflect new and enhanced participation in the Federal Direct Loan Program.** U.S. Department of Homeland Security includes Federal Emergency Management Agency for all years included herein.
Fact Book 149 Fall 2013

FINANCIAL HIGHLIGHTS OF THE UNIVERSITY Five-Year Trends, Fiscal Years, Amount in Millions
Fiscal Year Ending2009 2010 2011 2012 2013
What We Own Cash & Investments1 $840.4 $885.3 $1,031.5 $1,032.6 $1,227.1 Receivables1 $337.4 $381.9 $359.3 $345.1 $348.2 Contributions (Pledges) and Trusts Receivable $149.7 $151.0 $148.4 $146.1 $149.7 Other Assets1 $52.0 $52.1 $103.3 $91.0 $76.4 Intangible Assets2 $101.2 $100.3 $100.3 $100.3 $1.1 Property and Equipment3 $1,431.6 $1,434.4 $1,442.9 $1,465.2 $1,536.1 Total Assets $2,912.3 $3,005.0 $3,185.7 $3,180.3 $3,338.6What We Owe For Services and Other Operating Expenses1 $410.8 $460.2 $487.7 $539.7 $529.3 Bonds & Notes Payable $900.6 $844.3 $845.3 $878.6 $923.8 Other Commitments (including pension)1 $285.9 $342.4 $279.1 $428.9 $332.4 Total Liabilities $1,597.3 $1,646.9 $1,612.1 $1,847.2 $1,785.5What We Own Less What We Owe Operations, Programs, Facilities Expansion, and Student Loans1 $131.4 $144.1 $153.3 $88.3 $138.2 Cumulative postretirement benefits related changes other than net periodic benefit cost1 -$232.9 -$286.0 -$208.0 -$375.0 -$289.3 Invested in Facilities1 $718.7 $721.9 $749.3 $784.8 $765.0 Contributions (Pledges) and Trusts $149.7 $151.0 $148.4 $146.1 $149.7 Life Income and Annuity Funds1 $9.5 $8.9 $10.7 $10.2 $11.6 Endowment and Similar Funds $538.6 $618.2 $719.9 $678.7 $777.9 Total Net Assets $1,315.0 $1,358.1 $1,573.6 $1,333.1 $1,553.1Sources of Funds for Operations Tuition and Fess, Net1 $369.5 $383.3 $401.2 $432.6 $463.4 Grants and Contracts $459.0 $466.4 $502.2 $482.3 $508.1 Patient Care $995.9 $1,096.6 $1,170.2 $1,230.0 $1,276.0 State Appropriation (School of Medicine) $8.0 $7.4 $16.6 $9.9 $7.5 Gifts and Trusts4 $86.5 $91.5 $84.5 $80.3 $86.7 Investment Return $42.0 $38.8 $40.3 $33.7 $36.0 Auxiliaries $99.5 $96.8 $99.2 $105.5 $107.2 Other Sources $31.2 $26.6 $26.8 $29.2 $39.8 Total Sources of Funds for Operations $2,091.6 $2,207.4 $2,341.0 $2,403.5 $2,524.7Gifts and Trusts Unrestricted5 $75.3 $66.8 $56.1 $65.4 $68.2 Temporarily Restricted $13.4 $26.6 $37.7 $32.2 $37.0 Permanently Restricted $14.0 $12.1 $11.4 $11.7 $12.1 Total Gifts and Trusts $102.7 $105.5 $105.2 $109.3 $117.3
Source: Controller's Office and University of Miami Annual Report.
1 Includes the effects of a reclassification made to prior years information to conform to subsequent year presentation.2 Related to purchase of University of Miami Hospital in 2008 and a physician practice in 2010.3 Includes the effect of accumulated depreciation and amortization of $1,207.9 million in 2012-13, $1,116.3 million in 2011-12, $1,017.5 million in 2010-11, $927.6 million in 2009-10, and $833.8 million in 2008-09.4 Net assets released from restrictions of $25.8 million in 2012-13, $19.6 million in 2011-12, $31.9 million in 2010-11, $33.0 million in 2009-10, and $17.3 million in 2008-09 are included in Sources of Funds for Operations above.5 Unrestricted gifts and trusts of $60.9 million in 2012-13, $60.7 million for 2011-12, $52.6 million for 2010-11, $58.5 million for 2009-10, and $69.2 million for 2008-09 are included in Sources of Funds for Operations above.
Fact Book 150 Fall 2013

ENDOWMENT Five-Year Trends, Fiscal Years, Amount in Millions
Fiscal Year Ending2009 2010 2011 2012 2013
Endowment Market Value of Endowment $538.6 $618.2 $719.9 $678.7 $777.9
Source: Treasurer's Office
Fact Book 151 Fall 2013