off-grid power supply carbon footprint and sustainable energy planning of primary health facilities
DESCRIPTION
This study will provide an insight to the carbon impact and savings potential of renewable off grid generation technology at country grant level.TRANSCRIPT

1
Authors: Dr. Maria Brucoli1 | Dr. Kristian Steele2 | Dr. Christoph Hamelmann3 | Elliman Jagne4 | Daisy Mukarakate5
Off-grid power supply carbon footprint and sustainable energy planning of primary health facilities
Cost effective, resilient and sustainable access to energy is an important building block for development and is a strategically important objective for UNDP as recognised by the Sustainable Energy for All (SE4ALL1) programme.
In the health sector, power availability is a key requirement for successful service delivery with power needed for life-support equipment (e.g. incubators), essential equipment (e.g. refrigerators), and basic
function delivery requiring light to see or power for small equipment.
In many countries where UNDP-GF administers programmes, there is insufficient generation capacity or delivery infrastructure. This means that in many cases GF-grants are being used to procure and support micro scale energy infrastructure. This study will provide an insight to the carbon impact and savings potential of renewable off grid generation technology at country grant level.
Introduction
1http://www.se4all.org/
1Engineer and Microgrids Specialist Building Engineering, Arup2Senior Analyst, Advanced Technology & Research, Arup3Regional Practice Leader HIV, Health and Development, UNDP Regional Centre, Europe and the CIS4Operations Manager GFATM projects, UNDP Zimbabwe5Programme Specialist – Environment and energy, UNDP Zimbabwe
UNOPS©

2
Electrical power provision in Zimbabwe
Current generation capacity (mainly thermal and hydro) in Zimbabwe cannot meet local demand2 and the country imports around 35% of its electricity from its neighbouring countries including Mozambique, South Africa and the Democratic Republic of Congo. These imports tend to vary and expose the country to high price volatility and external influences. Load shedding is regularly administered and large areas of the country (both urban and rural) are not connected to the electricity grid.
In the absence of a grid connection many go without power, or where it is essential, it is supplied by local micro-scale generation usually in the form of diesel generators. For health programme providers in Zimbabwe like UNDP-GF, it is common practice to power off-grid health clinics with diesel generators. Although a reliable and well established technology, diesel generators are expensive to run, have a negative effect on the air quality, greenhouse gas carbon emissions and expose the users to external influences (e.g. price volatility, supply interruption, etc.).
Study scope
Given its location, Zimbabwe has a lot of potential for renewable low carbon energy generation in particularly from solar power as demonstrated in Figure 1. In the absence of a reliable grid connection, local micro-scale energy systems including Photo Voltaic (PV) panels can offer a valid alternative to the Business As Usual (BAU) solution of using expensive and polluting diesel generators3,4.
Within this context, this study is aiming to understand the carbon saving potential of off-grid micro-scale renewable energy systems compared with traditional approaches to energy provision in UNDP-GF administered health clinic infrastructure in Zimbabwe.
Figure 1. Daily solar radiation for Zimbabwe which demonstrates good potential for PV renewable energy systems7.
2http://www.zesa.co.zw/ 3NREL “Renewable Energy for Rural Health Clinics”4ICRC “Support for Primary Healthcare Services in Zimbabwe – 2006 to 2013”
Global Horizontal Radiation
Cle
arne
ss In
dex
Daily
Rad
iatio
n (k
Wh/
m2 /d
)
Jan
Feb
Mar Apr
May Jun
Jul
Aug
Sept Oct
Nov Dec0
1
2
3
4
5
0.0
0.2
0.4
0.6
0.86
Daily Radiation Clearness Index
UN
CD
F©
UN
DP©
UN
DP©

3
Calculation approach
The step-by-step methodology implemented to carry out this study is shown in Figure 2.
Health facility infrastructure in Zimbabwe
Health facilities in Zimbabwe are categorized based on the level of care they provide and their ownership. The system is decentralized and patients need to first visit a primary level facility and then are often referred to the
appropriate level of health care facility if additional care is required. From Table 1, which shows the inventory of the health facilities in Zimbabwe, it can be seen that within this system the most common health facility in Zimbabwe is the “rural health centre/clinic” with over 1400 such clinics in existence.
The study found that it is fairly common for rural health centres/clinics not to be connected to the electricity grid and to be supplied by diesel generators. On this basis and given the large number of rural health clinics, it was decided that most could be gained if the study focused on this type facility.
Table 1. Health facilities inventory in Zimbabwe.
GeneratorsSolar PVBatteries
Business as usualRenewable energy
Carbon Emissions AnalysisRecommendationsModel
SelectionPower Supply
DesignHOMER Analysis
+ Life Cycle Analysis
Clinic offeredservicesElectric loaddemand
Figure 2.
Schematic of study approach consisting of a five step process including 1) UNDP-GF supported Zimbabwe clinic review and identification of priority clinic types; 2) defining clinic service requirements; 3) determining clinic energy loads; 4) development of energy supply scenarios; and 5) determination of clinic carbon footprints.
Central Hospitals
Rural Health
Centres / Clinics
District Hospitals
General Hospitals
Mission Clinics
Mission Hospitals
Provincial Hospitals
Rural Hospitals Totals
Bulawayo Central Hospitals 3 0 0 0 0 0 0 0 3
Bulawayo City 0 36 1 0 0 0 0 0 37
Chitungwiza City 0 7 0 0 0 0 0 0 7
Harare Central Hospitals 3 0 0 0 0 0 0 0 3
Harare City 0 59 0 0 0 0 0 0 59
Manicaland Province 0 245 5 0 0 18 1 11 280
Mashonaland Central 0 132 5 1 0 5 1 2 146Mashonaland East Province 0 176 7 2 6 5 1 8 205Midlands Province 0 199 7 4 12 11 1 7 241Matabeleland North 0 127 6 1 2 5 0 7 148Matabeleland South 0 100 5 0 6 6 1 7 125Masvingo Province 0 165 3 3 6 11 1 7 196Mashonaland West Province 0 166 4 1 2 6 1 12 192Totals 6 1412 43 12 34 67 7 61 1642

4
Health clinic services
With this focus it then became important to create a physical definition for a rural health centre/clinic. A floor plan for an example facility can be found in Figure 3 (a real clinic in Masvingo Province); and this was used as the basis for creating the nominal physical definition. The clinic was then further defined as being in a rural and relatively remote site, not near a river or hills of any particular significance. It was assumed located off the Zimbabwe energy grid but benefiting from road access with a 50km distance to the nearest main highway where there was fuel access and also the national energy grid network.
The physical definition of the facility and the nature of the services it offers are important because they shape the loading requirements and subsequently the power demand. Based on the plan in Figure 3 it was assumed that the clinic offered the following services:
- Capacity of 8 beds
- Delivery suite
- Treatment of minor illnesses and injuries
- Small number of permanent staff
- Minor surgical procedures
- Immunization services
- Cold chain requirements for vaccines, blood and medical supplies
- On site basic lab and some simple diagnostic equipment
Electrical loading
Given the service requirements it then became possible to make assumptions regarding energy loading requirements and develop a maximum power demand. Outline requirements for the services were based on UNDP-GF programme experience, the example clinic layout and reference of USAID guidance6. This was also used to define the load requirements we expect to see in UNDP-GF supported rural health clinics. As such it can be expected that electric power is required for:
- General purpose and task lighting (e.g. to support minor surgical procedures)
- Maintaining the cold chain for vaccines, blood, and other medical supplies utilizing basic lab equipment (a centrifuge, haematology mixer, microscope, incubator, etc.)
- A pump load and UV water purification system for water provision
- External lighting
The power loading requirements of this equipment are defined in more detail in Table 2. This was then used to establish a 24 hour loading profile (Figure 4) which could then be used as a multiplier over the clinic service life.
5Personal communication Peter Ooko K’Aluoch UNOPS Zimbabwe 6USAID “Powering Health: Electrification options for rural health centres”
Figure 3. Example clinic Masvingo Province used as the basis for defining facility health service provision and subsequently energy loading5.

5
Table 2. Unit power demand requirements for example UNDP-GF supported rural health centre/clinic.
Figure 4. 24 hour electricity load demand for example UNDP-GF supported rural health centre/clinic.
Power Demand Power (W/m2) Power (W) Quantity
General lighting 8 - -
Task lighting 15 - -
Water pump - 2000 1
UV water purification - 1000 1
Small Refrigerator (non-medical use) - 500 2
Vaccine Refrigerator/ Freezer - 1000 2
Centrifuge - 600 1
Haematology mixer - 100 1
Microscope - 100 2
Incubator - 400 2
Water bath - 1000 1
Sterilizer Oven (Laboratory Autoclave) - 1000 1
Hand-powered aspirator - - 1
24 hours
kW
0.0
8.0
6.0
4.0
2.0
10.0
12.0
6
Power supply scenarios
With the facility type and energy demand profile now defined, two power supply scenarios were designed. A suitable power supply for the clinic must be capable of proving reliable electricity to all the connected loads under normal operation. In case of a major disruption or fault, consideration needs to be given on how power supply can be still given to those essential/life-supporting loads.
Within this context, two power delivery strategies were established as the basis for the analysis:
- BAU off-grid power supply
- Renewable energy off-grid power supply
Each will now be described in detail.
BAU off-grid power supply
Powering rural health clinics with diesel generators is the most common and traditional solution. Given the load demands summarised in Figure 4 and the water pump starting characteristic a suitably sized generator was selected. The generator was also assumed to require a fuel pumping system and an oil tank. For this BAU scenario a 15kW generator was selected and was assumed installed in the power system configuration shown in Figure 5.
A model of this system was built in the Hybrid Optimization Model for Electric Renewables (HOMER7) software in order to evaluate the operating carbon emissions.
Renewable energy off-grid power supply
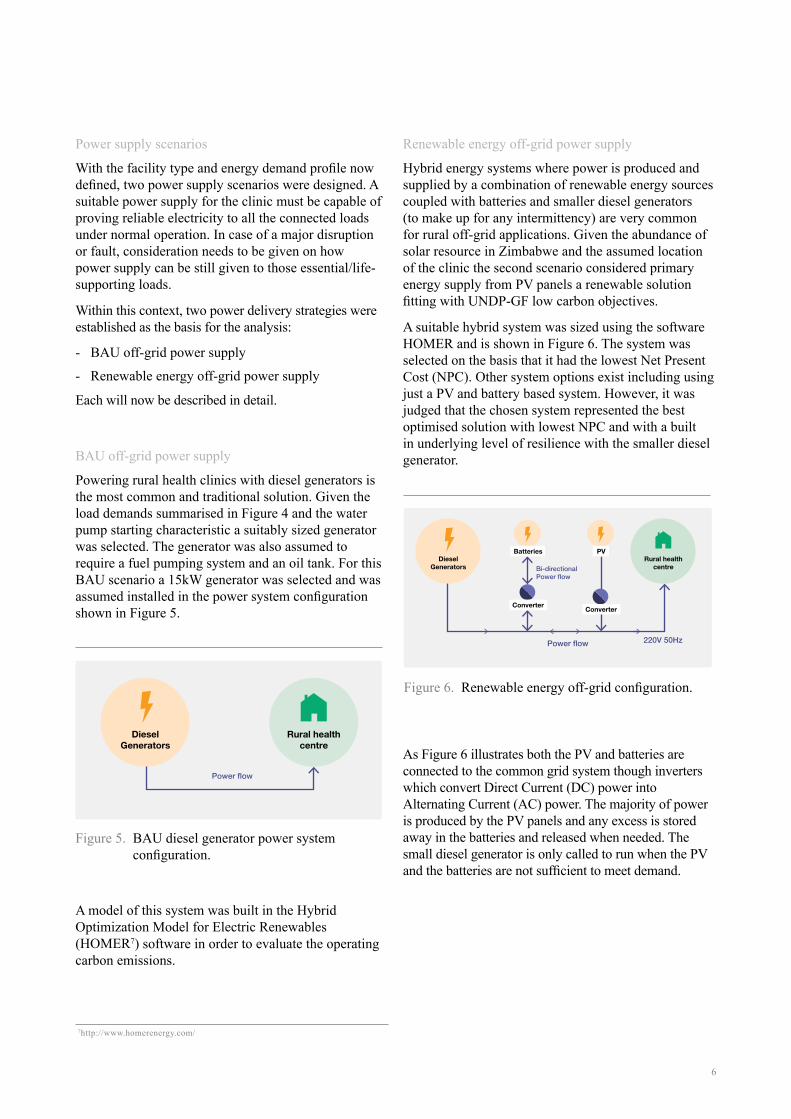
Hybrid energy systems where power is produced and supplied by a combination of renewable energy sources coupled with batteries and smaller diesel generators (to make up for any intermittency) are very common for rural off-grid applications. Given the abundance of solar resource in Zimbabwe and the assumed location of the clinic the second scenario considered primary energy supply from PV panels a renewable solution fitting with UNDP-GF low carbon objectives.
A suitable hybrid system was sized using the software HOMER and is shown in Figure 6. The system was selected on the basis that it had the lowest Net Present Cost (NPC). Other system options exist including using just a PV and battery based system. However, it was judged that the chosen system represented the best optimised solution with lowest NPC and with a built in underlying level of resilience with the smaller diesel generator.
As Figure 6 illustrates both the PV and batteries are connected to the common grid system though inverters which convert Direct Current (DC) power into Alternating Current (AC) power. The majority of power is produced by the PV panels and any excess is stored away in the batteries and released when needed. The small diesel generator is only called to run when the PV and the batteries are not sufficient to meet demand.
Figure 5. BAU diesel generator power system configuration.
Figure 6. Renewable energy off-grid configuration.
7http://www.homerenergy.com/
Rural healthcentre
DieselGenerators
Power flow
Power flow
Bi-directional Power flow
220V 50Hz
Batteries
Converter Converter
PVDiesel
GeneratorsRural health
centre
7
Embodied carbon
For completeness the study also took account of the carbon footprint associated with the manufacture and production of the two energy systems; i.e. so called embodied carbon. This was undertaking by creating simplified life cycle assessment (LCA) models of each system (see Table 3). In this way the study could consider the full life cycle carbon footprint of both scenarios measuring the greenhouse gas emissions arising from both supply chain / manufacture, and their operation. Built into this aspect of the study were also the carbon emissions of maintaining both systems during operation.
Study findings
The embodied and operating carbon emission levels determined for each scenario are shown in Table 4. This data is further summarised through Figure 7 and Figure 8 both presenting the comparison of two scenarios over an operational life span of 30 years.
The main findings of this study can be summarised as follows:
1. The greenhouse gas emissions and associated carbon footprint (including both embodied and operating values) of the BAU scenario are much
higher (around 6.5 times) than the ones of the renewable energy scenario.
2. The embodied carbon in the components for the renewable energy scenario is higher than the one associated with the BAU diesel generator system (around 40 times); but the magnitude of embodied emissions for both systems is small compared with their operational footprint.
3. This means the carbon payback time for the renewable energy scenario is less than one year.
4. The carbon emissions associated with the renewables hybrid system in operation come from periodic use of its back up diesel generator and routine maintenance.
5. There is likely an opportunity to reduce the carbon emissions of both systems subject to more precise sizing of components and their optimisation to reflect more specific scenarios.
6. The emissions associated with fuel transportation are not factored. Similarly the emissions associated with the decommissioning are not included. When included, this is likely to increase the overall emissions from the two scenarios and possibly increase the division between the two even further.
If there are 1400 rural health centres/clinics in Zimbabwe and we assume 50% are currently off grid
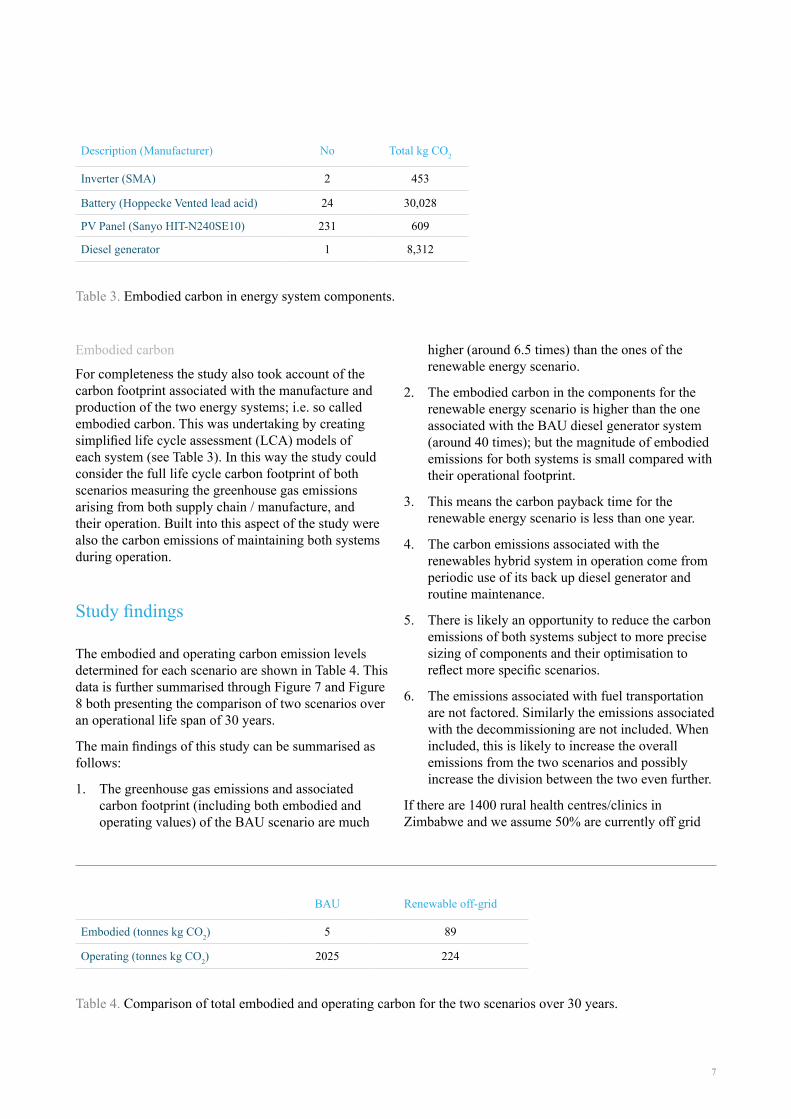
Table 3. Embodied carbon in energy system components.
Table 4. Comparison of total embodied and operating carbon for the two scenarios over 30 years.
Description (Manufacturer) No Total kg CO2
Inverter (SMA) 2 453
Battery (Hoppecke Vented lead acid) 24 30,028
PV Panel (Sanyo HIT-N240SE10) 231 609
Diesel generator 1 8,312
BAU Renewable off-grid
Embodied (tonnes kg CO2) 5 89
Operating (tonnes kg CO2) 2025 224

8
Figure 7. Annual carbon emission comparison between two scenarios. The up-front embodied carbon emissions are much greater for the renewables approach, but very quickly this carbon pays back due to the operational emissions arising from generator use in the BAU scenario.
Figure 8. Cumulative carbon emissions over a 30 year operational period demonstrating the savings of the renewables solution over BAU.
Cum
ulat
ive
carb
on e
mis
sion
s (to
nnes
CO
2)
Year
0
1000
500
1500
2000
2500
9
running BAU energy system they have a collective annual carbon emissions rate of 47,000 tonnes CO2. If these were to shift to a renewables solution as studied in this paper the emissions rate would be just 3000 tonnes CO2. Over a thirty year service period this equates to a difference / saving of some 1.3 million tonnes CO2.
Concluding points
This pilot study has found the supply of power using a hybrid system based on PV panels brings significant carbon savings compare to the BAU solution of burning fossil fuel derived diesel. On a UNDP-GF programme level and over many years the outline estimate indicates that this would aggregate to a huge saving in programme carbon emissions taking account of embodied, operational and maintenance lead emission sources. Within this context it is recommended that the following further steps are taken:
- Look more closely at how UNDP-GF programmes are supporting health clinic power generation infrastructure regarding its design, procurement and operation (i.e. including fuel purchasing as well) and how UNDP-GF can act to change practice to lower carbon renewable solutions.
- Determine an economic cost benefit understanding of proposed renewable low carbon energy systems in comparison with BAU (i.e. subject to further study). Our experienced based judgement would set
payback at approximately 4 years which is a little longer than the carbon payback (determined as 2 years in this study) but still beneficial.
- Obtain metered load data in order to further analyse the power requirements of different health clinic types improving the accuracy of this pilot study but also looking at other clinic designs and the opportunities they provide.
- Investigate the current policy in Zimbabwe related to the implementation of renewable energy programmes and act where there is synergy between UNDP-GF and the Government to facilitate the deployment of renewable low carbon systems in clinics8,9,10.
- Seek input from UNDP Environment and Energy programme to explore mobilising and expanding other financing options for market transformation to catalyse public and private finance11. Explore options for scaling-up energy delivery, through field-proven pilot projects and new operational practice within UNDP-GF.
8Implementation of renewable energy technologies – opportunities and barriers: Summary of countries studies, UNEP, 20029Kaseke, N., The cost of power outages in Zimbabwe’s mining sector, The African Executive, 2010 10Mapako, M., The links between energy and development: Observations from the rural electrification programme in Zimbabwe, UNEP/Riso development and energy in Africa regional workshop, Arusha, 200711Standardized Baseline Assessment for Rural Off-Grid-Electrification in Sub-Saharan Africa, UNDP, A standardization tool to streamline and simplify the CDM project cycle, UNDP, 2013
UN
MIL
©
For further information please contact:
Dr. Christoph Hamelmann Regional Practice Leader HIV, Health and Development
UNDP Regional Centre, Europe and the CIS
Dr. Kristian Steele Senior Analyst
Advanced Technology & Research Arup
DisclaimerThe content, analysis, opinions and policy recommendations contained in this publication do not necessarily reflect the views of the United Nations Development Programme