of markets and middlemen: the role of brokers …ageconsearch.umn.edu/bitstream/99871/2/of...
TRANSCRIPT

MSSD DISCUSSION PAPER NO. 39
Markets and Structural Studies Division
International Food Policy Research Institute 2033 K St., N.W.
Washington, D.C. 20006 U.S.A. http://www.cgiar.org/ifpri
November 1999
Contact: Diana Flores Tel: 202/862-5655 or Fax: 202/467-4439
OF MARKETS AND MIDDLEMEN:
THE ROLE OF BROKERS IN ETHIOPIA
by
Eleni Z. Gabre-Madhin
i
CONTENTS
CONTENTS ......................................................................................................... i
ACKNOWLEDGEMENTS ...................................................................................iii
ABSTRACT........................................................................................................ iv
1. INTRODUCTION............................................................................................1
HISTORICAL AND COMPARATIVE INSTITUTIONAL
PERSPECTIVES ............................................................................................
2
2. DATA AND SURVEY METHODS ..................................................................7
THE STUDY AREAS...........................................................................7
THE SURVEY .....................................................................................8
3. THE FUNCTIONS OF THE DELALA .............................................................9
4. THE INCIDENCE OF BROKERAGE USE ...................................................14
THE USE OF BROKERAGE BY MARKET AND TRANSACTION TYPE......................................................................14
SOURCES OF COMMITMENT FAILURE IN LONG-DISTANCE TRADE ...............................................................17
THE ROLE OF BROKERS IN ALLEVIATING COMMITMENT FAILURE .................................................................19
ii
6. AGENCY RELATIONS BETWEEN TRADERS AND BROKERS.................22
TRADERS’ DEPENDENCE ON BROKERS .....................................22
ETHNICITY IN TRADER-BROKER RELATIONS .............................23
TRANSPARENCE OF TRADE-BROKER RELATIONS....................24
CONFLICT IN TRADER-BROKER RELATIONS ..............................27
MECHANISMS TO LIMIT CHEATING BY BROKERS......................28
7. CONCLUSIONS...........................................................................................34
8. REFERENCES.............................................................................................48
TABLES
Table 1--Rationale for Choice of Broker’s Services ..........................................40
Table 2--Profile of Brokers and Traders............................................................41
Table 3--Price Discovery Role of Brokers .........................................................38
Table 4--Activities of Brokers ............................................................................37
Table 5--Contractual Choices of All Traders .....................................................39
Table 6--Traders’ Relations with Brokers ..........................................................43
FIGURES
Figure 1--Production Zones and Road Network in Ethiopia ..............................46
Figure 2--Contractual Choices by Type of Market and Type of Transaction .....47

iii
ACKNOWLEDGEMENTS
I am most grateful to the traders and brokers who participated in this study. I am
indebted to Marcel Fafchamps, Jeffrey Williams, Alain de Janvry, Bruce
Johnston, John Gibson, and M.Shahe Emran for helpful comments and Million
Tafesse for able survey supervision. Financial support from the Rockefeller
Foundation and the collaboration of the Institute for Development Research and
the Department of Economics at Addis Ababa University is gratefully
acknowledged.

iv
ABSTRACT Using survey data on traders and brokers in the Ethiopian foodgrain market,
this paper reveals that the brokerage institution is critical to market
performance in that it enables traders to circumvent the commitment problem
of long-distance trade with unknown partners. In the absence of grain
standardization, public information, and legal contract enforcement, brokers
act as inspectors and guarantors of each transaction. The paper analyzes the
sources of commitment failure, the role and functions of brokers and the
extent of brokerage use by brokers and argues that agency relations are not
based on ethnicity, depend on effective reputation rather than trust, and are
structured in an incentive-compatible manner.

1
1. INTRODUCTION
The effective functioning of foodgrain markets is vital to economic growth and to
national food security. However, following Polanyi (1957), it is widely recognized
that market transactions, particularly in developing countries, are frequently
embedded in long-term, personalized, relationships (Granovetter 1985; Plattner
1989; Harriss-White 1993). At the same time, North and Thomas (1973) have
argued strongly that the evolution from personalized exchange to impersonal or
anonymous exchange, supported by legal systems that enforce contracts, is
central to the process of growth and development. In the absence of formalized
market institutions that deter dishonest behavior, such as credit bureaus, trade
inspection services, and commercial tribunals, what institutions arise that
promote trade among unknown parties?
This paper analyzes the features and structure of the institution of grain brokers
in the Ethiopian grain market. Using primary data collected in a survey of 169
Ethiopian traders and brokers in 12 markets, this paper has two objectives. First,
the paper seeks to demonstrate that brokers, operating as intermediaries or
commission agents in the exchange of grain between wholesalers, enable these
wholesalers to circumvent the commitment failure problem that is intrinsic to
2
long-distance trade with unknown partners in a market with weak information and
limited contract enforcement. Second, the paper addresses the agency relations
prevailing between wholesalers (traders) and brokers and demonstrates that the
brokerage institution is sustained by underlying incentive-compatible norms that
limit conflict between traders and brokers.
HISTORICAL AND COMPARATIVE INSTITUTIONAL PERSPECTIVES
Historical institutional analysis of pre-modern trade in medieval Europe by
Milgrom et al. (1990) shows that an institution, known as the Law Merchant in
12th and 13th century Champagne fairs, enabled impersonal exchange to occur.
The Law Merchant enabled trade through a reputation system that stored
information about traders’ past behavior and sanctioned violators of the
commercial code.
Similarly, Greif (1993) views the Maghribi traders’ coalition in the 11th century as
a means of overcoming the commitment problem intrinsic to long distance trade.
Clay (1993) shows that coalitions of long-distance traders in 19th century
Mexican California promoted honest exchange through information sharing and
punishing of cheaters. In contrast, Platteau (1994a, 1994b) argues that
decentralized arrangements based on reputation are not sufficient to ensure
honest behavior and that private and public-order institutions are necessary to
create the social conditions for markets to operate.

3
Fafchamps (1996a) demonstrates theoretically that decentralized markets can
spontaneously emerge in the presence of commitment failure, despite the
absence of formal courts, if agents are sufficiently heterogeneous. However,
economic efficiency is not fully realized as exchange is not anonymous and is
based on mutual trust and information sharing. Kranton (1996) shows that less
efficient personalized exchange relations, such as the reciprocal exchange of
goods and services, can persist even when impersonal exchange is possible if
the size of the personalized market is initially large, goods are homogenous, and
individuals are interconnected in networks.
COMMITMENT FAILURE IN THE ETHIOPIAN GRAIN MARKET
In the Ethiopian grain market, the price of grain is not publicly known, grain is
highly differentiated with no formal standardization and classification, and there
are very limited legal means to enforce contracts (Dadi et al. 1992). These
various constraints cause traders to be relatively easily cheated with regard to
the appropriate market price, the quality and quantity of the delivered grain, or
other contractual terms such as the timing of delivery, grain spoilage or loss
during transport, inter alia. This commitment problem severely inhibits traders

4
from placing orders with other traders in distant markets or, in general, from
trading with unknown merchants, even if they physically meet. Traders
circumvent this problem through engaging the services of an established broker,
who serves as an intermediary between partners who do not have a previous
relationship and may never meet.
THE FUNCTION OF ETHIOPIAN GRAIN BROKERS
Brokers are agents, operating on a commission basis, who only transact on
behalf of a principal. They are located permanently in the central market of
Addis Ababa and are able to obtain market information relatively easily. There
are approximately 40 established brokers in the ehil berenda, the country’s
central market in Addis Ababa, relative to a total of roughly 2500 licensed grain
wholesalers in the entire country (Lirenso, 1993). Each broker has a clientele of
regional traders, with whom he has cultivated a long-term relationship that may
span generations.
Ethiopian grain brokers, known as delala, function in much the same way as
commission agents or brokers in highly sophisticated market exchanges around
the world. The main function of brokers in the Ethiopian central market is to
facilitate market exchange through matching buyers and sellers who come from
markets located in outlying regions. Secondly, brokers provide a mechanism for
obtaining a market price at which goods clear the market, a function known as
5
price discovery on commodity exchanges.1 In the Ethiopian grain market,
brokers set a daily spot price for each type and origin of grain (30-40 different
prices) through an implicit bidding process. Thus, each broker makes a rapid
evaluation of the day’s supply and demand, fixes a price, then adjusts it
according to what other brokers have fixed, in a tâtonnement process which
results in a single market price. The Ethiopian price discovery process closely
resembles what is known as Ring trading in the London metals market, in which
brokers determine the price of each metal within a pre-set time period through
explicitly bidding on price (Gibson-Jarvie 1993).2
BROKERS IN OTHER DEVELOPING COUNTRIES
Brokerage in foodgrain markets is also documented elsewhere across Africa.
N.W. Thomas (1908) reports historical evidence of brokers throughout northeast,
and to a lesser extent central and western, Africa. Historically, brokers appear to
have played a major role in the food trade of the western Sudan and are linked
to the presence of Hausa traders (Cohen 1969; Meillassoux 1971; Jones 1972).
Gilbert (1969) finds evidence of brokers in nearly all studied food markets in
1 See Commodity Trading Manual, Chicago Board of Trade, 1989. 2 Other examples of a similar system are found in the London bullion market which informally determines the London “Gold Fix,” a daily gold price set by brokers.
6
northern Nigeria, where brokers, known as dillali, are generally of the dominant
ethnic group. Hill (1966) documents the activities of “landlord-brokers” in food
markets in the Kumasi market of Ghana, similar to the role of logeurs in Mali
(Amselle 1969).
Elsewhere, Lele (1971) describes the role of Indian commission agents in the
foodgrain market, known as adatya in Mahareshtra or dalal in Hindustani, who
operate in a manner closely resembling that of Ethiopian brokers. Scott (1985)
documents the existence of commission agents in the Cañete Valley of Peru,
who facilitate exchange between potato producers in the Valley and wholesalers
in Lima.
Thus, the same word, derived from Arabic, is used to describe brokers in
Ethiopia (delala), Nigeria (dillali) and India (dalal), possibly revealing that the
practice of brokerage may originate in Muslim commercial practices. Pankhurst
(1961) documents reports by Marco Polo of “merchants of all nations” trading in
12th century Ethiopia, while Alvarez (1881) describes the influence of foreign
traders including “Moors, from Giada (Jeddah), Morocco, Fez, Tunis, Turks,
Greeks, Moors from India, Ormuz, and Cairo” actively trading in Ethiopia in the
13th century.3 Jackson (1978) also notes the existence of Muslim-dominated
trade routes transversing pre-modern Ethiopia.
3 Pankhurst, 1961, p. 307.
7
2. DATA AND SURVEY METHODS THE STUDY AREAS An extensive survey was carried out in 1996 by the author in seven regions of
Ethiopia. These regions comprised 3 grain surplus areas— Wollega, Arsi, and
Gojjam, and 3 grain deficit areas –Wollo, Tigray, and Hararghe— in addition to
the central urban market of Addis Ababa. Wollega is a major maize-producing
region, Arsi is a major wheat-producing region, and Gojjam is a major teff -
producing region (Figure 1).
A total of 12 markets were selected on the basis of their importance as centers
of wholesale grain trade and as transit points for grain flows across the country.
Surveyed markets are Nekempte and Jaji in the Wollega region, Assela and
Sagure in the Arsi region, Bahir Dar and Bure in the Gojjam region, Dessie and
Kombolcha in the Wollo region, Mekele in the Tigray region, Dire Dawa and
Harar in the Hararghe region, and Addis Ababa. The grains included in the study
are principally teff (an indigenous grain uniquely unique to Ethiopia), wheat, and
maize, although transaction data were also collected for barley, millet, and
sorghum.
8
THE SURVEY Panel data were obtained in two rounds of trader and broker surveys carried out
in May-July 1996 and October-December 1996. In each market, a random
selection of existing traders in the market was taken, given the unavailability of a
reliable census of traders from official sources. The total sample includes 169
traders, comprised of 152 wholesale traders in 12 markets and 17 grain brokers
in the Addis Ababa market.
Data were collected in the first round on traders’ choices of trading
arrangements, transfer costs, relations with brokers, market channels, traders’
resources and assets, and demographic variables. A separate broker survey
collected data on brokers’ assets, client base, price formation, and transactions.
In the second round of the trader survey, in addition to data on traders’
contractual choices and transfer costs, data were collected on traders’
transaction costs of search, liquidity, and social capital. The second round of
the broker survey collected data on price differentiation and quality parameters,
social capital, and demographic variables. Although the government ban on
private trade was lifted in 1990, traders remained suspicious of interviewers and
reluctant to provide cost and flow information. Given the sensitivity of these data
and their qualitative nature, the author’s presence at nearly all interviews
ensured a high level of quality of responses.
9
3. THE FUNCTIONS OF THE DELALA
Grain brokers operate from permanent market stalls in the central grain market,
the ehil berenda, in Addis Ababa. On average, interviewed brokers handled
transactions for clients in about 6 markets around the country, with an average of
60 clients per broker. Field interviews revealed that the amount of grain flowing
through brokerage channels ranged from 1411 quintals per week (1.4 tons) in a
low-volume month such as April to a high of 2789 quintals (2.8 tons) per week in
a busy month such as January or February (Table 1). Roughly extrapolating
these figures for the estimated number of 50 established brokers operating in the
market results in 1,102 tons of grain handled weekly by Addis Ababa brokers, or
52,917 tons over the marketing year.4
Among the clients handled by each broker, the largest share were distant sellers,
with an average of 38 seller clients per broker. In the case of distant sellers and
distant buyers, brokers may handle orders exclusively by telephone. Interviewed
brokers indicated that they could work solely by telephone with 77 percent of
their seller clients and 20 percent of their buyer clients (Table 4). Thus, distant
buyers are more likely to come themselves to the market. This may be due to
4 Lirenso (1993) estimates for 1992 that 342 regional wholesalers from 64 market towns shipped 1,354 tons weekly to 50 brokers.

10
the higher risk of commitment failure faced by buyers, who are more vulnerable
to cheating on the quality or price of the grain.
For each transaction, the broker’s functions can be broken down into six distinct
services. Initially, prior to receiving a shipment of grain, the broker provides
market information and business advice to a wholesaler client, who is interested
in either selling or buying. Traders in distant markets will send a shipment of
grain after consulting with their broker about prevailing market conditions and
prices.
Once the grain is shipped, a second service provided by the broker is the
receiving of grain in a given physical space. Even if the grain is not off-loaded
from the transport vehicle, upon arrival in Addis Ababa, the truck is parked in
front of the broker’s stall. The parking space in front of the broker’s stall
represents the point of entry into the next day’s trading, since the shipment of
grain must be physically present and visible to incoming buyers.
Third, the broker fulfills the role of inspection and grading of the incoming grain.
At the point of receiving the grain, in the case of a sales order, the broker
inspects the sacks of grain on the truck. In order to ascertain the quality of the
grain, the broker uses a pointed tubular device, known as memermeria, to take
samples randomly from different sacks within a shipment. The broker’s
11
experience in gauging grain qualities and his knowledge of current market
conditions enables him to determine what the market-clearing price of each
quality and type of grain is.
Fourth, brokers set the market price for each of the types of grain they receive.
According to interviewed brokers, brokers each set an average of 7.30 prices
daily. The time required for brokers to set prices ranges between 15 and 30
minutes, or about 6 minutes per price (Table 2). The price discovery function of
brokers involves an evaluation of the day’s supply and demand conditions prior
to the start of the market day at 6 am. Using the previous day’s closing price as
a basis, brokers “fix” a market price for each quality of grain they have received
from regional clients. They each informally conduct a survey of prices
simultaneously announced by other brokers that handle the same origins and
types of grain, after which they may adjust the price accordingly. Within a few
minutes, this process results in a single daily spot price for each grain, by type,
regional origin, and quality. Field observations revealed that there were roughly
40 to 50 different prices of grain daily, varying by type of grain, region of origin,
variety, and quality, set by brokers in the Addis Ababa market.
Brokers indicated that the daily spot price might hold for the entire period of a
day’s trading, between 6 and 9 am. Typically, however, the price changes 1 to 2
times in the trading period, as brokers try to clear remaining supplies of grain.
12
Thus, two-thirds of the sampled brokers revealed that the market price changes
two or three times daily.
Fifth, brokers search for buyers or sellers of grain on behalf of their clients. The
search process involves extensively discussing with other brokers, touring the
marketplace by foot talking to buyers, and having assistants standing on top of
trucks shouting out the available types and qualities of grain.
At the point of sale or purchase, a sixth service provided by brokers is arranging
the handling of the grain, for which each broker has a staff of laborers who off-
load, re-sack, and weigh grain for a fixed fee. Brokers handle transport logistics
either through paying the transport fees of the transporter out of the sales
proceeds or arranging for transport for a buyer.
When a sale is completed on behalf of a client, brokers deduct their commission
and remit the funds to the regional seller. If the grain has not been sold and the
seller is short of funds, brokers may extend sales advance to valued clients.
Brokers indicated that they provide this service to roughly 40 percent of their
clientele (Table 1). Unsold grain is off-loaded to the broker’s warehouse where it
is stored for a monthly rental fee. Brokers reported an average capacity of 938
quintals (9.4 tons), of which close to 200 quintals (20 percent) , were of client’s
unsold stock (Table 1).
13
Depending on their relationship with their client, brokers may provide buyer credit
up to 30 days. Brokers consider offering this service to approximately one-third
of all their clients (Table 1).
14
4. THE INCIDENCE OF BROKERAGE USE In addition to using brokers, traders can also use an agent, a salaried employee
who is located in a different market and acts as an agent on their behalf or
exchange directly themselves with a buyer or a seller. Each of these three
arrangements can occur either in the same market in which the trader is located
or in an outside market, resulting in six different choices for exchange.
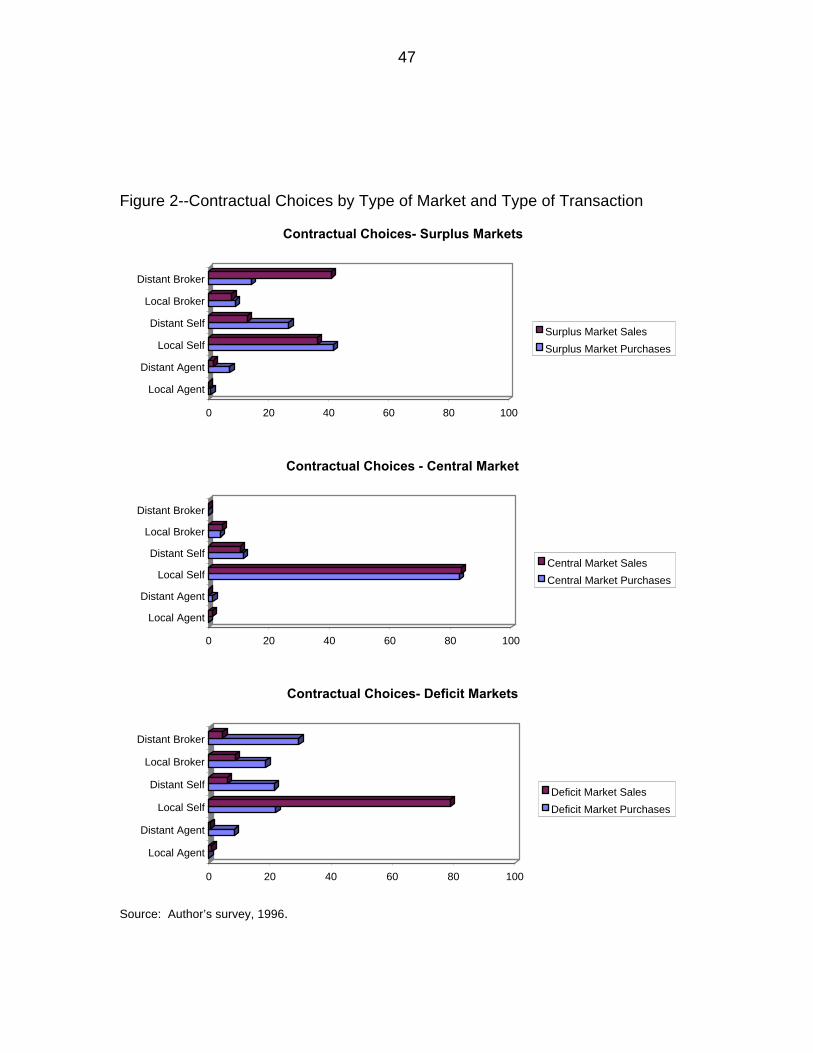
The choice of brokerage by traders varies according to the type (sale versus
purchase) of transaction as well as the location (surplus, deficit, or central zone)
of the transaction. Thus, traders in markets located in surplus regions (42
percent of sample respondents) exhibit different choices than traders in deficit
regions (34 percent of sample) and traders in the central market (24 percent of
sample).
THE USE OF BROKERAGE BY MARKET AND TRANSACTION TYPE Traders in surplus regions reported use of local brokers for 7.5 percent of all
transactions and of distant brokers for 15.4 percent of all purchase transactions.
In contrast, they used local brokers for 9.4 percent of all sales and distant
brokers for 47.1 percent of all sales transactions. The low incidence of

15
brokerage for purchases is due to purchases directly from farmers, while the
higher share of distant brokerage for sales is due to their sales of grain in the
central market of Addis Ababa (Figure 2).5
In the case of traders located in deficit zones, traders indicated using local
brokers for 17.8 percent of all purchases and distant brokers for 31.6 percent of
all purchases. The use of brokerage for sales by traders in deficit markets was
significantly lower, 7.1 percent of local brokers and 3.1 percent of distant
brokers. This pattern is due to the fact that traders sold grain directly to local
retailers as well as consumers.
Finally, due to their location, central market traders only use local brokerage, with
10.8 percent for local purchases and 7.4 percent for local sales, and no distant
brokerage at all, since central market traders tend to make transactions only
locally. Wholesalers in the central market can buy directly from regional sellers
who bring grain to the central market and can sell directly to local retailers,
consumers, and millers.
5 The data used are self-reported figures provided by traders, recalling transactions over a six-month horizon. Given the low frequency of transactions, the recall period does not greatly increase error. Two observations of contractual choice data were gathered from two survey rounds. The results of the two rounds have been pooled, which provides a better estimation of the true values. Correlations between rounds are significant for data on the use of brokers and of self-search.

16
For the sample of traders as a whole, without distinguishing by type of
transaction, brokerage is used in roughly one-quarter of all transactions.
Traders search on their own, either locally or in distant markets, in 72 percent of
transactions (Table 3). These results are revealing in that, while the majority of
traders (85 percent) indicate using brokers regularly in their transactions, the
actual incidence of brokerage is low relative to direct trade. The co-existence of
direct exchange and brokerage appears linked to the use of brokers for
transactions in distant markets, sales for surplus market sellers and purchases
for deficit market buyers.
17
5. COMMITMENT FAILURE AND THE ROLE OF BROKERS
The geographic dispersion of supply and demand centers of grain in Ethiopia
necessitates transfers of grain over long distances. However, relations among
traders located in different regions are characterized by a commitment problem.
The commitment problem arises because traders have limited information about
market conditions in distant markets and because neither the grain itself, nor the
sacks in which it is transported, nor the contractual terms under which it
exchanges hands are standardized across all parties in the market.
SOURCES OF COMMITMENT FAILURE IN LONG-DISTANCE TRADE
Interviewed traders reported that partners can, and do, cheat by delivering a
lower quality of grain than was discussed at the time of sale. Since there are no
official inspections of grain, a trader who contacts a partner by telephone is
forced to take the partner’s word at face value. Furthermore, grain quality can
deteriorate in the course of storage or transport to the buyer.
The relevant parameters of quality for Ethiopian grain are color, taste,
appearance of kernels, moisture content, impurity, breakage of kernels, and
18
baking qualities.6 These parameters, qualitative in nature, are open to
considerably different interpretations. Traders can cheat by misquoting or
omitting information on any of the above parameters at the time of oral
agreement of the grain price. Furthermore, long-distance orders are placed by
telephone with no legal contract, traders can cheat by denying contract terms.
Other opportunities to cheat are presented by the lack of standardized sacks.
Traders indicate that sacks, re-used numerous times, vary dramatically in terms
of the quantity they carry and their quality. Traders can cheat partners by having
sacks that hold less than the 100 kilograms that they are presumed to hold (if the
cheater is a seller). In small rural markets where there are no scales, traders are
reported to cheat farmers routinely by buying grain in sacks that hold
considerably more than 100 kilograms. Moreover, the practice of re-using sacks
also creates room for opportunistic behavior. Traders report that buying a load
of grain in the sacks of the selling merchant is undesirable because the seller will
provide the oldest possible sacks, which are likely to tear and cause grain loss or
damage over the course of transport.
The commitment problem is also a function of the point at which ownership of
grain is transferred between partners. When a seller retains ownership, and
6 Brokers revealed in interviews that they use these parameters to determine the appropriate price.

19
concomitant risk, for a shipment of grain until it reaches the final destination, the
trader is highly vulnerable to reneging on the buyer’s part. Similarly, if the buyer
takes ownership of a load of grain at the seller’s venue, the buyer is highly
vulnerable to fraudulent representation of the grain or damage during transport.
In the event that cheating occurs, recourse to a legal third party is very limited in
Ethiopia. In part, the lack of legal recourse is due to the time-consuming nature
and inaccessibility of formal courts. Moreover, it is not customary for business
partners to engage in legal suits, also true elsewhere in Africa (Berry, 1993).
According to interviewed traders, a trader who has been cheated by a partner
must return to the market in order to seek out the wrongdoer and engage in a
public confrontation. When the partner is unfound or a settlement cannot be
reached, the trader bears the loss.
THE ROLE OF BROKERS IN ALLEVIATING COMMITMENT FAILURE This commitment problem causes traders to be extremely reluctant to trade with
partners whom they don’t know. Without an institution to promote trade,
exchange between anonymous, long-distance, partners would rarely occur
because traders would anticipate cheating by their partners. Yet there is ample
evidence that grain is traded considerable distances around Ethiopia and that
cheating is the exception, rather than the norm.

20
How does brokerage resolve the commitment problem? As neutral
intermediaries, brokers are uniquely able to gather information from a large
number of traders. The majority of interviewed traders asserted that the broker’s
access to traders and the broker’s superior market information were the primary
reasons for using a broker. Close to 40 percent of traders cite brokers’ access to
more contacts as most important in their choice while 25 percent list the broker’s
access to information as most important in their choice (Table 4). Conversely,
when traders feel they know the market or have sufficiently trustworthy partners,
they don’t use brokers. More than half of interviewed brokers (53 percent) noted
that knowing the market well enough justified not using a broker while 26 percent
indicated that a broker was unnecessary when they had well-known trading
partners.
Brokers generally do not trade on their own account, with less than 10 percent of
transactions on their own account (Table 5). While they do not bear market price
risk, they are held accountable in the event of a breach of contract. Brokers
enumerate their role as guarantors or witnesses of each transaction as important
among the services they provide. Through their intermediation, they ensure that
imnet, or trust, is present in the long-distance transaction.
Location is a key aspect of the role played by brokers. Because brokers are
permanently located in the central market, they are easily identifiable to all
21
traders who come in and out of the market. Thus, they are natural repositories
of information, regarding market flows, the behavior of market participants, and
the outcomes of past transactions. Their permanent presence in the central
market ensures the continuity of a reputation transmission mechanism. In
addition, their continuous presence implies that, in the event that a falling out
between partners occurs during a long-distance trade, the broker can be
contacted to mediate and resolve the dispute.
Despite the lack of formal barriers to becoming a broker, the number of brokers
is relatively small. Interviews with brokers revealed that brokers view the imnet
(trust) they have acquired from their network of traders as a critical asset in their
business. Thus 60 percent of brokers had a parent in grain trade, and 40
percent had a parent in grain brokerage (Table 5). Grain brokerage businesses
pass from generation to generation, transferring the imnet gradually from the
father to the son, who acquires the father’s clients. The high value placed on the
broker’s work is similar to the importance of xinyong, or trust, in traditional
Chinese trading practices in southeast Asia, which is also transferred across
generations (Menkoff 1994).7
7 The existence of trust is the most frequent explanation given by Chinese traders for their success in business. The necessity “to trust trust” is among the safeguards against the possible breach of business commitments (see Menkoff in Dieter-Evers and Schrader, 1994; Fukuyama, 1995, Tadelis, 1997).
22
6. AGENCY RELATIONS BETWEEN TRADERS AND BROKERS
While brokers enable traders to circumvent the commitment problem with other
traders, what prevents brokers from abusing their trust (imnet) with their clients?
TRADERS’ DEPENDENCE ON BROKERS Several key features of the relationship between brokers and traders emerge
from the data. First, a large proportion of Ethiopian grain traders (85 percent of
sample) use brokers regularly. Most traders have long-term working relations
with their brokers, with a sample average of 6 years. Interviewed brokers report
that 87 percent of their clients were long-term (see Table 6). 8
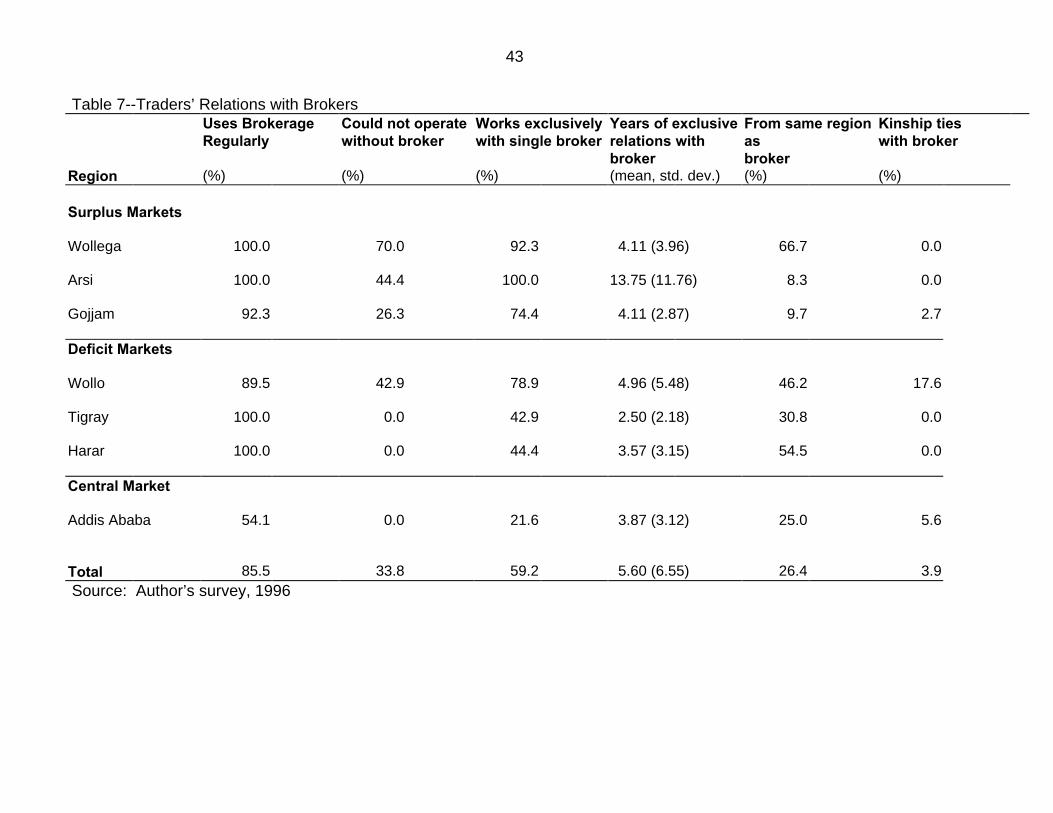
The reliance on brokers among regional traders is far greater than that of traders
located in the central market, where only 54 percent report regular use of
brokerage (Table 7). The level of dependence on brokerage, as measured by
whether traders perceived it was possible to carry out long-distance trade without
brokers, varied across regions. A greater share of traders in surplus markets,
ranging from 26 percent to 70 percent of traders, felt they could not operate in
distant markets without a broker while all traders in the deficit regions (with the
exception of Wollo) and the central market considered it possible to trade without
8 Similarly, Fafchamps (1996b) finds an average of 4.1 years of business relations among firms in Ghana.
23
brokers. In general, regional buyers are more likely to travel the distance to the
central market and purchase the grain themselves, while regional sellers are
more likely to closely work with a broker, using telephone transactions. This
may have to do with the opportunity cost of time faced by regional sellers of
grain, who are busy purchasing grain from smaller rural markets, and whose
business would suffer if they were obliged to physically travel to the central
market for each long-distance sale.
Another aspect of the dependence of traders on brokers was whether traders
worked exclusively with a single broker or whether they worked with a number of
brokers. Traders in surplus regions, as well as in Wollo, appear to follow the
practice of working with a single broker, with 74 percent to 100 percent of traders
in these markets following this practice (Table 7). In contrast, a smaller share
(20 percent - 40 percent) of traders in the deficit regions and the central market
followed this practice. Thus, while the usage of brokers is equally widespread
among regional buyers and sellers, long-distance grain sellers appear to be
markedly more dependent on brokers than long-distance grain buyers.
ETHNICITY IN TRADER-BROKER RELATIONS While the proportion of traders with the same ethnic origin as their broker ranged
between regions from 8 percent to 54 percent, overall, only 26 percent of traders
were from the same region as their brokers. As further confirmation, only 4
percent of traders revealed that they had “kinship” ties with their brokers (Table
24
7). Interviewed brokers reported that, on average, only 16 percent of distant
buyer clients and 18 percent of distant seller clients were from the same region.
The absence of ethnicity as a basis of agency relations is a striking departure
from other studies of trust-based trading networks, in which ethnicity plays a
major role (Fafchamps 1992,1996; Greif 1993; Dieter-Evers 1994).
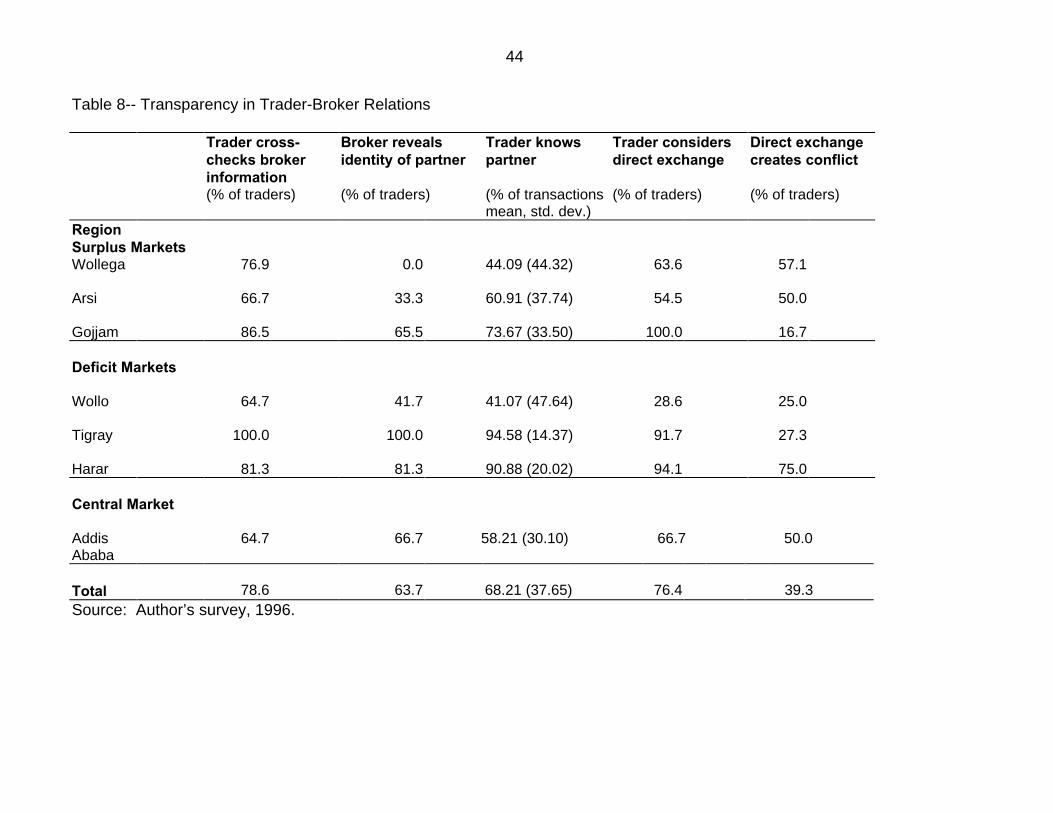
TRANSPARENCE OF TRADE-BROKER RELATIONS The absence of a public market information system and the physical distance
between regional traders and central market brokers in Ethiopia result in high
monitoring costs for traders to monitor brokers’ actions. Traders indicate that
they are always suspicious of possible cheating by brokers. Traders suspect
that brokers occasionally “skim” additional profits off the actual price that they
obtain in the market as opposed to the price that they convey to the trader. This
is called ferq and is a source of conflict between traders and brokers. In all
regions, the majority of traders indicated that they regularly cross-check
information provided by their broker. The proportion of traders who carry out
cross-checks ranges from 65 percent to 100 percent, and was 79 percent of the
sample as a whole (Table 8).
The extent to which brokers are open about the trading partner (buyer or seller)
with whom their client has exchanged grain is an indication of the transparence
of agency relations. Brokers who regularly reveal the identity of the partner or
25
who introduce the trading parties may be less likely to behave opportunistically.
At the same time, traders may use partner disclosure to bypass using the broker
in future trading.
Wide discrepancy exists in the share of traders who reported regularly being
informed of their partners’ identities, ranging from 0 percent in Wollega to 100
percent in Tigray, while overall 64 percent of traders reported being informed
(Table 8). With the exception of Wollo, more traders in deficit regions were
provided with this information, probably due to the greater number of regional
buyers who went themselves to the central market to conduct purchases.
Traders reported knowing their partner, on average, for 68 percent of all
transactions. However, this also varied by region, with traders in deficit regions
having a larger share of transactions in which they knew their partner. From the
brokers’ perspective, interviewed brokers estimated that their clients meet their
trading partners for 54 percent of the transactions they handle (see Table 6).
Addressing the question whether traders attempt to bypass their brokers when
they know who their trading partner is, traders and brokers provided widely
divergent responses. Only 21 percent of brokers considered that direct
exchange is likely in the event that trading partners meet (Table 6). They stated
that direct exchange was unlikely primarily because their clients were unwilling to
risk transacting without a witness. In addition, brokers stated that trader would
not engage in future direct exchange with a partner found by a broker since this

26
would compromise their relations and restrict the trader’s pool of possible
partners to a single partner. This implies that brokers would consider ending the
working relationship in the event that a client trader attempted direct exchange, if
the broker found out.
In contrast, a large share of traders (76 percent) indicated that they would
consider direct exchange with a partner whom they had met through their broker.
In the event that they were to engage in direct contact, 65 percent of traders
indicated that they were willing to engage in transactions using only telephone
contact, without personally meeting the new partner. On the other hand, the
large majority, 83 percent, indicated that they would not be willing to extend
supplier credit to the new partner. In response to how many repeated
exchanges were necessary in order to create a trusting relationship with a
previously unknown partner, on average, traders required 9-10 transactions with
the same trader in order to establish trust with a partner. The fact that direct
exchange may cause conflict with their broker was confirmed by roughly 40
percent of the sample (Table 8).
Thus, it would appear that there is limited transparence in the agency relations
between traders and brokers, given that not all traders are ever informed of their
trading partners and those that are informed are not informed at all times.
Further, agency relations appear influenced by the implicit threat by brokers that
27
traders who use this information to bypass the broker will be “punished” by losing
their working relations.
CONFLICT IN TRADER-BROKER RELATIONS In previous sections, two sources of conflict between traders and brokers were
noted. Conflict may arise when traders suspect price misinformation by brokers
or when traders attempt to bypass their broker and exchange directly with
partners whom their broker found in a previous transaction.
Among interviewed traders, roughly one-third (34 percent) had experienced
conflict with their broker, with a sample average of 1.5 conflicts in the past
marketing year (Table 9). The number of conflicts varied widely between and
within regions. Comparing the number of conflicts with brokers to the number of
conflicts traders experienced with trading partners, traders experienced less
conflict with their brokers than with the sum of partner conflicts, both using a
broker and not using a broker.
The majority of traders (65 percent of sample) used informal mediation as a
means of resolving conflicts, with the share of traders using this option ranging
from 40 percent to 100 percent. With the exception of a single region, Hararghe,
no traders employed legal recourse to resolve conflicts with their brokers (Table
9). Thus, agency relations are characterized by relatively little conflict, the

28
absence of legal recourse, and the prevalence of informal mediation by
members of the trading community. The widespread use of informal mediation,
rather than legal recourse, is consistent with the existence of generalized social
norms that govern economic relations (Platteau, 1994b).
MECHANISMS TO LIMIT CHEATING BY BROKERS Without institutional constraints limiting the possibility of opportunistic behavior
by brokers, trader-broker relations would be characterized by a higher incidence
of conflict and would not be self-enforcing. What are the mechanisms for limiting
opportunistic behavior on the part of brokers and reducing conflict?
29
Effective Reputation Mechanism
Agency relations are structured in a manner that provides a means for
sanctioning brokers’ actions. Field interviews revealed that, not only do a
significant share of traders engage in exclusive relations with a single broker, but
that it is also quite common that most traders in a given regional market tend to
work with the same one or two brokers in the central market.9 On the surface,
this structure may appear to give brokers significant market power vis-à-vis the
individual traders in a market. More importantly, this structure offers a safety net
for individual traders in that information provided by the broker flows freely
among all traders in a given market. This enables a reputation system to work
by the implicit threat that a broker who cheats one client is likely to compromise
relations with all clients in that market and nearby markets in the region.
Evidence that traders actually do carry out sanctions and effectively boycott a
broker was found in the course of field interviews.10
9 Thus, brokers in Addis Ababa are each specialized in handling transactions from a particular set of markets in a region. Brokers who handle grain from the same area have their stalls adjacent to each other, enabling the rapid transmission of price and market information. 10 Many, though not all, traders interviewed in the market town of Nekempte in Wollega region had collectively boycotted a broker located in the central market and had collectively switched to another broker.
30
Brokers’ Incentive Compatibility: The Absence of “Marketmaking”
A second means of limiting opportunistic behavior by brokers lies in the incentive
compatibility of brokers relative to their clients. A potential source of conflict in
agency relations would exist if brokers, trading on their own account, bought and
sold grain from their own clients.11 Field interviews revealed that very few grain
brokers buy or sell clients’ grain on their account, at least overtly, in the interests
of maintaining neutrality vis-à-vis their client traders.12 Thus, the grain market
structure does not have a role for “marketmakers,” who openly purchase
unmatched orders at a discount (the bid price) and sell unmatched orders at a
premium (the ask price), in order to create a market for those willing to pay the
price of immediacy (Demsetz 1968).
If a partner is not found for a client, the majority of brokers stated that they would
store their clients’ grain in their warehouses, either at a charge (71 percent of
brokers) or without charge (14 percent), or in another warehouse (7 percent). A
small share of brokers (7 percent) indicated that they would buy or sell their
clients’ grain themselves, although this would be at the market price (see Table
11 A number of commodity exchanges, such as the Chicago Board of Trade, prohibit house trading by brokers, in order to limit “frontrunning,” when brokers trade on their own accounts before placing clients’ orders of which they have a priori information. 12 While brokers stated that they do not trade directly with their own clients, many are engaged in grain trade. Thus, brokers may conduct undetected “frontrunning”, in which case they would be reluctant to reveal the identity of the matched partner.
31
7).13 Interviewed brokers reiterated that trading on their own accounts was
considered a serious breach of the implicit rules governing agency relations.
Because information on buy and sell orders, on a given trading day, is
incomplete, traders cannot confirm a broker’s information that a partner was
unavailable. Brokers would only be willing to transact at a rate more favorable
than the market, thus causing a strain in their relations with clients. The
implication of the absence of marketmaking is that brokers never assume market
risk and that markets are relatively less liquid.
For their part, traders reported no sales or purchases directly from brokers,
indicating that brokers who do trade with their own clients may be doing so
covertly. Traders insisted that brokers never offer them this option, which would
be greatly preferred since they gain immediacy and transfer market risk to the
broker.
Brokers’ Incentive Compatibility: Fixed and Flat-Rate Commissions
Ethiopian grain brokers are compensated for their services with a fixed
commission that is a flat rate per quantity transacted, rather than a percentage of
the final transaction price. This practice is common to all regions studied in
13 Matching remaining orders at the market price would not be economically rational behavior for a broker, who would incur market risk in the process. This action would only be justified in the interests of favoring a long-term client.
32
Ethiopia and confirmed by 93 percent of sampled brokers (see Table 7). Lirenso
(1993) also noted this payment system in the Ethiopian grain market in 1992.
Field interviews revealed that the flat fee is fixed across brokers and across time,
but varies according to regions.14 Brokers noted that fees were invariant across
time because they represented the brokers’ fixed operating costs. Brokers
attributed regional differences in brokerage fees to “convention,” however, they
may be linked to the fact that certain regions have higher volume of trading than
others. Also, brokerage fees charged to buyers are typically higher than fees to
sellers.15 This may be to the higher level of service provided by buyer’s brokers,
who not only find a match but who also must ascertain the quality of the grain
and inspect the shipment for signs of cheating by the seller.
The practice of fixed brokerage fees has also been noted elsewhere, in rural
Indian foodgrain markets by Lele (1971) and in northern Nigerian grain markets
by Gilbert (1969). Historical records from the late 19th century indicate that
brokerage fees for grain traded on the Chicago Board of Trade were flat fees per
quantity and fixed across time.16 This is also true of other international
14 Brokers charge different fees for grain coming from different regions. The fee is the same for all brokers handling grain from the same region, and changes in the fee are jointly determined by the brokers. 15 Sales brokerage fees range from Birr 1.00 to Birr 1.20, while purchase brokerage fees are Birr 2.00. 16 See the Thirtieth Annual Report of the Trade and Commerce of Chicago, 1887.
33
commodity markets, such as coffee and cocoa. In these markets, both sellers
and buyers pay commission fees, as is the case in the Ethiopian grain market.
In the Ethiopian grain market, a flat brokerage fee is compatible with broker
incentives for several reasons. First, brokers do not usually act as dual agents,
and represent only one of the trading partners (Table 6). Thus, they receive a
commission from only one party in the transaction. In a given transaction, both
the seller’s agent and the buyer’s agent each receive a commission from their
clients.
Second, the service for which brokers are compensated is not price search,
given that there is a spot price that prevails in the market, but rather the search
for buyers or sellers. For this reason, brokers maximize profit across a large
volume of transactions in a short period of time, charging a small transaction fee.
Third, and most importantly in the Ethiopian market, a flat commission limits
cheating by brokers. Since brokers themselves determine the market price in the
price discovery role described above, a percentage fee would bias the price
discovery process and provide brokers with incentives to fix the prices to their
advantage.
34
7. CONCLUSIONS
Enhanced food security and the expansion of the Ethiopian market economy
require the frequent and ready transfer of grain from surplus regions to deficit
regions. The effective functioning of the grain market depends on the ability of
traders to exchange grain anonymously with buyers and sellers in distant
markets, without risk of commitment failure. This paper studied in depth the
types of commitment problems that arise in a market with few formal institutions
to deter opportunistic behavior. Weak public market information, the lack of
grain standardization, the oral nature of contracts, and limited legal enforcement
of contracts are all factors that contribute to the difficulty that traders encounter
in attempting to trade directly with an unknown partner. In order to circumvent
this commitment problem, traders face two alternatives: either to trade in a
personalized fashion with partners whom they know well and with whom they
have a trust-based relationship or to trade with an anonymous partner through
the intermediation of a broker.
Brokers have multiple functions in the grain market. They are primarily engaged
in matching buyers and sellers in what would otherwise be a time-consuming
search process as well as in setting daily spot prices. Because they have the
35
trust of their clients, brokers act as inspectors and witnesses to each transaction
and guarantee that the contract will be enforced. This latter role supports
impersonalized exchange in the Ethiopian grain market.
Brokerage use varies by type of market and type of transaction. Traders in
surplus regions use brokerage more for sales while traders in deficit regions use
brokerage more for purchases. Traders in the central market use brokers
considerably less.
Traders’ dependence on brokerage varies across regions, with more traders in
surplus regions indicating regular use of brokerage. Similarly, traders in surplus
regions tend to work exclusively with a single broker. Relations between traders
and brokers are generally long-term, with repeated interaction. Somewhat
surprisingly, ethnicity does not seem to be a motivating factor in the relations
between traders and brokers.
Despite repeated interaction and loyalty in trader-broker relations, the difficulty of
monitoring brokers’ actions presents moral hazard problems for traders. Brokers
do not regularly provide their clients, particularly in surplus regions, with
information on the identity of the trader with whom they have exchanged grain.
Although agency relations are not fully transparent, there are relatively few
instances of conflict between traders and brokers. Conflict is avoided through

36
established conventions that limit brokers’ opportunistic behavior and that are
incentive-compatible for brokers. These conventions are that brokers tend to be
specialized in a certain region and thus handle a large number of clients from
one market town. This enables traders to exchange information regarding the
broker amongst themselves and maintain a viable reputation mechanism that is
based on collective sanctions of wrongdoing by the broker. Second, brokers’
incentive compatibility is maintained by the norm that brokers generally never
buy or sell on their own account and are remunerated with flat brokerage fees.
Agency relations between brokers and traders are characterized by a system
based on reputation, rather than trust. In contrast to studies of networks or
trader coalitions that are linked through a common ethnic or religious base and
that function on the basis of trust, the structure of Ethiopian brokerage is self-
enforcing through the use of reputation and incentive-compatibility constraints on
brokers’ operations.

37
Table 1--Activities of Brokers
Mean (Standard Deviation) Number of Markets That Broker Contacts
5.80 (2.70)
Total Number of Clients Number of Local Buyer Clients Number of Distant Buyer Clients Number of Local Seller Clients Number of Distant Seller Clients
60.50 (32.27) 11.20 (15.77) 7.44 (5.75) 2.10 (5.38) 38.44 (17.18)
Total Buyer Clients
13.30 (15.36)
Total Seller Clients
46.62 (18.76)
Share of Distant Buyer Clients With Whom Can Work Solely by Telephone
19.63 (37.21)
Share of Distant Seller Clients With Whom Can Work Solely by Telephone
76.77 (35.83)
Share of Buyer Clients To Whom Broker Would Offer Buyer Credit
32.22 (34.58)
Share of Seller Clients To Whom Broker Would Offer Sales Advance
41.15 (43.62)
Storage Capacity (quintalsa) Quantity Currently of Own Stock Quantity Currently of Rental to Clients
928.93 (758.02) 446.25 (853.49) 198.75 (231.40)
Total Number of Employees Full-time salaried Full-time non-salaried Daily wage workers
14.85 (10.33) .85 ( 1.34) 2.54 ( 1.45) 10.93 ( 9.20)
Average Weekly Transactions (quintals) January 1996 February 1996 March 1996 April 1996 May 1996 June 1996
2777.27 (2106.11) 2788.64 (2302.75) 2543.18 (2089.32) 1411.36 (1394.96) 1752.27 (1856.56) 1956.82 (1671.23)
Source: Author’s survey, 1996 a A quintal is equivalent to a 100 kg. sack.

38
Table 2--Price Discovery Role of Brokers
Share of Sample
Existence of Single Daily Market Price
78.6
Frequency of Price Changes Daily 2 - 3 times per day
21.4 64.3
Mean (Standard Deviation)
Time Required to Set Market Prices
(Minutes)
18.77 (11.25)
Number of Prices Set Daily
7.30 (3.47)
Time Required to Set Each Price 6.20 (4.80) Source: Author’s survey, 1996
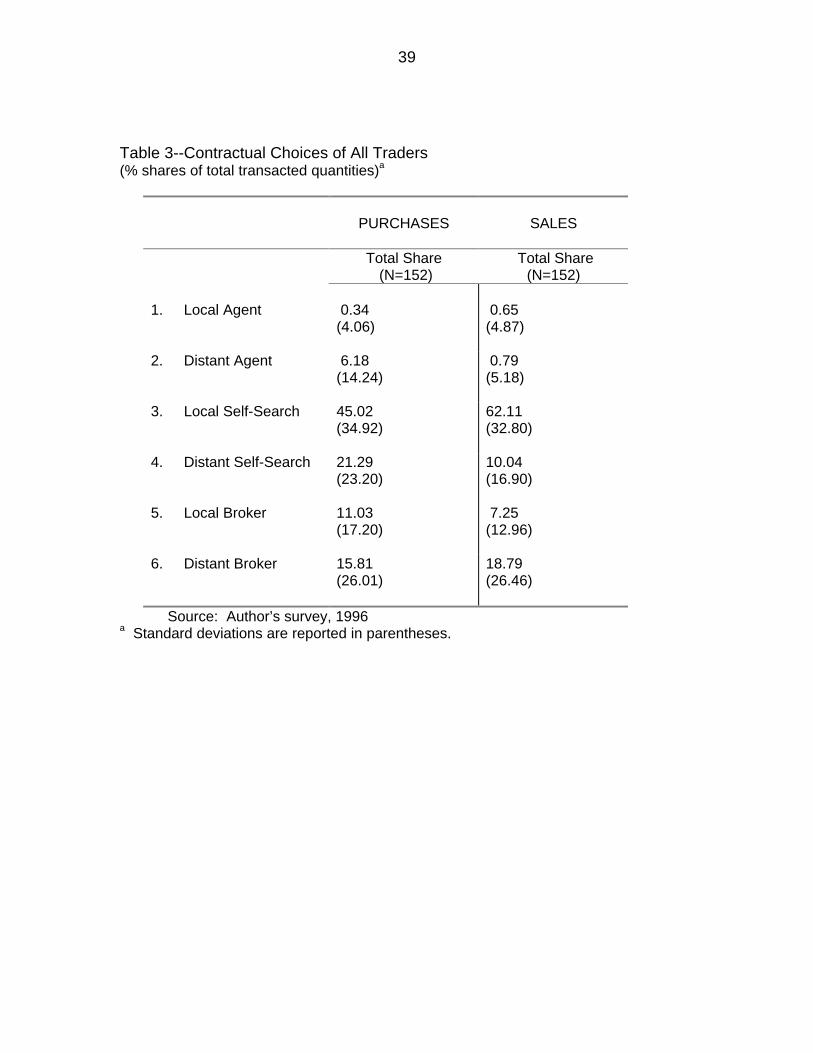
39
Table 3--Contractual Choices of All Traders (% shares of total transacted quantities)a
PURCHASES
SALES
Total Share (N=152)
Total Share (N=152)
1. Local Agent
0.34 (4.06)
0.65 (4.87)
2. Distant Agent 6.18 (14.24)
0.79 (5.18)
3. Local Self-Search 45.02 (34.92)
62.11 (32.80)
4. Distant Self-Search 21.29 (23.20)
10.04 (16.90)
5. Local Broker 11.03 (17.20)
7.25 (12.96)
6. Distant Broker 15.81 (26.01)
18.79 (26.46)
Source: Author’s survey, 1996 a Standard deviations are reported in parentheses.

40
Table 4--Rationale for Choice of Broker’s Services Reasons to Work with Broker:
Count Percentage
Reasons Not to Work with Broker:
Count Percentage
Broker has better access to market information
28 24.8%
I trade with partners whom I know closely
28 25.9%
Broker acts as guarantor
11 9.7%
I know the market well enough
57 52.8%
Broker has more contacts
44 38.9%
Brokers cheat on prices
7 6.5%
Broker identifies good quality
9 8.0%
I want to save commission fees
10 9.3%
I have no choice 12 10.6%
I don’t need a quick transaction
5 4.6%
Broker gives business advice
2 1.8%
Disagreement with broker
1 0.9%
Less costly to work with broker
7 6.2%
Total
113 100%
108 100%
Source: Author’s trader surveys, 1996
41
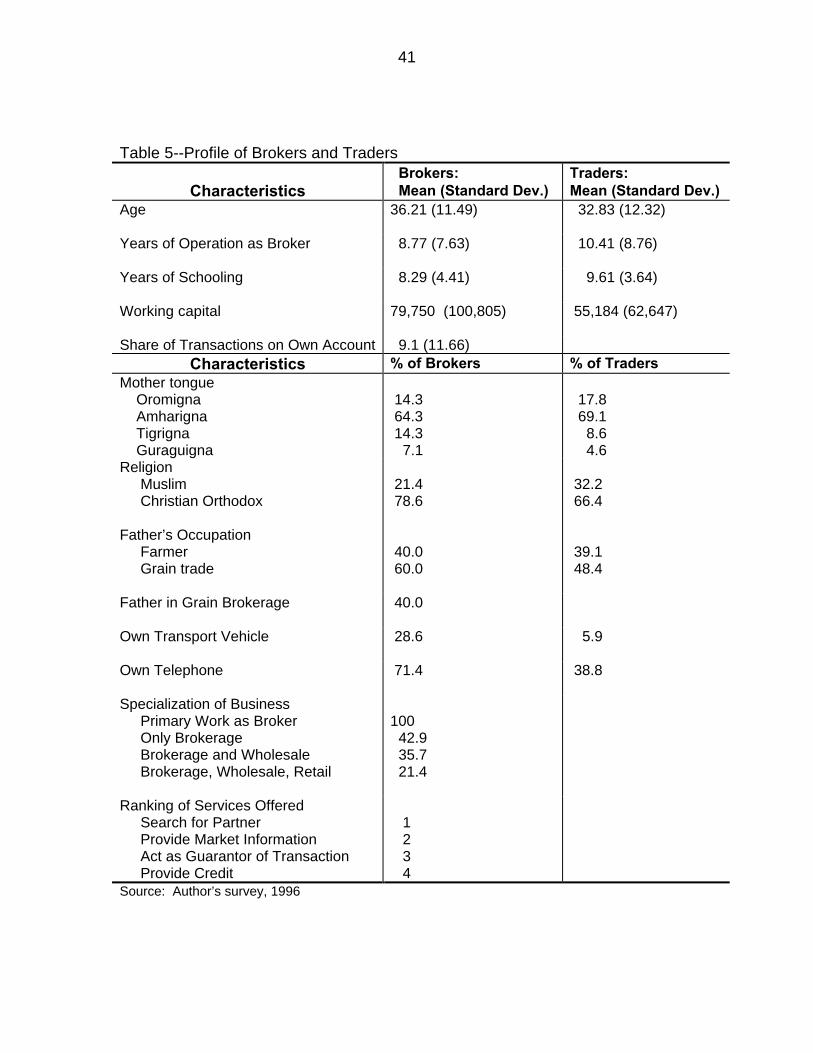
Table 5--Profile of Brokers and Traders
Characteristics Brokers: Mean (Standard Dev.)
Traders: Mean (Standard Dev.)
Age
36.21 (11.49) 32.83 (12.32)
Years of Operation as Broker
8.77 (7.63) 10.41 (8.76)
Years of Schooling
8.29 (4.41) 9.61 (3.64)
Working capital
79,750 (100,805) 55,184 (62,647)
Share of Transactions on Own Account 9.1 (11.66) Characteristics % of Brokers % of Traders
Mother tongue Oromigna Amharigna Tigrigna Guraguigna
14.3 64.3 14.3 7.1
17.8 69.1 8.6 4.6
Religion Muslim Christian Orthodox
21.4 78.6
32.2 66.4
Father’s Occupation Farmer Grain trade
40.0 60.0
39.1 48.4
Father in Grain Brokerage
40.0
Own Transport Vehicle
28.6 5.9
Own Telephone
71.4 38.8
Specialization of Business Primary Work as Broker Only Brokerage Brokerage and Wholesale Brokerage, Wholesale, Retail
100 42.9 35.7 21.4
Ranking of Services Offered Search for Partner Provide Market Information Act as Guarantor of Transaction Provide Credit
1 2 3 4
Source: Author’s survey, 1996

42
Table 6 -- Broker Relations with Trader Clients
% of Respondents Basis of Broker-Trader Relations referral common region anonymous meeting
50.0 42.9 7.1
Flat fee payment
92.9
When no partner is found for client: Broker charges client for storage Broker rents outside space for client Broker buys/sells grain at market price Broker stores grain without charge
71.4 7.1 7.1 14.3
If partners meet, future direct exchange is likely
21.4
Mean (standard deviation) Share of Long-Term Clients
87.43 (13.85)
Share of Distant Buyer Clients from Same Region
16.00 (35.02)
Share of Distant Seller Clients from Same Region
17.89 (34.79)
Type of Agencya Represent both buyer and seller Represent buyer only Represent seller only
7.36 (26.68) 16.21 (28.49) 76.43 (35.60)
Broker’s Actions a: Immediate Matching of Partners No Match - Rent Storage to Client No Match - Buy or Sell on Own Account
77.53 (11.12) 17.00 (10.68) 6.68 (11.06)
Transparence during match a Only buyer present Only seller present Both buyer and seller present Neither buyer nor seller present
37.36 (23.59) 3.73 (13.45) 53.68 (26.37) .77 (1.88)
Source: Author’s survey, 1996 a Represents shares of brokers’ transactions over recall period.
43
Table 7--Traders’ Relations with Brokers Uses Brokerage Could not operate Works exclusively Years of exclusive From same region Kinship ties Regularly without broker with single broker relations with
broker as broker
with broker
Region (%) (%) (%) (mean, std. dev.) (%) (%)
Surplus Markets
Wollega 100.0 70.0 92.3 4.11 (3.96)
66.7 0.0
Arsi 100.0 44.4 100.0 13.75 (11.76)
8.3 0.0
Gojjam 92.3 26.3 74.4 4.11 (2.87)
9.7 2.7
Deficit Markets
Wollo 89.5 42.9 78.9 4.96 (5.48)
46.2 17.6
Tigray 100.0 0.0 42.9 2.50 (2.18)
30.8 0.0
Harar 100.0 0.0 44.4 3.57 (3.15)
54.5 0.0
Central Market
Addis Ababa
54.1 0.0 21.6 3.87 (3.12)
25.0 5.6
Total
85.5
33.8
59.2
5.60 (6.55)
26.4
3.9
Source: Author’s survey, 1996
44
Table 8-- Transparency in Trader-Broker Relations
Trader cross- checks broker information
Broker reveals identity of partner
Trader knows partner
Trader considers direct exchange
Direct exchange creates conflict
(% of traders) (% of traders) (% of transactions mean, std. dev.)
(% of traders) (% of traders)
Region Surplus Markets Wollega 76.9 0.0 44.09 (44.32) 63.6 57.1
Arsi 66.7 33.3 60.91 (37.74) 54.5 50.0
Gojjam 86.5 65.5 73.67 (33.50) 100.0 16.7
Deficit Markets
Wollo 64.7 41.7 41.07 (47.64) 28.6 25.0
Tigray 100.0 100.0 94.58 (14.37) 91.7 27.3
Harar 81.3 81.3 90.88 (20.02) 94.1 75.0
Central Market Addis Ababa
64.7
66.7
58.21 (30.10)
66.7
50.0
Total
78.6
63.7
68.21 (37.65)
76.4
39.3
Source: Author’s survey, 1996.

45
Table 9 -- Conflict in Trader-Broker Relations Trader had
conflict with broker
Number of conflicts with broker1
Conflict resolved through mediation
Conflict resolved through legal recourse
No. of conflicts with partner resolved by broker1
No. of conflicts with partner without use of broker1
Region (% of traders) (mean,s.d.) (% of traders) (% of traders) (mean, s.d.) (mean, s.d.) Surplus Markets
Wollega 38.5 3.55 (6.30) 100.0 0.0 1.55 (2.46) 1.55 (3.01)
Arsi 41.7 .73 (1.56) 60.0 0.0 0.0 (0.0) .73 (1.42)
Gojjam 29.7 1.50 (1.98) 50.0 0.0 1.40 (2.58) .27 ( .69)
Deficit Markets Wollo 17.6 .57 (.94) 66.7 0.0 1.09 (1.76) 1.50 (2.02)
Tigray 25.0 .75 (1.06) 66.7 0.0 2.83 (5.17) 1.36 (3.04)
Harar 50.0 1.25 (1.69) 40.0 20.0 .53 (1.23) .65 (1.46)
Central Market Addis Ababa 42.1 2.07 (2.99) 100.0 0.0 .87 (1.60) 4.73 (5.11)
Total 34.1 1.47 (2.73) 65.2 4.3 1.20 (2.58) 1.38 (2.88) Source: Author’s survey, 1996. 1 Over a recall period of 1 marketing year.
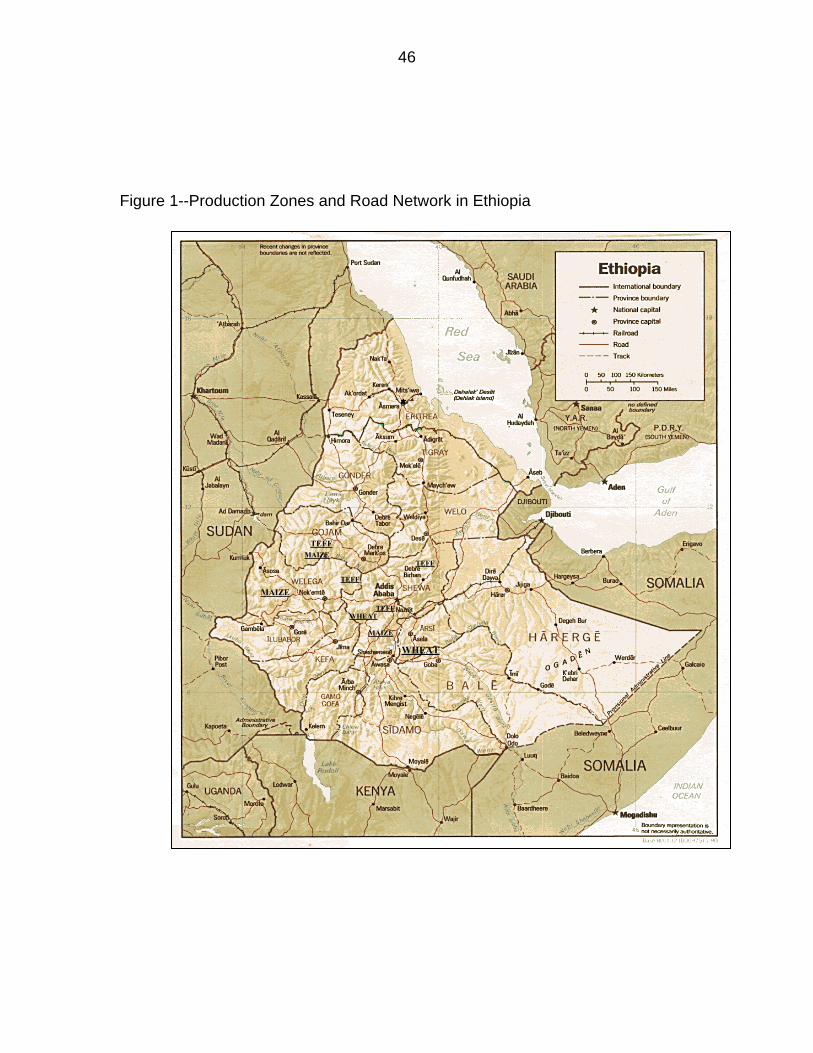
46
Figure 1--Production Zones and Road Network in Ethiopia
TEFF
MAIZE
TEFF
TEFF
MAIZE
WHEAT
WHEAT
MAIZETEFF
47
Figure 2--Contractual Choices by Type of Market and Type of Transaction
0 20 40 60 80 100
Local Agent
Distant Agent
Local Self
Distant Self
Local Broker
Distant Broker
Contractual Choices- Surplus Markets
Surplus Market Sales
Surplus Market Purchases
0 20 40 60 80 100
Local Agent
Distant Agent
Local Self
Distant Self
Local Broker
Distant Broker
Contractual Choices - Central Market
Central Market Sales
Central Market Purchases
0 20 40 60 80 100
Local Agent
Distant Agent
Local Self
Distant Self
Local Broker
Distant Broker
Contractual Choices- Deficit Markets
Deficit Market Sales
Deficit Market Purchases
Source: Author’s survey, 1996.
48
8. REFERENCES Abbot, John (ed) (1993). Agricultural and Food Marketing In Developing
Countries: Selected Readings, Wallingford: CAB International. Alvarez, F. (1881). Narrative of the Portuguese Embassy to Abyssinia during the
years 1520-1527, edited by Lord Stanley of Alderley. Amselle, Jean-Loup (1969). “Rapport de mission sur l’economie marchande au
Mali,” Cahiers d’Etudes Africaines, Vol. IX: 313-317. Berry, Sara (1993). No Condition is Permanent: The Social Dynamics of Agrarian
Change in Sub-Saharan Africa, Madison: University of Wisconsin Press. Chicago Board of Trade (1887). Thirtieth Annual Report of the Trade and
Commerce of Chicago, Chicago: Knight and Leonard Co. Chicago Board of Trade (1989). Commodity Trading Manual, Chicago. Clay, Karen (1993). “Trade, Institutions, and the Law: The Experience of
Mexican California,” mimeo, Stanford University. Coase, Ronald (1937). “The Nature of the Firm,” Economica, Vol. 4, No. 16,
November: 386-405. Cohen, Abner (1969). Custom and Politics in Urban Africa: A Study of Hausa
Migrants in Yoruba Towns, Berkeley: University of California Press. Cronon, William (1991). Nature’s Metropolis, New York: W.W. Norton and
Company. Dadi, Legesse, A. Negassa, and S. Franzel (1992). “Marketing Maize and Tef in
Western Ethiopia: Implications for Policies Following Market Liberalization,” Food Policy, Vol. 17, No. 3, June: 201-213.
Demsetz, Harold (1968). “The Cost of Transacting,” Quarterly Journal of
Economics, Vol. 82, No.1, February: 33-53.
49
Dercon, Stefan (1995).“On Market Integration and Liberalisation: Method and Application to Ethiopia,” Journal of Development Studies, Vol. 32, No.1, October: 112-143.
Evers, Hans-Dieter and Heiko Schrader (eds) (1994). The Moral Economy of
Trade, London: Routledge. Fafchamps, Marcel (1992). “Solidarity Networks in Pre-Industrial Societies:
Rational Peasants with a Moral Economy,” Economic Development and Cultural Change, Vol. 41, No. 1, October: 147-174.
Fafchamps, Marcel (1996a). “Market Emergence, Trust, and Reputation,”
mimeo, Stanford University. Fafchamps, Marcel (1996b). “The Enforcement of Commercial Contracts in
Ghana,” World Development, Vol. 24, No. 3, March. Fukuyama, Francis (1995). “Social Capital and the Global Economy,” Foreign
Affairs, Vol. 74, No. 5, September/October: 89-103. Geertz, Clifford (1978). “The Bazaar Economy: Information and Search in
Peasant Marketing,” American Economic Review, Vol. 68 (2) (May): 28-32. Gibson-Jarvie, Robert (1983). The London Metal Exchange, New York: Nichols
Publishing Company. Gilbert, Elon (1969). Marketing of Staple Crops in Northern Nigeria, Ph.D.
Dissertation, Stanford University. Granovetter, Mark (1985). “Economic Action and Social Structure: The Problem
of Embeddedness,” American Journal of Sociology, Vol. 91, No. 3, pp 481-510.
Greif, Avner (1993). “Contract Enforceability and economic Institutions in Early
Trade: The Maghribi Traders’ Coalition,” American Economic Review, Vol. 83, No. 3, June: 525-548.
Hayami, Yujiro and Toshihiko Kawagoe (1993).The Agrarian Origins of
Commerce and Industry, New York: St. Martin’s Press. Heytens, Paul (1986). “Testing Market Integration,” Food Research Institute
Studies, Vol. 20, No. 1: 25-40.
50
Hill, Polly (1966). “Landlords and Brokers: A West African Trading System,”
Cahiers d’Etudes Africaines, VI: 349-366. Jackson, Richard (1978). “Nineteenth Century Market Systems in Ethiopia and
Madagascar” in Robert Smith (ed.), Market-place Trade: Periodic Markets, Hawkers, and Traders in Africa, Asia, and Latin America, Vancouver: Centre for Transportation Studies.
Jones, William O. (1972). Marketing Staple Food Crops in Tropical Africa, Ithaca:
Cornell University Press. Kranton, Rachel (1996). “Reciprocal Exchange: A Self-Sustaining System,”
American Economic Review, Vol. 86, No. 4, September: 830-851. Lele, Uma (1971). Food Grain Marketing in India, Ithaca: Cornell University
Press. Lirenso, Alemayehu (1993). “Grain Marketing Reform in Ethiopia,” Ph.D.
Dissertation, University of East Anglia. Meillassoux, C. (1971). The Development of Indigenous Trade and Markets in
West Africa, Oxford: Oxford University Press. Menkoff, Thomas (1994). “Trade Routes, Trust, and Tactics: Chinese Traders in
Singapore,” in Evers and Schraders (eds) (1994). Milgrom, Paul, Douglass North and Barry Weingast (1990). “The Role of
Institutions in the Revival of Trade: The Law Merchant, Private Judges, and the Champagne Fairs,” Economics and Politics, Vol. 2, No. 1, March: 1-23.
North, Douglass and Robert Thomas (1973). The Rise of the Western World: A
New Economic History, Cambridge: Cambridge University Press. Pankhurst, Richard (1961), An Introduction to the Economic History of Ethiopia,
London: Lalibela House. Platteau, Jean-Philippe (1994a). “Behind the Market Stage Where Real Societies
Exist: Part I - The Role of Public and Private Order Institutions,” Journal of Development Studies, Vol. 30, No. 3, April: 533-577.

51
Platteau, Jean-Philippe (1994b). “Behind the Market Stage Where Real Societies Exist: Part II - The Role of Moral Norms,” Journal of Development Studies, Vol. 30, No. 4, July: 753-815.
Plattner, Stuart (1989). Economic Anthropology, Stanford: Stanford University
Press. Polanyi, Karl (1957). Trade and Market in the Early Empires. New York: Free
Press. Scott, Gregory J. (1985). Markets, Myths, and Middlemen, Lima: International
Potato Center. Thomas, N.W. (1908). “The Market in African Law and Custom,” Journel of the
Society of Society of Comparative Legislation”, XIX: 90-106.