of current busine
TRANSCRIPT

SEPTEMBER 1935
OF
CURRENT BUSINE
UNITED STATESDEPARTMENT OF COMMERCEBUREAU OF FOREIGN AND DOMESTIC COMMERCE
WASHINGTONV O L U M E 1 5 N U M B E R 9

UNITED STATES BUREAU OF MINES
M I N E R A L S Y E A R B O O K 1935
The First Complete Official Record Issued in 1935
A LIBRARY OF CURRENT DEVELOPMENTSIN THE MINERAL INDUSTRY
(In One Volume)
Survey of gold and silver mining and marketsDetailed State mining reviewsCurrent trends in coal and oilAnalysis of the extent of business recovery for vari-
ous mineral groups
75 Chapters ' 59 Contributors ' 129 Illustrations - about 1200 Pages
THE STANDARD AUTHENTIC REFERENCE BOOK ON THE MINING INDUSTRY
Part I—Survey of the mineral industries:Review of the mineral industryStatistical summary of mineral productionWorld production of minerals and economic
aspects of international mineral policiesPart 11—Metals:
Gold and silverCopperLeadZincLead and zinc pigments and zinc saltsDetailed accounts of metal production in
Alabama, Arizona, Arkansas, California,Colorado, Georgia, Idaho, Illinois, Kansas,Kentucky, Maryland, Michigan, Missouri,Montana, Nevada, New Jersey, NewMexico, New York, North Carolina, Okla-homa, Oregon, Pennsylvania, South Caro-lina, South Dakota, Tennessee, Texas,Utah, Virginia, Washington, Wisconsinand Wyoming.
CO NTSecondary metalsIron ore, pig iron, ferro'alloys, and steelBauxite e,nd aluminumMercuryMangane.se and manganiferous oresMolybdenumTungstenTinChroHHtt:AntimonyArsenicRadium, uranium, and vanadiumPktinum and allied metalsNickelMinor metals: Beryllium, bismuth, cadmium,
cobalt, selenium, tantalum and columbium,tellurium, titanium, and zirconium
Ore concentration
E N T SPart m—Konmetals-
CoalCoke and byproductsRecent developments in coal preparation and
utilizationFuel briquetsPeatCrude petroleum and petroleum productsUses of petroleum fuelsInfluences of petroleum technology upon com-
posite interest in oilNatural gasNatural gasolineCirbon blackMiscellaneous commercial gasesHeliumAsphalt and related bitumensCementDimension stoneSlateCrushed and broken stoneSand and gravelGypsum
LimeClayAbrasive materialsSulphur and pyritesSalt, bromine, calcium chloride, and iodinePhosphate rockFuller's earthTalc and ground soapstoneFluorspar and cryoliteFeldsparAsbestosBarite and barium productsPotashMagnesium and its compoundsMicaNatural sodium compounds and boron min-
eralsPrecious and semiprecious stonesMinor nonmetals: Graphite, greensand, Icy
anite, mineral wool, monazite, olivme,strontium minerals, and vermiculite
Part IV—Mme safety:Safety in mining
COMPLETE INDEX
PRICE $2.00 To avoid delay order now. PRICE $2.00Since the beginning of the series every edition of the Minerals lCearboo\ has
been exhausted before the supply came from the press. Send no money to theUnited States Bureau of Mines as this book may be purchased only from theSuperintendent of Documents, Washington, D. C., who will deliver copies aboutSeptember 30.

UNITED STATES DEPARTMENT OF COMMERCEDANIEL C. ROPER, Secretary
BUREAU OF FOREIGN AND DOMESTIC COMMERCECLAUDIUS T. MURCHISON, Director
SURVEY OFCURRENT BUSINESS
Prepared in the
DIVISION OF ECONOMIC RESEARCH
H. GORDON HAYES, ChiefM. JOSEPH MEEHAN, Editor
Volume 15 SEPTEMBER 1935 Number 9
C O N T E N T SSUMMARIES AND CHARTS
PageBusiness indicators 2Business situation summarized 3Comparison of principal data, 1931-35 4Commodity prices 5Domestic trade 6Employment 7Finance 8Foreign trade 9Real estate and construction 10Transportation 11Survey of individual industries:
Automobiles and rubber 12Forest products 13Iron and steel 14Textile Industries 15
SPECIAL ARTICLE
Domestic motor vehicle sales during 1935 16
STATISTICAL DATANew and revised series:
New series: United States Employment Service applications,placements, and number in active file; hosiery production,shipments, and stocks 19, 20
Revised series: Industrial disputes; employment and pay rolls inhotels; employment, payrolls, and weekly earnings in Massa-chusetts for 1932, 1933, and 1934; cash income from sales offarm products 1933 and 1934; Panama Canal traffic 19, 20
Weekly business statistics through August 24 21
STATISTICAL DATA—Continued
Monthly business statistics: PageBusiness indexes 22Commodity prices 23Construction and real estate 24Domestic trade 25Employment conditions and wages 27Finance 31Foreign trade 36Transportation and communications 37
Statistics on individual industries:Chemicals and allied products 38Electric power and gas 41Foodstuffs and tobacco 41Fuels and byproducts 45Leather and products 47Lumber and manufactures 48
Metal and manufactures:Iron and steel 49Machinery and apparatus 51Nonferrous metals and products 52
Paper and printing 53Rubber and products 55Stone, clay, and glass products 56Textile products 57Transportation equipment 58
Canadian statistics 60
General index Inside back cover
Subscription price of the SURVEY OF CURRENT BUSINESS is 31-50 a year. Single-copy price: Monthly, 10 cents; weekly, 5 cents.Foreign subscriptions, 33, including weekly supplements. Make remittances only to
Superintendent of Documents, Washington, D. C.
12398—35-
SURVEY OF CURRENT BUSINESS September 1935
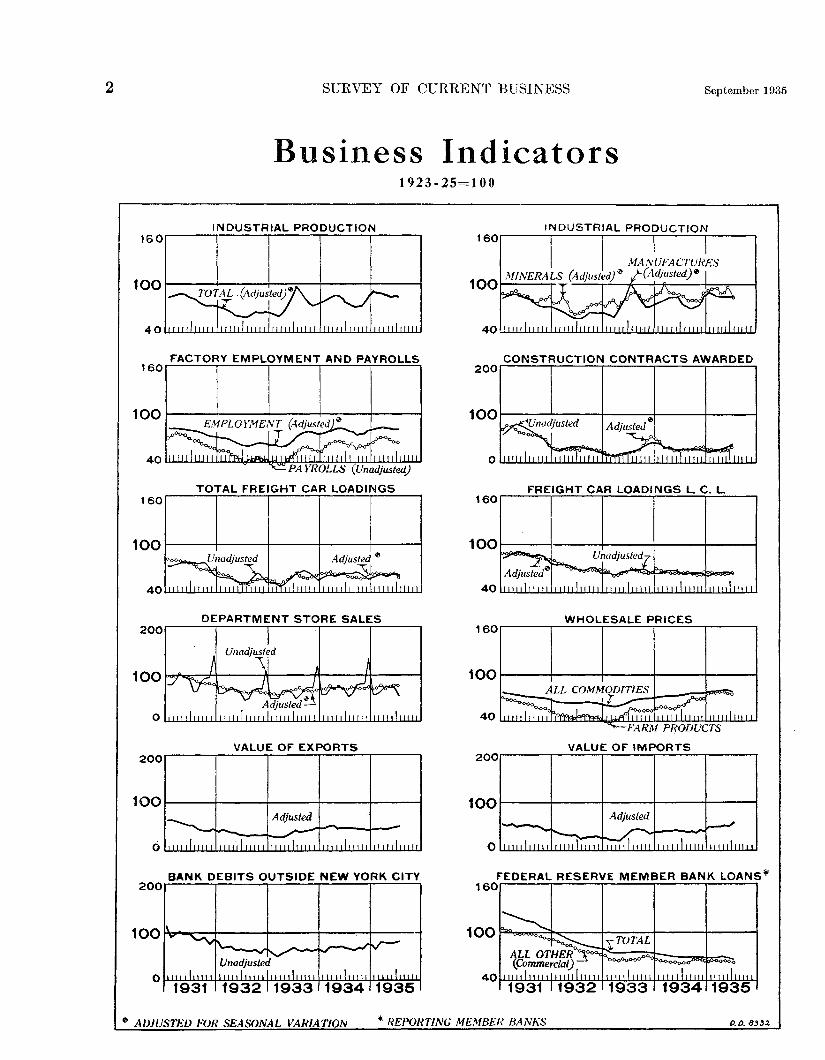
Business Indicators1923-25-100
160INDUSTRIAL PRODUCTION
too
160
10O
FACTORY EMPLOYMENT AND PAYROLLS
-PAYROLLS (Unadjusted}
TOTAL FREIGHT CAR LOADINGS160
1OO
40
2OO
10O
Unadjusted Adjusted '
DEPARTMENT STORE SALES
VALUE OF EXPORTS2OO
1OO
I I I ! I 1 1 1 1 1 I I I I 1 1 I 1 1 I I I
Adjusted
^^^^""^1 1 1 ii h 1 1 1 1 1 ! 1 I l! I I 1 1 11 1 1 1 1 i II 1 I t
200
100
BANK DEBITS OUTSIDE NEW YORK CITY
1931
Unadjusted
1932H933 1934 1935
160
1OO
INDUSTRIAL PRODUCTION
MANUFACTURESMINERALS (Adjusted}* /(Adjusted)*
4O i I IN l l M I I I I I M I III I I I l l I I II I I I I i I I I I I 1 1 I I I I I I I I
20O
1OO
CONSTRUCTION CONTRACTS AWARDED
160
1OO
FREIGHT CAR LOADINGS L. C. L.
16O
1OO
WHOLESALE PRICES
ALL COMMODITIES
200
1OO
-FARM PRODUCTS
VALUE OF IMPORTS
^ s~
1 III 1 1 1 1 1 1 1 V— N^—1 1 1 1 1 1 t l 1 1 !
Adjusted
1 1 1 1 1 i M 1 1 1 I I 1 1 1 1 1 1 1 !
—160
1OO
FEDERAL RESERVE MEMBER BANK LOANS
9 ADJUSTED FOR SEASONAL VARIATION * REPORTING MEMBER BANKS D. O. 63 3Z

September 1935 SURVEY OF CUEEENT BUSINESS
Business Situation SummarizedBUSINESS activity durii/g the summer months has
maintained a relatively favorable trend, with theindexes of industrial production, retail sales, construc-tion, and foreign trade all recording considerableincreases over the corresponding period of 1934.Agricultural income, while higher for the year to date,was lower in July than a year ago, owing to the droughtconditions in the earlier period which induced a rapidprice rise and the marketing of accumulated surpluses.
Manufacturing output did not record the usualseasonal recession in July and, while this conditionhas reflected gains in some of the durable goodsindustries, there has also been improvement in thewool, silk, rayon, shoe, and rubber manufacturingindustries, while cigarette output broke all records inJuly. Weekly figures for August indicate that therise in steel ingot production has been particularlysharp. The decline in automobile production in Julyexceeded the estimated seasonal movement, but thetrend of car sales continued strong. Productiondropped off substantially in August, as the majorcompanies made preparations for the introduction ofnew models.
Electric power production has been at a high rateduring August, with the seasonally adjusted weeklyindex of output reaching a new all-time peak. Lumberproduction also improved but the cotton textile
industry continues in a relatively unfavorable position.Cotton consumption in July dropped by the usualseasonal amount, but an increase in the adjusted indexis indicated for August.
The August crop report of the Department of Agri-culture indicates substantial gains in the anticipatedharvest in comparison with a year ago. Some deterio-ration in the wheat crop occurred during July, butcorn improved and a large gain in cotton productionover last year's small crop is in prospect.
Little change in the number employed is indicatedby the July figures. The declines in the industriessurveyed monthly by the Bureau of Labor Statisticswere offset by seasonal increases in agriculture andin road building. Factory employment did not declineto the usual extent in July, the adjusted index advanc-ing after 3 monthly declines. Factory pay rolls were1.7 percent lower in July than in June, but were 7.9percent higher than a year ago.
Changes in the available retail sales indexes forJuly were mixed; the rural general merchandise salesindex, however, was the only one recording a declineof more than seasonal proportions. The adjustedindexes of new passenger car sales and variety storesales advanced, while the department store salesindex was unchanged.
MONTHLY BUSINESS INDEXES
Year and month
1929- July1930: July1931: July1932: July..1933: July1934:
JulyAugustSeptemberOctober _ _ .NovemberDecember.
1935:January __February.March _ _AprilMayJune -_July
Monthly average, Janu-ary through July:
193319341935. .. .
Industrial production
Unadjusted 1
•aI
1
1
1«1g
Adjusted 2
•a1
i13c<e
<»
1i
Factory em-ployment
and pay rolls
>»o
ll<~ 3°S
0g 0
1>»"§rt£p,ie
It§8
Freight-car loadings
Total
ISO
I I0
*•̂
Merchan-dise, 1. c. 1.
i«o£aP
1«O3|
Departmentstore sales,
value
00
5
C3fi
102
1
<
Foreigntrade, value,adjusted *
Hw
3
1
1 Ban
k
deb
its
outs
ide
New
Yor
k C
ity
Const
ruct
ion
contr
acts
, al
lty
pes
, val
ue,
ad
just
ed 2
Monthly average, 1923-25=100
12090805696
737373757478
88919189878683
748388
12089795597
717170737376
87919191878483
748288
118100866390
848387878485
91929079889784
778689
124938258
100
767371747586
91898886858686
125928257
102
747269727485
90888686848486
116100866591
858082818190
94969787899884
107.090.378.059.672.5
79.579.373.976.876.778.9
80.581.982.482.381.279.980.4
63.580.181.2
107.284.366.239.850.8
60.562.258.061.059.563.2
64.169.170.770.868.566.465.3
42.362.767.8
11195785166
636367646056
58616259616360
556261
123103765165
615959575964
64656561616358
10594876870
646567666562
61636565656463
666668
10695886970
656564636466
65656463636464
7971664648
5160798283
135
59617179767655
566668
109100946670
737775737478
74758273768080
12180543243
484948454543
45474846465052
334848
11974592748
433943394741
51484949525160
324351
144.0117.393.463.470.4
70.568.065.373.368.079.6
76.466.880.379.879.480.784.4
58.769.678.3
12495612721
272729313131
27282627273036
183429
Who
lesa
le
pric
e in
dex
, 78
4co
mm
od
itie
s
Monthlyaverage,1926=100
96.584.472.064.568.9
74.876.477.676.576.576.9
78.879.579.480.180.279.879.4
62.673.779.6
* Adjusted for number of working days. * Adjusted for seasonal variation. 3 Average of unadjusted indexes.

SUEVEY OF CURRENT BUSINESS September 1935
Comparison of Principal Data, 1931-35
FIRST 7 MONTHS Y///////A REMAINDER OF YEAR
BANK DEBBTS OUTSIDE NEW YORK CITY — (BILLIONS OF DOLLARS)
O SO 10O 15O 2OO 25O
CONSTRUCTION CONTRACTS AWARDED — (BILLIONS OF DOLLARS)
STEEL INGOT PRODUCTION (MILLIONS OF TONS)
3010 20 4O 50
AUTOMOBILE PRODUCTION — (THOUSANDS OF CARS)
FREIGHT CAR LOADINGS — (MILLIONS OF CARS)
10 2O 30 40
//////////7//7/X
'//////////A
//////////////////A
D.D. 8333

September 1935 SUKVEY OF CURRENT BUSINESS
Commodity PricesWHOLESALE commodity prices have advanced
during August as a result of the renewed upturnin the prices of farm products and foods. The Bureauof Labor Statistics index in mid-August reached a highsince 1930, fractionally above the previous high reachedin 3 different weeks during April and May.
The farm product series has risen 3.2 points duringthe 3 weeks ended August 17, and the food series 3.2points since the last week in July, while the series ofcommodities other than farm products and foods hasremained practically unchanged. These changes havereflected adverse developments in the crop situation aswell as the further rise in meat prices.
Retail food prices were 0.4 percent lower during the2-week period ended July 30 than they were 4 weeksearlier. As compared with a year ago, retail food pricesfor the last 2 weeks of July were up 9.9 percent. Theprincipal increases took place in fats arid oils, meats,and eggs, which increased 55, 31, and 24 percent,respectively. The prices of fruits and vegetables were5.1 percent less than a year earlier. Food prices arestill about one-fourth below the 1929 level.
The cost of living of wage earners, as measured bythe National Industrial Conference Board's index, de-
clined 0.1 percent from June to July, bringing theindex to 82.6 percent of the 1923 average. This is4.4 percent above its level in July 1934 and 17 percentbelow that of July 1929. Of the 5 items or groupscomprising this index, food prices and rents in Julywere about 10 percent above their levels a year ago;the cost of clothing and coal was down 3.4 and 3.2percent, respectively; and the prices of sundries werepractically unchanged.
Retail prices of department-store articles, accordingto Fairchild 's index, continued during July the declinewhich has been under way since April 1934. Prices onAugust 1 were the lowest since September 1, 1933,and were 0.6 percent lower than in the previous month,3.1 percent lower than a year earlier, and 4.9 percentbelow the high of 1934. The broad nature of thedecline during the past year and more is indicated bythe fact that each of the 5 groups and 18 of the 26items showed declines during this period.
The general level of prices received by farmers,according to the Department of Agriculture, advancedslightly by the middle of August after declining fromApril to July. Marked increases occurred in the pricesof hogs and wheat.
INDEXES OF COMMODITY PRICES
Year and month
1929: July1930: July . . . .1931: July1932: July _1933: July1934:
JulyAugust __SeptemberOctober.NO v<vm barDecember
1935:JanuaryFebruaryMarch .AprilMay
JulyMonthly average, January
through July:193319341935
Wholesale (Department of Labor)
**00r» coc*o
Ml«42•e o£3
>»13 -3
IIS C
liu
Economic classes
g§«1
1
i
VI
1«SK
Cfl
2
1§
Groups and subgroups
%w3T3
I&4
wB1
OR•oo&!»
+J
9
g 35£l3
ii•+•* 42Q
*!P
*
sS
SBG3S33&
i"S3
fS£«3<a
1
1
M
|,5?•e9•3§,
1eS«
"O
§enO•aB
WD
.5Ace'5*faTJ
?!oaasOH
30>
•el8I«*
*e3-w0
s
£«3•e1
1Mo>H
05
1
iMonthly average, 1926=100
96.584.472.064.568.9
74.876.477.676.576.576.9
78.879.579.480.180.279.879.4
62.673.779.6
95.686.676.170.572.2
78.279.280.179.279.379.5
80.881.581.782.382.482.282.0
67.577.481.8
99.181.164.354.761.8
68.371.673.972.172.273.1
76.677.476.677.577.676.475.8
52.866.076.8
93-479.869.355.569.1
72.772.671.871.571.171.0
71.271.771.872.373.573.972.8
60.473.573.5
107.683.164.947.960.1
64.569.873.470.670.872.0
77.679.178.380.480.678.377.1
47.861.278.8
102.274.149.036.773.4
74.886.088.185.087.291.5
88.887.482.887.983.276.978.3
47.165.683.6
102.986.874.060.965.5
70.673.976.174.875.175.3
79.982.781.984.584.182.882.1
58.067.482.6
116.791.873.462.050.8
63.469.476.670.068.469.0
81.687.991.694.397.094.593.3
50.957.491.5
91.784.573.969.772.2
78.478.378.378.078.078.0
77.777.477.377.277.678.078.0
67.478.577.6
95.188.578.169.779.5
87.085.885.685.285.085.1
84.985.084.984.684.885.385.2
72.386.985.0
93.388.378.973.073.2
75.475.776.577.176.977.8
79.380.481.581.081.280.778.7
72.275.480.4
83.378.062.972.365.3
73.974.674.674.674.473.7
72.972.573.072.873.174.274.7
63.072.573.3
109.1100.889.468.686.3
86.383.884.183.884.285.1
86.286.085.486.388.388.989.3
74.388.387.2
94.393.185.774.074.8
81.681.881.881.781.381.2
81.280.780.780.780.680.580.4
52.781.580.7
101.090.884.379.280.6
86.886.786.686.386.285.9
85.885.885.785.986.686.986.4
78.287.386.2
89.679.766.551.568.0
71.570.871.170.369.770.0
70.370.169.469.269.470.170.2
55.974.769.8
82.876.669.764.364.0
69.970.270.269.770.671.0
70.770.169.268.768.768.467.7
60.169.269.1
Cos
t of
livin
g
(Nat
ional
In
du
s-tr
ial
Con
fere
nce
Bo
ard
)
Mo.average,
1923 =100
100.095.285.977.075.2
79.179.681.080.9SO. 880.8
81.682.482.483.282.982.782.6
72.778.582.5
Far
m,
com
bin
ed i
nd
ex,
47 c
om
-m
od
itie
s (D
epar
tmen
t o
f A
gri-
cult
ure
) l
Mo.average,1909 to1914=
100
147120866383
8796
103102101101
107111108111108104102
6483
107
Retail
S•wC«
s-*Srt.fi
*$fi
•9O£Mo.
average,1913=
100
159144119101105
110112117116115114
119122122124124123122
95108122
Is.if11ISs1o>ft
Dec.1930
(Jan. 1,1931) =
100
90.374.076.1
87.987.787.787.487.487.2
86.886.686.386.386.185.785.3
71.388.886.1
* Revised. See p. 20 of the November 1934 issue. 2 Middle of month. 3 Index is for 1st of following month.
6 SUEVEY OF CUREENT BUSINESS September 1935
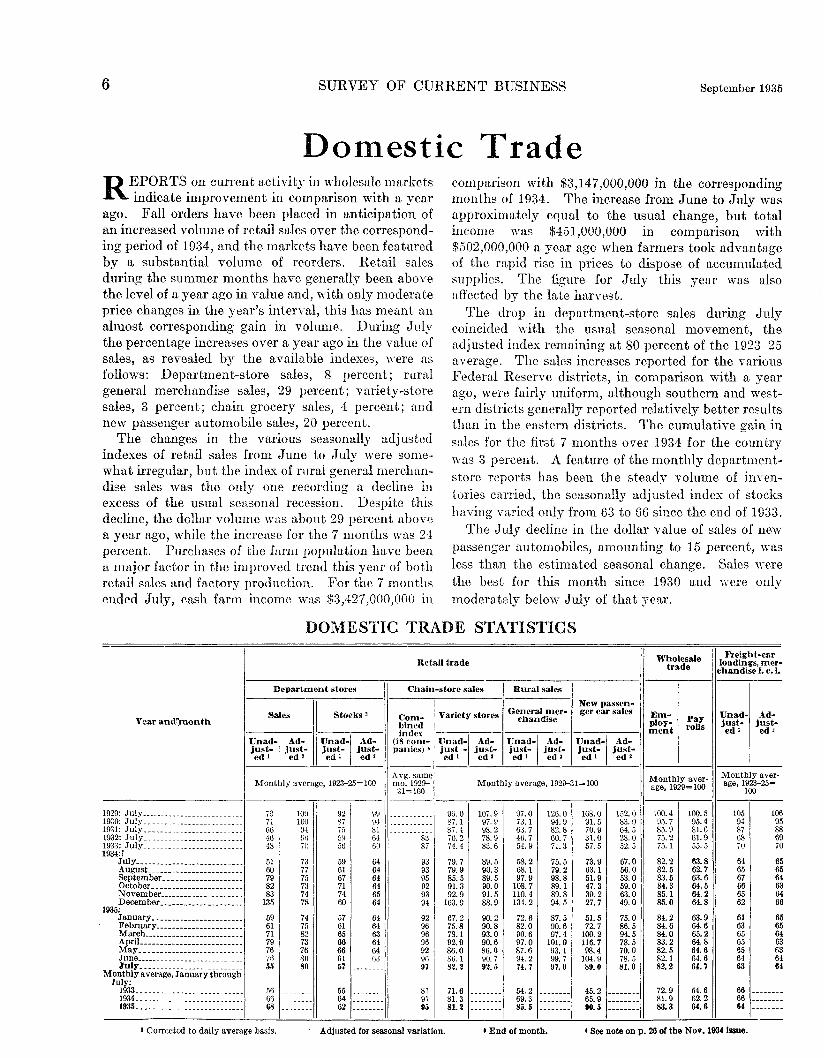
Domestic TradeREPORTS on current activity in wholesale markets
indicate improvement in comparison with a yearago. Fall orders have been placed in anticipation ofan increased volume of retail sales over the correspond-ing period of 1934, and the markets have been featuredby a substantial volume of reorders. Retail salesduring the summer months have generally been abovethe level of a year ago in value and, with only moderateprice changes in the year's interval, this has meant analmost corresponding gain in volume. During Julythe percentage increases over a year ago in the value ofsales, as revealed by the available indexes, were asfollows: Department-store sales, 8 percent; ruralgeneral merchandise sales, 29 percent; variety-storesales, 3 percent; chain grocery sales, 4 percent; andnew passenger automobile sales, 20 percent.
The changes in the various seasonally adjustedindexes of retail sales from June to July were some-what irregular, but the index of rural general merchan-dise sales was the only one recording a decline inexcess of the usual seasonal recession. Despite thisdecline, the dollar volume was about 29 percent abovea year ago, while the increase for the 7 months was 24percent. Purchases of the farm population have beena major factor in the improved trend this year of bothretail sales and factory production. For the 7 monthsended July, cash farm income was $3,427,000,000 in
comparison with $3,147,000,000 in the correspondingmonths of 1934. The increase from June to July wasapproximately equal to the usual change, but totalincome was $451,000,000 in comparison with$502,000,000 a year ago when farmers took advantageof the rapid rise in prices to dispose of accumulatedsupplies. The figure for July this year was alsoaffected by the late harvest.
The drop in department-store sales during Julycoincided with the usual seasonal movement, theadjusted index remaining at 80 percent of the 1923-25average. The sales increases reported for the variousFederal Reserve districts, in comparison with a yearago, were fairly uniform, although southern and west-ern districts generally reported relatively better resultsthan in the eastern districts. The cumulative gain insales for the first 7 months over 1934 for the countrywas 3 percent. A feature of the monthly department-store reports has been the steady volume of inven-tories carried, the seasonally adjusted index of stockshaving varied only from 63 to 66 since the eud of 1933.
The July decline in the dollar value of sales of newpassenger automobiles, amounting to 15 percent, wasless than the estimated seasonal change. Sales werethe best for this month since 1930 and were onlymoderately below July of that year.
DOMESTIC TRADE STATISTICS
Year ancTinonth
1929: July1930: July1931: July _1932: July...1933: July1934:1
July.AugustSeptemberOctoberNovemberDecember
1935:January. _February... . _MarchApril .MayJuneJuly
Monthly average, January throughJuly:
193319341935
Retail trade
Department stores
Sales
Unad-just-ed i
Ad-just-
ed 2
Stocks 3
Unad-just-ed^
Ad-just-
ed 2
Monthly average, 1923-25=100
7971664648
5160798283
135
59617179767655
566668
11001009461)70
737775737478
74758273768080
9287
5956
596167717460
57616566666157
556462
9994816460
646464646564
646463646463
Chain-store sales
Com-binedindex
(18 com-panies) 4
Avg. samemo. 1929-
31=100
8387
939395929394
92969696929697
819195
Variety stores
Un ad-just -edi
Ad-just-ed a
Rural saies
General mer-chandise
Unad-just-ed i
Ad-just-ed 2
New passen-ger car sales
Unad-just-ed i
Ad-just-
ed 2
Monthly average, 1929-31=100
96.087.187. 470.274.4
79.779.985.591.392.9
163.9
67.275.878.192.986.086.182.2
71.681.381.3
107.997.998.278.983.6
89.590.389.590.091.588.9
90.290.893.090.686.090.792.5
97.073.163.746. 754.9
58.268.197.9
108.7110.4134.2
72.682.090.697.087.694.274.7
54 269.385.5
126.094.982.8CO. 771.3
75.579.298.889.189.894.5
87.590.697.4
101.093.199.797.0
168.091.570.931.057.5
73.963.151.947.339.227.7
51.572.7
100.2116.798.4
104.989.0
45.265.990.5
152.083.064.528.052.5
67.056.053.059.063.049.0
75.086.594.578.570.078.581.0
Wholesaletrade
Em-ploy-ment
Payroils
Monthly aver-age, 1929=100
100.495.785.975.275.1
82.282.583.584.385.185.0
84.284.684.083.282.582.182.2
72.981.983.3
100.595.481.661.955.5
63.862.763.664.564.264.8
63.964.665.264.864.664.664.7
54.662.264.6
Freight-carloadings, mer-
chandise I. c. I.
Unad-just-ed i
Ad-just-ed 2
Monthly aver-age, 1923-25=
100
10594876870
646567666562
61636565656463
666664
10695886970
656564636466
65656463636464
i Corrected to daily average basis. ' Adjusted for seasonal variation. « End of month. < See note on p. 26 of the Nov. 1934 issue.

September 1935 SURVEY OF CURRENT BUSINESS
EmploymentTHE general level of employment in July was about
the same as in June. The only sharp recessionswere in retail trade, which reflected the seasonal declinein sales, and in the anthracite- and bituminous-coalindustries. All the industries surveyed monthly bythe Bureau of Labor Statistics showed an estimatedtotal decline in employment of about 150,000, but thisloss was at least partially offset by the seasonal improve-ment in agricultural employment and in road building.
Factory employment declined only 0.1 percent inJuly, with the result that the seasonally adjusted indexrose 0.5 of a point to 80.4. This gain followed three suc-cessive monthly declines. The index was higher thanfor any July since 1930, although only 1 percent aboveJuly 1934. Factory pay rolls also declined by lessthan the usual seasonal amount from June to July;they were higher than for any July since 1931 and 7.9percent above a year ago.
Of the 46 durable-goods industries, 19 reportedgains in employment, 25 losses, and 2 no change.Several industries reported contraseasonal gains. Thesewere sawmills (10 percent), agricultural implements(5.5 percent), millwork (6.9 percent), and machinetools (4.6 percent). Employment in the agricultural-implement industry in July was more than 68 percentabove July 1934, and was the highest since April 1930.The gain in the machine-tool industry reflected thelarge increase in business experienced by this industry in
recent months. The most pronounced declines inemployment in July for this group of industriesoccurred in the electric- and steam-car building andlocomotive industries. Other declines reported werelargely of a seasonal character.
Increased employment was reported in 20 of the 44nondurable-goods industries. Food-products indus-tries showed seasonal gains. Other increases includedsilk and rayon goods (8.1 percent), boots and shoes (6.4percent), and men's clothing (2.6 percent).
Nonmanufactaring industries employed fewer work-ers in July than in June, but 10 of the 17 industriesreported a higher level of employment. These latterincluded the private building construction industry
^with an increase of 1.4 percent over June and 5.1 per-cent over July 1934. Recent improvement in the secu-rity markets was reflected in a gain of 1.6 percent in thenumber of workers employed by brokerage houses.
Changes in the number employed in the variousGovernment employment projects from June to Julyvaried from a large increase in the C. C. C. enrollmentto a very substantial decrease in the number employedon the Federal Emergency Relief Administration workprojects. The decline in the number of persons receiv-ing emergency relief from public funds from June toJuly was due in part to seasonal gains in agriculturalemployment, as well as to improved work opportunitiesin individual lines of business.
STATISTICS OF EMPLOYMENT, PAY ROLLS, AND WAGES
Year andmonth
1929: July1930: July1931: July1932: July1933: July. - . _1934:
JulyAugustSeptember..OctoberNovember ._December...
1935:JanuaryFebruary. _ _MarchApril .May... _JuneJuly
Monthly aver-age, Januarythrough July:
193319341935
Factory employment !and pay rolls
Employment
Unad-justed
Ad-justed*
Payroil
Unad-justed
Monthly average,1923-25=100
106. 189.577.053.971.5
78.779.575.878.476.878.0
78.781.282.482.481.179.679.5
63.079.580.7
107. 090.378.059 672.5
79.579.373.976.876.778.9
80.581.982.482.381.279.980.4
107. 284.366. 239. 850.8
60.562.258.061.059.563.2
64.169.170.770.868.566.485.3
42.362.767 8
Nonmanufaeturlng employment and pay rolls(Department of Labor)
Anthracitemining
Em-ploy-ment
Payrolls
Bituminouscoal mining
Em-ploy-ment
Payrolls
Electric lightand powerand manu-factured gas
Em-ploy-ment
Payrolls
Telephoneand telegraph
Em-ploy-ment
Payrolls
Retail trade
Em-ploy-ment
Payrolls
Monthly average, 1929=100
83.291.665. 144.543.8
53.649.556.958.560.761.6
62.964.451.452.653.556. 849.4
49.161.155.9
64.784. 053.734.538.2
42.339.747.048.351.252.3
57.564.338.949.949.506. 037.5
41.261.851.9
94.188.076.458. 663.2
77.077.178.279.379.879.7
80.081.181.674.375.377.969.9
65.276.077.2
85.668. 950.424.433. 6
49.750.451.457.658.357.0
59.666.167.545.049.164.735.6
31.553.655.4
103.2105.996. 782.377.5
85.085.685.885.885.583.6
82.782.282.282.683.283.884.7
77.282.883.1
102. 3106. 797.478.770.0
81.179.979.380.679.678.3
78.078.379.479.079.879.881.5
70.876.779.4
102.6100.086.679.168.5
71.071.070.970.369.969.7
70.570.069.869.770.070.270.3
71.770.370.1
104. 1106.693.379.666.7
72.374.072.274.972.273.2
73.972.975.373.173.774.475.7
69.370.274.1
97.393.084.273.171.0
79.077.881.782.683.791.1
79.579.280.283.682.282.179.0
71.681.180.8
98.892.881.359. 251.0
60.158.460.661.961.966.2
59.759.360.462.562.062.460.4
51.760.361.0
Trade-Unionmem-
bers em-ployed
Percentof total
members
9178746669
727275767573
74767879797774
677477
Wages
Factory »
Averageweekly
earnings
Averagehourly
earnings
Dollars
28.4425.4922. 4515.3419. 34
19.9019.5819. 5520.0020.1220.74
21.6122.0921.8621.9321.7621. 7621.75
16.7520.2121.82
.587
. 591
.564
.489
.456
.588
.588
.592
.593
.594
.594
.594
.595
.597
.598
.599
. 599.598
.458.573.597
Com-monlaborrates a
Centsper
hour
3940363234
424141414140
39393940414242
334140
1 Adjusted for seasonal variation. 'National Industrial Conference Board. s Road building.

8 SURVEY OF CURRENT BUSINESS September 1935
FinanceSECURITY prices maintained the upward trend
evident since March through the first half ofAugust, following which prices moved irregularlydownward. Stock averages have advanced to a highfor the recovery period with Standard Statistics'index of 421 stocks at 85.2 in mid-August, or the bestlevel reached since September 1931. The rise duringearly August embraced all sections of the market, butthe widest gains were in public-utility issues. Therecovery in utility shares since March, when theindex of 37 representative issues was at approximatelythe low point for the bear market, has been verysharp, amounting to 64 percent.
According to a Dow-Jones tabulation of August 21,26 companies have increased their dividends sinceJuly 1, 12 resumed dividend payments, 16 paid ac-cumulated dividends, 449 declared dividends at therate previously in effect, and only 3 reduced dividends.It is of interest to note that, despite the improvementin profits this year as compared with 1934, nearly asmany individual companies reporting in the above-mentioned period recorded lower profits as reportedincreases. The actual number of companies was 323and 341, respectively.
Bond prices declined moderately during August, theDow-Jones index receding about a point. Low interestrates and the tremendous reserves of the banking sys-tem, plus the available investment funds in the handsof individuals and institutions, have tended to sustainprices. Excess reserves of the reporting memberbanks of the Federal Reserve System have again risento record heights, the total in the middle of August
standing at approximately 2.7 billion dollars. Addi-tional gold imports have contributed to the recent risein reserves. Silver imports in the first week of Augustreached the high figure of $14,604,924, including over5 million dollars in foreign coins.
New security issues, which have been put out inlarge volume, have been mainly refunding operations.New capital issues for the month of July amounted toonly $134,000,000, although the total offerings had aface value of $644,452,000. Offerings of new securitiesduring August have not been as heavy as in July, but re-funding issues tentatively scheduled for the near futuremake up a large total. Reports on some of the recentlyoffered issues indicate that the pricing was so close thatthe issues have not been immediately absorbed byinvestors.
From the last reporting period in June to August 14,outstanding loans of the reporting member banksdeclined, with a smaller total reported for both securityand "other loans." Compared with a year ago, thetotal outstanding shows a decline of nearty a halfbillion dollars. In connection with this continuedshrinkage in loans despite the general business im-provement, it is significant to note that the FederalDeposit Insurance Corporation reported that in 1934insured banks, which comprise nearly all operatingbanks, wrote off losses of $1,130,000,000, representinglargely worthless loans. Acceptance of such largelosses was made possible by Reconstruction FinanceCorporation loans and the raising of additional capitalby private subscription.
FINANCIAL STATISTICS
Year andmonth
1929: July _ ._1930: July1931: Julv1932: July ..1933: Julv1934:
JulyAugustSeptember. _.OctoberNovember.. -December. _ _
1935:JanuaryFebruaryMarchAprilMayJuneJuly
Bankdebits
outsideNewYorkCity
Report ing memberbanks, Wednesdayclosest to end ofmonth 1
Loanson
securi-ties
Allotherloans
In-vest-
ments
FederalReservebankcreditout-
stand-ing,
end ofmonth
Totalbank-er's ac-cept-ancesout-
stand-in,g'rend of
month
Netgoldim-
portsin-
cludinggoldre-
leasedfromear-
mark *
Moneyin
circu-lation
Savings deposits
NewYorkState
PostalSav-ings
Millions of dollars
28, 41623, 14518, 44412,51113, 878
13, 91013, 42012, 88814, 46513, 40915, 701
15, 06613, 18115, 84915, 74615, 65515,91416, 657
4,0803,772
3,3583,2473,0473, 0513,0173,081
3,0242,9952,9743.1123,0543,0992,967
5,4264,774
4,5154, 5554,7474,7564,6884, 565
4,5374,6034,6354,5844,5584,4494,360
7,0948,011
9,8899,906
10, 01710, 03010, 05910, 575
10, 68310,72310, 90010, 99310, 85910, 96011, 180
1, 347934976
2,4392,209
2,4622,4642,4642,4552,4532,463
2,4612,4652,4712,4682,4692,4802,465
1,1271, 3501,228
705738
516520539562561543
516493466413375343321
12.7-22.6-10.2
52.8.6
52.936.2
-16.311.1
120.892.2
150.5123.012.3
146.31?.8. 5231.415.8
4,7644,4834,8365,7525,675
5,3505,3555,4275,4735,4945,577
5,4115,4395,4775,5005,5075,5225,550
4,4344,5725,1495, 2535,085
5,1145,0545,1455,1285,1195, 154
5,1425,1475,1855,1585,1525,1875,161
158181372830
1,178
1,1901, 1921,1931,1991,2041,207
1,2011,2051,2031,2001,2051,2051,190
Stockprices(421)
Stand-ard
Statis-tics
1926=100
207.3149.398.235.980.4
71.467.867.067.369.469.2
69.767.863,967.573.176.079.4
Bondprices,NewYorkStockEx-
change(do-
mestic)
Dollars
96.4098.2995.4979.2588.03
92.0091.1390.0591.2391.6892.57
93.3593.3591.7992. 9592.8193.9494.12
Newcapitalissues
Thous.of dollars
852, 370474, 580223, 127105, 381117, 560
213, 608179, 54843, 375
121, 903107, 036140, 941
92, 09750, Oil
108, 07989, 85086, 39558, 083
134, 127
Aver-agedivi-dendper
share(600
com-panies)
Dollars
2.882.912.311.311.05
1.211.231.231.241.271.27
1.281.291.291.291.291.291.30
Interestrates,com-
mercialpaper
(4-6months)
Percent
63-3^22H-254itt-m%-\H-lK-lH-ln-iH-l%-\%H3A3A
»91 cities. 2 Net exports indicated by (—).

September 1935 SURVEY OF CURRENT BUSINESS
Foreign TradeBOTH exports and imports increased in July over
the preceding month. The change in exports wasslight, but imports, which usually decline about 3percent, were up 13 percent. Allowing for seasonaladjustment, exports in July rose 2 points to 52 per-cent of the 1923-25 average, the highest figure for anymonth since July 1931, while the index of importsincreased 9 points to 60 percent, the highest figuresince December 1930. The merchandise balance forJuly was $4,327,000 in favor of imports.
The increase in exports in July was due mainly tolarger shipments of nonagricultural products. Al-though exports of a few agricultural items, particularlyunmanufactured tobacco, were larger in quantity thanin June, agricultural exports as a group declined 6percent in value from $41,794,000 to $39,467,000.Exports of unmanufactured cotton declined from193,402,000 pounds in June to 157,885,000 pounds inJuly. For the crop year ended July 31, exports ofraw cotton amounted to 5,037,000 bales of 500 poundsas compared with 7,964,000 during the preceding year.This is the lowest volume of exports of unmanufac-tured cotton since 1922; with the exception of thatyear and the war year, 1917, cotton exports were thelowest since 1895. Among other leading agriculturalproducts, exports of lard, dried fruit, canned fruit, andfeedstuffs declined during July, while apples and meatproducts increased slightly.
The increase from $125,433,000 in June to $128,-539,000 in July in nonagricultural exports was theresult of quantity increases in a wide range of com-modities. Machinery exports, including electricalappliances and agricultural implements, advancedfrom $20,560,000 in June to $23,260,000 in July;exports of iron and steel manufactures increased from$9,461,000 to $10,329,000; exports of wood and papermanufactures, from $6,298,000 to $6,965,000; exportsof chemicals and related products, from $7,979,000to $8,372,000, and textile manufactures from $4,993,000to $5,190,000. Exports of petroleum and productswere about the same in value in July as in June.Coal exports were slightly smaller in quantity.
Although the increase in imports also involved awide range of commodities, agricultural commoditiesas a group increased from $84,783,000 in June to$99,445,000 in July, or 17 percent, while nonagricul-tural imports increased from $70,531,000 to $74,717,000,or 6 percent. Among the agricultural imports, thelargest absolute increases were in sugar, crude rubber,copra, coffee, tung oil, hides and skins, and cocoa.Cane-sugar imports of 731,376,000 pounds were the larg-est amount for any month since January, while crude-rubber imports of 107,813,000 pounds were the largestfor any month since June 1934. In July, importsof butter, cheese, grain, cigarette leaf tobacco, coco-nut oil, and palm oil declined as compared with June.
EXPORTS AND IMPORTS
Year and month
1929: July1930: July _ ._1931: July1932: July - _1933: July1934:
JulyAugustSeptember.OctoberNovember _December _. _ . .
1935:JanuaryFebruaryMarchAprilMayJuneJuly _
C u m u l a t i v e , J a n u a r ythrough July:
1933 -_19341935 .
Indexes
Valueof
totalex-
ports,ad-
justed1
Valueof
totalim-
ports,ad-
justed1
Monthly aver-age, 1923-25=100
12180543243
484948454543
45474846465052
333M8348
11974592748
433943394741
51484949525160
332343351
Ex-ports,in-
clud-ing
reex-ports
Exports of United States merchandise
Total
Crudematerials
TotalEawcot-ton
Food-stuffs,total
Semi-man -ufac-tures
Finishedmanufactures
iTotal
Ma-chin-ery
Auto-mo-biles,parts,arid
acces-sories
Imports J
TotalCrudema-
terialsFood-stuffs
Semi-man -ufac-tures
Fin-ishedman-ufac-tures
Millions of dollars
402.9266. 8180.8106.8144.1
161. 8172.0191.7206. 4194.9170.7
176.2163.0185.0164. 4165.5170.2173.4
813. 41, 198. 01,197.6
393. 8262.1177.0104. 3141.6
159.2169. 8189.2203.6192.3168.5
173. 6160.3182. 0160.7159.8167.2168.0
798. 51, 177. 61,171.6
50.036.528.427.651.5
37.239.766.482.971.754.5
55.845.040.538.236.940.638.3
258.8338.0295.3
24.414.713. 515.936.8
20.317.832 243.439.235.0
32 227.121.821.819.423.419.2
177.5205.2164.8
56.140.932.315.615.4
17.122.120.121.918.515.7
16.316.316.212.915.415.515.3
95.5129.0107.8
60.539.827.914.121.4
28.829.429.728.830.430.3
27.225.530.826.226.428.928.1
118.2193.2193.2
227.2144.888.447.053.3
76.278.773.070.171.768.0
74.373.694.583.481.082.286.2
326.0517.5575.2
56.837.722.59.6
10.1
18.920.218.818.720.619.1
18.218.823.722.822.220.623. 3
64.4121.0149.5
47.217.511.76.27.5
18.415.314.012.411.012.4
17.220.525.022.018.620.119.4
49.1125.1142.8
353.0220.6174.579.4
143.0
124.1117.3149.8137,9149. 4126. 2
168.6152.3175.4166. 2166.8155.3174.2
735.1954.0
1,158.7
119.069.650.019.546.5
39.134.238.635.140.128.8
43.145.250.445.944.443.753.0
198.7283.0325.7
75.949.047.126.338.8
29.130.857.346.847.847.8
65.851.759.356. 155.049.458.5
242.8286.4393.8
71.844.730.011.931.0
27.523.024.226.127.421.0
29.629.035.230.733.631.732.1
135.1185.7221.9
86.257.247.421.826.8
28.529.229.629.934.128.6
30.126.330.533.433.930.432.5
158.5198.9217.2
' Adjusted for seasonal variations.12398—35 2
2 Genera] imports through December 1933; imports for consumption in 1934 and 1935. 3 Monthly average.
10 SUKVEY OF CURRENT BUSINESS September 1935
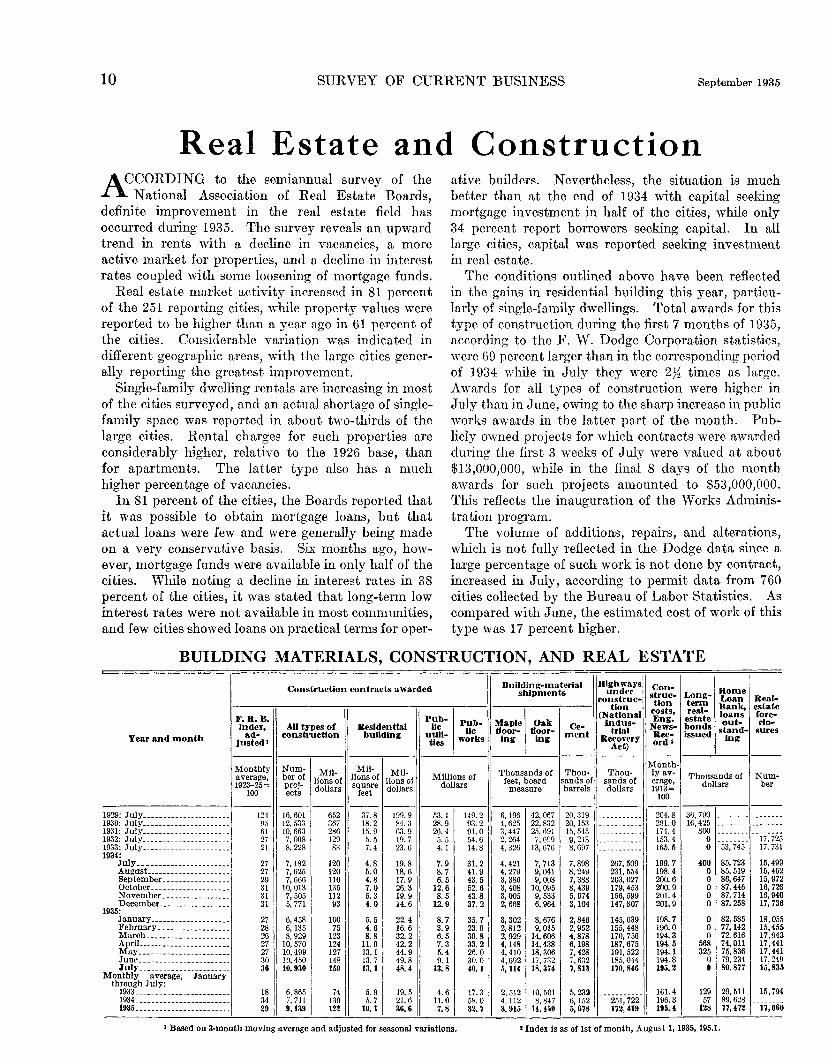
Real Estate and ConstructionACCORDING to the semiannual survey of the
National Association of Real Estate Boards,definite improvement in the real estate field hasoccurred during 1935. The survey reveals an upwardtrend in rents with a decline in vacancies, a moreactive market for properties, and a decline in interestrates coupled with some loosening of mortgage funds.
Real estate market activity increased in 81 percentof the 251 reporting cities, while property values werereported to be higher than a year ago in 61 percent ofthe cities. Considerable variation was indicated indifferent geographic areas, with the large cities gener-ally reporting the greatest improvement.
Single-family dwelling rentals are increasing in mostof the cities surveyed, and an actual shortage of single-family space was reported in about two-thirds of thelarge cities. Rental charges for such properties areconsiderably higher, relative to the 1926 base, thanfor apartments. The latter type also has a muchhigher percentage of vacancies.
In 81 percent of the cities, the Boards reported thatit was possible to obtain mortgage loans, but thatactual loans were few and were generally being madeon a very conservative basis. Six months ago, how-ever, mortgage funds were available in only half of thecities. While noting a decline in interest rates in 38percent of the cities, it was stated that long-term lowinterest rates were not available in most communities,and few cities showed loans on practical terms for oper-
ative builders. Nevertheless, the situation is muchbetter than at the end of 1934 with capital seekingmortgage investment in half of the cities, while only34 percent report borrowers seeking capital. In alllarge cities, capital was reported seeking investmentin real estate.
The conditions outlined above have been reflectedin the gains in residential building this year, particu-larly of single-family dwellings. Total awards for thistype of construction during the first 7 months of 1935,according to the F. W. Dodge Corporation statistics,were 69 percent larger than in the corresponding periodof 1934 while in July they were 2}^ times as large.Awards for all types of construction were higher inJuly than in June, owing to the sharp increase in publicworks awards in the latter part of the month. Pub-licly owned projects for which contracts were awardedduring the first 3 weeks of July were valued at about$13,000,000, while in the final 8 days of the monthawards for such projects amounted to $53,000,000.This reflects the inauguration of the Works Adminis-tration program.
The volume of additions, repairs, and alterations,which is not fully reflected in the Dodge data since alarge percentage of such work is not done by contract,increased in July, according to permit data from 760cities collected by the Bureau of Labor Statistics. Ascompared with June, the estimated cost of work of thistype was 17 percent higher.
BUILDING MATERIALS, CONSTRUCTION, AND REAL ESTATE
Year and month
1929: July .. _1930: July1931- July1932: July1933: July1934:
JulyAugustSeptemberOctober _ _NovemberDecember
1935:JanuaryFebruaryMarch _AprilMayJuneJuly
Monthly average, Januarythrough July:
193319341935
Construction contracts awarded
F. R. B.index,
ad-justed i
Monthlyaverage,1923-25=
100
124956127
272729313131
27282627273036
183429
All types ofconstruction
Num-ber ofproj-ects
16, 60112, 53310, 6637,0088,228
7,1827,6257,666
10, 0137,5055,771
6,4586,1358,929
10, 57010, 49910, 45010. 930
6,8657,7119, 139
Mil-lions ofdollars
65236728612983
12012011013511293
10075
123124127148159
74139122
Residentialbuilding
Mil-lions ofsquare
feet
37.818.215.95.57.4
4.85.04.87.05.34.0
5.54.68.8
11.913.113.713.1
5.95.7
10.1
Mil-lions ofdollars
199.984.363.919.723.6
19.818.617.926.319.914.6
22.416.632.242.244.949.848.4
19.521.636.6
Pub-lic
utili-ties
Pub-lic
works
Millions ofdollars
53.128.926.45.54.1
7.98.76.5
12.68.5
12.9
8.73.96.57.35.49.1
13.8
4.611.07.8
149.293.291.054.614.8
31.241.943.552.643.837.2
35.723.939.833.226.030.040.1
17.358.032.7
Building-materialshipments
Maplefloor-ing
Oakfloor-ing
Thousands offeet, boardmeasure
6,1964,6253,4472, 2644,326
4,4214,2793,3863,4083,0052,668
3,3022,8122,9294,1484,4104,6925,114
2,5124,1123,915
42, 06722, 83225, 6917,699
13,676
7,7139,0419,003
10, 0959,5336,964
8,6769,015
14, 60614, 43818, 30617, 73218, 374
10, 5018, 847
14, 450
Ce-ment
Thou-sands ofbarrels
20,31920, 15315, 5459,2188,697
7,8988,2497,3888,4395,6743,104
2,8462,9524,8786,1987,4287,6327,813
5,2326,1525,678
Highwaysunder
construc-tion
(NationalIndus-
trialRecovery
Act)
Thou-sands ofdollars
267, 509231, 554203, 027179, 453156, 599147, 807
145, 639155, 448170, 756187, 675191, 522185, 044170, 846
251, 722172, 419
Con-struc-tion
costs,Eng.
News-Rec-ord »
Month-ly av-erage,1913=
100
204.8201.0174.4153.4165.5
199.7198.4200.6200.9201.4201.9
198.7196.0194.3194.5194.1194.8195.2
161.4196.3195.4
Long-termreal-estatebondsissued
HomeLoanBank,loansout-
stand-ing
Thousands ofdollars
36, 79016, 425
80000
40000000
000
568325
00
12957
128
53, 745
85, 72385, 51986,64787, 44687, 71487, 258
82, 58577, 14272, 61674, Oil75, 83679, 23480. 877
29, 51189, 62877, 472
Real-estatefore-clo-sures
Num-ber
17, 72517, 731
15, 49915, 46215, 97216,72316, 94017, 736
18, 05515,45517,94317,44117,44117, 24915,835
15,794
17,060
i Based on 3-month moving average and adjusted for seasonal variations. »Index is as of 1st of month, August 1, 1935, 195.1.

September 1935 SURVEY OF CURRENT BUSINESS 11
TransportationFREIGHT-CAR loadings, which have followed an
uneventful course during the past several weeks,rose above the 600,000 level in the week ended August17 for the first time since June, and above those oflast year for the first time since the week ended June22. Loadings of miscellaneous freight and l.c.l. ship-ments for this week were the highest since May.Loadings for the first 33 weeks of 1935 were 2.1 per-cent below those for the same period last year. Ofthe three principal categories of shipments, miscella-neous freight shows a slight increase for the year todate and l.c.l. and coal a slight decrease.
The adjusted index of loadings for August turnedupward following the sharp drop in July when the indexwas off 5 points to 58, largely as a result of a drop inshipments of coal after the heavy June movementinduced by strike threats. Loadings of grain andgrain products and of coke declined, after seasonaladjustment in July, while shipments of forest productsshowed a contraseasonal increase.
Railway employment in July remained practicallyunchanged at 57 percent of the average employmentfor the 3 years 1923-25, or 55.5 percent of that baseafter adjustment for seasonal variations.
Operating results in July were relatively unsatis-factory, reflecting the decline in traffic as well as thecontinued high operating expenses in relation to gross
revenues. Gross revenues of the carriers were aboutthe same as in July 1934, but the net railway operat-ing income was down 24 percent. For the first 7months of the year income of the roads was at therate of 1.69 percent of their property investment, ascompared with 1.99 in the same period of 1934.
Purchasing of new equipment by the railroads isstill restricted. During July, there was a substantialdecline in both employment and pay rolls in the railwayequipment manufacturing industry in reflection of thecompletion of contracts and the dearth of new orders.
In the closing days of the session, Congress enacteda railway emplo37ee retirement act to replace the actwhich recently was declared unconstitutional by theUnited States Supreme Court. Supplementary tothis act, legislation was enacted levying a charge of7 percent upon the pay rolls of carriers, half of whichis to be deducted from payments to employees. TheAssociation of American Railroads estimates thatthis will add $63,000,000 annually to operatingexpenses.
A new law was enacted with a view to facilitatingrailway reorganizations. Legislation was also passedby this session of Congress placing motor trucks andbusses engaged in interstate commerce (with importantexceptions) under the regulatory power of the Inter-state Commerce Commission beginning October 1.
RAIL AND WATER TRAFFIC
Year andmonth
1929: July.1930: July1931: July1932: July1933: July1934:
JulyAugustSeptember. _OctoberNovember..December...
1935:JanuaryFebruaryMarchAprilMayJuneJuly
Monthly aver-age, Januarythrough July:
19331934 ._1935
Freight-car loadings
F. R. B. index
Unad-justed^
Ad-justed 2
Monthly aver-age, 1923-25=
100
11195785166
636367646056
58616259616360
556261
10792765165
615959575964
64656561616358
Total Coal CokeFor-est
prod-ucts
Grainand
prod-ucts
Live-stock
Mer-chan-diseI. c. 1.
OreMis-cella-neous
Freight-car sur-
plus
Thousands of cars 4
1, 040. 0920.8756.2483.2624.6
587.8605.0628.5632.9588.3518.4
542.6581.4602.9575.8581.8607.0557. 2
528.1592.9580.2
146.5137.6112.673.6
112.8
94.195.9
116.1121.0123.6122.9
137.6143.4136.694.798.4
124.279.6
98.9118.7117.3
11.98.54.92.56.5
4.44.15.25.65.46.0
7.88.66.75.75.86.04.7
5.07.36.5
61.341.227.114.326.9
20.822.322.022.421.218.3
18.725.125.225.425.026.326.4
19.322.824.7
61.762.056.438.644.8
42.840.134.830.627.825.1
24.025.626.926.925.625.430.0
33.731.626.3
23.020.318.914.615.0
22.230.934.128.522.516.3
14.512.411.612.912.910.29.9
15.616.512.0
248.9232.2214.6161. 1165. 7
153.2159.6159.3163.2160.1144.2
144.1152.2160.8161. 1159.8153.5150.2
160.5159.9154.7
76.461.836.16.3
25.0
31.329.024.417.16.53.1
2.73.23.78.6
25.631.832.8
7.914.915.7
410.3357. 2285.5172.3227.9
218.9223.1232.5244.5221.3182.5
193.2210.9231.4240.2228.6229.6223.6
187.2221.3223.0
198455564764393
348359318328381392
342320300310305272296
577368306
Pull-manpas-sen-gerscar-ried
Thou-sands
2,9392,5412,0231,2761,224
1,2801, 4031,3541,2651,1311,371
1,3981,2041,2191,1931,1461,309
1,0471,226
Financial sta-tistics, class I
railroads
Operat-ing rev-enues
Net rail-way op-eratingincome
Thousands ofdollars
551, 654451, 787372, 808235, 331293, 724
276,010282, 679275, 511292,903256,967257, 506
264, 213254, 940280, 899274, 652279, 549281, 336272,991
244, 138272, 272275,349
121, 63181, 47155, 86511, 28764, 753
35, 44139, 67741, 02048, 62531,58338, 738
21, 34925, 72037, 85134, 62639, 50534, 02526,852
31,35837, 47331,418
Canal traffic
SaultSte.
Marie
NewYorkState
Thousands ofshort tons
14, 12012, 3677,6132,6386,050
7,5226,9906,1455,0062,627
299
000
8885,9857,0587,503
444563506376473
519627465726559
0
000
329554482
Pan-ama 3
Thous.of long
tons
1,3351,221
820576823
770976
1, 0451,0291,015
885
825708961811938862
*689"971"851
1 Daily average basis. 2 Adjusted for seasonal variations. 3 American vessels, both directions. 4 Average weekly basis. 6 months' average.

12 SURVEY OF CURRENT BUSINESS September 1935
Automobiles and RubberDURING August, automobile production has slack-
ened as efforts have been concentrated on clearingpresent stocks of cars and in pushing work on the newmodels. One of the leading manufacturers suspendedproduction for the first 10 days of August, but resumedthe assembly of 1935 cars on the 12th with the sameschedule that was in effect prior to the shut-down.The weekly average production of cars and trucks inthe United States and Canada in the 4 weeks endedAugust 31, according to Cram's estimates, was 51,000units, compared with a weekly average of 78,000 unitsin July. The decline in production from June to July,on a daily average basis, exceeded the estimated sea-sonal change, the adjusted index receding 5 points to 95.
Production in the week ended August 10 droppedbelow the level of a year ago for the first time thisyear, and it is probable that the month's output willfall short of last August's 245,000 units. Sales trendsduring the first half of August were favorable, accord-ing to announcements of leading companies; the totalsfor the month, however, are expected to show a declinefrom the July figures in line with the seasonal trend.
July retail sales of cars made another favorablerecord. Sales of pleasure vehicles continue in excessof a year ago, while commercial car sales have alsomade an excellent record for the current year. Regis-trations of new commercial cars for the first 7 monthsof 1935 were 44 percent above a year ago.
Substantial outlays are being made currently by theleading motor companies to expand and round outtheir production facilities. Part of these expenditureshave been occasioned by the sales records of individualmakes of cars which have necessitated larger plantfacilities. Some of the less favorably situated manu-facturers have, of course, considerable excess plantcapacity which they have not been able to utilize.
The earnings of the industry during the first halfof the year are impressive, both for the manufacturersand the equipment industry. A Dow-Jones tabulationof the reports of 27 parts and equipment manufacturersshows profits of $30,659,000, an increase of 62 percentover the first half of 1934 and approximately the sameas the profits for the first half of 1930. The leadingcar manufacturers also reported very substantial gainsin earnings.
Earnings statements of the principal rubber manu-facturing companies were less favorable, although re-cording some improvement over 1934. The low level ofearnings was influenced by the adverse trend of re-placement tire sales and the unsettled conditions in thedistribution field. Domestic shipments of pneumatictires in the first half of the year were less than in 1934.July sales were reported to be unusually heavy as aresult of the price situation which caused distributorsand large users to augment their stocks.
AUTOMOBILE AND RUBBER STATISTICS
Year andmonth
1929: July1930: July1931: July1932: Ju ly__1933: July1934:
§ July'. "August
SeptemberOctober.__ _.NovemberDecember
1935:JanuaryFebruaryMarch .AprilMay.JuneJuly
Monthly average,January throughJuly:
19331934 _1935
Automobile production
United States
F.B.B.index,
ad-justed1
Month-ly av.,1923-
25= 100
14175603369
786151414088
10410310611086
10095
4876
101
TotalPas-sen-ger
cars s
Thousands
501266218109229
26523517013283
154
293336430478365361337
174283371
42622218495
191
2231841258449
111
229276362402308297276
147232307
Trucks
Canada
Total
Automobileexports
Passen-ger Trucks
Registrations
Newpassen-ger cars
Newcom-
mercialcars
Number
74, 84243, 32834, 31714, 43838, 092
41, 83951,31144, 96747, 98834, 46242, 563
63, 58460, 07768, 01876, 11857, 20564, 71160,965
27, 53950, 55764,383
17,46110, 1884,2207,4726,540
11,1149,9045,5793,7801,6972,694
10, 60718, 11421,97524, 12120, 76515, 74513,069
6,40013, 31417,771
29, 0827,8286,4783,0395,546
17, 62112, 52210, 2368,0409,2088,279
11, 03515, 06720, 98618, 34113, 60416,51714,752
5,59513, 85115,757
26, 0604,0403,5181,8653,582
6,3387,3057,5307,5127,0727,141
6,5916,7608,8208,0926,2919,753
10,274
2,8448,0308,083
432, 609254, 069194, 322104, 188185, 700
228, 760193, 828146, 931140, 880107, 64875, 514
136, 635170, 615261, 477319, 652293, 201280, 360285, 195
124, 026174, 902249,591
57, 89339, 87630, 08514, 69530, 642
37, 49040, 79037, 22540, 87828, 68924, 125
34, 75934, 79741,51146, 78547, 96848, 24351,243
17, 63933, 17943,615
New passenger-car sales
Unad-justed
Ad-justed i
Monthly average,1929-31=100
168.091.570.931.057.5
73.963.151.947.339.227.7
51.572.7
100.2116.798.4
104.989.0
45.265.990.5
152.083.064.528.052.5
67.056.053.059.063.049.0
75.086.594.578.570.078.581.0
Pneumatictires 2
Pro-duc-tion
Do-mesticship-ments
Thousands
4,8563,1933,9412,8934,571
3,2523,4272,8483,1883,2413,665
4,4884,2514,2154,3764,0503,793
"2,806*4,366"4,196
5,7234,2294,2441,8454,324
3, 9544,0912,9932,8343,0262,921
3,4693,1124,0004,9083,8504,061
"2,887" 4, 055"3,900
Crude rubber
Do-mestic
con-sump-tion,total
Im-ports
Worldstocks,end ofmonth
Long tons
37, 37326, 90529, 38226, 01043, 660
30, 03530, 31227, 31728, 52631, 35832, 996
42, 86438,86838, 99740, 91337, 82733, 32733,109
29, 19637, 45237,986
44, 33835, 42444, 05232, 52445, 243
42, 67432, 70032, 01029, 24037, 21218, 171
40, 52347, 84446, 64041, 45630, 70532, 18248,131
28, 37544, 72341,069
292, 287436, 413548, 794589, 037618, 258
676, 200674, 702694, 361680, 616684, 408705, 975
698, 153686, 195678, 809677, 006677, 569669, 725669,000
626, 637669,811679,494
* Adjusted for seasonal variations. a See note on p. 55. 3 Taxicabs included with passenger cars. See footnote on p. 59. " 6 months' average.

September 1935 SURVEY OF CURRENT BUSINESS 13
Forest ProductsEJMBER production has continued to expand dur-
ing August, the weekly index having advanced tothe highest point since May 1931. Shipments and neworders have also increased. During July productionwas 40 percent larger than a year ago, while ship-ments and new orders were up 54 and 39 percent,respectively, according to comparisons based on 4-week reporting periods. Similar substantial percent-age increases are expected to be recorded when Augustfigures are available. Lumber prices, which have shownno great change for the year through July, contin-ued on an even level through the early weeks of August.
Employment in the lumber and allied productsindustry has reflected this increased activity, the indexadvancing 6.1 percent from June to July, with markedgains reported for the mill work and sawmill divisions.As compared with July 1934, a gain of 6.4 percent wasreported. Pay rolls for the month were 5.5 and 21 per-cent, respectively, higher than in the preceding monthand in July 1934. The largest relative increase inwage payments over a year ago occurred in the furni-ture and millwork divisions which increased 23 and48 percent, respectively.
A recent report to the Department of Commerceby the Lumber Survey Committee showed the in-dustry to be in a better condition than in severalyears. Total lumber stocks on July 1, 1935, were750,000,000 feet less than at the beginning of theyear, a decline of approximately 10 percent. Thiswas a result of deliberate planning, in part by the
controls established under the code, and the increaseddemand for building operations. The gains in resi-dential building are causing a demand for some slow-moving or frozen items. Consumption of lumberduring the third quarter of 1935 is estimated at4,210,000,000 feet, which indicates a total for theyear 1935 of between 16 and 17 billion feet. Thismeans a larger output, with fewer active mills, thanin 1934.
The reduction of freight rates on lumber from thewest coast, recently approved by the InterstateCommerce Commission, is expected to aid rail trafficto some extent. While it is doubtful if the carrierswill be able to haul lumber to the east coast in com-petition with water traffic, it is expected that somemidwestern business will be diverted to western roads,since this traffic has had to bear the cost of back haulsfrom the Atlantic coast.
Affected principally by mill closings during theholiday week of July 6, the rate of operations of papermills dropped from 72 percent of capacity in June to68 percent in July. The operations of paperboardmills likewise averaged lower during the month.
Newsprint paper production in the United States wasthe lowest for any month of this year except February,while Canadian output increased slightly. For thefirst 7 months of the year, production in both countrieswas 2,053,755 tons, the largest output for any similarperiod since 1930. Shipments declined for the monthand stocks increased.
FOREST PRODUCTS STATISTICS
Year and month
1929: July1930" July1931: July1932: July1933: July1934:
JulyAugustSeptember _ .OctoberNovemberDecember -
1935:JanuaryFebruaryMarch _ . .AprilMayJuneJuly
Monthly average, Januarythrough July:
193319341935
Lumber production
Total Doug-las fir
South-ernpine
Cali-forniared-wood
Millions of feet, board measure
1,1171,4301,1701,189
974822
1,0331,0661,1391,2681,2281,242
81220£1164
30219014980
196
70144141129123103
1111441451586966
105
132118114
22412283
126
999998
1029679
100102103107107110131
100112109
28281589
212625282621
20232325262628
1124U
Carload-ings i
Ad-justed s
Employment
Furni-ture,ad-
Justed a
Tur-pen-tineand
rosin,unad-justed
Pay rolls
Unadjusted
Furni-ture
Tur-pen-tineand
rosin
Monthly average, 1923-25=100
9058382139
302930303032
31353333333539
2631U
115.287.774.252.165.3
64.962.863.061.260.762.9
66.467.670.371.170.569.672.6
55.863.869.7
90.471.983.5
97.398.396.289.392.492.9
95.696.399.799.299.098.998.9
71.999.698.2
106.871.355.825.236.0
39.342.744.647.244.545.9
43.547.149.749.247.148.548.6
28.539.747.7
50.533.934.2
50.351.352.245.147.950.2
52.754.252.357.957.359.956.8
30.550.755.9
Paper production >
TotalBookpaper,un-
coated
News-print
Paperboard
Wrap-pingpaper
News-print
Con-sump-tionby
pub-lishers
Short tons
588, 957707, 942637, 172762, 737658, 391618, 648
759, 837704, 580752, 875731,046
69, 61983, 06673, 24387, 39479, 93674, 427
88, 87886, 98996, 41196,85293, 35882, 09886, 121
90,101
111,592102, 64899, 39673, 60380, 396
76, 18480, 90474, 12080, 56274, 85179, 777
80, 57670,81273,52874, 89184, 36177, 31973, 108
76, 82180, 99776, 371
283, 272
201, 924246,266233, 426263, 679227, 733199, 940
262, 026251, 870275, 770260, 851262, 463256, 665260,207
247, 836228, 921261,407
103, 667134, 136111,076151,019126, 441120, 246
147, 698135,078139,857132, 986148, 984
173, 375163, 666157, 119131,823132, 482
150,500145, 095151,900168,372172,287165, 496
157, 870169,816171, 139166, 122201, 970161, 884153,811
131,903158, 602163,9*5
i Of forest products. 1 See note on p. 54. • Adjusted for seasonal variations. * 6 months' average.

14 SUEVEY OF CUERENT BUSINESS September 1935
Iron and SteelTHE rapid expansion in steel-ingot production dur-
ing a normally dull season has been outstandingamong the summer developments, particularly sincethe increase has resulted mainly from a wide-spreaddemand from miscellaneous consumers. In the 7-weekperiod ended August 24, the rate of ingot output in-creased by one-half to about 50 percent of capacity.The current rate of production is more than twice thatfor the same period last year, and is the highest reachedin August since 1930. Apparently many consumerswho began the third quarter with very low stocks, as aresult of hand-to-mouth purchasing policies in thesecond quarter when there was hope of price reductions,have started buying freely to supply immediate needsand to replenish depleted inventories since prices didnot weaken after the termination of the N. R. A. code.
Tin-plate mills, after operating for several weeks atfour-fifths of capacity, have restricted operations as aresult of the seasonal recession in demand. Largeorders for automobile steel are reported to have beenplaced, but the volume of releases has not increasedcorrespondingly. Trade reports indicate that im-proved farmer buying of such items as implements,machinery, and wire has been a factor in the increasedpurchasing of steel.
July shipments of finished steel products by theUnited States Steel Corporation were 9 percent lowerthan in June, on a daily average basis. Shipments ofsteel sheets by independent manufacturers declined
from June by 5.6 percent. In contrast with the trendin all months since January, new orders for sheets,which increased 60 percent, exceeded shipments.Unfilled orders at the end of July amounted to 170,000tons as compared with 113,000 tons a month earlier.
Machine tool orders continued in July the expansionthat has been under way since February. The indexof orders rose about one-third from June to 120, thehighest level since 1929. Unlike the June increase,foreign orders were responsible for the large gain;domestic orders were only 9 percent higher.
The report of the American Iron and Steel Instituteon production of products for sale in the first 6 monthsof 1935 reveals some marked changes for the periodin comparison with 1934. In general, the output ofthe heavier rolled products decreased and productionof the lighter products increased. Total steel productsfor sale were 2.2 percent lower than in 1934, but outputof standard rails fell 47 percent and splice bars andtieplates were 32 percent lower. Production of platesand heavy structural shapes decreased by 19 and 7.4percent, respectively. Reflecting the larger volumeof automobile assemblies, output of sheets was 10percent greater and strip production was above 1934by 6.8 percent. Production of tin plate and wireproducts increased about 7 percent each. Totalexports included in this tabulation fell 6 percent to436,000 tons.
IRON AND STEEL STATISTICS
Year and month
1929- July1930: July1931- July1932: July1933: July1934:
July - -August _ - -- -SeptemberOctober - -NovemberDecember
1935:JanuaryFebruary _ _ -March _ _ _AprilMayJune . _ - - -July
Monthly average, Januarythrough July:
193319341935
General operations
Produc-tion,ad-
justed i
Em-ploy-ment,
ad-justed i
Payrolls,
unad-justed
Monthly average,1923-25= 100
14991582599
483938414965
80807267666669
e
486971
105.089.369. 850. 162.8
71.468.865.465.666.467.7
69.470.670.871.171.571.773.7
51.370.671.1
105.379.852.423.441.4
47,645.541.142.844. 247. G
51.959.059.359.458.555.853.8
28.952.356.7
Iron andsteel
Ex-ports
Im-ports
Pig iron
Pro-duc-tion
Thousands of longtons
272132845388
233243301220299283
263229323205287290297
87212271
71 i393718
18
24203520
23292129483332
292631
3, 7852, 6401,463
! 5721, 792
1,2251,054
893951
! 957j 1, 028
1,477i 1,609
1.7701,6631,7271, 5531,520
8901,5751,617
Fur-naces
inblast
Num-ber
216144
46106 I_ |756262655969
90969897979195
629595
Steel ingots
Pro-duc-tion
Thou-sands
of longtons
4,8512, 9221,888
8073, 168
1,4891,3811,2691, 4821,6111,964
i 2, 8722, 7782,8682,6412, 6362.2312, 270
1,7202,5562,614
Per-cent
ofcapac-
ity
95
1
23252836
4852504644403:)
314546
Steel sheets »
Newor-ders
Ship-ments
Thousands ofshort tons
33720714466
174
736677
103133193
32218319316815G129206
132180193
34519517873
174
85787395
109142
206201233202187161152
110184192
UnitedStatesSteel
Corpo-ration,
finishedprod-ucts,ship-ments
Longtons
946, 745593, 900272, 448701, 322
369, 938378, 023370, 306343, 962366, 119418, 630
534, 055583, 137668, 056591,728598, 915578, 108547,794
416, 249578, 405585, 970
Prices
Ironandsteel,com-
posite 3
Steelbillets,Besse-mer
(Pitts-burgh)
Steelscrap(Chi-cago)
Dollars per long ton
36.3333.0030.7828.8729. 67
32.3232.2432.1532.1032.1532.39
32.5832.5432.3632.2932.3532.4232.44
28.3632.1132.43
35.0031.0029.0026. 0026.00
27.4027.0027.0027.0027.0027.00
27.0027.0027.0027.0027.0027.0027.00
26.0027.1627.00
14.7512.008.754.88
10.41
9.559.198.508.759.25
10.31
11.8011.2510.509.85
10.069.97
10.35
7.0710.8010.54
Fin-ishedsteel,com-posite
Dollarsper 100pounds
2.562.292.202.172.17
2.462.442.442.442.442.44
2.442.442.442.442.442.442.44
2.102.412.44
» Adjusted for seasonal variations. a Black, blue, galvanized, and full finished. ' See table on p. 19 of the January 1035 issue.

September 1935 SUKVEY OF CURRENT BUSINESS 15
Textile IndustriesDEVELOPMENTS of importance in textiles during
August centered largely in the cotton industry.Following the forecast of an estimated crop of 11,798,-000 bales, compared with 9,636,000 a year ago, camethe announcement by the A. A. A. that loans on the1935 cotton crop will be made at the rate of 10 cents perpound, as compared with 12 cents on the 1934 crop.However, an additional grant up to 2 cents a pound willbe given cooperating producers.
Cotton prices weakened following the announcementof the loan policy and there was a general slackening oforders for cotton goods in view of the price uncertainty.In the earlier part of the month, sales had tended up-ward and were in excess of production.
Another event of interest was the report of the cab-inet committee on the cotton textile industry. The-report recommended, among other things, that thepresent cotton processing tax be continued, that legis-lative and administrative action be taken to deal withthe limitation of machine hours and machine opera-tions, that consideration be given to setting up a leas-ing system for the retirement of obsolete equipment,and that steps be taken to control Japanese imports,by mutual agreement, if possible.
While recent developments have caused hesitationin some quarters, the textile industry continued to
operate at a relatively high rate in August, due to thapace of the woolen and rayon industries, and to someimprovement in the silk industry. The gain in theseasonally adjusted index of textile production in Julyraised the figure to the highest point touched sinceAugust 1933, when production was still at a high levelas a result of the introduction of the N. K. A. code.
Daily average cotton consumption declined in eachof the first 7 months of the year, but statistics for thefirst 3 weeks of August indicate an increase for thecurrent month. Cotton cloth finishing was consider-ably below the June rate.
Adding further to the gains made earlier in the year,the woolen industry in July was operating at the high-est level since war times. Consumption of wool was2X times that of a year ago and, on a daily averagebasis, was about 4 percent ahead of June. During thefirst 7 months of this year, consumption of wool waslarger than for any comparable period since the sta-tistics first became available in 1921.
Daily average silk deliveries increased about 22 per-cent from June to July. The gain, which was more thanseasonal, was due in part to the shipment of a substan-tial amount of raw silk from American warehouses toCanadian warehouses and producers. Prices were upsharply in August, while warehouse stocks were lower.
TEXTILE STATISTICS
Year and month
1929: July1930: July1931: July1932: July1933: July1934:
JulyAugustSeptemberOctober _ _NovemberDecember
1935:January ._ .FebruaryMarchAprilMayJuneJuly
Monthly average,January throughJuly:
1933 .1934 .1935
Pro-duc-
tion in-dex, ad-justed i
Month-ly av-erage,
1923-25=100
11784
10069
130
788063898797
1031009898
102100104
10086
100
Cotton,raw
Millcon-
sump-tion
Kun-ningbales
547, 165379, 022450, 884278, 568600, 641
359, 951420, 949295, 960520, 310477, 060413, 535
546, 787478, 291481, 135462, 844469, 250385, 946391, 771
542, 199469, 292459, 432
Cotton manufactures
Spin-dle ac-tivity,total
Mil-lions ofspindlehours
7,7575,3016,5283,6568,128
5, 1525,7533,7167,1856,7036,027
7,5106,5756,6636, 0586,0955,0835,158
7,4936,6136,163
Cotton cloth,finishing
Plainbleach-
edPrintgoods
Thousands ofyards
101,015113,209111,581134, 386126, 726128, 898
145, 390137, 335148, 710144, 429130, 28490, 49689,164
4 130, 6094 126, 544
75,83384,49990, 772
126, 384114, 139107, 379
120, 203117, 780122, 548104, 597100, 26570, 38161,842
* 104, 7504 99, 659
Whole-sale
price,cottongoods
Month-ly av-erage,1926=
100
98.283.966.850.080.2
85.186.487.886.684.484.3
84.183.382.481.882.782.582.0
57.987. 182.7
Wool
Con-sump-tion 2
Thou-sands
ofpounds
47, 29634, 68253, 88626, 71957, 377
27, 25428, 49523, 46734, 06544, 85857, 065
58, 37051,61665, 00662, 06670, 61780, 42866, 648
40, 77131, 14364,964
Wool manufactures
Spinningspindles
Wool-en
Wor-sted
Looms
Nar-row Wide
Percent of active hoursto total reported
78526439
108
677245636671
85928176838994
717086
6253835096
292621354865
74716163717267
633968
6042431754
252418342926
2831292728
24
403527
6248644597
515128454863
81888273?7?78
665979
Ii
Whole-sale
price,woolen
andworstedgoods
Month-ly av-erage,1926=
100
1 87.779.267.453.672.3
80.778.978.074.874.174.0
73.873.673.173.173.5
! 1QA!
59.482.474.2
Silk
Deliv-eries tomills
Bales of133
pounds
51, 62439, 94844, 74638, 38244, 597
32, 02136, 24732, 59949, 10637, 54840, 941
47, 44341, 73244, 34739, 75738, 36133, 728
! 44,180
j
43. 58437, 89541, 382
Spin-ningspin-dles s
Percentof
activehours
to total
41.540.328.043.244.446.8
55.052.245.840.5
Whole-sale
price,raw,
Japan-ese, 13-15 (NewYork)
Dollarsper
pound
4.8762. 9552. 364J.2312.273
1.1391. 1331. 1251.1851.2921.358
1. 3481.4321.3271.3911.4181. 3761. 447
1.5751.3351.391
Rayon
Deliveriesfrom mills
Un-ad-
just-ed
Ad-just-ed i
Dailyaverage,
1923-25=100
240179314213470
334307308382386488
553441295274417381426
382337398
289218390270610
440287221357429574
565387279264439477560
415355424
'Adjusted for seasonal variations. 1 Grease equivalent; see note on p. 58. a Twisting spindles. 4 6 months' average.

16 SURVEY OF CURRENT BUSINESS September 1935
Domestic Motor Vehicle Sales During 1935By Howard S. Welch, Chief, Automotive-Aeronautics Trade Division
THE automobile industry has been a notable pace-maker during the post-war period and it is natural
that it has been one of the leaders in the currentrecovery in business activity. After a steep slideduring the 3-year period 1930-32, during which newpassenger car registrations were reduced from 3,880,247in 1929 to 1,096,399 in 1932, the trend of productionand sales has been sharply reversed, with the resultthat from a volume standpoint the current year haswitnessed activity at a pace reminiscent of the banneryears of the industry. Although this volume has beenmarketed at considerably' lower prices than in the moreprosperous years, it has been possible for the industry(including the parts and equipment manufacturers) tomake a very satisfactory showing with regard to profits.
The accompanying chart portrays the fluctuationsin the dollar volume of new passenger-car sales sinceJanuary 1929. The precipitous drop in sales carried
the index from a peak of 155 in the spring of 1929 to alow of 28 in the summer of 1932. Sales turned up-ward in the latter part of that year, but the improve-ment wras halted by the development of the bankingcrisis. The improvement after the first quarter of1933 has been pronounced, and during the currentyear, production and sales have measured up to theoptimistic expectations entertained at the opening ofthe current selling season.
In studying the fluctuations of dollar sales, consid-eration should be given to the influence of price reduc-tions and the trend toward the lower priced cars whichtoday compare favorably with cars selling in a muchhigher price range in the predepression years. Theaverage price used in computing the accompanyingindex shows a decline of between one-fourth andone-fifth from 1929 to 1933, and the average for thecurrent year is about the same as in 1933.
Trend of the dollar volume of new passenger car sales, adjusted for seasonal variation.
INDEX NUMBER (1929-31 = 100)!80
20
0
D.D.85/9

September 1935 SUKVEY OF CUERENT BUSINESS 17
While the chart is based on actual sales totals,references to sales elsewhere in the article refer toregistrations which are the only unit data availablecurrently.
Registrations tended upward at a rapid pace duringthe last three-quarters of 1933 and throughout 1934.During the latter year, 1,888,557 new passenger carsand 403,886 new trucks were registered by ownersin the United States. While the automobile dealerswere selling these new cars to the public, it is esti-mated, by the National Association of Sales FinanceCompanies, that they also sold 4,020,000 used carsand trucks, or at the rate of 1.75 used machines pernew car.Registrations 44 Percent Higher Than in 1934
Following the outstanding performance in 1934,the industry has bettered substantially its accomplish-ment during the current year. During the first 6months of 1935, companies and individuals purchasedfrom motor-vehicle dealers 1,461,940 new passengercars and 254,063 trucks, paying for these vehicles asum estimated at approximately $1,460,000,000. Thefirst half year registrations were 44 percent greater in1935 than during the corresponding period of lastyear, while the increase over the same 6 months of1933 was 121 percent.
For passenger automobiles only, which are by far themost important as far as volume and profits are con-cerned, there were 466,385 more of these units regis-tered during the first 6 months of 1935 than in thecorresponding period of last year. Ten States ac-counted for some 282,000 of this increase, Californiaand Illinois leading with about 43,000 each; NewYork, Michigan, and Ohio accounting for about 30,000each; Indiana and Pennsylvania around 27,000;Texas, Wisconsin, and New Jersey between 15,000and 20,000 each.
The accompanying table shows the trend of newpassenger car registrations for the first 6 months ofthe past 3 years and comparable data for the corre-sponding months of 1929. The striking divergence ofsales during this period in the various regions andindividual States is immediately apparent.
One of the outstanding features of the registrationis that sales during 1935 in 3 of the 4 principal regionsrepresented almost the same percentages of the totalas in 1929; also that the percentage in the other areawas only moderately below the ratio for the other 3regions. This situation is in sharp contrast to thatprevailing in 1932 and 1933 when there existed verywide disparities relative to 1929 as between the differentregions. In comparison with 1933, it has necessitatedincreases of 141 and 130 percent, respectively, in theWest and South to bring the ratio up in these areaswhile the Eastern States were recording an increase of67 percent. A rise of 150 percent (the largest relative
12398—35 3
increase) was insufficient to pull the Middle WesternStates abreast of the balance of the country. TheWestern States showed the largest relative increasefrom 1934 to 1935; as compared with 1933 the largestincrease was in the middle-western area.
It is also of particular interest that in Georgia andthe District of Columbia there were more new carsregistered in the first half of the current year than in1929. In Georgia the increase over the first 6 monthsof 1934 was 3 percent, while in the District of Colum-bia there was an increase of 28 percent.
In the Western States the increase in registrationsfrom the first half of 1934 to the first half of 1935ranged as high as 100 percent in Montana, from 80 to85 percent in Idaho and Oregon, and from 70 to 80percent for California and Utah. In only two otherStates, South Dakota and Indiana, were 1935 salesmore than double the 1934 figures, but increases of 70percent or more occurred in four Middle WesternStates—Wisconsin, Illinois, Iowa, and Kansas.
In the East, the percentage changes from 1934 to1935 did not vary as widely as in other regions. NewYork and Pennsylvania, in which the registrationtotals were largest, each recorded increases of abouta third. Maine, with an increase of 15 percent, re-ported the smallest gain for any State.Commercial Gar Registrations Highest Since 1929
Motor-vehicle dealers in the United States de-livered to owners 254,063 new trucks during the first6 months of 1935, according to the registration figures.Registrations for this period were only 3.5 percentbelow the corresponding total in 1929, but were sub-stantially higher than for any intervening year.Sales were strong at the beginning of the year, morethan 34,000 units having been registered monthly inJanuary and February. March deliveries totaled41,511 units and during the second quarter theyamounted to more than 47,000 monthly. Each monthsince the beginning of the year has seen an increasein truck registrations over the preceding month—Julyfigures show registrations of 51,000 units, an increaseof 3,000 over June.Trends in Latter Half of Year
A substantial net increase in car and truck sales isindicated for 1935 by the results experienced to date,but it is improbable that the market will absorbmotor vehicles during the last 6 months of the yearat a rate equal to deliveries during the first half year,since over the past 10 years the first 6 months hasaccounted for 55 percent of the total yearly passenger-car registrations. This percentage has varied from 46percent in 1933 to 63 percent in 1931, but the averagefor the years when business activity was rising wasabout 53 percent.
In calculating the probable ratio for the year 1935,the factor of earlier new model introductions injects
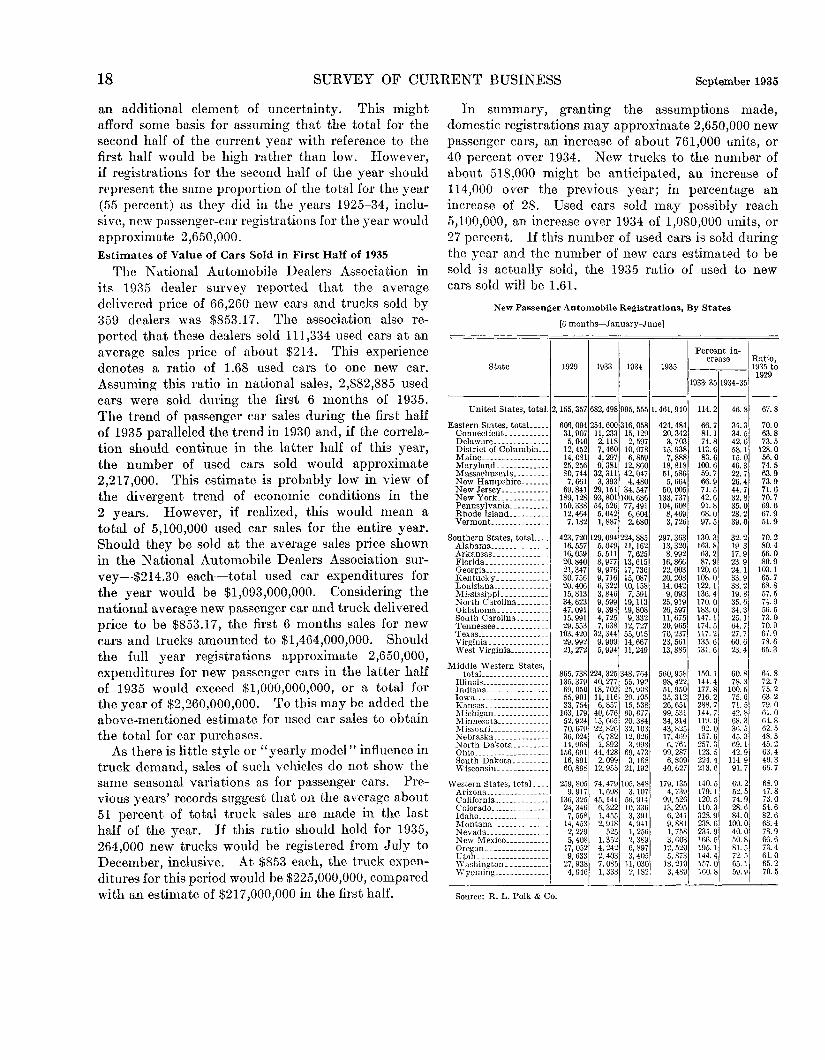
18 SURVEY OF CURRENT BUSINESS September 1935
an additional element of uncertainty. This mightafford some basis for assuming that the total for thesecond half of the current year with reference to thefirst half would be high rather than low. However,if registrations for the second half of the year shouldrepresent the same proportion of the total for the year(55 percent) as they did in the }^ears 1925-34, inclu-sive, new passenger-car registrations for the year wouldapproximate 2,650,000.Estimates of Value of Cars Sold in First Half of 1935
The National Automobile Dealers Association inits 1935 dealer survey reported that the averagedelivered price of 66,260 new cars and trucks sold by359 dealers was $853.17. The association also re-ported that these dealers sold 111,334 used cars at anaverage sales price of about $214. This experiencedenotes a ratio of 1.68 used cars to one new car.Assuming this ratio in national sales, 2,882,885 usedcars were sold during the first 6 months of 1935.The trend of passenger car sales during the first halfof 1935 paralleled the trend in 1930 and, if the correla-tion should continue in the latter half of this year,the number of used cars sold would approximate2,217,000. This estimate is probably low in view ofthe divergent trend of economic conditions in the2 years. However, if realized, this would mean atotal of 5,100,000 used car sales for the entire year.Should they be sold at the average sales price shownin the National Automobile Dealers Association sur-vey—$214.30 each—total used car expenditures forthe year would be $1,093,000,000. Considering thenational average new passenger car and truck deliveredprice to be $853.17, the first 6 months sales for newcars and trucks amounted to $1,464,000,000. Shouldthe full year registrations approximate 2,650,000,expenditures for new passenger cars in the latter halfof 1935 would exceed $1,000,000,000, or a total forthe year of $2,260,000,000. To this may be added theabove-mentioned estimate for used car sales to obtainthe total for car purchases.
As there is little style or "yearly model'' influence intruck demand, sales of such vehicles do not show thesame seasonal variations as for passenger cars. Pre-vious years' records suggest that on the average about51 percent of total truck sales are made in the lasthalf of the year. If this ratio should hold for 1935,264,000 new trucks would be registered from July toDecember, inclusive. At $853 each, the truck expen-ditures for this period would be $225,000,000, comparedwith an estimate of $217,000,000 in the first half.
In summary, granting the assumptions made,domestic registrations may approximate 2,650,000 newpassenger cars, an increase of about 761,000 units, or40 percent over 1934. New trucks to the number ofabout 518,000 might be anticipated, an increase of114,000 over the previous year; in percentage anincrease of 28. Used cars sold may possibly reach5,100,000, an increase over 1934 of 1,080,000 units, or27 percent. If this number of used cars is sold duringthe year and the number of new cars estimated to besold is actually sold, the 1935 ratio of used to newcars sold will be 1.61.
New Passenger Automobile Registrations, By States
[6 months—January-June]
State
United States, total.
Eastern States, totalConnecticut ..DelawareDistrict of Columbia.-.MaineMarylandMassachusettsNew HampshireNew JerseyNew York _.Pennsyl vaniaRhode Island _ _ ...Vermont
Southern States, totalAlabamaArkansas.. -FloridaGeorgia _ ._KentuckyLouisiana _ .MississippiNorth CarolinaOklahomaSouth CarolinaTennesseeTexasVirginia _West Virginia
Middle Western States,total _
IllinoisIndianaIowaKansas _ _MichiganMinnesota - _Missouri _NebraskaNorth DakotaOhio -_ --South DakotaWisconsin
Western States, totalArizonaCaliforniaColoradoIdahoMontana -- -NevadaNew MexicoOregon _UtahWashington _ _"Wyoming
1929
2, 155, 357
606, 09431, 9075,040
12, 45214, 08125, 25680, 7447,661
69, 841189, 128150, 33812, 4647,182
423, 72016, 55716, 05920, 84021, 34730, 75620, 40615, 81334, 62347, 09115,99129, 553
103, 42029, 99221, 272
865, 738135, 37969, 05055, 90133, 754
163, 17952, 92470, 07936, 02414, 968
156, 69116, 89160, 898
259, 8059,917
136, 32524, 3467,558
14, 4532,2295,408
17, 0529,633
27, 9384,946
1933
682, 498
254, 60011, 2332,1187,4604,2979,381
32,3113,393
29, 15193, 80154, 5265,0421,887
129, 0945,0495,5118,9779,9769,7166,3223,8469,5999, 3934,7257,638
32, 3449, 9995,994
224, 32540, 27718, 70211,1166,857
40, 67615, 66522, 8266,7821,892
44, 4282,099
12, 955
74, 4791,698
45, 1416,3221,4552,918
5251, 3524,2422,4037,0851, 338
1934
995, 555
316, 05815, 1292,597
10, 0786,859
12, 86042, 0474,480
34, 547100, 68677, 4916,6042,680
224, 88511, 1627,625
13, 61517, 73615, 08710, 1587,591
19, 11319, 8089,332
12, 72755, 01514, 66711, 249
348, 76455, 19225, 90820, 10515, 53869, 67720, 38432, 10312, 0263,998
69, 4733, 168
21, 192
105, 8483,107
56, 91410, 3363,3914,9411, 2562,3896,8973,405
11, 0302,182
1935
1, 461, 940
424, 48420, 3423,703
15, 9387,888
18,81861, 5865,664
50, 005133, 737104, 608
8,4693,726
297, 36313, 3208,992
16, 86622, 00320, 20814, 0429,093
25,91926, 59711,67520, 96570, 23723, 56113, 885
560, 95898, 42251,95035, 31226, 65199, 53134, 31443, 82517, 4896,761
99, 2876, 809
40, 627
179, 1354,739
99, 52613, 2956,2419,8811,7583, 603
12, 5205,873
18, 2103,489
Percent in-crease
1933-35
114.2
66.781.174.8
113.683.6
100.659.766.971.542.691.868.097.5
130.3163.863.287.9
120.6108.0122.1136.4170.0183.0147.1174.5117.2135.6131.6
150.1144.4177.8216.2288.7144.7119.092.0
157.6257.3123.5224.4213.6
140.5179.1120.5110.3328.9238.6234.9166. 5195.1144.4157.0160.8
1934-35
46.8
34.334.542.658.115.046.322.726.444.732.835.028.239.0
32.219.317.923.924.133.938.219.835.634.325.164.727.760.623.4
60.878.3
100.575.671.542.868.336.545.369.142.9
114.991.7
69.252.574.928.684.0
100.040.050.881.572.565.159.9
Ratio,1935 to1929
67.8
70.063.873.5
128.056.074.563.973.971.670.769.667.951.9
70.280.456.080.9
103.165.768.857.574.956.573.070.967.978.665.3
64.872.775.263.279.061.064.862.548.545.263.440.366.7
68.947.873.054.682.668.478.966.673.461.065.270.5
Source: R. L. Polk & Co.

September 1935 SURVEY OF CUERENT BUSINESS 19
PANAMA CANAL[Thousands of long tons]
MonthJanuary _ _ _ _ _ _ _ _February -
April - - - --M!ay - - - -Jun6July _ _August - _ - -September - -October - - -- -NovemberDecember -
Total -Monthly average
January - -February - - - - - - --IVTarchApril - -IVIayJune - -JulyAugust - -SeptemberOctoberNovember - - - -_December —
TotalMonthly average _ _
19U
111323425447453
1,759»352
1925
1,9071,8392,1041,9511,8231,9201,9601,9121 8922,0092,0232,358
23, 6981,975
1915426424607521584567715571465
12
4, 8923489
1926
2,3462,1392,6062,2372,4162,1332, 1852,3202,2392,3742,2712,308
27 574
2,298
19161
366480483623506645617512540
4,7734 477
1927
2, 2102,2292,5332, 4292,3782,2282,4492,4292,3972,7162,4882,572
29, 0882,424
1917640547571628596630664578724600695563
7,436620
1928
2,3712, 6592,4272,4732,4962,1392, 2912,4242,3132,5812,5002,713
29, 3872,449
1918
553473661627758629584534548657626630
7,280607
1929
2,8582,5492,7422,7182,5362,4232,5972,6802,4322,8442, 5332. 523
31,4352,620
1919
530563505507642586568716638705575fi24
7,459622
1930
2,6112,3772,5572,4562,2612,1472,4012, 1472,0582, 3932,2622, 165
27, 8352,320
1920894780894867975834886
1, 0401, 009
991985
1, 076
11,231936
1931
2, 106,929,914
2,009,924,757,865,788,754,763,577,649
22, 0351,836
19211,177
9531,084
908793695709839755985855952
10, 705892
19321,5941,6451, 6431,4421,6761, 4041, 259,348,346,581,531, 620
18, 0891, 507
1922807838960
1,0461,158
9771,2111, 1661, 1381,4461,4271,535
13, 70 J1, 142
1933
1,4621,4341,7371,5261,6281,6901, 6981,9131, 7962,1241, 9492, 191
21, 1481,762
19231, 5921,5631,9412,1872,2652, 0962,3382, 1682, 1692, 1272,2182, 495
25, 1592,097
1934
2,0862,1242, 4652,2912,3021,7671,9342, 1882, 1432,1732,3392,089
25, 9012, 158
19242,4272,2442,2722,159
. 2, 3542,0232,0971,9582,1122,0181,9622,266
25, 892
2,1581935
1,9451,8362,2102,0792,2922,081
1 Compiled by the Panama Canal Record, the official publication of the Panama Canal. This series supersedes the data that appeared on pages 118 and 119 of the 1932annual supplement and in the monthly issues of the SURVEY through the issue for the month of March 1935 wherein statistics were last shown for July 1934. The revision wascaused by changing the method of classifying vessels passing through the Canal. The figures now include cargo carried on all toll-paying vessels of 300 or more net tons(Panama Canal measurement). Previously the toll-paying traffic was classified by commercial vessels of 20 net tons or over, and launches under 20 tons. The new classifi-cation is intended to give a better indication of the ocean traffic of normal-sized ships by the exclusion of small local vessels.
2 Average of 5 months, August to December, inclusive.3 Average of 10 months, January to September, inclusive, and December.4 Average of 10 months, January and April to December, inclusive.
HOSIERY >[Thousands of dozen pairs]
Month
JanuaryFebruaryMarch _ _ ._ _ _ _ _ApfilMay -.JuneJulyAugust _ _ _ _ .SeptemberOctoberNovember _ _ _December.. -
TotalMonthly average
Shipments
1939
8,9539,025
10, 1409,612
10, 0209,8058,7239,599
10, 62211, 52010, 5588,343
116,9209,743
1930
7,6807,6378,2318,2248, 0867,4776,4697,6569,444
10, 3739,4557,959
98, 6908,224
1931
7,0317,9308,9568,7598, 5478,2536,8688,0768,8749,2918,6618, 110
99, 3548,280
1933
7,2237, 7268,6778, 1697,7957,7845,6818, 034
10, 40711, 22510, 3368,753
101,8118,484
1933
6,8067,5968,5798,788
10, 28812, 26510, 0618,7969,4788,9397,7176,023
105, 3368,778
1934
6,8208,242
10, 4889,4029,6118,4586,3498,6668,0789,7919,3088,220
103, 4338,619
1935
8,5888,7329,7689, 1809,1247,513
Production
1933
8, 1146, 177
1934
7,3029,092
10, 4719,878
10, 1328,4746,6747, 8386 9899, 5649,4668,001
103 8818, 657
1935
9,9969,2149,6929,3929,2037,121
Stocks, end of month
1933
15, 44315, 84015.994
1934
16, 56317, 50117, 57118, 13418, 74218, 84519 16418, 33217 23817, 00617, 15916.934
17, 766
1935
18, 34318, 82518, 74918, 96219, 04018, 649
1 Compiled by the National Association of Hosiery Manufacturers and based on the reports of 622 hosiery manufacturers operating 807 plants. This group of companiesand plants include some companies which began operating during the period July 1933-April 1935 and some which closed during that period. The statistics cover 96.5 per-cent of the plants of the country which account for about 98 percent of the total output of the industry. Stocks on hand in 1935 are computed by adding production to thestocks reported for December 1934 and subsequent months and subtracting shipments. For periods prior to 1935, the semiannual stock reports have been used to revise thestocks on hand which were computed each month. The statistics for shipments from January 1929 through June 1933 were estimated from the reports of the U. S. Bureauof the Census. Additional information is given in the monthly reports of the association.
CASH INCOME FROM SALES OF FARM PRODUCTS 1
[1924-29 = 100]
Month
January . _ _February.MarchApril _ _ _MavJuneJulyAugustSeptemberOctober _ _NovemberDecemberMonthly average
Crops andlivestock,combined
index
Un-ad-
justedAd-
justed
Crops,com-binedindex
Ad-justed
Livestock and productsadjusted
Com-binedindex
Dairyprod-ucts
Meatani-mals
Poul-tryandeggs
1933
41.030.533.036.550.052.058.549 558.067.560.549.0
49.0
44.037.038.047.564.070.078.551.050.048.551.553.553.0
40.533.034.549.073.085.5
101.046.546.043.547.059.055.0
47.041.542.045.554.554.555.055.554.554.556.047.550.5
58.051.550.051.057.557.562.564.066.566.568.564.560.0
33.034.536.541.050.053.049.549.545.042.545.535. 543.0
67.539.043.050.059.545.050.048.546.051.557.546.050.0
Crops andlivestock,combined
index
Un-ad-
justedAd-
justed
Crops,com-binedindex
Ad-justed
Livestock and productsadjusted
Com-binedindex
Dairyprod-ucts
Meatani-mals
Poul-tryandeggs
1934
51.046.049.045.550.050.059.563.573.582.064.056.057.5
54.556.058.560.059.065.573.065.556.058.055.556.060.0
57.557.061.565.561.075.589.573.062.052.545.552.563.0
51.055.055.553.557.555.555.557.050.064.066.559.556.5
58.562.567.064.065.564.566.071.071.572.575.073.567.5
46.048.046.047.552.048.547.547.556.556.056.549.550.0
53.057.564.055.056.555.054.557.562.065.077.563.560.0
i Computed by the U. S. Department of Agriculture, Bureau of Agricultural Economics, and represents a revision of the statistics on this subject shown on p. 19 of theMay 1934 and in subsequent monthly issues for the period January 1933-July 1935, inclusive. The revision of the indexes was occasioned by the availability of additionaldata which afforded a more accurate measurement of farm marketing. This information is shown in greater detail in a release of the Department o ]Agriculture, datedJuly 27, 1935 ,obtainable upon request. For 1935 data see p. 23 of this issue.

20 SURVEY OF CURRENT BUSINESS September 1935
UNITED STATES EMPLOYMENT SERVICE[Number]
Year and month
1933JulyAugustSeptember _OctoberNovember -December
TotalMonthly average
1934JanuaryFebruary _. .March _AprilMay .June -.- .-
New ap-plications
106, 123407, 269684, 190795. 773
2, 351, 0264, 719, 4219, 063, 8021, 510, 634
1, 892, 147404, 745363, 219319, 383282, 152309, 526
Place-ments
34, 78647, 596
118, 798203, 767475, 996
2, 221, 3203, 102, 263
517, 044
1,311,795547, 209485, 263501, 518530, 281473, 194
Applica-tions in
active file
2 8, 262, 7622 8, 357, 8902 7, 899 2222 7, 627, 375
Placementsper activeapplicant
059.060
067.062
Year and month
1934JulyAugustSeptemberOctoberNovemberDecember
TotalMonthly average
1935JanuaryFebruaryIVIarchAprilM!ayJune
New ap-plications
341 788370 705331 898340 Oil292 021233, 711
5, 481, 306456 776
321 318263 824266 496313 661379 573662^ 138
Place-ments
321 861309 736250 152283 013208 665170', 723
5, 393, 410449 451
153 606131 082185 108247 507271 7112481 568
Applica-tions in
active file
7 181 5147 127 5456 951 6906 786 3576 603 9706, 526, 875
6 467 7496 559 0536 384 7326 312 0606 094 1926, 713, 047
Place-ments peractive ap-
plicant
045043036042032
.026
024' 020
029039045
.037
1 Compiled by the U. S. Department of Labor, United States Employment Service. The service operates over 700 urban and district offices and several hundred additionalbranch and temporary offices. The operating organization is composed of 2 major branches. The first consists of State employment services, affiliated with the UnitedStates Employment Service, under the terms of the Wagner-Peyser Act whereby State appropriations are matched, within limits after the State service has conformed to theFederal operating standards. These State services function in 24 States. The second operating division is the National Reemployment Service, a Federal organization.Offices of this service provide employment service in portions of the affiliated States not covered by the State Employment Services and give complete coverage in all otherStates. Additional information showing the previous months' operations, a short account of some feature of the tabulated reports and summary tables giving a State-by-State monthly record of placements, applications and active file may be found in the monthly issues of the Monthly Labor Review of the U. S. Department of Labor.These series shown above began in July 1933.
2 Partly estimated.HOTELS—EMPLOYMENT AND PAY ROLLS '
[Monthly average 1929=100]
Month
JanuaryFebruaryMarchApril - -M!ayJune - _ _ _ -July _ _.AugustSeptember .. -October --NovemberDecemberMonthly average
Employment1929
97.899.5
100.299.999.9
100.199.7
100.5101.5101.2101.298.4
100. 0
1930
99.7101. 199.998.598.297.396. 195.294.694.692.290.196.5
1931
90.590.490.290.088.987.085.784.284.283.581.579.586.3
193378.878.678.577.976.274.072.070.770.871.470.669.474. 1
1933
68.868.667.267.268.269.569.670.472.473.072.373.970. 1
193476.478.980.481.581.881.980.480.080.080.980.680.080.2
1935
80.381. 180.881.181.681.380.3
Pay roll1929
98.7101.4102.4100.6100.199.299.197.899.2
101.0100.999.7
100.0
1930
99.8102.7102.599 298*. 897.795.994.193.193.491.489.196.5
1931
87.889.088.686.085.182.279.977.577.176.774.572.681.4
1932
70.569.568.166.164.261.057.554.954.955.854.953.960.9
193352.252.149.848.449.149.449.449.651.553.452.754.951.0
193457.260.962.262.762.962.961.560.261.062.762.462.261.6
193562.263.563.963.663.7'63.562.1
i Computed by the U". S. Department of Labor, Bureau of Labor Statistics, and represents a revision of data shown on pages 61 and 69 of the 1932 Annual Supplement andin the monthly issues through the month of May 1935. The occasion for the revision was the exclusion of employment and pay-roll data of resort hotels from the old series.The series now embraces data from hotels that are open the entire year. The data have been adjusted to the Census of American Business for 1933.
INDUSTRIAL DISPUTES 1
Year and month
1928192919301933:
JanuaryFebruaryMarchApril -MavJune - - - _ _JulyAugust --SeptemberOctober _ - - -NovemberDecember -_ _ _ _ - --- -
To till inprogress
687934674
8799
133119187187292330322254165112
Worker^involved
Numsie438, 374266, 305160, 457
21, 16919, 98947, 46336, 87464,89161,330
139, 099211, 524298, 480219, 846139, 20845,612
Man-days lost
r31, 556, 9479,975,2132, 730, 368
251, 829113,215348, 459551, 930664, 689576, 535
1, 505, 4081,570,5123, 873, 6623, 659, 5021,298,113
404. 993
Year and month
1931 _ .193219331934:
JanuaryFebruaryMarch.. _ _ _ _ _ _ _ _ . _ _ _ _AprilMayJune..- _ _ _ _ _ _JulyAugust _ _ _ _ _ _ _ _ _ _ _ _SeptemberOctober.. _ __November _ _ _December.. _ _ _ _ . _ _ _
Total inprogress
901829
1 574
121135216281326265258255233260203198
WorkersinvolvedISiumbei284, 443244 144813,134
80, 880119, 910127, 742199, 580249, 693106, 852219, 037122, 144486, 798102, 97198, 20173, 481
Man-days lost
r
6, 386, 1836 462 973
14 818,846
668, 501939, 580
1, 424, 8332,517,7492, 226, 0691, 676, 2652, 020, 1721, 735, 6724, 029, 155
852, 787841, 570376, 297
i Compiled by the U. S. Department of Labor, Bureau of Labor Statistics, and supersedes the series on the same subject that was shown for the last time on page 29 ofthe February 1935 issue. The above data were first included in the SURVEY in the March 1935 issue. The present series represent the number of disputes actually in prog-ress during the month whereas the series previously published represented the number of disputes in effect at the end of the month. The data on the new basis are availablemonthly beginning January 1933 and annually beginning 1928. For information representing industry and occupational classification refer to current issues of the MonthlyLabor Review, a publication of the 17. & Department of Labor. For 1935 data see p. 29 of this issue.
MASSACHUSETTS FACTORY EMPLOYMENT AND WAGES 1
[1925-27 = 100]
Month
January _ _ _ _ _ _ _FebruaryMarchApril _ _ _ _ _ -Mi ayJuneJuly - _ _ - _ - _AugustSeptemberOctober _ _NovemberDecemberMonthly average
Employment1932
61.764.764.260.158.453.851.755.860.963.861.058. 259.3
1933
57.259.455.355. 557.661.967.972.073.875.271.768.064.6
1931
67.471.872.973.672.468.266.567. 256. 567.666. 669.068.3
Pay rolls1932
49.752.952.146.741.939. 236.840.245.246.643.241. 244.6
1933
39. 141.636.637.441.546.252.156.258.258.254.651.747.8
1934
52.057.659.359.558.453.953.254.046.652.150.957.354.6
Weekly earnings1932
80.681.781.277.774.372.971.172.074.273.170.870.875.0
193368.370.166.267.472.174.776.778.178.977.476. 176.173.5
193477.280.281.480.880.779.180.080.382.577.176.483.079.9
1 Compiled by the Massachusetts Department of Labor and Industries and represents a revision of the data for the period January 1932 to December 1934, that appeared onp. 19 of the August 1933 and on pp. 28, 29, and 30 of the monthly issues since that date. This revision was occasioned by the adjustment of the monthly data beginningJanuary 1932 to conform to the trend indicated by the State Census of Manufactures for the year 1932. For 1935 data see pp. 28, 30, and 31 of this issue.

September 1935 SUEVEY OF CURRENT BUSINESS 21
WEEKLY BUSINESS INDICATORS[Weekly average, 1923-25 = 100]
ITEM
Business activity:New York Times**Business Week*1_
Commodity prices, whole-sale.
Dept. of Labor, 1926 = 100:Combined index (784).
Farm products (67 1Food (122)All other (595)
Fisher's Index, 1926-100:Combined index (120)
Copper electrolytic JCotton, Middling, spot . _
Construction contracts {
Distribution: Carloadings.Employment: Detroit, fac-
toryFinance:
Failures, commercialSecurity prices:
Bond pricestStock prices t
1935
Aug.21
87.866.8
80.880.786. 178.1
84.657.240.8
38.4
65.3
48.6
107.6105.6
Aug.17
88.166.5
80.580.385.378.0
83.756.543.4
42.9
64.1
70.2
49.9
107.9106.1
Aug.10
86.265.4
80.179.784.378.0
83.156.542.6
60.9
53.8
108.0104.5
Aug.3
86.865.4
79.678.483.477.9
82.956.544.1
62.3
48.4
108.2104.2
July27
86.463.8
79.277.182.277.9
82.656.544.9
47.6
62.2
66.6
54.3
108.2103.0
July20
85.564.4
79.177.282.077.9
81.756.545.2
36.5
61.9
52.8
108.3101.8
1934
Aug.25
76.558.1
76.971.875. 578.4
78.563.849.6
31.2
63.3
53.6
104.183.6
Aug.18
78.658.3
76.168.974.178.4
77.863.848.9
28.0
62.8
79.5
48.4
103.481.2
1933
Aug.26
84.964.5
69.658.265.074.4
70.463.835.3
19.7
66.5
80.1
98.092.5
Aug.19
89.364.1
69.357.564.474.2
70.363.834.2
26.9
67.1
76.7
98.288.5
TEM
Finance— Continued.Banking:
Debits outside N. Y.C t
Federal Reserve re-porting memberbanks: §
Deposits:Net demand ..Time
Loans, total _.Interest r'Vtes:
Call loansjTime loans t
Money in circulation J.Production:
AutomobilesBituminous coalfElectric powerfLumberPetroleumSteel ingots
Receipts, primary markets:Cattle and calves. -HogsCotton.Wheat
1935
Aug.24
78.7
158.9122.766.2
6.15.7
115.0
66.361.2
110.451.3
129. 167.1
102.931.761.9
113.9
Aug.17
69.0
157.5123.465.7
6.15.7
114.7
73.954.4
110.050.5
130. 164.5
97.427.336.9
143.1
Aug.10
78.8
155.5123.365.6
6.15.7
114.5
63.048.2
109.252.2
127.661.8
74.323.537.7
162.1
Aug.3
85.5
156.1122.765.3
6.15.7
113.9
91.052.2
1C9.349.4
126.560.5
59.426.135.8
155. 5
July27
74.0
156.4122.666.4
6.15.7
113.4
108.661.5
109. 543.8
131.359.2
62.629.133.8
110.2
July20
81.6
157. 2122.466.9
6.15.7
114.0
109.153.6
108.536.7
131.555.3
70.127.125.485.4
1934
Aug.25
64.7
127. 9126. 370.0
24.222.9
110.4
74.060.898.937.3
118.326. 3
215.537.241.956.9
Aug.18
67.3
128.0126.070.1
24.222.9
110.3
75.856.5
100.537.4
120.930.3
207.044.228.861.5
1933
Aug.26
59.1
101.8124.578.2
24.222.9
115.5
65.676.997.843.6
132.364.5
82.163.073.185.7
Aug.19
63.8
101.8124.978.9
24.226.3
115.8
70.775.499.042.0
132.868.4
81.163.750.068.5
* Computed normal = 100.^ Latest week is preliminary.
t Weekly average, 1928-30=100.$ Daily average.
§ 1933-35 indexes are based on reports from 91 cities; earlier data cover 101 cities.• Index revised. See weekly supplement of June 1, 1933, for explanation.
WEEKLY BUSINESS STATISTICS
ITEM
COMMODITY PRICES, WHOLESALECopper, electrolytic, New York dol. per lb—Cotton, middling, spot, New York dol. per lb—Food index (Bradstreet's) • dol. per lb—Iron and steel composite f.._ dol. per ton--Wheat, No. 2, Hard Winter (K. C.) dol. per bu_.
Banking: FINANCEDebits, New York City . mills, of dol—Debits, outside New York City mills, of dol—Federal Reserve banks:
Reserve bank credit, total mills, of dol—B ills bought mills, of dol _Bills discounted mills of dolU. S. Government securities mills, of dol—
Federal Reserve reporting member banks: §Deposits, net demand mills, of dol—Deposits, time _ __ ___ _ mills, of dol—Investments, total mills, of dol
U. S. Government securities mills, of dol—Loans, total mills, of dol—
On securities _ mills, of dolAll other mills, of dol—
Interest rates, call loans per cent —Interest rates, time loans percent-
Exchange rates:French franc (daily av.) cents—Pound sterling (daily av.) dollars--
Failures, commercial _ number—Money in circulation mills, of dol—Security markets:
Bond sales (N. Y. S. ^O-.thous. of dol. par value. .Bond prices, 40 corporate issues dollars. .Stock sales (N. Y. S. E.) thous. of shares--Stock prices (N. Y. Times) r dol. per share. .Stock prices (Standard Statistics) 1926=100..
Industrial (351) 1926=100 .Public utilities (37) ._ 1926=100—Railroad (33) . 1926=100—
PRODUCTION, CONSTRUCTION ANDProduction: DISTRIBUTION
Automobiles (Cram's estimate) numberBituminous coal (daily av.)— thous. of short tons—Electric power .mills, of kw-hr..Petroleurn. .. thous. of bbl_.Steel ingots (Dow- Jones' estimate) _pct. of capacity..
Construction-contract awards (da. av.) .thous. of dol__Distribution:
Freight-car loadings, total cars—Coal and coke cars .Forest products. cars—Grain and products cars—Livestock. __ cars—Merchandise, 1. c. 1 cars—Ore carsMiscellaneous _ _ .. cars—
Receipts:Cattle and calves thousandsHogs thousands—Cotton into sight —thous. of bales—Wheat, at primary markets thous. of bu—
1935
Aug. 24
0.079.1112.75
32.721.03
3,4293,646
2,46857
2,430
15, 7994,398
11, 1507,2837,4172,9804,437
.25
.25
6.6294.98198
5,586
73, 87096.34
10, 481102. 58
84.496.084.436.5
50, 5851,0431,8402,689
506,170
626, 373105, 11830, 75640, 45215, 042
159, 79435, 204
240, 007
325206161
9,058
Aug. 17
0.078.1182.71
32.681.02
2,9163,200
2,47756
2,430
15, 6614,426
11,1107,2727,3672,9794,388
.25
.25
6.6344.97203
5,571
66, 39096.60
11,111103. 04
85.296.685.837.2
56, 386927
1,8332,709
496,895
615, 00694, 82630, 54042, 81414, 279
159, 31434, 556
238, 677
30817796
11, 384
Aug. 10
0.078.1162.67
32.641.04
3,6823,652
2,47656
2,430
15, 4554,420
11, 1307,3017,3612,9814,380
.25
.25
6.6254.96219
5,562
57, 13096.739,729
101. 5382.094.278.934.6
48, 067820
1,8192,657
47
583, 74382, 90829, 66341, 45611, 285
157, 47332, 186
228, 772
23515298
12, 896
Aug. 3
0.078.1202.63
32.591.06
3,4533,965
2,46557
2,430
15, 5174,398
11, 1807,3807,3272,9674,360
.25
.25
6.6234.96
1975,629
56, 93096.889,744
101. 2281.593.976.335.6
69, 415889
1,8212,634
46
597, 08397, 16929, 25841, 7309,528
158, 91833, 004
227, 476
18816993
12, 373
July 27
0.078.1222.60
32.55.99
3,5483,429
2,46056
2,430
15, 5444,394
11, 2727,5077,4462,9974,449
.25
.25
6.6134.96221
5,509
50, 40096.897,464
100.0180.092.972.444.8
82, 8941,0471,8242,735
457,642
596, 462107, 51528, 66833, 3519,672
156, 33734, 013
226, 906
19818988
8,766
July 20
0.078.1232.58
32.42.95
4,1853,783
2,47257
2,430
15, 6184,380
11, 2577,4927,5053,0344,471
.25
.25
6.6334.96215
5,538
49, 90097.016,28298.8479.191.772.634.1
83, 255912
1,8072,739
425,863
593, 36694, 46828, 41633, 37910, 165
157, 34533, 274
236, 319
22117666
6,794
1934
Aug. 25
0.088.1352.34
32.221.07
2,8542,997
2,4575
202,432
12, 8184,5139,9116,6517,8143,2714,5431.001.00
6.6845.08218
5,361
72, 18093.254,08181.1769.979.165.737.0
56, 4551,0361,6482,465
205,016
605, 516105, 21621, 50536, 68332, 321
160, 68527, 745
221, 361
681242109
4,529
Aug. 18
0.088.1332.28
32.231.06
3,0353,117
2,4685
202,431
12, 8274,5059,9076,6607,8253,2944,5311.001.00
6.6745.09
1975,357
64, 74092.563,16978.8367.576.664.134.5
57, 854962
1,6742,519
234,495
601, 78896, 70822, 58439, 60731, 485
159, 89428, 668
222, 842
654287
754,896
1933
Aug. 26
0.088.0961.93
29.94.86
2,7532,740
2,2587
1502,094
10, 3784,5168,1005,1558,5053,7374,7681.001.00
5.4604.56326
5,607
47, 86087.79
11, 16589.7976.180.784.950.3
50, 0471,3101,6302,756
493,170
637, 510136, 80427, 18228, 72718, 804
168, 82238, 718
218, 453
259409190
6,815
Aug. 19
0.088.0931.91
29.91.84
3,4342,957
2,2407
1662,059
10, 3634,5348,1255,1868,5833,7954,7881.001.15
5. 2854.46312
5,622
47,30087.958,49585.9872.175.684.446.7
53, 9201,2841,6502,767
524,326
643, 406135, 92127, 34928, 72717, 358
169, 36439,511
225, 176
256414130
5,452
1933
Aug. 27
0.052.0871.75
28.84.47
2,6372,468
2,32135
4271,851
10, 1484,5807,0724,2169,3554,0105,3452.001.50
3.9203.46589
5,706
86, 79282.51
20, 95165.7657.755.191.334.7
19, 896887
1,4362,114
136,016
606,917106, 22921, 56036, 70332, 309
160, 73427, 745
221, 637
242336148
9,160
§ Statistics cover 91 cities since Jan. 10, 1934, and 90 cities before; 1 city was added to the series in order to offset the effect of 1 member bank which ceased reporting,t Revised series. See p. 19 of the January 1935 issue. • Aggregate price of 1 pound each of 31 commodities.

22 SURVEY OF CURRENT BUSINESS September 1935
Monthly Business StatisticsThe following summary shows the trend of industrial, commercial, and financial statistics for the past 13
months. Statistics through December 1931 for all series except those marked with an asterisk (*) will befound in the 1932 Annual Supplement to the Survey of Current Business, together with an explanation of thesources and basis of the figures quoted. Series so marked represent additions since the Annual was issued andsimilar information, if published, will be found in the places noted at the bottom of each page. Note, how-ever, that many revisions have occurred since the last Annual Supplement was published. A specialsupplement was included in the April 1935 issue, pages 57 to 72, inclusive. This supplement gavethe monthly averages of all current series for the years 1932, 1933, and 1934.
Data subsequent to July will be found in the Weekly Supplement to the Survey.
Monthly statistics through December 1931,together with explanatory footnotes and refer-ences to the sources of the data, may be foundin the 1932 Annual Supplement to the Survey
1935
July
1934
July August Septem-ber October Novem-
berDecem-
ber
1935
January Febru-ary March April May June
BUSINESS INDEXES
BUSINESS ACTIVITY ( Annalist) f
Combined index! normal=100._Automobile production! normal = 100..Boot and shoe production !__ .normal = 100. _Carloadings, freight normal = 100__Cement production normal- 100-.Cotton consumption normal = 100. _Electric power production.. .normal =100..Lumber production • normal = 100._Pig-iron production normal = 100._Silk consumption normal=100Steel ingot production! norinal=100._Wool consumption f normal = 100Zinc production normal = 100—
INDUSTRIAL PEODUCTION (F. B. B.)
Total unadjusted 1993-25— 100Manufactures, unadjusted... 1923-25= 100..
Automobiles! --- 1923-25=100Cement 1935-25—100Food products 1923-25=100..Glass, plate 1923-25=100Iron and steelf 1923-25=100..Leather and shoesf 1923-25=100..Lumber - 1923 25—100Paper and printing 1923-25= 100—Petroleum refining _ . 1923-25 = 100. _Rubber tires and tubes _ 1923-25=100Shipbuilding 1923-25=100..Textiles — 1923-25=100Tobacco manufactures 1923-25= 100..
Minerals unadjusted .- 1923-25=100Anthracite 1923-25= 100-Bituminous coal 1923-25= 100—Iron ore shipments .1923-25=100Lead 1923-25--* 100-Petroleum, crude 1923-25 = 100—Silver 1923-25=100Zinc -- 1923-25=100
Total, adjusted 1923-25=100..Manufactures, adjusted 1923-25 = 100. .
Automobiles! 1923-25 — 100Cement 1923 25— 100Food products - 1923-25=100Glass, plate 1923-25 = 100-Iron and steel! 1923-25=100Leather and shoes! 1923-25=100Lumber 1923-25=100Paper and printing . 1923-25=100Petroleum refining 1923-25-100Rubber tires and tubes 1923-25—100Shipbuilding 1923-25=100Textiles 1923-25=100Tobacco manufactures 1923-25=100—
Minerals, adjusted - 1923-25=100Anthracite —1923-25=100Bituminous coal 1923-25 = 100__Iron ore shipments 1923-25=100Lead 1923-25-100 .Petroleum, crude 1923-25 = 100Silver 1923-25 = 100Zinc. 1923-25 = 100-
80.883.5
107.058.445.980.7
104.365.750.064 058.3
71.9
t> 83*831006374
16864
v 107
V97~v 152
T84P51J>5010257
f 1376274
*86»86
q55274
16969
v 108
TP 104140
v H4v C3*55
5059
v 1347380
73.268.3
108.961.949.677.696.7
"54.040.658 2
•41.449.851.0
73718264
10091449829
156814173
139845258
10551
131345376747853
10292
°489929
156832878
1288563645253
1284057
71.262.4
108.359.643.882.494.1
"64.534.857 1
•34.748 252.5
73716762
1008738
10738
15778
14076
1358350609543
126395673726148
10686
°399736
157799580
1268050614744
1243960
66.553.192.559.146.858.592.4
•61.031.254 434.729 253.7
73705663
1228537
10233
15276
13363
1398762688552
125345871695150
12084
«388832
15279
13363
1258262644455
1223661
70.551.489.057.640.892.292.5
•58.131.875 536.664 666.2
75733753
11087409330
154731292
1298768716058
1233973
«74724146
10787418529
153821789
1208153653556
1223976
71.546.499.258.942.386.093.6
«54.833.360 843.493.968.0
74732647
10879458825
156801291
1288465731157
120387775
a 744048
10283
a 499226
1551071487
1258164651455
1213577
77.5«89.0110.763.143.984.397.8
"55.237.274 658.0
100.767.3
a 78764835
103105
« 578926
155921492
115857176
60120547686858845
102140°6510429
1541331897
143907272
601245374
83.6104.3124.266.237.997.098.5
«56.352.367 170.0
126.864.6
8887862590
155«77
9929
15110619
108128918282
491265075
•9190
1044291
174°8010733
15111527
103136947674
481315071
83,3100.7116.267.339.890.199.3
«63.958.168 269.3
101.065.9
9191
1112779
179a 8411029
15611048
105121927285
5212970798988
1034581
166°8010830
15510168
100133966781
501326574
81.5102.1116.866.843.182.598.8
°60.054.470. 162.3
102.764.6
« 9191
1303475
199a 81111
15310269
100124904587
5613055788886
1064777
183a 7210S
153938998
130975487
551325073
80.698.7
117.163.447.678.998.7
"61.650.968.358.8
129.767.2
8991
1415076
20574
111
15310388
100127797251
5713049788686
1105180
1850 67113
153889198
138876960
581304975
"79.375.8
« 116. 561.549.481.7
« 99. 3a 45. 8
51.566 758.6
154 465.0
8787
1086578
169
a 104
1609671
1011368871608062
1325073858486KK
7815566
o 113
160
561Q9
1348971695363
1315173
a 79. 5«83.6
« 100. 363.152.174.8
« 102. 2«52.5
49.361 857.1
125 370.6
80«84114717?
1656698
166952795
150978571
10556
« 13646768684
1005874
16266
a 102
16P• )21
a 1001389897
"795355
a 133
4779

September 1935 SURVEY OF CUREENT BUSINESS 23
Monthly statistics through December 1931,together with explanatory footnotes and refer-ences to the sources of the data, may be foundin the 1932 Annual Supplement to the Survey
1935
July
1934
July August Septem-ber October Novem-
berDecem-
ber
1935
January Febru-ary March April May June
BUSINESS INDEXES—Continued
MARKETINGS
Agricultural products* (quantity)1923-25= 100. _
Animal products 1923-25=100..Dairy products 1923-25= 100..Livestock 1923-25 = 100—Poultry and eggs 1923-25- 100-Wool - . 1923-25=100 .
Crops 1923-25=100—Cotton 1923-25=100—Fruits 1923-25=100-Grains 1923-25 =100Vegetables 1923-25=100-
Agricultural products, cash income receivedfrom marketings of:*t
Crops and livestock:Unadjusted 1924-29=100..Adjusted .1924-29=100..
Crops, adjusted .1924-29= 100. _Livestock and products, adjusted
1924-29=100..Dairy products, ad justed. .1924-29= 100. _Meat animals, adjusted— 1924-29=100..Poultry and eggs, adjusted. 1924-29 =100. _
STOCKS
D omestic stocks 1923-25 = 100Manufactured goods 1923-25= 100. _
Chemicals and allied prod. 1923-25= 100. _Food products 1923-25= 100. _Forest products .1923-25= 100. _Iron and steel products 1923-25= 100. _Leather 1923-25= 100. _Metals, nonferrous 1923-25=100Paper, newsprint 1923-25 = 100. _Rubber products 1923-25= 100. _Stone, clay, and glass .1923-25=100 .Textiles 1923-25=100
Raw materials 1923-25= 100. .Chemicals and allied prod .1923-25= 100. _Foodstuffs . -- .1923-25=100 _Metals 1923-25=100Textile materials 1923-25= 100. .
World stocks— foodstuffs and raw materials:Totalf .1923-25=100
Coffee— adj. for seasonal . . .1923-25= 100. _Cotton— adj. for seasonal— 1923-25=100..Rubber— adj. for seasonal f. 1923-25 =100..Silk— adj for seasonal 1923-25=100Sugar— adj. for seasonalf.. .1923-25=100 .Tea— adj. for seasonal .1923-25= 100. .Tin— unadjusted 1923-25= 100. _Wheat adj for seasonal 1923 25-100
7086
1455881
5105332885968
53.560.554.5
67.071.561.577.5
11110812189
11410179
15972
11317012611379
10290
155
136385
63
9210712410077
444783587
11975
59.573.089.5
55.566.047.554.5
1401141171081169679
14111510916213016190
198108173
»265J>396
22138724230914278
241
9311211812267
173745092
10154
63.565.573.0
57.071.047.557.5
1431081191031169678
14579
11216011916992
217105173
262»390
23137423829514174
237
10510210011663
105107160816982
73.556.062.0
50.071.556.562.0
1541091211031179379
15091
113161119187109217107217
*250*368
22137323426714674
228
1141001021117091
12921010458
108
82.058.052.5
64.072.556.065.0
1601081171001179479
15586
113150120198122208113254
v 236»>361
19136321027315379
211
89938691
1058184
134743876
64.055.545.5
66.575.056.577.5
1611071141001179681
16071
113152123200121202107269
*»229»363
17435420029414872
190
73847881
102366286663364
56.056.052.5
59.573.549.563.5
1591061161001189579
16348
11316011719811620793
263
*> 22937017135218629514566
196
6974887566344342672378
53.054.546.0
64.077.558.561.0
14310511586
1189583
16366
11316211817010716287
239
v 22434216335820829114071
190
6060775663183931692283
47.557.549.0
66.080.559.565.5
13410512280
1179680
16171
11316211515598
14090
226
f 222v 344
15036121531014294
171
5466766791354134672486
51.060.054.0
66.075.063.566.0
12610312275
1169680
15667
11315811714292
12593
208
v 224v 362
16236120530615393
161
57758961
111543919822790
55.569.066.5
72.081.567.674.0
11910111769
1149881
15160
11315711913287
11490
195
»224»35Q
151"364
211320162180162
6382
11661
1171304422893394
57.064.057.0
71.577. 567.578.0
11310211672
11310180
14962
114162121121849995
179
v 221f 369
158«357
20129515580
166
6181
1445298
31540196931
103
52.060.054.5
66.573.059.577.5
o 110« 105«117
83o 113
10279
15563
114168127114
"81a 93
101168
P 219
148«369
211
15169
1 CO
COMMODITY PRICES
COST OF LIVING (N. I. C. B.)
Total, all groups. ... 1923=100Clothing 1923=100 .Food 1923=100Fuel and light... 1923=100..Housing 1923=100 .Sundries 1923=100
FARM PRICES (Dept. of Agri.)§t
Total, all groups 1909-14=100Chickens and eggs 1909-14=100 _Cotton and cottonseed 1909-14=100Dairy products.. .1909-14=100 .Fruits 1909-14=100Grains 1909-14=100—Meat animals 1909-14=100Truck crops .1909-14 =100..Miscellaneous 1909-14= 100—
RETAIL PRICES
Department of Labor indexes:Coal 1913=100Food # 1913=100-
Fairchild's index:*Combined index Dec. 1930—100
Apparel:Infants' wear.., Dec. 1930=100..Men's Dec. 1930=100-Women's _ _ Dec. 1930=100
Home furnishings Dec. 1930=100Piece goods Dec. 1930=100..
82 674 483 383.770 593 1
102107102
«979896
1169385
150122
85 2
93.287.188 187.784.6
79 177.075 286.464 792 5
87769993
1139166
10294
159110
87 9
93.988.390 488.284.8
79 677 276 586.965 492 3
9686
10797
10110668
108125
162112
87 7
94.087.790 188 585.5
81 077 679 987.466 092 4
1031041109993
11282
133126
165117
87 7
94.087.789 888 987.6
80 977 579 187.566 492 8
1021081079998
10974
110137
166116
87 4
94.487.789 588 986.3
80 877 478 887.666 692 8
10112510710594
10972
107123
165115
87 4
94 387.388 889 286.1
80 877 378 487.566 893 0
10111910910785
11673
130113
165114
87 2
93 987.488 188 586.0
81 676 981 187.166 993 0
10711410811287
11596
117111
164119
86 8
93 987.487 988 285.8
82 476 383 587.167 493 0
11111910812190
114105188101
165122
86 6
93 487.487 888 285.8
82 476 083 387.167 993 0
10897
10211490
11111716292
164122
86 3
93 687.387 787 985.1
83 276 485 486.068 793 0
11110510311710511511715692
158124
86 3
93 887.487 788 184.8
82 975 085 183.969 692 5
10811010510798
11211812789
148124
86 1
93 587.387 888 284.6
82 774 584. 983.769 909 7
10410810399
1001021199686
147
1230 85 7
93 587.287 987 384.8
0 Revised. v Preliminary.* New Series. See pp. 16-19 of the May 1934 issue, cash income for marketings of agricultural products, p. 19 of the December 1932 issue, Fairchild price index and
pp. 19 and 20 of the March 1933 issue, marketings.§ Data for August 15, 1935: Total 106, chickens and eggs 111, cotton and cottonseed 97, dairy products98, fruits 87, grains 96, meat animals 129, truck crops 92,
miscellaneous 102.t Index of farm prices has been completely revised. For earlier data see p. 20 of the November 1934 issue. World stocks—revised total, rubber adjusted and sugar
adjusted indexes for January 1927-June 1932, appeared on p. 20 of the September 1932 issue. Cash income for marketings of agricultural products revised from January 1933-June 1935. For revisions see p. 19 of this issue.
# The data on retail prices of food until Aug. 15, 1933, were reported as of the 15th of each month. From then on the prices have been reported every 2 weeks. Themonthly figures for months subsequent to August 1933 represent the figure nearest to the 15th of the month.

24 SURVEY OF CURRENT BUSINESS September 1935
Monthly statistics through December 1931,together with explanatory footnotes and refer-ences to the sources of the data, may be foundin the 1932 Annual Supplement to the Survey
1935
July
1934
July August Septem-ber October Novem-
berDecem-
ber
1935
January Febru-ary March April May June
COMMODITY PRICES—Continued
WHOLESALE PEICES
Department of Labor index:Combined index (784) 1926=100—
Economic classes:Finished products - 1926=100—Raw materials 1926=100..Semimanufactures 1926=100—
Farm products 1926=100 .Grains 1926=100-Livestock and poultry 1926=100-
Foods 1926=100 .Dairy products 1926=100..Fruits and vegetables. 1926 = 100_ .Meats — 1926=100--
Other products 1926=100Building materials.. 1926=100..
Brick and tile 1926=100Cement — 1926 =100Lumber 1926 = 100—
Chemicals and drugs 1926=100Chemicals 1926=100..Drugs and pharmaceuticals!926= 100—Fertilizer materials — 1926= 100. .
Fuel and lighting .—1926=100-Electricity .1926 =100. .Gas 1926-100Petroleum products 1926= 100—
Hides and leather 1926=100..Boots and shoes 1926—100Hides and skins — 1926=100.Leather 1926=100
House-furnishing goods 1926 = 100.Furniture 1926=100.Furnishings 1926=100
Metals and metal products. 1926= 100.Iron and steel 1926=100Metals, nonferrous 1926=100Plumbing and heating equip-
ment 1926=100Textile products .. 1926=100.
Clothing 1926=100Cotton goods _. . 1926 = 100Knit goods 1926=100.Silk and rayon „ 1926=100Woolens and worsted 1926=100.
Miscellaneous 1926 =100Auto tires and tubes . 1926=100Paper and pulp 1926—100
Other wholesale price indexes:Bradstreet's (96) 1926=100.Dun's (300) 1926=100.
World prices, foodstuffs and raw materials:*Combined index 1923-25=100.
Coffee 1923-25=100.Copper 1923-25=100Cotton . _ 1923-25=100Rubber ..1923-25=100.Silk 1923-25=100Sugar 1923-25=100Tea- 1923-25=100Tin 1923-25=100Wheat 1923-25=100.
Wholesale prices, actual. (See under respec-tive commodities.)
PURCHASING POWER OF THEDOLLAR *
Wholesale prices . _. 1923-25=100Retail food prices 1923-25—100Farm prices t- 1923-25=100Cost of living . 1923-25=100
79.4
82.075.872.877. 178.382.882.174.065.193.378.085.289 194.981.778.784.674.065.774.7
52.989.397 879.880 280.476.884 086.487 066 1
68.870.280.782.059.927.976.467 745 079 7
76.890.9
48.540.556.344.928.320 258.665. 1
104.051.2
126.9123 2144.123 3
74.8
78.268.372.764 574.848.870 674.868.263.478 487.091 393 985 375 478 573.067 673.992 499 251.386 3qg o66 675 181.678 584 886.886 768 8
75 071.581 985 159.524 580.769 944 682 4
72 189.0
47.053.963 547 434.215 941 666 4
103 348.4
134 6136 2168 9128 7
76.4
79.271.672.669.886.056.273 977.365.669.478 385.891 393 981.875 779.272.764.874.692.699 251.683.897 957.471 381.878.984.686.786 668.9
75.070.879.586.459.324.478.970.244.782 4
73.489.7
50.456.863 549.336.215 843.467 5
103.359.4
131.8134 0153.1127.9
77.6
80.173.971.873.488.164.176 176.266.076.678 385.691 393.982.376 580.372.766.474.695.299 351.384.197 960.470 681.878.884 886.686 568 4
71.671.179 787.859.924.378.070 244.782 4
73.290.2
50.156.863 548 236.015 749.464 2
102 454.5
129 7128 2142.7125 6
76.5
79.272.171.570.685.055.374.877.167.670.078 085.291 293.982.077. 181.173.565.774.694.596 950.483.897.759.770 581.77ft. 084 486.386 268.1
68.170.379.186.660.524.874.869.744.782 4
71.889.1
48.355.963 546.032.716 649.966.6
101.348.8
131.6129 5144.1125 8
76.5
79.372.271.170 887.254.075 178.665.368.478 085.091 293 981.276 980.973.564.674.494.092 450.584.297 363.170 881.378.484.386.286 067.7
68.869.778.484.461.025.874.170.647.582 1
71.990.2
48.254.963 546.330.518 050.964 5
101.948.3
131.6130 4145.6125.9
76.9
79.573.171.072 091.557.275 379.662.469.078 085.191 293 981.277 882.273.465.373.793.189 349.885.197.267.471 881.278.284 285.985 667.5
68.870.078.484.361.927.174.071.047.581 5
73.591.8
48.955.463 546.730.319.051.161.3
101.251.4
130.9131 1145.6125.9
78.8
80.876.671.277 688.873.379 983.562.881.677 784.991 193 979.979 384.573.166.572.989.987 648.886.297.171.174 381.278.284.385.885.767.6
68.070.378.484.163.528.673.870.747.581.5
75.793.7
47.954.463.546.730.718.847.461.4
101.249.8
127.7126.4137.4124.7
79.5
81.577.471.779.187.478.482 787.063.687.977 485.090 693.980.580.486.573.166.272.590.387.748.786.097.269.674.680.777.284.185.886.167.2
67.170.178.583 363.628.173.670.147.580.9
75.893.7
47.650.963.546.330.120.049.662.199.448.3
126.6122.9132.5123.6
79.4
81.776.671.878 382.885.881 982.963.291.677 384.990 294.479.981.588.173.066.373.088.388 649.885.497.266.674 280.777.384.185.786 067.1
67.269.478 582.462.527.373.169.246.680.6
74.891.4
46.846.063.542.326.818.553.161.793.351.0
126.9123.2136.1123.6
80.1
82.377.572.380 487.985.984.584.967.394.377.284.689 794.979.981.087.273.866.072.887.888 051.086.397.271.274.980.777.184.285.986.068.2
67.169.278.581.861.627.673.168.746.380.4
75.893.4
48.243.563.543,026.919.458.465.899.750.9
125.8120.8132.5122.4
80.2
82.477.673.580.683.287.684.177.766.397.077.684.889.394.979.881.287.574.265.973.188.792.052.288.397.276.179.680.677.184.186.686.669.2
67.169.478.582.760.427.673.568.745.080.0
76.792.4
49.542.063.545.228.119.859.465.3
101.753.4
125.6120.8136.1122.9
79.8
82.276.473.978 ^76.984.882.874.668.794.578.085.389 294.981.680.786.374.365.774.290.295 253.288.997.378.080.580.577.183.986.987.169.1
66.270.180.782.559.527.275.668.445.079.7
76.290.7
48.541.062.443.829.319.260.361.0
101.650.2
126.3121.8141.4123.2
CONSTRUCTION AND REAL, ESTATE
CONSTRUCTION CONTRACTSAWARDED
Contracts awarded, F. R. B.:%Total, unadjusted 1923-25=100
Residential 1923-25 = 100. .Total, adjusted 1923-25=100..
Residential 1923-25 = 100. .F. W. Dodge Corporation (37 States) : A
Total, all types:Projects numberValuation thous of dol
Nonresidential buildings: tProjects numberFloor space thous. of sq. ft..Valuation thous. of dol..
40253625
10, 930159 250
3,3258,288
56, 969
30122712
7,182119 663
2,9058,275
60, 751
28102710
7,625120 015
3,1348,996
50, 816
30112911
7,666110 151
2,7877,524
42, 309
29123112
10, 013135 225
3,5357,885
43, 686
28113111
7,505111 692
2,6967,258
39, 440
25103112
5,77192 685
2,1704,939
28,067
22102712
6,45899, 774
2,5265,622
32, 958
24132814
6,13575, 047
2,3494,985
30, 613
26162616
8,929122, 941
3,1036,994
44, 477
30222718
10, 570124, 020
3,3887,774
41, 328
32252721
10, 499126, 720
3,1779,073
50, 433
"3526
« 30a 24
10, 450148 005
3,0699,075
59, 036« Revised.* New series. For earlier data on the following subjects refer to indicated pages of the monthly issues as follows: World prices, p. 20, September 1932; Purchasing
Power of the Dollar (except for farm prices), p. 18, August 1933.t Revised series. For revisions of construction contracts awarded on nonresidential buildings for years 1930, 1931, and 1932, refer to p. 20 of the September 1933 issue.
Farm prices (purchasing power) are on p. 20 of the April 1935 issue.A A continuation of the statistics shown on pp. 30 and 32, of the 1932 annual supplement, by classes, for the years 1932 and 1933 was published on p. 19 of the August
1934 issue.$ Indexes are based on 3-month moving average of F. W. Dodge data centered at second month.
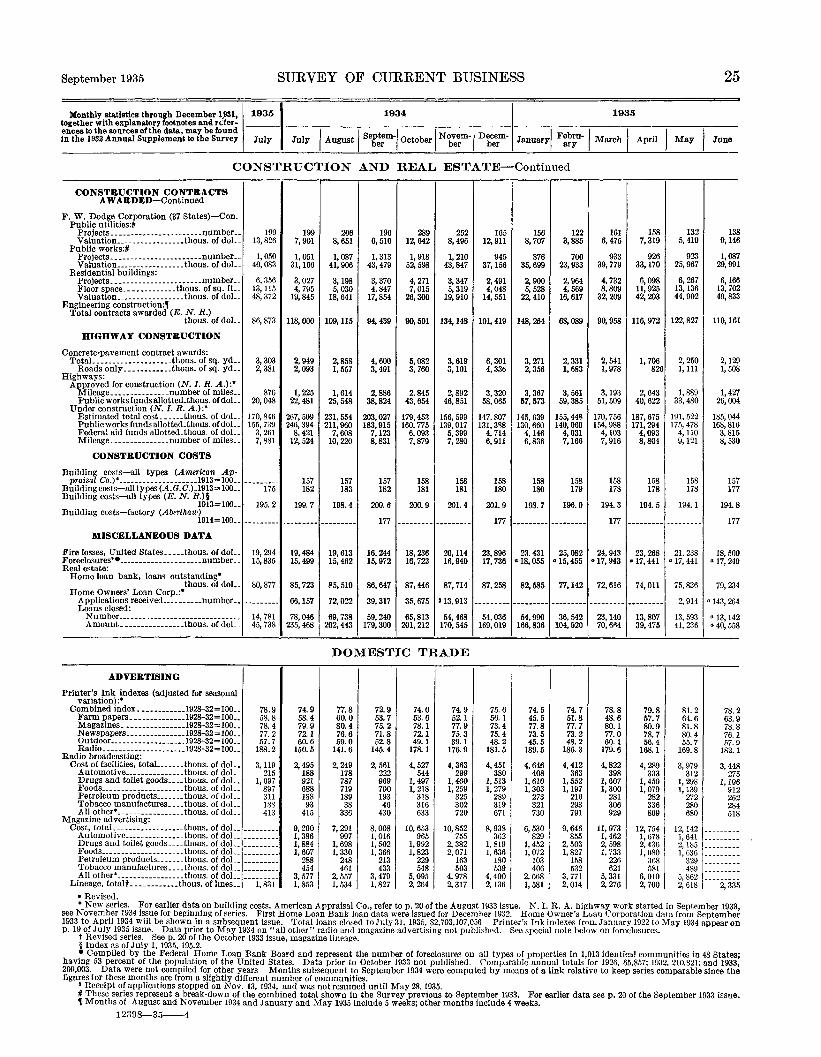
September 1935 SURVEY OF CURRENT BUSINESS 25
Monthly statistics through December 1931,together with explanatory footnotes and refer-ences to the sources of the data, may be foundin the 1932 Annual Supplement to the Survey
1935
July
1934
July August Septem-ber October Novem-
berDecem-
ber
1935
January Febru-ary March April May June
CONSTRUCTION AND REAL, ESTATE—Continued
CONSTRUCTION CONTRACTSAWARDED— Continued
F. W. Dodge Corporation (37 States)— Con.Public utilities:*
Projects number-Valuation ..thous. of doL.
Public works:#Projects -- number..Valuation thous. of dol..
Residential buildings:Projects number..Floor space.. _. thous. of sq. ft._Valuation— thous. of dol..
Engineering construction^Total contracts awarded (E. N. R.)
thous. of doL .
HIGHWAY CONSTRUCTION
Concrete-pavement contract awards:Total . -thous. of sq. yd..
Roads only __thous. of sq. yd..Highways:
Approved for construction (N, 7. R. A.):*Mileage number of miles..Public works funds allotted.thous . of dol - _
Under construction (N. I. R. A.):*Estimated total cost thous. of dol._Public works funds allotted.thous. of dol . .Federal aid funds allotted -thous. of dol._Mileage number of miles
CONSTRUCTION COSTS
Building costs— all types (American Ap-praisal Co.)* 1913=100
Building costs— all types (A . 0. C.) .1913 - 100. .Building costs— all types (E. N. /?.)§
1913=100..Building costs— factory (Aberthaw)
1914=100..
MISCELLANEOUS DATA
Fire losses, United States thous. of doL.Foreclosures** numberReal estate:
Home loan bank, loans outstanding*thous. of dol..
Home Owners' Loan Corp.:*Applications received number..Loans closed:
NumberAmount thous. of dol
19913, 826
1,05040, 083
6,35613, 11548, 372
86, 873
3,3032,381
87620, 048
170, 846155, 739
3,2617 881
175
195.2
19, 29415 835
80, 877
14 78145, 738
1997,901
1,05131, 166
3,0274,795
19,845
118, 000
2,9492,093
1,22522, 481
267, 509246, 394
8,42112 524
157182
199.7
19, 48415 499
85, 723
66, 157
78 046235 468
2068,651
1,08741, 906
3,1985,030
18, 641
109, 115
2,8581,557
1,61425, 548
231, 554211, 960
7,60810 220
157183
198.4
19, 61315 462
85, 519
72, 022
69 738202 443
1966,510
1,31343, 479
3,3704,847
17, 854
94, 439
4,6003,491
2 88638,824
203,027183,915
7,1238 831
157182
200.6
177
16,24415 972
86, 647
39 317
59 240179 300
28912, 642
1,91852, 598
4,2717,015
26, 300
90,501
5 0823,760
2 84543, 654
179, 453160, 775
6,0937 879
15̂181
200.9
18,23616 723
87, 446
35 675
65 813201 212
2528,496
1,21043, 847
3,3475,319
19, 910
134, 148
3 6193,101
2 89246, 851
156, 599139, 017
5,3997 280
158181
201.4
20, 11416 940
87,714
« 13 913
54 468170 545
16512,911
94537, 156
2,4914,048
14, 551
101,419
6 3014,336
3 32058, 065
147. 807131, 388
4r7146 911
158180
201.9
177
23,89617 736
87, 258
54 036169 019
1568,707
87635, 699
2,9005,528
22, 410
148, 264
3 2712,356
3 36757, 573
145,639130, 660
4,1466 836
158180
198.7
23. 431a ig 055
82,585
54 990166 836
1223,885
70023, 933
2,9644,569
16, 617
68, 089
2,3311,683
3,56159, 385
155, 448140, 060
4,0317 166
158179
196.0
25, 082a 15 455
77, 142
36 542104 920
1616,475
93339, 779
4,7328,809
32, 209
90,958
2,5411,978
3,19351, 509
170, 756154, 988
4,1037 916
158178
194.3
177
24, 943a 17 943
72, 616
23 14070 664
1587,319
92633, 170
6,09811,92542, 203
116, 972
1,706826
2,64340, 622
187, 675171, 294
4,0938 804
158178
194.5
23, 268a 17 441
74, Oil
13 80739 475
1325,419
92325, 967
6,26713, 13644, 902
122, 827
2,2501,111
1,88933, 480
191, 522175, 478
4,1109 121
158178
194.1
21, 238a 17 441
75, 836
2 914
13 59341 236
1389,146
1,08729, 991
6,16613, 70249, 833
110,161
2,1291,508
1,42726, 004
185, 044168, 816
3,8158 530
157177
194.8
177
18, 500o 17 249
79, 234
a 143 264
a 13 142o 40 558
DOMESTIC TRADE
78.263.978.876.157.9182.1
3,448275
1,106912262284518
ADVERTISING
Printer's Ink indexes (adjusted for seasonalvariation) :*
Combined index... 1928-32=100.. 78.9 74.9 77.8 72.9 74.0 74.9 75.6 74.5 74.7 78.8 79.8 81.2Farm papers .1928-32=100,. 58.8 58.4 60.0 53.7 53.6 52.1 56.1 45.5 51.8 48.6 57.7 64.6Magazines .1928-32=100.. 78.4 79.9 80.4 75.2 78.1 77.9 73.4 77.8 77.7 80.1 80.9 81.8Newspapers .1928-32=100,. 77.2 72.1 76.6 71.8 72.1 75.3 75.4 73.5 73.2 77.0 78.7 80.4Outdoor 1928-32=100.. 57.7 60.6 59.0 52.8 49.1 39.1 48.2 45.5 48.2 60.1 56.4 55.7Radio 1928-32=100.. 188.2 150.5 141.6 145.4 178.1 176.9 181.5 189.5 186.3 179.6 168.1 169.8
Radio broadcasting:Cost of facilities, total .thous. of dol-. 3,119 2,495 2,249 2,561 4,527 4,363 4,451 4,646 4,412 4,822 4,289 3,979
Automotive thous. of dol.. 215 188 178 222 544 299 380 408 363 398 333 312Drugs and toilet goods thous. of doL. 1,097 921 787 969 1,497 1,460 1,513 1,610 1,552 1,607 1,450 1,298Foods thous. of doL. 897 688 719 700 1,218 1,259 1,279 1,303 1,197 1,300 1,079 1,139Petroleum products thous. of doL. 311 188 189 193 318 325 289 273 216 281 282 272Tobacco manufactures thous. of dol__ 188 93 38 46 316 302 319 321 293 306 336 280Allother* thous. of dol._ 413 415 336 430 633 720 671 730 791 929 809 680
Magazine advertising:Cost, total,.- thous. of dol 9,200 7,291 8,008 10,653 10,852 8,938 6,530 9,646 11,973 12,754 12,142
Automotive . thous. of dol 1,386 997 1,016 965 755 362 829 855 1,462 1,678 1,641Drugs and toilet goods thous.of dol 1,884 1,698 1,502 1,992 2,382 1,819 1,452 2,503 2,598 2,436 2,185Foods thous. of dol 1,607 1,330 1,366 1,823 2,071 1,636 1,072 1,827 1,733 1,080 1,636Petroleum products thous. of dol 288 248 213 229 163 180 103 158 226 368 329Tobacco manufactures thous. of dol 454 461 433 548 503 539 406 532 621 581 489Allother* -thous. of dol 3,577 2,557 3,479 5,095 4,978 4,400 2,668 3,771 5,331 6,010 5,862
Lineage, totalf-- thous. of lines.. 1,831 1,853 1,534 1,827 2,264 2,317 2,136 1,581 2,014 2,276 2,700 2,618 2,335• Revised.* New series. For earlier data on building costs, American Appraisal Co., refer to p. 20 of the August 1933 issue. N. I. R. A. highway work started in September 1933,
see November 1934 issue for beginning of series. First Home Loan Bank loan data were issued for December 1932. Home Owner's Loaxi Corporation data from September1933 to April 1934 will be shown in a subsequent issue. Total loans closed to July 31, 1935, $2,703,107,056 Printer's Ink indexes from January 1922 to May 1934 appear onp. 19 of July 1935 issue. Data prior to May 1934 on "all other" radio and magazine advertising not published. See special note below on foreclosures.
t Revised series. See p. 20 of the October 1933 issue, magazine lineage.§ Index as of July 1, 1935, 195.2.• Compiled by the Federal Home Loan Bank Board and represent the number of foreclosures on all types of properties in 1,013 identical communities in 48 States;
having 53 percent of the population of the United States. Data prior to October 1933 not published. Comparable annual totals for 1926, 65,857; 1932, 210,821; and 1933,209,003. Data were not compiled for other years Months subsequent to September 1934 were computed by means of a link relative to keep series comparable since thefigures for these months are from a slightly different number of communities.
2 Receipt of applications stopped on Nov. 13, 1934, and was not resumed until May 28,1935.# These series represent a break-down of the combined total shown in the Survey previous to September 1933. For earlier data see p. 20 of the September 1933 issue.1 Months of August and November 1934 and January and May 1935 include 5 weeks; other months include 4 weeks.
12398—35 4

26 SURVEY OF CUREENT BUSINESS September 1935
Monthly statistics through December 1931,together with explanatory footnotes and refer-ences to the sources of the data, may be foundin the 1932 Annual Supplement to the Survey
1935
July
1934
July August Septem-ber October Novem-
berDecem-
ber
1935
January Febru-ary March April May June
DOMESTIC TRADE—Continued
ADVERTISING— Continued
Newspaper advertising:Lineage, total (52 cities)* thous. of lines..
Classified -- thous. of lines- _Display -thous. of lines_-
Automotive thous. of lines.-Financial thous. of lines_.General thous. of lines-.Retail thous. of lines. _
GOODS IN WAREHOUSES
Space occupied, public merchandise in ware-houses percent of total ..
NEW INCORPORATIONS
Business incorporations (4 States). .number. _
POSTAL BUSINESS
Air mail, mile performance* -thous. of poundsMoney orders:
Domestic, issued (50 cities):Number thousands..Value thous. of doL.
Domestic, paid (50 cities):Number thousands. .Value - thous. of doL.
Foreign, issued— value thous. of doL.Receipts, postal :1
50 selected cities .thous. of doL.50 indutsrial cities.- __.thous. of doL.
RETAIL TRADE
Automobiles:*New passenger car sales:
Unadjusted 1929-31 =100--Adjusted.— 1929-31 = 100..
Chain store sales:Chain Store Age index:*t
Combined index (18 companies)!av. same month 1929-31 = 100. .
Apparel index (3 companies)!av. same month 1929-31=100..
Grocery (5 companies)!av. same month 1929-31= 100..
Five-and-ten (variety) stores:*Unadjusted 1929-31=100..Adjusted .1929-31 =100..
H. L. Green Co., Inc.:*gales thous. of dol__Stores operated number. _
S. S. Kresge Co.:Sales thous. of dol__Stores operated number..
S. H. Kress & Co.:Sales -- thous. of dol__Stores operated - number..
McCrory Stores Corp.:Sales thous. of dol_.Stores operated ..number..
G. C. Murphy Co.:Sales thous. of dol..Stores operated number..
F. W. Woolworth Co.:Sales thous. of dol_.Stores operated number
Restaurant chains (3 companies) :Sales thous. of doL,Stores operated number
Other chains:W T. Grant & Co.:
gales thous. of d o l _Stores operated - number. _
J. C. Penny Co.:Sales thous. of dol..Stores operated number
Department stores:Collections:*
Installment accountpercent of accounts receivable
Open accountnprnput of accounts receivable. _
87, 36318, 29969, 0646,4151,926
16, 86243, 861
2,142
0)
3,51234,607
11,35889,525
23, 1232, 866
89.081.0
97
101
91
82.292.5
2,049137
10, 004735
5,884232
2,493205
2,354188
20, 16f1,965
6,276469
15,9151,478
83, 18316, 47566, 7097,0761,718
15, 27942, 636
65.8
2,048
454, 193
3,27032, 670
9,78483, 7272,043
21,4192,661
73.967.0
93
88
85
79.789.5
1,840131
9,472724
5,336227
2,365200
2,076181
19,5151,949
3,265372
« 5, 736458
13, 9671,465
15.0
40.7
87, 69217, 79069, 9026,5141,219
13, 76948, 401
66.0
2,013
511,006
3,28632, 795
10, 25388, 0452,299
23,1982,758
63.156.0
93
97
87
79.990.3
1,974132
10, 252726
5,574227
2,419195
2,118181
20, 7951,951
3,623372
6, 295458
16, 1191, 467
16.0
38.9
96,37817,93678, 4424,8411,193
16, 10356, 305
63.9
1,788
487, 707
3,13831, 753
10, 37587, 9762,507
23,5272,664
51.953.0
95
99
86
85.589.5
2,081131
10, 414727
5,685227
2,390194
2,105181
21, 3421,954
3,520369
6,572461
19, 9841,468
15.6
39.0
108, 81018, 60590, 2053,9171, 653
22, 03962, 595
63.2
2,140
580, 239
3,91536, 639
12, 620111,756
1,985
27,5273,106
47.359.0
92
101
85
91.390.0
2,327130
11, 499728
6,367230
2,777194
2,481184
23, 3041,954
3,725368
7,822462
21, 2421,469
17.1
44.3
106, 99917,41489, 5853,5921,285
19, 09565, 614
65.7
2,092
516, 205
4,39434, 306
12, 049102, 390
2,267
25, 8252,825
39.263.0
93
102
85
92.991.5
2,289130
11,285731
6,182232
2,658194
2,426185
22, 3321,956
3,444365
7,494464
21, 3811,473
16.7
44.1
105, 66917, 38988, 2803,9201,432
13, 48269, 446
67.1
2,106
581, 405
4,04038,328
13, 142101, 699
5,567
33, 1643,930
27.749.0
94
99
86
163.988.9
4,446130
21,213731
12,412232
5,526194
4,471186
39, 5661,954
3,766367
14, 212465
29, 3001,474
16.5
43.9
88, 05515, 78172, 2746,2602,083
14, 98948, 942
66.3
2,608
508, 804
3,78036, 429
11,91690,7102,217
25, 8273,112
51.575.0
92
95
86
67.290.2
1,557128
8,488732
4,762232
2,148207
1,803186
17, 1481,955
3,418361
5,166465
12,9051,474
16.4
45.7
85, 43015, 32370, 1084,1831,450
16, 93947, 535
65.2
2,159
528,398
3,62533,812
10, 77782,7172,148
24, 1182,907
72.786.5
96
96
88
75.890.8
1,609128
8,975732
4,968232
2,317205
1,891186
18, 2191,956
3,193359
5,571465
12, 0391,474
16.3
41.6
110, 06719, 49090, 5775,5602,052
20, 21562, 751
64.5
2,356
643, 044
3,91136,834
12, 82295, 6742,579
27, 3133,049
100.294.5
96
105
88
78.193.0
1,981129
10, 328734
5,472232
2,667205
2,266186
20, 4831,960
3,562359
6,953466
15, 5071,474
18.0
43.9
112, 80319, 84492, 9607,4671,894
20, 31363, 286
63.6
2,318
0)
3,80536, 700
12, 44494, 3932,415
26, 7753,110
116.778.5
96
104
89
92.990.6
2,384132
11, 518734
6,441232
3,027205
2,576186
22, 3821,960
3, 458357
7,663467
17, 5971,478
17.4
43.8
115,85420, 17495, 6808,9881,614
20, 50464, 584
63.1
2,329
0)
3,71435, 237
12, 17792, 9752,149
27, 3653,222
98.470.0
92
100
89
86.086.0
2,158132
10, 872735
5,934232
2,612205
2,420186
21,0501,962
3, 4P 5356
7,430469
16, 9801,478
17.1
45.3
102, 21020, 06182, 1498, 4261,642
18, 04254, 038
62.4
2,179
(0
3,55233, 807
12, 02387, 441
24, 6792,829
104.978.5
96
99
90
<* 86. 1°90.7
2,229131
11,048736
5,700233
2,817205
2, 584188
21,1131,965
3,195358
7,654469
17, 9291,478
16. 1
i Temporarily discontinued by the reporting source. Revised.* New series. For description of Chain Store Age indexes see p. 19 of the December 1932 issue. Comparable data of H. L. Green Co., Inc., sales prior to July 1933 not
available. For earlier data on automobiles see p. 19 of the April 1934 issue and variety store sales p. 18 of the March 1934 issue. Data prior to October 1933 on collectionsnot published. Data are currently being received from about 400 stores on open accounts and about 250 on installment accounts. New series on air mail not available priorto May 1934. Series on basis of weight carried was published in the Survey for the period February 1926 to December 1933
t Revised series. For revisions refer to the indicated pages of the monthly issues as follows: Apparel sales index of Chain Store Age, p. 26, October 1933. Combinedindex and grocery index of Chain Store Age were revised for period January 1932 through August 1934. See footnote on p. 26 of the November 1934 issue.
1 Monthly data from January 1932 through June 1935 are on page 20 of the July 1935 issue.• The New York Evening Post series on newspaper advertising in 22 cities is available for the period 1916 through January 1933. See the 1932 annual supplement and
monthly issues prior to December 1934.
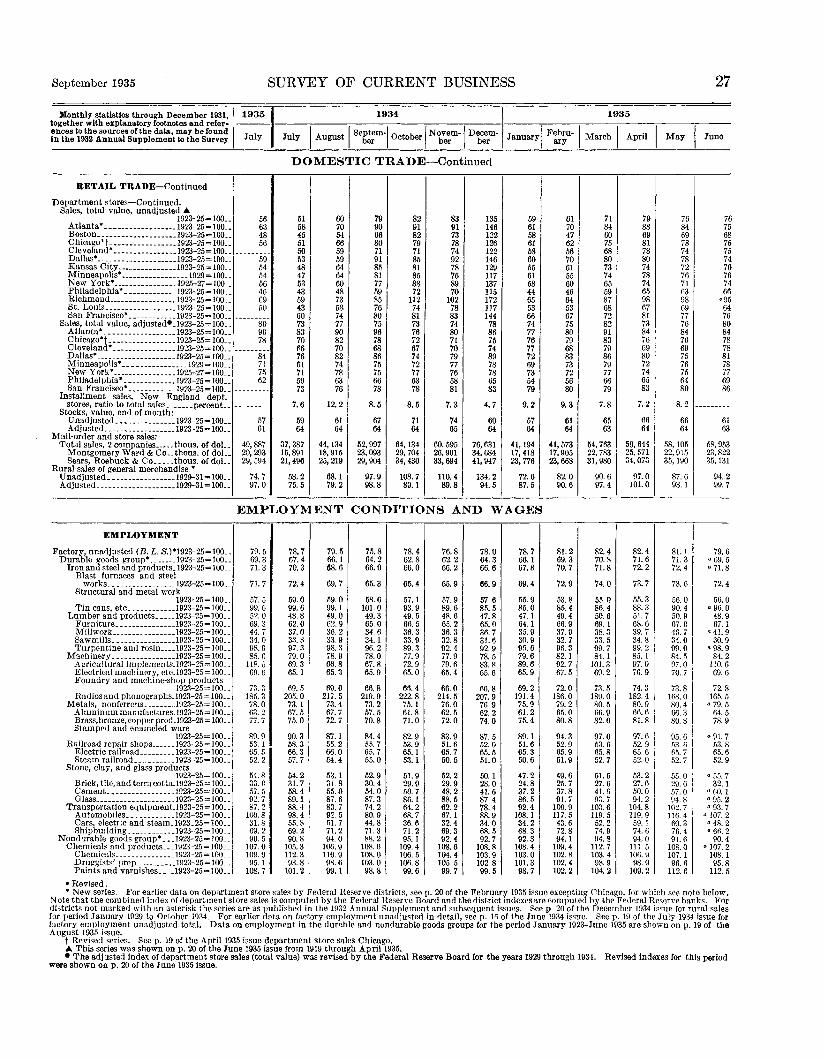
September 1935 SURVEY OF CURRENT BUSINESS 27
Monthly statistics through December 1931,together with explanatory footnotes and refer-ences to the sources of the data, may be foundin the 1932 Annual Supplement to the Survey
1935
July
1934
July August Septem-ber October Novem-
berDecem-
ber
1935
January Febru-ary March April May June
DOMESTIC TRADE—Continued
RETAIL TRADE— Continued
Department stores— Continued.Sales, total value, unadjusted A
1923-25=100-Atlanta* 1923-25-100Boston 1923-25=100-Chicago*f _ _ _ 1923-25 = 100-Cleveland*. _ . 1923-25—100Dallas* —.1923-25=100-Kansas City .1923-25 =100—Minneapolis* _. 1929 = 100New York*.__ 1925-27=100-Philadelphia* . 1923-25=100Richmond 1923-25=100-St. Louis 1923-25=100-San Francisco*. _ . 1923-25=100
Sales, total value, adjusted* .1923-25 =100-Atlanta* 1923-25=100-Chicago*f _ 1923-25=100-Cleveland* .1923-25=100..Dallas* ..1923-25=100-Minneapolis* 1929=100—New York* 1925-27=100—Philadelphia* 1923-25=100.San Francisco* . 1923-25—100
Installment sales, New England dept.stores, ratio to total sales percent
Stocks, value, end of month:Unadjusted 1923-25—100Adjusted ... 1923-25=100
Mail-order and store sales:Total sales, 2 companies thous. of dol—
Montgomery Ward & Co.. thous. of dol__Sears, Roebuck & Co thous. of dol._
Rural sales of general merchandise:*Unadjusted . 1929-31 = 100—Adjusted ... 1929-31 = 100-
56634856
59545456466950
809078
84"717562
5761
49, 88720, 29329, 594
74.797.0
51584551505348475343594360738370P67661715973
7.6
5964
37, 38715, 89121, 496
58.275.5
60705466595964646048735874779082708274786376
12.2
6164
44, 13418,91525, 219
68.179.2
79906680719185817759857680759678688675756678
8.5
6764
52, 99723, 09329, 904
97.998.8
82918279718581858872
1127481737672677472776378
8.5
7164
64, 13429, 70434, 430
108.789.1
83917378749278768970
1027883748071707977765881
7 3
7465
60, 59526, 90133, 694
110.489.8
135146122126122146129117137115172117144788675748978786583
4.7
6064
76, 63134, 68441, 947
134.294.5
59615861586055615844655366747776777269735479
9 2
5764
41, 19417,41823, 776
72.687.5
61704762567061556046645367758079688373725680
9 3
6164
41, 57317,90523, 668
82.090.6
71846075688073746559876872829183798679776679
7.8
6563
54, 76322, 78331, 980
90.697.4
79886981788074787465986781738476698072746583
7.2
6664
59, 64425, 57134, 073
97.0101.0
76846978747872767163986977768476697576756480
8.2
6664
58, 10522, 91535, 190
87.693.1
76756876757470767466
"956476808478788178776986
6163
58, 95323, 82235, 131
94.299.7
EMPLOYMENT CONDITIONS AND WAGES
EMPLOYMENT
Factory, unadjusted (B. L. S.)*1923-25=100-Durable goods group* 1923-25=100—
Iron and steel and pro ducts. 1923-25 =100..Blast furnaces and steel
works ... 1923-25=100 .Structural and metal work
1923-25 = 100..Tin cans, etc. 1923-25=100-
Lumber and products 1923-25 = 100—Furniture . _ _ . 1923-25 =100Millwork 1923-25=100..Sawmills _ 1923-25=100Turpentine and rosin 1923-25= 100..
Machinery 1923-25=100Agricultural implements.1923-25 = 100_ -Electrical machinery, etc. 1923-25 =100-Foundry and machine-shop products
1923-25 = 100-Radios and phonographs_1923-25=100—
Metals, nonfcrrous 1923-25 = 100 .Aluminum manufactures, 1923-25 = 100. .Brass, bronze, copper prod .1923-25 = 100—Stamped and enameled ware
1923-25=100..Railroad repair shops 1923-25 = 100—
Electric railroad 1923-25=100-Stearn railroad 1923-25=100—
Stone, clay, and glass products1923-25 = 100-
Brick, tile, and terra cotta. 1923-25= 100-Cement . 1923-25=100Glass 1923-25 = 100-
Transportation equipment. 1923 -25 =100—Automobiles 1923-25=100Cars, electric and steam. 1923 .25 =100-Shipbuilding .. 1923-25 = 100
Nondurable goods group* -..1923-25 =100..Chemicals and products.. .1923-25 = 100. _
Chemicals 1923-25 = 100—Druggists' prep 1923-25—100Paints and varnishes 1923-25 =100..
79.569.371.3
71.7
57.599.652.069.344.734.098.985 6
118. 569.6
73.3185.378.063.277.7
89.953.165.552.2
54.833.057.592.787.2
100.831.869.290.5
107.0109. 995 1
108.7
78.767.470.3
72.4
59.099.648.862.037.033.897.379 069. 365.1
69. 5205. 073.167.575.0
90.358.366. 357.7
54.231.758.489.188.498.455.869.290.8
105.3112.393 8
101.2
79.566.168.6
69.7
59.099.149.062.936.233.998.378.966.865.3
69.0217.573.467.772.7
87.155.266.054.4
53.131.855.087.683.792 551.771.294.0
106.9110.998 699.1
75.864.266.0
65.3
58.6101.049.365.034.634.196.278.067.865.9
66.8219.973.257.570.8
84.455.765.755.0
52.930.454.087.374.280.944.871.388.2
108.6108. 0103 098.8
78.462.866.0
65.4
57.193.949.566.536.333 989.377 972.965.0
66.4222.875.161.871.0
82.953.965.153.1
51.929.950 786.164.268 736.671.295.1
109.4106.5106 899.6
76.862.266.2
65.9
57.989.648.665.236.332 892.477 979.665.4
66.0214.576.062.572.0
83.951.665.750.5
52.229.948 288.562.267 132.469 392.4
108.6104.4105 599.7
78.064.366.6
66.9
57.685.547.865 036 731 692.978 583.865.6
66.8207.9
76 962.274.0
87.552.065.551.0
50.128.041 687.478.488 934.068 592.7
108.8103.9102 899.5
78.766.167.8
69.4
55.985.047.164.135.930.995.679.689.665.9
69.2191.475.961.275.4
89.151.665.350.6
47.224.837.286.592.4
108 134.268.392.3
108.4103.0101 398.7
81.269.370.7
72.9
53.885.449.466.937.932 796.382 192.767.5
72.0186.079.265.080.8
94.352.965.951.9
49.625.737.891.7
100.9117 543.672 894.1
109.4102.8102 4102.2
82.470. S71.8
74.0
55.086.450.669. 138.333 599.784 1
101.369.2
73.5189.0
SO. 566.982.0
97.053.665.852.7
51.527.641.693.7
103.6119 552.274.994.8
112.7103.498 9
104.2
82.471.672.2
73.7
55.388.351.768.639.734.899.285. 197.070.9
74.3182.480.966.681.8
97.652.965.652.0
53.227.650.094.2
104.8119.959.174.694.0
111.5106.998 9
109.2
81.171.372.4
73.6
56.090.450.967 040.734 099.084 597.070.7
73.8168.080 466.380.8
95.653.665. 752 7
55.029.657 094,8
102. 7116 460.376 491.6
108.0107.196 6
112.6
79.6"69.5°71.8
72.4
56.0"96. 0
48.967. 1
«41.930.9
«98.984 2
110.669.6
72.8165.5"79. 5
64.578.9
"91. 753.865.652.9
«55.732.1
a60 1-95.2°93. 7
a 107 2«48. 2"66 2
90.4a 107. 2
108.1°5 8
112.5« Revised.* New series. For earlier data on department store sales by Federal Reserve districts, see p. 20 of the February 1935 issue excepting Chicago, for which see note below.
Note that the combined index of department store sales is computed by the Federal Reserve Board and the district indexes are computed by the Federal Reserve banks. Fordistricts not marked with an asterisk the series are as published in the 1932 Annual Supplement and subsequent issues. See p 20 of the December 1934 issue for rural salesfor period January 1929 to October 1934. For earlier data on factory employment unadjusted in detail, see p. 1*> of the June 1934 issue. See p. 19 of the July 1934 issue forfactory employment unadjusted total. Data on employment in the durable and nondurable goods groups for the period January 1923-June 1935 are shown on p. 19 of theAugust 1935 issue.
t Revised series. See p. 19 of the April 1935 issue department store sales Chicago.A This series was shown on p. 20 of the June 1935 issue from 1919 through April 1935.• The adjusted index of department store sales (total value) was revised by the Federal Reserve Board for the years 1929 through 1934. Revised indexes for this period
were shown on p. 20 of the June 1935 issue.

28 SURVEY OF CURRENT BUSINESS September 1935
Monthly statistics through December 1931,together with explanatory footnotes and refer-ences to the sources of the data, may be foundin the 1932 Annual Supplement to the Survey
1935
July
1934
July August Septem-ber October Novem-
berDecem-
ber
1935
January Febru-ary March April May June
EMPLOYMENT CONDITIONS AND WAGES—Continued
EMPLOYMENT— Continued
Factory unadjusted— Con td.Nondurable goods group— Continued.
Chemicals and products— Continued.Petroleum refining _ 1923-25 = 100. _Rayon and products 1923-25= 100 ._
Food and products 1923-25=100..Baking 1923-25=100-Beverages 1923-25=100 .Slaughtering, meat pack-
ing 1923-25=100..Leather and products 1923-25 = 100..
Boots and shoes 1923-25 = 100Leather ... .1923-25 = 100. _
Paper and printing 1923-25=1 00. _Paper and pulp - 1923-25 — 100
Rubber products 1923-25=100..Rubber tires and tubes.. 1923-25 = 100..
Textiles and products 1923-25 = 100..Fabrics 1923-25= 100- .Wearing apparel 1923-25 = 100
Tobacco manufactures 1923-25= 100..Factory adjusted (F. R. B.) *.. 1923-25 = 100..
Chemicals and products 1923-25 = 100..Chemicals 1923-25 = 100Druggists' preparations.— 1923-25 = 100..Paints and varnishes _ 1923-25=100Petroleum refining 1923-25 = 100,.Rayon and products 1923-25 = 100
Food and products . ..1923-25 = 100Baking 1923-25 = 100. .Slaughtering, meat packing
1923-25=100..Iron and steel and products . . 1923-25 = 100. _
Blast furnaces and steel works1923-25=100..
Structural and metal work . 1923-25 = 100. .Tin cans, etc 1923-25=100
Leather and products 1923-25 = 100 .Boots and shoes 1923-25 = 100Leather 1923-25-100
Lumber and products 1923-25 = 100Furniture .1923-25 = 100Millwork 1923-25 = 100Sawmills 1923-25 = 100
Machinery 1923-25 = 100Agricultural implements . . 1923-25 = 100. .Electrical machinery, etc. .1923-25 =100..Foundry and machine-shop products
1923-25=100..Radios and phonographs... 1923-25 = ] 00 . _
Metals, nonferrous 1923-25 = 100Brass, bronze, copper prod .1923-25 = 100..Stamped and enameled
ware 1923-25 = 100Paper and printing 1925-25=100..Paper and pulp 1923-25 = 100Railroad repair shops 1923-25 = 100 _
Electric railroads 1923-25=100Steam railroads 1923-25 = 100
Rubber products 1923-25=100Rubber tires and tubes 1923-25= 100. _
Stone, clay, and glass products1923-25=100..
Brick, tile, and terra cotta. 1923-25= 100. _Cement ... . 1923-25 = 100Glass 1923-25 = 100
Textiles and products 1923-25=100..Fabrics . 1923-25=100Wearing apparel 1923-25 = 100
Tobacco manufactures 1923-25=100..Transportation equipment. .1923-25 = 100..
Automobiles 1923-25 = 100..Cars, electric and steam.. .1923-25 = 100..Shipbuilding 1923-25 = 100
Factory, by cities and States:Cities:
Baltimore* 1929-31 = 100 .Chicago*.. 1925-27=100Cleveland* 1923-25=100Detroit 1923-25=100..Milwaukee* . ._ .1925-27=100New York 1925-27-100Philadelphia.! — 1923-25=1 00. _Pittsburgh *f 1923-25-100
States:Delawaref 1923-25=100Illinois . 1925-27=100Iowa 1923 = 100Massaehusetts*tA 1925-27=100..
111.3327.9103.9111.4178.3
80 687.085 693 195.5
108 977. 170.387.987.584 957.680.4
110.9112 6100.4108 9108. 9327 9100 1109.8
81.172.7
72.756.395 886.684 395 852 172 644.333 386 1
125. 169.6
73.3193.080.078.4
91.096. 5
108.952.865 551.976 167.2
54.430.453.496 692.491 290 958.284.897.929.770 8
78.864 886. 566.692 667 987.767 3
89 172 4
118 267.8
111.7296.8110.1116.3188.9
103.589.489 091.593.4
104 883.977.485.987.079 861.179.5
109.6115. 199.0
101.4109.3296 8106 7114.6
104.171.4
73.457.895 888.987 794 148 864 936 733 179 I73.265. J
69.5213.575 175.8
91 494.4
104 858.066 357 482 874.0
53.929.354 392 890.290 685 561.885.895.552.170 8
81.667 282 683.982 668 182.368 4
93 571 5
106 768.5
113.4304.2122.1115.8185.8
112 491.191 988.493.8
104 880 773.988.285 690 165.179.3
110.9114 9100.6101 8111.3304 2110 8115 4
114.768.8
70.357.692 487 987 589 748 462 835 733 078 170.565.3
68.9197.774 973.3
89. 195.0
104 855.066 054 282 073.8
52.029.451 689 191.389 092 465.483.792.349.275 3
80.167 979 670.281 071 883.868 9
89 672 9
108 567.2
112.9305.5127.1115.7176.7
121 285.785 586 895.3
105 478 470.473.162.095 564.773.9
108.2108 5100.8100 0110.9305 5110 5113 7
122.465.4
65.457.095 382 481 486 748 063 034 333 075 772.465.9
66.6164. 773 671.6
85 895.6
105 455 465 754 779 o71.7
51.128.750 985 372.962 793 462.975.582.143.976 0
80.670 176 764.277 575 182.165 3
91 274 2
108 956.5
112.9307.0119.5116.1168.2
117 683.482 388.296.4
106 677.469.492.389.794 465.376.8
107.5105 3102.199 3
113. 1307 0109 3114.3
116.765.6
65.955.894. 181.479 788 347 761 236.033 375 876.465.0
66.9157.174 171.9
82.896.0
108 653.765 152 878 171.8
50.029.248 881 790.788 891 362.569.374.738.276 1
79.469 376 350.276 975 684.666 6
91 673 5
111 867.6
111.9320.8109.0115.4151.9
109.381.679 889.296.8
106 976.668.790.989.789 664.076.7
107.2102.3101.8100 5113.0320 8107.3113 6
108.266.4
66.757.893 683.482 388 647 360 736 332 677 282.165.4
67.3175.574.972.8
84.095.4
106 951.765 750 777 071.0
51.930.047 887 490.288 290 861.170.477.435.972 1
78.265 974 862.479 474 186.265 8
86 270 3
113 066.6
110.8329.5103.8115.4148.7
105.584.882 992.797.5
107 479 071.992.894.086 061.978.9
108.1101 8101.3101.1112. 1329 5107 9115.4
101.167.7
68.058.188 988.988 192 347 862 937 332 279 284.165.6
68.4203.876 174.5
88.495.8
107 452 165 551 179 574.4
51.229.543 987 892. 192 487 461.684.496.637.068 5
77.366 078 691.284 073 688.466 3
84 669 9
111 869.0
109.0338.094.4
106.7144.6
94 388.387 094 095 6
106 881 874.795.295 889 456.580.5
108.4101 699.1
101 0111.1338 0104 8109 0
91.669.4
69.957.490 889 188 492 348 866 437 032 481 486.765.9
70.3227.3
76 875.8
92 094.9
106 852 465 351 483 477.0
51.728.241 994 o95.194 891 360.793.5
109.238.366 3
75.765 683 9
108.386 970 786.565 5
84 469 9
109 370.0
107.3346.893.8
111.3145.7
87.291.690 795.696.7
108 783 075.398.497.296 857.381.9
108.6101 2101.4102 3108.7346 8105 0113 8
85.770.6
72.255.389 289 788 993 250 867 638 434 283 187.167.5
71.6226.878 379.3
93 296.4
108 753 665 952 783 876.4
52.429.642 494 i96.695 694 757.798.4
114.146.969 3
78.468 386 4
109.590 073 489.567 4
83 273 1
110 271.6
107.9348.992.7
110.9151.3
82.992.792 195.596.9
109 783 375.199.296.4
101 457.882.4
110.7102 396.8
103 4109.0348 9102 8113.2
84.970.8
72.456.389 290 589 993 351 970 338 834 685 694.769.2
72.6252.779 079.8
93 496.7
109 753 865 853 084 476.6
52.429.944 492 996.694 696 958.299.4
114.452.671 1
80.268 687 6
110.291 675 288.868 4
82 674 3
113 372 3
108.3334.994.7
111.8156.0
81.591.590 894.596.9
109 882.574.997.293.3
101 856.882.3
108.1106 3100.7108 8108.3334 9101 4113 6
84.271.1
72.256.087 992 291 794 352 471 139 435 086 091.670.9
73.1231.279 980.4
94 997.3
109 852 665 651 682 373.6
52.727.450 392 796.092 799 257.799.1
113.554.770 0
83.369 388 7
110.893 174 988.368 3
84 375 6
114 071 7
108.3326.995.1
112.7161.6
80 686 785 293 296 5
109 981 373.693.591 095 356.681.2
109.3109 0100.4108 6108.5326 9102 0112 7
81.671.5
72.556.389 589 187 994 551 370 540 233 484 994.170.7
72.7200.080 880.3
94 397.1
109 953 365 752 379 970.2
53.628.055 393 i93.691 095 656.894.0
105.954.974 1
82.669 082 1
102.493 072 387.8no o
85 974 8
117 1fio n
« 110. 6325.9«98.0114.2
0 170. 0
81 4°83. 00 80 6
92 895.6
a 109 10 79 8
72.9«90.4
89 40 88 6"57.8« 79. 9111. 3110 2100.3108 4
* 109. 6325 9100 1113 0
81.8°71.7
72.655.7
« 92 8«86 4a 84 4
95 148 869 6
o 41 430 184 4
111.469.6
72.0182.7
a 80 5
79.4
a 91 6
96.4a 109 1
53 465 652 4
a 77 768.4
« 53.529.9
a 56 492 1
•91.790 6
a 90 0a58. 1"88.7
0 101. 5«44 .4a 65 4
"80.867 080 993.792 469 888.167 5
90 373 4
117 2A7 ±
* Revised.* For earlier data see the following references: For factory employment, adjusted, all series, see pp. 16 to 19 of the July 1934 issue; employment in Baltimore, Milwaukee,
and Massachusetts, p. 18, December 1932; and employment in Chicago, p. 20, June 1933; Pittsburgh employment, p. 18, January 1934; Cleveland employment, p. 19, July
t For revised data refer to the indicated pages as follows: Employment in Delaware and Philadelphia, p. 19, September 1933; for revisions of years 1930-34 for those seriesand for the city of Pittsburgh, see p. 20 of the March 1935 issue; for Massachusetts, employment for 1931, p. 19, August 1933.
A Data revised for years 1932-34, inclusive. For revision not shown in the May 1935 issue see p. 20 of this issue.

September 1935 SURVEY OF CURRENT BUSINESS 29
Monthly statistics through December 1931,together with explanatory footnotes and refer-ences to the sources of the data, may be foundin the 1932 Annual Supplement to the Survey
1935
July
1934
July August Septem-ber October Novem-
berDecem-
ber
1935
January Febru-ary March April May June
EMPLOYMENT, CONDITIONS AND WAGES—Continued
EMPLOYMENT— Continued
Factory, by cities and States— Continued.States— Continued.
Maryland* 1929-31 = 100-New Jersey t 1923-25 = 100New York 1925-27=100Ohio 1926 = 100Pennsylvania! 1923-25 = 100Wisconsin 1925-27=100—
Nonmanufacturing (B. L. S.):Mining:
Anthracite 1929 = 100Bituminous coal . 1929 = 100—Metaliiferous 1929=100,.Petroleum, crude production. 1929 = 100—Quarrying and nonmetallic— 1929 = 100. _
Public utilities:Electric light and power and manufac-
tured gas 1929 = 100Electric railroads 1929 — 100Telephone and telegraph 1929 = 100
Trade:Retail t 1929 = 100Wholesalet .1929=100 .
Miscellaneous:Dyeing and cleaning*!7" 1929=100..Hotelsf 1929 = 100Laundries*tr 1929=100-.
Miscellaneous data:Construction employment, Ohio
1926=100-Farm employees, hired, average per farm*
number. .Federal and State highway employment,
total* numberConstruction*.. . . numberMaintenance* number. _
Federal civilian employees:United States* numberWashington number
Railroad employees, class I thousands..Trades-union members employed:
All trades percent of total—Building trades* percent of totalMetal trades* percent of totalPrinting trades* percent of totalAll other trades* percent of total-
On full time, all trades, percent of total. .
LABOE CONDITIONS
Hours of work per week in factories:* f tActuaj, average per wage earner hours..
Industrial disputes: §Disputes (in progress) numberMan-days lost numberWorkers involved (in progress) number
Labor turn-over:fAccessions percent of no. on pay rollSeparations:
Discharged— ..percent of no. on pay roll—Laid oil percent of no on pay rollVoluntary quits
percent of no. on pay roll—
PAY KOLL3
Factory unadjusted (B.L.S.)*. 1923-25=100-Durable goods group*. 1923-25=100..
Iron and steel and products 1923-25= 100—Blast furnaces and steel works
1923-25=100-Structural and metal work
1923-25=100..Tin cans, etc 1923-25=100
Lumber and products 1923-25= 100—Furniture 1923-25 = 100..Millwork 1923-25 = 100..Sawmills 1923-25 = 100Turpentine and rosin 1925-25=100—
Machinery . -1923-25 = 100Agricultural implements. 1923-25 = 100..Electrical machinery, etc_1923-25 = 100—Foundry and machine shop products
1923-25 = 100-Radios and phonographs. 1923-25 =100..
86.272.572.190.375.186.8
49.469.945. 177.050.9
84.771.570.3
79.082.2
81.780.384.4
33.0
1.01
375,442226, 867148, 575
764, 925104, 498
1,038
744977857853
4.17
.202.57
.90
65.355.552.8
52.3
42.596 738.148.634.022 956.867 5
137.054.7
56.6113.1
87.076.569.789.074.485.7
53.677.039.981.655.6
85.073 171.0
79.082.2
80.580.484.6
30.5
.87
549, 203380, 701168, 502
702, 03787, 9781,065
724376837848
34.0
258>. 020, 172219, 037
3.71
.192 96
.70
60.549.947.6
47.9
40.694.531.639.323.120 950.358 570.249.8
51.1114.4
86.277.070.487.674.582.4
49.577. 142.782.754.7
85.672.871.0
77.882.5
78.680.083.7
26.6
.88
531, 034350. 764180, 270
707, 54691, 0651,048
4075827848
33.5
2551,735,672122, 144
3.24
.193 56
.75
62.250.045.5
44.0
41.893 633.542.723.122 151.358. 168.350.2
50.3123.1
86.776.771.484.472.980.9
56.978.242.381.853.3
85.872.570.9
81.783.5
80.080.082.9
26.4
.94
498, 151309, 745188, 4G6
713 66292, 5571,035
754275838352
33.3
2334,029,155486, 798
3.61
.163 41
1.55
58.045.541.1
37.3
40.596 233.944.621.822 352. 255.666.748.0
46.7127.0
85.476.072.081.975.080.2
58.579.343.379.551.8
85.872.270.3
82.684.3
80.380.981.7
25.1
.80
450, 322281, 087169, 235
71 5, 60693, 322
1,028
764473838453
33.9
260852 787102, 971
4.09
.194 38
.73
61.046.442.8
39.2
40.882 535.247.224. 122 645. 157 074.449.3
47.6137.8
85.575.070.983.074.479.5
60.779.843.278.849.5
85.571.869.9
83.785.1
75.880.680.3
24.7
.66
426, 603267, 152159, 451
707, 30793, 827
995
754473838149
34.0
203841, 57098, 201
4.32
.153.78
.62
59.546.144. 2
41.7
41.279 433.644.524.021 347.957. 285.750.0
46.6131.5
85.575.371.185.375.080.6
61.679.744.478.742.1
83.671.069.7
91.185.0
72.480.079.5
21.6
.65
323, 700189, 020134, 680
707, 60694, 050
977
734374847948
35.0
198376, 29773, 481
6. 14
.152 72
.58
63.250.447.6
46.5
39.279 633.345.924.620 050.260 291.252.2
49.7132.0
84.973.170.687.374.381.3
62.980.044,374.936.9
82.771.270.5
79.584.2
70.380.379.6
17.5
.65
240. 414120. 131120, 283
710,34794, ?89
976
744075838051
36.4
211774, 30194, 176
6.33
.182 10
.76
64.152.551.9
53.9
39.580 731.743.523.019 152.760 897.552.4
51.5112.5
87.973.873.191.376.184.0
64.481.144.374.237.3
82.271.070.0
79.284.6
69.681. 179.6
18.3
.68
221, 40699, 197
122, 209
715, 90195, 517
985
763975858354
37.1
222868,43994, 438
4.23
.181 88
.73
69. 158.659.0
63.8
37.677 334.847.125.321 454. 264 3
100.955.0
55.7103.2
89.374.974.394.177.185.7
51.481.645.074.040.5
82.271.369.8
80.284.0
72.580.879.7
18.4
.72
217, 539109, 390108, 149
720, 27997, 388
995
784176858555
36.6
2561,026,778
94, 848
3.79
.172 32
. 75
70.760.559.3
63.3
38.783 336.349.725 822 452.366 9
113.757.2
57.5110.6
90.774.574.894.975.985.1
52.674.346.074.945.3
82.671.469.7
83.683.2
79.981.180.0
24.8
.79
282, 740147, 256135, 484
745, 345100, 949
994
794377868657
36.7
2891 355,000142, 000
3.63
.202 60
.93
70.861.859.4
62.3
39.885 437.549.227.723 757.967 6
108.858.4
58.0107.0
89.574.273'. 793.075.585.7
53.575.344.476.0495.
83.271.670.0
82.282.5
80.981.681.1
30.7
.89
331,000195, 459135, 541
747, 478102, 539« 1,013
794677868457
36.3
3091,840,000148, 000
3.01
.173 00
1.21
68.560.158. 5
61.1
40.987 031.847. 129. 120 157.367 8
110.558.2
57.9101. 5
«88.272.472.590.875.086.6
56.877.946.076.550.4
83.871.770.2
82.182.1
83.781.382.3
°35.0
.98
362, 339224, 086138, 253
753,017103,453
1, 035
774977868154
35.9
3.18
.203 46
.83
«60 .4" 57. 6« 55. 8
« 56.8
°49. 7a 93 g
36. 348.531.520 959. 966 9
127. 556.1
56.2100.9
0 Revised.* For earlier data see the following references: Employment in Maryland, and Federal civilian employment, total, United States, p. 18, December 1932: Federal and
State highway employment, dyeing and cleaning establishments, and laundries, p. 19, June 1933; trades-union members employed, p. 18, December 1932, and hours of work,p. 20, October 1932. Pay rolls in the durable group for the period January 1923-June 1935 are shown on p. 19 of the August 1935 issue. Data for factory pay rolls by classesare shown on p. 18 of the June 1934 issue. See also p. 19, July 1934 issue.
t For revised data refer to the indicated pages as follows: Employment in New Jersey and Pennsylvania, p. 19, September 1933; employment in laundries, and dyeingand cleaning establishments, p. 20, August 1934; hotels revised for the period January 1929-May 1935, inclusive; see p. 20 of the August 1935 issue. For revised data on employmentin wholesale and retail trade for 1929-34, see p. 20 of the March 1935 issue. Hours or work per week in factories revised for 1933. See p. 20 of the July 1934 issue. For laborturnover see p. 20 of the April 1935 issue.
• Figures represent the condition as of the end of the month shown. This method has been followed since September 1932. Figures shown previous to that date in theSurvey are as of the first of the month. They were published as of the first of the following month by the Department of Agriculture.
1 Data revised, for 1934. See pp. 29 and 56 of the May 1935 issue.§ Data revised. For revisions for years 1933 and 1934 see p. 20 of this issue.^ The revised series on dyeing and cleaning and laundry pay rolls shown in the August 1935 issue have been dropped by the B. L. S. and the publication of the original
series resumed. The June 1934 figures for dyeing and cleaning reverts to 64.1 and for laundries to 68.3.

30 SURVEY OF CURRENT BUSINESS September 1935
Monthly statistics through December 1931,together with explanatory footnotes and refer-ences to the sources of the data, may be foundin the 1932 Annual Supplement to the Survey
1935
July
1934
July August Septem-ber October Novem-
berDecem-
ber
1935
January Febru-ary March April May June
EMPLOYMENT CONDITIONS AND WAGES — Continued
PAY ROLLS— Continued
Factory unadjusted— Continued.Durable goods group— Continued.
Metals, nonferrous 1923-25 = 100-Aluminum manufactures
1923-25=100-Brass, bronze, copper products
1923-25=100-Staniped and enamel ware
1923-25=100-Eailroad repair shops 1923-25= 100-
Electric railroads _ 1923-25=100..Steam railroads 1923-25=100.-
Stone, clay, and glass products1923-25-100-
Brick, tile, and terra cotta1923-25=100.-
Cement .1923-25= 100—Glass 1923-25=100..
Transportationequipment-1923-25=100-_Automobiles 1923-25=100-Cars. electric and steam .1923-25 =100. .Shipbuilding 1923-25=100..
Nondurable goods group* —1923-25 =100. .Chemicals and products. -.1923-25 =100. .
Chemicals 1923-25=100..Druggists' preparations- 1923-25= 100-Paints and varnishes.— 1923-25 = 100-Petroleum refining 1923-25=100.Rayon and products 1923-25 = 100..
Food and products 1923-25=100-Baking 1923-25=100..Beverages 1923-25 = 100..Slaughtering, meat packing
1923-25=100-Leather and products 1923-25=100-
Boots and shoes 1923-25=100—Leather ... 1923-25 =100-
Paper and printing 1923-25=100Paper and pulp 1923-25=100.
Bubber products .1923-25=100-.Rubber tires and tubes.. 1923-25 = 100-
Textiles and products 1923-25 = 100—Fabrics .1923-25 = 100-Wearing apparel 1923-25=100—
Tobacco manufactures 1923-25=100-Factory by cities:
Baltimore* 1929-31 = 100-Chicago* 1925-27=100-Milwaukee* .1925-27=100—New York* .1925-27=100-.Philadelphia*!- ..1923-25 = 100-Pittsburgh*f 1923-25=100-
Factory by States:Delaware! 1923-25=100..Illinois A - - 1925-27=100-Maryland* .1929-31 = 100-Massachusetts*!* 1925-27= 100. _New Jersey!— - _ _ 1923-25 = 100-New York ...1925-27 =100..Pennsylvania! .1923-25=100-Wisconsin 1925-27 = 100..
Nonmanufacturing (B. L. <S.):Mining:
Anthracite- 1929=100-Bituminous coal 1929 = 100 .Metalliferous 1929 = 100-Petroleum, crude production
1929=100-Quarrying and nonmetallic_1929 = 100--
Public utilities:Electric light and power and manu-
factured gas 1929=100—Electric railroads 1929 = 100-Telephone and telegraph... 1929 =100-
Trade:Retail! 1929=100-Wholesale ! 1929=100-
Miscellaneous:Dyeing and cleaning*! ± — 1929=100-Hotels! -. 1929=100..Laundries*!^ .. 1929=100—
WAGES-EARNINGS AND EATES
Factory, weekly earnings (25 industries) :*!cfAll wage earners - -dollars —
Male:Skilled and semiskilled .dollars..Unskilled -- -dollars..
Female ..dollars-
59.6
51.2
57.7
75. 447.958.747.2
39. 0
20.437.876.974.785.828.458.277.795.6
102. 292.388.9
100. 9240.295.596. 4
192.3
75.077.372.990.881.484.961.254. 068.570.161.347.6
73.345.977.956. 872.556.6
64.451.876.757.358.859.557.271.3
37.535.631.2
59.234.4
81.563.475.7
60.464.7
61.462.170.9
21.75
24.5817.6614.77
i
53.6
43.8
54.4
72.951.158.850,6
36.1
17 039.169 566.070.750.755.673.988.796.686.178.895.7
208.695.698.2
193.5
91,477.276.279.277.377.161.955.962.564.455.347.3
75.445.861.855.367.152.9
68.348.077.153.258.155.755.562.2
42.349.725.1
60.035.0
81.163.872.3
60.163.8
58.961.568.2
19.90
22.3416.4314.33
I
53.2
40.8
51.2
70.848.558.547.9
34.9
16.835.468.270.476.551.256.477.890.098.589.977.997.2
213.2105.197.8
185.0
99.078.779.176.178.478.858.849.968.164.770.649.3
68.845.261.159.468.158.4
64.748.672.654.059.356.957.360.7
39.750.427.0
61.234.0
79.962.874.0
58.462.7
56.760.266.6
19.58
21.7215.9214.23
54.0
41.4
48.7
66.745.656.944.9
34.7
16.133.967.452.354.340.057.074.089.992.192.375.896.3
215. 5109.399 6
167.0
109.269.267.773.680.379.656.147.657.549.170.950.3
68.946.156.760.866.450.3
65.148.673.046.659.057.353.157.8
47.051.425.9
59.732.4
79.362.472.2
60.663.6
59.061.065.9
19.55
21.6215.9814.10
57.5
51.1
49.5
70.446.857.146.2
35.5
16.932.469.449.752.034.456.279.691.692.499.178.197.9
217. 2103.498.3
157.2
107.064.360.476.982.783.258.349.674.773.173.449.0
66.246.458.861.870.854.7
67.749.870.552.158.857.257.260.8
48.357.628.2
60.832.1
80.663.074.9
61.964.5
59.162.764.8
20.00
22.4816.2914.43
58.8
53.8
51.3
71.944.457.443.5
35.6
16.529.472.048.451.330.054.076 690.990. 796.878.596 8
231.696. 198.6
142.2
100.761.054.682.082.782.058.150.471.172.564.148.8
67.743.760.759.672.553.7
61.647.472.550.958.356 156.460.2
51.258.328.5
59.029.4
79.661.872.2
61.964.2
53.962.463.7
20.12
22.6016.2314.39
61.5
56.2
55.6
79.144.458.443.5
34.4
15.324.171.967.678.431.555.379,591.790.094.878. 197.8
240. 192.998 7
135.0
98.469.163.786.586.383.566.060.075.380.261.349.9
66.445.066.460.375.155.8
61.248.272.157.359.758.058.162.5
52.357.029.4
59.523.6
78.362.373.2
66.264.8
51.162.263.3
20.74
23.0316.5915.08
58.4
51.1
58.3
77.643.858.042.9
31.6
13.021.269.979.492.231.756.279.091.690.896.879.495.2
245. 483.389.6
133.4
84.076.472.588.583.483.569.462.278.582.266.641.5
65.245.667.758.672.456.4
61.748.870.958.758.158.357.862.0
57.559.630.1
55.520.8
78.062.973.9
59.763.9
50.462.263.9
21.61
23.9517.6515.21
63.4
58.7
63.2
86.848.059.747.2
34.8
15.022.175.694.7
110.343.459.782.593.291.097.983.795.3
252.383.493.7
137.2
76 582.579.292.684.186.871.965.784.584.579.540.8
72.048.473.460,974.464.1
62.852.778.060.859.560.961.967.3
64.366.129.9
54.922.2
78.363.172.9
59.364.6
49.863.564.1
22.09
24.6418.0315.46
64.6
61.2
64.0
91.449.660.748.9
37.4
16.325.081.398.2
112.754.563.883.896.193.795.986.296.4
252.383.093.7
146.9
73.584.180.794.284.588.470.662.786.883.383.544.3
76.148.875.265.375. 265.8
61.554.181.062.361.563.163.469.3
38.967.530.9
56.024.9
79.463.475.3
60.465.2
53.563.964.6
21.86
24.2517.8515.47
64.4
60.9
64.1
89.650.760.450.1
39.3
16.331.982.7
102. 7117.165.162.082.395.996.297.791.996.9
242.785.595.5
153.6
74.379. 175.191.484.687.871.265. 482.478.086.443.1
78.548.578.563.774.666.3
62.554.682.560.960.862.962.669.7
49.945.031.8
56.728.9
79.063.373.1
62.564.8
61.963.665.5
21.93
24.6217.8715.21
63.3
59.8
61.5
84.852.560.252.0
40.3
17.736. 881.694.2
105. 165.865.779.194.897.893.995.196.8
237.886. 997.3
162.5
74.072.366.790.084.886.966.558.775.574.972.143.8
77.047 . 477.259.773.065.5
62.753.080.458.260.961.261.669.4
49.549.131.4
57.832.8
79.863.673.7
62.064.6
61.763.766.6
21.76
24.4117.4914.83
62.6
56.8
60.0
79.051.059.050.5
40.5
19.340. 182.082.493.446.655.577.695.098.093.794.099.3
240. 590.399.6
173.4
74.870.964.791.183.487.464.958. 970.972.064. 646.8
« 76. 446.776.357.473.560.5
66.452.3
« 79.756.859.260.259.870.5
66.064.731.5
58.333.8
79.863.974.4
62.464.6
65.763.568.2
21.76
24. 1117.4814.7
* For earlier data on the following subjects, refer to the indicated pages of the monthly issues as follows: Pay rolls, Baltimore, p. 18, December 1932; pay rolls, Chicago,p. 20, June 1933; pay rolls, Milwaukee, p. 18, December 1932; pay rolls, New York, p. 20, June 1933; pay rolls, Philadelphia, p. 18, December 1932; pay rolls, Pittsburgh,p 18 January 1934* pay rolls, Maryland and Massachusetts, p. 18, December 1932; pay rolls in dyeing and cleaning establishments and laundries, p. 19, June 1933; factoryweekly earnings, p 20, October 1932. Data on pay rolls for nondurable goods industries for the period January 1923-June 1935 are shown on p. 19 of the August 1935 issue.
Philadelphia1931 D 19 A~ .̂.̂ ~~w .- -^ » . - _August 1934;*hotels*revised7for'the period January" 1929^-May 1935, inclusive; see p. 20 of this issue; factory weekly earnings for 1933, p. 20, July 1934.
* Revised data on Illinois pay rolls from April 1929 to December 1932 will be shown in a subsequent issue.• Data revised for the years 1932-34, inclusive. For revisions not shown in the May 1935 issue see p. 20 of this issue.cT Data for 1934 revised. See pp 30 and 56 of the May 1935 issue.A The revised series on dyeing and cleaning and laundry employment shown in the August 1935 issue have been dropped by the B. L. S. and the publication of the
original series resumed. The June 1934 figure for dyeing and cleaning reverts to 86.2 and for laundries to 84.0.

September 1935 SURVEY OF CUREENT BUSINESS 31
Monthly statistics through December 1931,together with explanatory footnotes and refer-ences to the sources of the data, may be foundin the 1932 Annual Supplement to the Survey
1935
July
1934
July August Septem-ber October Novem-
berDecem-
ber
1935
January Febru-ary March April May June
EMPLOYMENT CONDITIONS AND WAGES—Continued
WAGES— EARNINGS AND RATES—Continued
Factory, weekly earnings (25 industries) *—•Continued.
All wage earners 1923=100—Male:
Skilled and semiskilled 1923 = 100 _Unskilled 1923 = 100
Female - ___ 1923 = 100Factory, av. hourly earnings (25 indus-
tries):*!^All wage earners dollars
Male:Skilled and semiskilled „ dollars..Unskilled dollars..
Female - dollars _Factory, weekly earnings, by States:
Delaware - .1923-25=100—Illinois 1925-27=100-Massachusetts*t* - .1925-27 = 100—New Jersey 1923-25=100New York 1925-27=100Pennsylvania . 1923-25=100—Wisconsin 1925-27=100
Miscellaneous data:Construction wage rates:* §
Common labor (E. N. J?.)_dol. per hour..Skilled labor (E. N. /2.)__dol. per hour-
Farm wages, without board (quarterly)dol. per month..
Railroads wages dol per hourRoad-building wages, common labor :#1
United States dol. per hour..East North Central dol. per hour..East South Central dol per hourMiddle Atlantic dol. per hour..Mountain States dol. per hour _New England -dol. per hour..Pacific States —dol. per hour--South Atlantic dol. per hourWest North Central dol per hourWest South Central dol. per hour..
Steel industry:U. S. Steel Corporation dol. per hour—Youngstown district percent base scale .
81.7
79.879.385.7
.598
.659
.489
.434
76.377.384.390.682.676.581.1
.5291.08
.42
.53
.30
.43
.57
.43
.57
.31
.47
.36
.485
74.8
72.573 783 1
588
.650484
.429
77.172.680 085 379 874 469 3
.5301.10
596
.42
.5030
.41
.56
.43
.583243
.34
.485101 5
73.6
70 571 582 5
588
.650481425
76 371.780 386 580 977 071 2
.5301.11
612
.41
.5030
.415643
.583145
.34
.485101 5
73 5
70 271 781 8
592
.654480430
75 470.782 586 480 274 069 4
.5351.12
27 83629
.41
.5030
.425644
.583245
.34
.485101 5
75.2
73 073 183 7
593
.656487428
78 072.877 i86 979 576 973 5
.5361.12
616
.41
.5130
.4255
*42.583246
.34
.485101 5
75 6
73 472 883 5
594
.658490428
75 472.376 487* 379 176 773 0
.5391.12
fv?9
.41
.5130
.425542
.573247
.34
.485101 5
77 9
74 774 587 5
594
.656487428
76 373.783 088 981 678 475 2
.5411.12
26 69636
.40
.5230
.425542
.573248
.34
.485101 5
81 2
77 879 288 2
594
.656491430
77 174.483 889 182 678 174 3
.5381.11
fi47
.39
.5230
!425543
.573147
.35
.485101 5
83 0
80 080 989 7
595
.659490431
79 677.184 990 483 381 478 4
.5241.10
Rfi7
.39
.5330
.445545
.553147
.36
.485101 5
82 1
78 780 189 7
597
.659494433
78 677.786 092 085 082 479 3
.5241.11
28 82647
.39
.5230
.445547
.553146
.37
.485101 5
82.4
79.980 288 2
598
. 659492434
78 377.384 891 384 182 480 5
.5261.10
676
.40
.5330
.4356
.45
.553146
.37
.485101 5
81.8
79.378.586.0
.599
.661
.493
.436
77.175.884.291.883.081.479.8
.5231.08
.669
.41
.53
.30
.43
.56
.43
.55
.31
.47
.37
.485
81.8
78.378.585.4
.599
.660
.493
.436
77.676.384.091.383.079.480.8
.5271.07
30.08
.42
.53
.30
.43
.57
.43
.56
.31
.47
.37
.485
FINANCE
BANKING
Acceptances and com'l paper outstanding:Bankers' acceptances, total, .mills, of dol—
Held by Federal Reserve banks:For own account mills, of dol—For foreign correspondents
mills, of dolHeld by group of accepting banks, total
mills, of dol—Own bills—- mills, of dol—Purchased bills mills, of dol—
Held by others. mills, of dol—Com'l paper outstanding mills, of dol—
Agricultural loans outstanding:Farm mortgages:
Federal land banks mills, of dol—Joint stock -land banks t _ _ _ mills, of dol—Land bank commissioner* .mills, of dol—
Federal intermediate credit bank loans toand discounts for: *
Regional agricultural credit corp's andproduction credit ass'ns.. mills, of dol—
All other institutions mills, of dol—
321
29614814824
164
2,024201743
12964
516
1
47222225042
168
1,711306430
12873
520
1
48322226137
188
1,766295478
12574
539
1
50322328035
192
1,811285516
11873
562
1
51624527145
188
1,849276552
10583
561
51725226544
178
1,886266587
10188
543
1
49724325446
166
1,916256617
10090
516
48523824730
171
1,943246643
10088
493
45221723541
177
1,961239665
10387
466
42319722643
182
1,975230687
11586
413
391178214
22175
1,976223697
12489
375
35616219319
173
1,998215716
13083
343
317154163
26159
2,017208733
13168
t Revised series. For revisions on the following subjects, refer to the indicated pages of the monthly issues. Massachusetts weekly earnings for 1931, D. 19. August1933; factory hourly earnings for 1933, p. 20, July 1934.
c?Data for 1934 revised. See pp. 30 and 56 of the May 1935 issue.• Data revised for years 1932-34, inclusive. For revisions not shown in the May 1935 issue see p. 20 of this issue.§ Construction wage rates as of Aug. 1, 1935, common labor, $0,529; skilled labor, $1.08.# Beginning with March 1932 data are based on Federal aid and State projects; before that time the data are based on Federal-aid projects.^ Increase in wage rates during March 1934 was due to provisions of title I, sec. 204, par. 2, item C of the National Recovery Act, which required State highway depar
ments to fix minimum wage scales.t Joint stock land banks in liquidation.* New series. For earlier data on the following subjects, refer to the indicated pages of the monthly issues as follows: Factory weekly earnings for period of January
1927 through August 1932, p. 20, October 1932; factory hourly earnings for January 1926-December 1931, p. 18, December 1932; weekly earnings Massachusetts for January1926-December 1931. p. 18, December 1932; construction wage rates for January 1922-July 1933, p. 19, September 1933. Additional series on agricultural loans were firstincluded in the June 1934 issue for Land Bank Commissioner for July 1933-April 1934.
A Breakdown of figures shown in issues up to November 1934.

32 SURVEY OF CURRENT BUSINESS September 1935
Monthly statistics through December 1931,together with explanatory footnotes and refer-ences to the sources of the data, may be foundin the 1932 Annual Supplement to the Survey
1935
July
1934
July August JBe^m- October Novem-ber
Decem-ber
1935
January Febru-ary March April May June
FINANCE—Continued
BANKING— Continued
Agricultural loans outstanding— Continued.Other loans:
Agricultural marketing act revolvingfund loans to cooperatives t
mills, of doL_Banks for cooperatives, incl. Central
Bank* mills, of doL-Emergency crop loans*
mills, of doL .Prod cred ass'ns* - .mills, of dol _Regional ag. credit corp.*. .mills, of dol—
Bank debits total mills, of dol _New York City - mills, of dol _Outside New York City mills, of dol—
Brokers' loans:Reported by N. Y. Stock Exchange
mills, of dol—Ratio to market value percent- .By reporting member banks:
To brokers and dealers in N. Y.*mills, of dol—
To brokers and dealers outside N. Y.*mills, of dol—
Federal Reserve banks:Assets, total mills, of dol__
Reserve bank credit outstandingmills, of dol—
Bills bought mills, of dol—Bills discounted mills, of dol—United States securities, .mills, of doL.
Reserves, total. mills, of dol..Gold reserves^ mills, of dol__
Liabilities total mills, of dol. _Deposits, total mills, of dol..
Member bank reserves—mills, of dol—Notes in circulation mills, of dol—
Reserve ratio - percent--Federal Reserve reporting member banks:*
Deposits:Net demand .mills, of dol _Time mills, of dol—
Investments mills, of dol—U S. Gov. direct obligations* •
mills, of dol—U. S. Gov. guaranteed issues* •
mills, of dol _Other securities* * mills, of dol—
Loans, total .mills, of dol..Acceptances and commercial paper* A
mills of dol0Ti repl estate* A mills, of dol—On securities mills, of dol__Other loans* A mills, of dol—
Interest rates:Acceptances, bankers' prime percent..Call loans renewal percent—Com'l paper, prime (4-6 mos.)... percent. _Discount rate, N. Y. F. R. Bank-percent—Federal Land bank loans* percent-Intermediate credit bank loans.. .percent- _Reil estate bonds long term percentTime loans, 90 days percent--
Savings deposits:New York State mills, of dol—U. S. Postal Savings:
Bal. to credit of depositors.thous. of dol..Bal. on deposit in banks. thous. of dol—
FAILURES
Commercial failures:Total - number..
Agents and brokers __ number. _Manufacturers total number
Chemicals, drugs, and paints-number..Foodstuffs and tobacco number--Leather and manufactures.. _number__Lumber — _ _ number _Metals and machinery number..Printing and engraving number..Stone, clay, and glass number..Textiles number .M iscpllaneous number.. .
49
25
12711369
33, 39^16, 73716, 657
761'1. 98
798
57
9, 550
2, 465
2, 4306,51;.6, 24 (i9, 5505,4785, 1003, 201:
74.;.
15. 5174, 39:
11, 1>U
7, 380
8922,90f7, 327
94!'2, 9673, 120
1. 5('4.002. 00
/•'i
5, 161
1,189,593352, 594
931
2374
20:
3327
115175
55
21
9150
12927 75213, 84213, 910
9233.00
8, 161
2, 4625
222, 4325, 1 544,9308, 1614. 2954, 0293,07769.9
12, 7454,4889, 889
7, 873
3 358
l/s-H1 00M-i1.505.002.00
%~1
5, 114
1, 190, 288643, 600
91298
2354
231137259
4081
55
23
9258
11825 70512 28513, 420
8742.68
8,197
2,4645
232,4325, 2205,0018, 1974,3124,0523, 13470. 1
12, 9264,5109, 906
7,802
3,247
li-H1 00M-i1.505.002.00
3*-i
5, 054
1, 192, 199596, 937
92995
2375
22113232165
328-1
55
23
9161
10724 00911 12212, 888
8322.57
8,220
2,4646
152,4315, 1964,9808, 2204, 2573, 9343, 167
70.0
13,0834, 471
10,017
7,794
3 047
YrYi1 00M-l1.505.002.00
X-i5, 145
5, 192,764573, 022
79064
2144
199
35269
111982
57
25
835897
26 75012. 28614, 465
8272.62
693
153
8,229
2,4556
112,4305,2124, 9898,2294, 2624,0063, 16170.2
13,4764,474
10, 030
6,639
5292,8627,807
456986
3,0513,314
K-Me1.00&-11.505.002.00
M-l
5, 128
1,198,578559, 918
1,091117258
628
72428121130
112
57
25
785891
24 75211 34313, 409
8312.45
660
155
8,332
2,4536
112,4305,3175, 1078,3324,3134,0813,21370.6
13, 6274,392
10, 059
6,715
5552,7897,705
452979
3,0173, 257
H1.00*A-i1.505.002.00
H-i5, 119
1 , 203, 548550, 608
923103223
31610301912
3096
55
28
786187
30 91515, 21415, 701
8802 59
598
54
8,442
2, 46367
2,4305,4015, 1438,4424,4054, 0963,22170.8
13, 6854,388
10, 575
7, 192
5832,8007,646
436977
3,0813,152
Ys1.00k-11.505.002.00
M-i
5, 154
1,207,428539, 547
963100225
425
7322614122976
54
28
776585
30 06314, 99715, 066
8252.50
702
166
8, 719
2,46167
2,4305,6805, 4058.7194,8104, 5433,08572.0
14, 0274,434
10, 683
7, 237
6012, 8457, 561
439971
3,0243, 127
Ys1.00&-11.505.002.00
M-i5, 142
1,200,767508, 312
1, 18489
26910325
283715114388
50
29
767182
25 73012, 54913, 181
8162.54
726
166
8,873
2,46566
2,4305,8075,5598,8734,8894,5873,15472.2
14, 1754,449
10, 723
7,227
6602,8367,598
440965
2, 9953,198
l/81.00
X1.505.002.00
M-i
5,147
1, 205, 429490, 653
1,005116229
10159
3225108
4080
50
28
758680
31 74415, 89515, 849
7732.50
720
170
8,833
2,47158
2,4375,8255,5928,8334,8934,2473,16672.3
14, 0874,476
10, 900
7,280
7022,9187,609
436966
2,9743,233
1A1.00
M1.505.002.00
M-i
5,185
1,202.657477, 111
97699
2236
179
332699
2493
50
30
959778
31 65115 90515, 746
8052.40
881
184
9,096
2,46856
2,4306,0145,7699,0965,0844,7153, 15373.0
14, 8224,556
10, 993
7,324
7092, 9607,696
387963
3,1123,234
l/8.64
3A1.504.332.00
H-l
5,158
1.200.425451, 563
1, 11578
2607
21144128178
2797
47
32
124105
30 20614,55115, 655
7932.29
828
58
9, 165
2, 46958
2. 4306, 1085, 9019, 1655,1464, 8323, 18973.3
15, 0034.497
10, 859
7,211
7042, 9447, 612
359960
3, 0543,239
H. 25
1. 504. 252.00
/'i
5, 152
"1,205.201"411,714
1, 02792
2439
2111282710
3793
49
24
12611073
31 58115, 66715,914
8092.23
886
66
9,529
2,48056
2, 4336,4266,2039,5295,4064,9793. 25874.2
15, 5144, S85
10, 960
7,279
8462, 8357,548
307957
3,0993,185
H
3A1.504.192.00
H
5, 187
1, 204, 5983G9, 238
96176
2286
329
1729
4123188
° Revised.f Revised series. Certain classes of loans included in figures shown through May 1934 have been reclassified and removed from the agricultural loan category.* New series. For earlier data on the following subjects, refer to the indicated pases of the monthly issues. Add i t i ona l series on agricultural loans were first included
in the June 1934 issue for banks for Cooperatives, including Central Bank and Productive Credit Associations, for October 1933-April 1934, and Emergency Crop Loansand Regional Agricultural Credit Corporations for April 1933-April 1934. Data for Emergency Crop Loans for fiscal years from June 1922-June 1931, and monthly periodsfor January 1932-March 1933, and Regional Credit Corporations for October 1932-March 1933 wi l l be shown in a subsequent issue. New series on "Brokers' Loans"not available for periods not shown. For brokers' loans by reporting New York City member banks, see November 1934 and previous issues. Earlier data for FederalReserve member banks shown on p. 18 of the January 1934 issue except as noted below. These data cover 90 cities and supersede the previous data for 101 cities. Theyare available only from January 1932 to date. One additional city has been added in 1934 to offset the dropping of 1 bank which discontinued reporting. See specialnotes below on Foreign Reserve member bank loans and investments. For new series on interest rates of Federal land banks see p. 20 of the April 1935 issue.
• These 8 series represent'! break-down of the investment total. Monthly data previous to October 1934 not available.A Data on acceptances and commercial paper, on real estate and other loans represent a break-down of the "All other" loans total which has previously been shown.
If added, they give a total comparable to figures formerly presented.§ Figures 'subsequent to December 1933 represent gold certificates on hand and due from Treasury, plus redemption fund.

September 1935 SUEVEY OF CUREENT BUSINESS 33
Monthly statistics through December 1931,together with explanatory footnotes and refer-ences to the sources of the data, may be foundin the 1932 Annual Supplement to the Survey
1935
July
1934
July August Septem-ber October Novem-
berDecem-
ber
1935
January Febru-ary March April May June
FIN AN CE—Continued
FAILURES— Continued
Commercial failures— Continued.Total— Continued.
Traders, total numberBooks and paper numberChemicals, drugs, and paints
number..Clothing - . numberFood and tobacco numberGeneral stores numberHousehold furnishings _ numberMiscellaneous number
Liabilities, total-— thous. of dol._Agents and brokers thous. of dol—Manufacturers, total thous of dol
Chemicals, drugs, paintsthous. of dol—
Foodstuffs and tobacco. -thous. of doL.Leather and manufactures
thous. of dol—Lumber thous. of dol._Metals and machinery. -thous. of dol._Printing and engraving— thous. of dol—Stone, clay, and glass thous. of dol._Textiles thous of dolMiscellaneous thous. of dol—
Traders, total. _ thous. of dol—Books and paper.. _ thous. of dol—Chemicals, drugs, paints
thous. of dol_.Clothing thous. of dol—Foods and tobacco thous. of dol—General stores thous. of dol—Household furnishings.. -thous. of dol—Miscellaneous. _. thous. of dol —
LIFE INSURANCE
(Association of Life Insurance Presidents)
Assets, admitted, totalf mills, of dol—Mortgace loans mills, of dol—
Farm mills of dolOther mills, of dol—
Bonds and stocks held (book value) :mills, of dol__
Government ..mills, of doL.Public utility mills, of doL.Railroad mills, of dol—Other A. mills, of dol..
Policy loans and premium notesmills, of dol..
Insurance written:!Policies and certificates thousands
Group thousandsIndustrial _ thousandsOrdinary thousands
Value, total .thous. of doL.Group —thous. of doL.Industrial _ thous. of dol._Ordinary _ thous. of dol—
Premium collections! thous. of dol—Annuities thous. of dol—Group thous. of doL.Industrial thous. of del--Ordinary -.thous. of dol—
(Life Insurance Sales Research Bureau)Insurance written, ordinary, total
mills, of dol—Eastern district mills, of dol..Far Western district ...mills, of dolSouthern district.. _ mills, of dol—Western district mills, of dol—
Lapse rates 1925-26=100
MONETARY STATISTICS
Foreign exchange rates:#Argentina •_ dol. per paper peso..Belgium —dol. per belga..Brazil dol per milreisCanada __ __ dol. per Canadian dolChile^ dol. per pesoEngland dol. per £__France dol. per franc..Germany dol. per reichsmarkIndia dol per rupeeItaly dol. per lira--Japan dol. per yen--Netherlands dol. per florin--Spain dol. per peseta--Sweden dol. per krona..Uruguay dol. ner Deso—
6209
5985
285267581
20. 4476,8384 994
70362
339784956145579765
2,8388, 615
43
4961,0643,734
2001,1091,969
18,6964,590
8443,746
8,5313,2641,9732.623
671
2,821
1,161167756238
904, 149267, 582203, 465
J33, 102
269, 12139, 8369,567
55, 488164, 230
4831995058
176
.330
.169
.083
.998
.0514.96.066.404.373.082.292.680.137.256.805
579g
6871
251206893
19, 3264,4166 786
309146
138975766778192717
2,7658,124
135
870790
« 3, 221123839
« 2, 146
17, 6595,2721 0764,196
7,1332,2031,7402,606
584
2,893
1 04226
766250
694, 25946, 795
202, 256445, 208
252, 57233, 2468,885
54, 072156, 369
4982134860
177
.336
.234084
1.012. 103
5.04.066.385.379.086.298.678.133.260.801
59712
6965
275106592
18, 4603,4017 489
22192
2201,2911,543
175146998
2,9027,569
225
714587
3, 505145943
1,449
17, 7255,2011 0474,154
7,2002,2361,7502,617
597
2,889
1 07325
793255
699, 87939, 628
212, 380447, 871
234, 66233, 5018,350
49, 111143, 700
484208
4759
170
.338
.237085
1 024. 103
5.07.067.395381
.087
.300
.684
.138
.261
.810
5129
4166
230316471
16, 4401,7357 467
291178
3651,8921,737
85365673
1,8817,238
177
436504
3,362320988
1,451
17, 7985,1411 0234,118
7,3922,4071, 7542,619
612
2,886
88016
654211
551, 55621, 087
170, 935359, 534
211, 89222, 7607,870
50, 772130, 490
4001624052
146
.333
.237083
1 029. 103
4.99.067.403
376.087.298.686.138.258.812
7163
681073352265
11619, 9684,4775 927
38263
731,654
333139312418
2,6979,564
57
568994
4,087532
1,0542,272
17, 8915,0771 0014,076
7,5172, 5031,7582,626
630
2. 8SO
1 10425
821258
694, 71836, 206
216, 439442, 073
245, 25227, 1658,344
55, 301154, 442
4952134958
175
.330
.235082
1 021. 103
4.94.066.405371
.086
.287
.681
.137
.255
.806
5971
62106270125294
18, 3504,9886 396
20237
941,018
342183316481
3,7056,966
5
6341,0272,567
1551,1171,461
17, 9824,997
9714,026
7,6032,5771, 7842,630
612
2,869
1 06121
784256
676, 75728, 137
205, 463443, 157
236, 51436, 7717,845
48, 392143, 506
476206
4657
167
.333
.233082
1 025. 104
4.99.066.402375
.085
.291
.676
.137
.257
.802
6386
55129274266088
19,9114,5037 578
36271
731,652
991281138350
3,7867,830
51
4781,7192,942
311678
1,651
18, 0404,917
9503,967
7,8342,8041,7912,629
610
2,868
1 26054
922284
838, 57671, 394
239, 873527, 309
367, 48173, 5799,753
104, 056180, 093
5902515971
209135
.330
.234089
1 013. 102
4.95.066.402372
.085
.288
.676
.137
.255
.802
82613
7616432018
118117
18,8245,3755 319
157209
59836818135132550
2,4238,130
124
5801,4312, 573
1581,7891,475
18, 1764,877
9323,945
7,9482,8781,8052,630
635
2,861
1 05124
745282
824, 90327, 348
196, 255601, 300
302, 19571, 7979,864
52, 549167, 985
6453055570
215
.326
.233082
1 002.051
4.89.066.401369
.085
.285
.675
.136
.252
.800
660g
53128296247081
18, 7384,7226 383
16497
3151,2911,054
180265784
2, 2337,633
61
4211,0443,028
327645
2,107
18, 2474,819
9173,902
8,0162, 9591,8122,635
610
2,854
1 05414
790250
721, 39120, 388
209, 017491, 986
244, 33027, 3528,785
53, 512154, 681
5342315361
189
.325
.233081999051
4.87.066401368
.085
.284
.676
.137
.251
.801
65410
5686
293268796
18, 5235,0066 842
62135
2351,6781,761
83269670
1,9496,675
63
525622
2,730551744
1,440
18, 3024,765
8983,867
8,0973,0131,8292,637
618
2,846
1 18523
892269
768, 49130, 611
235, 261502, 619
252, 45626, 60510, 1J454, 257
161, 480
5452335464
194
.318
.228082991051
4.78.066404360
.083
.280
.680
.137
.246
.805
77712
4711034533
103127
18, 0642,6735 601
382160
2341,474
287363302527
1,8729,790
117
398761
4,924329
1,3761,885
18, 3824,717
8833,834
8,2013,0871,8502,643
621
2,841
1 15132
854265
733, 87037, 495
228, 188468, 187
252, 98229, 2318,580
54, 625160, 546
5402265466
194
.322
.169083995051
4.84.066403364
.083
.284
.675
.137
.249
.802
69213
8085
330257188
15, 6702,1716 205
162383
1418448272051234.88
3,0327,294
243
719556
3,438165914
1,259
18, 4794,668
8683,800
8,3273,1631,8812,639
644
2,834
1 10338
804261
732, 18850, 231
215, 323466, 634
255, 22633, 8008,966
48, 658163, 802
500203
5262
183
.326
.169083
.999
.0514.89.066.402369
.082
.287
.676
.137
.252
.801
6579
65102281188696
20, 4638,7894 827
91249
18766875213
634
1,6576,847
123
823588
2,288235
1,3171,423
18, 5674,631
8553,776
8,3753,1991,8882,637
651
2,829
a 1 04728
769« 250
697, 47139, 537
205, 951451,983
242, 55430, 6118,415
52, 331151,197
4902015159
179126
.329
.169083999
.0514.93.066.404372
.083
.290
.679
.137
.254
.804a Revised.f Revised series. For earlier data see pp. 18,19. and 20 of the July 1933 issue, insurance written and admitted assets; p. 18 of the June 1933 issue, premium collections.1 The nominal official gold value of the Chilean peso was changed from 3 pence gold to ll/2 pence gold as of Jan. 2, 1935.# Par values of foreign currencies as given on pp. 86 and 87 of 1932 annual supplement were changed with the reduction in gold content of the United States dollar.• Quotation based on paper peso since Dec. 10,1933, instead of srold peso as formerly. Former equivalent to 44 percent of latter. See note on p. 56 of the March 1934 issue.A The figures for "other" bonds and stocks held (book value) for the months of January and February 1934 shown as 611 and 616 million dollars, respectively, in the
monthly issues from May 1934 to April 1935 should read 514 for January and 518 for February.

34 SUEVEY OF CURRENT BUSINESS September 1935
Monthly statistics through December 1931,together with explanatory footnotes and refer-ences to the sources of the data, may be foundin the 1932 Annual Supplement to the Survey
1935
July
1934
July August Septem-ber October Novem-
berDecem-
ber
1935
January Febru-ary March April May June
FINANCE—Continued
MONETARY STATISTICS-Continued
Gold and money:Gold:
Monetary stocks, U. S mills, of doL-Movement, foreign:
Net release from earmark.thous. of doL.Exports . thous. of doL.Imports__ _- thous. of doL-
Net gold imports, including gold re-leased from earmark A*.thous. of doL-
Production Rand fine ouncesReceipts at mint, domestic-fine ounces- -
Money in circulation, total-mills, of doLSilver:
Exports thous. of doL-Irnports - . __ -thous. of doL-Price at New York dol per fine ozProdueton, world • thous. of fine oz_-
Canada ..thous. of fine oz__Mexico thous. of fine ozUnited States thous. of fine oz..
Stocks, refinery, end of month:United States thous. of fine ozCanada thous. of fine oz__
NET CORPORATION PROFITS(Quarterly)
Profits, totalf mills, of dol~Industrial and mercantile, total
mills, of doL.Autos, parts and accessories
mills, of doL -Foods.. mills, of dol ..Metals and mining mills, of dolMachinery mills, of doL_Oil . mills, of dolSteel and railroad equip mills, of dol-.Miscellaneous mills, of doL.
Publie utilities! mills, of dolRailroads, class I (net railway operating
income) mills, of dolTelephones (net op. income) mills, of dol
PUBLIC FINANCE (FEDERAL)
Debt, gross, end of month mills, of dol..Expenditures, total (incl. emergency) J
thous. of doL.Receipts, totalf thous of dol
Customs _ ... thous. of dolInternal revenue, total thous. of dol
Income tax . thous of dolReconstruction Finance Corporation loans
outstanding, end of month: f§Grand total thous of dol
Total section 5 as amended.thous. of dol.Bank and trust companies, including
receivers .. _ .._ .thous. of dol__Building and loan assoc.thous. of dol__Insurance companies thous. of dol_.Mortgage loan companies
thous. of dol_-Railroads, incl. receivers. thous. of dol...All other under section 5. thous. of doL.
Total emergency relief and constructionact as amended thous. of doL.
Self-liquidating projects.thous. of do l__Financing of exports of agricultural sur-
pluses, thous. of dolFinancing of agricultural commodities,
and livestock thous. of dol_-Amounts made available for relief and
work relief thous. of dolTotal bank conservation act as amended
thous. of dol-Other loans and authorizations
thous. of doL.
9,128
-42359
16, 287
15, 805927, 803167, 667
5, 550
1,54730, 230
.68216, 5921, 1565, 8003,352
1,9431,842
29, 120
847,317301, 883
29,711236, 96223, 963
2,813,3111,102,849
455, 92810, 30718, 052
139,972413,338
65, 252
700, 359148, 525
14,517
239, 629
297, 688
903, 503
106, 595
7,893
588114
52, 460
52, 934876, 094141,910
5,350
1,7892, 458.463
13, 6671,3595,3211,853
7, 8652,402
27, 189
478, 859232, 712
19. 331195, 59221, 709
2,707,2821.330,662
578, 05036, 22032, 524
184, 174354, 742144, 952
571, 23496, 033
15, 185
161,478
298, 537
781, 409
23, 977
7,971
-1,05514, 55651, 781
36, 170881,86193, 2125,355
1,74121. 926
.49015, 4811,3786,5362,087
5,0682,257
27, 080
523, 078297. 256
22 952229! 548
22, 924
2,685,4011,291,855
591, 56030, 59331,363
161,312343, 482133, 185
532, 465107, 159
14, 875
111,907
298, 524
803, 333
57, 748
7,971
2,41922, 2553,585
-16,251857, 442144,313
5,427
1,42420. 831
.49515, 0321,5126,0981,786
5,4652,739
*87.4
20.224.06.43.89.5
<*16.439.946.6
115.9
27, 190
462, 034515.38336, 174
379, 738171, 177
2,668,7461,277,641
584, 03727, 69730, 532
160, 057343, 595131,723
504. 035111,062
14, 954
80, Oil
298, 009
827, 374
59, 696
7,989
2602,173
13, 010
11.097885, 627153, 887
5,473
1,16214, 425
.52415, 5811,0396,8212,099
4,4192,593
27, 188
771, 530302. 28730. 509
209, 69719, 189
2,649,6951,275,322
579.81724.60429, 852
158,762353, 491128, 796
473,910112,063
15,216
48, 626
298, 006
837, 742
62, 721
8,047
-85310
121, 199
120, 804878, 84796, 3655,494
1.69815,011
.54315, 3491,5176,2411,976
9162,955
27, 299
656, 589292, 21928. 376
189; 11922, 528
2,664,1151,285,262
595, 07022, 55829, 250
155,628361,830120, 926
465, 591116,891
14, 992
35, 935
297, 774
849, 432
63, 830
8,191
61140
92, 249
92, 170866, 037119, 864
5,577
1,0148,711.544
15, 4621, 1875,6142,917
1,1462,743
»58.9dJ>3.0917.9»8 4
2.48 6
d 10. 5»35. 1"52 1
119.3
28, 479
663, 725439, 088
32, 428333, 785163, 057
2,682,0071,295,746
626, 39019, 95124, 745
159, 736376, 89488, 030
473, 037122, 536
15, 176
37, 552
297, 774
863, 984
49, 240
8,284
1,131363
149, 755
150, 523890, 87598, 5905,411
1,24819, 085
.54416, 7031,5316.8922,722
1,3693,452
28, 476
481, 343233, 486
26, 351194, 36622, 321
2,657,8671,251,311
591, 64915,47723, 953
155, 839379, 46484, 929
478, 385125, 203
15, 176
40, 288
297, 718
873, 979
54, 192
8,465
23646
122, 817
123, 007821, 246
79, 5645,439
1,66116, 351
.54616, 167
9056,6403,411
1, 6143,144
28, 526
528, 998237, 248
24, 960181, 62133, 310
2,652,0391,217,112
564,51513, 42822, 526
154,957379, 70281, 984
481, 064127, 604
15, 164
40, 578
297, 718
895, 904
57, 959
8,552
-661540
13, 543
12, 342882, 309117,786
5,477
3,12820, 842
.59014, 951
9665, 1072,950
1,8533,106
115.2
*>45. 618.99.44.61 9
d0.835.6
»56 4
84.8
28, 817
576, 224645. 60532, 303
557, 304321, 908
2,641,1671,183,651
538, 43112, 28122, 035
151,796380, 19978, 909
490, 230132, 683
14, 953
44, 883
297, 711
902, 846
64, 440
8,641
-2, 30162
148, 670
146, 307869, 956
97, 0805,500
1,59311, 002
.67814, 5501,0015,1922,579
2,3722,513
28, 668
815, 151267, 82231, 453
194, 08324, 385
2,649,3291,167,476
522, 47111,30321, 184
149, 128386, 617
76, 773
502, 604134, 269
14, 963
55, 661
297, 711
900, 541
78, 708
8,755
-1,53549
140, 065
138, 481916, 035114, 552
5,507
2, 88513, 501
.744« 16, 072
1,896« 5, 193
2,693
3,2802,112
9,025
998166
230, 538
231, 370889, 026112,619
5,522
1,71710, 444
.719« 15, 090
1,148« 5, 432
2,387
2,3511,930
"1I - - - - -
» 283, 651266, 178
30, 339206, 677
24, 835
2,664,91]1, 165, 674
503, 00010, 38520, 060
146, 426413,438
72, 365
512, 694137, 321
14, 926
62, 757
297, 690
902, 358
84, 185
28, 701
930, 747496, 042
28, 177427, 606251, 889
2, 747, 4961,137,162
480, 4049,808
19, 231
145,551414,344
67, 824
614, 744146, 457
14, 532
156,066
297, 689
905, 262
90, 328
A Or exports (—). ° Revised. * Preliminary. d Deficit.• Data are compiled by the American Bureau of Metal Statistics and represent the estimated world output. The series for the period January 1928-August 1934 presented
in the SURVEY covered the principal producing countries which produced the following percentages of the world total: 1928, 87.9; 1929, 87.1: 1930, 85.5; 1931,82 0; 1932. 75 5-a n d 1933, 77.5. ' . » » » . - ,
c? Series revised to include emergency expenditures. Figures as shown in Survey for months prior to May 1932 are comparable with this series. Comparable figuresfor the period May 1932 to March 1933 are on p. 33 of the June 1934 issue. Later data are shown in monthly numbers.
' The item of $333,245,378 carried by the Treasury as a credit under the trust funds for May represents a transfer of that amount from the general fund to the trust funds.Amount represents deposits of governmental agencies for which Treasury has been acting as fiscal agent. The amount therefore has not been included in the May total ofreceipts and expenditures.
1 For 1934 includes $2,808,221,138 for February, $2,233,252 for March, $409,052 for April, $298,868 for May, $213,447 for June, $272,163 for July, $268,204 for August, $134,843for September, $173,702 for October, $116,585 for November, $132,296 for December. For 1935 includes $123,639 for January, $68,241 for February, $157,326 for March, $89,144for April, $06 103 for May, $105,773 for June, and $65,219 for July, representing the increment resulting from reduction in weight of gold dollar.
* For earlier data on net gold imports see p. 20 of the December 1932 issue.§ This excludes relief grants to States by the R. F. C. under the Emergency Relief Act of 1933 upon certification of grants by the Federal Emergency Relief Adminis-
trator. During 1934 these amounted to $499,650,000 on Jan. 31, Feb. 28, Mar. 31, and Apr. 30, $500,000,000 disbursed for relief purposes under Emergency Appropriation Actof 1935, and $10,000,000 purchase of stock in R. F. C. Mortgage Co. and $12,500,000 for preferred stock subscription in export-import banks.
t Revised series. See p. 19 of the July 1934 issue, corporation profits. The data of the Reconstruction Finance Corporation has been revised to include the statisticsof certain loaning agencies of the Corporation not included heretofore and for revisions made in recent audits. Revised data for February 1932-June 1935, inclusive, areshown on p. 20, of August 1935 issue.
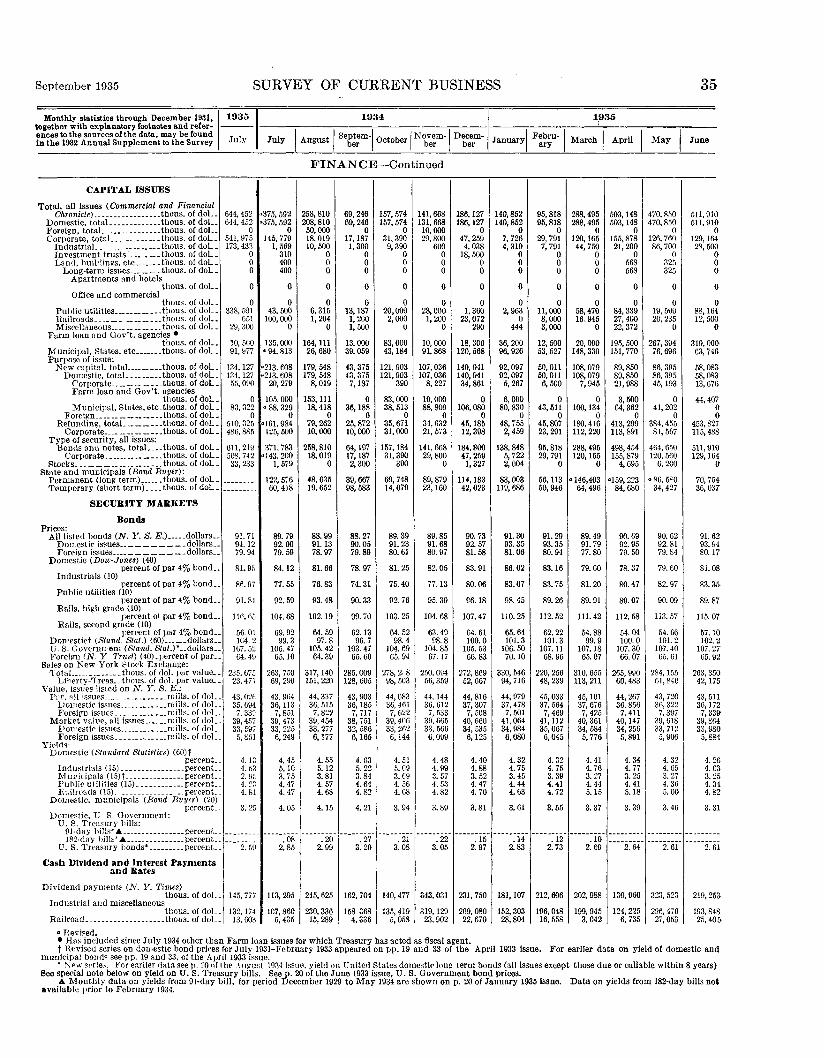
September 1935 SURVEY OF CUERENT BUSINESS 35
Monthly statistics through December 1931,together with explanatory footnotes and refer-ences to the sources of the data, may be foundin the 1932 Annual Supplement to the Survey
1935
July
1934
July August Septem-ber October Novem-
berDecem-
ber
1935
January Febru-ary March April May June
FINANCE—Continued
CAPITAL ISSUES
Total, all issues (Commercial and FinancialChronicle) thous. of dol._
Domestic, total thous. of dol__Foreign total thous. of dol _Corporate, total thous. of doL.
Industrial thous. of doL.Investment trusts. thous. of dol__Land, buildings, etc _ _ .thous. of doL.
Long-term issues thous. of doL_Apartments and hotels
thous. of dol__Office and commercial
thous. of doL.Piiblic utilities thous. of dol__Railroads thous. of doL.Miscellaneous thous. of doL _
Farm loan and Gov't. agencies •thous. of doL.
Municipal, States, etc thous. of doL_Purpose of issue:
New capital, total thous. of doL.Domestic, total thous. of dol__
Corporate thous. of doL_Farm loan and Gov't. agencies
thous. of doL _Municipal, States, etc. thous. of doL.
Foreign thous. of dol__Refunding, total thous. of dol__
Corporate thous. of doL.Type of security, all issues:
Bonds and notes, total thous. of doL.Corporate thous. of clol__
Stocks thous. of doL-State and municipals (Bond Buyer):
Permanent (long term) thous. of doL_Temporary (short term) thous. of doL _
SE CUBIT Y MARKETS
BondsPrices:
All listed bonds (N. Y. S. E.) dollars..Domestic issues dollars. _Foreign issues. dollars..
Domestic (Dow-Jones) (40)percent of par 4% bond..
Industrials (10)percent of par 4% bond..
Public utilities (10)percent of par 4% bond..
Rails, high grade (10)percent oi par 4% bond..
Rails, second grade (10)per cert of par 4% bond..
Domestic! (Stand. Stat.) (60) dollars..U . S. Government (Stand. S/<rt.)*__dollars__Foreign (N. Y Truat) (40) .percent of par. .
Sales on New York Stock Exchange:Total thous. of dol. par value. _
Liberty-Treas. -thous. of dol. par value..Value, issues listed on N. Y. S. E.:
Ppr. all issues _ mills, of dol. _Domestic issues mills, of dol.Foreign issues _ mills, of dol .
Market value, all issues mills, of dolDoirestic issues __ mills, of dolForeign issues mills, of dol
Yields:Domestic (Standard Statistics) (60) t
percent. -Industrials (15) percent--Municipals (15)f percent. -Public utilities (15) percent..Riiil^oads (15) -. percent
Domestic, municipals (Bond Buyer} (20)percent. -
Domestic, U S. Government:U. S. Treasury bills:
91-day bills* A _. _percent_.182-day bills* A .. percent
U. S. Treasury bonds* percent. -
Cash Dividend and Interest Paymentsand Bates
Dividend payment? (N. Y. Times)tbous. of doL_
Industrial and miscellaneousthous. of dol. .
Railroad .thous. of dol..
644, 452644, 452
0541, 975173, 433
000
0
0338, 591
65129, 300
10, SCO91, 977
134, 127134, 12755, 090
083, 322
0510, 325486, 885
611,219508, 74233, 233
91.7194.1279.94
81.95
86.97
91.81
116. 65
56.01104. 2
107. 5264. 49
235 67523, 471
43, 02635 694
7, 33°39 45733, 5975 861
4.134.532.954.234 81
3.25
2.59
145, 777
132,17413. 603
375, 592375, 592
0145, 779
1,569310400400
0
043, 500
100, 0000
135,000« 94, 813
"213. 608"213, 608
20, 279
105, 000« 88. 329
0<» 161. 984
125, 500
371,783<* 143, 200
1,579
122, 57660 418
89.7992.0079.59
84.12
77.55
92.59
104. 68
69.9299.3
106. 4765.10
263 75069, 290
43, 96436 1137,851
39 47333 2256 249
4.455.103.754.474 47
4.05
082.85
113,295
107, 8605.435
258, 810208, 81050, 00018, 01910, 500
000
0
06,3151,204
0
164, 11126, 680
179, 548179, 548
8,019
153, 11118, 418
079, 26210, 000
258, 81018, 019
0
48, 63519, 652
88.9991.1378.97
81.66
76.83
93.48
102. 19
64.5997.8
105. 4264.39
317, 140151, 220
44, 33736 5157,822
39 45433, 2776 177
4.555.123.814.574.68
4.15
.202.99
245, 625
230, 33615. 289
69, 24669, 246
017, 1871,300
000
0
013, 1871,2001,500
13, 00039, 059
43, 37543, 3757,187
036, 188
025, 87210, 000
64, 19717, 1872,300
39, 66798 583
88.2790.0579.89
78.97
74.31
90.33
99.70
62.1396.7
103. 4765.60
285, 009128, 605
43, 90336, 1857,717
38 75132, 5866 165
4.635.223.844.644.82
4.21
.273.20
162, 704
158 3684.336
157, 574157, 574
031, 3909,390
000
0
020,0002,000
0
83, 00043, 184
121, 903121, 903
390
83, 00038, 513
035, 67131, 000
157, 18431, 390
390
69, 74814, 079
89.3991.2380.61
81.25
75.40
92.76
103. 25
64. 5298.4
104. 6965.94
278, 2- 898, 503
44, 08336 4617,622
39 40633, 2626 144
4.515.093.694.564 68
3.94
.213.08
140, 477
135, 4195.058
141, 668131, 66810,00029, 800
600000
0
028, 0001,200
0
10, 00091, 868
107, 036107, 036
8,227
10, 00088, 809
034, 63221, 573
141, 66829, 800
0
89, 87923, 160
89.8591.6880.97
82.05
77.13
95.39
104. 68
63.4998.8
104. 8567.17
250, 09456, 359
44, 14436,612
7, 53339 66533, 5666 099
4.484.993. 574.534.82
3.89
.223.05
343, 031
319, 12923. 902
186, 127186, 127
047, 2594,038
18, 50000
0
01,360
23,072290
18, 300120, 568
140, 941140, 94134, 861
0106, 080
o45, 18512, 398
184, 80047, 2591,327
114, 18342, 023
90.7392.5781.58
83.91
80.06
66.18
107. 47
64.61100.0
105. 5366.83
272 86952, 667
44,81637 3077,508
40 66034, 5356 125
4.404.883.524.474.70
3.81
.152.97
231,750
209, 08022. 670
140, 852140, 852
07,7264,319
000
0
02,963
0444
36, 20096, 926
92, 09792, 097
5,267
6,00080, 830
048, 7552,459
138, 8485,7222,004
83,003119, 686
91.3093.3581.06
86.02
83.07
98.45
110. 25
65.64101.3
106. 5070.10
330, 54694, 716
44, 97937 4787,501
41 06434, 9846 080
4.324.753.454.444.63
3.61
.142.83
181, 107
152, 30328. 804
95, 81895, 818
o29, 7917,791
000
0
011, 0008,0003,000
12, 50053, 527
50,01150, Oil6,500
043, 511o45, 80723, 291
95, 81829, 791
0
56, 11350, 946
91.2993.3580.94
83.16
83.75
89.26
112. 52
62.22101.3
107. 1168.96
220, 25648, 239
45, 03337 564
7,46941,11235, 0676 045
4.324.753.394.414.72
3.55
.122.73
212, 606
196, 04816. 558
288, 495288, 495
0120, 16544, 750
000
0
058, 47016,945
0
20, 000148, 330
108, 079108, 079
7,945
0100, 134
o180.416112, 220
288, 495120, 165
0
« 146,40364, 496
89.4991.7977.80
79.00
81.20
89.91
111.42
54.8899.9
107. 1865.07
310, 655113, 211
45, 10137 676
7,42540 36134, 5845 776
4.414.763.274.445.15
3.37
.102.69
202, 988
199, 9453.042
503, 148503, 148
0155, 87821, 200
0568568
0
084, 33927, 40022, 372
195, 500151, 770
89, 85089, 85021, 988
3,50064, 362
o413, 299113,891
498, 454155, 879
4,695
°159, 22384 680
90.6992.9579.50
78.37
80.47
89.07
112. 58
54.04100.0
107. 3066.07
265 99060, 483
44, 26736 8567,411
40 14734, 2565 891
4.344.773.254.415.18
3.39
2.64
130, 960
124, 2256.735
470, 850470, 850
o126, 76086, 700
0325325
0
019, 50020, 235
0
267, 39476, 696
86, 39586, 39545, 193
041, 202
0384, 45581,567
464, 650120, 560
6,200
« 86, 58034, 427
90.6292.8179.84
79.60
82.97
90.09
113. 57
54.66101.2
107. 4065.61
284, 15561,840
43, 72036, 3227,397
39, 61833, 7125 906
4.324.653.274.365.00
3.46
2.61
323, 523
296, 47027. 053
511,910511,910
0129, 16428, 500
ooa0
088, 16412, 500
0
319, ooa63, 746
58, 08358, 08313 676
44, 40700
453, 827115, 488
511,910129, 164
a70, 75436 037
91. 6293.9480.17
81.08
83.35
89. 87
115. 07
57. 10102.2
107. 2765.92
263, 35042, 175
43,51136 172
7,339-39 86433, 9805 884
4.264.633.254.344.82
3.31
2.61
219, 253
193, 84825. 405
« He vised.• Has included since July 1934 other than Farm loan issues for which Treasury has acted as fiscal agent.t Revised series on domestic bond prices for July 1931-February 1933 appeared on pp. 19 and 33 of the April 1933 issue. For earlier data on yield of domestic and
municipal bonds see pp. 19 and 33, of the April 1933 issue.* New series. For earlier data see p, 20 of the August 1934 issue, yield on United States domestic long term bonds (all issues except those due or callable within 8 years)
See special note below on yield on U. S. Treasury bills. See p. 20 of the June 1933 issue, IT. S. Government bond prices.A Monthly data on yields from 91-day bill, for period December 1929 to May 1934 are shown on p. 20 of January 1935 issue. Data on yields from 182-day bills not
available prior to February 1934.

36 SURVEY OF CUEEENT BUSINESS September 1935
Monthly statistics through December 1931,together with explanatory footnotes and refer-ences to the sources of the data, may be foundin the 1932 Annual Supplement to the Survey
1935
July
1934
July August Septem-ber October Novem-
berDecem-
ber
1935
January Febru-ary March April May June
FINANCE—Continued
SECURITY MARKETS-Continued
Cash Dividend and Interest Paymentsand Rates— Continued
Dividend payments and rates (Moody' *):Dividend payments, annual payments at
current rate (600 companies)mills, of doL.
Number of shares adjusted millionsDividend rate per share, weighted average
(600) dollars--Banks (21) dollars.-IndustriaJ (492) dollarsInsurance (21) - .. dollarsPublic utilities (30) dollars..Railroads (36) dollars. .
StocksPrices:
Dow-Jones:Industrial? (30) dol. per sharePublic utilities (20) _. dol. per share. _Railroads (20) dol. per share
New York: Times (50) dol. per share--Industrials (25) dol. per share..Railroads (25) dol. per share--
Standard Statistics (421) .1926=100Industrials (351) 1926=100Public utilities (37) .1926=100Railroads (33) 1926=100 .
Standard statistics:Banks, N. Y (20) - 1926 = 100Fire insurance (20) 1926= 100. _
Sales, 2V. Y. S. E thous. of shares..Values, and shares listed, N. Y. S. E.:
Market value all listed shares-mills, of dol—Number of shares listed millions--
Yields:Common, Standard Statistics (90)
percent ..Industrials (50) _ percent __Public utilities (20) __ percent ..Railroads (20) ..percent..
Preferred, Standard Statistics:Industrials, high grade (20) percent--Stockholders (Common Stock)
American Tel. & Tel. Co., total numberForeign. , _ . _ . .number .
Pennsylvania Railroad Co , total numberForeign number
U. S. Steel Corporation, total number. .Foreign- . number..Shares held by brokers percent of total
1, 190. 21918. 42
1.303.191.112.231.831.24
122.722.533.6
98.91171. 7826.0579.491 773 934 1
56.889.7
29, 429
38, 9131,308
0)0)0)0)5.19
1,113.4918 05
1.213.77.96
1.711.971.20
94.522.240 7
83.00133. 8732. 1271.479 769.241.2
57.866.8
21, 116
30, 7521,294
3.673.385.732.69
5.67
1. 128. 9918 08
1.233.77.98
1.711.981.20
91.620.535 4
79.16130. 4627.8667.876 764.635.6
53.465.1
16, 693
32, 6181,310
4.003.606.303.71
5.71
1, 131. 1918 08
1.233.77.98
1.711.981.20
90.519.835 1
78.76129. 9527.5667.075 763.735.1
48.165.0
12, 636
32, 3201,313
4.213.836.533.76
5,79
675,4107,743
233, 7073,151
192, 2143,80219.03
1, 137. 1918 08
1.243.77.99
1.711.981.20
93.519.835 7
81.71135. 3228.1167.376 462.935.6
48.767.3
15, 660
31, 6131,305
4.223.836.713.70
5.79
1, 163. 9918 08
1.273.771 031 711.981.21
99 318.835 8
85.14141 6228.6769 480 160.735.3
51.672.4
20, 868
33, 8881,305
4.143.707.143.72
5.64
1, 168. 7918 08
1.273.731.061.781.901.21
101.618.036 5
85.07141. 4628.6869.280 358.235.8
49.173.2
23, 588
33, 9341,305
4.253 767.843.68
5.48
674, 7397,826
232, 9983,156
191, 4464,08319.44
1, 177. 5918 08
1.283.681 071.911.871.24
103.117.535 5
85.82144. 2127.4369.781 457.434.6
51.573.7
19,410
32,9911,305
4.243.748.023.79
5.42
1, 184. 4918 08
1.293.681 081.911.871.24
103.016.532 4
84.64144 2325.0667.880 054.531.8
53.474.2
14, 404
32, 1801,303
4.243.748.074.13
5.38
1, 181. 6918 42
1.293.281.091.911.861.24
99.815.628 5
80.74139. 4822.0163.975 453.227.8
47.572.3
15, 948
30,9361,304
4.514.018.124.70
5.33
675, 7557,877
232, 6343,152
191, 2244,06219.34
1, 184. 4918. 42
1.293.281.101.911.861.24
106.017.930.1
85.68147. 5623.8167.578 959. 129.4
75.275.2
22, 408
33, 5481,302
4.353.966.704.50
5.30
1, 186. 1918. 42
1.293.281.102.071.841.24
113.519.231 0
89.84155. 6424.05
73 185 564 531 0
47.379.2
30, 438
34, 5491,304
0)0)0)0)
5.19
1, 186. 9918 42
1.293.191.102.171.841.24
116.921.432 5
95.83166. 0325.6376 088 070 432 7
49 883 2
22, 340
36, 2271,304
0)
0)0)
5.22
671, 3247,847
231, 9703,145
190, 3754,02119 55
FOREIGN TRADE
INDEXESValue:
Exports, unadjusted - 1923-25 = 100. _Exports, adjusted for seasonal
1923-25=100 .Imports, unadjusted 1923-25 = 100. .Imports, adjusted for seasonal
1923-25=100..Quantity, exports:
Total agricultural products. . 1910-14=100.-Total, excluding cotton 1910-14=100..
VALUE §
Exports, incl. reexports thous. of dol. _By grand divisions and countries:
Africa thous. of dol__Asia and Oceania thous. of dol..
Japan thous of dolEurope thous. of doL.
France . . . thous. of dol_.Gerrnany thous of dolItaly thous. of doL_United Kingdom thous. of doL.
North America, northern - thous. of dol. _Canada thous. of dol_.
North America, southern -thous. of dol__Mexico thous. of dol .
South America thous of dolArgentina thous. of dol._Brazil _ . thous. of dol _Chile thous. of dol _
46
5255
60
3933
173, 371
9,21131,59811,86469,7227,3456,3485,167
24,30630,14129,67917,6246,004
15,0644,6223,7331,432
43
4839
43
4646
161, 787
8,50235, 93512,81261, 8146,3797, 7034,275
24, 38027, 28126.76114, 6564, 762
13, 5973,6923, 216
814
45
4937
39
4654
171, 965
6,65938, 13213 «5768, 728
6,4766,8034,951
30, 69427, 85227, 25714, 0734,765
16 5224,4373,9651.329
50
4841
43
6561
191, 660
7,99640, 11919, 97786,91210, 3347,4435,093
40, 11925, 37024, 85015, 9764,614
15,3183,7123, 9791.181
54
4540
39
8270
206, 352
5,75746, 88326, 99495, 10010, 5126,2756,226
47, 03627, 42026, 87517,4185,910
13, 7744,1352,9611,045
51
4547
47
7358
194, 901
7,29041, 83722, 84688, 5419,1315, OB38,445
40. 53626, 65526, 03815, 4854.506
15, 0923,7804,3591.645
45
4341
41
6246
170, 676
6,66344, 29423, 30969, 3469,9354,6464,821
28, 48621, 37921,00915, 8424,407
13, 1522,9463,2251,271
46
4552
51
5743
176, 223
5,37639, 96919,90178, 5507,5444,7356,233
37, 96823, 15122, 81515, 674
5, 03513, 5033, 5043,5511.110
43
4747
48
5039
163, 006
7,14937, 40315, 97466, 4827,3266,0756,870
25, 76623, 66423, 31714, 3534,370
13,9553,7653,5341,316
49
4855
49
4541
185, 001
8,13538, 59314, 74476, 0137,3346,1136,947
29, 44426. 53226, 00518, 7065,963
17, 0214,6234,1251,316
43
4653
49
4130
164, 350
8,00634, 10013,71963. 3888,6144,8194,156
20, 55028. 95728, 58215, 7475,370
14, 1503,8644,0241,088
44
4653
52
4035
165, 457
6,79733, 44113, 97764, 9459,2984,9803,552
24, 23831, 38030, 63616, 1955, 625
12, 6993,5353, 1581,119
45
5049
51
4433
170, 193
7,92733, 32514, 10869, 3808,7417,0275,565
21, 92428, 17027, 72317, 3426,368
14, 0484,3833,4741.209
1 Temporarily discontinued by the reporting source.§Data revised for 1932. See p. 34 of the March 1933 issue. Other revisions for the year 1932 were shown on p. 34 of the April, May, December 1933, and January 1934
issues. For revised data for months of 1933 see p. 20 of the September 1934 issue.
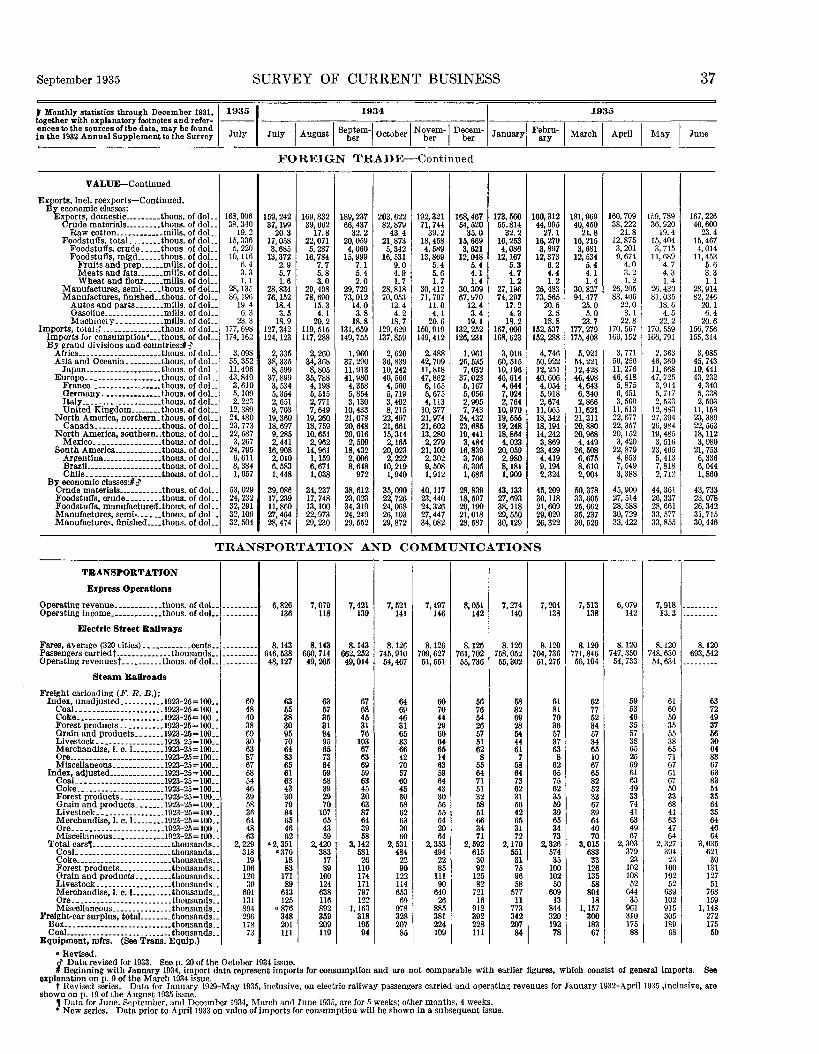
September 1935 SURVEY OF CURRENT BUSINESS 37
f Monthly statistics through December 1931,together with explanatory footnotes and refer-ences to the sources of the data, may be foundin the 1932 Annual Supplement to the Survey
1935
July
1934
July August Septem-ber October Novem-
berDecem-
ber
1935
January Febru-ary March April May June
FOREIGN TRADE—Continued
VALUE— Continued
Exports, incl. reexports— Continued.By economic classes:
Exports, domestic - _ thous. of dolCrude materials thous of dol
Raw cotton. mills, of doL.Foodstuffs, total thous. of doL.
Foodstuffs, crude thous of dol. .Foodstuffs, mfgd thous. of dol
Fruits and prep mills, of dol._Meats and fats .mills, of dol._Wheat and flour mills, of dol..
Manufactures, semi- thous. of dol_.Manufactures, finished— thous. of dol._
Autos and parts. mills, of doL.QasoliDe mills, of dolMachinery mills, of doL
Imports, total J — thous. of doL.Imports for consumption*.. .thous. of dol..By grand divisions and countries :#c?
Africa thous. of dol..Asia and Oceania thous. of dol._
Japan thous. of dol_.Europe thous. of doL.
France. thous. of dolGermany thous. of doL.Italy _ thous. of dolUnited Kingdom thous. of doL.
North America, northern. thous. of dol__Canada . thous. of dol
North America, southern.4hous. of doL.Mexico thous. of dol
South America thous. of dolArgentina thous of dolBrazil. thous. of dolChile thous of dol
By economic classes:#cfCrude materials thous. of doL.Foodstuffs, crude thous. of dol._Foodstuffs, manufactured.thous. of dol_.Manufactures, semi- thous. of doL.Manufactures, finished thous. of doL.
168, 00638, 340
19.215, 3365,220
10, 1166.43.31.1
28, 13586, 196
19.46. 3
23.3177, 698174, 162
3,09855, 35211,49643, 8493,6105,1092,223
12, 38924, 48023, 77322, 5873,267
24, 7956,6118,3841,657
53, 02924, 23232, 29132, 10632, 504
159, 24237 199
20.317, 0583,685
13, 3722.95.71.6
28,83476, 152
18.43 5
18 9127, 342124, 123
2,33538, 3358,599
37, 8993,5345,3542,6519,703
19, 36018, 6979,2852,441
16, 9082 0106,5831 448
39, 08617, 23911, 86027, 46428,474
169, 83239 662
17.822, 0715,287
16, 7847.75.83.0
29, 40878, 690
15.34 1
20 2119,515117, 288
2,26034, 3688,805
35, 7884,1985,5152,7717,649
19, 26018, 75910, 6512,962
14, 9611,1596,6711 038
34, 23717, 74813, 10022, 97329, 230
189, 23766 437
32.220, 0594,060
15, 9997.15.42.0
29, 72973, 012
14.03 8
18.8131, 659149, 755
1,96037, 29011,91341, 9804,3585,8543,130
10, 43321,07820,64829, 0162,509
18, 4322,0068,648
972
38, 61223,02334, 31924, 24929, 552
203, 62282 879
43.421, 8735,342
16, 5319.04.91.7
28, 81870, 053
12.44 2
18 7129, 629137, 859
2,62036, 83910, 24240, 6664,5605,7193 4028,215
22, 49721, 66115, 3142 165
20, 0232 222
10, 2191 940
35, 09022, 72624, 06826, 10329, 872
192, 32171 744
39.218, 4584,589
13, 8695.45.61.7
30, 41271,707
11.04 1
20 6150, 919149, 412
2,48842, 70911,81847, 862
6, 1655,6754, 113
10, 37721, 97421, 60213, 2802,279
21,1002 3029,5081 912
40, 11723, 44024, 32627, 44734, 082
168, 46754 520
35.015, 6693,621
12 0485.44.11.4
30,30967, 970
12.43 4
19 1132, 252126, 231
1,96126, 5357,032
37,0236,1675,0562,9057,743
24, 43223, 68519, 4413 484
16, 8393 7066,3051 685
28, 83918, 59729, 19021,01828,587
173, 66055,814
32.216, 2534,086
12, 1676.34.71.2
27, 19674, 297
17.24 3
18.2167, 006168, 623
3,01660, 51510, 19646, 6144,6447,0242,764
10,97019, 55519, 24818, 8644,023
20, 0592 9808,1811 909
43, 13327, 69338, 11829, 55030, 129
160, 31244, 995
27.116, 2703,897
12, 3736.24.41.2
25, 48373, 565
20.52 8
18.8152, 537162, 288
4,74650, 92212, 25140, 6064,0545,9182,674
11,06518, 34218, 19414, 2423,869
23, 4294 4199,1942 324
45, 20930,11821, 60929, 02926, 322
181, 96940 450
21.816, 2153,681
12, 5345.44.11.4
30, 82794, 477
25.05 0
23.7177, 279175, 408
5,92154, 22112, 42846, 4984,6436,3402,866
11,62121,31120, 88020, 9684,449
26, 5086 6758,6102 904
50, 37833, 60525, 66235, 23730, 526
160, 70938, 222
21.812, 8753,2019,674
4.03.21.2
26. 20583, 406
22.03.1
22.8170, 567166, 152
3,77150, 25611, 27646, 4185,8756,4513,560
11,51322, 67722, 35720, 1523,420
22, 8794,8537,5493,388
45, 90027, 51428, 58830, 72933, 422
159, 78936, 920
19.415, 4043,715
11,6894.74.31.4
26, 43081, 035
18.64.5
22.2170, 559166, 791
2,36346, 36011, 66847, 7253,9145,7472,533
12, 88327, 39426, 98419, 4853,516
23, 4655,4137,8182 712
44, 36126, 33728, 66133, 57733, 855
167, 22640, 600
23.415, 4674,014
11, 4535.63.31.1
28, 91482, 246
20.16.4
20.6156, 756155, 314
3,08545, 74310, 44143, 2324,3405,3382,503
11, 15323, 38922, 56318, 1123,080
21, 7536,3366,0441,860
43, 73323, 07826, 34231,71530, 446
TRANSPORTATION AND COMMUNICATIONS
TRANSPORTATION
Express Operations
Operating revenue ..thous. of dol..Operating income thous of dol
Electric Street Railways
Fares, average (320 cities). cents..Passengers carried t thousandsOperating revenues! - thous. of dol
Steam Railroads
Freight carloading (F. R. J5.):Index, unadjusted 1923-25 = 100. .
Coal. _ 1923-25=100..Coke.... 1923-25=100..Forest products.. 1923-25=100..Grain and products 1923-25=100..Livestock 1923-25=100Merchandise,! c 1 1923-25=100Ore 1923-25=100Miscellaneous 1923-25=100..
Index, adjusted 1923-25=100 .Coal 1923-25=100.-Coke 1923-25=100Forest products ... .1 923-25 =100Grain and products 1923-25=100Livestock 1 923-25 = 100Merchandise, 1. c. 1... 1923-25=100..Ore 1923-25=100Miscellaneous . 1923-25=100
Total cars^ thousandsCoal thousandsCoke _ thousandsForest products thousandsGrain and products thousands..Livestock .. thousandsMerchandise, 1. c. 1 thousandsOre thousandsMiscellaneous _. thousands
Freight-car surplus, total thousandsBox . thousandsCoal thousands
Equipment, mfrs. (See Trans. Equip.)
604840386930638767585446395836644863
2,22931819
10612039
60113189429617873
6,826136
8.143646, 53848, 127
635538309570648365616343307984654662
0 2, 351°376
1883
17189
613125
« 876348201111
7,079118
8.143660, 71449, 205
6367353184956573645968392970
107654359
2,420383
1789
160124638116892359209119
7,421139
8.143662, 25249, 014
6768453176
103676369596345306387643958
3,14268126
110174171797122
1,16331819694
7,521141
8.126745 91054, 467
646946316583664270576045305862633060
2,5314842290
12211465369
97832820785
7,497146
8.126709 62751, 551
607044296064651463596443305655642064
2,3534942285
11190
64026
885381224109
8,051142
8.126761 70255, 736
667654265761628
55647151325851663471
2,5926153092
12582
72116
912392228111
7,274140
8.120758 05265, 302
688269286444617
58647362315642653172
2,17055131759658
57711
77334220784
7,204138
8.120704, 73651, 275
618170365737638
62657562355939653473
2,32657435
10010250
60913
84432019278
7,513138
8.120771 84656, 104
627752346734651067658252336739644070
3,01568333
12613558
80418
1,15730018367
6,079142
8.120747, 35054, 733
595346355738652569616349337441634967
2,30337923
10210852
64435
96131017588
7,91813.3
8.120748, 63054, 634
616050355538657167616750336841634764
2,32739423
10010252
63910291530518968
8.120693, 542
637249375630648367638354356435644664
3,03562130
13112751
768159
1,14827217550
« Revised.c? Data revised for 1933. See p. 20 of the October 1934 issue.# Beginning with January 1934, import data represent imports for consumption and are not comparable with earlier figures, which consist of general imports. See
explanation on p. 9 of the March 1934 issue.t Revised series. Data for January 1929-May 1935, inclusive, on electric railway passengers carried and operating revenues for January 1932-April 1935 .inclusive, are
shown on p. 19 of the August 1935 issue.^ Data for June, September, and December 1934, March and June 1935, are for 5 weeks; other months, 4 weeks.* New series. Data prior to April 1933 on value of imports for consumption will be shown in a subsequent issue.

38 SUEVEY OF CURRENT BUSINESS September 1935
Monthly statistics through December 1931,together with explanatory footnotes and refer-ences to the sources of the data, may be foundin the 1932 Annual Supplement to the Survey
1935
July
1934
July August Septem-ber October Novem-
berDecem-
ber
1935
January Febru-ary March April May Jun
TRANSPORTATION AND COMMUNICATIONS—Continued
TRANSPORTATION-Continued
Stearn Railroads— ContinuedFinancial operations (class I railways):
Operating revenues! -thous. of dol_.Freightf.- thous. of dolPassengerf thous. of dol..
Operating expensesf. -- -thous. of dol—Net railway operating incomef
thous. of dol..Operating results (class I roads):
Freight carried 1 mile mills of tonsReceipts per ton-mile centsPassengers carried 1 mile millions
Canals: Waterway TrafficCape Cod __thous. of short tonsNew York State tho .s. of short tons..Panama, totalf thous of long tons
U. S. vessels thous. of long tonsSt. Lawrence thous. of short tonsSault Ste. Marie thous of short tonsSuez _ thous. of metric tonsWelland thous of short tons
Rivers:Allegheny .thous. of short tonsMississippi (Government barges)
thous. of short tons..Monongahela ._ thous. of short tonsOhio (Pittsburgh to Wheeling)
thous. of short tons-Ocean traffic:
Clearances, vessels in foreign tradefthous. of net tons..
Foreignf thouc . of net tonsUnited Statesf thous. of nat tons
Shipbuilding. (See Trans. Equip.)
TravelAirplane travel:
Express carried* pounds..Miles flown* thous. of milesPassengers carried* numberPassenger-miles flown* thous of miles
Hotel business:Average sale per occupied room... dollars..Rooms occupied . percent of total
Foreign travel:Arrivals U 8 citizens numberDepartures U S citizens numberEmigrants numberImmigrants numberPassports issued number--
National parks:Visitors number..Automobiles number--
Pullman Co.:Passengers carried thousandsRevenues total thous of dol
COMMUNICATIONSTelephones (59 carriers):*
Operating revenues thous. of dol—Station revenues thous. of del-Ton's, message thous. of dol—
Operating expenses thous. of dol—Net operating income thous. of dol—Telephones in service, end of mo.
thousandsTelegraphs and cables:
Operating revenues. _ — thous. of dol—Commercial telegraph tolls__thous. of dol—Operating expenses. thous. of dol—Operating income thous. of dol—
275, 349220. 49031, 604
217, 931
26,851
229
1.0077,503
1 128
293
1421,271
928
6,3794.0992,280
2.8756
13. 546
612,437159, 961
"276, 010"221, 292« 32. 212
"208, 493
« 35, 441
24 2571 Oil1,778
206519
1 934770977
7 5222 1941 334
282
1091 030
698
6,0233 8592,165
163. 3424, 118
48, 17218 153
2.8452
24, 05526 6423,5152 777
12, 294
570, 295145, 887
1,2803 710
78, 57651, 57919, 80857, 52513, 263
13, 981
8,7506,7187,961
381
282, 679224, 83732, 801
211, 706
39, 677
25, 402.985
1.854
223627
2,188976866
6,9902,4031 273
261
1201,088
599
6,5414,2602,282
198, 9024,189
54, 83521, 358
2.9854
49, 34148 6964,0043,7857,591
531, 734163, 074
1,4033 928
79, 29051, 55820, 64457, 34714, 150
13, 990
9,3247,2268,024
895
275,511220, 49230, 607
203,800
41, 020
25, 885.943
1,695
214465
2, 1431.045
9246 1452,3031 171
222
113944
569
5, 8553,6662,188
206, 3273,660
44, 72818 875
2.9157
43, 92737 533
4,7103 5855,o99
385, 14754, 624
1,3543 892
78, 07651,83619, 21155, 72014, 660
14, 058
8,6866,6577,664
620
292, 903238, 79228, 572
212, 573
48,625
26, 497.980
1,543
272726
2,1731,0291 0365,0062,7071 331
213
100963
584
5,6913,6662,025
221, 9054,019
48, 47720, 838
2.9661
24, 97620 8252,6303,5865,059
74, 70916, 830
1,2653 790
81, 63864, 37420. 26858, 05216, 209
14, 093
9,1306,9847,906
822
256, 967208, 54724, 846
197, 872
31,583
23, 708.961
1,279
264559
2,3391,015
8842 6272,4241 253
181
100977
597
5,2963,4021,893
206, 3273,660
44, 72818, 875
3.0358
15, 09118 5424,3543.3865,046
38, 7297,375
1,1313 310
79, 58353, 60418, 98957, 05015, 119
14,112
8,4436,4777,639
405
257, 506199, 35632,016
195, 351
38, 738
23, 105946
1,635
2540
2,08988539
2992,414
142
147
761,049
632
4,3272,8191,508
217, 8523,365
33, 56315, 595
2.9254
12, 38813 9423,8532,5594,959
37, 4047,656
1,3713 794
«> 80, 411fc 53, 212
19, 92758, 714
* 14, 980
14, 132
9,4117,3628,0951,091
264, 213211,00830, 448
212, 972
21, 349
24 964.942
1,491
2040
1,945825
0o
2,513o113
881,429
711
4,2882,8181,471
177, 5533,231
28, 92213, 405
2.8564
14, 44317 0162,4242,9435,658
54, 7209,767
1,3984 231
81, 47554, 63619, 79357, 82315, 377
14, 162
8,7546,7687,808
557
254, 940206, 024
27, 264200, 103
25,720
24 140.944
1,341
1640
1,836708
0o
2,090o125
781,545
717
4,1702,7351,435
171,8183,349
34, 99816, 232
2.9562
15, 47417, 6282,2261,9485,139
63, 2579,599
1,2043 702
77, 83452, 79817, 93055, 42014, 214
14, 201
8,2126,3407,372
454
280,899228, 60327, 737
213, 278
37, 851
27 586929
1,370
2360
2,210961
0o
2,383o155
1081,784
886
4,6433,1091,534
238, 3694,126
55, 19824, 751
2.8360
20, 47016, 6652,4602,4018,453
73, 9617,545
1,2194 004
81, 20754, 08620, 06157, 29215, 793
14, 250
9,1537,0527,810
952
274, 652221, 96827, 181
209, 328
34, 626
23, 3201.0411,386
213329
2,079811157888
2,461484
191
1541,142
754
5,1883. 4351,753
231, 2374, 194
61, 49926, 747
2.9162
23, 37416, 5362,2492,516
12, 674
90, 91415, 908
1,1933,675
82, 12754, 48320, 56657, 49916, 214
14, 303
9, 3777,3667,7901,195
279, 549224, 330
27, 114209, 196
39, 505
24, 6621,0161,377
230554
2,292938919
5, 9852, 1611, 122
246
1521, 383
877
5,7033,6992,004
258, 924« 4, 749
° 64,971° 27, 075
2.7761
19.40019, 0332,6972, 951
22, 854
100, 59328,176
1,1463.660
83, 40654. 99821,25059, 05916, 052
14, 355
9, 8097, 6347,9641, 4fl)
281,336225, 18331,053
216,464
34, 025
25, 933
227482
2,081862882
7, 0582, 1351 072
273
a 1331,561
881
5. 9563,8582,102
330, 9704,993
73, *9631, 226
2.8658
19, 51919, 3422,4122.817
24, 879
317, 18284, 368
1, 309
81,75754, 00620, 56957, 44316,025
14, 335
9 '3727,2687,8241,156
CHEMICALS AND ALLIED PRODUCTS
Alcohol: CHEMICALSDenatured:
Consumption (disposed of)thous. of wine gal—
Production thous. of wine gal—Stocks, end of month.thous of wine gal-
Ethyl:Production thous. of proof gal—Stocks, warehoused, end of month
thous. of proof gal._Withdrawn for denaturing
thous. of proof gal..Tax paid* thous. of proof gal—
7, 2138,1922, 750
16, 704
26, 055
14,0461,771
6,4486,7311,801
13, 702
28,967
11,3591,052
6, 7606,9431,978
13,823
29, 788
11, 6841,121
10,0489,8411, 763
15, 636
27, 094
16, 4561,075
19, 58219,1941,380
21,332
14,449
32, 6821,266
10, 54210. 3161,149
19, 550
15, 566
17, 2721,573
8,8748,7801,063
17, 065
15,216
14,8552,096
5,8976, 0471,236
12, 290
15,630
9, 7571,453
4,4824,6111, 363
9,767
16, 957
7,3821,019
7,4457,4541,317
12,844
15, 230
12, 7111,588
5,2385, 5541,694
14, 235
18, 092
9,1721,510
5.7735,8641,750
15, 791
22, 213
5,5365.5851,793
14, 624
24, 468
9.3741,642
1 Revised.6 Returns reflect adjustments for estimated refunds.. In December 1934 operating revenues are reduced by approximately $970,000 and net operating income by
approximately $803,000." Refunds in February 1935 are of minor importance and reduce the several accounts only slLihtly.t Revised series. For earlier data see p. 20 of the April 1934 issue for operating revenues, operating expenses, and net railway operating income of class I railways. For
revisions of data for clearances of vessels in foreign trade, see p. 36 of the September 1934 issue. For revisions on Panama Canal from August 1914 to June 1935. see p. 19of this issue.
* New series. Data on airplane travel covers scheduled airlines operating in United States. For data on passengers carried for period of 1928 to 1933 and passenger-milesflown from 1930 to 1933, see p 20 of the February 1934 issue. For data on miles flown and express carried from 1926 through 1933, see p. 19 of the January 1935 issue. Foralcohol withdrawn tax paid from 1925 to 1934, see p. 20 of the April 1935 issue. New series on telephones as compiled by Federal Communications Commission. Data super-sede those published in previous issues of the Survey which covered all carriers having annual operating revenues in excess of $250,000; present series covers only those com-panies with operating revenues in excess of $250,000 which have interstate lines. In December 1933 operating revenues of these companies weie 97.7 percent of the totalof the companies previously reporting.

September 1935 SURVEY OF CUERENT BUSINESS 39
Monthly statistics through December 1931,together with explanatory footnotes and refer-ences to the sources of the data, may be foundin the 1932 Annual Supplement to the Survey
1935
July
1934
July August Septem-ber October Novem-
berDecem-
ber
1935
January Febru-ary March April May June
CHEMICALS AND ALLIED PRODUCTS—Continued
CHEMICALS— ContinuedAlcohol— Continued.
Methanol:Exports, refined gallons..Price, refined, wholesale, N. Y.
dol. per gal_.Production:
Crude (wood distilled)*! A gallons..Synthetic -gallons..
Explosives:Orders, new* thous of Ib
Sulphur and sulphuric acid:Sulphur, production (quarterly) •
long tonsSulphuric acid (104 plants):
Consumed in production offertilizer .short tons__
Price, wholesale, 66°, at worksdol. per short ton--
Production short tonsPurchases:
From fertilizer mfrs short tonsFrom others short tons..
Shipments:To fertilizer mfrs short tons__To others short tons
FERTILIZERConsumption, Southern States!
thous. of short tons..Exports, totalf . long tons__
Nitrogenousf Ion? tons_.Phosphate materials! long tonsPrepared fertilizers long tons..
Imports, total f# long tonsNitrogenous! - long tons .
Nitrate of sodaf long tons__Phosphatesf long tonsPotashf -long tons..
Price, nitrate of soda, 95 percent, N. Y.dol. per cwt__
Superphosphate, bulk:Production-. short tonsShipments to consumers short tons-Stocks, end of month short tons..
Pine oil: NAVAL STORESProduction gallons. _
Rosin, gum:Price, wholesale "B", N. Y..dol. per bbl_.Receipts, net, 3 ports bbl. (500 Ib.) —Stocks, 3 ports, end of month.bbl. (SOOlb.)-
Rosin, wood:Production .bbl. (500 lb.)-Stocks, end of month bbl. (5001b.)_.
Turpentine, gum:Price, wholesale, N. Y. -dol. per gaL_Receipts, net, 3 ports bbl. (50 gal.)--Stocks, 3 ports, end of month.bbl. (50 gal.) ~
Turpentine, wood:Production bbl. (50 gal.)._Stocks, end of month bbl. (50gal.)_.
OILS, FATS, AND BYPRODUCTSAnimal fats and byproducts (quarterly) :
Animal fats:fConsumption, factory thous. of IbProduction thous of IbStocks, end of quarter thous of Ib
Gelatin, edible:Production _ _ thous of lbStocks, end of quarter thous of Ib
Greases:!Consumption, factory thous of IbProduction thous of IbStocks, end of quarter . . thous of Ib
Lard compounds and substitutes:!Production thous of lbStocks, end of quarter thous of Ib
Fish oils (quarterly):!Consumption factory thous of IbProduction thous of IbStocks, end of quarter thous of Ib
Vegetable oils and products:Vegetable oils, total:
Consumption, factory (quarterly)!thous of Ib
"Exports thous. of lb__liiiports!# thous o f l bProduction (quarterly)! thous o f l bStocks, end of quarter:!
Crude thous of IbRefined thous. of lb._
55, 125
.38
331,4371,278,505
22, 189
15.50110, 249
27, 71423, 334
24, 68441 239
17102, 46715, 31977, 054
42143, 17420, 8992,2001,350
19, 909
1.275
205, 10519, 396
914, 169
373, 417
4.85124, 401311, 355
47, 65189, 015
.4835, 293
122, 631
7,2612,997
59395, 895
28, 348
.38
256, 136939, 439
23, 384
83, 079
15.5088, 049
7 41125, 951
14, 59621 991
2683, 3824,577
75, 600273
69, 28543, 57610, 9761,495
19, 265
1.350
147, 0849,711
871, 093
261,410
5.31116,019200, 649
37, 037105, 286
.4831, 14855, 171
5,54719, 016
1,03468, 665
77, 732
.38
253, 612951, 834
26, 063
77, 404
15.5097, 478
13, 04817, 060
28, 11129 587
48126, 11016, 553
108, 475405
48, 44218, 535
1501,541
25, 845
1.350
152, 56621, 831
875, 320
282, 242
5.31109, 234218, 256
38, 537105, 887
.4632, 47365, 510
5,90419, 078
88341 302
44, 937
.38
260, 4021,079,910
25, 489
314, 199
85, 915
15.50116, 120
21, 13612, 560
31, 05623, 594
101109, 98229, 59176, 987
17469, 17624, 666
9313,141
38, 963
1.275
188, 007108, 752880, 238
312, 375
5.3089, 289
244, 968
43, 095108, 933
.4626, 86671, 778
6,79819, 817
228, 945465, 719382, 938
1, 5706,556
60, 99281, 95469, 600
352, 96524, 964
33 59568, 374
189 492
479, 8731,161
55 213416, 559
548, 547502, 427
41, 941
.38
297, 7591,309,086
26, 892
137, 357
15.50149, 968
38, 16427, 249
39, 79734, 938
126135, 58827,121
104, 143350
81, 56031, 5791,2121,786
44, 422
1.275
276, 44463, 486
957, 279
300, 544
5.4292, 482
260, 040
39, 785109, 812
.5225, 16186, 020
6,28818, 504
23453 935
48, 945
.38
309, 7391,789,970
25, 108
143, 282
15.50159, 781
39, 33022, 796
41, 52028,615
88118, 43721,09393, 509
26582, 12138, 7287,1952,001
35, 276
1.275
307, 65324, 965
1,078,044
303, 686
5.25101, 682272, 027
41, 884108, 244
.5322, 99994, 189
6,54818, 752
42760 028
38, 211
.38
319, 1901,301,841
22, 635
293, 025
152, 268
15.50172, 052
36, 73428,813
47, 36728 537
97127, 08113,615
107, 313312
91, 80742, 08517, 0852,411
44, 015
1.275
332, 14023, 358
1,159,392
317,912
5.25122,173321, 660
41,016105, 339
.5222, 834
106, 971
6,29016, 819
217, 186498 603418, 631
5,2797 817
49, 24689 25773, 856
338 85927 584
46 35898 11671 872
802, 381372
34 200730 260
554, 108598, 460
23, 222
.38
315, 9831,303,171
29, 147
162, 658
15.50169, 301
34, 54527, 824
39, 69335, 186
31668, 9286,241
56, 946153
155, 34863, 24527,8113,126
84, 235
1.275
342, 21034, 553
1,189,505
330, 830
5.2027, 406
272, 474
44, 489110, 806
.544,300
94, 781
7,07516, 116
33171 191
44, 525
.38
300, 0081,126,799
26, 019
133, 319
15.50154, 359
26, 26921, 647
30, 61538 716
68492, 84610, 74678, 276
258141, 78789, 47744, 4943,169
46, 213
1.275
282, 81063, 856
1,160,817
360, 252
5.1619, 525
217, 489
43, 252111,659
.552, 235
86, 987
6,13813, 418
52278 745
73, 365
.38
351, 4681,303,230
18, 544
255, 396
104, 041
15. 50141,352
18, 76918, 636
41, 99042, 319
1,41384, 2966,707
66, 562196
159, 071107, 34155, 9573,177
42, 669
1.275
246, 286189, 133964, 940
337, 646
4.9928, 397
250,113
43, 294108, 956
.554,761
88, 164
6,31610, 526
234, 949352, 519380, 419
5,0478,629
50, 73271, 73863, 590
316, 22732, 738
60 56346, 208
221, 547
754, 643396
80, 395581, 304
525, 210642, 272
30,471
.38
386, 0061,167,282
23, 202
93, 873
15.50139,333
11,76013,397
33, 85540, 293
70493, 456
5, 55182, 946
98176, 640111,64283,4154,486
56, 045
1 275
203, 152169, 152814, 804
370, 222
4.6769, 290
250, 213
46, 02895, 283
.5218,41087,971
7,0497,122
93991 445
33, 621
.38
403, 2711,203,143
22 659
87 944
15. 50111 10°
11 61013, 186
18,47329 714
237157 46221 116
1 26 226' 245
1 no 007101 850
7s) 8724 °,OQ
76, 743
1. 275
1 CO 00,1
79, 704831 596
378, 395
4 6597 354
258! 255
47. 86795, 829
.5224, 36685, 846
7,0044, 588
63296, 622
66, 077
.38
341, 0931, 198, 186
22 193
271 452
75 690
15.5099 176
16 83020, 862
25, 38134 382
6663 402
5 24450 637
17969 78337 13716 9185 608
23, 436
1.275
1 fi7 flQ1^
" 24, 973a O7A §35
360, 889
4 64110 998272, 312
47, 29391,477
.5032, 128
103, 831
6,7873,278
212, 053306, 659386, 852
5,0528, 526
51, 14664,91663, 732
293, 42529, 747
59, 1399,143
172,371
628, 186251
121, 023357, 167
507, 571602, 217
* New series. For earlier data see p. 20 of the April 1933 issue (crude methanol) and p. 19 of January 1934 issue (explosives).! Revised series, see p. 36 of the June 1933 issue, for 1932 revisions, exports and imports of fertilizer and imports of vegetable oils; for 1933 revisions on exports see p. 20
of the September 1934 issue; for revised data for crude methanol production for 1933, see p. 36 of the May 1934 issue; quarterly data on oils, fats, and byproducts for the years1932 and 1933 also revised. See p. 19 of the March 1935 issue.
A The refined equivalent of crude production is approximately 82 percent.• Texas only. Louisiana produced 23 percent of United States production in 1933 and 16 percent in 1934.1 Figures since January 1922 revised due to dropping of Missouri from Southern States classification. See p. 19 of the Januar : 1934 issue.# See footnote on p. 37 of this issue. Monthly revisions for 1933 are shown on D. 20 of the October 1934 issue.
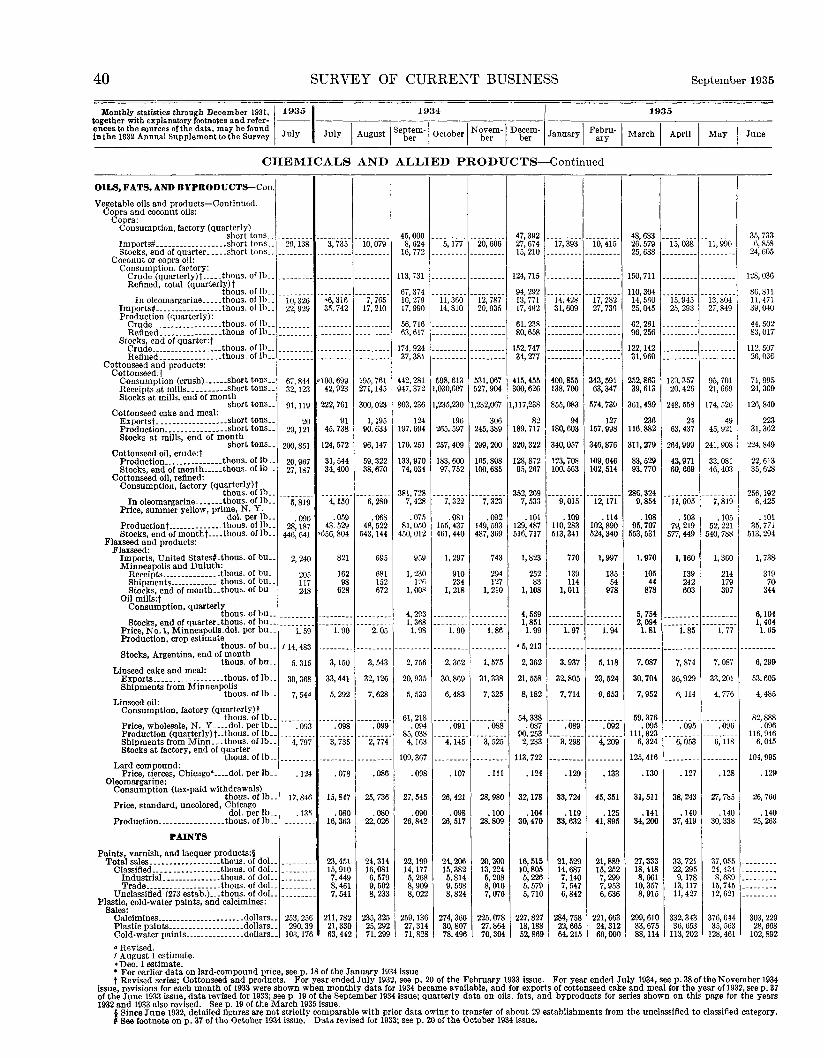
40 SURVEY OF CURRENT BUSINESS September 1935
Monthly statistics through December 1931,together with explanatory footnotes and refer-ences to the sources of the data, may be foundin the 1332 Annual Supplement to the Survey
1935
July
1934
July August Septem-ber October Novem-
berDecem-
ber
1935
January Febru-ary March April May June
CHEMICALS AND ALLIED PRODUCTS—Continued
OILS, FATS, AND BYPRODUCTS—Con.
Vegetable oils and products— Continued.Copra and coconut oils:
Copra:Consumption, factory (quarterly)
short tons..Imports^ short tons..Stocks, end of quarter short tons..
Coconut or copra oil:Consumption, factory:
Crude (quarterly)! thous. of IbRefined, total (quarterly)!
thous. of Ib...In oleomargarine thous. of lb_.
Imports!! thous. of IbProduction (quarterly) :
Crude thous. of IbRefined thous. of Ib
Stocks, end of quarter:!Crude thous. of Ib .Refined thous. of ib_.
Cottonseed and products:Cottonseed:!
Consumption (crush) short tons..Receipts at mills short tons__Stocks at mills, end of month
short tons..Cottonseed cake and meal:
Exports! short tons..Production short tons..Stocks at mills, end of month
short tons..Cottonseed oil, crude:!
Production thous. of lb__Stocks, end of month thous. of lb_.
Cottonseed oil, refined:Consumption, factory (quarterly)!
thous. of lb_.In oleomargarine thous. of lb__
Price, summer yellow, prime, N. Y.dol. per lb__
Production! thous. of lb__Stocks, end of month! thous. of lb._
Flaxseed and products:Flaxseed:
Imports, United States* -thous. of bu__Minneapolis and Duluth:
Receipts thous. of buShipments thous. of bu_.Stocks, end" of month.. thous. of bu._
Oil mills:!Consumption, quarterly
thous. of bu__Stocks, end of quarter -thous. of bu_.
Price, No. 1, Minneapolis -dol. per bu__Production, crop estimate
thous. of bu_.Stocks, Argentina, end of month
thous. of bu_.Linseed cake and meal:
Exports thous. of lb._Shipments "from Minneapolis
thous. of lb__Linseed oil:
Consumption, factory (quarterly)!thous. of lb_.
Price, wholesale, N. Y dol. per Ib..Production (quarterly) !-thous. of Ib..Shipments from Minn. .. thous. of lb._Stocks at factory, end of quarter
thous. of lb._Lard compound:
Price, tierces, Chicago*.— dol. per lb__Oleomargarine:
Consumption (tax-paid withdrawals)thous. of lb_.
Price, standard, uncolored, Chicagodol. per lb__
Production thous. of lb__
PAINTS
Paints, varnish, and lacquer products: §Total sales thous. of dol._
Classified thous. of dolIndustrial..- thous. of dol._Trade thous. of dol .
Unclassified (273 estab.) thous. of dolPlastic, cold-water paints, and calcimines:
Sales:Calcimines dollarsPlastic paints dollars..Cold-water paints dollars..
26, 138
10, 32622, 929
67, 84432, 123
91,119
2029, 121
200, 851
20, 96727, 187
5,819
.09628, 187
446, 641
2,240
205117248
1.59
/ 14 433
5,315
39, 368
7,544
.093
4,797
.124
17, 846
.135
253, 256290, 39
103, 176
3,735
«6, 31635, 742
"100,69942, 923
222, 761
9145, 738
124, 572
31,54434, 400
4,150
.05943. 529
"656, 804
821
16298
628
1.90
3,150
33, 441
5,292
.098
3,735
.078
15, 847
.08016, 363
23, 45115,9107,4498,4617,541
211, 78221, 33063, 442
10, 079
7, 76517, 210
195, 761271, 145
300, 023
1,19590. 633
96, 147
59, 32238, 670
6,280
.06848, 522
543, 144
695
681152672
2.05
3,543
32, 126
7,628
.099
2,774
.086
25, 736
.08022, 026
24, 31416, 0816,5799,5028,233
235, 32525, 29271, 299
45, 0008,624
16, 772
113 731
67, 37410, 27917, 990
56, 71663, 617
174, 92437, 381
442, 281947, 372
803, 236
124197, 694
170, 251
133, 97074, 034
381, 7287,428
.07581,050
450,012
959
1,230126
1,008
4,2931,3681.98
2,756
20, 935
5,533
61,218.094
85, 0384, 163
109, 367
.098
27, 545
.09026, 842
22, 19914, 1775,2688,9098,022
259, 13627, 31471,828
5,177
11,36014, 810
598, 613,030,607
1,235,230
196265, 597
257, 409
183, 60097, 752
7,322
.081155, 437461, 440
1,297
910234
1,218
1.90
2,362
30, 869
6,483
.091
4,145
.107
26, 421
.09826, 517
24, 20615, 3825,8149,5688,824
274, 36630, 80778,496
20, 606
12, 78720, 935
531, 067527, 904
1,232,067
306245, 389
299, 200
165, 808100, 685
7,323
.092149, 593487, 369
743
294127
1,210
1.86
1,575
31, 338
7,325
.088
3,525
.111
28, 980
.10028,809
20, 30013, 2245,2088,0167,076
225, 07827, 86470,304
47, 39227, 67415, 210
124, 715
94, 29213, 77117, 492
61, 23880, 658
152, 74734, 277
415, 455300, 626
1,117,238
82189, 717
320, 322
128,87295, 267
352, 2097, 533
.101129, 487516,717
1,823
25283
1,108
4,5691,8511.99
« 5, 213
2,362
21, 558
8,182
54, 338.087
90, 2532,233
113, 722
.124
32, 178
.10430, 470
16, 51510, 8055,2265,5795,710
227, 82718, 18852,869
17, 393
14,42831, 609
400,855138, 700
855, 083
94180, 603
340, 057
123,708100, 563
9,015
.109110,283513, 341
770
139114
1,011
1.97
3,937
32, 805
7,714
.089
3,298
.129
33, 724
.11933, 632
21, 52914, 6877,1407, 5476,842
284, 75822, 66564, 215
10, 415
17, 28227, 730
343, 59163, 347
574, 739
127157, 998
346, 876
109, 046102, 514
12, 171
.114102, 890524, 340
1,997
13554
978
1.94
5,118
23, 524
9,653
.092
4,209
.133
45, 351
.12541, 895
21, 88915, 2527,2997,9536,636
221, 66324, 31269.000
48, 68326, 57925, 688
150, 711
110,30414, 56025,045
62 26196, 256
122, 14231, 960
252,86339, 613
361, 489
236116, 882
311, 279
83, 52993, 770
286, 3249,854
.10895, 707
553, 531
1,970
10544
878
5,7542,0941.81
7,087
30,704
7,952
59, 376.095
111,8236,324
125, 416
.130
31,511
.14134,200
27, 33318, 4188,061
10, 3578,915
299, 61033, 67588, 114
15, 038
15,94525, 293
133,35720, 426
248, 558
2463, 437
264,999
43,97160, 669
11, 005
. 10379, 219
577, 449
1,160
139242603
1.85
7,874
36,929
6,114
.095
6,053
.127
38, 243
.14037, 419
33, 72122, 2959, 178
13, 11711, 427
332, 34336, 653
113, 202
11, 990
13, 80427, 849
95, 70121,669
174, 526
4945, 921
241, 908
33, 08146, 403
7,819
.10552, 221
540, 788
1,360
214179397
1.77
7,087
33. 201
4,776
.096
6,118
.128
27, 785
.14030, 338
37, 05524, 4348,689
15, 74512, 621
376, 64435, 563
128,461
35, 7336,858
24, 605
128, 036-
86,81111,47139, 040
44, 50283, 017
112, 50726, 036
71,99524, 309
126, 840
22331,362
224, 849
22, 61335, 628
256, 1926,425
.10135, 771
513, 294
1,738
31970
344
6,1041,4641.65
6,299
53, 605
4,485
82, 888.096
116,9466,045
104, 995
.129
26, 766
.14025, 263
303, 22928, 668
102, 892
o Revised./ August 1 estimate.•Dec. 1 estimate.* For earlier data on lard-compound price, see p. 18 of the January 1934 issuet Revised series; Cottonseed and products. For year ended July 1932, see p. 20 of the February 1933 issue. For year ended July 1934, see p. 38 of the November 1934
issue, revisions for each month of 1933 were shown when monthly data for 1934 became available, and for exports of cottonseed cake and meal for the year of 1932, see p. 37of the June 1933 issue, data revised for 1933; see p 19 of the September 1934 issue; quarterly data on oils, fats, and byproducts for series shown on this page for the years1932 and 1933 also revised. See p. 19 of the March 1935 issue.
§ Since June 1932, detailed figures are not strictly comparable with prior data owing to transfer of about 29 establishments from the unclassified to classified category.# See footnote on p. 37 of the October 1934 issue. Data revised for 1933; see p. 20 of the October 1934 issue.
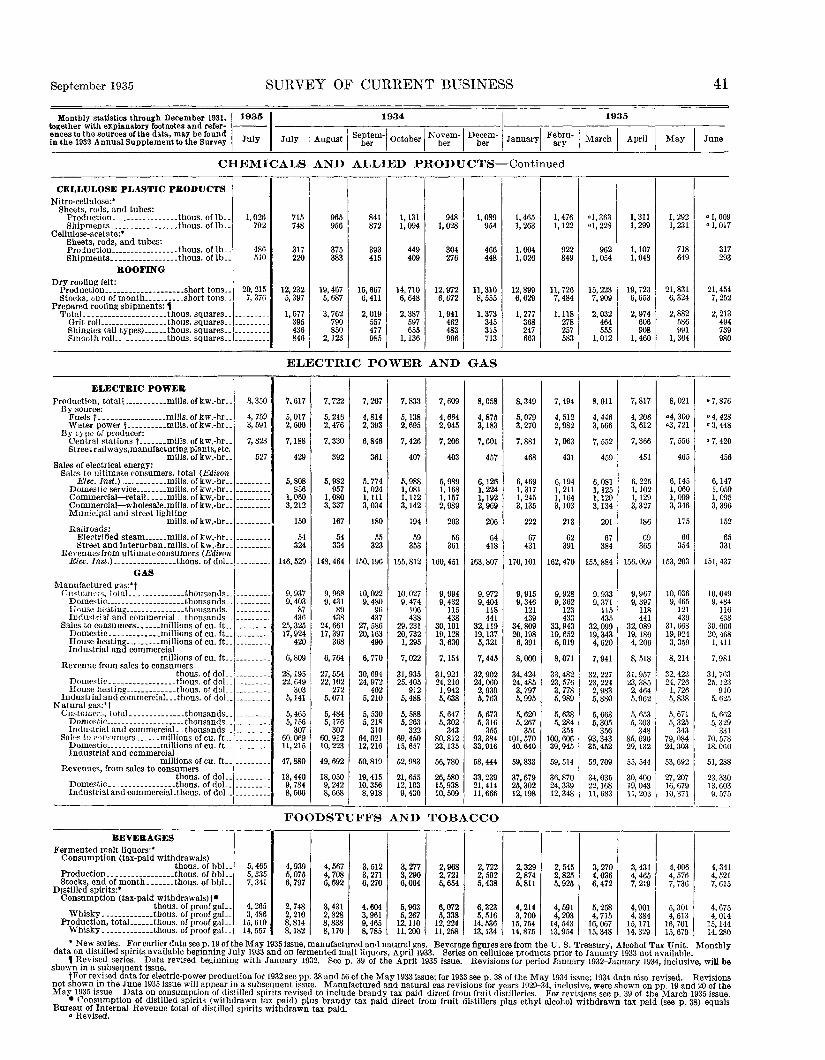
September 1935 SURVEY OF CURRENT BUSINESS 41
Monthly statistics through December 1931,together with explanatory footnotes and refer-ences to the sources of the data, may be foundin the 1932 Annual Supplement to the Survey
1935
July
1934
July August Septem-ber October Novem-
berDecem-
ber
1935
January Febru-ary March April May June
CHEMICALS AND ALLIED PRODUCTS—Continued
CELLULOSE PLASTIC PEODUCTSNitro-cellulose:*
Sheets, rods, and tubes:Production .thous. of Ib .Shipments _. _ ..thous. of lb__
Cellulose-acetate:*Sheets, rods, and tubes:Production thous. of lb._Shipments thous. of lb__
ROOFINGDry roofing felt:
Production.. _ ...short tons..Stocks. fcnd of month ... short tons -
Prepared roofing shipments: 1Total thous. squares
Grit roll thous. squares. _Shingles (all types) thous. squaresSmooth roll thous. squares..
1,026792
480510
20, 2157,376
715748
317220
12, 2325,397
1,677395436846
965956
375383
19, 4675,687
3,762790850
2,123
841872
393415
15, 6676,411
2 019557477985
1,1311,094
449409
14, 7106,648
2,387597655
1,136
9481,028
304276
12, 9726,672
1 941462483996
1,089954
466448
11,3108,555
1,373345315713
1,4651,263
1,0041,026
12, 8996,629
1 277368247663
1,4761,122
922849
11, 7267,484
1 118278257583
«1,363°1, 228
9621,054
15, 2237,909
2 032464555
1,012
1,3111,299
1,1071,048
19, 7236,653
2,974606908
1,460
1,2921,231
718649
21, 8316,324
2,882586991
1,304
0 1, 0090 1, 017
317293
21, 4547,252
2,213494739980
ELECTRIC POWER AND GAS
ELECTEIC POWEEProduction, totalt mills, of kw.-hr..
By source:Fuels t mills, of kw.-hr- .Water power f mills, of kw.-hr_.
By type of producer:Central stations f mills, of kw -hrStreet railways,manufacturing plants, etc.
mills, of kw.-hr..Sales of electrical energy:
Sales to ultimate consumers, total (EdisonElec. Inst) . .. mills, of kw.-hr
Domestic service mills, of kw.-hr..Commercial — retail mills, of kw -hrCommercial — wholesale-mills, of kw.-hr..Municipal and street lighting
mills, of kw.-hr_-Railroads:
Electrified steam mills, of kw.-hr .Street and interurban mills, of kw -hr
Revenues from ultimate consumers (EdisonElec, Inst.) thous. of doL.
GASManufactured gas:*f
CustonH'fs, total thousandsDomestic thousandsHouso heating ._ thousandsIndustrial and commercial. . thousands,-
Sales to consumers __ millions of cu ftDomestic millions of cu. ftHouse heating millions of cu ftIndustrial and commercial
millions of cu. ft.Revenue from sales to consumers
thous. of dolDomestic thous. of doL_House heating thous. of doL.
Industrial and commerciaL-.thous. of doL.Natural gas:*t
Customers, total _ thousandsDomestic. thousands. .Industrial and commercial _ _ thousands _.
Salop to consumers millions of cu. ft-. .Domestic.- _ . millions of cu ftIndustrial and commercial
millions of cu. ft_.Revenues, from sales to consumers
thous. of dolDomestic thous. of doL.Industrial and comnaerciaLthous. of dol
8,350
4,7593,591
7,823
527
7,617
5,0172,600
7,188
429
5,808956
1,0803,212
150
54324
146, 529
9,9379 403
87436
25, 32517, 924
420
6,809
28, 19522, 649
3035,141
5,4655, 156
30760. 06911,215
47, 880
18, 4409,7848,506
7,722
5,2462,476
7,330
392
5,982957
1,0803,337
167
54334
148,464
9,9689 431
89438
24, 66117, 397
368
6,764
27, 55422, 102
2725,071
5 4845,176
30760,91210 223
49, 692
18, 0509,2428,668
7,207
4,8142,393
6 846
361
5,7741,0241,1113,034
180
55323
150, 196
10 0229 480
96437
27 58620, 163
490
6,770
30, 69424, 972
4025,210
5 5305,218
31064, 02112 216
50, 819
19 41510, 3568 918
7,833
5,1382,695
7,426
407
6 9881,0811 1123,142
194
59353
155, 812
10 0279 474
106438
29 23120, 7321 295
7,022
31,93525, 405
9125,488
5 5885, 263
32269, 45015 657
52, 983
21 65512, 1039 430
7,609
4,6642,945
7 206
403
5 9891,1681 1572 989
203
56361
160, 451
9 9949 432
115438
30 10119 1283 630
7,154
31 92124, 2101,9425, 638
5 6475,302
34380,81223 135
56 780
26 58015, 93810 509
8,058
4,8753,183
7 601
457
6 1261,2241 1922 969
206
64418
163, 807
9 9729 404
118441
32 11919 1375 321
7 445
32 90224. 0602,9395,763
5 6735,316
35593, 38433 916
58 444
33 23921,41411 666
8,349
5,0793,270
7 881
468
6 4691,3171 2453 135
222
67431
170, 101
9 9159 346
121439
34 80920 1986 391
8 000
34 42424, 4853,7975,995
5 6205,267
351101, 57040 640
59 833
37 67925, 30212 198
7,494
4,5122,982
7 063
431
6 1941,2111 1643 103
213
62391
162, 470
9 9289 362
123433
33 94319 6526 019
8 071
33 48223, 5763,7785,989
5 6385,284
351100, 60639 945
59 514
36 87024, 33912 348
8,011
4,4463,566
7 552
459
6 0811,1251 1203 134
201
67384
155, 884
9 9339 371
115435
32 09919' 3434 620
7 941
32 22723, 2242,9835,880
5 6635,305
35693, 34335 452
56 709
34 03522, 16811 683
7,817
4,2063,612
7,366
451
6,2251,1021 1293,327
186
69365
156, 069
9 9679 397
118441
32 08919 1804 206
8 518
31 95723, 3852,4645,962
5 6535,303
34885, 69029 132
55 544
30 40019, 04311 203
8,021
«4, 300«3, 721
7,556
465
6,1451,0601,0993,346
175
66354
153, 203
10, 0369 465
121439
31 66819 9243 359
8,214
32 42324, 726
1, 7265,838
5 6715,325
34379, 08424 303
53 692
27 20716, 67910 371
" 7, 8760 4, 4280 3, 448a 7, 420
456
6,1471,0591 0953,396
152
65331
151, 437
10, 0499 484
116438
30 00620 4681 411
7 981
31 7G325, 123
9105,625
5 6625,329
33170, 57818 060
51 288
23 33013, 6039 575
FOODSTUFFS AND TOBACCO
BEVEEAGESFermented malt liquors:*
Consumption (tax-paid withdrawals)thous. of bbl_.
Production thous. of bbl._Stocks, end of month thous. of bbl.-
Distilled spirits:*Consumption (tax-paid withdrawals) f*
thous. of proof gal- .Whisky thous of proof gal
Production, total -thous. of proof gal--Whisky thous. of Droof eal _
5,4655,3357,341
4,2653,486
15, 61014. 557
4,9395,0756,797
2,7482,2108,8148.182
4,5674,7086,692
3,4312 8288,' 8388.170
3,5123,2716,270
4,6043,9619^4658. 785
3,2773,2906,064
5,9635,267
12! no11.200
2,9682,7215,654
6,0725 338
12,' 2241 1 . 258
2,7222,5925,438
6,3235, 516
14| 53613. 134
2,3292,8745,811
4,2143 700
15,' 75414. R7S
2,5452,8255,925
4,5914 203
14' 54313 Q54
3,2704,0366,472
5,2584 715
16* 0671 s. -us
3,4314,4657,219
4,9014 384
15* 1711 4. 29.Q
4,0064,5767,736
5,3014 613
16,' 701I K f i7Q
4,3414,5217,615
4,6754 014
15,' 14414 9Sft
* New series. For earlier data see p. 19 of the May 1935 issue, manufactured and natural gas. Beverage figures are from the U. S. Treasury, Alcohol Tax Unit. Monthlydata on distilled spirits available beginning July 1933 and on fermented malt liquors, April 1933. Series on cellulose products prior to January 1933 not available.
1 Revised series. Data revised beginning with January 1932. See p. 39 of the April 1935 issue. Revisions for period January 1932-January 1934, inclusive, will beshown in a subsequent issue.
fFor revised data for electric-power production for 1932 see pp. 38 and 56 of the May 1933 issue; for 1933 see p. 38 of the May 1934 issue; 1934 data also revised. Revisions
Bureau of Internal Revenue total of distilled spirits withdrawn tax paid.*« Revised.

42 SURVEY OF CURRENT BUSINESS September 1935
Monthly statistics through December 1931,together with explanatory footnotes and refer-ences to the sources of the data, may be foundin the 1932 Annual Supplement to the Survey
1935
July
1934
July August Septem-ber October Novem-
berDecem-
ber
1935
January Febru-ary March April May June
FOODSTUFFS AND TOBACCO—Continued
BEVERAGES— Continued
Distilled spirits— Continued.Slocks, end of month, thous. of proof gaL-
Whisky thous. of proof gaL.Rectified spirits:
Alcohol, ethyl, withdrawn tax paid (see p.38) '
Consumption (tax-paid withdrawals)*thous, of proof gaL-
DAI&Y PRODUCTSButter:
Consumption, apparent*! . -thous. of lb._Price, N. Y., wholesale (92-score)
dol. perlb_.Production (factory)!—.. thous of lb._Receipts, 5 markets thous. o f l b . -Stoc-ks, cold storage, creamery, end of
month thous. of lb_.Cheese*
Consumption, apparent! thous. of lb_.Imports# thous. of lb_.Price, no. 1 Amer N. Y dol. per Ib..Production (factory)! _._thous. of lb._
American whole milk! thous. of lb_.Receipts, 5 markets thous. of IbStocks, cold storage, end of month f
thous. of lb__American whole milk! thous. of lb_-
Milk:Condensed and evaporated:
Production:!Condensed (sweetened) . . thous. of lb__Evaporated (unsweetened) §
thous. of lb-.Exports:
Condensed (sweetened). -thous. of lb__Evaporated (unsweetened)
thous. of lb__Prices, wholesale, N. Y.:
Condensed (sweetened). dol. per case--Evaporated (unsweetened)
dol. per case..Stocks, manufacturers, end of month:
Condensed (sweetened):Bulk goods -__ thous. of lb__Case goods thous. of Ib
Evaporated (unsweetened):Case goods thous of Ib
Fluid milk:Consumption in oleomargarine
thous. of lb__Production, Minn, and St. Paul
thous. of lb-.Receipts:
Boston, incl. cream thous. of qt_.Greater New York* thous. of qt_.
Powdered milk:Exports _ thous. of IbOrders, net, new thous. of l b _ _Stocks, mfrs. end of mo thous. of Ib
FRUITS AND VEGETABLES
Apples:Production, crop estimate thous. of bu_.Shipments, car lotf _ .. carloads. -Stocks, cold storage, end of month
thous. of bbl_.Citrus fruit, car-lot shipments! carloads -Onions, car-lot shipments! carloads. -Potatoes:
Price, white, N. Y - dol. per 100 IbProduction, crop estimate thous. of bu_.Shipments, car lot! - carloads
GRAINS
Exports, principal grains, including flour andmeal! thous. of bu _
Barley:Exports, including malt! thous. of bu_.Price, no. 2, Minn.:
Straight* dol. per bu._Malting* dol. per bu_-
Production, crop estimate. - thous . of buReceipts, principal markets* thous. of bu._Visible supply, end of monthA
thous. of bu-_
171, 094163, 202
1,271
133, 252
.24186, 27872, 036
149, 464
52, 1592,832
. 1568, 76054, 40118, 480
94, 61982, 324
23, 334
209, 278
319
1,581
4.85
2.80
13, 10218, 159
339, 978
4,489
32, 713
28112, 703
/ 169, 4031,307
11,4661,020
965/376,957
15 453
1,999
549
.58
.65/286, 653
1, 559
3,681
68, 87263, 422
1,389
•136, 328
24•174, 949
61,251
108, 748
«48, 8513,213
.13°64, 633"51, 052
16, 487
115,84297, 018
16, 997
190, 089
1,261
3,278
4.85
2.70
9,92117 156
205 545
3,900
31, 899
20, 766110, 460
20913, 18443 007
1,145
8,1281,303
1.200
18 748
759
165
.81
.91
3,509
6,946
73, 84168, 343
1,532
150, 881
.27162,58957, 881
120, 467
54, 8743,511
.1557, 88744, 65017, 257
122, 495103, 805
19, 425
175, 125
985
5,066
4.85
2.70
9,21017, 432
167, 864
5,184
27, 988
19, 291103, 812
31911, 60142, 838
1,897
7,0512,342
.894
11,513
3,371
789
.951.00
8,556
9,006
78, 38072, 883
1,577
137, 487
.26141, 80949, 392
125,047
50, 1634,063
. 1451, 20638, 20512, 840
127, 363108, 624
16, 226
146, 130
797
2,759
4.85
2.70
9,47615, 891
175, 129
6,332
24,004
18, 099103, 331
37611,09041, 794
10, 405
4,0925,8513,682
1.006
14, 761
3,388
743
1.071.16
8,595
12, 403
84, 09378, 471
2,672
144, 961
.27130, 86149, 928
111,073
61,1364,460
. 1447, 46433, 73214, 277
118,008102, 832
16, 691
138, 107
553
3,324
4.85
2.70
9,41713 555
215 700
6,165
24, 174
18, 290106, 118
16311,62940, 795
17, 742
10, 4087,3943,514
.948
21, 627
2,884
582
1.021.10
5, 484
13, 525
90, 05584 19*
2,825
140, 844
.29110,65541, 564
81 034
50, 0725 730
.1535, 83528, 14613 609
109, 97296, 688
15, 943
103, 419
821
2,840
4.85
2.70
9 13511 236
203 402
6,552
23, 449
17, 846102, 914
23411,43736 530
7,776
10, 32813, 6312,083
1 006
14 829
2,773
535
1.061.17
6,188
14, 900
98, 02891 630
3,137
136, 810
.31102,70239, 110
47 175
42, 3943 565
.1531,16321,5179 522
102, 19789, 878
13,683
93, 731
470
2,965
4.85
2.70
7 68710 516
156 793
6,880
24, 747
17, 350101,691
16811,71633 151
•120, 6705 672
8,89014, 5331,886
975•385 421
12 066
1,842
111
1.091.20
•118, 3484,796
14, 401
109, 203102 504
1,235
128, 802
.34100, 13042, 716
18 907
50, 5283 575
.1726, 10918, 77113 526
81,22071, 007
14, 297
118,562
499
2,679
4.85
2.79
5 6358 068
59 791
7,731
27, 094
17, 656103, 072
21310, 70030 207
5 732
6 92814, 8662,787
975
18 393
2,050
628
1.091.18
2,297
12, 962
119,034112 082
1,202
110,936
.3697, 00337, 873
8 110
42, 8204 084
.1827, 74319, 49310 821
70, 15660, 943
15, 122
123, 657
599
2,642
4.85
3.00
4 6465 153
28 913
9,622
25, 978
15, 74792, 157
22315, 36723 568
5 838
4,64614, 1992,601
1 006
20 923
1,615
209
1.081.15
1,893
11,516
129,679122, 560
1,492
114,699
.32107, 06038, 127
5 341
45, 8204 220
.1734, 40823, 8918 955
62, 85154, 769
18, 764
141,331
842
4,882
4.85
3.00
4,8803 714
39 993
7,700
29, 838
17, 624105, 684
17013, 75520 407
4 674
2,64215, 1981,208
881
20 878
1,762
128
1.011.08
2,104
9,005
139, 036131, 659
1,414
136, 030
.34127, 46044, 246
5,676
53,3114,455
.1740, 54729, 43110, 688
54, 45946, 593
23, 224
180, 943
717
3,267
4.85
3.00
5 7595 552
74 145
8,645
29, 722
17, 110105, 280
20012, 29820 896
3 107
1 18916, 7412,385
935
17 688
1,478
88
.971.07
2,550
7,684
150, 477142, 639
1,451
150,312
.27175, 09658, 860
33, 096
58, 2823,735
.1656, 90942, 70211,803
56, 76748, 320
27, 349
231, 663
89
3.441
4.85
3.00
9 57112 284
179 684
7,012
38, 702
18, 131111,529
22813, 64627 377
1 175
36015, 5743, 326
806
18 386
1,607
79
.87
.94
3,205
6,845
160, 624152, 686
1,345
134, 819
.24196, 60372, 844
«96, 392
55, 8773,836
.1570, 65954, 87214, 645
•75, 291«64, 395
33, 619
269, 344
265
2,432
4.85
3.00
°13 05916 511
°287 204
5,998
39, 899
""116,417
207«12, 33836 393
616
12,1143,038
713
21 073
1,594
67
.71
.82
2,628
5,169
« Revised. § Bulk evaporated milk not included since December 1931. • Dec. 1 estimate. / August 1 estimate.A Represents the visible supply east of the Rocky Mountains as reported by Dun & Bradstreet.*New series. For earlier data see p. 20 of the November 1932 issue, barley; for receipts of milk in Greater New York, p 20 of the August 1934 issue. Since the division of
no. 2 barley by the Depanment of Agriculture in to siraigu and malting grades as ol j a i y 1, 1934, prices for each grade have been reported separately. See p. 19 of the June1933 issue for butter consumption. Data on consumption of rectified spirits are as indicated by the sale of stamps. Data prior to April 1933 not published.
# See footnote on p. 37 of this issue. Data for 1933 also revised, see p. 20 of the October 1934 issue.!Revised series. For revisions refer to the indicated pages of the monthly issues, as follows: For 1931 on apparent consumption of cheese, production of total and
American whole-milk cheese, and production of condensed and evaporated milk, p. 20, January 1933. For earlier data on stocks (cold-storage holdings) of total and Americanwhole-milk cheese, p. 19, April 1933. For 1932 revised data on production of factory and American whole-milk cheese, production of condensed and evaporated milk, p. 39,September 1933 For subsequent revisions for 1932 on production of evaporated mi lk , p 39. November 1933. For 1932 and 1933 revisions on t > u t t e r and cheese consumptionand 1933 revisions on production of butter, cheese, condensed and evaporated milk, see p 19 of the March 1933 issue. For final revision fur 1933, cai-lot shipments of applescitrus fruits, onions, and potatoes, see, p. 20, January 1935 issue. For revised figures for 1933 exports of principal grains and barley, see p. 20 of September 1934 issue.

September 1935 SURVEY OF CURRENT BUSINESS 43
Monthly statistics through December 1931,together with explanatory footnotes and refer-ences to the sources of the data, may be foundin the 1932 Annual Supplement to the Survey
1935
July
1934
July August Septem-ber October Novem-
berDecem-
ber
1935
January Febru-ary March April May June
FOODSTUFFS AND TOBACCO—Continued
GRAINS— ContinuedCorn:
Exports, including mealf thous. of bu_.OriudingS- thous. of bu__Prices, wholesale:
No. 3, yellow (Kansas City).dol. per bu_-No. 3, wh i t e (Chicago) dol. per bu._
Production, crop estimate thous. of buReceipts, principal markets- -thous. of bu_.Shipments, principal markets
thous. of bu_.Visible supply, end of month •
thous. of bu_.Oats:
Exports, including oatmealf.thous. of bu__Price, no. 3, white (Chicago) -dol. per bu._Production, crop estimate thous. of buReceipts, principal markets-.thous. of bu..Visible supply, end of month *
thous. of bu_.Rice:
Exportsf pockets 100 IbImports# pockets 100 IbPrice, wholesale, head, clean, New Orleans
dol. per Ib..Production, crop estimate thous. of buSouthern States (La., Tex., Ark., and
Tenn.):Receipts, rough rice, at mills
thous. of bbl. (1621b.)_.Shipments from mills (milled rice) total l
thous. of pockets (100 Ib.)..Stocks, domestic, rough and cleaned (in
terms of cleaned rice) end of monththous. of pockets (100 lb.)._
Rye:Exports, including flour thous. of bu_.Price, no. 2. Minneapolis dol. per bu._Production, crop estimate thous. of bu_-Receipts, principal markets*. thous. of bu..Visible supply, end of month*
thous. of bu_.Wheat:
Exports:!Wheat, including flour thous. of bu__Wheat only thous. of bu_.
Prices, wholesale:No. 1 Dark Northern Spring, Minn.*
dol. per bu.-No. 2 Red Winter, St. Louis
dol. per bu_.No 2 Flard Winter, K C dol. per bu..Weighted average 6 markets, all grades
dol per bu_.Production, crop estimate, total
thous. of bu
Winter wheat thous. of bu_-Receipts thous. of buShipments _. thous. of bu_Stocks visible supply world thous of bu
Canada _ _ thous. of bu_-I 'nited States* _ _ _ thous. of bu.
Stocks, held by mills (quarterly)thous. of bu_
Wheat, flour:Consumption (computed) t. thous. of bbL.Exports thous. of bbl_.Or ind iug of wheat thous. of bu_.Prices, wholesale:
Standard P;, tents, Minn___do l . per bbl_.Win te r , straights, Kansas City
dol. per bbl_.Produetion:
Flour, ac tua l (Census) thous. of bbL.Flour prorated, total (Russell's) f
thous. of bblOffal thous. of lb_.Operations, percent of total capacity
Stocks, total, end of month (computed)thous. of bbl_
Held by mills (quarterly) thous of bbl
LIVESTOCK AND MEATS
Total meats:Consumption, apparent A mills, of IbProduction (inspected slaughter) A
mills, of IbStocks, cold storage, end of month, total *
mills, of l b - _Miscellaneous meats mills, of lb_.
634.017
.87
.87'2,272,147
7,313
4, 565
7,317
154.36
/1, 187,0002.544
7, 075
55 37411 789
.040f 38, 159
14
270
383
2.48
f 52, 236286
6,907
1,23166
1.13
.87
.99
1.13
'607, 678'175 969'431,709
28 89511,233
192,41936, 674
""""24833,894
7.44
6.13
7,382
599,04646
54050
5185,721
0).66
26, 568
13, 610
44, 830
76.45
3,388
21, 445
75 29658 464
.039
153
483
1,267
0.74
2,246
<> 12. 049
2,168826
1.08
.92
.93
.95
49 70816,831
477 iQo185, 120117,973
7, 550286
33, 701
7 18
6.01
7, 325
7 966600, 486
47
4,700
971
1,066
99478
4716,539
.78
.76
41, 447
17, 488
60, 451
69.49
7,231
24, 605
59 42146 173
.039
244
555
972
0.89
847
11, 798
2,0421,776
1.20
1.011.07
1.15
23 04513, 934
491 130183,710121, 727
8,891435
39, 682
7.46
6.14
8,654
9,425704, 298
52
4,920
1,063
979
88190
3574,839
.81
.84
18, 685
10, 448
62, 407
87.55
4,886
24, 241
31 32847 313
.039
836
747
1,083
2.87
1,401
11, 776
2,199109
1.21
1.041.08
1.19
19 08214 767
506 250222, 260119 001
160 904
9,268443
40,371
7.50
6.22
8,822
9 881716, 936
59
5,0903 473
959
954
852105
3085,302
.80
.82
16, 157
12, 372
58, 683
71.52
4,516
22, 627
61 16444* 645
.039
1,974
993
2,189
0.76
1,502
12, 323
1,92357
1.15
1.001.02
1.14
12 94615 395
4Q7 570246, 247107,050
9,875397
41, 833
7.32
5.88
9,181
10 382736, 619
55
5,200
1,154
1,161
828107
2244,062
.91
.93
8,858
12, 514
50, 537
78.54
3,876
22, 191
61 64042 643
.049
910
810
2,356
0.76
2,332
13, 425
1,936152
1.14
1.011.02
1.13
9 15415 066
471 620249, 68698 756
8,8813SO
37, 393
7.25
5.79
8,211
9 311655, 023
53
5, 250
1, 086
1 204
921113
1475,261
.961.01
•1,377 1269,226
11, 294
43, 462
73.56
«525 8893,119
22, 576
53 22546 330
.049« 38 296
612
714
2,311
0.80
• 16, 045445
12, 572
1,51132
1.17
1.041.04
1.12
• 496 929«91 377
• 405,5527 8438 051
509 410253*11989, 766
134,935
8,694315
34, 323
7.25
5.85
7,547
8 585601,417
49
4,8203 857
960
1 122
1,077126
744,051
.96
.98
6,720
8,931
34, 204
91.56
1,983
21, 258
73 88293 287
.049
688
829
2,247
0.76
86
11,486
1,25714
1.18
1.021.01
1.12
5 1278 638
517 317242, 36374 774
8,600265
37, 766
7.32
5.79
8,315
9 024657, 904
51
4,700
1 003
988
1,021110
513,399
.92
.94
5,999
7,767
28, 160
54.54
2,256
19, 443
46 194182 985
.039
1,280
1,054
2,562
0.69
57
10, 630
1,3014
1.15
.981.00
1.12
3 7716 846
481 793235, 51562 769
8,009276
34, 509
7.28
5.75
7,599
8 465599, 975
53
4,600
777
777
98189
624,574
.88
.89
7,559
9,308
21, 923
68.49
2,261
14, 366
26 12181 158
.039
825
910
2,550
0.61
405
9,652
1,50210
1.13
.95
.97
1.06
4 gfis6 355
445 599227, 25952 735
87 314
8,697317
36, 309
7.16
5.66
7,986
8 767634, 700
49
4,5003 582
828
782
91378
445,513
.93
.94
9,878
7,905
15, 924
65.50
2,224
11, 867
141 59315, 644
.039
175
953
1,842
0.61
190
8,988
1,28130
1.19
.971.05
1.13
6,3907,971
405, 507216, 18142, 832
8,154266
35, 466
7.48
5.91
7,787
8,290621, 828
48
4,270
882
799
81366
394,571
.92
.91
10, 850
7,356
12, 041
63.44
3,351
10, 786
288 0727 717
.040
143
961
1,075
0.54
1,680
9,198
1,4262
1.16
.93
.99
1.08
8 2988 683
380 760199, 92631, 607
7,920303
35, 567
7.22
5.69
7,806
8 125625, 958
48
4,200
917
843
71657
294,028
.89
.38
9,091
6,039
8,860
303.39
1,901
8,399
309 7126 897
.040
82
529
632
0.46
298
8,559
1,1958
1.05
.86
.88
.97
10 02411 217
342 490194, 77923 739
58 700
7,624253
33, 745
6.87
5.54
7,381
7 857597, 746
47
4 1003 639
808
744
64153
* Price not available.» Brewer's rice not included.• Dec 1 estimate./Aug. ! estimate.* New series. For earlier data, see p. 20 of the November 1932 issue, rye; and p. 20 of the June 1935 issue, wholesale price of wheat, No. 1 Dark Northern Spring, Minne-
apolis.t Data revised. For revisions of wheat flour, production and consumption (Russell's) from July 1931 to December 1932, see p. 19 of the August 1933 issue. For revised
data on rice exports for 1932 see p. 39 of the June 1^3'i issue and for 1933 exports see p. 20 of the September 1934 issue.• Represents the visible supply east of the Rocky Mountains as reported by Dun & Bradstreet.A Government slaughter not included.# See footnote on p. 37 of this issue. Data for 1933 also revised, see p. 20 of the October 1934 issue.
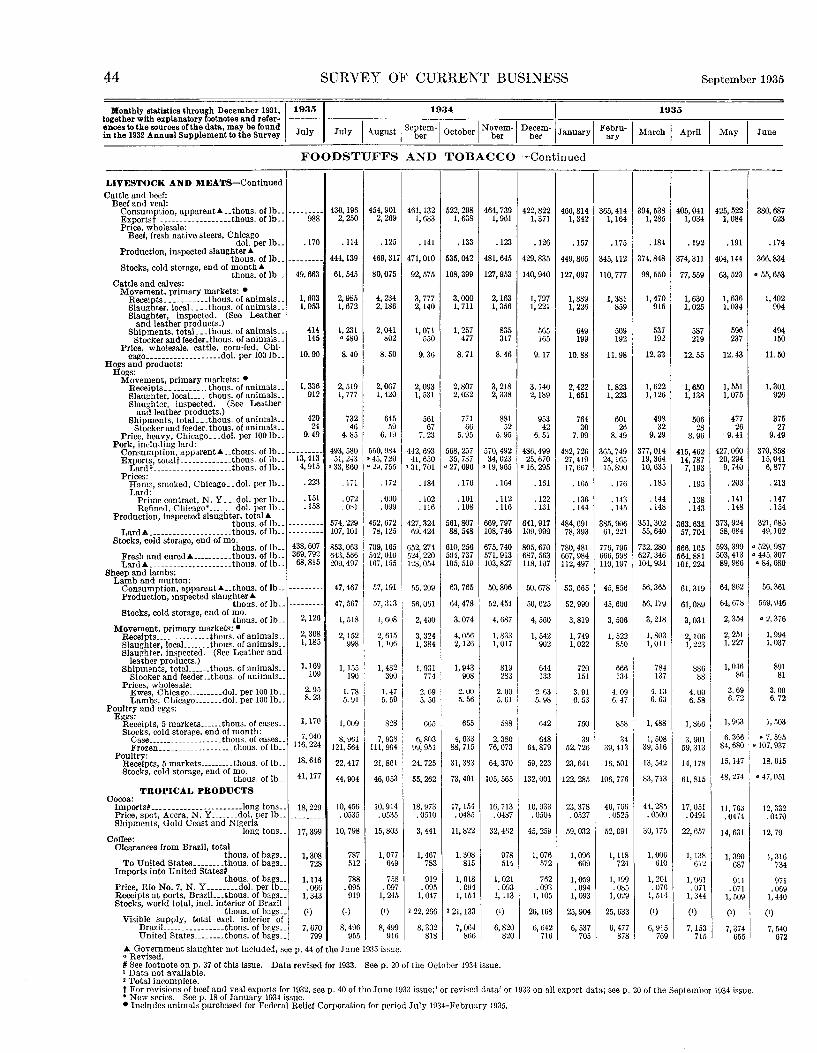
44 SURVEY OF CURRENT BUSINESS September 1935
Monthly statistics through December 1931,together with explanatory footnotes and refer-ences to the sources of the data, may be foundin the 1932 Annual Supplement to the Survey
1935
July
1934
July August Septem-ber October Novem-
berDecem-
ber
1935
January Febru-ary March April May June
FOODSTUFFS AND TOBACCO — Continued
LIVESTOCK AND MEATS— ContinuedCattle and beef:
Beef and veal:Consumption, apparent A _ _thous. of lb~Exportst .--thous. of lb_.Price, wholesale:
Beef, fresh native steers, Chicagodol. per lb._
Production, inspected slaughter Athous of Ib
Stocks, cold storage, end of month Athous. of lb._
Cattle and calves:Movement, primary markets: •
Receipts thous. of animals. .Slaughter, local thous. of animals ..Slaughter, inspected. (See Leather
and leather products.)Shipments, total- --thous. of animals-.
Stocker and feeder.thous. of animals. .Price, wholesale, cattle, corn-fed, Chi-
cago dol. per 100 Ib.-Hogs and products:
Hogs:Movement, primary markets: •
Receipts -thous. of animals.-Slaughter, local thous. of animals. .Slaughter, inspected. (See Leather
and leather products.)Shipments, total- --thous. of animals-.
Stocker and feeder, thous. of animals. .Price, heavy, Chicago. -_dol. per 100 lb.-
Pork, including lard:
Exports totalf - thous. of lb._Lardt thous. of lb._
Prices:Hams, smoked, Chicago. -dol. per lb._Lard:
Prime contract, N. Y__.dol. per lb_.Refined, Chicago* dol. per lb._
Production, inspected slaughter, total Athous. of lb-_
Lard A thous. of lb_.Stocks, cold storage, end of mo.
thous. of lb_-Fresh and cured A thous. of lb~Lard A thous. of lb._
Sheep and lambs:Lamb and mutton:
Consumption, apparent A __thous. of lb-_Production, inspected slaughter A
thous. of lb-_Stocks, cold storage, end of mo.
thous. of lb_-Movement, primary markets: •
Receipts thous. of animals.-Slaughter, local thous. of animals. .Slaughter, inspected, (See Leather and
leather products.)Shipments, total _ thous. of animals- _
Stocker and feeder- thous. of animals-Prices, wholesale:
Ewes Chicago dol. per 100 lb._Lambs, Chicago dol. per 100 lb_.
Poultry and eggs:Eggs:
Receipts 5 markets thous. of cases. .Stocks, cold storage, end of month:
Case thous ofcases..Frozen thous. of lb_.
Poultry:Receipts 5 markets thous. of IbStocks, cold storage, end of mo.
thous. of Ib..TROPICAL PRODUCTS
Cocoa:Imports# long tonsPrice, spot", Accra, N. Y dol, per lb_.Shipments, Gold Coast and Nigeria
long tons..Coffee:
Clearances from Brazil, totalthous. of bags. _
To United States thous. of bags..Imports into United States#
thous. of bags...Price, Rio No. 7, N. Y dol. per Ib..Receipts at ports, Brazil... thous. of bags..Stocks, world total, inch interior of Brazil
thous. of bags..Visible supply, total excl. interior of
Brazil thous. of bags..United States thous. of bags..
988"
.170
49, 663
1,6031,053
414145
10.90
1, 336912
42024
9.49
13,4134,915
.223
.151
.158
438, 607369, 79268,815
2,126
2,3681,185
1,169109
2.958.23
1,170
7,940116,224
18, 646
41,177
18, 229
17, 399
1,308728
1,114.066
1,343
0)
7,670799
430, 1962,250
.114
444, 139
61, 545
2,9851,672
1,231°480
8.40
2,5191, 777
73246
4.85
493, 58051, 243
o 33, 860
.171
.072
. OS1
574, 229107, 101
853, 063643, 566209, 497
47, 467
47, 567
1,518
2, 152998
1, 155190
1.785.91
1,009
8, 96 i121,564
22, 417
44, 904
10, 456.0535
10, 798
787512
788.095919
0)
8,496955
454, 9012,269
.125
469, 317
80, 075
4,2342,186
2,041b02
8.50
2,0671, 420
64559
6.19
550, 9840 46, 7200 29, 755
.172
.090
.099
452, 67278, 125
709, 165542, 010107, 155
57, 191
57, 313
1,608
2,6151,106
1,482390
1.475.59
828
7, 938111,994
21,861
46, 053
10,914. 0535
15, 803
1,077649
758.097
1,245
(0
8,499916
461, 1321,683
.141
471, 010
92, 575
3,7772,140
1,071550
9.36
2,0931,531
56167
7.23
442, 69341, 650
"31,701
.184
.102
.116
427, 32469, 424
652, 274524, 220128,054
55, 209
56, 061
2,400
3,3241,384
1,931774
2.095.56
665
6,80399, 951
24, 725
55, 262
18. 973.0510
3,441
1,467783
919.095
1,047
2 22, 266
8,302818
522, 2981,638
.133
535, 042
108, 399
3,0001,711
1,257477
8.71
2,8072,032
77166
5.95
568, 25735, 737
" 27, 096
.176
.101
.108
561, 80788, 548
610, 256504, 737105, 519
63, 765
64, 478
3,074
4,0562,126
1,943908
2.005.56
655
4,63388, 715
31, 383
73, 401
17, 154. 0485
11,822
1,308815
1,018.094
1,154
2 21, 133
7,064866
464, 7391,961
.123
481, 645
127, 953
2,1631,356
835317
8.46
3,2182,338
88152
5.95
570, 49234, 023
0 19, 965
.164
.112
.116
669, 797108, 746
675, 740571, 913103, 827
50, 806
52, 451
4,687
1,8331,017
819283
2.005.61
588
2,38076, 073
64, 370
105, 565
16, 713. 0487
32, 462
978514
1, 021.093
1,113
0)
6,820820
422, 8221,371
.126
429, 835
140, 940
1,7971,221
565165
9.17
3,1402,189
95342
6.51
486, 49925, 670
0 16, 295
.161
.122
.131
641, 917109, 999
805, 670687, 563118, 107
50, 678
50, 625
4,560
1,542902
644133
2.635.98
642
64864, 879
59, 223
132, 001
10, 933.0504
45, 259
1,076572
762.093
1,105
26, 168
6,642716
466, 8141,342
.157
449, 865
127, 097
1,8891,226
649199
10.88
2,4221,651
76430
7.99
482, 72627,41917, 667
.165
.136
.144
484, 69178, 393
780, 481667, 984112, 497
53, 665
52, 990
3,819
1,7491,022
720151
3.916.53
750
3952, 726
23, 641
122, 285
23, 378.0527
59, 032
1,096609
1,059.094
1,093
25,904
6,537705
365, 4141,164
.175
345, 112
110,777
1,381859
509192
11.98
1,8231,223
60126
8.49
365, 74924, 16515, 890
.176
.143
.145
385, 90661,221
776, 795666, 598110, 197
45, 856
45, 600
3,506
1,522850
666134
4.096.47
858
3439, 413
16, 501
106, 776
46, 706.0525
52,091
1,118724
1,199.085
1, 029
25, 633
6,477878
394, 5381,285
.184
374, 848
98, 550
1,470915
537192
12.33
1,6221,126
49832
9.29
377, 01419, 36410, 635
.185
.144
.148
351, 30255, 640
732, 280627, 346104, 934
56, 365
56, 179
3,218
1,8031,011
784137
4.136.63
1,488
1,50839, 516
13, 542
83, 713
44, 285.0500
30, 175
1,006610
1,201.076
1,514
0)
6,915769
405, 0411,034
.192
374, 311
77, 559
1,6301,025
587219
12.55
1,6501,138
50628
8.96
415, 46214, 7877,193
.195
.138
.143
363, 63157, 704
666. 105564, 881101, 224
61,319
61, 089
3,031
2,1061,223
88688
4.006.58
1,866
3,90159, 313
14, 178
61,815
17,051.0491
22, 657
1,138612
1,061.071
1,344
0)
7,153715
425, 5221,084
.191
404, 144
63, 523
1,6361,034
596237
12.43
1,5511,075
47726
9.41
427, 06020, 2949,740
.203
.141
.148
373, 92458, 684
593, 399503, 41389, 986
64, 862
64, 678
2,354
2, 2511,227
1,04686
3.696.72
1,963
6, 36684, 680
15, 147
48, 274
11,763.0474
14, 631
1,390687
911.071
1,509
0)7,374
655
380, 687623
.174
366, 834
« 55, 653
1,402904
494150
11.50
1,301926
37527
9.49
370, 85815,0416,877
.213
.147
.154
321, 68549, 102
« 529, 987« 445, 307« 84, 680
56, 361
559, 946
« 2, 376
1,9941,037
89181
3.006.72
1,503
« 7, 595« 107, 937
18, 615
« 47,051
12, 332.0470
12,79
1,316734
971.069
1,440
(0
7,540672
A Government slaughter not included, see p. 44 of the June 1935 issue.0 Revised.# See footnote 9n p. 37 of this issue. Data revised for 1933. See p. 20 of the October 1934 issue.1 Data not available.2 Total incomplete.t For revisions of beef and veal exports for 1932, see p. 40 of the June 1933 issue;' or revised data: or 1933 on all export data; see p. 20 of the September 1934 issue.* New series. See p. 18 of January 1934 issue.• Includes animals purchased for Federal Relief Corporation for period July 1934-February 1935.

September 1935 SURVEY OF CURRENT BUSINESS 45
Monthly statistics through December 1931,together with explanatory footnotes and refer-ences to the sources of the data, may be foundin the 1932 Annual Supplement to the Survey
1935
July
1934
July August Septem-ber October Novem- Decem-
ber ber
1935
January *$?- March April May June
FOODSTUFFS AND TOBACCO—Continued
TROPiCAL PRODUCTS— Continued
Sugar:Raw sugar:
Cuba:Stocks, total, end of month
thous. of long tons._United States:
Meltings 8 portsf long tons..Price, wholesale, 96° centrifugal, New
York dol. per lb._Receipts:
From Hawaii and Puerto Ricolong tons..
Importsf # long tonsStocks at refineries, end of mo.f
long tons..Refined sugar:
Exports, including maple t — long tons_.Price, retail, gran., N. Y dol. per l b _ _Price, wholesale, gran., N. Y.dol. per lb_.Receipts:
From Hawaii and Puerto Rico*long tons..
Imports:Cuba* * long tons__Philippine Islands* long tons
Shipments 2 portsf long tons..Stocks, end of month, 2 portst -long tons. .
Tea:Imports# thous. of lb_.Price, wholesale, Formosa, fine, N. Y.
dol. per lb__
MISCELLANEOUS PRODUCTS
Candy sales by manufacturers. thous. of dol_.Fish:
Landings, fresh fish, principal portsthous. of lb._
Salmon, canned, shipments . cases _Stocks, total, cold storage, 15th of month
thous. of lb._TOBACCO
Leaf:Exportsf thous. of lb._Imports, unmanufactured^.. thous. of lb_.Production, crop estimate- -.thous. of IbStocks, total, including imported types
(quarterly) mills, of Ib -Flue-cured, fire-cured, and air-cured
mills, of IbCigar types . _- .. mills, of lb_.
Manufactured products:Consumption (tax-paid withdrawals):
Small cigarettes millions--Large cigars thousandsManufactured tobacco and snuff
thous. of lb_.Exports, cigarettes . _. _ _ thousandsPrices, wholesale:
Cigarettes dol. per 1,000.Cigars dol. per 1,000..
1,589
414,436
.033
117,378326 736
536, 236
6,496.055.051
12, 099
27, 9426 555
58, 60613, 346
5,830
.275
11.191
42,811
48, 157
14, 7825,250
'1,221,630
13, 138432, 159
29, 066304, 549
5.38046. 005
2,212
300, 448
.032
188, 19653 117
633, 593
6,376.055.047
11,039
18, 317590
49, 9738,565
6,471
.215
10, 010
33, 392496, 061
50, 777
19, 0135,209
11,355378, 056
28,691225, 387
5. 38046. 839
2,041
307 685
.033
73, 18091 212
626, 796
9,494.055.047
536
15, 439o
44, 9714,415
9,193
.215
16, 433
« 37, 794832, 225
62, 601
25, 6053,830
11,810425 453
30, 948310, 334
5.38046. 839
1,764
350, 048
.029
98, 415683 137
501, 240
13, 369.055.047
3,089
134, 194o
55, 47710, 565
7,426
.215
<• 24, 419
« 33, 251941, 121
73, 637
53, 0975,989
2 202
1 749372
10, 294394 862
27, 234260 409
5. 38046. 839
1,589
411, 507
.029
49, 393241 262
363, 952
20, 194.055.046
0
64, 7242 619
42, 48135,854
7,942
.215
« 25, 107
a 25, 056889 651
77, 151
64 8105,140
10 718494 456
30, 506280 590
5.38046. 742
1,345
278, 822
.029
65, 794165 562
456, 679
24, 453.053.045
670
4,9112 435
36, 98123,429
7,668
.215
24, 935
26, 966367 430
77, 126
47, 5344,521
9,727466 164
27, 769282 269
5.38046. 697
983
227, 522
.029
58, 463260 715
718, 953
21, 461.052.043
2,528
6,34353
37,41425, 969
5,015
.215
24, 596
24, 350362, 326
73, 850
28, 6093,608
e] 045 660
2,224
1,783360
9,210317 563
22, 709288 768
5 38046. 697
930
356, 818
.028
100, 368484 448
483, 143
8,948.052.042
6,972
63, 28018
42, 30918, 110
7,385
.215
20,475
21,616348, 805
64, 176
31,7114,418
11,337327 578
30, 120332 412
5.38046. 697
1,789
300, 884
.029
151, 033139 153
M24, 085
10, 307.051.042
18, 816
18, 385o
48, 57715, 565
6,524
.275
21, 238
27, 454659, 355
51, 574
24, 6294,501
9,306320 864
26, 103329 290
5 38048. 820
2,317
327, 724
.030
181,898205 251
"492,247
7,932.051.043
13, 158
15, 263729
50, 51516, 026
8,401
.275
21, 753
37, 369676, 996
35, 213
31, 8974,643
2,348
a 1, 866387
10, 200351 694
27, 970323, 732
5 38046. 820
2,465
340, 929
.033
168, 519242 346
567, 039
4,209.052.049
12, 806
45, 1644,816
59, 10911,839
6,049
.275
20, 419
44, 343309, 459
22, 068
17, 9375,700
10, 697373 673
27,689261 677
5 38046.041
2,230
436, 500
.033
125, 811225 913
509, 028
3,187!053.052
15, 028
24, 5865 875
56, 19013, 857
5,999
.275
19, 637
41, 588203 609
21, 691
17, 3864,044
11, 709407 731
30, 603382 815
5 38046. 041
1,993
323, 013
.033
163, 091210 218
504, 813
5,681.053.052
16, 260
10, 3616 857
50, 36814, 603
5,499
.275
14, 434
38, 378368 097
35, 905
12, 4526,623
2 161
1 700373
12, 120402 272
27, 879308 500
5 38046. 041
FUELS AND BYPRODUCTS
Anthracite: COALExports thous. of lone; tons..Prices:
Retail, composite, chestnutdol. per short ton..
Wholesale, composite, chestnutjdol. per short ton,.
Production! __ . thous. of short tons..Shipments! . thous. of short tons
Stocks in storage:*Total thous. of short tonsStocks, in yards of dealers, end of month
no. of days' supply. .Bituminous:
Consumption:Coke plants ._ thous. of short tonsElectric power plantsf
thous. of short tons..Railroads thous. of short tonsVessels, bunker thous. of long tons..
88
11.86
9.245P 3, 549
3,032
1,462
54
3,765
2,792
161
82
12.60
9.4513,4432,974
1,769
65
3,529
2,9454,543
101
87
12.83
9. 5983,5843 110
2,197
79
3 376
3,0074,735
119
90
13.05
9.7603,9773 401
2,506
80
3 241
2,7424 801
98
122
13.11
9.8154,7294 027
2 673
54
3 481
2,9155 089
109
120
13.04
9.8334T1813 601
2 540
60
3 438
2,6984 855
120
91
13.02
9.8474,7054 214
1,921
36
3 637
2.8705 248
89
116
13.01
11. 0335,6915 071
1,415
24
4 199
3,0115 550
79
140
13.02
9.8414,5053 946
921
23
4,178
2,6775,094
82
84
13.01
9.7163,0822 555
774
24
4 381
2,6435,389
99
121
12.47
9.1324,8064 igs
456
27
3 969
2,5404 822
95
156
11.70
8.8094,9194 347
705
36
4 134
2,5794 706
132
156
11.63
8.9185,6424 879
970
44
3 860
"2,6094 535
144
t Revised series. For revisions refer to the indicated pages of the monthly issues, as follows: Exports of tobacco for 1932, p. 42, June 1933—data revised for 1933,See p. 20 of the September 1934 issue; 1932 final revision of anthracite production, p. 42, January 1934. Anthracite shipments for 1932, p. 42, December 1933; consumption ofbituminous coal by electric power plants for 1932, p. 42, May 1933; for 1933, p. 42, May 1934. Data also revised for 1934. Revisions not shown on p. 43 of the June 1935 issuewill appear in a subsequent issue. For revised data for 1932 on sugar meltings and stocks, see p. 41 of the May 1933 issue. For 1932 revisions of sugar imports and exportssee p. 41 of the June 1933 issue. For revisions of exports in 1933, see p. 20 of the September 1934 issue. Revised data on shipments and stocks of refined sugar at 2 ports(for period January 1925-April 1935) will be shown in a subsequent issue. Change resulted from a reduction in the number of reporting refineries.
• See footnote on p. 37 of this issue. Data revised for 1933. See p. 20 of the October 1934 issue.• Beginning with August 1934 certain anthracite stocks were included which had not been covered in previous reports. The original figure for the end of August 1934
was 2,023,120 tons; revised for the month was, as shown, 2,197.411 tons.• Revised.J Price converted to short-ton basis. Data on a short-ton basis prior to April 1931 were not published. Earlier monthly data were reported on a long ton basis.» Preliminary.• December 1 estimate.A Note major correction in data on imports of refined sugar from Cuba June-November 1934 were shown in the February 1935 issue.• New series. For earlier data, see p. 20 of the August 1934 issue, for receipts of refined sugar from Hawaii and Puerto Rico and imports from Cuba. Data prior to May
1934 on imports of refined sugar from the Philippine Islands are not available./ August 1 estimate.

46 SURVEY OF CURRENT BUSINESS September 1935
Monthly statistics through December 1931,together with explanatory footnotes and refer-ences to the sources of the data, may be foundin the 1932 Annual Supplement to the Survey
1935
July
1934
July August Septem-ber October Novem-
berDecem-
ber
1935
January Febru-ary March April May June
FUELS AND BYPRODUCTS—Continued
COAL-ContinuedBituminous— Continued.
Exports thous. of long tons..Price, retail composite, 38 cities
dol. per short ton..Prices, wholesale:
Composite, minerun-dol. per short ton--Prepared sizes (composite)
dol. per short ton..Production! thous of short tons. _Stocks, consumers, end of month
thous. of short tons..COKE
Exports thous. of long tons..Price, furnace, Connellsville
dol. per short ton._Production:
Beehivef thous. of short tons..Byproductf thous. of short tons..Petroleum thous. of short tons. .
Stocks, end of month:Byproduct plants thous, of short tons..Petroleum, refinery. -thous. of short tons..
PETSOLEUM AND PRODUCTSCrude petroleum:
Consumption (run to stills) -thous. of bbL_Imports# thous. of bbl-Price, Kansas-Oklahoma dol. perbbl..Productionf§ thous. of bbl._Refinery operations pet. of capacity _.Stocks, end of month:
California:Heavy crude and fuel oil§
Light crude§ thous. of bbl._East of California, totalf§-thous. of bbl__
Refineriest§ thous. of bbl—Tank farms and pipe linesf§
thous. of bbl—Wells completed! § number-
Refined products:Gas and fuel oils:
Consumption:Electric power plantsf- -thous. of bbl-
Vessels bunker thous. of bbl—Price, fuel oil, Oklahoma, 24-26 refineries
dol. per bbl—Production:
Residual fuel oil*t§ thous. of bbl_.Oas oil and distillate fuels* f§
thous. of bbl—Stocks:
Residual fuel o*l, east of California*t§thous. of bbl-
Gas oil and distillate fuels, total* §thous. of bbL-
Gasoline:Consumptionf§ ..thous. of bbL.Exports* ..thous. of bbl__Exports, value. (See Foreign Trade.)Price, wholesale:
Drums, delivered, N. Y..dol. per gal—Refinery, Oklahoma dol. per gal..
Price, retail, service station, 50 citiesdol per gal
Production:At natural gas plantsf§ .thous. of bbl..At refineriesf § thous . of bbl . _
Retail distribution (41 States) t
Stocks, end of month:At natural gas plants§ ._ thous. of bbl..At refin°riest§ thous. of bbl...
Kerosene:Consumptionf§ thous. of bbl —Exports thous. of bbl-Price, 150° water white, refinery, Pa.
dol. per gal-Production § thous. of bbl_-Stocks, end of month§ thous. of bbl—
Lubricating oil:Consurnptiont§ thous. of bbl—Price, cylinder oil, refinery. Pa.
dol. per gal..Production§ thous. of bbl .-Stocks, refinery, end of month §
tbous. of bbl,...
983
8.12
4.252
4.314p 22, 252
40, 729
70
3.37
462,586
140
2,995441
84,9033,000
**. 94085, 485
74
58, 49832, 662
289, 70356, 081
233,6221,348
918
2,666
.765
20, 210
8,709
26, 909
22,915
41, 2032,759
.166
.056
3.13240, 667
3,02730, 550
2, 885456
.0504, 2129, 169
1, 655
.1202, 213
6, 517
1,108
8.23
4.185
4.34324, 869
30, 387
1,036
8.30
4.199
4.39327, 452
31, 441
105 127
3.73
522, 380
96
2, 312494
80, 0652,561.940
81,54873
73, 83435, 881
312, 93855, 959
256, 9791,182
8903,2422,412
.725
20, 824
7,651
21, 659
19, 603
37, 3951,495
.155
.045
.140
2,96037,078
1,090
1,59033, 190
2,815751
.0464,3207,062
1, 491
.1832,209
6,782
3.73
452,278
101
2,648478
1,033
8.31
4.192
4.43527, 772
33, 077
114
3.73
572,171
110
2,846484
79, 9282,621.940
79, 05872
71, 20736, 279
308, 13855, 432
252, 7061,216
9263,2162,633
.725
20, 139
8,723
24, 645
22, 927
38, 9411,766
.155
.047
.139
3,03137, 296
1, 123
1,58930, 421
2,804976
.0464,3767,651
1,498
.1482, 152
6,841
73,6113,270.940
75, 81068
69, 49036, 672
305, 74056, 245
249, 4951,047
8663,2822,350
.725
19, 447
8,298
26,768
24, 295
34,9341,677
.155
.046
.136
3,04634, 488
1, 074
1,34628, 949
3,571789
.0474,2627,539
1,387
.1602,106
6,965
1,059
8.35
4.190
4.44932, 807
35, 810
92
3.73
782,312
129
3,081464
949
8.35
4.190
4.44930, 856
36, 356
83
3.73
972,262
113
3,418459
75, 9912,395
.94076, 776
67
67, 13337, 209
302, 63656, 339
246, 2971,234
9263,4942,354
.725
20, 070
7,904
27, 379
24, 848
37, 5351,823
.155
.043
.119
3,23836, 282
1,094
1,08326, 340
3,956957
.0494,8897,497
1,677
.1462, 145
6,939
73, 7843,448.940
72, 46369
63, 89137, 290
297, 06855, 253
241,8151,032
8003,2152,250
.750
19,913
8,044
28,081
24, 449
34, 9611,833
.165
.046
.124
3,21235, 591
1,022
88925, 201
4,451625
.0484,7867,199
1,495
.1342,090
6,869
537
8.36
4.190
4.46032, 331
34, 476
42
3.73
872,414
97
3,418405
386
8.37
4.180
4.45936, 681
32, 045
32
3.73
882,802
116
3,129375
76, 5932,794.940
75, 01070
61,86137, 529
292, 81055, 019
237, 7911,050
8943,3532,434
.750
21, 066
8,136
26, 579
21, 957
30, 4861,429
.161
.046
.129
3,23635, 997
931
• 1,33628,311
4,761797
.0464,7776,398
1, 394
.1262,346
7,331
75, 4561,699.940
78,71569
60, 87937, 823
293, 22655, 892
237, 3341,004
8923,4372,477
.750
20, 335
7,696
25, 274
18, 021
28, 0621,845
.136
.045
.132
3,28635, 330
848
1,46133, 224
4, 299691
.0475,0116,388
1,557
.1102,175
7,100
351
8.39
4.180
4.46234, 781
32, 197
25
3.73
932,781
110
2,860353
70, 8171,753.940
72, 76372
60, 68937, 447
292, 77656, 316
236, 4601,103
7963, 1082,148
.750
19, 178
7,147
24, 136
16, 260
26, 4321,092
.128
.044
.132
2,95232, 702
809
1,47238, 548
4,597441
.0494,7916,119
1,297
.113
356
8.39
4.180
4.44638, 655
38, 543
23
3.70
1012,911
119
2,961367
76, 6303,227.940
81, 48868
59, 71436, 872
295, 35157, 651
237, 7001,209
8143,4412,698
.750
20, 453
8,678
23,614
16, 052
31,9972,081
.120
.046
.133
3,22335, 314
970
1,77840, 220
3,959538
.0505, 2156,834
1,617
.1102, 028 2, 251
7,416 ! 7,277
882
8.24
4.180
4.31421, 937
36, 249
18
3.60
672,670
120
3,019397
75. 0662,651.940
78, 42768
58, 81835, 377
297, 38059, 343
238,0371,248
7643,3652,402
.750
19, 328
7,183
22, 677
16, 232
36, 0761,330
.138
.051
.136
3,05634, 728
1,043
2,05037, 867
3,751498
.0504,3256,886
I , 802
.110
772
8.11
4.217
4.27726, 773
35, 541
50
3.60
572,793
132
2,791416
80, 4123,160.940
82, 45470
58, 92833, 233
298, 24059,909
238, 3311,467
8493,3902,621
.769
21,311
8,198
23, 884
17, 365
39, 0891,848
.162
.053
.139
3, 08537, 583
1,113
2,57934, 725
3,545496
.0504,4747,295
1, 919
955
8.05
4.234
4.29430, 067
« 41, 127
69
3.54
612,600
135
2,787424
81, 7242,937.940
82, 33874
57, 89433, 282
294, 31457, 584
236, 7301,385
8523,2412, 496
.775
20, 267
8,205
25, 548
20, 232
37, 8842,729
.163
.056
.140
3,13438, 180
2,74532, 499
2,768614
.0504,4178,310
1,558
. 113 . 1202, 309 2, 392 2, 247
7,026 6,897 j 6,855
t Revised series. For revisions refer to the indicated pages of the monthly issues, as follows: Bituminous coal production, for 1932, p. 42, January 1934. Bituminouscoal production revised for 1933 and 1934. Revisions not shown in the May 1935 issue will appear in a subsequent issue. Beehive and byproducts coke for 1932, p. 43 ofDecember 1933 issue, and for 1933 revisions see p. 43, July 1934. Data for 1934 also revised; revisions not shown in the July 1935 issue will appear in a subsequent issue. Crudepetroleum production, stocks, east of California (total), at refineries and at tank farms and pipe lines, and wells completed, for 1932. See footnote on p. 56, November 1933.Consumption of gas and fuel oils in electric power plants for 1932, p. 43; May 1933; for 1933 revisions, p. 43, May 1934. Data also revised for 1934. Revisions for monthsnot shown for 1934 on p 44 of the June 1935 issue will appear in a subsequent issue. Production of residual fuel oils and gas oil and distillate fuels, stocks of residual fueloil east of California, consumption of gasoline, production of gasoline at natural-gas plants and refineries, stocks of gasoline at refineries, consumption of kerosene and lubri-cating oil, for 1932, p. 56, November 1933; retail distribution of gasoline in 41 States for 1932, p. 43, May 1933, for 1933, p. 43, May 1934.
# See footnote on p. 37 of this issue. Imports also revised for 1933. See p. 20 of the October 1934 issue.§ Data revised for 1933. See p. 20 of the January 1935 issue.• Data revised for 1933. See p. 20 of the September 1934 issue.a New basis due to ^.classification of motor-mel stocks. , * , . , , , ., ,, j. ^n * * i* New series. For earlier data see p. 20 of the February 1933 issue, production and stocks of residual fuel oil and gas oil and distillate fuels.

September 1935 SURVEY OF CURRENT BUSINESS 47
Monthly statistics through December 1931,together with explanatory footnotes and refer-ences to the sources of the data, may be foundin the 1932 Annual Supplement to the Survey
1935
July
1934
July August Septem-ber October Novem-
berDecem-
ber
1935
January Febru-ary March April May June
FUELS AND BYPRODUCTS—Continued
PETROLEUM AND PRODUCTS-Continued
Refined products— Continued.Other products:
Asphalt:ITnports# thous. of short tonsProductionf§ thous. of short tons_.
Stocks, refinery, end of monththous. of short tons..
Coke. (See Coke.)Wax:
Production thous. of l b _ _Stocks, refinery, end of mo.§_thous.oflb-
2352
405
32, 480138, 941
3318
359
34, 160115, 137
1320
339
33, 880119, 702
1263
315
33, 880118, 991
0267
292
39, 480123, 099
1215
307
39, 480130, 222
0153
338
37, 520136, 136
3147
366
36, 960141, 252
9132
378
35, 280145, 744
8182
409
37, 240141, 809
1251
411
43, 120144, 153
0308
424
41, 160145, 982
2350
435
31, 360141, 506
LEATHER AND PRODUCTS
HIDES AND SKINS
Imports, total hides and skmst#-thous. of lb._Calf and kip skins thous. of l b__Cattle hides thous. of lb..GoatskinsJ thous of IbSheep and lamb skins thous. of Ib--
Livestock, inspected slaughter:Calves A ___ _ thous. of animals ..Cattle A.. ..thous. of animals..Hogs thous. of animals..Sheep A thous. of animals _
Prices, wholesale:Packers, heavy native steers, Chicago
dol. per lb_.Calfskins, no. 1 country, Chicago
dol. per l b__LEATHER
Exports:Sole leather thous. of IbUpper leather t* thous. of sq. ft..
Production:Calf and kip* thous. of skins. .Cattle hides*t - - thous. of hides ..Goat and kid*J thous. of skinsSheep and lamb* ft thous. of skins..
Prices, wholesale:Sole, oak, scoured backs (Boston)
dol. per lb_.Upper, composite, chrome, calf, black,
"B" grade dol. per sq. ft..Stocks of cattle hides and leathers (all kinds)
end of month:Total* H thous. of equiv. hides ..
In process and finished*thous. of equiv. hides
Raw* | thous. of equiv. hides..
LEATHER MANUFACTURES
Gloves and mittens:Production (cut), total* ._ dozen pairs
Dress and semidress* dozen pairs..Work* _ dozen pairs
Shoes:Exports - thous. of pairsPrices, wholesale:
Men's black calf blucher,Boston dol. per pair
Men's black calf oxford, lace,St. Louis dol. per pair..
Women's colored calf, Goodyear welt,oxford, average dol. per pair--
Production, totalf thous. of pairs..Men'sf thous. of pairsBoys' and youths'f thous. of pairs..Women's!- thous. of pairs.-Missses' and children'sf-thous. of pairs. .Slippers, all typesf thous. of pairs. _All other footwearf thous. of pairs.-
33, 17821, 16416, 3298,2114,470
464745
1,7121,546
.130
.146
3824,595
.34
.361
69
5.50
4.21
4.0431, 4847,7931,707
13,0102,8583,1292,987
19, 9071,9008,2685, 6072,930
7741,1993,3231,294
.098
.093
2053,850
1,1521,5123,6382,452
.29
.320
14, 861
10,3214,540
187, 068119, 18967, 879
88
5.50
4.15
4.0028, 3946,7341,452
11, 8442,6473,3332,383
12, 958808
4,5714,3552,512
9901,6122.6411,527
.088
.076
7535,043
1,1771,6783,7072,334
.27
.300
15, 261
10 1205,141
226, 267146, 87979, 388
88
5.50
4.15
4.0035, 6248 6161,757
15, 0253,1574,2402,828
10, 879806
2,4083,9062,409
8431,8042, 6011,743
.099
.093
4255,354
9701,4743,2902,222
.27
.297
16, 121
10 0376,084
192, 446121, 18371, 263
73
5.50
4.15
4.0028, 1846 9691,321
10, 5642,6304,2792,421
10, 018919
2,1483,2022,658
6601,4173, 5462,627
.096
.092
3636,684
1,1611,6783 6373,062
.27
.296
16,837
10 2536,584
209, 337134, 59274, 745
72
5.50
4.15
4.0028, 7097 6341,5128,8042,7715,2122,775
11, 095658
3,7633,2192,554
5221,2844,0231,447
.099
.110
4516,030
1,0151,6843 3292,871
.27
.298
17,421
10 5076,914
196, 371131, 08265, 289
77
5 50
4.15
4.0023, 8526 9391,2526,1472,2934,8272,394
12, 6351,0925,3422,8562, 397
4941,0764, 1961,298
.110
.114
2335,677
1,0791,6833 2742,707
.28
.307
17, 905
10 8307,075
141, 37786, 73554 642
49
5 50
4.15
4.0023, 2006 5631,1947,7462,4012,8922,404
16, 8791,2895,6105 7522,549
512978
3,0471,345
.120
.122
2815, 428
1,1191,8783 5933,131
.30
.319
18,288
11 2717,017
141 12474, 64966 475
40
5 50
4.15
4.0029, 007
7 6771,381
11,8973,0781,7343,239
18, 5681,3067,4025 8702,351
391663
2,4091, 137
.111
.113
1847,307
1,0231,7^93 652
, 3, 090
.30
.320
18, 236
11 3946,842
177 442100 42477 oig
55
5 50
4.15
4.0030, 1077 567l'273
12, 6313,1362,1063,393
24, 7051,429
11,8016 4803, 440
473691
2,1581,374
.104
.112
1877,094
1,0951,8084 0382,982
.30
.320
18, 152
11 4196,733
194 886114 88080 006
92
5 50
4.15
4.0033, 5848 1361,384
13, 9273,3012, 5594,279
24, 7361,140
12, 8156,1323,160
511683
2,1771,483
.113
.118
2136,040
1,0881,8234, 1843,144
.32
.320
18, 209
11 4476,762
187, 746103, 35384, 393
82
5 50
4.15
4.0033, 8288 0501,370
13, 5633,6102,6184,617
27, 0031,810
12, 2756 0564,643
508735
2,1721 584
.123
.153
4486,035
1,156o i 866
3 970a 2, 850
.37
.342
0 18,0470 11 487
0 6, 560
201 204112 95588 249
79
5 50
4.15
4.000 30, 750
8 145a 1,511
« 10,8103,177
" 2, 9480 4, 160
25, 1072,942
10, 2037 2773,348
439669
1,8281 421
.124
.156
2425,522
1,3161 6613 5872,772
.35
.354
18, 203
11 5166,687
68
5 50
4.15
4.00« 26,732
o 7 704.
1,566a 8,727a 2,706
2,516a 3,423
to State relief:antity of hides
H Raw stocks in all hands as shown above include all hides from Government animals slaughtered under Federal inspection. Hides from cattle allottedagencies and which were not killed under Federal inspection are not included unless they have already moved into sight. It is obvious, therefore, that a qu;from noninspected slaughter held by State relief agencies constitutes an invisible addition to the visible supplies shown above.
0 Revised.t Data on production of sheep and lamb and goat and kid leathers from 1927-34 have been revised. For revisions not shown on p. 44 of the April 1935 i^sue s^e p 19
of the June 1935 issue.A Government relief slaughter included for the period June 1934-February 1935. See p. 44 of the June 1935 issue for the figures, excluding relief slaughter. For sheep
and lambs, relief slaughter only affected the data for the months of September to December 1934.§ Data revised for 1933. See p. 20 of the January 1935 issue.# See footnote on p. 37 of this issue. Imports revised for 1933, see p. 20 of the October 1934 issue.* New series: For earlier data refer to the indicated pages of the monthly issues. Leather production, p. 19, June 1933; leather stocks, p. 19, January 1935. New series
on gloves and mittens cover 234 identical manufactures as reported to the U. S. Department of Commerce, Bureau of the Census. Data prior to July 1934 are not avail-able. These data are not comparable with data through January 1934 previously shown.
t Revised series. For earlier data refer to the indicated pages of the monthly issues, Production of cattle, sheep, and lamb leather, p. 44, April 1934; imports of totalhides and skins, exports of upper leather, p. 43, June 1933; boot and shoe production for 1934, p. 45, March 1935. Production of asphalt for 1932, p. 56, November 1933.
• Data revised for 1933. See p. 20 of the September 1934 issue.
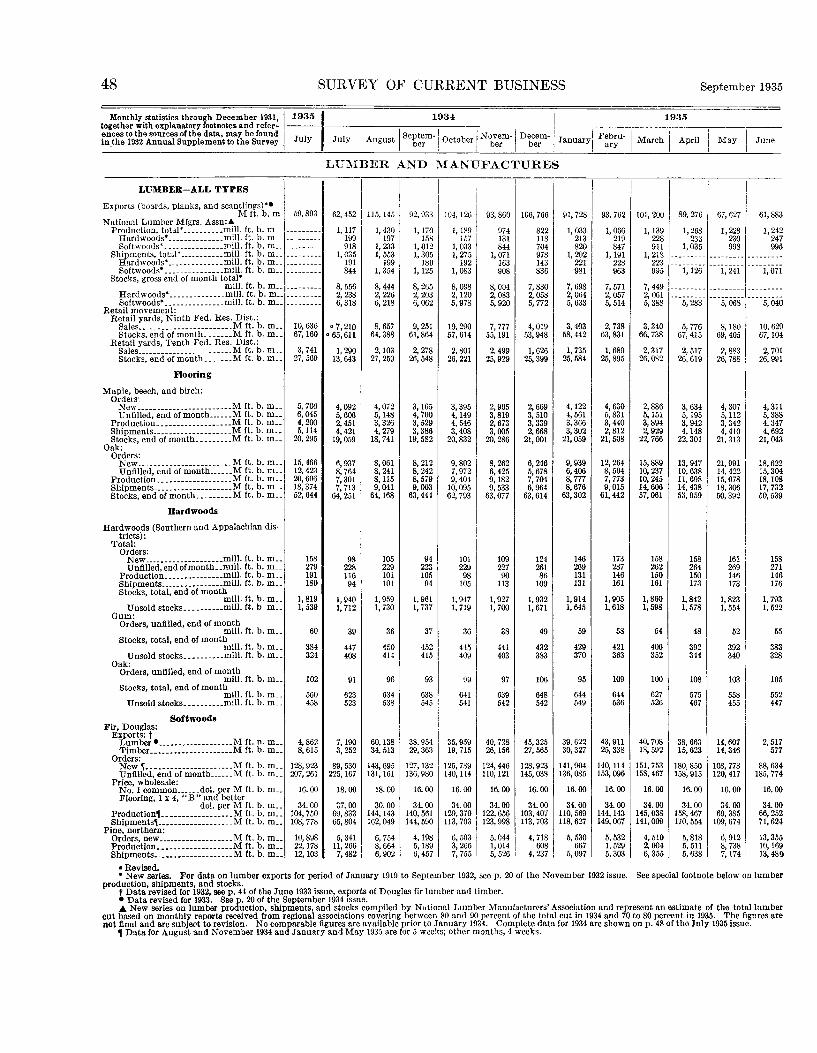
48 SURVEY OF CURRENT BUSINESS September 1935
Monthly statistics through December 1931,together with explanatory footnotes and refer-ences to the sources of the data, may be foundin the 1932 Annual Supplement to the Survey
1935
July
1934
July August SCberm" OctoberNovem-
berDecem-
ber
1935
January Febru-ary March April May June
LUMBER AND MANUFACTURES
LUMBER-ALL TYPES
Exports (boards, planks, and scantlings)*®M ft. b. m
National Lumber Mfgrs. Assn:AProduction, total* .mill. ft. b. m._
Hardwoods* - __mill. ft. b. m__Softwoods* mill. ft. b. m
Shipments, total* mill. ft. b. m._Hardwoods* - mill. ft. b. m._Softwoods* mill. ft. b. m
Stocks, gross end of month total*mill. ft. b. m._
Hardwoods* mill. ft. b. m__Softwoods* mill. ft. b. m__
Retail movement:Retail yards, Ninth Fed. Res. Dist.:
Sales M ft. b. m_.Stocks, end of month _-M ft. b. m._
Retail yards, Tenth Fed. Res. Dist.:Sales M ft. b. m..Stocks, end of month M ft. b. m__
Flooring
Maple, beech, and birch:Orders:
New M ft. b. mUnfilled, end of month M ft. b. m._
Production M ft. b. m_.Shipments M ft. b. m._
Oak:Orders:
New --M ft. b. m._Unfilled, end of month _M ft. b. m._
Production M ft. b. m__Shipments M ft. b. m._Stocks end of month M ft. b. m__
Hardwoods
Hardwoods (Southern and Appalachian dis-tricts):
Total:Orders:
New - mill. ft. b. m_.Unfilled, end of month, .mill. ft. b. m_.
Production mill. ft. b. m__Shipments.. mill. ft. b. m_.Stocks, total, end of month
mill. ft. b. m._Unsold stocks mill. ft. b. m
Gum:Orders, unfilled, end of month
mill. ft. b. m__Stocks, total, end of month
mill. ft. b. m _ _Unsold stocks mill. ft. b. m__
Oak:Orders, unfilled, end of month
mill. ft. b. m__Stocks, total, end of month
mill. ft. b. m..Unsold stocks mill. ft. b. m _
SoftwoodsFir, Douglas:
Exports: fLumber* M ft. n. m__Timber M ft. b. m
Orders:New K M ft. b. m _ _Unfilled, end of month M ft. b. m__
Price, wholesale:No. 1 common dol. per M ft. b. m._Flooring, 1 x 4, "B" and better
dol. per M ft. b. m__Production J ._ M ft. b. m _ _Shipments^ M ft. b. m__
Pine, northern:Orders, new . M ft. b. mProduction M ft. b. m__Shioments M ft. b. m._
59, 893
10, 63667, 160
3,74127, 569
5,7066,0454,2005,114
20, 295
15, 46612, 42320, 60618, 37452, 644
158279191180
1,8191,539
60
384324
102
560458
4,8628,615
128, 923207, 261
16.00
34.00104, 750108, 778
10, 89822, 17812, 103
62, 452
1,117199918
1 035191844
8, 5562 2386,318
«7,210« 65, 611
1,29013, 643
4 0925,6062,4514,421
19 059
6 9378, 7647 3017,713
64 251
9822811694
1,9401 712
39
447408
91
623523
7,1903,252
89, 530225, 167
18.00
37.0069, 83365, 804
5,34111, 2667,482
115, 145
1,430197
1 2331 553
1991 354
8,4442 2266,218
8,65764,388
2,10327, 259
4 0725,1483,3264,279
18 741
8,0618,2418 1159,041
64, 168
105229101101
1,9591 730
36
450414
96
634538
60, 13834, 513
143, 695131, 161
18.00
30.00144, 143162, 049
6,7548,6646,902
92, 933
1,170158
1 0121 305
1801 125
8,2652 2036,062
9,25161, 864
2,27826, 548
3 1654,7003,5293,386
19 582
8,2128, 2428,5799,003
63, 444
9422310594
1,9611,737
37
452415
93
638545
38, 95429, 363
127, 132136, 980
16.00
34.00140, 561144, 590
4,1985,1896,457
104, 126
1,189157
1 0331 275
1921 083
8, 0982 1205,978
10 29057, 614
2,80126, 221
3 3()54,1494, 5463,408
20 832
9 8027,9729 404
10, 09562 793
10122998
105
1,9471 719
36
445409
99
641541
35, 95919, 715
125, 789140, 114
16.00
34. 00129, 370113, 703
6,5033,2667,755
93, 860
974131844
1 071163908
8 0042 0835,920
7 77755, 191
2,49925,929
2 9053,8192,6733,005
20 286
8 2626,4259 1829,533
63 077
10922790
113
1,9271 700
38
441403
97
639542
40, 72826, 156
124, 446110, 121
16.00
34.00122, 656123, 998
5,0441,0145,526
106, 766
822118704978143836
7,8302 0585,772
4 01953, 948
1,62625, 399
2 6693,5103 3392^668
21 001
6 2465,6787 7046,964
63, 614
12426186
109
1,9321 671
49
432383
106
648542
45, 32527, 565
128, 923145, 038
16.00
34.00103, 407113, 703
4,718608
4,237
91, 728
1,033213820
1 202221981
7,6982 0645,633
3,40358, 442
1,73525, 584
4 1224,5613,3663,302
21 059
9,9396,4068,7778,676
63, 302
146269131131
1,9141,645
59
429370
95
644549
39, 62230, 327
141,904136, 085
16.00
34.00110,569118, 627
5,530667
5,097
93, 762
1,066219847
1 191228963
7,5712 0575,514
2,73863, 831
1,68925, 895
4 6305,8313,4402,812
21, 508
12, 2648,5047,7739,015
61, 442
173287146161
1,9051,618
58
421363
109
644536
43,91125, 338
140, 114153, 096
16.00
34.00144, 143149, 067
5,5321,5295,303
101, 200
1,139228911
1 218223995
7,4492 0615,388
3,34066, 738
2,31726, 082
2 8865,1513,8942,929
22 766
15, 88910, 23710,24514, 60657, 061
158262150161
1,8601,598
54
406352
100
627526
40, 70818, 592
151, 753158, 467
16.00
34.00145, 038141, 009
4,5102,0046,355
89, 276
1,268233
1 035
1 126
5,283
5 77667, 415
2,51726, 619
3 6345,1953,9424,148
22 301
13, 94710, 63811 69814, 43853, 959
158264150173
1,8421,578
48
392344
108
575467
38, 66315, 623
180, 850158, 915
16.00
34.00158, 467170, 554
5,8185,5115,638
67, 627
1,228230998
1 241
5,068
8 18069, 405
2,88326, 788
4 3075,1123,3424,410
21 313
21 99114, 42215 07818, 30650 392
161269146173
1,8231 554
52
392340
103
558455
14, 60714, 346
108, 778120, 417
16.00
34.0069, 385
109, 674
6,9128,7387,174
61, 883
1,242247995
1 071
5,040
10 62967, 104
2,70126, 991
4 3115,3884,3474,692
21 043
18 62215, 30418 10817, 73250 539
158271146176
1,7931 522
55
383328
105
552447
2,517577
88, 634185, 774
16.00
34.0066, 25271, 624
13, 35510, 16913, 489
• Revised.• New series. For data on lumber exports for period of January 1919 to September 1932, see p. 20 of the November 1932 issue. See special footnote below on lumber
production, shipments, and stocks.t Data revised for 1932, see p. 44 of the June 1933 issue, exports of Douglas fir lumber and timber.• Data revised for 1933. See p. 20 of the September 1934 issue.A New series on lumber production, shipments, and stocks compiled by National Lumber Manufacturers'Association and represent an estimate of the total lumber
cut based on monthly reports received from regional associations covering between 80 and 90 percent of the total cut in 1934 and 70 to 80 percent in 1935. The figures arenot final and are subject to revision. No comparable figures are available prior to January 1934. Complete data for 1934 are shown on p. 48 of the July 1935 issue.
1 Data for August and November 1934 and January and May 1935 are for 5 weeks; other months, 4 weeks.
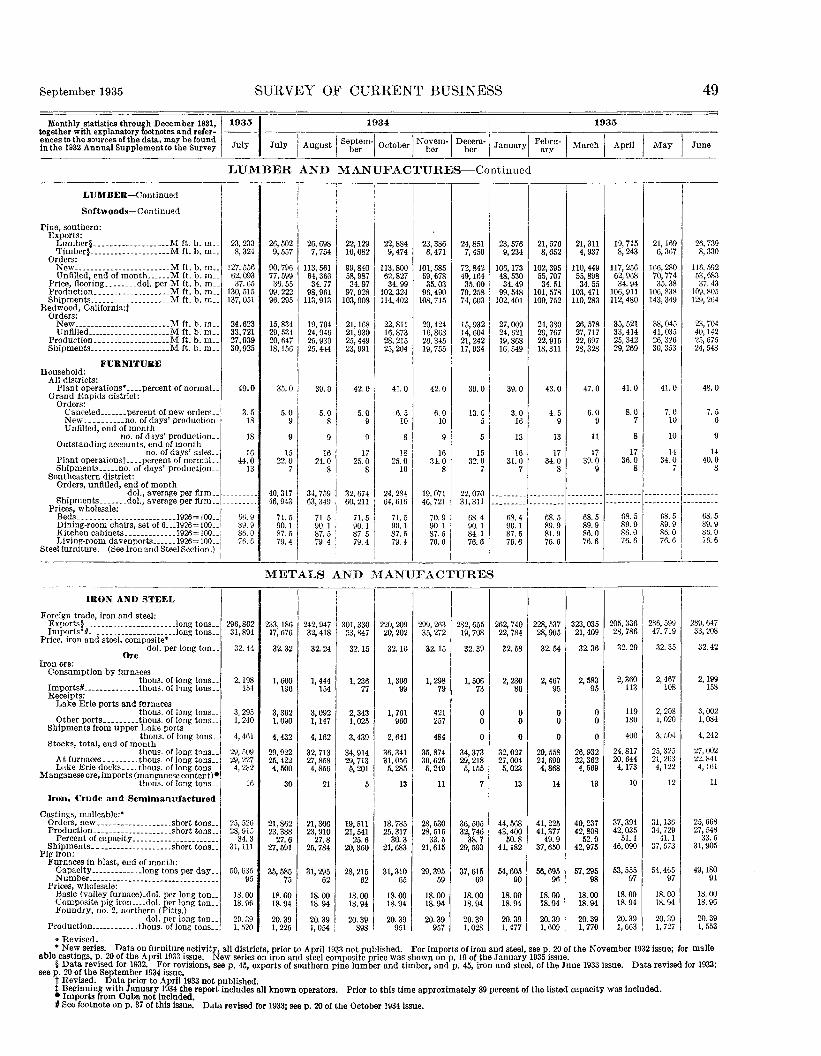
September 1935 SURVEY OF CURRENT BUSINESS 49
Monthly statistics through December 1931,together with explanatory footnotes and refer-ences to the sources of the data, may be foundin the 1932 Annual Supplement to the Survey
1935
July
1934
July August Septem-ber October Novem-
berDecem-
ber
1935
January Febru-ary March April May June
LUMBER AND MANUFACTURES—Continued
LUMBER— Continued
Softwoods— Continued
Pine, southern:Exports:
Lumber§ _ M ft. b. m._Timber§ M ft. b. m
Orders:New M ft b mUnfilled, end of month M ft. b. m_.
Price, flooring dol. per M ft. b. mProduction M f t b mShipments _ M ft b. in
Redwood, California:]:Orders:
New M ft b inUnfilled M f t b m
Production M ft. b. mShipments. _ M ft. b. m_
FURNITUREHousehold:
All districts:Plant operations* percent of normal..
Grand Rapids district:Orders:
Canceled _ percent of new ordersNew _. _ no. of days' productionUnfilled, end of month
no. of days' production. _Outstanding accounts, end of month
no. of days' sales. _Plant operations! percent of normal--Shipments no. of days' production..
Southeastern district:Orders, unfilled, end of month
dol , average per firmShipments dol., average per firm
Prices, wholesale:Beds 1926=100Dining-room chairs, set of 6. .. 1926 =100...Kitchen cabinets 1926=100-.Living-room davenports 1926 = 100- .
Steel furniture. (See Iron and Steel Section.)
23, 2338,324
127, 55662, 09337.65
130, 515137, 051
24 62333,72127,93930,925
49.0
3.518
18
1644.0
13
6<> 989. 986.076.6
26, 5029,557
90 79677, 59936.55
99 22296, 295
15 83429 53420 64718 158
35.0
5 09
9
1522.0
7
40 31746 943
71 590.187. 579.4
26, 6987 754
113 56164, 38634 77
98 961113 913
19 70424 94625 93025 444
39.0
5 0g
9
1624.0
8
34 75963 349
71 590.187.579.4
22, 12910 082
99 84058, 98734 97
97 928103 908
21 16821 93025 44923 991
42.0
5 09
9
1725.0
8
32 67460' 211
71 590.187.579.4
22, 8849 474
113 80062, 827
34 99102 324114 402
22 81116 87328 21525 204
41.0
6 510
8
1825.0
10
24 28464 616
71 590.187.579.4
23, 3866 471
101 58559, 67835 03
96 490108 715
20 42416 86826* 34519' 755
42.0
6 010
9
1634.0
8
19 07146 721
70 990 187.576.6
24 8517 450
72 84249! 16435 00
79 25874 603
15 93214 60421 24217' 934
39.0
13 55
5
1532.0
7
22 07031 311
68 490.184.176.8
23, 5769 234
106 17348, 53034 49
99 548102 401
27 00924 62119 86816 549
39.0
3 016
13
1631.0
7
68 490.187.576.6
21, 5768 652
102 39555, 70734 51
101 578100 752
24 38029 76722 91518 311
43.0
4 59
13
1734.0
8
68 589.981.976.6
21,3114 937
110 44955, 898
34 55103 471110 283
26 57827' 71722 69728, 328
47.0
6 09
11
1739.0
9
68 589.986.076.6
19, 7158 243
117, 25662, 96834.94
106,911112, 480
35 52133, 41425, 34229, 269
41.0
8.07
8
1736.0
8
68.589.986.076.6
21, 1696,367
166, 28070, 77435.38
106, 838143, 349
38 04541, 03526, 32630, 353
41.0
7.010
10
1434.0
7
68. 589.986.076.6
26, 7398,330
116, 59253,68337.43
109, 805129, 264
23 70440, 14225, 67524, 548
48.0
7.56
9
1440.0
8
68.589.986.076. 6
METALS AND MANUFACTURES
IRON AND STEEL
Foreign trade, iron and steel:Exports§ _ long tonsImports*^. long tons
Price, iron and steel, composite*dol. per long ton..
OreIron ore:
Consumption by furnacesthous. of long tons..
Imports#___ thous. of long tonsReceipts:
Lake Erie ports and furnacesthous. of long tons..
Other ports thous of long tonsShipments from upper Lake ports
thous. of long tons..Stocks, total, end of month
thous. of long tons.-At furnaces thous of long tonsLake Erie docks thous. of long tons.-
Manganese ore, imports (manganese content) •thous. of long tons..
Iron, Crude and Semimanufactured
Castings, malleable:*Orders, new short tonsProduction short tons..
Percent of capacityShipments short tons..
Pig iron:Furnaces in blast, end of month:
Capacity long tons per dayNumber. _
Prices, wholesale:Basic (valley furnace) -dol. per long ton..Composite pig iron dol. per long ton..Foundry, no. 2, northern (Pitts.)
dol. per long ton..Production thous. of loner tons
296,80231,894
32.44
2,198154
3,2951 240
4, 461
29, 50929 2274,282
16
25, 52628, 915
34 331,111
50, 63595
18.0018.96
20. 391. 520
233 18617 676
32.32
1, 600196
3,3621 090
4,432
29, 92225 4224, 500
30
21 86223, 388
27 627, 591
35 58575
18.0018.94
20.391 . 225
242 94732 418
32.24
1,444154
3,0921 147
4,162
32, 71327 8584,856
21
21 30623, 910
27 g25, 784
31 29562
18.0018.94
20.391 . n/u
301 33003 ^47
32.15
1,23677
2,3431 025
3,439
34, 91429 7135,201
5
19 51121, 541
25 620, 360
28 21562
18.0018.94
20.39SQS
220 20920 202
32.10
1,30699
1,761960
2,641
36, 34131 0565,285
13
18 78525, 317
30 321, 683
31 31065
18.0018.94
20.39951
299 26335 272
32.15
1,29879
421257
484
35, 87430 6255,249
11
28 53028, 515
33 o21,615
29 39559
18.0018.94
20.39Q57
282 65519 708
32.39
1,50673
0o0
34, 37329 2185,155
7
36 50532, 746
38 729, 593
37 gis69
18.0018.94
20.391 . 028
262, 74022 784
32.58
2,28086
0o0
32, 02727 0045,023
13
44 56843, 400
50 841, 182
54 60590
18.0018.94
20.391.477
228, 53728 905
32.54
2,46795
0o0
29, 55824 6904,868
14
41 22541, 377
49 937, 650
56 69596
18.0018.94
20. 391.609
323, 03521 409
32.36
2,58395
0o0
26, 93222 3624,569
13
40 23742, 808
52 042, 975
57 29598
18.0018.94
20.391.770
205, 33628, 786
32.29
2,360113
119180
400
24, 81720, 6444,173
10
37, 39442, 035
51.146, 090
53, 55597
18.0018.94
20.391.663
286, 59947, 719
32. 35
2,467108
2, 2081,020
3,504
25, 32521, 2034,122
12
31, 13634, 729
41.137, 573
54, 46597
18.0018.94
20.391.727
289, 64733, 208
32.42
2,199158
3,0021,084
4,242
27, 00222, 8414,161
11
25, 66827, 548
33.531, 905
49, 18091
18.0018.98
20.391.553
« Revised.* New series. Data on furniture activity, all districts, prior to April 1933 not published. For imports of iron and steel, see p. 20 of the November 1932 issue; for malle
able castings, p. 20 of the April 1933 issue. New series on iron and steel composite price was shown on p. 19 of the January 1935 issue.§ Data revised for 1932. For revisions, see p. 45, exports of southern pine lumber and timber, and p. 45, iron and steel, of the June 1933 issue. Data revised for 1933;
see p. 20 of the September 1934 issue.t Revised. Data prior to April 1933 not published.t Beginning with January 1934 the report includes all known operators.• Imports from Cuba not included.# See footnote on p. 37 of this issue.
Prior to this time approximately 89 percent of the listed capacity was included.
Data revised for 1933; see p. 20 of the October 1934 issue.

50 SURVEY OF CURRENT BUSINESS September 1935
Monthly statistics through December 1931,together with explanatory footnotes and refer-ences to the sources of the data, may be foundin the 1932 Annual Supplement to the Survey
1935
July
1934
July August Septem-ber October Novem-
berDecem-
ber
1935
January Febru-ary March April May June
METALS AND MANUFACTURES—Continued
IRON AND STEEL-Continued
Iron, Manufactured Products
Cast-iron boilers and radiators:Boilers, range:f
Orders: jNew number of boilers..Unfilled, end of month, total
number of boilers. .Delivery, 30 days or less
number of boilers _.Delivery, more than 30 days
number of boilers. _Production number of boilers..Shipinents .number of boilers..Stocks, end of month-number of boilers. .
Boilers, round:Production... .thous. of lb__Shipments thous. of lb__Stocks, end of month thous. of lb_.
Boilers, square:Production thous of IbShipments thous. of ibStocks, end of month ..thous. of lb__
Boiler fittings, cast iron:Production . short tons _Shipments short tons
Boiler fittings, malleable:Production short tonsShipments. _ short tons._
Radiators:Production
thous. of sq. ft. heating surface. _Shipments
thous. of sq. ft. heating surface. _Stocks, end of month
thous. of sq. ft. heating surface. .Radiators, convection type:*
New orders:Heating elements only, without cabi-
nets or grillesthou. of sq. ft. heating surface t--
Heating elements, including cabinetsand grilles
thou. of sq. ft. heating surface J..
Sanitary Ware
Bathroom accessories: fProduction number of piecesShipments. number of pieces..Stocks, end of month. ..number of pieces..
Plumbing brass. (See Nonferrous metals.)Plumbing and heating equipment, wholesale
price (8 pieces)* dollars..Porcelain enameled flatware:
Orders, new, total - dollars _Signs. __ dollars.-Tabletops dollars..
Shipments, total dollars ..Signs.. dollars..Tabletops _ dollars..
Porcelain plumbing fixtures:Orders:
New, net number of piecesUnfilled, end of month
number of pieces..Shipments number of piecesStocks, end of month number of pieces ..
Vitreous-china plumbing; fixtures: tOrders:
New, net number of piecesUnfilled, end of month
number of pieces _ _Shipments . number of piecesStocks, end of month.. .number of pieces..
Steel, Crude and Semimanufactured
Bars, steel, cold finished, shipmentsshort tons..
Castings, steel:* AOrders, new, total short tons .
Percent of capacity. _.Railway specialties short tons..
Production, total short tons..Percent of capacityRailway specialties short tons..
Ingots, steel :§Production thous of long tons
Percent of capacity _
69, 459
35, 842
35, 142
70092, 88388, 90836, 176
2,8983,647
41, 138
12 71116 332
137,923
4,2914 696
3 0733,036
3,422
4,675
35, 610
82
167
338 449321, 312386, 716
201. 83
753 635300 160146, 128770 024307 018153, 937
2 391
3,7029 7719,405
319 589
293, 904216 745403, 381
25,295
34, 57029.0
9,57431, 125
26. 15,857
2,27039
33, 576
9,738
7,844
1,89433, 25533, 74633, 869
2,6912,592
44, 739
11,65211,172
124,414
3,3333,523
2 2822,180
3,483
3, 136
33, 867
77
128
156, 270150, 739383, 161
217. 88
594, 146226, 883110,079738, 460304, 752106, 273
1,785
4,3901,954
10, 762
111, 496
98, 924117, 780676,061
18, 130
41, 82226.7
22, 40746, 182
29.517, 661
1,48927
.36, 006
9,993
8,695
1,29837, 73535,75135, 853
4,1954,571
44, 437
15 55417 890
121,973
3,9144 651
2 1742,484
4,282
5,336
32, 969
62
178
205, 380211,005375, 376
218. 16
719, 146306, 463145, 494740, 802332, 917145, 001
2,723
4,3332,5429,626
130, 449
107, 020122, 353656,033
17, 622
25, 53816.3
5,69743, 748
27.917, 741
1,38123
51, 734
12, 724
11,878
84645, 37549, 00332, 225
3,8866, 258
42, 035
15 03025, 208
111,740
4,2254,655
2,3832,354
4,011
6,262
30, 885
44
158
349, 072328, 010376, 512
211. 26
636,811193, 716220, 279652, 158232, 206195, 541
2,017
3,8542,1988,847
139, 012
113, 991132, 041615, 467
14,304
20, 03012.8
4,41731,816
20.011, 152
1,26923
64,211
10, 195
9,492
70363, 43466, 74028, 919
5,76210, 65237, 136
18 83334, 18596, 329
6,0455 943
2 8382,890
4,680
9,282
26,517
94
196
143, 483133, 574371, 499
207. 03
713, 141248, 598178, 245764, 436269, 665205, 059
2 427
3,2982 7717,873
258, f»57
165, 687206, 961519, 867
18, 500
24, 32715.5
5,53829, 142
18.69,309
1,48225
57, 566
9,740
9,355
38559, 67359, 43929, 153
4,3915,330
36, 218
19 78319 35396, 933
5,9955 027
2,9843,090
5,208
6,456
25, 473
124
131
202, 354195, 289370, 036
206.89
563, 137180, 523133, 900583, 567199, 652131,993
2,582
3,6672,1107,610
183, 982
183, 152166,517482, 685
17, 923
21, 55213.8
4,28325, 799
16.57,218
1,61128
44, 906
16, 329
16, 329
040, 33737,47135, 446
2,9463, 626
32, 366
13 09913, 43696, 554
4,2983,060
2,9921,914
3,632
4,482
24, 786
115
182
267, 293271, 912358, 472
206. 50
525, 540193, 535111, 188530, 050204, 527106, 772
1,269
3,0201,3009,703
234, 350
283, 202134, 30G489, 729
24,049
27, 31217.4
8,12823, 916
15.35,142
1, 96436
68, 106
19, 357
19, 357
063, 87964, 90430, 443
3,2332,666
32, 826
16, 45710, 604
101, 340
4,6904,750
3,1533,205
4,679
3,117
26, 178
81
93
75, 31064, 305
363, 755
206. 07
689, 715318, 343149, 384594, 427219, 672152, 409
1,620
2,9781,5099,660
183, 281
262, 363204, 120426, 570
31,783
32, 34927.1
6,83529,035
24.36,052
2,87248
53, 897
15, 892
15, 892
057, 29457, 36230, 375
3,8502, 494
34, 221
15 9179,275
108, 115
4,1903,865
3,1812,704
4,343
2,787
27, 845
43
66
121, 190111,005369, 605
202. 61
692, 358235, 427153, 431637, 165190, 316142, 380
1,013
2,7201,2369,960
301, 925
369, 128195, 160380, 756
31,903
31, 72526.6
5,49029,687
24.96,181
2,77852
46, 320
12, 723
12, 723
051,89149, 48932, 777
4,3482,102
36, 500
16, 8586,964
117,911
3,6613,420
3,1142,582
4,648
2, 023
30, 568
48
87
78, 64075, 147
374, 749
200. 86
829, 084223, 860181, 437864, 145278, 110167, 296
2,641
3,5351,7909,917
243, 296
374, 217238, 207316, 705
34,080
30, 72325.8
7,95931, 940
26.87,585
2,86850
55, 093
12, 052
12, 052
051,05255, 76428, 065
4,3112,115
38, 090
16, 4097,730
126, 053
3,7903,955
2,7293,274
4,602
2,366
32, 891
46
106
120, 821119,171367, 593
199. 68
900, 388255, 477212,598900, 828265, 137213, 646
2,904
4,5531,722
10, 710
164, 042
308,912229, 347297, 971
31,972
28, 23323.7
4,32231, 952
26.86,731
2,64146
o 80, 689
32, 319
32, 219
0"61,815« 60, 422
29, 458
4,6042, 493
40, 149
19, 0629, 241
136, 149
3, 8704,271
3,2283,014
5,304
2,835
35, 388
49
153
208, 732174, 640370, 588
199. 50
888, 888279,016208, 213865, 904283, 524189, 044
2 322
4,5062 309
10, 688
127 764
217, 842218 834333, 240
29, 640
29, 08324.4
4,77930, 646
25.74,867
2,63644
0 106, 605
55, 291
54, 691
600o 88, 486« 85, 413
32, 201
4,4872,710
41,917
16, 43610, 700
141, 520
3,6104,321
3,1072,873
4,742
3,462
36, 753
56
148
"245,019« 228, 210
370, 180
198. 32
760, 743274, 078164, 808773, 531264, 896174, 671
2 101
4,1222 417
10,600
161 199
191, 060187 981381, 675
25,600
30. 25725.4
6,48027, 665
23. 25,443
2,23140
a Revised.* New series. For earlier data, see p. 20 of the January 1933 issue wholesale price of plumbing and heating equipment. Figures on convection-type radiators prior to
January 1932 not published. Steel castings, see p. 20 of the October 1934 issue.t In equivalent direct radiation.f Revised series. For earlier data on bathroom accessories see p. 20 of the October 1933 issue, and for range boilers see p. 20 of the July 1934 issue. Data on vitreous china
plumbing fixtures revised starting January 1933, see p. 47 of the April 1935 issue; revisions for 1933 will be shown in a subsequent issue.A Steel casting series revised January 1935 by the increase of the number of companies from 164 to 180; comparable data not completed for 1934 and earlier years. Figures
for 164 companies in January 1935 were new orders, total 31,816 percent of capacity 20.3; new orders, railway specialties, 6,835; production, total, 28,519, percent of capacity18.2, production, railway specialties 6,052.
§ For 1932 revision see p. 46 of the July 1933 issue, for 1933, p. 47 of the August 1934 issue, for 1934, p. 50 of the August 1935 issue.

September 1935 SURVEY OF CURRENT BUSINESS 51
Monthly statistics through December 1931,together with explanatory footnotes and refer-ences to the sources of the data, may be foundin the 1932 Annual Supplement to the Survey
1935
July
1934
July August Septem-ber October Novem-
berDecem-
ber
1935
January Febru-ary March April May June
METALS AND MANUFACTURES—Continued
IRON AND STEEL— Continued
Steel, Crude and Semimanufactured-Continued
Prices, wholesale:Composite, finished steel dol. per lb__Steel billets, Bessemer, Pittsburgh
dol. per long ton_.Structural-steel beams, Pittsburgh
dol. per lb._Steel scrap, Chicago. -_dol. per gross ton..
U.S. Steel Corporation:Earnings, net thous. of dol..Shipments, finished products*, .long tons..
Stcel, Manufactured Products
Barrels, steel:Orders, unfilled, end of month.. .number..Production . . number
Percent of capacityShipments . ._ .numberStocks, end of month number..
Boilers, steel, new orders:Area thous. of sq. ftQuantity number of boilers
Furniture, steel:Business group:
Orders:New thous of dolUnfilled, end of month__thous. of dol_.
Shipments thous. of dolShelving: A
Orders:New thous. of dolUnfilled, end of month__thous. of doL.
Shipments thous. of dolSafes:
Orders:New thous. of dolUnfilled, end of month. .thous. of doL.
Shipments thous of dolLock washers, shipments thous. of dol._Plate, fabricated steel, new orders, total
short tons..Oil storage tanks short tons
Sheets, black, blue, galvanized, and full fin-ished:
Orders:New short tonsUnfilled, end of month short tons__
Production, total short tons_ _Percent of capacity
Shipments short tons. _Stocks, end of month, total short tons__
Unsold stocks short tons. _Tin and terneplate:*
Production thous. of long tons _Track work, production short tons__
MACHINERY AND APPARATUS
Air-conditioning equipment'.!Orders, new, total.. thous. of dol__
Air- washer group thous. of doL _Fan group _ _ __ thous. of doLUnit-heater group thous. of dol__
Electric overhead cranes:Orders:
New thous. of dol__Unfilled, end of month thous. of dol__
Shipments thous. of dolElectrical equipment. (See Nonferrous
rnetals.)Exports, machinery. (See Foreign Trade.)Foundry equipment:
Orders:New 1922-24-100Unfilled, end of month 1922-24 =100__
Shipments 1922-24 = 100_ _Fuel equipment:
Oil burners:*!Orders:
New no. of burners. .Unfilled, end of month _no. of burners. _
Shipments no. of burners. _Stocks, end of month no. of burners..
Pulverized fuel equipment:Orders, new, storage system:
Furnaces and kilns.no. of pulverizers..Water-tube boilers.no. of pulverizers. _
Orders, new, unit system:Fire-tube boilers no. of pulverizers. _Furnaces and kilns.no. of pulverizers..Water-tube boilers.no. of pulverizers. _
0. 0244
27.00
.018010. 35
~547,"794"
932. 843509, 121
37.4505, 94233, 925
519536
1 321950
1,208
272167257
144288134203
18, 8904 193
206 313170,299145, 505
48 1152, 146125, 37872, 632
4,054
1,493173886435
1541,604
332
94 0126.5102.3
12, 5222,875
11, 18217, 141
00
08
10
0. 0246
27.40
.01819.55
~369~9§8~
684, 403519, 444
36 7528, 84731,755
385458
8661,047
863
222191231
136200130171
12, 5232 028
72 51769, 47285, 286
26 285, 442
110, 40071, 362
805,226
1,299273602424
16756378
50 743.167.2
8,4163,5107,191
19, 036
00
00
17
0. 0244
27.00
.01809.19
"§78~62§"
605, 573316,340
22 3318, 67829, 461
566597
870815
1,101
206172226
162196166162
16, 2933 334
66 06464, 27077, 197
23 877, 706
109, 28271, 968
1155,364
1,267197519550
19468979
43 136.348.7
12, 8493,894
12, 46518, 022
00
32
21
0. 0244
27.00
.01808.50
3,769370, 306
596, 694363 885
25 5368 771
24, 575
539696
813668879
209120261
11817713087
15, 1083 445
77 06367, 06276, 051
23 473, 26099, 88864,398
853,383
1,190147467576
5965989
46 446.' 637.0
16, 7142,475
18, 13314, 600
00
303
0. 0244
27.00
.01808.75
~343~962~
460, 880524 232
36 7516 68432, 123
416696
993664998
258154224
147181142130
16, 581927
102 92077, 423
104, 89832 3
95, 107102, 26463, 667
932,153
1,50189
590822
138651143
55 349.151.5
19, 2741,776
19, 97311, 461
00
057
0. 0244
27.00
.01809.25
"§66," 119"
330, 593421 003
29 6419 50033, 626
287447
1 0°6651
1 039
258196217
161216126129
16, 6293 252
133 344100| 745143, 057
44 0108, 880107, 55065, 400
832,065
1,592152575865
139670158
80 469.759.6
9,3551,3869,745
11, 348
00
223
0. 0244
27.00
.018010.31
3,762418, 630
452, 930373 gso
26 4374 994
27, 328
260331
1 063619
1 090
219164208
190230172171
26, 0255 185
193 130158, 456159, 740
49 2141, 566104, 72064, 393
902,272
1,328127459742
129592207
66 954.481.1
5,338735
5,95212, 469
30
068
0. 0244
27.00
.018011.80
"534," OSS'
1,171,996390 459
30 0391 232
26, 555
392329
1 184663
1 139
273192245
160245145277
18, 7781 389
321 831279, 012235, 714
74 0205, 915105, 18260, 177
1302,333
1,10693
485527
39390580
86 669.276.2
4,667871
4,53112, 986
00
065
0. 0244
27.00
.018011. 25
"583," 137"
1,158,398355 220
26 2353 41828, 357
282296
1 108707
1 064
267208251
142211176241
15, 0642 531
183 322248, 931219, 062
71 5201,054108, 78862, 024
1502,892
989209433347
200808297
75 757.785.1
4,680857
4,69413, 490
00
04
12
0. 0244
27.00
.018010.50
12,428668, 056
1,081,327462 771
34 1464 97826, 150
656418
1 222709
1 221
307175340
163228147255
16, 8322 377
193 057214, 685227, 082
74 1233, 446108, 26059, 757
1903,440
1,111164577369
79684198
69 343.282.6
5,761801
5,81714, 170
00
21
18
0.0244
27.00
.01809.85
~59l,"728~
944, 168538, 255
39 6534 47929, 926
313443
1 114701
1,123
271155291
16823815847
13, 2442,152
168 093177, 950209, 219
68 2202, 365116,31668, 153
2004,472
1,361229674457
264813140
113 286.169.7
8,781702
8,88014, 622
10
082
0. 0244
27.00
.018010.06
"598, 915
971, 344471 592
34 7474 13927, 379
641961
1 237746
1 214
257130269
207257185238
17, 6303 690
149 725144,' 392191, 507
63 8186, 971124, 44271, 345
1904,228
1,405252704449
6261,318
921
100 7117.767.0
10, 6621,3809,984
14, 025
00
07
11
0. 0244
27.00
.01809.97
14, 118578, 108
976, 634460, 737
34 0457. 37030, 746
391523
1 236845
1, 137
313152291
170277150204
17, 9141,872
128, 957112, 947143, 304
47.9160, 812126, 53174, 099
1404,210
1,520215810495
6821,782
217
100 2135. 682.2
«10, 125«1, 535
« 10, 554•14. 186
00
124
* New series. For earlier data see p. 18 of the January 1934 issue, United States Steel Corporation shipments, and p. 20 of the December 1932 issue for tin and terneplate.Current oil-burner series available only back to January 1933 are based on reports from 149 concerns; see p. 48 of the May 1934 issue for 1933 data.
t Revised series. Data on air-conditioning machinery, oil burners revised starting January 1933; see footnote on p. 48, April 1935 issue. The revisions for 1933 willbe shown in a subsequent issue.
A Revised data on steel furniture shelving for years 1932, 1933, and 1934 will be shown in a subsequent issue.

52 SURVEY OF CURRENT BUSINESS September 1935
Monthly statistics through December 1931,together with explanatory footnotes and refer-ences to the sources of the data, may be foundin the 1932 Annual Supplement to the Survey
1935
July
1934
July August Septem-ber October Novem-
berDecem-
ber
1935
January Febru-ary March April May June
METALS AND MANUFACTURES—Continued
MACHINERY AND APPARATUS— Con.
Fuel equipment— Continued.Stokers, mechanical, new orders: 1
Class 1, residential number-.Class 2, apartment and small commer-
cial num. ber_ _Class 3, general commercial and small
commercial heaters number. _Class 4, large commercial:
NumberHorsepower
Machine tools: AOrders:
New* avg. mo. shipments 1926= 100. _Pumps:
Domestic, water, shipments: 1Pitcher, hand, and windmill units..Power, horizontal type units--
Measuring and dispensing, shipments:Gasoline:
Hand operated ..units..Power _ units
Oil, grease, and other:Hand operated -- units-Power - units. .
Steam, power, and centrifugal:Orders:
New -- __thous. of dol. .Water-softening apparatus, ship-
mentsl __units._Water systems, shipments 1 1 units..Woodworking machinery:
Orders:Canceled thous. of doL.New thous. of doL.Unfilled, end of month thous. of doL.
Shipments:Quantity machinesValue thous. of dol..
NONFERROUS METALS ANDPRODUCTS
MetalsAluminum:
Imports bauxite# long tonsPrice, scrap, cast ( N Y ) dol. per Ib
Babbitt metal: Production.-.thous. of lb._For own use thous of IbSales thous. of lb._
Copper:Exports, refined§ * short tonsImports, total §# . short tons._
Ore and blister short tonsPrice, electrolytic (N. Y.) dol. per lb._
Lead:Ore:
Receipts in U. S. ore short tons-.Shipments, Joplin district.. .short tons..
Refined:Imports^ short tons..Price, pig, desilverized (N. Y.)
dol. per lb._Production short tonsShipments, reported short tonsStocks, end of month-. short tons
Tin:Consumption in manufacture of tin and
terneplate*- ._. long tons-Deliveries long tons.-Irnports, bars, blocks, etc.# long tons..Price, straits (N. Y.) do!, per l b _ _Stocks, end of month:
World, visible supply ..longtons _United States long tons
Zinc:Ore, Joplin district:
Shipments ..short tonsStocks, end of month short tons
Price, slab, prime, western (St. Louis)dol. per lb._
Production, total (primary) §.. short tons..Retorts in operation, end of mo -.number. .Shipments, total § short tons..
Domestic! short tons..Stocks, refinery, end of month §_short tons._
Conduit, nonmetallic, shipmentsthous. of f t_
Delinquent accounts, electrical trade. (SeeDomestic trade.)
2,868
190
96
19943, 294
119.8
33, 7341,004
6395, 757
7, 048668
747
49310, 827
5400515
177322
18, 2721, 1382, 199
5491,650
27, 07926, 19724, 967.0778
25, 8633,437
2,181
.041230, 48834, 575
230,915
2,6105,2904,179.5229
13, 1623,227
28, 29623, 529
.043335, 05533, 88432, 24132, 241
115, 723
1,270
141
78
20044, 100
34.7
36, 771971
4883,193
5,242488
541
3047,056
2252297
127186
13, 249. 09381, 989
5531, 435
25, 32414, 78014, 724.0878
22, 3041,518
1,719
. 037727, 35429 479
240, 595
1,2403,5754,900. 5192
16,3136,461
11, 82013, 368
.043224, 75630, 32426, 96626, 96697, 462
1,426
2,678
269
133
24143, 893
41.4
39, 552910
6202,630
5,092614
580
3448,204
5262312
148239
12, 985.09071,856
4571,400
24, 27916, 56515 048.0878
26, 0802,238
1,587
.037522, 99933 606
234, 312
1,7804, 0452,826.5195
15, 4944,968
27, 68616 992
.042826, 16930, 44221,66321, 663
101, 968
1,575
4,636
429
188
28741,987
36,2
26, 022696
5381,867
4,860614
637
3835,270
1172241
199242
14 463.08881,653
3801,273
24, 47612, 23610 8P5.0878
26, 7133,901
2,055
. 036927 07036 018
230 219
1,3203,8503,231.5149
15 3864 243
31,78221 290
.040526,51531,35221,91321,913
106, 570
1 609
5,077
458
177
29246, 623
43.9
25, 127732
6112,240
5,942766
663
4405,574
4222228
152227
16 749.09231,808
4441,364
29, 78422, 81719 131.0878
25, 2181,183
2,726
.036531 24335 943
229 859
1 4402,9253,148.5093
16 4754 998
21, 20317 337
.038334, 52731,96430, 29430, 294
110,803
1,692
2,761
265
142
20539, 767
52.4
21, 702545
5632,306
5,591422
615
3215,570
4243249
114214
14 1301049
1,726398
1,327
?8 67518, 48617 286.0878
23,2111,792
797
. 035729 75531 762
232 934
1 2904,8453, 859.5122
15 0944 048
23 06320 574
.037334, 97732, 79329, 92829, 875
115,852
1 810
2,125
210
90
16728, 199
66.1
31, 151541
4191,794
4,490339
630
3504,632
4244247
114236
12 587. 10972,164
5411,622
23, 64815, 15213 922.0878
25, 5634,767
851
. 036032 50034 680
235 457
1,4004,5301,478.5087
13, 6982 638
36, 82717 600
.037135, 98132, 94432, 00332, 003
119, 830
1, 142
1,241
147
61
13924, 339
65.5
36, 482615
3662,501
6,069485
898
4206,363
1312313
131241
19, 211. 12512,401
4081,993
22, 73915, 11013, 834.0878
27, 6444,536
3,002
.036926, 35033 695
229, 675
2, 1004,6004,023.5087
14, 6942, 581
26, 25715 263
.037335, 21832, 65835, 53835. 538
117, 685
1,895
1,113
107
48
10521, 164
53.0
36, 433690
4453,002
5,133442
777
3956,679
10302340
167267
7,191.12252,139
4611,678
24, 86922,91322, 129.0878
25, 5101,981
1,464
.035325, 10332 523
224, 638
2,4503,9055,196.4996
19,6523,571
32, 26417, 649
.037133, 49433, 21034, 90334, 870
116, 276
1,583
956
84
37
«105°23, 848
62.3
30, 601788
6713,651
4,503607
897
5097,531
4434441
151304
10, 716.12132,281
5351,746
26, 39320, 88419, 546. 0878
25, 8924,229
443
.035830,11828, 973
228, 580
3,1005,4958,612.4691
19, 4164,531
36, 02621, 983
.038936, 66735, 19641, 13741, 137
111,806
2,139
1,046
83
33
12032, 241
65.6
35, 432726
6444,874
6.753901
798
55210, 799
13311426
168318
18,010.12272,296
5201,776
27, 44616, 73415,626.0878
27, 2833,452
477
.036929, 85740, 922
220, 043
3,2605, 8255,234.5010
16, 6144,295
28, 75126, 552
.040335, 33433, 71938, 46038, 457
108, 680
2,605
1,706
107
41
13132, 548
73.3
36, 964879
7285,120
8, 257719
676
59211,685
12286451
157249
17, 663.12382, 245
4391,806
16, 80516, 83716, 070. 0878
24, 3021,157
1,430
.039633, 20232, 341
225, 057
3,1003,9505,224.5110
16,7184,930
15, 20425, 938
.042234, 59732, 38935, 65235, 629
107, 625
2,252
«2, 432
'153
55
"181°34, 821
91.1
29, 859908
6724, 451
7,433651
538
53510, 989
5284463
185268
16, 670.11462,167
6011,565
27, 25216, 49215, 754.0863
22, 952889
771
. 040229, 33226, 978
231, 077
2,2804,6155,320.5107
14, 2755,467
23, 01323, 725
.043034, 67733, 83629, 39329, 393
112, 909
1,841
A Series covering shipments and unfilled orders temporarily discontinued.* New series; for earlier data, see p. 20 of the December 1932 issue, tin and terneplate; p. 20 of the July 1934 issue for machine tools (incl. forging equipment),t Present series on water systems now cover 52 companies.• Data on exports revised for 1933; see p. 20 of the September 1934 issue.§ Data for 1932 revised; for revisions see p. 48 of the June 1933 issue, exports of refined and total imports of copper. For 1933 revisions on zinc, see p. 49 of the January
1934 issue; for 1934 revisions see p. 49 of the February 1935 issue.# See footnote on p. 37 of this issue. Data for 1933 revised; see p. 20 of the October 1934 issue.1 Revised series on domestic pumps and water systems starting January 1934; see p. 49 of the April 1935 issue; mechanical stokers, see p. 48 of the April 1935 issue,
New series on water-softening apparatus revised starting January 1933; revisions for 1933 will be shown in a subsequent issue.

September 1935 SURVEY OF CURRENT BUSINESS 53
Monthly statistics through December 1931,together with explanatory footnotes and refer-ences to the sources of the data, may be foundin the 1932 Annual Supplement to the Survey
1935
July
1934
July August Septem-ber October Novem-
berDecem-
ber
1935
January Febru-ary March April May June
METALS AND MANUFACTURES—Continued
NONFEBROUS METALS ANDPRODUCTS— Continued
Electrical Equipment
Furnaces, electric, new orders kilowatts..Electrical goods, new ordersf (quarterly)
thous. of dol._Laminated phenolic products, shipments
dollars.. _Mica, manufactured:
Orders, unfilled, end of monththous. of dol. .
Shipments thous. of doL.Motors (direct current):
Billings (shipments) dollarsOrders, new dollars. _
Panel boards and cabinets, shipmentsthous. of dol _
Porcelain, electrical, shipments:Special dollars. _Standard . ._ dollars
Power cables, shipments thous. of f t _ .Power switching equipment, new orders:
Indoor . __ dollarsOutdoor. dollars
Reflectors, industrial, sales units..Refrigerators, household, sales* numberVacuum cleaners, shipments:
Floor cleaners number..Hand-type cleaners* number
Vulcanized fiber:Consumption thous of IbShipments thous. of dol. _
Welding sets, new orders:Multiple operator unitsSingle operator _ . units
Miscellaneous Products
Brass and bronze (ingots):0
Shipments and deliveries net tons—Brass, plumbing:
Shipments* . _ number of piecesBrass sheets, wholesale price, milLdol. per lb._Copper, wire cloth:
Orders:New thous. of sq. ft..Unfilled, end of month__thous. of sq. f t —
Production thous of sq. ft..Shipments thous. of sq. ft..Stocks, end of month thous of sq. ft..
6,704
740, 922
77117
64, 79330 284
355
65,068
56,90613 950
1 579344
4,507
.136
441509358375787
479
667, 198
57106
260, 355207, 654
211
53, 52322, 383
337
22, 920125, 83844, 666
120, 846
40, 06512 025
1 839316
2292
4,317
693, 979.145
282423281300718
1,150
695, 382
4699
297, 734243, 700
328
49, 37124 691
470
45, 045107 43750, 74679, 195
50,21118 097
1 552329
1241
3,757
707, 156.145
369393382380696
1,163
100, 334
561, 273
6784
209, 308242, 528
207
39, 35123, 599
220
36, 728113 00248, 25639, 149
63, 93621, 758
1 333270
7223
3, 260
708, 694.145
292407331273747
1, 519
585, 565
62106
262, 947306, 879
257
56, 09927 263
277
35, 32296 64656, 02129, 567
67,41420 384
1 306315
9
371
4,106
960, 463.145
417441357371735
3,284
528, 025
64116
271, 758322,851
233
49, 07327, 585
223
37, 44291 90853, 25528, 718
68, 86621 838
1 053267
5273
3,919
849, 415.144
337428333326742
984
118, 397
604, 610
103114
276, 173468, 192
227
45, 18920 723
380
27, 85572 97448, 67871,477
71, 30723 920
990270
3368
3,688
758, 548.143
329479317281743
2,844
698, 402
108163
285, 191396, 301
218
47, 77134 649
320
30, 21478 99361, 34497, 421
60, 18018 744
1 381434
1347
5,338
997, 797.143
404411393435694
2,212
750, 943
105154
335, 876504, 332
192
48, 03134, 590
303
29, 08072 42551,956
121, 636
75, 58222, 872
1,431400
1277
4,959
933, 266.143
369462374357706
2,096
121,814
845, 020
99164
360, 513428, 379
239
58, 09324, 353
302
46, 22081,57054, 746
213, 464
90, 69329, 231
1, 835430
3487
5,014
1,045,820.143
404448417377714
2,218
888, 705
100160
464, 835476, 841
262
58, 57524, 561
448
54, 44188, 52156, 038
266, 931
79, 33031, 219
1, 819425
1497
5,698
1,061,366.143
351467383367742
1,586
816, 314
150166
401, 708433, 141
259
68, 47327, 898
374
35, 308161,63466, 466
244, 602
73, 08627, 321
1,871434
0413
4,620
1,000,624.143
398443424373797
783
134, 586
643, 770
106158
358, 543348, 349
258
62, 88233, 566
542
30, 180« 98, 066
62, 608« 161, 525
58, 70122, 521
1,716363
7324
4,111
993, 654.143
411472376375801
PAPER AND PRINTING
WOOD PULP
Consumption and shipments* short tonsGround wood* _. .short tons..Sulphate* short tonsSulphite total* short tons..
Bleached* .short tons..Unbleached* short tons..
Soda* short tonsDamaged, off-quality & misc'l*
short tonsProduction, all grades* short tons
Ground wood* short tons..Sulphate* short tons..Sulphite, total* short tons..
Bleached* _ short tonsUnbleached* short tons..
Soda* short tonsDamaged, off-quality & misc'l*
short tonsStocks* short tons
Groundwood* short tonsSulphate* ..short tons..Sulphite, total* short tons
Bleached*... _ short tons..Unbleached* short tons
Soda* short tonsDamaged, off-quality & misc'l*
short tonsImports:
Chemical, totalf# short tonsGround wood# short tons
Price, wholesale, sulphite, unbleacheddol. per 100 lb._
::..:::::
147 95211,715
1.90
311 54389, 47387 922
104, 26763, 98540, 28222 795
7 086298 90382, 24087, 666
100, 30260, 55839, 74422 168
6 587123 94753 8664,492
56 34134, 50221 8395 110
4 138
150 03121 037
2.10
338 87393, 47195 241
117, 66369, 56248, 10123 876
8 622326 20482, 58096, 504
115,71366 73648, 97724 409
6 998111 278
42* Q755,755
54 39131, 67622 7155 643
2 514
142 86417 272
2.10
317 73088, 61090 069
110, 10460, 02950, 07522 339
6 607312 10783, 48290, 869
109, 85563 66046, 19521 899
6 002105 65537 8476,555
54 14235, 30718 8355 202
1 909
139 51219 319
2.10
360 17799, 382
107 943119, 96569, 76750, 19825 498
7 38935Q 93893, 092
108, 551125, 07372, 19052, 88326 446
6 776105 3613l" 5027,163
59 25037, 73021 5206 150
1 296
165 93616 880
2.10
347 71194, 499
102 503119, 47570, 39849, 07724 966
6, 268354 234101, 646102, 168119, 80869, 63150, 17724 556
6 056111 75938 6236,828
59 48436, 96322, 5215 740
1,084
146 06018, 707
2.10
329, 96196, 81591 752
112, 67462, 47650, 19822 552
6, 158333 59499, 90292, 108
113, 73966, 05647, 68321 866
5 979115 67541,7107,174
60, 64840, 54320, 1055 238
905
139 26317, 950
2.10
376 632103, 616111,376128, 09175, 98052, 11126 729
6,819379, 466106, 321110, 520128, 78276, 01952, 76327 002
6 841119 398
44^ 4006,148
62, 67041, 92920, 7415 449
731
179, 30316, 977
2.10
352, 06891, 694
105,279120, 52473, 13747, 38728, 130
6,441352, 83194, 245
104, 581119,81573, 02146, 79427 850
6,340120 16146, 9515,450
61,96141,81320, 1485 169
630
108, 56313, 020
2.10
382, 39197, 743
114, 308134, 32982, 55251, 77729, 476
6,535384, 944106, 126114, 154128, 33076, 92251, 40829 734
6,600122 81455, 4345,296
55, 96236, 18319, 7795 427
695
119, 69013, 973
2.00
378, 73299, 695
111,592132, 77280, 23952, 53328, 959
5,714387, 766109, 066111,981131,79480, 96550, 82929, 038
5,887131 88964, 8055,685
54, 98436, 90918,0755,547
868
86, 36110, 097
1.90
386, 441102, 839113,251134, 94181, 79253, 14929, 317
6,093388, 572110,015113,421130, 84077, 69953, 14128, 276
6,020134 02071,9815,855
50, 83332, 81618, 0674,506
795
165, 39718, 368
1.90
92, 750115,342123, 53076, 95346, 577
7,172
94, 333114, 527115, 47170, 16245, 309
7,194
73, 5955,040
42, 62526, 02516,600
817
155, 40616, 744
1.90
« Revised.f Revised series; for earlier data on new orders for electrical goods see p. 19 of the August 1933 issue; and p. 49 of the June 1933 issue for 1932, for chemical wood pulp
imports.* New series. For earlier data on hand-type vacuum cleaners see p. 20 of the August 1934 issue. For electric refrigerators, see p. 20 of the July 1935 issue. Data prior to
October 1931 not published on brass, plumbing fixtures. Wood pulp figures based on reports to the Pulp Executive Authority by 172 mills, representing 91 percent of thetotal U. S. pulp industry. Figures available beginning with January 1934. Data not exactly comparable with figures previously shown. See footnote on p. 56 of theApril 1935 issue for the complete 1934 wood-pulp figures.
# See footnote on p. 37 of this issue. Data for 1933 revised; see p. 20 of the October 1934 issue.• Beginning with January 1934 figures have been compiled by the Code Authority of the Ingot Brass and Bronze Industry. The figures are more complete than those on
deliveries previously shown. Shipments of the concerns formerly reporting contribute about 80-85 percent of the total for the present series.

54 SURVEY OF CURRENT BUSINESS September 1935
Monthly statistics through December 1931,together with explanatory footnotes and refer-ences to the sources of the data, may be foundin the 1932 Annual Supplement to the Survey
1935
July
1934
July August Septem-ber October Novem-
berDecem-
ber
1935
January Febru-ary March April May June
PAPER AND PRINTING — Continued
PAPER tTotal paper:*f
Paper, including newsprint and paperboard:Production short tons-.
Paper, excluding newsprint and paperboard:
Orders, new short tonsProduction! short tonsShipmentst short tons..
Book paper:*Coated paper:
Orders new short tonsOrders, unfilled short tons .Production short tons..
Percent of potential capacityShipments short tons._Stocks end of month short tons
Uncoated paper:Orders, new short tons.Orders unfilled short tonsProduction short tons..
Percent of potential capacity.Shipments - short tons_.Stocks, end of month short tons.-
Newsprint:Canada:
Exports short tonsProduction short tons._Shipments from mills short tons..Stocks, at mills, end of month
United States: short tons"Consumption by publishers
short tons. .Imports?? short tons.-Price, rolls, contract, destination, N.
Y. base . _.dol. per short ton _Production, total. _ short tons_.Shipments from mills short tons.-Stocks, end of month:
At mills short tonsAt publishers short tons..In transit to publishers. .short tons__
Paperboard :§Consumption, waste paperf.. short tons..Orders:
New short tonsUnfilled, end of month short tons__
Production short tons. _Percent of capacity
Stocks of waste paper, end of month:At mills f - - short tonsIn transit and unshipped purchases
Fine paper" * short tons..Orders, new short tons__Orders, unfilled short tonsProduction short tons__Shipments short tons..Stocks, end of month short tons..
Wrapping paper: *Orders, new short tonsOrders unfilled short tonsProduction short tonsShipments shor t tons. _Stocks end of month ^hort tons
PAPER PRODUCTSAbrasive paper and cloth, shipments:
Domestic i earnsForeign. ... . reams
Paperboard shipping boxes:Shipments, total _ mills, of sq. ft
: Corrugated* .mills, of sq. ft..Solid fiber* mills, of sq. ft
PRINTINGBlank forms, new orders thous. of sets..Book publication, total-number of editions. _
New books number of editionsNew editions number of editions
Operations (productive capacity) 1923 — 100Sales books:
Orders, new thous. of books. _Shipments thous. of books_.
18,4648,798
19,33555.8
19, 44117, 194
78, 19029, 86486, 121
63.284, 99670,154
219,461234, 266226, 445
65, 705
153,811190,872
40.0073, 10871,070
18,721223,36429, 220
219,116
259,48678,241
260, 20761.4
235, 181
47,039
61,1167,364
2,0241,780
244
500403
97
12, 72812, 677
588, 723
298, 372310, 615305, 722
14, 0544, 739
13, 84241.8
14, 25313, 949
64, 69625, 88269, 619
41.770, 65454, 624
212, 845208, 238199, 926
« 55, 133
150, 500197, 227
40.0076, 18470,097
30,180253, 489
28, 202
224, 874
200, 27873, 256
201, 92452.6
230, 298
27, 726
21,5146, 277
20, 90421, 49450, 431
98, 62055, 904
103, 667101, 02498, 192
46, 0508,100
1,5761,371
205
63, 1334853869971
11,42211,357
707, 699
358, 523380, 529382, 723
17, 1135,057
17, 65048.1
17, 57014, 429
73, 99723, 19483, 066
52.382, 46357, 633
183, 930216, 164209, 938
61, 359
145, 095171, 390
40.0080, 90490,698
20,526270, 090
27, 670
208, 332
246, 18771, 523
246, 26658.7
232,819
24, 87726, 528
6, 74427, 23028, 59149, 326
128, 44150, 360
134, 136135,34496, 704
48, 5288, 216
1,7791,545
234
69, 9375524579570
11,12913,010
637, 033
331, 091329, 487329, 676
14, 2673,757
15, 74847.8
16, 08914, 279
74, 02225, 23673, 243
53.677, 00354, 615
190, 794196, 172195, 320
61/903
151,900159, 944
40. 0074, 12071,337
23,284241, 89342, 818
200, 164
228, 80472, 930
233, 42661.4
241, 56C
26, 61823, 3886, 437
23, 92823, 75349, 765
112,05251,872
111,076110,92797, 041
48, 9866, 990
1,7571,521
236
76, 89585271214078
11,79910, 793
762, 609
401, 767418, 368410, 067
18, 4003,722
19, 54352.8
18, 75015, 125
77, 42624, 26487, 394
59.785, 22155, 297
204, 904235, 021228, 921
67, 994
168, 372201, 146
40.0080, 56281, 229
22,679236, 73433,717
230, 695
255, 74468, 756
263, 67963.9
231, 094
33, 005
30, 5586,213
32, 40031, 60648, 548
152, 89456, 733
151,019148, 22395, 986
52, 3925, 998
1,9431,696
247
82, 10377165311878
14, 60512,924
658, 166
335, 974355, 582341,866
16, 5743, 912
17, 43849.8
17,81714, 812
72, 71123,22679, 936
59.075, 62758, 268
221, 553240, 869262, 206
46, 488
172, 287194, 392
40.0074,85179, 129
18,043244, 38835, 391
196, 461
218, 98062, 352
227, 73357.8
226, 941
27, 76424, 366
6, 88624, 73724, 52248, 800
116,42351, 005
126, 441124, 17599,616
46, 6358,121
1,6341,442
193
83,11872761211580
11,56411,399
618, 522
333, 152338, 805325, 579
15, 0314,113
15, 53048.1
15,41713, 396
70, 09526, 64674, 427
56.774, 72557, 715
245, 136239, 544254, 657
30, 366
165, 496222, 897
40.0079, 77786,495
12,312277, 125
46, 237
168, 375
201, 12165, 723
199, 94054.2
223, 692
20, 00023, 799
7, 46025, 26322, 19051, 804
119,12560, 937
120, 246111,816104, 971
41,5365,220
1,4921, 323
169
76, 2391,080
84723381
11,23311,590
759, 837
432, 518417, 235422, 470
19, 7684,815
19, 61653.1
20, 15111,721
86, 89931, 56488, 878
61.588, 40059, 061
184, 243201, 959180, 026
51, 932
157, 870160, 973
42.0080, 57675, 678
17, 346201,282
3'5, 622
210,812
273, 15180, 987
262, 02662.9
210, 520
35, 073
35, 4489,648
32.91734, 85947,913
163, 19870, 219
147, 698150, 147103, 089
58, 2876,804
« 1, 8081,615
193
83, 930518456
6277
11, 13011,818
704, 580
371, 666381, 89S382, 714
19, 2048,056
19, 16258.2
19, 35114, 406
77, 57128, 00686, 989
68.787, 03257, 874
146, 697180, 305160, 859
71, 364
169, 816138, 847
40.0070, 81269, 622
18, 317240, 10134, 214
211,560
252, 57884, 341
251, 87068.7
214, 069
39, 726
28, 5209,374
28, 69227, 87749, 060
128, 97165, 517
135, 078134, 484100, 203
59, 0715,934
« 1, 6381,464
175
70, 4016285636580
11,68910, 737
752, 875
390, 872403, 577398, 191
20, 9449,117
21, 48261.4
21,61413, 582
87, 82130, 42696,411
69.994, 94758, 583
206, 492205, 682198, 574
78, 396
171,139181, 597
40.0073, 52874, 665
17, 647210, 07232, 725
231, 584
268, 36079, 049
275. 770°69.1
207, 987
34, 17029, 4419,890
30, 79830, 36551,959
134, 95467, 271
139, 857137, 9G9101, 503
69. 4777,465
» 1, 886« 1, 667
218
78, 9721,004
78422080
12, 45611.361
731, 046
376, 518395, 304384, 542
20, 7339,106
21, 75862.0
21, 21511,870
87, 28230, 97596, 852
69.395, 23760, 919
158, 924222, 235236, 905
63, 553
106, 122188, 700
40. 0074, 89177, 102
15, 683203, 67233, 268
217, 300
255, 73079. 296
2flO, 85164.8
214, 680
30, 23325, 4219,913
28, 92227, 38950, 407
118,85860, 867
132, 986127, 543106, 385
69, 1736, 851
« 1,821« 1,617
«204
83, 393713568150
77
11,33712, 097
776,310
424 122429,486415, 264
20,3119,794
20,75658.8
19, 51315,810
81,32027, 80693, 3;58
69.°987,81563, 320
239, 881242, 693251,979
55,211
201.970227, 330
40. 0084, 36184,019
"16,142203, 35337, 342
219, 767
259, 99580, 367
262, 46362.7
222, 519
33. 481
35, 5849, 902
36, 89735,17451, 885
147, 15362, 098
148, 9S4148, 493105, 337
50, 7745,442
« 1,948« 1,741
"207
89, 49162444717780
11,73211,906
15, 8359,118
18, 26456.9
17,21516, 861
72, 22226, 75482, 098
66.778, 74066,352
227,215232, 020228, 196
57,771
161,884202, 878
40.00« 77,319a 77, 183
16,406213,07129,914
213, 523
218, 65678. 020
256. 66566.5
230, 365
32, 864
61,2948,538
1,8471,640
206
73, 78067449517978
12, 22111,672
0 Revised.f Revised series. Data for period January 1933-January 1934 inclusive on consumption and stocks of waste paper at mills will be shown in a subsequent issue. Data
on total paper for 1934 revised. Revisions for months not shown above will appear in the September 1935 issue.§ The Bureau of the Census has changed the title of the "Boxboard" report to " Paperboard" since data actually cover all board of .0012 of an inch or more in thickness
reported by the cooperating manufacturers. Figures given on production and new and unfilled orders are for 94 identical manufacturers; and consumption and stocks ofwaste paper for 82 manufacturers. Estimated coverage is given in general footnote below.
* New series. New series on paperboard shipping boxes compiled by the Container Code Authority, Chicago, 111., from reports from all members of the industry ofrecord beginning in January 1934. The volume of companies not reporting each month is estimated by tha Code Authority, so as to keep the series comparable. The solidfiber figures are complete as reported. Prior to January 1934 data covering this industry were compiled by the Paper Board Industries Association. See note below for total,book, fine, and wrapping paper.
$The figures on paper (including total, fine, and wrapping) are as reported by the American Paper and Pulp Association, except book paper, the data on which are reportedby the Book Paper Division of the Paper and Pulp Industry; they are not comparable with the data carried in the SURVEY from the American Paper and Pulp Associationthrough December 1933. The present classification of the association differs from that previously used by them, as well as from the Bureau of the Census classification.In addition to the classes shown, the association also reports on printing paper (including uncoated book), boards, paperboard, and newsprint. The first two of theseclassifications are not used in the SURVEY, while the Bureau of the Census report is used for paperboard and the Newsprint Service Bureau's report for newsprint (the latterseries is identical with that reported by the association). The ratio of the production reported by the association, the Newsprint Service Bureau, and the Bureau of theCensus (monthly report on paperboard) to the annual figures reported by the Bureau of the Census for 1934 follow: Total paper, 87.4 percent; fine paper, 76.1 percent; wrap-ping, 109.7 percent (present classification of association is much broader than is Census or earlier association classification); paperboard, 68 percent of all paperboard, but 81percent of the more comparable classifications of container board and boxboard; book paper, uncoated, 95 percent and coated 100 percent (book paper estimates are byassociation since the data cannot be checked with Census data); and newsprint, 97 percent. Figures for the first 5 months of 1934 on book paper are not available. Dataare available for the other series for the months of January to April 1934. These figures will be shown in a subsequent issue.
# See footnote on p. 37 of this issue. Data for 1933 revised. See p. 20 of the October 1934 issue.

September 1935 SURVEY OF CURRENT BUSINESS 55
Monthly statistics through December 1931,together with explanatory footnotes and refer-ences to the sources of the data, may be foundin the 1932 Annual Supplement to the Survey
1935
July
1934
July August Septem-ber October Novem-
berDecem-
ber
1935
January Febru-ary March April May June
RUBBER AND RUBBER PRODUCTS
CRUDE AND SCRAP RUBBER
Crude:Consumption, total long tons..
For tiresjf long tonsImports, total, including latexf# long tons..Price, wholesale, smoked sheets, N. Y.
dol. per lb._Shipments world long tonsStocks, world, end" of inonthf-.-long tons..
Afloat total! \ona tonsFor United States! long tons__
London and Liverpool -long toiis..British Malaya long tons..United States! l°ng tons..
Reclaimed rubber:Consumption long tons.Production long tonsStocks end of month long tons..
Scrap rubber:Consumption by reclaimers long tons__
TIRES AND TUBES J
Pneumatic casings:Production thousands. _Shipments total thousands
Domestic thousands _Stocks end of month thousands
Solid and cushion tires:Production thousands. _Shipments total thousands. _
Domestic thousands..Stocks end of month thousands _
Inner tubes:Production thousandsShipments, total thousands. .
Domestic thousandsStocks end of month thousands
Raw material consumed:Crude rubber. (See Crude rubber.)Fabrics ___tiious. oflb. .
MISCELLANEOUS PRODUCTS
Rubber bands, shipments thous. of lb._Rubber-proofed fabrics, production, total
thous. of yd.Auto fabrics thous. of yd..Raincoat fabrics thous. of yd-.
Rubber flooring, shipments thous. of sq. f t _ _Rubber and canvas footwear: •
Production, total thous. of pairs..Tennis - . thous. of pairs _Waterproof..,. thous. of pairs..
Shipments, total thous. of pairs..Tennis thous. of pairs..Waterproof thous. of pairs. .
Shipments, domestic, total.thous. of pairs. .Tennis thous. of pairs..Waterproof thous. of pairs..
Stocks, total, end of month.thous. of pairs. .Tennis thous. of pairs..Waterproof thous. of pairs. _
Rubber heels:Production thous. of pairs..Shipments, total *.._ thous. of pairs..
Export thous of pairsRepair trade thous. of pairs. _Shoe manufacturers thous. of pairs..
Stocks, end of month thous. of pairs..Rubber soles:
Production thous. of pairs..Shipments, total* thous. of pairs..
Export thous. of pairs..Repair tride thous. of pairsShoe manufacturers thous. of pairs..
Stocks, end of month thous. of pairs..Mechanical rubber goods, shipments:
Total thous. of dolBelting . _ thous. of dolHose thous. of dolOther thous. of dol
33, 109
48, 131
.12171,000
669, 00095, 70049, 018
174, 14185, 000
315, 000
7,1368,421
14, 889
3, 147702
2,4453,7371,5072, 2303, 6671,4902,177
18, 7674,836
13, 931
17, 83617,492
2324,810
12, 44934, 746
3,5993,597
10384
3,2023,875
30, 03522 03342, 674
.14670 000
676, 20096 65445, 869
105, 989106, 448367, 109
7, 0069, 446
22, 035
3,2524,0333,9549,154
18181730
3,4254,1934,1337,812
13, 267
220
3,332526
1,269372
3,587843
2,7444,6111,1743,4364,5941,1703,425
19, 9356,515
13 419
15, 90315, 656
3464,485
10, 82538, 997
3,0823,277
2318
2,9564,933
3 8341 0011 3621 472
30,31222 50932, 700
.15574 000
674, 70297 34940, 278
105, 290107, 607364, 456
7,0668 160
20, 649
3,4274 1794,0918 436
18161533
3 5704,0724 0037 328
13, 724
237
4, 291570
1,827413
5, 1611,0114,1506,5291,5434, 9866,4481,4674,982
18, 5675,983
12 584
18, 60515,493
3394,936
10, 21842, 140
3,6013,602
2382
3, 2184,894
3 923984
1 3991 540
27, 31719 86432, 010
.15488 000
694, 361113 71638, 831
113, 052103, 485364, 108
a 6, 1326 974
20 319
27, 693
2,8483 0872 9938 166
15131334
3 0172 9342 8717*410
12 942
231
4,742568
2 405339
3,918877
3,0416,498
9115, 5876, 436
8575, 579
15, 8586,821
10 037
13,91113, 219
2194,0798, 921
42, 652
2, 9523,107
2455
2,6504,718
3 187846
1 1381 203
28 52620 48929, 240
.13968 000
680, 61698 86838, 247
121,020101, 349359, 379
7,0978 143
21 079
3,1882 9192*8348 397
17151435
3 1232 6092 5437*907
13 169
330
5,279804
2 813386
5,0781 2013,8775, 525
7904,7355, 486
7584,727
15, 2486,0859 163
14, 43716, 889
3775,238
11,27340, 016
3,2393,297
13584
2,6994,656
3 715996
1 3761 343
31, 35823 46737,212
.13076 000
684, 40899 83738, 625
127, 88896, 556
358 000
6,4927 268
20 015
3,2413 0953*0268 516
16171633
3 0742 6842 6308* 247
15, 382
209
3,419405
1, 552375
4,9921 1653,8274, 727
5754,1524,653
5284, 125
15,5136,6758 838
13, 92215, 746
3264,175
11, 24438, 040
3,5413,617
3585
3,0304,528
3 094' 707
1 0781* 310
32 99625 13718, 171
.12999 000
705, 975124 97647, 644
134 92791, 072
355 000
7,0347 353
18 740
25, 959
3 6653 0152 9219 171
16151435
3 3982 7652 6898 904
15, 627
174
3 334744884411
4,8701 5703,3005, 3171,2584,0605,2731, 2404,033
15, 1776,9998 178
13, 42814, 075
3593,435
10, 28137, 751
3,4003,592
3530
3, 0594,329
3 601746
1 0011*854
42 86432 57540, 523
.13675 000
698* 153113 00042 066
148 33798, 471
338 345
9,58310 46517 743
4 4333 5533 469
10 086
22202032
4 1313 6103 5399*332
19 608
230
3 776286
1 141268
5,6682 6682,9996,3792,7783,6016,2502,6613,589
14, 4666,8907 576
14, 35116, 630
2965, 667
10, 66735,811
3,7053,696
9650
3,0374,311
4 515871
1 4302* 215
38 86829 67147, 844
.12974 000
686, 195103 00042 969
155 72794 695
332 773
8, 17810 07215 765
4 2513 1893 112
11 184
18161632
4 046
3*2613 200
10* 152
18 059
228
3,661287
1,122286
5,3833 0832.3004, 7523,2841,4684,6193,1651,454
15, 0876,6908 397
16, 33415, 260
2214, 777
10, 26236, 950
3,2433,601
7704
2,8903,948
4 261775
1 3722 115
38 99728 83246, 640
.11467 000
678,80992 00044, 485
162 01291 069
333 728
8,18310 54917 335
32, 709
4 2154 Q734 000
11 325
18202031
3 9994* 0433 980
10 094
7 349
276
4,071256
1 307366
5,8633 6732,1905,0874,0231,0645, 0413,9971,044
15, 8546,3319 523
16, 25616, 926
4395,102
11,38536, 349
3,3573,410
7563
2,8403,904
5 4631 0061 8422 615
40 91331* 82541, 456
.11570 000
677, 00697 40037 651
165 06486 723
328 118
9 21010 31517 032
4 3764 9894 908
10 673
20222131
4 1324 3204 °5r->9 864
8 01 1
285
4 063305
1 3C)8456
5,4153 1882, 2264,2103, 276
9344,1703, 243
92717, 0566, 241
10 815
17, 17318, 704
2417, 405
11,11834, 869
3,5253, 543
7631
2, £053,897
5 7111 3941 9492 368
37 827a 28 898
30, 705
.12076 000
677, 569103 20044 375
167 74591 345
311 000
8 44810 22316 341
4 0503 9453 850
10 797
23212034
3 7753 3478 287
10 296
7 736
293
4 030292
1 716486
4,8572 3762, 4813, 6882, 5791,1093, 6232, 5211,102
18, 2026, 026
12 176
20, 26219, 658
3367,471
11, 85035, 602
3,6073,701
6505
3,1903,733
4 9441 1091 6882 147
33 32725 96132, 182
.12673 000
« 669, 72599 20055 581
171 30388 000
315 000
7 3178 5^0
15 780
3 7934 1344 061
10 433
16201930
3 3763 9043 8409* 748
7 Q55
227
303
400
4,1511 3912, 7603,0021,7741,2272, 9641,7421,222
19, 3585, 642
13 716
19, 10518, 694
3565, 578
12, 76034, 250
3,5673,509
8380
3, 1213,887
4 4221 0261 3832 012
• Revised.J Data for 1934 are estimated to represent approximately 97 percent of the industry; data are estimated to cover 79 percent of the industry for 1929-33, inclusive, and 75
to H percent prior to 1929.# See footnote on p. 37 of this issue. Data for 1933 revised. See p. 20 of the October 1934 issue.• In October 1933, 4 new companies were included in the report and 1 additional company in January 1934. Since that month, the coverage of the industry is 100 per-
cent. For preceding periods the coverage varied but was about 80 percent. Overlapping figures are available for October 1933. See the October 1934 issue for October 1933data for the smaller number of firms.
* New series. Earlier data not published on rubber heels and soles prior to December 1932.! Revised series. Data on consumption of rubber for tires revised for 1932, 1933, and 1934. See p. 51 of the August 1934 issue. Revised data from September 1930-
December 1934—rubber world stocks, world afloat, and afloat to the United States appear on p. 20 of the July 1935 issue; for 1932 revisions for United States stocks, see p. 50of the May 1933 issue. See p. 50 of the June 1933 issue for crude rubber imports.

56 SURVEY OF CURRENT BUSINESS September 1935
Monthly statistics through December 1931,together with explanatory footnotes and refer-ences to the sources of the data, may be foundin the 1932 Annual Supplement to the Survey
1935
July
1934
July August Septem-ber October Novem-
berDecem-
ber
1935
January Febru-ary March April May June
STONE, CLAY, AND GLASS PRODUCTS
BRICK
Common brick:Price, wholesale, red, N. Y.
dol. per thous.-Shipments* thous of brickStocks* thous of brick
Face brick (average per plant):Orders, unfilled, end of mo.
thous. of brick..Production (machine)* thous. of brick--Shipments thous. of brick--Stocks, end of month! thous. of brick. .
Sand-lime brick:Orders, unfilled, end of mo.
thous. of brick. _Production thous. of brick--Shipments by raiL— __thous. of brick--Shipments by truck thous. of brickStocks, end of month -thous. of brick. _
Vitrified paving brick:Shipments* thous. of brickStocks* _ thous. of brick. _
PORTLAND CEMENT
Price, wholesale, composite dol. per bbl._Production thous of bbl
Percent of capacityShipments . thous. of bbl__Stocks, finished, end of month .thous. of bbl._Stocks, clinker, end of month. thous. of bbl._
GLASSWARE, ETC.
Glass containers: #Production thous. of gross
Percent of capacityShipments thous. of gross. .Stocks, end of month thous of °ross
Illuminating glassware:*Orders:
New and contract number of turns. _Unfilled, end of month
number of turns. .Production number of turnsShipments:
Total .number of turnsPercent of full operation _
Stocks, end of month number of turns. .Plate glass, polished, production t
thous. of sq. ft..
GYPSUM*
Crude (quarterly):Imports short tonsProduction short tonsShipments (uncalcined) short tons
Calcined (quarterly):Production short tons
Calcined products (quarterly):Shipments:
Board plaster (and lath) thous ofsq ftBoard, wall thous. ofsq. f t ._Cement, Keenes.. short tonsPlasters, neat, wood fiber, sanded, gag-
ing, finish, etc short tons..For pottery, terra cotta, plate glass, mix-
ing plants, etc short tonsTile, partition thous of sq ft
TERRA COTTA
Orders, new:Quantity _ _ short tonsValue thous. of dol_.
TILE
Hollow building tile:*Shipments .. short tonsStocks " short tons
9.40
337350313
2,107
1,1502,077
2131,9011,877
1.6678 0^1
35.77,813
23, 2916, 845
3, 57962.4
3, 4558,183
1,743
2,8281,555
1, 56761.0
5,053
13, 909
836104
10.5061 101
420 716
503179181
2,300
1551,219
45848
1,351
9,96078, 047
1.6508, 14435.7
7,89821, 8526,588
3, 11556 5
2,9917,616
1,453
2,2051 062
], 10543.1
4,610
7,242
96483
37,513385 898
10.5068 083
422, 641
405131208
2,333
1481,137
451, 0451,959
10, 33977, 396
1.6507,84234.5
8,24921, 4246, 332
3, 16953 2
3, 0837,666
1,423
2,2161 453
1,39049.9
4,649
7,450
1 38284
44, 272378 533
10.5062, 405
417, 025
369158172
2,292
1401,164
421,1212,091
8,77377, 701
1.6507,68034.8
7,38821, 7345,975
2,85954 0
3, 2607,231
1,411
2,2351, 188
1,42755.6
4,457
6, 738
88 408450 364145, 404
257, 048
32 60144,6123,501
188, 314
24, 6811 721
51550
38, 068369 641
10.5077, 698
412, 589
351203217
2,217
175920
83889
1,877
6,83177, 416
1.6506,67529.3
8, 43919, 9726,055
3,13252 6
3,1067,210
2,184
2,5401 844
1,88073.3
4,432
7,512
76165
38, 139367, 166
10.5064, 508
419, 833
322218143
2,303
8501,651
5521,1052,715
4,99376, 156
1.6505,779
26.25, 674
20, 0786,213
2,85551 8
2, 5377,481
1,990
2,4562 022
1,99977.9
4,475
6,587
53941
35, 643363 347
10.5048 188
412, 449
233120115
2,306
14019932
5311,561
1, 80677, 866
1.6504,447
19.53, 104
21, 4606,137
2,92253 0
2,4307,871
1,681
2,3051 877
1,85172.1
4,525
8,390
101 805334 31899, 956
234, 735
32 90449[ 7932,866
162, 020
23, 9851 550
1,09082
28, 817370, 116
10.5038, 281
400, 529
2546464
2,310
100175
0350
1,317
1,60179,711
1.6503,20214.1
2,84621,8476,318
2,93549 3
2,6797,990
1,774
2, 2521 638
1,69165.9
4,487
13, 365
96780
25, 795363, 291
10.4438, 291
387, 462
2587197
2,318
10015513
2661,363
1, 16779, 494
1.6503,053
14.92,952
21, 8996, 348
2,63949 9
2,5848,010
1,850
2, 3561 774
1,68565.6
4,624
13, 723
93480
23, 111353, 774
10.0060, 987
363, 458
28995
1382,282
92511520
414811
1, 33877, 039
1. 6584,29918.9
4,87821, 2896,343
2, 94651 4
2, 9637,955
2,115
2,6111 902
1,79169.8
4,795
16, 532
10 730292, 40684, 853
233, 852
29 93751,3622,997
165, 970
29, 1422,302
79566
29, 931350,710
10.00a 76, 646°341, 477
367177229
2,133
850345104343346
3,30780, 358
1. 6676, 1?627.9
6, 19821,2196,122
3, 11354.3
2, 9568,060
2,020
2, 6082,065
1, 92074.8
4,945
16, 999
1,440133
38, 498346, 785
9.63»83, 076
a343, 554
381293255
2,107
8101,821
1251,7541,374
4, 16287, 241
1.6678,22236.1
7,42821,9916,365
3, 40159.3
3,2458,141
1,965
2,6232,022
1,92775. 1
5, 097
14,582
79193
«43, 069"341,432
9.5088, 548
339, 564
342310284
2,078
6001,582
206793
1,860
7, 75389, 638
1.667«8, 725
39.6«7, 632
*23, 033«6, 741
3,29559.8
3, 2768,115
1,919
2,7511,829
1,81470.7
5,119
13, 163
!_
934113
42, 360333, 937
0 Revised.* New series. Earlier data not published on illuminating glassware prior to July 1932 (except production and percent of capacity); for earlier data see p. 20 of the June
1933 issue, face brick, machine production. Series on common and vitrified paving brick and tile beginning January 1934 were shown on p. 20 of the June 1935 issue. Forearlier data on gypsuin see p. 20 of the January 1933 issue.
t Adjusted for degrading and year end physical inventories.f Data on plate glass represent the total output of the industry. Complete figures for the months of 1932 were shown on p. 52 of the March 1933 issue, and for 1933 on
p. 52 of the March 1934 issue.# Series on glass containers are not comparable for 1934 and earlier years due to increase of number of firms reporting to 44. Shipments of the 44 firms for the year of
1933 amounted to 33,056,706, compared with 23,511,963 for the 30 firms reporting a year ago. Comparable statistics on shipments for the companies, now reporting by years,from 1928 to date were as follows (in gross): 1928, 31,943,016; 1929, 33,765,896; 1930, 31,905,933; 1931, 31,413,508; 1932, 26,947,949; and 1933, 33,048,747. Data are not available forthis period on production and stocks, nor are monthly figures on shipments available. It may be noted from the trend of these data that the monthly figures prior to 1934had a downward bias. Basis of estimating capacity was changed in computing the new series. Data beginning January 1934 revised, see p. 52 of the May 1935 issue.

September 1935 SUEVEY OF CUREENT BUSINESS 57
Monthly statistics through December 1931,together with explanatory footnotes and refer-ences to the sources of the data, may be foundin the 1932 Annual Supplement to the Survey
1935
July
1934
July August Septem-ber
TEXTILE
October Novem-ber
Decem-ber
1935
January F^u' March April M ay June
PRODUCTS
CLOTHING
Hosiery:*!Production thous. of dozen pairs. _Shipments thous. of dozen pairsStocks, end of month
thous. of dozen pairs. .Men's and boys' garments cut:
Overcoats - thous. of garments..Separate trousers -thous. of garments--Suits thous. of garments ..
COTTON
Consumption! thous. of balesExports:
Quantity, exclusive of lintersthous. of bales. .
Ginnings (total crop to end of month)thous. of bales..
Imports# thous. of balesPrices:
To producer dol. per IbWholesale, middling, N. Y dol. per lb_.
Production, crop estimate. --thous. of bales. _Receipts into sight^ thous. of bales. -Stocks, end of month:f
Domestic, total mills and warehousesthous. of bales..
Mills thous. of balesWarehouses _ _ thous. of bales..
World visible supply, totaL.thous. of bales. _American cotton thous. of bales
COTTON MANUFACTURES
Cotton yarn:Prices, wholesale:
22/ls, cones (Boston) dol. per lb_.40/ls, southern spinning* dol. per lb_.
Cotton goods:Cotton cloth:
Exports§ thous. of sq.yd-—ImportsJ. thous. of sq.yd-—
Prices, wholesale:Print cloth, 64 x 60 dol. per yd-Sheeting, brown, 4 x 4 (Trion mill)
dol. per yd—Cotton cloth finishing:*
Production:Bleached, plain thous. of yd..Dyed, colors thous. of yd..Dyed, black thous. of yd—Printed thous. of yd..
Stocks:*Bleached and dyed thous. of yd..Printed thous. of yd—
Spindle activity:!Active spindles thousands
Active spindle hours, totalmillions of hours ._
Average per spindle in place hours —Operations percent of capacity
EATON AND SILKRayon:
Deliveries:*Unadjusted 1923-25=100-Adjusted ... 1923-25=1003-mo. moving average of adjusted index
1923-25—100ImportsJ# thous. of IbPrice, wholesale, 150 denier, "A" grade
(N. Y.) dol. per Ib..Stocks, imported, end of month
thous of IbSilk:
D eli veries (consumption) bales _ _Imports, raw t #_ thous. of IbPrices, wholesale:
Raw, Japanese, 13-15, N. Y.dol. per lb._Silk goods, composite dol. per yd__
Stocks, end of month:World visible supply . balesUnited States (warehouses) bales. .
392
277
947
. 119
.122/ll, 798
395
6,529789
6,7394r2782,790
.299
.415
14, 5663,258
.059
.071
89,16478,2546,585
61,842
234,45796,103
22, 312
5,158171
73.5
426560
60
.55
44, 1665,562
1.447.92
199, 50032, 654
6,6746 349
19, 164
360
306
10011
123.129
432
6,7941,2285,5666,9504,737
.308
.435
15, 6471,944
.067
.077
101, 01566, 4725,686
75,833
310, 039109, 756
24, 418
5,152167
74 3
334440
37024
.55
280
32, 0214,719
1.139.92
272, 00066, 268
7 8388 666
18 332
421
253
1,39811
131.134
527
6,9051 0815,8246,6394 532
.315
.435
14, 4562,108
.071
.079
113, 20973, 6515,738
84, 499
269, 461101, 057
24, 154
5,753186
76 8
307287
31627
.55
275
36, 2474 731
1.133.93
285, 00058, 694
6,9898 078
17, 238
296
454
4,9588
131.131
1 676
8,6731 0577,6167,2105 225
.316
.435
17, 3302,512
.074
.082
111,58173, 4076,162
90, 772
266, 886101, 083
22, 113
3,716120
54 3
308221
28811
.55
276
32, 5996,846
1.125.93
285, 30076, 645
9 5649 791
17, 006
520
616
7,92012
125.125
2 283
10, 5211 1409,3817,9636 037
.312
.435
16, 4232,592
.070
.081
134, 38689, 4207,985
126, 384
277, 030108, 830
25, 095
7,185233
97 1
382357
33629
.55
272
49, 1065 387
1.185.93
277, 80066,479
9 4669 308
17, 159
477
572
9,0308
123.126
1 498
11, 0891 2949 7957,9556 086
.304
.425
16, 8573,517
.066
.078
126, 72687, 6796,693
114, 139
298, 233111, 758
25 051
6,703217
94 0
386429
45325
.55
265
37, 5487 219
1.292.95
275 00076, 502
8 0018 220
16 934
414
504
*9, 17410
124.127
•9 636977
10, 9401 3009 6417,8195 962
309.415
16, 4444,353
.068
.077
128, 89887, 9926,114
107, 379
284, 473107, 585
25 057
6,027195
87 1
488574
5236
.57
264
40 9412 566
1.358.96
272 30065, 934
9 9968 588
18 343
547
466
d 9, 380g
123.127
482
10, 1581 1948 9647,4825 565
306.415
15, 4845,474
.067
.077
145, 390107, 283
6,999120, 203
288, 864100, 008
25 146
7,510244
102 6
553565
50922
.60
263
47 4435 278
1.348.96
258 50048, 516
9 2148 732
18 825
478
390
8
122.126
374
9,5341 1618 3737,1975 132
299.410
15, 8487,727
.065
.076
137, 335104, 987
6,013117, 780
276, 86397, 232
24 925
6,575213
100 2
441387
4109
.60
262
41 7326 516
1.432.96
234 45748, 727
9 6929 768
18 749
481
318
9,47210
115.115
420
8,9021 1177 7856,8814 715
297.414
18, 7137,118
.062
.074
148, 710119, 107
6,797122, 548
291, 48197, 732
24 571
6,663216
92 9
295279
31026
.60
262
44 3475 658
1.327.94
223 54836, 583
9,3929 180
18, 962
463
323
9
117.117
227
8,2631 0617 2026,1244 169
296.415
16, 2855,903
.061
.073
144,429112,883
6,218104, 597
297, 866103, 500
23, 854
6,058197
85 3
274264
32716
.60
262
39, 7574,905
1.391.92
220, 57737, 587
9,2039 124
19, 040
469
279
10
120.123
274
7,539979
6, 5605,5933 720
.305
.415
16, 5395,460
.062
.074
130, 28498, 8106,000
100, 265
297, 776111, 926
23 028
6,095199
83 4
417439
a 3Q312
.55
261
38 3615 545
1.418.92
207 00036, 762
7,1217 513
18, 649
386
345
5
118.119
231
6,961883
6 0764,9983 253
301.415
13, 6573,729
.061
.073
0 90, 4960 73,531
« 5, 5040 70, 381
333, 991115, 255
22 709
5,083167
74 6
"381o 477
49239
.55
261
33 7285 201
1.376.92
190 70042, 018
0 Revised. 6 As of Dec. 13. d As of Jan. 16. « Final estimate. / As of Aug. 1.* New series. Hosiery compiled by the Hosiery Code Authority and estimated to represent 95 percent of the industry. For complete series see p. 19 of this issue. Data
on cotton cloth finishing are from the National Association of Finishers of Textile Fabrics and cover practically all the industry; comparable figures are not available priorto December 1933; the production statistics are prorated from data for 4-week periods; stocks are reported at end of each 4-week period. Data on cotton yarn, southernspinning from January 1933-April 1934 will be shown in a subsequent issue. Rayon deliveries from January 1923-April 1935 were shown on p. 19 of the June 1935 issue.
<S For revisions for crop years 1931-32, 1932-33, and 1933-34, see p. 52 of the October 1933 issue, p. 52 of the September 1933 issue, and p. 53 of the October 1934 issue,respectively.
t For revisions of cotton consumption, domestic stocks, and spindle activity for crop years 1931-32, 1932-33, 1933-34, see p. 20 of the February 1933 issue, pp. 52 and 53of the November 1933 issue, and p. 53 of the October 1934 issue, respectively.
§ For 1932 revisions see p. 53 of the Juna 1933 issue; for 1933 revisions see p. 20 of the September 1934 issue.# See footnote on p. 37 of this issue. Data revised for 1933; see p. 20 of the October 1934 issue.• St9cks at end of 4-week periods through June 16. July figures are averages for July 14 and Aug. 11. August figure as of Sept. 8. Subsequent data at the end of
succeeding 4-week periods.J For 1932 revisions see p. 53 of the June 1933 issue, and for 1933 revisions see p. 20 of the October 1934 issue.
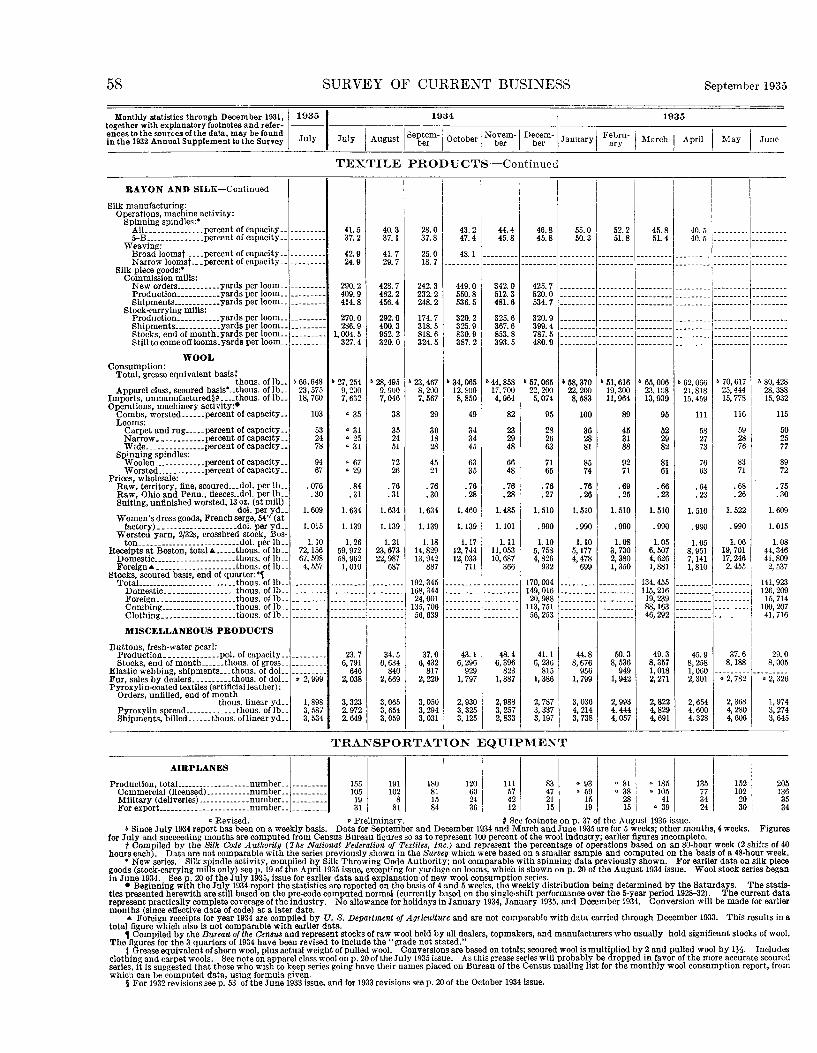
58 SURVEY OF CURRENT BUSINESS September 1935
Monthly statistics through December 1931,together with explanatory footnotes and refer-ences to the sources of the data, may be foundin the 1932 Annual Supplement to the Survey
1935
July
1934
July August Septem-ber October Novem-
berDecem-
ber
1935
January Febru-ary March April May June
TEXTILE PRODUCTS—Continued
EAYON AND SILK— Continued
Silk manufacturing:Operations, machine activity:
Spinning spindles:*All percent of capacity _ _5-B percent of capacity .
Weaving:Broad loomsf percent of capacity--Narrow loomst percent of capacity--
Silk piece goods:*Commission mills:
New orders yards per loom. .Production yards per loom..Shipments ..yards per loom..
Stock-carrying mills:Production _ .yards per loom..Shipments yards per loom..Stocks end of month yards per loom..Still to come off looms yards per loom..
WOOLConsumption:
Total, grease equivalent basistthous. of lb_.
Apparel class, scoured basis*~thous. of lb_.Imports, unmanufactured^ thous. of lb._Operations, machinery activity:*
Combs, worsted percent of capacity-.Looms:
Carpet and rug percent of capacity. _Narrow . percent of capacity. .Wide percent of capacity..
Spinning spindles:Woolen percent of capacity _.Worsted .percent of capacity. .
Prices, wholesale:Raw, territory, fine, scoured- .dol. per lb_.Raw, Ohio and Penn., neeces._dol. per lb_.Suiting, unfinished worsted, 13 oz. (at mill)
dol. per yd..Women's dress goods, French serge, 54" (at
factory) dol. per yd_.Worsted yarn, 2/32s, crossbred stock, Bos-
ton dol. per lb_.Receipts at Boston, total A. thous. of lb_.
Domestic - ..thous. of lbForeign*. thous. of lb-_
Stocks, scoured basis, end of quarter:*^Total .thous. of lb-_
Domestic thous of IbForeign thous. of l b _ _Combing thous. of lb_.Clothing thous of Ib
MISCELLANEOUS PRODUCTS
Buttons, fresh-water pearl:Production . .pet. of capacity. _Stocks end of month thous. of gross
Elastic webbing, shipments thous. of dolFur, sales by dealers thous. of dolPyroxylin-coated textiles (artificial leather) :
Orders, unfilled, end of monththous. linear yd__
Pyroxylin spread thous. of lb__Shipments, billed thous. of linear yd..
& 66, 64823,57518, 760
103
532478
9467
.076.30
1.609
1.015
1.1072, 15667, 5984,557
v 2, 999
1,8983,5873,534
41.537 2
42.924.9
290.2409.9414 8
270.0286.9
1,004 5327.4
" 27, 2549,2007,632
" 35
a 31a 250 31
0 67a 29
.84
.31
1.634
1.139
1.2659, 97258, 9621,010
23.76 791
6462,038
3,3232,9722,649
40.337 1
41.729.7
428.7462.2456 4
292.0400.3952 2320.0
* 28, 4959, 9007,046
38
352451
7226
.76
.31
1.634
1.139
1.2123, 67322, 987
687
34.56 634
8402,669
3,0653,6543,059
28.037 8
25.018.7
242.3232.2248 2
174 7318.5818 6324.5
* 23, 4678, 2007,567
29
301828
4521
.76
.30
1.634
1.139
1.1814, 82913, 942
887
192, 345168, 34424, 001
135, 70656 639
37.06 432
8172,220
3,0503,2943,031
43.247 4
48.1
449.0550.8536 5
320 2325.9830 9387.2
* 34, 06512, 8008,850
49
343445
6335
.76
.28
1.460
1.139
1.1712, 74412, 033
711
43.16 296
9291,797
2,9303,3253,125
44.445 8
342.0512.3481 6
325.6367.6853 8393.5
6 44, 85817, 7004,964
82
232948
6648
.76
.28
1.485
1.101
1.1111,05310, 687
366
48.46,396
8231,887
2,9883,2572,833
46 845 8
425.7520.0534.7
320.9399.4787 5480.9
& 57, 06522, 2005,074
95
282663
7165
.76
.27
1.510
.990
1.105,7584,826
932
170, 004149, 01620, 988
113, 75156, 253
41.16,236
8151,386
2,7873,3373,197
55 050 3
* 58, 37022, 2008,583
100
362881
8574
.76
.26
1.510
.990
1.105,1774,478
699
44.88,676
9561,799
3,0364,2143,738
52 251 8
* 51, 61619, 30011, 964
89
453188
9271
.69
.25
1.510
.990
1.083,7302,3801,350
50.38,536
9491,942
2, 9934,4444,057
45 851 4
b 65, 00623, 10813, 939
95
522982
8161
.66
.23
1.510
.990
1.056,5074,6261,881
134, 455115,21619, 23988, 16346,292
49.38,3571,0182,271
2,8224,8294,691
40 540 5
* 62, 06621,81815, 459
111
582773
7663
.64
.23
1.510
.990
1.058,9517 1411,810
45.98,2581,0602,301
2,6544,6004,328
* 70, 61725, 44415, 778
116
592876
8371
.68
.26
1.522
.990
1.0619, 70117, 2462,455
37.68,188
« 2, 782
2,3684,2804,606
& 80, 42828, 38815, 932
115
502577
8972
.75
.30
1.609
1.015
1.0844, 34641, 8092,537
141, 923126, 20915, 714
100, 20741, 716
29.08,005
« 2, 326
1,9743,2743,645
TRANSPORTATION EQUIPMENT
AIRPLANES
Production, total number .Commercial (licensed) numberMilitary (deliveries) number. _For export— number..
1551051931
191102
881
180811584
120602436
111574212
83472115
a 93« 59
1519
° 81« 38
2815
« 185a 105
41« 39
135773424
1521022030
2051363534
« Revised. *> Preliminary. # See footnote on p. 37 of the August 1935 issue.& Since July 1934 report has been on a weekly basis. Data for September and December 19.34 and March and June 1935 are for 5 weeks; other months, 4 weeks. Figures
for July and succeeding months are computed from Census Bureau figures so as to represent 100 percent of the wool industry; earlier figures incomplete.f Compiled by the Silk Code Authority (lhe National Federation of Textiles, Inc.) and represent the percentage of operations based on an 80-hour week (2 shifts of 40
hours each). Data are not comparable with the series previously shown in the Survey which were based on a smaller sample and computed on the basis of a 48-hour week.* New series. Silk spindle activity, compiled by Silk Throwing Code Authority; not comparable with spinning data previously shown. For earlier data on silk piece
goods (stock-carrying mills only) see p. 19 of the April 1935 issue, excepting for yardage on looms, which is shown on p. 20 of the August 1934 issue. Wool stock series beganin June 1934. See p. 20 of the July 1935, issue for earlier data and explanation of new wool consumption series.
* Beginning with the July 1934 report the statistics are reported on the basis of 4 and 5 weeks, the weekly distribution being determined by the Saturdays. The statis-tics presented herewith are still based on the pre-code computed normal (currently based on the single-shift performance over the 5-year period 1928-32). The current datarepresent practically complete coverage of the industry. No allowance for holidays in January 1934, January 1935, and December 1934. Conversion will be made for earliermonths (since effective date of code) at a later date.
* Foreign receipts for year 1934 are compiled by 17. <S. Department of Agriculture and are not comparable with data carried through December 1933. This results in atotal figure which also is not comparable with earlier data.
f Compiled by the Bureau of the Census and represent stocks of raw wool held by all dealers, topmakers, and manufacturers who usually hold significant stocks of wool.The figures for the 3 quarters of 1934 have been revised to include the "grade not stated."
t Grease equivalent of shorn wool, plus actual weight of pulled wool. Conversions are based on totals; scoured wool is multiplied by 2 and pulled wool by 1H- Includesclothing and carpet wools. See note on apparel class wool on p. 20 of the July 1935 issue. As this grease series will probably be dropped in favor of the more accurate scouredseries, it is suggested that those who wish to keep series going have their names placed on Bureau of the Census mailing list for the monthly wool consumption report, fromwhich can be computed data, using formula given.
§ For 1932 revisions see p. 53 of the June 1933 issue, and for 1933 revisions see p. 20 of the October 1934 issue.

September 1935 SURVEY OF CURRENT BUSINESS 59
Monthly statistics through December 1931,together with explanatory footnotes and refer-ences to the sources of the data, may be foundin the 1932 Annual Supplement to the Survey
1935
July
1934
July August Septem-ber October Novem-
berDecem-
ber
1935
January |~ March April May June
TRANSPORTATION EQUIPMENT—Continued
AUTOMOBILES*Exports:
Canada:Automobiles, assembled number _
Passenger cars numberUnited States:
Automobiles, assembled, total§number. .
Passenger cars§ numberTrucks § number. -
Financing:Retail purchasers, total thous. of dol_.
New cars _ ._ thous. of dol..Used cars _ thous. of dol_.Unclassified thous. of dol .
Wholesale (manufacturers to dealers)thous. of dol
Fire-extinguishing equipment:!Shipments:
Motor- vehicle apparatus numberHand -types number
Production:Automobiles:
Canada, total number..Passenger cars numberUnited States, totalf number
Passenger cars t - number. .Taxicabs* number-Trucks! number
Automobile rims thous of rimsRegistrations:
New passenger carsf-- number. .New commercial cars*.. number
Sales:General Motors Corporation:
To consumers.. _ numberTo dealers, tota]^ number
U. S. dealers number--Shipments, accessories and parts, total*
Jan. 1925=100..Accessories, original equipment
Jan. 1925=100-Accessories to wholesalers. .Jan. 1925= 100..Replacement parts Jan 1925=100Service equipment Jan. 1925=100.-
RAILWAY EQUIPMENT
Equipment condition:Freight cars owned:
Capacity mills, of lb._Number, total thousands
Bad order, total numberPercent of total in bad order
Locomotives, railway:Owned:
Tractive power mills, of lb._Number. number
Awaiting classified repairs, number _.Percent of total-
In^ tailed. _ _ numberRetired number--
Passenger cars:On railroads (end of quarter) . number
Equipment manufacturing:Freight cars:
Orders, new, placed by railroads... cars. .Orders, unfilled, total. ears..
Equipment manufacturers cars..Railroad shops cars..
Shiprnents, total II. cars—Domestic cars..
Locomotives, industrial electric (quar-terly):
Shipments, total numberMining use .number
Locomotives, railway:Orders, new, placed by railroads
number. .Orders, unfilled, end of month:
Equipment manufacturers (Census)total number..
Domestic, total... number..Electric.. number..Steam number. .
Railroad shops (A. A. R . )__ number"Shipments:
Domestic, total numberElectric _ number..Steam number
Exports, totalf ..number..Electric number..Steam number. _
5,0703,579
25, 02614 75210, 274
4729 571
13, 0699 471
337 049276, 084
60 9651 339
285, 19551 °43
108 645167 790139, 021
114
11395
13881
179, 5671 861
28l' 26215 3
2,22245 88310, 557
23 092
119
5002,173
4271,746
4038
5
4336288
66o990
6, 5554 692
23, 95917, 6216,338
95, 48565, 09328, 6011,791
90, 294
3222, 183
11,1148 407
264, 933223, 094
41 8391,155
228, 76037, 490
101, 243134, 324107, 554
99
9582
12767
188, 4911 971
299, 78015.5
2,31048, 58710, 789
22.370
568
013, 7559,6074,1483,1293,059
0
133122616120
606871
3,5172 532
19, 82712 5227,305
87, 70058, 02928, 0281,643
85, 108
4521, 495
9,9047 3^5
234,811183, 500
51 311752
193, 82840,790
86, 258109 27887, 429
92
8510113468
186, 8891 949
293 17315.3
2,29748 20910, 771
22 462
439
1138,3725,5252,8474,1864,184
5
13512359640
422
17143
3,3432 285
17, 76610 2367,530
67, 20943, 25022, 7081,252
55 586
3923 056
5,5794 211
170 007125, 040
44 967' 526
146, 93137, 225
71, 64871 88853, 738
81
7110112960
186, 1171 938
296 41815 5
2,28547 78210, 616
22 248
475
44, 363
45,4953,4222,0733,3313,329
8787
1
12711556590
133
10880
3,7782 754
15, 5528 0407,512
68, 22442, 73824, 1271,360
45 363
3124 007
3,7802 125
131 99184, 003
47 988'eso
140, 88040 878
69, 09072 05050, 514
79
6610713561
185, 4971 932
297 54615.6
2,27847 55310, 676
22 562
291
753,0801,7951,2851,7881,768
5
1181065650o
U29633
1,9291 140
16, 2809 2087,072
55,30333, 78420, 3991,120
29, 730
2531 219
1,6971 052
83 48249, 020
34 462578
107, 64828 689
62, 75261 03739, 048
77
6612412356
184, 8981 925
295 94715 6
2,27147 32910, 718
22 768
292
41,771
959812768748
69
1271258936o
160
16281711
641367
15, 4208 2797,141
43, 78924, 76118, 0161,012
36 530
4021 536
2,6942 443
153 624111,061
42 5631 199
75, 51424 125
41 53041 59428,344
99
10111010355
183, 3631 907
290* 70915 5
2,25146 86910, 344
22 181
543
43, 342
36062853
575999995
6363
0
12712110120o
213
18431
1,5851 366
17, 62611 0356,591
56, 15235, 93718, 9551,260
93 830
3025 169
10, 6078 269
292 817229, 233
63 5841 869
136, 63534 759
54, 10598 26875, 727
113
11592
12665
182, 6851 900
285 25615.2
2,24346, 63610, 419
22 380
261
2481839941912165
0
11510996130
1367963
4,8584 342
21, 82715 0676,760
66, 41942, 77922, 2851 355
106 054
2220 697
18, 11413 885
335 700275, 623
60 0771 616
170,61534 797
77 297121 14692,907
123
12310214570
182, 1171 892
277 45114 9
2,23646 36310, 423
22 564
337
8064271133149999
1
1029784130
1212o541
9,3556 665
29, 80620 9868,820
95, 18461, 72231, 6071,856
145 574
3621 713
21,97518 179
429, 834361, 816
68 0181 724
261,47741,511
126, 691169 302132, 622
135
14210114472
182, 7731 888
274, 77514 8
2,23246, 23710, 389
22 545
171
42, 420
044430
414143143
3930
8
91867881
16115871
6 3565 194
26, 43318 3418,092
113, 02673, 05837, 9292 039
159 930
4729 796
24, 12120 686
477 746401, 628
76 1181 907
319, 65246 785
143 909184 059152, 946
147
15611014488
181, 3961 883
284' 72815 4
2,23146 19210, 537
22 862
106
6001,447
533914334162
2
83777431
1165
221210
6,4995,088
19, 89513 6046,291
107, 82167, 63138, 2271,963
132, 074
40«34 585
20, 76517 093
364 727307, 522
57 205l' 561
293, 20147 968
109, 051134 597105, 159
132
13213214883
180, 5591 873
283, 31015.4
2,22846, 09910, 582
23 063
156
21,477
549928
1,031401
2
68626118
17143
13121
4,8293.276
26, 27016,5179, 753
106, 04866, 83337, 1912,025
118, 626
54« 34 692
15, 74512 276
361, 320296, 609
64 7111 428
280, 360« 48, 243
137, 782181 188150, 863
119
10210313182
180, 1141 868
276, 53515.0
2,22245, 91010, 541
23 057
246
5,1512,427
4142,013
6666
6154
3
43373434
2727o
11110
0 Revised.* New series. For earlier data see p. 20 of the February 1934 issue for total shipments, accessories and parts, and registrations of new commercial cars.t Revised series. For earlier data see p. 19 of the August 1933 issue for fire extinguishers and passenger-car registrations; p. 55 of the June 1933 issue for 1932 exports and
p. 20 of the September 1934 issue for 1933 exports of locomotives. Data on automobile production revised for 1933. See p. 55 of the August 1934 issue. For revised datafor 1934 see pp. 55 and 56 of the June 1935 issue.
t Index of sales of new passenger cars is shown on p. 26 of this issue.§ Data revised for 1932. See p. 54 of the June 1933 issue. Data revised for 1933. See p. 20 of the September 1934 issue.• Taxicabs are included in figures for passenger cars, beginning January 1934 in order to avoid disclosure of individual companies.1 United States and Canadian dealers, plus overseas shipment.

60 SURVEY OF CURRENT BUSINESS September 1935
Monthly statistics through December 1931,together with explanatory footnotes and refer-ences to the sources of the data, may be foundin the 1932 Annual Supplement to the Survey
1935
July
1934
July August Septem-ber October Novem-
berDecem-
ber
1935
January Febru-ary March April May June
TRANSPORTATION EQUIPMENT—Continued
RAILWAY EQUIPMENT-Cont.Equipment manuuf act uring— Continued.
Passenger cars:Orders, new, placed by railroads
number. _Orders, unfilled (end of quarter)
number..Shipments, total number. .Domestic number .ELECTRIC TRUCKS AND
TRACTORSShipments, industrial, total number..
Domestic .number. _Exports number. _
SHIPBUILDINGUnited States:
Merchant vessels:Under construction thous of gross tons _Completed during month
total gross tons. _Steel total gross tons. _
World (quarterly):Launched:
Number — - ships. _Tonnage thous. of gross tons. _
Under construction:Number ships. _Tonnage thous. of gross tons. _
0
1313
76742
4,530957
0
55
29272
35
10, 9707, 877
2
5656
38371
33
5,1562,907
0
1933838
39363
32
49, 9751,601
129307
2961,311
0
4141
45432
33
2,4411,555
0
22
24231
49
2,370858
0
1824429
50455
50
2,430447
124384
2711,252
0
6161
4242o
38
3,1032,097
0
1010
58571
36
4,4833,740
0
761313
59563
30
14,51011,344
112«»319
3251,270
55
4141
75705
20
12, 6408,543
0
99
67652
20
22, 02615,801
0
1212
5348
5
20
5,9282,189
135323
3301 283
CANADIAN STATISTICS
Business indexes: *Physical volume of business 1926=100..
Industrial production, total __1926 =100..Construction ft 1926=100. _Electric power 1926=100.Manufacturing „ __ .1926= 100. _Forestry 1926=100Mining f - - —-1926= 100. _
Distribution „ .1926= 100. _Carloadings 1926= 100. .Exports (volume) 1926= 100. _Imports (volume) 1926= 100. .Trade employment 1926= 100. _
Agricultural marketing 1926= 100. _Grain marketings 1926= 100_ _Livestock marketings 1926 = 100. _
Commodity prices:Cost of living index c? 1926=100Wholesale price index# 1926= 100_ _
Employment, total (first of month).1926= 100_ .Construction and maintenance .1926= 100. _Manufacturing 1926 = 100Mining .1926-100 _Service 1926 = 100_ _Trade 1926=100Transportation __1926=100__
Finance:Banking:
Bank debits mills, of doL _Interest rates _ 1926= 100. _
Commercial failures * .number _Security issues and prices:
New bond issues, total thous. of doL.Bond yields percent. .Common stock prices, total t - 1926= 100. .
Foreign trade:Exports __ thous. of doL.Imports thous. of doL .Exports, volume:
Wheat thous. of bu_ _Wheat flour . ... _ thous. of bbL.
Railway statistics:Carloadings thous. of cars. _Financial results:
Operating revenues .thous. of dol..Operating expenses thous. of dol _Operating income.- .thous. of doL.
Operating results:Freight carried 1 mile .mills, of tonsPassengers carried 1 mile .mills, of pass..
Commodity statistics:Production:
Electrical energy, central stationsmills, of kw.-hr..
Pig iron .. thous. of long tonsSteel ingots and castings
thous. of long tonsWheat flour thous of bbl
103.0104.058.1
199.4101.7100 7135.3100.275.078.679.8
122.3164.7183.480.4
71.599.5
101.198 5
121 5123.6122 182 7
2,54580 2
59, 523384
92.4
57, 78648, 414
9,158395
195
1,791
95.795.634.8
180.699.096.7
117.296.272.376.772.2
118.0148.8164.080.5
78.472.0
101.0140.693.8
107.0119.7119.182.6
2,76783.1
122
51, 7623.9881.3
56, 78744, 145
12, 979408
188
25, 20622, 0662,114
1,879150
1,62137
671 073
99.099.839.9
184.8100.798.4
135.796.774.977.370.0
118.0172.8195.870.0
78.772.399.9
129.094.2
110.3123.0116.583.6
2,53482.3
103
54, 9683.9483.8
55, 83743, 507
14, 710412
205
25, 20122, 9471,180
1,751169
1,67742
641 282
97.197.540.4
162.799.593.8
132.996.267.082.873.5
119.8127.7139.076.7
79.072.098.8
118.194.3
112.4125.5117.183.6
2,58182.0113
16, 9453 9383.8
58, 81542, 208
17, 588369
212
27, 60521, 6884,998
2,366134
1,62743
571 383
95.9<*95.5
37.2170.494.8
100.3143.597.268.785.378.2
119.561.257.975.7
79.371.4
100.0117.094.4
117.9116.2120.084.8
3,41082.9130
271, 0653.9785.2
68,31347, 229
21, 808486
243
29, 15121, 4536,746
2,561106
1,85347
581 654
96.597.042.2
181.496.0
104.1137.595.265.960.685.3
119.351.246.372.8
79.471.2
100.2111.092.8
121.2114.9121.383.9
3,09281.0
119
5,2483.8886.0
65, 67749, 884
18, 770504
211
25, 70219,9164,797
2,22694
1,95439
571 704
92.491.030.6
188.891.8
110.3121.896.165.761.672.6
123.836.029.067.3
79.071.298.9
100.391.3
122.9115.2126.080.1
3,04076.2
124
48, 8833.6586.2
61, 39539, 108
17, 336341
172
24, 77819,9023,629
1,739136
2,05342
59969
97.597.873.4
189 788.995 7
140.497.175.870.171.3
118.930.619.381.5
78 971.494.487.987 4
119.1115.2130.676.2
2,68276.2107
35, 3633.6588.6
44, 37437, 229
5,380346
182
20, 95320, 475
d419
1, 576115
2,01344
601 025
100.6101.176.9
188 992.595 2
143 599.478.379.270.7
120.762.255.293.4
79 171.994.687.290 1
120 3111.9116 676.2
2,08978.3
25, 4953.7587.8
47, 67737, 044
7,207310
180
21, 57919, 676
937
1,685105
1,80337
56941
94.293.351.3
190 586.893 1
143.496.873.373.865.6
120.565.457.7
100.0
79 072.096.494.292 7
118 8111.7116 776 5
2,23679.5
16, 3783.8184,4
59, 02648, 191
8,906497
187
23, 84720 8652,114
1 858133
1,94445
581 046
98.397.737.9
195 994 099 0
156 4100 079.181.571.5
121.091.891.792.0
78 872.593.480.293 9
117 7111.4117 476 3
2,36780, 8
72, 0223.8786.4
38 29636, 637
5,027277
185
24, 48220 5632,990
1 797125
1,88143
69966
103.2104.438.1
198 1105 1108 7147 6100 573.484.184.0
121.286.385.490.6
78 872.395.284.795 6
116 2116.4119 380 1
3,13278 5
66, 5263.7693.6
62 94754, 548
11,990383
188
24, 52921 8391,981
1 790124
1,92345
731 164
99.299.743.7
197 498 4
105 7138 497 870.670.074.6
122.6106.1112.378.2
78 77l!o97.689.598 4
119 2118.5119 979 9
2,71080 4
65, 1513.8593.8
52 76346, 739
6,495430
186
1,81645
73992
" Revised.^Data for 1934 revised. See p. 56 of the May 1935 issue.*New series. For earlier data see p. 18 of the February 1933 issue, business indexes, and p. 20 of the October 1933 issue, commercial failures.t Revised series. See p. 55 of the April 1934 issue, construction, and mining, for 1933. Series on common-stock prices revised back to December 1932 as a result of addi-
tional stocks being added; for revision see p. 56 of the April 1934 issue.#Number of commodities changed from 502 to 567 beginning with month of January 1934.3 Data revised January 1932 through July 1933. Revision for 1932 see p. 55 of the November 1933 issue. For final revisions for 1933 see p. 66 October 1934 issue.* Deficit.

INDEX TO MONTHLY STATISTICS
Abrasive paper and clothAcceptancesAccessories, automobileAdvertisingAfrica, United States trade withAgricultural products, cash income received
from, marketings ofAgricultural wages, loans .Air-conditioning equipmentAir mailsAirplanesAlcohol, denatured, ethyl, methanolAluminumAnimal fats, greasesAnthracite industry 22,Apparel, wearing 28Argentina, United States trade with; ex-
change; flaxseed stock 33,36Asia, United States trade withAsphaltAutomobiles 22 ,26 ,27 ,28 .Babbitt metalBarleyBathroom fixturesBeef and veal _ -Beverages, fermented malt liquors and dis-
tilled spiritsBituminous coal 22,30,Boiler arid boiler fittingsBonds, prices, sales, value, yieldsBook, publicationBoxes, paper, shippingBrassBrazil, coffee; exchange, United States trade
with 33,36,BrickBrokers' loansBronzeBuilding contracts awardedBuilding costsBuilding materials 24,Business activity index (Annalist)Business failuresButterCanadian statisticsCandyCanal trafficCapital issuesCarloadingsCattle and calvesCellulose plastic productsCement 2 2 , 2 7 , 2 8Chain-store salesCheetaChile, exchange, United States trade with_ 33,Cigars and cigarettesCivil-service employeesClay products- 23,27,28,Clothing _ _ _ 24,28,C o a l _ _ _ _ _ 22,29,Coroa _ _ ___Coffee 23,CokeCollections, department storesCommercial paperCommunicationsConstruction:
Contracts awarded, indexesCostsHighwaysWage rates
CopperCopper wire clothCopra and coconut oilCornCost-of-living indexCotton, raw and manufactures 23,Cottonseed, cake and meal, oilCrop 3 23,40,42,Dairy products 23,Debits, bankDebt, United States GovernmentDelaware, employment, pay rollsDepartment-store sales and stocksDeposits, bankDisputes, laborDividend paymentsDouglas firEarnings, factoryEggsElectrical equipmentElectric power, production, sales, revenues.Electric railwaysE.mp!oyment:
Cities and StatesFactoryNonmanufacturingMiscellaneous
EmigrationEnameled wareEngineering constructionEngland, exchange; United States trade
with 33,Exchange rates, foreignExpenditures, United States GovernmentExplosivesExportsFactory employment, pay rolls 27, 28,Failures, commercialFairchild retail price index
Page Page54 Fares, street railv/ays 37
31-32 Farm employees 2959 Farm prices, index 23
25.26 Federal Government, finance _ _ _ 3436,37 Federal-aid highways 25,29
Federal Reserve banks, condition of 3223 Federal Reserve member bank statistics 32
31.32 Fertilizers 3951 Fire-extinguishing equipment _ 5926 Firelossea 25
38,59 Fish and fish oils 39,4533.39 Flazseed 40
52 Flooring, oak, maple, beech, and birch 4839.40 Flour, wheat 4329.45 Food products 22 ,23 ,24 ,25 ,28 ,30 ,4130,57 Footwear 47,55
Foreclosures, real estate 25,37,40 Foreign trade, indexes, values 36,3736,37 Foundry equipment 51
47 France, exchange; United States trade with_ 33,30,59 36,37
52 Freight cars (equipment) 27,5942 Freight carloadings, cars, indexes 3750 Freight-car surplus 3744 Fruits 23,42
Fuel equipment 5141,42 Fuels 45,4645.46 Furniture 49
50 Gas, customers, sales, revenues 4135 Gas and fuel oils 4654 Gasoline 4654 General Motors sales 5953 Glass and glassware 22,27,28,30,56
Gloves and mittens 4737,44 Gold 34
56 Goods in warehouses 2632 Grains 23,24,42,4353 Gvpsum 56
24,25 Hardwoods 4825 Heels, rubber 55
48,49 Hides and skins 24,4722 Hogs 44
32.33 Home loan bank, loans outstanding 2542 Home Owners' Loan Corporation 25
60,61 Hosiery 5745 Hotels 29,30,3838 Housing 2335 Illinois, employees, factory earnings 28,30,31
22,37 Imports 3744 Income-tax receipts 3441 Incorporations, business 26
30,56 Industrial production, indexes 2226.27 Installment sales, New England 27
42 Insurance, life 3336,37 Interest payments 35,36
45 Interest rates 3229 Investments, Federal Reserve member banks 32
30.56 Iron, ore; crude; manufactures 22,4930.57 Italy, exchange; United States trade with_ 33,36,3745,46 Japan, exchange; United States trade with_ 33,
44 36,3724,44 Kerosene 46
46 Labor turn-over, disputes 2925 Lamb and mutton 44
31.32 Lard 4438 Lead 52
Leather 22,23,24,23,30,4724 Leather, artificial 5825 Liberty bonds 3525 Linseed oil, cake, and meal 40
30,31 Livestock 23,24,43,4452 Loans, agricultural, brokers', time, real es-53 tate 31,3240 Locomotives 5943 Looms, woolen, activity 5823 Lubricating oil 46
24,57 Lumber 22,24,27,28,29,48,4940 Lumber yards, sales, stocks 48
43, 57 Machine activity, cotton, silk, wool 57, 5824,42 Machine tools, orders 52
32 Machinery 27,28,29,51,5234 Magazine advertising 25
28,30 Manufacturing indexes 2227 Marketings, agricultural 2332 Maryland, employment, pay rolls 29,3029 Massachusetts, employment, pay rolls 28,30
35.36 Meats 43,4448 Metals 22,23,24,27,28,30,49,52
29,30 Methanol 3923,44 Mexico:
51 Silver production 3422.41 United States trade with 36,37
36 Milk 42Minerals 22,45,52
28 Money in circulation 3427.28 National Industrial Recovery Act, highway
29 construction 2529 Naval stores 3938 Netherlands, exchange 3350 New Jersey, employment, pay rolls 29,3125 Newsprint 54
New York, employment, pay rolls, canal36.37 traffic 28,29,38
33 New York Stock_ Exchange 35,3634 Notes in circulation 3439 Oats 43
35,37 Oceania, United States trade with 36,3729,30 Ohio, employment 2932.33 Ohio River traffic 38
23 Oils and fats. 39,40
PageOleomargarine 40Paints 40Paper and pulp 22,23,28,30,53,54Passenger-car sales index 26Passengers, street railways; Pullman. 37,38Passports issued 33Pay rolls:
Factory 29Factory, by cities and States 30Nonmanufacturing industries 30
Pennsylvania, employment, pay rolls 29, 30Petroleum and products 22,24,28,29,30,46Pig iron 22,49Pork 44Postal business 26Postal savings 32Poultry 23,44Prices:
Cost of living, indexes 23Farm indexes 23Retail indexes 23Wholesale indexes 24World, foodstuffs and raw material 24
Printing 22,54Production, industrial 22Profits, corporation 34Public finance 34Public utilities 29,36Pullman Co 38Pumps 52Purchasing power of the dollar 24Radiators 50Radio, advertising -- 25Railroads; operations, equipment financial
statistics 37,38,59Railways, street 37Rayon 57Reconstruction Finance Corporation loans
outstanding 34Refrigerators, household 53Registrations, automobiles 59Rents (housing), index 23Retail trade:
Automobiles, new, passenger 26Chain stores:
5-and-10 (variety) 26Grocery 26
Department stores 27Mail order 27
Rural general merchandise 27Roofing_ 41Rice___: 43Rubber, crude; Scrap; clothing; footwear;
tires _ 22,23,24,28,30,55Rye_. __"."_ 43Sanitary ware 50Savings deposits 32Sheep" and lambs 44Shipbuilding 22,27,23,30,60Shoes 22 ,24 ,28 ,30 ,47Silk 23,24,54Silver 22,34Skins 47Softwoods 48,49Spain, exchange 33Spindle activity, cotton 57Steel, crude; manufactures 22, 49, 50Stockholders 36Stock indexes, domestic and world 23Stocks, department stores 27Stocks, issues, prices, sales, yields 35Stone, clay, and glass products 22,
23,27,28,30,56Sugar 23,24,45Sulphur 39Sulphuric acid 39Superphosphate 39Tea___ 23,24,45Telephones and telegraphs 38Terneplate 51Terra cotta 56Textiles, miscellaneous products 58Tile, hollow building 56Timber 48,49Tin and terneplate 23,24,51Tires _ - 22,24,28,30,55Tobacco 22,25,28,30,45Tools, machine 52Trade unions, employment 29Travel 38Trucks and tractors, industrial electric 60United Kingdom, exchange; United States
trade with 33,36,37Uruguay, exchange 33United States Steel Corporation 31,36,51Utilities 29,30,34,35,41, 59Vacuum cleaners 53Variety-store sales index 26Vegetable oils 39, 40Vegetables 23,42Wages 30,31Warehouses, space occupied 26Waterway traffic 38Wheat and wheat flour 23,24,43Wholesale prices 24Wisconsin, employment, pay rolls 29,30Wood pulp 53Wool 22,58Zinc 22 ,52

U. S. DEPARTMENT OF COMMERCEBUREAU OF FOREIGN AND DOMESTIC COMMERCE
WORLDECONOMIC REVIEW
tfVlfc*'—" r tjtfVlfc^ , ,. Avfltogt.rt0^
K -od t^c\ved telKVKO^CT° clftics W^vc^TC^arc^
^^^l^^?^^
^^^^^•^^^ *0
^ft^^
$^% fe«*» ̂ *fe^ A%\^*
^%CP WCOrt*l
tUT<
The 1934 edition, WORLD ECONOMIC REVIEW, the second ofa series inaugurated by the Bureau of Foreign and DomesticCommerce a year ago, presents in summary form outstandingeconomic developments of the year, with a view to showingthe significant trends throughout the world. Contains 31charts and numerous statistical tables.
Part I: UNITED STATESINTRODUCTORYTREVIEW ELECTRIC LIGHT AND POWERCOMMODITY PRICES MANUFACTURING AND MININGPUBLIC AND PRIVATE FINANCE CONSTRUCTIONEMPLOYMENT AND PAY-ROLLS TRANSPORTATION AND COMMUNICATIONSAGRICULTURE DOMESTIC AND FOREIGN TRADE
APPENDIXA. Chronology of important events in 1934B. Digest of legislation enacted by the second session of the 73d CongressC. Comparative monthly and annual statistics for the more significant
economic indicators
Part II: FOREIGN COUNTRIESThe second part deals with major foreign countries and presents ma-
terial similar to that shown for the United States, the selection of whichhas taken into consideration both its general importance and its bearingon economic interests of the United States.
APPENDIXA. Imports and exports of 54 countries for the calendar years 1931-34B. Principal imports and exports of five leading countries, 1931-34C. Coal, pig iron, steel, and copper production of leading countries
Copies of the report may be obtained from
THE SUPERINTENDENT OF DOCUMENTS, WASHINGTON, D. C.The price is 30 cents per copy. A discount of 25 per cent is allowed
for orders for 100 or more copies to a single address