of certain extreme ultraviolet solar wavelengths
TRANSCRIPT

T H E R M O D Y N A M I C C O N T I N U I T Y 271
of the Planck constant. They might have been found by Gibbs through pure reasoning concerning his paradox. The constant h enters only through the special formula for the fractional likeness amplitude between q and p,
^(q,p) = exp(2i7rqp/h)) (8)
obtained from microphysical evidence. This ^-function is periodic and thereby gives rise to de Broglie's p=h/\,
INTRODUCTION
IONIZATION of the upper atmosphere by the absorption of solar radiation is well established as
the major mechanism in the production of ionosphere layers.1 The resulting stratified concentrations of electrons, which are observed in great detail by reflection of radio waves and designated D, E, Fh and F2, occur at varying heights of about 65, 100, 200, and 300 km, respectively. To study the possible photoionization processes one must correlate information on the available solar ionizing radiation, the distribution of absorbing gases, and the absorption coefficients of the gases for these wavelengths. As available radiation there very probably is, in addition to the solar blackbody continuum, an intense line emission spectrum in the extreme ultraviolet to which the resonance spectra of H and He from the vicinity of solar flares contribute strongly.2 Below 910A the excess of radiation over that from a solar blackbody at 6000°K has been estimated by Spitzer3 to be of the order of tenfold in order to establish a temperature of about 1500°K at the height
1 D. R. Bates and H. S. W. Massey, Proc. Roy. Soc. (London) A187, 261 (1946).
2 A. Hunter, Repts. Prog. Phys. (The Physical Society, London) 9,8(1942).
3 L. Spitzer, Jr., contributor, The Atmospheres of the Earth and Planets (University of Chicago Press, Chicago, Illinois, 1949), Chapter 7. I am indebted to Professor Spitzer for a preliminary loan of his manuscript.
to the Heisenberg uncertainty relation between coordinates q and momenta p, and to the duality and complementarity of the particle theory and its wave-like formalism. Also, Eq. (8) opens the path to the dynamics of those special mechanical systems whose Hamilton-ian and other observables are given as functions of the q's and ^'s. Those parts of quantum theory, however, which rest on the thermodynamic continuity principle are independent of microphysical experience.
of the F2 layer. Hunter,2 Sedra,4 Tousey,5 and others have estimated this excess to be 2 or 3 orders of magnitude. The resonance line 1216A of H has not been photographed in spectra recorded during rocket flights up to 140 km,6,7 although from Preston's low value8 of its absorption coefficient in N2 {a < 0.005 cm-1) one would expect considerable intensity at this height. The absorption continuum of NO, expected9 near 1216A, may possibly account for the absence of this wavelength in ordinary spectra from rocket flights. However, the quantitative experiments of Tousey5
using filters and thermoluminescent phosphors have detected strong radiation in the range 795A-1050A at heights between 88 and 127 km and in the band 1050A-1340A between 80 and 90 km.
Oxygen and nitrogen are major components of the upper atmosphere, the former being almost completely photodissociated10,11 at heights greater than about 100 km. Emissions from aurorae and the airglow show the presence of molecular nitrogen and atomic oxygen.12
4 R. N. Sedra, Phys. Rev. 83, 190 (1951). 5 Tousey, Watanabe, and Purcell, Phys. Rev. 83, 792 (1951). 6 J. J. Hopfield and H. E. Clearman, Phys. Rev. 73, 877 (1948). 7 Durand, Oberley, and Tousey, Astrophys. J. 109, 1 (1949). 8 W. M. Preston, Phys. Rev. 57, 887 (1940). 9 G. L. Weissler, conversations, June, 1951. 10 O. R. Wulf and L. S. Deming, Terr. Magn. Atmos. Elect. 43,
283 (1938). 11H. E. Moses and Ta-You Wu, Phys. Rev. 83, 109 (1951). 12 A. B. Meinel, Repts. Prog. Phys. (The Physical Society,
London) 14, 121 (1951).
P H Y S I C A L R E V I E W V O L U M E 8 7 , N U M B E R 2 J U L Y 1 5 , 1 9 5 2
Ionospheric Absorption by N2 and 0 2 of Certain Extreme Ultraviolet Solar Wavelengths
K. C. CLARK
University of Washington, Seattle, Washington (Received March 24, 1952)
Measurements are reported of the coefficients of absorption by the gases N2 and 0 2 of the emission from the H Lyman series 2-7, the resonance line 584A of He I, and twenty lines of H2 between 980A and 850A, the atomic lines likely being strong in solar radiation. For an atmosphere of constant relative composition the absorption coefficients are related to the atmospheric heights of maximum photoionization and maximum electron concentration by equations which allow for a constant temperature gradient, the inverse square decrease of gravity, and a recombination process which may vary with height. With these laboratory measurements for N2 and 0 2 and the known calculated absorption for O, ionosphere layer heights are computed for the simple case which assumes complete 0 2 dissociation above 100 km, no N2 dissociation, and two-body recombination. Although only the first assumption is probably secure, it appears that photoionization is capable of producing layers at heights which agree with observation.

272 K. C. C L A R K
SCALE IN INCHES
FIG. 1. Toroidal electrodeless discharge tube as mounted on vacuum spectrograph.
Also, atomic nitrogen is observed in aurorae, although the degree of nitrogen dissociation is not agreed upon.
The ionization cross section of 0 has been calculated by Saha and Rai13 and by Bates.14 Laboratory measurements of the absorption cross sections of N2 and 0 2 in the extreme ultraviolet have been made recently by Weissler15 and earlier by Schneider,16 both of whom used line emission sources. Qualitative absorption spectra in the extreme ultraviolet, which were made with a continuous source and used for wavelength studies, have been published by Takamine, Suga, and Tanaka,17 and Worley18 for N2, by Price and Collins19 for O2, and by Hopfield20 for dry air. The absorption of the H Lyman series in O2 has been clearly photographed by Takamine and Suga,21 who did not attempt cross-section measurements with their spark source.
The contribution reported here is a laboratory measurement of absorption coefficients of the gases N2 and O2 for the lines 2 to 7 of the H Lyman series, for the first line 584A of the corresponding resonance series of neutral He, and in addition for twenty lines of H2. These measurements can be interpreted in terms of the height in the upper atmosphere at which the maximum rate of absorption occurs. The resulting layer of maximum absorption will be single for each wavelength, provided the atmosphere is considered to have constant relative composition and no density inversions. If ionization is at least a partial contributor in the absorption process, the layer of maximum ion production will
13 M. N. Saha and R. N. Rai, Proc. Natl. Inst. Sci. India 1, 227 (1938), discussed in reference 1.
14 D. R. Bates, Monthly Notices Roy. Astron. Soc. 100, 25 (1939); 106, 432, 509(1946).
15 Weissler, Lee, and Mohr, J. Opt. Soc. Am. 42, 84, 200 (1952). 16 E. G. Schneider, J. Opt. Soc. Am. 30, 128 (1939). 17 T akamine, Suga, and Tanaka, Sci. Papers Inst. Phys. Chem.
Research (Tokyo) 34, 854 (1938). 18 R. E. Worley, Phys. Rev. 64, 207 (1943). 19 W. C. Price and G. Collins, Phys. Rev. 48, 715 (1935). 20 J. J. Hopfield, Astrophys. J. 104, 208 (1946). 21 T. Takamine and T. Suga, Sci. Papers Inst. Phys. Chem.
Research (Tokyo) 29, 213 (1936).
coincide with that of maximum absorption. The height of maximum electron density will also depend upon how the recombination and attachment processes vary with pressure and temperature.
EQUIPMENT AND PROCEDURE
Measurements were made using a normal incidence vacuum spectrograph containing a glass grating of 15,000 lines/in. and 1-m radius. The rulings have been etched with H F to improve the intensity at short wavelengths as described by Wood and Lyman.22 For high contrast, fine grain, and uniformity Eastman Process plates were used. These were sensitized by dipping in a 10 percent solution of Cenco pump oil in petroleum ether according to the technique of Schneider.16 The narrow band of fluorescence permitted emulsion calibrations using 3906A from a Hg arc. Calibration exposure times were made equal to those of the vacuum spectra to avoid reciprocity failure. A slit width of 0.04 mm produced lines sufficiently broad for accurate microphotometer tracing. The absorption coefficient is obtained from the linear slope of the semilogarithmic graph of transmitted intensity vs density of absorbing gas in the spectrograph.
The absorbing gases N2 and O2 came from tank and electrolytic supplies, respectively. The O2 was purified by passing over hot platinized asbestos, P2O5, solid CaOH, and solid C0 2 traps to remove H2, H 2 0 , C0 2 , and Hg, respectively. The N2 was purified similarly except that the asbestos was not heated and liquid N2 was used in the cold traps.
As a light source of steady and high intensity a toroidal electrodeless discharge tube was arranged as shown in Fig. 1 and excited by an inner coil at a frequency of 6 Mc/sec. The discharge was viewed end-on through a portion of the tube constricted to 1-cm diameter and water-cooled. An intermediate pumping chamber prevented the gas in the discharge from entering the optical slit of the spectrograph, and a suitable pressure differential was maintained by a capillary of 1-mm diameter and 30-mm length. The discharge was operated at pressures of 0.04 mm for purified H 2 and 0.08 mm for the mixture of 5 percent H2 in He. The heating power developed in the discharge was estimated to be about 50 watts. The H2 spectrum obtained was quite similar to that published by Jeppeson,23 which likewise extended to about 850A. Prominent lines were used for absorption measurements.
Table I lists the resulting measurements of absorption coefficients. These values are the means of from three to five independent sets of observations, each usually covering four pressures of absorbing gas. The ranges of probable error indicated refer not only to internal consistency but to estimated errors in over-all calibrations. The line H Lyman a at 1215.7A was not studied because of its low absorption and the previous careful
22 R. W. Wood and T. Lyman, Phil. Mag. 2, 310 (1926). 23 C. R. Jeppeson, Phys. Rev. 44, 165 (1933).

I O N O S P H E R I C A B S O R P T I O N 273
TABLE I. Measured absorption coefficients of N2 and O2 and corresponding layer heights at various temperature gradients above 120 km.
Line source
HLy2 H2 HLy3 HLy4 HLy5
HLy6 HLy7 H2 H2 H2
H2 H2 H2 H2 H2
H2 H2 H2 H2 H2
H2 H2 H2 H2 H2
H2 Hel
Wavelength A
1025.7 984.3 972.6 949.8 937.8
930.8 926.2 923.9 920.0 919.1
916.8 916.0 914.1 911.3 910.3
909.2 905.4 903.8 901.6 894.1
890.7 886.1 880.6 868.8 859.0
855.6 584.3
N 2
8 i 18
3900 27
100
190 71
103 610
16
240 22 52
420 58
67 52 25 48 32
96 340 230 331
24
480 480
Absorp.
~ 3 10
100 5
20
30 10 10
100 3
50 10 15
100 30
40 15 10 20 10
25 50 50 50 5
100 30
coefficient in cm -1 S.T.P. O2
53± 343
1350 171 113
460 172 296 166 127
388 120 130 177 399
356 133 198 270 229
250 248 185 154 137
290 440
20 25
150 15 10
20 10 15 15 15
10 15 15 20 10
10 10 10 25 10
15 20 15 10 10
60 80
O
(calc by
Saha and Rai)
120 120 120 120 120
120 120 120 120 120
120 310
Height in km of a =9.03°K/km 7.36
136 157 400 165 212
243 196 213 324 151
257 159 187 295 190
224 219 207 217 210
234 291 270 290 206
315 328
137 156 400 163 203
228 191 204 291 150
240 158 181 268 183
213 208 198 207 201
221 266 250 265 198
283 293
max absorption 5.14
138 155 346 161 193
212 184 194 255 150
220 157 176 241 178
201 197 190 196 192
207 239 227 239 190
251 257
0
~m 149 223 154 172
181 168 173 197 147
185 151 164 192 165
176 175 171 174 172
179 192 187 191 171
196 198
measurements by Preston, which Tousey5 and others regard as the most reliable. With two exceptions the present results cannot be directly matched with those of Weissler and of Schneider, which were made using neighboring emission lines. Included in the careful measurements of Weissler15 were the lines H Lyman /3 (1025.7A) and He I 584.4A. The absorption coefficients of N2 for these lines were observed by him to be 60 cm - 1
and 700 cm - 1 , respectively, and for 0 2 the values were 43 cm - 1 and 550 cm"1. I t is seen that the agreement is quite satisfactory in the case of O2, while the absorption by N2 appears to be significantly greater than the values in Table I. Weissler, using 1215.13A of He I I , obtained for N2 the value of 66 cm - 1 .
DENSITY DISTRIBUTIONS
The data for composition, pressure, and temperature of the atmosphere to 120 km are taken from the recent compilation of the National Advisory Committee for Aeronautics.24 Below 80 km the fractions by volume of the major constituents O2 and N2 in dry air are taken, following Wildt,25 to be 0.2095 and 0.7809, respectively. The region of partial 0 2 dissociation in summer daylight hours is taken to lie between 80 and 100 km, the volume fraction of atomic O increasing linearly through this region from 0 to 0.346. The volume fraction of N2
24 C. N. Warfield, Tech. Note No. 1200 (N.A.C.A., Langley Field, Virginia, 1947).
25 R. Wildt, Revs. Modern Phys. 14, 152 (1942).
correspondingly decreases to 0.646. Above 100 km the atmosphere will be assumed to consist of N2 and O.
If the temperature and the acceleration of gravity are considered constant, the variation of air density p with height h above sea level, measured relative to the value po at ho, follows the well-known exponential form
p /po=exp( -2 /#o) , (1)
where z=h—ho and the scale height Ho=RT0/Mg, with R the gas constant, T0 the temperature, M the mean molecular weight, and g the acceleration of gravity. The effect of the change in g with height can be included by using as the scale height the geometric mean of its values at h and h0.
The temperature above 120 km, however, is undoubtedly not constant. With the exception of the low rotational temperatures observed by Vegard26 in auroral streamers, where the excitation mechanism raises doubts,27,28 all evidence indicates that the temperature increases rather steadily, reaching a value between 1000 and 2000°K at 300 km. If, as suggested by Bates,29
Spitzer,3 and Woolley,30 this increase is described by a
26 L. Vegard, contributor. The Emission Spectra of the Night Sky and Aurorae (The Physical Society, London, 1948), p. 82.
27 N. C. Gerson, Repts. Prog. Phys. (The Physical Society, London) 14, 316 (1951).
28 L. M. Branscomb, Phys. Rev. 79, 619 (1950). 29 D. R. Bates, Proc. Phys. Soc. (London) B64, 805 (1951). 30 R. v. d. R. Woolley, Proc. Roy. Soc. (London) A189, 219
(1947).
274 K . C . C L A R K
constant gradient of a°K/km, the modified density-distribution above height ho can be simply shown31 to be
ln(p/Po) = - (Mg0/Ra+1) ]n(l+az/T0), (2)
which reduces to that of an isothermal atmosphere as a vanishes.
Allowance for the variation of g as well as the linear temperature gradient also leads to an exact expression. The substitution of g^go^/r2 and T=T0(l+az) in the basic atmospheric equation in the form
-dp/p=dT/T+dz/H (3)
gives an integrable equation. I t will be convenient to use the constants
p = aH0/T0 and y = ro/(0ro-Ho). (4)
The resulting density distribution is
ln(p/P0) = - ( Y 2 £ + 1) ln(l+jfe/Fo)
+Py2\n(l+z/r0) + yz/(r0+z). (5)
When the gradient a2>To/r0y this equation simplifies to
ln(p/Po) = - ( 1 / 0 + 1 ) l n ( l + / V # 0 ) + (l/ j8)ln(l+2/fo)+2//3(f0+2). (6)
HEIGHT OF MAXIMUM RATE OF ABSORPTION
If the absorption coefficient of the ith component gas is given by on ever1 for that gas at 0°C and 760-mm
£
-300 2
Z o
r 2 8 0 i - -! 0-
r-260 </) OD
< h240 ^
r220 g | S
- 2 0 0 O | \-
I
L 180 ~~ X
a«<
log
9.03° K/
7.36°K>
A
1
'km--/
u 1 V / a« / T«3-
17 1
a-5.14°
0
ABSORPTION OF AIR l 0 (a,F, + a j F 2 ) , a in c
K/km
m-' 0.5 10 1.5 2.0 2.5 3.0 3.5
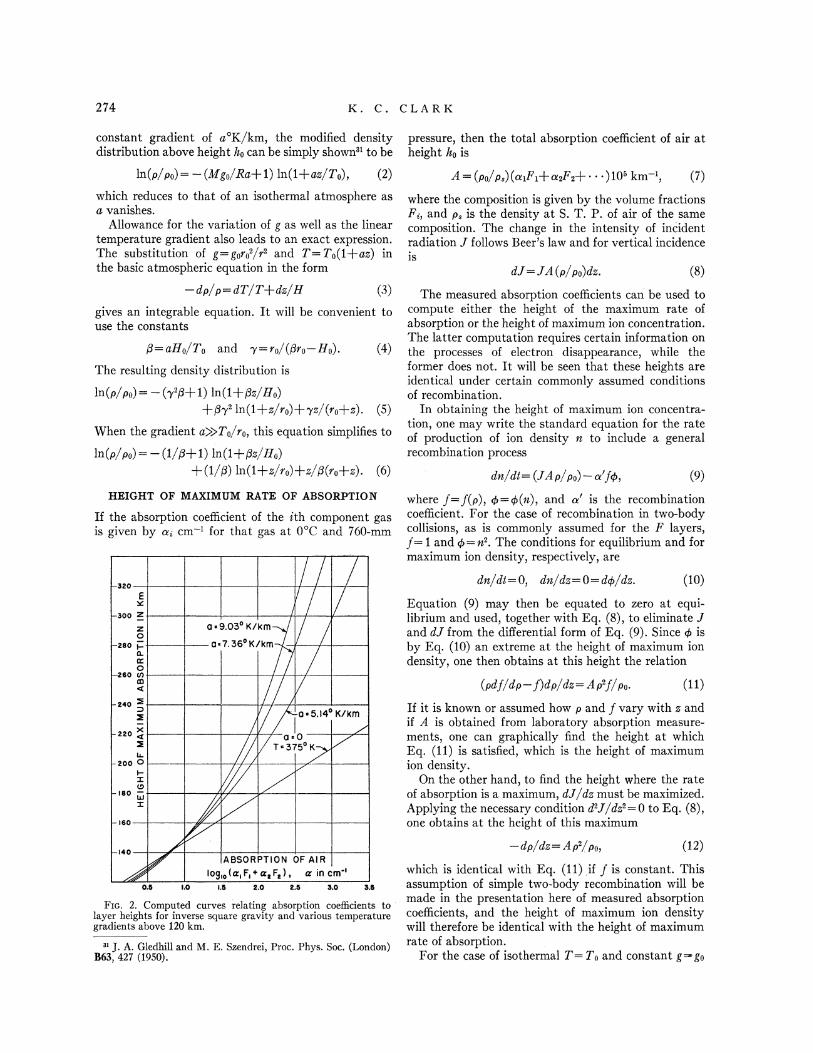
FIG. 2. Computed curves relating absorption coefficients to layer heights for inverse square gravity and various temperature gradients above 120 km.
31 J. A. Gledhill and M. E. Szendrei, Proc. Phys. Soc. (London) B63, 427 (1950).
pressure, then the total absorption coefficient of air at height h0 is
A = (p0/ps)(a1F1+a2F2+ • • -)105 km"1, (7)
where the composition is given by the volume fractions F{, and ps is the density at S. T. P. of air of the same composition. The change in the intensity of incident radiation / follows Beer's law and for vertical incidence is
dJ=JA(p/Po)dz. (8)
The measured absorption coefficients can be used to compute either the height of the maximum rate of absorption or the height of maximum ion concentration. The latter computation requires certain information on the processes of electron disappearance, while the former does not. I t will be seen that these heights are identical under certain commonly assumed conditions of recombination.
In obtaining the height of maximum ion concentration, one may write the standard equation for the rate of production of ion density n to include a general recombination process
dn/dt=(JAp/f>*)-a'f4>, (9)
where / = / ( p ) , # = <£(»), and a! is the recombination coefficient. For the case of recombination in two-body collisions, as is commonly assumed for the F layers, / = 1 and <t> = n2. The conditions for equilibrium and for maximum ion density, respectively, are
dn/dt=0, dn/dz=0 = d(j)/dz. (10)
Equation (9) may then be equated to zero at equilibrium and used, together with Eq. (8), to eliminate J and dJ from the differential form of Eq. (9). Since <j> is by Eq. (10) an extreme at the height of maximum ion density, one then obtains at this height the relation
(pdf/dp-f)dp/dz = Ap*f/Po. (11)
If it is known or assumed how p and / vary with z and if A is obtained from laboratory absorption measurements, one can graphically find the height at which Eq. (11) is satisfied, which is the height of maximum ion density.
On the other hand, to find the height where the rate of absorption is a maximum, dJ/dz must be maximized. Applying the necessary condition d2J/dz2 = 0 to Eq. (8), one obtains at the height of this maximum
-dp/dz = Ap2/p0, (12)
which is identical with Eq. (11) if / is constant. This assumption of simple two-body recombination will be made in the presentation here of measured absorption coefficients, and the height of maximum ion density will therefore be identical with the height of maximum rate of absorption.
For the case of isothermal T=TQ and constant g=*go

I O N O S P H E R I C A B S O R P T I O N 275
this layer height z is simply
z^HolnAHo, (13)
fH2
t . •
1-200 £ 0-j 0 ( 0
*H6 '
02 DISSOCIATION BOUNDARY
Htf 4o*'
-a? WAVELENGTH IN A.U!
and at this height the intensity is reduced from its original value by the fraction
J(z)/J(*>) = e-\ (14)
The assumption of a constant temperature gradient and constant g can directly be shown31 to produce the following modifications of Eqs. (13) and (14):
l n ( l + ^ / ^ 0 ) = /31n[^^o/ ( l+ /5) ] , (15)
/ ( * ) / / ( oo )==e-i-0. (16)
Nicolet32 has given an equivalent expression for electron layer height assuming recombination by collisions of an arbitrary number of bodies and an effective recombination coefficient which has an arbitrary power dependence on density.
The concept of associating the layer of maximum absorption with a certain optical depth in the atmosphere, as indicated in Eqs. (14) and (16), becomes artificial when one allows g to vary with the inverse square law, for as Mitra33 implies, the total mass above any height is given by a nonconvergent integral. But the treatment in Eq. (12) is still applicable, since the density function is given in Eq. (5). The equation for z becomes, in logarithmic form,
r/W+i) \nA = In
L Ho
r0\ H0/\ro+z/\ro+z / J
+ / 5 72 l n ( l + — ) - / V m ( l + - ) . (17)
INTERPRETATION OF RESULTS
Equation (17) gives the dependence of the layer height z upon A. Since the constants 0, y, H0, and r0
are known or estimated properties of the atmosphere and A is evaluated from absorption coefficients, the equation may be graphically solved for 2. Using at #o=120 km the values f0=6490 km, T0=375°K, M= 23.94, and g0=9.65X10~3 km/sec2 according to the N.A.C.A. tables, one computes a scale height H0 = 13.49 km. With these values Eq. (17) is solved graphically in Fig. 2, where the right side is plotted horizontally as a function of the ordinate z for four suggested values of temperature gradient. These values of a in °K/km are 9.03 ( r=2000°K at 300 km); 7.36 (Spitzer, 1700°K at 300 km) ; 5.14 (Woolley, 1300°K at 300 km); and 0 (isothermal). If g were taken to be a
32 M. Nicolet, J. Atmos. Terr. Phys. 1, 141 (1951). 33 S. K. Mitra, The Upper Atmosphere (Royal Asiatic Society of
Bengal, Calcutta, India, 1947), Chapter 1,
1000 950 900 850 600 580
FIG. 3. Layer ̂ heights for various wavelengths, assuming a=7.36°K/km. Lines of H Lyman series are numbered points. Continuous absorption by O sets the lower limit shown by upper dashed line.
constant g0, then the curve for a =9.03 would be lower by 10 km at 300 km. The measured absorption coefficients of N2 and 0 2 are listed by wavelength in Table I. Also, the corresponding coefficients of the continuous absorption by O as computed by Saha and Rai13 are given. This absorption continuum is somewhat uniform between about 500A and the ionization limit at 910A because of the overlapping of the continua of excited atoms. The values a =120 cm - 1 above 856A and a = 3 1 0 cm""1 a t 584A have been used.
Assuming that N 2 and O are the sole components above 120 km, one computes ln^4 and from the graph of Fig. 2 finds the height of maximum rate of absorption. These heights are plotted by wavelength in Fig. 3 for the assumed value of a=7.36°K/km. This value of a is seen to give a maximum at 293 km for the presumably strong 584A radiation from He I, which could concurrently ionize both N2 (X<796) and O (A<910). This height would agree with that of the F 2 ionosphere layer. I t is seen that for this same temperature gradient no wavelength between 910A and about 500A can penetrate the continuous absorption by O at a layer height of about 190 km, regardless of N2 transparency.
For all wavelengths measured the maximum rate of absorption occurs well above 120 km, and hence, absorption by 02 , which exists only below 100 km, need not be considered. But other wavelengths may escape the line absorption in the range 1010>X>910 and ionize 0 2 . Since the air density is relatively high in the dissociation region, any wavelength appreciably absorbed by 0 2 would be very rapidly attenuated, and the height of maximum rate of absorption would lie close to the upper boundary of the region. This height would agree with that of the E layer. For example, if 0 2 alone were the absorber, radiation for which a= 120 cm - 1 would be reduced by l/e in the first 2 km below 100 km, and only 5 km would similarly be needed if

276 K. C. CLARK
a—17 cm-1. The strong line absorption by N2 of those members of the H Lyman series used in the measurements seems to eliminate their role in E layer formation, but the necessary radiation could possibly come from the wings of these lines broadened in solar emission, from series members higher than the seventh, or from the solar blackbody continuum.34 The observations of Tousey5 and of Friedman35 indicate that there may also be soft x-rays of irregular intensity.
Bates36 has recently argued on the basis of computed and observed intensities of the first negative nitrogen bands in twilight enhancement that N24* forms but a small portion of the F layer ions and also that the F2
layer is derived from the Fi through a variation with altitude of the 0 + recombination coefficient. His results raise doubt as to the importance of N2 as an absorber even of wavelengths above its ionization limit and would indicate either or both of the following conclusions : the radiation around 584A is weak, and nitrogen in the F region is largely atomic. Herzberg37 has suggested that a known predissociation of N2 may be appreciable at these heights. The continuous absorption by N, for whose spectral head Bates has computed a= 1620 cm-1, should ideally be included in the analysis of atmospheric absorption. But as yet the degree of dissociation is not known; and hence the role of N, which may still be small, is here conveniently ignored. If the dissociation and the air density were known functions of height, then the dependence of A on z would be known. Equation (11) would be modified only by the additional term fa'p(dA/dz)/A on the right and could again be solved graphically for z.
SUMMARY
Absorption coefficients of N2 and O2 are given for the H Lyman series to the seventh member, the principal line of the resonance series of He I, and twenty wavelengths of H2, the atomic lines being chosen be-
34 R. v. d. R. Woolley and C. W. Allen, Monthly Notices Roy. Astron: Soc. 108,292 (1948).
35 Friedman, Lichtman, and Byram, J. Opt. Soc. Am. 41, 292 (1951).
36 D. R. Bates, Proc. Roy. Soc. (London) A196, 562 (1949). 37 G. Herzberg, Nature 161, 283 (1948).
cause of their probably strong contribution in solar emission. The relation of these data to ionosphere production is discussed, using an analysis for the height of maximum rate of absorption which takes into account a linear increase in atmospheric temperature with height above 120 km and the inverse square decrease of gravity. If the temperature is assumed to increase to 1700°K at 300 km, the combined absorption by N2 and O of the principal line of He I would have a maximum at 293 km, the height of the F2 layer. The wavelengths studied between 1010A and 910A could not penetrate N2 to the extent necessary to ionize 02 at the E layer; the source of this ionization may be broadened wings of these lines in solar emission, further lines in the H Lyman series, continuous solar radiation, or soft x-rays. Other intense solar emission than the lines studied may well contribute to the formation of other layers, in particular the F\ layer at the height of the maximum rate of 0 + production. The location of the absorption coefficients on a height scale strongly suggests that the upper atmosphere is not isothermal. The foregoing analysis has discussed the heights of maximum production rate of ions; these are also the heights of maximum concentration of electrons in the simple case where the two-body recombination coefficient is constant and the atmosphere has constant relative composition. Under less simple conditions of electron removal these heights will, in general, fail to coincide, and this situation may exist in the upper atmosphere. In fact Bates has suggested that the F\ and F2 layers may be formed by the same ions and radiation and rendered separate by a marked change in recombination coefficient with height. A correct computation of electron layer height must await further knowledge of the dominant mechanism of electron removal and the variation of recombination and attachment coefficients with height.
The laboratory measurements reported here were carried out at the Lyman Laboratory of Harvard University. The writer is very grateful to Professor O. Oldenberg for his friendship, for the suggestion of this research, and for the stimulating supervision of its experiments.