of agriculture performance audit june 2017 · this section of the performance audit focuses on the...
TRANSCRIPT

The State of Ohio, Auditor of State
Ohio Department of Agriculture
Performance Audit June 2017

Ohio Department of Agriculture Performance Audit
This page intentionally left blank.

Ohio Department of Agriculture Performance Audit
To the Governor’s Office, General Assembly, Director and Staff of the Ohio Department of Agriculture, Ohio Taxpayers, and Interested Citizens: It is my pleasure to present to you this performance audit of the Ohio Department of Agriculture (ODA or the Department). This service to ODA and to the taxpayers of the state of Ohio is being provided pursuant to Ohio Revised Code § 117.46 and is outlined in the letter of engagement signed November 23, 2015. This audit includes an objective review and assessment of selected program areas within ODA in relation to industry standards and recommended or leading practices. The Ohio Performance Team (OPT) of the Auditor of State’s (AOS) office managed the project and conducted the work in accordance with Generally Accepted Government Auditing Standards. The objectives of this engagement were to analyze the Department, its programs, and service delivery processes for efficiency, cost-effectiveness, and customer responsiveness. The scope of the engagement was confined to the areas of Laboratory Operations and Facility Utilization. This report has been provided to ODA and its contents have been discussed with Department leadership, division leadership, program specialists, and other appropriate personnel. The Department is reminded of its responsibilities for public comment, implementation, and reporting outlined under ORC § 117.461 and § 117.462. The Department is also encouraged to use the results of the performance audit to improve operational efficiency and service delivery. Sincerely, Dave Yost Auditor of State June 27, 2017

Ohio Department of Agriculture Performance Audit
Additional copies of this report can be requested by calling the Clerk of the Department’s office at (614) 466-2310 or toll free at (800) 282-0370. In addition, this report can be accessed online through the Auditor of State of Ohio website at http://www.ohioauditor.gov by choosing the “Audit Search” option.
http://ohioauditor.gov

Ohio Department of Agriculture Performance Audit
Table of Contents I. Engagement Purpose and Scope .................................................................................................. 1 II. Performance Audit Overview..................................................................................................... 2 III. Methodology ............................................................................................................................. 2 IV. ODA Overview ......................................................................................................................... 3 V. Summary of Recommendations and Impact .............................................................................. 6 VI. Audit Results ............................................................................................................................ 7
1. Laboratory Operations ............................................................................................................ 8
R1.2 Laboratory Efficiency .................................................................................................. 19
Appendix 1.A Laboratory Disciplines Hours and Output by Week CY 2016...................... 33
2. Facility Utilization ................................................................................................................ 38
R2.1 Space Utilization .......................................................................................................... 42
R2.2 Meeting Room Utilization ............................................................................................ 48
R2.3 Equipment Utilization .................................................................................................. 52
R2.4 Chemical Storage ......................................................................................................... 54
VII. Audit Scope and Objectives Overview ................................................................................. 56 VIII. Abbreviated Terms and Acronyms ...................................................................................... 57 IX. ODA Response ....................................................................................................................... 58

Ohio Department of Agriculture Performance Audit
This page intentionally left blank.

Ohio Department of Agriculture Performance Audit
Page | 1
I. Engagement Purpose and Scope
Ohio Revised Code (ORC) § 117.46 provides that the Auditor of State (AOS) shall conduct performance audits of at least four state agencies each budget biennium. In consultation with the Governor and the Speaker and Minority Leader of the House of Representatives and the President and Minority Leader of the Senate, the Auditor of State selected the Ohio Department of Agriculture (ODA or the Department) for audit during the fiscal year (FY) 2015-17 Biennium, encompassing FY 2015-16 and FY 2016-17. Prior to the formal start of the audit, the Ohio Performance Team (OPT) and ODA engaged in a planning process which included meetings, discussion, and assessments. Based on this, ODA received a letter of engagement marking the official start of the performance audit, March 30, 2017. The letter of engagement established that the objective of the audit was to review and analyze selected areas of ODA operations to identify opportunities for improvements to economy, efficiency, and effectiveness. The letter of engagement led to OPT planning and scoping work, in consultation with ODA, which identified the following scope areas: Laboratory Operations and Facility Utilization. Based on the established scope, OPT engaged in supplemental planning activities to develop detailed audit objectives for comprehensive analysis. See Section VII: Audit Scope and Objectives Overview for an overview of scope areas and audit objectives.

Ohio Department of Agriculture Performance Audit
Page | 2
II. Performance Audit Overview
The United States Government Accountability Office develops and promulgates Government Auditing Standards that provide a framework for performing high-quality audit work with competence, integrity, objectivity, and independence to provide accountability and to help improve government operations and services. These standards are commonly referred to as generally accepted government auditing standards (GAGAS). Performance audits are defined as engagements that provide assurance or conclusions based on evaluations of sufficient, appropriate evidence against stated criteria, such as specific requirements, measures, or defined business practices. Performance audits provide objective analysis so that management and those charged with governance and oversight can use the information to improve program performance and operations, reduce costs, facilitate decision making by parties with responsibility to oversee or initiate corrective action, and contribute to public accountability. OPT conducted this performance audit in accordance with GAGAS. These standards require that OPT plan and perform the audit to obtain sufficient, appropriate evidence to provide a reasonable basis for findings and conclusions based on the audit objectives. OPT believes that the evidence obtained provides a reasonable basis for our findings and conclusions based on the audit objectives. III. Methodology
Audit work was conducted between February 2017 and June 2017. To complete this report, OPT staff worked closely with ODA staff to gather data and conduct interviews to establish current operating conditions. This data and information was reviewed with staff at multiple levels within ODA to ensure accuracy and reliability. Weaknesses in the data obtained are noted within the report where germane to specific assessments. To complete the assessments, as defined by the audit scope and objectives, OPT identified sources of criteria against which current operating conditions were compared. Though each source of criteria is unique to each individual assessment, there were common sources of criteria included across the audit as a whole. These common sources of criteria included ODA internal policies and procedures; industry standards; and government and private sector leading practices. All sources of criteria were reviewed to ensure that their use would result in reasonable and appropriate assessments. The performance audit process involved information sharing with ODA staff, including preliminary drafts of findings and proposed recommendations related to the identified audit scope and objectives. Status meetings were held throughout the engagement to inform the Department of key issues, and share proposed recommendations to improve or enhance operations. Input from the Department was solicited and considered when assessing the selected areas and framing recommendations. The Department provided verbal and written comments in

Ohio Department of Agriculture Performance Audit
Page | 3
response to various recommendations, which were taken into consideration during the reporting process. Where warranted, the report was modified based on Department comments. This audit report contains recommendations that are intended to provide the Department with options to enhance its operational economy, efficiency, and effectiveness. The reader is encouraged to review the recommendations in their entirety. IV. ODA Overview
Responsibilities and Mission ODA is a cabinet-level Agency and, as such, the Director is appointed by, and serves at the pleasure of, the Governor. As a State agency, ODA is charged with creating and enforcing regulations concerning consumer and farmer protection, conducting county and independent fairs, food safety, herd and flock health, and protection of plants from pests. The Department’s mission is “To ensure the safety of the state’s food supply, to maintain the health of Ohio’s animals and plant life, and to create economic opportunities for Ohio’s farmers, food processors and agribusinesses.” Organizational Structure With oversight from the Director, ODA carries out its statutory responsibilities and mission through the operation of the following divisions:
• Amusement Ride Safety Division; • Animal Health Division; • Consumer Protection Lab; • Dairy Division; • Enforcement Division; • Food Safety Division; • Livestock Environmental Permitting Division; • Marketing Division; • Meat Inspection Division; • Plant Health Division; • Soil and Water Conservation; and • Weights and Measures Division.
In addition to the divisions listed above, there are also the following offices:
• Administration; • Business Management; • Communications; • Fairs Scheduling; • Farmland Preservation; • Human Resources;

Ohio Department of Agriculture Performance Audit
Page | 4
• Information Technology; and • Legal.
The following graphic illustrates both the basic organizational structure and the leadership hierarchy of the Department.
Source: ODA Organizational History The Ohio Board of Agriculture, established by a group of Ohio Farmers in 1845, was the earliest iteration of a formal agricultural organization in Ohio. The following year, the group was formally recognized as the Ohio State Board of Agriculture by the Ohio General Assembly. Initially, the Board set out to establish county fairs across Ohio with the purpose of celebrating farmers and their contributions to the state’s economy. This led to the establishment of an agricultural board in each Ohio county, which determined their own operating requirements. The county fairs enabled farmers to exhibit products and skills of their trade to the general public. Additionally, this fostered communication and connectivity among participants in a previously fragmented industry. This helped to spread best practices and techniques, yielding increased productivity and impact to Ohio’s economy. Toward the end of the nineteenth century, the effort to expand agricultural education led to the establishment of Ohio Farmer Institutes – providing opportunities for farmers to stay current on the most recent farming practices. The Ohio Department of Agriculture (ODA or the Department), formed in 1920, replaced the Ohio State Board of Agriculture. Whereas the Board had previously reported to the Ohio General Assembly, the Department began reporting directly to the governor. The Department continued

Ohio Department of Agriculture Performance Audit
Page | 5
its oversight of the county and state fair system. This included setting dates, assisting with funding, and also providing prize money for the fairs' harness racing events. In addition to oversight of Ohio's fairs, ODA has continued the work of its predecessor organizations by assisting farmers in increased production and enhanced crop and livestock quality.

Ohio Department of Agriculture Performance Audit
Page | 6
V. Summary of Recommendations and Impact
The following table shows performance audit recommendations and total financial implications for this report.
Table V-1: Summary of Section Recommendations and Impact Report Section Recommendations Annual Impact
Laboratory Operations R1.1 & R1.2 N/A Facility Utilization R2.1, R2.2, R2.3, & R2.4 $492,253 Total Financial Implication $492,253 Note: N/A indicates that no financial implication specific to the implementation of the stated recommendation was calculated as part of the analysis.

Ohio Department of Agriculture Performance Audit
Page | 7
VI. Audit Results
The performance audit identified recommendations within the scope areas of Laboratory Operations and Facility Utilization. Each scope area and report section includes recommendations focused on performance measurement and management. These recommendations evolved during the analysis of ODA operations. In a number of cases it was clear that Department leadership lacked the necessary data needed to make decisions. In other instances, data was being collected but was not aggregated in a useful way. This report includes recommendations to correct these deficiencies and to use the resulting data to improve decision-making. See Section IX: Abbreviated Terms and Acronyms for a list of acronyms used throughout this report.

Ohio Department of Agriculture Performance Audit
Page | 8
1. Laboratory Operations Section Overview This section of the performance audit focuses on the Ohio Department of Agriculture’s (ODA or the Department) Laboratory Operations (Laboratory). Information was collected and analyzed to develop an operating profile of the Laboratory. Analysis identified opportunities to improve management information and management information systems. The Laboratory Operations section is divided into two sub-sections of analysis, including:
• Laboratory Test Costing Methodology: The first sub-section analyzes costing methodologies used by the different laboratory disciplines and identifies opportunities for improved methodological consistency as well as increased test and service coverage.
• Laboratory Efficiency: The second sub-section analyzes laboratory efficiency when comparing available production hours to calculated workload hours and identifies opportunities for improved data collection with regards to time tracking information to aid with performance measurement and management.
Recommendations Overview Recommendation 1.1: ODA should develop and apply a consistent and comprehensive costing methodology for all tests provided by the laboratories. In doing so, the Department should fully consider all cost drivers that are significant to the operations of the Laboratory as a whole as well as each discipline. Where applicable to setting test prices, the Department should clearly identify where the actual cost per test is intended to be subsidized by the General Fund and the extent to which a subsidy is acceptable. Financial Implication 1.1: N/A. While savings may not be immediately quantifiable, ODA could realize future revenue enhancements through increased cost recovery for testing services once the full cost associated with the tests is understood. Recommendation 1.2: ODA should utilize a data system that allows for the capture of direct labor hours associated with output, in order to measure and manage operational efficiency within the laboratories. Financial Implication 1.2: N/A

Ohio Department of Agriculture Performance Audit
Page | 9
Noteworthy Accomplishment Noteworthy accomplishments acknowledge significant accomplishments or exemplary practices. The following summarizes a noteworthy accomplishment identified in this performance audit. Laboratory Integration Project: In 2016, ODA, the Ohio Department of Health (ODH), and the Ohio Environmental Protection Agency (OEPA) started a laboratory integration project. The focus of this project is to align all state laboratory fiscal operations in order to share resources and compare laboratory operations more effectively in the future. To date, ODA has partnered with OEPA and ODH in the following ways: shared analytical or technical assistance when equipment was down, shared equipment with other laboratories that did not have it available to meet new testing needs, submitted a combined capital equipment budget, combined purchases to obtain better bulk pricing, worked in unison during outbreak investigations, and shared some costly facilities, such as a BSL-31 laboratory space that is costly to maintain.
1 A BSL-3 laboratory is a Biosafety Level 3 Certification. This is a containment laboratory designed to work on microbes that can cause serious or potentially lethal disease through inhalation. The certification requirements make the BSL-3 laboratory more expensive to operate than other ODA laboratory operations.

Ohio Department of Agriculture Performance Audit
Page | 10
Section Background Laboratory Operations Overview ODA performs laboratory services in accordance with Ohio Revised Code § 901.43. The Department has five laboratories under the purview of the Deputy Director for Regulatory Programs and Laboratory Services2 and organizes these operations into three distinct laboratories:
• Animal Disease Diagnostic Laboratory (ADDL) - provides diagnostic expertise to veterinarians for food animals, horses, small animals, and exotic species.
• Consumer Protection Laboratory (CPL) - provides laboratory services for food and agricultural testing, including food, feeds, fertilizers, pesticides, and animal exhibition samples. It is also the state’s primary emergency response laboratory for biological and chemical terrorism in food and environmental products.
• Analytical Toxicology Laboratory (ATL) - provides laboratory services for the Ohio State Racing Commission (OSRC).3
Each laboratory maintains a list of services provided and publishes a price list for tests available based on the costs of testing supplies, staff, and equipment needed to perform the tests. The quality of the tests is maintained through strict adherence to laboratory policies, and each laboratory is certified in several areas. Primary users of laboratory services include programs operated by ODA, veterinarians and farmers across the state, the OSRC, and other producers of agricultural products. Additionally, the laboratories provide services to the federal government through several grant programs. Lastly, the CPL is an active member of the Feed Emergency Response Network (FERN), a federal program, and the Laboratory Response Network (LRN), a collaboration with the Ohio Department of Health.
2 The Department also operates the Weights and Measures Laboratory and the Plant Health Laboratory under the Deputy Director for Regulatory Programs and Conservation. 3 The ATL and the Ohio State Racing Commission work together through a contract, which is agreed upon every two years.

Ohio Department of Agriculture Performance Audit
Page | 11
Laboratory Organization The Laboratory is under the leadership of the Laboratory Director who reports to the Deputy Director. In addition to the Laboratory Director, there are three laboratory managers corresponding to each of the laboratories. Services within each laboratory are performed at the direction of this leadership team. The analytical testing activities of the laboratories are organized internally based on the type of specimen being analyzed. Laboratory disciplines are as follows:4
• Analytical Toxicology (CPL) – serves as the official drug testing laboratory for the OSRC. Equine samples are received from Ohio’s seven commercial race tracks and state-wide county fairs that host racing.
• Avian Serology (ADDL) – receives blood samples from commercial poultry producers, backyard-exhibition poultry, and companion and exotic bird owners.
• Bacteriology (ADDL) – provides diagnostic services for veterinarians, animal owners, and state and federal regulatory agencies for bacterial and mycotic diseases of livestock and poultry.
• General Chemistry (CPL) – provides analysis of animal feed (both livestock and pet foods), fertilizers, agricultural limes, meat, and dairy products as well as food safety samples.
• Microbiology (CPL) – provides testing services for state and federal regulatory programs through the examination of samples for pathogenic bacteria, and also provides testing in consumer complaint cases.
• Pathology (ADDL) – provides diagnostic information concerning animal health problems and diseases to veterinarians, animal owners and livestock/poultry producers through the provision of necropsies and tissue examinations.
• Pesticide and Residue (CPL) – provides analytical services in the area of trace-level analysis of pesticides/residues in various fruits and vegetables.
• Serology (ADDL) – provides diagnostic and export test services to veterinarians and provides testing for state and federal regulatory programs through the monitoring and surveillance of diseases of cattle, hogs, horses, goats, sheep, deer, llamas and related camelid species.
• Virology (ADDL) – provides diagnostic virology service to veterinarians, livestock owners, and state and federal regulatory agencies from animal tissues, serum, bodily fluids, and feces.
Laboratory Staffing and Workload Table 1-1 shows Laboratory staffing categorized by non-testing (e.g., quality assurance or administrative functions) and testing output as of February 2017. This information is important to understanding the amount of time for testing output available to each laboratory.
4 Laboratory affiliation for disciplines is included in parenthesis.

Ohio Department of Agriculture Performance Audit
Page | 12
Table 1-1: Laboratory Staffing Breakdown
Laboratory Total Employees Non-Testing Employees Testing Employees
% Testing Employees
ADDL 39 15 24 61.5% ATL 9 4 5 55.5% CPL 27 8.7 18.3 67.8% Total 75 27.7 47.3 60.6% Source: ODA Note: Administration counts for three laboratory directors which were excluded for this analysis. As shown in Table 1-1, the percentage of testing employees in each of the laboratories varies from 55.5 percent in ATL to 67.8 percent in CPL. This signifies that while there is some variation in the percentage of testing relative to non-testing employees, the three laboratories operate with a similar employee mix assigned to testing or other duty. A limited amount of cross-training occurs that allows laboratory scientists to float across laboratory disciplines, but they are generally trained in the disciplines in which they spend a majority of their time. Specimen preparation, analytical testing, and data entry are the core responsibilities of the laboratory scientists. Additionally, laboratory scientists are required to periodically calibrate laboratory equipment, verify testing equipment, and undergo continuing education. Laboratory scientists also spend a varied amount of time on the development of analytical procedures, also known as method development. Laboratory supervisors, in addition to managing personnel and testing workflow, must devote time to the development of analytical procedures and purchasing. Table 1-2 shows the quantity of annual tests completed, by laboratory, for calendar year (CY) 2011 to CY 2015 as well as the average annual quantity of tests.5 This type of analysis is important to understanding the general workload output experienced by each of the laboratories in a given year.
Table 1-2: Laboratory Output Analysis Laboratory CY 2011 CY 2012 CY 2013 CY 2014 CY 2015 Average
ADDL 413,975 330,672 353,802 285,228 396,907 356,117 ATL 139,492 33,346 34,424 50,988 129,760 77,602 CPL 222,175 224,798 240,297 235,948 235,229 231,689 Total 775,642 588,816 628,523 572,164 761,896 665,408 Source: ODA As shown in Table 1-2, on average, the laboratories have completed more than 665,000 tests annually over the last five years. Although the number of tests provides an important measure of workload, and is helpful to understanding total laboratory output, it is limited in that not all samples or test batches are alike, and do not take the same time to test.
5 As of the completion of this analysis in June 2017, the 2016 ODA Annual Report has not been published.

Ohio Department of Agriculture Performance Audit
Page | 13
R.1 Laboratory Test Costing Methodology Background The Department’s CPL, ADDL, and ATL laboratories are considered regulatory, surveillance, and diagnostic; meaning that they provide tests that are required by law and intended to assist Ohio’s agriculture industry with the disease diagnosis and surveillance and the detection of drugs. To fulfill these responsibilities, the laboratories provide an extensive list of over 500 different types of services and tests. The laboratories price tests based on a variety of factors, including actual costs, fees charged by competitors (e.g., other public laboratories), historical fees and increases, and available General Fund revenue. In some cases, the laboratory will charge the full cost of testing, while on other occasions it is appropriate to supplement the cost of the test with the General Fund, particularly to ensure that tests to identify diseases that could spread or affect public health are not financially prohibitive.6 To determine the actual cost to perform a test, the laboratories consider the following:
• The cost of chemicals and supplies used in the actual test; • The cost of labor, including any laboratory technicians, laboratory scientists, and direct
supervisor time used in the actual test; • The cost of building utilities and maintenance allocated on a per test basis; calculated by
dividing the total cost of maintenance and utilities (i.e., electricity, gas, and water) for the previous fiscal year by the total number of tests completed;
• The cost of equipment preventive maintenance and repairs, calculated by dividing the annual service and preventive maintenance agreement costs for equipment used to perform each test by the total number of tests performed on that machine;
• The cost of equipment depreciation, calculated using straight line and units of production methodologies;
• A 1.0 percent “repeat rate”; generically used to estimate the cost associated with repeating a test for various reasons, such as equipment failure, out of spec, or errors;
• Administrative fees, calculated by dividing the cost of the Laboratory Director, laboratory managers, and business support functions across total tests;
• A 5.0 percent accreditation fee to help cover costs associated with maintaining accreditation in the laboratories;7 and
• A 5.0 percent contingency fee to cover the ancillary/general use of equipment such as refrigerators or autoclaves, supplies, and expenses that are not directly tied to any test.
6 CPL last updated laboratory test prices in May 2015 while ADDL last updated test prices in February 2017. As of the completion of this performance audit CPL was in the process of developing an updated testing price list. 7 The ADDL is accredited through the American Association of Laboratory Diagnosticians. The CPL is accredited for ISO 17025 by the American Association for Laboratory Accreditation. The ATL is accredited for ISO 17025 by A2LA, as well as by the Racing Medication Testing Consortium.
Ohio Department of Agriculture Performance Audit
Page | 14
Methodology This sub-section, Laboratory Test Costing Methodology, seeks to assess and evaluate the current test costing methodology of the ADDL and CPL with a focus on identifying opportunities for improved consistency and effectiveness. During the planning and scoping phase of this performance audit, ODA leadership identified the laboratories as an area that could benefit from an objective analysis to identify opportunities for improvement. Information was collected and analyzed to develop an understanding of how each laboratory determines the cost associated with each individual test. Where necessary to develop a full understanding of operations, ODA and Laboratory leadership and staff provided supplemental testimonial evidence. ODA provided test data from the Laboratory Information Management System (LIMS) database for the CPL and ADDL laboratories.8 The LIMS system was put into place in July 2014 for ADDL, but not until March 2016 for CPL. Therefore, primary analysis and conclusions were based on CY 2014 through CY 2016 data, when available. The analysis focuses on identifying the costs associated with each lab test and identifying variation in costing methodologies. After identification of any variation, the analysis seeks to understand the comprehensiveness of the current methodologies.
8 The LIMS system is a repository of information to help manage laboratory operations. ODA uses the U.S. Animal Laboratory Information Management System (USALIMS), a proprietary database system for their laboratory operations. USALIMS was implemented at ODA in stages; ADDL in 2014 and CPL in 2016.

Ohio Department of Agriculture Performance Audit
Page | 15
Analysis In assessing the comprehensiveness of the Laboratory’s costing methodology, it is useful to consider what the National Institute of Health (NIH) provides as a guide for cost allocation. Cost Analysis and Rate Setting Manual for Animal Research Facilities9 (NIH), 2000) identifies ten basic principles for the costing and rate setting within an animal research facility. These principles are as follows:
1. Billing rates should be based on costs. 2. The objective should be to operate as closely as possible to a break-even analysis. 3. Billing rates should be established for all services that can be specifically identified to
users and involve significant activities. 4. All costs associated with providing service should be included in the total cost. 5. Costs should be treated consistently as either direct or support costs. 6. The assignment of costs to cost centers and the allocation of support costs to direct cost
centers should be based on beneficial relationships. 7. Billing units should logically represent the service provided. 8. All users should be charged consistently at full rates. 9. Revenue and costs should be compared at least annually to identify surpluses and deficits. 10. Adjustments should be made to compensate for surpluses or deficits.
In addition, the NIH recommends the following basic steps for cost analysis:
1. List all the internal costs. 2. Identify the direct cost centers, and the internal support centers. 3. Assign the internal costs to the direct and support cost centers. 4. Allocate the cost of the internal support cost centers to the direct cost centers. 5. Calculate unit costs by dividing the total allocated costs of each direct cost center by the
units of service provided.
9 Although the primary focus of ODA’s laboratories is not the care of animals for research, they do occasionally have to care for sick or dangerous wild animals. The criteria still applies to the laboratory services even if animal care is not needed for that particular sample.

Ohio Department of Agriculture Performance Audit
Page | 16
Table 1-3 shows ODA’s costing methodologies by expense type and by laboratory discipline for calendar year to date (CYTD) 2017.10 An “X” indicates that the type of cost is accounted for in the costing methodology of that discipline, while a blank, shaded, space indicates that the cost has not been accounted for. This type of analysis is informative to understanding the comprehensiveness and variation between laboratory disciplines to account for costs associated with laboratory testing.
Table 1-3: ODA Costing Methodologies by Discipline
Expense Type ADDL 1
CPL
ATL General Chem. Micro. PDP FIFRA
Method Development Set up Labor X X X X X X Testing Time X X X X X X Cleanup X X X Data Entry X X X X X X Data Analysis X X X X X X Data Review X X X X X X Reagents X X X X X X Supplies X X X X X X Shipping X X X X X X Laboratory Administration X X X X X X Instrument Cost and Depreciation X X X X X Instrument Repair and Maintenance X X X X X Building X X X X X X ODA Administration Accreditation Costs X X X X X X Error-Repeat Rate X X X X X X Contingency Fee X X X X X X Total 16 16 16 15 15 13 Total % 88.9% 88.9% 88.9% 83.3% 83.3% 72.2% Source: ODA 1 All five ADDL disciplines use a consistent centralized costing methodology. Note: ADDL laboratories do not track set up labor, testing time, cleanup, data entry, data analysis, or data review separately, but all are accounted for in their labor calculations. As shown in Table 1-3, the laboratory disciplines actively use between 72.2 and 88.9 percent of the available cost categories. Two cost categories, method development and ODA administration, are not being used by any of the laboratory disciplines. Broadly, there is
10 As of the completion of this analysis in May 2017.

Ohio Department of Agriculture Performance Audit
Page | 17
substantial variation in the way the laboratories are costing their tests and none of the current costing methodologies is comprehensive in nature. While each laboratory discipline has developed at least some costing methodology, the extent to which the costing methodologies fully cover the variety of test performed by each discipline should also be considered. Table 1-4 shows ADDL total tests performed for CY 2014 to CY 2016 as well as CPL tests performed from March 2016 to December 2016, tests with a costing methodology, and percentage of tests with costing methodologies for each laboratory discipline. This demonstrates the quantity of tests that have costing methodologies.
Table 1-4: Laboratory Tests with Costing Methodologies, by Discipline
Discipline Quantity of Tests with Costing Methodologies
Quantity of Tests Performed
% of Tests Performed w/Costing Methodologies
CPL General Chemistry 12,555 12,965 96.8% Microbiology 17,930 18,848 95.1% FIFRA 11 373 373 100.0% PDP 12 1,067 1,067 100.0% ATL 33,210 33,548 99.0% CPL Total 65,135 66,801 97.5%
ADDL Avian Serology 372,082 418,073 89.0% Virology 22,562 94,189 24.0% Pathology 32,717 35,014 93.4% Bacteriology 30,352 37,652 80.6% Molecular 0 78,777 0.0% Serology 159,801 313,761 50.9% ADDL Total 617,514 977,466 63.2% Source: ODA As shown in Table 1-4, based on testing volume, CPL has completed costing methodologies for 97.5 percent of its tests, while ADDL has completed costing methodologies for 63.2 percent of its tests. The percentage of tests accounted for with costing methodologies varies from a high of 100 percent in the CPL’s FIFRA and PDP disciplines to none for the ADDL’s Molecular discipline. As shown in Table 1-3, each discipline has similar costing categories that have been taken into account. However, in total, there is variation and when applied to the actual tests performed there are significant gaps remaining, especially within ADDL.
11 The Federal Insecticide, Fungicide, and Rodenticide Act (FIFRA) is one section of the Pesticide and Residue discipline. 12 The Pesticide Data Program (PDP) is one section of the Pesticide and Residue discipline.
Ohio Department of Agriculture Performance Audit
Page | 18
While the laboratory disciplines have developed costing methodologies that provide substantial coverage over each discipline and tests performed, these methodologies were developed independently. While it is understandable that not all tests will incur the same costs, utilizing a consistent overarching costing methodology would enable ODA to fully and uniformly capture the cost of providing laboratory services. The introduction of a consistent, comprehensive costing methodology across the laboratories would enable management to have the most accurate information when considering the prices of tests and the provision of services. During the course of this performance audit, ADDL began expanding its costing methodologies for laboratory tests, which should increase the percentage of tests with costing methodologies in the very near future. Conclusion ODA does not currently use a consistent and comprehensive costing methodology to determine the cost of providing individual laboratory tests. Further, the Department has not applied a consistent and comprehensive costing methodology to all test types. As such, laboratory and discipline management is at a disadvantage in its efforts to accurately determine the cost of each test when considering adjustments to test fees. Recommendation 1.1: ODA should develop and apply a consistent and comprehensive costing methodology for all tests provided by the laboratories. In doing so, the Department should fully consider all cost drivers that are significant to the operations of the Laboratory as a whole as well as each discipline. Where applicable to setting test prices, the Department should clearly identify where the actual cost per test is intended to be subsidized by the General Fund and the extent to which a subsidy is acceptable. Financial Implication 1.1: N/A. While savings may not be immediately quantifiable, ODA could realize future revenue enhancements through increased cost recovery for testing services once the full cost associated with the tests is understood.

Ohio Department of Agriculture Performance Audit
Page | 19
R1.2 Laboratory Efficiency Background Each year, the Laboratory drafts contracts with its major internal programs (i.e. Division of Plant Health) and some external customers (i.e., the Ohio State Racing Commission (OSRC)). The external facing contract between the Analytical Toxicology Laboratory (ATL) and the OSRC is much more detailed in nature, specifying the type of tests provided, a schedule of payments associated with that testing, and service-delivery expectations for the Laboratory. The contracts that are internal to ODA do not outline key provisions and expectations to be met, and are flat-rate contract amounts for the delivery of services, regardless of the number of samples tested. Both the Animal Disease Diagnostic Laboratory (ADDL) and Consumer Protection Laboratory (CPL) are considered diagnostic and regulatory laboratories. As such, they provide diagnostic (i.e. identification of disease) and regulatory (i.e. required by law) tests as a service to internal programs, veterinarians, and agricultural producers across the state. The Department strives to increase efficiency in order to keep test prices affordable for its clients and considers the following when calculating its fees:
• The actual cost to perform the test; • Fees charged by other competing public laboratories; • The time period from last fee increase; • The percentage increase from the current fee; and • Animal Health General Revenue Fund (GRF) funding availability.

Ohio Department of Agriculture Performance Audit
Page | 20
Employee Reported Time Laboratory employees incur regular pay, overtime or compensation time, and leave. Chart 1-1 shows total Laboratory staffing hours for Calendar Year (CY 2014) through CY 2016. This analysis provides an indication of potential patterns in hours worked as well as leave usage.
Chart 1-1: ODA Laboratory Total Payroll Hours
Source: OAKS Note: Employees record their hours to account for their time. These time code reporting descriptions can be classified as regular hours, leave hours, overtime or compensatory hours, compensation only hours, or adjustments. For the purposes of this analysis, compensation only hours and adjustments are excluded as they do not reflect hours worked or leave taken. As shown in Chart 1-1, reported hours were consistent from CY 2014 to CY 2016 and comprised a majority of the total hours. Additionally, there were no significant shifts in total reported hours in any of the categories. This data indicates the Laboratory does not rely heavily on overtime or compensatory time to complete the required workload. The hours reported on employee timesheets as either regular pay, comp time, or overtime, while excluding leave, is referred to as payroll reported hours. Reported hours in the payroll system associated with testing are referred to as available production hours. It was necessary for ODA to

Ohio Department of Agriculture Performance Audit
Page | 21
estimate available production hours because all Laboratory employees are not directly related to testing. As a result, ODA identified which employees are directly involved in testing. Also, the time associated with testing for those employees that are only partially devoted to testing, was estimated by ODA. Chart 1-2 shows the reported hours in the payroll system and available production hours for CY 2014 and CY 2016. This demonstrates the difference in total hours associated with testing relative to total payroll reported hours.
Chart 1-2: Payroll Reported Hours vs. Available Production Hours
Source: ODA As shown in Chart 1-2, payroll reported hours increased slightly from CY 2014 to CY 2016, as have the available production hours. In CY 2016, 56.8 percent of the laboratories payroll reported hours were available production hours showing that slightly over half of employee hours are associated with the laboratory output data.

Ohio Department of Agriculture Performance Audit
Page | 22
Methodology This sub-section, Laboratory Efficiency, seeks to assess and evaluate the efficiency of ADDL and CPL operations with a focus on identifying opportunities for improved efficiency and effectiveness. During the planning and scoping phase of this performance audit, ODA leadership identified the laboratories as an area that an objective analysis could identify opportunities for improvement. Staffing information was obtained from the Ohio Administrative Knowledge System (OAKS). Workload information (e.g., samples, analyses, and parameters) was obtained from ODA’s Laboratory Information Management System (LIMS) database for the CPL and ADDL laboratories and costing workbooks and methodologies were obtained from ODA’s Laboratory Directors. Where necessary to develop a full understanding of operations, ODA leadership and staff provided supplemental testimonial evidence. Primary analysis and conclusions were based on CY 2014 through CY 2016 data. The analysis identifies employee reported labor as approved on their timesheets. Next, reported hours associated with testing were identified by laboratory managers associating a percentage of time spent on testing for each position on the table of organization. The analysis then quantifies the direct testing labor associated with each test overlaying the costing workbook methodologies with the LIMS output data. Finally, by comparing the reported labor with the calculated labor, the analysis identifies areas where there are unaccounted for labor hours.

Ohio Department of Agriculture Performance Audit
Page | 23
Analysis Workload Hours ODA has developed testing methodologies to identify the associated cost of select test types. Table 1-5 shows the percentage of tests that have costing methodologies currently completed for each laboratory discipline. This demonstrates which disciplines have conducted costing methodologies on more of their unique test types.
Table 1-5: Unique Tests with Costing Methodologies by Discipline
Discipline Tests with Costing
Methodologies Tests Available in LIMS % of Tests w/Costing
Methodologies CPL
General Chemistry 54 64 84.4% Microbiology 34 57 59.6% FIFRA 13 13 100.0% PDP 1 1 100.0% ATL 7 40 17.5% CPL Total 109 175 62.3%
ADDL Avian Serology 17 34 50.0% Virology 11 107 10.3% Pathology 14 29 48.3% Bacteriology 10 54 18.5% Molecular 0 93 0.0% Serology 15 41 36.6% ADDL Total 67 358 18.7% Total All Laboratories 176 533 33.0% Source: ODA As shown in Table 1-5, based on the unique tests offered, CPL has completed costing methodologies for 62.3 percent of their tests, while ADDL has completed costing methodologies for 18.7 percent of their tests.
Ohio Department of Agriculture Performance Audit
Page | 24
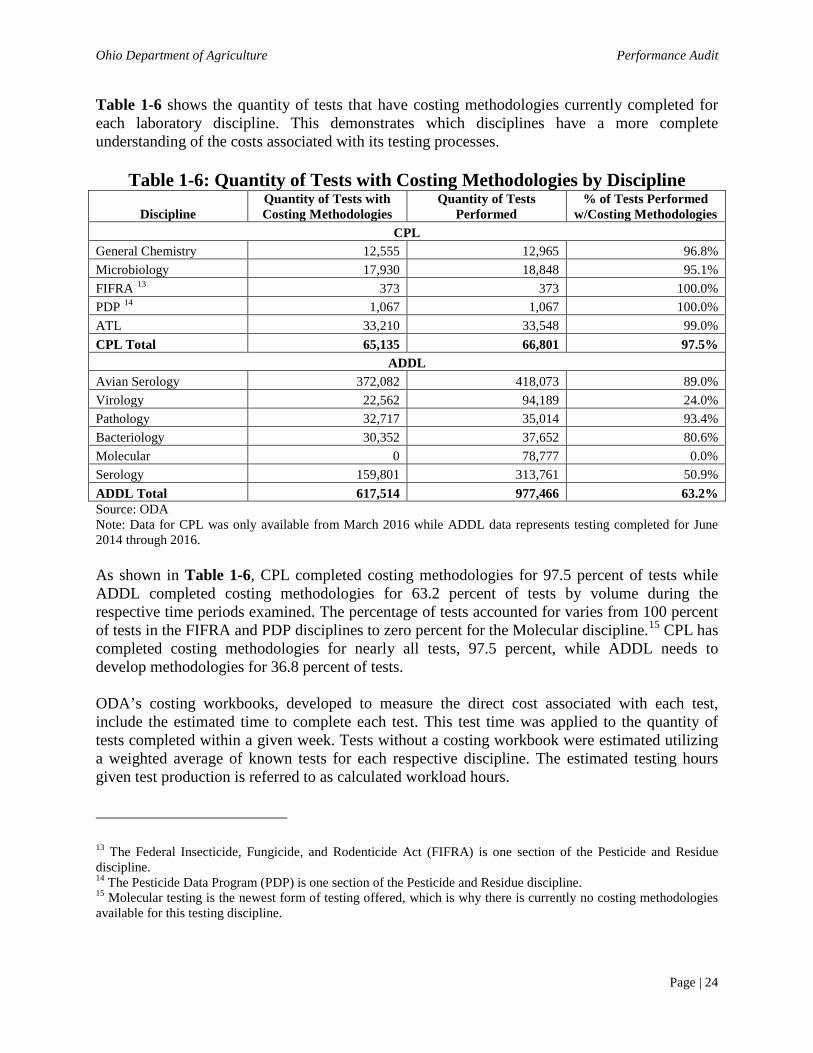
Table 1-6 shows the quantity of tests that have costing methodologies currently completed for each laboratory discipline. This demonstrates which disciplines have a more complete understanding of the costs associated with its testing processes.
Table 1-6: Quantity of Tests with Costing Methodologies by Discipline
Discipline Quantity of Tests with Costing Methodologies
Quantity of Tests Performed
% of Tests Performed w/Costing Methodologies
CPL General Chemistry 12,555 12,965 96.8% Microbiology 17,930 18,848 95.1% FIFRA 13 373 373 100.0% PDP 14 1,067 1,067 100.0% ATL 33,210 33,548 99.0% CPL Total 65,135 66,801 97.5%
ADDL Avian Serology 372,082 418,073 89.0% Virology 22,562 94,189 24.0% Pathology 32,717 35,014 93.4% Bacteriology 30,352 37,652 80.6% Molecular 0 78,777 0.0% Serology 159,801 313,761 50.9% ADDL Total 617,514 977,466 63.2% Source: ODA Note: Data for CPL was only available from March 2016 while ADDL data represents testing completed for June 2014 through 2016. As shown in Table 1-6, CPL completed costing methodologies for 97.5 percent of tests while ADDL completed costing methodologies for 63.2 percent of tests by volume during the respective time periods examined. The percentage of tests accounted for varies from 100 percent of tests in the FIFRA and PDP disciplines to zero percent for the Molecular discipline.15 CPL has completed costing methodologies for nearly all tests, 97.5 percent, while ADDL needs to develop methodologies for 36.8 percent of tests. ODA’s costing workbooks, developed to measure the direct cost associated with each test, include the estimated time to complete each test. This test time was applied to the quantity of tests completed within a given week. Tests without a costing workbook were estimated utilizing a weighted average of known tests for each respective discipline. The estimated testing hours given test production is referred to as calculated workload hours. 13 The Federal Insecticide, Fungicide, and Rodenticide Act (FIFRA) is one section of the Pesticide and Residue discipline. 14 The Pesticide Data Program (PDP) is one section of the Pesticide and Residue discipline. 15 Molecular testing is the newest form of testing offered, which is why there is currently no costing methodologies available for this testing discipline.

Ohio Department of Agriculture Performance Audit
Page | 25
Laboratory Output Chart 1-3 shows the payroll reported hours and laboratory test output, by quantity of tests produced, for CY 2016. This shows how the hours worked compared to the quantity of tests produced during the same time frame.
Chart 1-3 Available Production Hours and Test Output
Source: ODA As shown in Chart 1-3, while tests do not all take the same amount of time to complete, test output mirrors the number of hours worked. For example, during August and September, when the laboratory output was at its highest point, the reported payroll hours also showed a spike. This suggests that a greater quantity of test output requires a greater number of reported hours to complete.
Ohio Department of Agriculture Performance Audit
Page | 26
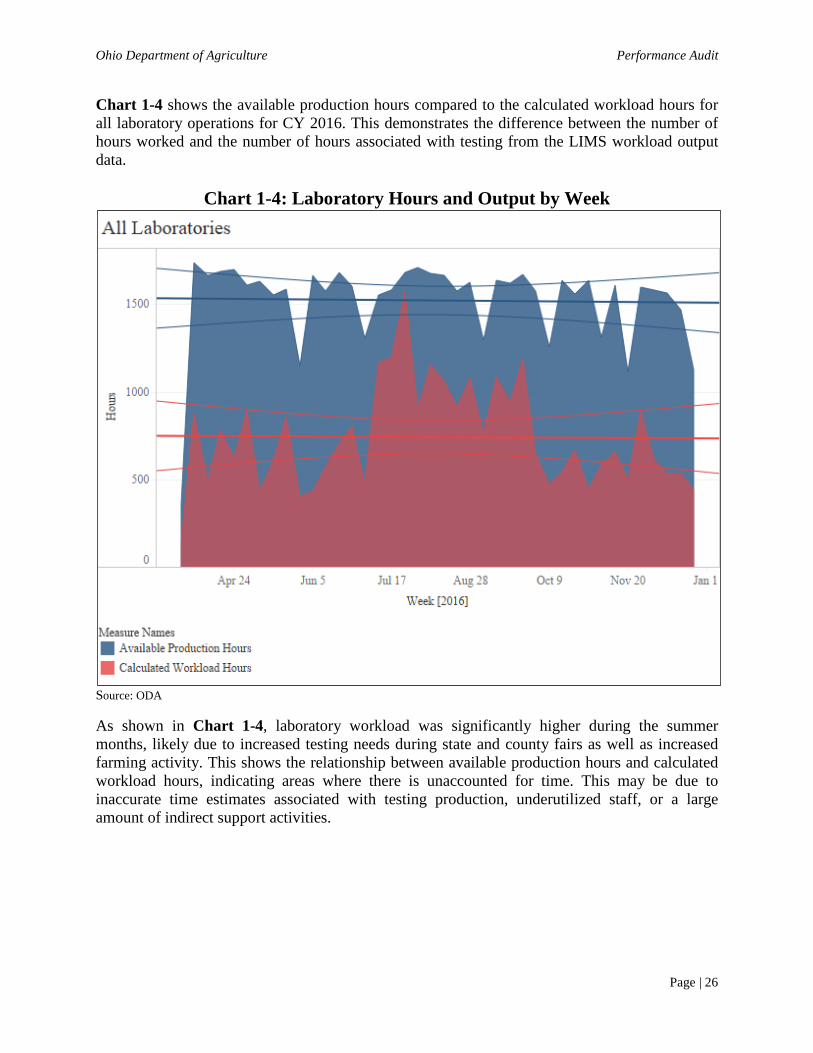
Chart 1-4 shows the available production hours compared to the calculated workload hours for all laboratory operations for CY 2016. This demonstrates the difference between the number of hours worked and the number of hours associated with testing from the LIMS workload output data.
Chart 1-4: Laboratory Hours and Output by Week
Source: ODA As shown in Chart 1-4, laboratory workload was significantly higher during the summer months, likely due to increased testing needs during state and county fairs as well as increased farming activity. This shows the relationship between available production hours and calculated workload hours, indicating areas where there is unaccounted for time. This may be due to inaccurate time estimates associated with testing production, underutilized staff, or a large amount of indirect support activities.

Ohio Department of Agriculture Performance Audit
Page | 27
Chart 1-5 shows the available production hours compared to calculated workload hours for the ADDL laboratory for CY 2016. This demonstrates the difference between the number of hours worked and the number of hours associated with testing from the LIMS workload output data.
Chart 1-5: ADDL Hours and Output by Week
Source: ODA As shown in Chart 1-5, available production hours and calculated workload hours declined slightly. Additionally, available production hours outpaced calculated workload hours by approximately 100 percent.

Ohio Department of Agriculture Performance Audit
Page | 28
Chart 1-6 shows available production hours compared to the calculated workload hours for the CPL for CY 2016. This demonstrates the difference between the number of hours worked and the number of hours associated with testing from the LIMS workload output data.
Chart 1-6: CPL Hours and Output by Week
Source: ODA As shown in Chart 1-6, laboratory production outpaced the total hours worked in June through September. This spike in the summer months is a result of additional testing to CPL due to testing samples from county fairs. While CPL used temporary employees to assist with these tests, the spike in production outpaced the increase in hours associated with hiring temporary employees.
Ohio Department of Agriculture Performance Audit
Page | 29
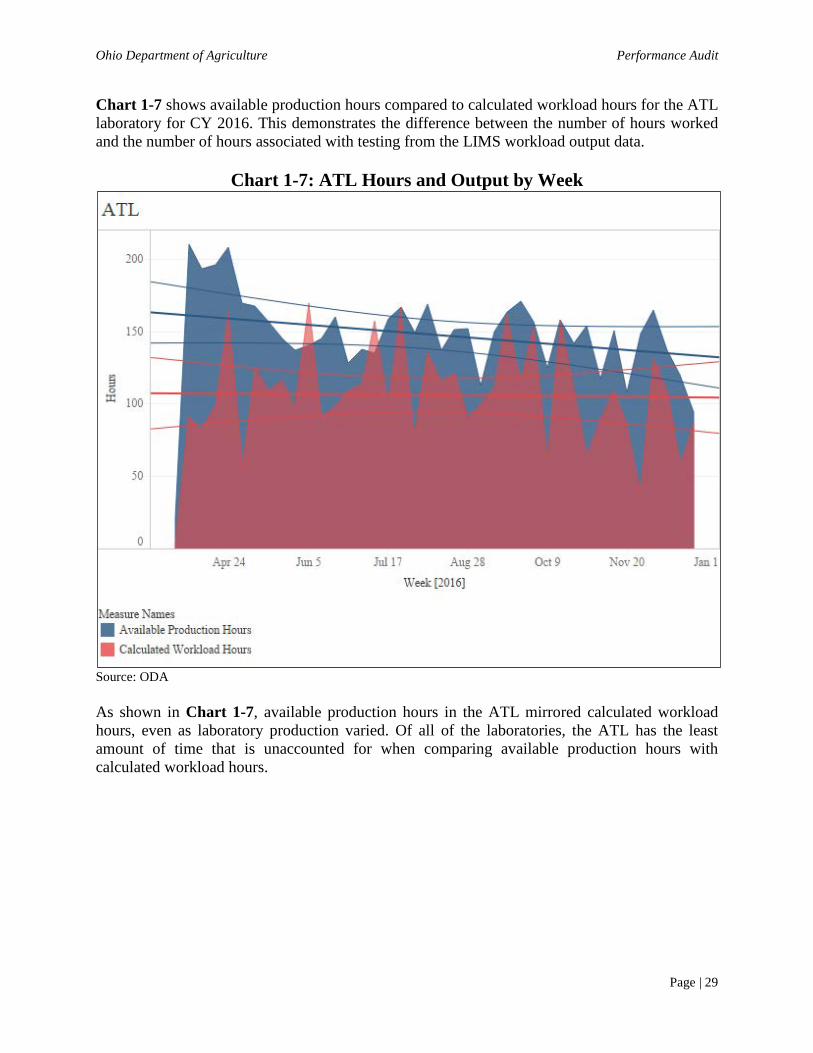
Chart 1-7 shows available production hours compared to calculated workload hours for the ATL laboratory for CY 2016. This demonstrates the difference between the number of hours worked and the number of hours associated with testing from the LIMS workload output data.
Chart 1-7: ATL Hours and Output by Week
Source: ODA As shown in Chart 1-7, available production hours in the ATL mirrored calculated workload hours, even as laboratory production varied. Of all of the laboratories, the ATL has the least amount of time that is unaccounted for when comparing available production hours with calculated workload hours.

Ohio Department of Agriculture Performance Audit
Page | 30
Calculated workload hours utilizing costing methodologies and reported testing hours were identified at the discipline level (see Appendix 1.A Laboratory Disciplines Hours and Output by Week CY 2016). By analyzing it at the discipline level, additional trends can be examined. Chart 1-8 shows available production hours compared to calculated workload hours for the CPL General Chemistry discipline for CY 2016. This demonstrates the difference between the number of hours worked relative to the number of hours associated with testing from the LIMS workload output data.
Chart 1-8: CPL General Chemistry Hours and Output by Week
Source: ODA As shown in Chart 1-8, calculated workload hours varied significantly with a large spike in calculated work hours occurring in July through September. This spike was due to a large number of tests being required during the summer months, resulting in the laboratory hiring temporary staff to assist with the increased workload. As previously noted in Chart 1-1, there were not large spikes in the amount of overtime or compensatory time associated with the increased workload. This suggests that the laboratory staff may be more efficient during these busy times, or are deferring other indirect activities such as training and quality assurance work.

Ohio Department of Agriculture Performance Audit
Page | 31
Chart 1-9 shows available production hours compared to calculated workload hours for the CPL Microbiology discipline for CY 2016. This demonstrates the number of hours associated with testing relative to the number of hours worked.
Chart 1-9: CPL Microbiology Hours and Output by Week
Source: ODA As shown in Chart 1-9, available production hours varied significantly from calculated workload hours in the microbiology discipline. Calculated workload hours for this discipline associated with production was only a fraction of the available production hours, indicating a large quantity of unaccounted for hours that may be attributed to downtime, unaccounted for indirect labor activities, or the need for better time studies into production rates. The juxtaposition between Chart 1-8 and Chart 1-9 demonstrate the significant variability among laboratory disciplines. According to The Ideal Laboratory Information System (Archives of Pathology & Laboratory Medicine16, 2013) laboratory information systems need to incorporate advanced developments and bioinformatics to generate the most benefits for clinical use. Best practices noted for LIMS include the ability to produce reports of laboratory productivity and management efficiency by aggregate numbers, such as the number of total billable tests, number of Full Time Equivalent
16 The Archives of Pathology & Laboratory Medicine is a monthly, peer-reviewed journal of the College of American Pathologists.

Ohio Department of Agriculture Performance Audit
Page | 32
(FTE), hours worked, and laboratory costs (broken down by discipline, variable costs, and fixed costs). Currently, the Laboratory’s data indicates variation between the total number of reported hours associated with testing and total laboratory production. As analyzed in R1.1, some of this unaccounted for time could be associated with costing methodologies that do not fully consider all of the inputs to laboratory output, however, by not capturing more specific time reporting information, the cause for unaccounted for time is unknown. Collecting this data would allow the Department to analyze the laboratories production efficiency. Conclusion ODA does not currently have a time reporting system that measures direct labor associated with output as well as labor associated with method development and quality assurance. Therefore, division management is unable to accurately determine the peak operational efficiency of its laboratories. Further, by doing so, ODA could prepare for or adjust staffing supply to correspond with testing demand. Recommendation 1.2: ODA should utilize a data system that allows for the capture of direct labor hours associated with output, in order to measure and manage operational efficiency within the laboratories. Financial Implication 1.2: N/A
Ohio Department of Agriculture Performance Audit
Page | 33
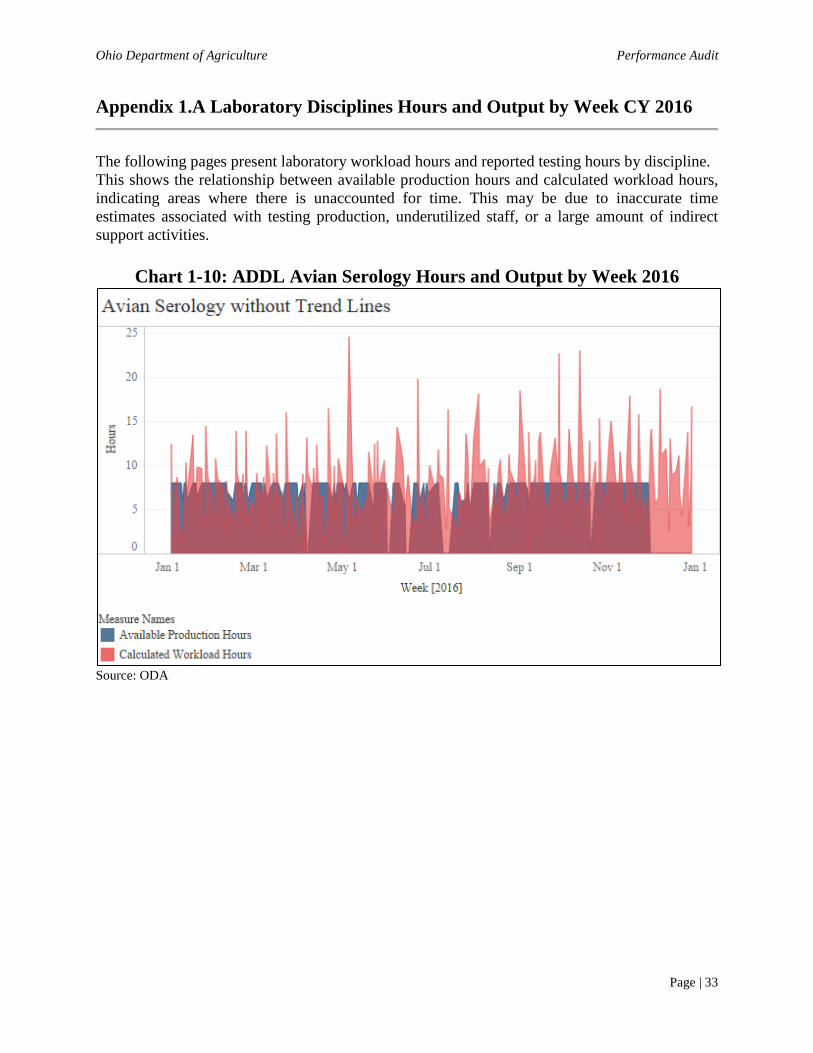
Appendix 1.A Laboratory Disciplines Hours and Output by Week CY 2016
The following pages present laboratory workload hours and reported testing hours by discipline. This shows the relationship between available production hours and calculated workload hours, indicating areas where there is unaccounted for time. This may be due to inaccurate time estimates associated with testing production, underutilized staff, or a large amount of indirect support activities.
Chart 1-10: ADDL Avian Serology Hours and Output by Week 2016
Source: ODA

Ohio Department of Agriculture Performance Audit
Page | 34
Chart 1-11: ADDL Bacteriology Hours and Output by Week 2016
Source: ODA
Chart 1-12: ADDL Pathology Hours and Output by Week 2016
Source: ODA

Ohio Department of Agriculture Performance Audit
Page | 35
Chart 1-13: ADDL Serology Hours and Output by Week 2016
Source: ODA
Chart 1-14: ADDL Virology Hours and Output by Week 2016
Source: ODA

Ohio Department of Agriculture Performance Audit
Page | 36
Chart 1-15: CPL General Chemistry Hours and Output by Week 2016
Source: ODA
Chart 1-16: CPL Microbiology Hours and Output by Week 2016
Source: ODA

Ohio Department of Agriculture Performance Audit
Page | 37
Chart 1-17: CPL Pesticide/Residue Hours and Output by Week 2016
Source: ODA Note: The PDP and Residue sections are combined for the purposes of this report, as they have one manager, but ODA considers them separate disciplines.
Chart 1-18: ATL Hours and Output by Week 2016
Source: ODA

Ohio Department of Agriculture Performance Audit
Page | 38
2. Facility Utilization
Section Overview This section focuses on the Ohio Department of Agriculture’s (ODA or the Department) facility management practices. Specifically, information was collected and analyzed to develop a profile of the Department’s facility usage. The analysis identified opportunities to reduce costs by more efficiently aligning facility supply and demand. The Facility Utilization section is divided into four subsections, each analyzing a distinct element of the Department’s facility usage including:
• Space Utilization: The first subsection analyzes how tenant revenue could be increased through right-sizing space and bringing utilization in line with industry benchmarks.
• Meeting Room Utilization: The second subsection analyzes additional tenant revenue that could be realized by repurposing underutilized meeting rooms.
• Equipment Utilization: The third subsection analyzes the benefit of tracking the utilization of grounds-keeping equipment.
• Chemical Storage: The fourth subsection analyzes the benefits of ensuring that chemicals are properly stored.
Recommendation Overview Recommendation 2.1: ODA should consolidate office and laboratory space to maximize the efficiency of the Department’s facility space. Through consolidation, ODA will be able to rent out its excess space to other entities, resulting in additional revenue. Financial Implication 2.1: ODA could obtain $485,727 in additional revenue annually by consolidating office and laboratory space in line with industry benchmarks and leasing excess space to other entities. Recommendation 2.2: ODA should track the utilization of meeting room space and consider repurposing underutilized meeting rooms as office space. Financial Implication 2.2: Repurposing one underutilized meeting room as tenant office space could generate $6,526 in additional annual revenue. Recommendation 2.3: ODA should track the usage of its grounds keeping and facility maintenance equipment. Further, the Department should right-size its maintenance fleet and equipment inventory based on the usage data. In doing so, the Department should identify and properly dispose of equipment determined to be inoperable or too costly to repair. Financial Implication 2.3: N/A. The disposal of underutilized equipment could result in one time revenue as well as a reduction in ongoing maintenance costs. However, these financial benefits could not be quantified at this time because of the lack of reliable utilization data.

Ohio Department of Agriculture Performance Audit
Page | 39
Recommendation 2.4: ODA should ensure that all chemicals are properly stored in accordance with leading practices and, if no longer needed, properly disposed of in accordance with applicable regulations. Where necessary, the Department should develop policies and procedures to ensure these practices are consistently carried out. Financial Implication 2.4: N/A

Ohio Department of Agriculture Performance Audit
Page | 40
Section Background ODA operates office and laboratory facilities at a central campus in Reynoldsburg in order to fulfill the Department’s mission to “protect Ohio citizens by ensuring the safety of the state’s food supply, to maintain the health of Ohio’s animals and plant life, and to create economic opportunities for Ohio’s farmers, food processors and agribusinesses.” Exhibit 2-1 shows the location and types of the 12 buildings on ODA’s Reynoldsburg campus. This demonstrates the close proximity of ODA’s buildings.
Exhibit 2-1: ODA Reynoldsburg Campus
Source: ODA and Google

Ohio Department of Agriculture Performance Audit
Page | 41
As shown in Exhibit 2-1, ODA has many buildings at the Reynoldsburg campus. These buildings serve a variety of roles, primarily consisting of:
• Offices – Clerical or administrative workspaces consisting of cubicles or individual offices.
• Laboratories – Workspaces for the dissection and investigation of various items tested, including animals, plants, and fertilizers.
• Maintenance Buildings – Workspaces used for the storage and repair17 of equipment. • Dangerous Wild Animals Building – Space to house, care for, and find a permanent
home for confiscated animals through ODA’s Dangerous Wild Animal Office. Although ODA has a sizeable campus in Reynoldsburg, many of the Department’s employees do not work from this location; a significant portion are field staff due to the strategic need to inspect and collect data on farms, meat processing plants, and other facilities. Table 2-1 shows the distribution of ODA employees by building as well as the number of employees considered field staff. This analysis provides a gauge of the size of ODA field employee staff in relation to the size of the Reynoldsburg campus staff.
Table 2-1: ODA Staff by Work Location Building No. Building Name Employees by Building 1 % of Total #21 Bromfield Office Building 76.5 16.1% #3 Consumer Protection Laboratory 37.5 7.9% #6 Animal Health Laboratory 36.5 7.7% #23 Plant Health Laboratory 33.5 7.0% #1 A. B. Graham Office Building 27.0 5.7% A, B, and C Maintenance Buildings 8.0 1.7% #5 Weights and Measures Laboratory 7.0 1.5% #4 Stackhouse Laboratory 1.0 0.2%
Total Employees at Reynoldsburg Campus 227.0 47.7%
Total Field Employees 2 249.0 52.3%
Total 476.0 100.0% Sources: OAKS and ODA Note: Headcount as of February 27, 2017 1 ODA identified that some laboratory staff have laboratory space and office space in different buildings. These individuals were accounted for with 0.5 increments in each building to account for this division of space. 2 Field employees include staff headquartered out of remote offices.
17 Although the Department contracts out the servicing of its vehicles, emergency repairs on vital testing tools are conducted here as well as the maintenance of grounds keeping equipment.

Ohio Department of Agriculture Performance Audit
Page | 42
R2.1 Space Utilization Background ODA operates five laboratories and two office buildings on its Reynoldsburg campus. These facilities are used to deliver key resources and services to the Department’s clients. Methodology This sub-section, Space Utilization, seeks to analyze the utilization of ODA’s offices and laboratories. During the planning and scoping phase of the performance audit, Department leadership identified this as an area where analysis might identify opportunities for improved efficiency. Sources of data include ODA, the Ohio Department of Administrative Services (DAS), and the Ohio Administrative Knowledge System (OAKS). The data points used in the analysis focused on FY 2016-17, as this was the most current data at the time the analysis was completed. All cases requiring clarification were addressed through the inclusion of centrally-held information and were supplemented by testimonial or documentary evidence from knowledgeable facilities employees. The analysis first examines the quantity of office and laboratory space at ODA’s Reynoldsburg Campus. The analysis then calculates the utilization of this space, weighing employee space requirements against an industry benchmark. Finally, the analysis quantifies the potential cost savings associated with consolidating the Department’s use of space.

Ohio Department of Agriculture Performance Audit
Page | 43
Analysis Facilities Space Measurement According to the Building Owners and Managers Association18, square footage can be calculated several different ways depending on the purpose of the measurement. Rentable square feet/footage (RSF) is commonly used in the facility management industry to determine rent, as it focuses on the specific area a tenant will occupy plus a share of building amenities including lobbies, restrooms, and hallways, while excluding elevator shafts and stairwells. ODA facilities vary in size, largely depending on the services provided and the Department’s staffing needs at the time of construction. Table 2-2 shows the Department’s RSF by facility and the employees by building using FY 2016-17 data. This analysis uses RSF per employee to provide an indication of the disparity in staffing density between buildings.
Table 2-2: ODA Building Staffing and RSF
Building Number Building Name Rentable Square
Footage 1 Employees by
Building RSF per
Employee #4 Stackhouse Laboratory 1,459 2 1.0 1,459 #3 Consumer Protection Laboratory 36,868 37.5 983 #6 Animal Health Laboratory 24,203 36.5 663
#23 Plant Health Laboratory 19,324 33.5 577 #1 A. B. Graham Office Building 14,752 27.0 546
#21 Bromfield Office Building 32,809 76.5 429 Total 129,415 212 N/A Average 21,569 35.3 611 Sources: ODA, Licking County Auditor, and OAKS 1 For the purposes of this analysis, highly specialized space, or space not suitable for general office or laboratory use, was excluded. Examples include; designated maintenance areas, the animal necropsy laboratory, the weights and measures laboratory, designated meeting rooms, and the Bromfield Office Building lobby. 2 The Stackhouse Laboratory is occupied primarily by Health and United States Department of Agriculture (USDA), whose space has been excluded for the purpose of this analysis. Only two rooms are associated with ODA. As shown in Table 2-2, the Stackhouse Laboratory has the most space per employee, with 1,459 RSF per employee while the Bromfield Office Building has the least space per employee, at 429 RSF. ODA’s largest laboratories, the Consumer Protection Laboratory and Animal Health Laboratory, consist of 983 and 663 RSF per employee respectively.
18 The Building Owners and Managers Association (BOMA) is a facilities management industry organization, founded in 1907, that publishes building measurement standards.
Ohio Department of Agriculture Performance Audit
Page | 44
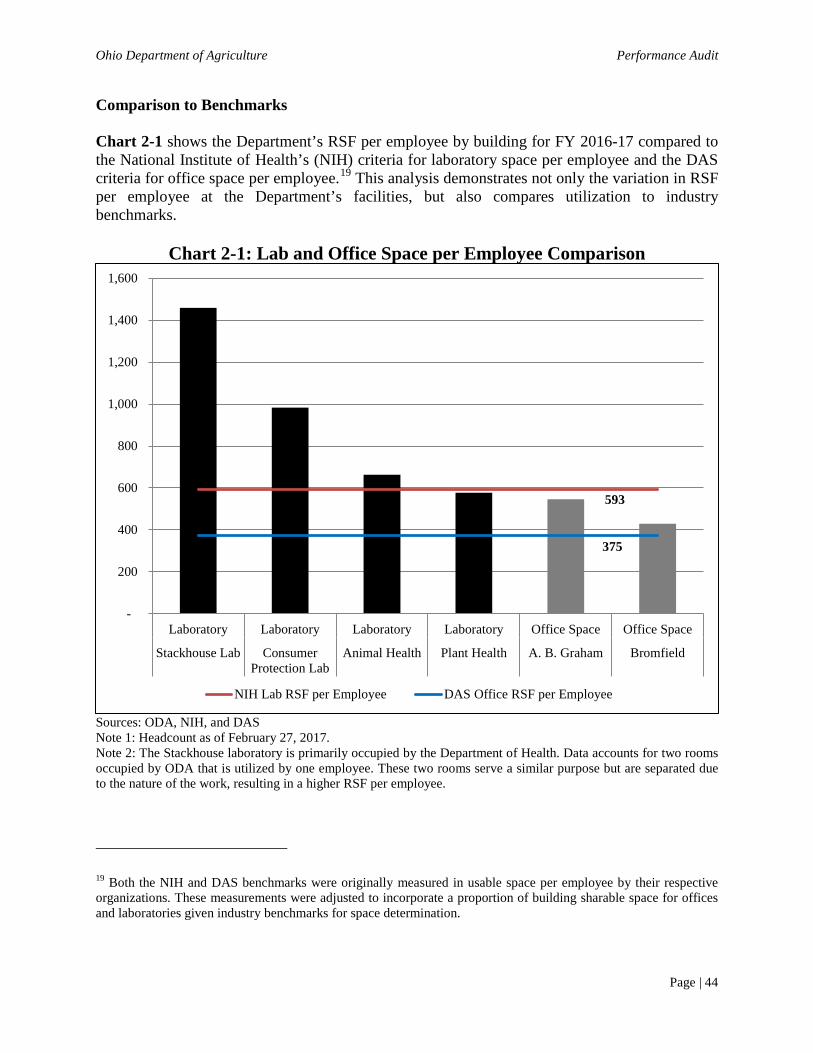
Comparison to Benchmarks Chart 2-1 shows the Department’s RSF per employee by building for FY 2016-17 compared to the National Institute of Health’s (NIH) criteria for laboratory space per employee and the DAS criteria for office space per employee.19 This analysis demonstrates not only the variation in RSF per employee at the Department’s facilities, but also compares utilization to industry benchmarks.
Chart 2-1: Lab and Office Space per Employee Comparison
Sources: ODA, NIH, and DAS Note 1: Headcount as of February 27, 2017. Note 2: The Stackhouse laboratory is primarily occupied by the Department of Health. Data accounts for two rooms occupied by ODA that is utilized by one employee. These two rooms serve a similar purpose but are separated due to the nature of the work, resulting in a higher RSF per employee.
19 Both the NIH and DAS benchmarks were originally measured in usable space per employee by their respective organizations. These measurements were adjusted to incorporate a proportion of building sharable space for offices and laboratories given industry benchmarks for space determination.
593
375
-
200
400
600
800
1,000
1,200
1,400
1,600
Laboratory Laboratory Laboratory Laboratory Office Space Office Space
Stackhouse Lab ConsumerProtection Lab
Animal Health Plant Health A. B. Graham Bromfield
NIH Lab RSF per Employee DAS Office RSF per Employee

Ohio Department of Agriculture Performance Audit
Page | 45
As shown in Chart 2-1, with the exception of the Plant Health Laboratory, all of the Department’s facilities have a higher RSF per employee than the industry laboratory and office space benchmarks of 593 and 375 RSF per employee, respectively. Although the Stackhouse Laboratory and Weights and Measures buildings have the highest RSF per employee, it should be noted that they are heavily influenced by very few employees, with only one employee in the Stackhouse Laboratory. Repurposing Excess Space Although ODA owns its buildings, there is an ongoing cost associated with their operations and maintenance. As a result, this creates an opportunity to realize greater cost-effectiveness in managing these facilities by repurposing any excess space. Table 2-3 shows the total excess office and laboratory space at ODA’s Reynoldsburg Campus. This highlights the proportion of excess space available at ODA’s facilities using leading industry guidelines for space management as a measure.
Table 2-3: Excess Space by Type
Office Space Laboratory Space
Total RSF 47,561 62,530 Optimized ODA RSF 1 38,813 44,449 Estimated Excess RSF 8,748 18,081 Estimated Excess RSF as % of Total 18.4% 28.9% Sources: ODA, NIH, and DAS 1 Optimized ODA RSF is based on aligning the Department’s occupied space with industry benchmarks given ODA’s current staffing. As shown in Table 2-3, ODA has 8,748 excess office square feet, 18.4 percent of its total available space. This space could be made available for third party use for a fee if ODA consolidated its space to certain areas of the Reynoldsburg campus. Table 2-3 also shows that ODA has 18,081 excess square laboratory square feet, 28.9 percent of its total available space. Although consolidation of laboratory space may be more difficult than consolidating office space, through proper execution, this can be done. According to the National Institute of Building Sciences,20 “the open lab format facilitates communication between scientists and makes the lab more easily adaptable for future needs. A wide variety of labs—from wet biology and chemistry labs, to engineering labs, to dry computer science facilities—are now being designed as open labs.” ODA laboratory space, although partially made up of small laboratory work rooms, consists of large open-space working environments. This facilitates consolidation efforts as it provides maximum flexibility in regards to workbench space as well as laboratory equipment. Although some laboratories require
20 The National Institute of Building Sciences is a nonprofit organization focused on advancing building construction technologies while reducing waste, energy, and resources.

Ohio Department of Agriculture Performance Audit
Page | 46
seclusion and high levels of security, ODA acknowledged that even these areas may not need to be as large as they currently are. The Department’s laboratory requirements have changed over the last several decades, due to changes in demand, funding, and equipment associated with ODA’s research. ODA noted that some of its rooms have excess space because they originally were established as a different kind of laboratory or a laboratory requiring a higher staffing level than the present. In other cases, some laboratories benefited from advancements in equipment. For example, in several laboratories, a single piece of testing equipment has replaced what previously might have required up to five pieces of equipment. Table 2-4 shows the potential revenue associated with its excess office and laboratory space using current ODA laboratory lease rates with the USDA and state agency office space lease rates for the greater Columbus area. Although actual rent could vary, these two revenue criteria are the best indication of the value of ODA’s available space.
Table 2-4: Excess Space and Associated Potential Revenue
Estimated Revenue From Excess Space Greater Columbus, State
Office Space Lease Average 1 Current USDA Laboratory
Lease Rate 2 Estimated Excess Space 8,748 18,081 Estimated Market Rate $11.81 $21.15 Forgone Rent From Estimated Excess Space $103,314 $382,413 Sources: ODA, USDA, and OAKS Note 1: The greater Columbus, state office lease average is calculated based on the average rental rate per square foot per year for office space utilized by state agencies in the greater Columbus area. Note 2: Just as the NIH criteria includes laboratory space allocations in its benchmark for both laboratory and office Space, ODA currently rents a mixture of laboratory and office space to the USDA at $21.15 per square foot. As shown in Table 2-4, ODA could generate additional revenue in the amount of $103,314 from additional office rent and $382,413 from additional laboratory rent. ODA leadership explained that in recent years, the Department has had external parties show interest in the potential to lease both office and laboratory space, but no agreement had been reached.. Although ODA currently occupies most areas within its buildings, it is not occupying them efficiently as shown in Chart 2-1, resulting in missed opportunities for additional revenue or increased savings. ODA expressed concern that some laboratory buildings are near their electric capacities, potentially causing problems with laboratory consolidation. Staffing and some equipment, however, could be consolidated by using a shared work environment. Other equipment could be shared resulting in greater efficiencies and reducing need for equipment replacement and repair. Examples of equipment that could be shared include; autoclaves, centrifuges, biohazard cabinets, computers, refrigerators, freezers, and fume hoods. ODA identified that it likely will need to invest in building utility upgrades in the future, with or without space consolidation. The additional revenue created by space rental could assist in these upgrades.

Ohio Department of Agriculture Performance Audit
Page | 47
Conclusion ODA’s laboratory needs have changed over the last several decades. As a result, when compared to industry benchmarks, the Department has excess office and laboratory square footage. ODA could rent this excess space to other state and federal entities to generate additional revenue. Recommendation 2.1: ODA should consolidate office and laboratory space to maximize the efficiency of the Department’s facility space. Through consolidation, ODA will be able to rent out its excess space to other entities, resulting in additional revenue. Financial Implication 2.1: ODA could obtain $485,727 in additional revenue annually by consolidating office and laboratory space in line with industry benchmarks and leasing excess space to other entities.

Ohio Department of Agriculture Performance Audit
Page | 48
R2.2 Meeting Room Utilization Background ODA has large meeting rooms in most of its facilities. These rooms are used primarily by ODA staff; however, several rooms are available to other State agencies and the public for a fee. ODA’s central campus is in close proximity to other state and federal entities, enabling ODA to lease space. The Ohio Department of Rehabilitation and Correction and the United States Department of Agriculture have used these facilities, and other organizations have shown interest in doing so. Methodology This subsection, Meeting Room Utilization, analyzes the use of the meeting rooms at ODA’s campus. During the planning and scoping of the performance audit, ODA leadership identified this as an area in which analysis might find opportunities for improved efficiency. The primary source of data was ODA’s Room Reservation System, an internal database to schedule the use of meeting rooms. The system identifies the room and the date, time and purpose of each meeting. The analysis focused on 2015 and 2016, as these were the two most recent years in which a full data-set was available. Administrative and IT employees were consulted and provided documentation when questions arose about meeting-room data. Scheduling was analyzed hour by hour, to determine frequency of use and how often multiple rooms were occupied simultaneously.

Ohio Department of Agriculture Performance Audit
Page | 49
Analysis ODA has meeting rooms for employee use in most of its buildings; however, some rooms can be reserved through the Department’s Room Reservation System. A review of the database showed that some rooms are reserved more often than others. Table 2-5 shows these rooms and their estimated size in square feet. This analysis is important because it highlights the amount of space available for meetings.
Table 2-5: Meeting Rooms Available Within Room Reservation Database
Building Number Room Number Estimated Usable Square
Feet Reservation System
Utilization 1 3 024 CAL 485 Infrequent Use 5 WM 1 502 Infrequent Use 6 AI Conf Rm 608 Infrequent Use 23 101 686 Frequent Use 21 129 820 Frequent Use 21 133 782 Frequent Use 21 207 449 Frequent Use 21 308 737 Frequent Use 21 Auditorium 2 4,071 Frequent Use Source: ODA 1 Infrequent use was defined as rooms with less than 5 percent of the reservations as the busiest room. 2 The auditorium can be used as a single room or subdivided into three individual rooms using existing separators. As shown in Table 2-5, ODA has 9 meeting rooms available for reservation; however, outside of Bromfield (i.e., Building 21) and Plant Health (i.e., Building 23), the use of several of these rooms was not actively tracked. Unlike other buildings on the ODA campus, Bromfield was designed with extra meeting rooms. These rooms were to serve as central meeting space, limiting the need for meeting space in other buildings, with the Plant Health Meeting Room as the main overflow space. Although unscheduled walk-in meetings are possible in Bromfield and the Plant Health buildings, such opportunities are limited. Meeting rooms in other buildings are used primarily by the occupants of those buildings, and although these rooms are available within the Room Reservation System, there is no formal use of the system by the occupants of these buildings.

Ohio Department of Agriculture Performance Audit
Page | 50
Table 2-6 shows the utilization of the six ‘frequent use’ meeting rooms identified in Table 2-5 that utilized the Meeting Room Reservation system in 2015 through 2016. The maximum utilization per day indicates the maximum number of rooms occupied simultaneously during the busiest hour of each business day. The annual average number of occurrences column shows how many days each year each utilization rate occurred.
Table 2-6: Meeting Rooms Utilization CY 2015 to CY 2016
Maximum Rooms In Use Per Day % of Rooms in Use
Number of Days This Occurred
Annual Average Number Of Occurrences % of Total
0 0% 22 11.0 4.4% 1 17% 54 27.0 10.7% 2 33% 94 47.0 18.7% 3 50% 119 59.5 23.6% 4 67% 132 66.0 26.2% 5 83% 69 34.5 13.7% 6 100% 11 5.5 2.2% 7 117% 3 1.5 0.6%
Total 504 252.0 100.0% Source: ODA Note: The auditorium, although previously counted as one room, can be subdivided into three individual rooms using existing separators. This allows for utilization in excess of 100 percent. As shown in Table 2-6, ODA most frequently had four rooms utilized simultaneously during the busiest moment of each day, a frequency of 26.2 percent, followed by three rooms utilized at a frequency of 23.6 percent. During the two year span, all available meeting rooms – six or more – were occupied on 14 days, or 7 days per year. This indicates that it is likely that some of ODA’s rooms are being underutilized. Table 2-7 shows the opportunity cost associated with keeping ODA’s most underutilized space, the Plant Health Meeting Room, as a meeting room as opposed to renting it to another State agency for office space. On average, ODA only needs this space for meetings on the seven days a year when the ODA’s meeting-space demand reaches maximum levels. If the Plant Health Meeting Room is not available any longer because it has been rented out as office space, ODA would need to find an alternative space in which to hold meetings on those seven days. This analysis considers the cost of renting space from a nearby hotel in such a circumstance, though the problem probably could be avoided simply by moving meetings to another time or day.

Ohio Department of Agriculture Performance Audit
Page | 51
Table 2-7: Meeting Room Opportunity Cost Plant Health Meeting Room Square Feet 686 Greater Columbus State Lease Average Annual Rental Rate per Square Foot 1 $11.81 Annual Revenue $8,101.66 Annual Days With 100% or More Utilization 7 Daily Hotel Rate for Meeting Room Use Off Campus 2 $225.00 Total Annual Cost of Room Rental $1,575.00 Net Opportunity Cost of Occupying Underutilized Space $6,526.66 Source: ODA and DAS 1 The greater Columbus state lease average utilizes the average annual rental rate per square foot for office space utilized by state agencies in the greater Columbus area. 2 The daily hotel meeting room rate is for the closest hotel to ODA’s campus with a conference room equal to or larger than the ODA meeting room being measured. As shown in Table 2-7, if ODA converts one of its meeting rooms into office space, ODA might incur up to $1,575 in rental of off campus meeting space. Table 2-7 additionally shows that by not renting the meeting room out as office space, the Department is missing out on $6,526.66 in additional revenue annually. Although this analysis evaluated the utilization of six meeting rooms with use within the Room Reservation System, a total of nine rooms were available within the system. Because of inconsistent use of the scheduling system, three of these rooms lacked the data to perform an analysis. If ODA determines that the remaining three meeting rooms are underused, they too could be repurposed and additional revenue may be realized. Conclusion ODA is likely underutilizing a portion of its total meeting room space. In light of this, ODA should begin to track the utilization of all meeting rooms in a consistent manner across the Department. By doing so, ODA would be better positioned to maximize opportunities for rental revenue by repurposing underused space. Recommendation 2.2: ODA should track the utilization of meeting room space and consider repurposing underutilized meeting rooms as office space. Financial Implication 2.2: Repurposing one underutilized meeting room as tenant office space could generate $6,526 in additional annual revenue.

Ohio Department of Agriculture Performance Audit
Page | 52
R2.3 Equipment Utilization Background ODA owns a 112 acre campus in Reynoldsburg, Ohio, with 61 acres rented for agricultural use. The remaining 51 acres and associated facilities are maintained by Department maintenance staff. In performing this work, these employees use various types of equipment, including tractors; mowers, side-by-side vehicles; trailers, and a boom lift. During the course of this performance audit several pieces of equipment were identified, and then confirmed by ODA, as either inoperable or underutilized. Methodology This sub-section, Equipment Utilization, seeks to highlight the need to track the use of grounds keeping and facility maintenance equipment. Onsite tours were conducted with key facilities personnel to identify equipment that was either inoperable or had not been used for an extended period. The primary sources for this section included facility tours and the inclusion of centrally held corroborating information from knowledgeable facilities employees. ODA’s current practice for the tracking of equipment utilization was compared to Government Finance Officers Association (GFOA) and the Ohio Department of Transportation (ODOT) to assess opportunities for improvement in equipment management practices. Analysis In addition to retaining ownership of some inoperable items, ODA does not formally track the usage of operable equipment. Therefore, while several pieces of equipment were identified as underutilized or unused by maintenance employees, the actual utilization rates were unable to be evaluated. Table 2-8 shows ODA’s grounds keeping equipment inventory; specifically mowers, side-by-sides, tractors, and tractor attachments. The table illustrates the quantity of equipment listed as well as the total purchasing price for each equipment type. This quantifies the amount of money ODA spends on equipment that may be underutilized or unused by maintenance employees.
Table 2-8: ODA Grounds Keeping Equipment FY 2016-17 Equipment Type Total Cost Count of Equipment Average Total Cost
Mowers $41,444 11 $3,767 Utility Task Vehicles $49,692 6 $8,282 Tractors $71,145 6 $11,858 Tractor Attachments 1 $52,017 5 $10,403 Source: ODA 1 Large mowers requiring a tractor utilizing a 540 RPM power take off shaft were considered tractor attachments for the purpose of this analysis.

Ohio Department of Agriculture Performance Audit
Page | 53
As shown in Table 2-8, tractors have the largest total equipment cost, with six tractors purchased representing $71,145. ODA’s most common equipment type is mowers, totaling 11 at an average cost of $3,767 per unit. The Government Finance Officers Association (GFOA) Best Practice: Asset Maintenance and Replacement (GFOA, 2010) recommends that “governments establish a system for assessing their assets and then appropriately plan and budget for any capital maintenance and replacement needs.” To do so, GFOA recommends developing a policy and process with a complete inventory and periodic measurement of the physical condition of the capital asset, including:
• Maintenance history; • Replacement costs; • Operating cost information; • Usage statistics; • Original useful life; and • Remaining useful life
In tracking and measuring equipment utilization ODA should seek to model its practice off of that which is already in use by ODOT. Specifically, ODOT has a practice of tracking equipment utilization and has instituted utilization goals and parameters to assist in the active right sizing of these assets. ODOT policy No. 19-001(P) establishes a goal of 320 hours of use per year for tractors, with an overall lifespan of 10 years prior to replacement. If these utilization standards are not met, the purchase of replacement equipment will not be approved. By not tracking utilization ODA is unable to determine whether each piece of equipment is needed permanently, or if renting as needed would be cost-effective. Although not purchased frequently, this equipment is costly to obtain and maintain. Conclusion ODA should formally track the utilization of its equipment. Doing so would allow the Department to prioritize replacement based on usage, useful life, and replacement costs. By tracking the utilization of equipment, ODA can take a data-driven approach to right-sizing its fleet while avoiding unnecessary equipment maintenance and repairs. Recommendation 2.3: ODA should track the usage of its grounds keeping and facility maintenance equipment. Further, the Department should right-size its maintenance fleet and equipment inventory based on the usage data. In doing so, the Department should identify and properly dispose of equipment determined to be inoperable or too costly to repair. Financial Implication 2.3: N/A. The disposal of underutilized equipment could result in one time revenue as well as a reduction in ongoing maintenance costs. However, these financial benefits could not be quantified at this time because of the lack of reliable utilization data.

Ohio Department of Agriculture Performance Audit
Page | 54
R2.4 Chemical Storage Background ODA’s laboratory stores chemicals that are used for laboratory operations, including testing and cleaning. These chemicals can contain dangerous agents, resulting in the need for safe storage. During the course of this performance audit, chemicals were identified as leaking from their containers. Methodology This sub-section, Chemical Storage, seeks to highlight the need for properly confining dangerous chemicals stored by the ODA. Facility tours were conducted with key ODA personnel to identify instances of chemical storage not in accord with leading practices. The primary sources for this section included facility tours and the inclusion of centrally held collaborating information from knowledgeable facilities employees. ODA’s current practice for storing chemicals was compared to the National Institute of Health (NIH) to assess areas for improvement. Analysis Laboratory chemical storage rooms were observed during facility tours with ODA leadership. Generally, chemicals were stored in open shelving units that were not clearly marked by name, date or use, and were not clearly organized. In one instance, chemicals continued to be stored in a locked storage room in the basement of the Stackhouse Building following the conclusion of the Antimicrobial Pesticide Program, which lost United States Environmental Protection Agency (USEPA) funding in 2012. The chemicals were dated by ODA staff as early as 2002, making some of them 15 years old. As a result, the containers for these chemicals began to leak; spilling chemicals on the shelving unit and on the ground. The Chemical Safety Guide, A companion to the National Institute of Health Chemical Hygiene Plan and Hazard Communication Program, (NIH, 2015), was written specifically for the laboratory environment. This plan outlines the information and services provided by the NIH on the safe use, storage, and disposal of hazardous chemicals in the laboratory. Both the National Institute of Health’s (NIH) Chemical Hygiene Plan (CHP) and its accompanying Chemical Safety Guide have checklists related to the storage of chemicals. The CHP lists the following storage steps:
• Avoid storing chemicals on the floor, even temporarily, or extending into traffic aisles; • Store liquids in unbreakable or double-contained packaging; Ensure all containers of
hazardous chemicals are properly labeled with the identity of the hazardous chemical(s) and appropriate hazard warnings;
• Inspect chemicals periodically for deterioration and container integrity.
Ohio Department of Agriculture Performance Audit
Page | 55
While some storage rooms had additional basins to catch leaking chemicals, basins were not used for the entire inventory, and in some instances chemicals were observed leaking from containers onto their shelves and onto the floor. In accordance with the CHP, once leaks were discovered, steps should have been taken to contain them. Improper storage of chemicals can pose a risk to the safety of ODA employees. Conclusion ODA should properly store and dispose of laboratory chemicals in accordance with leading practices. Doing so can help to ensure that the working environment is safer with decreased risk of exposure to unknown substances. Recommendation 2.4: ODA should ensure that all chemicals are properly stored in accordance with leading practices and, if no longer needed, properly disposed of in accordance with applicable regulations. Where necessary, the Department should develop policies and procedures to ensure these practices are consistently carried out. Financial Implication 2.4: N/A

Ohio Department of Agriculture Performance Audit
Page | 56
VII. Audit Scope and Objectives Overview
Generally accepted government auditing standards require that a performance audit be planned and performed so as to obtain sufficient, appropriate evidence to provide a reasonable basis for findings and conclusions based on audit objectives. Objectives are what the audit is intended to accomplish and can be thought of as questions about the program that the auditors seek to answer based on evidence obtained and assessed against criteria. AOS provided a Notice of engagement effective March 30, 2017. The original notice of engagement led to OPT planning and scoping work, in consultation with ODA, which identified two distinct scope areas including Laboratory Operations and Facility Utilization. Based on the agreed upon scope, OPT developed objectives designed to identify improvements to economy, efficiency, and effectiveness. Table VII-1 shows the objectives assessed in this performance audit and references the corresponding recommendation(s) when applicable.
Table VII-1: Audit Objectives and Recommendations Objective Recommendation(s)
Laboratory Operations What opportunities exist to improve the efficiency and/or effectiveness of the currently provided ODA laboratory services in relation to leading practices and/or industry standards? R1.1 and R1.2 Facility Utilization What opportunities exist to improve facility space utilization and minimize unnecessary costs in relation to industry standards and/or leading practices? R2.1, R2.2, R2.3, and R2.4 Note: Although assessment of internal controls was not specifically an objective of this performance audit, they were considered and evaluated when applicable to scope areas and objective.
Ohio Department of Agriculture Performance Audit
Page | 57
VIII. Abbreviated Terms and Acronyms
ADDL - Animal Disease Diagnostic Laboratory AOS - Auditor of State ATL - Analytical Toxicology Laboratory BOMA - Building Owners and Managers Association CPL - Consumer Protection Laboratory CY - Calendar Year DAS - Ohio Department of Administrative Services FIFRA - Federal Insecticide, Fungicide, and Rodenticide Act FTEs - Full Time Equivalent FY - Fiscal Year GAGAS - Generally Accepted Government Auditing Standards GFOA - Government Finance Officers Association GRF - General Revenue Fund LIMS - Laboratory Information Management System NIH - National Institute of Health OAKS - Ohio Administrative Knowledge System ODA or the Department - Ohio Department of Agriculture ODOT - Ohio Department of Transportation OPT - Ohio Performance Team ORC - Ohio Revised Code OSRC - Ohio State Racing Commission PDP - Pesticide Data Program RSF - Rentable Square Feet/Footage USDA - United States Department of Agriculture USEPA - United State Environmental Protection Agency

Ohio Department of Agriculture Performance Audit
Page | 58
IX. ODA Response
Throughout the audit process, staff met with Department management to ensure substantial agreement on the factual information presented in the report. When management disagreed with information contained in the report, and provided supporting documentation, revisions were made to the audit report. The Department was afforded the opportunity to formally respond to the final report with a written letter. However, the Department chose not to do so.

88EastBroadStreet,FourthFloor,Columbus,Ohio43215‐3506Phone:614‐466‐4514or800‐282‐0370Fax:614‐466‐4490
www.ohioauditor.gov
OHIO DEPARTMENT OF AGRICULTURE
FRANKLIN COUNTY
CLERK’S CERTIFICATION This is a true and correct copy of the report which is required to be filed in the Office of the Auditor of State pursuant to Section 117.26, Revised Code, and which is filed in Columbus, Ohio.
CLERK OF THE BUREAU CERTIFIED JUNE 27, 2017