oecd global forum on environment focusing on … · environment focusing on sustainable materials...
TRANSCRIPT
OECD GLOBAL FORUM ON ENVIRONMENT
Focusing on
SUSTAINABLE MATERIALS MANAGEMENT
25-27 October 2010, Mechelen, Belgium
Materials Case Study 1:
Critical Metals and Mobile Devices
ANNEXES
Working Document
OECD Environment Directorate, OECD, 2010
2
NOTE FROM THE SECRETARIAT
In addition to aluminium, wood fibres and plastics, critical metals have been identified as priority
materials for which sustainable management would bring significant environmental, social and economic
benefits. The objective of this case study on critical metals is to analyse the environmental impacts of
critical metals throughout their lifecycle and identify the best practices for their sustainable management.
This document includes all annexes to the critical metals case study that will be presented at the
OECD Global Forum on Sustainable Materials Management to be held in Belgium from 25 to 27 October
2010 and, together with the other three case studies, will serve as a basis for the discussions of Session 1
on Good SMM Practices in Priority Materials.
The Government of Canada case study project team involved participants from three federal
departments: Natural Resources Canada (NRCan), Industry Canada (IC) and Environment Canada (EC).
The project team was led by Alain Dubreuil and Rob Sinclair in the Minerals and Metals Sector
of NRCan.
Project support was provided by Orlando Dinardo (NRCan), Philippa Huntsman-Mapila
(NRCan), David Koren (NRCan), Peter Campbell (IC), Patrick Huot (IC), Cheryl Beillard (NRCan),
Duncan Bury (EC), Dennis Jackson (EC) and Andre Martin (EC).
Alberto Fonseca and Steven B. Young (University of Waterloo) were sub-contracted to conduct a
literature review and develop an analytical framework for advancing research into the social aspects of
sustainable metals management.
Nokia, Umicore, the US National Research Council of the National Academies and many other
players have provided valuable information that was used in the preparation of this case study; however,
the content of this document, including any errors or omissions, shall remain the responsibility of the
project team alone.
This report is work in progress. The opinions expressed in this paper are the sole responsibility of
the author(s) and do not necessarily reflect those of the OECD or the governments of its member countries.
3
ANNEXES
RE: CRITICAL METALS AND MOBILE DEVICES – A SUSTAINABLE MATERIALS
MANAGEMENT CASE STUDY
TABLE OF CONTENTS
ANNEXES ...................................................................................................................................................... 3
ANNEX 1: THE PERIODIC TABLE ............................................................................................................. 5
ANNEX 2: FACT SHEETS FOR ANTIMONY, BERYLLIUM, PALLADIUM AND PLATINUM ........... 6
1. Antimony (Sb) ......................................................................................................................................... 6 2. Beryllium (Be) ......................................................................................................................................... 9 3. Palladium (Pd) ....................................................................................................................................... 11 4. Platinum (Pt) .......................................................................................................................................... 14
ANNEX 3: PROJECT ADVISORY GROUP ............................................................................................... 16
ANNEX 3: PROJECT ADVISORY GROUP ............................................................................................... 17
ANNEX 4: FLOW OF E-SCRAP IN S.E. ASIA .......................................................................................... 18
ANNEX 5: ESTIMATED GLOBAL FLOW OF EXPIRED MOBILE PHONES (NOKIA) ....................... 19
ANNEX 6: INTEGRATED SMELTER PROCESS FLOW ......................................................................... 20
ANNEX 7: HYDROMETALLURGICAL PROCESS FLOW ..................................................................... 21
ANNEX 8: ENVIRONMENTAL IMPACT OF MATERIAL PRODUCED ............................................... 22
ANNEX 9: PYROMETALLURGICAL RECOVERY YIELDS .................................................................. 24
ANNEX 10: FORWARD VERSUS REVERSE LOGISTICS ...................................................................... 25
ANNEX 10: FORWARD VERSUS REVERSE LOGISTICS ...................................................................... 26
ANNEX 11: OLD OR OBSOLETE MOBILE PHONES IN CANADA ...................................................... 27
1. How is the telecommunications industry structured and who are the players? ..................................... 27 2. How big is the mobile phone market? ................................................................................................... 28 3. What voluntary stewardship activities are underway regarding end-of-life mobile phones? ................ 28 4. Are there any mandatory stewardship activities for mobile phones in Canada? ................................... 30 5. What is the estimated flow of end-of-life mobile phones? .................................................................... 30 6. How are spent mobile phones recycled in Canada? ............................................................................... 33 7. How does mobile phone collection and recycling compare with other end-of-life waste electronic and
electrical equipment (WEEE) management programs in Canada? ............................................................ 35
ANNEX 12: ............................ INCORPORATING SOCIAL ASPECTS INTO SUSTAINABLE METALS
MANAGEMENT .......................................................................................................................................... 36
4
1. Introduction ............................................................................................................................................ 36 2. Sustainable Materials Management and the “Overlooked” Social Aspects ........................................... 37 3. A SLCA-based Framework for Incorporating Social Aspects in SMM ................................................ 38 4. Preliminary Literature Review of Social Aspects in the Life Cycle of Electronics ............................... 41 5. Identifying Relevant Tools to Address Social Aspects in the Life Cycle of Metals .............................. 43 6. Conclusions and Recommended Future Work ....................................................................................... 45
APPENDIX 1: CLASSIFICATION OF SOCIAL INDICATOR REFERENCES ACROSS THE LIFE-
CYCLE .......................................................................................................................................................... 52
ANNEX 13: COMPOSITION OF MOBILE PHONES OVER TIME ................................................. 58
ANNEX 14: NEW MOBILE PHONES ................................................................................................ 60
5
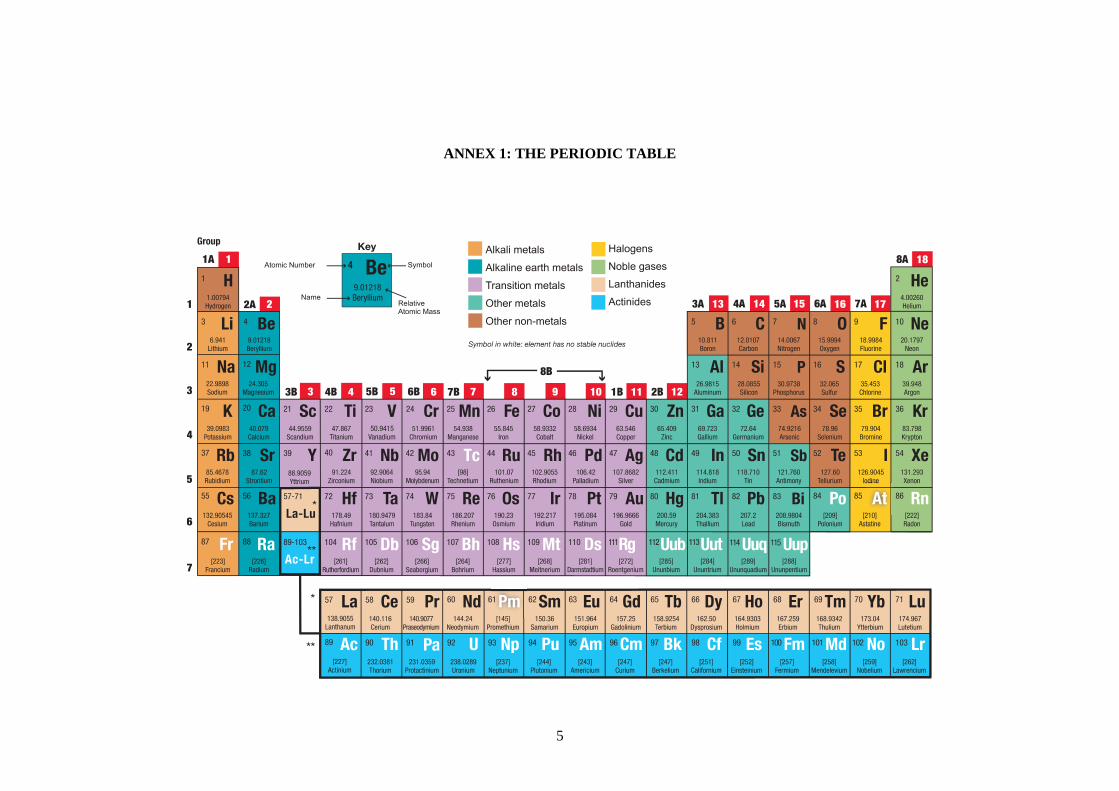
ANNEX 1: THE PERIODIC TABLE
6
ANNEX 2: FACT SHEETS FOR ANTIMONY, BERYLLIUM, PALLADIUM AND
PLATINUM
1. Antimony (Sb)
Summary description
1. Arsenic, antimony and bismuth all belong to group 15 of the periodic table. The stable forms
of these elements are crystalline, have a grey metallic lustre and are comparatively soft but brittle.
The principal antimony-containing mineral, stibnite, (Sb2S3) has a relatively low melting point (546oC)
which results in a simple recovery method from other minerals in an ore body. Antimony is also found
as various antimonides of metals such as nickel, copper, silver and mercury. Examples of these include
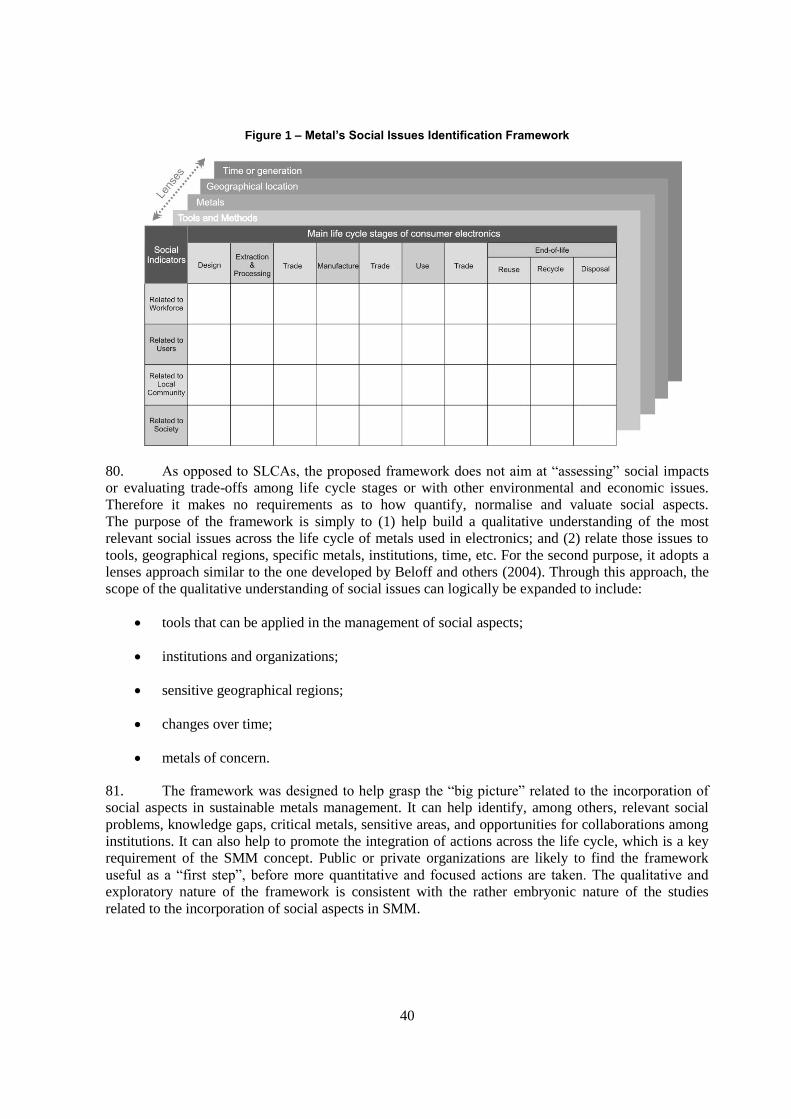
breithauptite (NiSb), dyscrasite (Ag3Sb) and pyragyrite (3Ag2S.Sb2S3). The principal source of
palladium occurs as an antimonide, stibiopalladinide (Pd5Sb2). Where stibnite is weathered, it is
converted to oxides such as valentenite (Sb2O3) and cevantite (Sb2O3.Sb2O5).
Global production
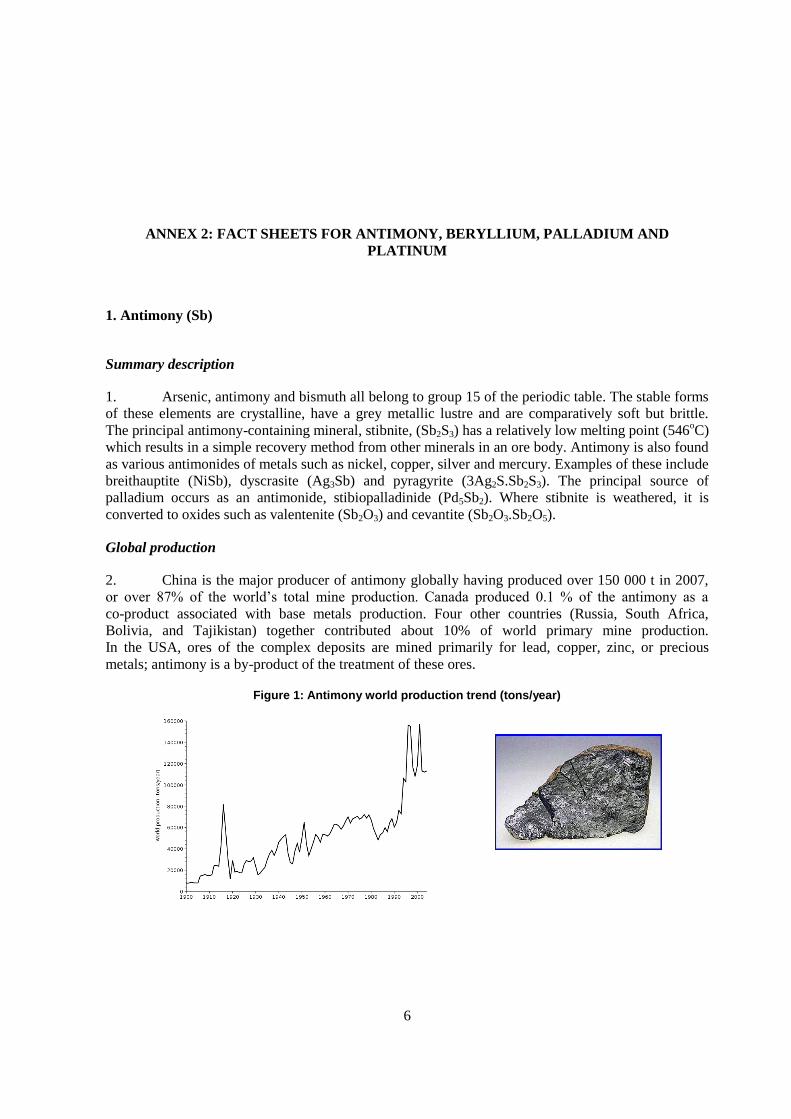
2. China is the major producer of antimony globally having produced over 150 000 t in 2007,
or over 87% of the world’s total mine production. Canada produced 0.1 % of the antimony as a
co-product associated with base metals production. Four other countries (Russia, South Africa,
Bolivia, and Tajikistan) together contributed about 10% of world primary mine production.
In the USA, ores of the complex deposits are mined primarily for lead, copper, zinc, or precious
metals; antimony is a by-product of the treatment of these ores.
Figure 1: Antimony world production trend (tons/year)
7
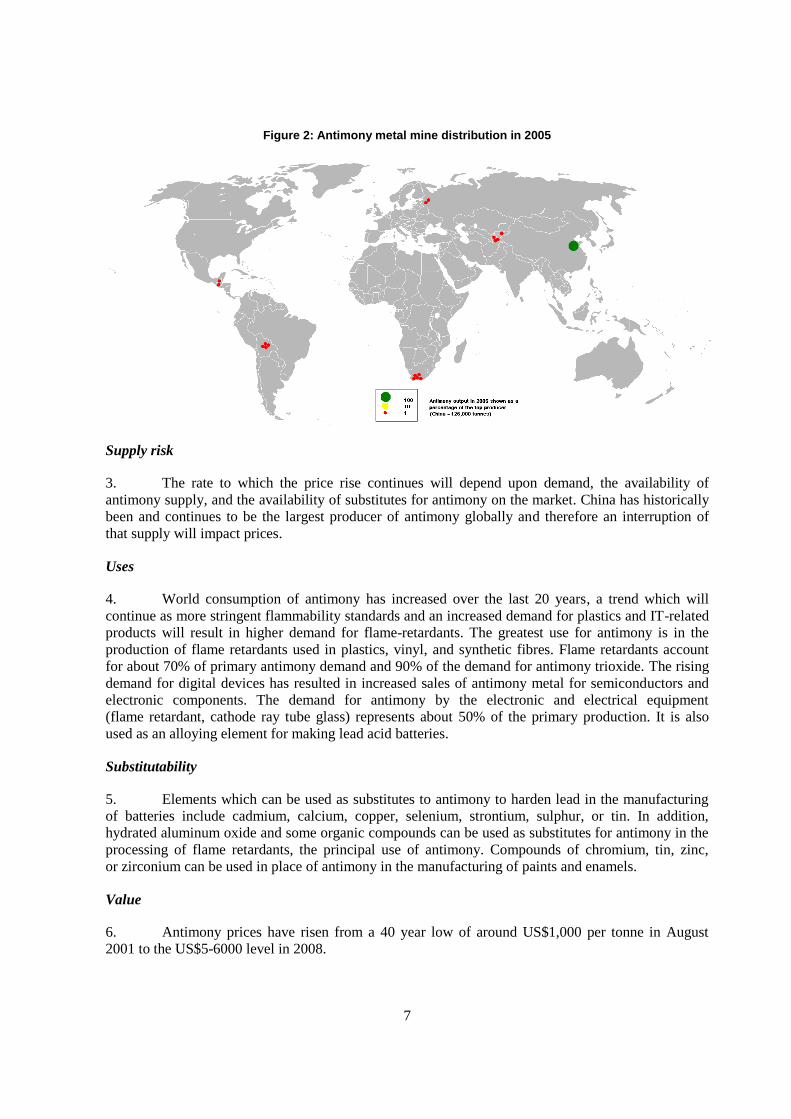
Figure 2: Antimony metal mine distribution in 2005
Supply risk
3. The rate to which the price rise continues will depend upon demand, the availability of
antimony supply, and the availability of substitutes for antimony on the market. China has historically
been and continues to be the largest producer of antimony globally and therefore an interruption of
that supply will impact prices.
Uses
4. World consumption of antimony has increased over the last 20 years, a trend which will
continue as more stringent flammability standards and an increased demand for plastics and IT-related
products will result in higher demand for flame-retardants. The greatest use for antimony is in the
production of flame retardants used in plastics, vinyl, and synthetic fibres. Flame retardants account
for about 70% of primary antimony demand and 90% of the demand for antimony trioxide. The rising
demand for digital devices has resulted in increased sales of antimony metal for semiconductors and
electronic components. The demand for antimony by the electronic and electrical equipment
(flame retardant, cathode ray tube glass) represents about 50% of the primary production. It is also
used as an alloying element for making lead acid batteries.
Substitutability
5. Elements which can be used as substitutes to antimony to harden lead in the manufacturing
of batteries include cadmium, calcium, copper, selenium, strontium, sulphur, or tin. In addition,
hydrated aluminum oxide and some organic compounds can be used as substitutes for antimony in the
processing of flame retardants, the principal use of antimony. Compounds of chromium, tin, zinc,
or zirconium can be used in place of antimony in the manufacturing of paints and enamels.
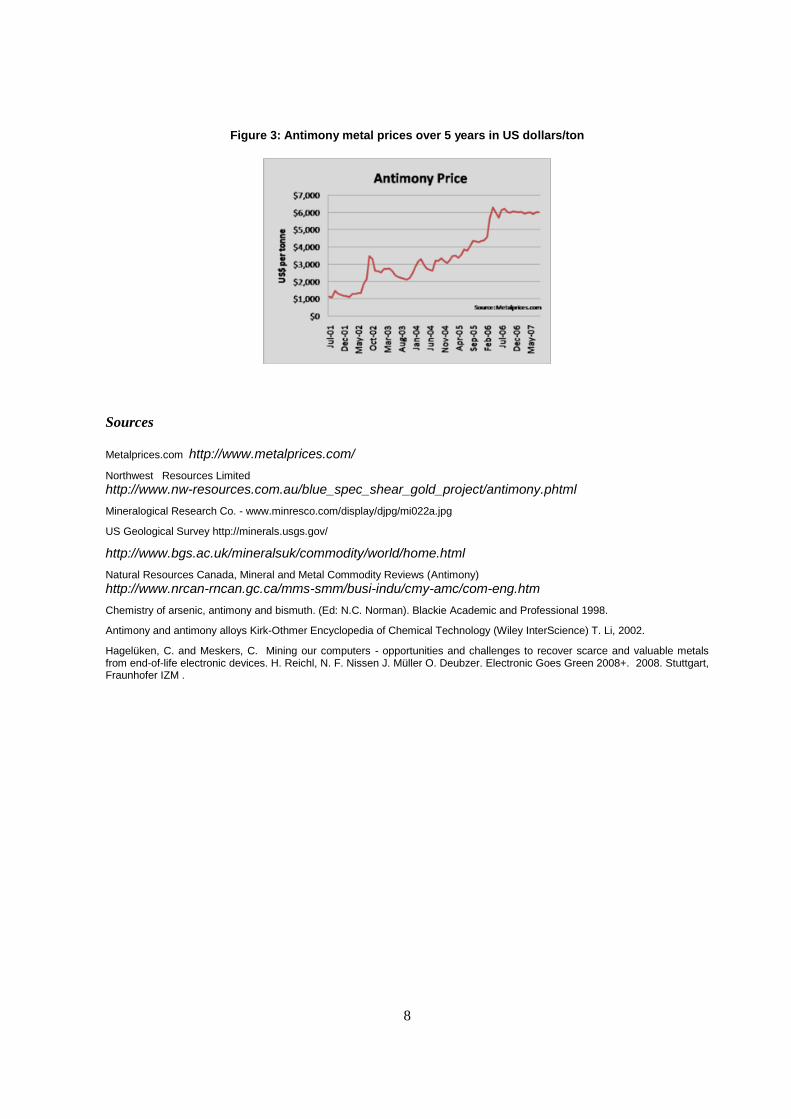
Value
6. Antimony prices have risen from a 40 year low of around US$1,000 per tonne in August
2001 to the US$5-6000 level in 2008.
8
Figure 3: Antimony metal prices over 5 years in US dollars/ton
Sources
Metalprices.com http://www.metalprices.com/
Northwest Resources Limited
http://www.nw-resources.com.au/blue_spec_shear_gold_project/antimony.phtml
Mineralogical Research Co. - www.minresco.com/display/djpg/mi022a.jpg
US Geological Survey http://minerals.usgs.gov/
http://www.bgs.ac.uk/mineralsuk/commodity/world/home.html
Natural Resources Canada, Mineral and Metal Commodity Reviews (Antimony)
http://www.nrcan-rncan.gc.ca/mms-smm/busi-indu/cmy-amc/com-eng.htm
Chemistry of arsenic, antimony and bismuth. (Ed: N.C. Norman). Blackie Academic and Professional 1998.
Antimony and antimony alloys Kirk-Othmer Encyclopedia of Chemical Technology (Wiley InterScience) T. Li, 2002.
Hagelüken, C. and Meskers, C. Mining our computers - opportunities and challenges to recover scarce and valuable metals from end-of-life electronic devices. H. Reichl, N. F. Nissen J. Müller O. Deubzer. Electronic Goes Green 2008+. 2008. Stuttgart, Fraunhofer IZM .
9
2. Beryllium (Be)
Summary description
7. Beryllium, an alkaline earth metal with a greyish-white surface, was first discovered in 1798
as a new element in beryl and emeralds, and later isolated in 1828 by reducing beryllium chloride with
potassium. Currently, most production of beryllium is through reduction of beryllium fluoride with
magnesium metal. Beryllium never occurs in nature as a free element, but as a compound; the most
common ore of beryllium is beryl.
8. Beryllium’s density is 1.8 grams per cubic centimetre, making it the second lightest metal
(lithium being the first) and least dense metal used in construction at two-thirds the weight of
aluminium and one quarter of the weight of steel. Beryllium also has high heat capacity and
conductivity, as well as being non-magnetic.
Global production
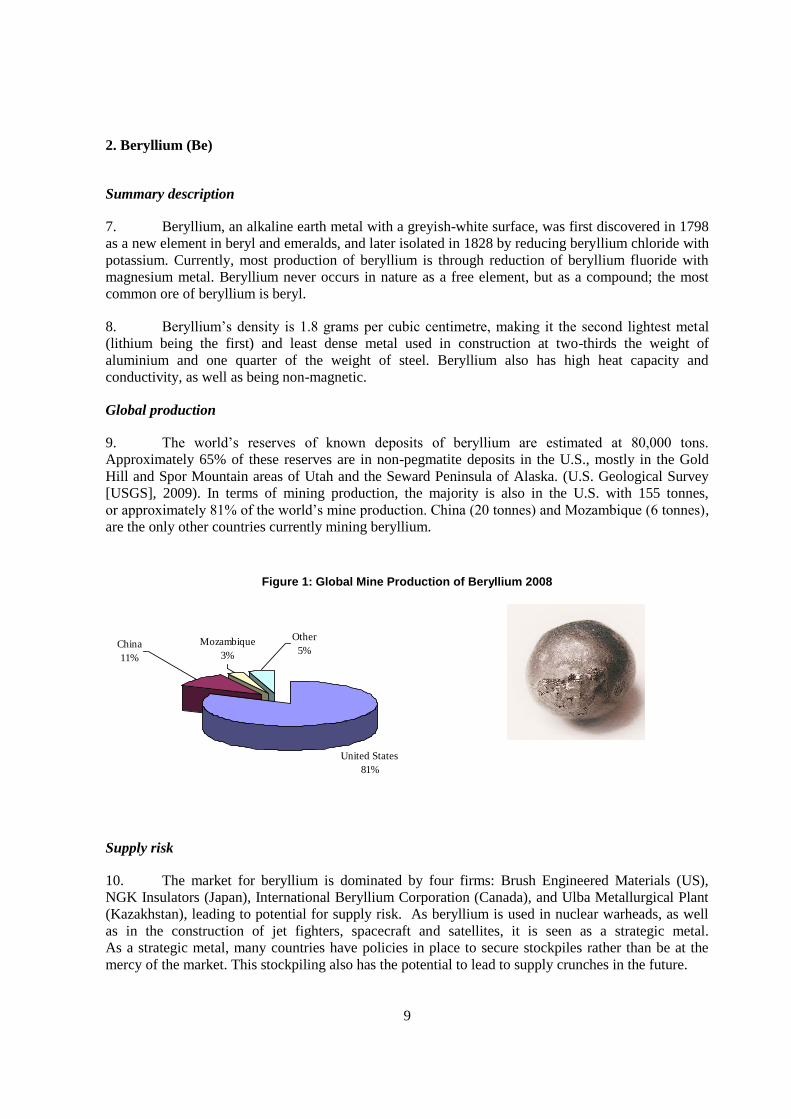
9. The world’s reserves of known deposits of beryllium are estimated at 80,000 tons.
Approximately 65% of these reserves are in non-pegmatite deposits in the U.S., mostly in the Gold
Hill and Spor Mountain areas of Utah and the Seward Peninsula of Alaska. (U.S. Geological Survey
[USGS], 2009). In terms of mining production, the majority is also in the U.S. with 155 tonnes,
or approximately 81% of the world’s mine production. China (20 tonnes) and Mozambique (6 tonnes),
are the only other countries currently mining beryllium.
Figure 1: Global Mine Production of Beryllium 2008
United States
81%
China
11%
Mozambique
3%
Other
5%
Supply risk
10. The market for beryllium is dominated by four firms: Brush Engineered Materials (US),
NGK Insulators (Japan), International Beryllium Corporation (Canada), and Ulba Metallurgical Plant
(Kazakhstan), leading to potential for supply risk. As beryllium is used in nuclear warheads, as well
as in the construction of jet fighters, spacecraft and satellites, it is seen as a strategic metal.
As a strategic metal, many countries have policies in place to secure stockpiles rather than be at the
mercy of the market. This stockpiling also has the potential to lead to supply crunches in the future.
10
Uses and issues
11. Beryllium-copper alloys are the most common use of beryllium. The United States
Geological Surveys estimates that approximately one-half of beryllium was used in computer and
telecommunications products, where it is used for electrical contacts and connectors. The remainder is
used in aerospace and defence, appliances, automotive electronics, and other industrial applications.
Because of the toxic nature of beryllium, various international, national guidelines and regulations
have been established regarding beryllium in air, water, and other media. The presence of beryllium
can impact the recyclability of copper. Some mobile phone producers are phasing out the use of
beryllium in new products.
Substitutability (alternatives)
12. In some applications of beryllium, copper alloys containing nickel and silicon, tin, titanium,
or other alloying elements may be substituted for beryllium-copper alloys; however, using these
substitutes results in reduced performance (USGS, 2009).
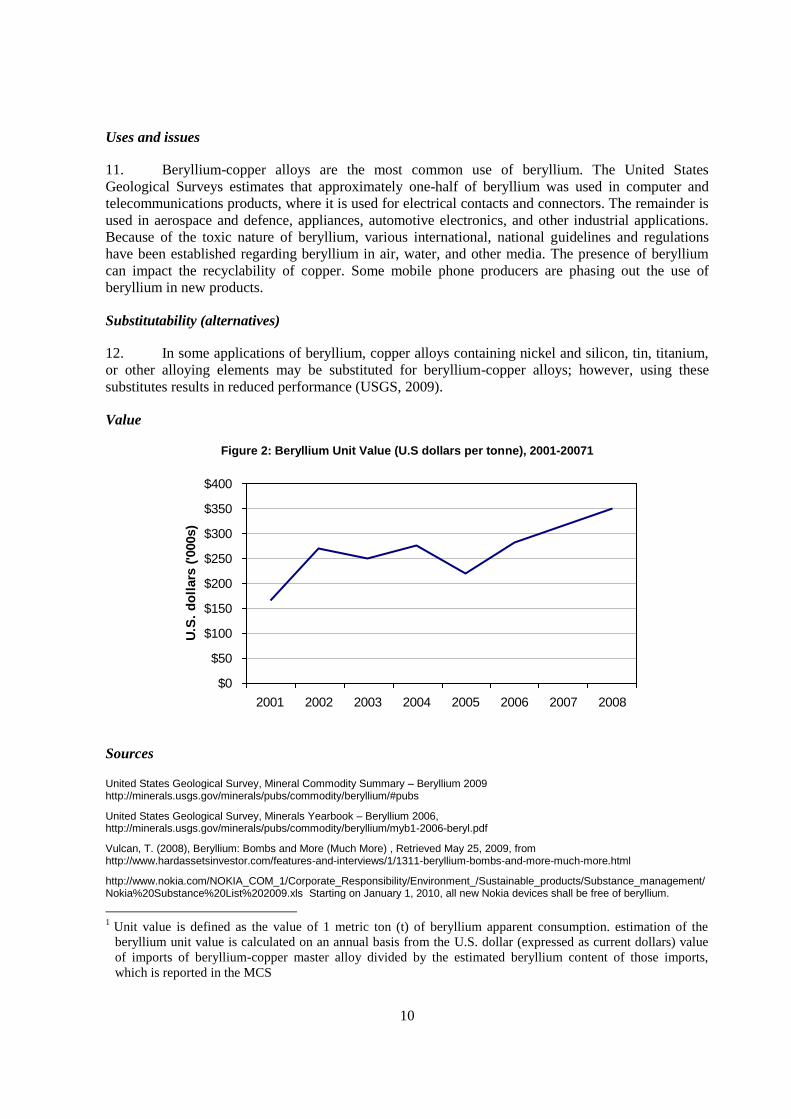
Value
Figure 2: Beryllium Unit Value (U.S dollars per tonne), 2001-20071
$0
$50
$100
$150
$200
$250
$300
$350
$400
2001 2002 2003 2004 2005 2006 2007 2008
U.S
. d
oll
ars
('0
00s)
Sources
United States Geological Survey, Mineral Commodity Summary – Beryllium 2009 http://minerals.usgs.gov/minerals/pubs/commodity/beryllium/#pubs
United States Geological Survey, Minerals Yearbook – Beryllium 2006, http://minerals.usgs.gov/minerals/pubs/commodity/beryllium/myb1-2006-beryl.pdf
Vulcan, T. (2008), Beryllium: Bombs and More (Much More) , Retrieved May 25, 2009, from http://www.hardassetsinvestor.com/features-and-interviews/1/1311-beryllium-bombs-and-more-much-more.html
http://www.nokia.com/NOKIA_COM_1/Corporate_Responsibility/Environment_/Sustainable_products/Substance_management/Nokia%20Substance%20List%202009.xls Starting on January 1, 2010, all new Nokia devices shall be free of beryllium.
1
Unit value is defined as the value of 1 metric ton (t) of beryllium apparent consumption. estimation of the
beryllium unit value is calculated on an annual basis from the U.S. dollar (expressed as current dollars) value
of imports of beryllium-copper master alloy divided by the estimated beryllium content of those imports,
which is reported in the MCS
11
3. Palladium (Pd)
Summary description
13. Palladium is one of the platinum group metals (PGMs). These metals have high melting
points and chemical inertness plus exceptional catalytic properties, even under extreme temperature
and corrosive conditions. The PGMs were first categorized as a single metal in 1751. Following the
identification of platinum, palladium was isolated as a separate elemental metal in 1803 by William
Hyde Wollaston. The industrial extraction of Pd from ores is technically complex.
Global production
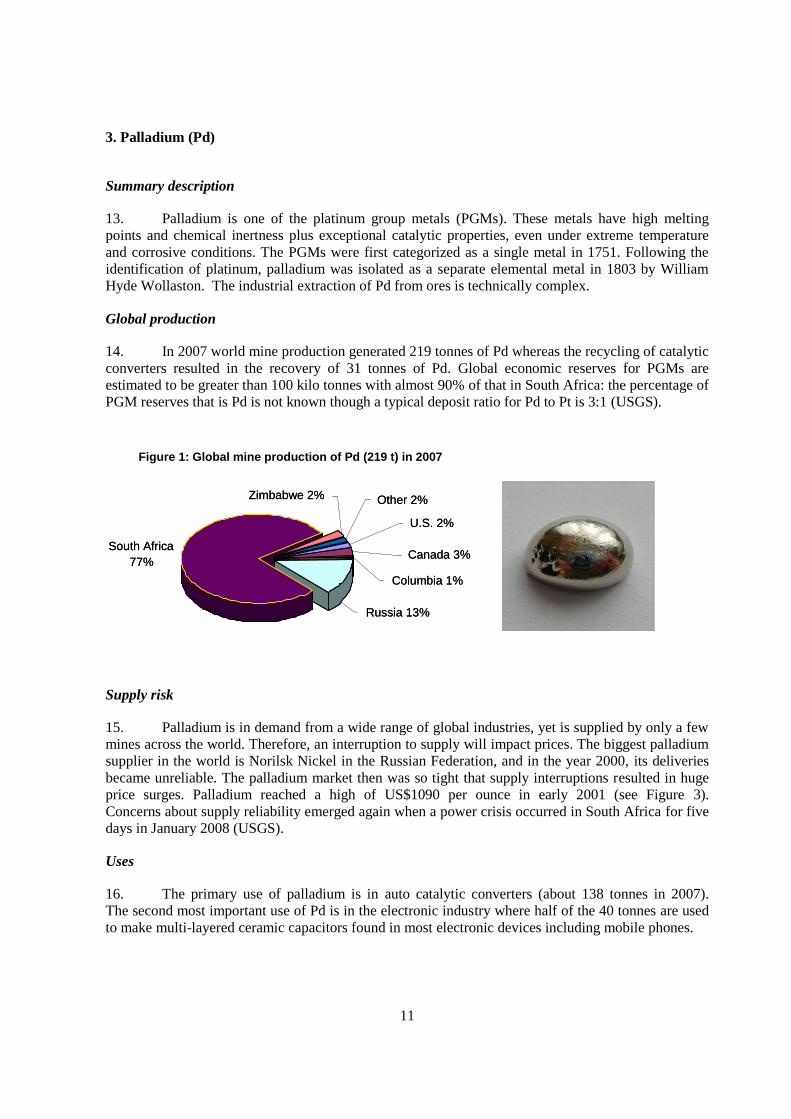
14. In 2007 world mine production generated 219 tonnes of Pd whereas the recycling of catalytic
converters resulted in the recovery of 31 tonnes of Pd. Global economic reserves for PGMs are
estimated to be greater than 100 kilo tonnes with almost 90% of that in South Africa: the percentage of
PGM reserves that is Pd is not known though a typical deposit ratio for Pd to Pt is 3:1 (USGS).
Figure 1: Global mine production of Pd (219 t) in 2007
South Africa
77%
U.S. 2%
Canada 3%
Zimbabwe 2% Other 2%
Columbia 1%
Russia 13%
South Africa
77%
U.S. 2%
Canada 3%
Zimbabwe 2% Other 2%
Columbia 1%
Russia 13%
Supply risk
15. Palladium is in demand from a wide range of global industries, yet is supplied by only a few
mines across the world. Therefore, an interruption to supply will impact prices. The biggest palladium
supplier in the world is Norilsk Nickel in the Russian Federation, and in the year 2000, its deliveries
became unreliable. The palladium market then was so tight that supply interruptions resulted in huge
price surges. Palladium reached a high of US$1090 per ounce in early 2001 (see Figure 3).
Concerns about supply reliability emerged again when a power crisis occurred in South Africa for five
days in January 2008 (USGS).
Uses
16. The primary use of palladium is in auto catalytic converters (about 138 tonnes in 2007).
The second most important use of Pd is in the electronic industry where half of the 40 tonnes are used
to make multi-layered ceramic capacitors found in most electronic devices including mobile phones.
12
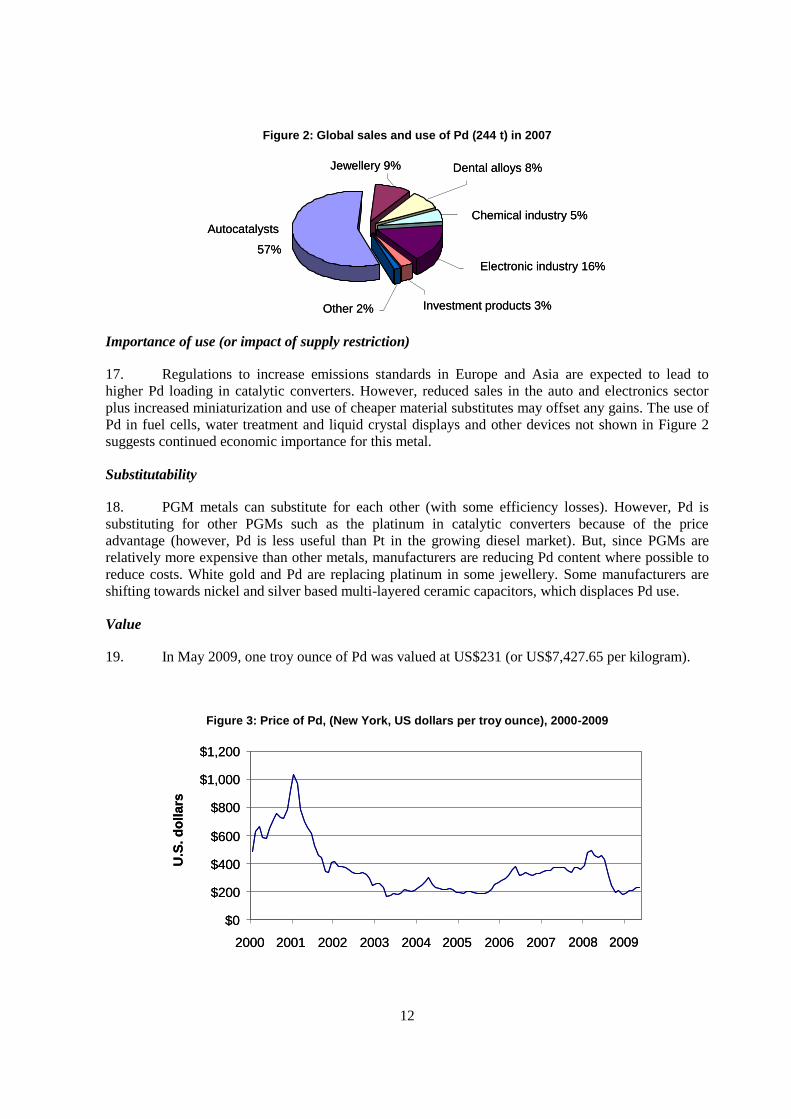
Figure 2: Global sales and use of Pd (244 t) in 2007
Autocatalysts
57%
Chemical industry 5%
Dental alloys 8%Jewellery 9%
Electronic industry 16%
Investment products 3% Other 2%
Autocatalysts
57%
Chemical industry 5%
Dental alloys 8%Jewellery 9%
Electronic industry 16%
Investment products 3% Other 2%
Importance of use (or impact of supply restriction)
17. Regulations to increase emissions standards in Europe and Asia are expected to lead to
higher Pd loading in catalytic converters. However, reduced sales in the auto and electronics sector
plus increased miniaturization and use of cheaper material substitutes may offset any gains. The use of
Pd in fuel cells, water treatment and liquid crystal displays and other devices not shown in Figure 2
suggests continued economic importance for this metal.
Substitutability
18. PGM metals can substitute for each other (with some efficiency losses). However, Pd is
substituting for other PGMs such as the platinum in catalytic converters because of the price
advantage (however, Pd is less useful than Pt in the growing diesel market). But, since PGMs are
relatively more expensive than other metals, manufacturers are reducing Pd content where possible to
reduce costs. White gold and Pd are replacing platinum in some jewellery. Some manufacturers are
shifting towards nickel and silver based multi-layered ceramic capacitors, which displaces Pd use.
Value
19. In May 2009, one troy ounce of Pd was valued at US$231 (or US$7,427.65 per kilogram).
Figure 3: Price of Pd, (New York, US dollars per troy ounce), 2000-2009
U.S
. d
ollars
$0
$200
$400
$600
$800
$1,000
$1,200
2000 2001 2002 2003 2004 2005 2006 2007 2008 2009
U.S
. d
ollars
$0
$200
$400
$600
$800
$1,000
$1,200
2000 2001 2002 2003 2004 2005 2006 2007 2008 2009

13
Sources
Metalprices.com http://www.metalprices.com/
Natural Resources Canada, Mineral and Metal Commodity Reviews (Platinum-Group Metals)
http://www.nrcan-rncan.gc.ca/mms-smm/busi-indu/cmy-amc/com-eng.htm
Platinum-Group Metals [Advance Release], U.S. Geological Survey Minerals Yearbook—2007
http://minerals.usgs.gov/minerals/pubs/commodity/
Stillwater Mining Company, http://www.stillwatermining.com/
Umicore Precious Metal Refining, , http://www.preciousmetals.umicore.com/
VM Group, The white book, 2008, Vortis (Merchant Banking)
14
4. Platinum (Pt)
Summary description
20. Platinum is obviously part of the “platinum group metals” (PGMs) that includes palladium,
rhodium, ruthenium, iridium and osmium. These metals have high melting points and chemical
inertness plus exceptional catalytic properties, even under extreme temperature and corrosive
conditions (i.e. it is immune to oxidation). Platinum was independently discovered in 1736 by Antonio
de Ulloa and in 1741 by Charles Wood.
Global production
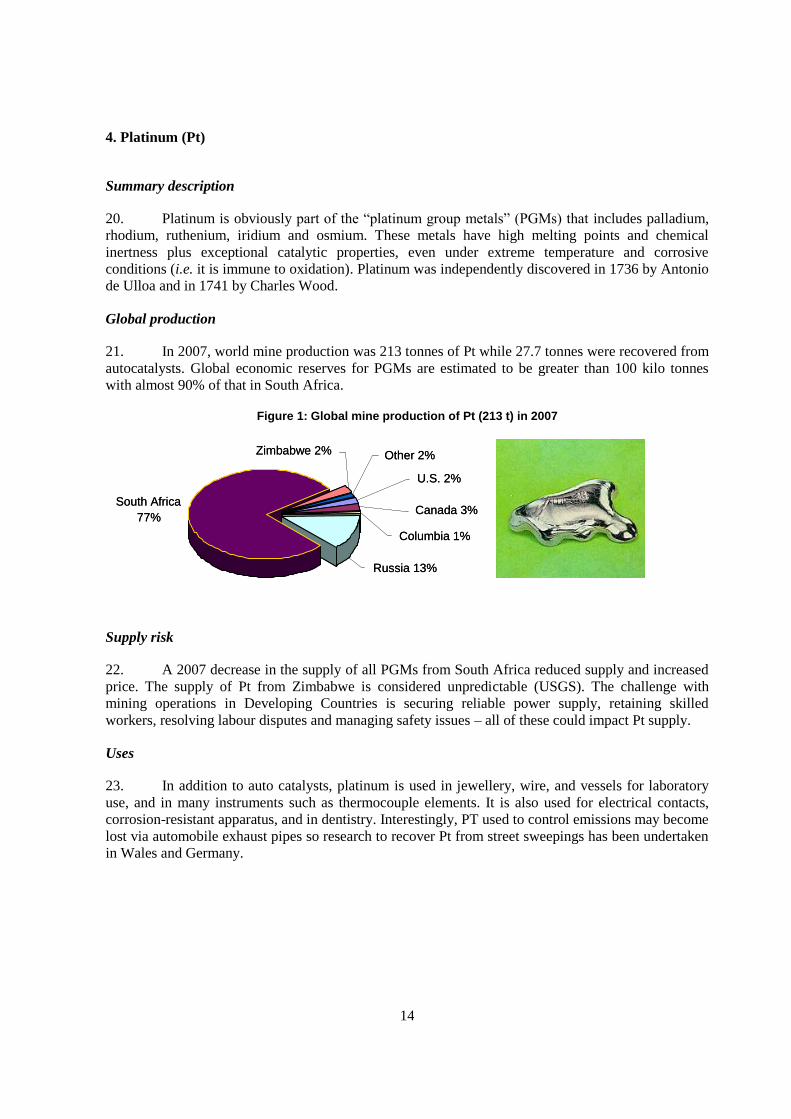
21. In 2007, world mine production was 213 tonnes of Pt while 27.7 tonnes were recovered from
autocatalysts. Global economic reserves for PGMs are estimated to be greater than 100 kilo tonnes
with almost 90% of that in South Africa.
Figure 1: Global mine production of Pt (213 t) in 2007
Supply risk
22. A 2007 decrease in the supply of all PGMs from South Africa reduced supply and increased
price. The supply of Pt from Zimbabwe is considered unpredictable (USGS). The challenge with
mining operations in Developing Countries is securing reliable power supply, retaining skilled
workers, resolving labour disputes and managing safety issues – all of these could impact Pt supply.
Uses
23. In addition to auto catalysts, platinum is used in jewellery, wire, and vessels for laboratory
use, and in many instruments such as thermocouple elements. It is also used for electrical contacts,
corrosion-resistant apparatus, and in dentistry. Interestingly, PT used to control emissions may become
lost via automobile exhaust pipes so research to recover Pt from street sweepings has been undertaken
in Wales and Germany.
South Africa
77%
U.S. 2%
Canada 3%
Zimbabwe 2% Other 2%
Columbia 1%
Russia 13%
South Africa
77%
U.S. 2%
Canada 3%
Zimbabwe 2% Other 2%
Columbia 1%
Russia 13%
15
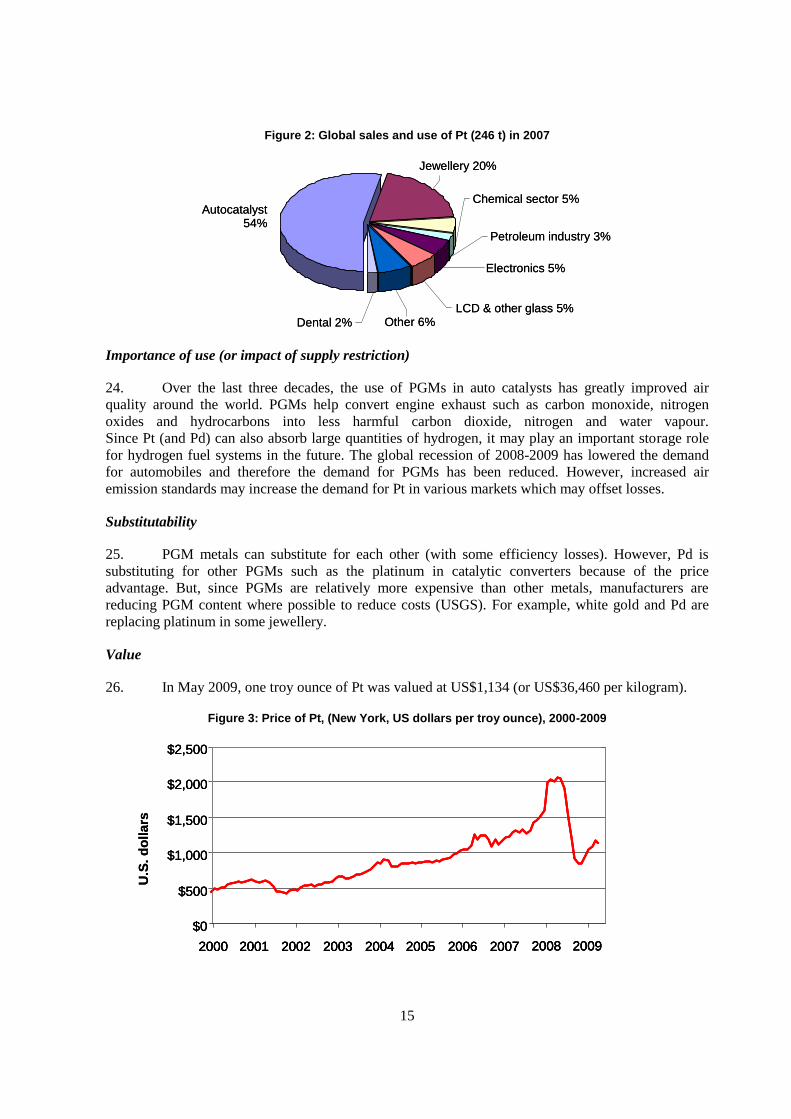
Figure 2: Global sales and use of Pt (246 t) in 2007
Autocatalyst54%
Jewellery 20%
Electronics 5%
Other 6%LCD & other glass 5%
Chemical sector 5%
Petroleum industry 3%
Dental 2%
Autocatalyst54%
Jewellery 20%
Electronics 5%
Other 6%LCD & other glass 5%
Chemical sector 5%
Petroleum industry 3%
Dental 2%
Importance of use (or impact of supply restriction)
24. Over the last three decades, the use of PGMs in auto catalysts has greatly improved air
quality around the world. PGMs help convert engine exhaust such as carbon monoxide, nitrogen
oxides and hydrocarbons into less harmful carbon dioxide, nitrogen and water vapour.
Since Pt (and Pd) can also absorb large quantities of hydrogen, it may play an important storage role
for hydrogen fuel systems in the future. The global recession of 2008-2009 has lowered the demand
for automobiles and therefore the demand for PGMs has been reduced. However, increased air
emission standards may increase the demand for Pt in various markets which may offset losses.
Substitutability
25. PGM metals can substitute for each other (with some efficiency losses). However, Pd is
substituting for other PGMs such as the platinum in catalytic converters because of the price
advantage. But, since PGMs are relatively more expensive than other metals, manufacturers are
reducing PGM content where possible to reduce costs (USGS). For example, white gold and Pd are
replacing platinum in some jewellery.
Value
26. In May 2009, one troy ounce of Pt was valued at US$1,134 (or US$36,460 per kilogram).
Figure 3: Price of Pt, (New York, US dollars per troy ounce), 2000-2009
$0
$500
$1,000
$1,500
$2,000
$2,500
2000 2001 2002 2003 2004 2005 2006 2007 2008 2009
U.S
. d
oll
ars
$0
$500
$1,000
$1,500
$2,000
$2,500
2000 2001 2002 2003 2004 2005 2006 2007 2008 2009
$0
$500
$1,000
$1,500
$2,000
$2,500
2000 2001 2002 2003 2004 2005 2006 2007 2008 20092000 2001 2002 2003 2004 2005 2006 2007 2008 2009
U.S
. d
oll
ars

16
Sources
Metalprices.com http://www.metalprices.com/
Natural Resources Canada, Mineral and Metal Commodity Reviews (Platinum-Group Metals) http://www.nrcan-rncan.gc.ca/mms-smm/busi-indu/cmy-amc/com-eng.htm
Platinum-Group Metals [Advance Release], U.S. Geological Survey Minerals Yearbook—2007
http://minerals.usgs.gov/minerals/pubs/commodity/
Steve Marsden Chemistry Resources, http://www.chemtopics.com/elements.htm
17
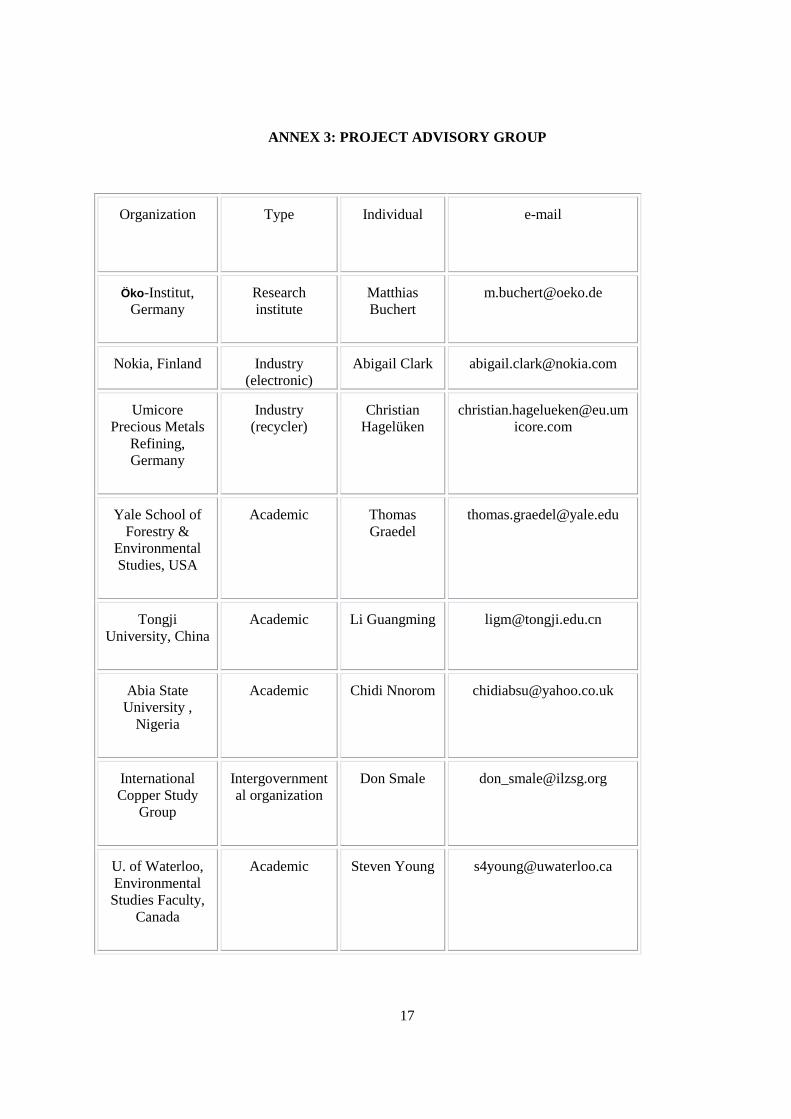
ANNEX 3: PROJECT ADVISORY GROUP
Organization
Type Individual e-mail
Öko-Institut,
Germany
Research
institute
Matthias
Buchert
Nokia, Finland Industry
(electronic)
Abigail Clark [email protected]
Umicore
Precious Metals
Refining,
Germany
Industry
(recycler)
Christian
Hagelüken
icore.com
Yale School of
Forestry &
Environmental
Studies, USA
Academic Thomas
Graedel
Tongji
University, China
Academic Li Guangming [email protected]
Abia State
University ,
Nigeria
Academic Chidi Nnorom [email protected]
International
Copper Study
Group
Intergovernment
al organization
Don Smale [email protected]
U. of Waterloo,
Environmental
Studies Faculty,
Canada
Academic Steven Young [email protected]
18
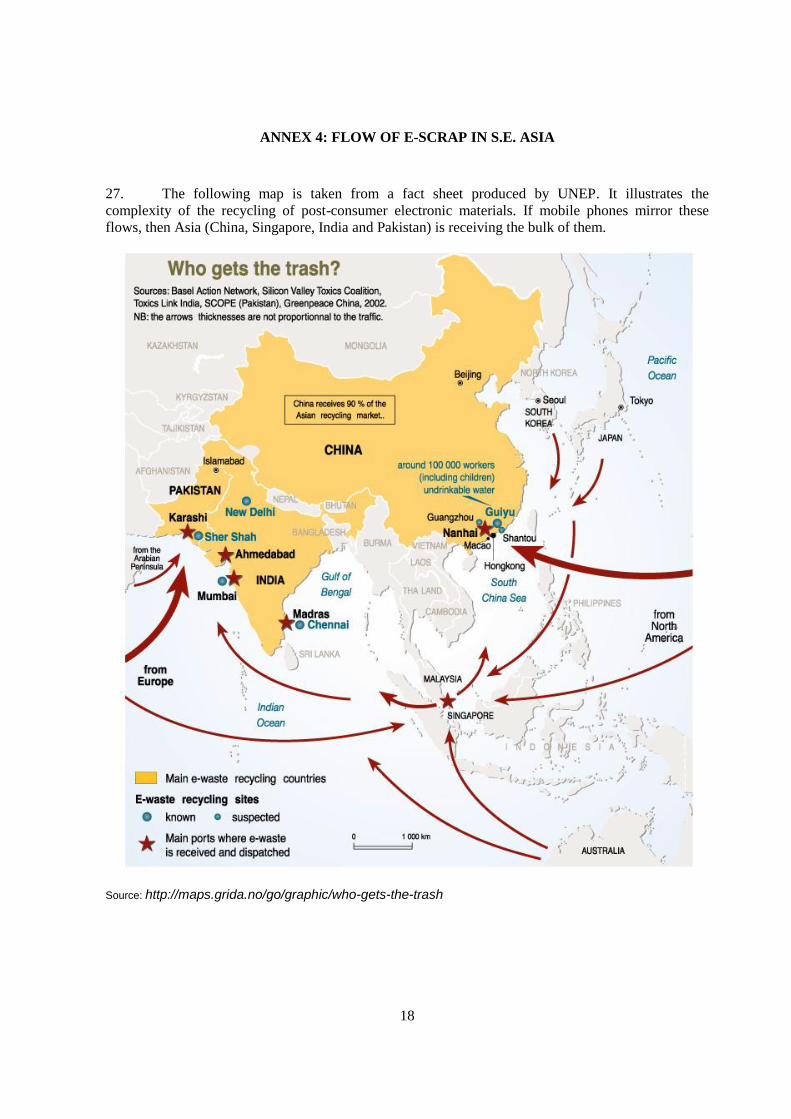
ANNEX 4: FLOW OF E-SCRAP IN S.E. ASIA
27. The following map is taken from a fact sheet produced by UNEP. It illustrates the
complexity of the recycling of post-consumer electronic materials. If mobile phones mirror these
flows, then Asia (China, Singapore, India and Pakistan) is receiving the bulk of them.
Source: http://maps.grida.no/go/graphic/who-gets-the-trash
19
ANNEX 5: ESTIMATED GLOBAL FLOW OF EXPIRED MOBILE PHONES (NOKIA)
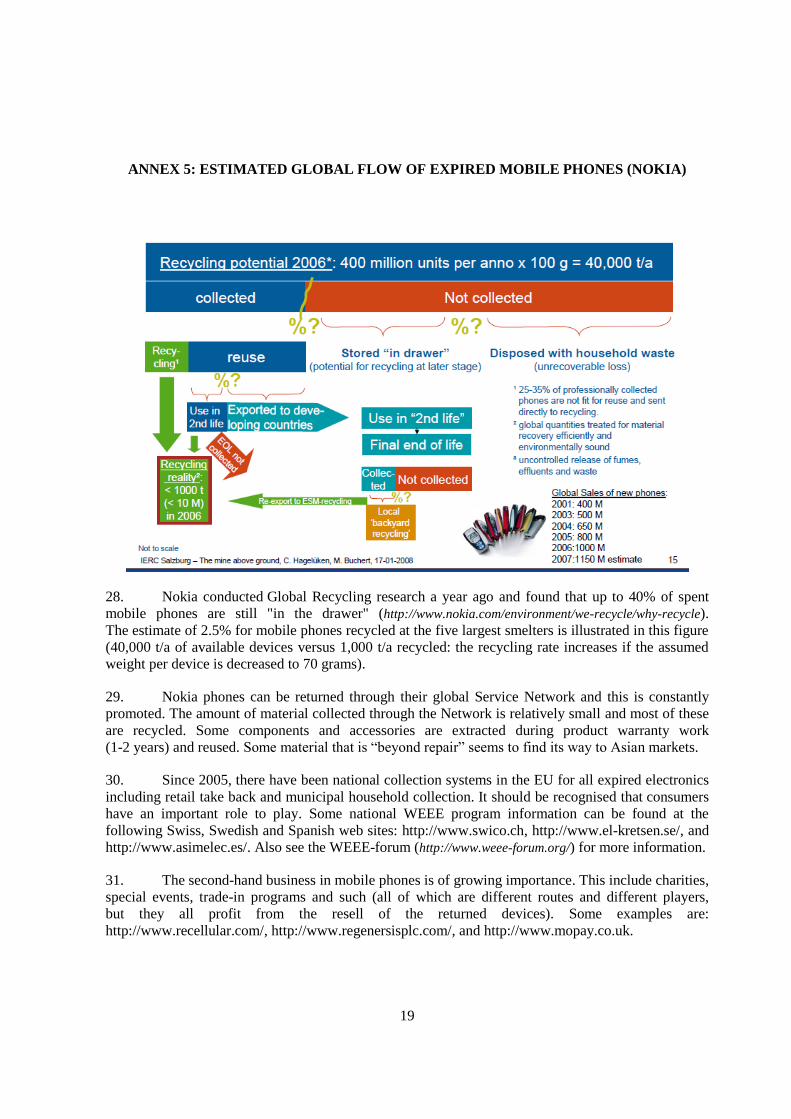
28. Nokia conducted Global Recycling research a year ago and found that up to 40% of spent
mobile phones are still "in the drawer" (http://www.nokia.com/environment/we-recycle/why-recycle).
The estimate of 2.5% for mobile phones recycled at the five largest smelters is illustrated in this figure
(40,000 t/a of available devices versus 1,000 t/a recycled: the recycling rate increases if the assumed
weight per device is decreased to 70 grams).
29. Nokia phones can be returned through their global Service Network and this is constantly
promoted. The amount of material collected through the Network is relatively small and most of these
are recycled. Some components and accessories are extracted during product warranty work
(1-2 years) and reused. Some material that is “beyond repair” seems to find its way to Asian markets.
30. Since 2005, there have been national collection systems in the EU for all expired electronics
including retail take back and municipal household collection. It should be recognised that consumers
have an important role to play. Some national WEEE program information can be found at the
following Swiss, Swedish and Spanish web sites: http://www.swico.ch, http://www.el-kretsen.se/, and
http://www.asimelec.es/. Also see the WEEE-forum (http://www.weee-forum.org/) for more information.
31. The second-hand business in mobile phones is of growing importance. This include charities,
special events, trade-in programs and such (all of which are different routes and different players,
but they all profit from the resell of the returned devices). Some examples are:
http://www.recellular.com/, http://www.regenersisplc.com/, and http://www.mopay.co.uk.
20
ANNEX 6: INTEGRATED SMELTER PROCESS FLOW
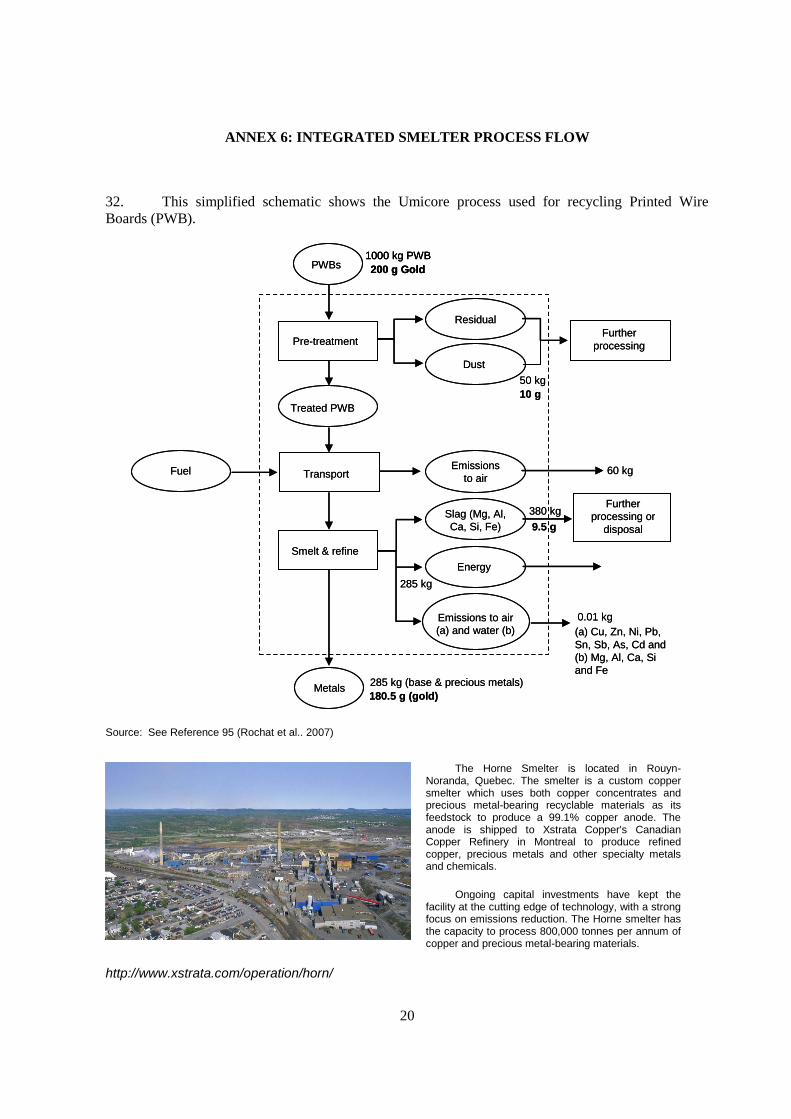
32. This simplified schematic shows the Umicore process used for recycling Printed Wire
Boards (PWB).
PWBs
Pre-treatment
Treated PWB
Smelt & refine
Metals
Fuel
Residual
Dust
Further
processing
1000 kg PWB
200 g Gold
Transport
Further
processing or
disposal
Emissions
to air
Slag (Mg, Al,
Ca, Si, Fe)
Energy
Emissions to air
(a) and water (b) (a) Cu, Zn, Ni, Pb,
Sn, Sb, As, Cd and
(b) Mg, Al, Ca, Si
and Fe
50 kg
10 g
60 kg
0.01 kg
380 kg
9.5 g
285 kg
285 kg (base & precious metals)
180.5 g (gold)
PWBs
Pre-treatment
Treated PWB
Smelt & refine
Metals
Fuel
Residual
Dust
Further
processing
1000 kg PWB
200 g Gold
1000 kg PWB
200 g Gold
Transport
Further
processing or
disposal
Emissions
to air
Slag (Mg, Al,
Ca, Si, Fe)
Energy
Emissions to air
(a) and water (b) (a) Cu, Zn, Ni, Pb,
Sn, Sb, As, Cd and
(b) Mg, Al, Ca, Si
and Fe
50 kg
10 g
60 kg
0.01 kg
380 kg
9.5 g
285 kg
285 kg (base & precious metals)
180.5 g (gold)
Source: See Reference 95 (Rochat et al.. 2007)
The Horne Smelter is located in Rouyn-Noranda, Quebec. The smelter is a custom copper smelter which uses both copper concentrates and precious metal-bearing recyclable materials as its feedstock to produce a 99.1% copper anode. The anode is shipped to Xstrata Copper's Canadian Copper Refinery in Montreal to produce refined copper, precious metals and other specialty metals and chemicals.
Ongoing capital investments have kept the facility at the cutting edge of technology, with a strong focus on emissions reduction. The Horne smelter has the capacity to process 800,000 tonnes per annum of copper and precious metal-bearing materials.
http://www.xstrata.com/operation/horn/
21
ANNEX 7: HYDROMETALLURGICAL PROCESS FLOW
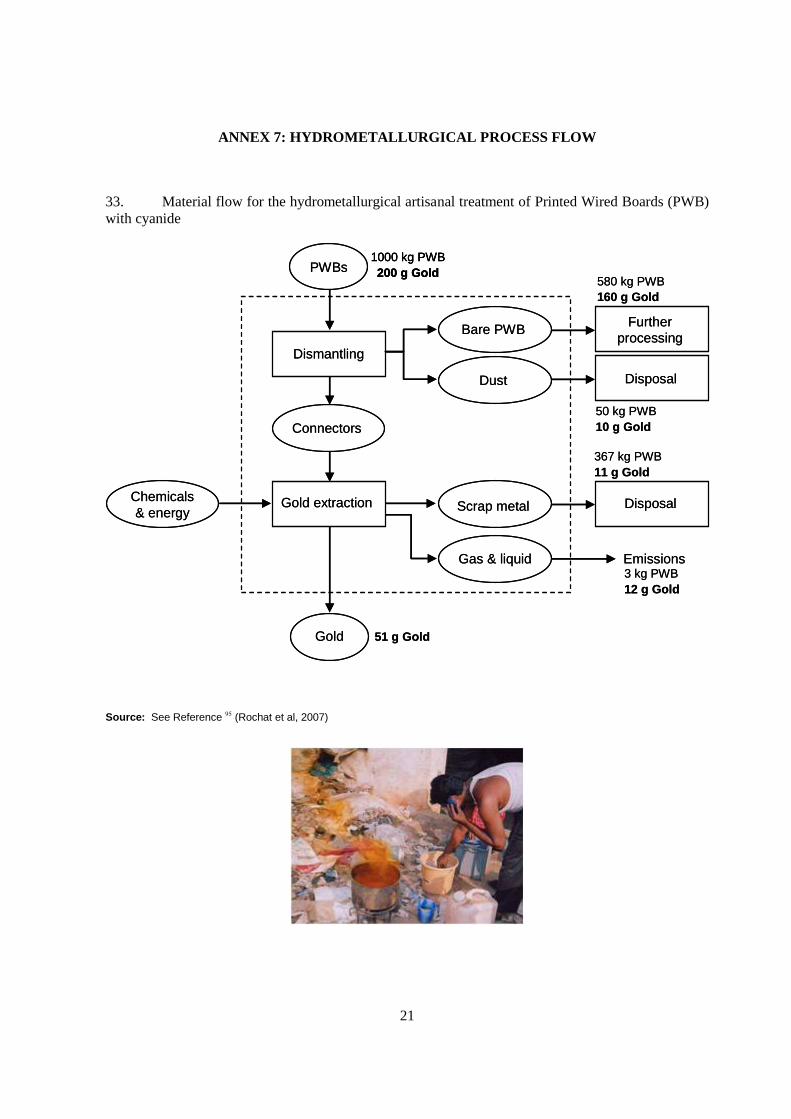
33. Material flow for the hydrometallurgical artisanal treatment of Printed Wired Boards (PWB)
with cyanide
PWBs
Dismantling
Connectors
Gold extraction
Gold
Chemicals
& energy
Bare PWB
Dust
Scrap metal
Gas & liquid
Further
processing
Disposal
Disposal
Emissions
1000 kg PWB
200 g Gold580 kg PWB
160 g Gold
50 kg PWB
10 g Gold
367 kg PWB
11 g Gold
3 kg PWB
12 g Gold
51 g Gold
PWBs
Dismantling
Connectors
Gold extraction
Gold
Chemicals
& energy
Bare PWB
Dust
Scrap metal
Gas & liquid
Further
processing
Disposal
Disposal
Emissions
1000 kg PWB
200 g Gold
1000 kg PWB
200 g Gold580 kg PWB
160 g Gold
50 kg PWB
10 g Gold
367 kg PWB
11 g Gold
3 kg PWB
12 g Gold
51 g Gold
Source: See Reference 95 (Rochat et al, 2007)
22
ANNEX 8: ENVIRONMENTAL IMPACT OF MATERIAL PRODUCED
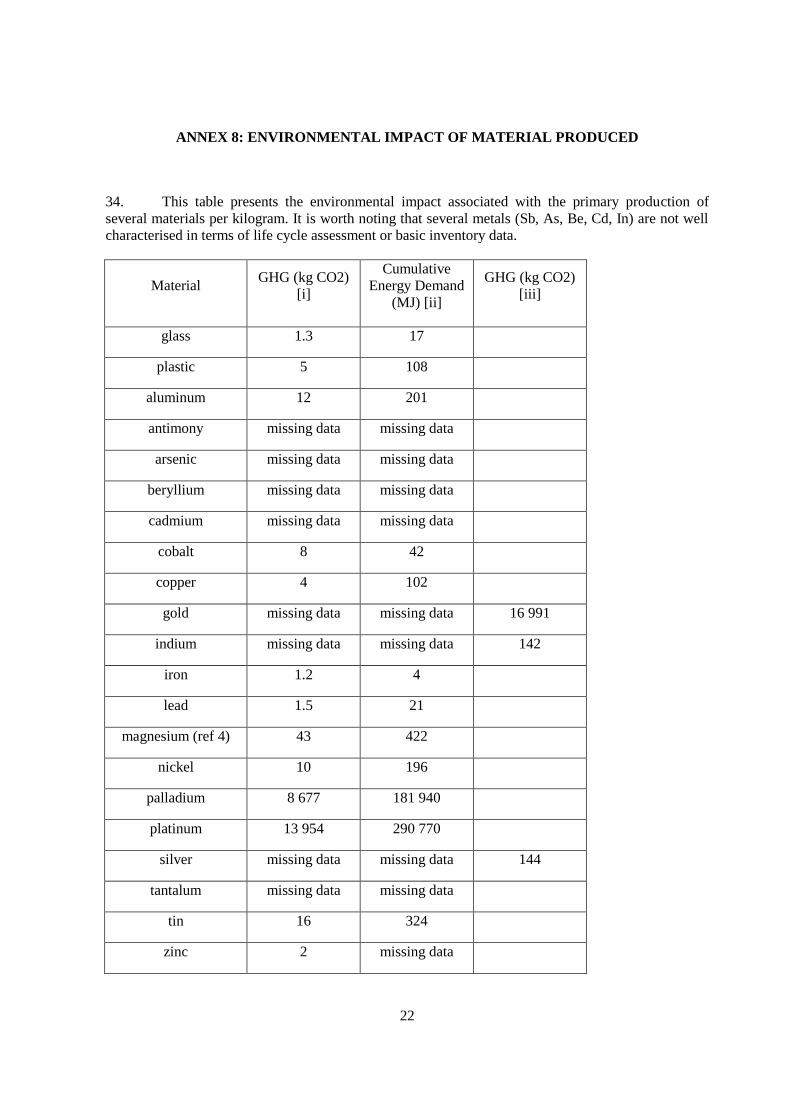
34. This table presents the environmental impact associated with the primary production of
several materials per kilogram. It is worth noting that several metals (Sb, As, Be, Cd, In) are not well
characterised in terms of life cycle assessment or basic inventory data.
Material GHG (kg CO2)
[i]
Cumulative
Energy Demand
(MJ) [ii]
GHG (kg CO2)
[iii]
glass 1.3 17
plastic 5 108
aluminum 12 201
antimony missing data missing data
arsenic missing data missing data
beryllium missing data missing data
cadmium missing data missing data
cobalt 8 42
copper 4 102
gold missing data missing data 16 991
indium missing data missing data 142
iron 1.2 4
lead 1.5 21
magnesium (ref 4) 43 422
nickel 10 196
palladium 8 677 181 940
platinum 13 954 290 770
silver missing data missing data 144
tantalum missing data missing data
tin 16 324
zinc 2 missing data

23
References:
[i] ecoinvent
[ii] Hagelücken, C. and Buchert, M. The mine above ground - opportunities & challenges to recover s
scarce and valuable metals from EOL electronic devices. International Electronic Research
Corporation (IERC) Salzburg. 2008.
[iii] LCA of magnesium - NRCan
24
ANNEX 9: PYROMETALLURGICAL RECOVERY YIELDS
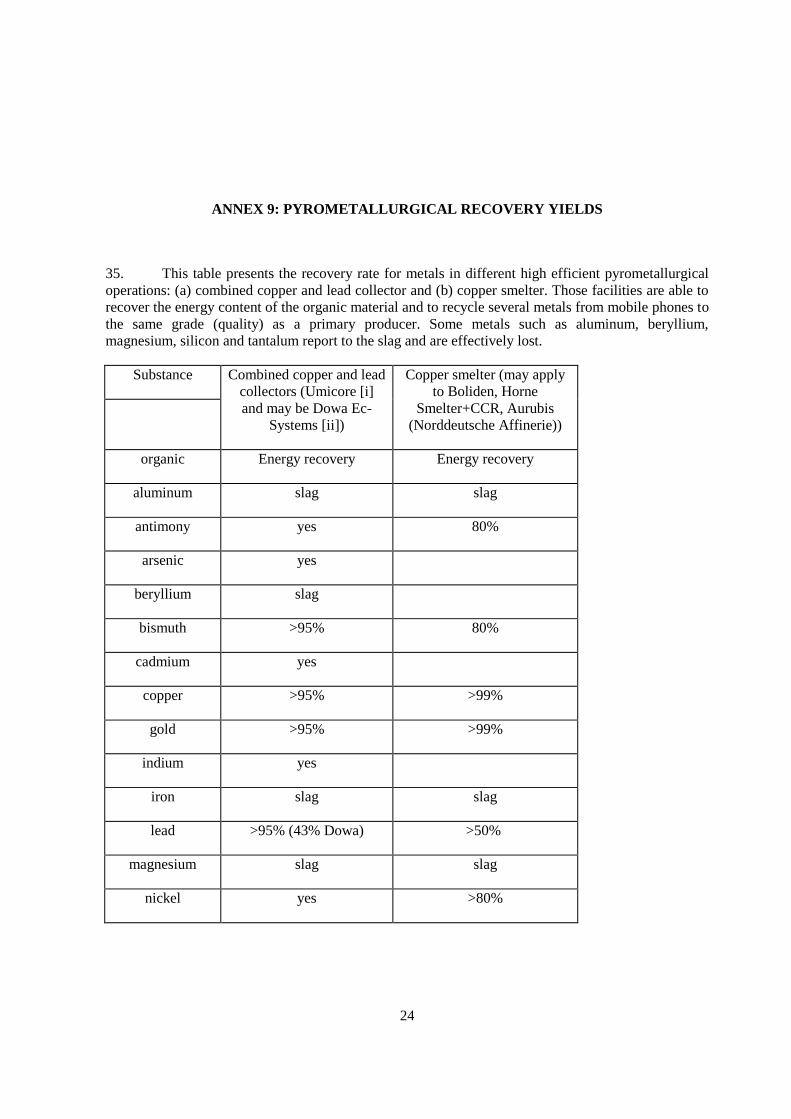
35. This table presents the recovery rate for metals in different high efficient pyrometallurgical
operations: (a) combined copper and lead collector and (b) copper smelter. Those facilities are able to
recover the energy content of the organic material and to recycle several metals from mobile phones to
the same grade (quality) as a primary producer. Some metals such as aluminum, beryllium,
magnesium, silicon and tantalum report to the slag and are effectively lost.
Substance Combined copper and lead
collectors (Umicore [i]
and may be Dowa Ec-
Systems [ii])
Copper smelter (may apply
to Boliden, Horne
Smelter+CCR, Aurubis
(Norddeutsche Affinerie))
organic Energy recovery Energy recovery
aluminum slag slag
antimony yes 80%
arsenic yes
beryllium slag
bismuth >95% 80%
cadmium yes
copper >95% >99%
gold >95% >99%
indium yes
iron slag slag
lead >95% (43% Dowa) >50%
magnesium slag slag
nickel yes >80%
25
palladium >95% >99%
platinum >95% >99%
selenium yes
silicon slag slag
silver >95% >99%
tantalum slag (lost) slag (lost)
tellurium yes
tin yes >50%
zinc slag (12% Dowa) >80%
References:
[i] Hagelüken, C. Mobile Phone Partnership Initiative (MPPI)-Study to test the recycling guideline, 2008-02.
[ii] Watanabe, K. and Nakagawara, S. The behavior of impurities at Kosaka Smelter. Kongoli F., Itagaki K., Yamauchi C., Sohn H.Y., Kongoli F., Itagaki K., Yamauchi C., and Sohn H.Y. Metallurgical and Materials Processing: Principles and Technologies Volume II: High-temperature metals Production. 2, 521-531. 2003///. San Diego, CA, TMS (The Minerals, Metals & Materials Society). Yazawa International Symposium: Metallurgical and Materials Processing: Principles and Technologies; High-Temperature Metal Production. 2 March 2003 through 6 March 2003.
26
ANNEX 10: FORWARD VERSUS REVERSE LOGISTICS
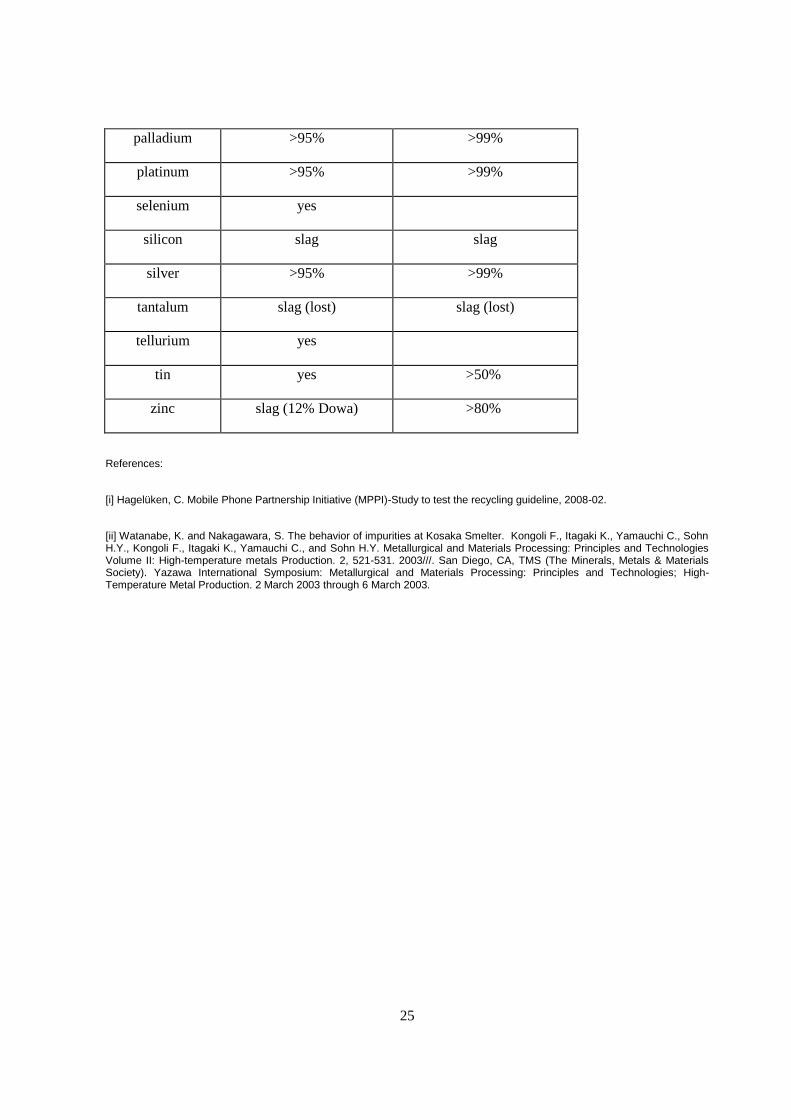
36. The Reverse Logistics Executive Council presents extensive information on their web site
(see under table) that illustrates the challenges faced by the private sector when it undertakes the task
of taking back old or spent products such as mobile devices.
Forward logistics Reverse logistics
Product quality uniform Product quality not uniform
Disposition options clear Disposition not clear
Routing of product unambiguous Routing of product ambiguous
Forward distribution costs more easily understandable
Reverse costs less understandable
Pricing of product uniform Pricing of product not uniform
Inventory management consistent Inventory management not consistent
Product life cycle manageable Product life cycle less manageable
Financial management issues clearer Financial management issues unclear
Negotiation between parties more straight-forward Negotiation less straight-forward
Types of customers easy to identify and market to Types of customers difficult to identify and market
Visibility of process more transparent Visibility of process less transparent
Source: www.rlec.org
27
ANNEX 11: OLD OR OBSOLETE MOBILE PHONES IN CANADA
37. The purpose of Annex 11 is to summarize/estimate the flow (sale, use, disposal, storage
and/or recycling) of cellular or mobile phones in Canada, which may or may not be typical of other
OECD countries. Existing and recent industry stewardship efforts may also be of interest and have
been referenced in the main report.
1. How is the telecommunications industry structured and who are the players?
38. The Canadian Radio-television and Telecommunications Commission (CRTC) regulates and
supervises these two industries: broadcasting and telecommunications. The CRTC is an independent
public agency that reports to Parliament via the Minister of Canadian Heritage (which is a
Government of Canada department).
39. The CRTC has a mandate to ensure that Canadians receive reliable and affordable telephone
and other related services but this role is changing. Where once there were only a few service
providers there are now many, with a plethora of packages and associated prices driving competition.
In addition, the lines between broadcasting and telecommunications are blurring as the technology
evolves, especially where various Internet services are concerned.
40. Industry Canada manages and licences the use of the radio-frequency spectrum.
In this regard, Ttere are a number of national and regional licensed wireless carriers in Canada most of
whom are members of the Canadian Wireless Telecommunications Association (CWTA):2
Aliant
Bell Mobility
Bruce Telecom
KMTS Mobility
MTS Communications Inc
Nexicom Mobility Inc.
Rogers Wireless Partnership
SaskTel
Sogetel Mobilité Inc.
TBay Tel
TELUS Mobility
Wightman Telecom Ltd.
Virgin Mobile
41. The three largest carriers (Rogers, Bell and TELUS) account for 94% of the market.
42. Cellular or mobile telephones are available from manufacturers around the world.
The big three manufacturers are Nokia, Motorola and Samsung while LG Electronics, Sony Ericsson
and BenQ-Siemens cover relatively minor shares of the market. The largest Canadian producer of
“smartphones” (Blackberry) is Research In Motion: The parts are from Asia and some assembly work
is done in Canada.
2 Canadian Wireless Telecommunications Association, http://www.cwta.ca/
28
2. How big is the mobile phone market?
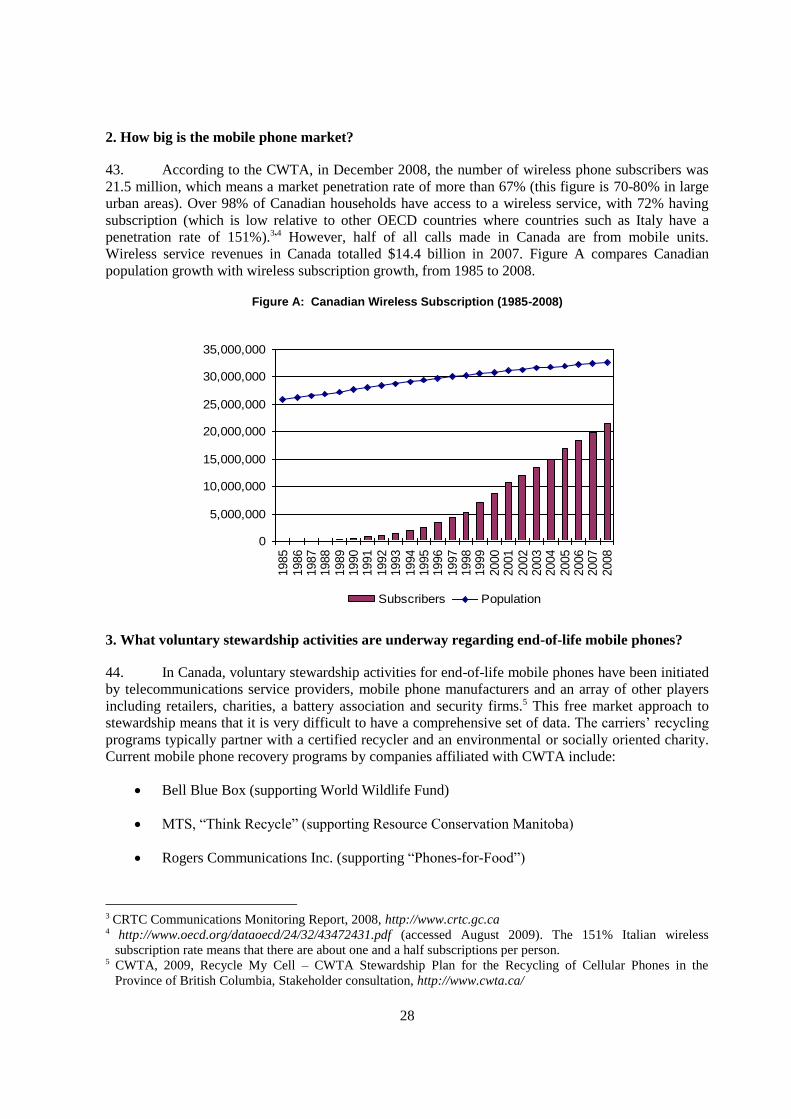
43. According to the CWTA, in December 2008, the number of wireless phone subscribers was
21.5 million, which means a market penetration rate of more than 67% (this figure is 70-80% in large
urban areas). Over 98% of Canadian households have access to a wireless service, with 72% having
subscription (which is low relative to other OECD countries where countries such as Italy have a
penetration rate of 151%).3,4 However, half of all calls made in Canada are from mobile units.
Wireless service revenues in Canada totalled $14.4 billion in 2007. Figure A compares Canadian
population growth with wireless subscription growth, from 1985 to 2008.
Figure A: Canadian Wireless Subscription (1985-2008)
0
5,000,000
10,000,000
15,000,000
20,000,000
25,000,000
30,000,000
35,000,000
1985
1986
1987
1988
1989
1990
1991
1992
1993
1994
1995
1996
1997
1998
1999
2000
2001
2002
2003
2004
2005
2006
2007
2008
Subscribers Population
3. What voluntary stewardship activities are underway regarding end-of-life mobile phones?
44. In Canada, voluntary stewardship activities for end-of-life mobile phones have been initiated
by telecommunications service providers, mobile phone manufacturers and an array of other players
including retailers, charities, a battery association and security firms.5 This free market approach to
stewardship means that it is very difficult to have a comprehensive set of data. The carriers’ recycling
programs typically partner with a certified recycler and an environmental or socially oriented charity.
Current mobile phone recovery programs by companies affiliated with CWTA include:
Bell Blue Box (supporting World Wildlife Fund)
MTS, “Think Recycle” (supporting Resource Conservation Manitoba)
Rogers Communications Inc. (supporting “Phones-for-Food”)
3 CRTC Communications Monitoring Report, 2008, http://www.crtc.gc.ca 4 http://www.oecd.org/dataoecd/24/32/43472431.pdf (accessed August 2009). The 151% Italian wireless
subscription rate means that there are about one and a half subscriptions per person. 5 CWTA, 2009, Recycle My Cell – CWTA Stewardship Plan for the Recycling of Cellular Phones in the
Province of British Columbia, Stakeholder consultation, http://www.cwta.ca/
29
SaskTel’s Phones for a Fresh Start (supporting PATHS)
TBayTel (supporting “P.R.O. Kids”)
TELUS “Return & Recycle” (supporting Trees Canada)
Motorola (“Mobile Devices Takeback Program”)
Videotron Allo la Terre (supporting Earth Day Quebec’s Allo la Terre)
Virgin Mobile Canada’s Red is the New Green
45. Additional mobile phone collection programs are conducted by outfits not affiliated with
CWTA because of the device’s intrinsic metal value. These other collection activities are generally not
tracked so the size or success of these activities is unknown. This makes national reporting somewhat
problematic. Here is a list of other programs operating in Canada:
Best Buy and Future Shops
Canadian Diabetes Society (“Project Redial”)
Charitable Recycling Program
Pitch-In Canada
Project Redial
The Rechargeable Battery Recycling Corporation
Various U.S. based collectors accept mobile phones by mail
30
4. Are there any mandatory stewardship activities for mobile phones in Canada?
46. Provincial and territorial regulations have jurisprudence over disposal/recovery of mobile
phones. EPR programs for waste electronic and electrical equipment (WEEE) are rolling out across the
country and are now active in British Columbia (B.C.), Alberta, Saskatchewan, and Nova Scotia, with
Ontario coming on-line April 2010 (which is about 67% of Canada’s population). In B.C. and
Saskatchewan, mobile phones are not included under their WEEE regulations. In the Alberta
Electronics Designation Regulation, electronics include mobile phones and other wireless devices.6
In Ontario, the mobile phones are included as a Schedule 3 item in the OES stewardship plan.7
47. In Nova Scotia and B.C., where the CWTA Recycle My Cell program has received
regulatory approval, this new stewardship plan is based on their national (no fee) model.8
Whilst CWTA acts as a coordinating and liaison agent for its members, take back programs that are
run by the various companies will continue as is. However, as required by the province, CWTA will
track and report all materials collected including quantity returned and the corresponding amounts
resold or recycled. The approved CWTA plans identify a set of “performance indicators” for “ongoing
evaluation” of their mobile phone collection program. At this time, a recovery target is not specified;
rather, the broad based assessment process will include annual consumer awareness surveys, waste
audits, web site traffic, toll free number calls or the like.
48. Recycle My Cell has also been formally recognized by the provinces of Prince Edward
Island, New Brunswick, Manitoba, Newfoundland and Labrador, and Saskatchewan as the official
cellular phone stewardship program within those provinces.
5. What is the estimated flow of end-of-life mobile phones?
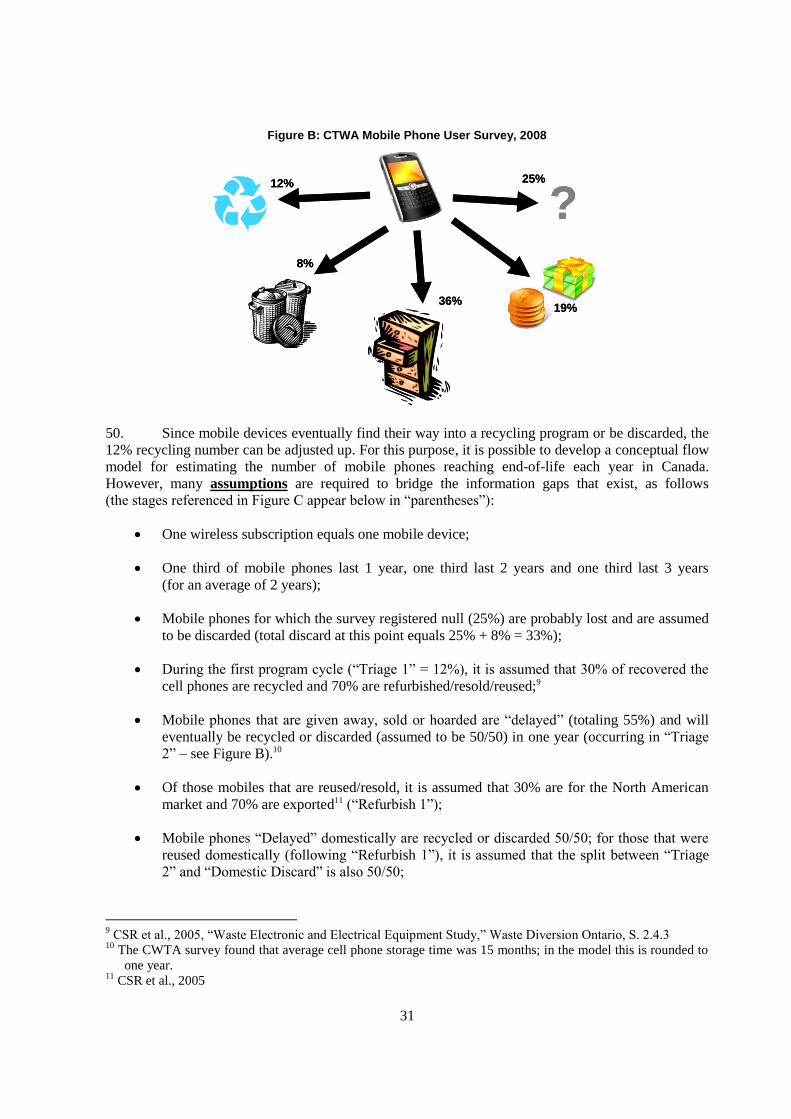
49. CWTA reported the results of a 2008 user survey in which expected mobile phone lifespan
was found to be 2.5 years (which is longer than the 18 months referenced in the main report).
What people said they do with old or obsolete mobile phones in Canada is shown in Figure B.
The CTWA also reports that in 2008, its member companies collected 360,167 old mobile phones;
however, non-member recovery data were not discovered and may be significant.
6 http://www.qp.gov.ab.ca/documents/Regs/2004_094.cfm?frm_isbn=9780779725168 7 http://www.wdo.ca/content/?path=page80+item38686 8 See http://www.tourismhrc.com/current-newsletter.php?article=499 for Jan-2009 news release.
31
Figure B: CTWA Mobile Phone User Survey, 2008
12%
8%
36% 19%
? 25% 12%
8%
36% 19%
? 25%
50. Since mobile devices eventually find their way into a recycling program or be discarded, the
12% recycling number can be adjusted up. For this purpose, it is possible to develop a conceptual flow
model for estimating the number of mobile phones reaching end-of-life each year in Canada.
However, many assumptions are required to bridge the information gaps that exist, as follows
(the stages referenced in Figure C appear below in “parentheses”):
One wireless subscription equals one mobile device;
One third of mobile phones last 1 year, one third last 2 years and one third last 3 years
(for an average of 2 years);
Mobile phones for which the survey registered null (25%) are probably lost and are assumed
to be discarded (total discard at this point equals 25% + 8% = 33%);
During the first program cycle (“Triage 1” = 12%), it is assumed that 30% of recovered the
cell phones are recycled and 70% are refurbished/resold/reused;9
Mobile phones that are given away, sold or hoarded are “delayed” (totaling 55%) and will
eventually be recycled or discarded (assumed to be 50/50) in one year (occurring in “Triage
2” – see Figure B).10
Of those mobiles that are reused/resold, it is assumed that 30% are for the North American
market and 70% are exported11 (“Refurbish 1”);
Mobile phones “Delayed” domestically are recycled or discarded 50/50; for those that were
reused domestically (following “Refurbish 1”), it is assumed that the split between “Triage
2” and “Domestic Discard” is also 50/50;
9 CSR et al., 2005, “Waste Electronic and Electrical Equipment Study,” Waste Diversion Ontario, S. 2.4.3
10 The CWTA survey found that average cell phone storage time was 15 months; in the model this is rounded to
one year. 11
CSR et al., 2005
32
Of mobiles processed via “Triage 2”, 50% are recycled domestically and 50% are exported
for reuse;
The final offshore fate is assumed to be 50/50 for recycle/discard.
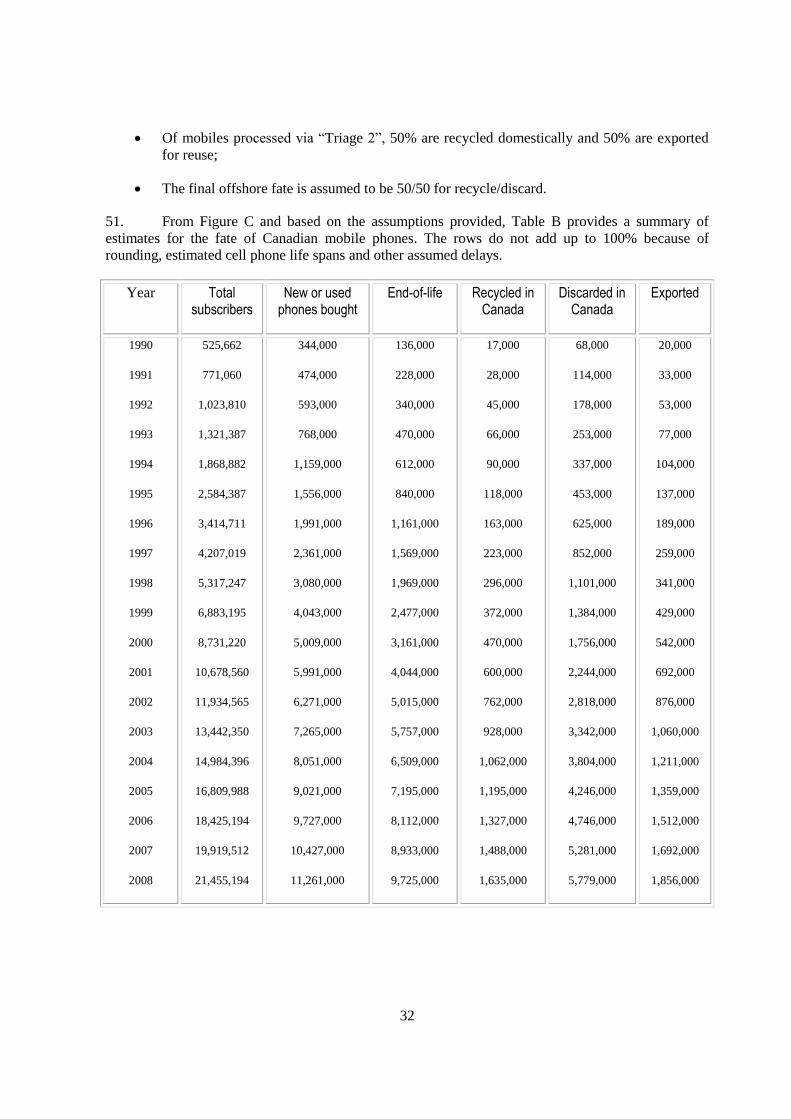
51. From Figure C and based on the assumptions provided, Table B provides a summary of
estimates for the fate of Canadian mobile phones. The rows do not add up to 100% because of
rounding, estimated cell phone life spans and other assumed delays.
Year Total subscribers
New or used phones bought
End-of-life Recycled in Canada
Discarded in Canada
Exported
1990
1991
1992
1993
1994
1995
1996
1997
1998
1999
2000
2001
2002
2003
2004
2005
2006
2007
2008
525,662
771,060
1,023,810
1,321,387
1,868,882
2,584,387
3,414,711
4,207,019
5,317,247
6,883,195
8,731,220
10,678,560
11,934,565
13,442,350
14,984,396
16,809,988
18,425,194
19,919,512
21,455,194
344,000
474,000
593,000
768,000
1,159,000
1,556,000
1,991,000
2,361,000
3,080,000
4,043,000
5,009,000
5,991,000
6,271,000
7,265,000
8,051,000
9,021,000
9,727,000
10,427,000
11,261,000
136,000
228,000
340,000
470,000
612,000
840,000
1,161,000
1,569,000
1,969,000
2,477,000
3,161,000
4,044,000
5,015,000
5,757,000
6,509,000
7,195,000
8,112,000
8,933,000
9,725,000
17,000
28,000
45,000
66,000
90,000
118,000
163,000
223,000
296,000
372,000
470,000
600,000
762,000
928,000
1,062,000
1,195,000
1,327,000
1,488,000
1,635,000
68,000
114,000
178,000
253,000
337,000
453,000
625,000
852,000
1,101,000
1,384,000
1,756,000
2,244,000
2,818,000
3,342,000
3,804,000
4,246,000
4,746,000
5,281,000
5,779,000
20,000
33,000
53,000
77,000
104,000
137,000
189,000
259,000
341,000
429,000
542,000
692,000
876,000
1,060,000
1,211,000
1,359,000
1,512,000
1,692,000
1,856,000
33
Figure C: Conceptual Flow of Spent Mobile Phones in Canada
End-of-life
cell phones
Domestic
Discard
Refurbish 1Domestic
Recycle
Triage 1 Delayed
Offshore
ReuseDomestic
Reuse
Offshore
DiscardOffshore
Recycle
Triage 2 Domestic
Discard
Refurbish 2Domestic
Recycle
(assume no more
domestic reuse)Offshore
Reuse
Offshore
DiscardOffshore
Recycle
33% 12% 55%
70% 30%
70% 30%
50% 50%
50%
50%
50% 50%
50% 50%
50% 50%
100%
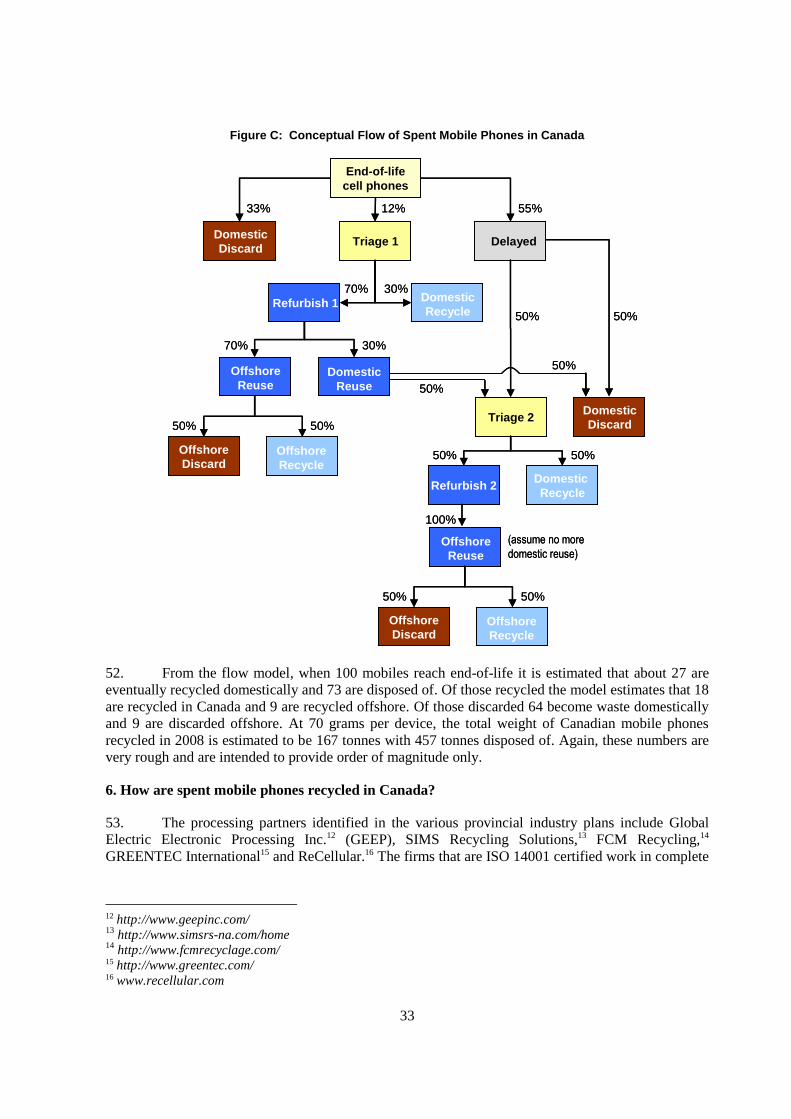
52. From the flow model, when 100 mobiles reach end-of-life it is estimated that about 27 are
eventually recycled domestically and 73 are disposed of. Of those recycled the model estimates that 18
are recycled in Canada and 9 are recycled offshore. Of those discarded 64 become waste domestically
and 9 are discarded offshore. At 70 grams per device, the total weight of Canadian mobile phones
recycled in 2008 is estimated to be 167 tonnes with 457 tonnes disposed of. Again, these numbers are
very rough and are intended to provide order of magnitude only.
6. How are spent mobile phones recycled in Canada?
53. The processing partners identified in the various provincial industry plans include Global
Electric Electronic Processing Inc.12 (GEEP), SIMS Recycling Solutions,13 FCM Recycling,14
GREENTEC International15 and ReCellular.16 The firms that are ISO 14001 certified work in complete
12 http://www.geepinc.com/ 13
http://www.simsrs-na.com/home 14
http://www.fcmrecyclage.com/ 15 http://www.greentec.com/ 16 www.recellular.com
34
compliance with Basel Convention directives concerning transboundary movement of recyclable
materials.
54. As an example of how mobile phones are recycled in Canada, a summary of the GEEP
process is provided: At present, GEEP is executing the following processes;
55. Harvesting of components: GEEP executes a manual disassembly and the recovery for
reuse of certain mobile phone components in other consumer electronic products: printed circuit
boards are then shredded and screened (70% of PCBs are non-metallic17). This process also allows for
the separation of plastic parts from metallic ones. With the plastic components, GEEP is exploring the
potential use of nano fuel technologies and the conversion of plastic waste to a diesel product.18
56. Recycling of whole units: GEEP strips the batteries off mobile phones and then shreds the
phones in 18 tonne batches, separate from other e-waste. Three fractions are produced: ferrous,
nonferrous and plastics. The primary economic drivers are the copper and gold components but silver,
palladium and platinum are recovered as well. The entire nonferrous fraction (screened at 1.9 cm) is
shipped to an integrated pyrometallurgical smelter in Europe. GEEP prides itself on the generation of
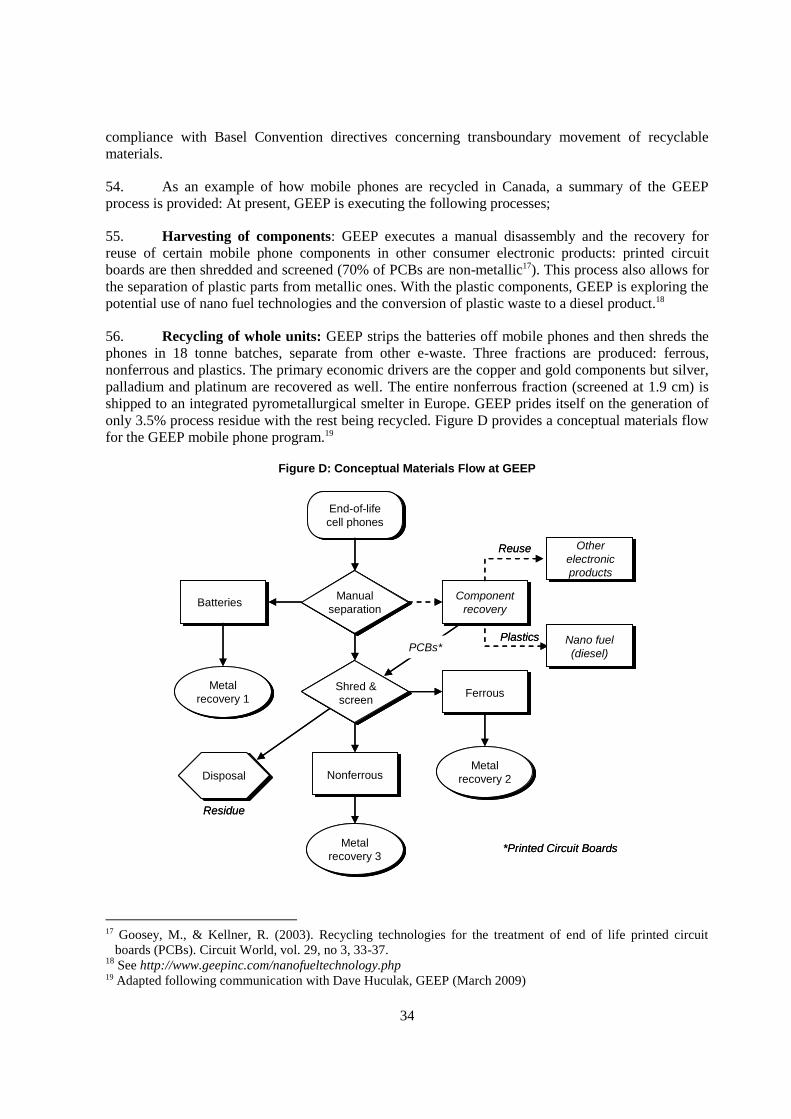
only 3.5% process residue with the rest being recycled. Figure D provides a conceptual materials flow
for the GEEP mobile phone program.19
Figure D: Conceptual Materials Flow at GEEP
End-of-life
cell phones
Manual
separationBatteries
Metal
recovery 1Shred &
screenFerrous
NonferrousMetal
recovery 2
Metal
recovery 3
Component
recovery
Nano fuel
(diesel)
Other
electronic
products
Disposal
Residue
Reuse
Plastics
*Printed Circuit Boards
PCBs*
End-of-life
cell phones
Manual
separation
Manual
separationBatteriesBatteries
Metal
recovery 1Shred &
screen
Shred &
screenFerrousFerrous
NonferrousNonferrousMetal
recovery 2
Metal
recovery 3
Component
recovery
Component
recovery
Nano fuel
(diesel)
Nano fuel
(diesel)
Other
electronic
products
Other
electronic
products
DisposalDisposal
Residue
Reuse
Plastics
*Printed Circuit Boards
PCBs*
17 Goosey, M., & Kellner, R. (2003). Recycling technologies for the treatment of end of life printed circuit
boards (PCBs). Circuit World, vol. 29, no 3, 33-37. 18
See http://www.geepinc.com/nanofueltechnology.php 19 Adapted following communication with Dave Huculak, GEEP (March 2009)
35
7. How does mobile phone collection and recycling compare with other end-of-life waste
electronic and electrical equipment (WEEE) management programs in Canada?
57. As noted previously, where a recycler like GEEP or SIMS process both WEEE and mobile
phones, because of the proportionately high content of valuable metals, mobile phones are not mixed
with other items. Therefore, to establish proper context, it can be estimated that if there are 20.1
million mobile/wireless devices in operation in Canada, at 70 grams for the body plus 30 grams for the
battery, this represents about 1,840 tonnes of product. With 9.7 million mobiles available for
reuse/recycling each year, 973 tonnes require end-of-life management. In contrast, based on some
estimates from Ontario,20 the amount of WEEE available for end-of-life collection in Canada is in the
240,000 tonne per year range.21
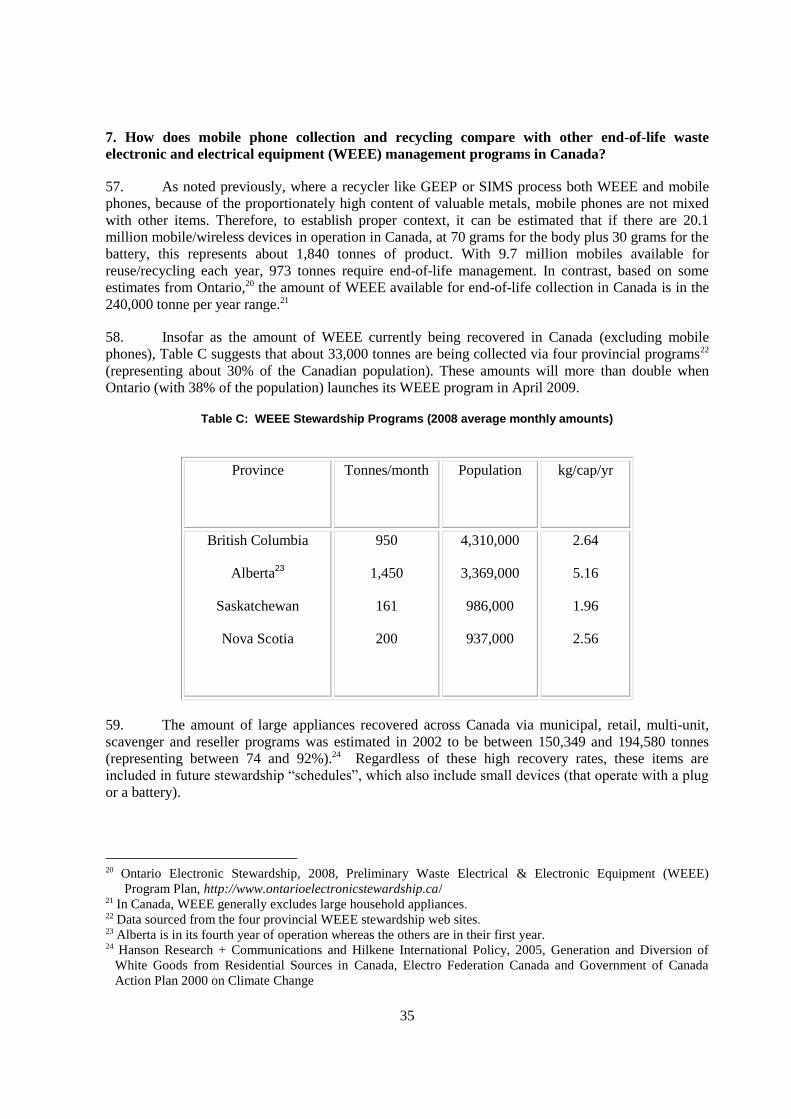
58. Insofar as the amount of WEEE currently being recovered in Canada (excluding mobile
phones), Table C suggests that about 33,000 tonnes are being collected via four provincial programs22
(representing about 30% of the Canadian population). These amounts will more than double when
Ontario (with 38% of the population) launches its WEEE program in April 2009.
Table C: WEEE Stewardship Programs (2008 average monthly amounts)
Province
Tonnes/month Population kg/cap/yr
British Columbia
Alberta23
Saskatchewan
Nova Scotia
950
1,450
161
200
4,310,000
3,369,000
986,000
937,000
2.64
5.16
1.96
2.56
59. The amount of large appliances recovered across Canada via municipal, retail, multi-unit,
scavenger and reseller programs was estimated in 2002 to be between 150,349 and 194,580 tonnes
(representing between 74 and 92%).24 Regardless of these high recovery rates, these items are
included in future stewardship “schedules”, which also include small devices (that operate with a plug
or a battery).
20 Ontario Electronic Stewardship, 2008, Preliminary Waste Electrical & Electronic Equipment (WEEE)
Program Plan, http://www.ontarioelectronicstewardship.ca/ 21 In Canada, WEEE generally excludes large household appliances. 22 Data sourced from the four provincial WEEE stewardship web sites. 23 Alberta is in its fourth year of operation whereas the others are in their first year. 24 Hanson Research + Communications and Hilkene International Policy, 2005, Generation and Diversion of
White Goods from Residential Sources in Canada, Electro Federation Canada and Government of Canada
Action Plan 2000 on Climate Change
36
ANNEX 12: INCORPORATING SOCIAL ASPECTS INTO SUSTAINABLE METALS
MANAGEMENT
60. The enclosed text provides a literature review and further discussion regarding social issues
within the life cycle of metals and, by extension, materials and products. This annex supplements
Section 2.4 of the main report. The corresponding author for this work is Professor Steven B. Young, +1-519-822-1660, [email protected]
1. Introduction
61. The Working Group on Waste Prevention and Recycling (WGWPR) of the Organisation for
Economic Co-operation and Development (OECD) is undertaking four cases studies to explore policy
opportunities and barriers associated with implementation of the concept of Sustainable Materials
Management (SMM). One of the case studies, submitted by the Government of Canada, regards
critical metals in consumer electronics.
62. Canada’s proposed case study aims to shed light on the use and fate of metals used in
consumer electronics, incorporating existing data about related material flows and discussions on the
environmental and social impacts of metals over the whole life cycle. It addresses several issues, such
as costs and benefits of SMM; consumer and producer interests; international and cross-sectoral
dimensions; effects on the competitiveness of firms in the related industries; and the social
implications of SMM. Given the many different kinds of consumer electronic devices, the study has
been using mobile phones as a proxy to assess the environmental, economic and social aspects of the
life cycle of metals.
63. The case study was divided in two phases. The ongoing Phase 1 will be completed by the
end of April 2009; Phase 2 is expected to be completed by September 2009, so that it can be discussed
at the WGWPR meeting in December 2009. Phase 1 consists mostly of literature reviews that will help
identify existing information, approaches, and knowledge gaps. These gaps and the questions they
raise will, in turn, inform the focus for developing new and existing approaches for Phase 2.
64. The present report, which is part of the works undertaken in Phase 1, has a threefold
objective:
Propose a framework that may help policy-makers identify barriers and opportunities
associated with the management of social aspects in the life cycle of metals used in
consumer electronics;
Present a preliminary literature review related to the social aspects of the proposed
framework.
Illustrate the potential usefulness of the framework.
65. Two relevant limitations of this report should be acknowledged. First, it was based solely on
literature reviews. Second, it was completed under a relatively constrained timeframe by two scholars.
37
Therefore, the information presented here focuses on the most relevant issues in connection to the
scope. The authors, assuming that the readers are familiar with the main issues being discussed, have
avoided extensive contextualization and conceptualizations.
66. The document is organized as follows. Section 2 discusses the challenge of incorporating
social aspects in Sustainable Materials Management initiatives. Section 3 emphasizes the relevance of
the emerging methods of Social Life Cycle Assessment (SLCA), and presents a SLCA-based
framework that may help in the identification of barriers and opportunities associated with the
management of social aspects in the life cycle of metals. Section 4 presents the result of a literature
review regarding the framework’s social aspects, pointing out knowledge gaps. Section 5 illustrates
how the proposed framework can be used in the identification of managerial and policy tools that
address social aspects in the life cycle of metals. Conclusions and recommendations for future studies
are finally drawn in Section 6.
2. Sustainable Materials Management and the “Overlooked” Social Aspects
67. Sustainable Materials Management (SMM) is a concept that emerged from the need to
harness the increasing socio-environmental externalities of materials flows in the biosphere.
It is an umbrella term that is being related to the integration of a wide range of actions that may be
applied during the extraction, manufacturing, use, transport, recycling and disposal of materials.
Unlike the sustainable development concept, which found an influential definition in a particular point
in time (WCED, 1987, p. 8), the definition of SMM is still in formative stages. Joseph Fiksel, in one of
the most seminal works on this emerging concept, defined SMM as
… an integrated approach toward managing material life cycles to achieve both economic
efficiency and environmental viability. Material life cycles include all human activities related to
material selection, exploration, extraction, transportation, processing, consumption, recycling,
and disposal. (Fiksel, 2006, p. 17)
68. Fiksel’s definition emphasizes the integration of actions during the life cycle of materials.
However, his approach focuses on the environmental and economic dimensions of sustainability.
According to this author, SMM strategies can be separated into two categories: dematerialization
(reduction of material throughput in an economic system) and detoxification (reduction of adverse
human or ecological effects associated with materials use).
69. A more comprehensive working definition has been proposed by the aforementioned
Working Group on Waste Prevention and Recycling and others during the First OECD Workshop on
SMM:
Sustainable Materials Management is an approach to promote sustainable materials use,
integrating actions targeted at reducing negative environmental impacts and preserving natural
capital throughout the life-cycle of materials, taking into account economic efficiency and social
equity. (OECD, 2007, p. 3)
70. This working definition also emphasizes the integration of actions during the life cycle of
materials. However, it does so by referring not only to economic and environmental issues, but also to
the need to consider social equity. It thus acknowledges to a certain extent the social dimension of
sustainability. Yet the main focus is still on “reducing negative environmental impacts and preserving
natural capital”.
38
71. The limited attention to social aspects of those definitions is reflected in initiatives related to
SMM. A recent compilation of such initiatives undertaken by the OECD (2008a) makes it clear.
Only a few of the 68 compiled initiatives were found to address social issues. The overall majority
covered environmental-focused tools related to eco-efficiency, eco-design, green procurement,
extended producer responsibility, among others. The same argument holds true for SMM
methodologies. An OECD study reviewed ten methodologies that are relevant to assess material use in
terms of its potential impacts on the environment, society and economy. It found that nine
methodologies were applicable to the assessment of environmental issues; five to economic issues;
and only two to social issues (OECD, 2008b). The latter (Total Cost Assessment and Cost Benefit
Analysis) had, nonetheless, a narrow approach, as they addressed social aspects primarily through an
economic lens. Attempts to apply the principles of SMM to metals have also downplayed non-
environmental issues (Gleich, Ayres, & Göbling-Reisemann, 2006; Zeltner, Bader, Scheidegger, &
Baccini, 1999).
72. Given the importance of integrating social and economic and environmental dimensions in
sustainability strategies (Atkinson, Dietz, & Neumayer, 2007; Dalal-Clayton & Bass, 2002),
future years are likely to witness increasing efforts towards the consideration of social aspects in
sustainable materials management as well. A significant barrier to be overcome, however, will be the
diversity of approaches that can inform this challenge.
73. “Social issues”, like SMM itself, is an umbrella term to describe a wide range of matters that
affect society. They can involve negative problems, such as violence, conflict, injustice, corruption,
racism, war, unemployment; or positive effects, such as job creation, peace, comfort, convenience, and
pleasure. These issues can affect society in various scales, from small employee groups, to local
communities or the global population in general. Moreover, the effects can overlap, combine and/or
change across the life cycle of materials.
74. To date, there is not a single SMM initiative or methodology trying to address the diversity
of social issues in the life cycle of materials. As the OECD studies (OECD, 2008a, 2008b) have
shown, efforts usually concentrate on particular aspects and life cycle stages. Recent developments in
the emerging field of social life cycle assessment are, nonetheless, hinting at comprehensive ways that
may help to frame this challenge.
3. A SLCA-based Framework for Incorporating Social Aspects in SMM
75. The emergence of the SMM concept is tied to the realization that “looking only at wastes,
i.e. end-of-life materials resulting from human activities, is no longer sufficient” and that “a more
creative and far-sighted solutions that employ life-cycle thinking (…)” are needed (OECD, 2007, p. 2).
In this context, life cycle assessment (LCA) emerges as one of the most relevant tools to SMM,
as it allows for such “far-sighted” approach.
76. LCA is a methodology for assessing impacts throughout the life cycle of a product, material,
process or activity, by identifying, quantifying and evaluating environmental and health aspects.
This tool has received widespread adoption in decision-making regarding environmental issues.
But because it fails to address social issues, its value as a tool to support sustainability-oriented
strategies is frequently questioned (Dreyer, Hauschild, & Schierbeck, 2006). In the past years,
however, there has been a growing interest in the incorporation of social aspects in LCAs.
Such efforts are being referred to as social LCA (SLCA) or, when including environmental aspects,
sustainability LCA.
39
77. SLCAs are particularly important because they have been dealing with many of the
challenging questions that are relevant to making SMM more inclusive to society’s needs: What social
aspects should be considered? How to assess or measure these aspects? Which types of indicators
should be used? Should they be quantitative, semi-quantitative or qualitative? Do SLCAs need new
areas of protection, such as well-being? A variety of methodologies for SLCA have been developed in
the past few years (Barthel, Pflieger, & Held, 2007; Brent & Labuschagne, 2008; Dreyer, et al., 2006;
Grießhammer, et al., 2006; Hauschild, Dreyer, & Jorgensen, 2008; Hunkeler, 2006; Kruse, Flysjö,
Kasperczyk, & Scholz, 2009; Labuschagne & Brent, 2006; Manhart & Grießhammer, 2007;
Norris, 2006; Pedersen, 2003; Weidema, 2006). Each of these carries particular assumptions and
interpretations.
78. Andreas Jorgensen and others (2008) recently compared fourteen methodologies and “found
a multitude of different approaches with regards to nearly all steps in the SLCA methodology,
reflecting that this is a very new and immature field of LCA.” In spite of this diversity, their study
made clear that there is an emerging trend related to the adoption of social midpoint indicators in
connection with stakeholder categories. That is, the social indicators in most of the evaluated
methodologies were being addressed in the context of impacted stakeholder groups, such as
workforce, local community, users/consumers, and society in general. As for the specific indicators,
they have been drawn from international norms and standards such as the Global Reporting Initiative
(GRI, 2006) and the International Labour Organization Conventions. The sense-making power of such
approaches to categorizing social aspects has been corroborated by its adoption in the
UNEP/SETAC’s Task Force on the Integration of Social Criteria into LCA (Grießhammer, et al.,
2006; UNEP/SETAC, 2008-2009), which gathers several of the world’s top specialists in this
emerging field.
79. The present report followed the same rationale in designing a framework that may help
policy-makers identify barriers and opportunities associated with the management of social aspects
across the life cycle of metals used in consumer electronics. The proposed framework, shown in
Figure 1, correlates the main life cycle stages of metals used in electronics with 26 social indicators
arranged according to 4 stakeholder groups. Given the context of the proxy research focus on mobile
phones, under which the present study has been undertaken, the framework’s selected life cycle stages
mirror the stages emphasized in studies on the life cycle of mobile phones (GSMA, 2006; McLaren,
Wright, & Parkinson, 1999; Scharnhorst, Hilty, & Jolliet, 2006). They include design, extraction and
processing, manufacturing, use, trade, reuse, recycle and disposal. The categorization of impacted
stakeholder groups and social indicators was, in turn, based on the most commonly found approaches
in the aforementioned methodologies of SLCA. Selected stakeholder groups encompass workforce,
users, local community and society. The specific indicators can be seen in Appendix 1, which will be
explained further on.
40
Figure 1 – Metal’s Social Issues Identification Framework
80. As opposed to SLCAs, the proposed framework does not aim at “assessing” social impacts
or evaluating trade-offs among life cycle stages or with other environmental and economic issues.
Therefore it makes no requirements as to how quantify, normalise and valuate social aspects.
The purpose of the framework is simply to (1) help build a qualitative understanding of the most
relevant social issues across the life cycle of metals used in electronics; and (2) relate those issues to
tools, geographical regions, specific metals, institutions, time, etc. For the second purpose, it adopts a
lenses approach similar to the one developed by Beloff and others (2004). Through this approach, the
scope of the qualitative understanding of social issues can logically be expanded to include:
tools that can be applied in the management of social aspects;
institutions and organizations;
sensitive geographical regions;
changes over time;
metals of concern.
81. The framework was designed to help grasp the “big picture” related to the incorporation of
social aspects in sustainable metals management. It can help identify, among others, relevant social
problems, knowledge gaps, critical metals, sensitive areas, and opportunities for collaborations among
institutions. It can also help to promote the integration of actions across the life cycle, which is a key
requirement of the SMM concept. Public or private organizations are likely to find the framework
useful as a “first step”, before more quantitative and focused actions are taken. The qualitative and
exploratory nature of the framework is consistent with the rather embryonic nature of the studies
related to the incorporation of social aspects in SMM.
41
4. Preliminary Literature Review of Social Aspects in the Life Cycle of Electronics
82. A literature review was undertaken in order to obtain a preliminary understanding of the
framework’s social indicators that are likely to be relevant in the life cycle of metals used electronics
(particularly mobile phones). Given the limitations of this study, the review covered only a few dozen
reports and publications that were made available in the English language. The search covered studies
in connection with the various metals used in mobile phones. Studies related to electronics in general
were considered when their respective discussions were applicable to mobile phones as well.
Results were systematically summarized in the Appendix and presented below according to each life
cycle stage. Final considerations are drawn at the end of this section.
Design
83. The literature review revealed issues of concern in connection with the indicator “quality of
product or service” (to users), as well as with the indicator “prevention of unjustifiable risk”
(to society). The academic paper of Han and others (2004) shows how some design features of mobile
phones are critical to user satisfaction. Several publications (Boswell, 1999; Brigden, Santillo, &
Johnston, 2008; Byster & Smith, 2006; Han, et al., 2004; Rifer, Brody-Heine, Peters, & Linnell, 2009)
discuss how the “choices” by electronic companies’ of materials and metals can lead to unjustifiable
risks to society, insofar as these materials can lead to serious health problems to workers in the end-of-
life of electronics. The report of Rifer and Boswell also point out that the lack of life cycle thinking in
the design can hamper the recyclability of electronics.
Raw Material Extraction and Processing
84. Many publications, mostly published by NGO organizations, were found to address social
issues of concern in the extraction and processing of minerals and metals (CorpWatch, 2007;
Cox, 2009; Farrell, Sampat, Sarin, & Slack, 2004; FOE, 2003; Grossman, 2006; GW, 2005, 2006;
Hayes & Burge, 2003; Norbrand & Bolme, 2007; Poyhonen & Simola, 2007; Steinweg & Haan,
2007). Those issues were related to almost every indicator of the framework, with the exception of the
indicators related to consumer stakeholders. The publications have a diversity of purposes and scopes.
Some address the problems of specific minerals, such as the conflicts related to coltan mineral
(tantalum) mining (Hayes & Burge, 2003), or the bad performance of specific metal companies
(Global Witness, 2006). Overall, the publications suggest that the impacts on the workforce and on
local communities hosting mining operations deserve special attention in policy-making.
Trade of Metals
85. Only three publications (SOMO, 2008; Steinweg & Haan, 2007; Young, Dias, Fonseca, &
O'Keefe, 2008) were found to address the social aspects of trade of metals. The publications show the
relevance of the indicators “transparent business information” and “unjustifiable risks to society” in
the trade of metals used in electronics. According to Young and others, the structure of the metal
market and the lack of transparency in trade represent a barrier to the consideration of the social
problems of extraction in the ethical supply management of metals used in electronics.
Manufacturing
86. Numerous publications were found to address social issues in the manufacturing of
electronics. The majority of these discussed labour-related problems/indicators (Astill & Griffith,
2003; CEREAL, 2006; Chan, 2008; Chan, Haan, Nordbrand, & Torstensson, 2008; Chan & HO, 2008;
Ferus-Comelo, 2006; ILO, 2007; Manhart, 2007; SACOM, 2006; Schipper & Haan, 2005, 2007;
42
Seibert, 2007). A few publications addressed indicators in connection with local communities
(Brigden, Labunska, Santillo, & Walters, 2007; Byster & Smith, 2006; Manhart, 2007) or with society
in general (ILO, 2007; Manhart, 2007; Manhart & Grießhammer, 2006; Poyhonen & Simola, 2007).
The review makes clear the existence of significant of labour-related concerns in the manufacturing of
electronics, especially in Asia and developing countries.
Trade of New Electronics
87. No publications addressing social aspects in the trade of new electronics were found.
Use of Electronics
88. Only two of the many reviewed publications gave attention to social aspects in the use of
mobile phones (Drori & Jang, 2004; Ling, 2004; Scott, Batchelor, Ridley, & Jorgensen, 2004).
Particularly relevant is the book of Rich Ling (2004) which presents several aspects (mostly positive)
associated with the use of mobile phones, reflected in the indicators “improvement of social and
economic opportunities”, “quality of product or service”, and “protection of privacy”. The publications
also stress mobile phones as a technology that contributes in several ways to national economies.
Trade of Used Electronics
89. The publications addressing social issues in the trade of used electronics were mostly
discussing the risks to society resulting from the trade of e-wastes (BAN, 2002; Cobbing, 2008;
Gregory, Magalini, Kuehr, & Huisman, 2009; Johnson & Graedel, 2008; Johnston, 1998;
Puckett, 2006; Puckett, et al., 2002; Weston, 2009). These publications discussed issues of
transparency, illegal and “hidden” commerce, responsibilities of producers and consumers of
electronics.
Reuse
90. No publications addressing social aspects in the reuse of mobile phones were found.
It is noteworthy, however, that arguments in two identified publications on the benefits of reusing
computers (James, 2001; Williams, et al., 2008) are applicable to mobile phones as well. That is, that
the reuse of electronics (thus, mobile phones) can contribute to national economies and to lessening
the global digital divide.
Recycling
91. The literature review revealed issues of concern mostly in connection with labour-related
indicators (Allsopp, Santillo, & Johnston, 2006; Brigden, Labunska, Santillo, & Allsopp, 2005;
Jackson, Schuman, & Dayaneni, 2006; Manhart, 2007). The publications show that the lack of
appropriate working conditions in electronics recycling plants impose, for example, risks to the health
and safety of employees. The aforementioned publications of James (2001) and Williams and others
(2008) also show that recycling can contribute to national economies.
Disposal
92. A few publications made references to the impacts of e-wastes disposal to the health and
safety of local communities surrounding landfills that receive e-wastes (Allsopp, et al., 2006; Byster &
Smith, 2006; Cox, 2009). Publications addressing other social indicators are likely to abound in the
literature but were not discovered during the study.
43
Final Considerations
93. The Appendix (based on the framework presented in Figure 1) places a reference for each
publication reviewed in this study as it relates to the social indicators and the life cycle stages of
consumer electronics. It shows that the overall majority of publications are addressing “negative”
social indicators in the extraction of minerals/metals, manufacturing of electronics and trade of
e-wastes. This table in the Appendix, therefore, “suggests” knowledge gaps related to positive social
indicators, as well as to particular life cycle stages, such as trade of new electronics and disposal of e-
waste. Additional research would be necessary to confirm these gaps, and to evaluate whether the lack
of information on those areas was a result of the limitations of this study’s scope and methods.
The authors recognize that the classification of publications according to the social indicators is not
precise: it reflects their particular interpretations. In spite of these limitations, the Appendix provides
an initial and broad-based sense of the diversity of relevant social issues across the life cycle of metals
used in electronics.
5. Identifying Relevant Tools to Address Social Aspects in the Life Cycle of Metals
94. The literature review made evident that the majority of the 26 social indicators categories are
likely to be relevant in policy-making targeting sustainable metals management. Policy-makers are,
however, unlikely to find a single tool that can address this diversity. The challenges imposed by each
indicator vary not only according to the nature of the indicator per se, but also according to
stakeholder groups and life cycle stages.
95. In order to illustrate the usefulness of applying the lenses of the Framework presented in
Figure 1, a set of 11 tools were correlated to the social indicators across the life cycle stages.
In undertaking this correlation, tools were broadly defined to include public, private, voluntary or
regulated instruments that may positively affect the social indicators. The correlation (shown in Figure
2) considered specific tools or categories of tools. For example, the various instruments that can be
applied in initiatives related to “Design for the Environment” and “Extended Producer Responsibility”
were considered broadly, as a whole.
96. As Thomas Birkland (2005) explains, policy tools refer to a variety of instruments
(economic, regulatory, educational, etc.) whose taxonomies have long been debated. There is not a
consensus on how to classify them or on how to rank their relevance in the context of social
responsibility. The 11 tools presented in Figure 2 were selected based on the authors’ own experience
and insights. Many other tools could have been included in the framework. In spite of this limitation,
Figure 2 illustrates the variety of actions that are necessary to address social issues in the life cycle of
metals. From social certification schemes and international agreements to third-party monitoring and
reporting mechanisms, each tool has a particular scope and audience, part of which is illustrated.
97. When correlating the tools, the authors considered their primary scope, highlighting potential
overlaps. The main purpose was to show the diversity of tools available to the management of social
issues. Another approach to using lenses, to refine future analysis, would be to correlate only specific
types of tools, or to correlate tools applicable only to a particular life cycle stage or social indicators.
Narrower approaches might be more helpful in identifying opportunities for partnerships and synergies
among organizations and social initiatives.
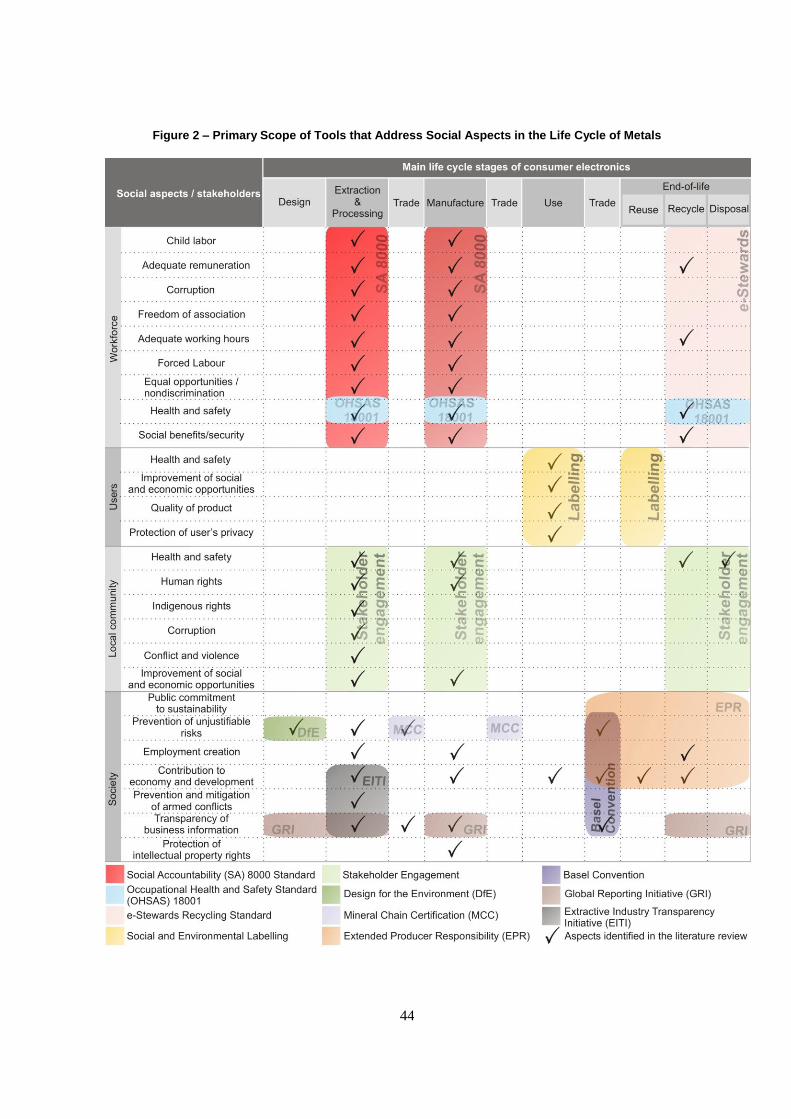
44
Figure 2 – Primary Scope of Tools that Address Social Aspects in the Life Cycle of Metals
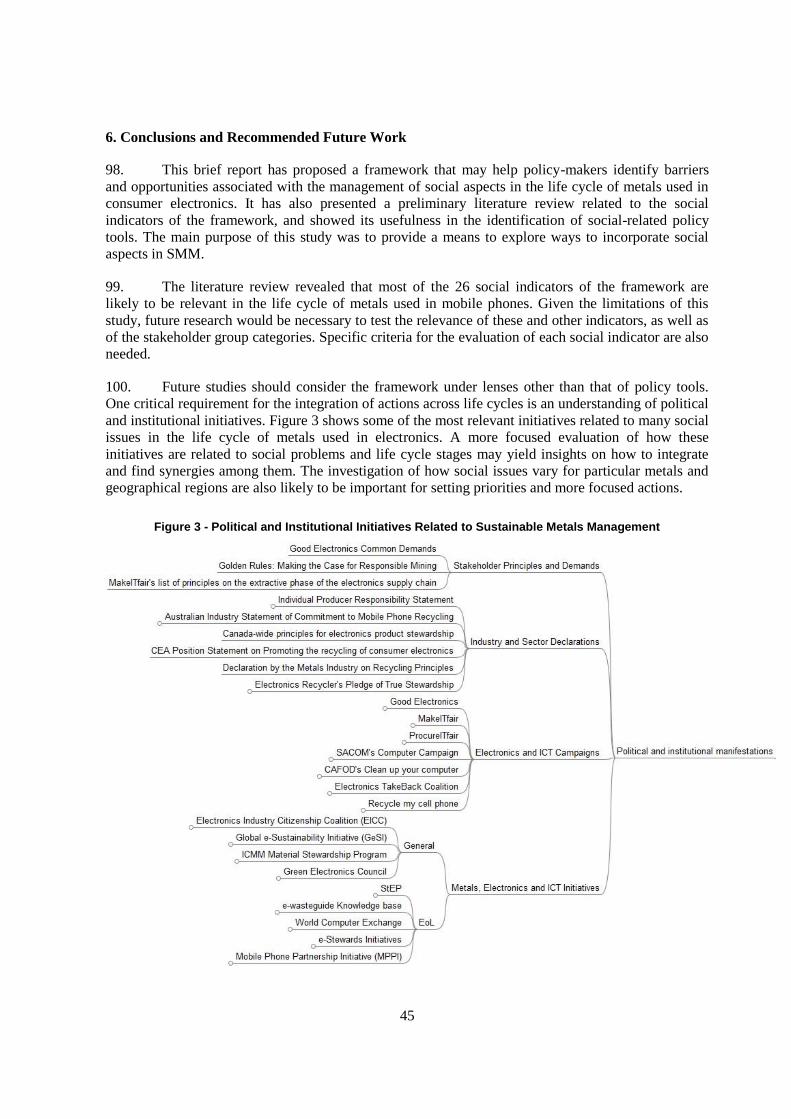
45
6. Conclusions and Recommended Future Work
98. This brief report has proposed a framework that may help policy-makers identify barriers
and opportunities associated with the management of social aspects in the life cycle of metals used in
consumer electronics. It has also presented a preliminary literature review related to the social
indicators of the framework, and showed its usefulness in the identification of social-related policy
tools. The main purpose of this study was to provide a means to explore ways to incorporate social
aspects in SMM.
99. The literature review revealed that most of the 26 social indicators of the framework are
likely to be relevant in the life cycle of metals used in mobile phones. Given the limitations of this
study, future research would be necessary to test the relevance of these and other indicators, as well as
of the stakeholder group categories. Specific criteria for the evaluation of each social indicator are also
needed.
100. Future studies should consider the framework under lenses other than that of policy tools.
One critical requirement for the integration of actions across life cycles is an understanding of political
and institutional initiatives. Figure 3 shows some of the most relevant initiatives related to many social
issues in the life cycle of metals used in electronics. A more focused evaluation of how these
initiatives are related to social problems and life cycle stages may yield insights on how to integrate
and find synergies among them. The investigation of how social issues vary for particular metals and
geographical regions are also likely to be important for setting priorities and more focused actions.
Figure 3 - Political and Institutional Initiatives Related to Sustainable Metals Management
46
101. Finally, future studies should consider the expansion of the framework (Figure 1) to
encompass not only social indicators, but also environmental and economic indicators in the same
structure. Such expansion may facilitate the identification of trade-offs among these three
sustainability dimensions and thus better inform decision-makers on the challenges of managing metal
flows more sustainably.
REFERENCES
Allsopp, M., Santillo, D., & Johnston, P. (2006). Environmental and Human Health Concerns in the
Processing of Electrical and Electronic Waste. Exeter: Greenpeace Research Laboratories.
Astill, K., & Griffith, M. (2003). Clean up your Computer: Working conditions in the electronics
sector. London: Catholic Fund for Overseas Development (CAFOD).
Atkinson, G., Dietz, S., & Neumayer, E. (2007). Handbook of Sustainable Development. Cheltenham:
Edward Elgar.
BAN (2002). Exporting Harm: The High -Tech Trashing of Asia - the Canadian Story. Seattle: Basel
Action Network.
Barthel, L., Pflieger, J., & Held, M. (2007). Social LCA: Analogies and Differences to Environmental
LCA, filling Data Gaps and Selected Study Results. Paper presented at the 3rd International
Conference on Life Cycle Management.
Beloff, B., Tanzil, D., & Lines, M. (2004). Sustainable Development Performance Assessment.
Environmental Progress, 23(4), 271-276.
Birkland, T. A. (2005). An Introduction to the Policy Process: Theories, Concepts and Models of
Public Policy Making. Armonk: M. E. Sharpe.
Boswell, C. (1999). The Impact of Design for Recyclability on the Electronics Recycling Process.
Paper presented at the Portable by Design Conference, Santa Clara.
Brent, A. C., & Labuschagne, C. (2008). An appraisal of social aspects in project and technology life
cycle management in the process industry. Management of Environmental Quality: An
International Journal, 18(4), 413-426.
Brigden, K., Labunska, I., Santillo, D., & Allsopp, M. (2005). Recycling of Electronics Wastes in
China & India: Workplace & Environmental Contamination. Amsterdam: Greenpeace
International.
Brigden, K., Labunska, I., Santillo, D., & Walters, A. (2007). Cutting Edge Contamination: A Study of
Environmental Pollution During the Manufacture of Electronic Products. Amsterdam:
Greenpeace International.
Brigden, K., Santillo, D., & Johnston, P. (2008). Playing Dirty: Analysis of hazardous chemicals and
materials in games console components. Amsterdam: Greenpeace International.
47
Byster, L. A., & Smith, T. (2006). The Electronics Production Life Cycle. From Toxics to
Sustainability: Getting Off the Toxic Treadmill. In T. Smith, D. A. Sonnenfeld & D. N. Pello
(Eds.), Challenging the Chip: Labor Rights and Environmental Justice in the Global
Electronics Industry. Philadelphi: Temple University Press.
CEREAL (2006). New Technology Workers: Report on Working Conditions in the Mexican
Electronics Industry: Centro de Reflexión y Acción Laboral (CEREAL).
Chan, J. (2008). High-Tech - No Rights? A One Year Follow Up Report on Working Conditions in
China's Electronic Hardware Sector. Mongkok and Lusanne: Pain Pour Le Prochain Action de
Caréme and SACOM.
Chan, J., Haan, E. d., Nordbrand, S., & Torstensson, A. (2008). Silenced to deliver: mobile phone
manufacturing in China and the Philippines: SOMO and SwedWatch.
Chan, J., & HO, C. (2008). The Dark Side of Cyberspace: Inside the Sweatshops of China's Computer
Hardware Production: WEED, SACOM, ProcureITfair.
Cobbing, M. (2008). Toxic Tech: Not in Our Backyard - Uncovering the Hidden Flows of e-Waste.
Amsterdam: Greenpeace.
CorpWatch (2007). Barrick's dirty secrets: communities worldwide respond to gold mining's impacts.
Oakland: CorpWatch.
Cox, S. (2009). Cell Phones Generate Particularly Dangerous E-Waste. In C. A. Bily (Ed.), What’s the
impact of e-waste. Farmington Hill: Greenhaven Press.
Dalal-Clayton, B., & Bass, S. (2002). Sustainable Development Strategies: A Resource Book. London:
Earthscan Publications Ltd.
Dreyer, L. C., Hauschild, M. Z., & Schierbeck, J. (2006). A Framework for Social Life Cycle Impact
Assessment. The International Journal of Life Cycle Assessment, 11(2), 8-97.
Drori, G. S., & Jang, Y. S. (2004). The Global Digital Divide: A Sociological Assessment of Trends
and Causes. Social Science Computer Review, 21(2), 144-161.
Farrell, L., Sampat, P., Sarin, R., & Slack, K. (2004). Dirty Metals: Mining, Communities and the
Environment, . Washington and Boston: Earthworks and Oxfam America.
Ferus-Comelo, A. (2006). Double Jeopardy: Gender and Migration in Electronics Manufacturing. In
T. Smith, D. A. Sonnenfeld & D. N. Pellow (Eds.), Challenging the Chip: Labor Rights and
Environmental Justice in the Global Electronics Industry. Philadelphia: Temple University
Pres.
Fiksel, J. (2006). A Framework for Susainable Materials Management. Journal of the Minerals,
Metals and Materials Society (August), 15-22.
FOE (2003). Mining, hands off! Why international financial institutions must stop drilling, piping and
mining. Amsterdan: Friends of Earth.
48
Gleich, A. v., Ayres, R. U., & Göbling-Reisemann, S. (2006). Sustainable Metals Management:
Securing our Future - Steps Towards a Closed Loop Economy. Dordrecht: Springer.
Gregory, J., Magalini, F., Kuehr, R., & Huisman, j. (2009). E-waste Take-Back System Design and
Policy Approaches. Bonn, Germany: StEP Initiative, United Nations University.
GRI (2006). Sustainability Reporting Guidelines. Amsterdam: Global Reporting Initiative.
Grießhammer, R., Benoît, C., Dreyer, L. C., Flysjö, A., Manhart, A., Mazijn, B., et al. (2006).
Feasibility Study: Integration of social aspects into LCA. Freiburg: UNEP/SETAC.
Grossman, E. (2006). High tech trash: digital devices, hidden toxics, and human health. Washington:
Island Press.
GSMA (2006). Mobile Phone Lifecycles: Use, Take-back, Reuse and Recycle. London: GSM
Association.
Global Witness (2005). Paying for protection: the Freeport mine and the Indonesian security forces.
Washington: Global Witness.
Global Witness (2006). Heavy Mittal? A State within a State: The inequitable Mineral Development
Agreement between the Government of Liberia and Mittal Steel Holdings NV. Washington, DC:
Global Witness Publishing Inc.
Han, S. H., Kim, K. J., Yu, M. H., Hong, S. W., & Kim, J. (2004). Identifying Mobile Phone Design
Features Critical to User Satisfaction. Human Factors and Ergonomics in Manufacturing, 14(1),
15-29.
Hauschild, M. Z., Dreyer, L. C., & Jorgensen, A. (2008). Assessing social impacts in a life cycle
perspective - Lessons learned. CIRP Annals - Manufacturing Technology, 57, 21-24.
Hayes, K., & Burge, R. (2003). Coltan Mining in the Democratic Republic of Congo: How tantalum-
using industries can commit to the reconstruction of the DRC. Fauna & Flora International.
Hunkeler, D. (2006). Societal Life Cycle Assessment. International Journal of Life Cycle Assessment,
11(6), 371-382.
ILO (2007). The production of electronic components for the IT industries: Changing labour force
requirements in a global economy (Report for discussion at the Tripartite Meeting on the
Production of Electronic Components for the IT Industries: Changing Labour Force
Requirements in a Global Economy). Geneva: International Labour Association (ILO).
Jackson, A. S., Schuman, A., & Dayaneni, G. (2006). Toxic Sweatshops: How UNICOR Prison
Recycling Harms Workers, Communities, the Environment, and the Recycling Industry: Center
for Environmental Health, Prison Activist Resource Center, Silicon Valley Toxics Coalition,
Computer TakeBack Campaign.
James, J. (2001). Low-cost computing and related ways of overcoming the global digital divide.
Journal of Information Science, 27(6), 385-392.
49
Johnson, J., & Graedel, T. E. (2008). The "Hidden" Trade of Metals in the United States. Journal of
Industrial Ecology, 12(5-6), 739-753.
Johnston, N. (1998). The implications of the Basel Convention for developing countries: the case of
trade in non-ferrous metal-bearing waste. Resources, Conservation and Recycling, 23, 1-28.
Jorgensen, A., Bocq, A. L., Nazarkina, L., & Hauschild, M. (2008). Methodologies for Social Life
Cycle Assessment. The International Journal of Life Cycle Assessment, 13(2), 96-103.
Kruse, S. A., Flysjö, A., Kasperczyk, N., & Scholz, A. J. (2009). Socioeconomic indicators as a
complement to life cycle assessment: an application to salmon production systems.
International Journal of Life Cycle Assessment, 14(1), 8-18.
Labuschagne, C., & Brent, A. C. (2006). Social Indicators for Sustainable Project and Technology
Life Cycle Management. The International Journal of Life Cycle Assessment, 11(1), 3-15.
Ling, R. (2004). The Mobile Connection: The Cell Phone's Impact on Society. San Francisco, CA:
Morgan Kaufmann.
Manhart, A. (2007). Key Social Impacts of Electronics Production and WEEE-Recycling in China.
Freiburg: Öko-Institut e.V.
Manhart, A., & Grießhammer, R. (2006). Social impacts of the production of notebook PCs:
Contribution of a Product Sustainability Assessment (PROSA). Freiburg: Öko-Institut e.V.
Manhart, A., & Grießhammer, R. (2007). Social Impacts of the Production of Notebooks PCs. Paper
presented at the 3rd International Conference on Life Cycle Management. from
http://www.lcm2007.org/presentation/Mo_3.09-Manhart.pdf
McLaren, J., Wright, L., & Parkinson, S. (1999). A Dynamic Life-Cycle Energy Model of Mobile
Phone Take-back and Recycling. Journal of Industrial Ecology, 3(1), 77-91.
Norbrand, S., & Bolme, P. (2007). Powering the Mobile World: Cobalt production for batteries in the
DR Congo and Zambia: SwedWatch (Research partner of makeITfair).
Norris, G. A. (2006). Social Impacts in Product Life Cycles: Towards Life Cycle Attribute
Assessment. The International Journal of Life Cycle Assessment, 11(1), 97-104.
OECD (2007). Outcome of the First OECD Workshop on Sustainable Materials Management. Paris:
Organisation for Economic Co-operation and Development (OECD), Working Group on Waste
Prevention and Recycling (WGWPR).
OECD (2008a). Inventory of International Initiatives Related to Sustainable Materials Management.
Paris: Organisation for Economic Co-operation and Development (OECD), Working Group on
Waste Prevention and Recycling (WGWPR).
OECD (2008b). A Study on Methodologies Relevant to the OECD Approach on Sustainable Materials
Management. Paris: Organisation for Economic Co-operation and Development (OECD),
Working Group on Waste Prevention and Recycling (WGWPR).
50
Pedersen, C. S. (2003). Environmental, health, safety and social life cycle management of moulded-
fibre packaging for consumer electronics. Paper presented at the EcoDesign 2003, Third
International Symposium on Environmentally Conscious Design and Inverse Manufacturing,
Tokyo, Japan.
Poyhonen, P., & Simola, E. (2007). Connecting components, dividing communities: Tin production for
consumer electronics in the DR Congo and Indonesia: FinnWatch (Research partner of
makeITfair).
Puckett, J. (2006). High-Tech's Dirty Little Secret: The Economics and Ethics of the Electronic Waste
Trade. In T. Smith, D. A. Sonnenfeld & D. N. Pellow (Eds.), Challenging the Chip: Labor
Rights and Environmental Justice in the Global Electronics Industry. Philadelphia: Temple
University Press.
Puckett, J., Byster, L., Westervelt, S., Gutierrez, R., Davis, S., Hussain, A., et al. (2002). Exporting
Harm: The High-Tech Trashing of Asia. Seattle: Basel Action Network, Silicon Valley Toxics
Coalition.
Rifer, W., Brody-Heine, P., Peters, A., & Linnell, J. (2009). Closing the Loop: Electronics Design to
Enhance, Reuse/Recycling Value - Final Report: Green Electronics Council, National Center for
Electronics Recycling, e-Strap News.
SACOM (2006). An Investigative Report on Labor Conditions of the ICT Industry: Making Computers
in South China: Students and Scholars against Corporate Misbehaviour (SACOM).
Scharnhorst, W., Hilty, L. M., & Jolliet, O. (2006). Life cycle assessment of second generation (2G)
and third generation (3G) mobile phone networks. Environment International, 32.
Schipper, I., & Haan, E. d. (2005). CSR Issues in the ICT Hardware Manufacturing Sector.
Amsterdam: Stichting Onderzoek Multinationale Ondernemingen (Centre for Research on
Multinational Corporations) - SOMO.
Schipper, I., & Haan, E. d. (2007). Hard (Disk) Labour: Research Report on Labour Conditions in the
Thai Electronics Sector. Amsterdam: Centre for Research on Multinational Corporations -
SOMO.
Scott, N., Batchelor, S., Ridley, J., & Jorgensen, B. (2004). The Impact of Mobile Phones in Africa.
Glasgow: Commission for Africa.
Seibert, A. (2007). Gender Aspects: Production of Next-generation Electronics in Poland: Karat
Coalition.
SOMO (2008). Mobile Connections: Supply Chain Responsibility of Five Mobile Phone Companies.
Amsterdam: SOMO - Centre for Research on Multinational Corporations.
Steinweg, T., & Haan, E. d. (2007). Capacitating electronics: the corrosive effects of platinum and
palladium mining on labour rights and comunities. Amsterdam: SOMO - Centre for Research
on Multinational Corporations.
UNEP/SETAC (2008-2009). Draft methodology sheet for category indicators: UNEP/SETAC.
51
WCED (1987). Our Common Future. New York and Oxford: Oxford University Press.
Weidema, B. P. (2006). The Integration of Economic and Social Aspects in Life Cycle Impact
Assessment. The International Journal of Life Cycle Assessment, 11(1), 89-96.
Weston, L. P. (2009). Consumers Should Take Responsibility for Disposing of Cell Phones. In C. A.
Bily (Ed.), What’s the impact of e-waste? Farmington Hills: Greenhaven Press.
Williams, E., Kahhat, R., Allenby, B., Kavazanjian, E., Kim, J., & Xu, M. (2008). Environmental,
Social, and Economic Implications of Global Reuse and Recycling of Personal Computers.
Environmental Science and Technology, 42, 6446-6454.
Young, S. B., Dias, G., Fonseca, A., & O'Keefe, M. S. (2008). Social and Environmental
Responsibility in Metals Supply to the Electronic Industry Retrieved September 22, 2008, from
http://www.gesi.org/files/20080620_ghgm_ser_metalstoelectronics.pdf
Zeltner, C., Bader, H. P., Scheidegger, R., & Baccini, P. (1999). Sustainable metal management
exemplified by copper in the USA. Regional Environmental Change, 1(1), 31-46.
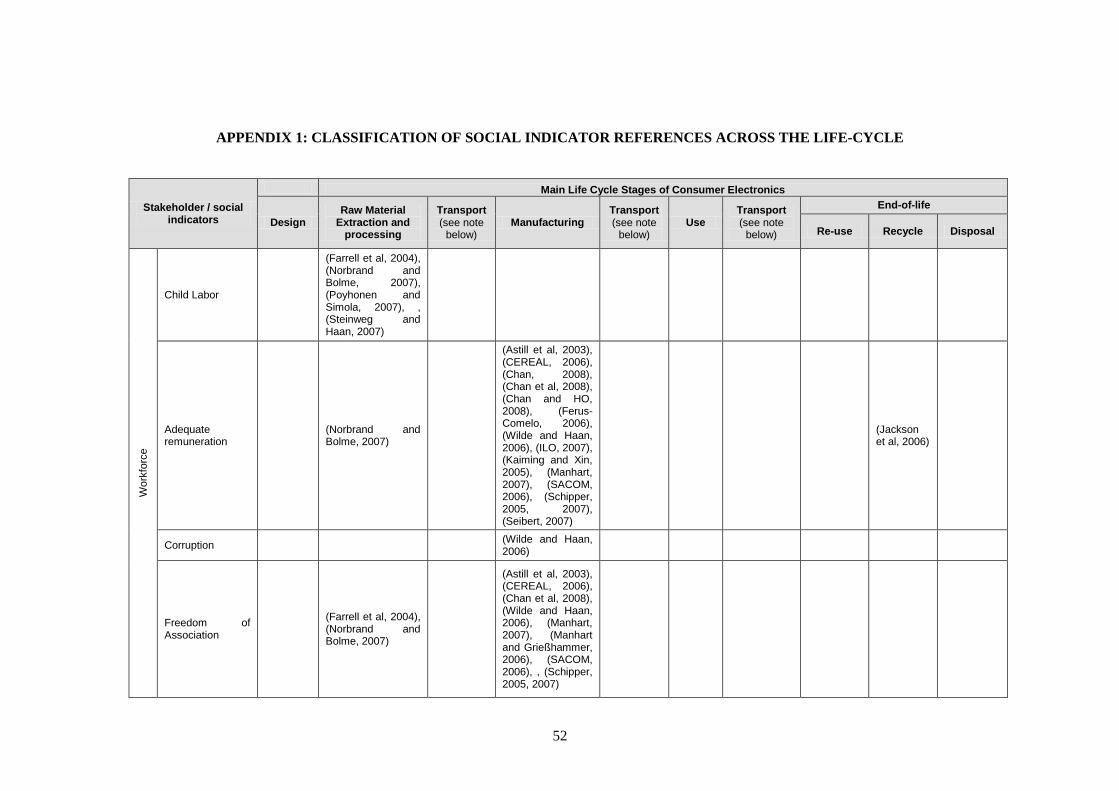
52
APPENDIX 1: CLASSIFICATION OF SOCIAL INDICATOR REFERENCES ACROSS THE LIFE-CYCLE
Stakeholder / social indicators
Main Life Cycle Stages of Consumer Electronics
Design Raw Material
Extraction and processing
Transport (see note
below) Manufacturing
Transport (see note
below) Use
Transport (see note
below)
End-of-life
Re-use Recycle Disposal
Work
forc
e
Child Labor
(Farrell et al, 2004), (Norbrand and Bolme, 2007), (Poyhonen and Simola, 2007), , (Steinweg and Haan, 2007)
Adequate remuneration
(Norbrand and Bolme, 2007)
(Astill et al, 2003), (CEREAL, 2006), (Chan, 2008), (Chan et al, 2008), (Chan and HO, 2008), (Ferus-Comelo, 2006), (Wilde and Haan, 2006), (ILO, 2007), (Kaiming and Xin, 2005), (Manhart, 2007), (SACOM, 2006), (Schipper, 2005, 2007), (Seibert, 2007)
(Jackson et al, 2006)
Corruption (Wilde and Haan, 2006)
Freedom of Association
(Farrell et al, 2004), (Norbrand and Bolme, 2007)
(Astill et al, 2003), (CEREAL, 2006), (Chan et al, 2008), (Wilde and Haan, 2006), (Manhart, 2007), (Manhart and Grießhammer, 2006), (SACOM, 2006), , (Schipper, 2005, 2007)
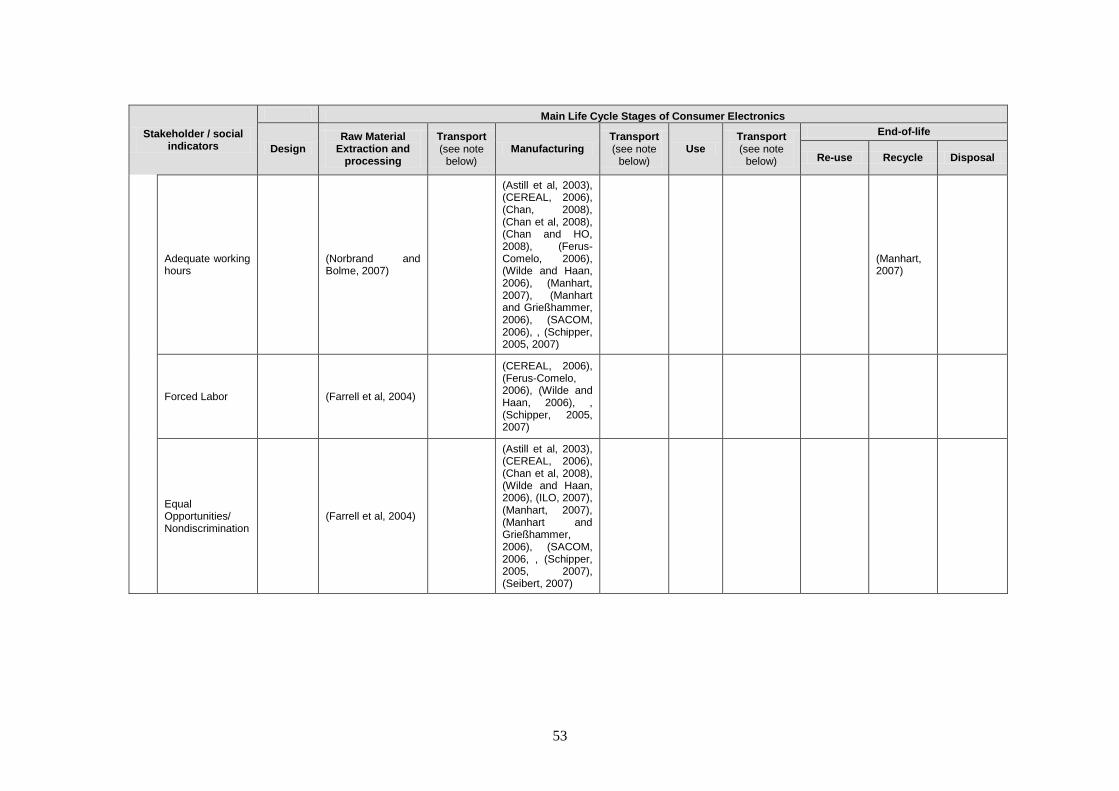
53
Stakeholder / social indicators
Main Life Cycle Stages of Consumer Electronics
Design Raw Material
Extraction and processing
Transport (see note
below) Manufacturing
Transport (see note
below) Use
Transport (see note
below)
End-of-life
Re-use Recycle Disposal
Adequate working hours
(Norbrand and Bolme, 2007)
(Astill et al, 2003), (CEREAL, 2006), (Chan, 2008), (Chan et al, 2008), (Chan and HO, 2008), (Ferus-Comelo, 2006), (Wilde and Haan, 2006), (Manhart, 2007), (Manhart and Grießhammer, 2006), (SACOM, 2006), , (Schipper, 2005, 2007)
(Manhart, 2007)
Forced Labor (Farrell et al, 2004)
(CEREAL, 2006), (Ferus-Comelo, 2006), (Wilde and Haan, 2006), , (Schipper, 2005, 2007)
Equal Opportunities/ Nondiscrimination
(Farrell et al, 2004)
(Astill et al, 2003), (CEREAL, 2006), (Chan et al, 2008), (Wilde and Haan, 2006), (ILO, 2007), (Manhart, 2007), (Manhart and Grießhammer, 2006), (SACOM, 2006, , (Schipper, 2005, 2007), (Seibert, 2007)
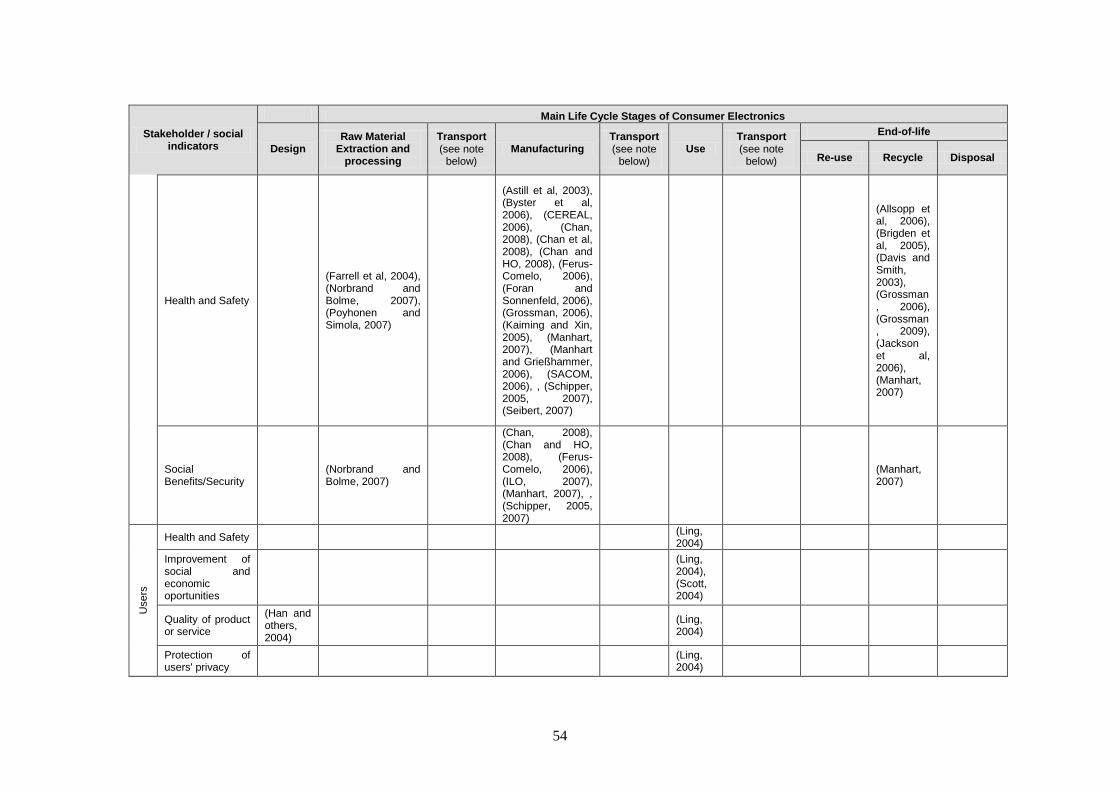
54
Stakeholder / social indicators
Main Life Cycle Stages of Consumer Electronics
Design Raw Material
Extraction and processing
Transport (see note
below) Manufacturing
Transport (see note
below) Use
Transport (see note
below)
End-of-life
Re-use Recycle Disposal
Health and Safety
(Farrell et al, 2004), (Norbrand and Bolme, 2007), (Poyhonen and Simola, 2007)
(Astill et al, 2003), (Byster et al, 2006), (CEREAL, 2006), (Chan, 2008), (Chan et al, 2008), (Chan and HO, 2008), (Ferus-Comelo, 2006), (Foran and Sonnenfeld, 2006), (Grossman, 2006), (Kaiming and Xin, 2005), (Manhart, 2007), (Manhart and Grießhammer, 2006), (SACOM, 2006), , (Schipper, 2005, 2007), (Seibert, 2007)
(Allsopp et al, 2006), (Brigden et al, 2005), (Davis and Smith, 2003), (Grossman, 2006), (Grossman, 2009), (Jackson et al, 2006), (Manhart, 2007)
Social Benefits/Security
(Norbrand and Bolme, 2007)
(Chan, 2008), (Chan and HO, 2008), (Ferus-Comelo, 2006), (ILO, 2007), (Manhart, 2007), , (Schipper, 2005, 2007)
(Manhart, 2007)
Users
Health and Safety (Ling, 2004)
Improvement of social and economic oportunities
(Ling, 2004), (Scott, 2004)
Quality of product or service
(Han and others, 2004)
(Ling, 2004)
Protection of users' privacy
(Ling, 2004)
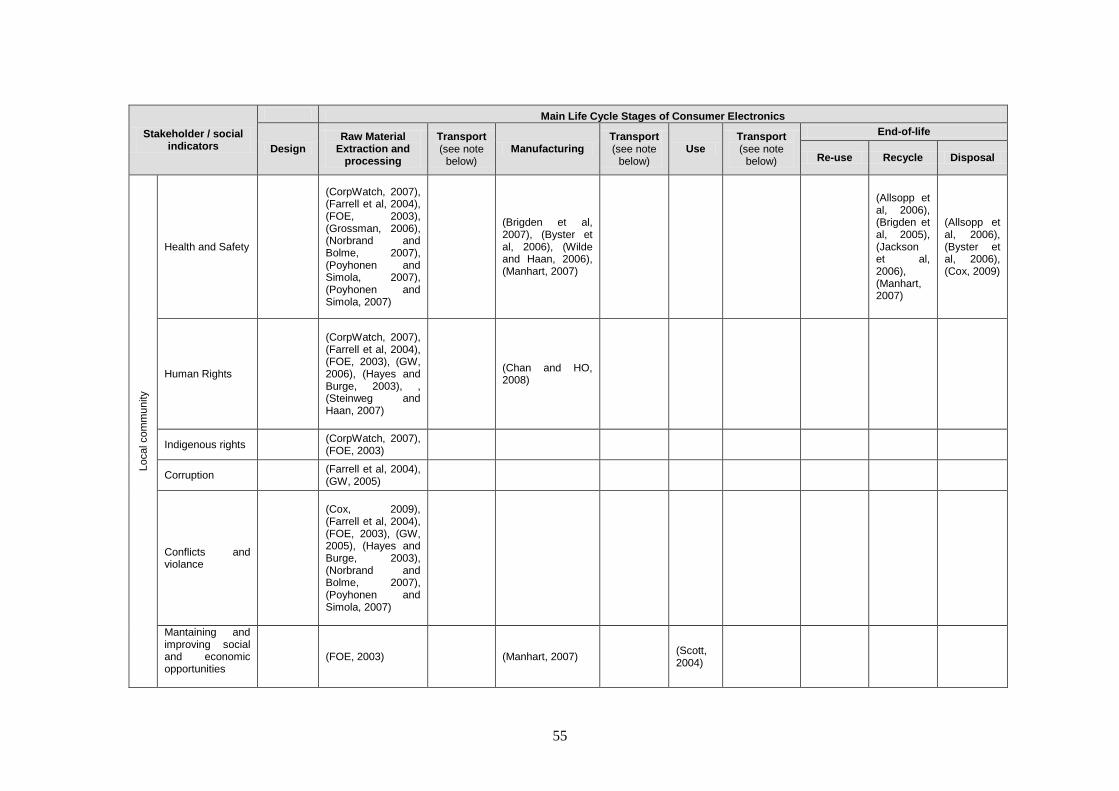
55
Stakeholder / social indicators
Main Life Cycle Stages of Consumer Electronics
Design Raw Material
Extraction and processing
Transport (see note
below) Manufacturing
Transport (see note
below) Use
Transport (see note
below)
End-of-life
Re-use Recycle Disposal
Local com
mu
nity
Health and Safety
(CorpWatch, 2007), (Farrell et al, 2004), (FOE, 2003), (Grossman, 2006), (Norbrand and Bolme, 2007), (Poyhonen and Simola, 2007), (Poyhonen and Simola, 2007)
(Brigden et al, 2007), (Byster et al, 2006), (Wilde and Haan, 2006), (Manhart, 2007)
(Allsopp et al, 2006), (Brigden et al, 2005), (Jackson et al, 2006), (Manhart, 2007)
(Allsopp et al, 2006), (Byster et al, 2006), (Cox, 2009)
Human Rights
(CorpWatch, 2007), (Farrell et al, 2004), (FOE, 2003), (GW, 2006), (Hayes and Burge, 2003), , (Steinweg and Haan, 2007)
(Chan and HO, 2008)
Indigenous rights (CorpWatch, 2007), (FOE, 2003)
Corruption (Farrell et al, 2004), (GW, 2005)
Conflicts and violance
(Cox, 2009), (Farrell et al, 2004), (FOE, 2003), (GW, 2005), (Hayes and Burge, 2003), (Norbrand and Bolme, 2007), (Poyhonen and Simola, 2007)
Mantaining and improving social and economic opportunities
(FOE, 2003) (Manhart, 2007) (Scott, 2004)
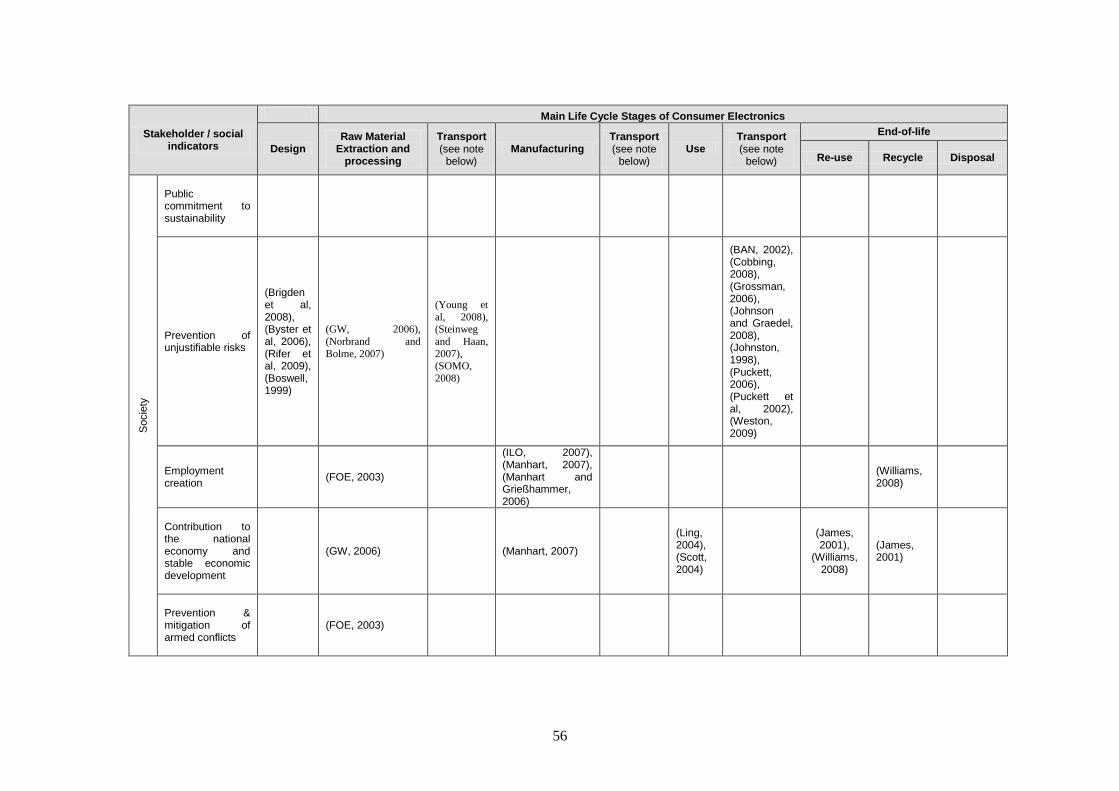
56
Stakeholder / social indicators
Main Life Cycle Stages of Consumer Electronics
Design Raw Material
Extraction and processing
Transport (see note
below) Manufacturing
Transport (see note
below) Use
Transport (see note
below)
End-of-life
Re-use Recycle Disposal
Socie
ty
Public commitment to sustainability
Prevention of unjustifiable risks
(Brigden et al, 2008), (Byster et al, 2006), (Rifer et al, 2009), (Boswell, 1999)
(GW, 2006),
(Norbrand and
Bolme, 2007)
(Young et
al, 2008), (Steinweg
and Haan,
2007),
(SOMO,
2008)
(BAN, 2002), (Cobbing, 2008), (Grossman, 2006), (Johnson and Graedel, 2008), (Johnston, 1998), (Puckett, 2006), (Puckett et al, 2002), (Weston, 2009)
Employment creation
(FOE, 2003)
(ILO, 2007), (Manhart, 2007), (Manhart and Grießhammer, 2006)
(Williams, 2008)
Contribution to the national economy and stable economic development
(GW, 2006) (Manhart, 2007)
(Ling, 2004), (Scott, 2004)
(James, 2001),
(Williams, 2008)
(James, 2001)
Prevention & mitigation of armed conflicts
(FOE, 2003)
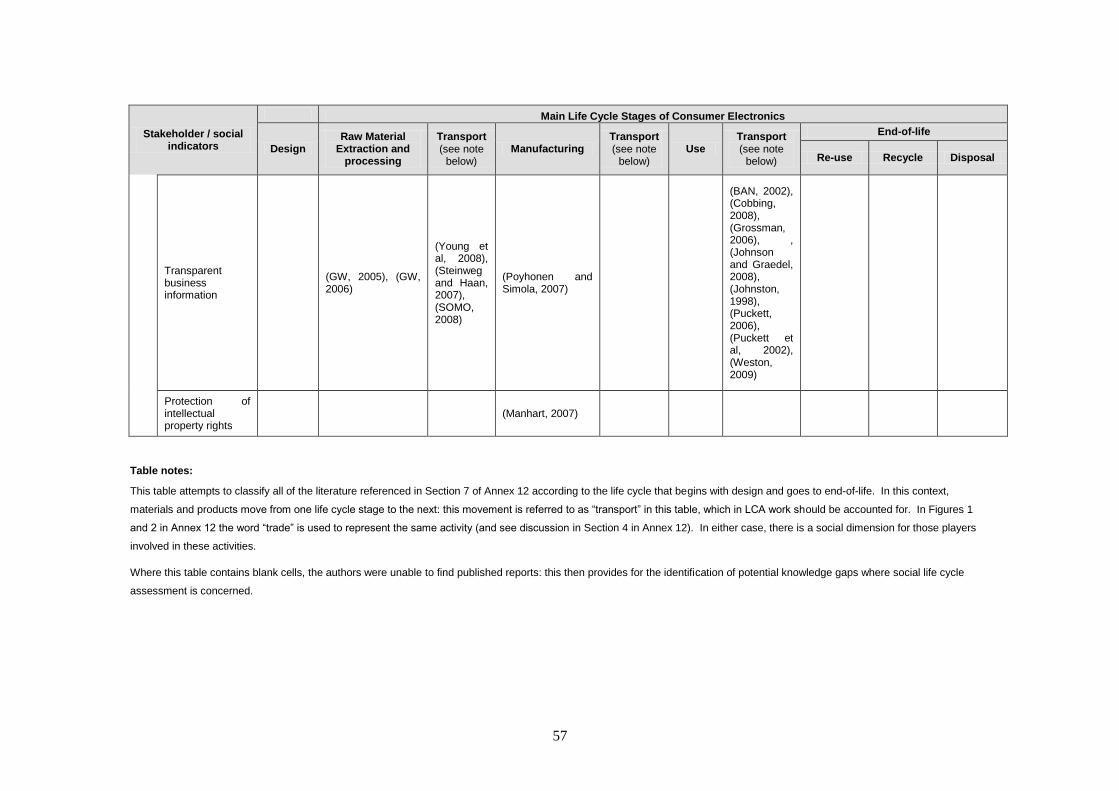
57
Stakeholder / social indicators
Main Life Cycle Stages of Consumer Electronics
Design Raw Material
Extraction and processing
Transport (see note
below) Manufacturing
Transport (see note
below) Use
Transport (see note
below)
End-of-life
Re-use Recycle Disposal
Transparent business information
(GW, 2005), (GW, 2006)
(Young et al, 2008), (Steinweg and Haan, 2007), (SOMO, 2008)
(Poyhonen and Simola, 2007)
(BAN, 2002), (Cobbing, 2008), (Grossman, 2006), , (Johnson and Graedel, 2008), (Johnston, 1998), (Puckett, 2006), (Puckett et al, 2002), (Weston, 2009)
Protection of intellectual property rights
(Manhart, 2007)
Table notes:
This table attempts to classify all of the literature referenced in Section 7 of Annex 12 according to the life cycle that begins with design and goes to end-of-life. In this context,
materials and products move from one life cycle stage to the next: this movement is referred to as ―transport‖ in this table, which in LCA work should be accounted for. In Figures 1
and 2 in Annex 12 the word ―trade‖ is used to represent the same activity (and see discussion in Section 4 in Annex 12). In either case, there is a social dimension for those players
involved in these activities.
Where this table contains blank cells, the authors were unable to find published reports: this then provides for the identification of potential knowledge gaps where social life cycle
assessment is concerned.
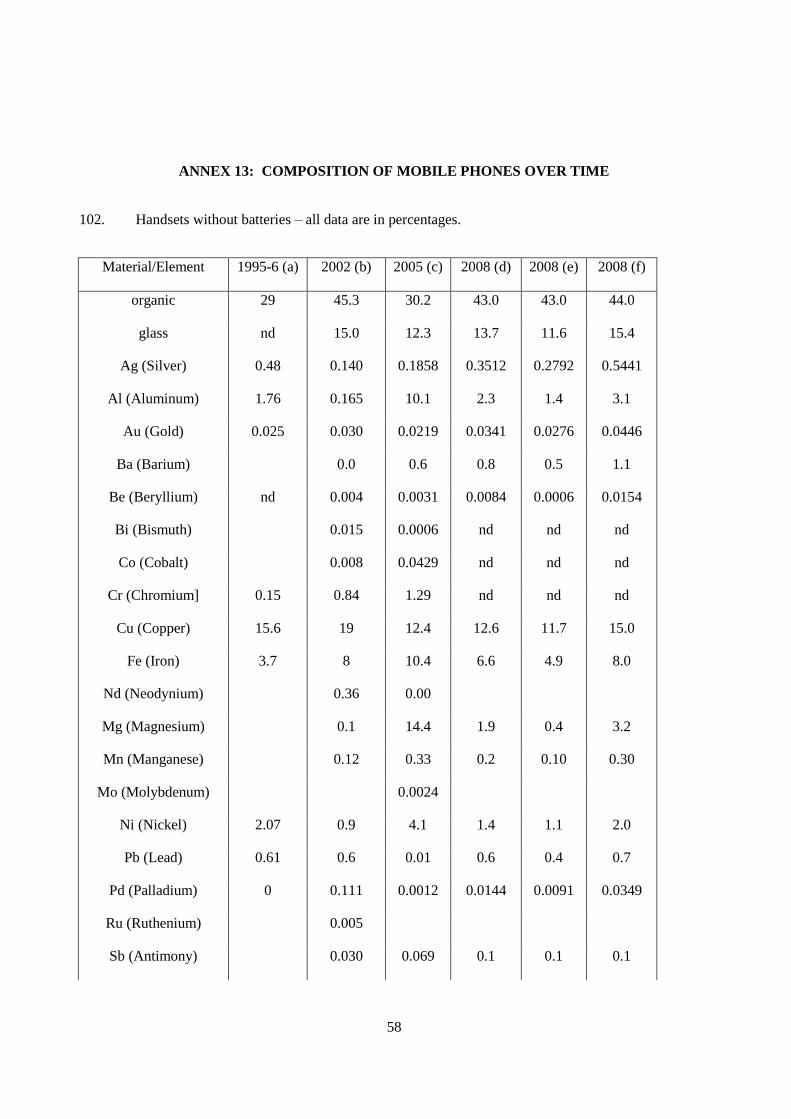
58
ANNEX 13: COMPOSITION OF MOBILE PHONES OVER TIME
102. Handsets without batteries – all data are in percentages.
Material/Element 1995-6 (a) 2002 (b) 2005 (c) 2008 (d) 2008 (e) 2008 (f)
organic 29 45.3 30.2 43.0 43.0 44.0
glass nd 15.0 12.3 13.7 11.6 15.4
Ag (Silver) 0.48 0.140 0.1858 0.3512 0.2792 0.5441
Al (Aluminum) 1.76 0.165 10.1 2.3 1.4 3.1
Au (Gold) 0.025 0.030 0.0219 0.0341 0.0276 0.0446
Ba (Barium) 0.0 0.6 0.8 0.5 1.1
Be (Beryllium) nd 0.004 0.0031 0.0084 0.0006 0.0154
Bi (Bismuth) 0.015 0.0006 nd nd nd
Co (Cobalt) 0.008 0.0429 nd nd nd
Cr (Chromium] 0.15 0.84 1.29 nd nd nd
Cu (Copper) 15.6 19 12.4 12.6 11.7 15.0
Fe (Iron) 3.7 8 10.4 6.6 4.9 8.0
Nd (Neodynium) 0.36 0.00
Mg (Magnesium) 0.1 14.4 1.9 0.4 3.2
Mn (Manganese) 0.12 0.33 0.2 0.10 0.30
Mo (Molybdenum) 0.0024
Ni (Nickel) 2.07 0.9 4.1 1.4 1.1 2.0
Pb (Lead) 0.61 0.6 0.01 0.6 0.4 0.7
Pd (Palladium) 0 0.111 0.0012 0.0144 0.0091 0.0349
Ru (Ruthenium) 0.005
Sb (Antimony) 0.030 0.069 0.1 0.1 0.1
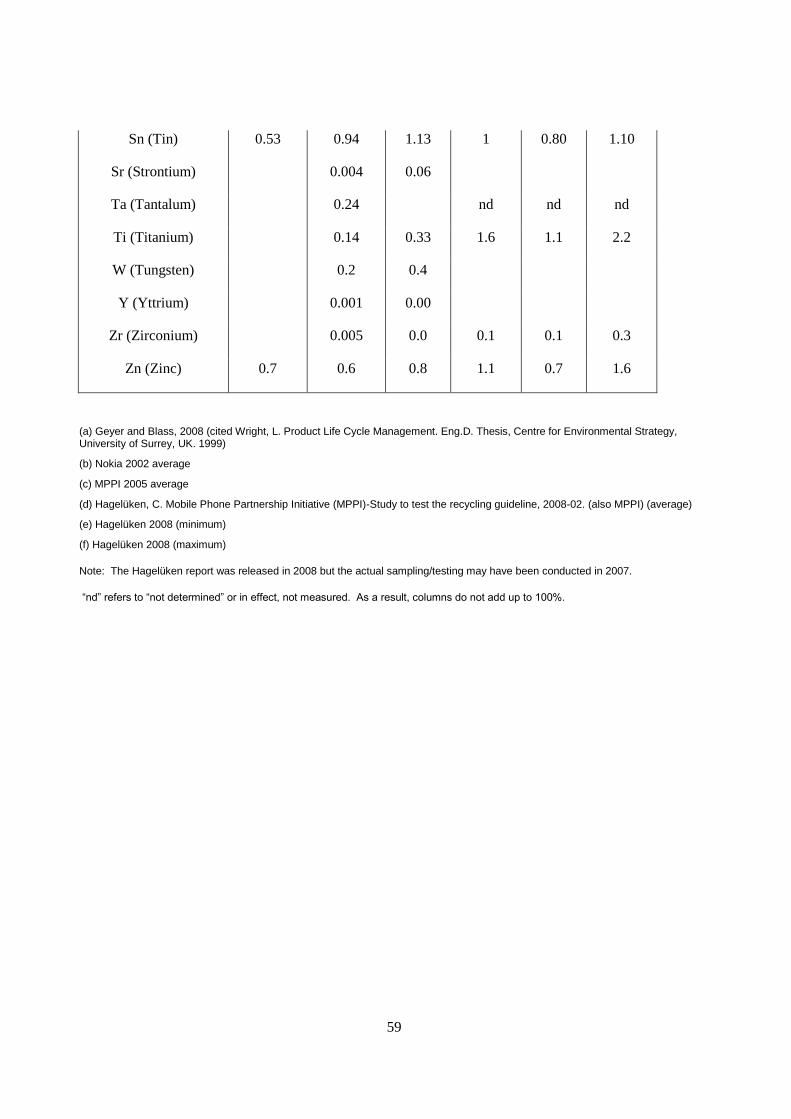
59
Sn (Tin) 0.53 0.94 1.13 1 0.80 1.10
Sr (Strontium) 0.004 0.06
Ta (Tantalum) 0.24 nd nd nd
Ti (Titanium) 0.14 0.33 1.6 1.1 2.2
W (Tungsten) 0.2 0.4
Y (Yttrium) 0.001 0.00
Zr (Zirconium) 0.005 0.0 0.1 0.1 0.3
Zn (Zinc) 0.7 0.6 0.8 1.1 0.7 1.6
(a) Geyer and Blass, 2008 (cited Wright, L. Product Life Cycle Management. Eng.D. Thesis, Centre for Environmental Strategy, University of Surrey, UK. 1999)
(b) Nokia 2002 average
(c) MPPI 2005 average
(d) Hagelüken, C. Mobile Phone Partnership Initiative (MPPI)-Study to test the recycling guideline, 2008-02. (also MPPI) (average)
(e) Hagelüken 2008 (minimum)
(f) Hagelüken 2008 (maximum)
Note: The Hagelüken report was released in 2008 but the actual sampling/testing may have been conducted in 2007.
―nd‖ refers to ―not determined‖ or in effect, not measured. As a result, columns do not add up to 100%.
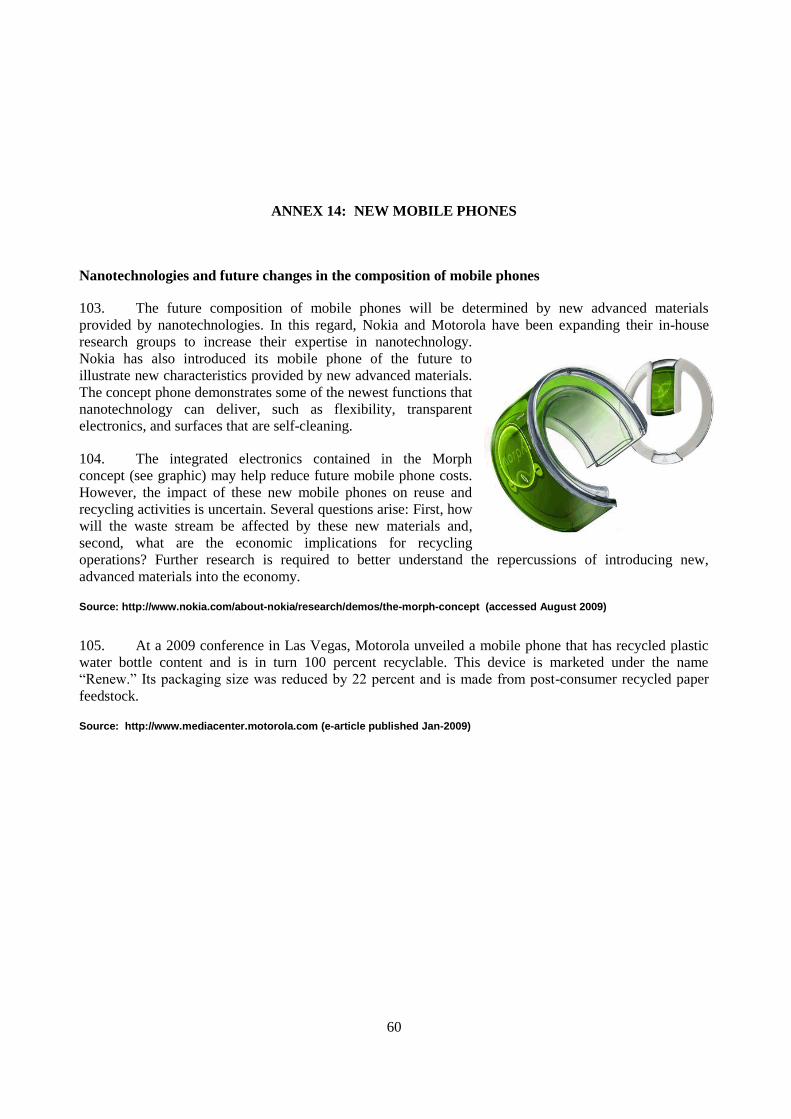
60
ANNEX 14: NEW MOBILE PHONES
Nanotechnologies and future changes in the composition of mobile phones
103. The future composition of mobile phones will be determined by new advanced materials
provided by nanotechnologies. In this regard, Nokia and Motorola have been expanding their in-house
research groups to increase their expertise in nanotechnology.
Nokia has also introduced its mobile phone of the future to
illustrate new characteristics provided by new advanced materials.
The concept phone demonstrates some of the newest functions that
nanotechnology can deliver, such as flexibility, transparent
electronics, and surfaces that are self-cleaning.
104. The integrated electronics contained in the Morph
concept (see graphic) may help reduce future mobile phone costs.
However, the impact of these new mobile phones on reuse and
recycling activities is uncertain. Several questions arise: First, how
will the waste stream be affected by these new materials and,
second, what are the economic implications for recycling
operations? Further research is required to better understand the repercussions of introducing new,
advanced materials into the economy.
Source: http://www.nokia.com/about-nokia/research/demos/the-morph-concept (accessed August 2009)
105. At a 2009 conference in Las Vegas, Motorola unveiled a mobile phone that has recycled plastic
water bottle content and is in turn 100 percent recyclable. This device is marketed under the name
“Renew.” Its packaging size was reduced by 22 percent and is made from post-consumer recycled paper
feedstock.
Source: http://www.mediacenter.motorola.com (e-article published Jan-2009)