oecd-fao agricultural outlook 2013 - food and … oil production.the present tightness in the market...
TRANSCRIPT

OECD-FAO Agricultural Outlook 2013
© OECD/FAO 2013
Chapter 5
Oilseeds1 and oilseed products
139

5. OILSEEDS AND OILSEED PRODUCTS
Oilseeds and oilseed products
Market situationStarting with very high vegetable oil and oilseed prices since 2010, the 2012 drought in
the United States led to even higher prices. Since soybeans contain about 80% meal and
only 20% oil, the impact of the drought was much stronger on the world price of protein
meal than on the price of vegetable oil. Because of this shortage of oilseeds, crushing
margins were comparably low during the 2012 crop marketing year.2
At 14%, the stock to use ratio3 in 2012 is low by historic comparison as well as
compared to coarse grains and wheat. Even under the normal weather conditions assumed
in the Outlook it is expected to remain at this level making it difficult to buffer the market
efficiently in case of production shortfalls.
Global supply of vegetable oil remained relatively stable in the 2012 crop year based on
growing palm oil production and a more limited impact of the US drought on the global
oilseed oil production. The present tightness in the market is mostly due to strong demand
for food and biodiesel uses.
Projection highlights● Assuming normal yields in all producing regions, world production of oilseeds should
rebound in marketing years 2013 and 2014 resulting in a sharp reduction of international
oilseeds and products prices. After this correction, prices are expected to increase slowly
based on strong food and fuel demands of vegetable oil and a solid feed demand for
protein meal.
● Relative profitability of oilseeds versus coarse grains is expected to favour the distribution
of land toward oilseeds and lead to a 26% increase in world production when combined
with yield gains. With 93% of global exports in 2022, the Americas should confirm their
role as the oilseeds basket of the world. China is expected to further solidify its position
as the leading oilseeds importer but its share of world oilseeds crush is expected to
stabilise at 25% of world total.
● After a period of over-proportional growth in palm oil production, its share in total
oilseed oil output is projected to stabilise at around one third of the total vegetable oil
production. World vegetable oil production remains very concentrated in the coming
decade as growth originates in the main producing regions. Demand for food remains
strong based on income and population growths, fuel uses are supported by
consumption mandates.
● Global protein meal output is projected to increase by 25% or 67 Mt. Two-thirds should
come from four countries: Argentina, Brazil, China and the United States. Compared to
the past decade, consumption growth of protein meal slows down significantly
reflecting both slower absolute growth in global livestock production and slower growth
in the relative use of protein meal in feed rations, signalling a less rapid structural
transformation process in the livestock sector in the coming decade.
OECD-FAO AGRICULTURAL OUTLOOK 2013 © OECD/FAO 2013140

5. OILSEEDS AND OILSEED PRODUCTS
859591
0
200
400
600
800
1000
1200
1400USD/t
Market trends and prospects
Prices
After the initial downward correction, all prices of the oilseed complex are expected to
increase over the medium term due to strong demands for vegetable oil and protein meal
(Figure 5.1). The demand for protein meal is driven by the growth in non-ruminant and
milk production in developing countries and by a greater incorporation rate of protein in
feed rations in these countries. The demand for fuel use of vegetable oil will be driven by
mandates since biodiesel consumption is not expected to be economically viable compared
to diesel despite the assumed high crude oil price. The assumption that the United States
biodiesel sector will be able to capture part of the advanced biofuel mandate from 2020
adds additional strength to the vegetable oil price in the outer years.
Also in real terms, these prices are expected to fall from their current high levels
(Figure 5.1). Over the medium term, oilseed and vegetable oil prices are expected to
stabilise at about the levels seen before the recent price spike and protein meal price falls
almost 10% below the 2009 level. These corrections bring crush margins back to their long
term average level as of 2016.
The lower growth in the protein meal price is the result of the complex nature of the
oilseed market. Meal demand is fueled by increasing milk, pork, poultry and egg
production in developing and certain developed countries. It is also driven by the high price
of fishmeal caused by the growing aquaculture production and by a somewhat stagnating
fishmeal supply due to fishing quotas. Finally, demand remains strong because meat and
bone meal is still prohibited as farm animal feed in many countries. Supply of protein meal
is determined by the combined drivers of meal and oil markets because of their joint
product nature. The expected growth in the oil market carries over into meal leading to a
very strong supply and flat prices.
Since maize production requires higher inputs of fertiliser and energy than oilseeds,
even the projected faster price gains in maize are not expected to offset its cost
Figure 5.1. Oilseeds prices remain at higher plateauEvolution of prices expressed in nominal and in real terms
Note: The left figure shows nominal prices and the right figure shows real prices.Source: OECD and FAO Secretariats. 1 2 http://dx.doi.org/10.1787/888932
0
200
400
600
800
1000
1200
1400
0
100
200
300
400
500
600
700
1992 1997 2002 2007 2012 2017 2022
USD/tUSD/t
OilseedsProtein mealsVegetable oils (right axis)
0
100
200
300
400
500
600
700
1992 1997 2002 2007 2012 2017 2022
USD/t
OilseedsProtein mealsVegetable oils (right axis)
OECD-FAO AGRICULTURAL OUTLOOK 2013 © OECD/FAO 2013 141

5. OILSEEDS AND OILSEED PRODUCTS
859610
2022
disadvantages, resulting in a better profitability for oilseeds over the Outlook period. This
results in the distribution of land toward them and a more marked reduction in the
production growth of maize compared to oilseeds.
Oilseed production and crush
The oilseeds’ share of world area for the commodities covered in the Outlook is
expected to grow slightly between the 2010-12 average and 2022, yet slower than it was the
case in the previous decade. Global area expansion of 10% combined with 14% yields
improvements should generate a 26% increase in world oilseed production over the coming
decade.
MERCOSUR countries (Argentina, Brazil, Paraguay and Uruguay) are expected to reach
38% of world production in 2022 compared to an average of 35% in 2010-12. In spite of a
small decline, the United States should remain the leading oilseeds producer, with a global
share of 21% by 2022. The Black Sea countries (the Russian Federation, Ukraine and
Kazakhstan) are expected to maintain their 6% share throughout the Outlook period.
In a context of increasing use of biodiesel to meet the Renewable Energy Directive,
European Union oilseeds production should increase by 21% over the projection period and
maintain its 7% share of world total. This should be driven by both expansion of the land
planted with rapeseed and by yield increases. Australia and Canada are also expected to
increase production sufficiently to maintain their share of world production.
Which regions of the world will crush these oilseeds depends on many factors,
including transport costs, trade policies, GMO acceptance, processing costs (labour and
energy) and infrastructure installations (ports, roads, etc). In this Outlook, it is anticipated
that China will continue to increase oilseed crush but its share of the world total stabilises
around 25% (Figure 5.2). However, since the bulk of the anticipated increase in crushing is
expected from imported oilseeds, China’s imports need to reach 83 Mt in 2022. Such a large
amount has a significant impact on the world price of oilseeds, but also on the price of
other crops through supply and demand substitution (Box 5.1).
Figure 5.2. Share of global oilseed crush among leading regions
Source: OECD and FAO Secretariats.1 2 http://dx.doi.org/10.1787/888932
0
5
10
15
20
25
30
2000 2001 2002 2003 2004 2005 2006 2007 2008 2009 2010 2011 2012 2013 2014 2015 2016 2017 2018 2019 2020 2021
%
China European Union MERCOSUR NAFTA
OECD-FAO AGRICULTURAL OUTLOOK 2013 © OECD/FAO 2013142
5. OILSEEDS AND OILSEED PRODUCTS
Large production increases in MERCOSUR gradually reach 25% of the world total crush
by the end of the Outlook period. Underpinned by its biodiesel policies, the European
Union’s production share should only fall slightly over the Outlook period. The downward
trend in the share of the NAFTA countries (the United States, Canada and Mexico) should
continue but at a slower pace.
Based on the projected smaller rate of growth in global oilseed production, annual
average growth in world oilseed crush is expected to be 2.2% compared to 3.8% in the
previous decade. This, in absolute terms, translates into an expansion of 89 Mt over the
Outlook period (2010-12 average compared to 2022). The largest expansion in crush volume
is projected to come from the MERCOSUR countries with 31 Mt followed by China at 24 Mt.
Since prices are expected to remain on the higher plateau and there are no new stock
holding policies by any major producer or consumer country, global stock-to-use ratio
(including protein meal stocks on an oilseeds equivalent basis) is expected to remain close
to 14% over the entire Outlook period. This limited capacity to compensate potential
production shortfalls in a major producing region contributes to the continued risk of price
volatility in the oilseed sector.
Vegetable oil production and consumption
World vegetable oil production is expected to increase by 25% or 39 Mt over the Outlook
period, relative to the 2010-12 average. It is likely to remain very concentrated with eight
major producers (Indonesia, Malaysia, China, the European Union, the United States,
Argentina, Brazil and India) accounting for almost 80% of total production throughout the
projection period. Malaysia’s and Indonesia’s palm oil output is projected to grow on
average at about 1.9% p.a., a slower rate than in the past as land restrictions, environmental
constraints and labour costs become more constraining. Due to this lower growth in
production, the share of palm oil in total vegetable oil output should stabilise at about 34%.
Based on its use of imported seeds in domestic crush, China ranks third in vegetable oil
production.
Population growth and rising per capita income are expected to lead to an average
2.1% p.a. growth of food vegetable oil use in developing countries. Annual food vegetable oil
use per capita is expected to average 19 kg across developing countries, but no more than
9.5 kg in least developed countries by 2022. As a group, developed countries are showing a
stable consumption level of 24-25 kg but individual countries differ based on tastes and
preferences in their diets.
In developed countries, continuing sustained demand for non-food uses, in particular
for biodiesel production, is expected to lead to an average annual growth of vegetable oil
use of 1.5% p.a. This rate is much slower than over the previous decade when biofuel
policies were taking effect. The share of vegetable oil consumption used for world biodiesel
production is expected to increase from 12% in 2010-12 to 15% in 2022 (Figure 5.3).
Argentina is expected to maintain an export-oriented biodiesel industry: consumption
of vegetable oil for biodiesel production is expected to reach 2.9 Mt by 2022, i.e. 73% of
domestic vegetable oil use. In the European Union and Thailand, vegetable oil for biodiesel
production is expected to account for more than 50% of domestic vegetable oil
consumption by 2022.
Globally, the use of edible vegetable oil for biodiesel production is expected to expand
by about 11 Mt to 30 Mt p.a. over the Outlook period. This constitutes a 61% increase over
OECD-FAO AGRICULTURAL OUTLOOK 2013 © OECD/FAO 2013 143

5. OILSEEDS AND OILSEED PRODUCTS
859629
0 %
the base period and takes up almost one-third of the total production growth of vegetable
oil. The European Union is expected to remain the largest producer of biodiesel with a
declining but still dominant share of global output throughout the decade. Other important
producing countries are Argentina, Brazil and the United States.
The use of maize oil for biodiesel production has emerged in the United States and is
expected to amplify over the Outlook period. This maize oil is extracted during the
processing of maize into ethanol and sweeteners in wet milling plants. Since only about
10% of ethanol is produced in wet milling plants, the largest part of maize oil production is
derived as a by-product of maize sweeteners4 (about two-thirds).
Oilseed meal production and consumption
Global meal output is projected to increase by 25%, reaching almost 339 Mt by 2022.
Production remains highly concentrated, with six countries (Argentina, Brazil, China, the
European Union, India and the United States) accounting for almost 80% of global
production. Two-thirds of the 67 Mt increase will come from only four countries: Argentina,
Brazil, China and the United States. In China and the European Union, meal production will
continue to rely on both domestically grown and imported seeds.
Global meal consumption should rise by 26%, with developing countries accounting
for over 80% of the increase and reaching 65% of global consumption by 2022. Compared to
the past decade, annual consumption growth is expected to slow down markedly reflecting
firstly the lower growth of developing countries livestock industries and secondly, the
slower growth in the inclusion of protein meal in feed rations.
In LDCs, protein meal use remains low, but its use is projected to grow faster in the
coming ten years than over the previous decade due to the faster development of livestock
production and increasing feed intensity of protein meal. While this projected
development represents a positive development for these countries, it is not a driving
factor in the global protein meal market since the increase in LDC consumption accounts
Figure 5.3. Biodiesel to use a large share of vegetable oilShare of vegetable oil consumption used for biodiesel production
Source: OECD and FAO Secretariats.1 2 http://dx.doi.org/10.1787/888932
0 10 20 30 40 50 60 70 8
Argentina
EU27
Thailand
Brazil
Malaysia
USA
Indonesia
World
2010-12 2022
OECD-FAO AGRICULTURAL OUTLOOK 2013 © OECD/FAO 2013144
5. OILSEEDS AND OILSEED PRODUCTS
859648
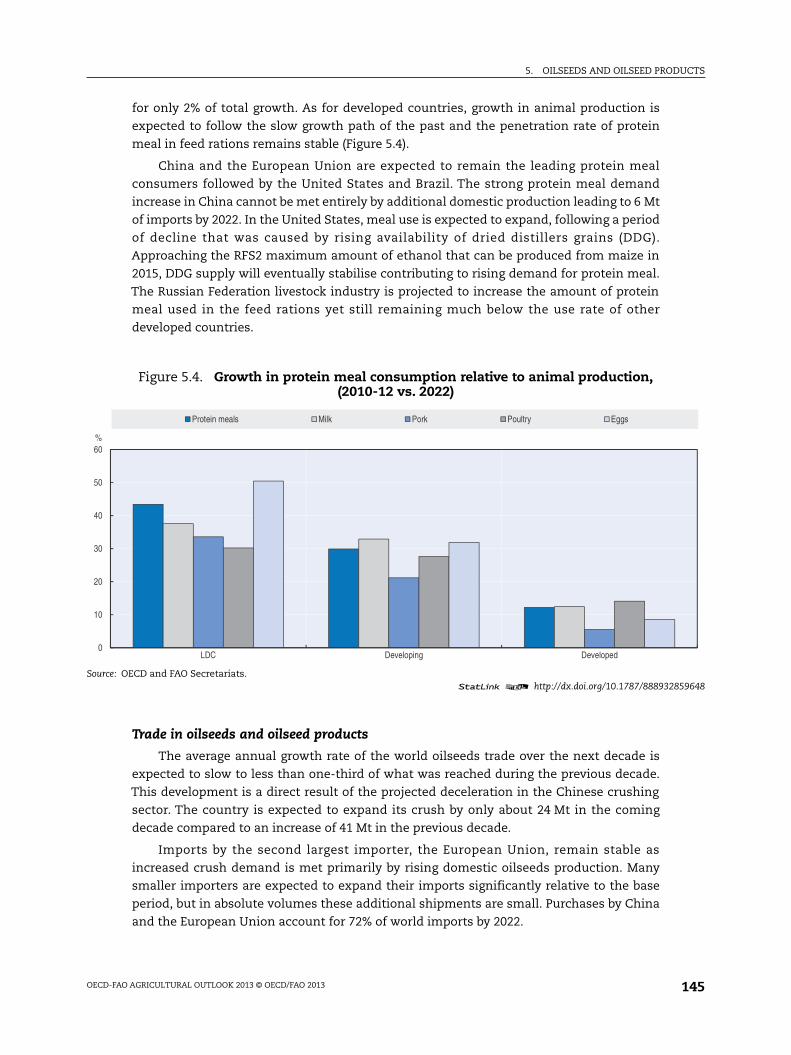
for only 2% of total growth. As for developed countries, growth in animal production is
expected to follow the slow growth path of the past and the penetration rate of protein
meal in feed rations remains stable (Figure 5.4).
China and the European Union are expected to remain the leading protein meal
consumers followed by the United States and Brazil. The strong protein meal demand
increase in China cannot be met entirely by additional domestic production leading to 6 Mt
of imports by 2022. In the United States, meal use is expected to expand, following a period
of decline that was caused by rising availability of dried distillers grains (DDG).
Approaching the RFS2 maximum amount of ethanol that can be produced from maize in
2015, DDG supply will eventually stabilise contributing to rising demand for protein meal.
The Russian Federation livestock industry is projected to increase the amount of protein
meal used in the feed rations yet still remaining much below the use rate of other
developed countries.
Trade in oilseeds and oilseed products
The average annual growth rate of the world oilseeds trade over the next decade is
expected to slow to less than one-third of what was reached during the previous decade.
This development is a direct result of the projected deceleration in the Chinese crushing
sector. The country is expected to expand its crush by only about 24 Mt in the coming
decade compared to an increase of 41 Mt in the previous decade.
Imports by the second largest importer, the European Union, remain stable as
increased crush demand is met primarily by rising domestic oilseeds production. Many
smaller importers are expected to expand their imports significantly relative to the base
period, but in absolute volumes these additional shipments are small. Purchases by China
and the European Union account for 72% of world imports by 2022.
Figure 5.4. Growth in protein meal consumption relative to animal production,(2010-12 vs. 2022)
Source: OECD and FAO Secretariats.1 2 http://dx.doi.org/10.1787/888932
0
10
20
30
40
50
60
LDC Developing Developed
%
Protein meals Milk Pork Poultry Eggs
OECD-FAO AGRICULTURAL OUTLOOK 2013 © OECD/FAO 2013 145

5. OILSEEDS AND OILSEED PRODUCTS
In terms of global oilseed exports, growth over the decade is expected to be smaller for
developed countries (23%) than for developing countries (32%). Exports from the United
States should grow by 17% over the projection period, while Brazil’s shipments should
increase by 22%. A similar growth is expected for Canada (29%) as a growing exportable
surplus is produced through continued gains in the popularity of cultivating canola in
the prairies. Argentina’s exports, starting from a lower base, are expected to increase
significantly, by 54%. Overall, world trade in oilseeds remains highly concentrated, with
these four leading exporters holding an 85% market share in 2022. Adding Paraguay’s
exports, which are growing over 60% in this Outlook, pushes this concentration ratio
to 90%.
Vegetable oil imports are less concentrated than oilseeds but there are three main
market players. The European Union, China and India are expected to represent about 46%
of world imports in 2022. With a projected increase in imports of 25% and 51%, China’s and
India’s import dependency rates reach 31% and 62%, respectively. Because of an 8 Mt
increase in domestic oilseed crush, the European Union’s imports of vegetable oil increase
much less in the next decade than in the previous one.
The vegetable oil deficit of least developed countries will continue to grow along with
the domestic usage. The share of domestically produced vegetable oil in this market is
expected to stay at around 40% over the Outlook period as domestic production in these
countries covers only about 40% of the strong demand growth. Their imports are expected
to increase from 4.9 Mt in 2010-12 to 6.6 Mt by 2022.
Vegetable oil exports continue to be dominated by a few players (Figure 5.5). Indonesia
and Malaysia will continue to account for almost two-thirds of total vegetable oil exports
during the coming decade. Argentina is expected to be the third largest exporter with a
share of about 10% despite exporting 66% of its domestic production in 2022, as the country
favour exports of products rather than oilseeds.
Figure 5.5. Share of vegetable oil exports in 2022
Source: OECD and FAO Secretariats.1 2 http://dx.doi.org/10.1787/888932859667
Indonesia34.2%
Malaysia30.7%
Ukraine4.4%
Canada3.3%
Brazil3.4%
Argentina10.1%
Rest of the world13.8%
OECD-FAO AGRICULTURAL OUTLOOK 2013 © OECD/FAO 2013146

5. OILSEEDS AND OILSEED PRODUCTS
For meal, the projections point to a slowdown in trade expansion from 45% in the
previous decade to 31% in the next decade. Deceleration should be slightly more
pronounced in developed than in developing countries. Between 2010-12 and 2022, 93% of
the anticipated expansion in global imports is projected to occur in the developing world.
The large increase in meal consumption in China is anticipated to change its trade
balance from a small net exporter at the beginning of the century to a net importer of about
6 Mt in 2022. The EU trade deficit should remain mostly stable as the additional seeds
produced to obtain the necessary oil for biodiesel will also increase the domestic supply of
protein meal.
Argentina will remain by far the largest meal exporter because, among the large
producers, it is the only country with a very small consumption base. This low level of
consumption is directly tied to the composition of its livestock sector which requires small
amounts of protein meal. The five significant American producers, Argentina, Paraguay,
Brazil, the United States and Canada, account for a large share of protein meal trade,
reaching 73% of world exports by 2022.
Risks and uncertaintiesIn addition to the issues and uncertainties common to most commodities
(macroeconomic environment, crude oil prices, weather conditions), each sector has its
specific supply and demand sensitivities.
Major uncertainties in the vegetable oil sector originate from the United States and
European Union biofuel policies, as they determine a large share of the demand in these
countries. The uncertainties related to the proposal by the European Commission to limit
the amount of first generation biofuels that can be counted towards the 10% renewable
energy targets to 5% are analysed and presented in the biofuel chapter of this document.
Since biodiesel is considered an advanced biofuel in the United States Renewable Fuel
Standard mandates, all the uncertainties related to that policy are also relevant for the
vegetable oil market. The main uncertainties are the yearly decision the Environment
Protection Agency (EPA) has to take regarding to the cellulosic, advanced and total
mandates. Until now, none of the reduction in the cellulosic mandate has translated into
reduction in the advanced and total mandates. It was assumed in the Outlook that this
would not be the case as of 2014. However, if the EPA continues current practices, the size
of the American biodiesel market could increase substantially. The other factor affecting
the incentives for blenders to use more biodiesel is the ethanol blend wall. In the Outlook,
it is assumed that E15 blends will be introduced in the market. This is far from being a
certainty.
For protein meal, the European Commission announced on 14 February 2013 that
processed animal protein (PAP) from poultry and pigs would be allowed in fish farming.
There is also a statement indicating that the Commission “intends proposing another
measure to reintroduce the use of PAP pork and poultry to poultry and pig farming” as of
2014. Both measures could affect the outlook for oilmeal consumption in the European
Union.
OECD-FAO AGRICULTURAL OUTLOOK 2013 © OECD/FAO 2013 147

5. OILSEEDS AND OILSEED PRODUCTS
auingas
rldce05
o antsrgeed
o a10,hisedchan
686
Oualionomndrgeot
22
Box 5.1. The influence of China’s oilseed imports on the world price of cerealsand oilseed
As illustrated in Figure 5.6, world prices of cereals and oilseeds have experienced a higher price platesince the crop year 2006. Many factors were identified as having contributed to this new plateau includthe growth in demand from developing countries. China joined the WTO in 2001 and since then hbecome a more active player in international agricultural markets. The influence of China on the wocereal prices has been downplayed on the basis of the relatively small modification in its trade balanbetween its WTO accession and the period of the higher price plateau. On average, between 2001 and 20the combined annual trade balance of wheat and coarse grains of China was a 5.6 Mt surplus, falling t0.1 Mt per year deficit on average during the 2006-10 period, a 5.7 Mt difference. This amount represeonly 0.3% and 2.3% of 2010 world production and imports, respectively. Given these small shares, a laimpact on international prices is unlikely. For oilseeds, the Chinese authorities appear to have easproduction targets in favour of sustaining self-sufficiency in cereals (Chapter 2). This shift has led tsubstantial increase in the oilseeds trade deficit from 19.8 Mt on average for 2001-05 to 42.6 Mt for 2006-a 22.8 Mt difference which represents 6% and 21% of 2010 world production and imports, respectively. Tquantity is sufficient to have a sizable impact on the world price of oilseeds. Considering the grain/oilsesubstitution possibilities on the supply and demand side, it is highly probable that China had a mustronger impact on the world price of cereals through the change in the oilseeds trade balance ththrough the change in the cereals trade balance itself.
Figure 5.6. World prices of cereals and oilseeds
Source: OECD and FAO Secretariats.1 2 http://dx.doi.org/10.1787/888932859
In order to examine this likely impact of the change in China’s cereal trade balance, the AGLINK-COSIMmodel was used to simulate a similar change over the Outlook period. The simulation involved a gradimprovement in the cereal trade balance over the 2014-22 period similar in scale to the deterioratexperienced over the historical period; i.e. 5.7 Mt. In order to avoid any other second round effects frother sectors in the Chinese market, the simulation involved a simultaneous reduction in imports aincrease in Chinese production. The impacts on the world prices in the last year (2022) are not very la(1.7% for maize) and would tend to validate the argument that the cereals trade balance of China did ncontribute very much to the new higher price plateau.
0
100
200
300
400
500
600
700
1990 1992 1994 1996 1998 2000 2002 2004 2006 2008 2010 2012 2014 2016 2018 2020 20
USD/t
Maize Wheat Oilseeds
OECD-FAO AGRICULTURAL OUTLOOK 2013 © OECD/FAO 2013148

5. OILSEEDS AND OILSEED PRODUCTS
ds.ingedndasdeeirrldes,his
in
eala’srsere
ls
705
Box 5.1. The influence of China’s oilseed imports on the world price of cerealsand oilseed (cont.)
A second scenario involved simultaneous improvements in the trade balances of cereals and oilseeSince oilseeds demand is basically derived from the vegetable oil and protein meal demand, changChinese crush demand alone in this simulation would have only resulted in a replacement of oilseimports by vegetable oil and protein meal imports. To perform the desired scenario, a reduction in demafor vegetable oil and protein meal in China was also needed. As a result, oilseeds crush demand as wellvegetable oil and protein meal demand were reduced simultaneously in order to reduce the oilseeds tradeficit by about 23 Mt while maintaining the Chinese trade deficit in vegetable oil and protein meal at thbaseline levels. The large reduction in Chinese oilseeds imports generated a 10% reduction in the woprice of that commodity (Figure 5.7). Through land substitution and reallocation of land between countrithe decline in oilseeds prices generated a 7.7 Mt increase in world cereals production in 2022. Tcombined with the improvement in China’s cereal trade balance led to a 5% (almost USD 12/t) reductionthe world price of maize and a 3% reduction in the price of wheat (USD 8.5/t).
Three observations can be drawn from this analysis. First, two-thirds of China’s influence on world cerprices comes from their imports of oilseeds. Second, even in a scenario with a partial reduction in Chintrade deficit, the negative impact on world prices was significant (10%, 5% and 3% for oilseeds, coagrains and wheat, respectively). Third, China’s influence on these world prices may accentuate in the futugiven that trade deficits are projected to exceed those during the 2006-10 period.
Figure 5.7. The decline in world prices from a reduced Chinese trade deficit for only cereaor cereals and oilseeds
Source: OECD and FAO Secretariats.1 2 http://dx.doi.org/10.1787/888932859
0
2
4
6
8
10
12
Wheat Coarse grains Oilseeds
%
Cereals alone Cereals & oilseeds
OECD-FAO AGRICULTURAL OUTLOOK 2013 © OECD/FAO 2013 149

5. OILSEEDS AND OILSEED PRODUCTS
Notes
1. The projections for oilseeds are not comparable to those published last year because cotton seedwas separated from the oilseeds total. It is part of a new cotton component. Cotton seed meal andoil are still included in the protein meal and vegetable oil aggregates.
2. See the glossary for the definition of crop marketing years for oilseeds and products in variouscountries.
3. Including stocks of oilseed meal (oilseed equivalent basis).
4. As a result, maize oil production from sweeteners of most components of the AGLINK-COSIMOmodel has been added to the total vegetable oil production.
References
FAPRI (2013), US Baseline Briefing Book, FAPRI, March 2013.
Baffes, J. and T. Haniotis (2010), Placing the 2006/08 commodity price boom into perspective, Washington DC,World Bank, 2010.
OECD-FAO AGRICULTURAL OUTLOOK 2013 © OECD/FAO 2013150

OECD-FAO AGRICULTURAL OUTLOOK 2013 © OECD/FAO 2013274
ANNEX A
Table A.11. World oilseed projections
Average2010/11-
2012/13est2013/14 2014/15 2015/16 2016/17 2017/18 2018/19 2019/20 2020/21 2021/22 2022/23
OILSEED (crop year)2
WorldProduction mt 390.4 408.2 414.0 427.0 435.7 443.7 452.5 460.7 470.9 480.8 490.5
Area mha 150.0 188.8 188.6 191.1 192.8 194.3 195.9 197.3 199.6 201.8 203.5Yield t/ha 1.9 2.2 2.2 2.2 2.3 2.3 2.3 2.3 2.4 2.4 2.4
Consumption mt 392.0 406.2 416.2 426.6 436.3 444.5 453.3 461.6 470.7 480.5 489.6Crush mt 345.3 357.5 366.5 376.5 385.0 392.4 400.5 408.2 416.7 425.8 434.3
Exports mt 74.5 118.6 120.1 123.8 125.8 127.6 129.6 131.4 134.4 137.3 140.2Closing stocks mt 40.3 38.5 37.2 38.6 39.0 39.2 39.4 39.5 40.7 41.9 43.8Price3 USD/t 605.0 564.1 514.0 511.2 507.0 521.7 523.0 530.0 530.5 538.9 540.0
Developed countriesProduction mt 165.5 176.3 177.3 182.6 186.2 188.3 191.5 194.0 197.3 200.5 203.2Consumption mt 136.6 139.2 142.1 145.2 148.5 151.0 153.7 156.1 158.6 160.9 163.0
Crush mt 124.4 126.5 128.8 132.2 134.8 137.0 139.6 141.9 144.4 146.6 148.6Closing stocks mt 14.4 13.9 14.2 15.6 16.0 16.2 16.2 16.1 16.3 16.4 16.6
Developing countriesProduction mt 224.9 231.9 236.7 244.3 249.5 255.4 261.0 266.6 273.6 280.3 287.2Consumption mt 255.4 267.0 274.1 281.4 287.8 293.5 299.6 305.5 312.2 319.6 326.6
Crush mt 220.9 231.0 237.7 244.3 250.1 255.4 260.9 266.3 272.4 279.1 285.6Closing stocks mt 25.8 24.5 23.0 23.0 23.0 23.0 23.3 23.4 24.4 25.6 27.2
OECD1
Production mt 140.8 150.7 150.6 155.7 157.8 159.0 161.2 162.7 165.0 167.1 169.0Consumption mt 123.4 125.0 127.1 129.7 132.1 133.9 135.8 137.3 139.0 140.5 141.8
Crush mt 112.5 113.9 115.4 118.2 120.0 121.6 123.3 124.7 126.4 127.8 129.1Closing stocks mt 13.2 13.2 13.3 14.7 15.1 15.2 15.1 15.0 15.1 15.1 15.2
PROTEIN MEALS (marketing year)World
Production mt 271.5 280.9 288.3 295.5 301.7 307.0 313.4 319.3 325.7 332.4 338.8Consumption mt 268.9 280.6 287.8 295.2 301.6 307.0 313.3 319.1 325.5 332.1 338.5Closing stocks mt 15.4 14.9 15.5 15.9 16.1 16.2 16.4 16.6 16.9 17.3 17.6
Price4 USD/t 436.9 464.3 403.9 389.0 387.0 390.2 396.2 401.7 403.6 404.2 406.1Developed countries
Production mt 87.2 88.6 90.4 92.6 94.2 95.3 97.1 98.5 100.1 101.5 102.8Consumption mt 107.3 111.5 112.2 113.5 114.8 115.1 116.5 117.3 118.3 119.3 120.0Closing stocks mt 1.3 1.2 1.3 1.3 1.3 1.3 1.3 1.3 1.3 1.4 1.4
Developing countriesProduction mt 184.3 192.3 197.9 203.0 207.5 211.7 216.2 220.7 225.6 230.9 236.0Consumption mt 161.6 169.1 175.5 181.7 186.9 191.9 196.8 201.8 207.2 212.8 218.5Closing stocks mt 14.2 13.7 14.2 14.6 14.7 14.9 15.1 15.3 15.6 15.9 16.3
OECDProduction mt 82.6 83.8 85.2 87.0 88.2 89.0 90.3 91.2 92.4 93.4 94.3Consumption mt 110.3 114.6 115.5 117.1 118.5 119.0 120.3 121.1 122.2 123.2 124.0Closing stocks mt 1.5 1.4 1.5 1.5 1.5 1.5 1.5 1.5 1.5 1.5 1.5
VEGETABLE OILS (marketing year)World
Production mt 156.2 163.3 166.9 170.9 174.3 177.5 181.2 184.6 188.3 192.1 195.7Of which palm oil mt 52.1 55.7 56.9 58.2 59.4 60.6 61.9 63.1 64.4 65.6 66.9
Consumption mt 154.9 163.7 167.9 170.6 174.9 178.3 181.8 185.3 189.0 192.6 196.2Food mt 108.4 133.6 137.0 138.6 141.2 143.4 145.8 148.1 150.5 153.2 156.0Biofuel mt 19.4 21.0 21.5 22.5 24.0 25.1 26.2 27.1 28.4 29.1 29.7
Exports mt 41.8 65.6 66.0 67.5 68.5 70.1 71.5 73.1 74.7 76.0 77.3Closing stocks mt 21.3 22.1 22.0 23.1 23.5 23.6 23.8 24.1 24.3 24.7 25.0
Price5 USD/t 1 206.6 1 141.4 1 038.3 1 077.6 1 065.2 1 097.7 1 104.9 1 117.6 1 136.1 1 154.6 1 160.3Developed countries
Production mt 39.8 40.5 41.2 42.3 43.1 43.7 44.6 45.4 46.2 47.0 47.7Consumption mt 46.9 47.7 48.3 48.9 49.8 50.6 51.3 52.1 53.3 53.7 54.1Closing stocks mt 3.4 3.3 3.3 3.4 3.5 3.5 3.5 3.6 3.6 3.8 3.9
Developing countriesProduction mt 116.4 122.8 125.7 128.6 131.2 133.8 136.5 139.2 142.1 145.0 147.9Consumption mt 108.0 116.0 119.5 121.7 125.1 127.7 130.5 133.2 135.7 139.0 142.2Closing stocks mt 17.9 18.8 18.7 19.7 20.0 20.1 20.3 20.5 20.7 20.9 21.1
OECDProduction mt 34.3 34.8 35.2 36.0 36.5 36.9 37.5 37.9 38.5 38.9 39.3Consumption mt 45.8 46.5 47.0 47.5 48.2 49.0 49.6 50.5 51.6 52.0 52.4Closing stocks mt 3.0 2.9 2.9 3.0 3.0 3.1 3.1 3.1 3.2 3.3 3.5

OECD-FAO AGRICULTURAL OUTLOOK 2013 © OECD/FAO 2013 275
ANNEX A
1. Excludes Iceland but includes all EU27 member countries.2. Beginning crop marketing year - see Glossary of Terms for definitions. Cotton seeds have been extracted from the oilseed total. Based on
the cotton outlook, cotton seed production and crush would reach about 50 mt in 2022.Average 2010/11-2012/13est: Data for 2012/13 are estimated.
3. Weighted average oilseed price, European port.4. Weighted average protein meal, European port.5. Weighted average price of oilseed oils and palm oil, European port.Source: OECD and FAO Secretariats.
1 2 http://dx.doi.org/10.1787/888932861358

OECD-FAO AGRICULTURAL OUTLOOK 2013 © OECD/FAO 2013276
ANNEX A
Note: Crop year: Beginning crop marketing year - see Glossary of Terms for definitions.Average 2010-12est: Data for 2012 are estimated.
1. Includes Israel and also transition economies: Kazakhstan, Kyrgyzstan, Tajikistan, Turkmenistan, Uzbekistan, Armenia, Azerbaijan andGeorgia.
2. Refers to mainland only. The economies of Chinese Taipei, Hong Kong (China) and Macau (China) are included in the Other Asia Pacificaggregate.
3. Excludes Iceland but includes all EU27 member countries.4. Least-squares growth rate (see glossary).Source: OECD and FAO Secretariats.
1 2 http://dx.doi.org/10.1787/888932861377
Table A.12.1. Oilseed projections: Production and tradeCrop year
PRODUCTION (kt) Growth (%)4 IMPORTS (kt) Growth (%)4 EXPORTS (kt) Growth (%)4
Average2010-12est 2022 2003-12 2013-22 Average
2010-12est 2022 2003-12 2013-22 Average2010-12est 2022 2003-12 2013-22
WORLD 390 414 490 460 3.13 2.07 110 714 141 194 6.68 1.82 110 371 140 197 6.27 1.83DEVELOPED COUNTRIES 165 474 203 242 3.70 1.63 25 357 27 995 -0.47 0.86 55 540 68 070 6.67 1.22
NORTH AMERICA 107 682 128 468 2.35 1.13 1 649 1 477 1.95 0.07 49 400 59 152 6.15 1.01Canada 18 184 23 367 8.05 1.62 519 541 -6.30 0.00 10 594 13 703 10.35 2.00United States 89 497 105 101 1.44 1.03 1 130 936 8.70 0.10 38 805 45 449 5.23 0.73
EUROPE 52 349 66 678 6.59 2.46 17 592 20 816 0.53 1.27 4 040 5 912 12.51 3.21European Union 28 073 33 832 4.20 1.97 16 096 18 981 -0.21 1.24 657 662 -0.30 0.34Russian Federation 9 933 12 095 7.03 2.68 895 1 272 73.42 2.31 283 1 011 0.00 9.84Ukraine 12 088 17 859 14.45 3.41 24 25 0.86 -0.19 2 705 3 640 25.61 2.20
OCEANIA DEVELOPED 2 861 4 130 9.33 2.53 35 30 1.32 -0.01 1 864 2 876 11.72 2.46Australia 2 851 4 120 9.32 2.53 25 25 1.53 0.00 1 863 2 876 11.72 2.46New Zealand 10 10 14.26 0.00 10 5 1.54 -0.08 0 0 -0.11 -1.52
OTHER DEVELOPED1 2 582 3 966 5.88 4.01 6 081 5 672 -3.48 -0.31 237 130 16.66 -6.76Japan 246 239 0.93 0.00 5 222 4 476 -4.23 -1.03 0 0 -10.09 0.00South Africa 1 523 2 714 6.32 5.21 46 130 -2.67 15.25 127 23 34.46 -20.01
DEVELOPING COUNTRIES 224 940 287 218 2.71 2.39 85 357 113 200 9.89 2.07 54 831 72 128 5.80 2.45AFRICA 10 043 12 910 1.11 2.65 3 009 3 773 12.34 1.84 281 169 9.41 4.51NORTH AFRICA 555 656 0.26 1.88 2 902 3 633 13.23 1.76 36 34 0.79 -1.37
Algeria 115 136 1.15 2.17 205 260 10.64 0.68 0 0 0.00 -0.05Egypt 270 327 -0.48 1.96 1 894 2 288 20.33 1.31 30 30 12.44 -1.30
SUB-SAHARAN AFRICA 9 489 12 254 1.16 2.69 108 140 -0.97 4.18 244 135 11.52 6.83LATIN AMERICA and CARIBBEAN 139 470 189 415 4.17 2.84 7 409 8 705 -0.21 0.07 52 832 71 075 6.06 2.58
Argentina 52 500 73 607 2.14 3.54 294 1 686 -42.13 0.81 11 372 17 501 1.51 2.24Brazil 73 635 95 403 5.01 2.31 84 68 -22.83 0.08 34 064 41 569 6.58 2.38Chile 83 144 1.12 5.25 209 234 -1.29 3.06 5 3 -5.15 -2.85Mexico 297 209 3.89 -4.29 5 432 5 589 2.08 0.11 10 10 2.67 -0.06Uruguay 2 623 4 434 21.71 2.99 4 4 -9.13 -0.53 2 242 3 488 21.69 3.06
ASIA and PACIFIC 75 427 84 893 0.62 1.42 74 939 100 721 11.41 2.27 1 719 884 -0.88 -5.15Bangladesh 365 435 3.47 1.60 252 237 2.91 1.04 0 0 0.00 -0.07China2 44 380 47 951 0.01 1.20 58 898 82 830 14.17 2.57 932 409 -4.71 -7.41India 23 222 27 165 1.29 1.71 191 2 62.22 -34.98 521 202 7.12 -4.35Indonesia 1 899 2 425 0.16 2.16 2 184 2 230 7.32 0.75 3 2 -7.15 -0.06Iran, Islamic Republic of 501 586 3.76 1.38 712 803 0.03 0.47 3 3 -1.41 -0.06Korea 136 144 0.88 0.00 1 311 1 453 -1.78 1.47 0 0 -4.56 0.00Malaysia 7 8 4.37 1.28 559 587 -1.35 0.95 17 22 -6.53 -0.14Pakistan 871 1 070 8.42 2.55 1 311 1 709 7.06 1.68 8 0 68.19 -0.29Saudi Arabia 4 4 0.00 0.81 5 7 0.00 1.89 0 0 0.00 -1.86Turkey 1 257 1 620 6.08 0.94 2 150 2 169 5.53 1.10 38 40 33.86 -0.66
LEAST DEVELOPED COUNTRIES (LDC) 6 617 8 640 0.98 2.60 381 356 1.60 1.03 106 143 4.40 7.82OECD3 140 802 168 962 2.82 1.32 33 185 35 719 -0.25 0.73 51 994 62 761 6.16 1.06BRICS 152 693 185 330 2.89 1.98 60 114 84 302 13.94 2.56 35 927 43 214 6.14 2.27

OECD-FAO AGRICULTURAL OUTLOOK 2013 © OECD/FAO 2013 277
ANNEX A
Note: Crop year: Beginning crop marketing year - see Glossary of Terms for definitions.Average 2010-12est: Data for 2012 are estimated.
1. Least-squares growth rate (see glossary).2. Includes Israel and also transition economies: Kazakhstan, Kyrgyzstan, Tajikistan, Turkmenistan, Uzbekistan, Armenia, Azerbaijan and
Georgia.3. Refers to mainland only. The economies of Chinese Taipei, Hong Kong (China) and Macau (China) are included in the Other Asia Pacific
aggregate.4. Excludes Iceland but includes all EU27 member countries.Source: OECD and FAO Secretariats.
1 2 http://dx.doi.org/10.1787/888932861396
Table A.12.2. Oilseed projections: Consumption, domestic crushCrop year
CONSUMPTION (kt) Growth (%)1 DOMESTIC CRUSH (kt) Growth (%)1
Average2010-12est 2022 2003-12 2013-22 Average
2010-12est 2022 2003-12 2013-22
WORLD 391 994 489 640 3.47 2.06 345 295 434 270 3.77 2.15DEVELOPED COUNTRIES 136 565 162 990 2.26 1.77 124 420 148 629 2.66 1.82
NORTH AMERICA 60 840 70 687 0.49 1.36 55 230 63 790 0.88 1.41Canada 8 913 10 210 5.93 1.31 8 018 8 970 6.96 1.09United States 51 928 60 476 -0.23 1.36 47 211 54 820 0.09 1.46
EUROPE 66 277 81 556 4.72 2.17 61 019 75 510 5.20 2.19European Union 43 878 52 162 2.73 1.86 40 533 48 402 3.07 1.80Russian Federation 10 569 12 336 9.28 2.07 9 996 11 645 9.77 2.20Ukraine 9 385 14 234 12.81 3.75 8 459 13 116 14.90 4.01
OCEANIA DEVELOPED 939 1 284 5.84 2.39 912 1 262 6.30 2.44Australia 920 1 270 5.80 2.42 901 1 250 6.26 2.46New Zealand 19 14 7.79 0.02 12 12 9.62 0.02
OTHER DEVELOPED2 8 508 9 463 -1.41 1.52 7 259 8 068 -1.76 1.63Japan 5 564 4 708 -3.73 -0.82 4 681 3 828 -4.23 -0.99South Africa 1 440 2 787 4.67 6.49 1 283 2 599 4.66 6.96
DEVELOPING COUNTRIES 255 429 326 650 4.16 2.21 220 875 285 641 4.44 2.32AFRICA 12 794 16 507 2.89 2.45 7 954 9 335 4.22 1.42NORTH AFRICA 3 427 4 250 10.42 1.85 3 211 3 972 11.20 1.79
Algeria 322 396 6.38 1.26 303 375 6.60 1.20Egypt 2 126 2 580 15.42 1.49 1 990 2 397 17.35 1.38
SUB-SAHARAN AFRICA 9 367 12 257 0.99 2.67 4 743 5 363 1.05 1.15LATIN AMERICA and CARIBBEAN 93 868 126 728 3.24 2.79 87 468 119 734 3.02 2.93
Argentina 41 332 57 507 2.12 3.91 40 384 56 487 2.16 3.98Brazil 39 560 53 885 4.26 2.25 35 117 49 158 3.58 2.44Chile 289 375 -0.42 3.91 279 363 -0.48 3.98Mexico 5 718 5 788 2.15 -0.09 5 374 5 444 3.19 -0.09Uruguay 385 948 21.65 2.87 326 828 21.32 3.00
ASIA and PACIFIC 148 767 183 414 4.90 1.81 125 453 156 572 5.52 1.94Bangladesh 633 671 3.60 1.40 545 547 3.09 0.99China3 102 415 129 172 6.12 1.94 85 461 109 856 7.02 2.13India 22 729 26 866 1.47 1.63 20 113 23 502 1.46 1.59Indonesia 4 103 4 651 3.55 1.47 2 322 2 997 6.73 2.57Iran, Islamic Republic of 1 209 1 386 1.56 0.85 1 151 1 312 1.46 0.79Korea 1 499 1 596 -0.90 1.33 1 066 1 079 -0.84 0.95Malaysia 550 572 -1.06 1.04 543 566 -1.11 1.04Pakistan 2 244 2 777 8.12 2.01 2 027 2 475 8.38 1.99Saudi Arabia 9 11 0.00 1.50 6 7 0.00 0.61Turkey 3 414 3 747 5.78 1.08 3 201 3 491 5.83 0.98
LEAST DEVELOPED COUNTRIES (LDC) 6 921 8 851 1.02 2.47 4 608 5 469 1.20 1.69OECD4 123 370 141 813 1.22 1.41 112 470 129 099 1.60 1.41BRICS 176 713 225 046 5.15 2.03 151 970 196 759 5.43 2.20

OECD-FAO AGRICULTURAL OUTLOOK 2013 © OECD/FAO 2013278
ANNEX A
Note: Average 2010-12est: Data for 2012 are estimated.1. Includes Israel and also transition economies: Kazakhstan, Kyrgyzstan, Tajikistan, Turkmenistan, Uzbekistan, Armenia, Azerbaijan and
Georgia.2. Refers to mainland only. The economies of Chinese Taipei, Hong Kong (China) and Macau (China) are included in the Other Asia Pacific
aggregate.3. Excludes Iceland but includes all EU27 member countries.4. Least-squares growth rate (see glossary).Source: OECD and FAO Secretariats.
1 2 http://dx.doi.org/10.1787/888932861415
Table A.13.1. Protein meal projections: Production and tradeMarketing year
PRODUCTION (kt) Growth (%)4 IMPORTS (kt) Growth (%)4 EXPORTS (kt) Growth (%)4
Average2010-12est 2022 2003-12 2013-22 Average
2010-12est 2022 2003-12 2013-22 Average2010-12est 2022 2003-12 2013-22
WORLD 271 467 338 786 3.50 2.06 73 198 96 187 3.44 2.75 74 002 96 106 3.36 2.75DEVELOPED COUNTRIES 87 154 102 790 1.70 1.64 38 808 39 805 1.39 0.19 17 259 22 539 7.25 3.53
NORTH AMERICA 45 300 52 053 0.35 1.30 3 820 4 465 3.77 1.30 11 566 12 458 5.69 1.94Canada 4 831 5 504 5.44 1.21 1 055 863 -1.74 -0.60 3 239 3 566 9.74 1.71United States 40 469 46 549 -0.13 1.31 2 764 3 603 6.73 1.82 8 327 8 892 4.49 2.04
EUROPE 35 036 42 976 4.39 2.10 28 943 29 012 -0.16 0.11 5 438 9 856 11.25 6.10European Union 25 377 30 180 2.14 1.74 26 674 26 317 -0.53 -0.06 1 039 3 997 5.47 11.55Russian Federation 4 906 5 682 12.10 2.34 440 702 -3.95 4.84 1 153 831 7.69 1.02Ukraine 3 940 6 137 17.15 4.01 70 53 -2.38 -4.03 2 973 4 807 16.36 4.27
OCEANIA DEVELOPED 893 1 147 6.23 1.79 2 046 2 423 20.00 0.48 23 22 5.85 -0.01Australia 885 1 139 6.21 1.81 620 702 5.99 0.91 23 22 5.85 0.00New Zealand 8 8 8.22 0.00 1 425 1 721 36.79 0.31 0 0 .. ..
OTHER DEVELOPED1 5 926 6 615 -1.82 1.52 4 000 3 905 7.28 -0.56 231 203 8.81 -0.65Japan 3 219 2 697 -4.73 -0.99 2 350 2 585 8.70 0.79 2 0 -25.78 0.00South Africa 767 1 551 4.19 6.78 1 148 756 4.68 -4.66 64 75 40.43 4.86
DEVELOPING COUNTRIES 184 313 235 996 4.45 2.24 34 390 56 381 6.25 5.04 56 744 73 567 2.36 2.53AFRICA 6 299 8 713 3.80 2.81 2 947 5 200 4.57 5.52 420 857 -0.11 6.14NORTH AFRICA 2 530 3 083 9.93 1.78 2 626 4 858 4.45 5.71 6 5 5.03 -0.49
Algeria 197 246 8.49 1.20 943 1 619 8.18 4.75 0 0 0.00 -0.33Egypt 1 651 1 948 12.86 1.40 675 1 854 -1.82 9.19 2 2 0.00 -0.70
SUB-SAHARAN AFRICA 3 769 5 630 0.93 3.42 321 341 5.61 3.19 413 852 -0.17 6.20LATIN AMERICA and CARIBBEAN 68 590 93 732 3.04 2.96 6 675 9 132 3.42 3.57 42 562 58 725 1.77 3.18
Argentina 30 867 42 826 2.35 4.04 0 0 0.00 0.00 27 780 38 384 1.22 4.17Brazil 28 358 39 424 3.54 2.45 24 25 -30.56 4.47 12 289 18 256 2.65 1.96Chile 202 254 -0.53 3.98 961 1 209 4.44 1.62 10 9 115.95 -1.44Mexico 3 965 4 180 2.61 0.01 564 1 427 10.65 10.02 15 15 12.44 0.08Uruguay 201 555 21.58 2.99 253 251 18.48 7.60 6 5 0.03 -4.95
ASIA and PACIFIC 109 423 133 552 5.44 1.73 24 769 42 049 7.36 5.32 13 762 13 985 4.50 0.00Bangladesh 369 383 2.90 1.18 343 711 11.03 6.94 0 0 0.00 -0.48China2 65 513 80 784 7.08 1.75 1 592 5 847 21.76 17.80 918 128 2.21 -22.04India 19 270 23 074 3.21 1.76 76 80 1.76 -0.23 5 380 6 118 3.67 1.99Indonesia 5 428 6 920 7.57 1.97 3 351 6 365 7.51 6.08 3 329 3 986 7.66 1.20Iran, Islamic Republic of 1 005 1 231 1.86 1.61 2 086 3 051 21.25 4.42 180 104 24.19 -4.24Korea 881 893 -0.80 0.89 3 211 3 811 2.63 1.65 0 0 .. ..Malaysia 3 084 3 832 1.96 1.86 1 104 1 089 5.72 -0.33 2 354 2 573 2.82 0.33Pakistan 3 589 4 599 2.31 2.63 626 1 385 19.22 4.79 142 77 20.40 -3.68Saudi Arabia 29 3 -0.16 0.60 592 857 -1.58 2.29 4 0 7.06 -2.24Turkey 2 522 2 565 3.26 0.54 1 386 3 171 6.72 6.72 183 60 13.89 -6.24
LEAST DEVELOPED COUNTRIES (LDC) 3 148 4 678 0.71 3.49 527 1 035 7.95 7.05 200 682 -1.28 9.66OECD3 82 611 94 257 0.84 1.29 41 942 46 395 1.56 0.90 12 902 16 624 5.78 3.53BRICS 118 813 150 514 5.61 1.99 3 281 7 411 5.97 10.57 19 804 25 408 3.16 1.35

OECD-FAO AGRICULTURAL OUTLOOK 2013 © OECD/FAO 2013 279
ANNEX A
Note: Average 2010-12est: Data for 2012 are estimated.1. Least-squares growth rate (see glossary).2. Includes Israel and also transition economies: Kazakhstan, Kyrgyzstan, Tajikistan, Turkmenistan, Uzbekistan, Armenia, Azerbaijan and
Georgia.3. Refers to mainland only. The economies of Chinese Taipei, Hong Kong (China) and Macau (China) are included in the Other Asia Pacific
aggregate.4. Excludes Iceland but includes all EU27 member countries.Source: OECD and FAO Secretariats.
1 2 http://dx.doi.org/10.1787/888932861434
Table A.13.2. Protein meal projections: ConsumptionMarketing year
CONSUMPTION (kt) Growth (%)1
Average2010-12est 2022 2003-12 2013-22
WORLD 268 898 338 524 3.60 2.06DEVELOPED COUNTRIES 107 329 120 048 0.96 0.84
NORTH AMERICA 36 117 44 062 -0.58 1.12Canada 2 665 2 801 -0.89 0.01United States 33 452 41 261 -0.55 1.20
EUROPE 58 577 62 124 1.55 0.65European Union 51 013 52 500 0.63 0.36Russian Federation 4 201 5 551 10.23 2.85Ukraine 1 056 1 380 16.52 2.79
OCEANIA DEVELOPED 2 912 3 547 14.26 0.89Australia 1 479 1 818 5.92 1.47New Zealand 1 433 1 729 36.58 0.31
OTHER DEVELOPED2 9 723 10 315 1.03 0.76Japan 5 600 5 282 -0.59 -0.12South Africa 1 848 2 231 4.11 1.45
DEVELOPING COUNTRIES 161 569 218 475 5.72 2.81AFRICA 8 841 13 047 4.32 3.62NORTH AFRICA 5 155 7 929 6.84 4.02
Algeria 1 136 1 862 8.14 4.25Egypt 2 329 3 797 6.34 4.51
SUB-SAHARAN AFRICA 3 686 5 118 1.49 3.02LATIN AMERICA and CARIBBEAN 32 186 43 983 5.10 2.80
Argentina 3 044 4 406 20.45 3.03Brazil 15 600 21 105 4.26 2.87Chile 1 149 1 452 3.37 2.17Mexico 4 514 5 592 3.30 1.83Uruguay 448 801 20.17 4.24
ASIA and PACIFIC 120 542 161 446 6.01 2.74Bangladesh 713 1 094 6.15 4.56China3 66 212 86 437 7.51 2.52India 14 152 17 004 3.25 1.73Indonesia 5 401 9 254 7.39 5.13Iran, Islamic Republic of 2 909 4 175 11.16 3.83Korea 4 092 4 704 1.58 1.51Malaysia 1 826 2 342 3.04 2.63Pakistan 4 072 5 903 3.44 3.22Saudi Arabia 617 859 -1.46 2.29Turkey 3 733 5 669 4.24 3.71
LEAST DEVELOPED COUNTRIES (LDC) 3 477 5 031 1.72 3.48OECD4 110 256 124 021 0.69 0.88BRICS 102 013 132 328 6.31 2.46

OECD-FAO AGRICULTURAL OUTLOOK 2013 © OECD/FAO 2013280
ANNEX A
Note: Average 2010-12est: Data for 2012 are estimated.1. Includes Israel and also transition economies: Kazakhstan, Kyrgyzstan, Tajikistan, Turkmenistan, Uzbekistan, Armenia, Azerbaijan and
Georgia.2. Refers to mainland only. The economies of Chinese Taipei, Hong Kong (China) and Macau (China) are included in the Other Asia Pacific
aggregate.3. Excludes Iceland but includes all EU27 member countries.4. Least-squares growth rate (see glossary).Source: OECD and FAO Secretariats.
1 2 http://dx.doi.org/10.1787/888932861453
Table A.14.1. Vegetable oil projections: Production and tradeMarketing year
PRODUCTION (kt) Growth (%)4 IMPORTS (kt) Growth (%)4 EXPORTS (kt) Growth (%)4
Average2010-12est 2022 2003-12 2013-22 Average
2010-12est 2022 2003-12 2013-22 Average2010-12est 2022 2003-12 2013-22
WOLRD 156 234 195 658 4.62 2.01 64 207 78 226 5.66 1.93 64 072 77 321 5.24 1.95DEVELOPED COUNTRIES 39 787 47 722 3.82 1.85 16 455 18 208 4.41 1.24 9 688 11 736 11.90 2.64
NORTH AMERICA 14 922 16 796 1.40 1.17 3 875 3 308 9.57 -2.46 3 997 4 504 10.91 2.12Canada 3 181 3 590 9.39 1.17 262 232 1.96 -1.21 2 564 2 929 13.10 1.87United States 11 740 13 206 -0.09 1.17 3 613 3 076 10.38 -2.55 1 433 1 575 7.44 2.61
EUROPE 21 829 27 485 6.37 2.32 10 218 12 483 3.09 2.84 5 442 6 935 12.67 3.02European Union 14 197 17 164 4.51 1.91 8 209 10 315 2.89 3.42 999 876 2.09 0.19Russian Federation 3 543 4 160 8.26 2.11 944 1 118 0.96 1.80 1 157 1 408 22.23 2.67Ukraine 3 645 5 629 14.58 4.01 326 266 6.02 -3.85 3 080 4 420 17.27 4.00
OCEANIA DEVELOPED 461 622 5.33 2.05 488 524 5.50 1.04 138 195 15.90 2.19Australia 457 617 5.30 2.07 381 416 9.19 1.29 138 194 15.98 2.19New Zealand 5 5 8.98 0.00 107 108 -2.64 0.12 0 0 -0.60 -0.22
OTHER DEVELOPED1 2 574 2 819 -0.27 1.59 1 874 1 894 2.99 -0.78 111 103 5.79 2.15Japan 1 441 1 166 -2.30 -0.95 730 940 2.60 0.51 1 0 9.08 0.00South Africa 398 762 3.41 6.57 786 592 3.32 -2.81 86 77 6.30 2.89
DEVELOPING COUNTRIES 116 447 147 936 4.90 2.07 47 752 60 018 6.13 2.15 54 384 65 585 4.34 1.83AFRICA 5 421 7 213 2.88 2.48 7 322 9 346 6.15 2.83 1 145 645 12.20 -2.66NORTH AFRICA 763 917 7.42 1.66 2 994 3 423 3.44 1.45 419 292 25.61 -1.57
Algeria 83 102 4.26 1.20 560 691 1.04 1.65 34 20 -6.97 -1.62Egypt 433 510 10.71 1.40 1 745 2 174 5.70 2.15 319 219 51.50 -2.11
SUB-SAHARAN AFRICA 4 658 6 297 2.28 2.61 4 327 5 924 8.40 3.72 726 353 9.05 -3.48LATIN AMERICA and CARIBBEAN 21 666 29 507 3.37 2.72 3 913 3 841 4.30 2.00 8 588 11 809 -2.31 4.35
Argentina 8 177 11 516 1.85 3.76 11 13 2.26 -0.11 4 933 7 639 -3.32 5.36Brazil 7 659 10 524 3.78 2.42 397 486 16.82 1.58 1 849 2 912 -4.90 3.95Chile 71 95 -0.05 3.98 309 374 2.27 0.90 3 3 -5.24 -0.66Mexico 1 643 1 772 3.07 0.22 750 927 3.30 4.14 22 0 -15.22 ..Uruguay 83 192 20.32 2.99 80 51 13.04 1.48 2 2 -2.16 -0.62
ASIA and PACIFIC 89 360 111 215 5.43 1.87 36 518 46 831 6.33 2.03 44 651 53 131 5.91 1.41Bangladesh 218 221 4.14 1.00 1 436 2 120 4.16 2.84 0 0 0.00 -0.20China2 21 320 25 733 5.57 1.68 9 101 11 418 3.52 1.60 119 159 -3.93 -0.98India 7 258 8 694 1.72 1.76 9 688 14 665 10.26 3.20 69 99 -11.14 -0.52Indonesia 30 051 38 365 8.80 1.84 74 65 6.93 -0.25 20 969 26 288 8.22 1.64Iran, Islamic Republic of 302 372 1.76 1.66 1 460 1 470 1.81 1.00 189 93 0.29 -0.99Korea 250 256 -0.43 0.82 850 953 6.62 0.71 19 5 13.41 0.00Malaysia 21 080 26 093 3.32 1.97 2 695 2 299 13.01 -1.40 19 510 22 878 4.33 1.42Pakistan 1 321 1 651 4.57 2.45 2 296 2 943 4.31 2.55 113 0 1.09 -46.34Saudi Arabia 11 2 -0.15 0.60 386 581 -0.46 3.39 8 1 -16.64 -3.28Turkey 1 241 1 320 4.12 0.70 1 168 1 391 4.57 1.11 443 399 33.73 -1.09
LEAST DEVELOPED COUNTRIES (LDC) 2 740 3 939 1.78 3.24 4 923 6 599 5.04 2.85 256 130 5.81 -2.10OECD3 34 342 39 311 2.61 1.37 16 832 19 263 4.73 1.58 5 695 6 058 9.27 1.55BRICS 40 177 49 874 4.63 1.94 20 916 28 278 6.26 2.28 3 280 4 655 -0.02 3.21

OECD-FAO AGRICULTURAL OUTLOOK 2013 © OECD/FAO 2013 281
ANNEX A
Note: Average 2010-12est: Data for 2012 are estimated.1. Least-squares growth rate (see glossary).2. Includes Israel and also transition economies: Kazakhstan, Kyrgyzstan, Tajikistan, Turkmenistan, Uzbekistan, Armenia, Azerbaijan and
Georgia.3. Refers to mainland only. The economies of Chinese Taipei, Hong Kong (China) and Macau (China) are included in the Other Asia Pacific
aggregate.4. Excludes Iceland but includes all EU27 member countries.Source: OECD and FAO Secretariats.
1 2 http://dx.doi.org/10.1787/888932861472
Table A.14.2. Vegetable oil projections: Consumption, per capita food useMarketing year
CONSUMPTION (kt) Growth (%)1 PER CAPITA FOOD USE (kg) Growth (%)1
Average2010-12est 2022 2003-12 2013-22 Average
2010-12est 2022 2003-12 2013-22
WORLD 154 876 196 243 4.75 2.02 18.3 20.0 1.82 0.67DEVELOPED COUNTRIES 46 869 54 088 3.00 1.50 24.9 24.4 -0.57 -0.05
NORTH AMERICA 15 163 15 523 1.63 0.08 37.9 32.2 -0.83 -1.01Canada 903 893 0.77 -1.42 23.9 20.8 -1.73 -0.59United States 14 260 14 630 1.69 0.18 39.5 33.5 -0.77 -1.03
EUROPE 26 552 33 024 4.16 2.37 21.8 23.3 -0.76 0.46European Union 21 409 26 597 4.06 2.54 21.9 22.3 -2.74 -0.05Russian Federation 3 267 3 869 3.43 1.80 22.9 27.6 3.59 1.98Ukraine 905 1 474 7.52 2.27 19.4 22.8 7.83 0.64
OCEANIA DEVELOPED 809 946 4.10 1.44 26.4 27.0 0.89 0.26Australia 698 834 5.61 1.63 26.7 27.9 2.00 0.44New Zealand 111 112 -2.41 0.11 25.1 22.8 -3.51 -0.83
OTHER DEVELOPED2 4 345 4 595 1.03 0.59 16.2 16.4 0.26 0.21Japan 2 180 2 093 -0.67 -0.28 17.2 16.9 -0.69 -0.08South Africa 1 105 1 275 3.31 1.35 20.3 22.0 1.44 0.82
DEVELOPING COUNTRIES 108 007 142 155 5.59 2.23 16.7 19.0 2.98 0.95AFRICA 11 557 15 900 4.10 2.97 11.4 12.2 1.57 0.68NORTH AFRICA 3 333 4 039 3.06 1.76 19.7 20.7 1.50 0.52
Algeria 611 772 1.97 1.72 16.8 18.7 0.45 0.57Egypt 1 854 2 458 4.89 2.48 22.2 25.0 3.04 1.02
SUB-SAHARAN AFRICA 8 224 11 861 4.55 3.42 9.7 10.7 1.78 0.93LATIN AMERICA and CARIBBEAN 16 581 21 592 7.59 1.85 19.2 22.3 1.24 0.76
Argentina 3 071 3 959 18.86 1.72 23.4 23.9 -0.31 0.22Brazil 6 035 8 089 8.45 1.75 20.1 26.6 1.26 0.99Chile 375 466 1.62 1.47 21.5 24.6 0.64 0.73Mexico 2 347 2 699 3.39 1.22 20.4 21.1 2.11 0.26Uruguay 161 241 16.94 2.64 16.0 17.7 2.21 0.59
ASIA and PACIFIC 79 869 104 663 5.44 2.20 17.7 20.5 3.61 1.15Bangladesh 1 646 2 337 4.19 2.68 10.8 13.6 2.96 1.56China3 29 828 36 919 4.60 1.64 21.9 26.3 4.06 1.37India 16 919 23 244 6.25 2.66 13.3 16.0 4.61 1.41Indonesia 8 801 12 031 9.75 2.40 19.1 22.3 2.67 1.16Iran, Islamic Republic of 1 544 1 746 1.76 1.27 20.4 21.1 0.58 0.47Korea 1 079 1 204 4.36 0.73 22.3 24.1 3.87 0.45Malaysia 3 912 5 483 3.48 2.68 23.6 26.6 3.16 0.81Pakistan 3 492 4 615 4.58 2.53 19.4 20.3 2.56 0.60Saudi Arabia 392 582 0.52 3.39 13.8 16.7 -2.19 1.50Turkey 1 912 2 307 1.92 1.37 25.5 27.6 0.59 0.40
LEAST DEVELOPED COUNTRIES (LDC) 7 388 10 400 3.72 3.08 8.5 9.5 1.30 0.94OECD4 45 764 52 410 2.86 1.44 26.0 25.1 -0.97 -0.25BRICS 57 154 73 396 5.34 1.97 18.3 21.8 3.80 1.27
OECD-FAO AGRICULTURAL OUTLOOK 2013 © OECD/FAO 2013282
ANNEX A
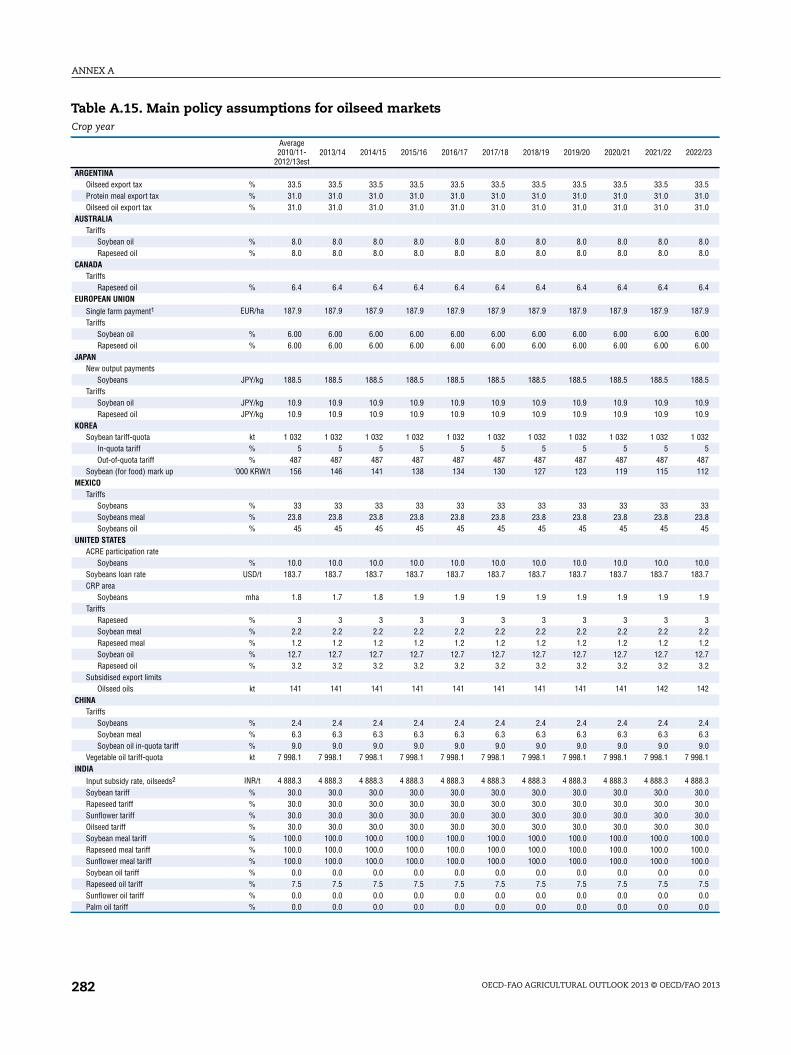
Table A.15. Main policy assumptions for oilseed marketsCrop year
Average2010/11-
2012/13est2013/14 2014/15 2015/16 2016/17 2017/18 2018/19 2019/20 2020/21 2021/22 2022/23
ARGENTINAOilseed export tax % 33.5 33.5 33.5 33.5 33.5 33.5 33.5 33.5 33.5 33.5 33.5Protein meal export tax % 31.0 31.0 31.0 31.0 31.0 31.0 31.0 31.0 31.0 31.0 31.0Oilseed oil export tax % 31.0 31.0 31.0 31.0 31.0 31.0 31.0 31.0 31.0 31.0 31.0
AUSTRALIATariffs
Soybean oil % 8.0 8.0 8.0 8.0 8.0 8.0 8.0 8.0 8.0 8.0 8.0Rapeseed oil % 8.0 8.0 8.0 8.0 8.0 8.0 8.0 8.0 8.0 8.0 8.0
CANADATariffs
Rapeseed oil % 6.4 6.4 6.4 6.4 6.4 6.4 6.4 6.4 6.4 6.4 6.4EUROPEAN UNION
Single farm payment1 EUR/ha 187.9 187.9 187.9 187.9 187.9 187.9 187.9 187.9 187.9 187.9 187.9Tariffs
Soybean oil % 6.00 6.00 6.00 6.00 6.00 6.00 6.00 6.00 6.00 6.00 6.00Rapeseed oil % 6.00 6.00 6.00 6.00 6.00 6.00 6.00 6.00 6.00 6.00 6.00
JAPANNew output payments
Soybeans JPY/kg 188.5 188.5 188.5 188.5 188.5 188.5 188.5 188.5 188.5 188.5 188.5Tariffs
Soybean oil JPY/kg 10.9 10.9 10.9 10.9 10.9 10.9 10.9 10.9 10.9 10.9 10.9Rapeseed oil JPY/kg 10.9 10.9 10.9 10.9 10.9 10.9 10.9 10.9 10.9 10.9 10.9
KOREASoybean tariff-quota kt 1 032 1 032 1 032 1 032 1 032 1 032 1 032 1 032 1 032 1 032 1 032
In-quota tariff % 5 5 5 5 5 5 5 5 5 5 5Out-of-quota tariff % 487 487 487 487 487 487 487 487 487 487 487
Soybean (for food) mark up '000 KRW/t 156 146 141 138 134 130 127 123 119 115 112MEXICO
TariffsSoybeans % 33 33 33 33 33 33 33 33 33 33 33Soybeans meal % 23.8 23.8 23.8 23.8 23.8 23.8 23.8 23.8 23.8 23.8 23.8Soybeans oil % 45 45 45 45 45 45 45 45 45 45 45
UNITED STATESACRE participation rate
Soybeans % 10.0 10.0 10.0 10.0 10.0 10.0 10.0 10.0 10.0 10.0 10.0Soybeans loan rate USD/t 183.7 183.7 183.7 183.7 183.7 183.7 183.7 183.7 183.7 183.7 183.7CRP area
Soybeans mha 1.8 1.7 1.8 1.9 1.9 1.9 1.9 1.9 1.9 1.9 1.9Tariffs
Rapeseed % 3 3 3 3 3 3 3 3 3 3 3Soybean meal % 2.2 2.2 2.2 2.2 2.2 2.2 2.2 2.2 2.2 2.2 2.2Rapeseed meal % 1.2 1.2 1.2 1.2 1.2 1.2 1.2 1.2 1.2 1.2 1.2Soybean oil % 12.7 12.7 12.7 12.7 12.7 12.7 12.7 12.7 12.7 12.7 12.7Rapeseed oil % 3.2 3.2 3.2 3.2 3.2 3.2 3.2 3.2 3.2 3.2 3.2
Subsidised export limitsOilseed oils kt 141 141 141 141 141 141 141 141 141 142 142
CHINATariffs
Soybeans % 2.4 2.4 2.4 2.4 2.4 2.4 2.4 2.4 2.4 2.4 2.4Soybean meal % 6.3 6.3 6.3 6.3 6.3 6.3 6.3 6.3 6.3 6.3 6.3Soybean oil in-quota tariff % 9.0 9.0 9.0 9.0 9.0 9.0 9.0 9.0 9.0 9.0 9.0
Vegetable oil tariff-quota kt 7 998.1 7 998.1 7 998.1 7 998.1 7 998.1 7 998.1 7 998.1 7 998.1 7 998.1 7 998.1 7 998.1INDIA
Input subsidy rate, oilseeds2 INR/t 4 888.3 4 888.3 4 888.3 4 888.3 4 888.3 4 888.3 4 888.3 4 888.3 4 888.3 4 888.3 4 888.3Soybean tariff % 30.0 30.0 30.0 30.0 30.0 30.0 30.0 30.0 30.0 30.0 30.0Rapeseed tariff % 30.0 30.0 30.0 30.0 30.0 30.0 30.0 30.0 30.0 30.0 30.0Sunflower tariff % 30.0 30.0 30.0 30.0 30.0 30.0 30.0 30.0 30.0 30.0 30.0Oilseed tariff % 30.0 30.0 30.0 30.0 30.0 30.0 30.0 30.0 30.0 30.0 30.0Soybean meal tariff % 100.0 100.0 100.0 100.0 100.0 100.0 100.0 100.0 100.0 100.0 100.0Rapeseed meal tariff % 100.0 100.0 100.0 100.0 100.0 100.0 100.0 100.0 100.0 100.0 100.0Sunflower meal tariff % 100.0 100.0 100.0 100.0 100.0 100.0 100.0 100.0 100.0 100.0 100.0Soybean oil tariff % 0.0 0.0 0.0 0.0 0.0 0.0 0.0 0.0 0.0 0.0 0.0Rapeseed oil tariff % 7.5 7.5 7.5 7.5 7.5 7.5 7.5 7.5 7.5 7.5 7.5Sunflower oil tariff % 0.0 0.0 0.0 0.0 0.0 0.0 0.0 0.0 0.0 0.0 0.0Palm oil tariff % 0.0 0.0 0.0 0.0 0.0 0.0 0.0 0.0 0.0 0.0 0.0