october 2011 housing inventory
DESCRIPTION
Local Area Market StatsTRANSCRIPT

Monthly Indicators
October 2011 Quick Facts
A RESEARCH TOOL PROVIDED BY THE HILTON HEAD AREA ASSOCIATION OF REALTORS®
- 1.2%
Change inMedian Sales Price
There's the numbers, then there’s the story behind them. For months, declining inventory has been the national tale to tell. This suggests a changing narrative with different voices. A buyer might tell you that record low mortgage rates and affordable prices made homeownership more attractive than renting. A seller may say that less competition allowed them to receive more of their asking price The moral of the story? Real estate is local both in terms of geography
- 20.2%
Change inInventory
+ 36.6%
Change inClosed Sales
23456789
101112
Click on desired metric to jump to that page.
price. The moral of the story? Real estate is local both in terms of geography and personal circumstance.
New Listings in the Hilton Head region decreased 10.3 percent to 359. Pending Sales were up 34.4 percent to 250. Inventory levels shrank 20.2 percent to 2,925 units, a trend that could indicate a changing landscape.
Prices were fairly stable. The Median Sales Price decreased 1.2 percent to $239,133. Days on Market decreased 4.4 percent to 138 days. Absorption rates improved as Months Supply of Inventory was down 26.6 percent to 12.1 months.
Recent reports from the broader economy have dispelled the story of a double-dip recession. An early reading of gross domestic product (GDP) showed 2.5 percent growth. Meanwhile, national job growth, a major driver of housing demand and price support, has recently strengthened. An increasingly impatient White House has rolled out phase two of the Home Affordable Refinance Program (HARP) for Fannie- and Freddie-backed mortgages. This should help a number of consumers as they write the next chapter.
Months Supply of InventoryInventory of Homes for SaleHousing Affordability IndexPercent of List Price ReceivedAverage Sales PriceMedian Sales Price
All data from the Multiple Listing Service of Hilton Head Island. Provided by the Hilton Head Area Association of REALTORS® and South Carolina REALTORS®. Powered by 10K Research and Marketing. | 1
Closed SalesPending SalesNew ListingsMarket Overview
Days On Market Until Sale

Market Overview
Key Metrics Historical Sparklines 10-2010 10-2011 + / – YTD 2010 YTD 2011 + / –
2,253 + 8.2%
145 138
400 359 - 10.3% 5,184
161 220 + 36.6% 2,083
New Listings
Pending Sales
Closed Sales
Days on Market Until Sale
- 12.9%
186 250 + 34.4% 2,247 2,576 + 14.6%
4,517
- 4.4% 131 139 + 6.5%
Key market metrics for the current month and year-to-date figures.
10-2008 10-2009 10-2010 10-2011
10-2008 10-2009 10-2010 10-2011
10-2008 10-2009 10-2010 10-2011
10-2008 10-2009 10-2010 10-2011
Housing Affordability Index
Inventory of Homes for Sale
125
3,667
136 + 5.6%
--
$347,905 $326,495 - 6.2%
$242,152 $239,133
$323,375 $342,260 + 5.8%
94.2% 94.0%
Months Supplyof Homes for Sale
Median Sales Price
Average Sales Price
Percent of List Price Received
$233,916 $227,750
- 0.3%
- 2.6%
- 0.2% 94.0% 93.7%
All data from the Multiple Listing Service of Hilton Head Island. Provided by the Hilton Head Area Association of REALTORS® and South Carolina REALTORS®. Powered by 10K Research and Marketing. | Click for Cover Page | 2
129
--
-- --
--
--16.5
130 + 4.3%
- 20.2%
- 26.6%
2,925
12.1
- 1.2%
10-2008 10-2009 10-2010 10-2011
10-2008 10-2009 10-2010 10-2011
10-2008 10-2009 10-2010 10-2011
10-2008 10-2009 10-2010 10-2011
10-2008 10-2009 10-2010 10-2011
10-2008 10-2009 10-2010 10-2011

New Listings
MonthPrior Year
Current Year
+ / –
November 409 337 -17.6%
December 350 306 -12.6%
January 454 427 -5.9%
February 515 499 -3.1%
March 676 575 -14.9%
April 621 555 -10.6%
May 482 452 -6.2%
June 516 420 -18.6%
July 502 376 -25.1%
August 522 445 -14.8%
September 496 409 -17.5%
October 400 359 -10.3%
A count of the properties that have been newly listed on the market in a given month.
451
400
359
October
5,189 5,184
4,517
Year To Date
-12.9%-11.3% -10.3% -0.1%
12-Month Avg 495 430 -13.2%
All data from the Multiple Listing Service of Hilton Head Island. Provided by the Hilton Head Area Association of REALTORS® and South Carolina REALTORS®. Powered by 10K Research and Marketing. | Click for Cover Page | 3
2009 2010 2011
200
300
400
500
600
700
800
1-2007 1-2008 1-2009 1-2010 1-2011
Historical New Listing Activity
2009 2010 2011

Pending Sales
MonthPrior Year
Current Year
+ / –
November 183 208 +13.7%
December 184 173 -6.0%
January 185 240 +29.7%
February 199 263 +32.2%
March 263 297 +12.9%
April 279 258 -7.5%
May 232 258 +11.2%
June 226 277 +22.6%
July 256 284 +10.9%
August 209 242 +15.8%
September 212 207 -2.4%
October 186 250 +34.4%
A count of the properties on which contracts have been accepted in a given month.
234
186
250
October
1,924
2,247
2,576
Year To Date
+14.6%-20.5% +34.4% +16.8%
12-Month Avg 218 246 +13.1%
All data from the Multiple Listing Service of Hilton Head Island. Provided by the Hilton Head Area Association of REALTORS® and South Carolina REALTORS®. Powered by 10K Research and Marketing. | Click for Cover Page | 4
2009 2010 2011
50
100
150
200
250
300
350
1-2007 1-2008 1-2009 1-2010 1-2011
Historical Pending Sales Activity
2009 2010 2011

Closed Sales
MonthPrior Year
Current Year
+ / –
November 214 182 -15.0%
December 218 220 +0.9%
January 172 183 +6.4%
February 156 176 +12.8%
March 213 226 +6.1%
April 252 270 +7.1%
May 212 261 +23.1%
June 261 215 -17.6%
July 220 222 +0.9%
August 215 262 +21.9%
September 221 218 -1.4%
October 161 220 +36.6%
A count of the actual sales that have closed in a given month.
231
161
220
October
1,710
2,0832,253
Year To Date
+8.2%-30.3% +36.6% +21.8%
12-Month Avg 210 221 +6.8%
All data from the Multiple Listing Service of Hilton Head Island. Provided by the Hilton Head Area Association of REALTORS® and South Carolina REALTORS®. Powered by 10K Research and Marketing. | Click for Cover Page | 5
2009 2010 2011
50
100
150
200
250
300
1-2007 1-2008 1-2009 1-2010 1-2011
Historical Closed Sales Activity
2009 2010 2011

Days on Market Until Sale
MonthPrior Year
Current Year
+ / –
November 157 141 -10.2%
December 138 136 -1.5%
January 131 133 +1.3%
February 145 156 +7.9%
March 140 143 +2.1%
April 128 152 +18.8%
May 113 133 +17.5%
June 141 158 +12.0%
July 126 140 +11.3%
August 126 110 -12.8%
September 121 137 +13.2%
October 145 138 -4.4%
Average number of days between when a property is listed and when an offer is accepted in a given month.
153145
138
October150
131139
Year To Date
+6.5%-5.0% -4.4% -12.4%
12-Month Avg 142 150 +5.5%
All data from the Multiple Listing Service of Hilton Head Island. Provided by the Hilton Head Area Association of REALTORS® and South Carolina REALTORS®. Powered by 10K Research and Marketing. | Click for Cover Page | 6
2009 2010 2011
95
105
115
125
135
145
155
165
1-2007 1-2008 1-2009 1-2010 1-2011
Historical Days on Market Until Sale
2009 2010 2011
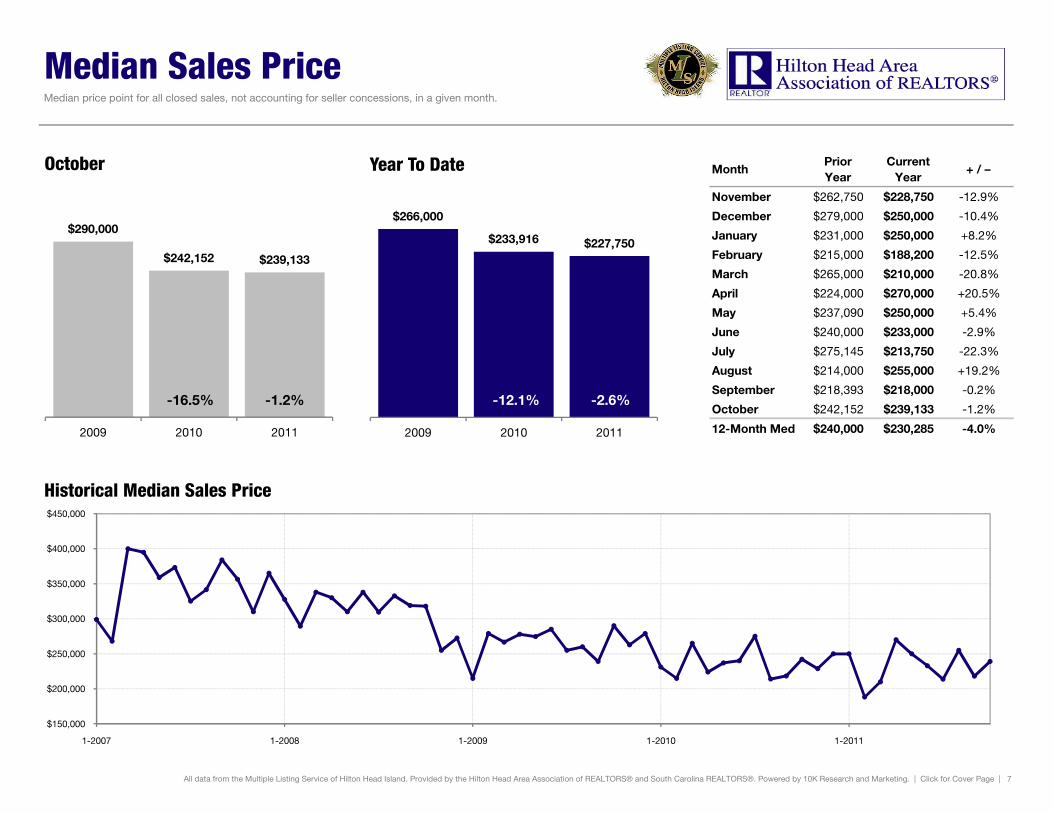
Median Sales Price
MonthPrior Year
Current Year
+ / –
November $262,750 $228,750 -12.9%
December $279,000 $250,000 -10.4%
January $231,000 $250,000 +8.2%
February $215,000 $188,200 -12.5%
March $265,000 $210,000 -20.8%
April $224,000 $270,000 +20.5%
May $237,090 $250,000 +5.4%
June $240,000 $233,000 -2.9%
July $275,145 $213,750 -22.3%
August $214,000 $255,000 +19.2%
September $218,393 $218,000 -0.2%
October $242,152 $239,133 -1.2%
Median price point for all closed sales, not accounting for seller concessions, in a given month.
$290,000
$242,152 $239,133
October
$266,000
$233,916 $227,750
Year To Date
-2.6%-16.5% -1.2% -12.1%
12-Month Med $240,000 $230,285 -4.0%
All data from the Multiple Listing Service of Hilton Head Island. Provided by the Hilton Head Area Association of REALTORS® and South Carolina REALTORS®. Powered by 10K Research and Marketing. | Click for Cover Page | 7
2009 2010 2011
$150,000
$200,000
$250,000
$300,000
$350,000
$400,000
$450,000
1-2007 1-2008 1-2009 1-2010 1-2011
Historical Median Sales Price
2009 2010 2011

Average Sales Price
MonthPrior Year
Current Year
+ / –
November $361,187 $327,176 -9.4%
December $375,862 $310,895 -17.3%
January $329,121 $303,936 -7.7%
February $395,687 $291,285 -26.4%
March $338,453 $328,279 -3.0%
April $352,849 $346,612 -1.8%
May $364,834 $339,727 -6.9%
June $330,841 $353,623 +6.9%
July $401,054 $298,544 -25.6%
August $300,997 $320,250 +6.4%
September $347,477 $322,931 -7.1%
October $323,375 $342,260 +5.8%
Average sales price for all closed sales, not accounting for seller concessions, in a given month.
$394,110
$323,375$342,260
October
$385,470$347,905
$326,495
Year To Date
- 6.2%- 17.9% + 5.8% - 9.7%
12-Month Avg $351,468 $325,257 -7.5%
All data from the Multiple Listing Service of Hilton Head Island. Provided by the Hilton Head Area Association of REALTORS® and South Carolina REALTORS®. Powered by 10K Research and Marketing. | Click for Cover Page | 8
2009 2010 2011
$250,000
$300,000
$350,000
$400,000
$450,000
$500,000
$550,000
$600,000
$650,000
1-2007 1-2008 1-2009 1-2010 1-2011
Historical Average Sales Price
2009 2010 2011

Percent of List Price Received
MonthPrior Year
Current Year
+ / –
November 93.0% 92.4% -0.7%
December 93.2% 93.2% +0.0%
January 93.5% 92.8% -0.8%
February 94.3% 93.8% -0.5%
March 93.8% 93.2% -0.7%
April 94.2% 93.8% -0.5%
May 94.9% 93.5% -1.4%
June 94.7% 94.3% -0.5%
July 93.5% 93.6% +0.1%
August 93.4% 94.2% +0.8%
September 93.4% 94.2% +0.8%
October 94.2% 94.0% -0.2%
Percentage found when dividing a property’s sales price by its last list price, then taking the average for all properties sold in a given month, not accounting for seller concessions.
93.7% 94.2% 94.0%
October
93.3% 94.0% 93.7%
Year To Date
-0.3%+0.5% -0.2% +0.7%
12-Month Avg 93.8% 93.6% -0.3%
All data from the Multiple Listing Service of Hilton Head Island. Provided by the Hilton Head Area Association of REALTORS® and South Carolina REALTORS®. Powered by 10K Research and Marketing. | Click for Cover Page | 9
2009 2010 2011
90%
91%
92%
93%
94%
95%
96%
1-2007 1-2008 1-2009 1-2010 1-2011
Historical Percent of List Price Received
2009 2010 2011

Housing Affordability Index
MonthPrior Year
Current Year
+ / –
November 111 132 +19.2%
December 101 120 +18.9%
January 122 117 -4.1%
February 130 149 +14.6%
March 108 136 +26.1%
April 125 111 -11.7%
May 119 120 +1.0%
June 121 129 +7.0%
July 109 139 +26.8%
August 138 122 -11.1%
September 136 142 +4.8%
This index measures housing affordability for the region. An index of 120 means the median household income was 120% of what is necessary to qualify for the median-priced home under prevailing interest rates. A higher number means greater affordability.
100
125130
October
108
129136
Year To Date
+5 6%+25 2% +4 3% +19 4%October 125 130 +4.3%
12-Month Avg 120 129 +8.0%
All data from the Multiple Listing Service of Hilton Head Island. Provided by the Hilton Head Area Association of REALTORS® and South Carolina REALTORS®. Powered by 10K Research and Marketing. | Click for Cover Page | 10
2009 2010 2011
60
80
100
120
140
160
1-2007 1-2008 1-2009 1-2010 1-2011
Historical Housing Affordability Index
2009 2010 2011
+5.6%+25.2% +4.3% +19.4%

Inventory of Homes for Sale
MonthPrior Year
Current Year
+ / –
November 3,660 3,514 -4.0%
December 3,410 3,223 -5.5%
January 3,406 3,157 -7.3%
February 3,524 3,170 -10.0%
March 3,718 3,229 -13.2%
April 3,793 3,307 -12.8%
May 3,803 3,295 -13.4%
June 3,828 3,213 -16.1%
July 3,789 3,115 -17.8%
August 3,788 3,082 -18.6%
September 3,779 3,061 -19.0%
October 3,667 2,925 -20.2%
The number of properties available for sale in active status at the end of a given month.
3,753 3,667
2,925
October
-20.2%-2.3%
12-Month Avg 3,680 3,191 -13.2%
All data from the Multiple Listing Service of Hilton Head Island. Provided by the Hilton Head Area Association of REALTORS® and South Carolina REALTORS®. Powered by 10K Research and Marketing. | Click for Cover Page | 11
2009 2010 2011
1,000
1,500
2,000
2,500
3,000
3,500
4,000
4,500
1-2007 1-2008 1-2009 1-2010 1-2011
Historical Inventory of Homes for Sale

Months Supply of Inventory
MonthPrior Year
Current Year
+ / –
November 20.5 16.1 -21.2%
December 18.5 14.7 -20.7%
January 17.8 14.4 -19.2%
February 18.1 14.2 -21.5%
March 18.6 14.1 -24.2%
April 18.3 14.3 -22.1%
May 17.8 14.3 -19.4%
June 17.8 13.8 -22.1%
July 17.4 13.2 -24.3%
August 17.0 12.9 -24.0%
September 17.0 12.7 -25.5%
October 16.5 12.1 -26.6%
The inventory of homes for sale at the end of a given month, divided by the average monthly pending sales from the last 12 months.
22.2
16.5
12.1
October
-26.6%-25.5%
12-Month Avg 17.9 13.9 -22.5%
All data from the Multiple Listing Service of Hilton Head Island. Provided by the Hilton Head Area Association of REALTORS® and South Carolina REALTORS®. Powered by 10K Research and Marketing. | Click for Cover Page | 12
2009 2010 2011
0
5
10
15
20
25
30
1-2007 1-2008 1-2009 1-2010 1-2011
Historical Months Supply of Inventory