o~clw - ntrs.nasa.gov
TRANSCRIPT

DEVELOPMENT OF A STERILIZABLE RUGGEDIZED VIDICON FOR
LUNAR AND PLANETARY PHOTOGRAPHY '
Interim Technical Report '
Period Covered
2 1 May 1965 through 2 1 August 1966
Contract No. 950985
Prepared for
California Institute of Technology
4800 Oak Grove Drive Pasadena, California
/ JET PROPULSION LABORATORIES
Prepared by
S A O~ClW S . A. Ochs Project Engine e r
Approved by
Approved by a 3,LLt\b* .lel.f+
F. D. Marschka Project Supervisor
e R'. W. Endstrom' Manager, Advanced Development
Prepared by
Electronic Components and Devices I RADIO CORPORATION OF AMERICA
Industrial Tube and Semiconductor Division . Lancaster, Pennsylvania
September 1966 .
....

a . - '
Foreword
This report was prepared by Radio Corporation of America, Electronic Components and Devices , Industrial Tube and Semiconductor Division, Lancaster, Pennsylvania, under JPL Contract No. 950985. The J P L Project Engineers were L. Ralph Baker and Henry Canvel.
This Interim Report covers the period from May 21, 1965 to August 21, 1966. Tube Operations, D. W. Epstein, Manager, Advanced Development Section, R . W. Engstrom , Manager. F. D. Marschka was the Project Supervisor and S. A . Ochs the Project Engineer. The following engineers also contri- buted to the work described in this report: J. L. Rhoads, J. G . Ziedonis, W. M. Kramer, R . L. Blazek and J. A. Zollman. The fabrication and testing of components and tubes was done with the assistance of D. D. Neuer.
The work was performed in Conversion
.
TABLE O F CONTENTS
I.
11.
111.
IV.
V.
Task I
PHOT OC ONDUCTOR DEVELOPMENT
STERILIZATION AND DECONTAMINATION
TESTING
A. Dark Current Vs. Target Voltage B. Signal Current Vs . Target Voltage C . Light Transfer Characteristic D. Spectral Characteristics E. Re solution F. Grey-Scale Rendition G. Erasure
EXPERIMENTAL RESULTS
A. Dark Current B. Sensitivity C . Light Transfer Characteristics D. Spectral Response E, Re solution F. Gray-scale G. Erasure
DISCUSSION
Page
1
2
3
3 % 3 4 4 4 4 4
5
5 1 5 15 19 19 23 23
23
e

T A B L E O F C O N T E N T S
Task I1
I. DESIGN
Page
28
11. MANUFACTURE OF TUBES 3 3
111. ENVIRONMENTAL TESTING AND FAILURE ANALYSIS 38
IV. PERFORMANCE 50 8- .
v. SUMMARY AND CONCLUSIONS 53

LIST OF FIGURES
Page F i g u r e
1 Distr ibut ion of Tubes in T e r m s of Dark Cur ren t Af te r Ster i l izat ion t o Ini t ia l Dark Cur ren t 10
. 2 Distribution of Tubes in T e r m s of
In i t ia l D a r k C u r r e n t 11 : . LF Dark Curren t Af te r Ster i l izat ion t o
Semilog Plot of Dark C u r r e n t (of F ive Tubes) V s . T e m p e r a t u r e 13
3
4 Semilog Plot of Dark C u r r e n t (of T h r e e Tubes) Vs . T a r g e t Voltage, Before and Af ter Dry-Heat S te r i l i - zat ion 14
Distribution of Tubes in T e r m s of Sensit ivity (Signal C u r r e n t a t 1 . 0 f t - cd T a r g e t Illumination) Af te r S te r i l i za t ion to Ini t ia l Sensit ivity 1 6
. '8
5
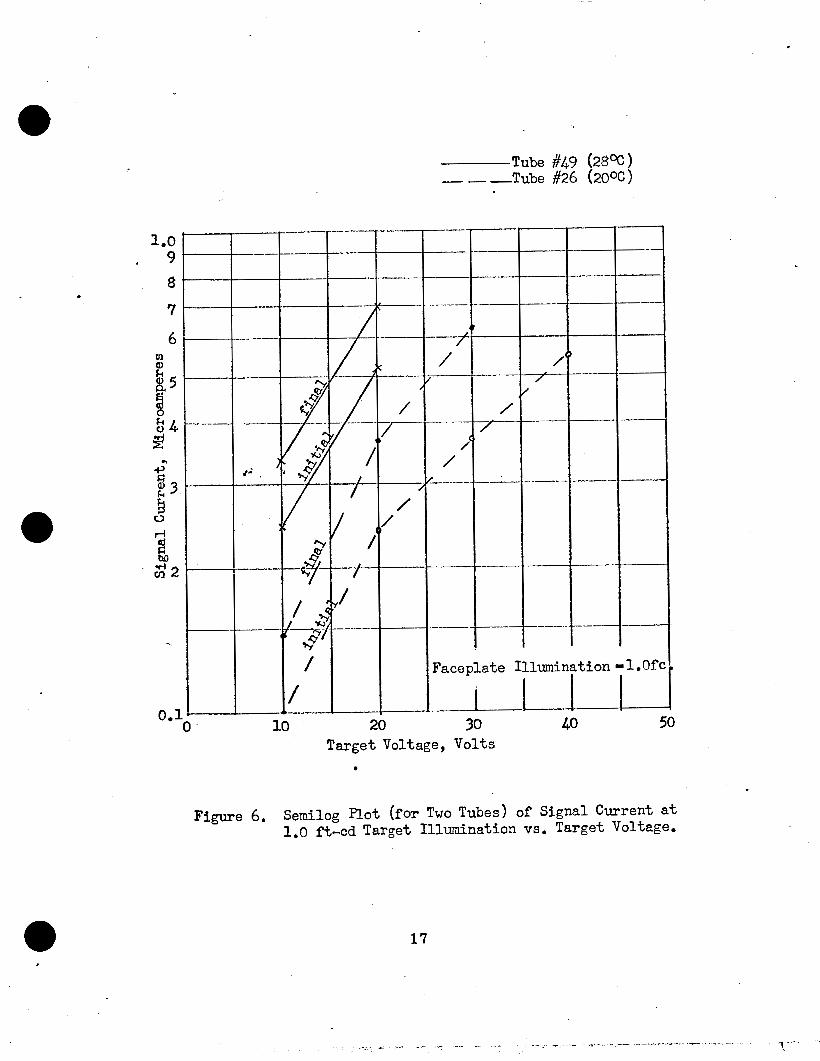
6 Semilog Plot ( fo r Two Tubes) of Signal Curren t a t 1 . 0 f t -cd T a r g e t I l lumination Vs . T a r g e t Voltage 1 7
7 Distribution of Tubes , Before and Af te r Ster i l izat ion, in T e r m s of G a m m a 18
Light T r a n s f e r Curve of Tube No. 22 8 at Slow-Scan Rate 20
9 Average Spec t ra l Response (of 11 . Tubes) Before and After S te r i l i za t ion 21
10 Distribution of Tubes , Before and After Ster i l izat ion, in Terms of Re solution 22
11 Distribution of Tubes , Before and Af ter Ster i l izat ion, in T e r m s of Gray- Scale Rendition ' 24
n

LIST OF FIGURES (CONT'D. )
Figure
12
13
14
15
16
17
18
19
20
2 1
22
' 23
24
25
26
. 27
28
Distribution of Tubes, Before and After Sterilization, in Terms of Residual Signal at Third Scan After Removal of Light
Semilog Plot of Average Dark Current and Average Signal Current at 1.0 ft-cd Faceplate Illumination V s . Target Voltage, Before and After Sterilization
External and Cross Sectional View of Complete (Unpotted) Ceramic Vidicon
Ceramic Vidicon
Cross Sectional View of Gun Section of Ceramic Vidicon
Ceramic Cathode Structure
External View of Ceramic Vidicon a s Potted in Magnetic Shield
Centrifuge for Constant Acceleration Test
Vibration Test Unit
High Acceleration Shock Machine and Detail of Drop Table (with holding fixture)
Oscilloscope Trace of Typical Shock Pulse
Heater Test Assembly
Dark Current Vs. Target Voltage for Ceramic Vidicon
Signal Current Vs. Target Voltage for Ceramic Vidicon
Signal Current Vs. Faceplate Illumination for Ceramic Vidicon
Spectral Response of Ceramic Vidicon
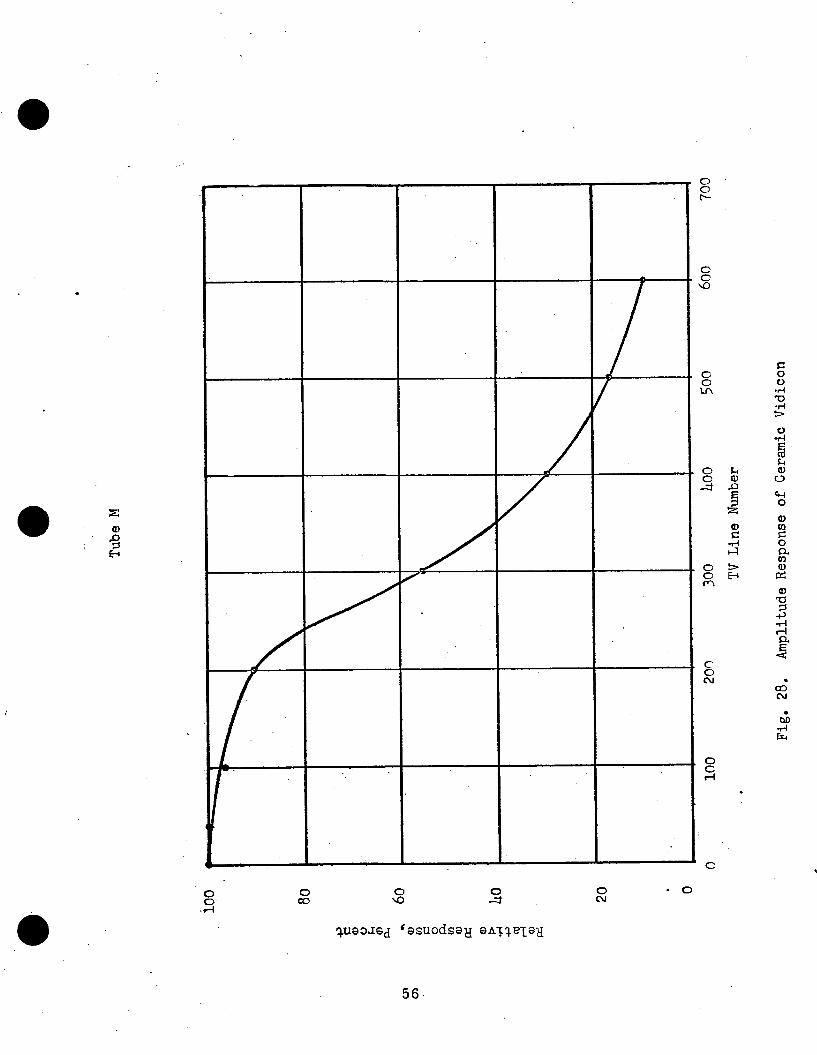
Amplitude Response of Ceramic Vidicon
..'.
Page
25
27
29
30
32
34
35
39
40
42
43
47
5 1
54
55
56

ABSTRACT
A one inch vidicon was developed which can withstand ethylene-oxide and dry-heat sterilization as well as exposure to severe shock and vibration. a cergmic’metal modular construction and is potted in a magnetic shield. deflection a r e employed. through the sterilization treatment and environmental testing. resolution of over 500 TV lines having been observed.
The tube has
Electrostatic focusing and Tubes successfully passed
Electrical performance is encouraging with
.

Ob j e c t iv e
The first phase of Contract No. 950985 covered a 15-month research and development project for a sterilizable, ruggedized vidicon. 10-month program for developing a photoconductor suitable for us-e. inLthis camera tube. of Task I was to develop and demonstrate a photoconductor capable of giving satisfactory performance after having under- gone the required dry-heat sterilization and gas decontami- nation compatibility tests.
Task I of this contract comprised a
More specifically, the objective
The objective of Task I1 is to build a tube which incorporates the photoconductor developed in Task I and which is ruggedized to withstand the vibration and shock environment of a missile launch and the impact shock of a landing spacecraft. .

Task I
:I. PHOTOCONDUCTOR'DEVELOPMENT ~-
The development of a sterilizable slow-scan photoconductor followed the general outline presented in proposal DP 5132 a s amended.
The substrate used consisted of vitreous quartz of extremely high quality as far a s surface defects were concerned. The faceplates were selected according to their freedom from visible imperfections when viewed by microscope of 30X magnification under light of grazing incidence. Although the inspection criterion w a s a complete absence of visible imperfections, few substrates in actual fact met this specification.
The initial tubes made on this project were already very promising a s fa r as general performance and 're$st-ance to dry-heat sterilization were con- cerned. grey and black spots were visible in the television picture and appeared to be caused by imperfections in the photoconductor layer. this problem included: the photoconductor evaporation, (2) improved filtering of the inert gas which is admitted to the system upon completion of the evaporation, (3)' shortening the time during which the photolayer is exposed to a i r before exhaust of the tube on which it is mounted, and (4) improved faceplate preparation. all of these measures may have contributed to the reduction of spurious signals, it became increasingly clear during the course of the project that the chief source of spottiness lay in the faceplate cleaning procedures.
However, they showed up a serious problem of spottiness. White,
Attempts at removing (1) improvement of the vacuum conditions during
Although
Repeated re-evaluation and improvements of the faceplate washing and drying procedures resulted in a very substantial reduction of spottiness. Although this problem cannot be considered a s having been completely solved, spurious signals were reduced to the point where they a re only of secondary importance.
No evidence w a s observed of any increase in spottiness due to the sterilization procedures .
The final faceplate cleaning procedure decided upon consisted of the following steps: (1) flash substrates in a water solution of Alconox detergent by swabbing with cotton balls, (2) Rinse substrates in hot deionized water and, then, in cold deionized water, (3) 7Fallow:I.with: a closely controlled rinsing and drying procedure in a vapor dryer charged with isopropyl alcohol. . The degree of cleanliness of the substrates at this stage w a s preserved a s closely a s possible until the faceplate w a s loaded in the evaporator. It is- not likely that any appreciable contamination could occur during this interval since the cleaning facilities and the evaporator a r e both located in the same clean room.

The evaporations were performed in a dry pumping system evacuated by sorption and ion pumps without the use of organic vapors. was designed such that the signal electrode and the photoconductive layer could be deposited without breaking vacuum. substrate was not exposed to a i r from the time it was loaded into the evaporator to completion of the photosurface. Therefore , the possibility of contamination occurring between the signal plate and the photoconductor w a s minimized.
The jigging
Because of the above, the
The application of glow-discharge cleaning w a s evaluated. that this process was not needed for producing the desired photoconductor characteristics o r for good layer adherence to the substrate. discharge cleaning was considered a s the possible cause of some gross spots found in early tubes, it was decided not to continue to use this cleaning method any further.
It appeared
Since glow- '
The signal electrode (back plate) used in all tubes consisted of rhodium which was evaporated from a rhodium-plated tungsten-wire heater. resistance of the signal electrodes, a s monitored on test slides, varied between 90K and 900K ohms per square. be independent of variations in signal-electrode resistance so long a s the resistance w a s below one megohm per square. of a rhodium coating a s used in this work is approximately 65 to 70% relative to airJ.-.
The photolayer used .was of the RCA developed ASOS type. performance changed so little with the sterilization bakes, an elaborate program of photoconductor development was not necessary. modification in the evaporation schedule was made (at tube No. 11) in order to effect a slight decrease in dark current, although it does not appear that an appreciable change was caused. evaporations were made using essentially the same evaporation profile.
The finished faceplates were removed from the evaporator, inspected optically and then mounted in RCA 7735A vidicons. These commercial tubes a r e 1" vidicons with magnetic focus and deflection. Their heater operates a t 6 .3 volts and 0 . 6 amperes.
The
Tube performance appeared to
The optical transmisssion
Since electrical
Only a minor
Except for this small adjustment, all
11. STERILIZATION AND DECONTAMINATION
Dry-heat sterilization of the experimental tubes was performed in accordance with J P L Spec. XSO-30275-TST-A, "Environmental Test Specification Compatibility Test for Plan&ary Dry-Heat Sterilization Requirements.
The vidicons were baked in an electrically-heated air-tight chamber provided with a dry nitrogen atmosphere. Up to 8 tubes were treated simultaneously. The tubes rested on Teflon supports inside a stainless steel box which was placed in the heating chamber. The temperature w a s monitored by two or
I t
2

three chromel-alumel thermocouples, which were usually placed in contact with the faceplate rings of different tubes. A separate thermo- couple placed in contact with the stainless steel box w a s connected to a Brown Electronik recording controller which regulates the electric power for heating the chamber.
During a typical heating cycle, the temperature of the experimental tubes was raised to 145OC plus o r minus 2OC and maintained there for 36 hours. A t the end of the cycle the tubes were allowed to stabilize at room temperature. In all cases , several hours o r days elapsed between heating cycles.
For the ethylene-oxide decontamination, tubes were placed in the air-tight chamber and exposed to an atmosphere containing twelve percent ethylene- oxide and 88 percent Freon 12, by weight. The relative humidity was con- trolled a s per paragraphs 3 . 5 and 3 . 6 . 1 of JPL Specification GM050198-ETS. The temperature was kept at 4OoC and monitored as described above. The required amount of water was metered with a pipette and injected into the chamber through a stopcock. for 24 hours.
The vidicons exposed to this test were treated
111. TESTING
The vidicons ,were. tested at standard television rate, 60 fields per second. interlaced, with 525 lines per' frame. height was scanned.
A ras te r of 0.48" width and 0 .36" The following measurements were made:
- . - L - 7 ' - - ! A ~ A . Dark Current V s ...T arget Voltage I . :: 1 -:I, . '-* .If . - 2
Readings were taken at successively higher values of target voltage (usually to 60V). until it was just able to discharge the target surface. The current w a s measured with a Keithley 414 micro-microammeter. slow response of the meter, it took considerable time for equilibrium to be established at any given target voltage. In order to obtain mean- ingful results within a practical time, all dark current readings were taken one minute after the target w a s f irst discharged at the particular target voltage in question.
For each reading, the electron beam was increased
Due to the
The temperature of the faceplate was found to be an important parameter influencing d a r k current. temperature was monitored with a thermocouple and attempts were made to keep the faceplate dt a constant temperature by means of a flow of cooled air.
Therefore, in many tes ts , the faceplate
B. Signal Current V s . Target Voltage
The sensitivity of the photoconductor was measured in t e rms of the signal current due to a faceplate illumination of one footcandle. were taken at different target voltages increasing in steps of lOV, as long a s sufficient electron beam w a s available.
Readings
. '

C . Light Transfer Characteristic
Signal current was measured a s a function of faceplate illumination (at intensities of 0.01, 0.10 and 1.0 footcandle) with the faceplate at 20V. characteristic when plotted on log-log coordinates, was then measured.
The gamma of the photoconductor, i. e. the slope of the
D. - SDectral Characteristics
The tube was operated at a target voltage of 20V and the uniform target illumination adjusted to the value yielding a signal current of 0.200 uA. Narrow band optical filters were then interposed between the light source and the target, and the corresponding signal current w a s measured for each wavelength. A correction factor was then applied to each measurement to make allowance for the brightness of the tungsten light source at the wavelength in question and for the transmission of the particular filter used.
E . Resolution
A EIA resolution pattern was projected onto the faceplate. With the target at 20V, the light intensity was varied until a signal current of 0.200 uA was produced. it was just able to discharge the highlight portions on the target.
The beam was decreased in magnitude until
The ultimate resolution was measured in the central region of the target and at the corners. In some cases, the beam focus was read- justed between these two readings so a s to give optimum resolution. This procedure was adopted since the resolution capability of the photoconductor, rather than that of the beam, was desired.
F. Grey-Scale Rendition r
The dynamic range of the tubes was measured in t e rms of the number of grey-scale steps which could be recognized on the EIA resolution pattern. ment of resolution.
The same operating parameters were used as for the measure-
G . Erasure
The erase characteristics of the tubes were measured in t e rms of the signal remaining at the third scan after the removal of uniform illumination. voltage, usually 20V, and the light intensity adjusted such that the signal current w a s 0 .200 uA. The lower half of the faceplate was then masked so that a reference black level signal w a s produced.
. The tube was operated at a pre-determined target
4

A chopper, located between the light source and the tube, interrupted the light for one-third of a second every second. The signal output was displayed on an oscilloscope and the lag measured in t e rms of the signal produced at the third scan after the light had been interrupted.
a . IV. EXPERIMENTAL RESULTS
A total of fifty-one vidicons were made. Six of these did not receive the three sterilization cycles and final test: One (#11) had too many spots to be useful; three (#15,22,23) were overheated during the sterilization procedure so that the indium faceplate seal melted and vacuum was lost; the glass bulbs of two tubes (#27, 47) cracked during the second bake cycle.
Table I shows some of the data obtained from these fifty-one tubes. be seen that the changes in the various characteristics caused by the dry- heat sterilization procedure a r e f a r from consistent and a re relatively small compared to the variations from tube to tube. However, certain significant features emerge quite clearly and provide a basis for predicting the effect of the sterilization process on any given tube.
It can
A . Dark Current
Dark current, at a fixed target voltage, was considered the tube char- acteristic which would be most susceptible to change under the steri l i- zation procedure. Table I1 shows the distribution of 45 vidicons a s to change in dark current at two target voltages. ratio
At each value of the
Dark Current after Sterilization Initial D a r k Current
the number of tubes is given for which this ratio w a s obtained. same data a re displayed graphically in Figs. 1 and 2, for target voltages of 20V and 30V, respectively. Here the abscissas represent the dark current ratio, divided into segments of width 0 .3 . the segment marked 1 .7 includes the values of the dark current ratio in the range from 1. 55 to 1.85. tubes belonging to each segment. approximate this distribution of the experimental tubes.
The 4-
F o r instance,
The ordinates indicate the number of Smooth curves were drawn which
*The dark currents of tubes No. 25 and 26 at Et = 20V were s o small that , theLmeasurements were very inaccurate. The entries for these two
tubes in Fig. 1, therefore, were hsedon the dark currents measured at Et = 30V.
5

a .
H
l-l al P cd t-l
I4 cd c
.rl
F4 cd
c E
m * m t ' O r ' m O N m 4 N C D c o O t ' N m a 3 ( D C o k W t ' W t ' 0 3 C D W r ' r ' C D C D t ' t ' t ' C D W . . . . . . . . . . . . . . . . . . . 0
bl-l
m 0 0 0 N m m d m C D ~ m 0 0 o o C D * t ' * ~ ~ :/ m C D t ' t ' r ? C D r ' r ' C D C D o C D . r ' r - t ' r ' W t ' r - t ' P ? . . . . . . . . . . c: . . . . . . . . . H O -~ W
cd m P
s 0 co
s 0 co
d co
0 co
r' r' n
0 m II
3
i Y Y
0 co
n
0 m
I I
3
w' W * PI
0, r?
CD t'
N r'
0 co 4 co CD
t' N co 0
03
m r-
0 a3
0-l r'
N co
W r'
0 co
co t'
0 a3
0 co
4 co
(D co
2 m o 4 0 M M
o o m m m o o o o d c v w m m o
2 r ' o 0 M m O O C D m m . . . . . . . . . . . . . . . . . .
4 m r ' o w 4 & G * * m m o a
4 4 - 4 4 0 3 . 4
c v o r ' o o o m o m M ( D l . n * m o t ' m r ' N m c . . . . . . . . . . . . . . . . . . . . . . * m C D M c o d * N c * m r ' m CD cv O M C - W L
4

c 0 u
W
H
0
cd E f t3
rn a Q)
rn -P
o o o o o o o o m o o o o m o o o 4 4 4
co .a 0 4 + 4 4 l + - - 4 4 4 4 4 4 4 4
rn a 0 + v1 t ? c o F o o o o o o o o o o o o c o o m o o o o
4 4 4 4 4 4 4 4 4 4 4 4 4 4 4 4 4
0 0 * O F c o c o c o c o c o s
A cd
k H
. . .d d
0 0 0 0 m .o m 0 0 0 0 0 0 0 0 0 0 o m 0 o F o N o o o m m m o m o o m m w w m m m m m w w m * m m w m
o o m o m m m m m
rn
m o o o o o o o o o o o m o o o m o o N m 0 0 m 0 0 m 0 m 0 0 N m O O N m O m d c m a a w a m m m m a m m m w m *
0 0 0 m m m m m *
7

l 4
cd c I;:
cd
m 4 m m f - 0 E D P r - w w f - . . . . . .
a . d C J 4 5 l c n * M w * f - c c w w w w . . . . . . .d c k
0 tn a, v)
5l
+-.
0 4
0 d
0 4 P 0
d 0 4
v) a, c ;rl
0 u Y
H
h 5 I;:
In cv m
In 0 0 Eo
0 0 CJ
In cv M
CJ In
a, P rd
l-l
I+ l4
.d cd
0 0 *
0 In In
In f- *
in f- In
0 0 M
0 In
0 0 co *
a3 cn ED
f- In In
. 5l d In -
a3 In’ . F I N O
r- w . . . ‘ a 3 0 0
M r n d

Table I1
Distribution of 45 Tubes in Te rms of - Dark-Current R.atio
Dark Current After Sterilization Initial Dark Current
0 . 7 . 0 .8
0 . 9 1 . 0 1.1 1 ..2 1 . 3 1 . 4 1 . 5 1 . 6 1 . 7 1.8 1 . 9 2 . 0 2 . 1 2 . 2 2 . 3 2 . 4 2 . 5 2 . 6 2 . 7 2 . 8 2 . 9 3 . 0 3.1 3 . 2 3 .3 3 . 4 3 . 5 3. 6' 3.7 3.8 3.9 4.0
4 . 8 5.0 5 .1 5 . 2 6.1
.
i'u'uniber of Tubes Et = 20V Et = 30V
1 2 2 3 2 1 3 4 3 1 3 2 0 1 3 2 2 1 2 1 0 0 . 0 0 0 1 0 0 0 1 0 0 0 1
0 2 0 . 1 1 . 1 1 2 2 6 5 1
'3 ' 4
3 1 2 1 2 0 0 0 1 0 0
* o 1 0 1 0 0 0 1 0
0 0 1 0 2
. 9

a
-. - P- -
1 ! i
I
I---- i
i
c

11
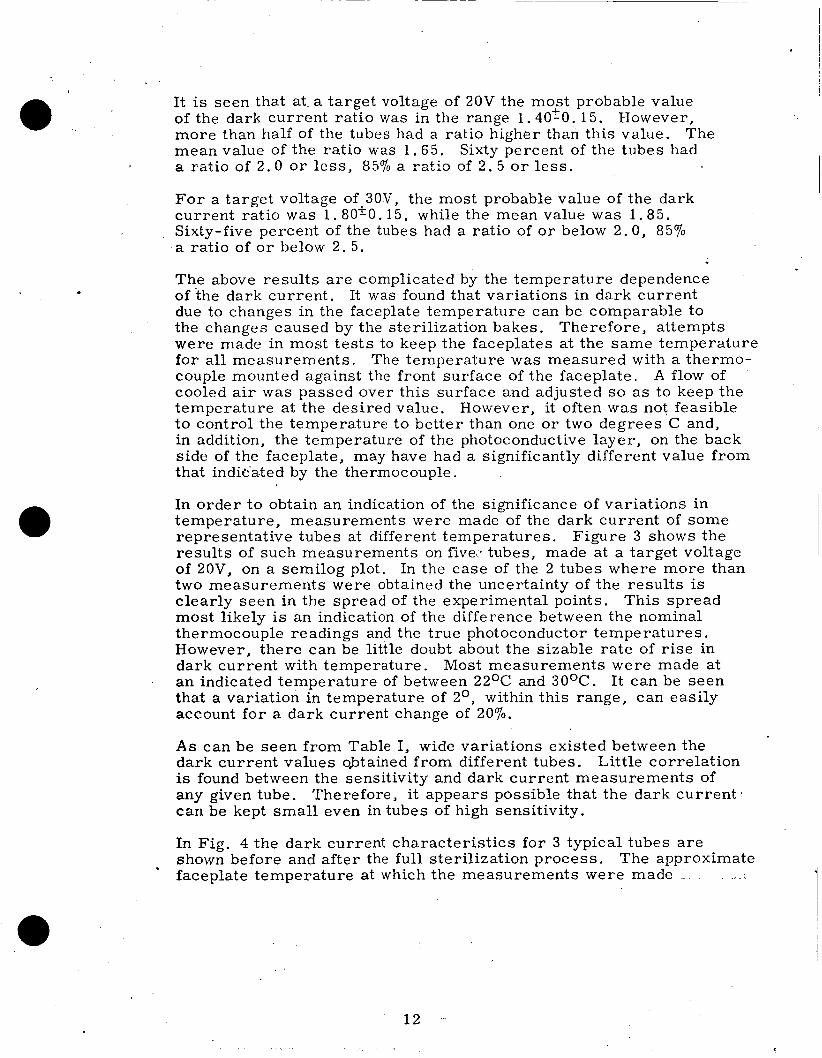
It is seen that a t -a target voltage of 20V the most probable value of the dark current ratio was in the range 1.40tO. 15. However, more than half of the tubes had a ratio higher than this value. mean value of the rat io was 1.65. Sixty percent of the tubes had a ratio of 2.0 o r lcss , 857" a ratio of 2 . 5 or l ess .
The
For a target voltage of 30V, the most probable value of the dark current ratio was 1.80*0.15, while the mean value was 1.85. Sixty-five percent of t h e tubes had a ratio of o r below 2 . 0 , 85% a ratio of o r below 2 .5 .
The above results a r e complicated by the temperature dependence of the dark current. due to changes in the faceplate temperature can be comparable to the changes caused by the sterilization bakes. Therefore, attempts were made in most tes t s to keep the faceplates at the same temperature for all measurements. couple mounted against the front surface of the faceplate. cooled a i r was passed over this surface and adjusted so a s to keep the temperature at the desired value. However, it often w a s not feasible to control the temperature to better than one o r two degrees C and, in addition, the temperature of the photoconductive layer, on the back side of the faceplate, may have had a significantly different value from that indic-ated by the thermocouple.
It was found that variations in dark current
The temperature w a s measured with a thermo- A flow of
In order to obtain an indication of the significance of variations in temperature, measurements were made of the dark current of some representative tubes at different temperatures. Figure 3 shows the results of such measurements on five,. tubes, made at a target voltage of 20V, on a semilog plot. In the case of the 2 tubes where more than two measurements were obtained the uncertainty of the results is clearly seen in the spread of the experimental points. most likely is an indication of the difference between the nominal thermocouple readings and the true photoconductor temperatures. However, there can be little doubt about the sizable rate of r i se in dark current with temperature. Most measurements were made at an indicated temperature of between 22OC and 3OoC. It can be seen that a variation in temperature of 2O, within this range, can easily account fo r a dark current change of 20%.
This spread
As can be seen from Table I, wide variations existed between the dark current values obtained from different tubes. is found between the sensitivity and dark current measurements of any given tube. can be kept small even in tubes of high sensitivity.
Little correlation
Therefore, it appears possible that the dark current .
In Fig. 4 the dark current characterist ics for 3 typical tubes a re shown before and after the ful l sterilization process. The approximate
1 faceplate temperature at which the measurements were made .. -
12

a 5
4
3
2
v1 c 0
8
5
4
3
.@02
A- . C21106 7 (227158
I117
i
.I
Temperature, Degrees c
Figure 3. Semilog Plot of Dark Current (of Five Tubes) VS. Temperature. Target Voltage = 20 V.
13

l * O 9 . 8 7
4~ I
3.
2
0.1 9 8 7 6 5
4
3
2
01 9 8 7 6 5
4
3
2
.001 60 Target voltage, V.
Figure 4.. Semilog Plo t of Dark Current (of three tubes) vs. Target Voltage, Before and After Dry-Heat S t e r i l i z a t i o n .
14

fo r each tube is indicated. after the first and second sterilization bakes also a re given. In general it was found that the increase in dark current due to the f i rs t bake was greater than for the subsequent bakes.
The results reported above suggest that for any given tube it is likely that sterilization will cause an increase in dark current constant target voltage of less than 10070.
For one tube (#14), the results obtained
at
B. Sensitivity
C.
In general, the sensitivity of the photoconductor chosen for this project was found to increase as a result of the dry-heat sterilization, but by a smaller percentage than the dark current. graphical presentation of the distribution of 44 vidicons as to change in signal current at 20V target voltage, for uniform illumination of one footcandle intensity. sterilization, to initial sensitivity, as well as the mean value of this ratio,according to these results is about 1. 25.
Although temperature changes of the faceplate caused some cor res - ponding variations in signal current, these represented a much smalleg peryentage change than the corresponding effect with dark current. . In the case of one tube in which the faceplate temperature was changed from 23OC to 3OoC, at one footcandle illumination and 20V target voltage, the signal current rose by l e s s than 1070.
Figure 5 is a
The most probable ratio of sensitivity ~ after
?
1
Typical plots of signal current vs. target voltage at 1 .0 fc faceplate illumination a re given in Fig. 6 for two experimental tubes. found in the case of dark current, the increase in sensitivity after the first bake was greater than after the second and third.
A s was
The measurements indicated that the sensitivity of any future tube with the photoconductor used in this project , can be expected to increase by about 2570 during sterilization.
Light Transfer Characteristic
The log-log plots of signal current vs . target illumination for the various tubes in most measurements were slightly concave upward, i. e. the slope of the curves was lower at smaller light levels. The gamma values given' in Table I a r e the average slopes of the various curves. before and after sterilization. The average values of gamma for the two se t s of measurements a r e the same within the accuracy of the data. is within the expected uncertainty of the measurements.
.
In Fig. 7 the distribution of tubes in t e rms of gamma is sh-own,
The difference in shape of the two distribution graphs also It can, there-

16
20
Tube #49 (28%) - - -Tube #26 (20OC)
Faceplate Il lumination -1.Ofc
30 50 Target Voltage, Volts
Figure 6. Senilog n o t ( for Two Tubes) of Signal Current a t 1.0 ft-cd Target I l lun ina t ion VS. Target Voltage,
17

II
0 L 55 a
.80
After S t e r i l i z a t i o n
. 60 .65 .70 075 Gamma
Figure 7. Dis t r jbu t ion of Tubes, Before and Af ter S t e r i l i z a t i o n , i n Terms of Gamma. Target Voltage = 20V.
18

fore , be concluded that the light transfer characteristic of the experimental photoconductor is not sensitive to the sterilization process a s far a s shape and slope of the curve a r e concerned. The amma of the photoconductor generally falls in the range of 0.68 1$ 0.04.
A set of measurements were made on one tube (No. 22) when scanned with a one-second frame time. The data were taken before the tube was dry-heat sterilized. when the oven overheated during the third sterilization bake causing failure of the indium seal, at the faceplate. no other such slow-scan measurements were made on la ter tubes.
The data obtained from tube No. 22 a r e shown in Fig. 8. The measurements were made at various exposure t imes ranging from 0.01 sec. to 0 .5 sec. experimental points corresponds to a gamma of 0 .71 . of gamma measured f o r this tube at standard television rate w a s 0.68. It is seen that a measurable signal was obtained below an exposure of 0.002 f t . -cd. -sec. and that saturation appears to set in somewhat above 0.15 ft. -cd. -sec.
Unfortunately, the tube was lost
Due to time limitations,
The straight line drawn so a s to average the The value
D. Spectral Response
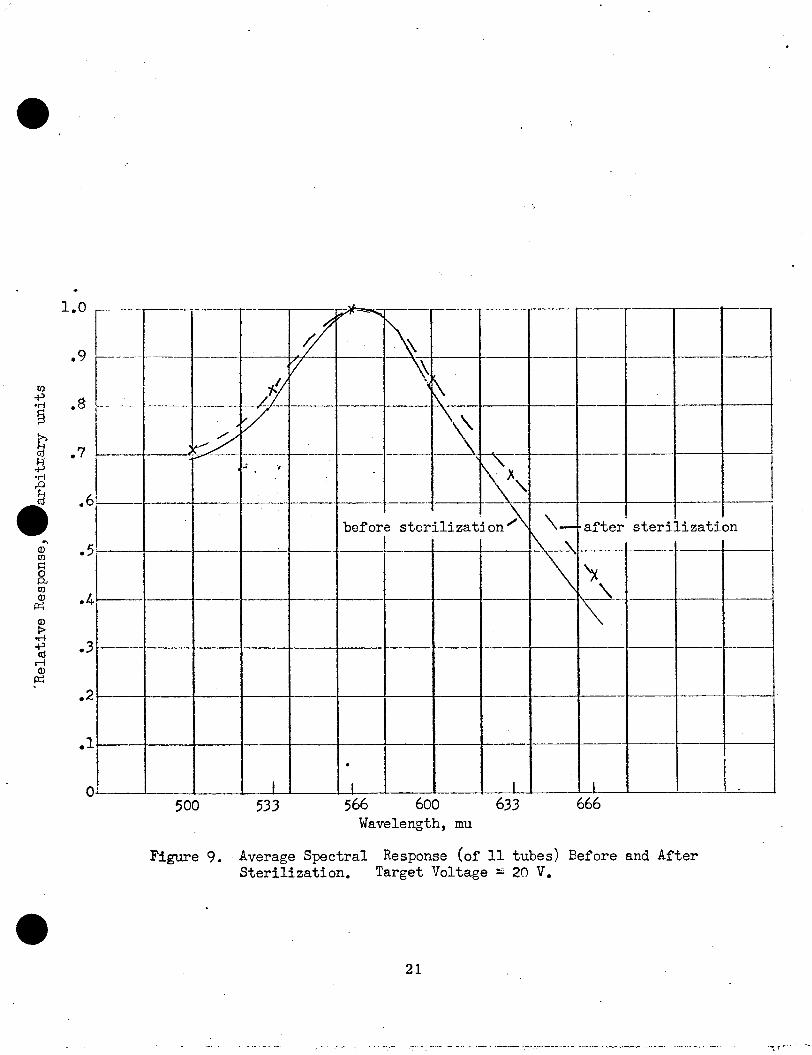
Figure 9 shows the average spectral response of eleven tubes before and after sterilization. Measurements were made at six wavelengths ranging from 500 to 666 millimicrons. The experimental results for each tube were adjusted s o that the values quoted correspond to the same amount of power at all wavelengths incident on the faceplate. The curves for the different tubes were then normalized to the same maximum response value, which in all cases occurred at the 566 mu reading. normalized response characteristics. the response at wavelengths above and below the peak of the curve has somewhat increased relative to the peak response, i. e . the curve has become slightly flatter.
Data taken on four ear l ier tubes, made before the slight modification in the photoconductor, showed less consistent results than the eleven tubes mentioned above which were made with the la ter form of photo- conductor. The maximum response for the four ear l ie r tubes occurred at somewhat shorter wavelengths (at or Ijelow 500 mu) than for the la te r tubes .
The two curves in Fig. 9 represent the average of these It is seen that after sterilization
E. Resolution
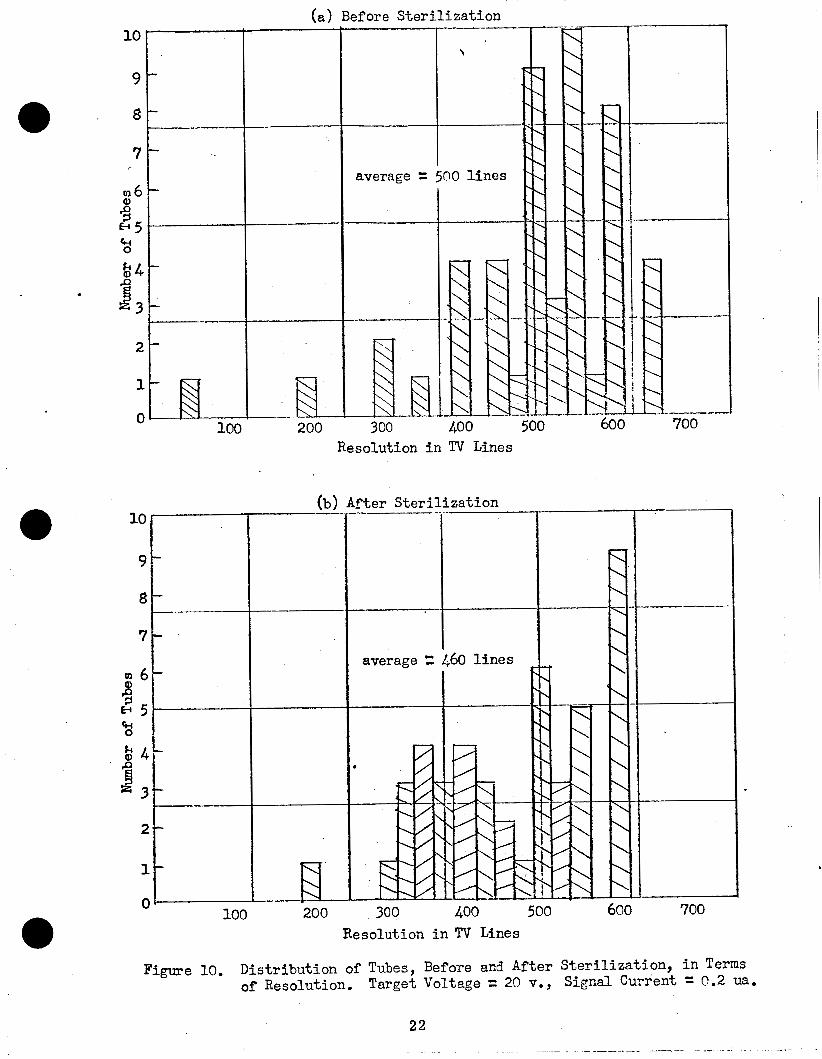
The distribution of tubes, before and after sterilization, in t e rms of . ultimate resolution is shown in Fig. 10. The average resolution was
found to have decreased from an initial value of 500 lines to a final value of 460 lines. and after fu l l sterilization: twenty-seven tubes decreased in resolution,
Of the forty-four tubes tested for resolution before
_. 19
..

3
Figure 8. Light Transfer Curve of Tube Nc. 22 at Slow-Scan Rate. Frame Time = 1 second. Target Voltage = (26c 1)V.
20
_. - .. . ! - -
i
~ I
. 1.0
.9
k
h L al . J m
tl 2 e 4
a m
al 3 d +> e 2 al
7
01
C 500 533
. -I 566 600
Wavelength, mu
A--
-
I 633 I )66
Figure 9. Average Spectral Response (of 11 tubes) Before and After S t e r i l i z a t i o n . Target Voltage = 20 V,
21
(a) Before S t e r i l i z a t i o n 10
9
8
7
m 6
m 5 % b 4
& 2
1
0 200 300 500 600 Resolution i n TV Lines
(b) After S t e r i l i z a t i o n . . --
-EL 200
average = 4.60 l i n e s I f
-_I ---
300 500 600 700
Resolution i n TV Lines
Figure 10. Distr ibut ion of Tubes, Before and After S t e r i l i z a t i o n , i n Terms of Resolution. Target Voltage = 20 v., Signal Current = 0.2 ua.

F.
G .
five remained unchanged, and twelve increased during sterilization. It therefore appears that the exposure of the experimental photocon- ductor to three dry-heat sterilization cycles can be expected to result in a small deterioration of i ts resolution capability.
Gray-scale
In Fig. 11 the distribution of vidicons is . shown, before and after sterilization, a s to gray-scale rendition. quarters of each set of tubes could distinguish the ful l ten gray-scale steps. same, 9 - 1 / 4 before and 9 - 1 / 2 after sterilization.
It can be seen that three-
The average number of gray-scale steps was essentially the
The gray-scale pattern used for this measurement was limited to ten steps. of distinguishing a larger number of steps.
It is likely that some of the tubes would have been capable
Erasure
The residual signal, at the third scan after removal of the illumination, was measured on 3 3 tubes before sterilization and on 15 tubes after sterilization. No significant change was observed. A s indicated in Fig. 12 , the average residual signal in either case was 80-1/2% of the original %ignd.
V.. DISCUSSION
The aim of Task I w a s to develop and demonstrate a photoconductor suitable for slow-scan operation and able to survive the necessary sterilization requirements.
Work performed in preparation for this contract already had indicated that an ASOS photosurface with rhodium signal plate on a high-quality quartz substrate is relatively immune to the dry-heat sterilization process.
Fifty-one tubes were made using the ASOS photosurface. these tubes were exposed to the ful l set of three 36-hour 145OC sterilization bakes. stances not connected with the behavior of the photoconductor.
Three tubes were also exposed to the ethylene-oxide decontamination process without any appreciable ef4ect.
Forty-five of
The remaining six tubes were lost, due to various incidental circum-
The effect of the sterilization bakes consisted primarily of an increase i n ' dark-current and a smaller rise in sensitivity. The data indicates that the dark current can be expected to grow by l e s s than 100% and the sensitivity by about 25%. These changes a r e well within the range of these quantities as. found in different tubes and it is felt that they a re highly acceptable.
23

0
30
0
1 - 4 - Gray-Scale Steps
I . ‘2
(b) After Steril ization
I Gray-Scale Steps
Figure 11. Distribution of Tubes, Before and After Steril ization, i n Terms of GrayScale Rendition. Target Voltage = 20 V.

(b) After S t e r i l i z a t i o n
72 74 76 78 80 82 84 86 88 90 Residual Signal (at th i rd scan), %
Figure 12. Dis t r ibu t ion of Tubes, Before and After S te r i l i za t ion , i n Terms of Residual Signal a t Third Scan a f t e r Removal of Light. Current = 0.2 ua.
Target Voltage = 20 V., Original Signal
25

. In addition a small deterioration in resolution and, possibly, a minor shift in the spectral response toward longer wavelengths were observed. No systematic changes were found in gamma, gray-scale rendition o r lag.
The measurements made during Task I were necessarily limited in scope. characteristics of the photoconductor under study, as it w a s on testing i t s stability under sterilization and decontamination procedures.
a . The chief emphasis was not so much on ascertaining the precise
Practically no work was done at slow-scan rates, although the photocon'- ductor is intended to be used under such conditions. availability of standard-rate equipment and the considerable time -saving in testing at faster rates, made it impractical to do this work at l e s s than sixty fields per second. the sterilization bakes is any different at slower scan rates than it is at the standard television rate.
Both the greater
There i s no reason to believe that the effect of
As a final presentation of the results obtained on Task I, Fig. 13 shows the average performance of all the tubes which were tested before and after the complete sterilization procedure. current (at one -footcandle faceplate illumination) a re shown as a function of target voltage. behavior of a photosurface made in the manner of those described in this report.
Dark current and signal
These curves can serve as a guide in predicting the
26

1.0 9 8 7
4
3
2
.1 9 8
. 001 9
4
0
---I---
I
i. 10 20 30 40
Target Voltage, V.
. . - EEZi -- L
I
I I
- I !
Dark Current ------,-
I I
50 60
II
--
I
Figure 13. Semilog Plot of Average Dark Current and Average Signal Current a t 1.0 f t -cd Faceplate Illumination VS. Target Voltage, Before and After S t e r i l i za t ion . Signal Current = 20.
Number of Tubes Included f o r Dark Current = 45, f o r
27
Task I1
I. DESIGN
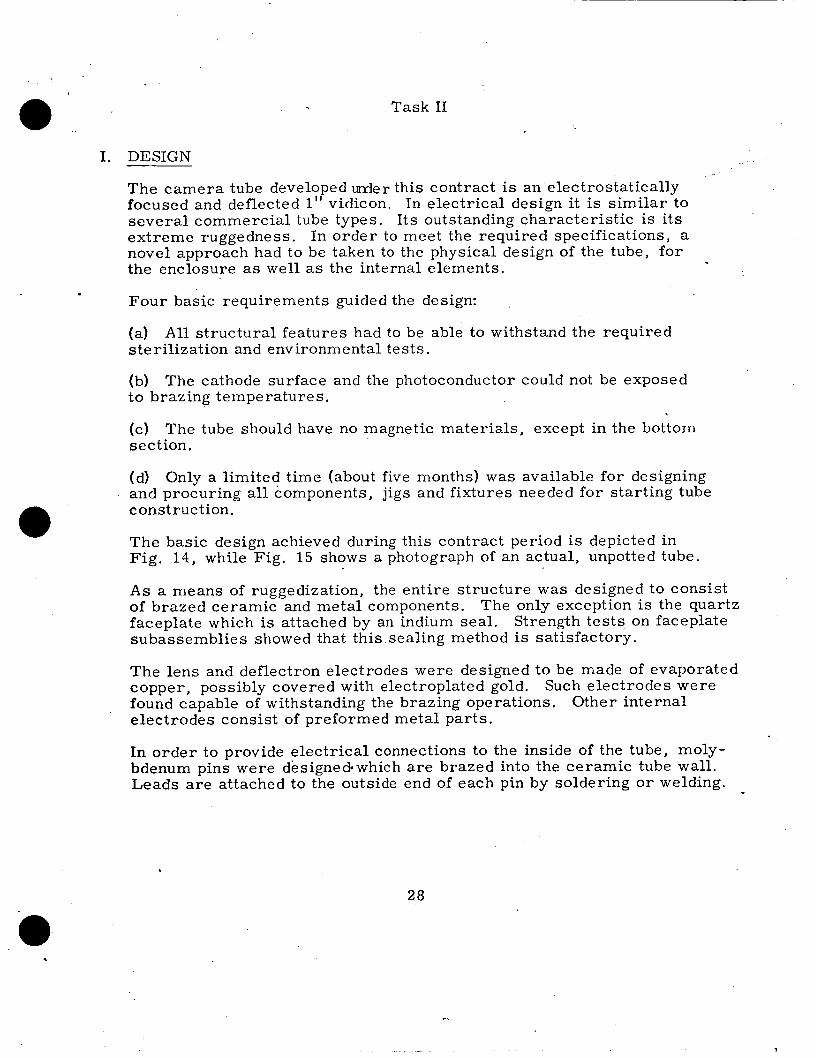
The camera tube developed Lnder this contract is an electrostatically focused and deflected 1" vidicon. several commercial tube types. Its outstanding characteristic is i ts extreme ruggedness. novel approach had to be taken to the physical design of the tube, for the enclosure as well a s the internal elements.
In electrical design it is similar to
In order to meet the required specifications, a
Four basic requirements guided the design:
(a) s t e riliz at ion and environment a1 t e s t s .
A l l structural features had to be able to withstand the required
(b) to brazing temperatures.
(c) sect ion.
The cathode surface and the photoconductor could not be exposed
The tube should have no magnetic materials, except in the bottom
(d) Only a limited time (about five months) was available for designing and procuring all components, jigs and fixtures needed for starting tube construction.
The basic design achieved during this contract period is depicted in Fig. 14 , while Fig. 15 shows a photograph of an actual, unpotted tube.
As a means of ruggedization, the entire structure was designed to consist of brazed ceramic and metal components. faceplate which is attached by an indium seal. Strength tes ts on faceplate subassemblies showed that this sealing method is satisfactory.
The only exception is the quartz
The lens and deflectron electrodes were designed to be made of evaporated copper, possibly covered with electroplated gold. found capable of withstanding the brazing operations. electrodes consist of preformed metal parts.
Such electrodes were Other internal
In order to provide electrical connections to the inside of the tube, moly- bdenum pins were designed*which a r e brazed into the ceramic tube wall. Leads a re attached to the outside end of each pin by soldering o r welding.
28

External V i e w (Without Pot t ing o r Shielding)
ceramic sec t ions c welded heliar= Kova --c
\ r ings
-1.1 - .+- 1.04
0
Cross Sect ional V i e w
A l l dimensions are in inches
-signal lead
\ I
J
Fig. lk. &tern31 and Cross Sect ional V i e w of Complete (Unpotted) Ceramic Vidicon
29 1 .- . -. . . ,. ~ . , . - . ._ .. __-.I __ .. -. __ - L .. .. . .

Fig . 15. Ceramic Vidicon
30
Several electrical connections are made via the brazed joints which hold the various tube components together.
Brazing jigs were developed which ensure good align,mcnt of the various tube components as well a s reliable brazed joints. Similarly, jigs were designed for holding and cooling the Kovar flanges during the heliarc welding operations, and optimum welding parameters were determined.
. .
Work done pr ior to this contract indicated that mechanically tensioned (rather than fired) nickel mesh has the highest resistance to damage under exposure of shock 1 of all available mesh materials. Further tes ts , performed under this contract, reaffirmed this fact. The mesh design, therefore, is based on 1000-line (per inch) nickel mesh, mechanically tensioned on a flat nichrome ring which is screw mounted to a support ring. The latter is a molybdenum d i sk which is part of the stacked ceramic-metal tube body (see Fig. 14).
-
The three-element electrostatic electron lens and the five-cycle deflectron were designed according to standard procedures , with particular emphasis being given to minimizing lens and deflection aberrations. The deflectron w a s made a part of the third lens electrode (G5). Therefore, the center potential of the deflectron nominally should be at the same voltage as G5.
The deflectron portion of the tube was made a separate ceramic section which forms part of the tube envelope.
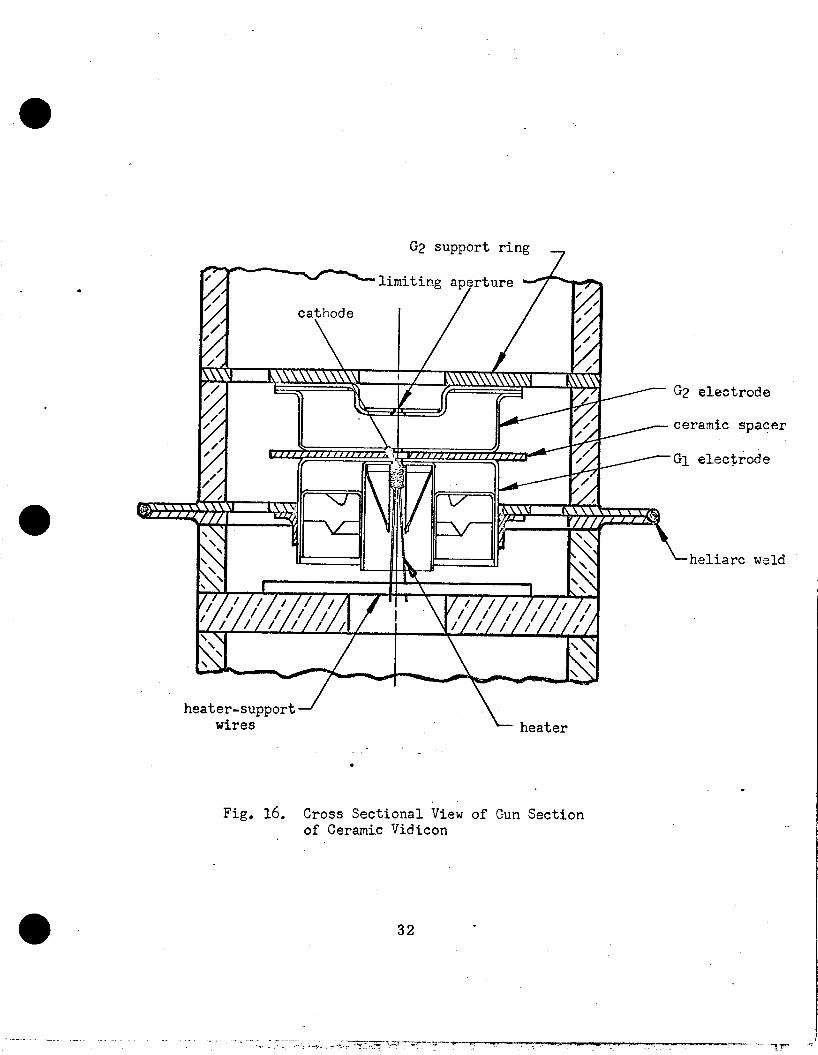
It was decided early in the contract that it would be desirable to use the low-power ( 0 . 6 watt) "dark heater" gun which had been previously dev- eloped by RCA. construction while maintaining accurate alignment and spacing of i ts parts. The resultant design is shown in Fig. 16 .
However,. a method had to be found of ruggedizing i t s
Standard parts a r e used in constructing the gun, but they a re mounted in a novel fashion. is first welded toge'thes with accurate alignment (checked by microscope) of i ts upper (defining) and lower apertures. a r e then brazed to a ceramic spacer and to the G2 support ring, thereby becoming an integral part of the tube structure. achieved by using a brazing jig which positions the gun electrodes in their proper location relative to the axis of the tube.
In a subsequent operation, the cathode subassembly is mounted inside the G1 cup. A precision jig was designed to ensure accurate spacing between
The G2 .electrode, which consists of several sections,
The G2 and G1 electrodes
Good alignment is
-
31
a
G2 support r i ng
.
heater-support wires
a
ceramic spacer
he l i a rc wsld
\ heater
. Fig. 16. Cross Sect ional V i e w of Gun Section
of Ceramic Vidicon
32

the cathode surface and the GI electrode.
The lower section of the tube (less copper tubulation) is then attached by heliarc weld. the heater legs a re attached after the heater has been slipped into the cathode sleeve.
The lower section provides two Kovar wires to which
The getters chosen for this application a re exothermic units flashed by current fed into the tube through the wall pins. ceramic tube walls a r e sufficiently translucent to permit visual moni- toring of the flashing operation.
It was found that the
The tube is evacuated through a copper tubulation on a Kovar header which is attached by means of another heliarc weld. bake and cathode activation, the tube is removed from the pump by means of a pinch-off at the copper tubulation.
After the proper pump-down,
As a separate project, some work w a s performed on a ceramic cathode consisting of a directly heated cathode on a ceramic substrate. typical sample is shown in Fig. 17 . The design shown in Fig. 17 should provide greater strength, simpler construction and, possibly, lower power consumption than the present design. might include the control electrode (GI) and the accelerator electrode (G2) as part of the same structure.
Several units of a design similar to that shown in Fig. 17 were made and tested. The heater pattern was formed of molybdenum metalizing applied by a silk screen process. maximum), the results were encouraging and indicated that the necessary operating temperatures can be reached and that reasonable lifetimes may be obtainable.
A
In i t s final form this structure
Although the electron emission was low (1. 5 mA
Test .result$ ... on potting compounds-indicated that a specific formulation of a polyurethane ( P R 1538) is able to withstand the required sterilization treatments and has a sufficiently high stiffness (although a stiffer material would be preferable).
Shielding efficiency and impact tests on shielding materials showed that Moly Permalloy (which had been suggested by JPL) w a s satisfactory. appearance and approximate dimensions of the potted tube a re indicated in Fig. 18. including leads with banana plugs. materials is about 171 grarhs.
The
The total mass of a complete potted tube is about 419 grams The mass of the potting and shielding
11. MANUFACTURE OF TUBES
In general terms, the basic steps in the production of a ceramic vidicon are as follows:
3 3

heater contact
T h e a t e r cctntact
cathode coat ing
insulat i region
n icke l bas e,J material
L heater p a t t s r n
Fig. 17. Ceramic Cathode St ruc ture
34 c

- m c 0 d
r I
c-
4 al ri
% M k 6 *
C 0 o
35

a . (a) deposit e d.
The ceramic parts a r e metalized and the copper electrodes a r e
(b)
(c)
(d) .The cathode is mounted.
(e)
The melybdenum pins a re brazed into the ceramics.
Each of the two major sections a re brazed.
The two sections a re joined by heliarc weld.
(f)
(g) The mesh is mounted.
(h) The faceplate is attached.
The heater and getters a re mounted and the tubulation is attached.
(i) flashed and the tube is pinched off.
The aforementioned production steps a re discussed below in greater detail. Also discussed a r e some of the problems encountered which had to be solve d .
The tube is pumped, the cathode is activated, the getters a r e
(a) for brazing is to metalize them with molybdenum and then plate nickel onto the metalizing. The molybdenum support rings and stainless steel (GI and G2) electrode cups also a r e nickel plated while the Kovar heliarc flanges are left bare for brazing. .
The standard procedure' used for preparing the ceramic (alumina) surfaces
The electron lens and deflectron electrodes a re deposited by vacuum evaporation of copper. cutting away the unwanted copper. The more complicated deflectron profile is formed by photoresist masking and etching.
Preliminary tests had shown that the brazing solder, while in the molten state, attacks the wall electrodes i f it could reach them via a nickel plated surface. metalized regions connecting the pins o r brazed joints to the corresponding copper electrodes.
(b) joints , which were made with a higher temperature (silver-copper- palladium) brazing alloy, tended to form brittle joints after the second braze. of the ceramic material adjacent to the joints and it resulted in a tendency to form a i r leaks.
The lens electrodes a re shaped by grinding o r
This difficulty was overcome by not nickel plating the
. Experience with several tubes indicated that the first set of brazed
This may be due to the brittleness of the alloy o r to a weakening
Tests were therefore made to use the lower temperature
36

eutectic alloy of silver and copper, formerly employed only in the second braze, for both brazing operations. Since the molten alloy dissolves some of the nickel substrate, the resultant braze has a higher melting point than the original eutectic and car, be kept from softening, during the second brazing cycle , by careful temperature control. method was successful and has been used in all recent tubes.
This
The molybdenum pins, which a r e brazed into the tube w a l l in the f i rs t brazing operation, a r e held in place by a set of round metal s t raps .
(c) positioning of parts during the second braze. the jigs from being brazed to the tube. necessary before fully satisfactory jigging was achieved.
(d) in the G1 cup. G1 spacing to within 0.001 inch, by means of a micrometer motion. accurate spacing is maintained by the use of built-in welding electrodes which permit the cathode subassembly to be welded in place while being held in the mounting jig.
The success of thi& technique was demonstrated by the fact that the G1 voltages for picture cutoff generally have fallen in the desired range of -45 to -110 volts.
High precision stainless steel jigs are used for producing proper Oxide coatings prevent
Considerable redesign was
A jig w a s designed for mounting the cathode subassembly accurately A technique w a s evolved for attaining the desired cathode-
The
37
(e) proper conditions (surface speed, gas flow, weld current and probe spacing) had been ascertained. difficulties were first encountered which were traced to the presence of s i lver (from the brazing joints) on the Kovar surfaces. of all t races of silver w a s found to remove this problem.
Strong and reproducible heliarc welds have been obtained once the
Argon is used as the inert atmosphere. Considerable
Meticulous removal
Several tubes have been opened up (for the purpose of studying their inside condition and/or for internal repairs) by grinding open one o r both of the heliarc welds. condition, it is possible to use them over again for a second welding operation.
(f) proved to be very practical. mounting operations for the heater o r getters. attached, by means of a second heliarc weld similar to that described above.
(g) a square hole) and then attached by means of a thin nichrome part which is spot welded to the ring through the mesh.
After refinishing the Kovar flanges to a smooth surface
The technique developed for introducing and attaching the heater has No difficulties have been encountered in the
The tubulation section is
The electroformed nickel mesh is stretched over a nichrome ring (with
It was found that in order to .

' obtain a taut and wrinkle-free mounting, the mesh not only has to be drawn uniformly tight but also great care must be taken in the welding operation so that no part of the mesh i s exposed to excess heat. The finished mesh subassembly is mounted in the tube with four stainless s teel screws.
(h) during the attaching of the faceplate by means of an indium seal and to ensure proper placing of the faceplate and the target ring. Great care is required in proper preparation of the ceramic surface on which the - seal is made. It has to be cleaned immediately prior to faceplate sealing to remove all particles which might cause leaks. Reliable seals have been obtained in this fashion.
A jig was designed and built to ensure proper application of pressure
The surface is first ground flat and polished smooth.
(i) The tubes have been exhausted mostly on oil-free vacuum systems containing sorption and ion pumps. However, successful tubes were also pumped by means of mechanical forepumps and mercury diffusion pumps. because of the photoconductor and indium seal, the tubes require long bake times, usually at least twelve hours.
Since the bakeout temperature has been limited to about 14OoC,
Appropriate cbanges had to be made in the procedures for cathode acti- vation and getter deposition in'order to adapt them to the conditions imposed by this tube. cathode performance has not been consistently good. The probable cause is the difficulty of proper outgassing of the gun parts and unusual thermal conditions in the ceramic tube due to the G1-G2 mounting arrangement.
Adequate results have been obtained; however,
Pinching-off of the copper tubulation generally has yielded reliable vacuum seals.
A total of twelve complete tubes were started. operable vidicons.
Six of these resulted in
111. ENVIRONMENTAL TESTING AND FAILURE ANALYSIS
Suitable tes ts were performed on all tube parts which were considered to be potentially prone to failure due to the required sterilization o r environ- mental conditions. The test level at which failure occurred and the mode of failure were determined, when appropriate. test a Schaevitz Model No. 'B-10-D centrifuge was u s e d (Fig. 19). a 4 - 1 / 2 ft. radius a rm, it h a s a maximum acceleration capability of 200 g ' s
For the static-acceleration With
The Ling Electronics Model No. 300 vibration unit, shown in Fig. 20, used for all vibration testing, can provide sinusoidal vibration to 100 g ' s peak
38

Fig . 19 . Sentr i r ’uge Tor Constant Acce l s r a t ion Test
39

Fig. 20. V i b r a t i o n Tes t Unit
40

or random vibration to 50 g ' s r . m . s. in the frequency range of 5 to 3000 cps. In Fig. 20 a "slippery table" is shown attached to the exciter, oriented horizontally, a s used for this project.
It can exert forces of up to 7000 lb.
I
The high acceleration shock machine, designed for testing the ceramic vidicon and i t s components, is shown in Fig. 21 . An 8 lb. magnesium drop table, sliding on Teflon bearings, has provided impact shocks of up to 3700 g's amplitude, in a 0.45 ms half-sine pulse. At the drop height of 60 inches, a 60% rebound is obtained. The total available drop height is 76 inches. Figure 2 2 shows a CRO trace of a typical shock pulse. frequencies from 200 cps to 7000 cps. The short-duration, high-g shock profile is obtained by using fiber glass material a s the impact spring.
-
The detection circuit contains a wide-band filter passing
The tes t s made on various tube components and whole tubes a re discussed below:
(a) Faceplate and Indium Seal - The resonant frequency of the faceplate subassembly is much higher than that corresponding to the shock-pulse duration. s t r e s s experienced by the faceplate and indium seal can be deduced directly from'the amplitude of the pulse. faceplate is about 0.0075 lb. If the pulse height is 3000 g's , the maximum force on the indium seal is 3000 x 0.0075 o r 2 2 . 5 lbs.
- - - - - - - - - - - -
Thus no amplification of the pulse is caused and the maximum
The weight of the quartz
Static load tes ts were performed to establish the strength and failure mode of the indium seal on the vidicon. technique were investigated, differing in the method in which the ceramic seal surface is prepared. In the first kind of seal, the ceramic surface is ground and then metalized with molybdenum. samples of indium seals formed on such a surface were tested under static loading, applied axially in the direction tending to push the faceplate away from the ceramic. The seals failed at forces varying from 75 lbs. to 270 l b s . at 224 lbs. of the indium seal.
The second kind of seal is formed on a bare ceramic surface which, after grinding, has been lapped smooth with a diamond compound. Six samples were tested. Three failed due to breakage of the quartz faceplate, at 161, 209 and 220 lbs . , respectively. In the other three samples, the indium separated at forces of 114, 115 and 269 l b s . , respectively.
Two variations in sealing
Ten
i n one case, tne quartz faceplate cracked In all other samples,failure occurred due to separation
The average strength was 139 lbs.
The average strength w a s 181 lbs.
4 1
0- I


- 'lime, 1 ms/cm
FiF. 22. %til loscope Trace o f Typ ica l Shock Pulse
4 3
e
A

A l l seals had been found to be vacuum tight.
The second technique described above, using a bare ceramic surface, was chosen for the ceramic vidicon. It promises to yield seals which a re at least four times a s strong a s required by the tube. Actually, since in the static tests the force was applied for many seconds before failure occurred, the seals can be expected to with- stand a higher momentary force a s in the case of the shock pulses.
Temperature tes ts on the indium seal indicated that no a i r leaks develop if the tube is exposed to a temperature of 152OC for 24 hours . Slight leakage occurs during a 24 hour exposure at 154 to 155OC and bad leakage during a 24 hour exposure at 155 to 156OC.
(b) - - - Mesh - The nickel ring is attached to the 0.030 inch thick molybdenum support ring by means of four No. 0-80 stainless steel screws. tes t s on these screws screwed into molybdenum sheet of 0.025 inch thickness, indicated that they failed at about 100 lbs. due to stripping of the threads and failure of the molybdenum sheet. The weight of the mesh ring is about 3 x 10⁻³ lb. the total force experienced by the four screws is therefore 9 lbs. The screws, therefore, have an adequate margin of safety.
Tension
A t an axial acceleration of 3000 g's,
It is contemplated to sandwich a spring washer between the mesh and support ring. reduce the probability of a screw working loose during vibration testing. Such a spring would weigh about a s much as the mesh and be under an applied tension, due to the spring, of about 1 lb. per screw. Therefore, such a n arrangement would still give a very high degree of safety.
Thirty-one mesh samples were tested with axial shock pulses of 3100 g's amplitude and 0 .45 m s duration, five shocks being applied in each direction. permanent damage. Their resonant frequency decreased by about 10% o r less . The remaining four samples developed some wrinkles. How- ever, it appears that these four samples w e r e overstressed due to poor mounting in the testing fixture.
This would insure constant tension on each screw and
Twenty-seven samples developed no wrinkles o r other
The resonant frequency of the mesh ranged from 2300 to 4000 cps with the average close40 3600 cps.
Shock tes ts were made on two subassemblies consisting of mesh suppott rings brazed between ceramic cylinders. Mesh rings were attached to the support rings with four screws a s used in the complete tube. Each sample w a s exposed to five 3000 g, 0 .45 m s shock in five ortho-
Due to mounting.limitations, the pieces were not . gonal directions.
44
. .

tested with shocks in the direction in which no force is exerted on the screws. presumably because it h a d not been properly tightened originally. After it was retightened, neither it nor the other seven screws showed any sign of loosening or other failure after the tests.
One screw loosened in the first.shock applied to it, a j.
(c) _ _ _ - _ _ _ - - G1-G2 Subassembly - Early tes t s on the subassembly, consisting of the G1 and G2 cups brazed to a 14-mil thick ceramic spacer, showed that the ceramic tended to fail in shear perpendicular to the axis. The difficulty was clearly caused by the difference in thermal expansion of the metal and ceramic parts. Two remedial steps were taken. the spacer was made of a stronger ceramic. in the G1 and G2 cups making them more flexible.
F i r s t , Second, slots were cut
Two subassemblies of this arrangement were exposed to five 3000 g, 0 .45 m s shocks in each of the six directions, without showing any dam age.
A static load test was made on two G1-G2 subassemblies with the force applied cantilever-fashion. one due to breakage of the ceramic spacer, the other due to separation of the epoxy in which the samples were mounted. transmitted by the spacer during a 3000 g transverse shock is about 8 . 5 lbs.
Both samples failed at 1 2 5 lbs. ,
The shear force
One tube w a s found to contain a cracked ceramic spacer which, presumably, w a s due to the fact that this section had undergone four brazing cycles, instead of the usual single cycle. In one other case the spacer was found to be cracked immediately after the brazing operation. setting of the parts in the brazing jig.
It is possible that this failure w a s the result of improper
In no case did a G1-G2 spacer, which w a s sound after being brazed, fail in any subsequent environmental testing.
A failure found in a tube which had been exposed to transverse shock, indicated a weakness in the brazed joint between the G2 cup and its molybdenum support ring, enlarging the brazing surface to almost twice i ts previous size.
(d) - - - Heater - The cathode$&er consists of a double helix of rhenium- tungsten alloy wire just under 0 .001 inch in diameter. sections of wire (the heater "legs") protrude from the cathode sleeve . and a re welded to two 30-mil Kovar wires. alumina.
This joint therefore was strengthened by
Two straight
The heater is coated with
45
In the first of several tes ts , eight heater-cathode subassemblies were mounted in ceramic test units (Fig. 23) in an arrangement similar to that used in the vidicon. F o u r of the heaters had short legs (. 050 inch long) and four had longer legs (. 140 inch long). The units were exposed to five 2500 g, 0. 5 m s shock pulses in each of six orthogonal directions. The f o u r long-legged samples failed: three due to the heater having left the cathode sleeve and one due to a welded contact opening up. four short-legged units seemed to be intact although the heaters may have shifted inside the cathode sleeve.
The
A second set of test samples were made which were s imilar to the above except that they could be life tested with the cathode, hot. the first test had shown up the flexibility of the bare filament wire, care was taken to leave the insulation intact up to the weld point. units were exposed to a complete set of shocks of 2500 g amplitude and 0 . 5 ms duration and then to another se r ies of 3100 g amplitude and 0.42 m s duration. This test was followed by the complete ser ies of vibration tests. The two failures (one during the first shock test, the other during vibration) occurred in units having the longer legs and consisted of loss of con- tinuity. Four of the remaining samples (three with short legs, one with long legs) were then given a life test. Power was alternately on for 55 min. and off for 5 min. The filament voltage was 8V, instead of the design value of 6 . 3 V . the test w a s terminated at over 1200 hours.
Since
The
Six of the eight samples survived all tes ts .
The heaters were still operable when
X-ray pictures taken of these units at a la ter date showed that two of the heaters with short legs had shifted inside the cathode sleeve. One had moved away from the cathode by an appreciable amount and would probably have given unsatisfactory performance.
The above environmental tests on heater samples had been made on heaters which had not yet undergone the cathode activation procedure. Since the recrystallization temperature of the filament wire is above the highest temperature reached during activation, it w a s felt that the properties of the heater would be similar before and after this process. In order to verify this assumption, eight more heater test units were made and after cathode activation, were exposed to a complete set of 3000 g shocks. A l l eight heaters had short legs.
Three of the heaters farled by completely leaving the cathode sleeve and opening up. Four of the remaining filaments were found to have shifted somewhat within the cathode sleeve.
.
In order to improve the reliability of the heater, work w a s started on a technique to cement the heater to the underside of the cathode.
46

f
m e t a l i z a t i on, connected t o one heater lead
a second heater lead
ceramic spacer
0.
Fig. 23. Heater Test Assembly
47
c a t hod e
/ cathode sleeve
.c disk

This would prevent any appreciable motion of the heater and improve i t s resistance to shock and vibration substantially. enhance thermal contact between heater and cathode and thus reduce the required filament power. Very encouraging results have been obtained by the use of fine nickel powder in an organic binder. nickel sinters during the cathode activation procedure and forms a strong bond between the coated heater and the cathode base material. One test unit, with such a heater was exposed to the complete 3000 g shock and vibration test schedule and found to be undamaged. second unit w a s exposed to a set of shock pulses of 3700 g amplitude without any sign of deterioration.
It should also
The
A -
Six more units a r e to be tested.
Static tension tes ts were made on samples of straight filament wire welded to .030 inch Kovar wire. ment is similar to that used in the ceramic vidicon. to occur at about 0 . 2 l b s . , due in all cases to fracture of the wire. If one leg has to supply the total inertial force for accelerating the whole filament at 3000 g, the transmitted force is only 0. 02 1b.s.
The aforementioned welding arrange- Failure was found
- - _ - - - Contact Pins - The molybdenum pins, used for 2electrical contacts through the tube wal l and to brazed joints, were found to form vacuum- tight and strong bonds to the ceramic. Static loading of the pins caused failures at about 200 lbs . , due to cracking of the ceramic.
- Magnetic - - - - Shield - - - - Experiments were made on the magnetic shielding effect of Moly Permalloy shields before and after being exposed to shock. The four samples consisted of 0 .020 inch material formed into cylinders of six inch length and 1-1/8 inch I . D. in CllOO epoxy and exposed to a complete set of 3000 g, 0 . 4 5 m s shock pulses.
Shielding efficiency w a s measured in an applied field of 90 gauss. The field observed inside the shield w a s found to be about 0 . 6 gauss initially and had a maximum value of 1. 5 gauss after the shock test. Thus the shielding efficiency w a s still above 98%.
They were potted
- - - PottingCompounds - - - - - - Most of the potting compounds tested were found to have insufficient stiffness. should be at least 80 in order that the potted tube has a resonant f re- quency of 3000 cps or qbove as required. Epoxy which would satisfy this requirement, has an excessive thermal expansion coefficient which might cause damage to the tube at low temperatures.
The durometer reading of the compound
A preliminary search indicated polyurethane to be the most promising material as f a r a s stiffness and resistance to the sterilization procedures a r e concerned. Test samples were made of several formulations of
' th is material with metal rods potted within metal tubes simulating the
48

actual tube arrangement. PR1538 (Product Research Co. ), cured at about 90°C for eight hours, was found to have acceptable elastic characteristics and to be able to withstand th'e dry-heat and ethylene- oxide sterilization procedures without appreciable change in physical pro ert ies. Saniples of this material also were exposed to a i r at 160 8 F and relative humidity of 95% for 3 days without apparent changes.
Since it is desirable to use a potting compound of considerably greater stiffness than the minimum durometer value of 80 mentioned above , t es t s were made on P R 1538 to which various amounts of fine glass spheres (30 to 300 microns in diameter) had been admixed. Encour- aging increases in stiffness have been obtained, but problems remain concerning proper mixing without inclusion of a i r bubbles and con- cerning the heat resistance of the resultant material.
(h) - Complete - - - - Tube - - - A prototype ceramic bottle w a s made to indicate whether the various types of joints, used in the tube, a r e impervious to the ethylene oxide decontamination gas. The ionization gage which had been incorporated in the unit, showed that no perceptible trace of the gas was allowed to penetrate the bottle.
In the first environmental test of a potted tube, 'a mechanical sample w a s used which did not contain a mesh o r a heater. Thirty shocks (five along each of the six directions) of 3000 g amplitude and 0. 45 millisecond duration were applied without causing apparent damage. The resonant frequency in the axial direction was found to be in excess of 3000 cps.
Three potted tubes were exposed to nearly square shock pulses, of at least 3200 g amplitude and one-half millisecond duration in tes ts performed at the Jet Propulsion Laboratories. were incomplete internally while the third was an operative vidicon. Altogether these tubes were exposed to thirteen transverse and six axial shoc k s .
Two of the tubes
No damage w a s found on the body of any of these tubes.
any shock in the axial direction. filament and of a distortion of the G2 cup structure. that the break in the heater, which occurred adjacent to the weld at the support w i r e , w a s caused by the motion resulting from the failure at the G2 cup. .
The complete . vidicon failed during the fifth transverse shock without having received
The failure consisted of an open It is believed
As has been mentioned above, the braze a rea between the G2 cup and i t s support ring has since been increased considerably.
*
Experimental tes ts on the behavior of the ceramic vidicon under shock- pulse excitation indicated that the acceleration experienced by the
49
.. . . . .. . . . . . . .. . : . -I - - - - .. 1 '

tube components I s significantly greater than that applied to the fixture which holds the tube, as mounted in the potting compound is about 3000 cps. frequency corresponding to the 0 .45 m s pulse duration i s 2200 cps. pulse applied to the magnetic shield causes an acceleration of tube tube which is greater than the applied acceleration by a factor of about 1 .4 .
The resonant frequency of the tube The
- These two frequencies a re sufficiently close, that a shock
Due to the flexibility inherent in the Kovar joint at the gun of the tube (see Fig. 16), the amplification factor for the lower tube section is even larger . This is particularly true for transverse shocks in which the lower section is deflected in cantilever fashion. The amplification factor in this case is about 2. 5.
A s a final test for the period of this report, a potted ceramic vidicon was exposed to a complete environmental test . w a s f irst given an operational test which was repeated after the prescribed constant-acceleration and sinusoidal and random vibration tests. each of the six directions. 0 .45 ms duration. 1200 g and of the axial shocks 2800 g. the accelerations experienced by the heater, a s well as the axial accelerations of the mesh, were about 3000 g ' s . a r e the critical aspects of the tube.
The tube
The tube was then exposed to five shock pulses in These pulses were half-sinusoidal with
Presumably, therefore, all
These, of course,
The amplitude of the applied transverse shocks was
The pursuant operational test gave no indication of any deterioration.
The tube wi l l be put through the gas and dry-heat sterilization pro- cedures and will then be tested at higher shock levels than before.
A similar tube was delivered to J P L at the end of this Interim Report period.
IV. PERFORMANCE
A s an example of the characteristics of an electrostatic ceramic vidicon, the results of measurements on the most recent tube a r e given. tube is s imilar to the previous samples, except that a 1 / 2 inch electrode section w a s added between teflectron and mesh in order to improve beam landing and deflection sensitivity. formance than the other tubes, but had similar resolution. been exposed to any sterilization treatments.
A l l measurements were made under standard (60 f rames/ second) television operation, without aperture correction. Figure 24 shows dark current a s a function of target voltage, and Fig. 25 gives signal current, at a faceplate
This
It was somewhat better in per- . It has not

a
.10 09 . 08
' 007 . 06 05
. Ob
03
02
01 009 . 008
. 006
. 007
2 .005 h
24
Q f;; .002
001 .0009 . 0008 . 0007 .0006 0005
.OOOL
0003
. 0002
.oom
Tube I4
0 10 Target Voltage, V
Fig. 211. Dark Current Vs. Target Voltage f o r Ceramic Vidicon
51
b
3

Tube M
Faceplate Il lumination = 1.0 fc.
4 E
1.0
0.2
0.1
00 07
.06 . 05
. 04
. 03
. 02
. 01 0
. 10 20 30
Target Voltage, V h0
Fig. 25. Signal Current Vs . Target Voltage f o r Ceramic Vidicon
52

illumination of 1 . 0 footcandle, versus target voltage. semilogarithmic. versus faceplate illumination for a target voltage of 20V. has a gamma of 0 . 6 7.
Both plots a r e Figure 26 is a logarithmic graph of signal current
The vidicon
Figure 27 depicts the spectral response of the tube. values were adjusted to yield the signal current corresponding to the same amount of luminant power incident on the faceplate at all wave- lengths. The sensitivity peaks near 570 mu. The relatively high values at the shorter wavelengths a re believed to be spurious, probably because of transmission of infrared o r ultraviolet radiation by the optical filters.
The tube resolves at least 550 television lines in the center of the r a s t e r and 500 lines in the corners. distinguished.
The experimental
At least nine gray-scale steps can be
The horizontal square-wave response of the vidicon is presented in Fig. 28. The equivalent line number, Ne, corresponding to this characteristic i s 267 lines.
A typical set of operating voltages is the following:
Target 20V
400 G1
3 50 G2 G3
60 3 50
G4
400 G5
Mesh 700
- 50
Center of deflectron
V. SUMMARY AND CONCLUSIONS P
The photoconductive layers made during Task I were evaluated in the commercial 7735A type vidicon. consisted of
Performance characteristics studied
(a) Dark current vs. target voltage, (b) Signal current (at constant, uniform illumination) vs.
target voltage, ( c ) Signal current (at constant target voltage) vs . illumination, (d) Spectral response, ( e ) Ultimate resolution, (f) Gray-scale rendition, (g) Lag.
The tubes were tested for some o r all of these characteristics before and after the dry-heat sterilization procedure which consisted of three 36-hour 145OC bakes in dry nitrogen. tested following the first bake, and some also after the second.
’
In addition, many tubes were
53 n

.. ,
0.3
0.2
0.1 2 .09
A .08 e 0 r: .07 ; .06
.05 rl
0 02
001 . .02 .03 .% . .
Tube M
Target Voltage = 20V Dark Current = .001 mA
.06 .08 0.1 0.2 0.3 0.1 0.6 0.a 1.0
Faceplate Illumination, fc
Fig. 26. Signal Current Vs. Faceplate Illumination for Ceramic Vidicon
54

Tube M
500
Wavelength, mu
600
Fig. 27. Spectral Response of Ceramic Vidicon
5.5
760
c 0 0 .I4 Q d 3

In testing, primary consideration was given to the dark current and signal current characteristics and, to some degree, resolution. significant changes, from tube to tube o r from before to after steri l i- zation, were observed in either gray-scale rendition or lag character- ist ics. In some tubes, sterilization caused a perceptible change in the shape of the spectral response curve but not of sufficient degree to be of significance in this program.
No
The major effect of the sterilization procedure on tube characteristics consisted of an increase in d a r k current and a smaller increase in signal current. These changes varied considerably from tube to tube. On the average, the dark current at 20V target voltage approximately doubled and the signal current increased by about 25%.
While the resolution in most tubes d id not change much during steri l i- zation, several tubes did show an appreciable loss while a few exhibited an increase.
Most of the tubes showed some spurious signal (spots). that this problem can be greatly reduced by proper cleaning of the faceplates prior to the photoconductor evaporation. sterilization cause an increase in spottiness.
It w a s found
In no instance d id
A t the beginning of this project the slow-scan photoconductor used w a s found to be suitable for sterilization. chemical composition w a s made, in order to cause a small decrease in dark current. improvements in freedom from spurious signals and of obtaining experi- mental data for establishing the characteristics of the photoconductor.
Only a minor adjustment in i ts
The major portion of the work in Task I consisted of
In Task I1 it w a s demonstrated that an operable vidicon can be built which is capable of good performance as well a s being able to withstand sterilization procedure s and severe environment a1 te sting . The -. tube design is based on a ceramic-metal modular construction. Electrostatic focusing and deflection a re employed with the deflectron, an integral portion of the ceramic envelope. The tube is potted in a polyurethane compound within a Moly Pe rmalloy magnetic shield.
Early efforts were directed at developing techniques for making strong and vacuum-tight brazed joints while maintaining precise positioning of the tube parts. copper) brazing alloy for the two consecutive brazes.
Best results were obtained by use of a single (silver-
57

The quartz faceplate is attached with an indium seal. tensioned, unfired, nickel mesh was found to be the most rugged electroformed mesh material a s far as resistance to vibration and shock a re concerned. struction and a technique is under development for cementing the heater to the underside of the cathode.
Mechanically
The low-power gun is made in a brazed con-
Continual emphasis was put on ensuring the reliability of the tube under environmental testing. were tested and an effort was made to anticipate all possibilities of eventual failure.
All crit ical components and subassemblies *
The performance of the tube is very encouraging. when the activation of the cathode has been optimized, a further improvement in performance characteristics wi l l result.
It is expected that
A prototype model of the vidicon w a s delivered to JPL.
58