oce the official magazine of the oceanography … · ing a nonlinear 1½-layer reduced-gravity...
TRANSCRIPT

CITATION
Qiu, B., D.L. Rudnick, I. Cerovecki, B.D. Cornuelle, S. Chen, M.C. Schönau,
J.L. McClean, and G. Gopalakrishnan. 2015. The Pacific North Equatorial Current:
New insights from the origins of the Kuroshio and Mindanao Currents (OKMC) Project.
Oceanography 28(4):24–33, http://dx.doi.org/10.5670/oceanog.2015.78.
DOI
http://dx.doi.org/10.5670/oceanog.2015.78
COPYRIGHT
This article has been published in Oceanography, Volume 28, Number 4, a quarterly
journal of The Oceanography Society. Copyright 2015 by The Oceanography Society.
All rights reserved.
USAGE
Permission is granted to copy this article for use in teaching and research.
Republication, systematic reproduction, or collective redistribution of any portion of
this article by photocopy machine, reposting, or other means is permitted only with the
approval of The Oceanography Society. Send all correspondence to: [email protected] or
The Oceanography Society, PO Box 1931, Rockville, MD 20849-1931, USA.
OceanographyTHE OFFICIAL MAGAZINE OF THE OCEANOGRAPHY SOCIETY
DOWNLOADED FROM HTTP://TOS.ORG/OCEANOGRAPHY

Oceanography | Vol.28, No.424
8025
8026
8027
8029
8030
8031
80328033
80348107
8117
8118
8120
8121
81228123
81268127
8128
8129
8133
8135
8136
8139
8140
120°E 130°E 140°E 150°E 160°E 170°E 5°S
0°
5°N
10°N
15°N
20°N
25°N
30°N
The trajectories of the 17 profiling floats deployed
by the OKMC program.
A NEW LOOK AT THE LOW-LATITUDE WESTERN PACIFIC
The Pacific North Equatorial CurrentNew Insights from the Origins of the
Kuroshio and Mindanao Currents (OKMC) Project
ABSTRACT. Located at the crossroads of the tropical and subtropical circulations, the westward-flowing North Equatorial Current (NEC) and its subsequent bifurcation off the Philippine coast near 13°N serve as important pathways for heat and water mass exchanges between the mid- and low-latitude North Pacific Ocean. Because the western Pacific warm pool, with sea surface temperatures >28°C, extends poleward of 17°N in the western North Pacific, the bifurcation and transport partitioning of the NEC into the Kuroshio and Mindanao Currents are likely to affect the temporal evolution of the warm pool through lateral advection. In addition to its influence on physical conditions, NEC variability is also important to the regional biological properties and the fisheries along the Philippine coast and in the western Pacific Ocean. This article synthesizes our current understandings of the NEC, especially those garnered through the recent Origins of the Kuroshio and Mindanao Current (OKMC) project.
Oceanography | Vol.28, No.424
By Bo Qiu, Daniel L. Rudnick,
Ivana Cerovecki, Bruce D. Cornuelle,
Shuiming Chen, Martha C. Schönau,
Julie L. McClean, and
Ganesh Gopalakrishnan

Oceanography | December 2015 25
8025
8026
8027
8029
8030
8031
80328033
80348107
8117
8118
8120
8121
81228123
81268127
8128
8129
8133
8135
8136
8139
8140
120°E 130°E 140°E 150°E 160°E 170°E 5°S
0°
5°N
10°N
15°N
20°N
25°N
30°N
Kuroshio and the rest veering south to form the Mindanao Current (MC). The Kuroshio constitutes the western bound-ary current for the wind-driven subtrop-ical gyre, and the MC constitutes the wind-driven tropical gyre in the North Pacific Ocean (e.g., Lukas et al., 1991; Fine et al., 1994; Hu et al., 2015).
Our past knowledge about the mean structure and time-dependent changes of the NEC and its associated northwest-ern Pacific Ocean circulation has largely come from repeat hydrographic, CTD/XBT (conductivity-temperature-depth/expendable bathythermograph), and tide gauge sea level surveys (e.g., Wyrtki, 1974; Wyrtki and Kilonsky, 1984; Toole et al., 1988, 1990; Kessler, 1990; Qiu and Joyce, 1992). In the last decade, signifi-cant new understanding about the NEC has been garnered through the advent of new observational technologies such as satellite altimetry, profiling floats, and autonomous gliders. Advances regard-ing the NEC and its variability have also been achieved through strongly eddy- active regional and global ocean general circulation model (OGCM) simulations and their adjoint model explorations. In this article, we review the advances made in the past decade, with special empha-ses directed to those advances achieved as part of the Origins of the Kuroshio
and Mindanao Currents (OKMC) proj-ect, sponsored by the Office of Naval Research, that took place in the Philippine Sea from 2009 to 2015.
TIME-MEAN FEATURES OF THE NECAlthough the volume transport of the observed NEC agrees with Sverdrup theory prediction, the spatial structures of the NEC in the western North Pacific are significantly more complicated. Figure 2a shows the time-mean geostrophic veloc-ity field in the surface 0–100 m layer in the western North Pacific Ocean. The construction of this velocity field is based on available historical CTD/X-CTD and all Argo and OKMC profiling float T-S (temperature-salinity) data (Qiu et al., 2015a). Notice that the float sampling density in the Philippine Sea is signifi-cantly enhanced by the deployment of 27 OKMC profiling floats that had five-day repeat cycles. While the Sverdrup theory predicts a well-behaved westward current between 8°N and 30°N (i.e., the center latitudes of the tropical and sub-tropical gyres, respectively), Figure 2a reveals that the westward-flowing NEC is confined to the 8°N to ~17°N band and that it exhibits a zonally fluctuating pat-tern. Such fluctuations are likely caused by the presence of several meridionally
INTRODUCTIONFollowing the boundary of the wind-driven tropical and subtropical gyres paralleling ~13°N, the North Equatorial Current (NEC) flows westward and becomes progressively intensified by gathering convergent Sverdrup inflows along its path in the interior Pacific Ocean (Figure 1a; Nitani, 1972). West of the dateline, the NEC in the surface layer (<100 m depth) occupies a nominal width between 8°N and 17°N, although its northern edge below the surface layer can extend as far as 28°N (Figure 1b). The main body of the westward-flowing NEC is confined to the upper layer shallower than the 26.8 σθ isopycnal that delin-eates the base of the ventilated thermo-cline in the North Pacific Ocean (Huang and Qiu, 1994). By the time it enters the Philippine Basin west of 140°E, the NEC’s volume transport between 7°N and 18°N can reach 46 Sv above the 26.8 σθ isopyc-nal according to Figure 1b. This mean volume transport value is, by and large, consistent with the Sverdrup transport value of 50 Sv, estimated, for example, from the long-term QuikSCAT wind stress data set (Risien and Chelton, 2008). Upon reaching the western boundary along the Philippine coast near 125°E, the NEC bifurcates (pink dot in Figure 1a), with a part turning north to become the
FIGURE 1. (a) Mean sea surface height field (cm) of the western North Pacific Ocean from Rio et al. (2011). Gray shades denote where water depth is shallower than 1,000 m. The pink dot near 12°N along the Philippine coast indicates the location of the mean North Equatorial Current (NEC) bifurcation. (b) Latitude-depth section of density (solid contours, in σθ) and zonal geostrophic velocity (color shading) along 130°–135°E. The geostrophic velocity is referenced to 2,000 m, and dashed lines denote the zero velocity contours. Adapted from Qiu et al. (2015a)

Oceanography | Vol.28, No.426
aligned ridge systems that the NEC tra-verses (i.e., the Kyushu-Palau Ridge along ~135°E, the South Honshu Ridge along ~140°E, and the East Mariana Ridge along ~145°E). The water depths above these ridge systems range from 500 m to 3,000 m (see the green/gray shades in Figure 2). These NEC zonal fluctuations were also noted recently by Vianna and Menezes (2010) as a mean circulation feature in the western North Pacific in their analysis of high-resolution geodetic satellite data.
In the latitude band of 17°N to ~30°N, Figure 2a shows that the mean surface flow is often eastward and spatially frag-mented. This flow corresponds to the Subtropical Countercurrent (STCC) band, and its spatial incoherence is due to regionally enhanced eddy activity related to the baroclinically unstable STCC-NEC system (Qiu, 1999; Roemmich and Gilson, 2001; Kobashi and Kawamura, 2002). Note that the unstable STCC is confined to the upper 200 m and the wind-driven westward-flowing NEC can be clearly identified beneath the surface-trapped STCC, extending to 28°N (Figure 1b).
To represent the flow pattern below the ventilated thermocline, Figure 2b plots the geostrophic velocity vectors averaged in the 26.8–27.5 σθ layer (depth
~ 500–1,300 m). In the NEC latitude band of interest, a series of eastward jets appear approximately along 6°N, 9°N, 13°N, and 18°N. These eastward jets, dubbed the North Equatorial Undercurrent (NEUC) jets by Qiu et al. (2013b), have typical speeds of 5 cm s–1 and are zonally coher-ent from the Philippine coast. A better view for the vertical structures of these eastward jets can be found in Figure 1b, which shows the latitude-depth sec-tion of the zonal geostrophic veloc-ity (shaded contours) along 130°E to 135°E. It is evident in the figure that the cores of these four eastward jets tend to shift to progressively denser isopycnals from south to north.
It is important to emphasize that the subthermocline eastward NEUC jets described above are not confined to the Philippine Sea basin but rather appear coherently across the North Pacific Ocean basin (Qiu et al., 2013b). To clarify the mechanisms responsible for these jets, Qiu et al. (2013a) analyzed output from a strongly eddy-active global OGCM and found that these subthermocline jets have a mode-1 baroclinic vertical struc-ture and are spatially persistent on inter-annual and longer time scales. By adopt-ing a nonlinear 1½-layer reduced-gravity model and the baroclinic Rossby wave
triad interaction theory, Qiu et al. (2013a) showed that the seed for the NEUC jets originates in annual baroclinic Rossby waves driven by basin-scale surface wind stress forcing. Emanating from the Pacific basin’s eastern boundary (Todd et al., 2011), the wind-forced annual Rossby waves are subject to nonlinear triad inter-actions (Pedlosky, 1987). They break down offshore where the e-folding time scale of the most unstable triad instabil-ity matches the advective time scale of the wind-forced “primary” waves (zonal wavelengths typically several thousands of kilometers off the North American coast at 10°N and a few hundreds of kilo-meters at 30°N). With their meridio-nal wavelength scales of ~500 km set by the short secondary unstable waves, the time-mean NEUC jets are found to be generated by converging potential vortic-ity fluxes of the unstable nonlinear eddies.
GLIDER OBSERVATIONS OF THE NECSpray underwater glider observations of the NEC were recorded from June 2009 to January 2014. Glider headings are con-trolled remotely via satellite during mis-sions lasting about four months and traveling around 3,000 km while pro-filing to a depth of 1,000 m. In repeat
FIGURE 2. (a) Velocity vectors averaged in the surface 0–100 m layer calculated from available temperature-salinity data. Velocity vectors with an eastward (westward) component are plotted in red (blue). Green and gray shades denote the water depths shallower than 500 m and 3,000 m, respectively. (b) Same as (a), except for in the subthermocline layer of 26.8–27.5 σθ, or ~500–1,300 m. Adapted from Qiu et al. (2015a)

Oceanography | December 2015 27
deployments across the NEC, gliders pro-vided over 5,000 profiles of temperature and salinity, and traveled a total distance of 20,000 km. Details and analysis of glider observations of the NEC are found in Schönau and Rudnick (2015). Gliders augment CTD/XBT and float climatology by providing mean transport and trans-port variability of water masses contained in the NEC and the two NEUC jets that fall within glider range.
From the glider observations, absolute zonal geostrophic velocity is calculated using the thermal wind equation and referenced to the glider’s depth-average velocity. Using objective analysis to map all the glider profiles together, the mean depth-average velocity across the NEC is shown in Figure 3. The primarily zonal flow of the NEC is evident, with almost zero depth-average velocities at 10°N and 13°N. Referencing to this velocity, the
mean absolute zonal geostrophic veloc-ity is shown as a function of depth in Figure 4a. The westward flow of the NEC (negative) is observed to be strongest near the surface with eastward undercurrents (red) deeper than the 26 kg m–3 isopyc-nal (dashed). Thus, the minima in depth- average velocity observed in Figure 3 are partly due to the persistent NEUCs.
The NEC transports water masses that are formed elsewhere and subsequently mix in the western Pacific. These water masses are identified by their subsurface salinity extrema, the saline North Pacific Tropical Water (NPTW), with salin-ity between 34.75 psu and 35.2 psu, and
fresh North Pacific Intermediate Water (NPIW), with salinity less than 34.4 psu. Figure 4 shows mean salinity contours (black) and the subsurface salinity extrema of NPTW and NPIW contoured (red) at 34.95 psu and 34.4 psu, respec-tively. These water masses can serve as useful tracers for evaluating advection and diffusion in the region.
The total mean transport through the glider section is calculated by integrating the transport of each glider section of the NEC from the surface to potential den-sity surface 27.3 kg m–3, and from 8.5°N to 16.5°N. The mean transport is –37.6 Sv with a standard deviation of 15.6 Sv
0.1 m s–1
124°E 126°E 128°E 130°E 132°E 134°E
8°N
9°N
10°N
11°N
12°N
13°N
14°N
15°N
16°N
17°N
18°N
5.0
6.2
-33.4
0.3
–15.7
FIGURE 3. Depth-average glider velocity and mean transport of the North Equatorial Current (NEC). The Philippine Islands, where the NEC bifurcates into the northward-flowing Kuroshio Current and southward- flowing Mindanao Current, are visible to the west. The NEC has primarily zonal flow, and arrows indicate trans-port westward (blue) and eastward (red). Solid arrows indicate transport shallower than 26 kg m–3 and dashed arrows the transport deeper than 26 kg m–3. Potential density surface 26 kg m–3 lies just below the thermocline and denotes the mean locations of the tops of the two eastward undercurrents below the NEC. The transport of the undercurrents is separated into that of the northern undercurrent with 5.2 Sv (106 m3 s–1) and the southern undercurrent with 6.1 Sv.
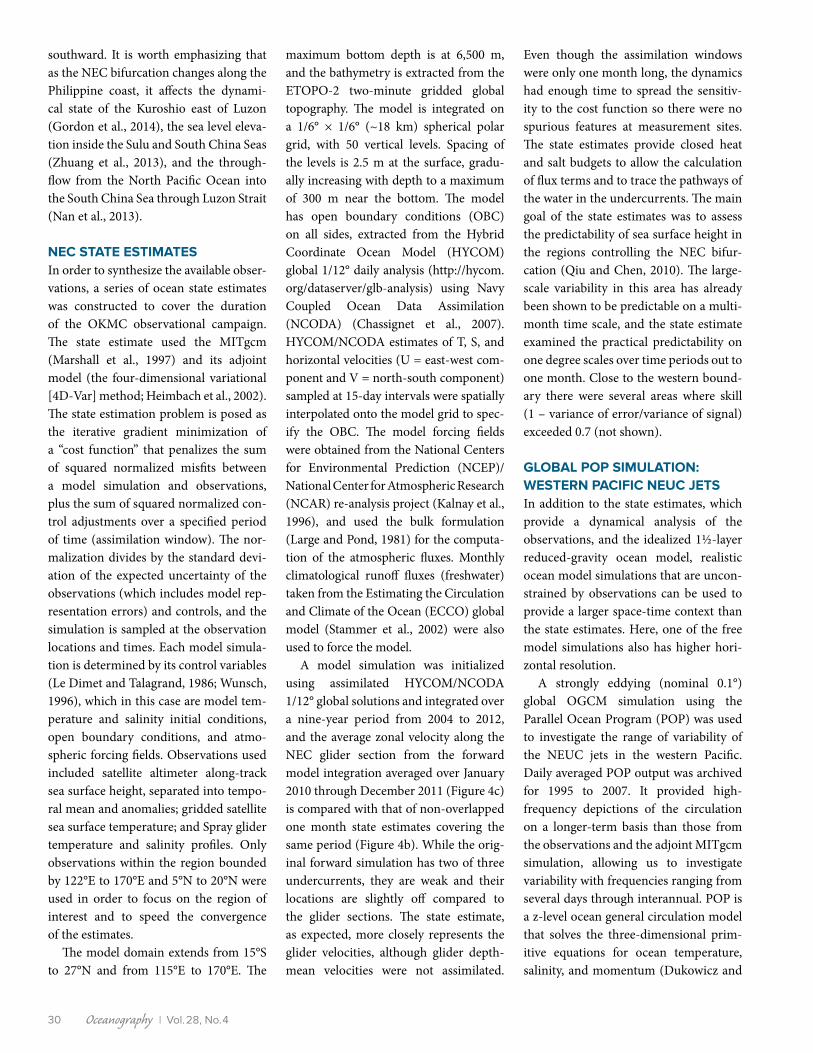
FIGURE 4. Mean absolute zonal geostrophic velocity of (a) objectively mapped glider observations, (b) MITgcm two-year mean (2010–2011) with assimilated data, and (c) MITgcm forward run (2004–2012). Black contours indicate mean salinity ranging from 33.8 psu to 35.1 psu and the line of zero velocity between westward and eastward flow. Red contours encircle the sub-surface salinity maximum of North Pacific Tropical Water (NPTW) at 34.95 psu and the subsurface salinity minimum of North Pacific Intermediate Water (NPIW) at 34.4 psu. A gray line marks potential density surface 26 kg m–3 just above the undercurrents. Assimilation of glider data into a regional numerical model improves on the modeling of both undercurrents and salinity extrema.
34.1 34.234.34.3
34.334.3
34.434.4
34.4
34.4
34.4 34.434
34.5
34.5
34.5
5 34.534.5
34.5 34.5 34.5
34.634.6
34.6
34.6 34.6 34.6
34.734.7
34.7
34.7 34.7 34.7
34.834.834.8
34.8 34.8 34
34.934.934.9 34.9 34.93535 35
2626
26
Dep
th (m
)
0
0
0 0
0
0
0
0
200
400
600
800
1000
Velo
city
(m s−
1 )−0.5
−0.4
−0.3
−0.2
−0.1
0
0.1
0.2
0.3
0.4
0.5
34.134.234.2 34.334.3
34.3
34.3
34.434.434.4
34.4
34.4
34.4 34.4
34.534.534.5
34.5
34.5
34.5
34.534.5
34.5
34.634.6 34.6
34.6 34.6 34.6
34.734.7 34.7
34.7 34.7 34.7
34.834.8
34.8 34.8 34.8 34.8
34.934.934.9 34.9
Dep
th (m
) 0
00
0
200
400
600
800
100033.9 3434 34.134.1 34.234.234.2 34.3 34.3 34.3
34.3
34.4 34.4 34.4
34.4
34.4 34.4
34.534.5
34.534.5
34.5
34.5 34.5 34.5
34.634.6
34.6
34.6 34.6 34.6
34.734.7
34.7
34.7 34.7 34.7
34.834.8
34.8 34.8
Latitude (o)
Dep
th (m
) 0
0
8 9 10 11 12 13 14 15 16
0
200
400
600
800
1000
(a)
(b)
(c)
(a)
(b)
(c)

Oceanography | Vol.28, No.428
(Schönau and Rudnick, 2015). The mag-nitude is in agreement with previous esti-mates of NEC transport that reference to a level of no-motion deeper than 1,500 m (Toole et al., 1990; Qu et al., 1998), and Argo climatology (Roemmich and Gilson, 2009) integrated over this range.
To examine the effect of NEUC vari-ability on total transport through the section, the transport through the glider section is separated into trans-ports that are shallower and deeper than 26 kg m–3, the mean isopycnal above all the under currents. Transports of the NEC (<26 kg m–3) and the NEUCs (>26 kg m–3) are shown as functions of lat-itude and time by integrating the absolute geostrophic velocity from the surface to 26 kg m–3 (Figure 5a), and from 26 kg m–3 to 27.3 kg m–3 (Figure 5b). Taking the mean and standard deviation between sections, the mean transport shallower than 26 kg m–3 is –33.1 ± 7.0 Sv, and transport from 26 kg m–3 to 27.3 kg m–3 is –4.5 ± 9.2 Sv. Thus, the westward trans-port of the NEC from the surface and extending through the thermocline is relatively consistent during the years of observations, with a mean westward flow of –33.4 Sv and a small mean east-ward flow of 0.3 Sv (Figure 3). The mean
eastward flow is so weak that it is not dis-tinguishable from variability that is not averaged out, given the length of our record. Eddies may cause the transport variability by latitude visible in Figure 3, but the total transport remains relatively constant between sections.
Deeper than 26 kg m–3, the transport
is more variable than that of the over-lying NEC. Here, the mean westward transport is –15.7 Sv, and the mean east-ward flow in the two NEUCs is 11.2 Sv. The integrated transport deeper than 26 kg m–3 (Figure 5b) highlights both the persistence and variability in width and location of these undercurrent jets. The cores of the NEUCs are centered at 9.6°N and 13.1°N, with occasional instances of the undercurrents combining (sum-mer 2010) and additional undercurrents observed at higher latitudes (fall 2013). When the NEC transport at the surface is strong, there are small undercurrents, and when the overlying NEC is weak, the undercurrents tend to have a greater width over the glider range (Schönau and Rudnick, 2015). Typically, the NEUCs are 50 to 150 km wide. To estimate trans-port of each NEUC, 11.3°N is used as a reasonable boundary between the two undercurrents, based on the variability of
each in Figure 5b. The mean transport of the NEUC centered at 9.6°N, integrating eastward transport from 8.5°N to 11.3°N and 26 to 27.3 kg m–3, is 6.2 Sv and that of the NEUC centered at 13.1°N integrated from 11.3°N to 16.5°N is 5.0 Sv. The stan-dard deviation of each undercurrent is roughly 3 Sv. It is interesting that these undercurrents have approximately equal magnitude and variability.
What water masses are the NEC and underlying undercurrents transporting? To answer this question, we can look at the distribution of transport as a function of potential temperature and salinity on a T-S diagram (Figure 5c). To construct this diagram, the temperature and salin-ity from each objectively mapped sec-tion is taken in 0.2°C by 0.01 psu bins, and the transport of each bin is summed over all sections. The mean transport is found by dividing the total transport by the bin size and the number of sections. Integrating Figure 5c yields the mean transport from the surface to 1,000 m over the glider range.
In this representation, the west-ward transport by the NEC of sub-ducted water masses and eastward trans-port by the NEUCs are apparent. Both NPTW, salinity near 35 psu and potential
21
21
22
22
22
23
23
23
24
24
24
25
25
26
26
26
27
27
27
28
Salinity (psu)
Po
ten
tia
l T
em
pe
ratu
re ( o
C)
33.2 33.4 33.6 33.8 34 34.2 34.4 34.6 34.8 35 35.2 35.40
4
8
12
16
20
24
28
32
Tra
nsport
(S
V p
su−
1 o
C−
1)
−40
−30
−20
−10
0
10
20
30
40
8 9 10 11 12 13 14 15 16Jun−09Oct−09Feb−10Jun−10Oct−10Feb−11Jun−11Oct−11Feb−12Jun−12Oct−12Feb−13Jun−13Oct−13
Latitude (o)
Date
8 9 10 11 12 13 14 15 16Latitude (o)
Tran
spor
t per
leng
th (S
v km
−1)
−0.1
−0.05
0
0.05
0.1
(a) (b) (c)
FIGURE 5. Transport integrated by potential density as a function of latitude from (a) the surface to 26 kg m–3, and (b) 26 kg m–3 to 27.3 kg m–3. The transport at the surface and through the thermocline represents the NEC, with variability due to eddies. The transports of the undercurrents are visible in red deeper than 26 kg m–3. The dashed line at 11.3°N in (b) is used as boundary to calculate the eastward transport of the undercurrents separately. (c) T-S transport diagram calculated by integrating the total transport in a given 0.1 psu and 0.2°C bin over all glider sections and dividing by the number of sections and bin size. Integrating this section would give the mean transport from 0 m to 1,000 m. The diagram highlights the westward transport of NPTW and NPIW by the NEC (blue) and the eastward transport of the two undercurrents (red).
(a) (b) (c)

Oceanography | December 2015 29
density of 23.5 kg m–3, and NPIW, salin-ity below 34.4 psu and a potential density of 26.5 kg m–3, exhibit strong westward advection (blue). Below the thermo-cline, the T-S characteristics of the water masses take up more volume, leading to large transports of this water even though the velocity may be weaker. The eastward transport of the undercurrents (red) is striking below potential density surface 26 kg m–3. It is interesting that the water properties of the two undercurrents are distinct. The T-S properties of the under-currents suggest that they carry a mixture of interleaved intermediate waters, the NPIW and Antarctic Intermediate Water (AAIW) from the South Pacific, and allude to a connection to other undercur-rents in the western Pacific.
TIME-VARYING FEATURES OF THE NEC Near the western boundary of the Pacific basin, the NEC’s variability and bifurca-tion are subject to both local monsoonal wind forcing and remote forcing of the broad-scale interior ocean via baroclinic Rossby waves (Qiu and Lukas, 1996). On the seasonal time scale, analyses based on historical hydrographic data, assimila-tion model output, and satellite altimeter measurements reveal that the NEC bifur-cation latitude reaches its northernmost position from November to December and its southernmost from May to July (Qu and Lukas, 2003; Yaremchuk and Qu, 2004; Qiu and Chen, 2010). This seasonal migration of the NEC bifurcation agrees in general with the predictions based on a 1½-layer reduced-gravity ocean model (Figure 9 in Qiu and Lukas, 1996) and a full-fledged ocean general circulation model (Figure 4 in Kim et al., 2004). Both models find a southernmost NEC bifur-cation in April/May, with its northern-most counterpart in October/November.
One consistent feature of both the data analyses and numerical models is that the annual excursion of the NEC bifur-cation is about 2° latitude, much smaller than the 10° annual excursion of the zero wind stress curl line averaged across the
Pacific basin. With their phase speed at 10–15 cm s–1, it takes mode-1 baroclinic Rossby waves 2.5 to 3 years to traverse the Pacific basin in the 10°N to 15°N band. Effects of the annually forced baroclinic Rossby waves tend to cancel out destruc-tively following the wave paths, resulting in a much reduced seasonal migration of the NEC along the western boundary (Qiu and Lukas, 1996). The monsoonal wind forcing near the Philippine coast, on the other hand, exerts a larger impact on the seasonal NEC bifurcation because it experiences no along-path destruc-tive cancellations.
For the wind forcing with interannual and longer time scales, the along-path cancellation effect also becomes less sig-nificant because the same-signed baro-clinic Rossby waves are induced across the Pacific basin. This, indeed, is the case based on the satellite altimetry measure-ments of the past 22 years. Figure 6a shows the monthly time series of the NEC bifur-cation latitude Yb along the Philippine coast estimated from the satellite altime-ter measurements (for the detailed meth-odology, see Qiu and Chen, 2010). While exhibiting variability with time scales ranging from intraseasonal to decadal,
the time series is clearly dominated by the interannual and longer time-scale fluctua-tions. On interannual time scales, one can readily identify the changes relating to the El Niño-Southern Oscillation (ENSO) events as represented by the Niño-3.4 index (Figure 6b). Consistent with mod-eling studies by Qiu and Lukas (1996) and Kim et al. (2004), the NEC tends to bifur-cate at a northerly (southerly) latitude during the El Niño (La Niña) years.
On a longer time scale, Figure 6a reveals that the NEC bifurcation has migrated progressively southward from 1993 to 2013. Such a long-term trend is not seen in the time series of Niño-3.4 index. Instead, this multidecadal south-ward trend matches favorably with the Pacific Decadal Oscillation (PDO) index presented in Figure 6c. As detailed in Qiu et al. (2015b; see their Figure 10), PDO-related wind stress curl forcing has an imprint in the tropical western Pacific Ocean along the 10°N to 15°N band. As the PDO phase switched grad-ually from positive to negative during 1993 to 2013, the wind stress curl in the 10°N to 15°N band became anomalously negative, causing the tropical-subtropi-cal gyre boundary to shift progressively
FIGURE 6. (a) Time series of the NEC bifurca-tion latitude Yb inferred from the monthly sat-ellite altimeter sea sur-face height data (gray line). The solid black line indicates the low-pass- filtered time series, and the dashed line indi-cates the linear trend. As detailed in Qiu and Chen (2010), Yb is defined as where the altimeter- derived meridional sur-face velocity averaged within the 2° band along the Philippine coast equals zero. (b) Time series of the Niño- 3.4 index. (c) Time series of the Pacific Decadal Oscillation (PDO) index.
Oceanography | Vol.28, No.430
southward. It is worth emphasizing that as the NEC bifurcation changes along the Philippine coast, it affects the dynami-cal state of the Kuroshio east of Luzon (Gordon et al., 2014), the sea level eleva-tion inside the Sulu and South China Seas (Zhuang et al., 2013), and the through-flow from the North Pacific Ocean into the South China Sea through Luzon Strait (Nan et al., 2013).
NEC STATE ESTIMATESIn order to synthesize the available obser-vations, a series of ocean state estimates was constructed to cover the duration of the OKMC observational campaign. The state estimate used the MITgcm (Marshall et al., 1997) and its adjoint model (the four-dimensional variational [4D-Var] method; Heimbach et al., 2002). The state estimation problem is posed as the iterative gradient minimization of a “cost function” that penalizes the sum of squared normalized misfits between a model simulation and observations, plus the sum of squared normalized con-trol adjustments over a specified period of time (assimilation window). The nor-malization divides by the standard devi-ation of the expected uncertainty of the observations (which includes model rep-resentation errors) and controls, and the simulation is sampled at the observation locations and times. Each model simula-tion is determined by its control variables (Le Dimet and Talagrand, 1986; Wunsch, 1996), which in this case are model tem-perature and salinity initial conditions, open boundary conditions, and atmo-spheric forcing fields. Observations used included satellite altimeter along-track sea surface height, separated into tempo-ral mean and anomalies; gridded satellite sea surface temperature; and Spray glider temperature and salinity profiles. Only observations within the region bounded by 122°E to 170°E and 5°N to 20°N were used in order to focus on the region of interest and to speed the convergence of the estimates.
The model domain extends from 15°S to 27°N and from 115°E to 170°E. The
maximum bottom depth is at 6,500 m, and the bathymetry is extracted from the ETOPO-2 two-minute gridded global topography. The model is integrated on a 1/6° × 1/6° (~18 km) spherical polar grid, with 50 vertical levels. Spacing of the levels is 2.5 m at the surface, gradu-ally increasing with depth to a maximum of 300 m near the bottom. The model has open boundary conditions (OBC) on all sides, extracted from the Hybrid Coordinate Ocean Model (HYCOM) global 1/12° daily analysis (http://hycom.org/dataserver/glb-analysis) using Navy Coupled Ocean Data Assimilation (NCODA) (Chassignet et al., 2007). HYCOM/NCODA estimates of T, S, and horizontal velocities (U = east-west com-ponent and V = north-south component) sampled at 15-day intervals were spatially interpolated onto the model grid to spec-ify the OBC. The model forcing fields were obtained from the National Centers for Environmental Prediction (NCEP)/National Center for Atmospheric Research (NCAR) re-analysis project (Kalnay et al., 1996), and used the bulk formulation (Large and Pond, 1981) for the computa-tion of the atmospheric fluxes. Monthly climatological runoff fluxes (freshwater) taken from the Estimating the Circulation and Climate of the Ocean (ECCO) global model (Stammer et al., 2002) were also used to force the model.
A model simulation was initialized using assimilated HYCOM/NCODA 1/12° global solutions and integrated over a nine-year period from 2004 to 2012, and the average zonal velocity along the NEC glider section from the forward model integration averaged over January 2010 through December 2011 (Figure 4c) is compared with that of non- overlapped one month state estimates covering the same period (Figure 4b). While the orig-inal forward simulation has two of three undercurrents, they are weak and their locations are slightly off compared to the glider sections. The state estimate, as expected, more closely represents the glider velocities, although glider depth-mean velocities were not assimilated.
Even though the assimilation windows were only one month long, the dynamics had enough time to spread the sensitiv-ity to the cost function so there were no spurious features at measurement sites. The state estimates provide closed heat and salt budgets to allow the calculation of flux terms and to trace the pathways of the water in the undercurrents. The main goal of the state estimates was to assess the predictability of sea surface height in the regions controlling the NEC bifur-cation (Qiu and Chen, 2010). The large-scale variability in this area has already been shown to be predictable on a multi-month time scale, and the state estimate examined the practical predictability on one degree scales over time periods out to one month. Close to the western bound-ary there were several areas where skill (1 – variance of error/variance of signal) exceeded 0.7 (not shown).
GLOBAL POP SIMULATION: WESTERN PACIFIC NEUC JETS In addition to the state estimates, which provide a dynamical analysis of the observations, and the idealized 1½-layer reduced-gravity ocean model, realistic ocean model simulations that are uncon-strained by observations can be used to provide a larger space-time context than the state estimates. Here, one of the free model simulations also has higher hori-zontal resolution.
A strongly eddying (nominal 0.1°) global OGCM simulation using the Parallel Ocean Program (POP) was used to investigate the range of variability of the NEUC jets in the western Pacific. Daily averaged POP output was archived for 1995 to 2007. It provided high- frequency depictions of the circulation on a longer-term basis than those from the observations and the adjoint MITgcm simulation, allowing us to investigate variability with frequencies ranging from several days through interannual. POP is a z-level ocean general circulation model that solves the three-dimensional prim-itive equations for ocean temperature, salinity, and momentum (Dukowicz and

Oceanography | December 2015 31
Smith, 1994), and it has an implicit free surface. This configuration has 42 verti-cal levels whose thickness ranges from 10 m in the uppermost level to 250 m in the deep ocean. Partial bottom cells were used for improved representation of flow over the bottom boundary. The horizon-tal grid resolution is roughly 11 km in the study region. Further details of the grid and bathymetry can be found in McClean et al. (2011).
The model was forced with Coordi-nated Ocean Research Experiment 2 interannually varying atmospheric forc-ing (CORE2-IAF; Large and Yeager, 2009) from 1990 to 2009. CORE2 fluxes are based upon six-hourly (1948–2006) near-surface vector wind, specific humid-ity, density, and air temperature based on NCEP reanalysis, daily downward radi-ation (1984–2006) from International Satellite Cloud Climatology Project (ISCCP) data (Zhang et al., 2004), and monthly precipitation (1979–2006) from a combination of satellite observations.
The ocean model was initialized from a 30-year spun up state based on the same POP configuration, but forced with monthly climatological CORE “Normal Year” forcing (Maltrud et al., 2010). More details of the simulation used in this study can be found in Delman et al (2015).
Figure 7a shows a 13-year (1995–2007) time-mean section of zonal velocity from POP model output along the glider line, at 134.5°E and between 8°N and 20°N. As in the glider observations shown in Figure 3, in POP, the strongest westward flow associated with the NEC is located between 10°N and 14°N (Figure 7a). The locations of the two strongest east-ward NEUC cores centered at 9°N and 13.5°N in POP agree well with both glider observations (Figure 4a) and with the T-S-based estimates shown in Figure 1b.
Not only the locations but also the strengths of the three eastward NEUC cores at 9°N, 13.5°N, and 15.5°–16°N in POP agree well with those from glider observations (Figure 4a). Both POP model
and glider observations show that the two southernmost jets are the strongest, with speeds up to 1.5 cm s–1 (Figures 4a, 7a). Both southernmost jets are characterized by strong variability, with a standard devi-ation up to 7 cm s–1 as determined from daily POP model output for 1995 to 2007 (Figure 7b). This strong variability in the undercurrents is partly caused by strong mesoscale eddy variability (evident in Figure 2b); it has been speculated that the generation of mesoscale eddies along the NEUC jets could be related to the triad instability of the wind-forced baroclinic Rossby waves in the eastern North Pacific basin (Qiu et al., 2013a).
Comparisons of Figure 7a with Figures 1b, 4a, 4b, and 4c show that the free for-ward runs of the two models both under-estimate the strength of the NEUC cores (Figure 4b). This could be an indication of their sensitivity to model forcing and boundary conditions.
Figure 7c shows variance-preserving spectra from the POP model of the net daily zonal transport across the same glider line over the depth range of approx-imately 700–1,400 m and averaged over the latitude bands 8°N to 15°N (encom-passing the two strongest eastward jets) and 15°N to 20°N (encompassing the two weaker jets). Near the annual frequency (2.7 × 10⁻³ cpd), the spectrum for the southern latitude band displays a strong peak, while that for the northern band shows an intermediate strength peak. In contrast, the annual frequency peak is absent in the spectrum of the trans-port integrated over the latitude range of 8°N to 20°N (Figure 7c). This indicates
FIGURE 7. (a,b) Latitude-depth section of time-mean (1995–2007) zonal velocity from Parallel Ocean Program (POP) model daily out-put along 134.5°E between 8°N and 20°N (glider line in Figure 3) over the upper 1,400 m of the water column, shown in color and in cm s–1. In (a), solid black lines are contours of the time-mean zonal velocity, also shown in color, with a contour interval 0.5 cm s–1, where only positive velocity associated with the North Equatorial Undercurrent (NEUC) is labeled. In (b), solid black lines show standard deviations of zonal velocity with contour intervals of 2 cm s–1. In both (a) and (b), gray lines show contours of σθ between 22 kg m–3 and 27.5 kg m–3, as indicated on the label. (c) Variance preserving spectra of zonal transport (Sv2) across 134.5°E between 8°N and 20°N (red line), 8°N and 15°N (blue line), and 15°N and 20°N (green line).

Oceanography | Vol.28, No.432
appreciable near annual period varia-tion of zonal transport in the two individ-ual latitude bands, which are out of phase and thus nearly entirely cancel when the full 8°N to 20°N latitude band is consid-ered (in accord with direct inspection of the corresponding time series). In the lat-itude band of the strongest eastward jets (8°N to 15°N), zonal transport is stron-gest in August/September and weakest in December/January (not shown).
A very different pattern of variabil-ity is present at semiannual frequency (5.6 × 10⁻³ cpd): the strongest spectral peak in the 8°N to 20°N band occurs at this frequency, and an intermediate strength peak is associated with the 8°N to 15°N band, while variability near this frequency is entirely lacking in the 15°N to 20°N band. In the latitude band of the strong eastward jets (8°N to 15°N), the second maximum in transport occurs in March. The timing of the two zonal trans-port maxima associated with the two strong zonal jets coincides with the timing of the two meridional transport maxima in the Mindanao Current/Undercurrent system over the top 1,000 m of the water column (Qu et al., 2008). Qu et al. (2008) attribute this semiannual variation in the western tropical Pacific Ocean to a com-bination of local Ekman pumping and westward-propagating Rossby waves originating in the central tropical Pacific. We speculate that the same mechanisms explain the semiannual variability found in the NEUC jets.
There is also notable energy at higher frequencies including intraseasonal; Qiu et al. (1999) associate these intraseasonal peaks with western Pacific zonal wind variability. Finally, we see that variabil-ity at periods longer than about a year is weak, likely because it is not well resolved with the available record length.
SUMMARYRather than a well-behaved, conflu-ent current transporting the wind-driven Sverdrup flows from the inte-rior North Pacific Ocean, the NEC in the Philippine Sea is rich in changes in its
time-mean spatial structures both hori-zontally and vertically. Underlying bot-tom topography, nonlinear rectification forced by remotely generated propagat-ing eddies, and intrinsic instability all contribute to the complex structures of the observed time-mean NEC. Subject to internal oceanic processes, as well as forc-ing by local and remote time-fluctuating surface wind stresses, the NEC exhib-its variability at time scales ranging from intraseasonal to multidecadal.
With the body of the NEC occupying the northern portion of the western Pacific warm pool, the roles played by the NEC in controlling the development of ENSO events and the regional upper ocean mass/heat budget are of particular impor-tance. From the viewpoint of dynamical processes, the NEC variability does not exert a critical impact upon ENSO evo-lution. This is because ENSO-related warm pool variability is mostly dictated by wind forcing inside the 10° equato-rial band through the recharge/discharge mechanism (Jin, 1997). In comparison, the thermodynamical roles played by NEC variability are less well explored. Because the NEC constitutes an import-ant pathway from the subtropics to the tropics in the western North Pacific basin, many observational and model-ing studies have tried in the past to quan-tify the extent to which the subtropical- origin temperature/salinity anomalies could be transmitted via the NEC toward the equator (see Sasaki et al., 2010, and references therein). Although recent mea-surements by regional programs, such as OKMC, and global efforts, such as satel-lite altimetry and Argo floats, have signifi-cantly improved data coverage in the low- latitude western Pacific Ocean, contin-ued observations are needed in order to further clarify the thermodynamical pro-cesses relating to the multifaceted NEC variability along the Philippine coast.
REFERENCESChassignet, E.P., H.E. Hurlburt, O.M. Smedstad,
G.R. Halliwell, P.J. Hogan, A.J. Wallcraft, R. Baraille, and R. Bleck. 2007. The HYCOM (HYbrid Coordinate Ocean Model) data assimilative sys-tem. Journal of Marine Systems 65:60–83, http://dx.doi.org/10.1016/j.jmarsys.2005.09.016.
Delman, A.S., J.L. McClean, J. Sprintall, L.D. Talley, and E. Yulaeva. 2015. Effects of eddy vorticity forc-ing on the mean state of the Kuroshio Extension. Journal of Physical Oceanography 45:1,356–1,375, http://dx.doi.org/10.1175/JPO-D-13-0259.1.
Dukowicz, J.K., and R.D. Smith. 1994. Implicit free- surface method for the Bryan-Cox-Semtner ocean model. Journal of Geophysical Research 99:7,991–8,014, http://dx.doi.org/ 10.1029/93JC03455.
Fine, R.A., R. Lukas, F.M. Bingham, M.J. Warner, and R.H. Gammon. 1994. The western equatorial Pacific: A water mass crossroads. Journal of Geophysical Research 99:25,063–25,080, http://dx.doi.org/ 10.1029/94JC02277.
Gordon, A.L., P. Flament, C. Villanoy, and L. Centurioni. 2014. The nascent Kuroshio of Lamon Bay. Journal of Geophysical Research 119:4,251–4,263, http://dx.doi.org/ 10.1002/2014JC009882.
Heimbach, P., C. Hill, and R. Giering. 2002. Automatic generation of efficient adjoint code for a par-allel Navier-Stokes solver. Pp. 1,019–1,028 in Proceedings of the International Conference on Computational Science-ICCS 2002, Amsterdam, The Netherlands, vol. 230, Part II, Springer-Verlag.
Hu, D., L. Wu, W. Cai, A. Sen Gupta, A. Ganachaud, B. Qiu, A.L. Gordon, X. Lin, Z. Chen, S. Hu, and others. 2015. Pacific western boundary currents and their roles in climate. Nature 522:299–308, http://dx.doi.org/10.1038/nature14504.
Huang, R.X., and B. Qiu. 1994. Three-dimensional structure of the wind-driven circulation in the subtropical North Pacific. Journal of Physical Oceanography 24:1,608–1,622, http://dx.doi.org/10.1175/1520-0485(1994)024 <1608:TDSOTW>2.0.CO;2.
Jin, F.-F. 1997. An equatorial ocean recharge par-adigm for ENSO: Part I. Conceptual model. Journal of the Atmospheric Sciences 54:811–829, http://dx.doi.org/10.1175/1520-0469(1997)054 <0811:AEORPF>2.0.CO;2.
Kalnay, E., M. Kanamitsu, R. Kistler, W. Collins, D. Deaven, L. Gandin, M. Iredell, S. Sana, G. White, J. Woollen, and others. 1996. The NCEP/NCAR 40 reanalysis project. Bulletin of the American Meteorological Society 77:437–471, http://dx.doi.org/10.1175/1520-0477(1996)077 <0437:TNYRP>2.0.CO;2.
Kessler, W.S. 1990. Observations of long Rossby waves in the northern tropical Pacific. Journal of Geophysical Research 95:5,183–5,217, http://dx.doi.org/10.1029/JC095iC04p05183.
Kim, Y., T. Qu, T. Jensen, T. Miyama, H. Mitsudera, H.-W. Kang, and A. Ishida. 2004. Seasonal and interannual variations of the North Equatorial Current bifurcation in a high-resolution OGCM. Journal of Geophysical Research 109, C03040, http://dx.doi.org/10.1029/2003JC002013.
Kobashi, F., and H. Kawamura. 2002. Seasonal variation and instability nature of the North Pacific Subtropical Countercurrent and the Hawaiian Lee Countercurrent. Journal of Geophysical Research 107, C03185, http://dx.doi.org/10.1029/2001JC001225.
Large, W., and S. Pond. 1981. Open ocean momentum flux measurements in moderate to strong winds. Journal of Physical Oceanography 11:324–336, http://dx.doi.org/10.1175/1520-0485(1981)011 <0324:OOMFMI>2.0.CO;2.
Large, W.G., and S.G. Yeager. 2009. The global cli-matology of an interannually varying air-sea flux data set. Climate Dynamics 33:341–364, http://dx.doi.org/ 10.1007/s00382-008-0441-3.
Le Dimet, F., and O. Talagrand. 1986. Variational algorithms for analysis and assimilation of mete-orological observations: Theoretical aspects. Tellus A 38:97–110, http://dx.doi.org/ 10.1111/ j.1600-0870.1986.tb00459.x.
Lukas, R., E. Firing, P. Hacker, P.L. Richardson, C.A. Collins, R. Fine, and R. Gammon. 1991. Observations of the Mindanao Current during the

Oceanography | December 2015 33
Western Equatorial Pacific Ocean Circulation Study. Journal of Geophysical Research 96:7,089–7,104, http://dx.doi.org/10.1029/91JC00062.
Maltrud, M.E., F.O. Bryan, and S. Peacock. 2010. Boundary impulse response functions in a century-long eddying global ocean simulation. Environmental Fluid Mechanics 10:275–295, http://dx.doi.org/10.1007/s10652-009-9154-3.
Marshall, J., A. Adcroft, C. Hill, L. Perelman, and C. Heisey. 1997. A finite-volume, incompress-ible Navier Stokes model for studies of the ocean on parallel computers. Journal of Geophysical Research 102:5,753–5,766, http://dx.doi.org/ 10.1029/96JC02775.
McClean, J.L., D.C. Bader, F.O. Bryan, M.E. Maltrud, J.M. Dennis, A.A. Mirin, P.W. Jones, Y-.Y. Kim, D.P. Ivanova, M. Vertenstein, and others. 2011. A prototype two-decade fully- coupled fine- resolution CCSM simulation. Ocean Modelling 39:10–30, http://dx.doi.org/10.1016/ j.ocemod.2011.02.011.
Nan, F., H. Xue, F. Chai, D. Wang, F. Yu, M. Shi, P. Guo, and P. Xiu. 2013. Weakening of the Kuroshio intru-sion into the South China Sea over the past two decades. Journal of Climate 26:8,097–8,110, http://dx.doi.org/10.1175/JCLI-D-12-00315.1.
Nitani, H. 1972. Beginning of the Kuroshio. Pp. 129–163 in Kuroshio: Physical Aspects of the Japan Current. H. Stommel and K. Yashida, eds, University of Washington Press, Seattle.
Pedlosky, J. 1987. Geophysical Fluid Dynamics. Springer-Verlag, 710 pp.
Qiu, B. 1999. Seasonal eddy field modulation of the North Pacific Subtropical Countercurrent: TOPEX/POSEIDON observations and theory. Journal of Physical Oceanography 29:2,471–2,486, http://dx.doi.org/10.1175/1520-0485(1999)029 <2471:SEFMOT>2.0.CO;2.
Qiu, B., and S. Chen. 2010. Interannual-to-decadal variability in the bifurcation of the North Equatorial Current off the Philippines. Journal of Physical Oceanography 40:2,525–2,538, http://dx.doi.org/ 10.1175/2010JPO4462.1.
Qiu, B., S. Chen, D.L. Rudnick, Y. Kashino. 2015a. A new paradigm for the North Pacific sub-thermocline low-latitude western boundary current system. Journal of Physical Oceanography 45:2,407–2,423, http://dx.doi.org/ 10.1175/JPO-D-15-0035.1.
Qiu, B., S. Chen, and H. Sasaki. 2013a. Generation of the North Equatorial Undercurrent jets by triad baroclinic Rossby wave interactions. Journal of Physical Oceanography 43:2,682–2,698,
.Qiu, B., S. Chen, L. Wu, and S. Kida. 2015b. Wind-
versus eddy-forced regional sea level trends and variability in the North Pacific Ocean. Journal of Climate 28:1,561–1,577, http://dx.doi.org/10.1175/JCLI-D-14-00479.1.
Qiu, B., and T.M. Joyce. 1992. Interannual variability in the mid- and low-latitude western North Pacific. Journal of Physical Oceanography 22:1,062–1,079, http://dx.doi.org/10.1175/1520-0485(1992)022 <1062:IVITMA>2.0.CO;2.
Qiu, B., and R. Lukas. 1996. Seasonal and interannual variability of the North Equatorial Current, the Mindanao Current, and the Kuroshio along the Pacific western boundary. Journal of Geophysical Research 101:12,315–12,330, http://dx.doi.org/ 10.1029/95JC03204.
Qiu, B., M. Mao, and Y. Kashino. 1999. Intraseasonal variability in the Indo-Pacific Throughflow and the regions surrounding the Indonesian Seas. Journal of Physical Oceanography 29:1,599–1,618, http://dx.doi.org/10.1175/1520-0485(1999)029 <1599:IVITIP>2.0.CO;2.
Qiu, B., D.L. Rudnick, S. Chen, and Y. Kashino. 2013b. Quasi-stationary North Equatorial Undercurrent jets across the tropical North Pacific Ocean. Geophysical Research Letters 40:2,183–2,187, http://dx.doi.org/10.1002/grl.50394.
Qu, T., J. Gan, A. Ishida, Y. Kashino, and T. Tozuka. 2008. Semiannual variation in the western tropical Pacific Ocean. Geophysical Research Letters 35, L16602, http://dx.doi.org/10.1029/2008GL035058.
Qu, T., and R. Lukas. 2003. The bifurcation of the North Equatorial Current in the Pacific. Journal of Physical Oceanography 33:5–18, http://dx.doi.org/10.1175/1520-0485(2003)033 <0005:TBOTNE>2.0.CO;2.
Qu, T., H. Mitsudera, and T. Yamagata. 1998. On the western boundary currents in the Philippine Sea, Journal of Geophysical Research 103:7,537–7,548, http://dx.doi.org/10.1029/98JC00263.
Rio, M.H., S. Guinehut, and G. Larnicol. 2011. New CNES-CLS09 global mean dynamic topogra-phy computed from the combination of GRACE data, altimetry, and in situ measurements. Journal of Geophysical Research 116, C07018, http://dx.doi.org/10.1029/2010JC006505.
Risien, C.M., and D.B. Chelton. 2008. A global cli-matology of surface wind and wind stress fields from eight years of QuikSCAT scatterometer data. Journal of Physical Oceanography 38:2,379–2,413, http://dx.doi.org/10.1175/2008JPO3881.1.
Roemmich, D., and J. Gilson. 2001. Eddy transport of heat and thermocline waters in the North Pacific: A key to interannual/decadal climate variability? Journal of Physical Oceanography 31:675–687, http://dx.doi.org/10.1175/1520-0485(2001)031 <0675:ETOHAT>2.0.CO;2.
Roemmich, D., and J. Gilson. 2009. The 2004–2008 mean and annual cycle of temperature, salinity, and steric height in the global ocean from the Argo Program. Progress in Oceanography 82:81–100, http://dx.doi.org/10.1016/j.pocean.2009.03.004.
Sasaki, Y.N., N. Schneider, N. Maximenko, K. Lebedev. 2010. Observational evidence for propaga-tion of decadal spiciness anomalies in the North Pacific. Geophysical Research Letters 37, L07708, http://dx.doi.org/10.1029/2010GL042716.
Schönau, M.C., and D.L. Rudnick. 2015. Glider obser-vations of the North Equatorial Current in the western tropical Pacific. Journal of Geophysical Research 120:3,586–3,605, http://dx.doi.org/ 10.1002/2014JC010595.
Stammer, D., C. Wunsch, R. Giering, C. Eckert, P. Heimbach, J. Marotzke, A. Adcroft, C. Hill, and J. Marshall. 2002. Global ocean circula-tion during 1992–1997, estimated from ocean observations and a general circulation model. Journal of Geophysical Research 107(C9), 3118, http://dx.doi.org/10.1029/2001JC000888.
Todd, R.E., D.L. Rudnick, M.R. Mazloff, R.E. Davis, and B.D. Cornuelle. 2011. Poleward flows in the southern California Current System: Glider observations and numerical simulation. Journal of Geophysical Research 116, C02026, http://dx.doi.org/10.1029/2010JC006536.
Toole, J.M., R.C. Millard, Z. Wang, and S. Pu. 1990. Observations of the Pacific North Equatorial Current bifurcation at the Philippine coast. Journal of Physical Oceanography 20:307–318, http://dx.doi.org/10.1175/1520-0485(1990)020 <0307:OOTPNE>2.0.CO;2.
Toole, J.M., E. Zou, and R.C. Millard. 1988. On the circulation of the upper waters in the west-ern equatorial Pacific Ocean. Deep Sea Research Part A 35:1,451–1,482, http://dx.doi.org/ 10.1016/0198-0149(88)90097-0.
Vianna, M.L., and V.V. Menezes. 2010. Mean meso-scale global ocean currents from geodetic pre-GOCE MDTs with a synthesis of the North Pacific circulation. Journal of Geophysical Research 115, C02016, http://dx.doi.org/10.1029/2009JC005494.
Wunsch, C. 1996. The Ocean Circulation Inverse Problem. Cambridge University Press, Cambridge, UK, 458 pp.
Wyrtki, K. 1974. Sea level and the seasonal fluc-tuations of the equatorial currents in the western Pacific Ocean. Journal of Physical Oceanography 4:91–103, http://dx.doi.org/10.1175/ 1520-0485(1974)004<0091:SLATSF>2.0.CO;2.
Wyrtki, K., and B. Kilonsky. 1984. Mean water and current structure during the Hawaii-to-Tahiti Shuttle Experiment. Journal of Physical Oceanography 14:242–254, http://dx.doi.org/ 10.1175/1520-0485(1984)014 <0242:MWACSD>2.0.CO;2.
Yaremchuk, M., and T. Qu. 2004. Seasonal variabil-ity of the circulation near the Philippine coast. Journal of Physical Oceanography 34:844–855, http://dx.doi.org/10.1175/1520-0485(2004)034 <0844:SVOTLC>2.0.CO;2.
Zhang, Y., W. Rossow, A. Lacis, V. Oinas, and M. Mishchenko. 2004. Calculation of radiative flux profiles from the surface to top-of- atmosphere based on ISCCP and other global data sets: Refinements of the radiative transfer model and the input data. Journal of Geophysical Research 109, D19105, http://dx.doi.org/10.1029/2003JD004457.
Zhuang, W., B. Qiu, and Y. Du. 2013. Low-frequency western Pacific Ocean sea level and circula-tion changes due to the connectivity of the Philippine archipelago. Journal of Geophysical Research 118:6,759–6,773, http://dx.doi.org/ 10.1002/2013JC009376.
ACKNOWLEDGMENTSThis study was supported by the Office of Naval Research project Origins of the Kuroshio and Mindanao Currents (OKMC): N00014-10-1-0267 (BQ and SC), N00014-10-1-0273 (DLR, JLM, BDC, MCS, IC and GG), and N00013-11-1-0429 (DLR and MCS). JLM and IC were also supported by a US Department of Energy Office of Science grant entitled “Ultra-High Resolution Global Climate Simulation” via a Los Alamos National Laboratory subcontract. Computational resources for the POP model simulation were provided by National Science Foundation resource grant TG110013. The POP output is available at the National Institute for Computational Sciences. Argo data were collected and made freely available by the International Argo Program and the national programs that contribute to it (http://www.argo.ucsd.edu, http://argo.jcommops.org). The Argo Program is part of the Global Ocean Observing System.
AUTHORSBo Qiu ([email protected]) is Professor, Department of Oceanography, University of Hawaii at Manoa, Honolulu, HI, USA. Daniel L. Rudnick is Professor, Scripps Institution of Oceanography, University of California, San Diego, La Jolla, CA, USA. Ivana Cerovecki is Assistant Project Scientist, Scripps Institution of Oceanography, University of California, San Diego, La Jolla, CA, USA. Bruce D. Cornuelle is Research Oceanographer, Scripps Institution of Oceanography, University of California, San Diego, La Jolla, CA, USA. Shuiming Chen is Research Associate, Department of Oceanography, University of Hawaii at Manoa, Honolulu, HI, USA. Martha C. Schönau is a graduate student at Scripps Institution of Oceanography, University of California, San Diego, La Jolla, CA, USA. Julie L. McClean is Researcher, Scripps Institution of Oceanography, University of California, San Diego, La Jolla, CA, USA. Ganesh Gopalakrishnan is Project Scientist, Scripps Institution of Oceanography, University of California, San Diego, La Jolla, CA, USA.
ARTICLE CITATIONQiu, B., D.L. Rudnick, I. Cerovecki, B.D. Cornuelle, S. Chen, M.C. Schönau, J.L. McClean, and G. Gopalakrishnan. 2015. The Pacific North Equatorial Current: New insights from the ori-gins of the Kuroshio and Mindanao Currents (OKMC) Project. Oceanography 28(4):24–33, http://dx.doi.org/10.5670/oceanog.2015.78.