occupational safety and health in brazil - rand corporation · working paper occupational safety...
TRANSCRIPT

WORKING PAPER
Occupational Safety and Health in Brazil
Risks and Policies
John Mendeloff
RAND Labor & Population
WR-1105-ALCF
July 2015
Prepared for the Alcoa Foundation
RAND working papers are intended to share researchers’ latest findings. Although this working paper has been peer reviewed and approved for circulation by RAND Labor and Population, the research should be treated as a work in progress. Unless otherwise indicated, working papers can be quoted and cited without permission of the author, provided the source is clearly referred to as a working paper. RAND’s publications do not necessarily reflect the opinions of its research clients and sponsors. is a registered trademark.

ii
Preface
This report describes selected workplace safety and health conditions and policies in Brazil. The discussion of conditions focuses on the quality of reporting about acute fatal and non-fatal work injuries. The review of policies focuses on the enforcement of safety regulations, but surveys other public interventions as well.
The report was supported by a grant from the Alcoa Foundation to the RAND Center for Health and Safety in the Workplace. It was conducted within the RAND Labor and Population Unit.
Abstract
Objectives The objectives of this paper are a) To examine the incidence of fatal and non-fatal
occupational injury rates in Brazil and b)To provide a selective overview of Brazil’s public policies to prevent those injuries, especially its program of workplace inspections.
Methods We supplemented a literature review on work injuries and public prevention policies in
Brazil with interviews with epidemiologists, government officials, and business and labor officials and with analyses of the 2012 Social Security data base on reported work injuries.
Findings A recent national household survey confirms what earlier, local studies had found: that the
injuries reported to the Social Security system represent under 20% of the total number of work injuries that occur each year. The workers covered by that system include only about ½ of the workforce, but there was substantial underreporting even among workers and injuries that should have been covered. Underreporting of fatalities is less extreme, but the magnitude is still difficult to pin down Brazil has an impressive array of public policies designed to prevent injuries, although again they often apply only to the formal sector of the economy. Although the labor inspectorate is sizable, the number of staff who are knowledgeable about safety and health may not be adequate.
Recommendations Consideration should be given to modifying the generalist system so that safety and health
specialists are better able to focus on that set of problems.

iii
Table of Contents
Preface ............................................................................................................................................. iiAbstract ........................................................................................................................................... iiFigures............................................................................................................................................. vTables ............................................................................................................................................. viSummary ....................................................................................................................................... viiAcknowledgments.......................................................................................................................... xiAbbreviations ................................................................................................................................ xiiI. Introduction ................................................................................................................................. 1
Workplace Safety in Rich and Poor Countries ......................................................................................... 1An Overview on Brazil ............................................................................................................................. 2Methods .................................................................................................................................................... 3
II. Fatal and Non-fatal Work Injuries in Brazil ............................................................................... 4Injury Rate Trends .................................................................................................................................... 6
Types of Reported Injuries ................................................................................................................... 7Issues of Underreporting—Non-fatal Injuries .......................................................................................... 8
Surveys Yield Similar Findings ........................................................................................................... 8Complicating Factors ........................................................................................................................... 8Strongest Evidence of Underreporting to Date .................................................................................... 9Patterns of Underreporting ................................................................................................................. 10
Issues of Underreporting—Fatal Injuries ............................................................................................... 12Comparing Fatality Rates in the US and Brazil ................................................................................. 13
Summary ................................................................................................................................................ 14III. Prevention in Brazil ................................................................................................................ 15
Requiring the Employment of Safety Staff ............................................................................................ 15Mandating Wage Premiums for Some High Risk Jobs .......................................................................... 16Introducing Experience Rating—the Accident Prevention Factor (FAP) .............................................. 16CIPA ....................................................................................................................................................... 16Public Prosecutors and Labor Courts ..................................................................................................... 17Inspections and Enforcement.................................................................................................................. 17
Recent Evolution of Labor Inspection ................................................................................................ 18Workload and Inspection Quality ....................................................................................................... 20Responding to Complaints Versus Planned Inspections .................................................................... 20Inspecting Small Versus Large Businesses ........................................................................................ 21
Inspection Style ...................................................................................................................................... 23A Major Deficiency ............................................................................................................................ 24
Stakeholder Viewpoints .......................................................................................................................... 24Concluding Observations ....................................................................................................................... 25

iv
References ..................................................................................................................................... 27Appendix A ................................................................................................................................... 30

v
Figures
Figure 1. Proportion of Labor Market Roles by Level of Risk in Brazil, 2010. ............................. 6Figure 2. Accident and Fatality Rates Reported to INSS, Brazil 1990-2012 ................................. 7Figure 3. Ratio of Survey-Reported Work Accident Rate to Rate Reported to INSS .................. 10Figure 4. Estimated Coverage of Survey Varied by State ............................................................ 11

vi
Tables
Table 1. Distribution of Economically Active Population by industry, level of risk, and role in labor market. Brazil, 2010 ...................................................................................................... 5
Table 2. Changes in Safety and Health Inspection Actions, 1996-2012 ...................................... 19Table 3. The Size of Establishments Receiving Safety and Health Inspections, 2014 ................. 22Table 4. MTE health and safety enforcement actions in 2011, selected industries. ..................... 23NR 4 - REGULATORY STANDARD 4 SPECIALIZED SERVICES IN SAFETY
ENGINEERING AND OCCUPATIONAL MEDICINE ..................................................... 30
vii
Summary
Introduction
This paper was written to examine the current status of safety and health conditions in Brazil and to consider the role of public policies in fostering improvements. The former task was limited to the occurrence of acute traumatic injuries, fatal and non-fatal. Therefore, many important issues —like long-term occupational diseases and forced labor—are not addressed. The second task focuses primarily on enforcement issues.
Methods
Research for this study included several components: First, we conducted a literature review to identify studies dealing either with a) the incidence of occupational injuries and illnesses, fatal and non-fatal, in Brazil; and b) Brazilian public policies related to the prevention of those events. Second, we obtained a database from the Brazilian Social Insurance system that included all of the work injuries reported during 2012. We used these data to analyze detailed causal factors in different industries. Third, we carried out interviews with epidemiologists, government officials, and business and labor officials concerned with safety in Brazil.
Fatal and Non-Fatal Injury Rates in Brazil
The reported work injury rate in Brazil declined sharply in the 1970s and 1980s, but has been relatively stable since then. However, what these movements tell us about the actual level of safety is unclear. The social security system in Brazil collects reports on occupational injuries (and illnesses) only from formalized firms and the number of workers covered grew considerably in the 1970s and 1980s and again after 2000. Thus it is not clear to what extent changes in rates are due to differences in the risks faced by newly covered workers versus changes in risk at given workplaces. In addition, of course, reporting of injuries is subject to numerous filters that affect the results we see. Several local surveys conducted from 1994 to 2004 showed that most accidents were not reported and that, even among formalized workers, the underreporting is large. Those studies suggested that the actual number of work accidents was at least 4 to 5 times as large as the number reported in the social security data. A national household survey published in 2015 found that in 2013 there were almost 7 times as many. The gap between the survey findings and the reported numbers was greatest for rural states, which tended to report the lowest rates.
We generally assume that fatalities are better reported than lesser injuries. The reported fatality rate leveled off at about 6 per 100,000 covered workers in 2009 and has remained at that

viii
level through 2013. An analysis shows that the sectors where fewest workers are formalized (agriculture and construction) have high fatality rates, which suggests that the total number of deaths is probably larger than we would estimate by simply adjusting for the percentage of all workers who are covered by the reporting requirement.
Comparing Brazilian fatality rates to those in other countries requires careful disaggregation in order to ensure that the categories of deaths are comparable. In 2012, 43% of the reported deaths in Brazil were due to commuting accidents. Excluding them leaves a rate for covered workers of 3.6 per 100,000. In the US (which does not count commuting deaths), the fatality rate in 2012 for all workers was 3.4. However, the US fatality rate for wage and salary workers was 2.8 and the rate for self-employed workers was 12.8. Brazil’s figures do not cover the self-employed, who comprise almost ½ of the labor force. If the disparity in rates between the two groups in Brazil resembles the US pattern, the number of deaths in Brazil might be 4 times the reported number.
Public Policies for Prevention
Brazil has a diverse set of public policies to prevent occupational injuries and illnesses. As many have noted, the Brazilian Constitution itself (of 1988) lays out many workers’ rights in surprising detail. As is true of even the most developed countries, however, we know very little about the effectiveness of these prevention policies. Brazil introduced experience rating to its national workers’ compensation program in 2010 and has long required that larger firms in riskier industries employ specified numbers of safety and health staff.
Brazil relies on a generalist system of labor inspection where inspectors are expected to enforce both safety and health regulations but also other labor standards dealing with hours of work, minimum wages, and forced labor. Although the overall labor inspectorate employs close to 3,000, fewer than 500 have formal training in safety and health. It is difficult to decide how to categorize inspections as “safety and health,” although it appears that the number is very large relative to the number of inspectors with formal training. Many inspections appear to be relatively superficial, and 40% occur at workplaces with 10 or fewer workers. Inspectors have become more aggressive about citing violations, although, for small workplaces, there are provisions that require warnings and an opportunity to correct violations before a fine can be levied. The health and safety inspectors do not carry out any monitoring of toxic exposures at workplaces, although they may order firms to hire someone to do it.
Further Observations
One very positive feature of the workplace safety and health situation in Brazil is the active interest of many people inside and outside of government in working to improve public policies and social practices. For example, the 2011 book on Health and safety at work in Brazil: institutional aspects, information systems and indicators reflects an impressive collaboration

ix
among ministries and think tanks to reflect on safety and health problems and to map out some strategies to address them. In addition, the Ministry of Health, working with several university public health programs, has been designing new ways to carry out surveillance.
But, at the same time, there are concerns about shrinking resources. We have noted the concern about a future decline in well-trained safety and health inspectors. And the staff at Fundacentro, the chief Ministry of Labor think tank on safety, has been declining. Without resources, good ideas and strategies will not do a great deal of good.
Certainly, there are problems, often deep-seated, that need to be addressed. The existence of the informal economy makes it difficult to obtain data to identify problems and difficult to use many of the tools for prevention for close to half of the workforce. Although there are pressures encouraging firms to formalize, there are also countervailing economic trends (e.g., greater contracting out) at work (Weil 2014).
Changes to Consider
The difficulties in establishing denominators, although not an overwhelming problem, creates intellectual difficulties that hamper communication and understanding. Similarly, the uncertainties about how to identify which inspections are for safety and health make it more difficult to plan how to use inspections or to track the effects of interventions.
Although this point is speculative, the generalist system of labor inspection may bear some responsibility for declining morale among inspectors focused on safety and health. A minority overall and in each state office, they may think that their technical skills are not highly valued by the organization. Much more information would be needed to draw up a balance sheet about the benefits and costs of the generalist system, but one idea may have some merit.
It seems likely that the generalist system has its greatest value in ensuring that a larger number of workplaces will see someone who has at least a modicum of knowledge about many types of labor standards. This value is greatest when inspections are especially rare, due either to isolation and long distances or the small size of the establishments. Perhaps there could be some division between safety and health inspectors and other labor inspectors along the following lines. Generalist inspectors would be used primarily in rural areas and at very small workplaces. Specialists, either for safety and health or for other labor standards, would concentrate on urban areas and larger workplaces. It seems possible that this approach might make better use of the different skill sets. Relying more on better-trained inspectors in each area may also help to address employers’ complaints about inconsistent enforcement.
One major shortcoming in the current program is the absence of any capability to monitor and collect industrial hygiene data. All countries face great obstacles in identifying cases of occupational disease; however, it is feasible to collect information about exposures to toxic chemicals and harmful physical agents. Currently, this is not being done and it would be

x
desirable for the Ministry of Labor and the Ministry of Health to seek to jointly develop and apply this capacity.
Although more information is certainly needed on this point, it also appears that there is inadequate attention to the consultation and training needs of employers and employees at establishments too small to be covered by the requirement that firms employ safety and health staff.

xi
Acknowledgments
This study was supported by a grant from the Alcoa Foundation to the RAND Corporation’s Center for Health and Safety in the Workplace. We thank the Foundation and the program officers with whom we worked, Scott Hudson and Esra Ozer.
We are especially grateful to the many people who took time to help me try to understand workplace safety and health issues in Brazil. They include the following:
Ciro Cato Heleno Correa Filho Sergio Medici de Eston Carolyn Kazdin Jorge Machado Rene Mendes Joao Batista Menezes Heitor Parenti Francisco Pedra Roberto Pires Edson Augusto dos Reis Vilma Sousa Santana Jeferson Seidler Fernando Vasconcelos Special thanks go to Vilma Sousa Santana and Jeferson Seidler for their help. At RAND, Daniela Kusuke served as a research assistant and translator and Michelle Horner
prepared the manuscript. Joy Moini in the RAND Labor and Population program helped to provide coordination. Jeffrey Shockey from Alcoa played a valuable role in supporting the project.

xii
Abbreviations
ACGIH American Conference of Governmental Industrial Hygienists
ANEST National Association of Occupational Safety Engineering (Associação Nacional de Engenharia de Segurança do Trabalho)
CAT Notification form for Workplace Accidents (Comunicação de Acidente do Trabalho)
CEREST Center of Reference in Occupational Health (Centro de Referência Em Saúde do Trabalhador)
CIPA Internal Commission for the Prevention of Accidents (Comissão Interna de Prevenção de Acidentes)
CNI National Industrial Federation (Confederação Nacional da Indústria)
CTPP Tripartite Joint Permanent Commission (Comissão Tripartite Paritária Permanente)
DEFIT Department of Labor Inspection (Departamento de Fiscalização do Trabalho); in SIT
DIEESE Inter-Union Department of Statistics and Socioeconomics Studies (Departamento Intersindical de Estatística e Estudos Socioeconômicos)
DSST Department of Workplace Health and Safety (Departamento de Saúde e Segurança no Trabalho); in SIT
FAP Experience rating (fator acidentario de prevenção)
IBGE Brazilian Institute of Geography and Statistics (Instituto Brasileiro de Geografia e Estatística)
ILO International Labour Organization
INSS National Institute of Social Security (Instituto Nacional do Seguro Social)
IPEA Applied Economic Research Institute (Instituto de Pesquisa Econômica Aplicada)
MPS Ministry of Social Security (Ministério da Previdência Social)
MTE Ministry of Work and Employment (Ministério do Trabalho e Emprego)
NR Regulatory norms—safety and health regulations (normas regulamentadoras)
SESMT Requirement for firms to employ safety staff (Serviços Especializados em Engenharia de Segurança e Medicina do Trabalho)

xiii
SIM System of death certificates (Sistema de Informações de Mortalidade)
SINAN National notifiable diseases information system (Sistema de Informação de Agravos de Notificação)
SIT Secretariat of Labor Inspection (Secretaria de Inspeção do Trabalho); in MTE
UGT General Union of Workers (União Geral dos Trabalhadores)

1
I. Introduction
Reported deaths and injuries occurring in Brazilian workplaces have been declining for decades, but research has long suggested that undercounts in reporting make Brazilian workplaces appear safer than they really are. Now, thefirstnationalhouseholdsurveyinBrazilthathasaskedaboutaccidentsatworkgenerallyconfirmswhatsmaller‐scalestudieshadbeenindicating:officialreportinggreatlyunderestimatesthetotalannualnumberofworkinjuries.
The objective of this paper is to review the current data on the incidence of workplace deaths and injuries and to provide a selective overview of Brazilian policies affecting workplace safety and health. With regard to the discussion of injury and fatality incidence, we don’t undertake any major new analyses, but instead try to assess the implications of studies that have been carried out. Considerable description of Brazilian policies exists in English, particularly in reports sponsored by the International Labour Organization (ILO). Rather than repeat this description, we try to present a more selective discussion of the role of different policies on work safety.
Workplace Safety in Rich and Poor Countries
When labor is cheap and capital is expensive, managers will be less likely to substitute capital for labor in order to reduce worker exposures to dangers. When basic needs are barely met, we expect the demand for safe work to often have a low priority. Thus there will be a strong tendency for richer countries to have safer workplaces. In addition, of course, more workers in richer nations have moved into occupations that pose lower fatal injury risks. As an example of the relationship between wealth and risk, one study of European Union members found that the fatality rate for a comparable set of industry sectors declined by 5-10% for each $1,000 increase in per capital GDP (Mendeloff and Staetsky, 2012). Whether a similar relationship applies to poorer countries is difficult to determine because the validity of the data, even for fatality rates, is more suspect.
The poor quality and general lack of availability of data make it difficult to be precise about the level of health and safety outcomes that we should expect Brazil to have achieved based on its level of economic development. Brazil, with the world’s fifth largest population, has a per capita income about one-fourth the level of the US and Western Europe. Based on this, it would be surprising for Brazil to be as safe as Western Europe or the US, or to be no safer than much poorer countries.
However, the level of wealth and even the industry composition of the workforce, while very important for shaping safety and health conditions, do not tell the whole story. Culture, institutions and public policies can contribute independently to the outcomes. The United States,

2
for example, although considerably richer than the United Kingdom, has a fatality rate that is at least twice as high.
An Overview on Brazil
Much of Brazilian law demonstrates great concern with the conditions of workers. The 1988 Constitution, adopted after the end of the military dictatorship, contains many detailed protections that, in other countries, would be handled only through statutes or regulations. For example, the Constitution specified maximum weekly hours and banned dangerous work for those under 18 (Santos 2014). These provisions reflect the intimate involvement of the government in labor relations.
Brazilian law also stipulates the number of different types of safety and health staff that establishments, depending on the size and industry, are required to hire. As a result there is a sizable group (over 100,000 people) that provides a lobby for safety as well as a resource at many workplaces.1
But these staffing requirements apply only to larger establishments and only to those in the formal sector. As in many poorer countries, a large percentage of workers and firms (almost 50% in Brazil) do not contribute to social insurance and are not registered with the government for social security benefits, including compensation for injuries. Thus their injuries are not reported and do not appear in most government statistical series. Another feature of Brazil is the relatively large (about 20%) share of the workforce engaged in agriculture. A great majority of these workers are not in formal jobs. Brazil still remains plagued by concerns about forced labor and child labor, although it has won praise for progress on these fronts (ILO 2011).
Corruption is another feature more common in poorer economies. In the 2014 Transparency International survey of perceived corruption in the public sector, Brazil was ranked 69th of 174, just behind Turkey, South Africa and Kuwait. In Latin America, however, it ranked above all countries except Chile and Uruguay.
Brazil’s safety and health policies have been guided to a significant degree by the International Labour Organization. Recently, it has innovated with a number of initiatives that appear to provide stronger incentives for worker safety and better tools for tracking and understanding workplace conditions.
In the discussion of Brazilian policies that follows, we are almost never able to rely on strong evidence about effectiveness. In this respect, however, Brazil resembles most developed economies. Although some evaluation and analysis has been conducted in richer countries, the kind of evidence that could be used to judge these policies is usually lacking there as well.
1 See Anuario Brasileiro de Protecao, 2015.

3
Methods
Research for this study included several components:
First, we conducted a literature review to identify studies dealing either with a) the incidence of occupational injuries and illnesses, fatal and non-fatal, in Brazil; or b) Brazilian public policies related to the prevention of those events.
Second, we obtained an electronic database from the National Institute of Social Security (INSS), Brazil’s social insurance system, which included all work accidents reported in 2012. We used these data to look in more detail at the types of accidents that were occurring.2
Third, we carried out interviews with epidemiologists, government officials, and business and labor officials concerned with safety in Brazil. Those we contacted are cited in our acknowledgements.
2 Tables based on the data base are available in Ministerio do Previdencia Social (2013) .

4
II. Fatal and Non-fatal Work Injuries in Brazil
Data sources on work injuries and health have improved in recent years, although they remain incomplete (Santana 2013). A key complication is that reports of injuries to the INSS) are required only for people registered as formal workers—that is, those who have obtained a work permit (called a carteira de trabalho). Any employer of this worker is supposed to record all employment contracts in the work permit document and to report earnings to the INSS. It entitles the worker to benefits paid by the employer and requires employers to pay the taxes needed to fund public benefits.
In theory, it is illegal for a firm not to provide a worker with formal coverage. In practice, Table 1 shows that, in 2010, only 45% of Brazilian workers had formal status. This percentage has increased over time, although not always at a steady rate. In 2013, it exceeded 50%. The issue of formal coverage is complicated because registration can be done by the individual worker and by the employer.3
In addition, not all workers who contribute to the INSS are covered by “workers’ compensation” and entitled to get work-related benefits for work-related injuries or diseases. The self-insured may voluntarily contribute to social security, but they are not covered by work-related benefits. Neither are domestic workers.4 Public employees and the military are covered for health expenses but not for work-related compensation benefits.
To have denominators to calculate injury or fatality rates, we need to know how many workers are covered by the INSS data. Since some workers are covered in some jobs some of the time, calculating a clear measure of worker exposure that can be matched with injury reports is complicated.5
Table 1, created by Santana (2013), reflects the average number of workers who contributed to the INSS during the year. It still does not capture the actual hours of work. In the literature on injury rates, we often find different denominators being used.6
3 Thus we can have all 4 cells of a 2 x 2 table filled in. So registered workers can work for registered firms and unregistered workers can work for unregistered firms. Conversely, a registered worker can work at an unregistered firm and an unregistered worker can work at a registered firm. Accidents to workers in these last two situations should be reported; however, poorer reporting for them is likely. 4 In mid-2015, formal registered domestic workers became covered by workers’ compensation insurance. 5 We do not examine here the complex issue of the many filters that affect whether workers report injuries and whether employers report them. See Azaroff et al. 2002. 6 See Ministerio do Previdencia Social (2013) . Table 32.4 in that report indicates that 67,149,740 different individuals contributed to the social security system in 2012 of whom 51,513,196 were employed workers. However, Table 33.1 indicates that there were 53,811,575 contributing employees. And Table 33.4 showed that the average monthly number of contributing employees was 40, 522,864.

5
Table 1. Distribution of Economically Active Population by Industry, Level of Risk, and Role in Labor Market, Brazil, 2010
Industry Number of workersLevel of
Risk
Type of Job in the Labor Market
Formal Informal Informal Autonomous
Farming 17,118,949 3 2,416,048 3,085,015 11,617,886
Industry 20,131,280 3 9,809,839 3,796,895 6,524,546
Mining 294,555 4 193,448 44,178 56,929
Manufacturing 12,520,285 3 7,487,248 1,862,642 3,170,395
Utilities 409,761 3 337,489 72,272 -
Construction 6,906,679 4 1,791,654 1,817,803 3,297,222
Service 58,982,380 2 31,324,724 14,131,023 13,526,633
Commerce 15,525,395 2 7,894,149 2,453,408 5,180,838
Transport 4,288,157 3 2,077,154 687,830 1,523,173
Information Services 1,835,689 1 630,273 572,710 632,706
Finance 947,663 1 757,874 145,233 44,556
Real Estate 656,726 1 312,769 144,318 199,639
Other Services 25,344,982 1 10,470,756 8,988,270 5,885,956
Administrative 10,383,768 1 9,184,749 1,139,254 59,765
Total 96,232,609 -- 43,550,611 21,012,933 31,669,065
Source: IBGE, Direitoria de Pesquisas, Coordenacao de Contas NacionaisTaken from Santana 2013, Table 3.
Table 1 also includes the average risk level, as judged by the Ministry of Labor and
Employment (MTE), for each industry. In Figure 1, we show the percentage of formal workers by risk category, where 4 is the most risky. Overall, riskier jobs are less likely to be formalized. The implication is that complete coverage of the workforce would tend to increase the average level of risk, a point we return to below.

6
Figure 1. Proportion of Labor Market Roles by Level of Risk in Brazil, 2010.
Injury Rate Trends
Figure 2 shows the rates of reported injuries and fatalities in Brazil for the last two decades. Uncertainties about the quality of reporting make it very difficult to interpret the changes in non-fatal rates. As described below, there is substantial underreporting of non-fatal injuries even within the formal sector.
The long-term trend in the reported fatality rate is clearly downward. The number of reported deaths peaked in 1987 at 5,738. The rate per 100,000 workers dropped below 30 in 1976 and hasn’t been above 20 since 1991. It hit 12 in 2000 and has remained at about 6 since 2009.
The volatility in the fatality rate during the 1990s is difficult to understand. It was a period when the size of the covered workforce was relatively stable. Since 1999, the number of formal workers has almost doubled and the fatality rate dropped from about 16 per 100,000 to 6 per 100,000. Thus we have the problem of interpreting the rate changes in light of the large expansion of the number of registered workers.
0
10
20
30
40
50
60
70
80
90
100
1 2 3 4
%
LevelofRisk
Informalautonomous
Informal
Formal
Source: IBGE,DiretoriadePesquisas,CoordenacaodeContas

7
Figure 2. Accident and Fatality Rates Reported to INSS, Brazil 1990-2012
Types of Reported Injuries
Before proceeding, it will be helpful to briefly review some of the categories used to describe reported injuries. Employers are required to issue a Notification of Accident at Work (CAT), which is then registered with the social security system (INSS).7 Non-fatal injuries with CATs are reported in three categories: typical, commuting, and diseases. All of the injuries are also classified as medical only, permanent incapacity, death, or temporary injuries with either 15 or fewer days of work lost or more than 15. This last distinction is important because the employer is responsible for compensating the worker for the first 15 days; the social security system pays the worker after that. Since the mid-1990s, commuting injuries have increased their share of all accidents with CATs from less than 10% to 20%. Diseases in 2013 accounted for only 2.7% of the cases with a CAT. The number was only ½ of what it had been 8 years before.
For comparisons with other countries that do not count commuting injuries, it is important to subtract these accidents which, in recent years, have comprised about 15-20% of the non-fatal injuries with CAT registration.
7 Since 2007, injuries to a registered worker are also counted even if no CAT is submitted.7 This policy change led to a sizable increase in the reported injury rate. Information on the categories above is not provided for cases without a CAT. In 2012 injury cases without a CAT constituted about 25% of all reported injuries; they ranged from over 40% of the total in the state of Bahia to less than 20% in Sao Paulo.

8
Issues of Underreporting—Non-fatal Injuries
The number of accidents reported through INSS has ranged from 1.5 to 2.0 per 100 covered employees since the early 1990s. At the state level, there is wide variation. In most of the less-developed states, reported injury rates have increased during the last two decades—probably due to more complete reporting—but still tend to be below the national average. In the more industrial states of the Southeast and South, the reported rates declined during the 1990s but largely stabilized during the past 15 years. For example, Sao Paulo state, with almost 30% of Brazil’s workers, had a reported rate above 4 per 100 in 1991 and 1992. By 2000, the rate had fallen below 2. Through 2013, it has risen and fallen within a range of 1.8 and 2.2.
Surveys Yield Similar Findings
For non-fatal injuries, surveys can help address incomplete reporting, although these have obvious potential biases due to recall problems, definitional confusions, and other matters.8 Still, it is noteworthy that survey studies identified by Santana et al.’s 2005 review showed some broadly similar results. Barata et al.’s household survey (2000) in Sao Paulo indicated an annual injury rate of 3.5 per 100 responding workers. Binder and Coredeiro’s (2003) study of the city of Botucito in Sao Paulo estimated a rate of 4.1, while Santana estimated a rate of 5.6 for a population in Salvador. Two surveys in rural areas estimated annual incidence rates of 10% (Faria et al. 2000) and 11% (Fehlberg et al. 2001). Thus, for this period, there is evidence that the INSS data understated the rate of work injuries by at least a factor of 2 in urban areas and perhaps twice that in rural areas.
Another important point is that some studies indicated whether the unreported injuries would have been covered. For example, Barata et al. (2000) found injuries in the formal sector had been underreported in INSS by 42%, well below the total undercount figure of 71%, but still a substantial amount.9 Binder and Cordeiro (2003) found that 54% of the injuries of covered workers had not been reported (and 78% of the injuries to all workers).
Complicating Factors
Several other features of Brazil’s injury data are noteworthy, especially when compared with United States data. One is that the number of cases identified as involving only medical assistance constitutes only about 15% of all reported accidents. In the US, employers are required to report cases involving medical treatment beyond first aid, even if the injuries have no effect on work loss or work assignment. In 2013, these “medical only” cases accounted for almost half of all injury and illness cases reported in the US Survey of Occupational Injuries and
8 Also, reporting of a number of accident types through the CEREST program has improved (Galdino et al. 2012). 9 Because the injuries of non-formal workers are not included in the INSS, non-reported may be a more accurate term than under-reporting.

9
Illnesses (SOII) (accounting for a rate of 1.7 per 100 workers out of a total recordable rate of 3.5). Given that health care in Brazil is paid for by the government out of general revenues, it is not surprising that these cases are often not reported.
Another disparity is that the numbers of cases with temporary disability in Brazil are about evenly split between those with less than 16 days off work and those with 16 days or more. (In 2013, 56% were less than 16 days.) Thus the median number of days lost from work is about 14 or 15. In the US, the median number of days lost in cases that involved days lost averaged about 7. The implication of this difference for the severity of injuries is not certain, but it certainly indicates that the economic impact of these temporary disabilities is greater in Brazil. It is also consistent with more underreporting of less serious injuries in Brazil (although US injuries are also underreported).
Another category of work injuries is reported in the US but not in Brazil: those involving restricted work activity or job transfer. In the US, this category has grown almost as large as the number of cases with days away from work. In 2013, it accounted for 0.7 injuries per 100 workers compared to 1.1 injuries with days away from work per 100 workers.10
Strongest Evidence of Underreporting to Date
Both the local surveys and the omission of these categories of injuries suggest that the true number of work injuries is much larger than the total captured in the INSS system. Indeed, the first national household survey of injuries, whose findings were released in June, 2015, estimated that the total number of work injuries in 2013 among all people over 17 years old was just under 5 million (compared to the INSS total below 800,000) and that the rate was 3.4 per 100 (about 2.3 times the INSS rate) (IBGE 2015). However, the new survey has problems of its own. The rate is based on a denominator of all 145 million people over 17. Not all of them work and not all of those working do so full-time. The number of full-time equivalent (FTE) workers in Brazil is closer to 100 million. Therefore, the rate per 100 FTE would be closer to 5 than to 3.4.
Because many factors affect the reporting of injuries and because the severity of the injuries is important to consider, attempts to identify the “true” overall injury rate need to consider what the purpose of the effort is.11 Regardless of its precision, the new estimate is certainly a better indicator of the work injury numbers than the INSS figures and should serve to give greater visibility to the issue. Even though, on average, the injuries identified in the survey are likely to be less serious than those reported to INSS, they are still likely to impose substantial social costs and need to be recognized.
10 Data from the SOII are available at www.bls.gov. Thus the total recordable injury and illness rate for all US industries in 2013 was 3.5 per 100 full-time equivalent workers. Medical only cases contributed 1.7 per 100; days away from work cases, 1.1; and restricted work activity cases, 0.7. 11 For example, even if injuries are underreported, if the underreporting is stable, the results can still be useful as a social indicator and for evaluation efforts.
10
Patterns of Underreporting
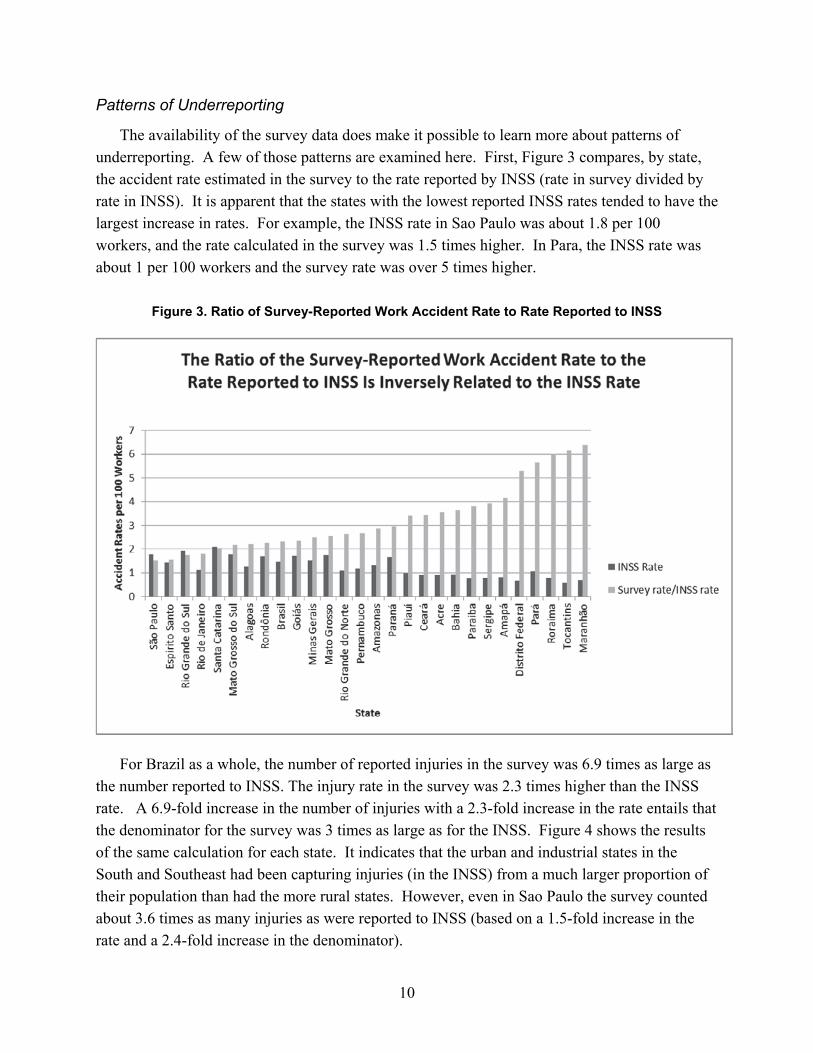
The availability of the survey data does make it possible to learn more about patterns of underreporting. A few of those patterns are examined here. First, Figure 3 compares, by state, the accident rate estimated in the survey to the rate reported by INSS (rate in survey divided by rate in INSS). It is apparent that the states with the lowest reported INSS rates tended to have the largest increase in rates. For example, the INSS rate in Sao Paulo was about 1.8 per 100 workers, and the rate calculated in the survey was 1.5 times higher. In Para, the INSS rate was about 1 per 100 workers and the survey rate was over 5 times higher.
Figure 3. Ratio of Survey-Reported Work Accident Rate to Rate Reported to INSS
For Brazil as a whole, the number of reported injuries in the survey was 6.9 times as large as the number reported to INSS. The injury rate in the survey was 2.3 times higher than the INSS rate. A 6.9-fold increase in the number of injuries with a 2.3-fold increase in the rate entails that the denominator for the survey was 3 times as large as for the INSS. Figure 4 shows the results of the same calculation for each state. It indicates that the urban and industrial states in the South and Southeast had been capturing injuries (in the INSS) from a much larger proportion of their population than had the more rural states. However, even in Sao Paulo the survey counted about 3.6 times as many injuries as were reported to INSS (based on a 1.5-fold increase in the rate and a 2.4-fold increase in the denominator).

11
Figure 4. Estimated Coverage of Survey Varied by State
We examined another issue with the survey data. We calculated the percent of temporary incapacity injuries in each state that involved fewer than 16 days and looked at the correlation of those figures with the accident rate reported by the survey in each state. The assumption was that underreporting is more likely to occur with injuries of lesser severity. Thus states where a higher proportion of reported injuries involve 16 days or more away from work might be expected to have lower reported injury rates.12
The distribution of temporary incapacity cases ranges quite widely across states. Averaging the numbers of cases over 3 years (2010-2012), the percentage with less than16 days ranged from 25% in Piaui (and less than 38% in Acre, Paraiba and Santa Catarina) to 63% in Espirito Santo (and 60% or more in Amazonas and Sao Paulo).13 With thousands of cases involved, variations this large seem very unlikely to reflect “natural” differences in injury severity.
We found that the correlation for the 27 states and the Federal District was -0.27 with a 1-tailed “p” value of .08. Thus, it does appear that a lower percentage of temporary disability cases falling below the 16-day threshold for public compensation is somewhat associated with greater underreporting.
12 Also, it seems plausible that, since firms are the ones who pay for lost wages for the first 15 days, they have limited incentive to report those injuries, especially since those cases are now potentially going to count against them in the calculation of the experience rating (Fator Acidentario de Prevencao, or FAP). (See below.) 13 It is worth noting that these percentages, although fairly stable within states over short periods, have fluctuated considerably over the last 20 years.

12
Issues of Underreporting—Fatal Injuries
Researchers generally assume that fatalities are better-reported than less severe injuries. They are harder to hide. Still, depending on the mechanisms for reporting them, substantial underreporting is possible.
For fatalities, we can’t rely on household surveys. The alternative sources of data include death certificates (SIM), reports from hospitals and clinics (the SINAN system), police reports, newspaper reports, and the accident investigations conducted by the safety inspectors. In the period through 2004 covered by Santana et al.’s review, SIM dramatically undercounted fatalities because they usually omitted information pertaining to work-relatedness. In the 8 studies she identified, the numbers of work deaths reported in SIM were considerably less than half of those reported to INSS (except for the City of Sao Paulo). Information on death certificates has improved in the last decade (Neto et al. 2011), and new comparisons among fatal data systems, including the improved reporting through health care providers, are under way; however, there has so far been limited success in synthesizing the data in a satisfactory way.
One 2003 paper (Giufridda et al,) noted that Brazil had reported 3,800 work deaths in 1998. So, if a) this constituted 100% of the deaths in the formal sector; and b) the formal sector accounted for 1/3 of total exposures; and c) the average riskiness of the two sectors were equal, then it would be reasonable to triple the number of deaths reported, to 11,400. Their “ less conservative” estimate assumed that a) only 50% of formal sector deaths were reported and b) that the true risk in the informal sector was 50% higher than in the formal sector. Those assumptions would generate an estimated total for Brazil in 1998 of 7,600 (3,800 times 2) in the formal sector. Then the informal sector would be assumed to have two times as many workers and a rate 50% higher, for a total of 3 times as many deaths, or 22,800. Thus the high estimate for Brazil as a whole in 1998 would be 30,400.
We took the analysis of risks in different sectors, shown in Figure 1, a step further by taking the fatality rates for each industry and projecting how many deaths would be reported, under the assumption that the death rate was the same in the formal and non-formal employment within each sector. For example, since 14% of agriculture employment was formal and since there were 161 reported deaths in agriculture in 2012, we projected that there would be 1,141 deaths if all agriculture workers were formalized [(1/0.14)*161]. Carrying this out for the other industries in Table 1 leads to a projection of 6,425 total deaths. This estimate assumes a) that there is now complete reporting for covered workers and b) that the rates are the same for formal and non-formal workers in the same industry. If reporting for formal workers is less than complete, the estimate would be higher. If rates for formal workers are not equal to those of other workers in the same industry, the estimates would be higher or lower.

13
We also examined the INSS database of reported injuries for 2012 in order to examine some distinctions that published data do not show.14 Only 10 deaths were due to diseases; 1,108 were due to commuting accidents; and the “typical” category had 1,458. Thus, while the percent of reported non-fatal injuries due to commuting was around 20%, the percent for fatal injuries was 43%. Excluding the commuting deaths, we have 1,468 deaths for 40,553,000 covered workers, a rate of 3.6 per 100,000 workers.15
Comparing Fatality Rates in the US and Brazil
The US injury and fatality data do not include commuting events.16 The US fatality rate in 2012, based on 4,628 deaths, was 3.4 per 100,000 full-time equivalent workers.17 Thus it is very close to the Brazilian rate. However, there are several additional factors to consider, which present a somewhat different picture. First, and more important, the US fatality rate for wage and salary workers was 2.8 per 100,000 while the rate for the self-employed was 12.8. Since the formal sector in Brazil excludes the self-employed, the 2.8 figure may be the better basis for comparison with the 3.6 rate in Brazil. This difference is still surprisingly small, but, as we note, other adjustments would increase it. One further adjustment could be to exclude other transportation deaths.
Forty-two percent (1,923) of the US deaths involved transportation (i.e., other than for commuting). In Brazil in 2012, we counted 492 transportation deaths among typical deaths, 34% of that total.18 Thus, a comparison of non-transportation death rates would show a bigger disparity. The relatively small number of reported work transportation deaths in Brazil seems somewhat surprising in light of the far greater use of motorcycles for highway transport and the less modern highway infrastructure.
The biggest wild card in estimating deaths in Brazil is the rate in the non-formal sector. If the gap in rates in Brazil between employed and self-employed workers is anywhere near as large as in the United States, the overall death rate could be 3 times the US rate. One clear lesson here is the importance of disaggregating in order to better understand what is going on.
14 Interestingly, that data set has 2,576 deaths (cases where the indicator of death is “yes”), about 200 fewer deaths than other data report. 15 This figure appears in the AEPS data from INSS for the average monthly number of workers making contributions to INSS during the year. 16 In the United Kingdom, all highway motor vehicle deaths are excluded from the work fatality figures, not just commuting deaths. 17 Data from the Census of Fatal Occupational Injuries is available on the U.S. Bureau of Labor Statistics website, www.bls.gov. 18 The causal agent codes we used to identify transportation accidents were 30.30.75.100 (bicycles), 303.30.75.200 (motorcycles), 30.30.75250 (motorized road vehicles), 30.30.75.300 (rail), 30.30.75.350 water transportation), 30.30.75.400 (airplanes) and 30.30.75.900 (vehicles not elsewhere classified). We did not count mobile machinery like forklifts and bulldozers.

14
Summary
In short, we found that the INSS figures greatly underestimate—perhaps by a factor of 6 to 8 times—the total annual number of work injuries in Brazil, based on our review of the literature and alternative data from a number of small surveys and one national study.
The precision (or imprecision) of workplace fatalities is less clear-cut because alternative data sources are unreliable, but it appears that fatalities may be at least 2.3 times higher than the official figure (excluding commuting deaths). At 3.6 per 100,000 workers, the rate of workplace fatalities in Brazil (excluding commuting deaths) is not too dissimilar to that of the United States, at 2.8 per 100,000 (excluding self-employed workers).
15
III. Prevention in Brazil
Brazil has an array of public policies that may help to reduce workplace injuries and illnesses. Along with inspection of workplaces, these include policies that:
larger workplaces, especially those in riskier industries, must employ in-house safety and health professionals (Regulatory Norm 4, or NR 4).
employees engaged in “dangerous activities and operations” receive an increase in salary of 30% (NR16). The rule describes which activities meet the criteria.
adjust workers’ compensation premiums (FAP) to punish high losses (up to 100% above the average industry tax rate) and reward low losses (up to 50% below the industry rate).
require joint labor-management safety committees (CIPA) at formal workplaces. These workplaces must also enroll workers in unions.
allow public prosecutors to seek significant fines in the Labor Court for serious work accidents involving negligence or consistent lack of safety efforts.
establish occupational safety and health centers (CEREST) in state capitals and over 150 other locations to carry out both treatment and surveillance missions.
Requiring the Employment of Safety Staff
NR 4 mandates how many safety and health professionals of each type that must be employed in different facilities. This is referred to as the SESMT requirement. Larger and riskier workplaces employ various types of professionals in the fields of occupational medicine, safety engineering, and others. Appendix Table 1 shows the requirements. As discussed earlier, each specific industry is assigned to a risk group. Thus mining and construction industries are assigned to the highest risk category (level 4). Manufacturing facilities range from 4 to 2. There is no requirement for any establishments with fewer than 50 workers. A metal fabrication factory (a category 3 risk facility where 4 is the highest risk) with 50-99 workers would also have no required personnel. If it had 100-249 employees, it would need to have 1 safety technician, an occupation that involves a year of technical training subsequent to high school. If it employed 500-1,000 workers, it would require 3 safety technicians as well as both an occupational physician and a safety engineer, both for at least 3 hours per week.
In 2012, Brazil had about 6.4 million businesses. About 3.6 million had no employees, and about 98% employed fewer than 50, so the vast majority are not affected by the SESMT. However, the 1% of largest firms employed 48% of the formal workforce (brazilbusiness.com).

16
Mandating Wage Premiums for Some High Risk Jobs
Another constitutional provision (included in NR-16) requires that workers employed in particular industries and occupations receive a 30% compensatory wage increase. The list of jobs included seems fairly arbitrary and incomplete.19 One safety professional reported that “we think these are a perverse way to buy, at a very cheap price, years of live or health of workers. The problem is that this is Constitutionally provided. It started at a time when people really believed that it could act as a safety incentive. But now, nobody believes it anymore. However, workers consider it as a vested right.”
Introducing Experience Rating—the Accident Prevention Factor (FAP)
In 2010 the Ministry of Social Security (MPS) began to implement the FAP, which introduced a degree of experience-rating into the assessments that firms had to pay for workers’ compensation. The existing policy divided industries into 3 risk categories based on a score determined by the injury frequency rate (weighted 35%), severity (weighted 50%) and cost (weighted 15%). The 3 groups paid 1%, 2%, or 3% of payroll in premiums, depending on the risk category. The FAP uses the same factors to further adjust the payment for about 1 million employers, comparing their score to the average score in their industry. The maximum payment for a poor score is a doubling of the industry rate; the minimum is a 50% reduction in the industry rate. In each year through 2015, more than 80% of the employers obtained a refund from the FAP process. About 8% were required to pay more and the rest had no change.
The FAP signals a million employers about their loss prevention performance and provides some extra financial incentive for prevention. It has been hailed by some safety and health professionals in Brazil. However, despite the clear theoretical arguments for a preventive effect from experience-rating, there remains significant uncertainty in the academic literature about the size of the effect in the countries where it has been implemented.20
CIPA
Companies above a minimum size threshold must establish an Internal Commission for the Prevention of Accidents (CIPA). These vary in membership by industry and establishment size. The regulations stipulate that employees elect their representatives and set the ratio of employee and employer members. CIPAs operate as a safety committee, and members are protected against retaliation. We are not aware of studies of their overall impact.
19 They are work with explosives, flammable substances, ionizing radiation, threats of physical violence, electricity, and motorcycles. See NR-16. 20 Outside the United States, skepticism seems to be dominant. See the articles in volume 10, No. 1 of Policy and Practice in Health and Safety (2012).

17
Brazilian law also requires that workers at formal firms have union representation. Most collective bargaining in Brazil is carried out at the local, not the national level. However, unions play an important role in the tri-partite structure that also links the major departments in the executive branch (Chaga et al. 2011). Data on the issues raised in strikes (in 2010-2012) indicates that working conditions were themes in about one-third (DIEESE, 2013). Although safety and health issues are included in this category, it is not clear how prominent they were. Not surprisingly, wages and compensation were an issue in about 90% of the strikes.
Public Prosecutors and Labor Courts
The Constitution establishes public prosecutors and gives them considerable authority and discretion. They are state (and sometimes local) government officials. A frequent intervention, referred to as “regressive,” is to force firms to pay back to the government costs that they have imposed on the social security system. The labor courts are also Constitutionally-established and play a pervasive role in resolving many kinds of disputes, including those involving health and safety. A Ministry of Labor and Employment (MTE) planning document in 2015 also refers to the Ministry offering subsidies to individuals for filing lawsuits against their employers (MTE 2015).
Inspections and Enforcement
By what standards should the quality of safety and health enforcement in Brazil be assessed? Ideally, we would be able to look not just at activities (e.g., the number of inspections) or outputs (e.g., the number of violations cited), but at outcomes like the effects on workers’ health and productivity. But even if we had outcome measures, we would still like to know whether the benefits exceed the costs and, perhaps most pertinently, whether the outcomes are satisfactory.
Regulatory standards in Brazil are established through what are called “regulatory norms” (NR). There are currently 35 of them,21 and they cover risks of various types as well as other issues (e.g., NR 18 covers construction and NR 15 covers toxic exposures, while NR 4 sets out the requirements for safety and health personnel). The MTE, responding to internal or external pressures, sets up a technical group composed of Ministry staff and researchers from Fundacentro, its research institute. The next step is for them to publish a draft for public comment. Next, the draft is referred to a tripartite working group, which either already exists for the general hazard or is established for this hazard. In turn, its draft must be approved by the Permanent Tripartite Parity Commission before adoption by the Ministry.22 There is little formal
21 They are currently numbered up to 36, but 1 has been revoked. 22 The best description of the Brazilian labor inspection process in English appears to be ILO (2010). The fullest description of the issues discussed in the paper can be found in Chagas et al. (2011).
18
economic analysis of new standards; instead, their legitimacy derives largely from the tripartite consensus process that vets them.
This rather bloodless account does not convey the political conflict that sometimes accompanies the attempt to set new standards. Arcuri et al. (2006) describe the 13-year effort that began in the early 1980s to develop stricter standards for exposure to benzene. In the earlier years the focus was on action by the states. A new national benzene standard was adopted in 1995. In fact, however, benzene is one of only 2 toxic substances in which the NR’s have been revised. Brazilian law adopted the 1976 threshold limit values of the American Conference of Governmental Industrial Hygienists (ACGIH); however, it has failed to update its standards as the ACGIH has tightened its standards. Over 50% of the current threshold limit values (TLVs) are above the current ACGIH levels (Dias, 2011).
Recent Evolution of Labor Inspection
Labor inspection in Brazil is carried out under the MTE. Through the mid-1990s, the inspectors in the MTE were divided between those devoted to safety and health (DSST) and those devoted to the enforcement of other labor laws (DLI). The latter include regulations on minimum wages, maximum hours, and child labor, but also extend to forced labor and to the collection of other types of revenue for the government. Typically, the inspectors for the latter included lawyers and accountants; for the former, medical doctors and engineers, who had been more inclined to offer advice to firms about how to address the problems.
When the division took place, finalized in 2003, both departments remained part of the Secretariat of Labor Inspection in MTE. In concept, inspectors are now “generalists” who work on both sets of issues. Inspectors are mingled at the state-level offices (Regional Superintendencies of Labour and Employment), out of which inspectors work.
Whether labor inspectors should be located in “generalist” versus “specialist” agencies has been a frequent topic of debate in many countries.23 On the “generalist” side is the point that many facilities will be visited only rarely, and it is important to take advantage of the occasion. On the other hand, lengthier inspections at some facilities reduce the number of facilities that can be visited. In addition, a generalist will typically be less knowledgeable and experienced with a particular type of problem.
Staff focused on safety have always been a minority within the labor inspectorate, even when the staffs were separate. The total number of labor inspectors has stayed close to 3,000 for a number of years. Currently, one senior official in SIT estimates that no more than perhaps 600 inspectors get involved in safety issues in a year.24
23 For a review of the discussion, see von Richthoven (2002). 24 Vasconcelos (2014) gives the figure of 750. In interviews with him and Jeferson Seidler in May, 2015, they suggested that a figure of 600 was probably more accurate.

19
In concept, all Brazilian workplaces with employees are subject to inspections, and serious accidents and complaints may trigger inspections in all sectors. However, to the extent that DSST relies on planned inspections, they focus on formal workplaces; they are ones the agency has information about.
Until 2008, inspector salaries had both a fixed and performance-based component; the latter was based on the number of inspections. Pires has documented that, since then, there have been several more innovative inspection team efforts to address both safety and other labor standards. However, these programs often appear to involve relatively small numbers of inspectors.
Table 2. Changes in Safety and Health Inspection Actions, 1996-2012
Year # Inspections Violations per Inspection
Interdictions/Embargos per 100 Inspections
1996 101,108 0.23 1.9
1997 140,796 0.19 1.8
1998 160,949 0.14 2.2
1999 162,858 0.12 2.7
2000 139,515 0.13 3.1
2001 127,414 0.14 3.1
2002 125,390 0.14 2.9
2003 129,686 0.17 2.5
2004 136,881 0.15 2.7
2005 166,126 0.12 2.3
2006 162,058 0.15 2.4
2007 157,376 0.20 2.6
2008 145,815 0.28 3.1
2009 158,065 0.30 3.4
2010 135,621 0.43 3.4
2011 138,143 0.55 3.3
2012 143,760 0.60 3.4
Source: Federal System of Labor Inspection / Brazilian Ministry of Labor and Employment. From Vasconcelos (2014).
Table 2 (adapted from Vasconcelos 2014) shows the number of labor inspections and
violations from 1996 through 2012.25 The first point to make is that, given the generalist inspectorate, the identification of “safety and health” inspections is not straightforward. Thus, in 2012, this table shows that there were 143,760 such inspections. In the same year there were 256,653 inspections labeled as labor standards inspections. In fact, there were a total of 304,283
25 Inspection data are available electronically beginning in 1996.

20
labor inspections. Labor standards were an issue in over 80%; safety and health, in over 45%. In about 100,000 inspections, both types were cited. Most inspections are not initially identified as one or the other, so the labeling depends on how many violations or instances of non-compliance with the two sets of labor laws are identified in the inspection. But there is continuing debate about where the lines should be drawn. For example, a recent review indicated that if a threshold of 5 safety and health issues were used, there would be about 80,000 safety and health inspections per year.
Another issue is the nature of the problems identified. Not too surprisingly, the lawyers and accountants often identify no safety problems. The most commonly identified problem is the absence of documentation that a worker has had the mandatory physical examination. Non-compliance with documentation requirements is the easiest type to detect. Reviews of inspections need to disaggregate the types of problems identified to see which are most likely to have a substantive effect on safety.
Workload and Inspection Quality
The number of safety and health inspections is impressive if, as noted, only about 600 inspectors regularly cite related violations. Dividing 600 by the 140,000 inspections would suggest a workload of well over 200 inspections per year. The 2,000 inspectors in the US who are devoted solely to workplace safety and health inspections make 100,000 inspections per year, an average of 50. The US inspectors also cite firms for an average of 3 or 4 violations (including 2 “serious” violations). The smaller number of inspections reflects this greater scrutiny as well as the paperwork burdens engendered by the more legalistic approach.
The most striking finding in Table 2 is that the number of safety-related violations per inspection increased 5-fold from 2005 to 2012. The number per labor standards inspection also rose, but not nearly as much. Along with fines, the chief tools of the inspector are embargos (a complete or partial work stoppage) or interdictions (complete or partial stoppage of business or particular operations). The number of these actions per health and safety inspection increased by about 50% from 2005 to 2012.
What accounts for this apparently more aggressive enforcement? Some agency staff suggested that the chief cause was the inflow of young lawyers who carried out an increasing proportion of the safety inspection work. They were more inclined to rely on legal action, whereas some of the traditional safety and health staff were more consultative. In addition, training for staff has encouraged more formal actions. Another view was that the more aggressive enforcement reflected the preferences of the Workers’ Party, which has held the Presidency since 2003.
Responding to Complaints Versus Planned Inspections
Formerly, most inspections were due to complaints. Now DSST is moving toward 80% planned inspections. The planning is based on industry categories, not on data for individual

21
firms or facilities. The plan for 2015 (MPS 2014) anticipated that 25% of inspections would be based on deaths from SIM (death certificates), while 40% were to be based on an industry priority list using measures developed by the DSST. Most of the rest were to be left up to the MTE’s state-level authorities.
There is some opposition to the move away from complaints. For example, the local inspection unit in Sao Paulo says it cannot make the shift because the Public Prosecutor there has said that his office may prosecute inspectors if they fail to respond to complaints. In the absence of complaints, the probability of inspection is very low except for big firms. One form of complaint, raised especially when a worker leaves a workplace, is the claim that he or she should have been paid the extra 30% due to workers in more hazardous jobs. A labor court has to adjudicate these claims. One facility with about 1,000 employees noted that it had 20-25 of these complaints in the last year.
There is no formal program of follow-up inspections to check whether employers who have been fined have actually abated the violations, although particular inspectors may indicate to the firm that they will be back to check.26 As noted, when inspectors hold off on fines, they are expected to follow up.
Accident investigations constitute another inspection type. Although these are especially likely in the case of fatalities, most of them are for non-fatal injuries. There is no clear protocol for deciding which accidents to investigate, so the decision may depend on media attention and travel distance as well as on severity. Between June 2001 and October 2014, the Fiscal Labor Auditors made an average of 1,800 inspections in response to accidents and occupational diseases to identify conditions and risk factors that led to losses. Information collected in these investigations includes the size and location of the facility, the age of the injured employees, and the violations cited. In recent years, 600 to 800 fatal accidents have been investigated annually. Given the limitations on other sources of data on fatalities, further effort to study these analyses and to try to improve their quality could be worthwhile. Currently, the reports disproportionately come from urban regions and manufacturing and construction (Veras et al. 2011).
Inspecting Small Versus Large Businesses
Additional perspective on the enforcement effort comes from Table 3, which shows the breakdown by establishment size of the workplaces identified as the subject of a safety and health inspection in 2014. Figures for the prior 4 years showed a similar pattern (although there was a drop in the proportion of cases at smaller workplaces after 2012).
26Cardoso and Lage (2005) report that smaller firms usually pay fines right away, perhaps in order to get the 50% discount for prompt abatement. Larger firms are more likely to challenge the fines. Since courts work slowly, these delays can have payoffs even if fines are ultimately upheld.

22
Table 3. The Size of Establishments Receiving Safety and Health Inspections, 2014
Employees N %
0 to 5 32,132 25.65%
6 to 10 18,044 14.41%
11 to 30 28,793 22.99%
31 to 50 10,609 8.47%
61 to100 11,347 9.06%
101 to150 5,771 4.61%
151 to200 3,451 2.76%
201 to300 3,689 2.95%
301 to500 3,525 2.81%
501 to 1000 3,099 2.47%
More than 1000 2,782 2.22%
Size missing 2,014 1.61%
Total 125,256
Source: Provided by MTE
Table 3 shows that 40% of inspections took place in 2014 at workplaces with 10 or fewer
workers and over 80% at those with 100 or fewer. These figures reflect, to some degree, the size distribution of establishments. However, two points seem worth noting. First, the great majority of these firms are not required to have any safety and health staff by SESMT and are likely to have very little knowledge about safety and health practices and rules. They need information and help as well as stronger incentives. Second, nevertheless, it may be worth asking whether the commitment of so many inspection resources to very small workplaces is worthwhile. Conditions may be worse there, but the potential benefit in terms of injuries prevented is quite limited. Also, keep in mind that firms with 10 or fewer workers can be fined only if they have been notified by an inspector that they are not in compliance and fail to take corrective action.
A related issue is the sectoral focus of the inspection effort. One difficulty here is that the industries where other types of labor standards are most precarious are not always those where safety and health issues are greatest.
Table 4 shows the figures for “health and safety” inspections in 2011 for selected industries. From a safety and health perspective, it is easy to see the argument for focusing on the industries where inspectors take actions that may improve safety. It is difficult to know how much this argument is offset by concerns about maintaining some inspection presence in order to provide some general deterrence effect.

23
Table 4. MTE Health and Safety Enforcement Actions in 2011, Selected Industries
Industry Inspections Violations per Inspection
Embargoes/ Interdictions per
Inspection
Mining 3163 1.38 .053
Transport 6522 .36 .008
Construction 31828 .87 .092
Agriculture 10324 .93 .018
Metal 6797 .78 .048
Commerce 36769 .23 .009
Hospitality 6835 .15 .003
Health 4237 .45 .006
Total-All Industries 138143
Source: Dataprev, CAT/Ministry of Social Security: Sistema Federal de Inspecao do Trabalho/Ministerio do Trabalho e Emprego; Taken from Vasconcelos 2014, p. 94
Inspection Style
We saw above that inspectors have become more aggressive in citing firms for violations. Although the DSST has the authority to issue penalties when it discovers a violation, it is more common for it to levy fines only when the firm has failed to fix a violation that was cited. There are specific requirements for this forbearance for inspections at small and medium-sized firms, and at firms that were recently established. Inspectors are also supposed to use this approach when they find non-compliance with recently-adopted regulations. In these cases, the protocol is for the inspector to plan to return and will fine only if the return visit finds that the violations have not been corrected.
The basic penalty for safety and health violations is about R$400. Persistent violations can lead to fines 15 times as high. Some studies of enforcement in the United States suggest that the frequency of inspections (and the likelihood of detection) are more important in improving compliance than the size of the penalties (Viscusi 1986); however, that conclusion may depend upon other contextual factors. As noted, the number of inspectors devoted to safety in Brazil appears small compared to the US (and to most of Western Europe as well), even though the number of inspections per establishment is considerably higher in Brazil.
As noted, inspectors who are doctors and engineers often tried to provide some advice to firms; however, the view in the Secretariat of Inspection is that “Our duty is not to be consultants. We can give explanations of how to apply the law. We focus on finding instances of non-compliance.” At least for safety, the growth of lawyers among inspectors tends to reduce

24
their competence to provide advice. There are apparently no other government sources of consultation. As we saw, larger firms are required to have some in-house expertise, but most firms are not.
There appears to be a widespread perception that corruption among labor inspectors can be a problem, particularly in the less-developed states. Unsurprisingly, it is difficult to find specific examples or to attach numbers to this.
A Major Deficiency
An important limitation of the safety inspectorate is that its inspectors do not carry out industrial hygiene activities. In other words, they do not sample for toxic substances or measure noise levels. They can, instead, order the firm to obtain such measures and submit them to the inspector. However, they lack the ability to independently verify the results.
There has been tension between the MTE and the Ministry of Health over the latter’s authority to enforce occupational hygiene standards. The dispute was resolved in favor of the MTE. The MTE argued that it was acceptable for the Ministry of Health to offer diagnostic and testing services, but not to assert authority over legal compliance. Given the MTE’s lack of capacity in that area,27 it would be very useful to design a process for the Ministry of Health to provide these services, integrating them with the MTE’s enforcement.
Stakeholder Viewpoints
Interviews with leaders of organized interests in Brazil displayed discontent with the state of MTE’s safety and health work.28 The executive director of the UGT (General Workers Union) and coordinator of the Bench Workers' CTPP (Tripartite Joint Permanent Commission) cited what he called the "disintegration" of the MTE, which has suffered from a lack of inspectors and experts in the field of prevention. "The last civil service exam held failed to meet the demand that we have," he says, also pointing out that most of the recently hired inspectors have no training in the area of Safety and Health at Work. A vice-president of Anest (National Association of Occupational Safety Engineering also focused on the decline in autonomy and budget that had accompanied the reorganization of the safety and health activities in the MTE.
In contrast, the Labor Relations Manager of CNI (National Confederation of Industry) focused on the increased aggressiveness of the inspectors: “Never has the punitive process worked this much as in the last two years.” He complained that from January 2011 to the current period in 2014, there were more than 50 changes in the rules and that the MTE did not allow industry enough time to adapt to them. He also complained about a lack of standardization in
27 Some of the older staff may have the competence to carry out industrial hygiene testing, but it is not part of the current training or competencies. 28The interviews reported here appeared in Anuario Brasileiro de Protecao, 2015

25
inspections: “I can adapt my machine and not be punished in the South. The same machine can be fined in the Northeast.”
The criticisms levied above are not necessarily inconsistent. The former focus more on losses in the budget, status, and qualifications of the safety and health inspectors. The latter focus more on what they see as the unreasonableness of the MTE policies and the inspectors who enforce them. Of course, unlike the employers, the former would like to see more inspectors with more authority to protect employees.
Vasconcelos, despite holding a leadership position within the MTE, shares the view that the training and qualifications of inspectors have led to declines in the inspectorate’s capabilities, an effect exacerbated by the failure of the numbers to keep up with the growth in the formal workforce. He believes that the generalist model of inspection needs to be reconsidered. He also criticized the DSST for failing to target its resources on sectors where the largest problems were, with the main complaint that wholesale and retail trade received over 25% of the inspections despite having only about 10% of the fatalities.
Concluding Observations
One very positive feature of the workplace safety and health situation in Brazil is the active interest of many people inside and outside of government in working to improve public policies and social practices. For example, the 2011 book Health and safety at work in Brazil: institutional aspects, information systems and indicators reflects an impressive collaboration among ministries and think tanks to reflect on safety and health problems and to map out some strategies to address them. In addition, the Ministry of Health, working with several university public health programs, has been designing new ways to carry out surveillance.
But, at the same time, there are concerns about shrinking resources. We have noted the concern about a future decline in well-trained safety and health inspectors. And the staff at Fundocentro, the chief MTE think tank on safety, has been declining. Without resources, good ideas and strategies will not do a great deal of good.
Certainly, there are problems, often deep-seated, that need to be addressed. The existence of the informal economy makes it difficult to obtain data to identify problems and difficult to use many of the tools for prevention for close to half of the workforce. Although there are pressures encouraging firms to formalize, there are also countervailing economic trends (e.g., greater contracting out) at work (Weil 2014).
The difficulties in establishing denominators, although not an overwhelming problem, creates intellectual difficulties that hamper communication and understanding. Similarly, the uncertainties about how to identify which inspections are for safety and health make it more difficult to plan how to use inspections or to track the effects of interventions.
Although this point is speculative, the generalist system of labor inspection may bear some responsibility for declining morale among inspectors focused on safety and health. A minority

26
overall and in each state office, they may think that their technical skills are not highly valued by the organization. Much more information would be needed to draw up a balance sheet about the benefits and costs of the generalist system, but one idea may have some merit.
It seems likely that the generalist system has its greatest value in ensuring that a larger number of workplaces will see someone who has at least a modicum of knowledge about many types of labor standards. This value is greatest when inspections are especially rare, due either to isolation and long distances or the small size of the establishments. Perhaps there could be some division between DEFIT and DSST along the following lines. Generalist inspectors would be used primarily in rural areas and at very small workplaces. Specialists, either for safety and health or for other labor standards, would concentrate on urban areas and larger workplaces. It seems possible that this approach might make better use of the different skill sets. Relying more on better-trained inspectors in each area may also help to address employers’ complaints about inconsistent enforcement.
One major shortcoming in the current program is the absence of any capability at DSST to monitor and collect industrial hygiene data. All countries face great obstacles in identifying cases of occupational disease; however, it is feasible to collect information about exposures to toxic chemicals and harmful physical agents. Currently, this is not being done and it would be desirable for MTE and the Ministry of Health to seek to jointly develop and apply this capacity.
Although more information is certainly needed on this point, it also appears that there is inadequate attention to the consultation and training needs of employers and employees at establishments too small to be covered by the SEMST regulation.

27
References
Almeida PCA. (2014). Seminario: FAP, FAT e NTEP [PowerPoint slides]. Coordenacao-Geral
de Politica de Seguro Contra Acidentes do Trabalho e Relacionamento Interinstitucional–CGSAT/DPSSO/SPPS/MPS. Retrieved from www.fiesp.com.br/arquivo-download/?id=169278
Arcuri, Arline S.A. , Luiza Maria N. Cardoso, Danilo Fernandes Costs, Jorge M.H. Machado, “ The benzene agreement,” OSH & Development No. 8117-128 (2006).
Azaroff, Lenore, Charles Levenstein, David Wegman. (2002) “Occupational Injury and Illness Surveillance: Conceptual Filters Explain Underreporting,” American Journal of Public Health 92(9) 1421-1429.
Barata RB, Ribeiro MC, and Moraes JC. (2000). Acidentes de trabalho referidos por trabalhadores moradores em área urbana no interior de São Paulo em 1994. Inf Epidemiol SUS, 9: 199-210.
Binder MC and Cordeiro R. (2003). Under registration of occupational accidents in Brazil, 1997. Revista de Saúde Pública, 37 (4): 409-416.
Bruha P. (2014, June 27). How Many Companies Are There in Brazil [Blog post]. Retrieved June 5, 2015, from http://thebrazilbusiness.com/article/how-many-companies-are-there-in-brazil
Cardoso A and Lage T. (2005). Labor Inspection in Brazil. Rev de Ciências Sociais, 48 (3): 451-490.
Chaga,Ana Maria de Resendes, Celso Amorim Salim, Luciana Mendes Santos Servo Saúde e
segurança no trabalho no Brasil : aspectos institucionais, sistemas de informação e indicadores (Brasília: Ipea, 2011).
Dias, José Pedro Jr., “Latin American: Occupational Exposure Limits,” 2010 or 2011, ppt
Departmento Intersyndical de Estatistica e Estudios Socioeconomicos (DIEESE),.”Sistema de Acompanhamento de Greves,” Estudios Pesquisas No. 76, May 2013.
Faria NMX, Facchini LA, Fassa AG, and Tomasi E. (2000). Processo de produção rural e saúde na serra gaúcha: um estudo descritivo. Cad de Saúde Pública, 16 (1): 115-128.
Fehlberg MF, Santos I, and Tomasi E. (2001). Prevalência e fatores associados a acidentes de trabalho em zona rural. Revista de Saúde Pública, 35 (3): 269-275.

28
Frumkin H and Camara VM. (1991). Occupational Health and Safety in Brazil. American Journal of Public Health, 81(12): 1619-1624.
Galdino A, Santana VS, Ferrite S. (2012). Workers’ Health Referral Centers and Reporting of Work-Related Injuries in Brasil. Cadernos de Saúde Pública, 28(1), 145-159.
Giufrrida, Antonio, Roberto F. Iunes, William D. Savedoff. (2002) “Occupational risks in Latin America and the Caribbean: economic and health dimensions,” Health Policy and Planning 17(3) 235-246.
Instituto Brasileiro de Geographia e Estatistica (IGBE), Pensa nacional de saude:2013: acesso e utilizacao dos servicos de saude, acidentes e violencias (IGBE: Rio de Janeiro, 2015)
International Labour Organization, Decent Work Country Profile: Brazil (Geneva and Brasilia, 2009).
International Labour Organization, “Understanding the Brazilian success in reducing child labour: empirical evidence and policy lessons,” June 2011.
International Labour Organization, Decent Work Country Profile: A Sub-national Perspective on Brazil (Geneva and Brasilia 2013).
Magalhães, Júdice Henrique, “La inspección (o no) del trabajo y las sanciones (o no) por incumplimiento de la legislación laboral en Brasil.”
Mendeloff , John and Laura Staetsky, “Occupational Fatality Rates in the United States and United Kingdom,” American Journal of Industrial Medicine doi 10.1002/ajim.22258. 9/30/13.
Ministerio do Previdencia Social (Instituto Nacional do Seguro Social—INSS) Anuario Estatistico da Previdencia Social 2012 (Brasilia 2013).
Ministerio do Previdencia Social, Diretrizes para o Planejamento 2015, Sersao 1.0 09/04/2014.
Ministerio do Trabalho e Empresa (MTE), “National Strategy for Reduction of Work Accidents, 2015-16 (Brasilia, 2015).
Neto,Dácio de Lyra Rabello, Ruth Glatt, Carlos Augusto Vaz de Souza, Andressa Christina Gorla, Jorge Mesquita Huet Machado. “As Fontes de Informacao do Sistema unico de saude para a sade do trabalhador, Chapter 8 in Saúde e segurança no trabalho no Brasil : aspectos institucionais, sistemas de informação e indicadores. Eds. Ana Maria de Resende Chagas, Celso Amorim Salim, Luciana Mendes Santos Servo. (Brasília : Ipea, 2011).
Pires, Roberto Rocha. (2010) “Flexibility, Consistency and Results in the Management of Bureaucratic Performance,” International Labour Office: ILO Office in Brazil (Brasilia: ILO, 2010).
Revista Protecao, Anuario Brasileiro de Protecao, 2015.

29
Santana VS, Loomis D. (2004) Informal jobs and non-fatal occupational injuries. Ann Occ Hygiene 48(2) 147- 157.
Santana VS, Oliveira R. (2004) Trabalho e saúde na con strução civil em uma área urbana do Brasil. Cad Saúde Pública 20(3):797-811.
Santana VS, Nobre L, and Waldvogel BC. (2005) Acidentes de trabalho no Brasil entre 1994 e 2004: uma revisão. Ciênc. Saúde Coletiva, 10 (4): 841-855.
Santana, VS. (2013) 1st Specialized Course in Occupational Health Epidemiology, CEPIST; Module 4-Epidemiological Measures and Sources of Information on Worker’s Health, Unit 3-Information Systems: occupational data - population bases. Federal University of Bahia.
Santos, Adolfo Roberto Moreira, “O MINISTÉRIO DO TRABALHO E EMPREGO E A SAÚDE E SEGURANÇA NO TRABALHO,” Chapter 1 in Saúde e segurança no trabalho no Brasil : aspectos institucionais, sistemas de informação e indicadores. Eds. Ana Maria
de Resende Chagas, Celso Amorim Salim, Luciana Mendes Santos Servo. (Brasília : Ipea, 2011).
Vasconcelos, FD. (2014). Atuação do Ministério do Trabalho na fiscalização das condições de segurança e saúde dos trabalhadores, Brasil, 1996-2012. Revista Brasileira de Saúde Ocupacional, 39 (129): 86-100.
Veras, Maria Emilia Piccinini, Pinto, Mary Grace Parente, Santos, Adolfo Roberto Moreira,” Labour Ministry of Information Systems and Relevant Work for Health and Safety Area at Work—RAIS, CAGED, IFCT,” (in Portuguese) Chapter 6 in Saúde e segurança no trabalho no Brasil : aspectos institucionais, sistemas de informação e indicadores. Eds. Ana Maria
de Resende Chagas, Celso Amorim Salim, Luciana Mendes Santos Servo. (Brasília: Ipea, 2011).
Viscusi, W. Kip. (1986) “The Impact of Occupational Safety and Health Regulation, 1973-
1983,” Rand Journal of Economics, 17(2), 567−580.
von Richthofen, Wolfgang, Labour Inspection: A Guide to the Profession, Geneva: ILO, 2002.
Weil, David. The Fissured Workplace (Cambridge MA: Harvard University Press, 2014).

30
Appendix A
NR 4 - REGULATORY STANDARD 4 SPECIALIZED SERVICES IN SAFETY ENGINEERING AND OCCUPATIONAL MEDICINE
Degree of
Risk
Number of employees in the establishment
50 --
100
101 --
250
251 --
500
501 --
1,000
1,001 ---
2,000
2001 --
3,500
3501 --
5,000
Above 5,000 for each group of
4,000 or fraction above 2,000 **
1
Technicians Technical Sec. Working - - - 1 1 1 2 1 Mon engineer. Work - - - - - 1 * 1 1 * Aux. Nursing Work - - - - - 1 1 1 Nurses' Work - - - - - - 1 * - Occupational Physician - - - - 1 * 1 * 1 1 *
2
Technical Sec. Working - - - 1 1 2 5 1 Mon engineer. Work - - - - 1 * 1 1 1 * Aux. Nursing Work - - - - 1 1 1 1 Nurses' Work - - - - - - 1 - Occupational Physician - - - - 1 * 1 1 1
3
Technical Sec. Working - 1 2 3 4 6 8 3 Mon engineer. Work - - - 1 * 1 1 2 1 Aux. Nursing Work - - - - 1 2 1 1 Nurses' Work - - - - - - 1 - Occupational Physician - - - 1 * 1 1 2 1
4
Technical Sec. Working 1 2 3 4 5 8 10 3 Mon engineer. Work - 1 * 1 * 1 1 2 3 1 Aux. Nursing Work - - - 1 1 2 1 1 Nurses' Work - - - - - - 1 - Occupational Physician 1 * 1 * 1 1 2 3 1
*3 hour daily minimum