objectives v be able to use basic volume weight equations v understand principal of soil compaction....
TRANSCRIPT

ObjectivesObjectives Be able to use basic Be able to use basic
volume weight volume weight equationsequations
Understand principal Understand principal of soil compaction. of soil compaction.
Explain how the Explain how the compaction test is compaction test is used in design and used in design and quality controlquality control
Be able to perform Be able to perform basic compaction testbasic compaction test(LAB EXERCISE)(LAB EXERCISE)
plot compaction data plot compaction data and evaluate for and evaluate for accuracyaccuracy
Understand procedure Understand procedure for Atterberg Limit for Atterberg Limit Tests (LAB Tests (LAB EXERCISE)EXERCISE)
Review of Compaction PrinciplesReview of Compaction Principles
Compaction Tests are not suitable for Compaction Tests are not suitable for soils with more than 30 % by weight of soils with more than 30 % by weight of the sample being larger than a ¾” sieve.the sample being larger than a ¾” sieve.
Compaction tests are not usually Compaction tests are not usually performed on soils with 12 % or fewer performed on soils with 12 % or fewer finesfines

Review of Compaction PrinciplesReview of Compaction Principles
Relative Density testing is used for Relative Density testing is used for clean sands and gravels – covered later clean sands and gravels – covered later in classin class
Standard Procedures for testing are Standard Procedures for testing are available for soils with some gravel available for soils with some gravel (less than the maximum allowable (less than the maximum allowable content)content)

Principle of compactionPrinciple of compactionPrinciple of compactionPrinciple of compaction
Theory developed by R.R. Proctor in 1930’s Theory developed by R.R. Proctor in 1930’s
in Californiain California
Three Factors determine the density that Three Factors determine the density that
results from soil compactionresults from soil compaction

Proctor Developed PrincipleProctor Developed PrincipleProctor Developed PrincipleProctor Developed Principle
Three variables determine the Three variables determine the density of a compacted soildensity of a compacted soil– The energy used in compactionThe energy used in compaction
– The water content of the soilThe water content of the soil
– The properties of the soilThe properties of the soil

State DiagramState Diagram
Water content, %
Dry
Den
sity
, pcf
100 % saturation
curve

State DiagramState Diagram
Water content, %
Dry
Den
sity
, pcf

Energy Used in CompactionEnergy Used in Compaction
Assume you have some clay soil that is Assume you have some clay soil that is at a water content of 16 percent.at a water content of 16 percent.
Look at the effect different compaction Look at the effect different compaction energy has on the density of the soil.energy has on the density of the soil.
Energy expressed as number of passes Energy expressed as number of passes of a sheepsfoot roller on a lift of soilof a sheepsfoot roller on a lift of soil

Water content, %
Dry
Den
sity
, pcf
1 pass of equipment
2 passes of equipment
3 passes of equipment
4 passes of equipment
10 passes of equipment
At this water content, energy has a large effect on compacted density
Water content, %
Dry
Den
sity
, pcf
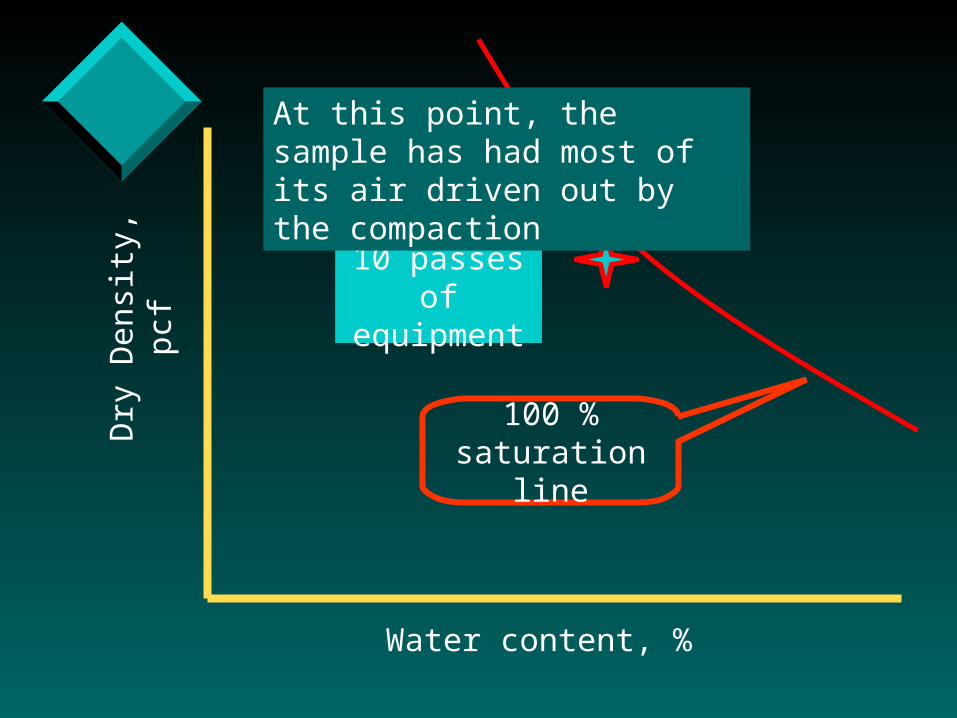
10 passes of equipment
At this point, the sample has had most of its air driven out by the compaction
100 % saturation
line

Water content, %
Dry
Den
sity
, pcf
1 pass of equipment
2 passes of equipment
3 passes of equipment
4 passes of equipment
10 passes of equipment
At a lower water content, energy has little effect on the compacted density of a clay soil

Compacting at low water contentsCompacting at low water contents
At low water contents, insufficient At low water contents, insufficient
water is available to lubricate the water is available to lubricate the
particles and allow them to be particles and allow them to be
rearranged into a dense structure. rearranged into a dense structure.
The frictional resistance of dry The frictional resistance of dry
particles is highparticles is high

Water content, %
Dry
Den
sity
, pcf
1 pass of equipment
2 passes of equipment
3 passes of equipment4 passes of equipment
10 passes of equipment
At a very high water content, energy has little effect on the compacted density of a clay soil because the water is incompressible and takes the applied force without densifying the soil
This results in a term called pumping

Compacting Very Wet SoilCompacting Very Wet Soil
At this point, few air pockets remain
– compaction forces are carried by water in soil
which is incompressible

Water has Zero Shear StrengthWater has Zero Shear Strength

Water has Zero Shear StrengthWater has Zero Shear Strength

Effect of Water ContentEffect of Water Content
Now examine the effect of just changing the Now examine the effect of just changing the water content on a clay soil, using the same water content on a clay soil, using the same energy each time the soil is compacted. energy each time the soil is compacted.
For example, assume soil is spread and For example, assume soil is spread and compacted with 4 passes of a sheepsfoot compacted with 4 passes of a sheepsfoot roller each time.roller each time.
Examine using State DiagramExamine using State Diagram

Effect of Water ContentEffect of Water Content
Dry
den
sity
, p
cf
Water content, %
Sample 1 compacted at 12 % water – Dry Density is 99.0
pcf
12 %
99.0 pcf

Effect of Water ContentEffect of Water ContentD
ry d
en
sity
, p
cf
Water content, %
Sample 2 compacted at 14 % water – Dry Density is 104.5 pcf
14 %
104.5pcf

Effect of Water ContentEffect of Water ContentD
ry d
en
sity
, p
cf
Water content, %
Sample 3 compacted
at 16 % water – Dry Density is 105.5 pcf
16 %
105.5pcf

Effect of Water ContentEffect of Water ContentD
ry d
en
sity
, p
cf
Water content, %
Sample 4 compacted
at 18 % water – Dry Density is 98.5 pcf
18 %
98.5 pcf

Effect of Water Content @ constant Effect of Water Content @ constant energyenergy
Dry
den
sity
, p
cf
Water content, %
Maximum dry
density, pcf
Optimum water content, %

Now, perform the same test at a Now, perform the same test at a different (Higher energy) on the soildifferent (Higher energy) on the soil
Dry
den
sity
, p
cf
Water content, %
4 passes of sheepsfoot
roller
10 passes of sheepsfoot
roller

Effect of Soil Type on CurvesEffect of Soil Type on CurvesD
ry d
en
sity
, p
cf
Water content, %
Plastic Clay Soils have Low Values of Maximum Dry Density
80-95 pcf

Effect of Soil Type on CurvesEffect of Soil Type on CurvesD
ry d
en
sity
, p
cf
Water content, %
20-40 %
Plastic Clay Soils have high values for optimum water content (20-40 %)

Effect of Soil Type on CurvesEffect of Soil Type on CurvesD
ry d
en
sity
, p
cf
Water content, %
Plastic Clay Soils have a Flat Curve for Lower Energies Density

Effect of Soil Type on CurvesEffect of Soil Type on CurvesD
ry d
en
sity
, p
cf
Water content, %
Sandy Soils with Lower PI’s have High Values of Maximum Dry Density
115-135 pcf

8-15 %
Effect of Soil Type on CurvesEffect of Soil Type on CurvesD
ry d
en
sity
, p
cf
Water content, %
Sandy Soils with Lower PI’s have Low Values of Optimum Water Content

Effect of Soil Type on CurvesEffect of Soil Type on CurvesD
ry d
en
sity
, p
cf
Water content, %
Sandy Soils have a Steep Curve – Short distance from plastic to liquid states of consistency

SummarySummaryD
ry d
en
sity
, p
cf
Water content, %
Lower PI – Sandier Soils
in this Region
110-135
Intermediate PI Soils in
this Region95-120 Higher PI –
Clayey Soils in this Region
75-95
SummarySummaryD
ry d
en
sity
, p
cf
Water content, %
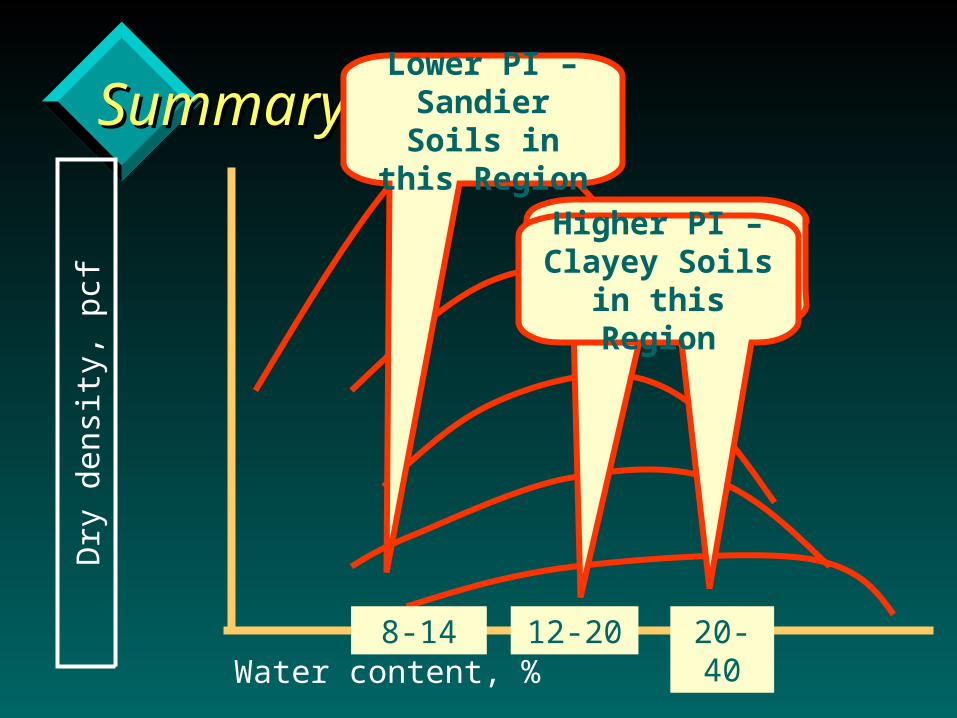
Lower PI – Sandier Soils
in this Region
8-14
Intermediate PI Soils in
this Region
12-20
Higher PI – Clayey Soils
in this Region
20-40

Family Family of of Curves Curves (Covered (Covered Later)Later)

Family of CurvesFamily of Curves
water content, %
d, d
ry d
ensi
ty,
pcf
Line of Optimums
Zero air voids curve not parallel
to line of optimums at upper end

Using a standard energy, if a series of Using a standard energy, if a series of specimens of a soil are compacted at specimens of a soil are compacted at increasing water contents, the resultant increasing water contents, the resultant dry density of the specimens will vary. dry density of the specimens will vary. The density will increase to a peak value, The density will increase to a peak value, then decrease.then decrease.
Proctor’s principle of Proctor’s principle of compactioncompaction

Principle of CompactionPrinciple of Compaction
A plot of the dry density versus the A plot of the dry density versus the water content from a compaction test water content from a compaction test will be parabolic in shape. will be parabolic in shape.
The peak of the curve is termed the The peak of the curve is termed the maximum dry density, and the water maximum dry density, and the water content at which the peak occurs is the content at which the peak occurs is the optimum water content.optimum water content.

Standard Proctor EnergiesStandard Proctor Energies
Several standard energies are used Several standard energies are used for laboratory compaction testsfor laboratory compaction tests– Standard – 12,400 ft-lbs/ftStandard – 12,400 ft-lbs/ft33
– Modified – 56,000 ft-lbs/ftModified – 56,000 ft-lbs/ft33
– California – 20,300 ft-lbs/ftCalifornia – 20,300 ft-lbs/ft33

Standard Proctor Compaction Test Standard Proctor Compaction Test SummarySummary
Uses 5.5 pound Uses 5.5 pound hammerhammer
dropped 12 inchesdropped 12 inches mold filled in 3 liftsmold filled in 3 lifts 25 blows of hammer 25 blows of hammer
per liftper lift Total energy is Total energy is
12,400 ft-lbs/ft12,400 ft-lbs/ft33
12”drop
3 lifts
5.5 # hamme
r

Modified Proctor Compaction Test Modified Proctor Compaction Test SummarySummary
Uses 10 pound Uses 10 pound hammerhammer
dropped 12 inchesdropped 12 inches mold filled in 5 liftsmold filled in 5 lifts 25 blows of hammer 25 blows of hammer
per liftper lift Total energy is Total energy is
12,400 ft-lbs/ft12,400 ft-lbs/ft33
18”drop
10 # hamme
r
5 lifts

Proctor Compaction Test SummaryProctor Compaction Test Summary
Several Standard molds are used Several Standard molds are used depending on maximum particle size in depending on maximum particle size in samplesample– 4”diameter mold (1/30 ft4”diameter mold (1/30 ft33) used for soils ) used for soils
with low gravel contentswith low gravel contents– Method A for soils with < 20 % gravelMethod A for soils with < 20 % gravel– Method B for soils with > 20 % gravel and < Method B for soils with > 20 % gravel and <
20 % larger than 3/8”20 % larger than 3/8”
Proctor Compaction Test SummaryProctor Compaction Test Summary
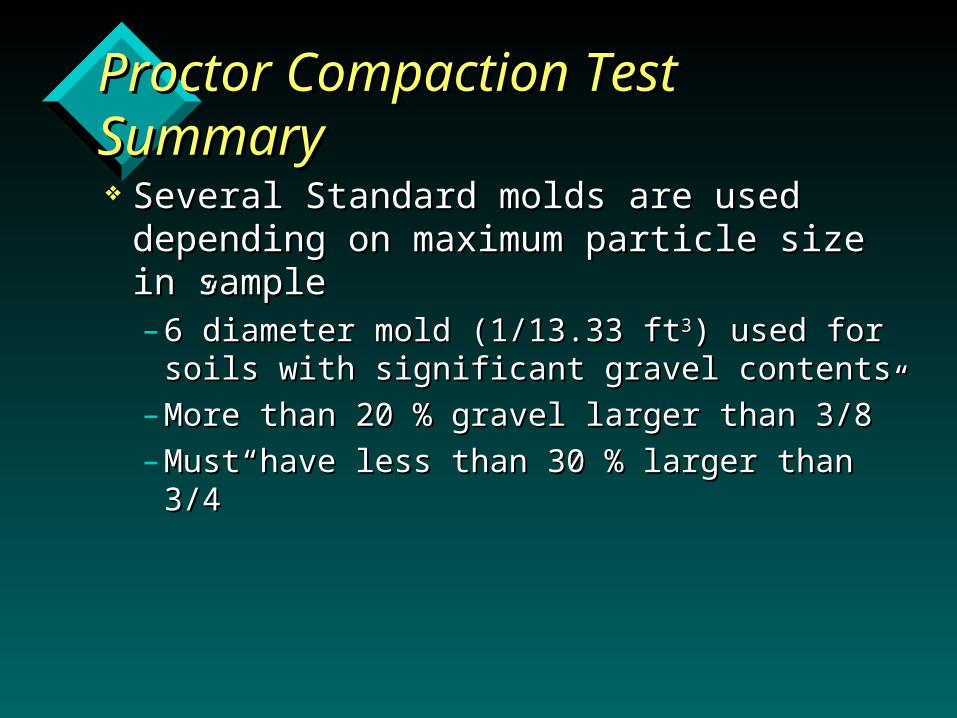
Several Standard molds are used Several Standard molds are used depending on maximum particle size in depending on maximum particle size in samplesample– 6”diameter mold (1/13.33 ft6”diameter mold (1/13.33 ft33) used for ) used for
soils with significant gravel contents soils with significant gravel contents
– More than 20 % gravel larger than 3/8”More than 20 % gravel larger than 3/8”
– Must have less than 30 % larger than 3/4”Must have less than 30 % larger than 3/4”

Proctor Compaction Test SummaryProctor Compaction Test Summary
Standardized tests are not available for soils Standardized tests are not available for soils with more than 30 percent by weight of the with more than 30 percent by weight of the total sample being larger than 3/4”in total sample being larger than 3/4”in diameter gravelsdiameter gravels
ASTM Compaction Test Methods are ASTM Compaction Test Methods are – D698AD698A D1557AD1557A– D698BD698B D1557 D1557BB – D698CD698C D1557C D1557C

Proctor Compaction Test SummaryProctor Compaction Test Summary
Prepare 4 to 5 Prepare 4 to 5 specimens at increasing specimens at increasing water contents about 2 water contents about 2 % apart. Example - % apart. Example - prepared samples at 14, prepared samples at 14, 16, 18, and 20 percent. 16, 18, and 20 percent. Use range of moistures Use range of moistures based on feel and based on feel and experience.experience.

Proctor Compaction Test SummaryProctor Compaction Test Summary
Then, compact Then, compact each sample each sample into a steel into a steel mold with mold with standard standard proceduresprocedures
Compaction mold
Cured soil
Hammer

Proctor Compaction Test SummaryProctor Compaction Test Summary
Then, strike Then, strike off excess off excess soil so the soil so the mold has a mold has a known known volume of volume of soil. soil.

Proctor Compaction Test SummaryProctor Compaction Test Summary
For each sample, measure the weight and the For each sample, measure the weight and the water content of the soil in the mold water content of the soil in the mold
The mold volume and weight are The mold volume and weight are pre-measured. pre-measured. Don’t assume nominal volumeDon’t assume nominal volume of of 1/30 ft1/30 ft33 or 1/13.33 ft or 1/13.33 ft33
Calculate moist densityCalculate moist density Calculate dry densityCalculate dry density Plot dry density and water content for each pointPlot dry density and water content for each point
Class ProblemClass Problem
Calculate Moist density, dry densityCalculate Moist density, dry density
Mold_Volume
Weight Moistmoist
100%
1w
moistdry

Point Mold+Soil
MoistSoil
MoistDensity
pcf
WaterContent
%
DryDensity
pcf
1 8.04 3.78 17.5
2 8.30 4.04 19.6
3 8.38 4.12 21.7
4 8.29 4.03 24.4
Class ProblemClass Problem
Mold wt = 4.26 #, Mold Vol. = 0.03314 ft3

Class ProblemClass Problem
Calculate Moist density, dry densityCalculate Moist density, dry density Plot curve of dry density versus Plot curve of dry density versus
water contentwater content Determine Maximum dry density Determine Maximum dry density
and optimum water contentand optimum water content

{
Set Up Plot – Form SCS-352Set Up Plot – Form SCS-352
5 pound
s
90
110

Set Up Plot – Form SCS-352Set Up Plot – Form SCS-352
Make each vertical division equal to 1 percent water
content

Class ProblemClass Problem
Calculate Moist density, dry densityCalculate Moist density, dry density Plot curve of dry density versus water Plot curve of dry density versus water
contentcontent Determine Maximum dry density and Determine Maximum dry density and
optimum water contentoptimum water content Plot zero air voids ( 100 % saturation Plot zero air voids ( 100 % saturation
curve assuming specific gravity = 2.68curve assuming specific gravity = 2.68

Zero Air Voids CurveZero Air Voids Curve
After you plot a compaction test, plotting After you plot a compaction test, plotting a zero air voids curve is very important. a zero air voids curve is very important. This curve is also called the 100 % This curve is also called the 100 % saturation curvesaturation curve
This curve shows for a range of dry This curve shows for a range of dry density values what the saturated water density values what the saturated water content is for any given valuecontent is for any given value

Compaction Problem Compaction Problem
1001
(%) xG
wsdry
watersat
Zero air void equation
Assume 3 values of d and calculate wsat%

85
95
105
115
125
135
10 12 14 16 18 20 22 24 26 28 30 32 34
Water Content, %
Dry
Den
sity
, pcf
100G
1(%)w
sd
wsat
100 % Saturation Curve
75 % Saturation Curve
95 % Saturation Curve
assumed Gs = 2.70Unit wt. water = 62.4
Assumed dry density = 105 pcf
wsat(%) = 22.1(%)

Zero Air Voids CurveZero Air Voids Curve
Dry Unit Weightpcf
SaturatedWater %
95
100
105

Plotted Class ProblemPlotted Class Problem
95
96
97
98
99
100
101
102
103
104
105
15 17 19 21 23 25 27 29
w %
Dry
De
ns
ity
, p
cf
Maximum drydensity = 102.5 pcf
optimum w % = 21.0 %
zero air voids curve

Zero Air Voids CurveZero Air Voids Curve
The 100 % saturation curve is used to The 100 % saturation curve is used to judge the reliability of the compaction judge the reliability of the compaction curve and of field measurements of curve and of field measurements of compacted soil density and water contentcompacted soil density and water content
Compacted soils for NRCS Compacted soils for NRCS specifications are usually at a degree of specifications are usually at a degree of saturation of about 75 to 95 percentsaturation of about 75 to 95 percent

75 % Saturation Curve
100 % Saturation Curve
95 % Saturation Curve

EvaluatingEvaluating Compaction TestsCompaction Tests– Standard requirements - spread in Standard requirements - spread in
water content about 2 % and at least water content about 2 % and at least two points above and below optimumtwo points above and below optimum
– Typical shape - soil type ?Typical shape - soil type ?
Review of CompactionReview of Compaction

Compaction Problem Compaction Problem
Other given information:
LL = 47, PI = 30, classified as CL soil
Gs = 2.68

Evaluating compaction testEvaluating compaction test
95
96
97
98
99
100
101
102
103
104
105
15 17 19 21 23 25 27 29
w %
Dry
De
ns
ity
, p
cf
zero air voids curve
2.1 %
Are points about two percent apart ?
2.1 % 2.7 %
2.7 %

Evaluating compaction testEvaluating compaction test
95
96
97
98
99
100
101
102
103
104
105
15 17 19 21 23 25 27 29
w %
Dry
De
ns
ity
, p
cf
zero air voids curve
2.1 %
2.1 %
2.1 %
2.7 %
Are two points below and 2 above optimum ?

Optimum water content about Optimum water content about 80 % saturated water 80 % saturated water content ? - Acceptable range content ? - Acceptable range is 75-95is 75-95
Review of CompactionReview of Compaction
1001
xG
wsdry
watersat
(%)
Optimum w% = 21.0
(%)6.2310068.2
1
5.102
4.62(%)
xwsat
% sat = 21.0÷23.6=89%
102.5 pcf

Plotted Class ProblemPlotted Class Problem
95
96
97
98
99
100
101
102
103
104
105
15 17 19 21 23 25 27 29
w %
Dry
De
ns
ity
, p
cf
Maximum drydensity = 102.5 pcf
optimum w % = 21.0 %
zero air voids curve
wsat @ 102.5 pcf =(62.4/102.5 - 1/2.68) * 100 = 23.6
%
wopt/wsat = 21.0/23.6 = 89 %

Wet side parallel to Wet side parallel to saturation curve at saturation curve at 90 % saturation ?90 % saturation ?
d, p
cf
w, %
Review of CompactionReview of Compaction
1001
(%) xG
wsdry
watersat
% Sat = 24.3 ÷ 26.4 = 92.0 %
Check a point on wet side at 98 pcf, w % on curve is
24.3%
(%)4.2610068.2
1
0.98
4.62(%)
xwsat

Plotted Class ProblemPlotted Class Problem
95
96
97
98
99
100
101
102
103
104
105
15 17 19 21 23 25 27 29
w %
Dry
De
ns
ity
, p
cf
Maximum drydensity = 102.5 pcf
optimum w % = 21.0 %
zero air voids curve
wopt/wsat = 24.3/26.6 = 91 %
wsat @ 98.0 pcf =(62.4/98.0 - 1/2.70) * 100 =
26.6 %

Evaluating Compaction TestsEvaluating Compaction Tests Typical value for fine-grained soils Typical value for fine-grained soils
compared to Navdocks equationscompared to Navdocks equations
dmax = 130.3 - 0.82 *LL + 0.3*PI
wopt = 6.77 + 0.43 * LL - 0.21 * PI
Review of CompactionReview of Compaction

Evaluating Compaction TestsEvaluating Compaction Tests Typical value for fine-grained soils Typical value for fine-grained soils
compared to Navdocks equationscompared to Navdocks equations
dmax = 130.3 - 0.82 *47 + 0.3*30 = 100.8 pcfOK - test value was 102.5 pcf
wopt = 6.77 + 0.43 * 47 - 0.21 * 30 = 19.6 % OK Test value was 21.0 %
Review of CompactionReview of Compaction

Soils are compacted to improve the Soils are compacted to improve the engineering properties over those of loosely engineering properties over those of loosely placed soils.placed soils.
The engineering properties are affected both The engineering properties are affected both by the density to which the soil is compacted by the density to which the soil is compacted and the water content at which it is compactedand the water content at which it is compacted
Purposes of compactionPurposes of compaction

Role of compaction tests Role of compaction tests in earth fill projectsin earth fill projects
Samples are obtained in site investigation and sent to Samples are obtained in site investigation and sent to laboratory for testinglaboratory for testing
Soils are tested to determine reference density - as well Soils are tested to determine reference density - as well as other index propertiesas other index properties
Engineering properties are measured by testing at a Engineering properties are measured by testing at a percentage of the reference test density. For example, a percentage of the reference test density. For example, a shear test might be performed at 95 percent of the shear test might be performed at 95 percent of the Standard Proctor maximum dry density of the soil. Standard Proctor maximum dry density of the soil.

The engineering properties are used in analyses to The engineering properties are used in analyses to determine a suitable designdetermine a suitable design
For example, the shear strength is used in a slope For example, the shear strength is used in a slope stability analysesstability analyses
If the engineering properties allow a satisfactory If the engineering properties allow a satisfactory design, then the degree of compaction is used in a design, then the degree of compaction is used in a contract specification.contract specification.
Role of compaction tests Role of compaction tests in earth fill projectsin earth fill projects

If an unsatisfactory design results, the soil is re-tested If an unsatisfactory design results, the soil is re-tested at a different degree of compaction to obtain better at a different degree of compaction to obtain better engineering propertiesengineering properties
The design is re-analyzed and the process repeated until The design is re-analyzed and the process repeated until a final satisfactory degree of compaction is decideda final satisfactory degree of compaction is decided
Then the degree of compaction is used in a contract Then the degree of compaction is used in a contract specification.specification.
Role of compaction tests Role of compaction tests in earth fill projectsin earth fill projects

Quality control processes are used to ensure that Quality control processes are used to ensure that the earth fill is compacted to the degree of the earth fill is compacted to the degree of compaction specified, within a range of specified compaction specified, within a range of specified water contentswater contents
Field compaction tests are performed to assure Field compaction tests are performed to assure that the proper reference density is being usedthat the proper reference density is being used
Role of compaction tests Role of compaction tests in earth fill projectsin earth fill projects

Compaction Compaction Tests as Tests as Used in Used in Design of an Design of an Earth FillEarth Fill
E n g in e erin g P rop e rtie s a re u sedin a n a na lyses - e .g .,
s lo p e sta b ility a n a lys is
E n g ine e ring P rop e rtyT e s ts a re p e rfo rm e d a t
th e p re lim in a ry d e s ig n de n s itye .g ., sh ea r te s ts
A P re lim in ary d e gre e o fco m pa c tio n is a ssu m ed
e .g ., 9 5 % S T a nd a rd P roc to r
S a m p les a re ob ta in e d a nd sub m ittedto a la b ora to ry fo rco m p a ctio n te s ts
in d ex te s ts

Q u a lity C o n tro l T e s tsa re pe rfo rm ed du ring
co n stru ctio n to e n su re th a tth e re q u ire d d e ns ity a n d w ate r co n te n t a re m et
If th e D e s ign is S a tis fac to ry,C o n tra c t sp e cs a re w ritten
re q u irin g the d eg ree o f co m p ac tionn e ed e d fo r th e p ro p erties
Q u a lity C o n tro l T e s tsa re pe rfo rm ed du ring
co n stru ctio n to e n su re th a tth e re q u ire d d e ns ity a n d w ate r co n te n t a re m et
W h en a sa tisfa c to ry de s ign is a ch ie vedfo r th e tes ted de gre e o f
co m pa c tio n , sp ec if ica tio n s a re w ritten
If th e D e sig n is n o t S a tis fa cto ry,a d iffe ren t d e gre e o f co m p a ction
is a ssu m e d, a nd m o re e n g in e eringp ro pe rty te s ts a re p e rfo rm ed

Example of ProcessExample of Process
Sample obtained to determine suitability as Sample obtained to determine suitability as clay linerclay liner
Sample Sent to LaboratorySample Sent to Laboratory Laboratory performs Standard Proctor TestLaboratory performs Standard Proctor Test A Permeability Test is performed at 95 % of A Permeability Test is performed at 95 % of
maximum Standard Proctor Dry Densitymaximum Standard Proctor Dry Density

Example of ProcessExample of Process
The sample is remolded at 2 percent wet of The sample is remolded at 2 percent wet of optimum (for this sample, 85 % saturated)optimum (for this sample, 85 % saturated)
The permeability test measures an The permeability test measures an acceptably low permeabilityacceptably low permeability
A recommendation is given to the field A recommendation is given to the field office that compaction to this combination office that compaction to this combination of density and water content results in of density and water content results in acceptably low permeabilityacceptably low permeability

Example of ProcessExample of Process
During construction, measurements of dry During construction, measurements of dry density and water content are made during density and water content are made during construction.construction.
If the degree of compaction and percent If the degree of compaction and percent saturation are equal to or better than saturation are equal to or better than specified, the liner is judged to have a low specified, the liner is judged to have a low permeability and is considered acceptable.permeability and is considered acceptable.

A compaction test measures a maximum A compaction test measures a maximum dry density of 104.0 pcf and an optimum dry density of 104.0 pcf and an optimum water content of 18.0 %. The soil has an water content of 18.0 %. The soil has an estimated Gestimated Gss value of 2.68 value of 2.68
A contract requires compaction to 95 % of A contract requires compaction to 95 % of maximum dry density at a water content maximum dry density at a water content of optimum or greaterof optimum or greater
Class Problem 2Class Problem 2

A field test measures a moist density of 126.3 A field test measures a moist density of 126.3 pcf and a water content of 23.4 %pcf and a water content of 23.4 %
Does the compacted fill meet the contract Does the compacted fill meet the contract requirement requirement ? ?
Use the values given for measured moist density Use the values given for measured moist density and water content, calculate the dry densityand water content, calculate the dry density
Assume a Gs value of 2.68 and compute a wsat Assume a Gs value of 2.68 and compute a wsat valuevalue
Class Problem 2Class Problem 2

Class ProblemClass Problem Compare the reported compaction water Compare the reported compaction water
content to theoretical saturated water contentcontent to theoretical saturated water content Compacted soils are commonly in the range of Compacted soils are commonly in the range of
75-95 percent saturated75-95 percent saturated What do the results tell you about the What do the results tell you about the
reliability of the field data?reliability of the field data? What would you look for to explain any What would you look for to explain any
problems?problems?

Conclusions of Class ProblemConclusions of Class Problem
The measured data appears to have The measured data appears to have problems.problems.
Possible errors are in the measurement of Possible errors are in the measurement of the dry density, the water content, or the the dry density, the water content, or the specific gravity value used in computationsspecific gravity value used in computations
Recommend investigating most probable Recommend investigating most probable causescauses