objectivation of the bacteriological and organoleptic quality of milk...
TRANSCRIPT

Commission of the European Communities
INFORMATION ON AGRICULTURE
Objectivation of the bacteriological and organoleptic quality of milk
for consumption
No. 21 September 1976
OBJECTIVATION OF THE BACTERIOLOGICAL AND ORGANOLEPTIC QUALITY OF MILK FOR CONSUMPTION
Serie: "Information on Agriculture" No. 21
The presence of non-pathogenic microorganisms and the organoleptic characteristics determine the length of time over which mBk may be kept fresh and be enjoyed as a beverage by the consumer.
Community legislation on drinking milk calls for the definition of the criteria and methods for determining the bacteriological and organoleptic characteristics of milk at the various stages, production (raw milk}, before and after heat treatment (pasteurization etc.) and on consumption after various periods of conservation. The criteria and methods of analysis applied by the various Member States differ considerably. The work reported here is intended to contribute towards the perfection of objective scientific tests which are rapid and inexpensive for determining the bacteriological and organoleptic properties of milk for human consumption at the various stages of its production, processing and conservation, until the time when it is consumed.
To this end, the potential offered by determination of the pyruvic acid content in particular has been examined.
This study is published only in English.

Commission of the European Communities
INFORMATION ON AGRICULTURE
Manuscript finished in May 1976
Objectivation of the bacteriological and organoleptic quality of milk
for consumption
No. 21 September 1976
COMMISSION OF THE EUROPEAN COMMUNITIES
DIRECTORATE-GENERAL FOR AGRICULTURE Directorate: Agricultural Economics- Division: "Balance-sheets, Studies, Statistical Information"
©Copyright EEC, Brussels, 1976 Printed in Belgium
Reproduction authorized, in whole or in part, provided the source is acknowledged
-3-
Foreword
The present study has been carried out within the framework
of the study-programme of the Directorate General for Agriculture by
Prof. Dr. A. TOLLE and Prof. Dr. W. HEESCHEN
of the Institut fUr Hygiene Bundesanstalt fUr Milchforschung KIEL (Germany)
and Dr. L.A. MABBIT
of the National Institute for Research in Dairying Shinfield Reading (United Kingdom).
The Division "Balance-sheets, Studies, Statistical Information", 11Milk products" and "Harmonization of Laws, regulations and adminis
trative provisions relating to veterinary matters and zootechnics" of
the Directorate general for Agriculture have cooperated in this project.
Original English
Manuscript finished May 1976
* * *
This study only reflects the opinions of the author which are not
necessarily those of the Commission of the European Communities and
does not prejudice its future position on this subject.

-5-
C o n t e n t s
1. Introduction (MABBIT) 9
1.1 Assessment of the bacteriological quality of milk in the 9 past and present
1.2 Present problems 10 1. 3 Subjects of investigations 10
2. Critical evaluation of tests for the bacteriolgical quality 10 of refrigerated milk (MABBIT)
2.1 Total bacterial counts 10 2.2 Tests for bacterial activity 11 2.3 Economic aspects 12
3. Pyruvate, the analoguous parameter for the bacteriological 13 quality of milk (TOLLE and HEESCHEN)
3.1 Microbial catabolism 13
3.1.1 Glycolysis 3.1.2 Proteolysis 3.1.3 Lipolysis
3.2 Pyruvate as the central metabolic parameter for the 19 measurement of bacterial activity under psychrotrophic conditions
3.2.1
3.2.2 3.2.2.1 3.2.2.2 3.2.2.2.1 3.2.2.2.2
A model scheme for the extracellular accumulation of pyruvate Analysis Fluorometry Colorimetry Auto Analyzer System Manual determination
3. 3 Results
3.3.1
of experimental assays
3.3.2 3.3.3 3.3.4 3.3.5 3.3.6 3.3.6.1
3.3.6.2
3.3.6.3
Specifity of the enzymatic determination of pyruvate Sampling Preservation of samples Secretory background value Pyruvate and pasteurization Pyruvate and bacterial activity Pyruvate as parameter for bacterial activity in relation to the number of microbes as the quantitative morphologic value Time series investigations for the measurement of catabolic activity in pure cultures Ability to form pyruvate from germ-groups, isolated from milk
3.4 Results of assays under field conditions
34
58
-6-
4. The suitability of the pyruvate-pool for the estimation of the keeping quality of milk {TOLLE and HEESCHEN)
4.1 The concept of keeping quality
4.1.1 The flavour quality of milk and influencing factors
4.1.2 Microbiological methods for the estimation of keeping quality
4.2 Pyruvate and keeping quality
4.2.1 4.2.2 4.2.2.1
4.2.2.2
4.2.2.3
4.2.2.4
4.2.2.5
4.2.2.6
Material and methods Results Pyruvate-difference-value and keeping quality of milk Microbial processes in raw milk and the keeping quality of pasteurized milk Pyruvate-threshold-value and spoilage of pasteurized milk Reduction-test, pyruvate and metabolites of microbial catabolism Alcohol-test, pyruvate and metabolites of bacterial catabolism Clot-on-boiling-test, pyruvate and metabolites of bacterial catabolism
68
68
73
5. Discussion and summary of chapters 3. and 4. (TOLLE and HEESCHEN) 109
6. Collaborative experiments between Institut fur Hygiene der Bundesanstalt fur Milchforschung, Kiel, and the National Institute for Research in Dairying, Shinfield (MABBIT) 114
6.1 Introduction 114
6. 1 • 1 6. 1. 2
Raw milks Pasteurized milks
6.2 Experimental methods
6.2.1 Milk samples and pre-test storage 6. 2. 1 • 1 Raw milks 6.2.1.2 Pasteurized milks
6.2.2
6.2.2.1 6.2.2.2 6.2.2.3 6.2.2.4 6.2.2.5 6.2.2.6
6.2.2.7
6.2.2.8
6.2.2.9
Bacteriological analyses (Ministry of Agriculture, Fisheries & Food, 1968) Total Count {TC) Coli-aerogenes (Coliform) Count {CAO) Psychrotrophic Count (PC) Thermoduric Count (LPC) Total Aerobic Spore Count (TS) Streptococcal Count (SSM) NIRD Report 1971-72) Resazurin Test (Hygiene Test for England and Wales) Methylene Blue (MB) Test (Statutory test for consumer milk in England and Wales) Alcohol Precipitation Test (APT)
115
6.2.3 6.2.4 6.2.5 6.2.5.1 6.2.5.1.1 6.2.5.1.2 6.2.5.1.3
6.2.5.2 6.2.5.2.1
-7-
Somatic cell counts Examination of microfloras Biochemical analyses Pyruvate NIRD colorimetric manual method (NIRD) Kiel colorimetric automated method (Kc) Kiel and NIRD fluorimetric automated method (Kf and NIRDf)
Lactate Kiel fluorimetric automated method Details of these methods are given in Appendix
6.3 Results and discussion
6.3.1 6.3.1.1 6.3.1.1.1 6. 3.1. 1.1. 1 6.3.1.1.1.2 6.3.1.1.1.3 6.3.1.1.1.4 6.3.1.1.1.5 6.3.1.1.1.6
6.3.1.1.2 6.3.1.1.2.1 6.3.1.1.2.2 6.3.1.1.2.3 6.3.1.1.2.4 6.3.1.1.2.5
6.3.1.1.3 6.3.1.1.3.1 6.3.1.1.3.2 6.3.1.1.3.3 6.3.1.1.3.4 6.3.1.1.3.5
6.3.1.1.4
6.3.1.1.5
6.3.1.2 6.3.1.3 6.3.1.3.1 6.3.1.3.1.1
6.3.1.3.1.2
6.3.1.3.1.3
6.3.1.3.1.4
Raw milks Bacteriological results Initial values Total counts (TC) Streptococcal counts (SSM counts) Psychrotroph counts (PC) Coliform counts (CAO) Thermoduric counts (LPC) Resazurin test (RT)
After storage at 5° for 4 and 5 days Total and psychrotroph counts (TC and PC) Streptococcal counts (SSM) Coliform counts (CAO) Thermoduric counts (LPC) Resazurin Test (RT)
After incubation at 20° for 17h Total count and psychrotroph count (TC & PC) Streptococcal counts (SSM) Coliform counts (CAO) Thermoduric counts (LPC) Resazurin Test (RT)
Microflorgs of the milks after storage at 5° and at 20 The error of the plate count
Somatic Cell Counts (cells) Biochemical Results Pyruvate Relationship of initial pyruvate to initial status of the milks Relationship of pyruvate ( values) to total and gsychrotroph colony counts after storage at 5 for 4 and 5 days Relationship of pyruvate to total and psych~otroph colony counts after storage at 20 for 17h Pyruvate values equivalent to one colony forming unit (CFU)
119
7.
6.4
6.5
6.6
6.3.2 6.3.2.1 6.3.2.2 6.3.2.3
Conclusion
6.4.1 6.4.2
References
APPENDIX·
Final statements
-8-
Pasteurized milks Initial biochemical ang bacteriological status After incubation at 10 for 2 days Comparison of Kiel and NIRD pyruvate results
Raw milks Pasteurized milks
148
-9-
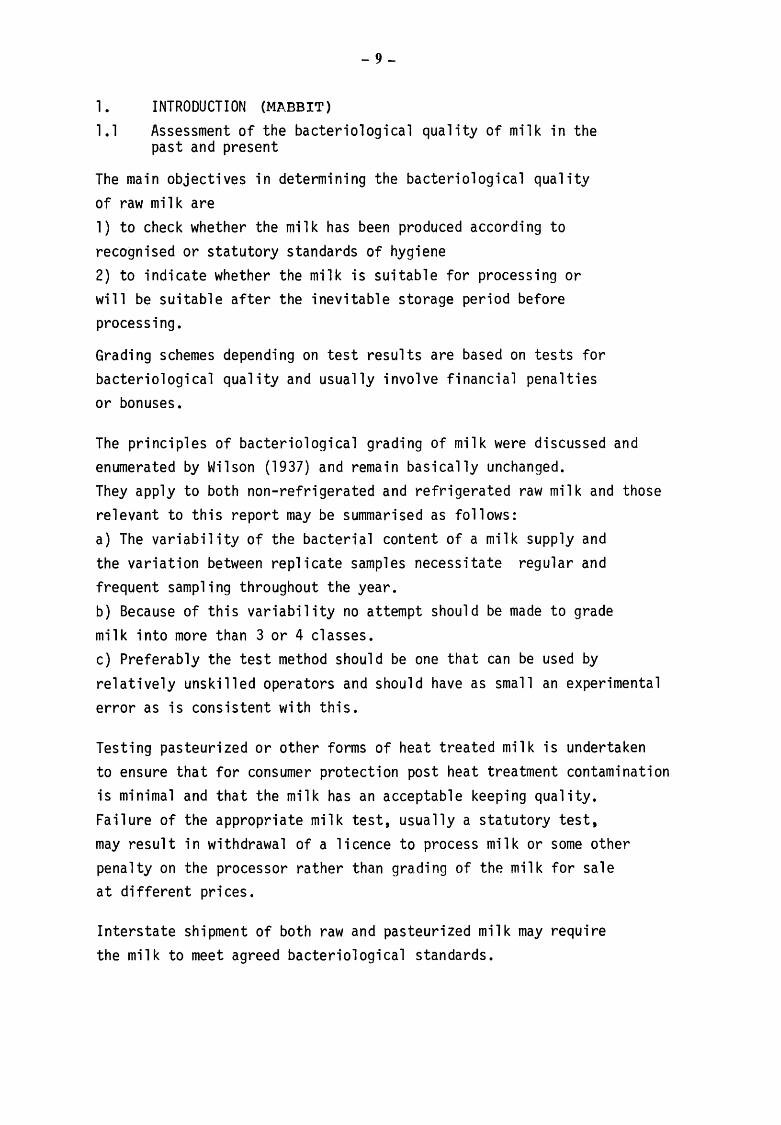
1. INTRODUCTION (MABBIT)
1.1 Assessment of the bacteriological quality of milk in the past and present
The main objectives in determining the bacteriological quality of raw milk are 1) to check whether the milk has been produced according to recognised or statutory standards of hygiene 2) to indicate whether the milk is suitable for processing or will be suitable after the inevitable storage period before processing.
Grading schemes depending on test results are based on tests for bacteriological quality and usually involve financial penalties or bonuses.
The principles of bacteriological grading of milk were discussed and enumerated by Wilson (1937) and remain basically unchanged. They apply to both non-refrigerated and refrigerated raw milk and those relevant to this report may be summarised as follows: a) The variability of the bacterial content of a milk supply and the variation between replicate samples necessitate regular and frequent sampling throughout the year. b) Because of this variability no attempt should be made to grade milk into more than 3 or 4 classes. c) Preferably the test method should be one that can be used by relatively unskilled operators and should have as small an experimental error as is consistent with this.
Testing pasteurized or other forms of heat treated milk is undertaken to ensure that for consumer protection post heat treatment contamination is minimal and that the milk has an acceptable keeping quality. Failure of the appropriate milk test, usually a statutory test, may result in withdrawal of a licence to process milk or some other penalty on the processor rather than grading of the milk for sale at different prices.
Interstate shipment of both raw and pasteurized milk may require the milk to meet agreed bacteriological standards.
- 10-
1 .2 Present problems Although the objectives and principles of testing milk have not changed over the years the rapid increase of refrigeration both at the point of production and in the home have necessitated the application of different test methods and standards. Without refrigeration the rate of deterioration of both raw and processed milk is ·particularly dependent on hygienic production and processing. Standards based on plate counts or dye reduction tests for milk which has been stored at atmospheric temperaturess e.g. on the farm before collection are reasonably satisfactory although correlation between these two types of tests is not good.
However with refrigerated milks correlation of such tests with production conditions and with the keeping quality of the milk ats says 5° is very poor. Pre-incubation at temperatures ranging from 12-18°C for up to 24 h before applying these tests has unpredictable results and does not sufficiently improve the correlations particularly as far as dye reduction tests are concerned. Reduction tests satisfy Wilson•s requirements for suitable grading tests but most psychrotrophic bacteria (i.e. bacteria capable of growth at 5-7°C) are poor dye reducers. Thus a new test, preferably sensitive to multiplication of psychrotrophss which can be applied to refrigerated milk is required.
1.3 Subjects of investigations Present investigations aim to develop a suitable test to replace bacterial {plate} counts or dye reduction tests and if necessary some means of preserving samples which would not invalidate test results.
2. Critical evaluation of tests for the bacteriological quality of refrigerated mi 1 k (MABBIT)
2.1 Total bacterial counts Methods for assessing the bacteriological quality of cooled bulk milk have recently been reviewed and critically assessed (International Dairy Federations 1974). Conclusions relevant to bacterial counts are as follows.

- II-
Milk produced under very good hygienic conditions should have a total count of <10,000 per ml as determined by the standard plate count method. With efficient cooling, the total count of the milk should not appreciably increase after storage below 4°C for two days. Under practical conditions, for various reasons, the production of milk of this quality may not be achieved but in any case, the bacterial count should not greatly exceed this figure. Consequently the number of bacteria in such milk at the time of collection is a direct and reliable indicator of the hygiene of production if this is taken to mean udder health and the effectiveness with which bacteria are excluded from the-milk during production.
Tests for the suitability of the milks for processing are more difficult to consider. Milk destined for the liquid market should preferably have a low count of bacterial spores and be free from objectionable taints. Present methods for the specific counting of spores are unsuitable for routine testing but bacterial taints could be effectively excluded by a bacterial count. Even those organisms which are particularly objectionable because of their taint producing capacity must be present in numbers above 106/ml before they cause trouble.
The disadvantages of counting methods are their innate inaccuracy (Wilson, 1937) and the time and expense involved. A new test which would more accurately assess bacterial numbers and which is rapid and cheap to operate is therefore required.
2.2 Tests for bacterial activity Dye reduction tests have already been discussed.
Reduction of nitrate, the catalase test and determination of dissolved oxygen have been shown to be unsatisfactory for refrigerated milk. Production of pyruvate, lactate free 1 fatty acids and ammonia have all been investigated and of these the pyruvate level in milk appears to be the most sensitive determinant of bacterial numbers and activity in milk. Determination of pyruvate is suited to centralized automated testing.
For refrigerated raw milk further investigations are needed to
- 12-
provide information on the value of or necessity for preincubation before testing for pyruvate, and the most suitable means of preserving samples, which would also permit determination of lactate, free fatty acids and ammonia if required. Pyruvate and lactate values in relation to the bacterial flora and numbers would need to be assessed.
Factors other than bacterial activity affect the acceptability of pasteurized milk to consumers. However, as with refrigerated raw milk, a rapid test such as that for pyruvate capable of assessing post-pasteurization deterioration brought about by psychrotrophic bacteria in pasteurized milk wotild undoubtedly contribute greatly to improving its keeping quality.
2.3 Economic aspects Centralized automated testing, e.g. for pyruvate, would not only permit frequent and regular testing of both raw and pasteurized milk but would be less costly than local testing. If at the same time somatic cell counts could be performed on the raw milk samples testing costs would be further reduced.
- 13 -
3. Pyruvate, the analoguous parameter for the bacteriological quality of milk (TOLLE and HEESCHEN) ,
3.1 Microbial catabolism
Microbial activity proceeds at the expense of the nutrients
contained in the medium. Metabolism is the series of chemical
reactions proceeding in proper sequence in the living cell. In
this process, anabolic reactions serve to build up the organism
and catabolic reactions to break it down. Sources of energy are
nutrients taken up from the environment. Large molecules are
split by exoenzymes and pass into the cell by means of various
vehicles in the cell, they are metabolized by means of numerous
enzymic reactions and through various pathways of glycolysis,
proteolysis and lipolysis. Adenosintriphosphoric acid serves as
a universal carrier of energy. It is commonly understood that
glycolysis results in acidification or fermentation, the result
of lipolysis is rancidity and that of proteolysis is putrefaction.
3.1.1 Glycolysis
The main sources of energy for most of the bacterial species are
sugars, hexoses in particular. Polysaccharides are broken down
differently outside the cell from monosaccharides (hexoses) by
the various microorganisms. From these hexoses several pathways
lead to the c3 substance pyruvic acid (pyruvate) which thus
takes a central place in metabolism (see Fig. 2).
The most common process of degradation proceeds via fructose-
1,6-diphosphate and is defined as FOP-pathway or EMBDEN-MEYERHOF
PARNAS (EMP)-pathway. The most important steps of the reaction are:
convertion of glucose into 2 molecules of triose phosphate,
dehydration of phosphoglycerate and conversion of pyruvate.
Outcome: 1 Mole glucose + 2 NAD + 2 ADP ---? 2 pyruvate +
2 NADH 2 + 2 ATP
- 14-
Another pathway of degradation of hexoses is that of pentose
phosphate (PP) or the DICKENS-HORECKER scheme. Degradation starts
with direct glucose oxidation, where the hydrogen split off is
transferred to NADP and gluconolactone-phosphate is produced
which spontaneously hydrolyzes to 6-P-gluconic acid. Further
dehydration and decarboxylation reaction results in the formation
of ribulose-5-phosphate via 3-keto-6-phosphogluconic acid. In the
following reactions of transketolase-transaldolase, the hexoses
are converted into pentoses.
Outcome: 1 Mole glucose + 1 ATP + 2 NADP ~ 1 Mole pentose + 1 ADP + 2 NADPH
2 + 1 C0
2
On the KDPG pathway or ENTNER-DOUDOROFF pathway, 6-P-gluconic
acid develops again at first as on the PP-pathway which, by
splitting off of water, is converted into 2-keto-3-desoxy-6-
phosphogluconic acid (KDPG). By a specific aldolase, KDPG is
split into pyruvic acid and glycerin aldehyde.
Outcome: 1 ~ole glucose + 1 NADP + 1 NAD + 2 ADP ~ 2 pyruvate +
1 NADPH 2 + 1 NADH2
+ 1 ATP
The microbial genera are, to various degrees, oriented towards
the pathways of degradation described. The enzymes of FDP and
PP pathways belong to the basic stock of most of the cells,
while the KDPG pathway is followed mainly by pseudomonads.
Temperature also has an influence on the pathway of degradation.
In the case of Pseudomonas fluorescens we were able to show that
the percentage share of KDPG in glucose degradation decreased,
the more the temperature dropped below the optimum, while the
percentage share of FOP in it increased.
Because of its central situation, EVruvic acid may be introduced
into various metabolic pathways. The most important are the
oxidative decarboxylation to acetyl CoA and dehydration to lactic

- 15-
acid. For further degradation, for making available the precursors
of synthesis and for energy production acetyl CoA is introduced
into the citric acid cycle and the respiration chain.
In lactic acid fermentation the NADH 2 produced on the FDP pathway
is regenerated by transfer of hydrogen to pyruvic acid. The trans
fer of split-off hydrogen to organic H acceptors is the only means
of energy production for many microorganisms (obligatory fermen
ters). The lactic acid formers are divided into homoferrnentative
and heterofermentative species according to their ability to
metabolize glucose either to lactic acid only or also to other
fermentation products and carbon dioxide.
Homoferrnentative species produce lactic acid only; they include:
Streptococcus lactis, S.cremoris, Lactobacillus casei,
L.acidophilus, L.plantarum, L.helveticus, L.bulgaricus.
Heterofermentative species produce lactic and acetic acid, ethanol,
and co2 , for instance:
Lactobacillus brevis, L.buchneri, L.fermenti, L.thermophilus,
Leuconostoc citrovorum, Lc.mesenteroides, Microbacterium lacticum,
Micrococcus luteus, M.varians, M.freudenreichii.
Their temperature optimum is around 25° C - 30° C in most cases.
The distinction between homo- and heterofermentative species is
in principal dependant on the different ways of degradation
of hexoses. The heteroferrnentative lactic acid bacteria do not
produce enzymes of the FDP pathway. The first steps of glucose
degradation are made over the PP pathway.
vJhe ther L-, D- and/ or DL-lacti c acid is produced, depends on the
stereospecificity of lactate dehydrogenase and on the presence
of a lactate racemase. The stereospecificity of lactic acid is
characteristic for the different lactic acid formers.
- 16-
It may be deduced from the nature of hexose degradation that
lactic acid and pyruvic acid may be used as parame~ers of
glycolytic processes.
3. 1 • 2 Proteolysis
The proteins are split up into permeable fragments by exoenzyrnes.
The fragments taken up by the cell are degraded by the peptidases
to amino acids. These are either used in protein biosynthesis, or
are passed to final degradation over various pathways of the
intermediary metabolism.
Amino acids are fermented under anaerobic condition over special
metabolic pathways.
Temperatures of 85° C up to 150° C are required for heat in
activation of extracellular proteolytic enzymes of psychrotrophic
organisms.
Typical proteolytes are: Bacilli, Pseudamonads, Clostridia,
Proteus, Streptococcus faecalis var.liquefaciens, Micrococcus
caseolyticus. They are putrefactants as far as they ferment the
proteins anaerobically to hydrogen sulphide, mercaptans, indol
and fatty acids.
Among the numerous possibilities for microbial spoilage, protein
decomposition appears to be the most complicated process and has
not been cleared up in detail so far.
It is characterized by the development of a putrefactive smell
and changes in consistency of a foodstuff.
Utilization of amino acids, the source of energy, is mostly
initiated by the reaction of decarboxylation or desamination. The
reaction products of decarboxylation are carbon dioxide and primary
or biogenic amines. Ammonia is split off in the case of desamina
tion. Transamination, in whidh the amino group of an amino acid
is transferred to an~-keto-acid, serves to synthesize amino acids
- 17-
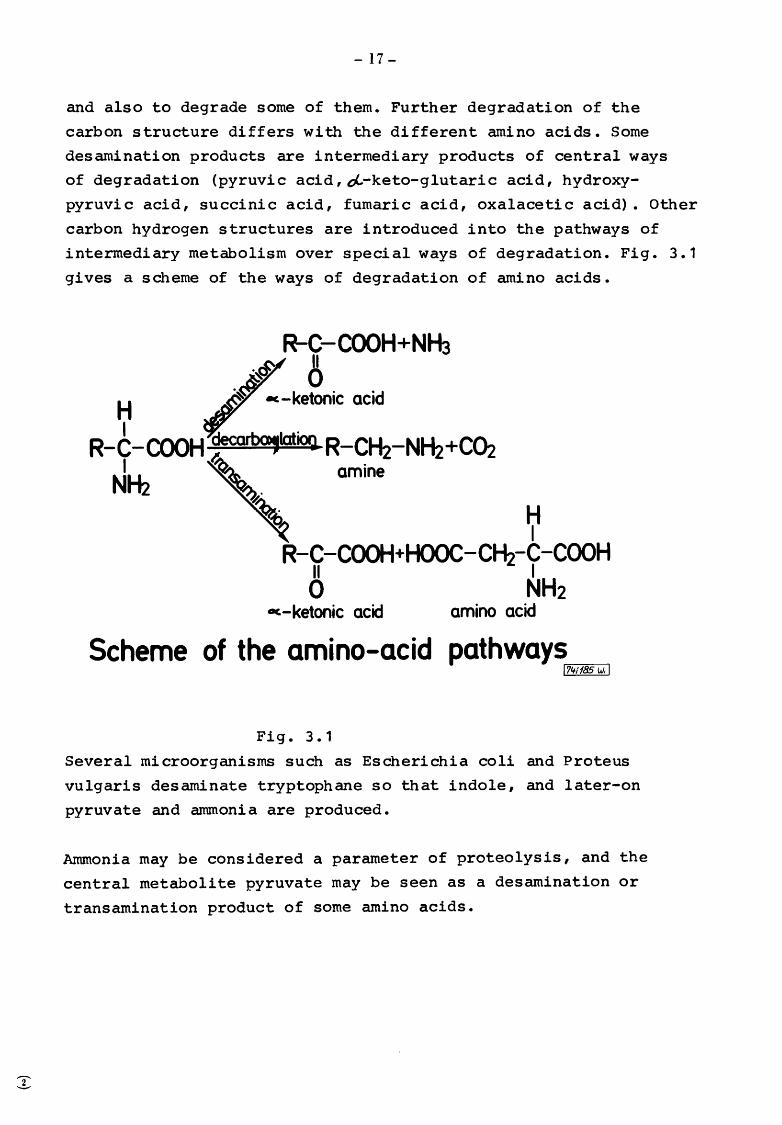
and also to degrade some of them. Further degradation of the
carbon structure differs with the different amino acids. Some
desamination products are intermediary products of central ways
of degradation (pyruvic acid,aL-keto-glutaric acid, hydroxy
pyruvic acid, succinic acid, fumaric acid, oxalacetic acid). Other
carbon hydrogen structures are introduced into the pathways of
intermediary metabolism over special ways of degradation. Fig. 3.1
gives a scheme of the ways of degradation of amino acids.
R-C-COOH+NH3
Lll 0
H -ketonic acid
R-6-COOH ~latiog R-C~-N~+CO:z I ~ NH2 ,. amine
H I
R-C-COOH+HOOC-C~-C-COOH II I
0 NH2 ~-ketonic acid amino acid
Scheme of the amino-acid pathways 1= 74,-,-1 1.='85=-w---,, I
Fig. 3.1
Several microorganisms such as Escherichia coli and Proteus
vulgaris desaminate tryptophane so that indole, and later-on
pyruvate and ammonia are produced.
Ammonia may be considered a parameter of proteolysis, and the
central metabolite pyruvate may be seen as a desarnination or
transamination product of some amino acids.
- 18-
3.1.3 Lipolysis
Most of the microbial lipases studied so far behave very much
like pancreas lipase since they preferably attack the
1,3-positions of the triglycerides present in dietary fat. Then
the fat is decomposed into its two major components - glycerol
and fatty acids. Furthermore, this hydrolysis involves
1,2-diglycerides or 2-monoglycerides as intermediary products.
The 2-monoglycerides are easily converted into 1-monoglycerides
by the migration of alkyls. At the beginning of lipolysis,
particularly short-chain fatty acids are split off.
The splitting products of fats pass over various metabolic
ways: glycerol is closely related to carbohydrates. It mav
either be used for the build-up of fructose or glucose or may
be further metabolized after oxidation and phosphorylation to
dehydroxy acetone phosphate over the EHBDEN-MEYERHOF pathway.
According to the principle of a-oxidation, the free fatty acids
are decomposed into c2 units (activated acetic acid) which are
either used in biosyntheses or are further metabolized in the
citric acid cycle.
The limited information obtained from the detection of free fatty
acids may be seen in the fact that the fattv acids are further
stepwise degraded through the B-oxidation.
Typical lipolytes are: Pseudomonades, alcaligenes aeromonades,
flavobacteria, achromobacter, micrococci, corynebacteria,
Escherichia, Klebsiella and bacilli. Of special importance are
psychrotrophic bacteria which are able to grow massively during
prolonged storage even in refrigerated food. The lipolytic
enzymes are either extracellular and/or intracellular. Many of
the extracellular enzymes are extremely heat-resistant. Tempera
tures of up to 150° c are required for their inactivation. Though
the microorganisms themselves are destroyed by pasteurization,
their lipolytic enzymes are hardly or only slightly inactivated.
- 19-
Due to their biochemical activity, fat-splitting microorganisms
may, in this way, also affect the quality of pasteurized products.
The organoleptic alterations are provoked particularly by even
numbered fatty acids with 4 to 12 C-atoms. Kind and quantity of
the liberated fatty acids vary from strain to strain and depend
on substrate conditions.
Lipolysis is detected through the senses by rancidity, soapiness
and discolorations.
Appendix:
Apart from microbial lipases, lipolysis may also be produced
by original lipases and by autoxidation (catalyzed by copper
and iron ions and released by short-wave light and high storage
temperatures) •
Originally milk contains several lipolytic enzymes. We distinguish
between plasma and membrane lipases, between lipoprotein lipases
and acid lipases. As regards the activity of lipases there is a
difference between cows; moreover some dependence on feeding,
stage of lactation, season and cell counts has been proved to
exist. The content of free fatty acids in milk is influenced by
the milking plant, due to turbulence and foam formation. No in
fluence is exerted by breed, milking method (manual or mechanical)
and daily milk or fat yield. These lipolytic enzymes are sensitive
to heat and are generally inactivated by pasteurization.
Lipolytic processes taking place in milk are of great economic
importance, since the fatty acids liberated during fat hydrolysis
as well as mono- and diglycerides confer a rancid or bitter
taste upon milk and milk products.
3.2 Pyruvate.as the central metabolic parameter for the measurements of bacterial activity under psychrotrophic conditions
The special difficulties associated wi~~ representative sampling
and efficient sample preservation have encouraged a working group
of our Institute to search for a bacterial metabolite which
- 20-
would extensively describe the bacterial breakdown in milk even under psychrotrophic conditions and would not be affected by other factors,
could be determined precisely and with an automated procedure if possible,
would be a soluble substance and as such allow representative sampling and reliable sample preservation, and
as a.chemical substance would not be affected by pasteurization and thus provide an additional picture of substrate changes.
Due to its central position in molecular metabolism, pyruvate
(pyruvic acid) appeared especially suitable for this purpose.
Preceeding papers have reported on the analytical as well as
the enzymatic pyruvate determination for the measurement of
the bacterial biochemical status of milk; the essential results
of our previous work together with the latest state of knowledge
and practical experience will be reported in the following.
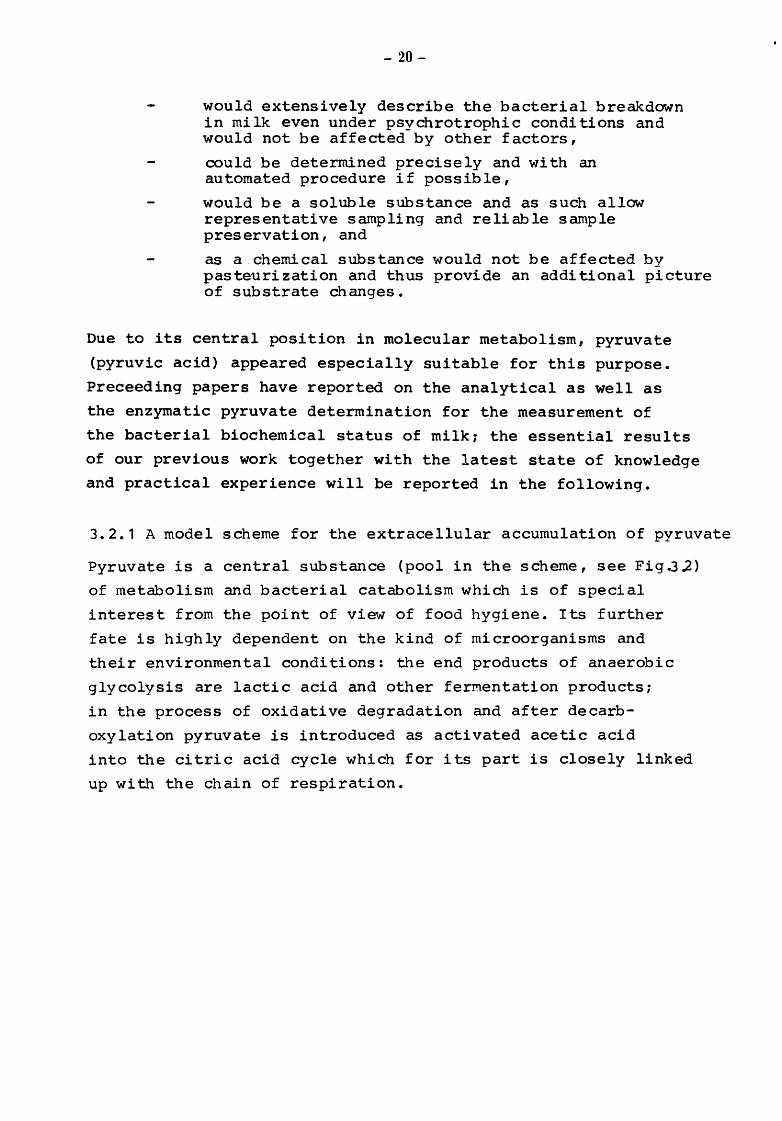
3.2.1 A model scheme for the extracellular accumulation of pyruvate
Pyruvate is a central substance (pool in the scheme, see Fig.32)
of metabolism and bacterial catabolism which is of special
interest from the point of view of food hygiene. Its further
fate is highly dependent on the kind of microorganisms and
their environmental conditions: the end products of anaerobic
glycolysis are lactic acid and other fermentation products;
in the process of oxidative degradation and after decarb
oxylation pyruvate is introduced as activated acetic acid
into the citric acid cycle which for its part is closely linked
up with the chain of respiration.

Cl
0
0
II
. / /
/ I •
- 21-
0
•
Cfli@:!l.~~tt:::~=::;:...
{J
I
, -cELL'Mll - CYTOPLASMA MEMBRAI'IE
MODEL OF PYRUVATE-FORMATION WITHIN THE SYSTEM CELL - SUBSTRATE (MILK)
Fig. 3.2
,
,
,
II
• tl
,
The first enzymatic steps leading to pyruvate evidently proceed
more quickly than the following steps, since we have observed a
systematic accumulation of pyruvate dependant on bacterial
growth. In this process, the amount of pyruvate released is
apparently related to the extracellular concentration of
pyruvate. To milk samples with equal bacterial counts different
concentrations of pyruvate were added experimentally; if the
extracellular concentration of pyruvate is low, more pyruvate
is released from the cell than in the case of higher pyruvate
concentrations, as may be seen from the foll~1ing Fig. 3.3.

Increase of pyruvate Pyruvatzunahme
(ppm)
2
0
- 22-
zugefi.ihrte Pyruvatmenge:
m Oppm
~ 1 ppm
~ 3ppm
D Sppm
Pyruvatzunahme in Milch nach experi -menteller Zugabe von Pyruvat ( Bebrutung : 3 Tage /12 °C Hn=11) ~'011i-wl
INCREASE OF PYRUVATE IN MILK AFTER EXPERIMENTAL ADDITION (INCUBATION: 72 h/120C) (n=11)
Fig. 3.3
Pyruvate added
The four columns show the pyruvate difference values which were
measured after incubation for 72 hours at 12° c. The first column
is that of a milk sample to which pyruvate was not added prior to
incubation. The other three columns show the difference values of
equal samples as before but with additions of 1 ppm, 3 ppm and
5 ppm of pyruvate respectively; the additions were made prior to
incubation. It may clearly be seen that the pyruvate difference
value decreases with increasing extracellular pyruvate concentration.
- 23-
This means that pyruvate measurements are more sensitive in
samples with low bacterial counts or low extracellular pyruvate
concentration than in higher bacterial ranges. This observation is
supported by studies on bacterial count equivalents attributed to
the respective pyruvate values (see Chapter 3.3.6) •It appears that
a diffusion equlibrium develops in the cell system and surrounding
nutritive medium.
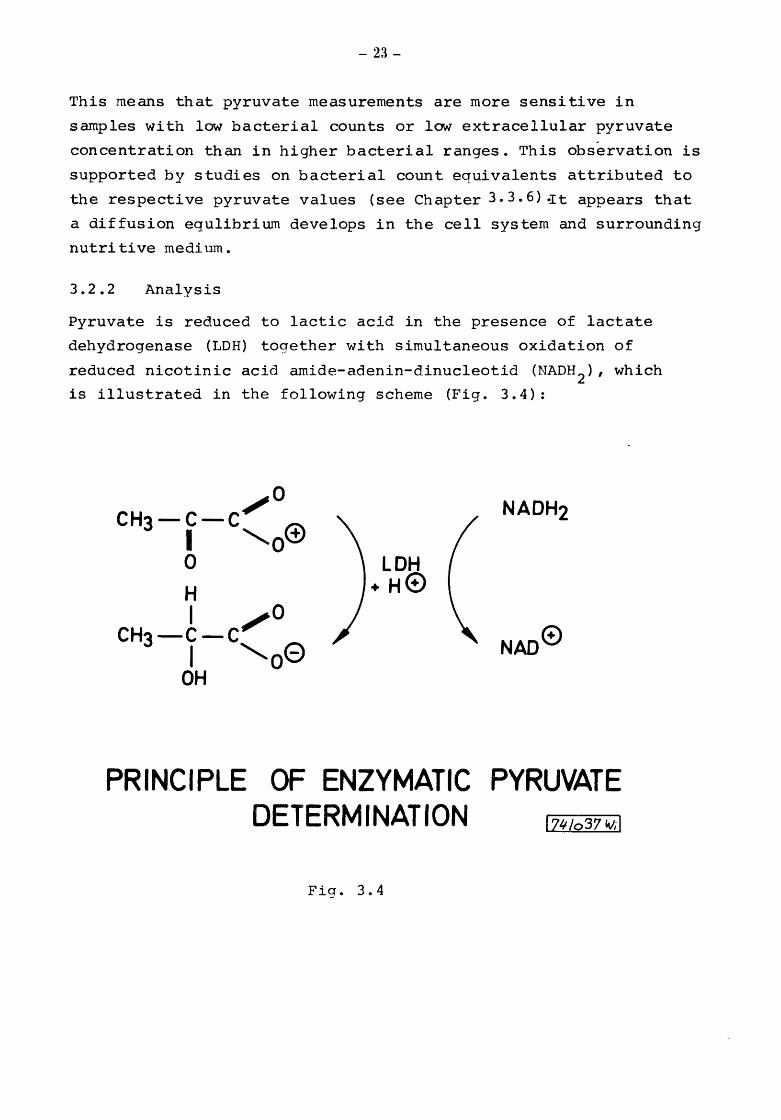
3.2.2 Analysis
Pyruvate is reduced to lactic acid in the presence of lactate
dehydrogenase (LDH) together with simultaneous oxidation of
reduced nicotinic acid amide-adenin-dinucleotid (NADH2), which
is illustrated in the following scheme (Fig. 3.4):
LDH + H®
NAD@
PRINCIPLE OF ENZYMATIC PYRUVATE DETERMINATION l74t/o37vd
Fig. 3. 4
- 24-
The amount of NADH2 consumed in this process is equivalent to
the quantity of pyruvate. The decrease of NADH2 is measured
fluorometrically as well as colorimetrically.
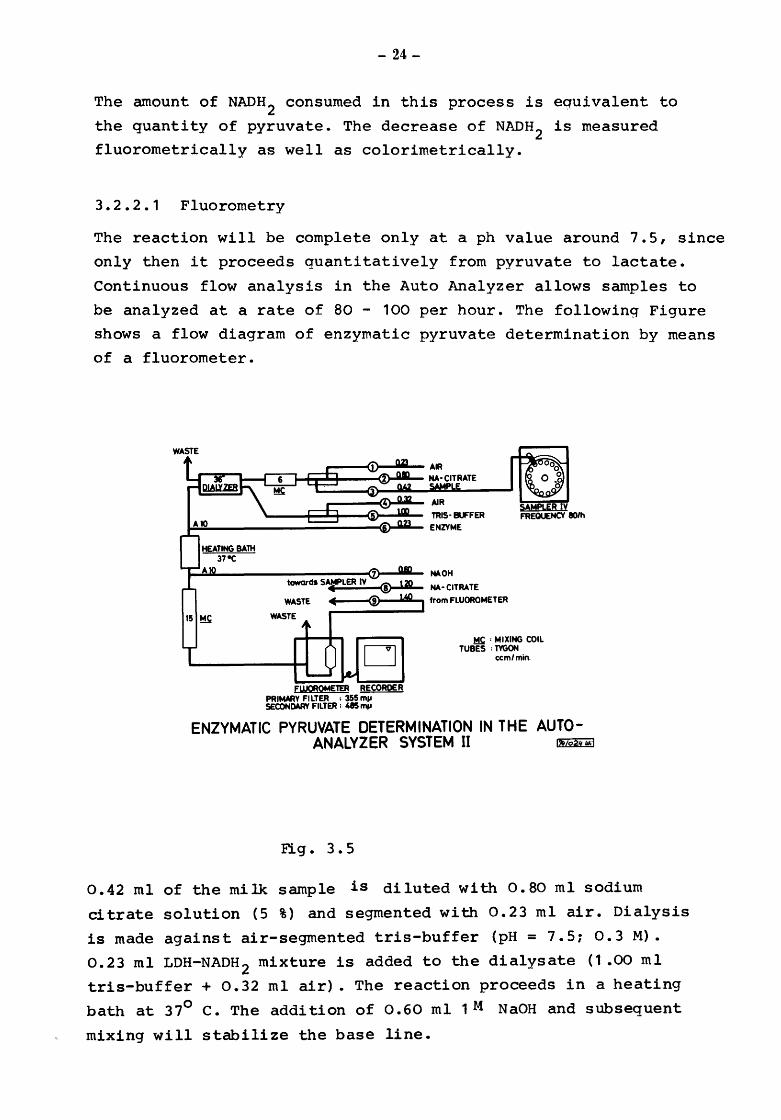
3.2.2.1 Fluorometry
The reaction will be complete only at a ph value around 7.5, since
only then it proceeds quantitatively from pyruvate to lactate.
Continuous flow analysis in the Auto Analyzer allows samples to
be analyzed at a rate of 80 - 100 per hour. The following Figure
shows a flow diagram of enzymatic pyruvate determination by means
of a fluorometer.
'----+-_,_o+-......Cl.>-...-._ TRIS· BlFFER
J.=..ll'-----------o(&J-.MIII.- ENZVME
WASTE
MS; : MIXING COIL TUBES : TYGON
ccm/min.
ENZYMATIC PYRUVATE DETERMINATION IN THE AUTO-ANALYZER SYSTEM II ~
F.ig. 3. 5
0.42 ml of the milk sample is diluted with 0.80 ml sodium
citrate solution (5 %) and segmented with 0.23 ml air. Dialysis
is made against air-segmented tris-buffer (pH= 7.5; 0.3 M).
0.23 ml LDH-NADH 2 mixture is added to the dialysate (1 .00 ml
tris-buffer + 0.32 ml air). The reaction proceeds in a heating
bath at 37° c. The addition of 0.60 ml 1M NaOH and subsequent
mixing will stabilize the base line.

- 25-
If standards are carried along with the flow of samples
and if the reaction mixture is constant, the reproducibility
obtained is nearly absolute: the correlation coefficient
between independent preparations is found to be r = 0.99.
(Methodical details see reference 21). By reducing the
quantity of NADH2 to about 5 ml of the stoCk solution and by
extending the amplitude in the diagram we have recently
succeeded in making the analysis more sensitive and in fixing
the accuracy of readings to 0.1 ppm.
Reagents (use volumetric flasks, make up to volume)
Sodium citrate soln.
Sodium citrate
Distilled water
Tris-buffer
Tris
Distilled water
adjust pH to 7.6 with cone. hydrochloric acid make up to volume (1000 ml)
Sodium hydroxide soln. (1 N)
Sodium hydroxide (pellets)
Distilled water
0.1 M Titriplex III soln.
NADH2
- stock soln.
NADH + H+ (sodium salt, MERCK)
Tris-buffer (pH 9.6)
(12.1 gms Tris in 1000.0 rnl distilled water)
- store in refrigerator -
Enzyme-working soln.
NADH 2 - stock soln.
LDH (rabbit muscle., 5.0 mgms/ml)
Tris-buffer (pH 9.6)
- prepare fresh daily -
up to
up to
up to
up to
50.0
1000.0
36.3
900.0
40.0
1000.0
30.0
grns
rnl
gms
rnl
gms
ml
rnl
0.06 grns
100.0 ml
5.0
o. 5
100.0
ml
ml
ml

- 26-
Pyruvate - stock soln. (1000 ppm)
Pyruvic acid (sodium salt)
Distilled water
- prepare fresh weekly -
up to
0.128 gms
1000.0 ml
Working standards for pyruvate determinations
Stock soln. (rnl) Pyruvate-concentration in ppm
1.0 Make up to
2.5 100 ml with
5.0 distilled
7.5 water
10.0
Precision of the method
PRECISION OF PYHUVATE DETERMINATION ( fluorometrically )
Standard deviations and coefficients of variation in relation to pyruvate level -sarnples in duplicate
Pyruvate (ppn1) n XA s cv a
< 1, 0 54 0, 74 0, 048 7,75
1, 01 - 1, 5 85 1,31 0, 046 3; 42
1, 51 - 2, 0 127 1,77 0, 063 3,52
2, 01 - 2, 5 73 2, 26 0,057 2, '45
2, 51 - 3, 0 39 2,73 0, 070 2,51
3, 01 - 5, 0 41 3,80 0, 076 1, 89
> 5,0 57 7, 99 0, 26 3,17
Total/average 476 2,64 0,082 3,55
Table 3.0 a
1 .o 2.5
5.0
7.5
10.0

- 27-
20 20
15 15
10 10 10
5 5
Pyruvat-Chromatogramm ( Frequenz 80/Std.) ( 4 Arbeitsstandards (ppm), Wiederholungsreihe einer Milch
probe, 10 unterschiedliche Milchproben)
PYRUVATE CHROMATOGRAM (RATE 80/h) {4 WORKING STANDARDS (ppm), REPITITION OF ONE SAMPLE,
10 DIFFERENT SAMPLES)
Fig. 3. 6
3.2.2.2 Colorimetry
3.2.2.2.1 Auto Analyzer System
Colorimetric pyruvate determination in the Auto-Analyzer System
proceeds according to the same analytical principles as in fluoro
metry (Fig. 3.4). The essential difference consists in the fact that
in the colorimetric pyruvate determination with blank the flow of
samples and of references passes through the same system, however,
no enzyme being added to the flo'Vl of references.. This way will

- 28-
automatically correct eventual unspecific reactions. The flow dia
gram is represented in Fig. 3.6 a.
PF
Sampler IV
Air No-citrate 80/h S~le 211
Air Tris- Blank
Air No-citrate Sample
Air Tris NAOH LOH
Waste __ .,... _____ o_..e_o >Colorimeter
Sampler -•--------2-00.,. No-citrate
Flow ceU: 15 mm Filter : 340 nm
Colorimetric pyruvate determination with blank in the Auto-Analyzer-System D
lt5/@Lfll
Fig. 3. 6 a
0.42 ml of the sample are diluted with 0.80 ml sodium citrate and
segmented with 0.32 ml air. Dialysis is made in the "analytical"
canal against 1.20 ml tris-buffer-NADH 2-LDH solution which is seg
mented with 0.42 ml air. No LDH is added to the receptor stream
of the reference canal. The reaction proceeds in a heating bath at
37° c. The measurements are made in a 15 rnm flow cuvette at 340 nrn.
Reagents
Sodium citrate soln.
Sodium citrate
Distilled water
Tris-buffer
Tris
Distilled water
Adjust pH to 7.6 with cone. HCl
Distilled water up to
50.0
1000.0
72.6
1800.0
2000.0
gms
ml
gms
ml
ml

NADH 2 stock soln.
NADH 2 (sodium salt)
Tris-buffer pH 9.6
- 29-
(12.1 gms tris in 1000 ml distilled water)
Sample and reference reagent
Tris-buffer pH 7.6
NADH2
stock soln.
After careful mixing divide into 2 x 1 litre. 0.6 ml LDH (from rabbit muscle 5.0 mg/ml) is added to the sample reagent (1000.0 ml)
Pyruvate stock soln.
Pyruvic acid (sodium salt)
Distilled water
Working standards
Stock soln.
1. 0
2.5
5.0
7.5
10.0
Precision of the method
up to 100 ml
distilled water
60
100.0
2000.0
30.0
mg
ml
ml
ml
0.128 gms
1000.0 ml
Pyruvate concn. tpprn)
1 • 0
2.5
5 .o 7.5
10.0
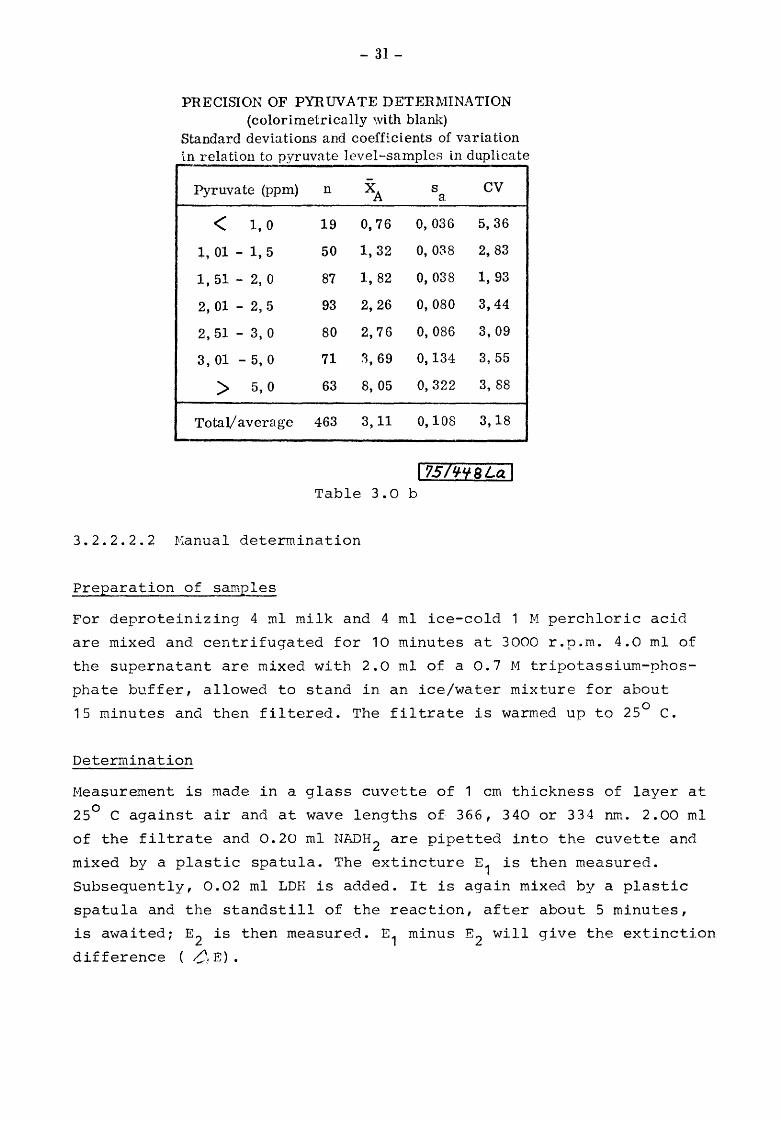
For the colorimetric pyruvate determination with blanks Table 3.0 b
shows standard deviations and coefficients of variation in depen
dence on various pyruvate contents.
- 30-
Distilled water is used instead of the filtrate in order to deter
mine the blank. The extinction difference measured hereby must be
subtracted from the extinction difference obtained with the filtrate.
Calculation
The pyruvate values are calculated in accordance with the following
equation:
~ E • V . MG • 106
c = 1.; • d • v • F (ppm)
where:
C = concentration
~ E = extinction difference
V = test volume (ml)
v = sample volume (ml)
MG =molecular weight of the substance (g) (pyruvate 88.1 gms) to be determined
I = extinction coefficient of NADH2 6 2 ( 3 6 6 nm: 3. 3 • 1 0 nm /Mole
340 nm: 6.22 . 106 nrn 2 /Mole
334 nm: 6.0 • 106 nm2 /Mole
d = thickness of layer
106
= conversion factor into ppm
F = dilution factor
There are the following conversion
366 nm c = E 88.9 (ppm)
340 run c = E 47.2 (ppm)
334 run c = E 48.9 (ppn)
Calibration curve
factors:
The pyruvate values may also be determined by means of a calibra
tion curve. In this case, aqueous pyruvate solutions of known con
centrations are treated like the samples and the extinction diffe
rences are recorded in dependence on the concentration.
- 31-
PRECISION OF PYRUVATE DETERl\!IINATION (colorimetrically with blank)
Standard deviations and coefficients of variation in relation to pyruvate level-samples in duplicate
Pyruvate (ppm) n XA s cv a.
< 1, 0 19 0, 76 0, 036 5,36
l, 01 - 1, 5 50 1,32 0, 038 2, 83
1, 51 - 2, 0 87 1, 82 0, 038 1, 93
2,01-2,5 93 2,26 0,080 3,44
2, 51 - 3, 0 80 2, 76 0,086 3,09
3, 01 - 5, 0 71 :i,69 0,134 3,55
> 5,0 63 8,05 0,322 3, 88
TotaVaverage 463 3,11 0,108 3,18
l75f~lf8La I Table 3.0 b
3.2.2.2.2 rv=anual determination
Preparation of samples
For deproteinizing 4 ml milk and 4 ml ice-cold 1 M perchloric acid
are mixed and centrifugated for 10 minutes at 3000 r.p.m. 4.0 rnl of
the supernatant are mixed with 2.0 rnl of a 0.7 M tripotassiurn-phos
phate buffer, allowed to stand in an ice/water mixture for about
15 minutes and then filtered. The filtrate is warmed up to 25° c.
Determination
Measurement is made in a glass cuvette of 1 em thickness of layer at
25° c against air and at wave lengths of 366, 340 or 334 nm. 2.00 ml
of the filtrate and 0.20 ml NADH 2 are pipetted into the cuvette and
mixed by a plastic spatula. The extincture E1 is then measured.
Subsequently, 0.02 ml LDB is added. It is again mixed by a plastic
spatula and the standstill of the reaction, after about 5 minutes,
is awaited; E2 is then measured. E1 minus E2 will give the extinction
difference ( ,(}.E) •
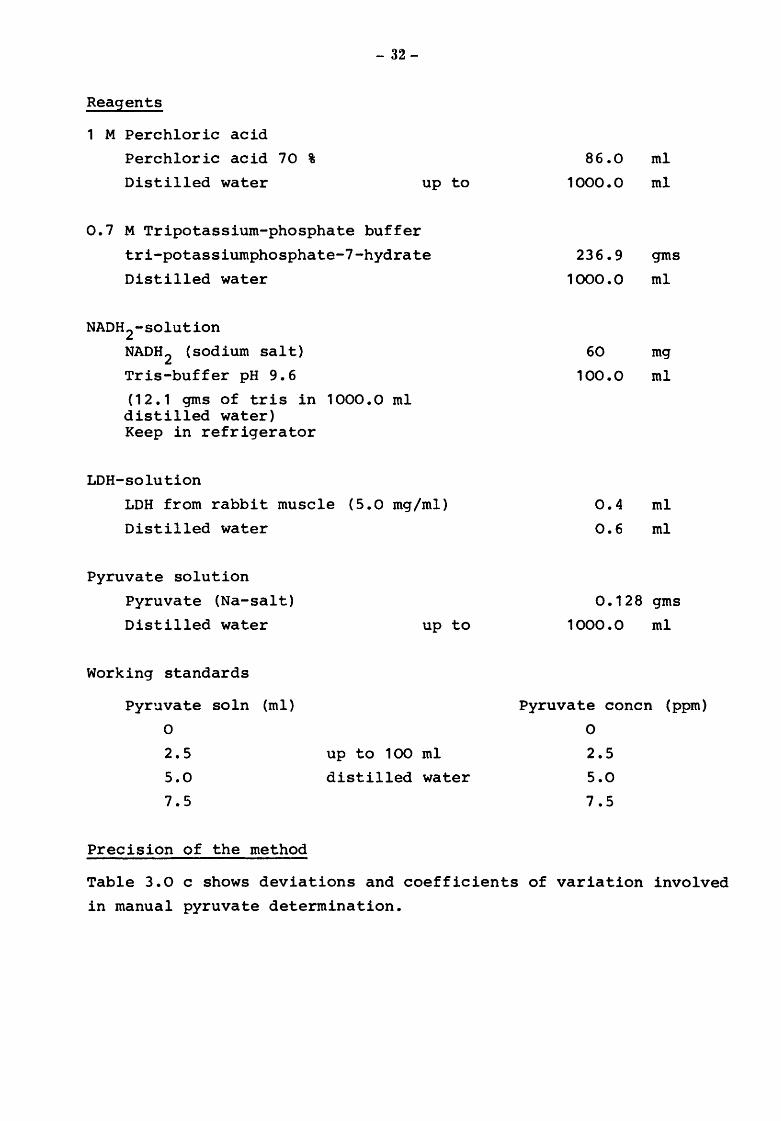
Reagents
1 M Perchloric acid
Perchloric acid 70 %
Distilled water
- 32-
up to
0.7 M Tripotassium-phosphate buffer
tri-potassiumphosphate-7-hydrate
Distilled water
NADH2-solution
NADH 2 (sodium salt)
Tris-buffer pH 9.6
(12.1 gms of tris in 1000.0 ml distilled water) Keep in refrigerator
LDH-solution
LDH from rabbit muscle (5.0 mg/ml)
Distilled water
Pyruvate solution
Pyruvate (Na-salt)
Distilled water
Working standards
Pyr~vate soln (ml)
0
2.5
5.0
7.5
Precision of the method
up to
up to 100 ml
distilled water
86.0
1000.0
236.9
1000.0
60
100.0
o. 4
o. 6
ml
ml
gms
ml
mg
ml
ml
ml
0.128 gms
1000.0 ml
Pyruvate concn (ppm)
0
2.5
5.0
7.5
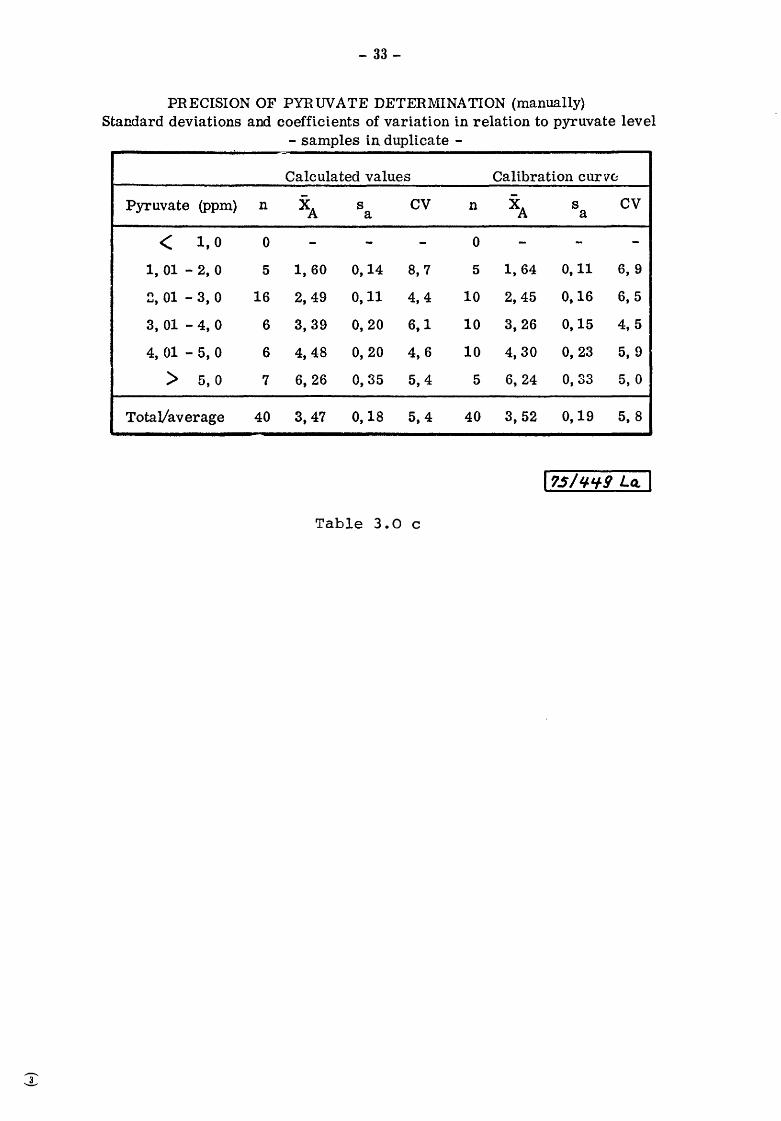
Table 3.0 c shows deviations and coefficients of variation involved
in manual pyruvate determination.
- 33-
PRECISION OF PYRUVATE DETERMINATION (manually) Standard deviations and coefficients of variation in relation to pyruvate level
- samples in duplicate -.;.
Calculated values Calibration cur VCJ
Pyruvate (ppm) n XA s cv n XA s cv a a
< 1,0 0 - - - 0 - - -1, 01 - 2, 0 5 1, 60 0,14 8, 7 5 1,64 0,11 6, 9
~' 01 - 3, 0 16 2, 49 0,11 4,4 10 2,45 0,16 6, 5
3, 01 - 4, 0 6 3,39 0,20 6,1 10 3,26 0,15 4,5
4, 01 - 5, 0 6 4,48 0,20 4,6 10 4,30 0,23 5, 9
> 5,0 7 6, 26 0, 35 5,4 5 6,24 0,33 5, 0
TotaVaverage 40 3,47 0,18 5,4 40 3,52 0,19 5, 8
Table 3.0 c
3.3
3.3.1
- 34-
Results of experimental assays
Specifity of the enzymtic determination of pyruvate
The check for the specifity of the method was carried out with
coreactants under identical conditions to that of pyruvate. The
coreactants occuring with LDH are:
1. a-hydroxy-pyruvate
2. glyoxalate
3. a-ketobutyrate
4. a-keto-n-valerate
5. oxalacetate
Under these substances B-hydroxy-pyruvate and glyoxalate reacted
with a rate of the same order as that of pyruvate. The remaining
three substances reacted essentially more slowly. The a-keto
analogues of valine, leucine, isoleucine, phenylalanine, tyrosine,
glutamic acid and aspartic acid practically do not react.
The investigations in the AutoAnalyzer proved, that the cross
activity of LDH against a-hydroxy-pyruvate was about 50%,
The enzyme reaction on the four other substrates was so
poor, that it could be neglected in the assays under study.
To elucidate a possible interference of B-hydroxy-pyruvate,
the pyruvate and B-hydroxy-pyruvate concentrations in 100 milk
samples were determined and compared with another.
This was done by merely changing the enzymes in the continuous
flow analysis. For the determination of B-hydroxy .-pyruvate
glycerate-dehydrogenase from spinach {BOEHRINGER) was used in
a concentration of 5 mgjml in the working solution. This
enzyme also reacts with glyoxalate with a rate, four to
five times lower than with B-hydroxy-pyruvate. Pyruvate itself
is not affected.
The pyruvate concentrations in milk ranged between 1 and 20 ppm.
The maximum B-hydroxy -pyruvate content was 2.5 ppm. This sh~rs
that only small quantities of this substance are present in milk
and will practically cause no interference with pyruvate. The
simultaneous determination of a-hydroxyt-pyruvate will not
restrict the specifity ofthese methods, as this compound is a
break-down product from serine and as such is fed into the
pathway of glycolysis. Here it is metabolized to pyruvate too.
- 35-
3. 3. 2 Sampling
Pyruvic acid occurs in milk in a dissolved state; this
facilitates representative sampling. Associated with reliable
preservation by formalin in equal concentration to that required
in electronic cell counting, this circunstance appears to be
an inestimable advantage for practical dairy hygiene.
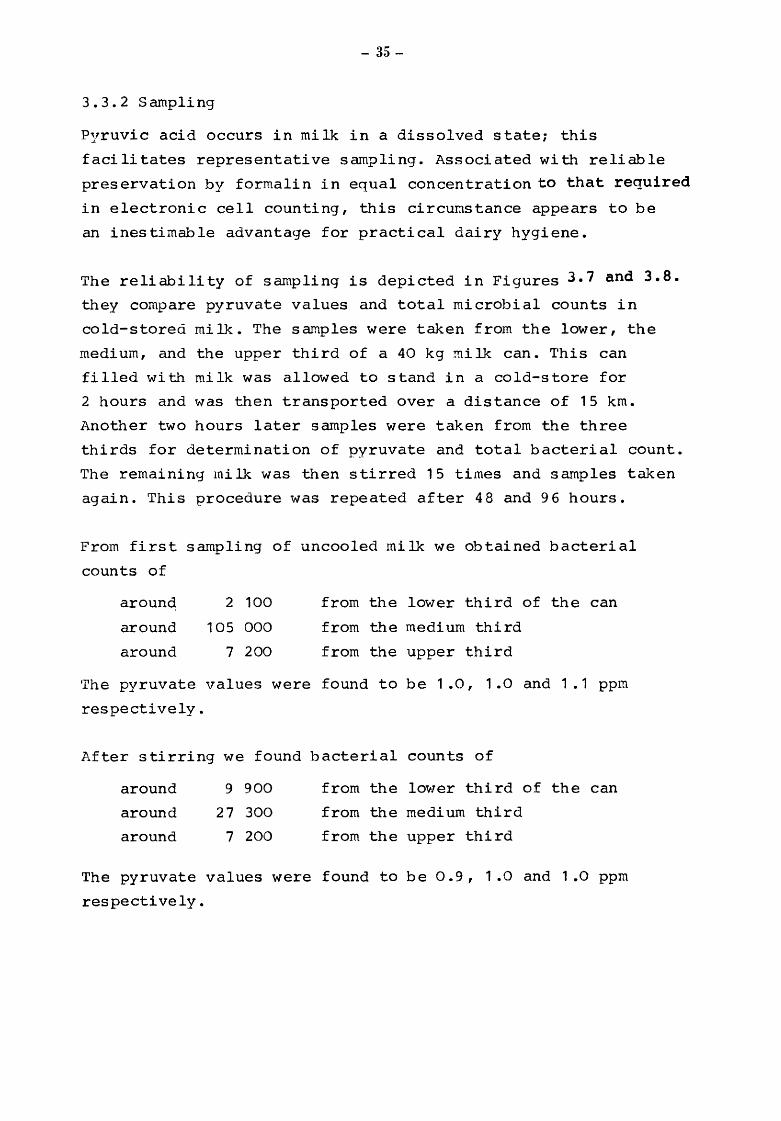
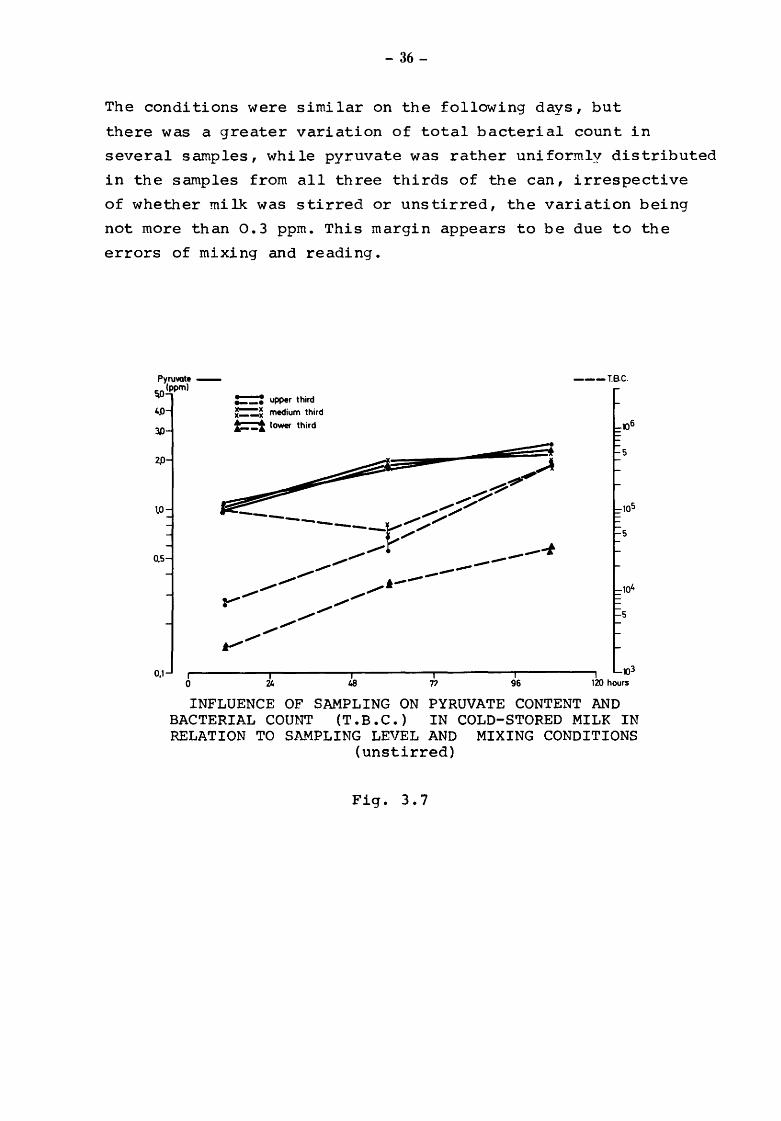
The reliability of sampling is depicted in Figures 3.7 and 3.8.
they compare pyruvate values and total microbial counts in
cold-stored milk. The samples were taken from the lower, the
medium, and the upper third of a 40 kg milk can. This can
filled with milk was allowed to stand in a cold-store for
2 hours and was then transported over a distance of 15 km.
Another two hours later samples were taken from the three
thirds for determination of pyruvate and total bacterial count.
The remaining milk was then stirred 15 times and samples taken
again. 'rhis procedure was repeated after 48 and 96 hours.
From first sampling of uncooled milk we obtained bacterial
counts of
around 2 100 from the lower third of the can
around 105 000 from the medium third
around 7 200 from the upper third
~rhe pyruvate values were found to be 1 .o' 1 .o and 1.1 ppm
respectively.
After stirring we found bacterial counts of
around 9 900 from the lov1er third of the can
around 27 300 from the medium third
around 7 200 from the upper third
The pyruvate values were found to be 0.9, 1.0 and 1.0 ppm
respectively.
- 36-
The conditions were similar on the following days, but
there was a greater variation of total bacterial count in
several samples, while pyruvate was rather uniformly distributed
in the samples from all three thirds of the can, irrespective
of whether milk was stirred or unstirred, the variation being
not more than 0.3 ppm. This margin appears to be due to the
errors of mixing and reading.
Pyruvate-~0(ppml ==: upper third
=~ medium third t=::t lower third
---T.B.C.
4Jl
3.0
0,5
0,1 0 24 48 11 96
5
5
5
X)3 120 hours
INFLUENCE OF SAMPLING ON PYRUVATE CONTENT AND BACTERIAL COUNT (T.B.C.) IN COLD-STORED MILK IN RELATION TO SAMPLING LEVEL AND MIXING CONDITIONS
(unstirred)
Fig. 3.7
- 37-
PyruvateS.O(ppm) = upper third :== medium third
t==:1 lower third
--- T.BC
4,0
3.0
2.0
1.0
0.5
0,1 0 48 72 96
5
5
103
120hours
INFLUENCE OF SAMPLING ON PYRUVATE CONTENT AND BACTERIAL COUNT (T.B.C.) IN COLD-STORED MILK IN RELATION TO SAMPLING LEVEL AND MIXING CONDITIONS
(stirred 15 times)
Fig. 3. 8
The comparative superiority of pyruvate measurement is also shown
when automatic sampling is compared with manual sampling. In this
case, samples for pyruvate determination and total bacterial counts
were drawn manually and automatically by means of the JANSKY system.
The principle of this automated sampling system consists in the fact
that a sampling tube with narrow diameter is run in parallel line to
the long milk tube. This makes it possible that the sampling tube is
carfully flushed and contamination is minimized. It is clear from
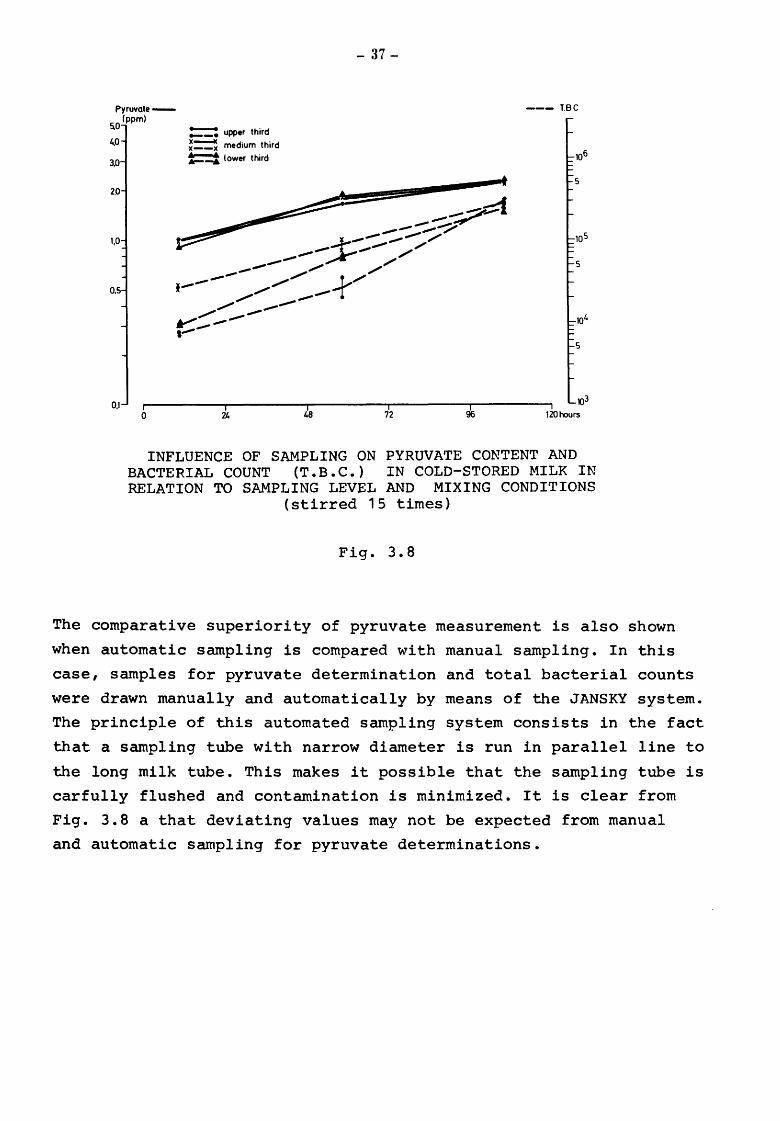
Fig. 3.8 a that deviating values may not be expected from manual
and automatic sampling for pyruvate determinations.
- 38-
y = 1,0078 X+ 0.06918
Pyruvate ppm automatic
Comparison of automatic and manual sampling. Test: Sampling of milk with low pyruvate content after previous sampling of milk with high pyruvate content
(Jansky system)
Fig. 3.8 a
(Y)
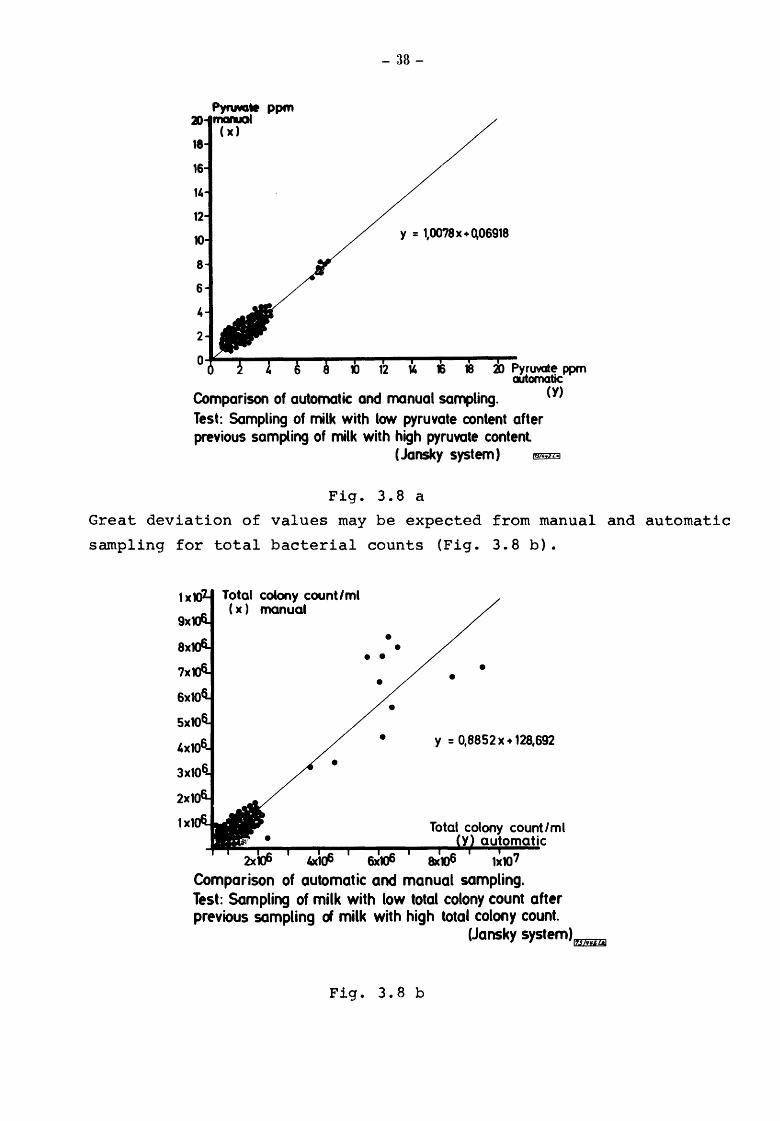
Great deviation of values may be expected from manual and automatic
sampling for total bacterial counts (Fig. 3.8 b).
Total colony count/ml ( x) manual
•
• • • •
• •
• • •
y = 0,8852 X +128,692
1x10⁷
Comparison of automatic and manual sampling. Test: Sampling of milk with low total colony count after previous sampling d milk with high total colony count.
(Jansky system) rm!IDil
Fig. 3. 8 b
- 39-
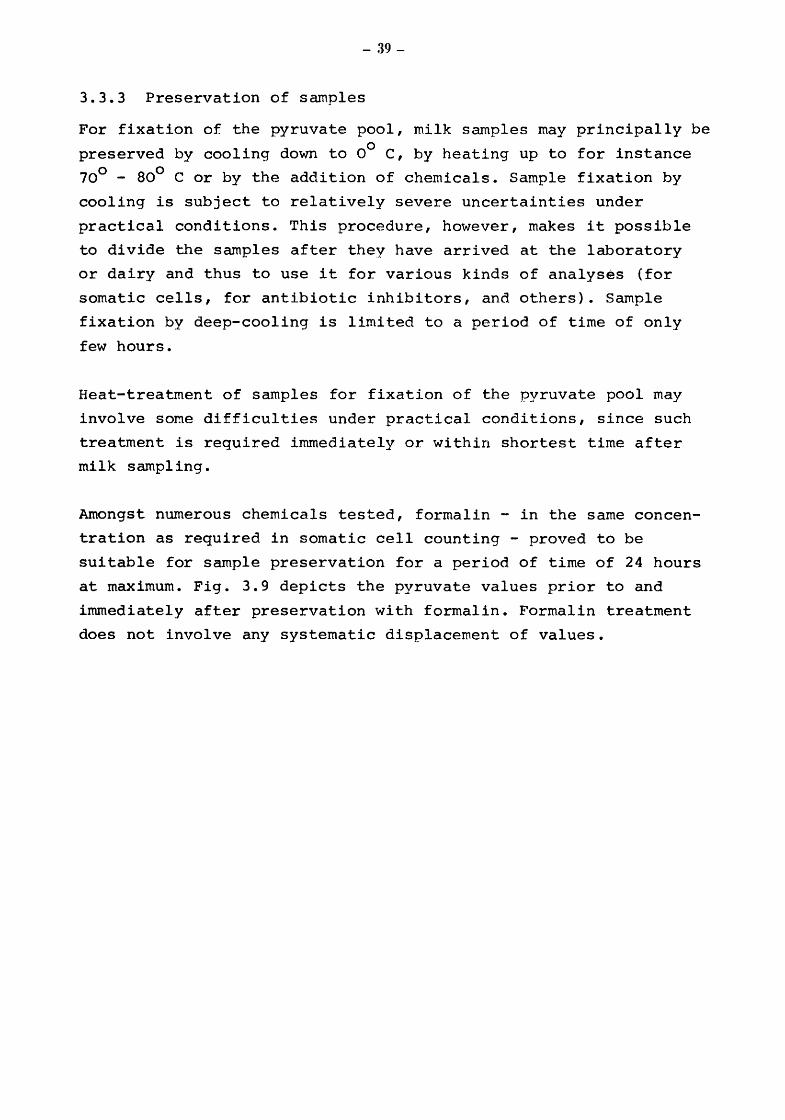
3.3.3 Preservation of samples
For fixation of the pyruvate pool, milk samples may principally be
preserved by cooling down to 0° c, by heating up to for instance
70° - 80° c or by the addition of chemicals. Sample fixation by
cooling is subject to relatively severe uncertainties under
practical conditions. This procedure, however, makes it possible
to divide the samples after they have arrived at the laboratory
or dairy and thus to use it for various kinds of analyses (for
somatic cells, for antibiotic inhibitors, and others). Sample
fixation by deep-cooling is limited to a period of time of only
few hours.
Heat-treatment of samples for fixation of the pyruvate pool may
involve soMe difficulties under practical conditions, since such
treatment is required immediately or within shortest time after
milk sampling.
Amongst numerous chemicals tested, formalin - in the same concen
tration as required in somatic cell counting - proved to be
suitable for sample preservation for a period of time of 24 hours
at maximum. Fig. 3.9 depicts the pyruvate values prior to and
immediately after preservation with formalin. Formalin treatment
does not involve any systematic displacement of values.

- 40-
3.5 vol. 0/o Formaldehyde 6,0 ( 0,2ml/10 ml milk) 0 h
5,0
4,0
3,0
2,0
1,0
1,0 2,0 3,0 4,0 s.o 6.0
Preservation of milk samples for pyruvate determination (fluorometri
cally) Without preservation/3.5 vol. •J. Formaldehyde
( Q2ml/10ml milk) 0 h 1?51.%9 w;·l
Fig. 3.9
- 41-
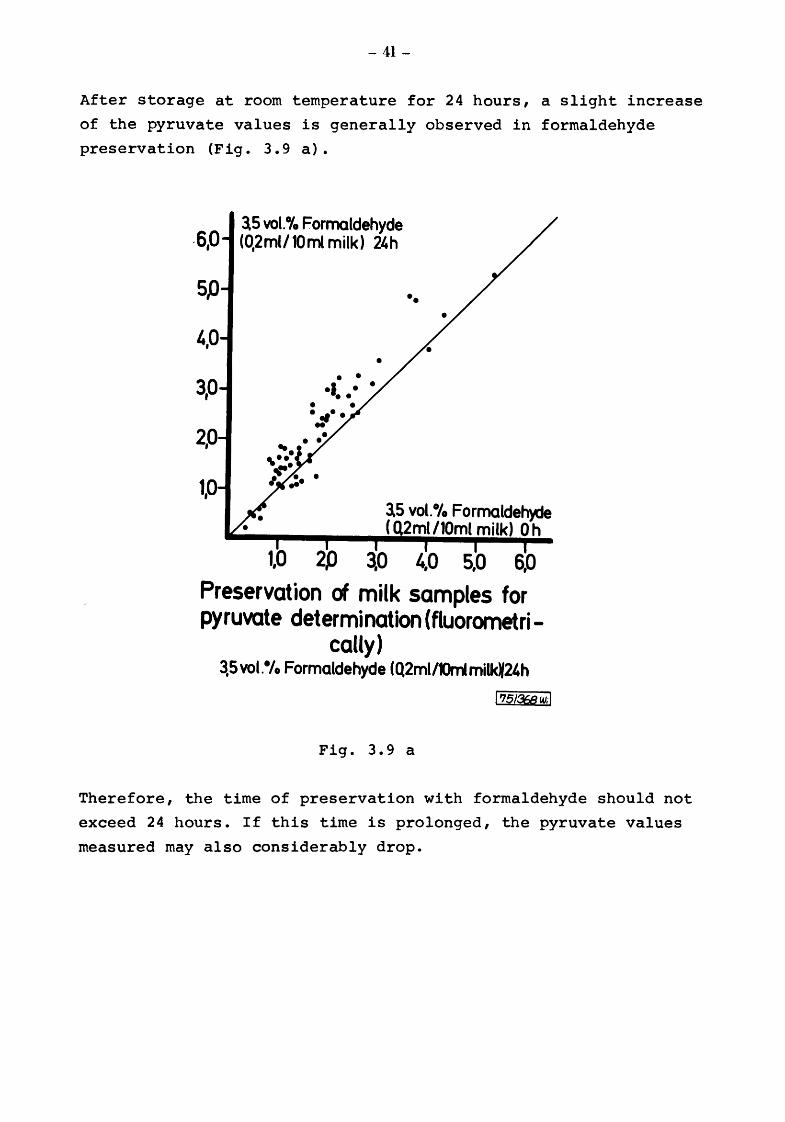
After storage at room temperature for 24 hours, a slight increase
of the pyruvate values is generally observed in formaldehyde
preservation (Fig. 3.9 a).
3,0
2,0
1,0
3.5 vol.4fo Formaldehyde (0,2ml/10ml milk) ~h
• • •I • • • • • • . ., .. ..
•
••
3.5 vot.•t. Formaldeh~ ( 2ml /10ml milk) 0 h
~0 4,0 5,0 6,0
Preservation of milk samples for pyruvate determination (fluorometri-
cally) 3,5vot.•t. Formaldehyde (Q2ml/llrrimilk¥24h
I '75/368ud
Fig. 3.9 a
Therefore, the time of preservation with formaldehyde should not
exceed 24 hours. If this time is prolonged, the pyruvate values
measured may also considerably drop.
- 42-
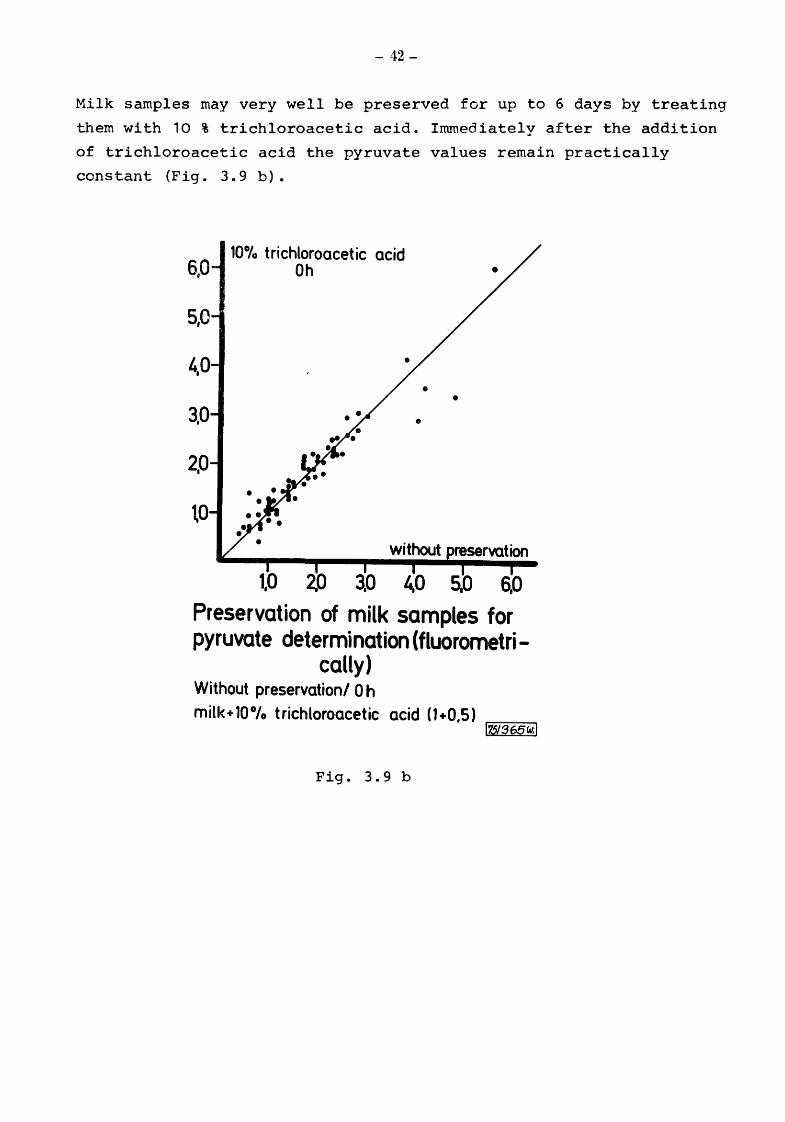
Milk samples may very well be preserved for up to 6 days by treating
them with 10 % trichloroacetic acid. Immediately after the addition
of trichloroacetic acid the pyruvate values remain practically
constant (Fig. 3.9 b).
6,0
5,0
3,0
2,0
\0
10°/o trichloroacetic acid Oh
•
• •
s.o 6,0
Preservation of milk samples for pyruvate determination (fluorometri-
cally) Without preservation/ 0 h milk+ 10°/o trichloroacetic acid 0+0,5)
Fig. 3.9 b
r-l1,51....,-3,--65_W. ___ ;l
- 43-
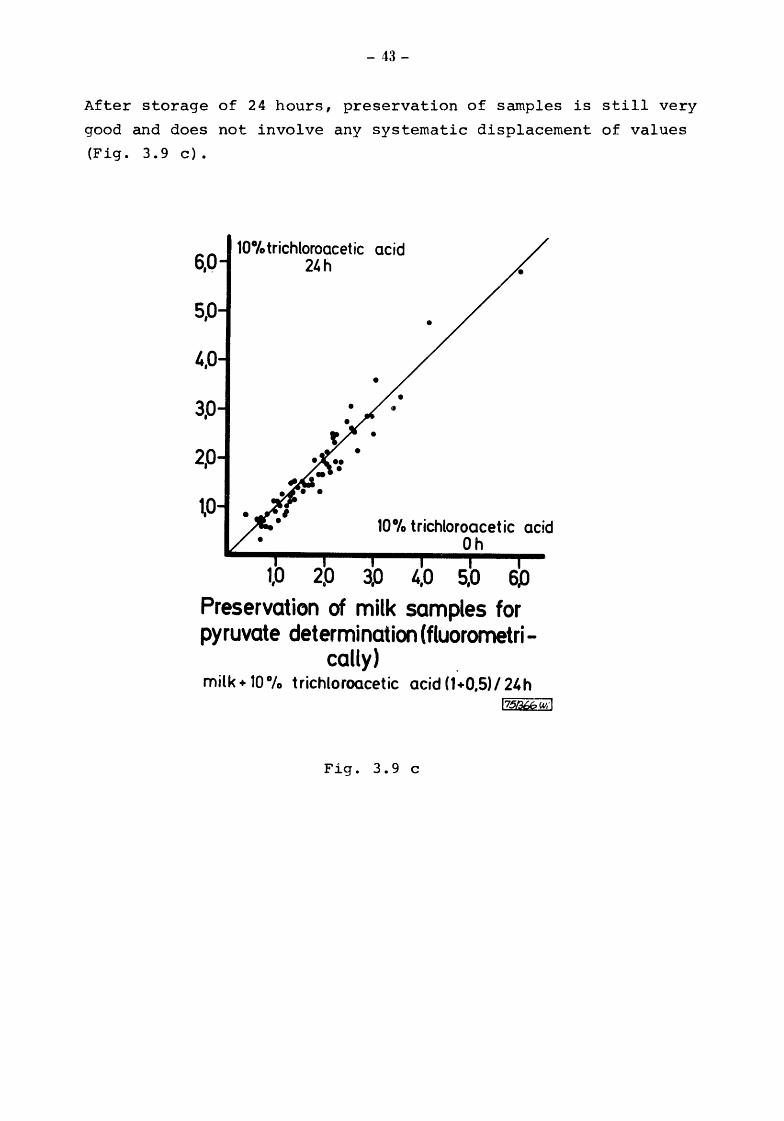
After storage of 24 hours, preservation of samples is still very
good and does not involve any systematic displacement of values
(Fig. 3. 9 c) •
1.,0 5,0 6.0
Preservation of milk samples for pyruvate determination (fluorometri-
cally) milk+ 10 °/o trichloroacetic acid {1 +0,5) /24 h
l751¥bw.·l
Fig. 3.9 c

-44-
Even after storage of 6 days (144 hours), pyruvate determination
may still be performed in samples preserved by this way, though
the deviation of values will be somewhat greater. Systematic
displacement of values, however, will not be recognized (Fig. 3.9 d).
6.0 10°/otrichloroacetic acid
1''h
5,0
4,0 • •
3,0 •
2.0
1,0 10°/o trichloroacetic acid
Oh
1,0 2,0 3,0 40 s.o 6.0 Preservation of milk samples for pyruvate determination ( fluorometri
cally) milk+ 10°/o trichloroacetic acid (1+0,5) /144 h
r=l75":":'"196=7~llrl
Fig. 3. 9 d

- 45-
For manual pyruvate determination after the colorimetric principle,
protein precipitation and preservation of samples by 1 M perchloric
acid is used. This will yield good preservation of milk samples for
up to 6 days. The advantage involved in sample preservation by
trichloracetic acid or perchloric acid may primarily be seen in
that the analysis of the samples may be adapted to the actual
working conditions and requirements without the samples becoming
unsuitable for analysis in the course of several days storage.
3.3.4 Secretory background value
42 quarter samples of the first strips from an experimental
herd with a cell count of up to 1 million/ml showed a
geometric mean of 0.24 ppm pyruvate. With the inclusion of
normal and double standard deviation, we obtained a pyruvate
base value from this material of 0.26 and 0.29 ppm, respectively.
These values were obtained after improvement of the technique
of preparation to give a reading accuracy of 0.1 ppm.
so % of another herd with a total of 120 quarters showed pyruvate
values of up to 0.2 ppm, 90 % of up to 0.4 ppm.

- 46-
For healthy black-pied lowland cattle we have actually assumed
a secretory base value of 0.5 ppm pyruvate. There are indications
that this value is lower in cattle breeds of higher regions. From
recent studies made in England it is seen that bacterial counts
in herd bulk milks exceeding 10 000 cfU/ml are frequently due
to mastitis streptococci.
3.3.5 Pyruvate and pasteurization
Pyruvate endures pasteurization without being affected by it
Cr.,iq. 3.10). For the first time, this opens up the possibility
of measuring the additive effect of bacterial activity in every
stage between production and consumption.
t .i 20
I &.10 • I • e ! s "" i i t
2
2 s I) 20 PYR~TE(ppm) after pasteurization-
PYRUVATE CONCENT OF MILK BEFORE AND AFTER PASTEURIZATION(71°C/~sec)
( n : 151 ) I Wp23 ..,, I
Fig. 3. 10
- 47-
The pyruvate values found before and after short-time pasteuriza
tion are grouped closely around the angle of 45°.
3.3.6 Pyruvate and bacterial activity
3.3.6.1 Pyruvate as parameter for bacterial activity in relation to the number of microbes as the quantitative morphologic value
If the base value of o.s ppm pyruvate is exceeded, any increase
is exclusively due to bacterial activity. Because of varying
metabolic activities which depend on bacterial species and their
adaptation under practical dairy conditions, we may expect an
equivalence with the number of organisms only with considerable
limitations, since we are comparing two different biological
quantities: metabolic activity on the one hand, and morphological
units on the other.
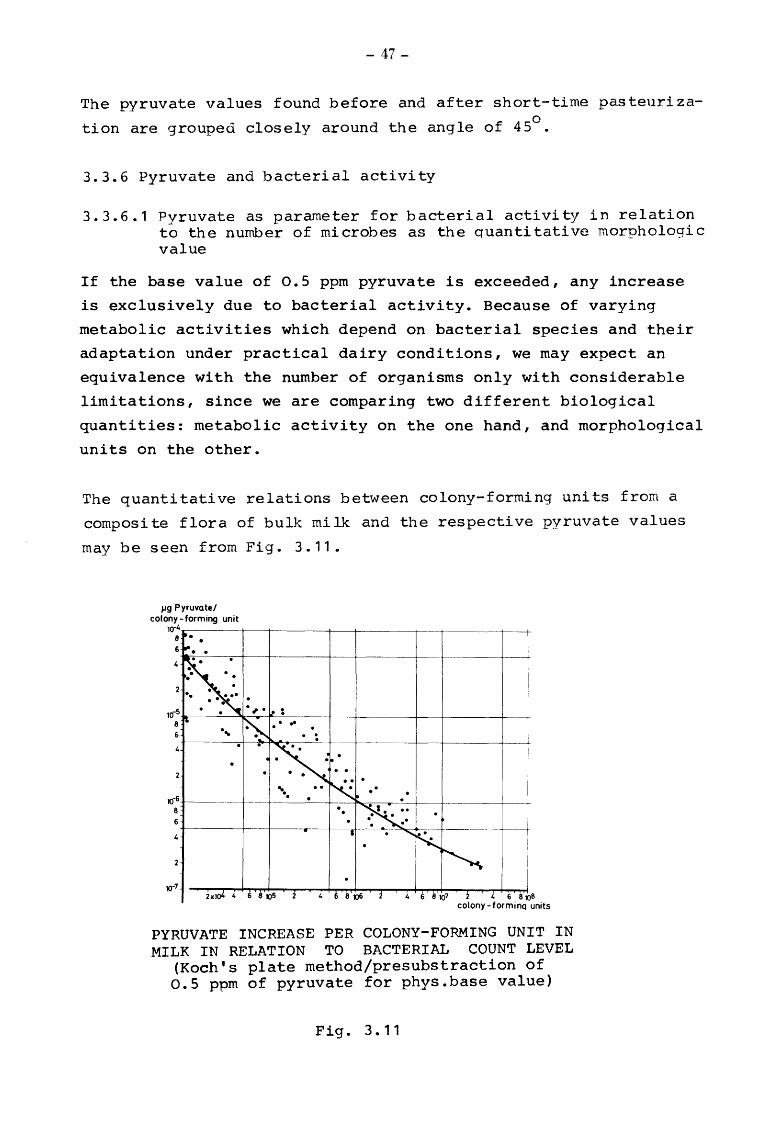
The quantitative relations between colony-forming units from a
composite flora of bulk milk and the respective pyruvate values
may be seen from Fig. 3.11.
IJQ Pyruvate/ colony- forming unit
1()""4-.::::------+--+-----~----+----+---- +--------+--+ 8 •
I
----~~;-~----~~------+--~-----+--+
10-6+------8
PYRUVATE INCREASE PER COLONY-FORMING UNIT IN MILK IN RELATION TO BACTERIAL COUNT LEVEL
(Koch's plate rnethod/presubstraction of o.s ppm of pyruvate for phys.base value)
Fig. 3.11
-~-
In the interpretation of the pyruvate and bacterial count equiva
lent it should be realised that the values obtained from single
determinations with the KOCH plate method may considerably differ
from the true values, as reported by several authors. Even multiple
determinations from one dilution series may give values which differ
from the mean value by two- to threefold. Consequently, the pyruvate
value equivalent to a colony-forming unit must vary; the pyruvate
value itself may be recorded with an accuracy of 0.1 ppm.
As may be seen from Fig. 3.11, 100 000 colony-forming units produce
pyruvate in amounts varying between 3 x 10- 6 to 1.5 x 10-S per -6 unit with a mean of 5 x 10 1ug, i.e. 0.1 ppm pyruvate is equi-
valent to 20 000 colony-forming units + 65 % within this range.
1 million colonies produce an amount of pyruvate varying between 5 x 10⁻⁷ and 2.5 x 10⁻⁶ per unit with a mean of 1 x 1o-6
1ug, or
0.1 ppm pyruvate is equivalent to approx. 100 000 colony-forming
units + 65 % within this range.
These results show the desired differentiation to be more
pronounced in the lower than in the higher range.
Corresponding conditions were found in individual direct bacterial
counts after BREED, where the quantitative response of a single-cell
is lower by one power of ten than that of a colony.
A number between 50 ooo - 100 000 colony-forming units/ml of
milk may actually be considered the lowest limit of sensitivity
of the method at which bacterial activity makes the pyruvate
content increase and exceed the base value of 0.5 ppm.
3.3.6.2 Time series investigations for the measurement of catabolic activity in pure cultures
The assays are used for the determination of the direction and intensity of the bacterial catabolism of saproph:1tes in milk.
The isolated observation of pure cultures is of an experimental
character. However it is of fundamental importance for the
understanding of the processes operating in mixed cultures.
4' -
- 49-
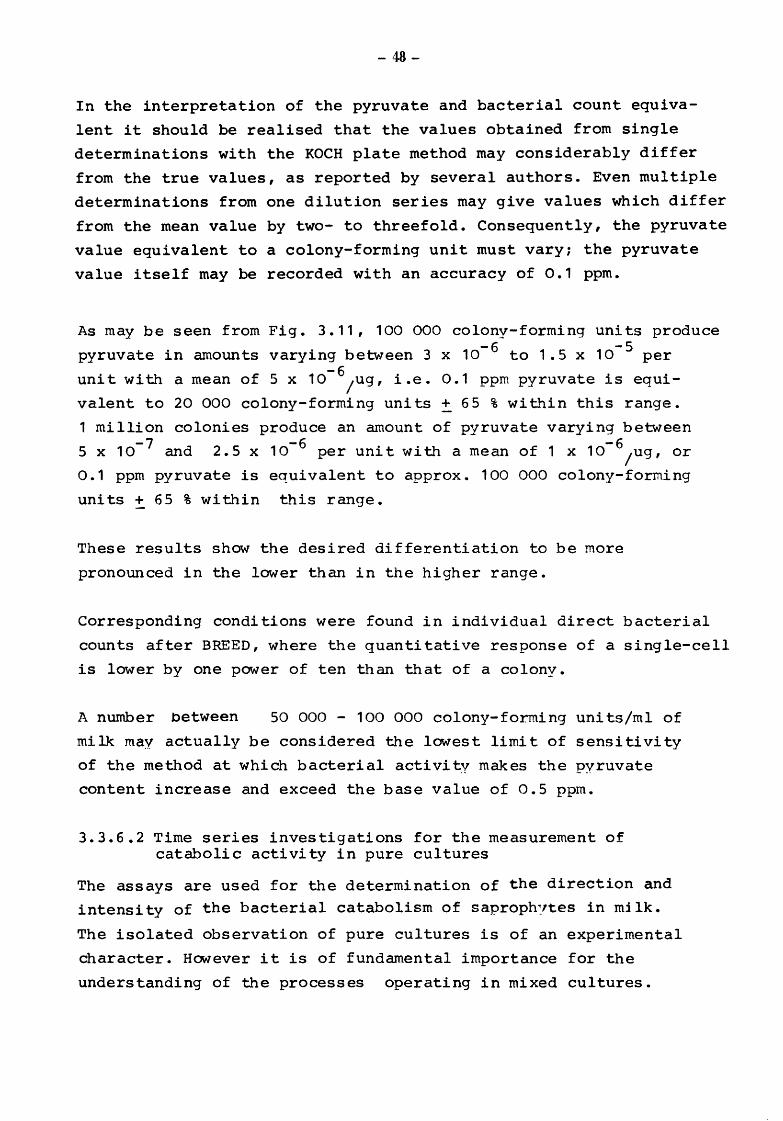
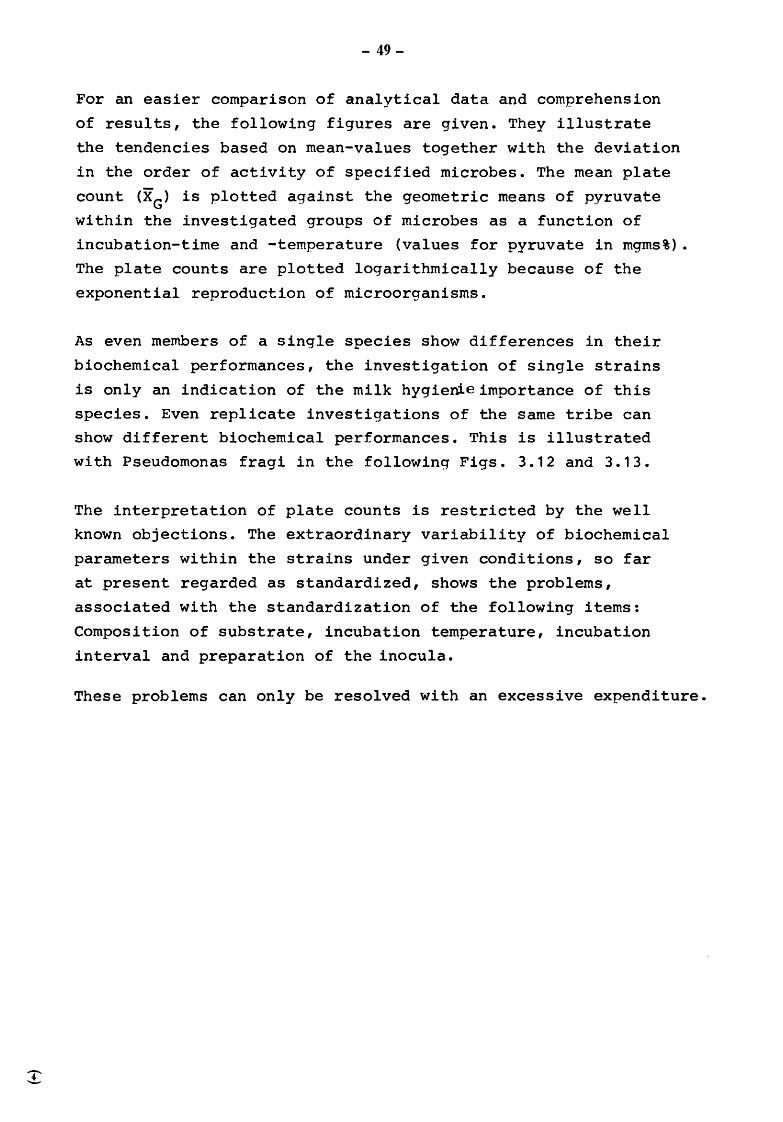
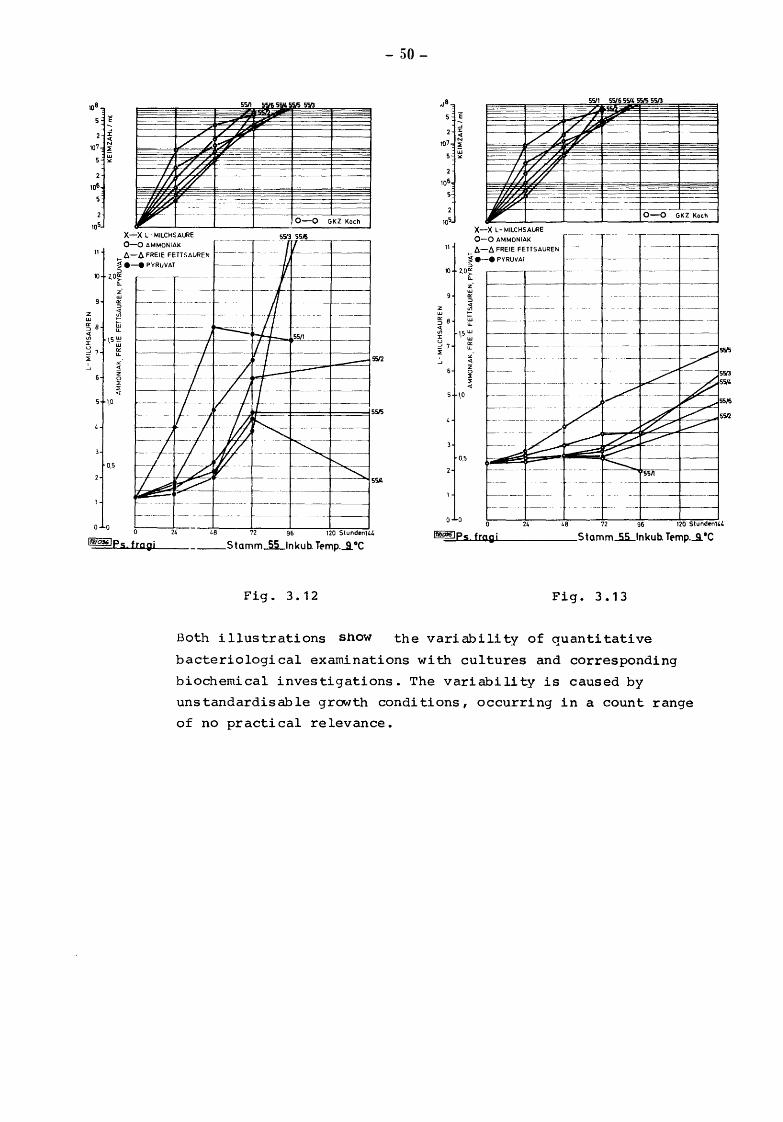
For an easier comparison of analytical data and comprehension
of results, the following figures are given. They illustrate
the tendencies based on mean-values together with the deviation
in the order of activity of specified microbes. The mean plate
count (XG) is plotted against the geometric means of pyruvate
within the investigated groups of microbes as a function of
incubation-time and -temperature (values for pyruvate in mgms%).
The plate counts are plotted logarithmically because of the
exponential reproduction of microorganisms.
As even members of a single species show differences in their
biochemical performances, the investigation of single strains
is only an indication of the milk hygienleimportance of this
species. Even replicate investigations of the same tribe can
show different biochemical performances. This is illustrated
with Pseudomonas fragi in the following Figs. 3.12 and 3.13.
The interpretation of plate counts is restricted by the well
known objections. The extraordinary variability of biochemical
parameters within the strains under given conditions, so far
at present regarded as standardized, shows the problems,
associated with the standardization of the following items:
Composition of substrate, incubation temperature, incubation
interval and preparation of the inocula.
These problems can only be resolved with an excessive expenditure.
5511 5516 551.1. ~ 515 S!n
~----F --~:-
f--- I ////
//IV#
rp:~~=---_ --------~~--- +o-o
11
X--X L-MILCHSAURE
0-0 AMMONIAK
f:,.-6, FREIE FETTSAUREN
~ e-e PYRUVAT ::>
10 2,0~ Q..
~; a: ::>
~ UJ lL
15 ~ 'w
5 1,0
0,5
e: ~-
z 0 :l': ::;: <(
GKZ Koch
5512
0 0 24 1.8 72 96 120 Stunden144
IY2::;;;10=36=a..l P...,.s'-Ljt r ... a41gf.Li ______ s tam m _55_ Ink u b. Tf'mp . ....S. •c
Fig. 3. 12
Both illustrations show
-50-
11
5!>'1 5516 5514 5SIS 5513 =
1-------+----/~~~~
I '/ /// 1---y+--r JI.R[h.?-/ff~~- ------ f---------+----+----1
--~ -1---- ---~-h-,'"'~-+------ ------ -f--------·--1-0---0--'G'-KZ-Ko-ch----l
X-X L-MILCHSAURE
0-0 AMMONIAK
6,-6, FREIE FETTSAUREN
~ ·-· PYRUVAT ::> 10 2.0~ ~----.--------- --
Q..
0,5
0 0 0
~Ps tragi 48 72 96 120 Stund•n144
Stamm_S.S .. .Jnkub. Tf'mp . ...A •c
Fig. 3.13
the variability of quantitative
bacteriological examinations with cultures and corresponding
biochemical investigations. The variability is caused by
unstandardisable growth conditions, occurring in a count range
of no practical relevance.
-51-
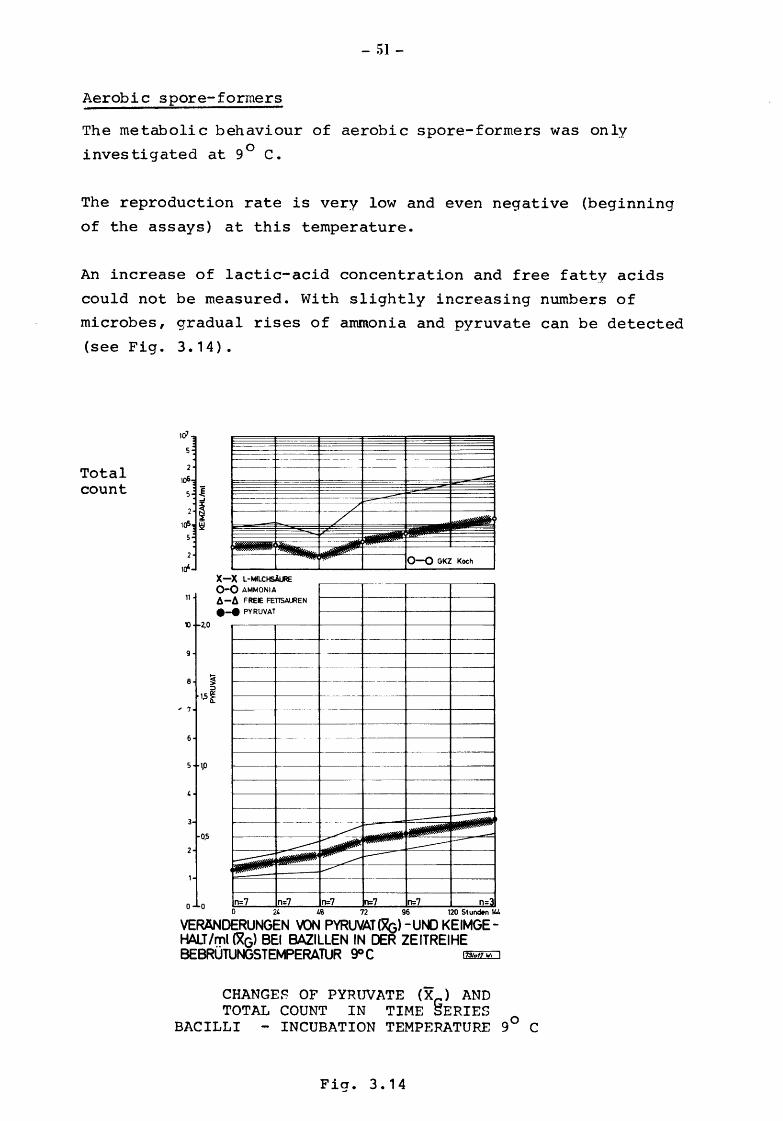
Aerobic spore-formers
The metabolic behaviour of aerobic spore-formers was only
investigated at 9° c.
The reproduction rate is very low and even negative (beginning
of the assays) at this temperature.
An increase of lactic-acid concentration and free fatty acids
could not be measured. With slightly increasing numbers of
microbes, gradual rises of ammonia and pyruvate can be detected
(see Fig. 3. 1 4) •
Total count
leY
2
lrf
11
10 2,0
8 ~ :::>
1,5~
~-~-- ··-
·-..,,.Jilliii!Pl"'
X-X L-MILC~ Q-Q AMMONIA
'"'''l"'r'!T''
fl-fl FREIE FETl'SAI.REN .... PYRUVAT
-~.
I 0-0 GKZ Koch
1-----+--·---- ------- ---1----+-----t
---------- ------+----+------!
~---+-----i~-----· ··-- --- ···---~----1-------i
, 7 -- -------+--+------+---1
~-- -- ----~--1----+-----t
5 1,0
0,5
~- ~ -+--~--~
0 0 n=7 n=7 n=7 n=7 n=7 n=3 0 24 48 72 96 120 Stu~n 144
VERANDERUNGEN VON PYRUVAT (%) - UNJ KEIMGEHALT /FJll lXG) BEl BAZILLEN IN DER ZEITREIHE BEBRUTUNGSTEMPERATUR goc ~
CHANGE~ OF PYRUVATE (XG) AND TOTAL COUNT IN TIME SERIES
BACILLI - INCUBATION TEMPERATURE 9° C
Fig. 3. 14

-52-
Enterococci
Species of enterococci show the poorest metabolic activity of all groups under study.
They are characterized by a glycolytic metabolic pattern at
9° c. The lactic acid concentration increases moderately after
a 72-hours-incubation at 6° c. Lipolytic activities could not be
aetected. Deaminating enzymes have little activity, especially at 6° c. The pyruvate concentration follows the gradual increase of plate counts only slowly (see fig. 3.15 and 3.16).
Apart from their ability to form lactic acid, the enterococci contribute only relatively insignificantly to the metabolic
processes in the substrate milk under psychrotrophic conditions.
X-X L- MILCHSAURE
0-0 AMMONIAK
2
1rP
f
./ -"
-.. x-x ~..CHSA~.R L-M AMMONIAK
J I
....-v ~
..... Q-OGI<Z~ ..-1-----i
fl-fl FREIE FETTSAUREN
~ ·-· PYRUVAT
o-o 11 6.-fl FREIE FET'TSAI.REN .... PYRUVAT
'C 2,0~
z UJ
~
~ 1,5~
lf
5 1,0
0,5
0 0
,,: 4: z ~ :l: 4:
0 24 k8 72 96 120 Stund•n144
VEFWIERLt«;EN \ON PYRlN\1'(%) -LN) KEIMGEHALT/ml (%)BEl ENTERQt()KKEN IN [ER ZEITREIHE BE8ROTUNGSTEMPERATl.R goc ~
CHANGES OF PYRUVATE (XG) AND TOTAL COUNT IN TIME SERIES
ENTEROCOCCI-INCUBATION TEMPERATURE 9°C
Fig. 3.15
., 2,0
I I
I I
I 5 1,0
v I
I l
j ..... 1 .-111111111""
I ... II"" f-.-- - . ...,
~ n=ft n=11 ln=11 n=n n-5 n=S
120 Stundln 0 0 0 24 ,, 72 96 "'
VERANOERUr«;EN \QN PYRlJ\ATC%)- UNO KEIMGEHALT /ml(Xc;> BEl ENTEROKOKKEN IN DER ZEITREIHE BEBRUTUNGSTEMPERATUR 6°C I2&U4J
CHANGES OF PYRUVATE (XG) AND TOTAL COUNT IN TIME SERIES
ENTEROCOCCI-INCUBATION TEMPERATURE 6°C
Fig. 3.16
10 2,0
5 1,0
0,5
0 0
-53-
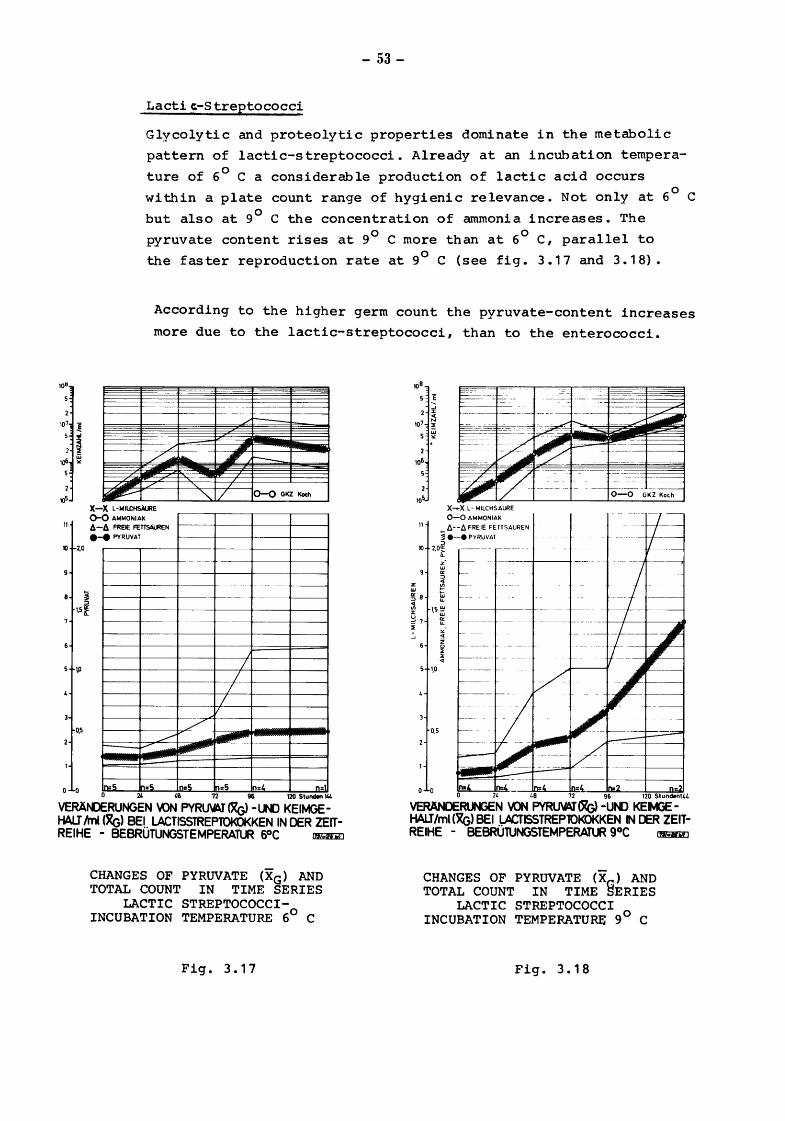
Lacti ct-S treptococci
Glycolytic and proteolytic properties dominate in the metabolic
pattern of lactic-streptococci. Already at an incubation tempera
ture of 6° C a considerable production of lactic acid occurs
within a plate count range of hygienic relevance. Not only at 6° C
but also at 9° C the concentration of ammonia increases. The
pyruvate content rises at 9° C more than at 6° C, parallel to
the faster reproduction rate at 9° C (see fig. 3.17 and 3.18).
According to the higher germ count the pyruvate-content increases
more due to the lactic-streptococci, than to the enterococci.
X-X L-htiLCHsAuRE 0 AMMONIAK o
Il-fl FREIE FETTSALREN
·-- PYRUVAT
- ---
----r--
--~r---
I I
I I
v 7
........... 1-- - 1-
ln:5 ln:5 ln:S n=S n=4 n= 24 '6 72 96 120 Stundln W.
VERANJERUNGEN \UN PYRU\AT lX(,) -l.N) KEIMGEHAU lrri (~) BE!. LACTISSTREPlOKOKKEN IN DER ZEITREIHE - BEBRUTUNGSTEMPERAfl.R SOC ~
CHANGES OF PYRUVATE (XG) AND TOTAL COUNT IN TIME SERIES
LACTIC STREPTOCOCCIINCUBATION TEMPERATURE 6° C
Fig. 3.17
CHANGES OF PYRUVATE (Xc) AND TOTAL COUNT IN TIME SERIES
LACTIC STREPTOCOCCI INCUBATION TEMPERATURE 9° C
Fig. 3. 18
;o&
11
10 2,0
-54-
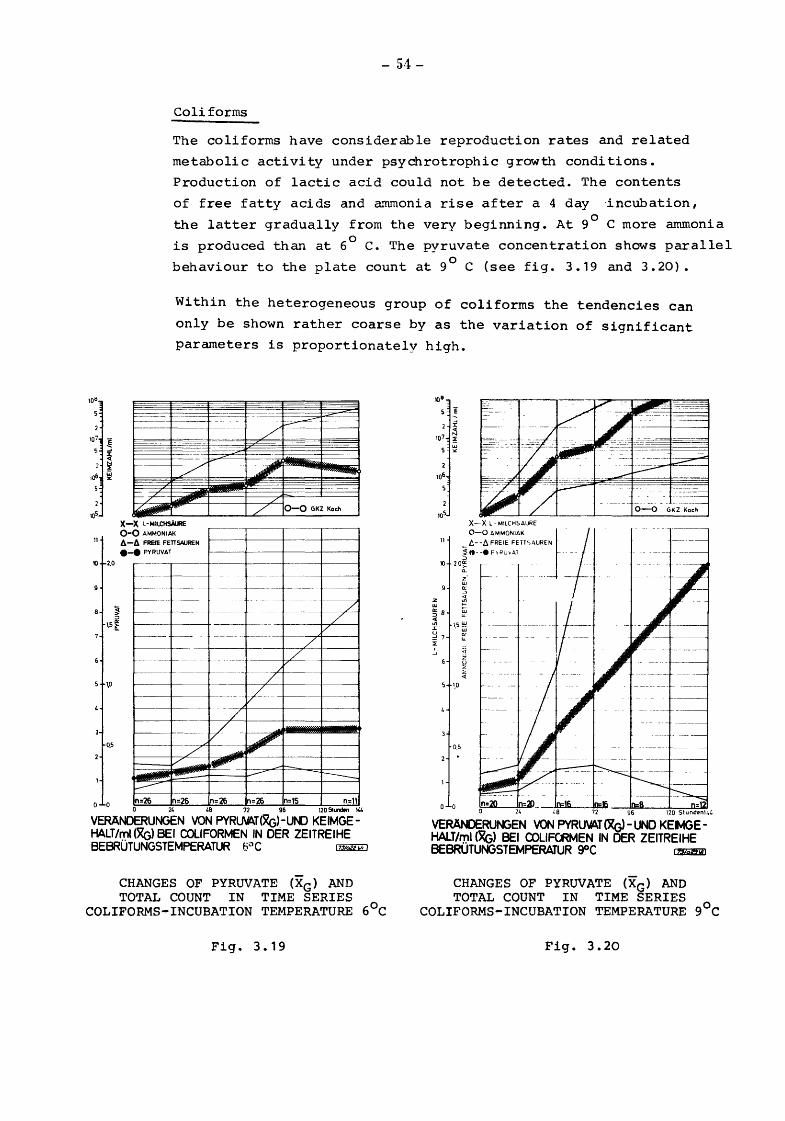
Coli forms
The coliforms have considerable reproduction rates and related
metabolic activity under psychrotrophic growth conditions.
Production of lactic acid could not be detected. The contents
of free fatty acids and ammonia rise after a 4 day ·incubation,
the latter gradua.lly from the very beginning. At 9° C more ammonia
is produced than at 6° c. The pyruvate concentration shows parallel
behaviour to the plate count at 9° C (see fig. 3.19 and 3.20).
Within the heterogeneous group of coliforms the tendencies can
only be shown rather coarse by as the variation of significant
parameters is proportionately high.
F~--------+------: ~~-~~- /~------------t-___,
~~~~-~--~-f--~---~--+---- -
~~-:;T- .uiiil'
x-x HoiiLCHSA~.Jte Q-0 AMMONIAK
A-A FREIE FETTSAUREN .... PYRUVAT
--~-
/
_/ 0-Q GKZ Koch
r------,----,-----.-------,
~---~----4----4----4---~----~
c--~-----+----4 - f- ---- --- ~---------11----~
f------ ---+---r-- r------
f------- ---
~ ~--r---- --------- f- ---- //
1,5~ ~----t-----+ ------~-------- --+-----+-v7"------t r------ 1---
/ /
/ 5 \0 r---~----+------ ~--- -+----1------1
/
-/ 0,5
n=26 n=26 n=26 n=26 n=15 n=11 0 24 48 72 96 120 Stundln 11.1.
0 0
VERANDERUNGEN VON PYRL.I\AT(%)-U~ KEIMGEHALT/r:t:"l (X(;) BEl COLIFORMEN IN OER ZEITREIHE BEBRUTUNGSTEMPERATUR 6~'C ~
CHANGES OF PYRUVATE (XG) AND TOTAL COUNT IN TIME SERIES
COLIFORMS-INCUBATION TEMPERATURE 6°C
Fig. 3. 19
VERANDERU~EN VON PYRU\AT (Xc;)- U'D KEMGEHALT/ry:ll ('~) BEl COUFORMEN IN DER ZEITREIHE BEBRUTUNGSTEMPERATUR goc ~
CHANGES OF PYRUVATE (XG) AND TOTAL COUNT IN TIME SERIES
COLIFORMS-INCUBATION TEMPERATURE 9°C
Fig. 3.20
11
10 '-0
5 1,0
0 0
-55-
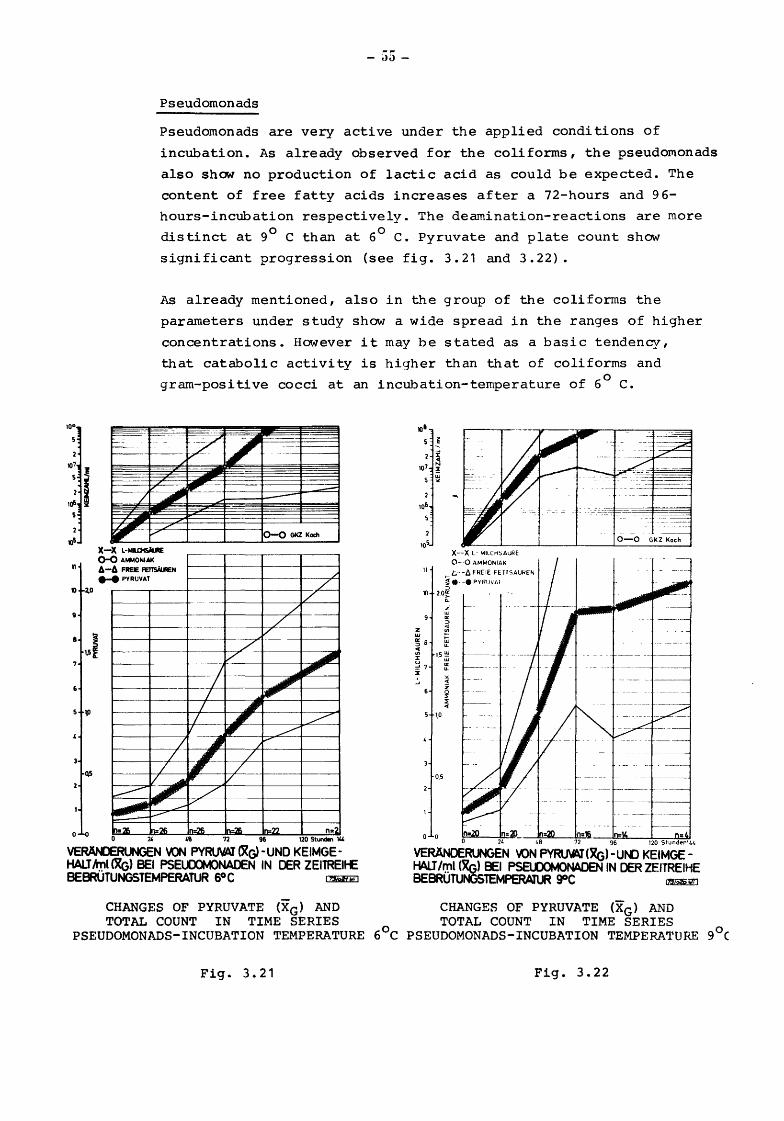
Pseudomonads
Pseudomonads are very active under the applied conditions of
incubation. As already observed for the coliforms, the pseudomonads
also show no production of lactic acid as could be expected. The
content of free fatty acids increases after a 72-hours and 96-
hours-incubation respectively. The dearnination-reactions are more 0 0 distinct at 9 C than at 6 C. Pyruvate and plate count show
significant progression (see fig. 3.21 and 3.22}.
As already mentioned, also in the group of the coliforms the
parameters under study show a wide spread in the ranges of higher
concentrations. However it may be stated as a basic tendency,
that catabolic activity is higher than that of coliforms and
gram-positive cocci at an incubation-temperature of 6 ° C.
~.·.Fe .. · .· ~ ,~ __ .._.__-!
r r x-x L·lot~LCHSA~.J~E
AMMONIAK 6 FREE FETTSoiUIEN
o-o 6-.... PYRUVAT
/ /
/
- ---
----
~-
I '- I
I I
I v ..
I II
/ .... ,... ~ ~ / ..... r....-v ,...,.-: ·---ln:26 1'1:26 ln:26
0-Q GKZ Koch
/
L v / -
/ --/ --
/ v ~ ,. _ _.,.
.>Ill~ .I
I ~ , ~ L~
/ /
v
ln::26 ln::22 n=2 0 24 "~ 72 96 120 Stundln 144
10 X-XL- MILCHSAuRE
0--0 AMMONIAK
t.·- -f). FREIE FE TTSAUI<EN
~ ·- -· PYR\JVAI ::> 10 2.0~
~-::>
§ 15!:! I~
5 1,0
0,5
" <(
z ~ :l: <(
o o n- = L8 96 120 StundPr144
VERANJERUNGEN ~ PYRlNAT {Xc;)-UNO KEIMGEHALT fr:Y:lllX{;) BEl PSEl.()(M)NA[)EN IN DER ZEITREit-E BEBRUTUNGSTEMPERATUR SOC ~
VERANDERUNGEN \ON PYRU\AT(XG) -Uf'.D KEIMGEHALT lr:!ll (~) BEl PSBDOMONADEN IN DER ZEITREIHE BEBRUTUNGsTEMPERATUR goc ~
CHANGES OF PYRUVATE (XG) AND CHANGES OF PYRUVATE (XG) AND TOTAL COUNT IN TIME SERIES TOTAL COUNT IN TIME SERIES
PSEUDOMONADS-INCUBATION TEMPERATURE 6°C PSEUDOMONADS-INCUBATION TEMPERATURE 9°(
Fig. 3.21 Fig. 3.22
-56-
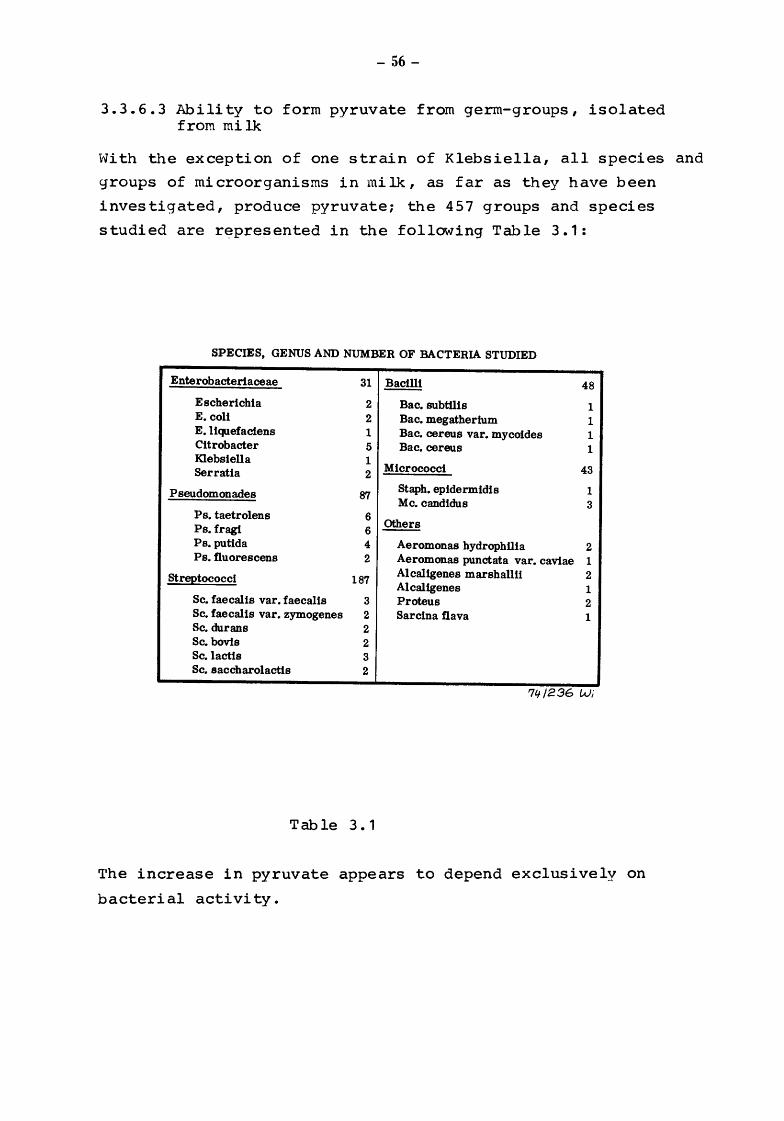
3.3.6.3 Ability to form pyruvate from germ-groups, isolated from milk
With the exception of one strain of Klebsiella, all species and
groups of microorganisms in milk, as far as they have been
investigated, produce pyruvate; the 457 groups and species
studied are r~presented in the following Table 3.1:
SPECIES, GENUS AND NUMBER OF BACTERIA STUDIED
Enterobacteriaceae 31 Bacilli 48
Escherichia 2 Bac. subtilis 1 E. coli 2 Bac. megatherium 1 E. liquefaclens 1 Bac. cereus var. mycoides 1 Citrobacter 5 Bac. cereus 1 Klebsiella 1 Serratia 2
Micrococci 43
Pseudomonades 87 Staph. epidermidis 1 Me. candidus 3
Ps. taetrolens 6 Ps. fragi 6 ~ Ps. putida 4 Aeromonas hydrophllia 2 Ps. fluorescens 2 Aeromonas punctata var. cavlae 1
Streptococci 187 Alcaligenes marshallU 2 Alcaligenes 1
Sc. faecal is var. faecalis 3 Proteus 2 Sc. faecalis var. zymogenes 2 Sarcina flava 1 Sc.durans 2 Sc. bovls 2 Sc.lactis 3 Sc. saccharolactis 2
'7/f/236 Wi
Table 3.1
The increase in pyruvate appears to depend exclusively on
bacterial activity.

-57-
Number of microorganisms
Fig. 3.23 shows the results obtained from plate counts in raw milk
free from microorganisms; each of these samples was inoculated
with Pseudomonads, coliforms, enterococci and lactic strepto
cocci and incubated at 6° c. The respective pyruvate values are also given.
/ Coliform•
/ .-""'1Lactic -· streptococc
~ .- _, . ..,. Enterococci
/ .......... ~' ~·· .......
.. ~·' , -~-·· ~ ;;--
PwudomoiiCidls
L L
/ ./
~
/ /
Coli farms / ~
/ ~----- _lnterococci
/ _,-~--·- "'"---L.Oc"ik strepto
I/ , ~ ............ L cocci
~. ~,.-- .... .,........ .... ./ ·-· -··- ·-··-
COMPARISON OF PYRUVATE AND BACTERIAL GROWTH OF Pseudomonades (-) Collforms (---)
Lactic streptococci (-·-) and Enterococci (-··-) ~ Incubation temperature 6°C
Fig. 3. 23
Those groups of microorganisms which are highest in number at
this temperature also produce the highest amount of pyruvate.
Number of organisms and pyruvate are in correlate well
these conditions. under
-58-
3.4 Results of assays under field conditions
The Institute for Hygiene has made an investigation in 9 milk
collection areas between Kiel and Munich, in order to determine
the bacteriological quality of milk at all stages - farm bulk
milk, in the road tanker, in the dairy's balance tank before
pasteurization, in the bulk tank after pasteurization, in
despatch and in retail containers. A total of 5682 samples was
examined by means of the enzymatic pyruvate determination and
4388 samples by means of the KOCH plate method with the inter
national standard reference medium as well as plate counting in
a computer image anaylzer. In two districts it was impossible to
determine the bacterial number to be attributed to the respective
pyruvate value: the outside temperature was too high and the
transport distance too long to guarantee sufficient preservation
by means of orthoboric acid - potassium sorbate. Therefore, Fig.
3.24 compares bacterial counts and pyruvate values of only 7
collection areas. One of the two remaining areas is represented
in Fig. 3.29 in order to give evidence of systemic pyruvate
accumulation, where the same milk is followed up directly from
production to retail trade in packages. The other remaining area
exhibits the lowest pyruvate values and is compared in Fig. 3.28
to that with the highest pyruvate pools.
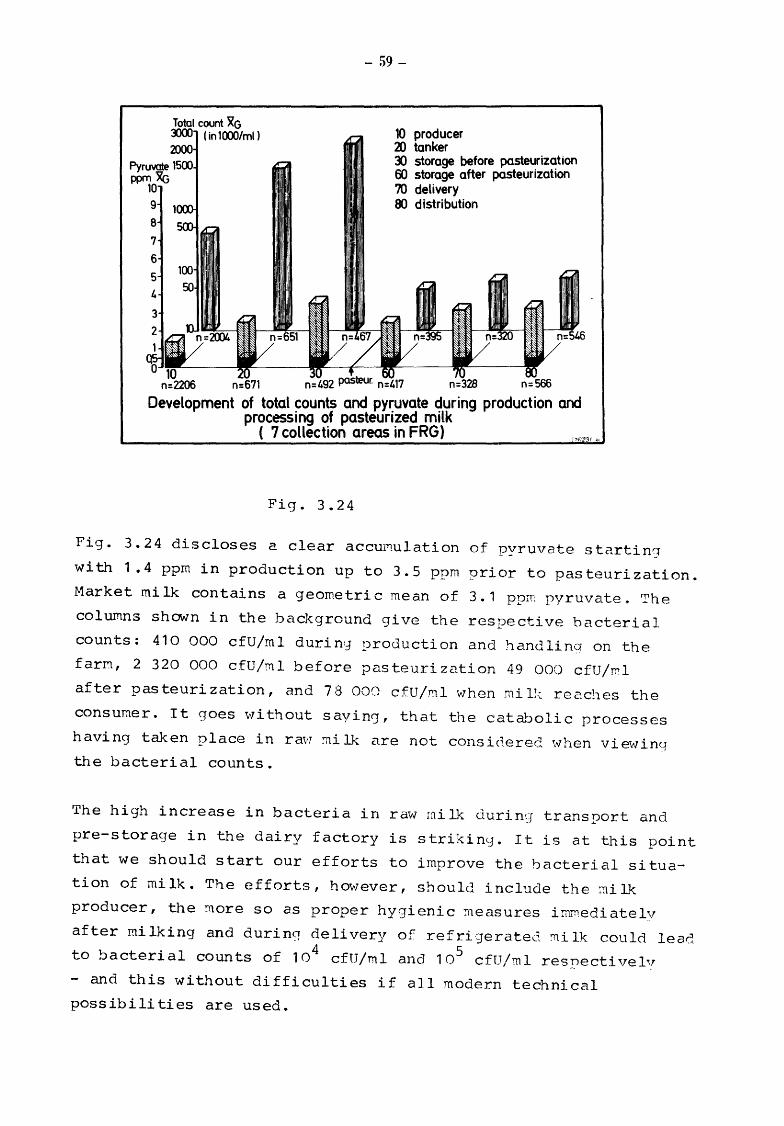
Fig. 3.24 gives the results obtained from the entire sample material
originating from 7 collection areas in 6 Federal Lander, divided
into the different stages between production and consumption.
Pyruvate values and bacterial counts were obtained from a cross
section through the various stages; however, it should be con
sidered that milk samples between the stages may not necessarily
be identical. This also explains the slight decrease of pyruvate
values after pasteurization. This decrease is not due to any
adverse effect of heat-treatment (see Fig. 3.10), but to the direct
introduction of freshly supplied raw milk into the pasteurizer
without being pre-stored in the dairy factory.
-59-
10 producer aJ tanker 30 storage before pasteurization 60 storage after pasteurization 70 delivery 80 distribution
n=2206 n=671 n=492 n=566
Development of total counts and py~uvate ~uring production and processing of pasteunzed m1lk
( 7 collection areas in FRG)
Fig. 3.24
Fig. 3.24 discloses a clear accu~ulation of pyruvate starting
with 1.4 ppm in production up to 3.5 ppm prior to pasteurization.
Market milk contains a geometric mean of 3.1 ppm pyruvate. The
columns shown in the background give the respective bacterial
counts: 410 000 cfU/ml duriny production and handling on the
farM, 2 320 000 cfU/ml before pasteurization 49 000 cfU/~1
after pasteurization, and 7 8 000 cfU/ml when mi 11-: rec.ches the
consumer. It goes v'lithout sayin(], that the catabolic processes
having taken place in ra'I;:J :ni lk are not considereC. vvhen vievlin<_:r
the bacterial counts.
The high increase in bacteria in raw milk durin~J transport and
pre-storage in the dairy factory is strikin0. It is at this point
that we should start our efforts to improve the bacterial situa
tion of milk. The efforts, however, should include the :ni lk
producer, the :uore so as proper hygienic measures imrn.ediatelv
after mi !king and during deli very of refri·gerated !ni lk could lead
to bacterial counts of 104
cfU/ml and 105 cfU/ml res}'_")ectivelv
- and this without difficulties if all modern technical
possibilities are used.
- 60-
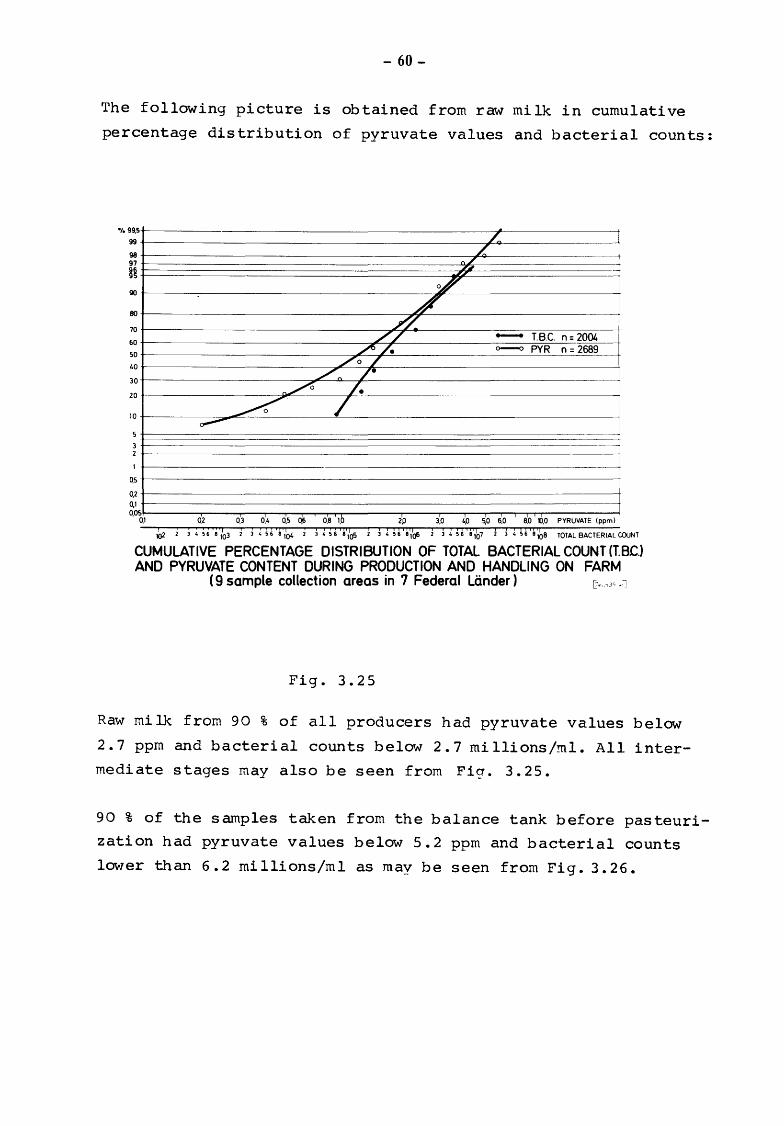
The following picture is obtained from raw milk in cumulative
percentage distribution of pyruvate values and bacterial counts:
"lo 99,5
99
98 97
g~
90
80
70
60
50
40
30
20
10
QS
0,2 0,1
~ ~-
~
-z L
n/ 161
Jl
o/ /
~~-
//. 77 - T. B.C. n = 2001. __
_/6 /. o--o PYR n = 2689 /o /
7,. 7• 7.
/
--
1 2 3 04 OS Q6 08 i1l 2 0,~ Q 0, p 30 40 50 6.0 8.0 ll.O PYRUVATE (ppm)
~ 3 4 56 e 163 i j ~ ~~ e 11ot. 2 :\l56'~'16s i :\l H'f,\:,s .) :\l H'•'161 .) j l ~n;b8 TOTALBACTERIALCOUNT
CUMULATIVE PERCENTAGE DISTRIBUTION OF TOTAL BACTERIAL COUNT (T.BC.) AND PYRUVATE CONTENT DURING PRODUCTION AND HANDLING ON FARM
( 9 sample collection areas in 7 Federal Lander) C"···"J" .J
Fig. 3.25
Raw milk from 90 % of all producers had pyruvate values below
2.7 ppm and bacterial counts below 2.7 millions/ml. All inter
mediate stages may also be seen from Fig. 3. 25.
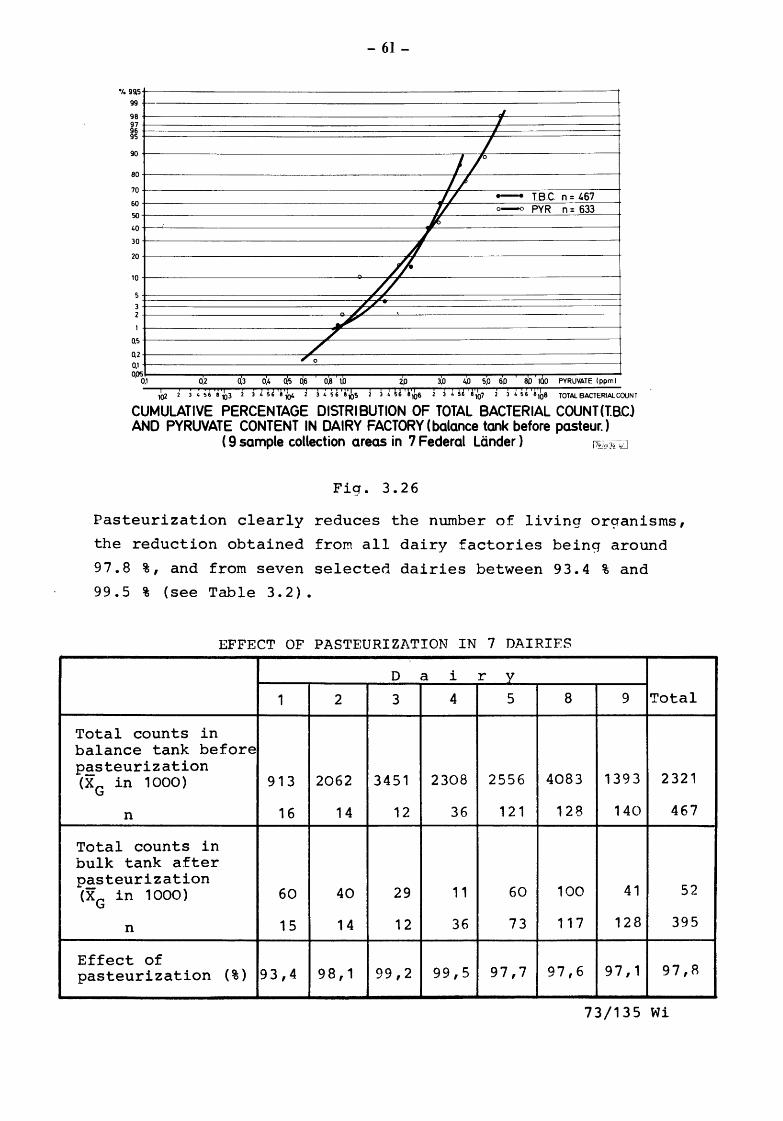
90 % of the samples taken from the balance tank before pasteuri
zation had pyruvate values below 5.2 ppm and bacterial counts
lower than 6. 2 mi llions/ml as may be seen from Fig. 3. 26.
%99,5
99
98 97 96 95
90
80
70
60
50
40
30
20
10
Q!i
0,2
0,1
- 61-
J I
I
I I 1° l/
.1/ - T.B.C. n = 467 1/ o-o PYR n = 633
.# I
§
n /r //
II
~ .// ~
/ /
'o 0'~.1 0,2 0,3 0,4 QS 0,6 0,8 tO ZP 3,0 4!J 5,0 6.0 8.0 lQO PYRUVATE I ppm l
1~ i 3 4 si ~~3 ~ :l 2 HT,~ ~ ! 4 H'~'~s J ~ l U'''~6 J j L wA,67 ~ ~ lH'~,b8 TOTALBACTERIALCOUNT
CUMULATIVE PERCENTAGE DISTRIBUTION OF TOTAL BACTERIAL COUNT (T.BCJ AND PYRUVATE CONTENT IN DAIRY FACTORY (balance tank before pasteur.)
( 9 sample collection areas in 7 Federal Uinder ) !7'-.io:J't iZJ
Fig. 3.26
Pasteurization clearly reduces the number of living or~anisms,
the reduction obtained from all dairy factories being around
97.8 %, and from seven selected dairies between 93.4 % and
99.5 % (see Table 3.2).
EFFECT OF PASTEURIZATION IN 7 DAIRIES
D a i r y
1 2 3 4 5 8 9 Total
Total counts in balance tank before pasteurization (XG in 1000) 913 2062 3451 2308 2556 4083 1393 2321
n 16 14 12 36 121 128 140 467
Total counts in bulk tank after pasteurization (XG in 1000) 60 40 29 11 60 100 41 52
n 15 14 12 36 73 117 128 395
Effect of pasteurization (%) 93,4 98, 1 99,2 99,5 97,7 97,6 97' 1 97,R
73/135 Wi
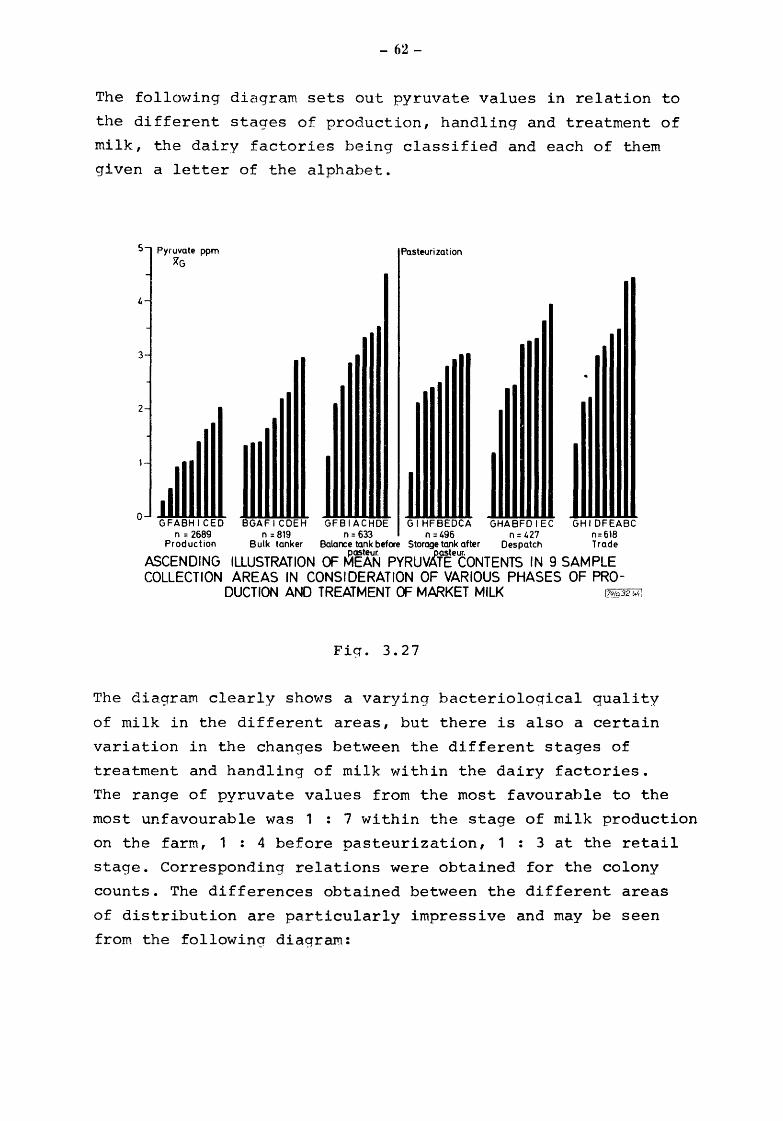
- 62-
The following diagram sets out pyruvate values in relation to
the different stages of production, handling and treatment of
milk, the dairy factories being classified and each of them
given a letter of the alphabet.
5 Pyruvate ppm Pasteurization
4
3
2
0
XG
BGAF I CDEH GFBI ACHDE G I HFBEDCA GHABFD I EC GH I DFEABC n=2689 n=819 n=633 n=496 n=427 n=618
Production Bulk tanker Balance tank before Storage tank after Despatch Trade
ASCENDING ILLUSTRATION OF MEAuN PYRUVA~eCONTENTS IN 9 SAMPLE COLLECTION AREAS IN CONS I DERATION OF VARIOUS PHASES OF PRO-
DUCTION AND TREATMENT OF MARKET MILK I7Qio32wt!
Fiq. 3.27
The diagram clearly shows a varying bacterioloqical quality
of milk in the different areas, but there is also a certain
variation in the changes between the different stages of
treatment and handling of milk within the dairy factories.
The range of pyruvate values from the most favourable to the
most unfavourable was 1 : 7 within the stage of milk production
on the farm, 1 : 4 before pasteurization, 1 : 3 at the retail
stage. Corresponding relations were obtained for the colony
counts. The differences obtained between the different areas
of distribution are particularly impressive and may be seen
from the following diagram:

- 63-
3
6 4
7
10 Production
20 Bulk tanker
3J Balance tank before pasteur. . - Dairy 60 Storage tank after pasteur r factory
70 Despatch
80 Trade
',:I I I I ,. ii# .,., I ~i,. 1/Cll /• .,, t
10 . 20 30 ( '0 70 I
n = 257 n = 61 n = 55 pasteur. n = 55 n = 64 00 type of milk
n = 28
DEVELOPMENT OF PYRUVATE CONTENT DURING PRODUCTION AND TREATOF MARKET MILK
(SAMPLE COLLECTION AREAS 7 AND 3)
Fig. 3.28
The milk available from one collection area was followed up
directly over all stages from production to pasteurization,
i.e. without the intervening admixture of freshly supplied raw
milk at the pasteurizer.
Pyr~~-~G () Production
20 Bulk tanker
} 10 ~ Balance tank before pasteur. Oo1ry
60 Storage tank after pasteur. factory
70 Despatch
80 Trade
...... 1 70
n = 16
DEVELOPMENT OF PYRUVATE CONTENT DURING PRODUCTION AND TREATMENT OF MARKET MILK
DIRECT FOLLOW-UP OF A BATCH OF MILK IN SAMPLE COLLECTION AREA No.6 7 o27 ·
Fig. 3.29

- 64-
The results obtained from pyruvate determination confirm the
experience gained during the previous enquiry: the efforts made
to reduce saprophytic contamination of milk are of varying
efficiency in the individual areas of distribution.
As far as milk production is concerned this appears to be due to
the fact that the common system for grading and payment of milk
does not encourage the farmer to reduce the bacterial count of
areas appears to be due to some isolated initiative of individual
dairy factories or advisory services. Approximately 10 % of the
milk producers contribute, to an unreasonably great extent, to an
impairment of the bacteriological quality of milk which may be
seen from the following 2 Tables where the pyruvate contents as
well as total bacterial counts are given.
CHARACTERISTICS OF CUMULATIVE PERCENTAGE DISTRIBtrl'ION OF PYRUVATE CONCENTRATIONS (ppm) IN RAW MILK ( DEUVERED TO 9 DAIRIES)
cun:Watlve jpercentage 1 2 3 4 5 6 7 8 9
10 0,5 0, 5 1,1 1,3 1,2 0,2 0,2 0,3 0,7
20 0,5 0,5 1,1 1,5 1,4 0,3 0,2 0,7 1,1
30 0,6 1,1 1,4 t',8 1,5 0,4 0,2 0,9 1,2
40 1,1 1,1 1,6 2,0 1,7 0,5 0,2 1,2 1,4
50 1,1 1,1 1,6 2,1 1,8 0,6 0,3 1,4 1,6
60 1,1 1,1 1,9 2,3 2,1 0,7 0,3 1,6 1,7
70 1,4 1,6 2,1 2,6 2,2 0,9 0,4 1,8 1,9
80 1,6 2,1 2,4 3,1 2,4 1,2 0,6 2,1 2,2
90 1,9 2,6 3,1 3,6 2,7 1,5 0, 8 2,8 2,6
99 5,5 8,5 7,5 5,8 >10,0 2,9 2,3 4,7 5,5
XG 0,9 1,0 1,6 2,0 1,8 0,6 0,3 1,1 1,4
Table 3. 3

- 65-
CHARACTERISTICS OF CUMULATIVE PERCENTAGE DISTRIBtmON OF TOTAL BACTERIAL COUNT ( in 1000 ) IN RAW MILK (DEUVERED TO 9 DAIRIES)
~tmllltive permntagE 1 2 3 4 5 6 7 8 9
10 62 62 62 124 62 -- -- 124 124
20 62 124 124 248 124 -- -- 248 124
30 124 124 248 310 124 -- -- 434 248
40 124 186 434 434 248 -- -- 620 310
50 186 310 620 744 372 -- -- 930 496
60 248 434 992 1.178 558 -- -- 1. 240 620
70 310 682 1.550 1. 612 806 -- -- 1,488 930
80 434 1.116 2.480 2.418 1.178 -- -- 1.984 1. 302
90 1. 054 2.046 6.200 3.906 2.046 -- -- 2.790 2.108
99 ~6. 200 >6. 200 >6. 200 >6. 200 >6. 200 -- -- >6.200 >6. 200
XG 162 277 551 630 288 731 402
Table 3. 4
Corresponding conditions also apply to the lactic acid content
which gives more exact results in insufficiently cooled or
uncooled milk than reduction tests. Table 3.5 shows that acidity
values may well be differentiated when only slight variations
occur.
LACTIC ACID CONTENT WITHIN THE VARIOUS REDUCTION (GRADES)
Reduction phase n XG s g
1 1837 33,6 1,46
2 165 59,3 1,79
3 43 106,5 2,08
70/040 Wi Table 3.5
As long as milk is insufficiently refrigerated, it should be
examined for acidity, particularly as its analytical determination
is based on the same principles as that for pyruvate determination
(see Fig. 3.5).
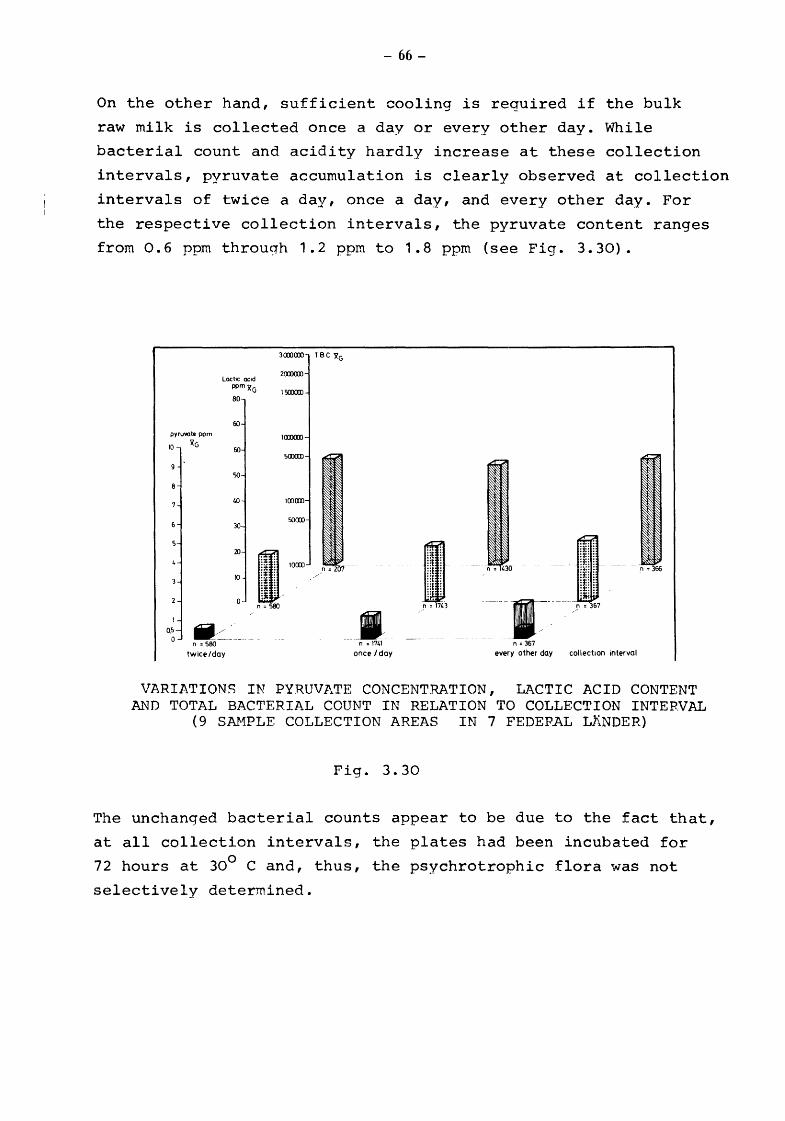
- 66-
On the other hand, sufficient cooling is required if the bulk
raw milk is collected once a day or every other day. While
bacterial count and acidity hardly increase at these collection
intervals, pyruvate accumulation is clearly observed at collection
intervals of twice a day, once a day, and every other day. For
the respective collection intervals, the pyruvate content ranges
from 0.6 ppm through 1.2 ppm to 1.8 ppm (see Fig. 3.30).
lactic acod ppmxG
80
60 pyruvate ppm
10
1
Q!i
0
~G 60
50
40
30
20
10
./ ___ _ n = 580
twice/day
3COO<XXJ TBC XG
2CXOOJ)
1 sooa:o
1CXOOll
so:xm
100COO
socm
I . n = 1743
·--•-n = 1741 n = 367 once /day every other day collectiOn interval
VARIATIONS IN PYRUVATE CONCENTRATION, LACTIC ACID CONTENT AND TOTAL BACTERIAL COUNT IN RELATION TO COLLECTION INTERVAL
(9 SAHPLE COLLECTION AREAS IN 7 FEDEPAL LANDER)
Fig. 3. 30
The unchanged bacterial counts appear to be due to the fact that,
at all collection intervals, the plates had been incubated for
72 hours at 30° C and, thus, the psychrotrophic flora was not
selectively determined.

- 67-
Seen generally the bacterial counts increase considerably in
the bulk road tanker and in the prestorage tank at the dairy
factory. An improvement in organizational and technical condi
tions is likely to reduce most effectively the microbial
contamination of milk in road tankers and prestora~e tanks.
The effect of pasteurization on the bacterial count indicates
that milk is heated rather similarly in the different dairy
factories, though one of them appears to operate at the upper,
and the other at the lower limit of the peritted time/tempera
ture conditions.
Literature
1. HEESCHEN, W.: Untersuchungen zur quantitativen Analyse und lebensmittelhygienischen Bedeutung bakterieller kataboler Reaktionen in Milch. Habilitationsschrift Freie Universitat Berlin 1972
2. HEESCHEN, W., TOLLE, A., ZEIDLER, H., FEICHMUTH, J.: Determination of Metabolites of Bacterial Activity in Milk. Technicon Intern. Congress 12.-14.6.1972, New York
3. TOLLE, A. , HEESCHEN, W. , V\"ERNERY, H. , REICHf'.iUTH, J. , SUHREN, G. : Die Pyruvatbestimmung - ein neuer Weg zur Messung der bakteriologischen Wertigkeit von Milch. Milchwissenschaft 27. (6) 343-352 (1972)
4. WERNERY, H.: Zur Beurteilung der bakteriologisch-hygienischen Wertiqkeit von Milch durch die quantitative Bestimmung von Pyruvat und die Computer-Bild-Analyse von Plattenkulturen. Inaug. Diss. Berlin (1972)
5. WERNERY,H., SUHREN,G., HEESCHEN, W., TOLLE, A., REICHMUTH, J.: Untersuchungen zur bakteriellen Belastung der Milch zwischen Gewinnung und Konsum in 9 Versorgungsgebieten der BRD. Dt. Molk.-Ztg. ~· 1222-1228 (1974)
6. SUHREN,G.: Zur Eignung der enzymatischen Pyruvatbestimmung fUr die Messung der bakteriellen Belastung von Milch. Inaug. Diss. Bonn (1973)
7. IDF (E Doc 33): Lipolyse in Milch (1974)
- 68-
4. The suitability of the pyruvate-pool for the estimation of the keeping quality of milk (TOLLE and HEESCHEN)
The problem of the interrelations between pyruvate content and the
keeping quality of milk is of direct practical interest. The un
certainties in this question involve the definition of freshness,
spoilage and keeping quality. These aspects, seen bacteriologically
include species, number, growth rate, and the appearance of meta
bolic products of the contaminating microorganisms. Microbial and
chemical processes, occurring in milk, show significant influence on
the organoleptic quality of milk. Provided that there are no patho
gens, this is the most important criterion 'for quality. For the
consumer, milk can be kept until changes can be detected by the
senses. Organoleptic criteria of a food differ from man to man
and country to country, and are formed by education, tradition,
environmental influences and habits.
The following is a short survey of the factors, which influence
the organoleptic properties of milk and its keeping quality. Des
cribing keeping quality and organoleptic characteristics the term
"flavour" will be used. The word flavour describes most sensory
impressions, evident in the oral cavity. It is therefore the
combined impression of taste and smell.
The flavour of fresh milk is difficult to describe as there is
a low level of smell and taste. The slight sweet and salty
character is produced by lactose and chlorides. Trace compounds
of low molecular weight form the characteristic flavour. Many
compounds in milk, when present in higher amounts, produce an
undesired off-flavour.
4.1 The concept of keeping quality
4.1.1 The flavour quality of milk and influencing factors
Apart from microbial factors, milk is exposed to a number of
other environmental influences from milking to consumption. The
following table shows the non-microbial effects on the flavour
of milk.

- 69-
NON-MICROBIAL INFLUENCES ON THE MILK-FLAVOUR
~Housing (e.g.barn-atmosphere)
~Feeding, season
Milk-production~~ ---Health condition
--------- --Rheologic factors
Storage and
Transportation
Processing
-------Metallic catalysts
~ Rheologic factors
~~Environmental influences
I~ --Metallic catalysts
::--------------·--Light
~Milkborne enzymes
Rheologic factors
~~Homogenization
~Heating
1~-------Packing material
~Metallic catalysts
~Light Milkborne enzymes
Table ..4. 1
The influences come from feeding, season, health condition of the
cow and the exposure of the milk to the barn-atmosphere. Further
changes in the flavour are caused by metals as catalysts,
mechanical treatment and milkborne enzymes, especially the lipo
lytic enzymes. These factors, difficult to standardize and
control, are excluded in the following. Nevertheless they show
the difficulties, naturally associated with the search for
a control parameter for microbial changes of milk.
The most important contribution to the microbial factors are
species and number of contaminating microorganisms.

- 70-
The question of the influence of bacterial processes in raw milk
on the keeping quality of pasteurized milk is contradictory.
Pasteurized milk, produced from severely contaminated milk
shows despite a relatively low-recontamination with microbes,
a bitter off-flavour within a short time. Poor, contaminated raw
milks usually produce an off-flavour, characterized as "oxidation
taste", commonly caused by non-microbial effects.
Without any doubt, the contamination of milk after pasteurization
is the main source of microbe-produced off-flavours. Next in
order of importance are thermoduric organisms. In addition,
products from microbial metabolism remain after pasteurization
and may produce off-flavours themselves or act as precursors
for a further break-down by the recontaminating flora. Last but
not least heat-stable microbial enzymes, especially lipases and
proteases of the psychrotrophic flora may remain active after
pasteurization. Even parts of heat deactivated and digested bacteria
may produce defects in flavour.
Clear flavour differences correlating with the germ population
or with distinct species of bacteria, are observed for relatively
high numbers of microbes. A malty flavour, produced by Streptococcus
lactis var. maltigenes, can be observed at 107 - 108 microorganisms/
ml. A fruity flavour, produced by Pseudomonas fragi can be smelt at
5 x 10⁷ microorganisms/ml. The following two comnrehensive tables
show the microbial influences on the milk-flavours.

- 71-
MICROBIAL INFLUENCES ON THE MILK-FLAVOUR
species plate count/ml flavour defects
Psychrotrophic 5 - 20 X 106 polluted, bitter, microbes rancid, fruity
Sc.lactis var. 107
- 108
malty maltigenes
Ps.fragi 5 X 10 8 fruity
Alcaligenes 106 viscolactis 5 X viscous
Table 4. 2
OFF-FLAVOURS IN MILK FROM BACTERIAL ORIGIN
Compounds produced
Free fatty acids
Lactic acid
Formic acid
Alcohols
Aldehydes
Esters
Ketones
N-containing compounds
S.containing compounds
Lactones
Off-flavour
rancid, soapy
sour
penetrating
fruity, aroma of cream or fungi
hitter, spoiled, mouldy, penetrating, caustic, sweet, sour
mouldy, malty, like garlic
Table 4.3
M i c r o b e s
psychrotrophic microbes
Streptococci, Lactobacillae Enterobacteriaceae
Enterobacteriaceae
Lactis-Streptococci, Ps. fragi Enterobacteriaceae, Clostridiae, Pediococcus
Lactis-streptococci, Lb.casei, Achromobacter, Enterobacteriaceae, Pediococcus
Lactis streptococci Ps.fragi
Lactis streptococci
psychrotrophic microbes
Enterobacteriaceae, Propionic acid bacteria anaerobic proteolytics
yeasts, fungi, Sarcina lutea, Saccharomyces
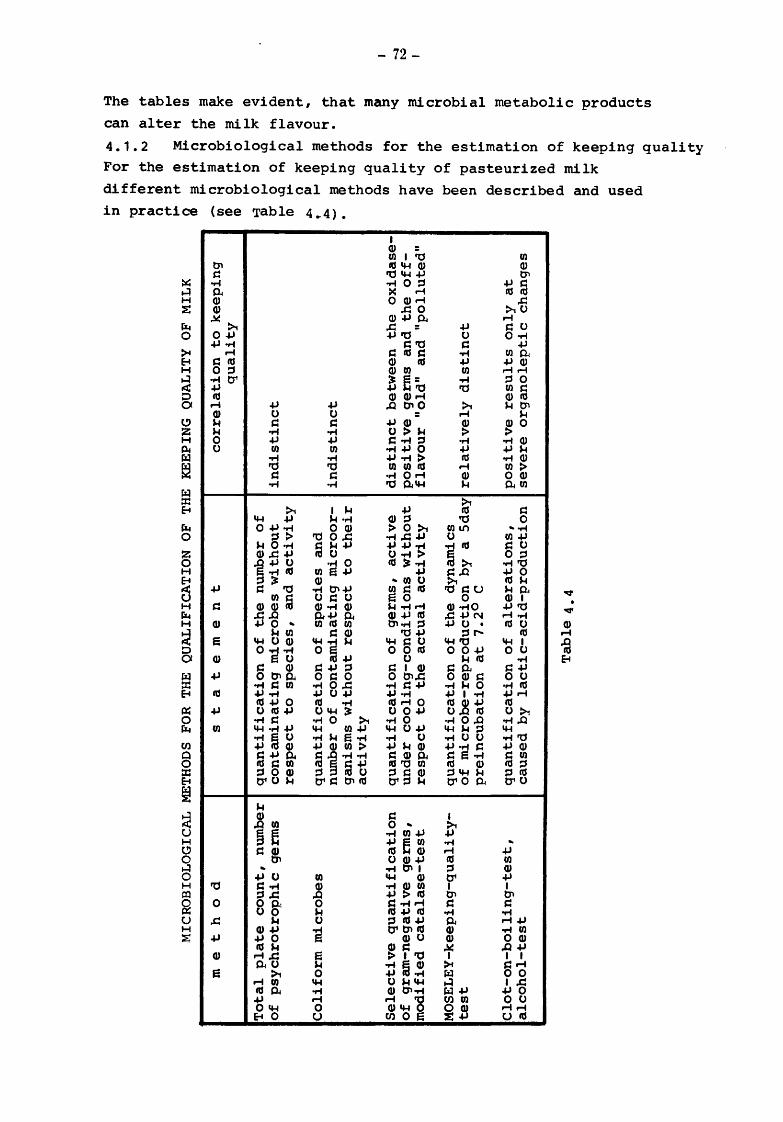
.....
0.
t'lj
.a:a.
0 1-3
::s
.....
0 .
PJ
::r
......
t1 -::s
(Q
~
......
t1
CD
tT
II.)
PJ
tT
PJ
~
::r
~
PJ
0 CD
tT
tr
tT
::s
(1) ~
.....
tT
(1)
i! t1
(1
)
MIC
RO
BIO
LOG
ICA
L M
ETH
OD
S FO
R
THE
QU
AL
IFIC
AT
ION
O
F TH
E K
EE
PIN
G
QU
ALI
TY
OF
MIL
K
Q
m
m
i! tT
0
tT
.....
t1
::r
a m
eth
od
s
t a
t e
m e
n
t co
rrela
tio
n t
o k
eep
ing
0
a 0
(1) ~
rn
t1
PJ
tr
qu
ali
ty
CD
0 tT
.....
~-
CD
(1)
tr
.....
0 .....
0
......
......
(1)
To
tal
pla
te
co
un
t,
nu
mb
er
qu
an
tifi
cati
on
of
the
nu
mb
er o
f ..;
0
::s 0
~
<
SlJ
......
I.Q
.....
of
psy
ch
rotr
op
hic
ger
ms
co
nta
min
ati
ng
mic
rob
es w
ith
ou
t in
dis
tin
ct
tr
0 0
.....
......
0.
......
I.Q
......
0 ....
.. (1
) re
spect
to sp
ecie
s,
and
acti
vit
y
(1)
.....
SlJ
SlJ
::s 0
~
......
<
tT
~
PJ
(1)
0 ..
Co
lifo
rm m
icro
bes
q
uan
tifi
cati
on
of
specie
s an
d
' ....
.. (1
) ~
r:: ~
ttl
t1
tT
nu
mb
er o
f co
nta
min
ati
ng
mic
roo
r-in
dis
tin
ct
~ .....
tT
.
::r
gan
ism
s w
ith
ou
t re
spect
to th
eir
::s
::r
PJ
tT
I.Q
0 tT
acti
vit
y
::r
0.
0 1-
0 rn
a
Q,
r:: ~
Sele
cti
ve q
uan
tifi
cati
on
q
uan
tifi
cati
on
of
ger
ms,
acti
ve
dis
tin
ct
bet
wee
n th
e o
xid
ase
-rn
PJ
.....
. .....
. 0
~
-l
of
gra
m-n
eg
ati
ve
ger
ms,
u
nd
er
co
oli
ng
-co
nd
itio
ns
wit
ho
ut
po
sit
ive g
erm
s an
d th
e o
ff-
::r
.....
t1
~
PJ
tT
a I
mo
dif
ied
cata
lase-t
est
resp
ect
to th
e
actu
al
acti
vit
y
flav
ou
r "o
ld"
and
"p
oll
ute
d"
< ~
tT
(1)
::r
0 0
(1)
t1
MO
SE
LE
Y-k
eep
ing
-qu
alit
y-
qu
an
tifi
cati
on
of
the
dy
nam
ics
tr
......
0 (1
) (1
) tr
te
st
of
mic
rob
e-r
ep
rod
ucti
on
by
a
Sd
ay r
ela
tiv
ely
dis
tin
ct
(1)
ttl
rn
.....
pre
incu
bati
on
at
7.2
° c
::s SlJ
cT
PJ
rn
.....
.....
. ~
cT
s C
lot-
on
-bo
ilin
g-t
est,
CD
PJ
~
qu
an
tifi
cati
on
of
alt
era
tio
ns,
po
sit
ive re
su
lts o
nly
at
rn
r:: tT
alc
oh
ol-
test
cau
sed
by
la
cti
c-a
cid
-pro
du
cti
on
se
vere
o
rgan
ole
pti
c
chan
ges
0
t1
.....
tT
t1
.....
0 SlJ
....
N
::s tr
tr
(I
) 0
(1)
Q,
0 ~
Tab
le 4
. 4
Q,
......
.....
i! ~
0 SlJ
::s .....
. (1
) '"tJ
Q
, ~
(1)
t1
ttl
0 r::
.....
Q,
rn
::s r::
(1)
I.Q
0 Q
, cT
1-
0 rn
r:: SlJ
~
.....
cT
'<

- 73-
From all procedures, based on a single determination such as the
total germ count or the number of psychrotrophic or coliform
microorganisms, only a poor correlation with the keeping quality
could be derived. Even the selective count of gram-negative
microorganisms correlated only with the production of distinct
off-flavours. ~11 these results only show the number of contamina
ting microbes without permitting any conclusion as to their actual
activity.
The clot-on-boiling-test and the alcohol-test primarily show
changes due to the production of lactic acid. Normally these
tests show positive results under psychrotrophic conditions,
when organoleptic alterations are evident.
The MOSELEY-keeping-quality-test is based on the determination of
total microbe-numbers before and after a five-day-incubation at
7.2° c. In that space of time a reproduction of the psychrotrophic
recontamination flora is possible. Correlations with keeping
quality are reported to be relatively close.
Viewing the different methods makes it clear, that only the
procedures based on the dynamics of the reproduction of
microbes give reliability.
4.2 Pyruvate and keeping quality
Within the objectives of this investigation the following questions
should be answered:
1. Can the keeping quality of milk be estimated by the
pyruvic-acid-determination before and after incubation?.
2. To what extent does the influence of microbial processes in
raw milk affect the keeping quality of pasteurized milk?
3. At what pyruvate content can a pasteurized milk be
characterized as spoiled?
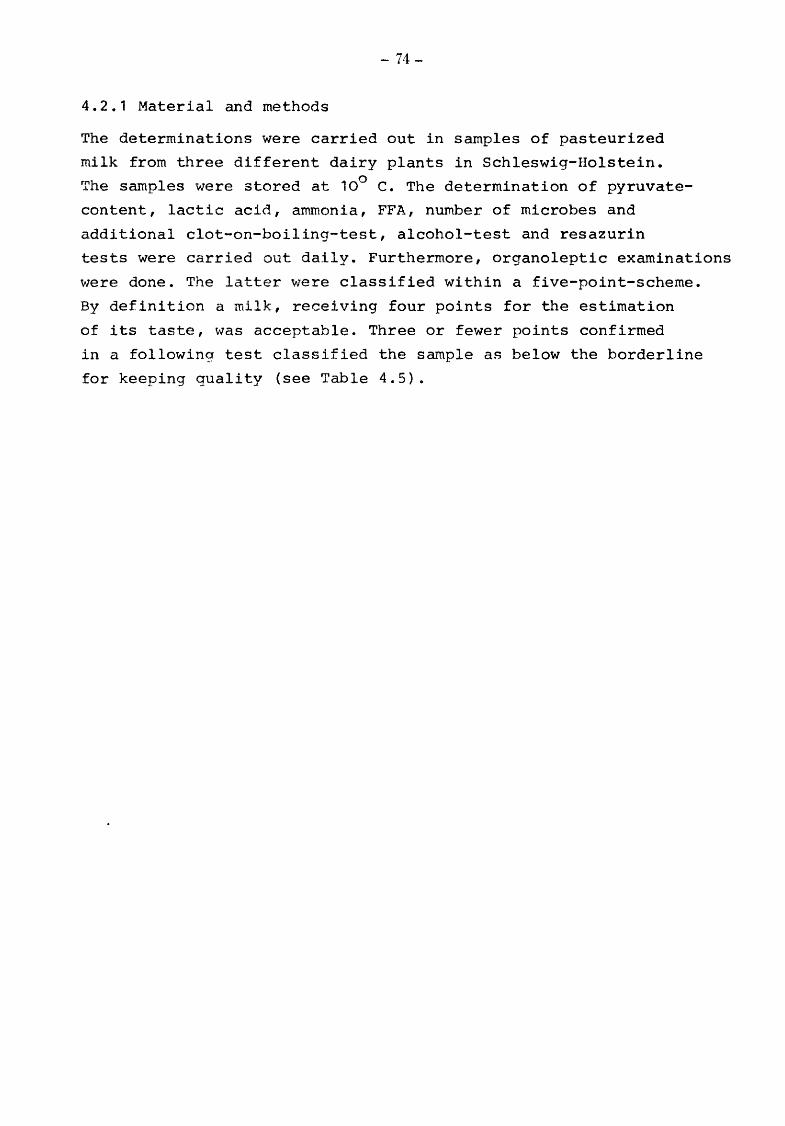
- 74-
4.2.1 Material and methods
The determinations were carried out in samples of pasteurized
milk from three different dairy plants in Schleswig-Holstein.
The samples were stored at 10° C. The determination of pyruvate
content, lactic acid, ammonia, FFA, number of microbes and
additional clot-on-boiling-test, alcohol-test and resazurin
tests were carried out daily. Furthermore, organoleptic examinations
were done. The latter were classified within a five-point-scheme.
By definition a milk, receiving four points for the estimation
of its taste, was acceptable. Three or fewer points confirmed
in a following test classified the sample as below the borderline
for keeping quality (see Table 4.5).

FEA
TU
RE
S O
F R
EA
LIZ
ED
IN
VE
ST
IGA
TIO
NS
s a
m p
1
e s
Fre
sh p
aste
uri
zed
m
ark
et
mil
k
sam
ple
s fr
om
th
ree
dif
fere
nt
dair
y p
lan
ts
Incu
bati
on
-tem
pera
ture
T e
s
t
py
ruv
ate
la
cti
c acid
amm
on
ia,
FFA
tota
l p
late
co
un
t
clo
t-o
n-b
oil
ing
-test
alc
oh
ol-
test
resazu
rin
e-t
est
od
ou
r,
taste
Tab
le
4.
5
M e
t
h o
d
en
zy
mati
c d
ete
rmin
ati
on
in
th
e
Au
toA
naly
zer
Sy
stem
Au
toA
naly
zer
Sy
stem
IDF
-meth
od
olo
gy
5 m
l m
ilk
h
eate
d to
1
00
° fo
r 5
min
1
ml
mil
k
+
2 m
l eth
yl-
alc
oh
ol
(68%
)
1 h
ou
r at
37
°c
team
-ju
dg
em
en
t acco
rdin
g to
th
e
5-p
oin
t-sc
hem
e o
f th
e
DLG
(G
erm
an A
gri
cu
ltu
ral
Org
an
izati
on
)
5 p
oin
ts
-ex
trao
rdin
ary
qu
ali
ty
4 p
oin
ts
-g
oo
d q
uali
ty
3 p
oin
ts
-sli
gh
t d
efe
cts
2
po
ints
-
cle
ar
defe
cts
1
po
int
-d
isti
nct
defe
cts
0
po
int
-sev
ere
d
efe
cts

- 76-
In the following figure the principles and parameters of the
determinations are shown for a pasteurized milk sample. Number
of microbes and pyruvate content show the expected conformity.
Before the milk was spoiled according to the given definitions,
a rapid increase of pyruvic acid was observed.
L I ::"'1!1...
f ~
/ I
I , /
...,. ~
o-o GKZ KOCH
-XGERUCH eGESCHMACK
~ -~RESAZURIN ......... --oALKOt«PROBE I ...........
~--·PYRUVAT I ............... _,._. I I I I I I
!~ I I
~~ I I ~ci I
6 2
4 3 .I ~· "" T I ~ '" J 1 ......,....j ,
'" I I _, ' I I ~
/ I I 74/241 2 4
/ I I / I I ,, . ,
" 0 5 24 48 72 96 120 Stunden 144
PROGRESSION OF PYRUVATE-CONTENT, PLATE COUNT AND CHANGES IN THE RESAZURIN-, ALCOHOL-, AND SENSORY TEST IN A MARKET MILK (INCUBATION-TEHPERATURE 120C)
Keimzahl/ml = plate count/m.l Pyruvat = pyruvate Geruch = odour Geschrnack = taste Resazurin = resazurin-test Alkoholprobe = alcohol-test GKZ KOCH = total plate count KOCH
Fig. 4. 1

- 77-
For the estimation of the spoilage-risk and bacterial activity,
the pyruvate-difference-value, derived from 72-hours-incubation,
was correlated with the spoilage time.
The determination of biochemical parameters was carried out by
continuous flow analysis in the AutoAnalyzer System. The bacterial
counts were done by the IDF-method. All other Measurements
were carried out with internationally approved procedures.
4.2.2
4.2.2.1
Results
Pyruvate-difference-value and keeping quality of milk
In the scope of this investigation the so-called pyruvate
difference-value (pyruvic-acid-change-value; difference between
pyruvate contents before and after incubation) was correlated
with the keeping time in days.
In the following fi0ures the means of pyruvate-difference-values
in samples of equal keeping time are set out.
0 n=15 5 Keeping quality
in dOys (o<bJr)
RESULTS OF THE DETERMINATION OF THE DIFFERENCE VALUE OF PYRUVATE (INCUBATION 72 h/10° C) NITH
REGARD TO THE KEEPING QUALITY (ODOUR) (XA)
Fig. 4.2
75/223
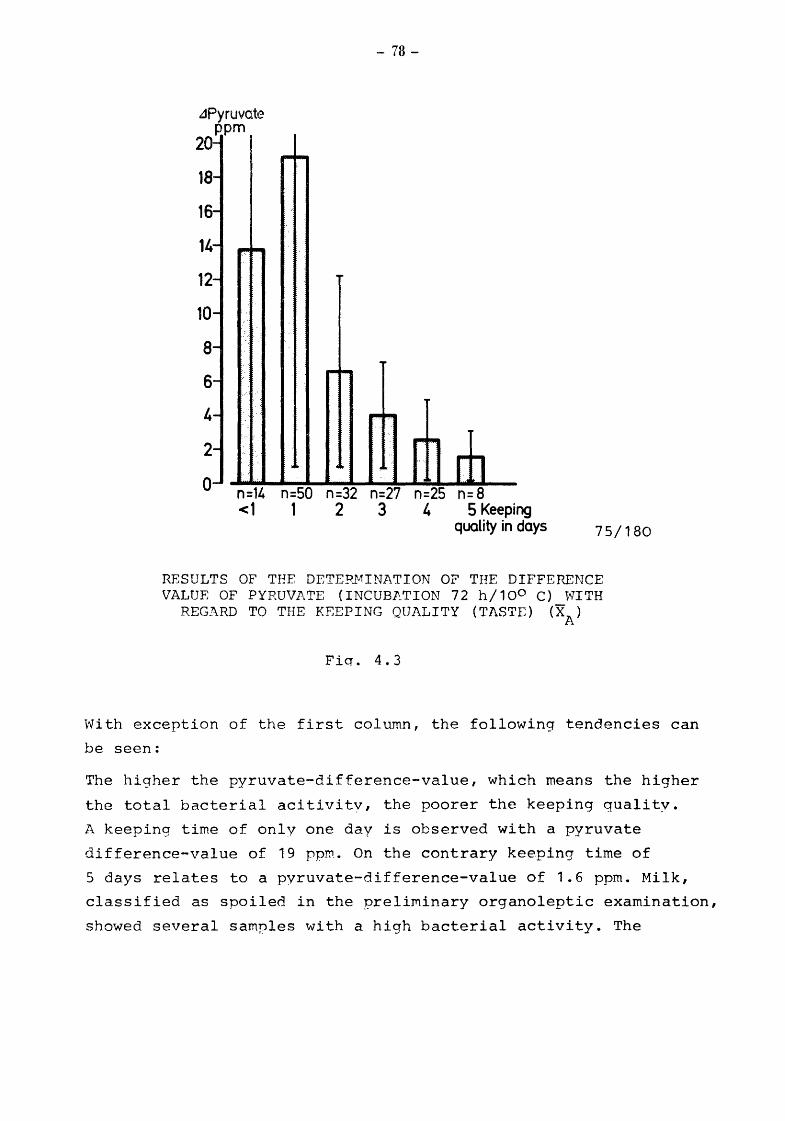
.dPyruvate RPm
~~
-""'
.
--
·-
- 78-
~~
~~~~~~-~
_i. [ n n=14 n=SO n=32 n=27 n=25 n= 8 <1 1 2 3 4 5 Keeping
quality in days 75/180
RESULTS OF TEE DETEPJ"~INATION OF THE DIFFERENCE VALUE OF PYRUVl'.TE (INCUB~_TION 72 h/100 C) WITH
REGARD TO THE KEEPING QUALITY (TASTE) (XA)
Fiq. 4.3
With exception of the first column, the following tendencies can
be seen:
The higher the pyruvate-difference-value, which means the higher
the total bacterial acitivitv, the poorer the keeping quality.
A keeping time of only one day is observed with a pyruvate
difference-value of 19 ppm. On the contrary keeping time of
5 days relates to a pyruvate-difference-value of 1.6 ppm. Milk,
classified as spoiled in the preliminary organoleptic examination,
showed several samples with a high bacterial activity. The
- 79-
greater part of these milk samples however featured only a low
pyruvate-difference-value. The spoilage of these samples is mainly
due to non-microbial influences. Therefore the mean pyruvate
difference-value of these samples was lower than 14 ppm. It cannot
be excluded, that also in the samples, already being spoiled on
the first day, ·a primary and very intensive glycolysis began.
The data are set out in Table 4.6.
RESULTS OF THE DETER:MINATION OF THE DIFFERENCE VALUE OF PYRUVATE (incubation 72h/10°C)WITH REGARD
TO THE KEEPING QUALITY (TASTE)
Keeping Difference value of pyruvate (ppm) quality
XA s in days n a
<1 14 13,8 21,01
1 50 19, 2 18,19
2 32 6, 6 5,61
3 27 4, 0 3,12
4 25 2, 6 2, 35
5 8 1, 6 1,54
75j167W,
Table 4.6
This situation is obvious from the lactic-acid-difference-value
of the same samples, shown in Fig. 4.4 and 4.5. The negative
correlation of lactic-acid-difference-value (in ppm) and keeping
quality duration (in days) shows a good correlation. Due to
fundamental considerations lactic acid seems to be a less
suitable parameter than pyruvate, as with it an exclusively
psychrotrophic flora (pseudomonads) cannot be included. The
variation within the groups is naturally rather high due to the
numerous nonmicrobial influences and the relatively long space
of time between the determinations. Nevertheless the results
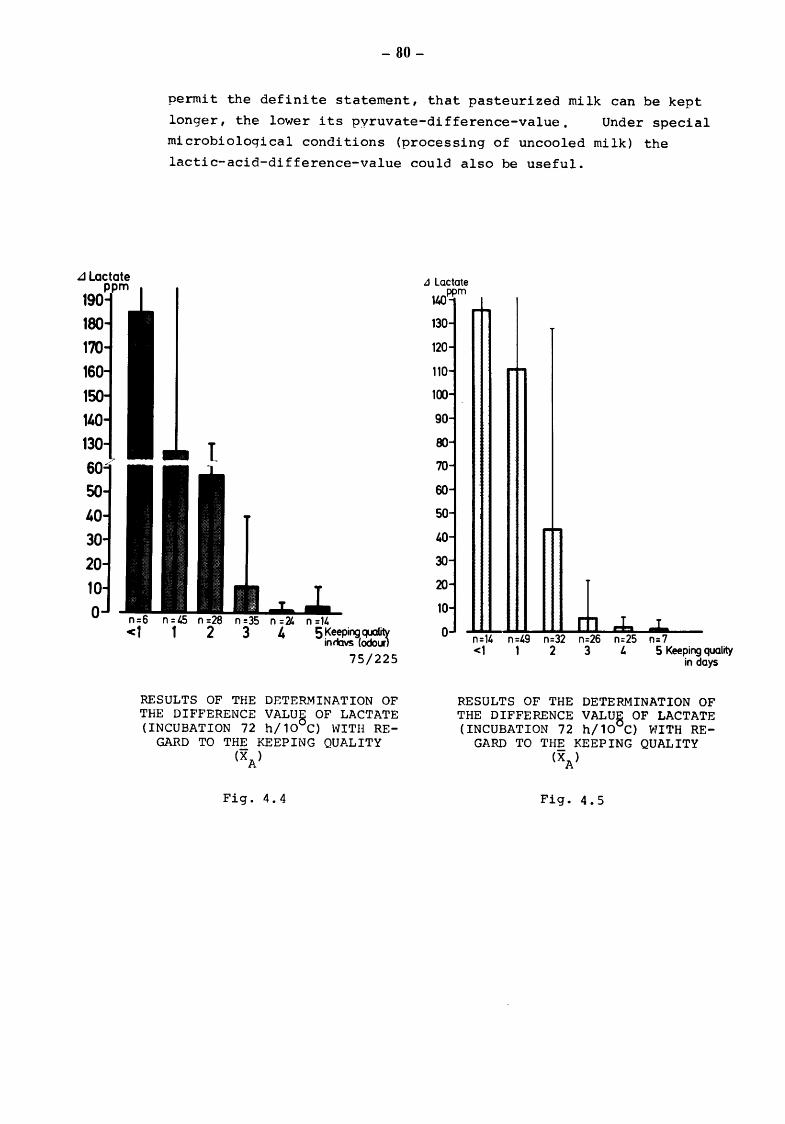
- 80-
permit the definite statement, that pasteurized milk can be kept
longer, the lower its pyruvate-difference-value. Under special
microbiological conditions (processing of uncooled milk) the
lactic-acid-difference-value could also be useful.
n=" 5 Keeping QUCllity inriavs (odolJ')
75/225
RESULTS OF THE DETERMINATION OF THE DIFFERENCE VALU5 OF LACTATE (INCUBATION 72 h/10 C) WITH RE-
GARD TO THE KEEPING QUALITY (XA)
Fig. 4. 4
J Lactate 1/.0ppm
130
120
110
100
90
80
70
60
50
40
30
20
10
0
....
..
n=1.4 n=.49 n=32 n=26 n::25 n=7 < 1 1 2 3 I. 5 Keeping quality
in days
RESULTS OF THE DETERMINATION OF THE DIFFEP£NCE VALU~ OF LACTATE (INCUBATION 72 h/10 C) WITH RE
GARD TO THE KEEPING QUALITY (XA)
Fig. 4.5
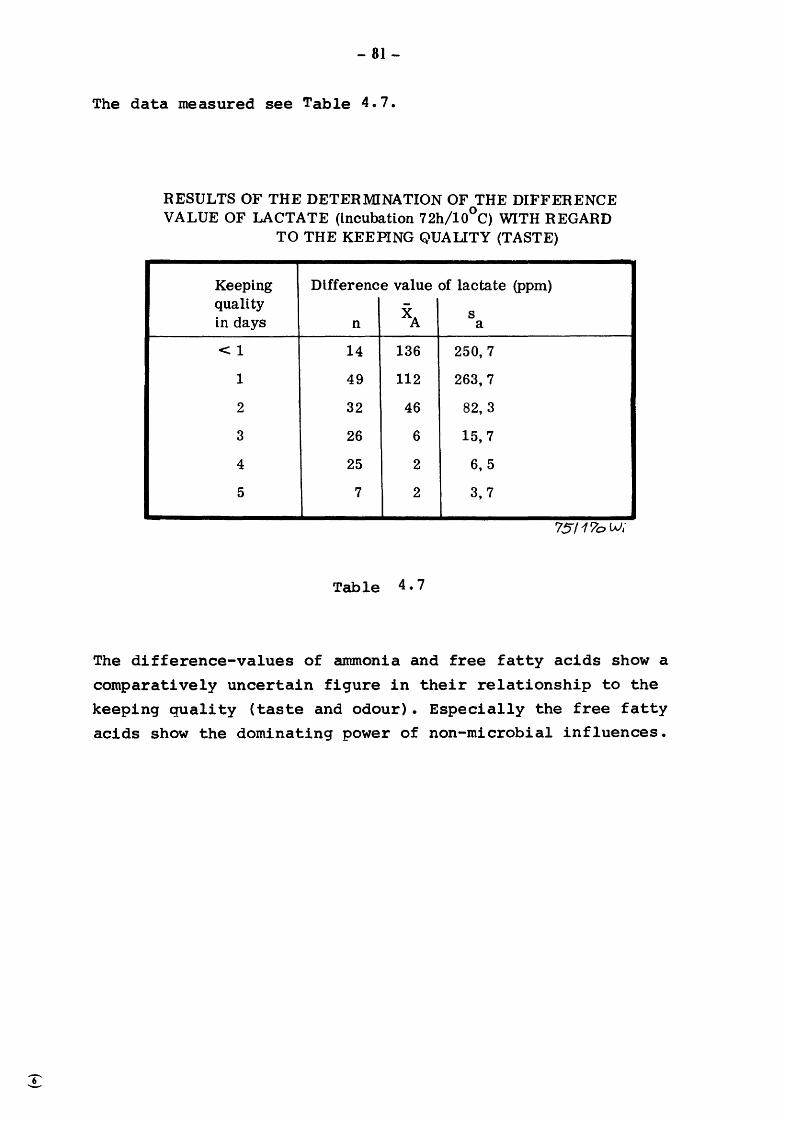
6 -
- 81-
The data measured see Table 4.7.
RESULTS OF THE DETER1\11NATION OF THE DIFFERENCE VALUE OF LACTATE (incubation 72h/10°C) WITH REGARD
TO THE KEEPING QUALITY (TASTE)
Keeping Difference value of lactate (ppm) quality
XA s in days n a
<1 14 136 250,7
1 49 112 263,7
2 32 46 82,3
3 26 6 15, 7
4 25 2 6,5
5 7 2 3, 7
75!17ow,·
Table 4. 7
The difference-values of ammonia and free fatty acids show a
comparatively uncertain figure in their relationship to the
keeping quality (taste and odour). Especially the free fatty
acids show the dominating power of non-microbial influences.
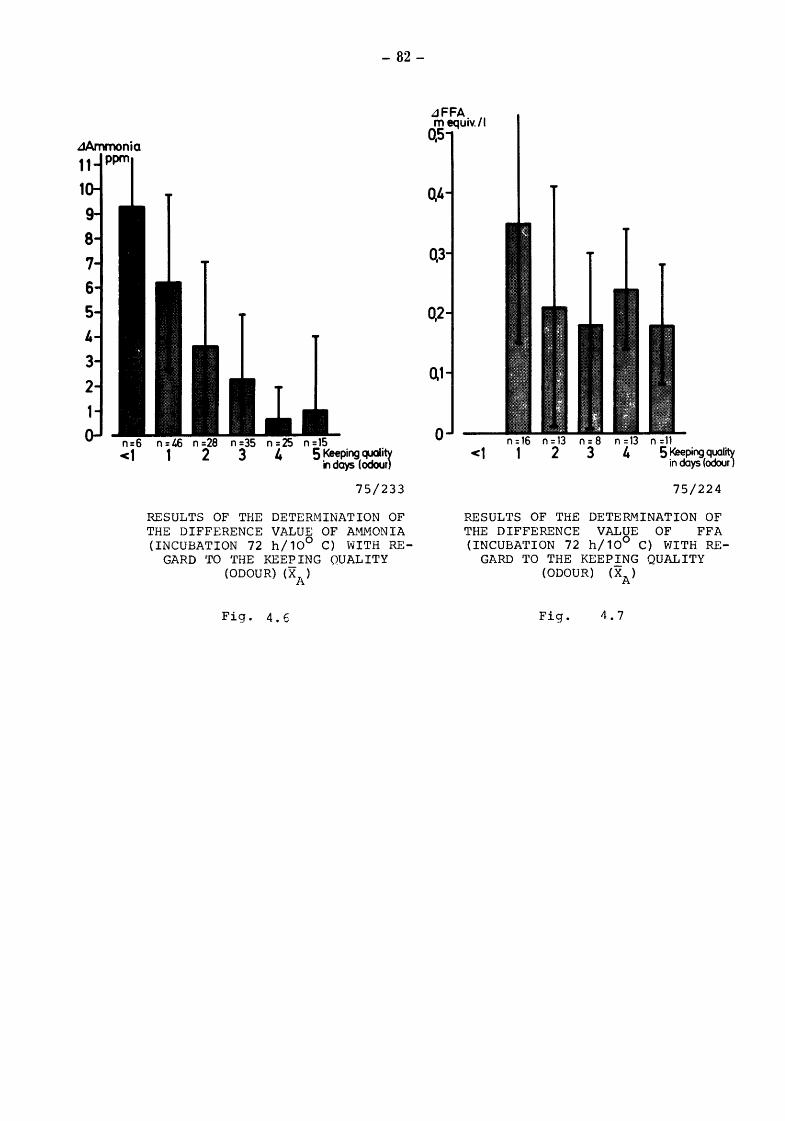
~nia
- 82-
n =15 5 Keeping quality
n days (odour)
75/233
RESULTS OF THE DETERMINATION OF THE DIFFERENCE VALUE OF &~ONIA (INCUBATION 72 h/10° C) WITH RE
GARD TO THE KEEPING QUALITY (ODOUR) (XA)
Fig. 4. 6
.JFFA m equiv./1
0,5
0.4
Q3
0,2
0.1
0 <1
n :11 5 Keeping quality
in days (odour l
75/224
RESULTS OF THE DETERMINATION OF THE DIFFERENCE VALUE OF FFA (INCUBATION 72 h/10° C) WITH RE
GARD TO THE KEEPING QUALITY (ODOUR) (XA)
Fig. 4.7

- 83-
A Ammonia ppm
6
5
4
3
2
0
.. · ); ··: .,, i ;:,, ...
[1 n=14 n=SO n=32 n=27 n=25 n=8 <1 1 2 3 4 5 Keeping quality
in days 75/178
RESULTS OF THE DETERMINATION OF THE DIFFERENCE VJ>.LUE OF A1'·1~·10NIA
(INCUBATION 72 h/10 C) WITH REGARD TO THE KEEPING QUALITY
(Tl\STE) (XA)
Fig. 4. ~
Ll FFA m-~uiv /l
0,4
0,3
0,2
0,1
0
--r+
-- --!""•
"'"""
.
n=3 n=20 n= 12 n= 6 n=17 n= 5 <1 1 2 3 4 5 Keeping quality
in days 75/177
RESULTS OF THE DETERfv!INATION OF THE DIFFERENCE VALHE OF FFA (INCUBATION 72 h/10 C) WITH RE-
GARD TO THE KEEPING QUALITY (TP~STE) (XA)
Fig. 4. 9
The data measured for ammonia and FFA are given in Tables 4.a· and
4. 9.
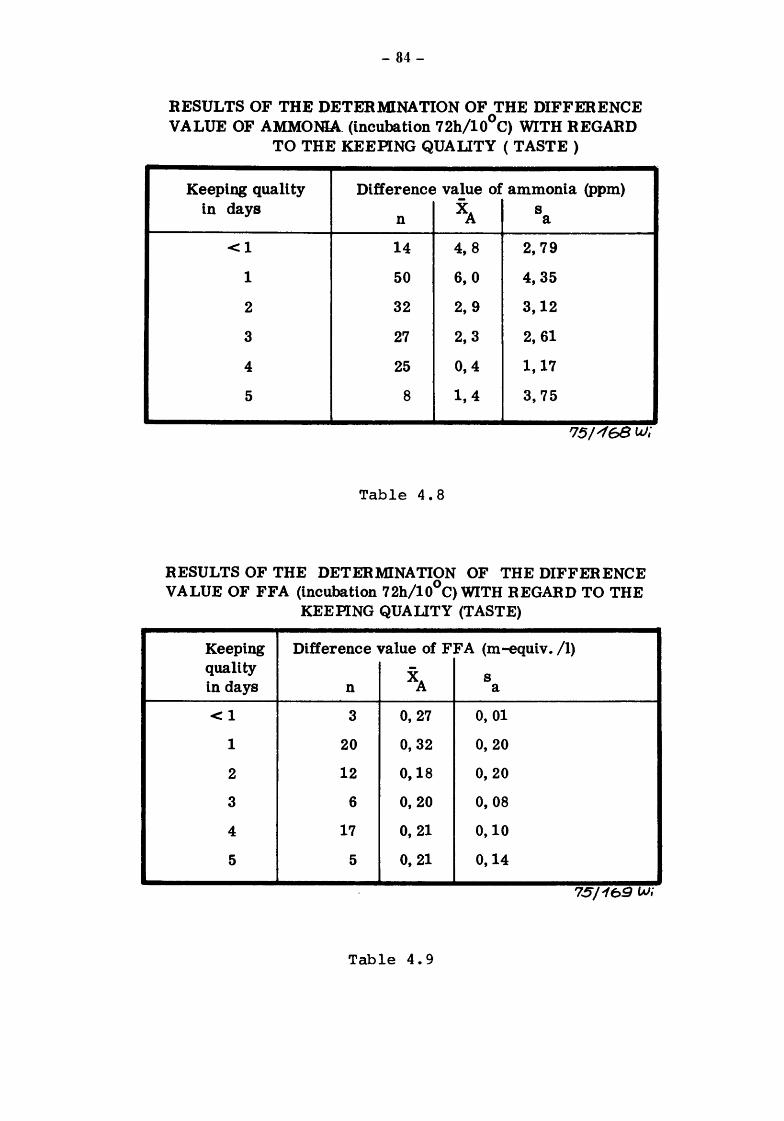
-84-
RESULTS OF THE DETER:MINATION OF THE DIFFERENCE VALUE OF AMMONIA (incubation 72h/10°C) WITH REGARD
TO THE KEEPING QUALITY ( TASTE )
Keeping quality Difference va!ue of ammonia (ppm) in days XA 8
n a
<1 14 4, 8 2, 79
1 50 6, 0 4,35
2 32 2, 9 3,12
3 27 2, 3 2, 61
4 25 0, 4 1,17
5 8 1,4 3,75
'75//f68 w,
Table 4.8
RESULTS OF THE DETERMINATION OF THE DIFFERENCE VALUE OF FFA (incubation 72h/10°C) WITH REGARD TO THE
KEEPING QUALITY (TASTE)
Keeping Difference value of FF A (m -equiv. /1) quality
XA 8 in days n a
<1 3 0, 27 0, 01
1 20 0,32 0, 20
2 12 0,18 0, 20
3 6 0, 20 0, 08
4 17 0, 21 0,10
5 5 0, 21 0,14
75/169 w,
Table 4.9

- 85-
Splitting the total material on the three dairy plants under
study shows uniform trends (Fig. 4.10 and Table 4.11).
~Pyruvate ppm
0 Dairy plant 1
• Dairy plant 3
c . Dairy plant 5
l 3 4 1
5 Keeping quality in davs
RESULTS OF THE DETERMINATION OF THE DIFFERENCE VALUE OF PYRUVATE
(INCUBATION 72 h/10° C) WITH REGARD TO THE KEEPING QUALITY (TASTE) AND DIFFERENT DAIRY PLANTS
Fig. 4.10
75/227
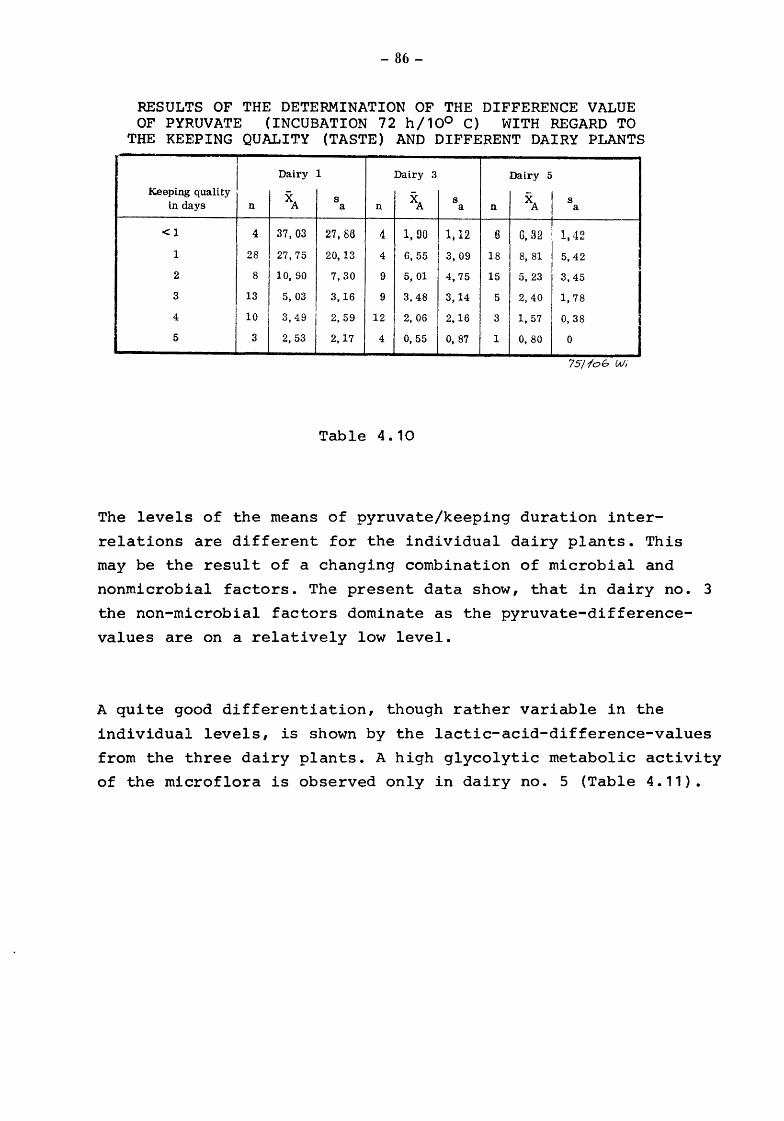
- 86-
RESULTS OF THE DETERMINATION OF THE DIFFERENCE VALUE OF PYRUVATE (INCUBATION 72 h/10° C) WITH REGARD TO
THE KEEPING QUALITY (TASTE) AND DIFFERENT DAIRY PLANTS !
Keeping quality I Dairy 1 Dairy 3 Dairy 5
XA s XA s XA s in days n a n a. n a
<1 4 37, 03 27,86 4 1, 00 lj12 B G, 32 1,42 1 28 27,75 20,13 4 6, 55 3,09 18 8, 81
I 5, 42
2 8 10, 90 7,30 9 5, 01 4, 75 15 5,23 3,45
3 13 5,03 3,16 9 3,48 3,14 5 2, 40 1,78
4 10 3,49 1 2, 59 12 2, 06 2,16 3 1, 57 0, 38
5 3 2. 53 1 2,17 4 0, 55 0, 87 1 0, 80 0
75/lob w,
Table 4.10
The levels of the means of pyruvate/keeping duration inter
relations are different for the individual dairy plants. This
may be the result of a changing combination of microbial and
nonmicrobial factors. The present data show, that in dairy no. 3
the non-microbial factors dominate as the pyruvate-difference
values are on a relatively low level.
A quite good differentiation, though rather variable in the
individual levels, is shown by the lactic-acid-difference-values
from the three dairy plants. A high glycolytic metabolic activity
of the microflora is observed only in dairy no. 5 (Table 4.11).
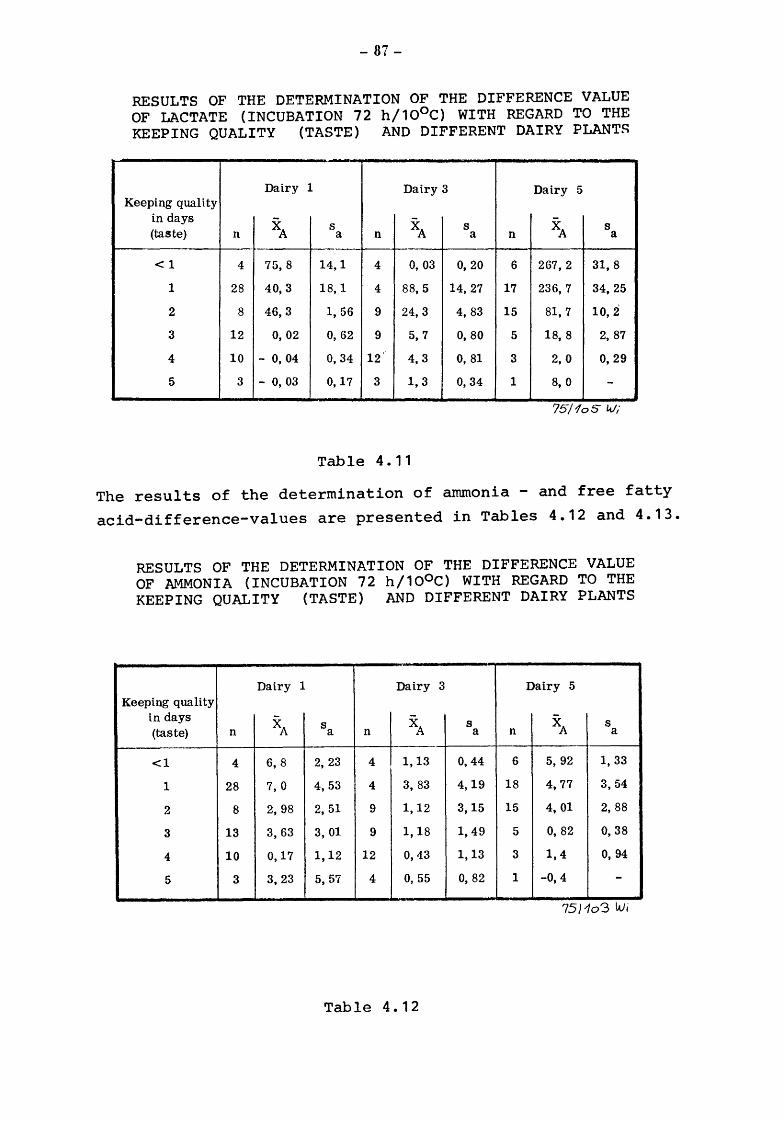
- 87-
RESULTS OF THE DETERMINATION OF THE DIFFERENCE VALUE OF LACTATE (INCUBATION 72 h/10°C) WITH REGARD TO THE KEEPING QUALITY (TASTE) AND DIFFERENT DAIRY PLANTS
Dairy 1 Dairy 3 Dairy 5 Keeping quality
in days XA XA XA (taste)
s s s n a n a n a
<1 4 75,8 14,1 4 0, 03 0, 20 6 267, 2 31,8
1 28 40,3 18,1 4 88,5 14,27 17 236,7 34,25
2 8 46,3 1, 56 9 24,3 4,83 15 81,7 10,2
3 12 0, 02 0, 62 9 5, 7 0, 80 5 18, 8 2, 87
4 10 - 0,04 0, 34 12' 4,3 0, 81 3 2, 0 0, 29
5 3 - 0,03 0,17 3 1,3 0, 34 1 8, 0 -75/1oS W;
Table 4.11
The results of the determination of ammonia - and free fatty
acid-difference-values are presented in Tables 4.12 and 4.13.
RESULTS OF THE DETERMINATION OF THE DIFFERENCE VALUE OF AMMONIA (INCUBATION 72 h/10°C) WITH REGARD TO THE KEEPING QUALITY (TASTE) AND DIFFERENT DAIRY PLANTS
Dairy 1 Dairy 3 Dairy 5 Keeping quality
in days XA XA XA (taste) n
s s s a n a n a
<1 4 6, 8 2, 23 4 1,13 0,44 6 5,92 1,33
1 28 7, 0 4,53 4 3, 83 4,19 18 4,77 3,54
2 8 2, 98 2, 51 9 1,12 3,15 15 4,01 2, 88
3 13 3,63 3, 01 9 1,18 1, 49 5 0, 82 0, 38
4 10 0,17 1,12 12 0,43 1,13 3 1,4 0, 94
5 3 3,23 5, 57 4 0,55 0, 82 1 -0,4 -
75J1o3 w;
Table 4.12
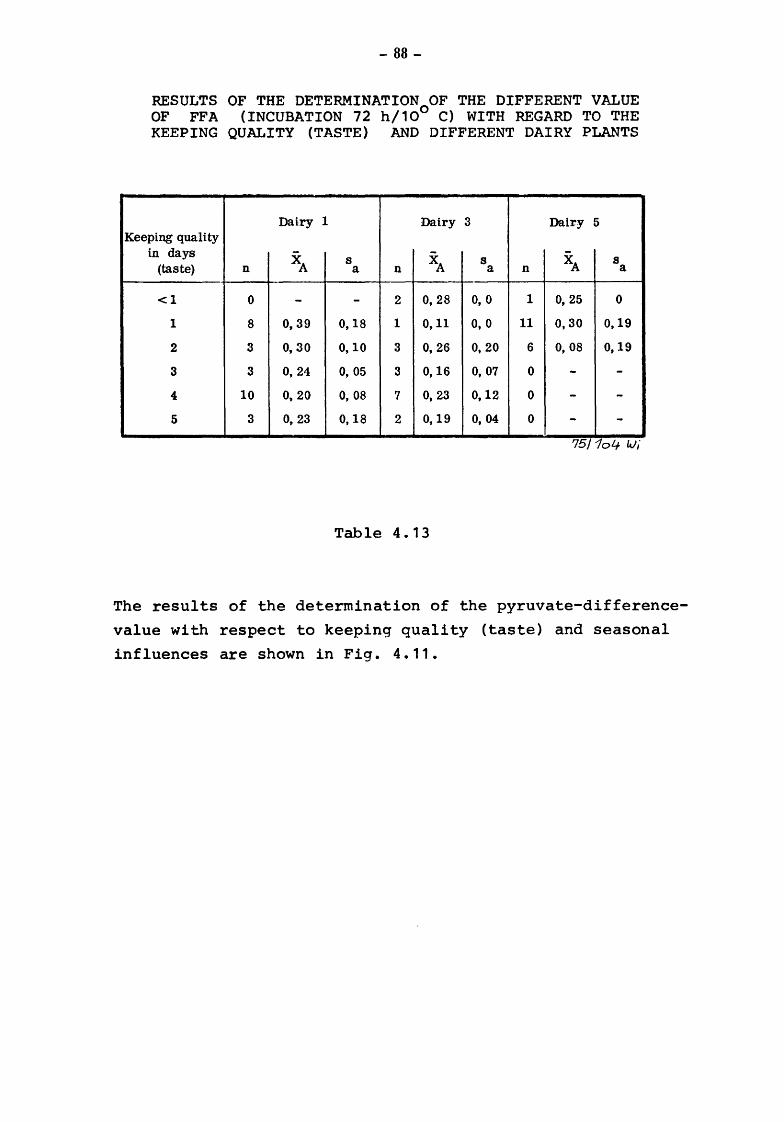
-88-
RESUL~S OF THE DETERMINATION OF THE DIFFERENT VALUE OF FFA (INCUBATION 72 h/10° C) WITH REGARD TO THE KEEPING QUALITY (TASTE) AND DIFFERENT DAIRY PLANTS
Dairy 1 Dairy 3 Dail"y 5 Keeping quality
in days XA s XA s XA s
(taste) n a n a n a
<1 0 - - 2 0,28 0, 0 1 0, 25 0
1 8 0, 39 0,18 1 0,11 0, 0 11 0, 30 0,19
2 3 0, 30 0,10 3 0,26 0,20 6 0,08 0,19
3 3 0,24 0, 05 3 0,16 0, 07 0 - -4 10 0, 20 0, 08 7 0, 23 0,12 0 - -5 3 0, 23 0,18 2 0,19 0, 04 0 - -
75/1o4 LV;
Table 4. 13
The results of the determination of the pyruvate-difference
value with respect to keeping quality (taste) and seasonal
influences are shown in Fig. 4.11.
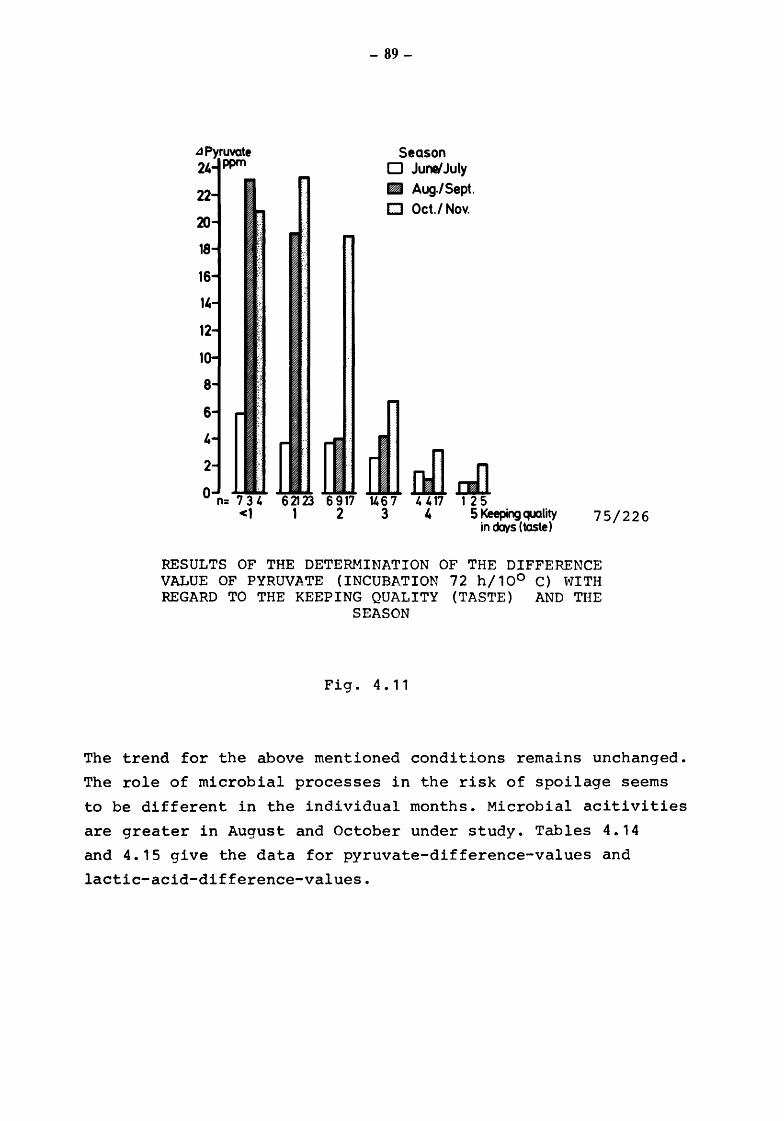
-89-
Season 0 Junt/July fB Aug./Sept. CJ Oct./ Nov.
nllnll 6 21 23 6 917 14 6 7 4 4 17 1 2 5
1 2 3 4 5 Keeping quality in days (taste)
75/226
RESULTS OF THE DETERMINATION OF THE DIFFERENCE VALUE OF PYRUVA.TE (INCUBATION 72 h/10° C) NITH REGARD TO THE KEEPING QUALITY (TASTE) AND THE
SEASON
Fig. 4. 11
The trend for the above mentioned conditions remains unchanged.
The role of microbial processes in the risk of spoilage seems
to be different in the individual months. Microbial acitivities
are greater in August and October under study. Tables 4.14
and 4.15 give the data for pyruvate-difference-values and
lactic-acid-difference-values.
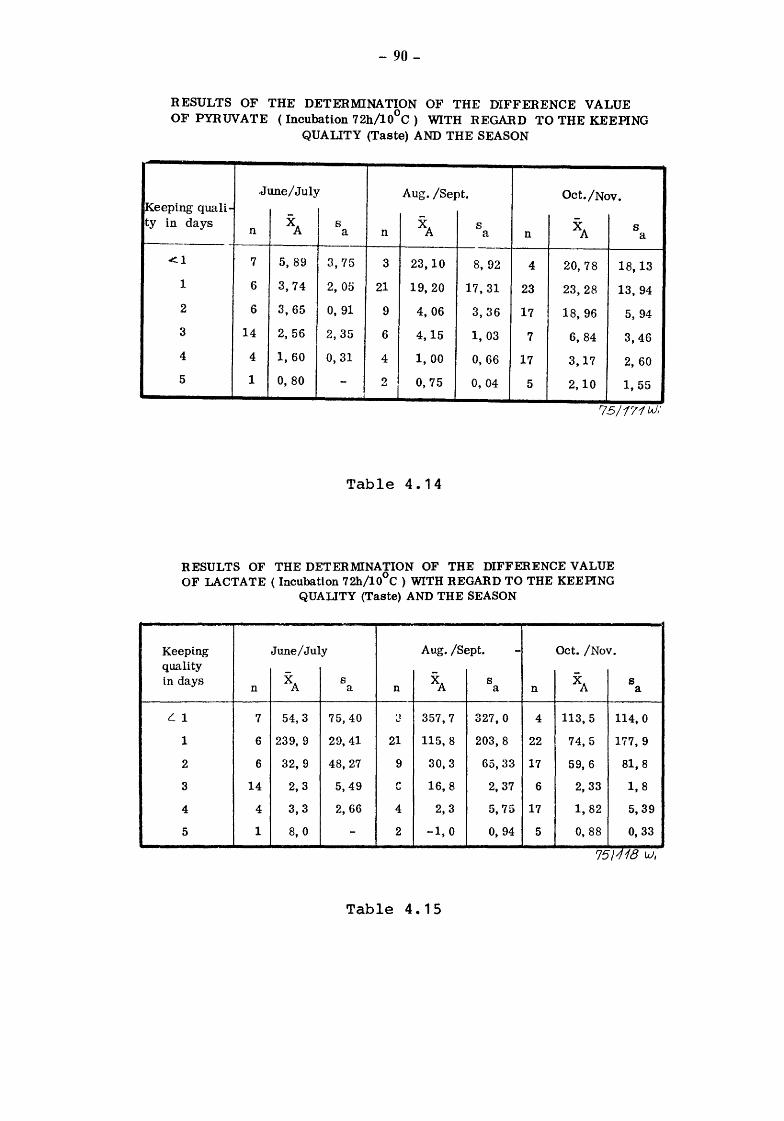
- 90-
RESULTS OF THE DETERMINATION OJ.4, THE DIFFERENCE VALUE OF PYRUVATE (Incubation 72h/10°C) WITH REGARD TO THE KEEPING
QUALITY (Taste) AND THE SEASON
.June/July Aug. /Sept. Oct./Nov. Keeping quali-ty in days XA s XA s XA s n a n a n a r------
<1 7 5, 89 3,75 3 23,10 8, 92 4 20,78 18,13
1 6 3,74 2, 05 21 19,20 17,31 23 23,28 13,94
2 6 3,65 0, 91 9 4,06 3,36 17 18, 96 5, 94
3 14 2,56 2,35 6 4,15 1, 03 7 6,84 3,46
4 4 1,60 0,31 4 1,00 0,66 17 3,17 2, 60
5 1 0, 80 - 2 0,75 0,04 5 2,10 1, 55
75/171W,
Table 4.14
RESULTS OF THE DETERMINATION OF THE DIFFERENCE VALUE OF LACTATE (Incubation 72h/10°C ) WITH REGARD TO THE KEEPING
QUALITY (Taste) AND THE SEASON
Keeping June/July Aug. /Sept. - Oct. /Nov. quality in days XA s XA s XA s
n a n a n a
L 1 7 54,3 75,40 ;] 357,7 327,0 4 113,5 114,0
1 6 239, 9 29,41 21 115,8 203,8 22 74,5 177,9
2 6 32, 9 48,27 9 30,3 65,33 17 59,6 81,8
3 14 2, 3 5,49 c 16, 8 2,37 6 2,33 1, 8
4 4 3,3 2, 66 4 2,3 5, 75 17 1,82 5, 39
5 1 8, 0 - 2 -1,0 0, 94 5 0,88 0, 33
75)118 w,
Table 4.15
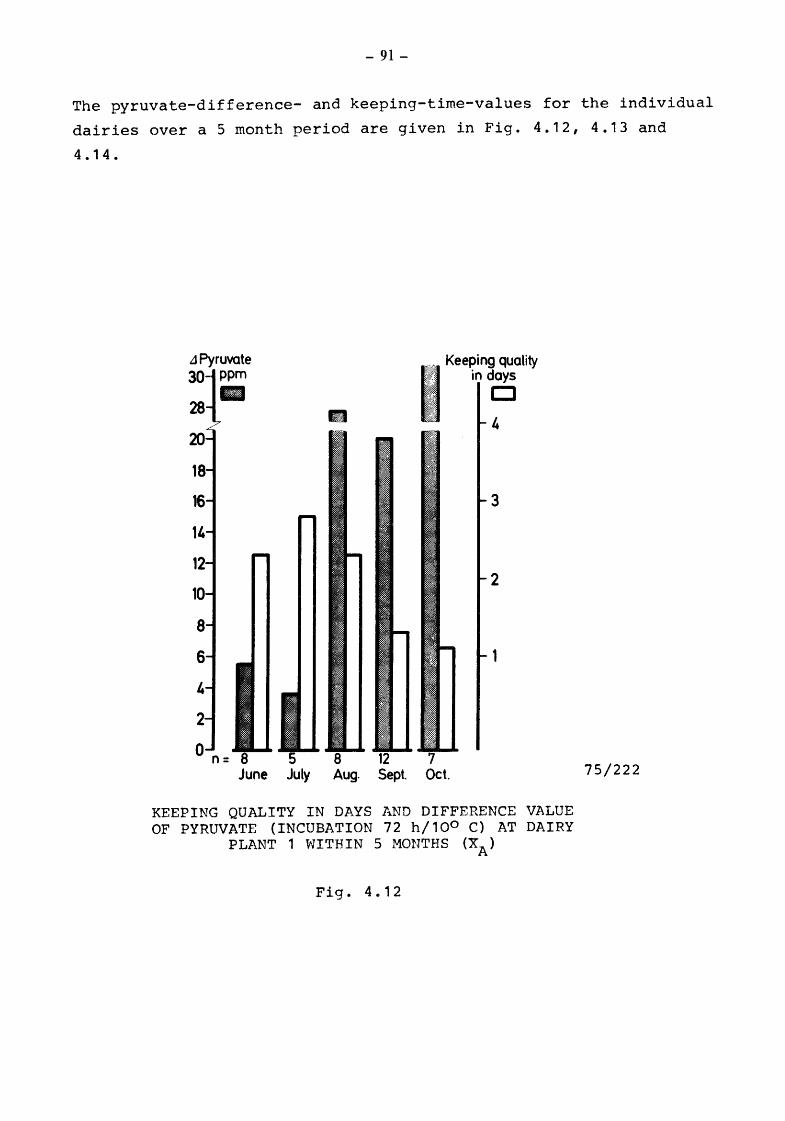
- 91-
The pyruvate-difference- and keeping-time-values for the individual
dairies over a 5 month period are given in Fig. 4.12, 4.13 and
4. 14.
JPyruvate 30 ppm
•
2
0 n =
1.1
,, Kee~ing quality
; •n des ·; 4
3
2
June July Aug. Sept. Oct.
KEEPING QUALITY IN DAYS AND DIFFERENCE VALUE OF PYRUVATE (INCUBATION 72 h/100 C) AT DAIRY
PLANT 1 WITHIN 5 MONTHS (XA)
Fig. 4. 12
75/222
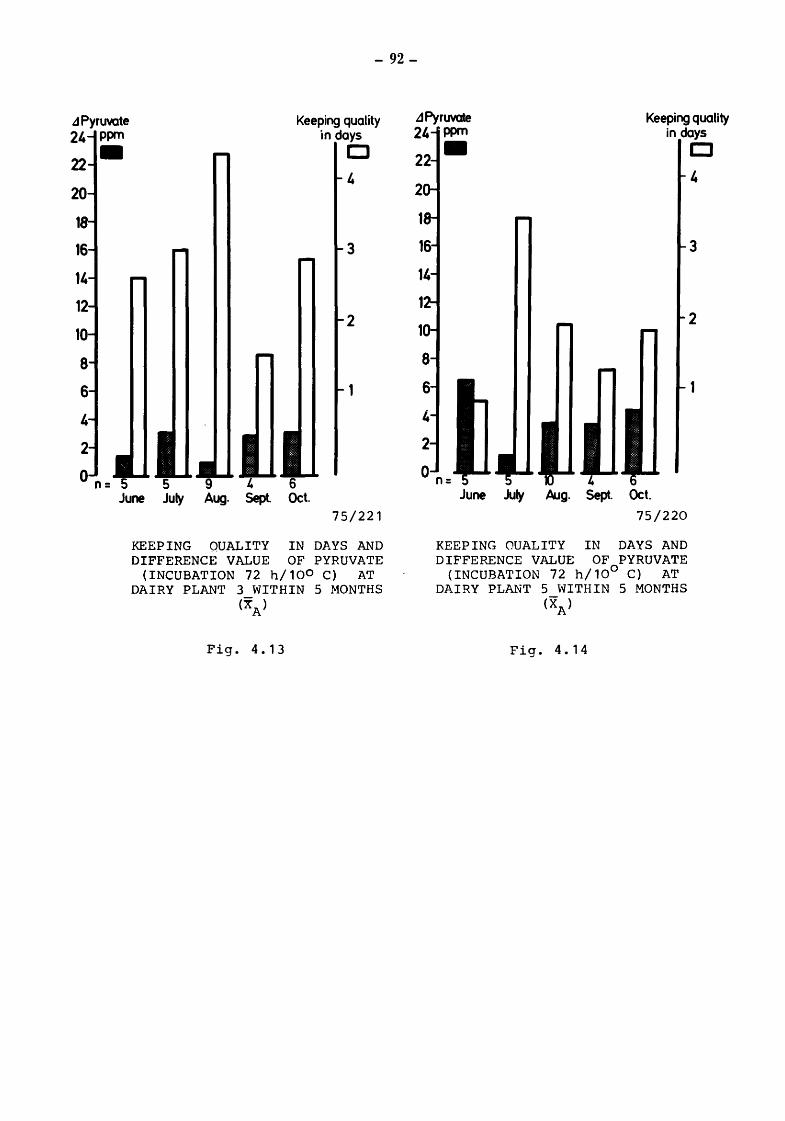
- 92-
JPyruvate Keeping quality 24 ppm in days
22 • CJ 4
20
3
14
2
0 n= June July Aug. Sept Oct.
75/221
KEEPING QUALITY IN DAYS AND DIFFERENCE VALUE OF PYRUVATE
(INCUBATION 72 h/100 C) AT DAIRY PLANT 3 WITHIN 5 MONTHS
(XA)
Fig. 4.13
.1PyrlMlte Keeping quality 24
22
2
ppm in days •
June July Aug. Sept. Oct. 75/220
KEEPING OUALITY IN DAYS AND DIFFERENCE VALUE OF PYRUVATE
(INCUBATION 72 h/10° C) AT DAIRY PLANT 5 WITHIN 5 MONTHS
(XA)
Fig. 4.14
CJ
' 3
2
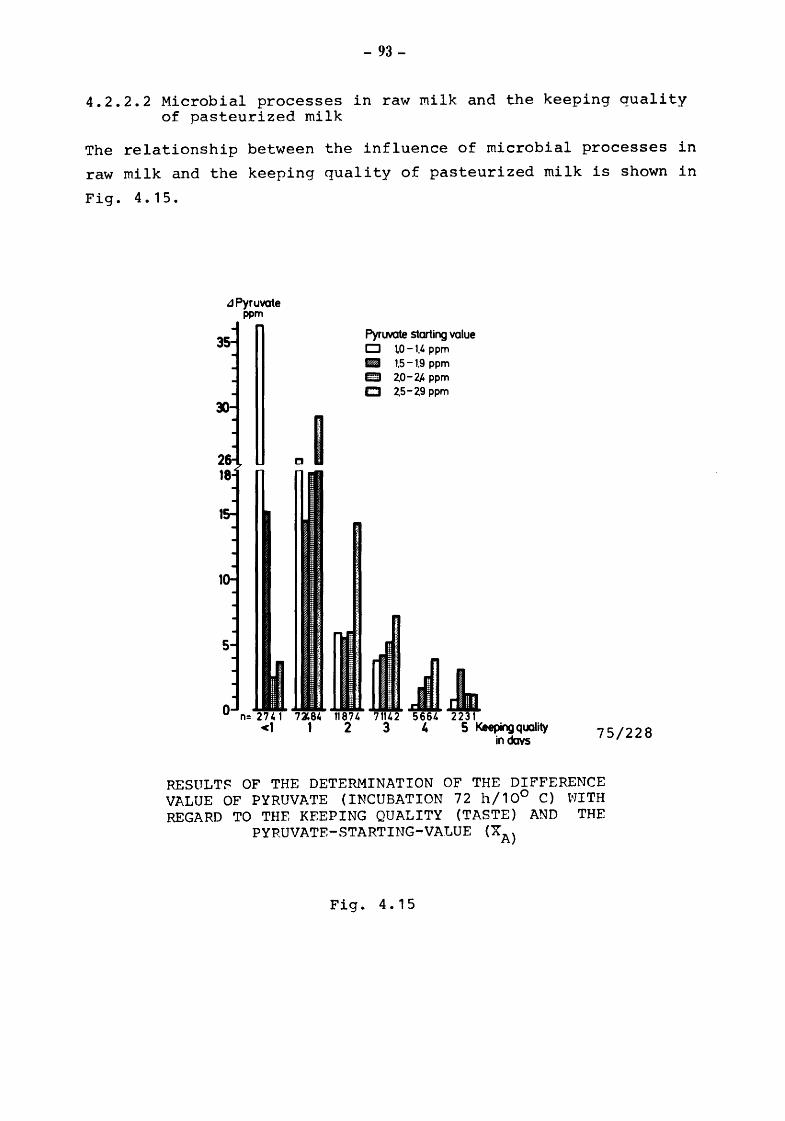
- 93-
4.2.2.2 Microbial processes in raw milk and the keeping quality of pasteurized milk
The relationship between the influence of microbial processes in
raw milk and the keeping quality of pasteurized milk is shown in
Fig. 4.15.
"Pyruvate ppm
<1 2
Pyruvate starting value CJ tO -1.4 ppm FIJ 1.5-1.9 ppm mD 2,0-2/. ppm C 2,5-2.9 ppm
A1 3 4 5 Keeping quality
in davs 75/228
RESULTS OF THE DETERMINATION OF THE DIFFERENCE VALUE OF PYRUVATE (INCUBATION 72 h/10° C) tqiTH REGARD TO THE KEEPING QUALITY (TASTE) AND THE
PYEUVATE-STARTING-VALUE (XA)
Fig. 4.15
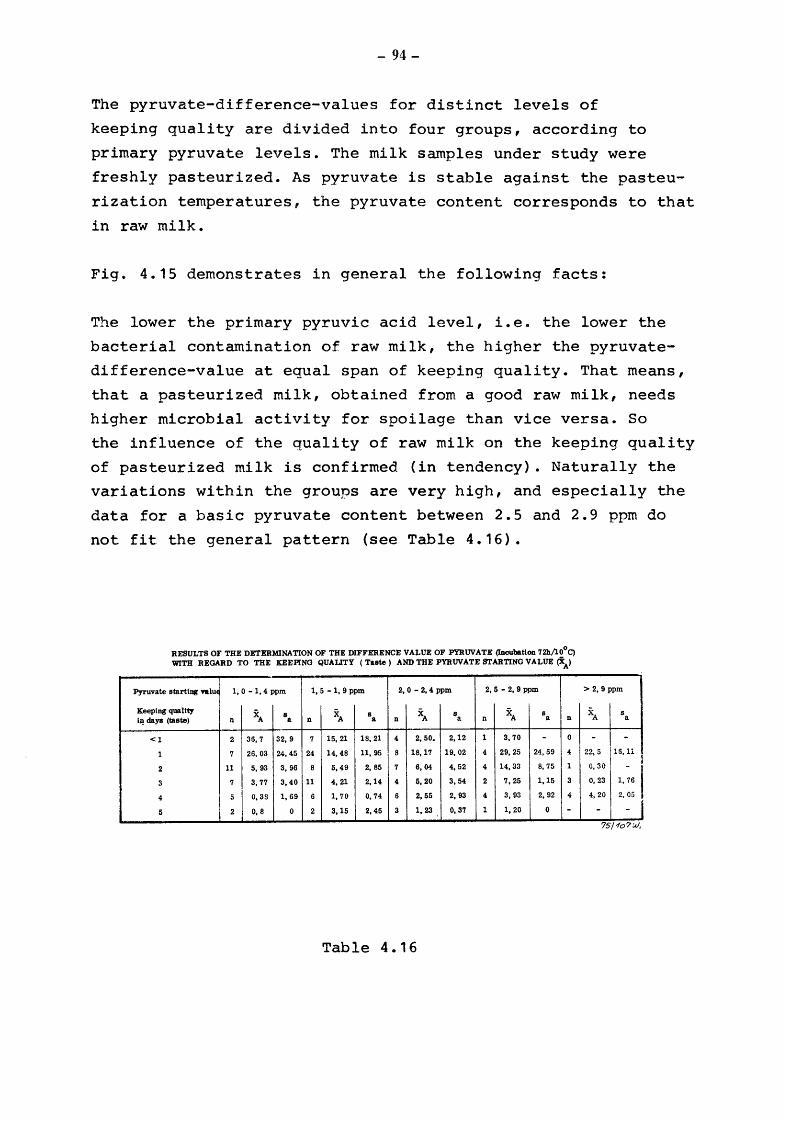
- 94-
The pyruvate-difference-values for distinct levels of
keeping quality are divided into four groups, according to
primary pyruvate levels. The milk samples under study were
freshly pasteurized. As pyruvate is stable against the pasteu
rization temperatures, the pyruvate content corresponds to that
in raw milk.
Fig. 4.15 demonstrates in general the following facts:
The lower the primary pyruvic acid level, i.e. the lower the
bacterial contamination of raw milk, the higher the pyruvate
difference-value at equal span of keeping quality. That means,
that a pasteurized milk, obtained from a good raw milk, needs
higher microbial activity for spoilage than vice versa. So
the influence of the quality of raw milk on the keeping quality
of pasteurized milk is confirmed (in tendency). Naturally the
variations within the groups are very high, and especially the
data for a basic pyruvate content between 2.5 and 2.9 ppm do
not fit the general pattern (see Table 4.16).
RESULTS OF THE DETERMINATION OF THE DIFFERENCE VALUE OF PYRUVATE (Incubatlon 72h/l0°C) WITH REGARD TO THE KEEPING QUALITY (Taste) AND THE PYRUVATE STARTING VALUE (iA)
Pyruvate starting Yalu 1, 0 -1,4 ppm 1, 5-1,9 ppm 2,0-2,4ppm 2, 5-2,9 ppm
Keeping quality XA 8 XA 8 XA 8 XA 8
II! days (taste) n a n a n a n a n
<1 2 36,7 32,9 7 15,21 18,21 4 2,50. 2,12 1 3, 70 - 0
1 7 26,03 24,45 24 14,48 11,95 8 18,17 19,02 4 29,25 24,59 4
2 11 5, 93 3, 96 8 5,49 2, 85 7 6, 04 4, 52 4 14,33 8, 75 1
3 7 3, 77 3,40 11 4, 21 2,14 4 5, 20 3,54 2 7, 25 1,15 3
4 5 0,38 1, 69 6 1, 70 0, 74 6 2, 55 2, 93 4 3, 93 2, 92 4
5 2 0, 8 0 2 3,15 2,45 3 1, 23 0,37 1 1, 20 0 -
Table 4.16
> 2, 9 ppm
x s A a
- -22,5 16,11
l 0, 30
1.~·1 0, 23
4, 20 2, ~5 l
-75/-fo?W,

- 95-
4.2.2.3 Pyruvate-threshold-value and spoilage of pasteurized milk
Fig. 4.16 to 4.19 set out pyruvate and other metabolites of
bacterial catabolism (lactic-acid, ammonia and free fatty acids
(FFA)) with respect to the number of points in the organoleptic
evaluation (taste) of the respective milk samples.
The numerical values are compiled in Table 4.17.
16,01 Pyruvate ppm
15,0
11,0
10,0
8,0
7,0
6,0
5,0
1.,0
~0
""'""
""""
..
·~
""~'-
·~ -~
!""~ . ' ~"'
n=90 n=403 n=172 n=108 n=69 n=145 5 I. 3 2 1 0 ~~e
COMPA.RISON OF TASTE WITH THE PYRUVATE-CONCENTRATION (~ )
A
Fig. 4.16
75/173
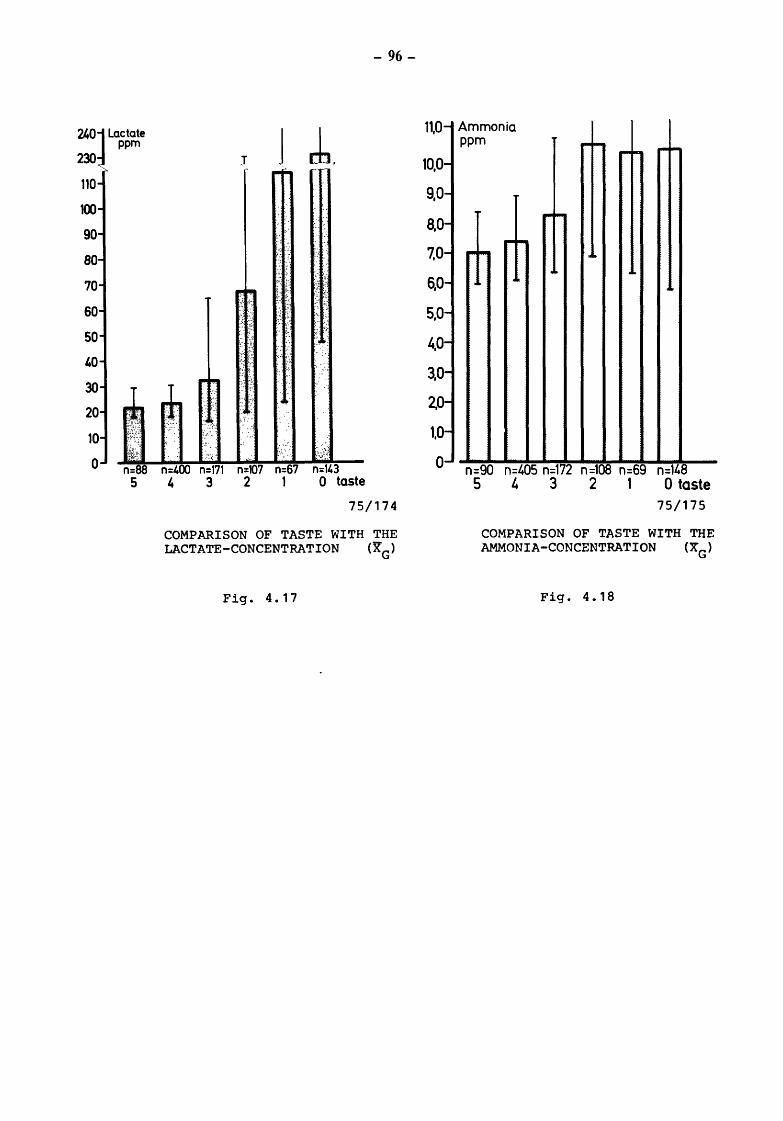
240
230
110
100
90
70
60
50
40
- 96-
75/174
COMPARISON OF TASTE WITH THE LACTATE-CONCENTRATION (~G)
Fig. 4.17
11,0
1,0
0
Ammonia ppm ""'~-'
""'""' --
"'""'" ,...~
.... ~ . ..
'
n=90 n=405 n=172 n=108 n=69 n=148 5 4 3 2 1 0 taste
75/175
COMPARISON OF TASTE WITH THE AMMONIA-CONCENTRATION (XG)
Fig. 4. 18
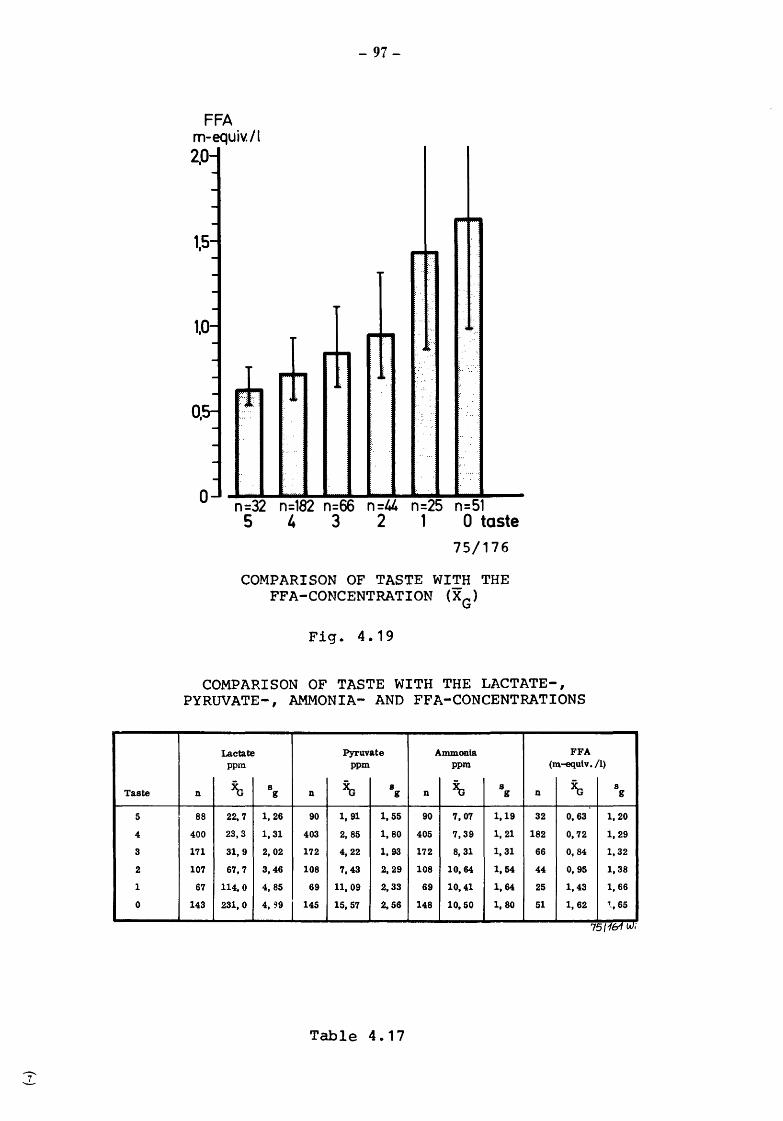
Taste
5
4
3
2
1
0
- 97-
FFA m-equiv./l 2.0
·~
.. ~. ~
-~--. . -~
~~ :. :-.:: . ~~-
n=32 n=182 n=66 n =1.4 n=25 n=51 5 4 3 2 1 0 taste
75/176
COMPARISON OF TASTE WITH THE FFA-CONCENTRATION (XG)
Fig. 4.19
COMPARISON OF TASTE WITH THE LACTATE-, PYRUVATE-, AMMONIA- AND FFA-CONCENTRATIONS
Lactate Pyruvate Ammonia FFA ppm ppm ppm (m-equlv. /1)
Xa 8 ~ 8 Xa 8 ~ 8 n g n g n g n g
88 22,7 1, 26 90 1, 91 1,55 90 7, 07 1,19 32 0, 63 1,20
400 23,3 1,31 403 2, 85 1,80 405 7,39 1, 21 182 0,72 1,29
171 31,9 2, 02 172 4,22 1, 93 172 8, 31 1, 31 66 0,84 1,32
107 67,7 3,46 108 7,43 2,29 108 10,64 1,54 44 0,95 1,38
67 114,0 4, 85 69 11,09 2,33 69 10,41 1,64 25 1,43 1,66
143 231,0 4, 99 145 15,57 2, 56 148 10,50 1, 80 51 1, 62 1-,65
75/161 Wi
Table 4.17
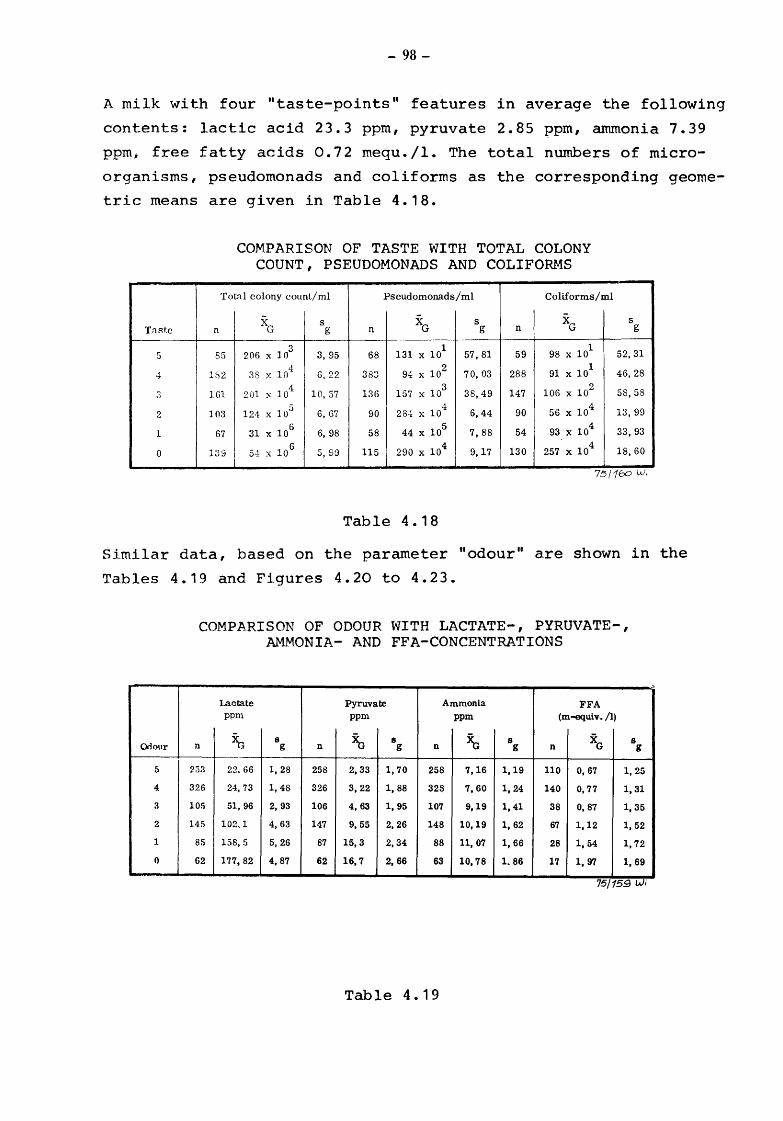
- 98-
A milk with four "taste-points" features in average the following
contents: lactic acid 23.3 ppm, pyruvate 2.85 ppm, ammonia 7.39
ppm; free fatty acids 0.72 mequ./1. The total numbers of micro
organisms, pseudomonads and coliforms as the corresponding geome
tric means are given in Table 4.18.
T:=tRte -·
5
4
,)
2
1
0
COMPARISON OF TASTE WITH TOTAL COLONY COUNT, PSEUDOMONADS AND COLIFORMS
Tot:ll colony count/ml Pseudomonads/ml Coliforms/ml
XG s XG s XG s n g n g n g
85 206 X J 03
3,95 68 131 X 101
57.81 59 98 X 101
52,31
1S2 ~s x 10 4
6, 22 383 9~ X 102
70,03 288 91 X 101
46,28
lGl 201 X 104
10, 37 136 157 X 103
38,49 147 106 X 102
58,58
103 121 X 105
6, 67 90 28-1 X 10⁴
6,44 90 56 X 104
13, 99
67 31 X 106
6, 98 58 44 X 105
7,88 54 93 X 104
33,93
1~3 ~1 5-:1: X 106
5,99 115 290 X 104
9,17 130 257. X 104 18,60
75/16o w,
Table 4.18
Similar data, based on the parameter "odour .. are shown in the
Tables 4.19 and Figures 4.20 to 4.23.
Odour
5
4
3
2
1
0
COMPARISON OF ODOUR WITH LACTATE-, PYRUVATE-, AMMONIA- AND FFA-CONCENTRATIONS
Lactate Pyruvate Ammonia FFA ppm ppm ppm (m-equiv-./1)
~ 8 ~ 8 ~ 8 XG 8 n g n g n g n g
233 22.66 1,28 258 2,33 1,70 258 7,16 1,19 110 0, 67 1,25
326 24, 73 1,48 326 3, 22 1, 88 328 7,60 1, 24 140 0, 77 1,31
105 51,96 2,93 106 4, 63 1, 95 107 9,19 1,41 38 0, 87 1, 35
145 102,1 4,63 147 9, 55 2, 26 148 10,19 1, 62 67 1,12 1, 52
85 158,5 5,26 87 15,3 2,34 88 11,07 1, 66 28 1,54 1, 72
62 177, 82 4, 87 62 16,7 2,66 63 10,78 1.86 17 1, 97 1,69
75/159 t,..J,
Table 4.19
·'
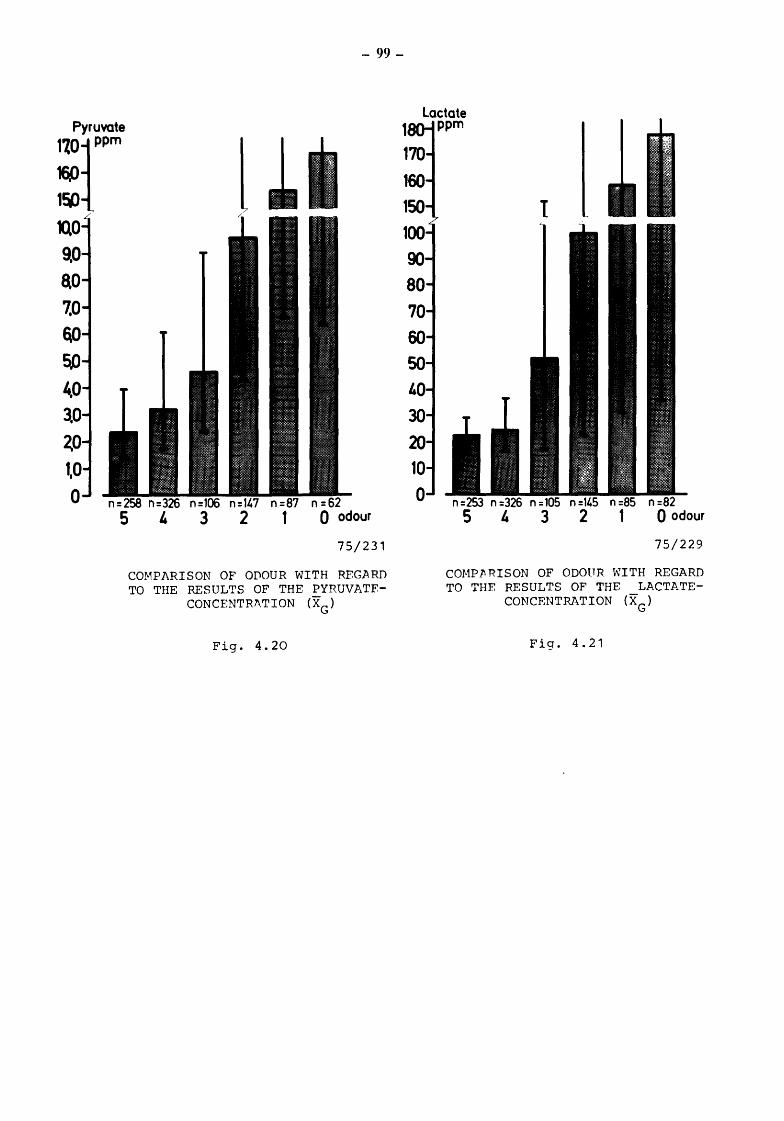
Pyruvate :rpm 1~{ 10.0
7.0 &0 5.0 4.0 3.0 2.0 1,0 0
- 99-
odour
75/231
COMPARISON OF ODOUR WITH REGARD TO THE RESULTS OF THE PYRUVATF.
CONCENTR7\TION (XG)
Fig. 4.20
1
n 0 odour
75/229
COHPJIRISON OF ODOUR WITH REGARD TO THE RESULTS OF THE LACTATE
CONCENTRATION (XG)
Fig. 4.21
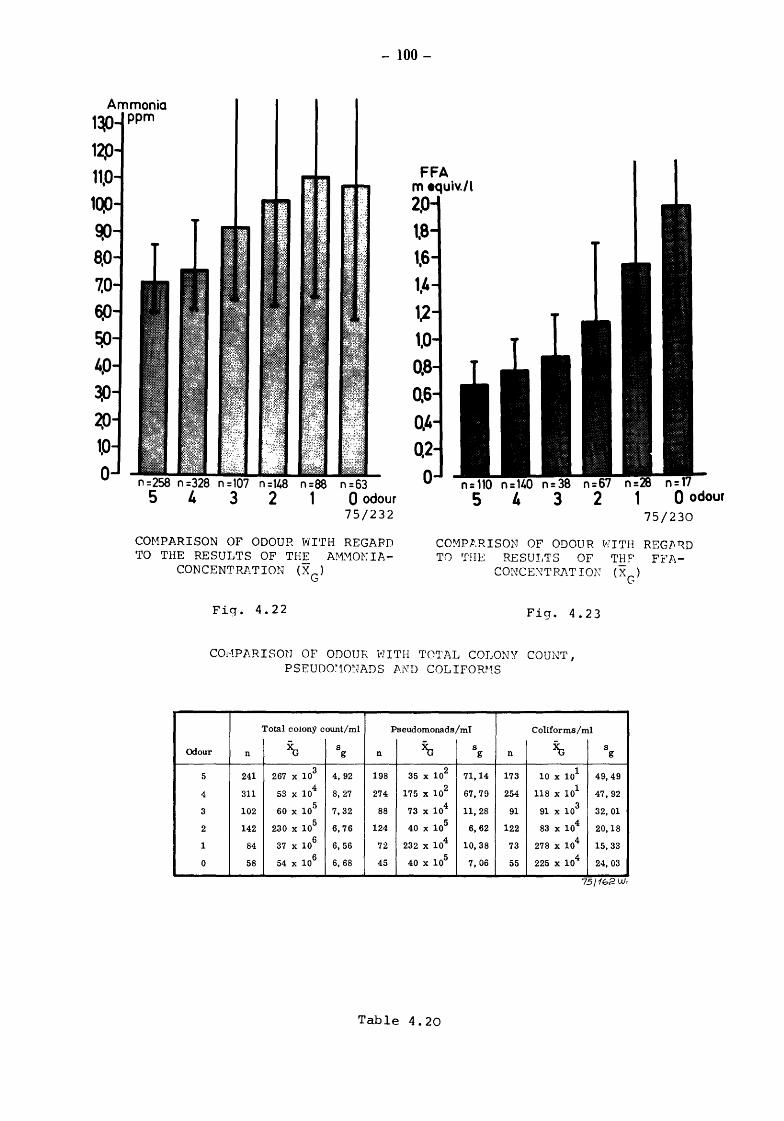
- 100-
FFA m equiv./l 2P 1,8
n =148 n =88 n =63 2 1 0 odour
75/232 75/230
COMPARISON OF ODOUR WITH REGARD •ro THE RESULTS OF THE AMMONIA
CONCENTRATION (XG)
COMPARISON OF ODOUR WITH REG~~D TO 'rHE RESULTS OF THF' FFA-
CONCET\!TRJ\.'1' ION (XG)
Fig. 4.22 Fig. 4.23
COJ-1Pl\RISOtJ OF ODOUR I•JITH TOTAL COLONY COUNT, PSEUDO:!O~JADS l'RD COLIFOR!'1S
Total colony count/ml Pseudomonads/ml Coliforms/ml
~ s ~ s ~ s Odour n g n g n g
5 241 267 X 103 4, 92 198 35 X 102 71,14 173 10 X 10
1 49,49
4 311 53 X 104
8, 27 274 175 X 102 67,79 254 118 X 101
47,92
3 102 60 X 105
7,32 88 73 X 104 11,28 91 91 X 103
32,01
2 142 230 X 105 6, 76 124 40 X 105 6, 62 122 83 X 104 20,18
1 84 37 X 106
6,56 72 232 X 104 10,38 73 278 X 104 15,33
0 58 54 X 106 6,68 45 40 X 105 7, 06 55 225 X 104 24,03
75}162 Wr
Table 4. 20
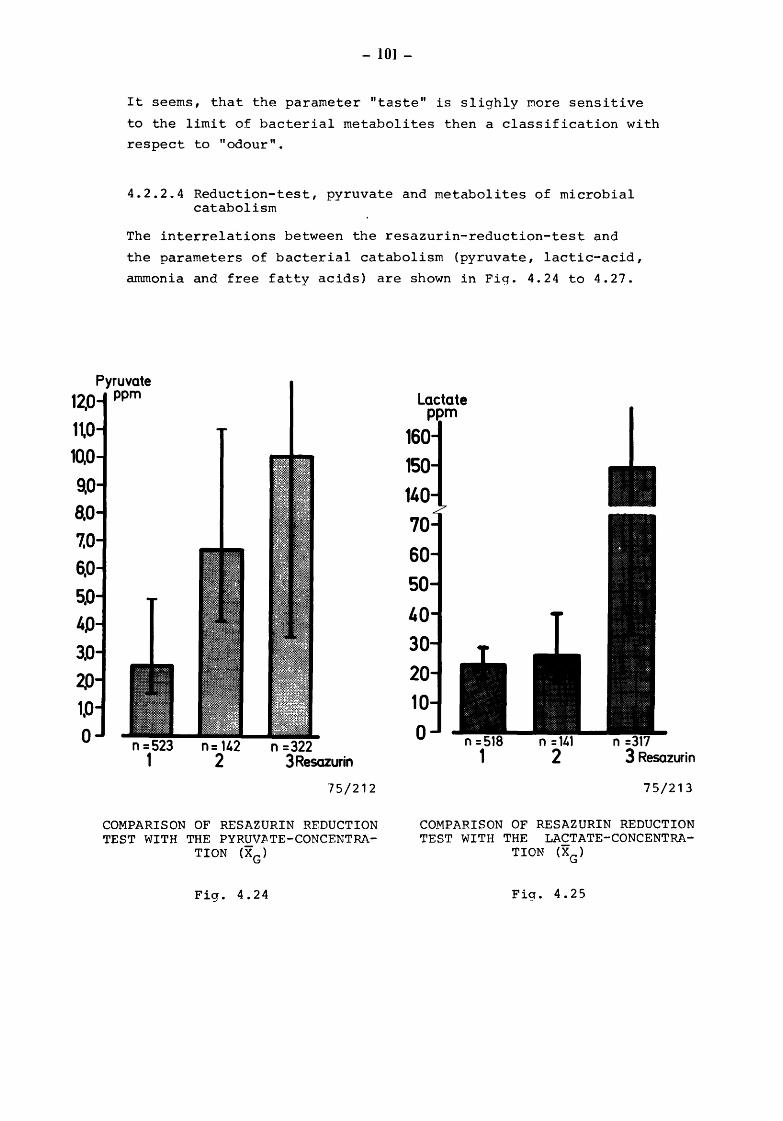
- 101-
It seems, that the parameter "taste" is slighly :more sensitive
to the limit of bacterial metabolites then a classification with
respect to "odour".
4.2.2.4 Reduction-test, pyruvate and metabolites of microbial catabolism
The interrelations between the resazurin-reduction-test and
the parameters of bacterial catabolism (pyruvate, lactic-acid,
ammonia and free fatty acids) are shown in Fig. 4.24 to 4.27.
Pyruvate 12,0 ppm
1\0 10.0
9.0 8,0
3.0
2P 1,0 0 n =523 n= 142
1 2 n =322
3Resazurin
75/212
COMPARISON OF RESAZURIN REDUCTION TEST WITH THE PYRUV~TE-CONCENTRA
TION (XG)
Fig. 4.24
140 70 60 50
40 30 20 10 0
75/213
COMPARISON OF RESAZURIN REDUCTION TEST WITH THE LACTATE-CONCENTRA
TION (XG)
Fig. 4. 25
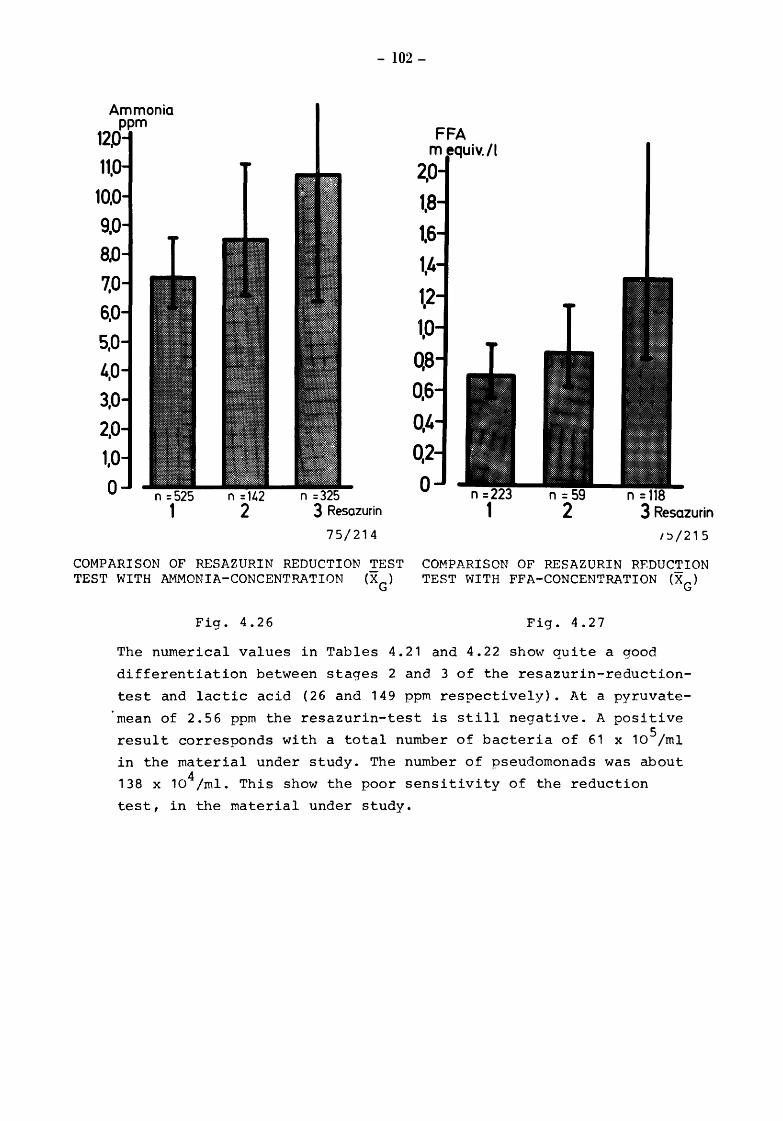
- 102-
Ammonia ppm
12.0
10.0 9,0
8.0 7.0 6.0 s.o 4,0
3,0
2.0 1,0
0 n = 3 Resazurin
75/214
COMPARISON OF RESAZURIN REDUCTION TEST TEST WITH AMMONIA-CONCENTRATION (XG)
Fig. 4. 2 6
FFA m equiv./t
2.0
1,4
1,2 1,0
QB 0.6 0,4 0,2 0
n = 3 Resazurin
1!:>/215
COMPARISON OF RESAZURIN RF.DUCTION TEST WITH FFA-CONCENTRATION (XG)
Fig. 4.27
The numerical values in Tables 4.21 and 4.22 show quite a good
differentiation between stages 2 and 3 of the resazurin-reduction
test and lactic acid (26 and 149 ppm respectively). At a pyruvate-
'rnean of 2.56 ppm the resazurin-test is still negative. A positive
result corresponds with a total number of bacteria of 61 x 10 5/rnl
in the material under study. The number of pseudomonads was about
138 x 104/ml. This show the poor sensitivity of the reduction
test, in the material under study.
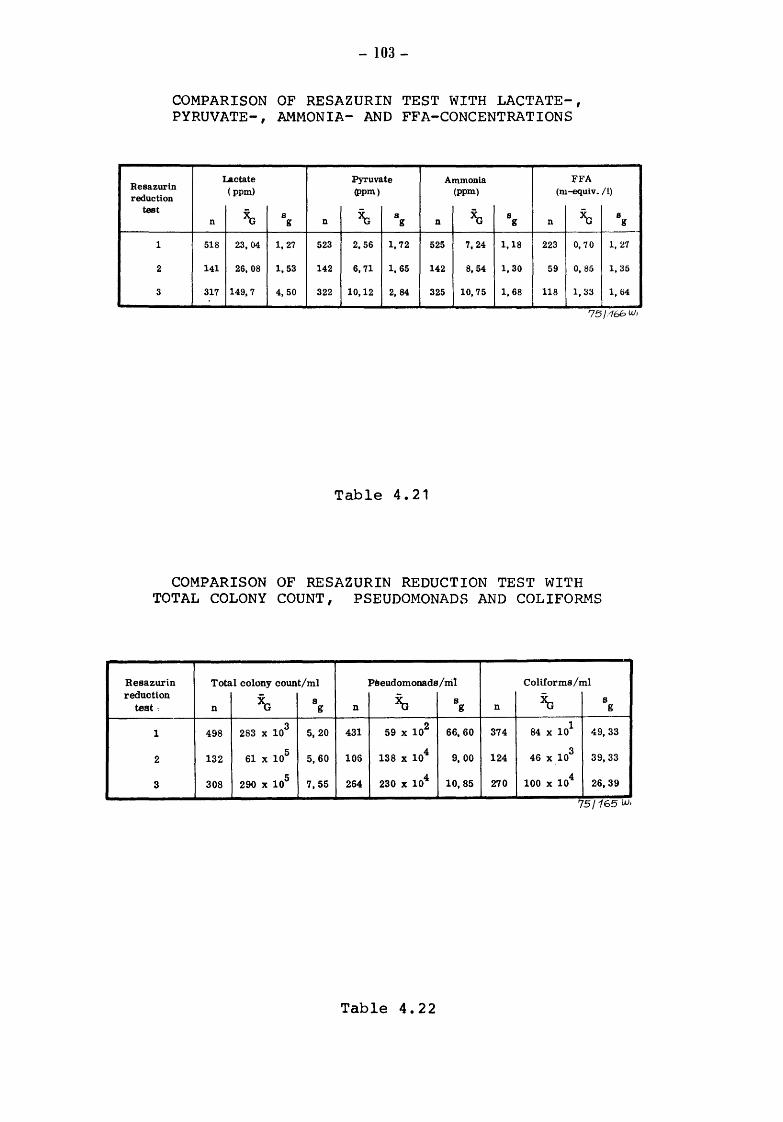
- 103-
COMPARISON OF RESAZURIN TEST WITH LACTATE-, PYRUVATE-, AMMONIA- AND FFA-CONCENTRATIONS
Lactate Pyruvate Ammonia Ji'FA Resazurin (ppm) (ppm) (ppm) (m-equiv./1) reduction
test ~ s ~ ~ 8 ~ 8 8 n g n g n g n g
1 518 23,04 1, 27 523 2, 56 1,72 525 7, 24 1,18 223 0, 70 1, 27
2 141 26,08 1,53 142 6,71 1,65 142 8, 54 1,30 59 0, 85 1,35
3 317 149,7 4, 50 322 10,12 2, 84 325 10,75 1,68 118 1,33 1, 64
75j.1bbW,
Table 4.21
COMPARISON OF RESAZURIN REDUCTION TEST WITH TOTAL COLONY COUNT, PSEUDOMONADS AND COLIFORMS
Resazurin Total colony count/ml Pseudomonads/Iril Coliforms/ml reduction
~ s ~ s ~ s teat c n g n g n g
1 498 283 X 103
5,20 431 59 X 102
66,60 374 84 X 101
49,33
2 132 61 X 105
5,60 106 138 X 104
9, 00 124 46 X 103
39,33
3 308 290 X 105
7,55 264 230 X 104
10,85 270 100 X 104
26,39
75/165 w,
Table 4.22
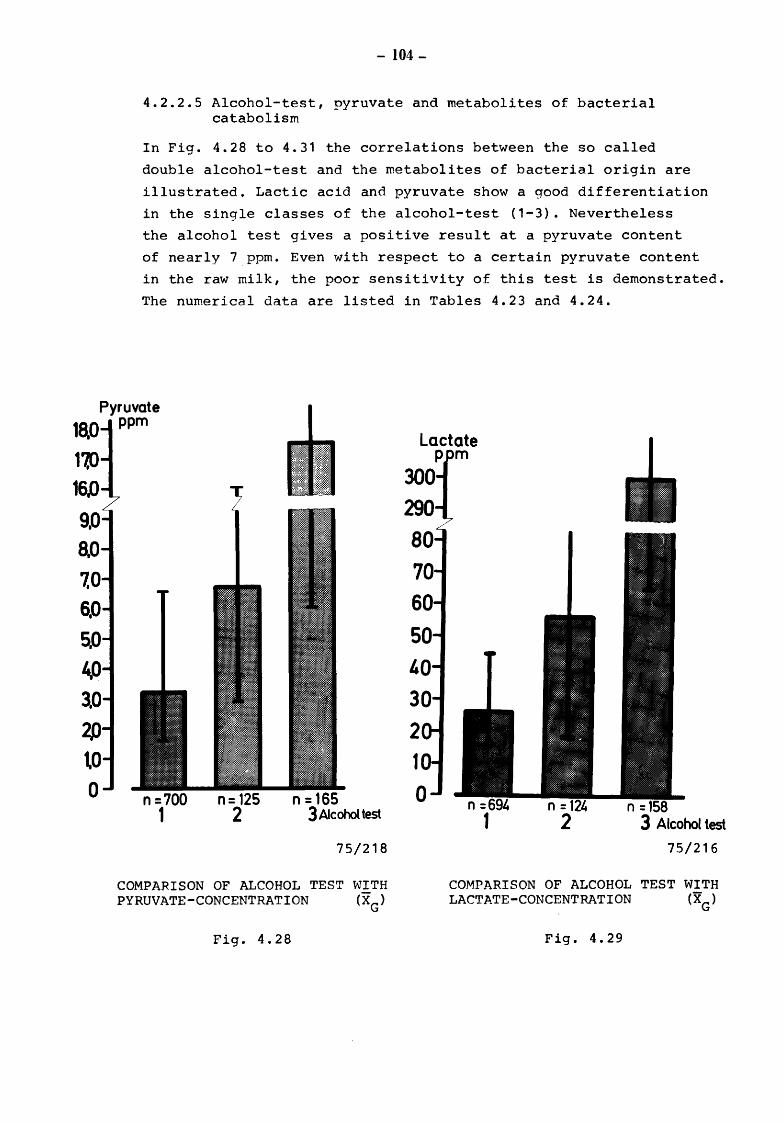
- 104-
4.2.2.5 Alcohol-test, pyruvate and metabolites of bacterial catabolism
In Fig. 4.28 to 4.31 the correlations between the so called
double alcohol-test and the metabolites of bacterial origin are
illustrated. Lactic acid and pyruvate show a good differentiation
in the single classes of the alcohol-test (1-3). Nevertheless
the alcohol test gives a positive result at a pyruvate content
of nearly 7 ppm. Even with respect to a certain pyruvate content
in the raw milk, the poor sensitivity of this test is demonstrated.
The numerical data are listed in Tables 4.23 and 4.24.
Pyruvate 18,0 ppm
Lactate p m 17.0
16.0
9,0 ao 7.0 6,0
0 n=700 1
n= 125 2
n = 165 3 Alcohol test
75/218
COMPAHISON OF ALCOHOL TEST \oJITH PYRUVATE-CONCENTRATION (XG)
Fig. 4.28
300 290
2 1
75/216
COMPARISON OF ALCOHOL TEST WITH LACTATE-CONCENTRATION (XG)
Fig. 4. 29
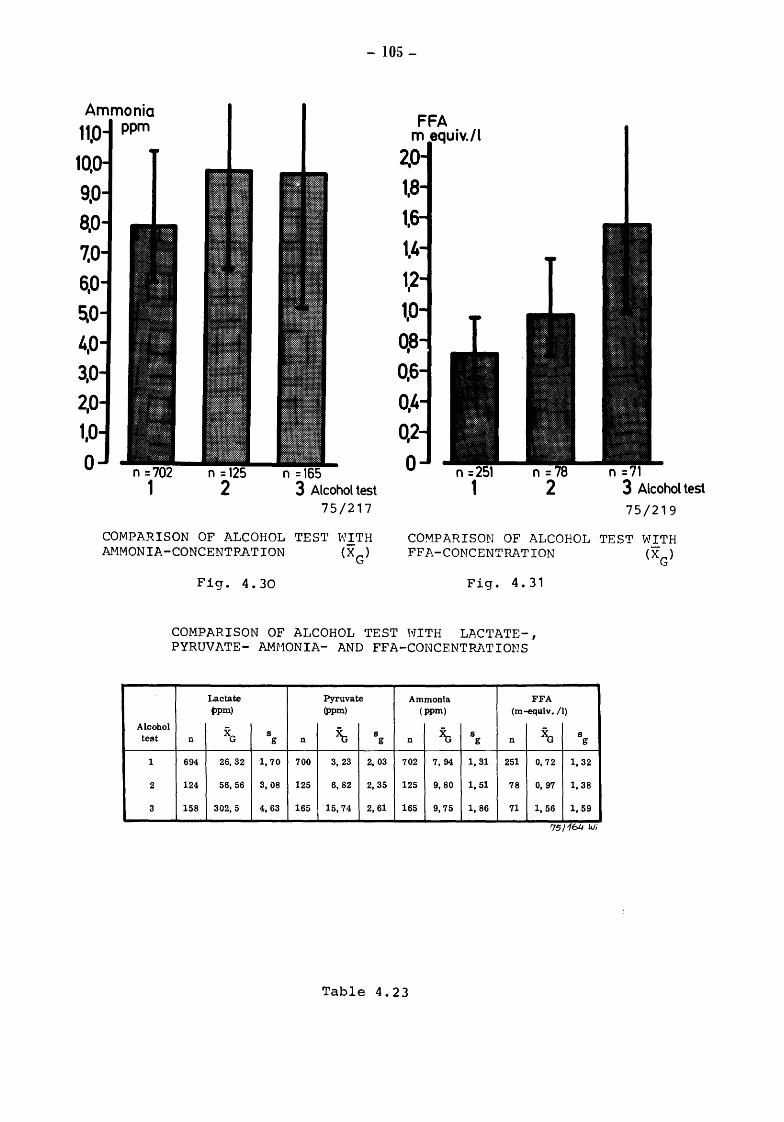
- 105-
FFA m equiv./l
2.0
n = n = 3 Alcohol test 3 Alcohol test
75/217 75/219
COMPARISON OF ALCOHOL TEST l~.riTH COMPARISON OF ALCOHOL TEST WITH M1MONIA-CONCENTPATION (XG) FFA-CONCENTRATION {XG)
Alcohol test
1
2
3
Fig. 4.30 Fig. 4.31
COMPARISON OF ALCOHOL TEST WITH LACTATE-, PYRUVATE- AMHONIA- AND FFA-CONCENTRATIONS
Lactate Pyruvate Ammonla FFA ppm) (ppm) (ppm) (m -equiv. /1)
XG ~ ~ ~ s 8 8 n g n g n g n
694 26,32 l, 70 700 3, 23 2, 03 702 7, 94 1,31 251 0, 72
124 56,56 3,08 125 6, 82 2,35 125 9, 80 1, 51 78 0, 97
158 302,5 4,63 165 15,74 2, 61 165 9, 75 1, 86 71 1, 56
8 g
1,32
1, 38
1, 59
?5/164 w,
Table 4.23
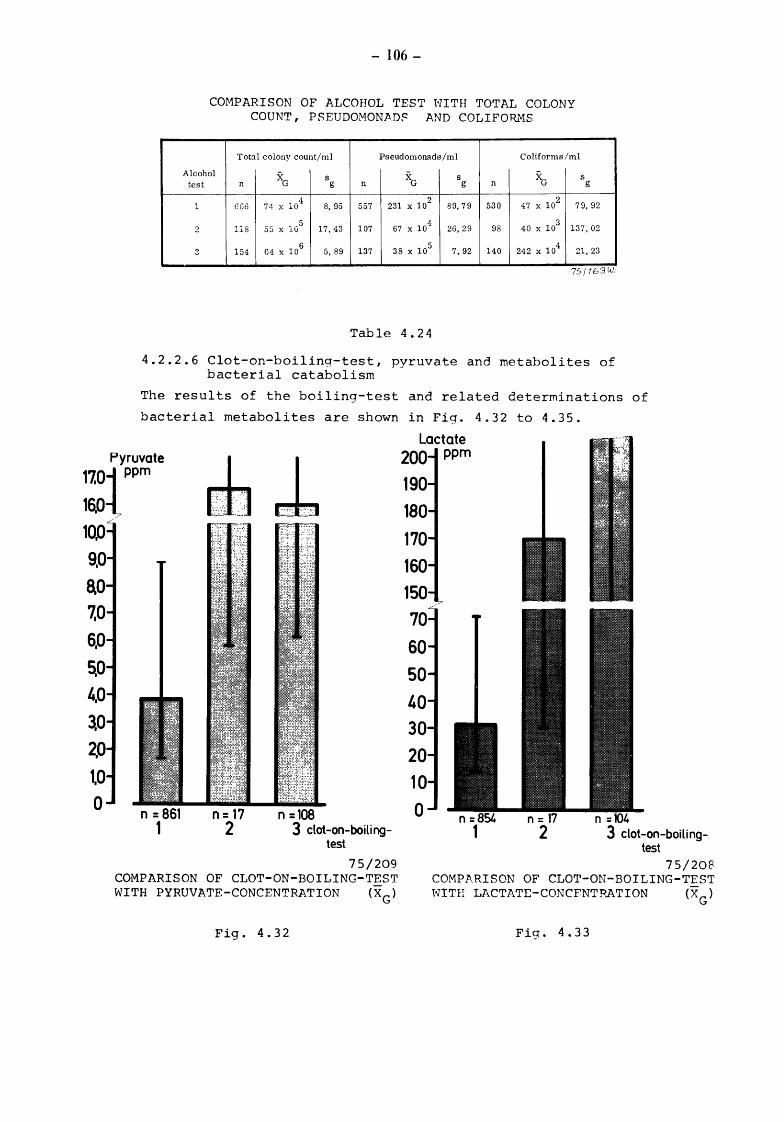
- 106-
COMPARISON OF ALCOHOL TEST WITH TOTAL COLONY COUNT, P SEUDOMONJ\D~ AND COLIFOR1'1S
Total colony count/ml Pseudomonads/ml Coliforms/ml
Alcohol XG s XG 8 XG s test n g n g n g
1 loGG 74 X 104
8, 95 557 231 X 102
89,79 530 47 X 102
79, 92
2 l:i.8 55 X 105
17,43 107 67 X 104
26,29 98 40 X 103
137, 02
3 154 G4 X 106
5, 89 137 38 X 105
7, 92 140 242 X 104 21,23
75/1b3W,
Table 4. 24
4.2.2.6 Clot-on-boiling-test, pyruvate and metabolites of bacterial catabolism
The results of the boiling-test and related determinations of
bacterial metabolites are shown
Pyruvate
in Fig. 4.32
Lactate 200 ppm
to 4.35.
17.0-J ppm 190 16.0{ 10.0 9,0
8.0 7.0 6,0
~0
4.0 ~0
2,0 1,0 0
n = 861 1
n = 17 2
n =108 3 clot-on-boiling
test
75/209 COMPARISON OF CLOT-ON-BOILING-TEST WITH PYRUVATE-CONCENTRATION (XG)
Fig. 4.32
60 50
40
0 n = 3 clot-on-boiling
test 75/208
COMPARISON OF CLOT-ON-BOILING-TEST NITH LACTATE-CONCFNTPATION (XG)
Fig. 4.33
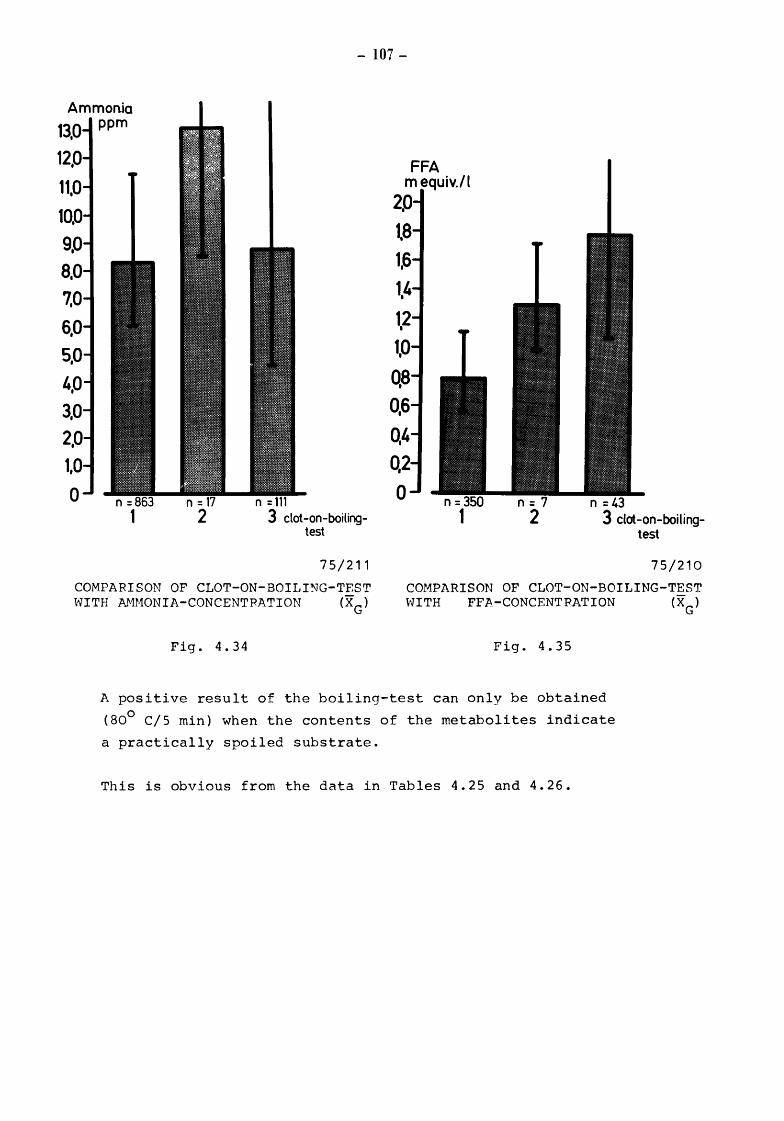
- 107-
Ammonia 13,0 ppm
12,0
11,0
10.0 9,0 8,0
7.0
6,0
5,0
0 n = 1 3 clot -on-boiling
test
75/211
COMPARISON OF CLOT-ON-BOILING-TEST h'ITH AMHONIA-CONCENTRATION (XG)
Fig. 4.34
FFA m equiv./l
2.0 1,8
n = 3 clot-on-boiling
test
75/210
COMPARISON OF CLOT-ON-BOILING-TEST vJITH FFA-CONCENTFATION (XG)
Fig. 4.35
A positive result of the boiling-test can only be obtained
(80° C/5 min) when the contents of the metabolites indicate
a practically spoiled substrate.
This is obvious from the data in Tables 4.25 and 4.26.

- 108-
COMPARISON OF THE CLOT-ON-BOILING-TEST WITH LACTATE-, PYRUVATE-, AMMONIA- AND FFA-CONCENTRATIONS
Lactate Pyruvate Ammonia FFA ppm ppm ppm (m -equiv. /1)
clot-on-boiling XG s ~ s XG s ~ s test n g n g n g n g
1 854 31,6 2, 25 861 3,85 2, 30 863 8, 32 1,38 350 0, 79 1, 40
2 17 169, 0 5,62 17 16,61 2, 85 17 13,06 1,54 7 1,30 1,32
3 104 ·142, 9 4,18 108 15,93 2, 60 111 8, 79 1, 93 43 1, 78 1,68
75f157 w,
Table 4.25
COMPARISON OF THE CLOT-ON-BOILING-TEST WITH TOTAL COLONY COUNT, PSEUDOMONADS AND COLIFORMS
Total colony count/ml Pseudomonads/ml Coliforms-/ml
clot-on-boiling ~ s ~ s XG s n g n g n g test
1 815 117 X 104
12,15 698 50 X 103 91,63 658 82 X 102 98,95
2 17 214 X 105
7, 87 13 115 X 104
8, 45 14 69 X 104 34,64
3 105 84 X 106
5,76 90 44 X 105 7, 94 95 43 X 10
5 15,38
751158 WI
Table 4.26

- 109 -
5. Discussion and summary of chapters 3. and 4. (TOLLE and HEESCHEN)
Because of its complex composition and high water activity milk
is a sheer ideal growth medium for bacteria the catabolic processes
of which in the substrate may be summarized as glycolysis, proteo
lysis, and lipolysis. In the foreground of discussions held up to
the twenties of this century about the assessment of saprophytic
bacterial contamination of milk were the morphologic criteria such
as the number of colony-forming units. Due to the sources of errors
involved and the required material in plate cultures, reduction
tests have then succeeded later in the thirties in order to measure
the glycolytic changes occurring in the substrate. The gram-posi
tive lactic acid formers developing in insuffiently cooled or
uncooled milk, indicated by such reduction tests, even have a
certain protective function due to the suppression of the gram
negative flora with its undesirable processes of lipolytic and
proteolytic degradation. Thus, to a certain extent, reduction tests
point to microorganisms which are not absolutely undesirable from
the hygienic point of view.
Today in the EEC member countries, milk is mechanically refrigera
ted, though to a different extent, seen on the whole however, to
a considerable degree. Refrigeration involves the development of
psychrotrophic organisms which cannot be determined by means of
reduction tests; these organisms, however, initiate undesired
catabolic processes such as gram-positive lactic acid formers.
Hence, this evolution involves the principal question
whether
1. colony counts technically improved (e.g. in form of the
plate/loop procedure, the automated preparation of dilution
plates, mechanization of the counting process by electronic
microcolony counting or the computer image analysis of plate
cultures) should be resumed or
wether
2. parameters others than morphological ones, such as biochemical
parameters, would supply better evidence and be more practicable.

- 110-
The present expertise deals with the question whether pyruvate -
the salt of pyruvic acid as a central parameter of microbial
metabolism would be suitable to describe the saprophytic
bacteriological contamination of milk and to give indications
as to the keeping quality of milk after heat-treatment.
After representation of the biochemical principles of microbial
catabolism, a model scheme is described to explain and to inter
pret the extracellular accumulation of pyruvate. According to
this model scheme, a systematic accumulation of pyruvate in milk
takes place in dependence on number and activity of the microor
ganisms present, and the amount of pyruvate released by the cell
may be looked upon as a direct "parameter of activity". Automated
or manual procedures may be used to measure the pyruvate pool in
milk. For the automated procedure in the continuous flow analysis
it is recommended to use the colorimetric process with blanks
since this is in accordance also with the manual procedure.
The enzymatic determination of pyruvate is of high specifity.
Since pyruvate is a substance dissolved in milk, sampling for it
is facilitated as compared with that for bacterial counting, and
this with reference to the representativeness of sampling as well
as to errors of displacement of values. Samples for fixation of
the pyruvate pool may be preserved by formaldehyde for a period
of up to 24 hours, prolonged fixation of the pyruvate pool may
be made by the addition of perchloric acid or trichloracetic
acid. The physiologic pyruvate values in milk do not exceed 0.5
ppm in case of the black-pied lowland cattle. Any excess of this
value is exclusively due to bacterial activity. As a thermostable
substance pyruvate endures pasteurization without being destroyed,
and thus it is possible to record a continuously additive picture
of the bacteriological quality of milk from production till con
sumption.
The correlations between pyruvate pool and bacterial activity of
saprophytic bacteria were studied in extensive time series by
using pure cultures of the most different species. All micro
organisms present in milk are practically able to produce pyruvate.
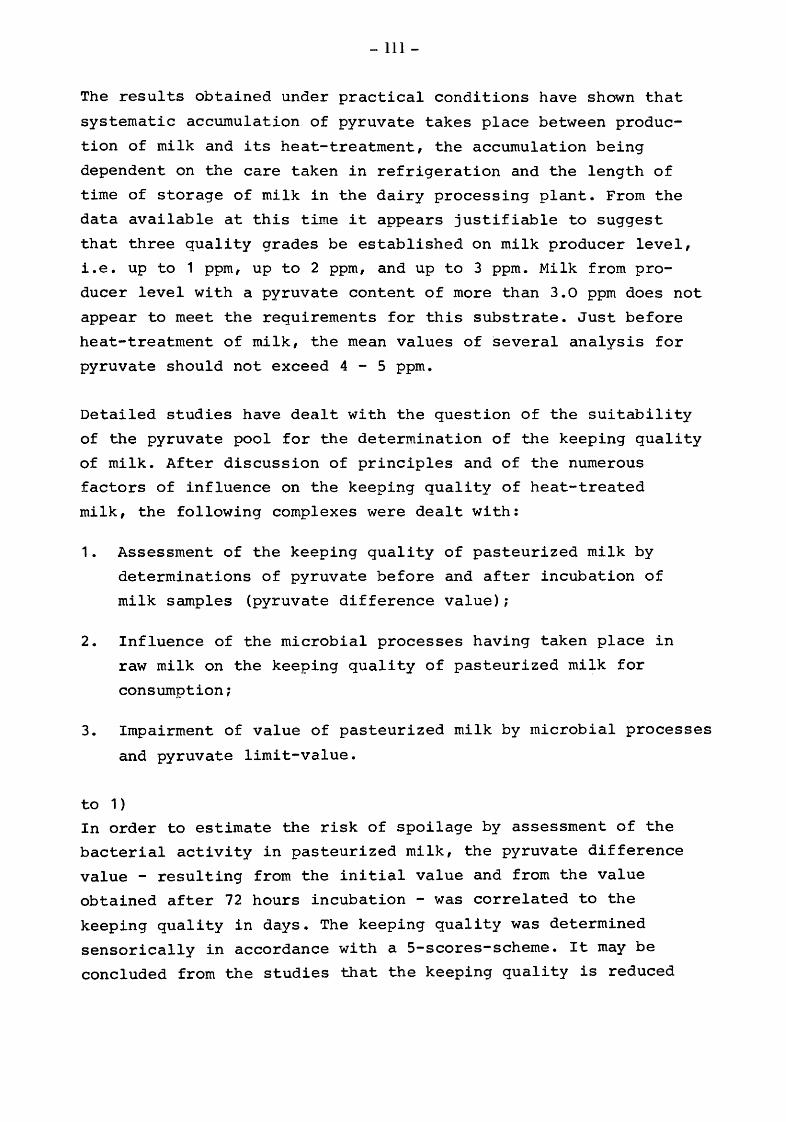
- Ill-
The results obtained under practical conditions have shown that
systematic accumulation of pyruvate takes place between produc
tion of milk and its heat-treatment, the accumulation being
dependent on the care taken in refrigeration and the length of
time of storage of milk in the dairy processing plant. From the
data available at this time it appears justifiable to suggest
that three quality grades be established on milk producer level,
i.e. up to 1 ppm, up to 2 ppm, and up to 3 ppm. Milk from pro
ducer level with a pyruvate content of more than 3.0 ppm does not
appear to meet the requirements for this substrate. Just before
heat-treatment of milk, the mean values of several analysis for
pyruvate should not exceed 4 - 5 ppm.
Detailed studies have dealt with the question of the suitability
of the pyruvate pool for the determination of the keeping quality
of milk. After discussion of principles and of the numerous
factors of influence on the keeping quality of heat-treated
milk, the following complexes were dealt with:
1. Assessment of the keeping quality of pasteurized milk by
determinations of pyruvate before and after incubation of
milk samples (pyruvate difference value};
2. Influence of the microbial processes having taken place in
raw milk on the keeping quality of pasteurized milk for
consumption;
3. Impairment of value of pasteurized milk by microbial processes
and pyruvate limit-value.
to 1}
In order to estimate the risk of spoilage by assessment of the
bacterial activity in pasteurized milk, the pyruvate difference
value - resulting from the initial value and from the value
obtained after 72 hours incubation - was correlated to the
keeping quality in days. The keeping quality was determined
sensorically in accordance with a 5-scores-scheme. It may be
concluded from the studies that the keeping quality is reduced
- 112-
with increasing pyruvate difference value, i.e. with increasing
bacterial activity. Thus, a keeping quality of only one day and
a mean pyruvate difference value of 19.2 ppm contrasts with a
keeping quality of 5 days and a pyruvate difference value of
1.6 ppm.
to 2)
As regards the question a.f the influence of microbial processes
in raw milk on the keeping quality of pasteurized milk, samples
were taken from a dairy; the pyruvate difference values were
determined and the samples divided into 3 groups according to
their initial pyruvate values. Due to the heat stability of
pyruvate towards pasteurization, the initial pyruvate value of
freshly pasteurized milk samples is in accordance with that of
the raw milk taken for pasteurization. It is clear from the
analysis of the results that 16 % of the milk samples with an
initial pyruvate value of below 1.5 ppm have a keeping quality
of more than 4 days, whereas at higher initial values only
10 % and 3 % respectively of the samples will reach this keeping
quality of more than 4 days. Thus, the number of samples with
a keeping quality of more than 4 days will be the lower, the
higher was the microbial contamination of the raw milk.
to 3)
Putting into correlation the scores of sensoric grading of
pasteurized milk with the respective pyruvate values will result
in a good graduation within the scheme of scores from 1 - 5. The
full number of scores (5) in flavour grading is in accordance
with an average pyruvate content of 1.9 ppm. If not more than
3 scores are attributed to a pasteurized milk, which is thus
clearly reduced in value, this corresponds with an average
pyruvate value of 4.2 ppm. In the case of pyruvate values of
8 ppm and more, the sensoric properties are adversely affected
to an extent that the milk in question is no longer suitable
for consumption. Comparative studies of pyruvate values and
results of the clot-on-boiling and alcohol tests have shown
that the latter tests supply positive results not before pyruvate
- 113-
values have already characterized a substrate as clearly reduced
in value. Therefore, neither clot-on-boiling nor alcohol test are
suitable to describe the bacteriological quality of raw milk in
any phase between production and heat-treatment.
Summarizing
It may be s~id that the measurement of the pyruvate pool is
well superior to colony counting procedures, and this from
the point of view of theorical conception as well as from that
of the results of tests and studies. Pyruvate in milk is a
parameter of activity suitable for the description of the actual
microbial contamination as well as for predicting the keeping
quality of heat-treated milk. It goes without saying that such
complex and difficult problematics may not fully be dealt with
within a period of time of only one year. The results available
so far should, therefore, be interpreted to the effect that they
may be used as the basis for further common studies within the
European Community.
- 114-
6. Collaborative experiments between Institut flir Hygiene der Bundesanstalt flir Milchforschung, Kiel, and the National Institute for Research in Dairying, Shinfield (MABBIT)
6.1 Introduction
To study in more detail pyruvate levels and the factors which
might affect them in refrigerated raw milk from individual farms
and commercially pasteurized bottled milk, collaborative work
between NIRD and Kiel has been undertaken. This report describes
the experiments and results with raw and pasteurized milks sampled
and analyseo at NIRD, and preserved sa~ples sent to Kiel for
pyruvate and lactate determinations.
6. 1 • 1 Raw milks
An earlier trial had provided valuable information on the
feasibility of such collaborative studies, problems with trans
portion and preservation and, more important, data on the changes
to be expected in bacterial counts during laboratory storage at
different temperatures; for example, with many of the milks there
was no significant increase in total counts until they had been 0 stored for 4 days at 5 although the psychrotroph counts showed
an increase after 3 days. The bacteriological analyses of the
raw milks showed the diversitiy in the initial counts, the
microfloras of the milks and the changes which occurred during
storage at 5° and at 20°.
In the series to which this report refers it was therefore decided
that after the initial examination colony counts and other tests
would not be made until the fourth day of storage at 5° and,
because of the relatively good bacteriological quality of many
of the samples the storage period would be extended to 5 days.
Furthermore determination of the predominant groups of organisms
in the microfloras before and after storaqe was considered
worthwhile.
The value of dye reduction tests and colony counts on raw milks
after pre-incubation for detecting poor hygiene in production is
currently under investigation in the U.K.; samples were therefore
- 115-
also pre-incubated at 20° for 17h before applyinq bacteriological
and biochemical tests.
Determination of pyruvate usin~ a manual spectrophotometric method
were made at NIRD for comparison with the automated fluorimetric
and colorimetric methods em~loyed at Kiel.
6.1.2 Pasteurized milks
The object of this trial, concerning bottled pasteurized milk from
three local dairies, was to deterroine whether increases in pyruvate
( ~ pyruvate) values during storage of the milks at 10° for 2 days
(48±1h), for example, could measure or indeed predict any
deterioration in the bacteriological quality of the milks at this
temperature, the quality being judged by increases in total and
psychrotrophic counts.
Based upon previous reports (Thomas, 1969; Page 90 of this report)
it has been assumed that pasteurized milk in which the bacterial
count has reached ~106 /ml is unacceptable because of the risk of
taints or other defects of bacterial origin.
Preserved samples of the bottles milks were analysed for pyruvate
in Kiel by both the automated fluorimetric and colorimetric methods.
Samples were also deep-frozen for up to 6 weeks and analysed by the
automated fluorimetric method at NIRD.
6.2 Experimental Methods
6.2.1 Milk samples and pre-test storage
6.2.1.1 Raw milks
Twelve refrigerated bulk tank milks (four/week) were examined.
Three of these were from NIRD farms, the remainder from local
commercial farms, chosen for convenience in collectinq samples.
All the farms were on everyday collection, and the samples taken
were of mixed evening and morning milk at <7°. After at least two

- 116-
minutes agitation of the bulk tank milk, a SOOml sample was taken
into a sterile bottle using a dipper, then transported to the NIRD
in an insulated box at refrigeration temperature.
On arrival in the laboratory, SOml milk was placed in a sterile 0 bottle and stored in iced water for subsequent incubation at 20
for 17h. Another 60ml was removed and stored in iced water, to
be used for the initial plating, pyruvate determination, and for
the somatic cell count. A sediment test was carried out. The
remaining milk was placed in a sterile flask and transferred to
an incubator at 5°± 1°, to be reexamined bacteriologically and
for pyruvate after storage for 4 and 5 days. For transport to
Kiel for pyruvate and lactate determinations, 4ml milk was
placed in a labelled plastic tube and an equal volume of 1M
perchloric acid was added.
6.2.1.2 Pasteurized milks
Thirty bottles of milk at the point of 11 door-step 11 delivery,
10 from each dairy, were tested. The samples from dairies A and
C had been cold-stored for 24h and those from dairy B for 48h
after pasteurization.
After refrigerated transport to NIRD and the initial plating,
portions were deep-frozen for subsequent pyruvate determination.
The milks were stored at 10° and were re-examined after 2,3 and
4 days. Milks, initially and after 2d at 10° were despatched to
Kiel for pyruvate determinations; 4ml-samples in labelled
plastic tubes were preserved by the addition of 2ml of 10%
trichloracetic acid.
6.2.2 Bacteriological analyses (Ministry of Agriculture, Fisheries & Food, 1968)
The following bacteriological tests as indicated were carried out . 0 0 0 0 on the samples init1ally, after storage at 5 ± 1 or 10 + 1 ,
and after incubation at 20°. The pour plate method and serial
dilutions made in quarter strength Ringer's solution were used
for all colony counts.
- 117-
6.2.2.1 Total Count (TC)
Plate Count Agar (PCA) was used, and the plates (in duplicate)
were incubated at 30° + 1° for 72h.
6.2.2.2 Coli-a~rogenes (Coliform) Count (CAO)
Violet-red-bile-agar (VRBA) was used, and the plates were in-. 0 0 . cubated at 30 + 1 for 24h.
6.2.2.3 Psychrotrophic Count (PC)
PCA was used and the plates (in duplicate) were incubated at
5° + 1° for 10d.
6.2.2.4 Thermoduric Count (LPC)
Sterile test tubes, containing 10ml milk, were immersed in a
water bath at 63.5° + 0.5° for 33 min. After rapid cooling to
17° - 18° the milk was plated on PCA. The plates were dried
at 37° for 30 min to minimise the incidence of spreading colonies
and were then incubated at 30° for 3d.
6.2.2.5 Total Aerobic Spore Count (TS)
This test was not carried out on the milks incubated at 20° for
17h. 4ml milk in a small sterile screw cap bottle were immersed 0 0 in water at 80 ~ 0.5 for 10 min, then cooled, plated on PCA,
dried as above and incubated at 30° for 3d.
6.2.2.6 Streptococcal Count (SSM) (NIRD Report 1971-72)
Streptococcal Selective Medium (Difco Brain Heart Infusion Agar +
0.1% thallous acetate + 1 ppm crystal violet) was used and
duplicate plates were prepared. One set of plates was incubated
at 30° for 3d to detect mastits and faecal streptococci. The
other set was incubated at 45° for 3d (in plastic bags) to
detect faecal streptococci only.
- 118 -
6.2.2.7 Resazurin Test (Hygiene Test for England and Wales)
The initial but not the stored samples were refrigerated for
24h prior to testing. Disc readings+) were taken after 2 and
2 1/2 h incubation at 37°. The milks were then examined half
hourly until reduction was complete or read again after 6h.
+) 6 = lilac blue; 0 = colourless; 1/2 = partial decolorization
6.2.2.8 Methylene Blue (MB) Test (Statutory test for consumer milk in England and Wales)
After pre-incubation at 18° for 18h, 10ml milk with MB added
is incubated at 37°; MB reduction within half-an-hour constitutes
a failure.
6.2.2.9 Alcohol Precipitation Test (APT)
One ml milk was added to 1ml reagent (68% alcohol + 0.01%
bromo-cresol-purple); the mixture was examined for precipitation
and acid. Absence of precipitation was recorded as a negative
result.
6.2.3 Somatic cell counts
All counts were determined using a Coulter Counter model F, and
the IDF (1971) method.
6.2.4 Examination of microfloras
Colonies were picked for identification from the TC plates of the
initial samples, the samples held at 5° for Sd and the samples
incubated at 20° for 17h.
Ten colonies, chosen at random, were picked off into Yeast Dextrose
Broth. After incubation at 30° for 24h, each broth was streaked
onto the surface of a dried Yeastrel Milk Agar plate; after incu
bation at 30° for 24h, the streaks were examined for purity and

- 119-
any showing mixed growth were discarded. Each culture was Gram
stained and the Gram reaction and morphology of the culture noted.
Gram-negative organisms were inoculated into MacConkey Broth (MCB)
and incubated at 30° for 48h. The catalase reaction was determined
by mixing some growth with a drop of H2o
2 on a slide. Formation
of gas bubbles was recorded as a positive reaction. These results
were used to classify the organisms into the groups shown in the
following table.
Classification of cultures isolated from TC plates
Morphology Gram Catalase McB Presumptive Groups reaction reaction
Cocci + + NA Micrococci
Cocci
Non-sporing rods
Sporing rods
Rods- or coccobacilli
Rods- or caecabacilli
+
+
+
NA = test not applicable
+
+
+
+
Biochemical analyses
Pyruvate
NA
NA
NA
+
Streptococci
Coryneforms
Spore-formers
Gram -ve rods
Coli forms
6.2.5
6.2.5.1
6.2.5.1.1
6.2.5.1.2
6.2.5.1.3
NIRD colorimetric manual method (NIRD)
Kiel colorimetric automated method (Kc)
6.2.5.2
6.2.5.2.1
Kiel and NIRD fluorimetric automated method (Kf and NIRDf)
Lactate
Kiel fluorimetric automated method
Details of these methods are given in Appendix
6.3
6.3.1
Results and discussion
Raw milks
6.3.1.1 Bacteriological results
6.3.1.1.1 Initial values
6.3.1.1.1.1 Total counts (TC)
5 The milks were of good bacteriological quality; all were<10 /ml
3 and only three exceeded 7 x 10 /ml (Table 1).
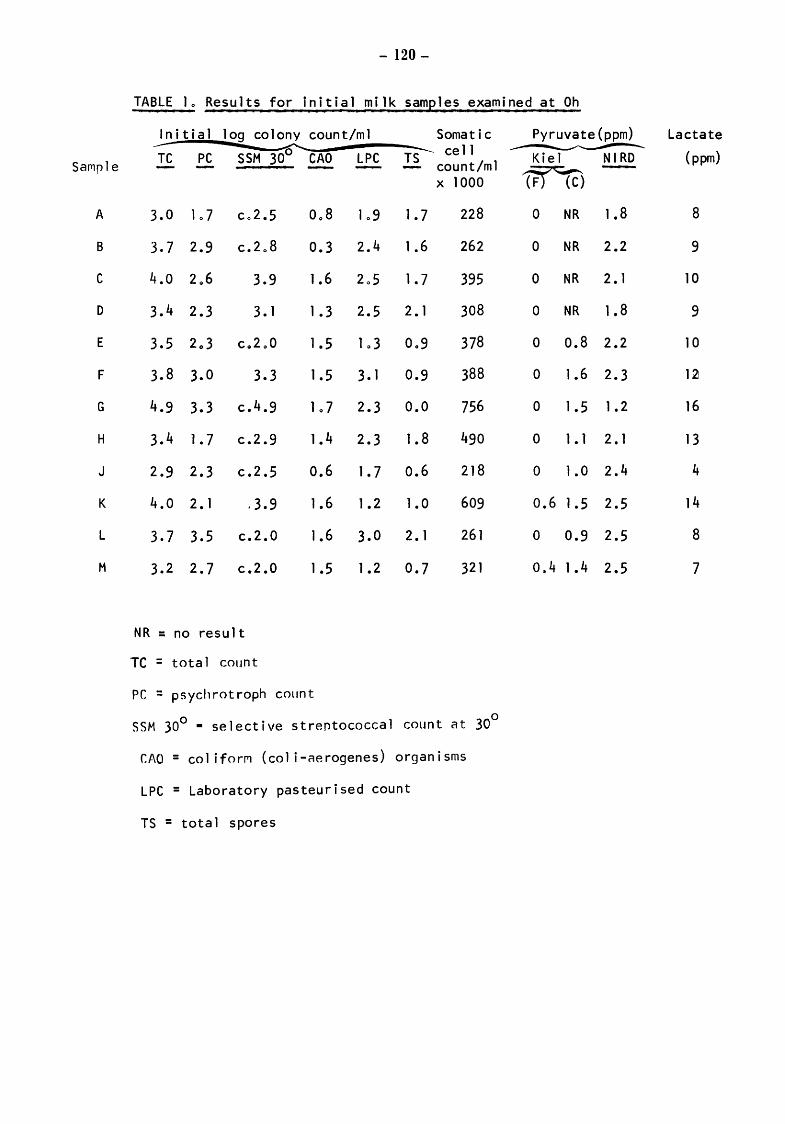
- 120-
TABLE lo Results for initial mi 1 k same1es examined at Oh
Initial log colony count/ml Somatic Pyruvate(ppm) Lactate ___. ~ r$- cell ---------------Sar1rle TC PC SSM 30° CAO LPC Kiel NIRD (ppm) - count/ml 1ff'(c) X 1000
A 3.0 1 0 7 Co2.5 Oo8 lo9 1.7 228 0 NR 1 • 8 8
B 3.7 2.9 c.2o8 0.3 2.4 1 • 6 262 0 NR 2.2 9
c 4.0 2o6 3.9 1 • 6 2o5 1 • 7 395 0 NR 2. 1 10
D 3.4 2.3 3. 1 1 • 3 2.5 2. 1 308 0 NR 1 • 8 9
E 3.5 2o3 Co2o0 1 • 5 1 0 3 0 .. 9 378 0 0.8 2.2 10
F 3.8 3.0 3.3 1 • 5 3. 1 0.9 388 0 1 • 6 2.3 12l
G 4.9 3.3 c.4.9 1 0 7 2.3 o.o 756 0 1 • 5 1 • 2 16
H 3.4 1 • 7 c.2.9 1 • 4 2.3 1.8 490 0 1 • 1 2. 1 13
J 2.9 2.3 c.2.5 0.6 1.7 0.6 218 0 1 • 0 2.4 4
K 4.0 2. 1 .3.9 1 • 6 1 • 2 1.0 609 0.6 1 • 5 2.5 14
L 3.7 3.5 c.2.0 1 • 6 3.0 2. 1 261 0 0.9 2.5 8
M 3.2 2.7 c.2.0 1 • 5 1 • 2 0.7 321 0.4 1.4 2.5 7
NR = no result
TC = total count
PC = psychrotroph count
SSM 30° • selective streptococcal count at 30°
CAO = coliforM (col i-aerogenes) organisms
LPC = Laboratory pasteurised count
TS = total spores
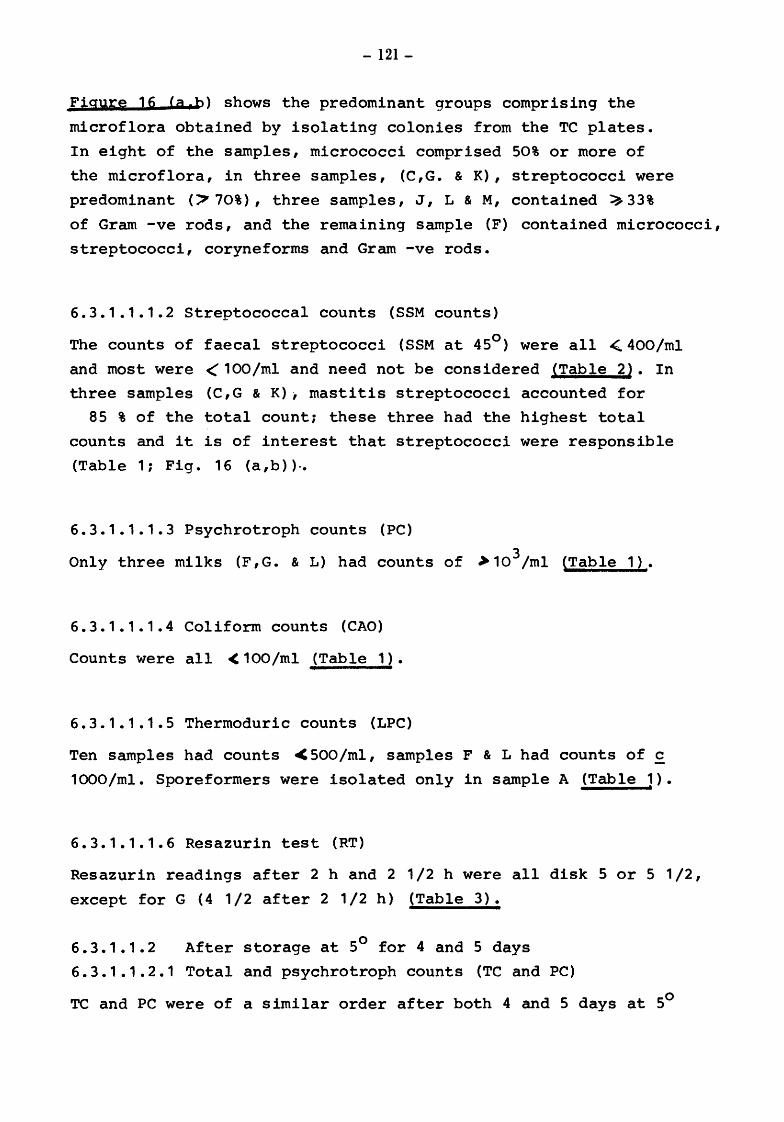
- 121-
Figure 16 <a h) shows the predominant groups comprising the
microflora obtained by isolating colonies from the TC plates.
In eight of the samples, micrococci comprised 50% or more of
the microflora, in three samples, (C,G. & K), streptococci were
predominant ("' 70%) , three samples, J, L & M, contained :;:,. 33%
of Gram -ve rods, and the remaining sample (F) contained micrococci,
streptococci, coryneforms and Gram -ve rods.
6.3.1.1.1.2 Streptococcal counts (SSM counts)
The counts of faecal streptococci (SSM at 45°) were all < 400/ml
and most were < 100/ml and need not be considered (Table 2). In
three samples (C,G & K), mastitis streptococci accounted for
85 % of the total count; these three had the highest total
counts and it is of interest that streptococci were responsible
(Table 1; Fig. 16 (a,b)) .•
6.3.1.1.1.3 Psychrotroph counts (PC)
3 Only three milks (F,G. & L) had counts of >10 /ml (Table 1).
6.3.1.1.1.4 Coliform counts (CAO)
Counts were all < 100/ml (Table 1).
6.3.1.1.1.5 Thermoduric counts (LPC)
Ten samples had counts <500/ml, samples F & L had counts of c
1000/ml. Sporeformers were isolated only in sample A (Table 1).
6.3.1.1.1.6 Resazurin test (RT)
Resazurin readings after 2 h and 2 1/2 h were all disk 5 or 5 1/2,
except for G (4 1/2 after 2 1/2 h) (Table 3).
6.3.1.1.2 After storage at 5° for 4 and 5 days
6.3.1.1.2.1 Total and psychrotroph counts (TC and PC)
TC and PC were of a similar order after both 4 and 5 days at 5°
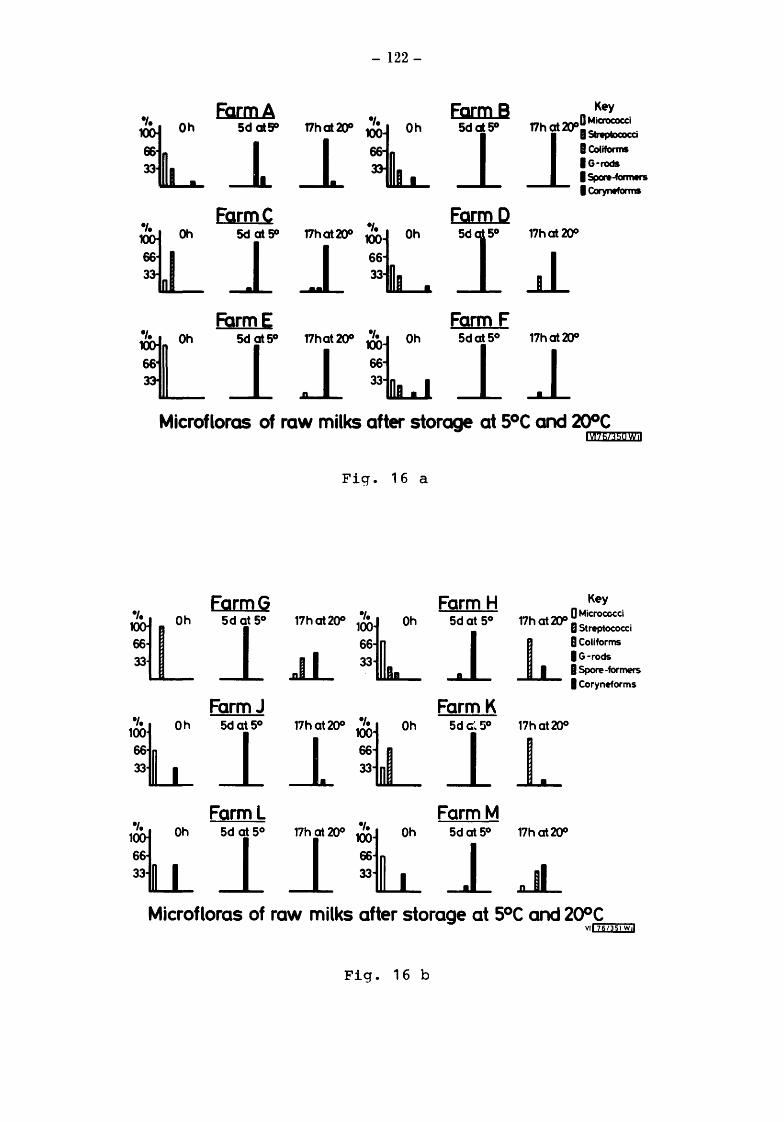
- 122-
EarmA EQ[mB Key
i: Sd atSO 17h at 'Jf.1J
\: Sd at 5° 1?h at 'Jf.1J 0 Micrococci
__1 _l _i _i::= I G-rods
I Spcn..formers I Ccryrwfornw
FarmC FarmD
~ SdatSO 17h at 'Jf.1J ~[ I
17hat2fP
_l _l 66 _J_ 33
FormE Farm F
t_ 5d at 5° 17hat200
~[. 5dat5° 17hat2fP
_i ~ _i _l Microfloras of raw milks after storage at S°C and 2QOC
1217GZ35CSS!il
Fig. 16 a
EarmG FarmH Key
~ Sd at S0 17h at2()0 .,.[ Sd at so 17h at 21.1' 0 Microcccci
_i 100
_l I Streptococci
66 it_ 8 Colilorms
J.L 33 I G-rods
I Spore-formers
I Coryneforms
FarmJ FarmK .,.~ Sd at S0 17hat2fP
~ Sd ct. 5° 17h at2()0
100
_i _l _i 66 L 33
Farml FarmM
~ Sd at S0 17h at 2()0
~k Sd at S0 17h at200
66 _i _i ~ 33 i Microfloras of raw milks after storage at S°C and 200C
vrl 76(351 w,!
Fig. 16 b

- 123-
TABLE 2~ ·Table showing change in streptococcal count after storase
at 20° for 17h
Log colony count/ml at Oh Log colony count/ml after ~ __ l?h aw_o0 __
::l;w1ple SSM 30° SSM 45° SSM 30° SSM 45°
A c 2.5 <2.0 3.2 2.8
B 2.8 <2.0 4.9 4.0
c 3.9 2.5 3.8 3.0
D 3. l 2o0 4. l 3.9
E c 2o0 1 .o 3.4 3.3 -F 3.3 1.8 4.4 3.9
G 4.9 < 1. 0 6.3 2.7
H ?..9 1 • 5 4.5 4.5
J c 2 .. 5 1 • 5 2.8 2.6 -K 3.9 1 • 0 5.7 5.6
L c 2.0 < l. 0 4.2 3.4 -M c 2.0 < l. 0 2.8 2.5
SSM 30° = selective streptococcal count at 30°
II II II
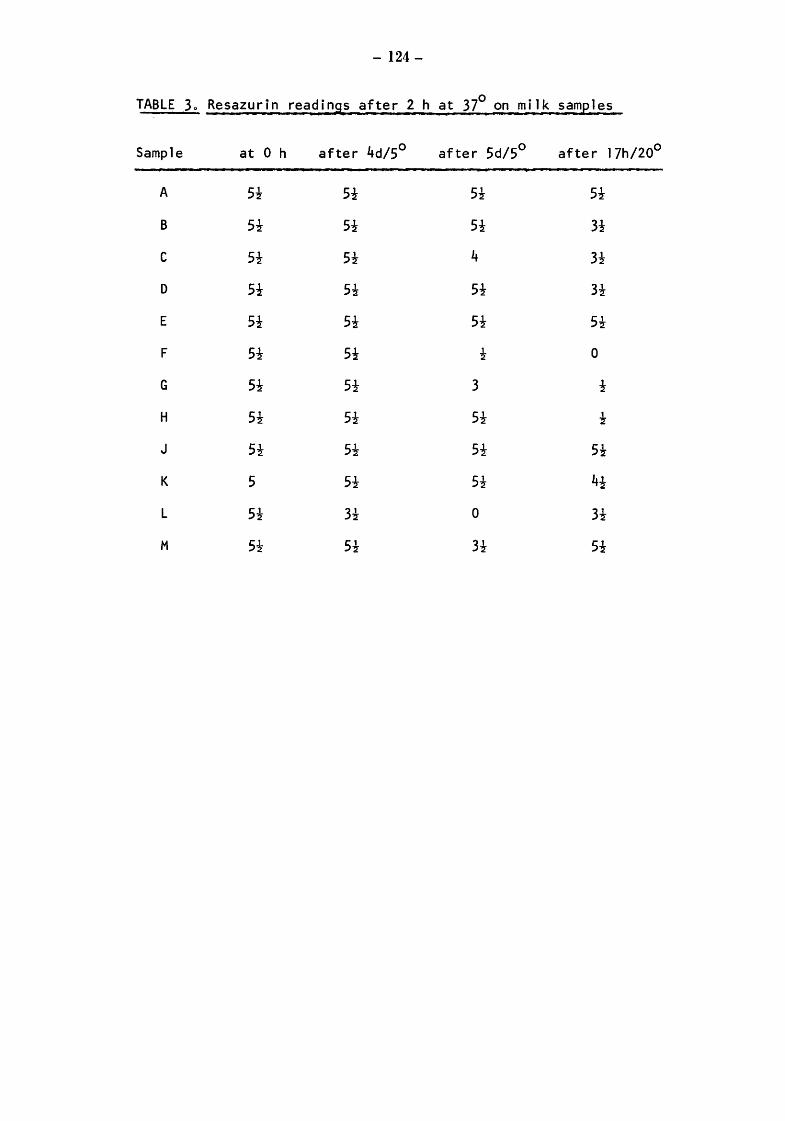
- 124-
TABLE 3o Resazurin readinss after 2 h at 37° on milk samples
Sample at 0 h after 4d/5° after 5d/5 0 after 17h/20°
A 5-! 5-! 5-! 5-!
B 5-! 5-! 5-! 3-!
c 5-! 5-! 4 3-!
D 5-! 5-! 5-! 3-!
E 5-! 5-! 5-! 5-!
F 5-! 5-! 1 0 ~
G 5-! 5-! 3 -!
H 5-! 5-! 5-! -!
J 5-! 5-! 5-! 5-!
K 5 5-! 5-! 4-!
L 5-! 3-! 0 3-!
M 5-! 5-! 3-! 5-!
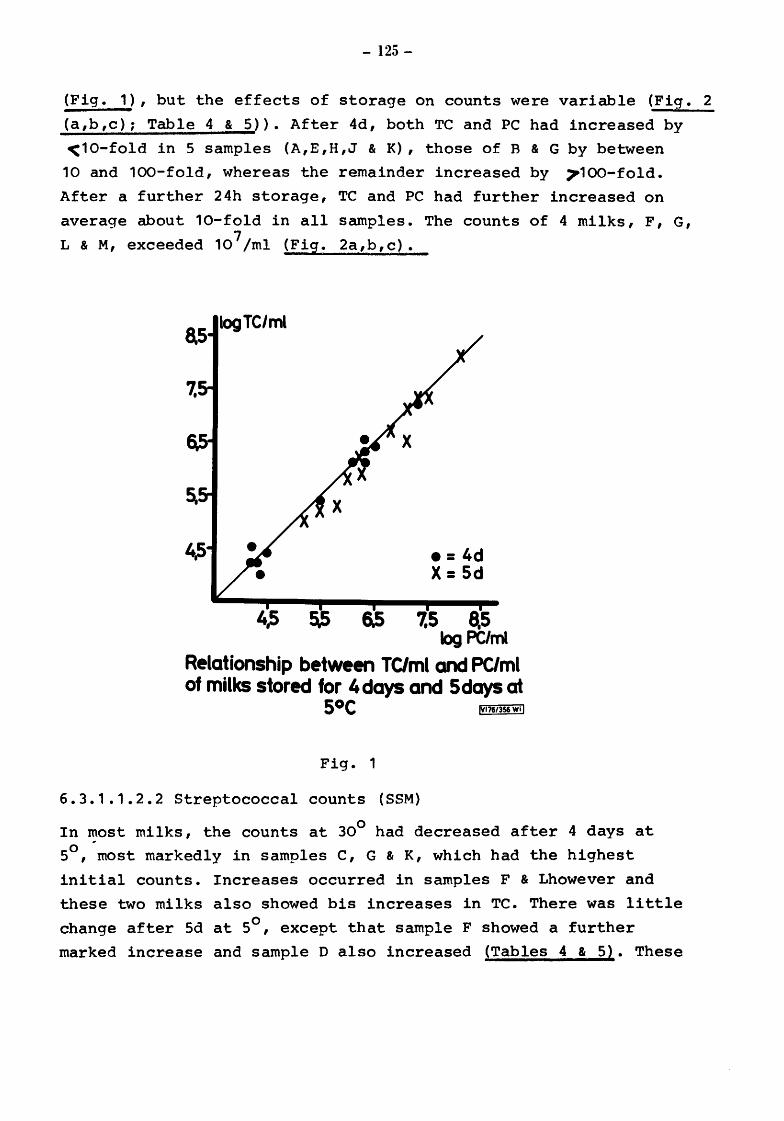
- 125-
(Fig. 1), but the effects of storage on counts were variable (Fig. 2
(a,b,c); Table 4 & 5)). After 4d, both TC and PC had increased by
<10-fold in 5 samples (A,E,H,J & K), those of B & G by between
10 and 100-fold, whereas the remainder increased by ~100-fold.
After a further 24h storage, TC and PC had further increased on
average about 10-fold in all samples. The counts of 4 milks, F, G, 7 L & M, exceeded 10 /ml (Fig. 2a,b,c).
logTC/ml
• = 4d X= Sd
6.5 7.5 8.5 log PC/ml
Relationship between TC/ml and PC/ml of milks stored for 4 days and 5 days at
SOC !Vt76t356 wij
Fig. 1
6.3.1.1.2.2 Streptococcal counts (SSM)
In most milks, the counts at 30° had decreased after 4 days at 0 ~
5 , most markedly in samples c, G & K, which had the highest
initial counts. Increases occurred in samples F & Lhowever and
these two milks also showed his increases in TC. There was little
change after Sd at 5°, except that sample F showed a further
marked increase and sampleD also increased (Tables 4 & 5). These
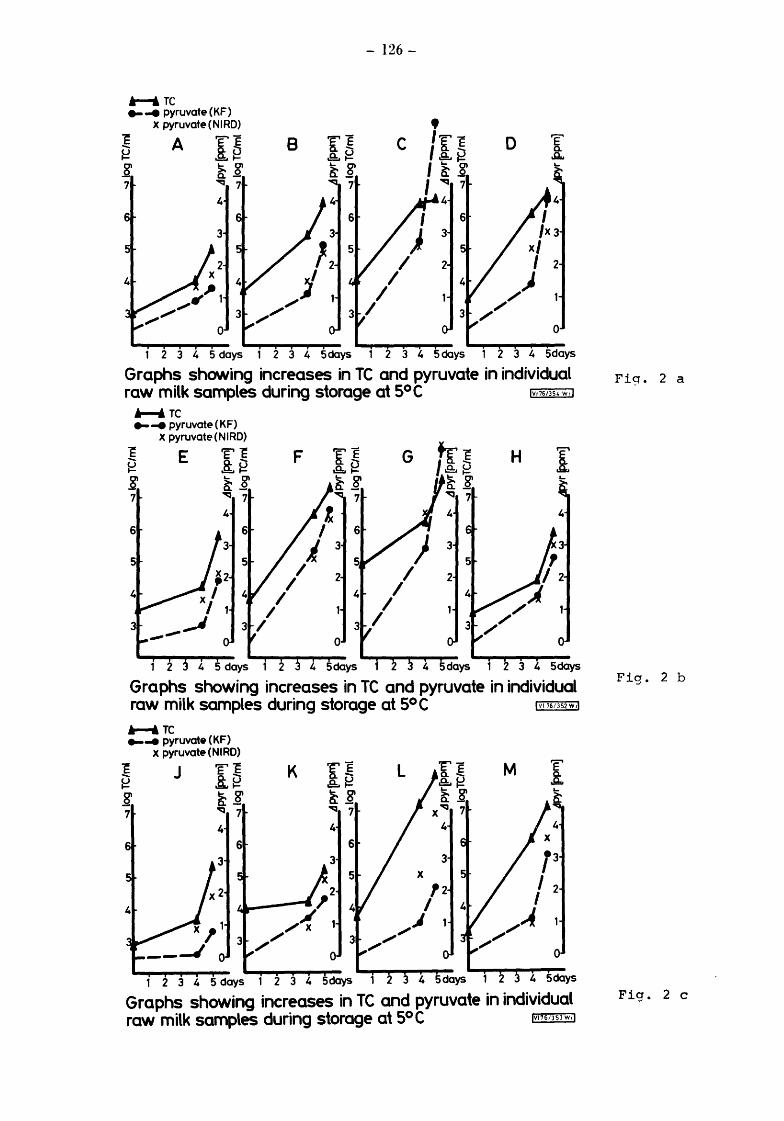
....... TC
.,__. pyruvate(KF)
6
5
4
X pyruvate ( N I RD)
A ~8 ~ .... .... 01 ~.2 ~ 7
0
- 126-
8
0
1 2 3 4 5 days 1 2 3 4 5 days 1 2 3 4 5 days 1 2 3 4 5days
Graphs showing increases in TC and pyruvate in individual raW milk Samples dUring storage at 5°C IV17stJs4 wd
....... TC e--e pyruvate(KF)
6
5
X pyruvate(NIRD)
E ~~ .a.~ .... 8' ~-~ 7 4
6
3 I I
F
I I
I
% I i 3
2
0
6
I I
I 3 I
H I ....
) 3 5
2
1 2 4 5 days 1 2 3 4 days 4 5days 1 3 4 5days
Graphs showing increases in TC and pyruvate in individual raw milk samples during storage at S°C !vi76/352W•'
....... TC
._ ... pyruvate(KF) X pyruvate (NIRD)
~ J 'E'E K r~ L r~ ~ g .a.~
Cl
.9:.~ .9:.~ .9..
~ ~~ ~~ ~.B' ....
7 'q 7 "q 7 xoq 7
4 4 4
6 6 6
5 X '3 f2 I 2
I I
X, 1 .,.J 1 ,A 3 .,, .,., __ _J 0
1 2 3 4 5 days 1 2 3 4 5days 2 4 5days 1 2 4 5days
Graphs showing increases in TC and pyruvate in individual raw milk samples during storage at S°C !vmmJw.,
Fig. 2 a
Fig. 2 b
Fig. 2 c
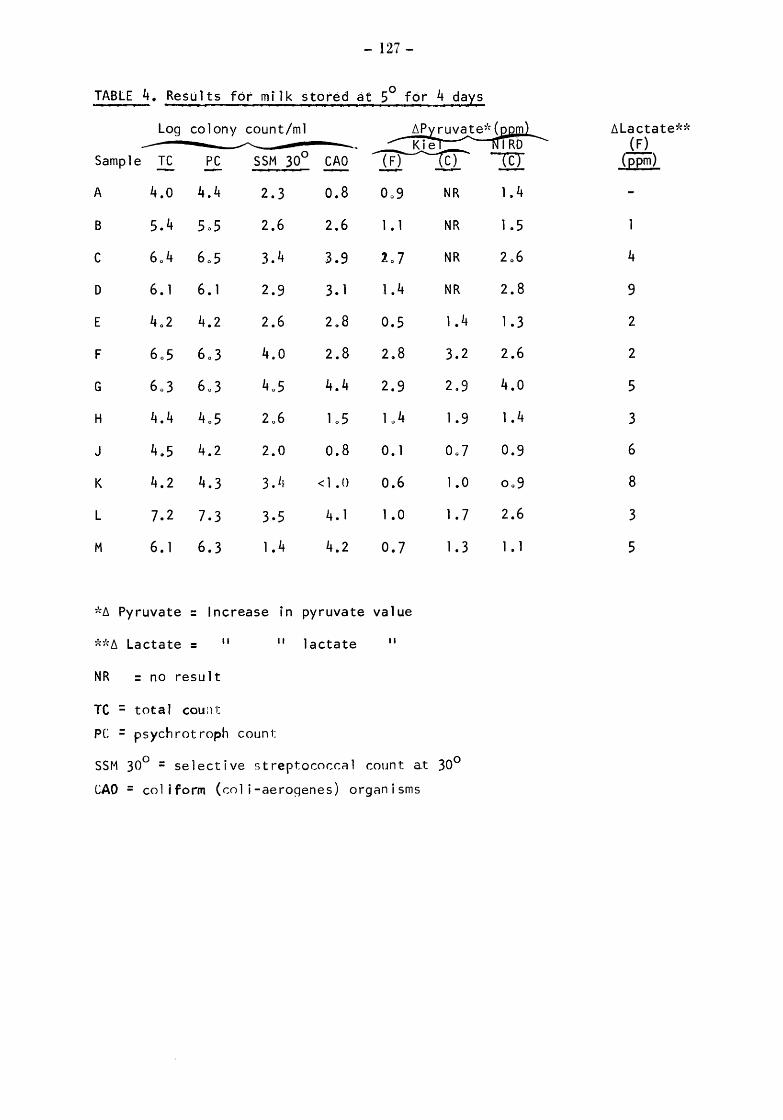
- 127-
TABLE 4. Results for milk stored at 5° for 4 days
Log colony count/ml -- --- K1e Sample TC PC CAO ~ill A 4.0 4.4 2.3 0.8 Oo9 NR
B 5.4 5oS 2.6 2.6 1 • 1 NR
c 6o4 6oS 3.4 J.9 'J..o7 NR
D 6. 1 6. 1 2.9 3.1 1 • 4 NR
E 4o2 4.2 2.6 2 .. 8 0.5 1 • 4
F 6oS 6o3 4~0 2.8 2.8 3.2
G 6o3 6o3 405 4.4 2.9 2.9
H 4.4 4o5 2o6 loS 1 0 4 1 • 9
J 4 .. 5 4.2 2.0 0.8 0. 1 Oo7
K 4.2 4.3 3 .lf < 1 • () 0.6 1 • 0
L 7.2 7.3 3·5 4.1 1 • 0 1 • 7
M 6. 1 6.3 1 • 4 4.2 0.7 1.3
*~ Pyruvate = Increase in pyruvate value
;'d'~ Lactate = 11 11 lactate II
NR = no result
TC = tot a I cou:1 t
PC = psychrotroph count
SSM 30° = selective streptococcAl c:ount at 30°
CAO = coliform (col i-aero~enes) organisms
1..4
1 • 5
2o6
2.8
1 • 3
2.6
4.0
1 • 4
0.9
Oo9
2.6
1 • 1
ilL a ctate"d' (F)
(ppm)
4
9
2
2
5
3
6
8
3
5
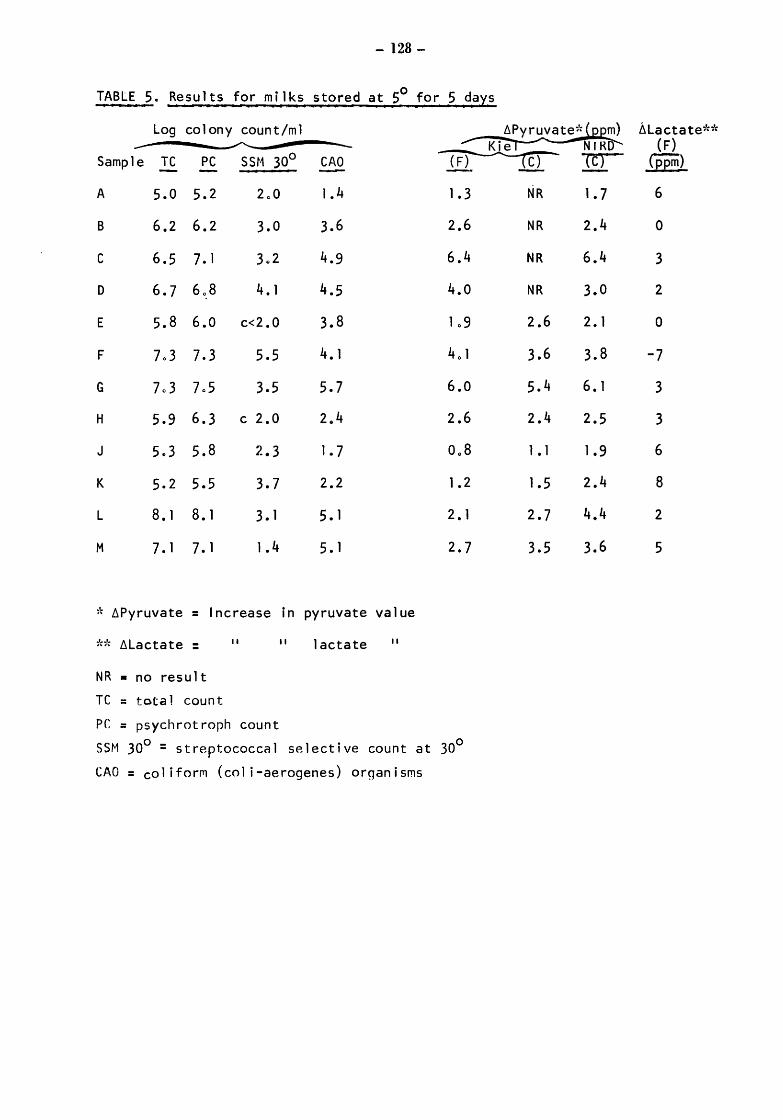
- 128-
TABLE 5c Results for milks stored at 5° for 5 da:ts
Log colony count/ml _..- ~ -- K1e
Sample TC PC SSt·1 30° CAO (FJ -. (C) {C)
A 5.0 5.2 2o0 1.4
B 6.2 6.2 3.0 3.6
c 6.5 7. 1 3.,2 4.9
D 6.7 608 4. 1 4.5
E 5.8 6.0 c<2.0 3.8
F 7o3 7.3 5.5 4. 1
G 7o3 7o5 3.5 5.7
H 5.9 6.3 c 2.0 2.4
J 5.3 5.8 2.3 1 .. 7
K 5.2 5.5 3.7 2.2
L 8. 1 8. 1 3.1 5. 1
M 7. 1 7.1 1 • 4 5. 1
* ~Pyruvate = Increase in pyruvate value
;'~·k ~Lactate :
NR • no result
TC = total count
II
PC = psychrotroph count
II lactate II
1 • 3
2.6
6.4
4.0
1 0 9
4 0 1
6.0
2.6
Oo8
1 • 2
2.1
2.7
SSM 30° = streptococcal selective count at 30°
CAO =coliform (col i-aerogenes) orqanisms
NR 1 • 7
NR 2.4
NR 6.4
NR 3.0
2.6 2.1
3.6 3.8
5.4 6. 1
2.4 2.5
1 • 1 1 • 9
1.5 2.4
2.7 4.4
3.5 3.6
6Lactate** (F)
(ppm)
6
0
3
2
0
-7
3
3
6
8
2
5
- 129-
results indicate that for milks stored for 4d or more at 5° 0 counts on SSM at 30 are unreliable for indicating the number of
mastitis streptococci initially present in the refrigerated milks.
Counts of faecal streptococci did not increase at 5° except after
5 days in one sample, K.
6.3.1.1.2.3 Coliform counts (CAO)
After 4d at 5°, changes in counts were highly variable but most 4 had increased, notably those of G, L & M which rose to >10 /ml.
There was a further increase after Sd at 5°-in all samples and
some, those of G, L & M were quite marked, indicating the pre
sence of psychrotrophic coliforms (Table 5).
6.3.1.1.2.4 Thermoduric counts (LPC)
These showed little change.
6.3.1.1.2.5 Resazurin Test (RT)
With the exception of sample L, which had the highest TC, after
4d at 5° the resazurin disk numbers were similar to the readings
on the milks initially while after Sd samples F & L reduced
resazurin to colourless in 2h, and C, G & M showed a deteriora
tion as compared with the result after 4d. Table 3 indicates
that milks having a TC ~107 /ml after refrigerated storage are
likely to reduce resazurin to the pink stage in 2 - 2 1/2 h,
although sample D was an exception.

- 130-
6.3.1.1.3 After incubation at 20° for 17 h
6.3.1.1.3.1 Total count and psychrotroph count (TC & PC)
Except for samples A, E & J which had TC and PC of ~106 /ml, there
were quite marked differences between these two counts, the PC
tending to be the lower (See Fig. 3). Milks showing the least
increase in both TC and PC after incubation
8 log lt/m117h at 2f:P
7
6
5
• •
• •
5 6 7 log PC/mt flh at 2f:P
Relationship between TC/ml and PC/ml of milks stored for 17 hours at 2ooc
.:=1Vr761=-:J=-=-saw-.,.il
Fig. 3

- 131 -
at 20° for 17 h also showed the least increase in TC and PC on
storage at 5° for 5 d (See Figs. 4 & 5; Tables 5 & 6).
log TC/ ml Sd at so
7.
X X
s.s 7,S a.s log TC/ml 17h at 2CP
Relationship between TC/ml after Sdays at soc and 17 hours at 200C lvt76/Jssw.,
Fig. 4
4.
4S s.s 6,S 7,S 8.5 log PC/ml 17hat2QO
Relationship between PC/ml after Sdays at S°C and 17hours at 200C lvt76/J&owil
Fig. 5
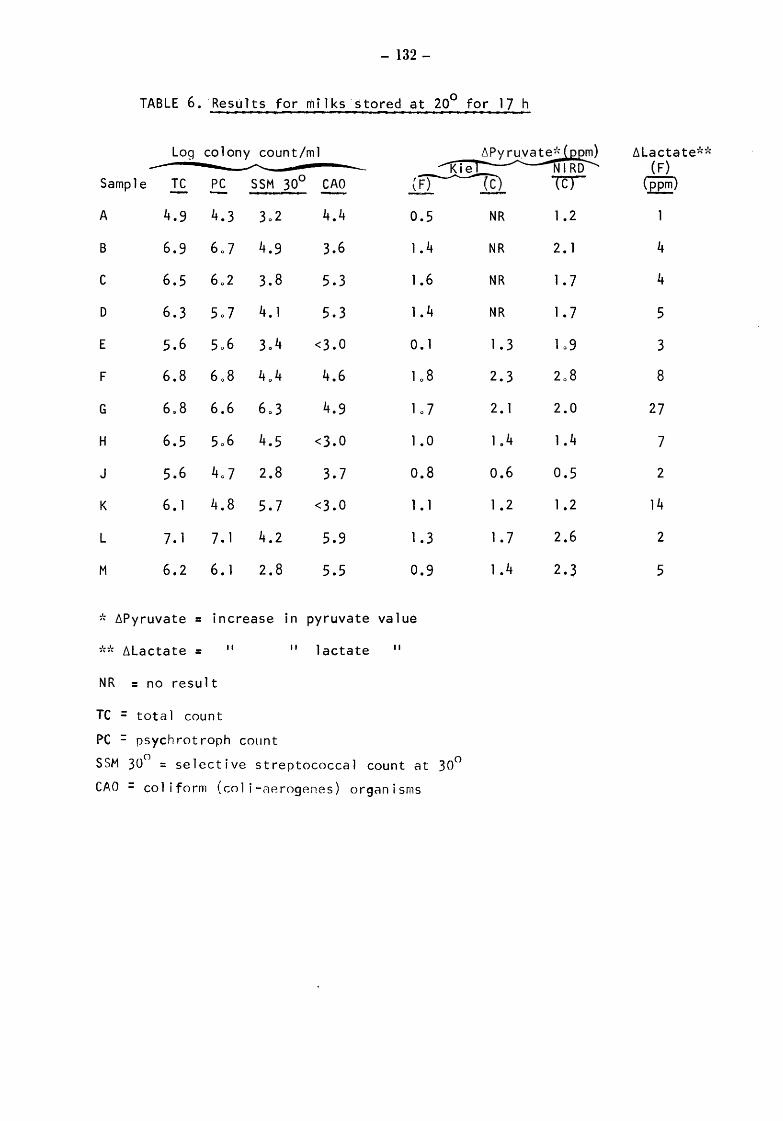
- 132-
TABLE 6. ·R~s~lts for milks Stored at 20° for 17 h
Log colony count/ml .llLactate"~d~ -- ....-....... --- K1e NIRD (F) Sample TC PC SSM 30° CAO {F)-~-(c) TCJ (ppm)
A 4.9 4.3 3o2 4.4 0.5 NR 1 . 2
B 6.9 6o7 4.9 3.6 1 . 4 NR 2. 1 4
c 6.5 6o2 3.8 5.3 1.6 NR 1 . 7 4
D 6.3 5o7 4.1 5.3 1 . 4 NR 1 • 7 5
E 5.6 5o6 3o4 <3.0 0. 1 1 • 3 1 0 9 3
F 6.8 6o8 4o4 4.6 1 0 8 2.3 2o8 8
G 6o8 6.6 6o3 4.9 1 0 7 2.1 2.0 27
H 6.5 5o6 4.5 <3.0 1. 0 1 . 4 1 . 4 7
J 5.6 4o7 2.8 3.7 0.8 0.6 0.5 2
K 6. 1 408 5.7 <3.0 l • 1 1 • 2 1 • 2 14
L 7. 1 7. 1 4.2 5.9 1 . 3 1 • 7 2.6 2
M 6.2 6. 1 2.8 5.5 0.9 1 . 4 2.3 5
"~~ .llPyruvate = increase in pyruvate value
;'d• .llLactate = II II lactate II
NR = no result
TC = total count
PC - psychrotroph count -
SSM 30° = selective streptococcal count at 30° CAO = coli form (col i-<lP-rogenes) organisms
- 133-
6.3.1.1.3.2 Streptococcal counts (SSM)
At 20°, faecal streptococci showed a marked increase, notably in
samples D, F, H & K (Table 2) and in H & K the total SSM count
consisted almost entirely of faecal streptococci. In samples B,
F, G and L, the mastitis streptococci multiplied rapidly, while
in the remaining 4 samples there was ·no significant increase.
It is evident that where milk is stored at temperatures permitting
the growth of faecal streptococci a count at 30° on SSM is not
specific for mastitis streptococci.
6.3.1.1.3.3 Coliform counts (CAO)
In 3 samples (E,H & K), coliforms failed to multiply appreciably
and counts of ~1000/ml were recorded. In the remainder the in
creases were variable and bore no relationship to the initial
counts {Tables 1 & 6).
6.3.1.1.3.4 Thermoduric counts (LPC)
These counts showed little change from the initial counts and
are not shown.
6.3.1.1.3.5 Resazurin Test {RT)
Three milks, F, G & H, reduced resazurin completely in 2h.
Only samples A, E, J & M did not reduce the dye to the pink
stage {< 3 1 I 2) and these milks, with the except ion of r-1, had cou~ts of ~06/ml (Tables 3 & 6l at the time of the test.
- 134-
6.3.1.1.4 Microfloras of the milks a~ter storage at 5° and at 20°
The histograMs in Fiq. 16 (a,b) of results obtained by isolating
colonies from TC plates, show that after 5d at 5° Gram -ve rods
were the predominatinq group in all samples, comprising 100%
of the microflora in eiqht of them. After 17h at 20° this group
formed ' 50 % of the microflora in ten samples but streptococci
were present in appreciable numbers in two of these, D & G, as
were coliforms in M. Streptococci predominated in H & K and in
both these samples the total counts exceeded the psychrotroph
counts by about 10-fold (Table 6).
6.3.1.1.5 The error of the plate count
From 4 milk samples, 10 replicate platings were made, duplicate
plates being poured from appropriate dilutions. The following
standard deviations (s) and coefficents of variation (CV) were
calculated for the 4 samples.
Sample Mean Count/rnl s cv %
A 6.85 X 10⁶ 13.58 X 10
5 19 .. 82
B 1 • 1 4 X 10⁶
8.66 X 10⁴ 7.58
c 8.8 t::
X 10J 9.18 X 10⁴ 10.40
D 5.3 X 10⁴ 6.02 X 10³ 11 , 24
These results indicate that the error of the plate counts as
determined for this work are well within normally accepted
limits {Wilson, 1935).
6.3.1.2 Somatic Cell Counts (cells)
Cell counts were all "' 500,000 /rnl, except for milks G & K, both
of which contained a high proportion of mastitis streptococci:
however sample C, similar to G & K in this respect, did not have
an unduly hioh cell count (392,000/ml) (Table 1). There was a
relationship between cell count and initial streptococcal count
(Fig. 6) but they were not highly correlated.
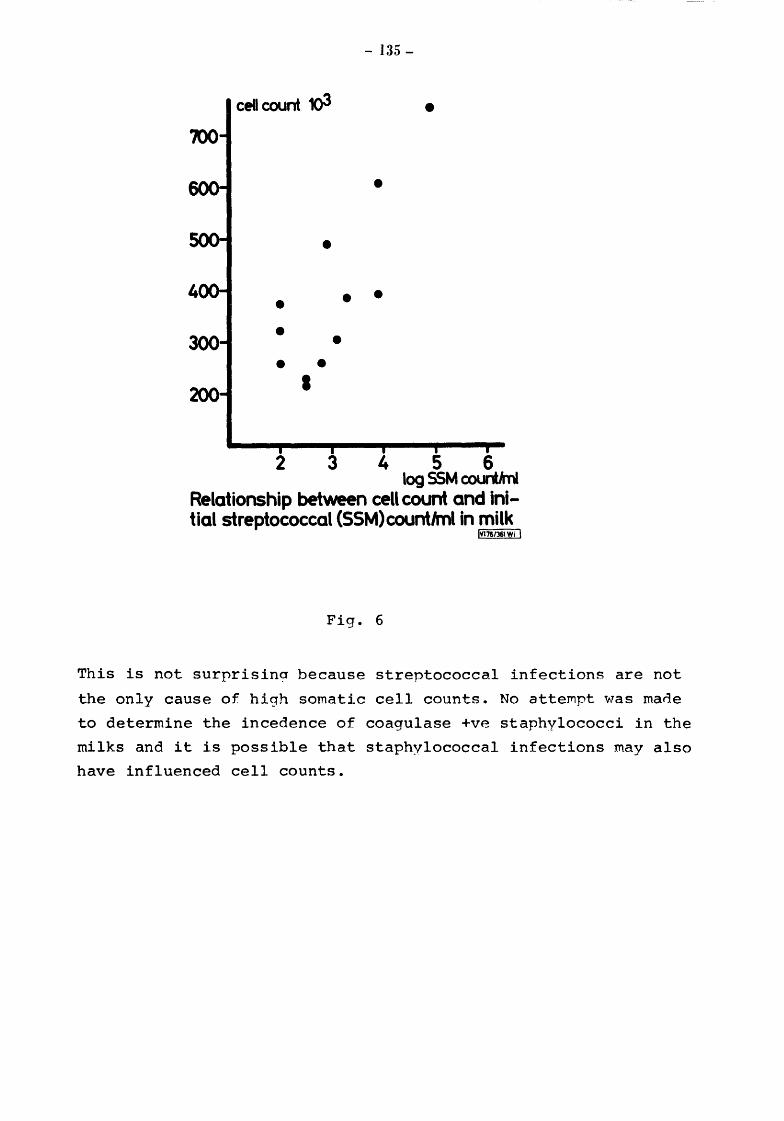
- 135-
cell count 1()3 •
•
•
• • • • • • •
I
2 3 4 5 6 log SSM COl.lr'tA'ri
Relationship between cell count and initial streptococcal (SSM)count/ml in milk
JVI76/361 Wi I
Fig. 6
This is not surprisin~ because streptococcal infections are not
the only cause of high somatic cell counts. No atte~pt was mane
to determine the incedence of coagulase +ve staphylococci in the
milks and it is possible that staphylococcal infections may also
have influenced cell counts.
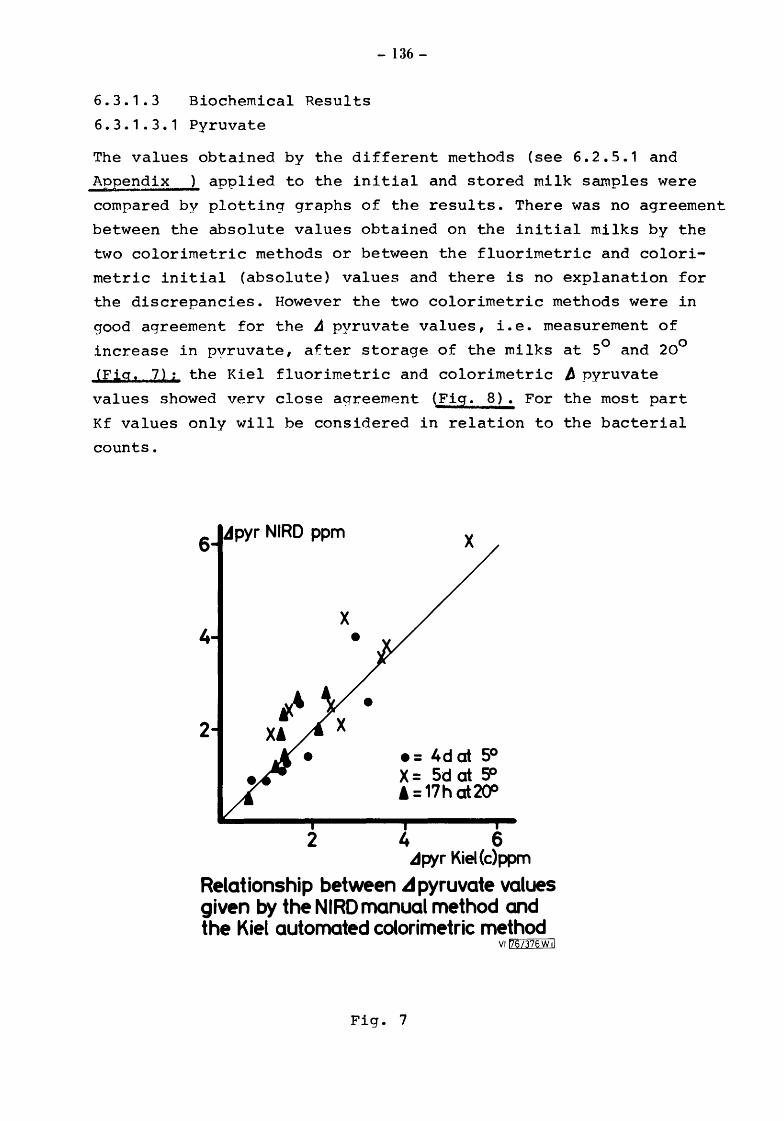
- 136-
6.3.1.3 Biochemical Results
6.3.1.3.1 Pyruvate
The values obtained by the different methods (see 6.2.5.1 and
Appendix applied to the initial and stored milk samples were
compared by plotting graphs of the results. There was no agreement
between the absolute values obtained on the initial milks by the
two colorimetric methods or between the fluorimetric and colori
metric initial (absolute) values and there is no explanation for
the discrepancies. However the two colorimetric methods were in
good agreement for the ~ pyruvate values, i.e. measurement of
increase in pyruvate, after storage of the milks at 5° and 20°
(Fig: 7); the Kiel fluorimetric and colorimetric A pyruvate
values showed verv close aqreement (fig. 8). For the most part
Kf values only will be considered in relation to the bacterial
counts.
6 ~pyr NIRD ppm
X 4
2
•
X
•=4dat5° X= Sd at SO '= 17h at2()0
2 4 6 ~pyr Kiel (c) ppm
Relationship between ~pyruvate values given by the NIRDmanual method and the Kiel automated colorimetric method
VI f76/376Wd
Fig. 7
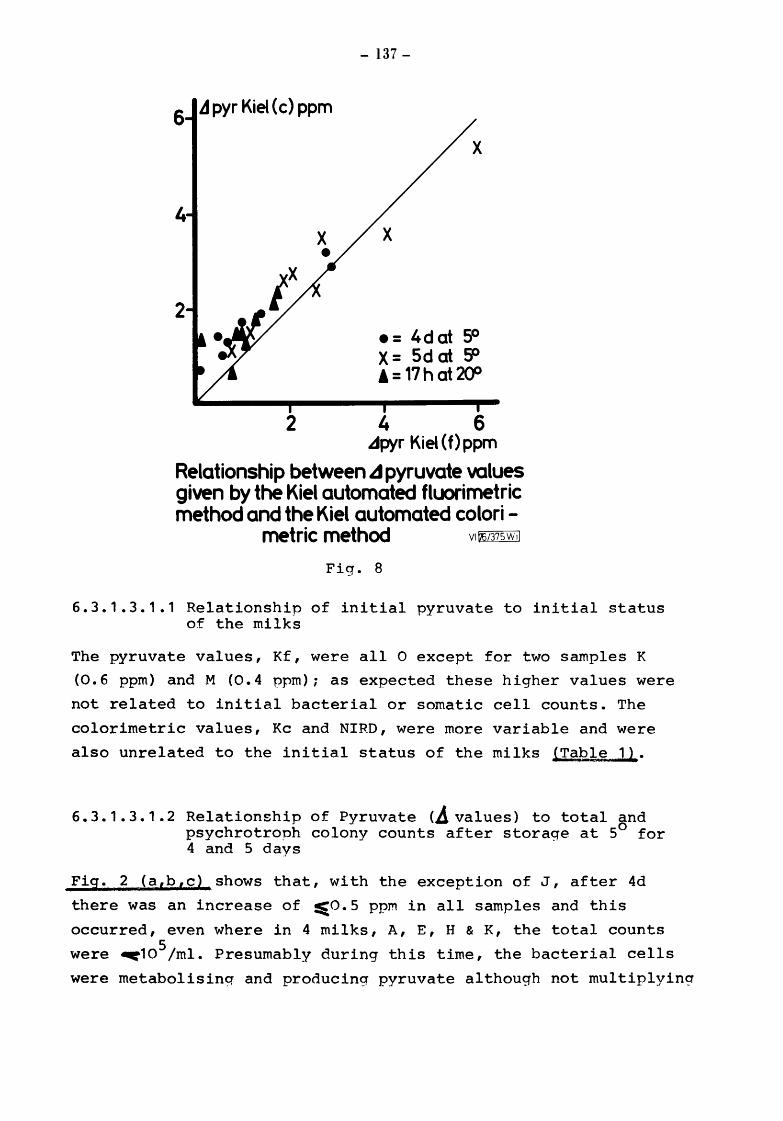
- 137-
6 ~ pyr Kiel (c) ppm
4
2 •= 4dat 5° X= Sd at SO A= 17h at 2QO
2 4 6 itpyr Kiel (f) ppm
Relationship between .1 pyruvate values given by the Kiel automated fluorimetric method and the Kiel automated colori -
metric method vl®/37swd
Fig. 8
6.3.1.3.1.1 Relationship of initial pyruvate to initial status of the milks
The pyruvate values, Kf, were all 0 except for two samples K
(0.6 ppm) and M (0.4 ppm); as expected these higher values were
not related to initial bacterial or somatic cell counts. The
colorimetric values, Kc and NIRD, were more variable and were
also unrelated to the initial status of the milks (Tabl~ 1).
6.3.1.3.1.2 Relationship of Pyruvate (~values) to total gnd psychrotroph colony counts after storage at 5 for 4 and 5 days
Fig. 2 (a,b,cL shows that, with the exception of J, after 4d
there was an increase of ~0.5 ppm in all samples and this
occurred, even where in 4 milks, A, E, H & K, the total counts
were ~105/ml. Presumably during this time, the bacterial cells
were metabolisinq and producing pyruvate although not multiplying

- 138-
rapidly. Hov1ever in milks B, D, L & M, the counts increased 50-
to 1000-fold, but the increases in pyruvate were of the same order
as for A, E, H & K, i.e. < 2ppm. Samples C, F & G with 100- to
1000-fold increases in TC and PC showed bigger increases in
pyruvate (2-3 ppm). After 5 days storage, pyruvate levels increased
further in all samples and, in milks C and G, reached 6.4 and
6.0 ppm respectively, although samples D and F, which had similar
counts had~ values of only 4.0 and 4.1 ppm respectively (Fiq.2a,
b,c). Sample L, which had a count ;>108
/ml had a surprisingly low
A pyruvate value, possibly because in milks in which very high
bacterial counts have developed, other biochemical changes
occurring may affect the analysis. The agreement between ~ pyruvate
values (Kf) an total counts is fairly good, although a slightly
better relationship is apparent if the NIPD pyruvate results are
used (Fig. 9).
~pyr ppm 6
4
2 • • • xx X
• X X
•• •
¥1 X
~ X
X= Kf •= NIRD
6 7 log TC/ml 5 d at 5°
Relationship between the TC/ml and the.dpyruvate values(NIRD and Kf) after 5 days at 5°C v1rnzTI?&llJ
Fiq. 9

- 139-
6. 3. 1 . 3. 1 • 3 Relationship of A pyruvate to totgl and psychrotroph colony counts after storage at 20 for 17h
There is some relationship between total counts and~ pyruvate
values (Fig.10}_ but the scatter is large. Sample E had a very
low value (0.1 ppm) and four samples B, H, L & M had relatively
low pyruvate levels in relation to their total counts (Table 6).
The relationship between the psychrotroph counts and pyruvate
levels is even less good ~lll.., Thus in some cases the amount
of pyruvate produced may be similar even though there is a dis
crepancy in count of more than 100-fold.
4 ~ pyr ppm (Kf)
3
2 • •• • •• 1 • • • •
•
4 5 6 7 8 log ltlni 17h at 200
Relationship between the TC/ml and the .dpyruvate values (Kf) after 17hours
at 20° c lvi'76135SWd
Fig. 10

- 140-
4 ~ pyr ppm (Kf)
3
2
• •• • • • 1 • • • •
• 6 7
log PChri 17h at 2()0
Relationship between the PC/ml and the~pyruvate values (Kf) after Tl hours
at 200C lv176/357Wi 1
Fig. 11
6.3.1.3.1.4 Pyruvate values equivalent to one colony forming unit (CFU)
Storage of the samples at 5° to bring about increases in the
total and psychrotroph counts was adopted to enable any re
lationships between counts and pyruvate to be studied under
conditions relevant to bulk tank storage. From the results
the amount of pyruvate produced per colony forming unit (CFU)
has been calculated over the range of TC observed after 4 and
Sd storage at 5°. Fiq.12 shows that in accordance with the
findings of Tolle & Heeschen (1975) pyruvate production/CFU is
related to the total count and decreases as the total count
increases. The reason for this is not clear but may involve
rates of multiplication, diffusion gradients, the varied nature
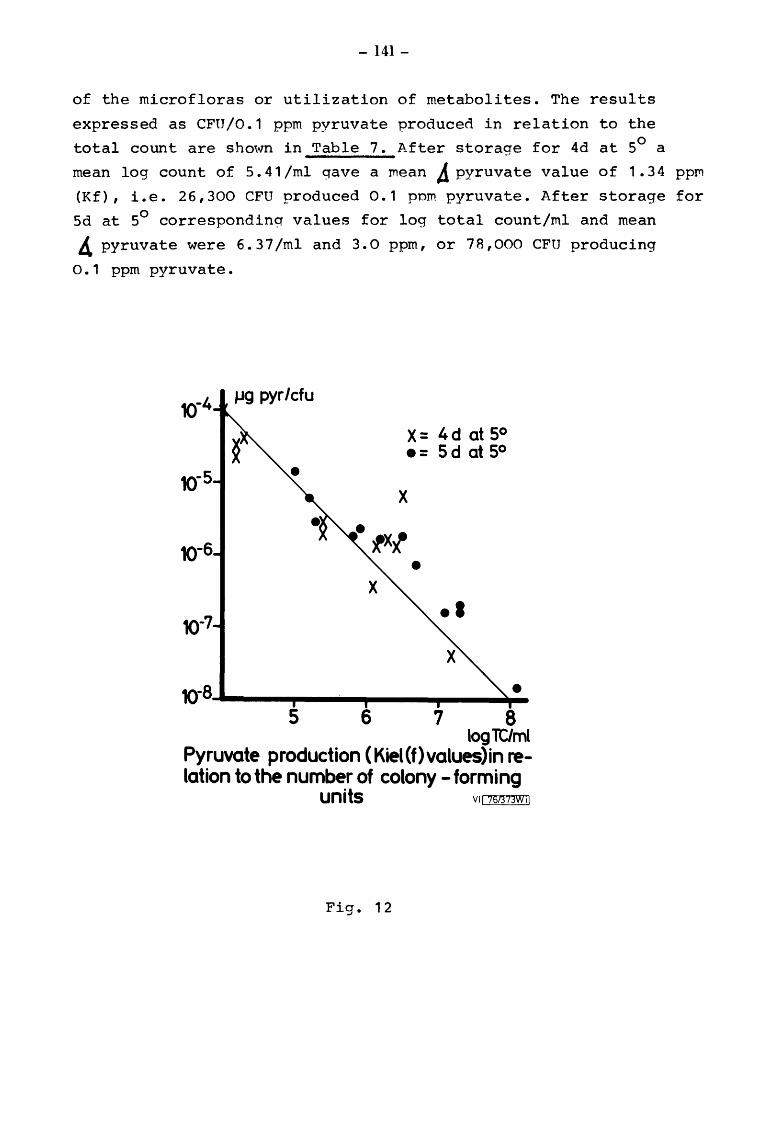
- 141-
of the microfloras or utilization of metabolites. The results
expressed as CFU/0.1 ppm pyruvate produced in relation to the
total count are sho,A~n in Table 7. After storage for 4d at 5° a
mean log count of 5.41/ml gave a mean A pyruvate value of 1.34 pp~
(Kf), i.e. 26,300 CFU produced 0.1 porn pyruvate. After storage for
5d at 5° corresponding values for log total count/ml and mean
4 pyruvate were 6.37/ml and 3.0 ppm, or 78,000 CFU producing
0.1 ppm pyruvate.
10-4 J..IQ pyr/cfu
X= 4d at 5° •=5dat5°
X
•
5 6 7 8 logltlml
Pyruvate production (Kiel(f)values)in relation to the number of colony -forming
units vq 76/3 73W11
Fig. 12
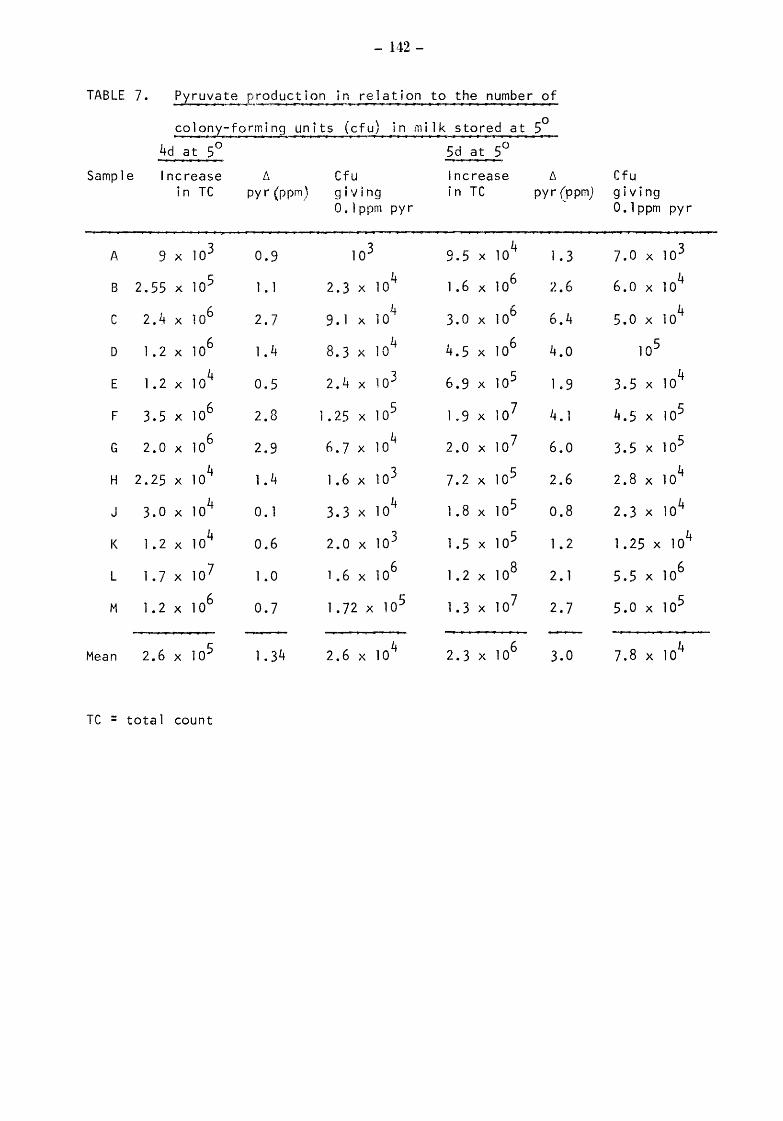
- 142-
TABLE 7. ~yruv.a.~-~-J?.~d.u.c_E.i~_n JD relation to the number of
col o.n1-f?.r.m.i ng. units (cfu) in milk stored at 50
4d at 5° 5d at 5°
Sample Increase f., Cfu increase l\ Cfu in TC pyr (ppm) giving in TC pyr (ppm) giving
0. 1 ppm pyr 0. 1 ppm pyr
A 9 X 10³ 0.9 103 9.5 X 10⁴ 1 • 3 7.0 X 10³
B 2.55 X 10⁵ 1.1 2.3 X 10⁴ 1 • 6 X 10⁶ 2.6 6.0 X 10⁴
106 I
106 104 c 2.4 X 2.7 9. l X 10l.f 3.0 X 6.4 5.0 X
D l • 2 X 10⁶ 1.4 8.3 X 10⁴ 4.5 X 10⁶ 4.0 105
104 103 r: 104
E 1. 2 X 0.5 2.4 X 6.9 X 10::> 1 e 9 3.5 X
F 3.5 X 10⁶ 2.8 1. 25 X 105 1 .. 9 X 10⁷ 4. 1 4.5 X 10⁵
G 2.0 X 10⁶ 2.9 h.7 X 104 2.0 X 10 7 6.0 3.5 X 10⁵
H 2.25 X 10⁴ 1.4 1.6 X 10³ 7.2 X 10⁵ 2.6 2.8 X 10⁴
J 3.0 X 10⁴ 0. 1 3.3 X 10⁴ 1. 8 X 10⁵ 0.8 2.3 X 10⁴
K 1. 2 X 10⁴ 0.6 2.0 X 10 3 1.5 X 10⁵ 1 • 2 1 • 25 X 10 4
L 1. 7 X 10⁷ l • 0 1. 6 X 10⁶ 1. 2 X 10⁸ 2.1 5.5 X 10⁶
M 1. 2 X 10⁶ 0.7 1. 72 X 105 l. 3 X 10⁷ 2.7 5.0 X 10⁵
Mean 2.6 X 10⁵ 1. 34 2.6 X 10 4 2.3 X 10⁶ 3.0 7.8 X 10⁴
TC = total count
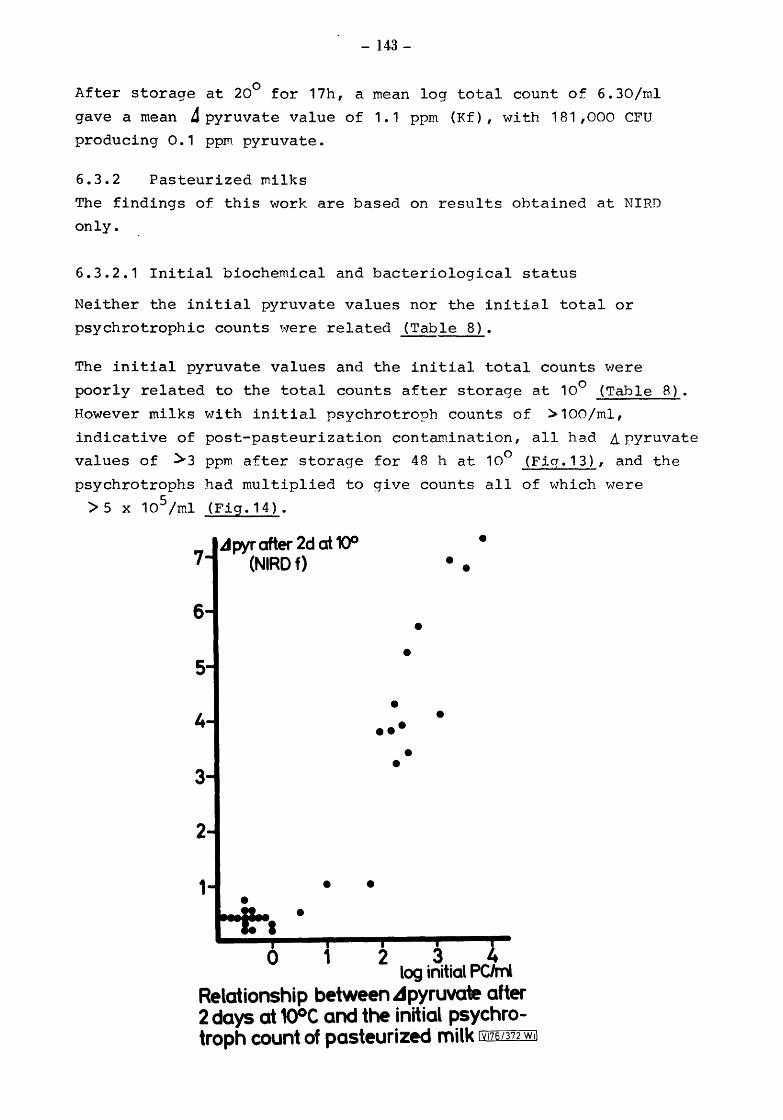
- 143-
0 After storage at 20 for 17h 1 a mean log total count of 6.30/ml
gave a mean 4 pyruvate value of 1.1 ppm (Kf) 1 with 181 1 000 CFU
producing 0.1 ppm pyruvate.
6.3.2 Pasteurized milks
The findings of this work are based on results obtained at NIRD
only.
6.3.2.1 Initial biochemical and bacteriological status
Neither the initial pyruvate values nor the initial total or
psychrotrophic counts \-Tere related (Table 8) •
The initial pyruvate values and the initial total counts were
poorly related to the total counts after storage at 10° (Table 8).
However milks with initial psychrotroph counts of >100/ml 1
indiCatiVe Of pOSt-pasteurizatiOn COntaminatiOn 1 all had a pyrUVate
values of >3 ppm after storage for 48 hat 10° (Ficr.13) 1 and the
psychrotrophs had multiplied to give counts all of v1hich were
> 5 x 1 0 5 I ml (Fig. 1 4 ) •
7 ad pyr after 2d at 1QO
(NIRD f)
6
3
• • • •
•
• •••
• •
•
•
• • •
1 2 3 4 log initial PChri
Relationship between .dpyruvate after 2 days at 1QOC and the initial psychrotroph count of pasteurized milk Mlliill3ilil
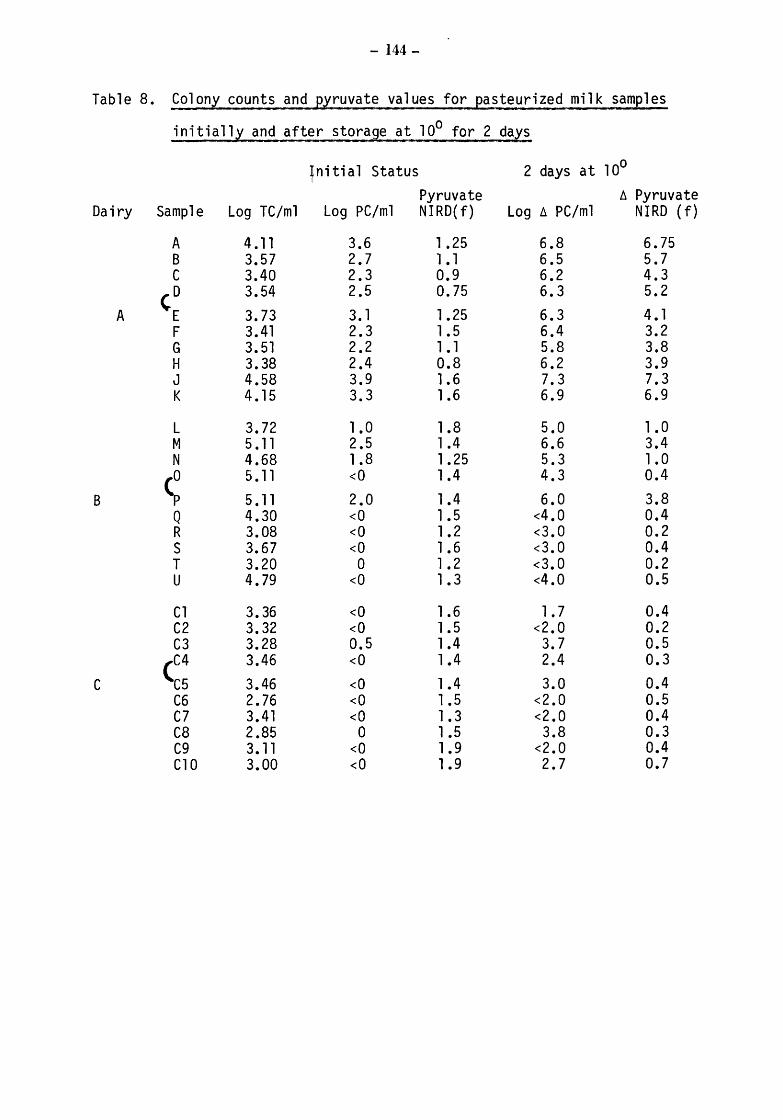
- 144-
Table 8. Colonl counts ~n~ ~ruyate values for 2asteurized milk samples
initially and aft~r _s_t_orage a.t. 10° for 2 days
~nitia1 Status 2 days at 10°
Pyruvate fl Pyruvate Dairy Sample Log TC/ml Log PC/m1 NIRD(f) Log D. PC/m1 NIRD (f)
A 4.11 3.6 1 .25 6.8 6.75 B 3.57 2.7 1 • 1 6.5 5.7 c 3.40 2.3 0.9 6.2 4.3 ,o 3.54 2.5 0.75 6.3 5.2
A E 3.73 3.1 1. 25 6.3 4.1 F 3.41 2.3 1. 5 6.4 3.2 G 3.51 2.2 1 • 1 5.8 3.8 H 3.38 2.4 0.8 6.2 3.9 J 4.58 3.9 1.6 7.3 7.3 K 4.15 3.3 1 .6 6.9 6.9
L 3.72 1. 0 1.8 5.0 1 • 0 M 5.11 2.5 1 .4 6.6 3.4 N 4.68 1. 8 1. 25 5.3 1 • 0
< 5.11 <0 1 .4 4.3 0.4
B 5.11 2.0 1 .4 6.0 3.8 Q 4.30 <0 1 • 5 <4.0 0.4 R 3.08 <0 1. 2 <3.0 0.2 s 3.67 <0 1 • 6 <3.0 0.4 T 3.20 0 1 • 2 <3.0 0.2 u 4.79 <0 1 • 3 <4.0 0.5
C1 3.36 <0 1. 6 1. 7 0.4 C2 3.32 <0 1 • 5 <2.0 0.2 C3 3.28 0.5 1 .4 3.7 0.5
(C4 3.46 <0 1.4 2.4 0.3
c C5 3.46 <0 1 .4 3.0 0.4 C6 2.76 <0 1 .5 <2.0 0.5 C7 3.41 <0 1. 3 <2.0 0.4 C8 2.85 0 1 .5 3.8 0.3 C9 3.11 <0 1. 9 <2.0 0.4 C10 3.00 <0 1 • 9 2.7 0.7
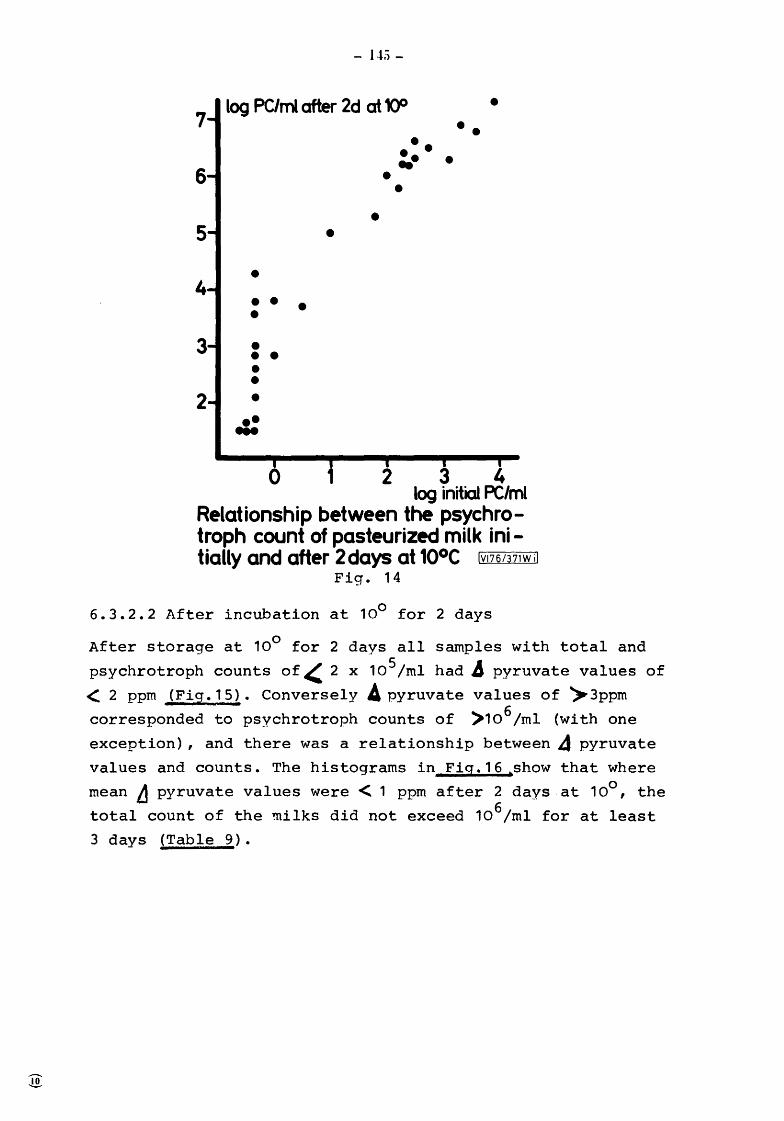
- 145-
log PC/ml after 2d at 1()0 •
• • • • • • • • • • • •
•• ...
•
•• •• -• • • •
•
3 4 log initial PC/ml
Relationship between the psychrotroph count of pasteurized milk initially and after 2days at 10°C lv176/371wil
Fig. 14
6.3.2.2 After incubation at 10° for 2 days
After storage at 10° for 2 days all samples with total and
psychrotroph counts of~ 2 x 10 5/rnl had j pyruvate values of
< 2 ppm (Fig.15). Conversely Apyruvate values of ~3ppm corresponded to psychrotroph counts of >1o6;m1 (with one
exception), and there was a relationship between A pyruvate
values and counts. The histograms in Fiq.16 tshow that where
mean~ pyruvate values were< 1 ppm after 2 days.at 10°, the
total count of the milks did not exceed 106/ml for at least
3 days (Table 9).

~ pyr after 2d at 10° (NIRDf)
- 146-
••
• • • ... •
• •
• •
4 5 6 7
•
log PC/ml after 2d at 1()0
Relationship between ~pyruvate and the psychrotroph count of pasteurized milk after 2 days at 10°C I Vl76/370 wd
Fig. 15
8 mean~pyr 2d at10°
4
2
n=1 n= n= n= n= 1 2 3 4 >4
days to reach TC of >1()6/ml after storage at 1QOC Relationship between the mean ~pyruvate after 2 days at 1QOC and the number of days takenb give total counts exceeding 106/ml in pasteurized milk after storage at 10°C
[VT!§ T3]]Y1!]
Fig. 16
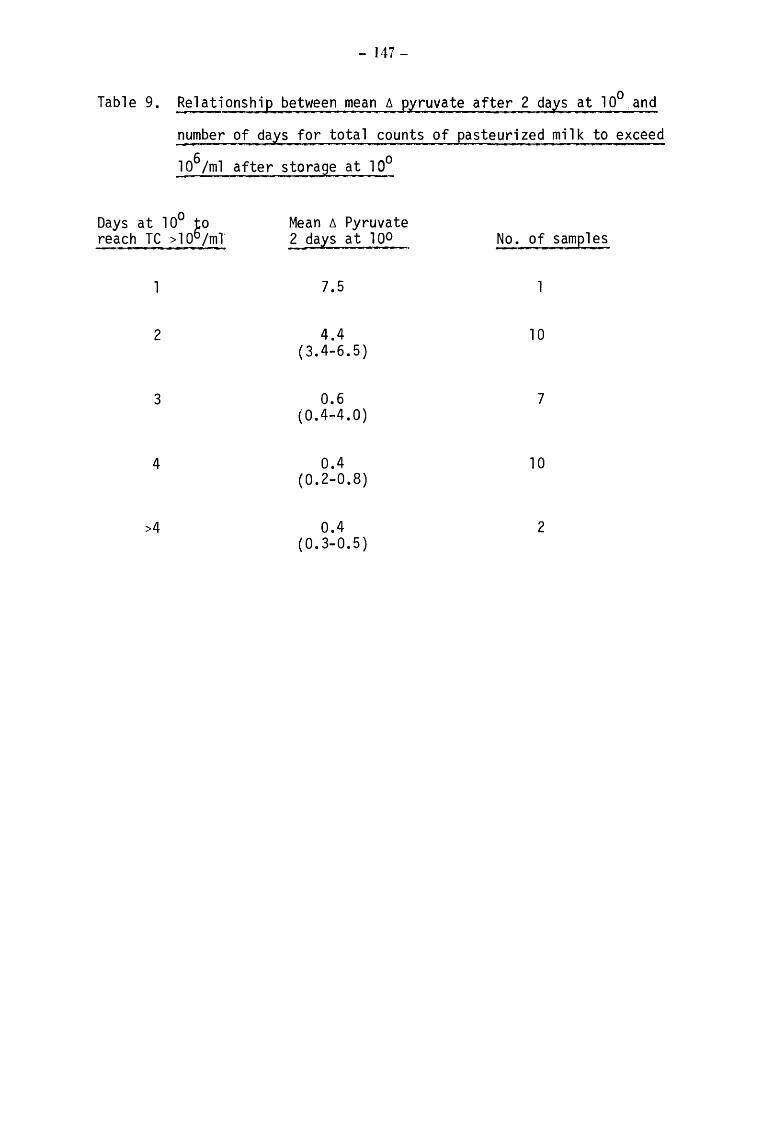
- 147-
Table 9. Relationship between mean tJ. .Pyruvate after 2 days at 10° and
number of days for total counts of pasteurized milk to exceed
106/ml after storage at 10°
Days at 10° Go reach TC >10 /ml
1
2
3
4
>4
Mean tJ. Pyruvate 2 days at 100
7.5
4.4 (3.4-6.5)
0.6 (0.4-4.0)
0.4 (0.2-0.8)
0.4 (0.3-0.5)
No. of samples
10
7
10
2
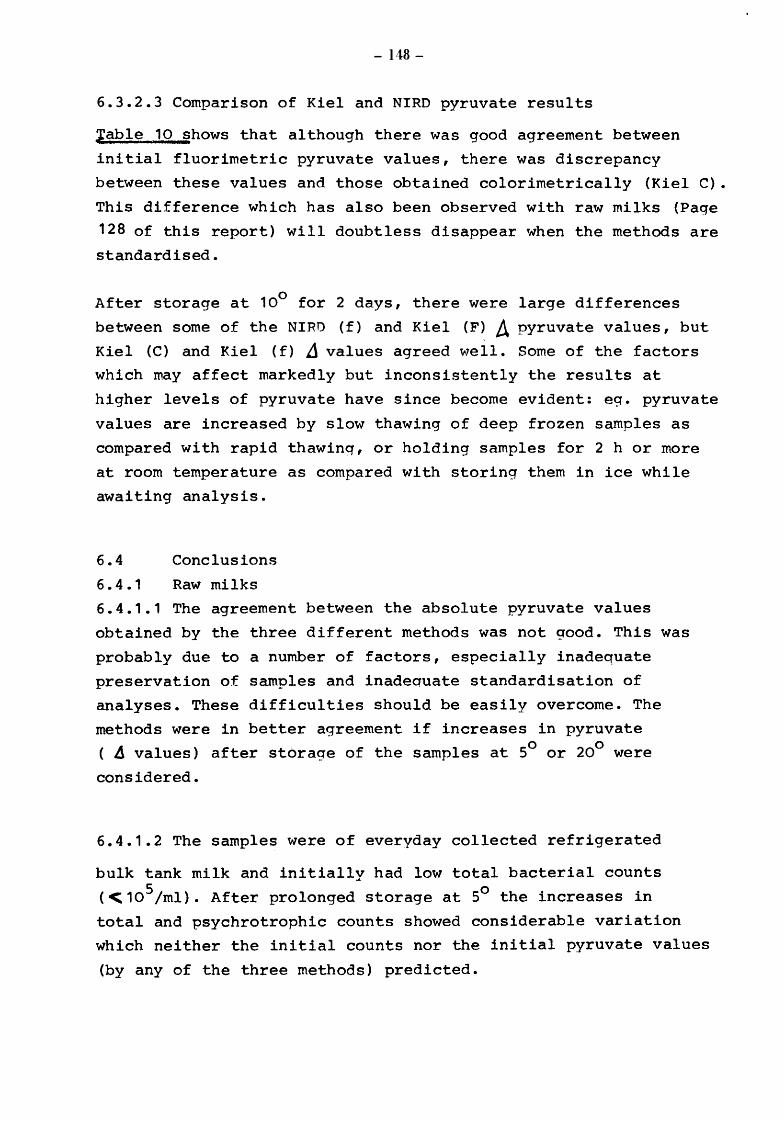
- 148-
6.3.2.3 Comparison of Kiel and NIRD pyruvate results
Iable 10 shows that although there was good agreement between
initial fluorimetric pyruvate values, there was discrepancy
between these values and those obtained colorimetrically (Kiel C).
This difference which has also been observed with raw milks (Page
128 of this report) will doubtless disappear when the methods are
standardised.
0 After storage at 10 for 2 days, there were large differences
between some of the NIRD (f) and Kiel (F) A pyruvate values, but
Kiel (C) and Kiel (f) J values agreed well. Some of the factors
which may affect markedly but inconsistently the results at
higher levels of pyruvate have since become evident: eg. pyruvate
values are increased by slow thawing of deep frozen samples as
compared with rapid thawing, or holding samples for 2 h or more
at room temperature as compared with storing them in ice while
awaiting analysis.
6.4
6.4.1
Conclusions
Raw milks
6.4.1.1 The agreement between the absolute pyruvate values
obtained by the three different methods was not good. This was
probably due to a number of factors, especially inadequate
preservation of samples and inadequate standardisation of
analyses. These difficulties should be easily overcome. The
methods were in better agreement if increases in pyruvate 0 0 ( ~ values) after storage of the samples at 5 or 20 were
considered.
6.4.1.2 The samples were of everyday collected refrigerated
bulk tank milk and initially had low total bacterial counts
(<105/ml). After prolonged storage at 5° the increases in
total and psychrotrophic counts showed considerable variation
which neither the initial counts nor the initial pyruvate values
(by any of the three methods) predicted.
- 149-
TABLE 19~omparison of the pyruvate values obtained by Kiel
and NIRD during the second trial of pasteurized milks, both
initially and after storage at 10° for 2 days
Absolute Pyruvate 10°
1:!1 Pyruvate 10° Initial Pyruvate after 2 days at after 2 days_ ,. 't
Dairy Sample K.iel NIRD Kie1 NIRD Kiel NIRD c F F c F F c F F
A 2.25 1. 75 1.25 3.6 2.9 8.0 1. 35 1 • 15 6.75 B 2."4 1. 75 1 • 1 3.3 2.6 6.8 0.9 0.85 5.7 c 1 .6 0.9 0.9 3. 1 2.55 5.2 1.45 1.65 4.3 D 1.55 0.8 0.75 3.2 2.5 6.0 1. 6 1.7 5.2
A E 1 .95 1 • 15 1.25 3.15 2.5 5.4 1 • 2 1. 35 4 0 1 F 1. 95 1.3 1 .5 2.95 2.45 4.7 1. 0 1 • 15 3.2 G 2. 1 1 .4 1 • 1 3.15 2.55 4.9 1. 05 1 • 15 3o8 H 2.0 1.45 0.8 2.85 2.4 4.7 0.85 0.95 3 .. 9 J 2.0 1 .55 1 .. 6 6.1 5.45 8.9 4. 1 3.9 7.3 K 2.0 1.55 I. 6 5. 15 4.25 8.5 3.15 2.7 6.9
L 2.3 1.95 1. 8 3o05 2.25 2.8 0.75 0.3 1 • 0 M 1. 85 1.7 1 04 4.25 3 .. 45 4.8 2.4 1. 75 3.4 N 1 • 8 1 .5 1.25 2 .. 5 1. 75 2.2 0.7 0.25 1 • 0 0 1 .. 85 1 .6 1 .. 4 2 .. 45 1. 75 1.8 0.6 o. 15 0.4
B p 2 .. 0 1.7 1 .. 4 5u2 4.85 5.2 3.45 3.15 3.8 Q 1 .. 8 1 .. 6 1 • 5 2o5 1. 8 1 .9 0.7 0.2 0.4 R 1 • 3 L.3 1 • 2 1 .. 95 1.4 1 • 4 0.65 o. 1 0.2 s 1.85 1.7 1 .. 6 2.6 1.85 2.0 0.75 0.25 0.4 T 1.25 1 0 35 1 .. 2 1.95 1.4 1 • 4 0.7 0.05 0.2 u 1 .6 1 • 5 1.3 2.5 1.8 1. 8 0.9 0.3 o.s C1 1 .9 1.6 1 .6 2.35 1 .8 2.0 0.45 0.2 0 .. 4 C2 1. 8 1.6 1 .5 2.3 1.7 1.7 0.5 o. 1 0.2 C3 1.8 1 .5 1 .4 2.4 1 .6 1 .9 0.6 0.1 0 .. 5
c C4 1. 85 1.55 1 .4 2.4 1.65 1 • 7 0.55 0.1 0.3 C5 1 • 9 1.55 1 • 4 2.4 1 .• 7 1 • 8 0.5 o. 15 0 .. 4 C6 1.85 1.6 1.5 2.4 1 .6 2.0 0.55 0 0 .. 5 C7 1 .9 1 .6 1 • 3 2.45 1. 7 1 • 7 0.55 o. 1 0 .. 4 C8 2.1 1.7 1 • 5 2.7 2.15 1.8 0.6 0.45 0 .. 3 C9 2.4 2.0 1 .9 3.0 2.5 2.3 0.6 0 .. 5 0 .. 4 C10 2.5 2.0 1. 9 3. 1 2.6 2.6 0.6 0 .. 55 0 .. 7
- 150-
6.4.1.3 Pyruvate values increased after storing the milks at
5° for 4d but increases were not closely related to increases
in total or psychrotroph bacterial counts. The relationship was
little or no better after a further 24h during which time both
the pyruvate levels and the counts increased.
6.4.1.4 With three milks known to have been produced under good
hygiene conditions, increases in pyruvate and total counts were 0 0 small after storage at 5 for Sd and 20 for 17h.
6.4.1.5 The confirmation that pyruvate increases with bacterial
growth at 5° suggests that further studies would be worthwhile.
Refrigerated bulk tank milks with higher initial colony counts,
and alternate day collected milks should be included to determine
whether initial pyruvate values are more informative for such Milks
and whether, after storaqe, increase in pyruvate correlates better
with increase in bacterial numbers, with the aim of detecting
those raw milks liable to undergo rapid deterioration at refrigera·
tion temperatures and which would therefore not withstand cold
storage at the processing dairy. Optimum conditions for pyruvate
production, e.g. time and temperature of pre-incubation need
further study. Milk production conditions on the farms should be
evaluated in detail. Such studies would reveal whether increase
in pyruvate is related to particular sources or degrees of conta
mination.
The results from a further 11 samples tested subsequently indicate
that a marked increase in nyruvate after pre-incubating daily
collected refrigerated tank milk for 24h at 18° would detect a
high proportion of milks which, after storage for 4 days at 5°,
would have psychrotroph counts of ~106 /ml and in which undesirable
changes might therefore occur durinq cold storage.
6.4.2 Pasteurized milks
The results indicate that storage of pasteurized milks at 10° for
one or more predetermined periods, eg. 2d, preceded and followed
- 151-
by the determination of pyruvate would be a rapid means of mea
suring the actual and potential quality of the milk. It may be 0 that temperatures other than 10 would be equally or more suitable
for this purpose.
6.5 References
Czok, R. & Lamprecht, W. (1970). "Methods of enzymatic analysis"
(2nd edition). Verlag Chernie, Weinheim. Vol. 2 p.1407. Bergmeyer.
International Dairy Federation (1971). Annual Bulletin Part II.
A monograph on bovine mastitis.
Ministry of Agriculture, Fisheries and Food (1968) Technical '
Bulletin no.17 "Bacteriological Techniques for Dairy Purposes" HMSO
National Institute for Research in Dairying Report (1971-72) p.115.
Thomas, S.B. (1969). Dairy Industries 34 351-5, 430-3, 501-5.
Wilson, G.S. (1935). Medical Research Council Special Report Series
no.206 "The Bacteriological Grading of Milk" HMSO.
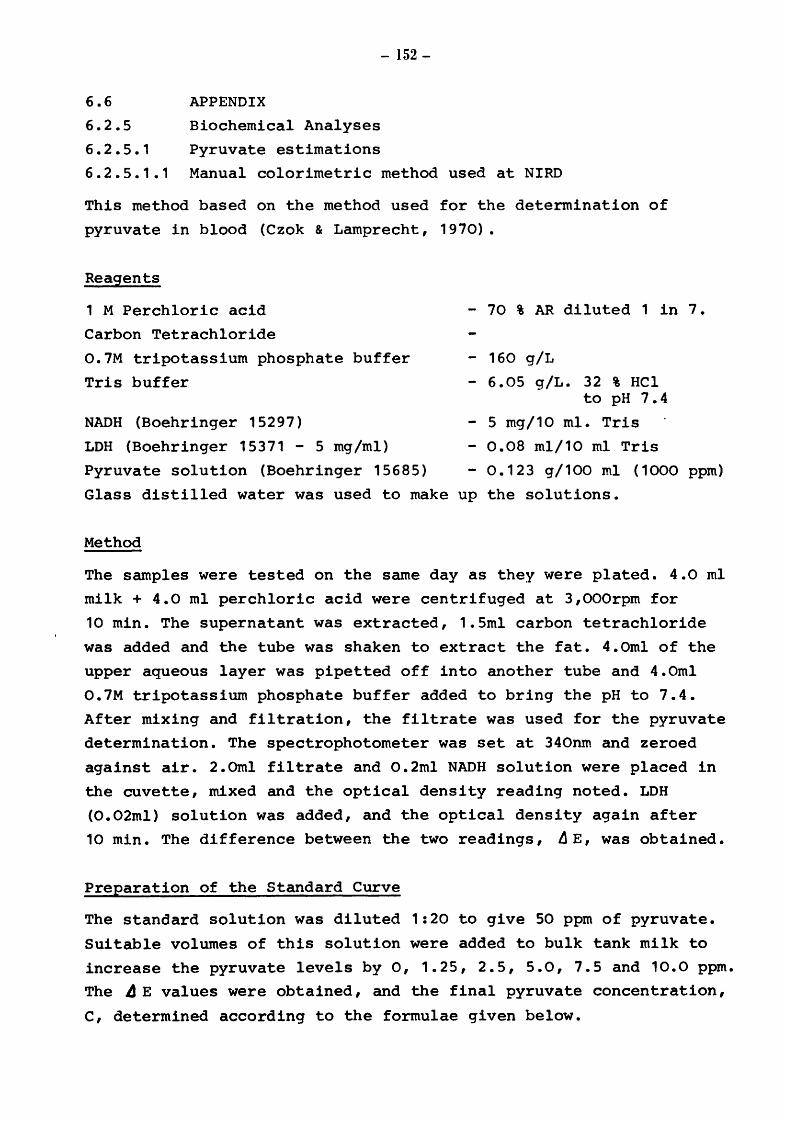
6.6 APPENDIX
Biochemical Analyses
Pyruvate estimations
- 152-
6.2.5
6.2.5.1
6.2.5.1.1 Manual colorimetric method used at NIRD
This method based on the method used for the determination of
pyruvate in blood (Czok & Lamprecht, 1970).
Reagents
1 M Perchloric acid
Carbon Tetrachloride
0.7M tripotassium phosphate buffer
Tris buffer
NADH (Boehringer 15297)
LDH (Boehringer 15371 - 5 mg/ml)
Pyruvate solution (Boehringer 15685)
- 70 % AR diluted 1 in 7.
- 160 g/L
- 6.05 g/L. 32 % HCl to pH 7.4
5 mg/10 ml. Tris
- 0.08 ml/10 ml Tris
- 0.123 g/100 ml (1000 ppm)
Glass distilled water was used to make up the solutions.
Method
The samples were tested on the same day as they were plated. 4.0 ml
milk + 4.0 ml perchloric acid were centrifuged at 3,000rpm for
10 min. The supernatant was extracted, 1.5ml carbon tetrachloride
was added and the tube was shaken to extract the fat. 4.0ml of the
upper aqueous layer was pipetted off into another tube and 4.0ml
0.7M tripotassium phosphate buffer added to bring the pH to 7.4.
After mixing and filtration, the filtrate was used for the pyruvate
determination. The spectrophotometer was set at 340nm and zeroed
against air. 2.0ml filtrate and 0.2ml NADH solution were placed in
the cuvette, mixed and the optical density reading noted. LDH
(0.02ml) solution was added, and the optical density again after
10 min. The difference between the two readings, ~E, was obtained.
Preparation of the Standard Curve
The standard solution was diluted 1:20 to give SO ppm of pyruvate.
Suitable volumes of this solution were added to bulk tank milk to
increase the pyruvate levels by o, 1.25, 2.5, 5.0, 7.5 and 10.0 ppm.
The ~E values were obtained, and the final pyruvate concentration,
c, determined according to the formulae given below.
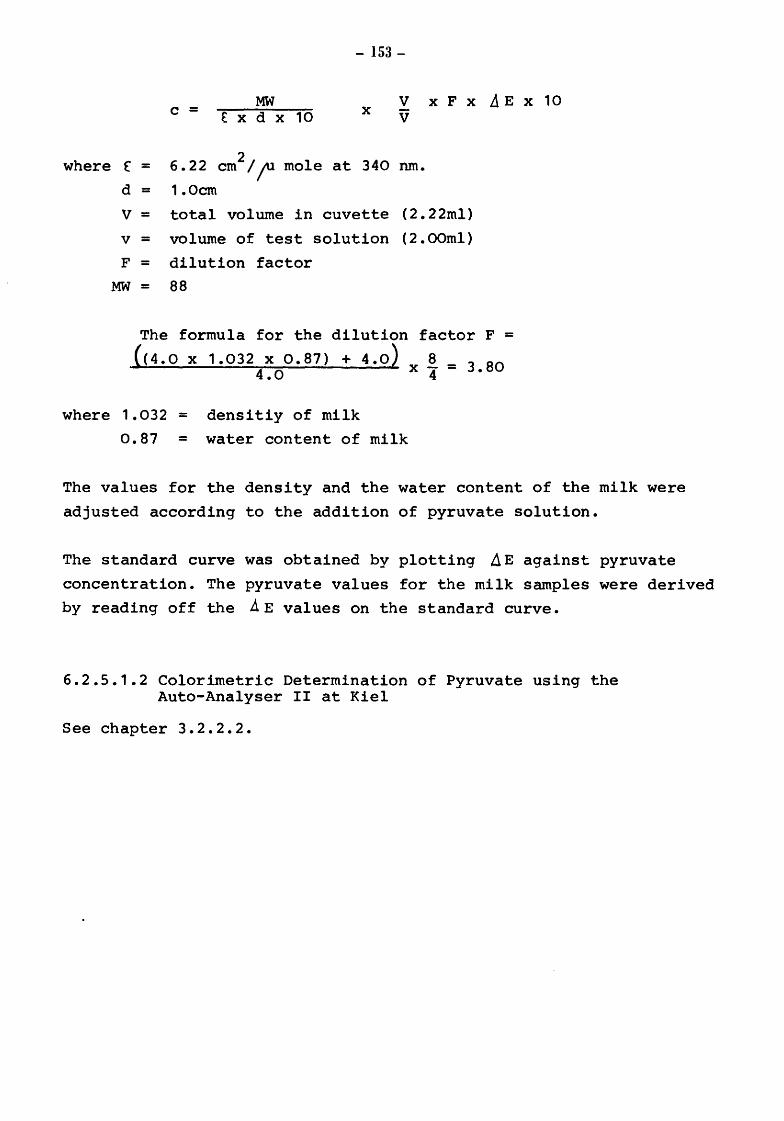
where (
d
v v
F
MW
=
=
=
=
=
=
MW c = € X d X 10
6.22 2 em I ;u mole 1.0cm
- 153-
X V X F X L1 E X 10 v
at 340 nm.
total volume in cuvette (2.22ml)
volume of test solution (2.00ml)
dilution factor 88
The formula for the dilution factor F =
((4.0 X 1.032 X 0.87) + 4.0) X 8 - - -4 = 3.80 4 .o
where 1.032 = densitiy of milk
0.87 = water content of milk
The values for the density and the water content of the milk were
adjusted according to the addition of pyruvate solution.
The standard curve was obtained by plotting ~E against pyruvate
concentration. The pyruvate values for the milk samples were derived
by reading off the A E values on the standard curve.
6.2.5.1.2 Colorimetric Determination of Pyruvate using the Auto-Analyser II at Kiel
See chapter 3.2.2.2.
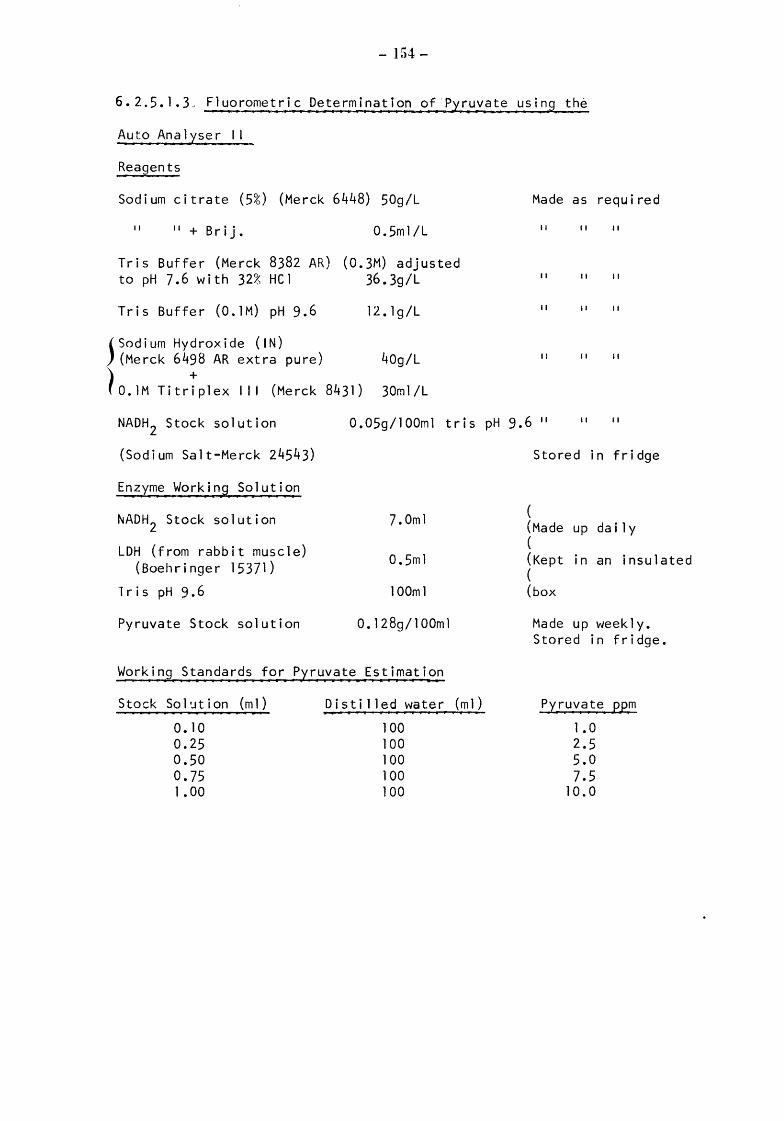
- 154-
6~ 2.5.1.3" Fluorometric Det.e.rm_i,nat ion pf, · Pyr,u,va.te using the -Auto Analyser II
Reagents
Sodium citrate (5%) (Merck 6448) 50g/L Made as required
II 11 + Brij. O.Sml/L II II II
Tris Buffer (Merck 8382 AR) ( 0. 3M) adjusted to pH 7.6 with 32~ HCl 36. 3g/L II II II
Tris Buffer ( 0. 1M) pH 9.6 12. lg/L II II II
j Sod i urn Hydroxide ( IN) (Merck 6498 AR extra pure) 40g/L II II II
) O.lM Titr~plex Ill (Merck 8431) 30m1/L
NADH 2 Stock solution
(Sodium Salt-Merck 24543)
0.05g/100ml tris pH 9.6 11 II II
Enzyme Working Solution
~ADH2 Stock solution
LDH (from rabbit muscle) (Boehringer 15371)
lris pH 9.6
Pyruvate Stock solution
7.0ml
0.5ml
lOOml
O.l28g/l00ml
Working Standards for P~ruvate Estimation -Stock Sol'Jtion (m 1) Distilled water
o. l 0 100 0.25 100 0.50 100 0.75 100 1 0 00 100
(m 1)
Stored in fridge
( (Made up daily ( (Kept in an insulated ( (box
Made up weekly. Stored in fridge.
P:rruvate ~~m 1 • 0 2a5 5.0 7.5
10.0
- 155-
0.42ml milk are diluted with 0.8m1 sodium citrate solution and segmented
with 0.23ml air, then dialysed against l.Oml tris buffer (pH 7.6, air
segmented) + 0.23ml enzyme working solution. The dialysate passes through
a water-bath at 37° to give the optimum reaction conditions. The addition
of 0.6ml sodium hydroxide stabilises the base-line.
Procedure
The system is calibrated at the start of each day's operation.
The reagents are aspirated through the system followed by three of the
lOppm standards with two sodium citrate washes in between. Using the
blank control, the peak given by the first lOppm standard is adjusted to
5 scale divisions. The baseline for the reagents is then set to 95 scale
divisions using the Full Scale Record control. The other two high
standards and intervening washes serve to check that these adjustments
are correct. All five standards are then run in ascending order of
concentration followed by two washes. Next the 2.5ppm standard, two washes,
five arbitrary milk samples in duplicate (the order chosen at random),
two washes and the 2.5ppm standard are run. The peaks given by the five
standards are used to plot·a standard curve on a chart reader. This
standard curve is used to check the reproducibility of the 2.5ppm standards
and the milk samples.
Following the routine calibration, milk samples to be analysed
are run through, with a 2.5ppm standard after every tenth sample.
When all the samples have been run, distilled water is pumped
through the system to clean the tubes.
Examination of Raw Milk Samples
Sixteen samples, which had been preserved by the addition of an
equal volume of IM Perchloric Acid, were despatched from NIRD weekly.
After centrifugation at 2900 rpm for 10 min the clear supernatant was
analysed for pyruvate by both methods. The standard pyruvate solutions
were also diluted with an equal volume of perchloric acid.

WASTE
- 156-
r----< >--~&...- AIR ~...-.&....+----< )o-Mo.lAI..-- NA- CITRATE
AMPLE
TRIS- BUFFER .....,...-.....-------------.<, ~-=a:-- ENZVME
........ ~----------------------<7 ~OH tawards S~8 t20
~~-CITRATE
WASTE 9 ·40 from FLUOROMETER
WASTE
~ :MIXING COIL TUBES : TYGON
ccm/min.
ENZYMATIC PYRUVATE DETERMINATION IN THE AUTO-ANALYZER SYSTEM II (7yto24 w.·l

- 157-
6.2.5.1.4 Fluorimetric Determinationof Lactate using the
Auto Analyser I I
Reagents
Sodium citrate (5%) (Merck 6448 AR)
Tris buffer (O.lM) (Merck 8382 AR) (adjusted to pH 7o6 with 32% HC1)
Hydrazine - Glycine Buffer
Hydrazine hydroxide (N2
H5
0H.80%)
Glycine
D i s t i 1 1 e d water
Oo 1M Titriplex Ill (Merck 8431)
Lactic Acid Enzyme Solution
NAD
5G'J /L
12.19/L
270.0ml
36oOg
1 .6L
30.0ml (adjusted to pH 9.5)
0.69
LDH (from Rabbit Muscle - Boehringer 15371) 2.0ml
Tris buffer
(Made up daily)
Lactate Stock Solution (lOOOppm)
L (+) Lactate - Lithium salt
Distilled water
Working Standards for the Lactic Acid Estimations
Stock solution (m 1) Distilled Water
1.0 100
3.0 100
5.0 100
10.0 100
20.0 100
lOOml
0. 1 07g
lOOml
Lactate (ppm)
10
30
50
100
200
The flow diagram is identical to the one for the pyruvate estimation.
- 158-
7. FINAL STATEMENTS
Milk - the most complete single food - is drawn twice a day in
thousands of farms and on its long way to the consumer is extremely
sensitive to bacterial deterioration. Saprophytic (non - pathogenic)
microbes in raw milk and milk for consumption are the limiting
factors for keepinq quality and thus of the greatest importance for
the consumer as well as for the dairy industry. Dependant on
growth conditions, saprophytic bacteria give rise to biochemical
changes in milk which may be described by the terms of glycolysis,
proteolysis and lipolysis and which characterize metabolic processes
in the degradation of carbohydrates, proteins and fats, respectively.
Accordingly, the growth of these bacteria in milk is associated with
changes which - in relation to the number, species and activity of
microbes - have an adverse effect on the organoleptic quality of the
product and finally causes its deterioration. It is not surprising
that the highest number of microbial analyses in a single food area
are probably done on milk. Because many farm milk supplies are
stored at refrigeration temperatures assessment of the psychrotrophic
microflora is an urgent objective. Current methods for examining the
bacteriological quality of milk are unsuitable for these micro
organisms and consequently new, automated and accurate methods are
urgently needed.
The principles of microbial spoilage indicate, that their are two
ways, by which it can be measured:
1. The quantitative and qualitative estimation of the microbial
flora as the causing factor and
2. The determination of key compounds of the microbial catabolism,
indicating the actual or potential state of deterioration.
There is no doubt, that the first way for many reasons is difficult
to realise and that under practical conditions the information
obtained is of limited value. As reqards the keeping quality it
is primarily not the absolut number of bacteria but rather their
biochemical activity which is of interest.
- 159-
The present study:
"Objectivation of the Bacteriological and Organoleptic Quality
of Milk for Consumption"
was based on th~ question, whether the keeping quality of market
milk can be assessed by the determination of pyruvate. Pyruvate
is a central substance in microbial catabolism and anpeared to be
suitable for·indicating the state of deterioration of milk and
- after preincubation of the sample - the activity of the conta~i
nating bacteria.
Like all enzymatic methods the enzymatic determination of pyruvate:
has the advantages of excellent specificity; high sensitivity; small
demand for laboratory cost per specimen; simplicity which m~es it
suitable for routine work.
A detailed chapter of this study deals with the principles of
bacterial catabolism in milk and the position of pyruvate as a
key compound within it even under psychrotrophic conditions.
In the following chapters results from experimental work done
in Kiel and in Reading, including the exchange of samples between
both, are described. In the context of practical application they
can be summarized as follows:
1. Automated sampling:
This together with an efficient preservation is an indisnensable
prerequisite for any testing procedure. Because pyruvate is
in solution samples can be taken automatically and accurately
by special equipment.
2. Preservation of samples:
This can be done with formaldehyde up to 24 hours, but with
trichloroacetic acid in a more precise way for a period of
five days.

- 160-
3. Standardization of the analytical method
The agreement between results from Reading and Kiel have con
tinued to improve but is still not adequate. One reason may be
the different techniques (manual and automated) used by the
authors. The rapporteurs, however, are convinced, that this
problem will be easily solved using the same technical procedure
when standards (samples and reagents) are available.
4. Interval of milk-collection and pyruvate
When raw milk is stored under refrigerated conditions a conti
nuous increase of pyruvate occurs, dependant on the number and
activity of contaminating microorganisms. An increase of pyruvate
(and therefore degradation of the milk) can be measured even in
those cases where there is no increase in the total number of
bacteria.
5. Bacterial numbers and pyruvate
The amount of pyruvate produced per colony-forming unit (cfu)
depends on the total number of microorganisms present in milk
and whether they are actively growing or not. The higher the
total number of organisms, the lower is the amount of pyruvate
produced per cfu. Thus the pyruvate measurement will provide
the desirable differentiation in the lower ranges of bacterial
numbers better than in the higher ones. Also more pyruvate is
produced if the bacteria are actively multiplying; pyruvate is
a more reliable indicator of deteriorative changes than is
bacterial numbers.
6. Influence of the raw milk quality on the keeping quality of
pasteurized milk
There is evidence, that the bacteriological quality of raw milk
immediately before heat-treatment influences the organoleptic
quality of the pasteurized product: the higher the bacterial
numbers in the raw milk the higher the pyruvate-level and the
shorter the keeping period of the pasteurized milk after heat
treatment.

- 161-
7. Keeping quality of pasteurized milk and pyruvate-difference
value
Within the context of this paper this is the most important
aspect. From the joint study done in Kiel and Reading it can
be concluded, both from a scientific basis and from experimental
results that the pyruvate-difference-value (pyruvate level after
preincubation minus the level before incubation) indicates the
keeping quality of refrigerated pasteurized milk earlier and
more certainly than any other test available.
The aim of this study to make a prelimenary assessment of the
pyruvate method has in particular indicated its potential as a test
for pasteurized milk.
Further work should involve the following items:
- Standardization of the method (manual and automated) including
the development of standard solutions in a biological matrix;
- International comparison tests;
- Confirmation of the results obtained concerning the pyruvate
keeping quality test;
- Elaboration of pyruvate threshold values for raw and pasteu
rized milk under different conditions of storage and pro
cessing;
-Elaboration of a draft for directives concerning the qu&ity
requirements of milk for consumption.
The forementioned projects will require at least one further year of
collaborative studies.
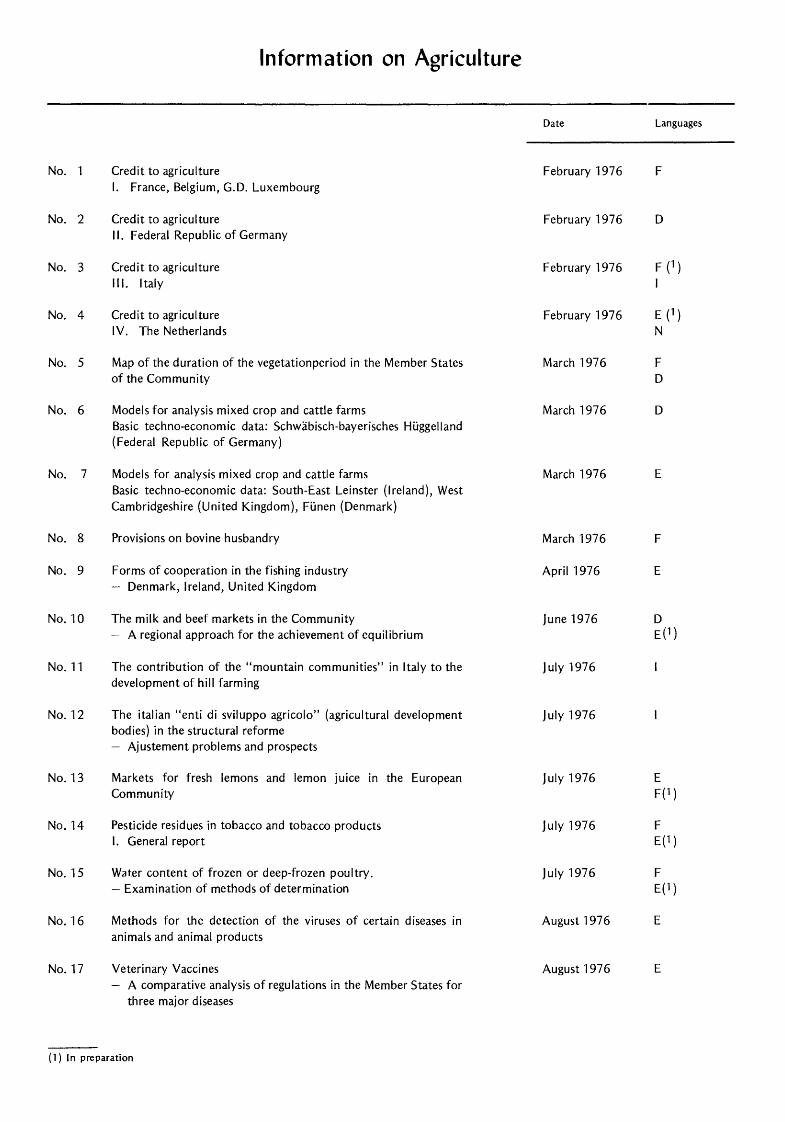
No. 1
No. 2
No. 3
No. 4
No. 5
No. 6
No. 7
No. 8
No. 9
No. 10
No. 11
No. 12
No. 13
No. 14
No. 15
No. 16
No. 17
Information on Agriculture
Credit to agriculture I. France, Belgium, G.D. Luxembourg
Credit to agriculture II. Federal Republic of Germany
Credit to agriculture Ill. Italy
Credit to agriculture IV. The Netherlands
Map of the duration of the vegetationperiod in the Member States of the Community
Models for analysis mixed crop and cattle farms Basic techno-economic data: Schwabisch-bayerisches Huggelland (Federal Republic of Germany)
Models for analysis mixed crop and cattle farms Basic techno-economic data: South-East Leinster (Ireland), West Cambridgeshire (United Kingdom), Funen (Denmark)
Provisions on bovine husbandry
Forms of cooperation in the fishing industry - Denmark, Ireland, United Kingdom
The milk and beef markets in the Community - A regional approach for the achievement of equilibrium
The contribution of the "mountain communities" in Italy to the development of hill farming
The italian "enti di sviluppo agricola" (agricultural development bodies) in the structural reforme - Ajustement problems and prospects
Markets for fresh lemons and lemon juice in the European Community
Pesticide residues in tobacco and tobacco products I. General report
Water content of frozen or deep-frozen poultry. - Examination of methods of determination
Methods for the detection of the viruses of certain diseases in animals and animal products
Veterinary Vaccines A comparative analysis of regulations in the Member States for three major diseases
(1) In preparation
Date
February 1976
February 1976
February 1976
February 1976
March 1976
March 1976
March 1976
March 1976
April 1976
june1976
july 1976
july 1976
july1976
july 1976
july 1976
August 1976
August 1976
Languages
F
D
F D
D
E
F
E
D E (1)
E F(1)
F E(1)
F E(1)
E
E

No. 18
No. 19
No.20
No. 21
The foreseeable trend in world availabilities of agricultural products and the consequences for the Community I. Wheat, feed grain, sugar - Summary
The foreseeable trend in world availabilities of agricultural products and the consequences for the Community II. Beef, sheepmeat, milk products
Forms of cooperation between farms for production and marketing in the new Member States
Objectivation of the bacteriological and organoleptic quality of milk for consumption
(1) In preparation.
Date Languages
August 1976 D F(1)
September 1976 D(l) F(1)
September 197 6 E
September 1976 E

Belgique - Belgie Momteur beige - Belgtsch Staatsblad
Rue de Louvam 40-42 -Leuvenseweg 40-42 1000 Bruxelles- 1000 Brussel Tel. (021 512 00 26 CCP 000-2005502-27 -Postrekemng 000-2005502-27
Sous-depot- Agentschap:
L1bra1r1e europl!enne - · Europese Boekhandel Rue de Ia Loi 244- Wetstraat 244 1040 Bruxettes - 1040 Brussel
Dan mark J.H. Schultz - Boghandel
Mantergade 19 1116 Kabenhavn K Tel. 14 11 95 Girokonto 1195
BR Deutschland Verl11g BundeunzelgM
5 Koln 1 - Bre1te StraBe- Postfach 108 006 Tel. (0221) 21 03 48 (Fernschreiber: Anze•ger Bonn 08 882 595) Postscheckkonto 834 00 Koln
France Service de vente en France des publteatKJns des Communsutes europeennes
Journal offteiel
26. rue Oesa•x 75 732 Pans Cedex 15 Tel. ( 1) 5 78 61 39 - CCP Pans 23-96
Ireland Stationery Offtee
Beggar's Bush Ouhlin 4 Tel. 68 84 33
Sales Offices
ltalia
L1brer1a dello Stato
P1azza G. Verd1 10 00198 Roma - Tel. (6) 8508
Telex 62008
CCP 1/2640
Agenzre:
00187 Roma -- V1a XX Settembre
(Palazzo M1ntstero del tesoro)
20 12 1 M1lano - Galiena
Vittono Emanuele 3
Tel. 80 64 06
Grand-Duche de Luxembourg
Offtetl des publiCations officie//es
des Communautils europeennes
5. rue du Commerce
Boite postale 1003 - Luxembourg
Tel. 490081 -- CCP 191-90
Compte courant bancatre :
BIL 8-109/6003/300
Nederland
StaatsdrukkeriJ- en wtgevenJbednjf
Chnstoffel Plant•tnstraat. 's-Gravenhage Tel. (070) 81 45 11
Postgtro 42 53 00
United Kingdom
H.M. StatiOnery Office
P.O. Box 569 London SE 1 9NH
Tel. (011 928 6977. ext. 365 National Giro Account 582-1002
United States of America
European Commumty InformatiOn Serv1ce
2100 M Street N.W
SUite 707
Washmgton O.C 20 037
Tel. (202) 872 8350
Schweiz - Suisse - Svizzera
Libra/fie Payor
6. rue Grenus
1211 Geneve
Tel. 31 89 50
CCP 12-236 Geneve
Sverige
L1bralf1e C.E. Fntze
2. Fredsgatan Stockholm 16
Post G1ro 193. Bank Gtro 73/4015
Espana
Librer/8 Mund1-Prensa
Castell6 37 Madnd 1
Tel 275 46 55
Other countries Office for Offte/81 Publications
of the European CommumtleS
5. rue du Commerce
Boite postale 1003 · Luxembourg Tel. 490081 - CCP 191-90
Compte courant bancatre :
BIL 8-109/6003/300

8875
FB 175,- DKr. 27,50 DM 12,- FF 21,- Lit. 3200
OFFICE FOR OFFICIAL PUBLICATIONS OF THE EUROPEAN COMMUNITIES Bo7te postole 1003 - Luxembourg
Fl. 12,10 £2,10 $5.-
7165/21