obesity - us epa · obesity is due primarily to an imbalance between caloric intake and activity....
TRANSCRIPT

Obesity | Health
254 America’s Children and the Environment | Third Edition
Obesity
Obesity is the term used to indicate the high range of weight for an individual of given height that is associated with adverse health effects.1 Definitions of overweight and obesity for adults are based on set cutoff points directly related to an individual’s body mass index (BMI, weight in kilograms divided by the square of height in meters). Essential to this definition is that a high degree of body weight be associated with a large amount of body fat. The BMI is correlated to body fat, but BMI varies with age and sex in children more than it does in adults. Thus the designation of a child or adolescent (ages 2 to 19 years) as either overweight or obese is based on comparing his or her BMI to a sex- and age-specific reference population (the CDC growth charts). Children and adolescents between the 85th and 94th percentiles of BMI-for-age are considered overweight; those greater than or equal to the 95th percentile are considered obese. The percentiles used to identify children as overweight or obese are fixed, and based on data collected from 1963–1980 (or, for children ages 2 to 6 years, data from 1963–1994).1-3
The prevalence of excessive body weight in the United States population has been increasing for several decades, though it has stabilized over the last several years.4-7 BMI is the most common screening measure used to determine whether an individual may be overweight or obese. The BMI does not measure body fat directly, but is used as a surrogate measure since it correlates with direct measures of body fat, especially at high BMI levels, and is inexpensive and easy to obtain in a clinical setting. The significance of a child being overweight is complicated by the BMI’s inability to distinguish between differences in mass due to muscle or due to the unhealthy accumulation of fatty tissue. A recent study found that less than half of “overweight” children had excess body fat, and that there are differences among race/ethnicity groups in the amount of body fat for a given BMI in children.8 Among children with an elevated BMI, some may have excess body fat, and others may be incorrectly identified as overweight because they have a higher amount of mass attributed to nonfatty tissue. Despite the limitations imposed by measuring the BMI, a rise in the prevalence of overweight children is cause for concern, since overweight children are more likely to become overweight or obese adults.9-11
Obesity has rapidly become a serious public health concern in the United States, and is associated with several adverse health effects in childhood and later in life, including cardiovascular disease risk factors (which includes hypertension and altered lipid levels),12-22
cancer,15,23,24 psychological stress,25-28 asthma,29-31 and diabetes.32-37 Some studies have found a relationship between obesity and early onset of puberty and early menarche in girls,38-40 although other research has found differences in the timing of puberty even after controlling for BMI in the population.41 As such, the extent to which the obesity epidemic may contribute to early puberty is unclear.
An emerging body of research suggests there may be common biological mechanisms underlying a cluster of adverse health effects (obesity, hypertension, altered lipid levels, and other metabolic abnormalities) referred to as metabolic syndrome. While the clinical utility of a diagnosis of metabolic syndrome is debated in the medical literature,42-44 the term describes an

Health | Obesity
America’s Children and the Environment | Third Edition 255
area of active research, and prospective data demonstrate the relevance of metabolic syndrome in obese children for both type 2 diabetes45 and cardiovascular disease.46 Metabolic syndrome has been identified in obese children and adolescents, and studies suggest a developmental origin of the condition.47-49 The consideration of obesity and metabolic effects as a group is supported by findings in laboratory animals, where early-life exposure to certain organophosphate pesticides can disrupt adult lipid metabolism, induce weight gain, and cause other metabolic responses that mimic those seen in diabetes and obesity.50-52 Given these relationships, obesity and other health conditions related to metabolism are discussed below.
Obesity is due primarily to an imbalance between caloric intake and activity. Increased caloric intake and reduced physical activity are likely the major drivers of obesity in children. Researchers are also investigating whether exposures to certain environmental chemical exposures may play a contributing role in childhood obesity.53,54 These chemicals, which are referred to as obesogens, are thought to be capable of disrupting the human body’s regulation of metabolism and the accumulation of fatty tissue.55 Studies have also reported associations between exposure to certain chemicals and diabetes in adults. Diabetes (Type 2) results from the body’s inability to regulate blood sugar levels with insulin in response to dietary intake, and is positively associated with the increasing rates of obesity seen in the U.S. population.56 Excess body weight is a risk factor for Type 2 diabetes. In the past, Type 2 diabetes has been diagnosed almost exclusively in adult populations, but it is now being diagnosed in youth—although with low prevalence (0.25%).56-59 However, the clinical designation of prediabetes (elevated blood glucose levels that do not meet the diagnostic criteria for diabetes) is prevalent in obese youth.35
While the possible contribution of chemical exposures to obesity is not clear, a number of animal and cellular studies provide some evidence that environmental chemical exposures may contribute to obesity and diabetes. Studies finding associations between chemical exposures and obesity in children are limited. A recent study reported that prenatal exposure to high levels of hexachlorobenzene was associated with increased BMI and weight in children at 6.5 years.60 Another recent study in Belgium, at relatively high exposure levels within the general population, reported an association between prenatal exposure to DDE (the primary metabolite of the pesticide DDT) and BMI, as well as an association between exposure to polychlorinated biphenyls (PCBs) and increased BMI during early childhood.61 In adults, associations have been reported between diabetes and both PCBs and dioxins at levels of exposure seen in the U.S. population.62,63 A study of adult occupational exposures to organochlorine and organophosphate pesticides reported an increased risk of diabetes in exposed workers.64 However, other studies have reported no association between these exposures and markers of obesity or diabetes.65-68 Several animal and cellular studies suggest that endocrine-disrupting chemicals (including bisphenol A, diethylstilbestrol, and tributyltin) may contribute to increased weight and diabetes.69-73 After reviewing these findings, scientists at a National Toxicology Program-sponsored workshop concluded that existing research provides evidence of plausibility (varying from “suggestive” to “strong” evidence) that several environmental chemicals could contribute to obesity and/or diabetes.74 For example, scientists concluded that the available data support the biological plausibility that exposure to a number of classes of pesticides may

Obesity | Health
256 America’s Children and the Environment | Third Edition
affect risk factors for obesity and diabetes. The National Institutes of Health Strategic Plan for Obesity Research and the White House Task Force on Childhood Obesity Report to the President also acknowledge a potential relationship between environmental exposures and obesity and cite the need for further research.75,76
Research has also considered a role for air pollution in childhood obesity and diabetes. In one recent study, adult mice fed a high-fat diet and exposed to concentrated particulate air pollution (PM2.5) experienced an increase in blood glucose levels and insulin resistance, which are precursors of diabetes.77 Other studies in animals and children have reported that obesity may result in greater susceptibility to the adverse effects of airborne pollutants such as PM2.5
and ozone, including airway inflammation, cardiovascular effects, and increased deposition of particles in the lungs.30,78,79 Air pollution may contribute to childhood obesity by limiting the number of days when air quality is appropriate for outdoor recreational activity, particularly in children with pre-existing respiratory conditions such as wheeze and asthma.80 Animal studies further suggest that diet-induced obesity may increase susceptibility to the effects of environmental toxicants such as PCBs, dioxins, and acrylamide.81-83
Other environmental factors are thought to contribute to the increasing rates of overweight and obesity seen in the U.S. population. The term “built environment” is used to describe the physical elements of the environment for a population.84,85 Multiple reviews of the literature have concluded that several properties of the built environment, including the extent of urban sprawl, housing density, access to food outlets, and access to recreational facilities, may be associated with overweight and obesity and/or levels of physical activity in children.84-90 The relationship between characteristics of the built environment and obesity is likely more significant in children than adults, because children are less able to leave their local environment without the help of an adult.91,92 Built environments that promote exercise through the inclusion of nearby recreational areas and walkable communities, and those that provide healthy eating options through reducing the number of fast food restaurants while providing access to fresh produce, are thought to reduce the frequency of obesity in children.84,85,93
“Green” environments that contain a greater number of natural environments and features such as parks, trees, and nature trails, may contribute to increased levels of physical activity in children that can reduce rates of obesity.94
Socioeconomically disadvantaged populations are more likely to be located in built environments with characteristics that promote lifestyles that increase rates of obesity in children.95-97 However, a child living in a suburban community with a higher socioeconomic status may spend greater amounts of time commuting in a car rather than walking, which may also contribute to a sedentary lifestyle that promotes obesity.98,99 Factors contributing to the prevalence of obesity may differ among environments. Previous research had suggested that differences in obesity rates in rural or urban environments were small.100,101 However, other recent studies have identified a higher prevalence of obesity in rural compared to urban environments.87,102 The complex interplay of behavioral, environmental, and physiological factors and the disparities in pediatric obesity observed in the population add to the difficulty in identifying effective interventions.
Health | Obesity
America’s Children and the Environment | Third Edition 257
The following indicators present the best nationally representative data on obesity in the U.S. child population. The first indicator shows the prevalence of obesity among children ages 2 to 17 years from 1976–2008. The second indicator presents the current prevalence of obesity by race/ethnicity and family income, using data from 2005–2008. Together these indicators highlight basic trends and current status in prevalence of childhood obesity in the United States.

Obesity | Health
258 America’s Children and the Environment | Third Edition
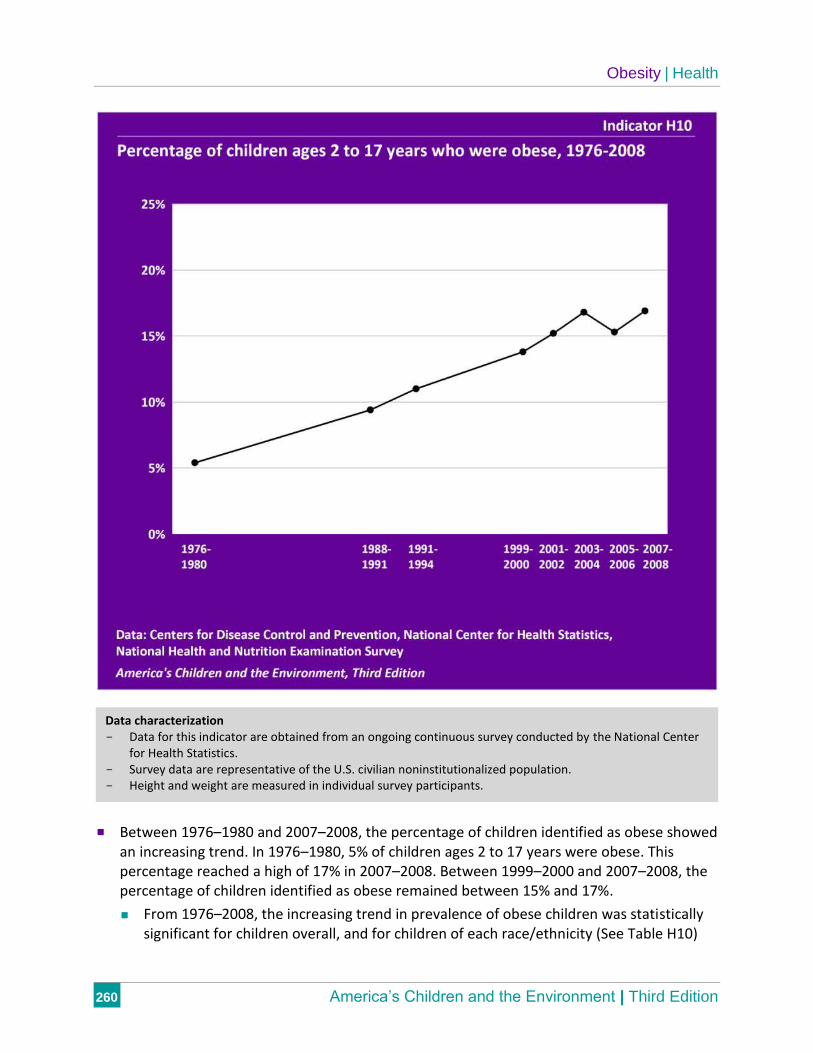
Indicator H10: Percentage of children ages 2 to 17 years who were obese, 1976–2008
Indicator H11: Percentage of children ages 2 to 17 years who were obese, by race/ethnicity and family income, 2005–2008
NHANES
The National Health and Nutrition Examination Survey (NHANES) provides data on childhood obesity in the United States. NHANES is a nationally representative survey of the health and nutritional status of the civilian noninstitutionalized U.S. population, conducted by the National Center for Health Statistics. Interviews and physical examinations are conducted with approximately 10,000 people in each two-year year survey cycle. Height and weight are measured for survey participants of all ages.
Obesity and BMI
Determination of obesity in children is based on the calculation of body mass index (BMI), which is correlated with body fat.103 First, the BMI is calculated by dividing an individual’s weight in kilograms by the square of his or her height in meters. For children and teenagers in the United States, the BMI number is then compared with an age- and sex-specific reference population based on the 2000 CDC growth charts. These charts are based on national data collected from 1963–1994 for children 2 through 6 years of age and from 1963–1980 for children ages 7 years and older.2 These growth charts apply to all racial and ethnic groups, and were obtained from nationally representative surveys. Children and teenagers with BMIs at or above the 95th percentile on the growth charts are classified as obese.1,3
Data Presented in the Indicators
Indicator H10 presents the percentage of children ages 2 to 17 years who were obese from NHANES surveys conducted from 1976 through 2008. Indicator H11 presents the current prevalence of childhood obesity by race/ethnicity and family income using the 2005–2006 and 2007–2008 surveys combined. The data from two NHANES cycles are combined to increase the statistical reliability of the estimates for each race/ethnicity and income group, and to reduce any possible influence of geographic variability that may occur in two-year NHANES data. Four race/ethnicity groups are presented in Indicator H11: White non-Hispanic, Black non-Hispanic, Mexican-American, and “All Other Races/Ethnicities.” The “All Other Races/Ethnicities” category includes all other races and ethnicities not specified, together with those individuals
About the Indicators: Indicators H10 and H11 present the prevalence of obesity in U.S. children ages 2 to 17 years. The data are from a national survey that measures weight and height in a representative sample of the U.S. population every two years. Indicator H10 shows the trend in obesity prevalence from 1976–2008. Indicator H11 presents comparisons of current obesity rates in children of different race/ethnicities and income levels, using data for 2005–2008.
Health | Obesity
America’s Children and the Environment | Third Edition 259
who report more than one race. The limits of the sample design and sample size often prevent statistically reliable estimates for smaller race/ethnicity groups. The data are also tabulated across three income categories: all incomes, below the poverty level, and greater than or equal to the poverty level.
Please see the Introduction to the Health section for discussion of statistical significance testing applied to these indicators.
Obesity | Health
260 America’s Children and the Environment | Third Edition
Between 1976–1980 and 2007–2008, the percentage of children identified as obese showed an increasing trend. In 1976–1980, 5% of children ages 2 to 17 years were obese. This percentage reached a high of 17% in 2007–2008. Between 1999–2000 and 2007–2008, the percentage of children identified as obese remained between 15% and 17%.
From 1976–2008, the increasing trend in prevalence of obese children was statistically significant for children overall, and for children of each race/ethnicity (See Table H10)
Data characterization - Data for this indicator are obtained from an ongoing continuous survey conducted by the National Center
for Health Statistics. - Survey data are representative of the U.S. civilian noninstitutionalized population. - Height and weight are measured in individual survey participants.
Health | Obesity
America’s Children and the Environment | Third Edition 261
and age group (Table H10a). From 1999–2008, the trends were not statistically significant for each of these groups.

Obesity | Health
262 America’s Children and the Environment | Third Edition
In 2005–2008, 16% of children ages 2 to 17 years were classified as obese.
In 2005–2008, a higher percentage of Mexican-American and Black non-Hispanic children were obese at 22% and 20%, respectively, compared with 14% of White non-Hispanic children and 14% of children of “All Other Races/Ethnicities.”
Data characterization - Data for this indicator are obtained from an ongoing continuous survey conducted by the National Center
for Health Statistics. - Survey data are representative of the U.S. civilian noninstitutionalized population. - Height and weight are measured in individual survey participants.

Health | Obesity
America’s Children and the Environment | Third Edition 263
The greater prevalence of obesity among Mexican-American and Black non-Hispanic children, compared with the lower prevalence among White non-Hispanic children and children of “All Other Races/Ethnicities,” was statistically significant.
Among children overall, the prevalence of obesity was greater in children with family incomes below poverty level than in those above poverty level. However, when accounting for differences by race/ethnicity as well as poverty status, children of “All Other Races/Ethnicities” were the only group to have a statistically significant association between low family income and higher prevalence of obesity.
References | Health
America’s Children and the Environment | Third Edition 381 H
HealthObesity1.CentersforDiseaseControlandPrevention.2010.DefiningChildhoodOverweightandObesity.RetrievedApril6,2010fromhttp://www.cdc.gov/obesity/childhood/defining.html.
2.CentersforDiseaseControlandPrevention.2010.CDCGrowthCharts.RetrievedMay4,2010fromhttp://www.cdc.gov/growthcharts/.
3.Krebs,N.F.,J.H.Himes,D.Jacobson,T.A.Nicklas,P.Guilday,andD.Styne.2007.Assessmentofchildandadolescentoverweightandobesity.Pediatrics120(Suppl4):S193‐228.
4.Ogden,C.L.,R.P.Troiano,R.R.Briefel,R.J.Kuczmarski,K.M.Flegal,andC.L.Johnson.1997.PrevalenceofoverweightamongpreschoolchildrenintheUnitedStates,1971through1994.Pediatrics99(4):E1.
5.Ogden,C.L.,M.D.Carroll,L.R.Curtin,M.A.McDowell,C.J.Tabak,andK.M.Flegal.2006.PrevalenceofoverweightandobesityintheUnitedStates,1999‐2004.JournaloftheAmericanMedicalAssociation295(13):1549‐55.
6.Ogden,C.L.,M.D.Carroll,L.R.Curtin,M.M.Lamb,andK.M.Flegal.2010.PrevalenceofhighbodymassindexinUSchildrenandadolescents,2007‐2008.JournaloftheAmericanMedicalAssociation303(3):242‐9.
7.Hedley,A.A.,C.L.Ogden,C.L.Johnson,M.D.Carroll,L.R.Curtin,andK.M.Flegal.2004.PrevalenceofoverweightandobesityamongUSchildren,adolescents,andadults,1999‐2002.JournaloftheAmericanMedicalAssociation291(23):2847‐50.
8.Flegal,K.M.,C.L.Ogden,J.A.Yanovski,D.S.Freedman,J.A.Shepherd,B.I.Graubard,andL.G.Borrud.2010.Highadiposityandhighbodymassindex‐for‐ageinUSchildrenandadolescentsoverallandbyrace‐ethnicgroup.TheAmericanJournalofClinicalNutrition91(4):1020‐6.
9.Serdula,M.K.,D.Ivery,R.J.Coates,D.S.Freedman,D.F.Williamson,andT.Byers.1993.Doobesechildrenbecomeobeseadults?Areviewoftheliterature.PreventiveMedicine22(2):167‐77.
10.The,N.S.,C.Suchindran,K.E.North,B.M.Popkin,andP.Gordon‐Larsen.2010.Associationofadolescentobesitywithriskofsevereobesityinadulthood.JAMA:TheJournaloftheAmericanMedicalAssociation304(18):2042‐7.
11.Whitaker,R.C.,J.A.Wright,M.S.Pepe,K.D.Seidel,andW.H.Dietz.1997.Predictingobesityinyoungadulthoodfromchildhoodandparentalobesity.NewEnglandJournalofMedicine337(13):869‐73.
12.Aglony,M.,M.Acevedo,andG.Ambrosio.2009.Hypertensioninadolescents.ExpertReviewofCardiovascularTherapy7(12):1595‐603.
13.Aguilar,A.,V.Ostrow,F.DeLuca,andE.Suarez.2010.Elevatedambulatorybloodpressureinamulti‐ethnicpopulationofobesechildrenandadolescents.JournalofPediatrics156(6):930‐5.
14.Bartosh,S.M.,andA.J.Aronson.1999.Childhoodhypertension.Anupdateonetiology,diagnosis,andtreatment.PediatricClinicsofNorthAmerica46(2):235‐52.
15.Biro,F.M.,andM.Wien.2010.Childhoodobesityandadultmorbidities.AmericanJournalofClinicalNutrition91(5):1499S‐1505S.
16.deKroon,M.L.,C.M.Renders,J.P.vanWouwe,S.vanBuuren,andR.A.Hirasing.2010.TheTerneuzenBirthCohort:BMIchangebetween2and6yearsismostpredictiveofadultcardiometabolicrisk.PLoSOne5(11):e13966.
17.Falkner,B.2009.Hypertensioninchildrenandadolescents:epidemiologyandnaturalhistory.PediatricNephrology25(7):1219‐24.
18.Franks,P.W.,R.L.Hanson,W.C.Knowler,M.L.Sievers,P.H.Bennett,andH.C.Looker.2010.Childhoodobesity,othercardiovascularriskfactors,andprematuredeath.NewEnglandJournalofMedicine362(6):485‐93.
19.Mitsnefes,M.M.2006.Hypertensioninchildrenandadolescents.PediatricClinicsofNorthAmerica53(3):493‐512,viii.
20.Raghuveer,G.2010.Lifetimecardiovascularriskofchildhoodobesity.AmericanJournalofClinicalNutrition91(5):1514S‐1519S.
21.Tirosh,A.,I.Shai,A.Afek,G.Dubnov‐Raz,N.Ayalon,B.Gordon,E.Derazne,D.Tzur,A.Shamis,S.Vinker,etal.2011.AdolescentBMItrajectoryandriskofdiabetesversuscoronarydisease.TheNewEnglandJournalofMedicine364(14):1315‐25.
22.Williams,C.L.,andB.A.Strobino.2008.Childhooddiet,overweight,andCVDriskfactors:theHealthyStartproject.PreventiveCardiology11(1):11‐20.
23.Brawer,R.,N.Brisbon,andJ.Plumb.2009.Obesityandcancer.PrimaryCare36(3):509‐31.
24.Donohoe,C.L.,G.P.Pidgeon,J.Lysaght,andJ.V.Reynolds.2010.Obesityandgastrointestinalcancer.BritishJournalofSurgery97(5):628‐42.
25.Gale,C.R.,G.D.Batty,andI.J.Deary.2008.Locusofcontrolatage10yearsandhealthoutcomesandbehaviorsatage30years:the1970BritishCohortStudy.PsychosomaticMedicine70(4):397‐403.
26.Gundersen,C.,B.J.Lohman,S.Garasky,S.Stewart,andJ.Eisenmann.2008.Foodsecurity,maternalstressors,andoverweightamonglow‐incomeUSchildren:resultsfromtheNationalHealthandNutritionExaminationSurvey(1999‐2002).Pediatrics122(3):e529‐40.
Health | References
382 America’s Children and the Environment | Third Edition
Obesity(continued)27.Koch,F.S.,A.Sepa,andJ.Ludvigsson.2008.Psychologicalstressandobesity.JournalofPediatrics153(6):839‐44.
28.Stunkard,A.J.,M.S.Faith,andK.C.Allison.2003.Depressionandobesity.BiologicalPsychiatry54(3):330‐7.
29.Ahmad,N.,S.Biswas,S.Bae,K.E.Meador,R.Huang,andK.P.Singh.2009.AssociationbetweenobesityandasthmainUSchildrenandadolescents.JournalofAsthma46(7):642‐6.
30.Bennett,W.D.,andK.L.Zeman.2004.Effectofbodysizeonbreathingpatternandfine‐particledepositioninchildren.JournalofAppliedPhysiology97(3):821‐6.
31.Fiorino,E.K.,andL.J.Brooks.2009.Obesityandrespiratorydiseasesinchildhood.ClinicsinChestMedicine30(3):601‐8,x.
32.Chiarelli,F.,andM.L.Marcovecchio.2008.Insulinresistanceandobesityinchildhood.EuropeanJournalofEndocrinology159(Suppl1):S67‐74.
33.Lamb,M.M.,D.Dabelea,X.Yin,L.G.Ogden,G.J.Klingensmith,M.Rewers,andJ.M.Norris.2010.Early‐lifepredictorsofhigherbodymassindexinhealthychildren.AnnalsofNutrition&Metabolism56(1):16‐22.
34.Lee,J.M.,M.J.Okumura,M.M.Davis,W.H.Herman,andJ.G.Gurney.2006.PrevalenceanddeterminantsofinsulinresistanceamongU.S.adolescents:apopulation‐basedstudy.DiabetesCare29(11):2427‐32.
35.Ostro,B.,L.Roth,B.Malig,andM.Marty.2009.Theeffectsoffineparticlecomponentsonrespiratoryhospitaladmissionsinchildren.EnvironmentalHealthPerspectives117(3):475‐80.
36.Weigensberg,M.J.,andM.I.Goran.2009.Type2diabetesinchildrenandadolescents.Lancet373(9677):1743‐4.
37.Zeitler,P.,andO.Pinhas‐Hamiel.2008.Preventionandscreeningfortype2diabetesinyouth.EndocrineResearch33(1‐2):73‐91.
38.Aksglaede,L.,A.Juul,L.W.Olsen,andT.I.Sorensen.2009.Ageatpubertyandtheemergingobesityepidemic.PLoSOne4(12):e8450.
39.Kaplowitz,P.B.2008.Linkbetweenbodyfatandthetimingofpuberty.Pediatrics121Suppl3:S208‐17.
40.Slyper,A.H.1998.Childhoodobesity,adiposetissuedistribution,andthepediatricpractitioner.Pediatrics102(1):e4.
41.Aksglaede,L.,K.Sorensen,J.H.Petersen,N.E.Skakkebaek,andA.Juul.2009.Recentdeclineinageatbreastdevelopment:theCopenhagenPubertyStudy.Pediatrics123(5):e932‐9.
42.Gale,E.A.2005.Themythofthemetabolicsyndrome.Diabetologia48(9):1679‐83.
43.Pratley,R.E.2007.Metabolicsyndrome:whythecontroversy?CurrentDiabetesReports7(1):56‐9.
44.Reaven,G.M.2011.Themetabolicsyndrome:timetogetoffthemerry‐go‐round?JournalofInternalMedicine269(2):127‐36.
45.Morrison,J.A.,L.A.Friedman,P.Wang,andC.J.Glueck.2008.Metabolicsyndromeinchildhoodpredictsadultmetabolicsyndromeandtype2diabetesmellitus25to30yearslater.TheJournalofPediatrics152(2):201‐6.
46.Morrison,J.A.,L.A.Friedman,andC.Gray‐McGuire.2007.Metabolicsyndromeinchildhoodpredictsadultcardiovasculardisease25yearslater:thePrincetonLipidResearchClinicsFollow‐upStudy.Pediatrics120(2):340‐5.
47.Cruz,M.L.,andM.I.Goran.2004.Themetabolicsyndromeinchildrenandadolescents.CurrentDiabetesReports4(1):53‐62.
48.Ozanne,S.E.,andC.N.Hales.2002.Earlyprogrammingofglucose‐insulinmetabolism.TrendsinEndocrinology&Metabolism13(9):368‐73.
49.Weiss,R.,J.Dziura,T.S.Burgert,W.V.Tamborlane,S.E.Taksali,C.W.Yeckel,K.Allen,M.Lopes,M.Savoye,J.Morrison,etal.2004.Obesityandthemetabolicsyndromeinchildrenandadolescents.NewEnglandJournalofMedicine350(23):2362‐74.
50.Lassiter,T.L.,andS.Brimijoin.2008.Ratsgainexcessweightafterdevelopmentalexposuretotheorganophosphorothionatepesticide,chlorpyrifos.NeurotoxicologyandTeratology30(2):125‐30.
51.Lassiter,T.L.,I.T.Ryde,E.A.Mackillop,K.K.Brown,E.D.Levin,F.J.Seidler,andT.A.Slotkin.2008.Exposureofneonatalratstoparathionelicitssex‐selectivereprogrammingofmetabolismandalterstheresponsetoahigh‐fatdietinadulthood.EnvironmentalHealthPerspectives116(11):1456‐62.
52.Slotkin,T.A.,K.K.Brown,andF.J.Seidler.2005.Developmentalexposureofratstochlorpyrifoselicitssex‐selectivehyperlipidemiaandhyperinsulinemiainadulthood.EnvironmentalHealthPerspectives113(10):1291‐4.
53.LaMerrill,M.,andL.S.Birnbaum.2011.Childhoodobesityandenvironmentalchemicals.TheMountSinaiJournalofMedicine78(1):22‐48.
54.Newbold,R.R.2010.Impactofenvironmentalendocrinedisruptingchemicalsonthedevelopmentofobesity.Hormones9(3):206‐17.
55.Grun,F.,andB.Blumberg.2006.Environmentalobesogens:organotinsandendocrinedisruptionvianuclearreceptorsignaling.Endocrinology147(6Suppl):S50‐5.
56.AmericanDiabetesAssociation.2000.Type2diabetesinchildrenandadolescents.Pediatrics105(3Pt1):671‐80.
References | Health
America’s Children and the Environment | Third Edition 383
Obesity(continued)57.Amed,S.,D.Daneman,F.H.Mahmud,andJ.Hamilton.2010.Type2diabetesinchildrenandadolescents.ExpertReviewofCardiovascularTherapy8(3):393‐406.
58.Karam,J.G.,andS.I.McFarlane.2008.Preventionoftype2DM:implicationsforadolescentsandyoungadults.PediatricEndocrinologyReviews5(Suppl4):980‐8.
59.CentersforDiseaseControlandPrevention.2008.NationalDiabetesFactSheet:GeneralInformationandNationalEstimatesonDiabetesintheUnitedStates,2007.Atlanta,GA:CDC.http://www.cdc.gov/diabetes/pubs/pdf/ndfs_2007.pdf.
60.Smink,A.,N.Ribas‐Fito,R.Garcia,M.Torrent,M.A.Mendez,J.O.Grimalt,andJ.Sunyer.2008.Exposuretohexachlorobenzeneduringpregnancyincreasestheriskofoverweightinchildrenaged6years.ActaPaediatrica97(10):1465‐9.
61.Verhulst,S.L.,V.Nelen,E.D.Hond,G.Koppen,C.Beunckens,C.Vael,G.Schoeters,andK.Desager.2009.Intrauterineexposuretoenvironmentalpollutantsandbodymassindexduringthefirst3yearsoflife.EnvironmentalHealthPerspectives117(1):122‐6.
62.Codru,N.,M.J.Schymura,S.Negoita,R.Rej,andD.O.Carpenter.2007.DiabetesinrelationtoserumlevelsofpolychlorinatedbiphenylsandchlorinatedpesticidesinadultNativeAmericans.EnvironmentalHealthPerspectives115(10):1442‐7.
63.Everett,C.J.,I.L.Frithsen,V.A.Diaz,R.J.Koopman,W.M.Simpson,Jr.,andA.G.Mainous,3rd.2007.Associationofapolychlorinateddibenzo‐p‐dioxin,apolychlorinatedbiphenyl,andDDTwithdiabetesinthe1999‐2002NationalHealthandNutritionExaminationSurvey.EnvironmentalResearch103(3):413‐8.
64.Montgomery,M.P.,F.Kamel,T.M.Saldana,M.C.Alavanja,andD.P.Sandler.2008.Incidentdiabetesandpesticideexposureamonglicensedpesticideapplicators:AgriculturalHealthStudy,1993‐2003.AmericanJournalofEpidemiology167(10):1235‐46.
65.Blanck,H.M.,M.Marcus,C.Rubin,P.E.Tolbert,V.S.Hertzberg,A.K.Henderson,andR.H.Zhang.2002.Growthingirlsexposedinuteroandpostnatallytopolybrominatedbiphenylsandpolychlorinatedbiphenyls.Epidemiology13(2):205‐10.
66.Cupul‐Uicab,L.A.,M.Hernandez‐Avila,E.A.Terrazas‐Medina,M.L.Pennell,andM.P.Longnecker.2010.PrenatalexposuretothemajorDDTmetabolite1,1‐dichloro‐2,2‐bis(p‐chlorophenyl)ethylene(DDE)andgrowthinboysfromMexico.EnvironmentalResearch110(6):595‐603.
67.Gladen,B.C.,M.A.Klebanoff,M.L.Hediger,S.H.Katz,D.B.Barr,M.D.Davis,andM.P.Longnecker.2004.PrenatalDDTexposureinrelationtoanthropometricandpubertalmeasuresinadolescentmales.EnvironmentalHealthPerspectives112(17):1761‐7.
68.Jackson,L.W.,C.D.Lynch,P.J.Kostyniak,B.M.McGuinness,andG.M.Louis.2010.Prenatalandpostnatalexposuretopolychlorinatedbiphenylsandchildsizeat24monthsofage.ReproductiveToxicology29(1):25‐31.
69.Grun,F.,andB.Blumberg.2009.Endocrinedisruptersasobesogens.MolecularandCellularEndocrinology304(1‐2):19‐29.
70.Grun,F.,H.Watanabe,Z.Zamanian,L.Maeda,K.Arima,R.Cubacha,D.M.Gardiner,J.Kanno,T.Iguchi,andB.Blumberg.2006.Endocrine‐disruptingorganotincompoundsarepotentinducersofadipogenesisinvertebrates.MolecularEndocrinology20(9):2141‐55.
71.Hugo,E.R.,T.D.Brandebourg,J.G.Woo,J.Loftus,J.W.Alexander,andN.Ben‐Jonathan.2008.BisphenolAatenvironmentallyrelevantdosesinhibitsadiponectinreleasefromhumanadiposetissueexplantsandadipocytes.EnvironmentalHealthPerspectives116(12):1642‐7.
72.Newbold,R.R.,E.Padilla‐Banks,W.N.Jefferson,andJ.J.Heindel.2008.Effectsofendocrinedisruptorsonobesity.InternationalJournalofAndrology31(2):201‐8.
73.Newbold,R.R.,E.Padilla‐Banks,R.J.Snyder,T.M.Phillips,andW.N.Jefferson.2007.Developmentalexposuretoendocrinedisruptorsandtheobesityepidemic.ReproductiveToxicology23(3):290‐6.
74.Thayer,K.A.,J.J.Heindel,J.R.Bucher,andM.A.Gallo.2012.Roleofenvironmentalchemicalsindiabetesandobesity:aNationalToxicologyProgramworkshopreview.EnvironmentalHealthPerspectives120(6):779‐89.
75.U.S.DepartmentofHealthandHumanServices.2011.StrategicPlanforNIHObesityResearch.Bethesda,MD:NationalInstitutesofHealthObesityResearchTaskForce.NIHPublicationNo.11‐5493.http://www.obesityresearch.nih.gov/About/StrategicPlanforNIH_Obesity_Research_Full‐Report_2011.pdf.
76.WhiteHouseTaskForceonChildhoodObesity.2010.SolvingtheProblemofChildhoodObesityWithinaGeneration.Washington,DC:ExecutiveOfficeofthePresident.http://www.letsmove.gov/sites/letsmove.gov/files/TaskForce_on_Childhood_Obesity_May2010_FullReport.pdf.
77.Sun,Q.,P.Yue,J.A.Deiuliis,C.N.Lumeng,T.Kampfrath,M.B.Mikolaj,Y.Cai,M.C.Ostrowski,B.Lu,S.Parthasarathy,etal.2009.Ambientairpollutionexaggeratesadiposeinflammationandinsulinresistanceinamousemodelofdiet‐inducedobesity.Circulation119(4):538‐46.
78.Chen,J.C.,J.M.Cavallari,P.H.Stone,andD.C.Christiani.2007.Obesityisamodifierofautonomiccardiacresponsestofinemetalparticulates.EnvironmentalHealthPerspectives115(7):1002‐6.
79.Shore,S.A.,Y.M.Rivera‐Sanchez,I.N.Schwartzman,andR.A.Johnston.2003.Responsestoozoneareincreasedinobesemice.JournalofAppliedPhysiology95(3):938‐45.
Health | References
384 America’s Children and the Environment | Third Edition
Obesity(continued)80.Corbo,G.M.,F.Forastiere,M.DeSario,L.Brunetti,E.Bonci,M.Bugiani,E.Chellini,S.LaGrutta,E.Migliore,R.Pistelli,etal.2008.Wheezeandasthmainchildren:associationswithbodymassindex,sports,televisionviewing,anddiet.Epidemiology19(5):747‐55.
81.Arzuaga,X.,N.Ren,A.Stromberg,E.P.Black,V.Arsenescu,L.A.Cassis,Z.Majkova,M.Toborek,andB.Hennig.2009.Inductionofgenepatternchangesassociatedwithdysfunctionallipidmetabolisminducedbydietaryfatandexposuretoapersistentorganicpollutant.ToxicologyLetters189(2):96‐101.
82.Ghanayem,B.I.,R.Bai,G.E.Kissling,G.Travlos,andU.Hoffler.2010.Diet‐inducedobesityinmalemiceisassociatedwithreducedfertilityandpotentiationofacrylamide‐inducedreproductivetoxicity.BiologyofReproduction82(1):96‐104.
83.LaMerrill,M.,R.Harper,L.S.Birnbaum,R.D.Cardiff,andD.W.Threadgill.2010.Maternaldioxinexposurecombinedwithadiethighinfatincreasesmammarycancerincidenceinmice.EnvironmentalHealthPerspectives118(5):596‐601.
84.Papas,M.A.,A.J.Alberg,R.Ewing,K.J.Helzlsouer,T.L.Gary,andA.C.Klassen.2007.Thebuiltenvironmentandobesity.EpidemiologicReviews29:129‐43.
85.Sallis,J.F.,andK.Glanz.2006.Theroleofbuiltenvironmentsinphysicalactivity,eating,andobesityinchildhood.TheFutureofChildren16(1):89‐108.
86.Davison,K.K.,andC.T.Lawson.2006.Doattributesinthephysicalenvironmentinfluencechildren'sphysicalactivity?Areviewoftheliterature.TheInternationalJournalofBehavioralNutritionandPhysicalActivity3:19.
87.Dunton,G.F.,J.Kaplan,J.Wolch,M.Jerrett,andK.D.Reynolds.2009.Physicalenvironmentalcorrelatesofchildhoodobesity:asystematicreview.ObesityReviews10(4):393‐402.
88.Maziak,W.,K.D.Ward,andM.B.Stockton.2008.Childhoodobesity:arewemissingthebigpicture?ObesityReviews9(1):35‐42.
89.Rahman,T.,R.A.Cushing,andR.J.Jackson.2011.Contributionsofbuiltenvironmenttochildhoodobesity.TheMountSinaiJournalofMedicine78(1):49‐57.
90.Sallis,J.F.,M.F.Floyd,D.A.Rodriguez,andB.E.Saelens.2012.Roleofbuiltenvironmentsinphysicalactivity,obesity,andcardiovasculardisease.Circulation125(5):729‐37.
91.McDonald,N.C.2008.Criticalfactorsforactivetransportationtoschoolamonglow‐incomeandminoritystudents.Evidencefromthe2001NationalHouseholdTravelSurvey.AmericanJournalofPreventiveMedicine34(4):341‐4.
92.Roemmich,J.N.,L.H.Epstein,S.Raja,L.Yin,J.Robinson,andD.Winiewicz.2006.Associationofaccesstoparksandrecreationalfacilitieswiththephysicalactivityofyoungchildren.PreventiveMedicine43(6):437‐41.
93.AmericanAcademyofPediatrics.2009.Thebuiltenvironment:designingcommunitiestopromotephysicalactivityinchildren.Pediatrics123(6):1591‐1598.
94.McCurdy,L.E.,K.E.Winterbottom,S.S.Mehta,andJ.R.Roberts.2010.Usingnatureandoutdooractivitytoimprovechildren'shealth.CurrentProblemsinPediatricandAdolescentHealthCare40(5):102‐17.
95.Cutts,B.B.,K.J.Darby,C.G.Boone,andA.Brewis.2009.Citystructure,obesity,andenvironmentaljustice:anintegratedanalysisofphysicalandsocialbarrierstowalkablestreetsandparkaccess.SocialScience&Medicine69(9):1314‐22.
96.Redwood,Y.,A.J.Schulz,B.A.Israel,M.Yoshihama,C.C.Wang,andM.Kreuter.2010.Social,economic,andpoliticalprocessesthatcreatebuiltenvironmentinequities:perspectivesfromurbanAfricanAmericansinAtlanta.Family&CommunityHealth33(1):53‐67.
97.Taylor,W.C.,J.T.Hepworth,E.Lees,K.Feliz,S.Ahsan,A.Cassells,D.C.Volding,andJ.N.Tobin.2008.Obesity,physicalactivity,andtheenvironment:istherealegalbasisforenvironmentalinjustices?EnvironmentalJustice1(1):45‐48.
98.Ewing,R.,R.C.Brownson,andD.Berrigan.2006.RelationshipbetweenurbansprawlandweightofUnitedStatesyouth.AmericanJournalofPreventiveMedicine31(6):464‐74.
99.Ewing,R.,T.Schmid,R.Killingsworth,A.Zlot,andS.Raudenbush.2003.Relationshipbetweenurbansprawlandphysicalactivity,obesity,andmorbidity.AmericanJournalofHealthPromotion18(1):47‐57.
100.Wang,Y.2001.Cross‐nationalcomparisonofchildhoodobesity:theepidemicandtherelationshipbetweenobesityandsocioeconomicstatus.InternationalJournalofEpidemiology30(5):1129‐36.
101.Wang,Y.,andM.A.Beydoun.2007.TheobesityepidemicintheUnitedStates‐‐gender,age,socioeconomic,racial/ethnic,andgeographiccharacteristics:asystematicreviewandmeta‐regressionanalysis.EpidemiologicReviews29:6‐28.
102.Davis,A.M.,K.J.Bennett,C.Befort,andN.Nollen.2011.ObesityandrelatedhealthbehaviorsamongurbanandruralchildrenintheUnitedStates:datafromthenationalhealthandnutritionexaminationsurvey2003‐2004and2005‐2006.JournalofPediatricPsychology36(6):669‐76.
103.CentersforDiseaseControlandPrevention.2010.AboutBMIforChildrenandTeens.RetrievedApril7,2010fromhttp://www.cdc.gov/healthyweight/assessing/bmi/childrens_bmi/about_childrens_bmi.html.

Appendices | Appendix A: Data Tables
America’s Children and the Environment | Third Edition A-59
Health
Obesity
Table H10. Percentage of children ages 2 to 17 years who were obese, 1976‐2008
1976‐1980
1988‐1991
1991‐1994
1999‐2000
2001‐2002
2003‐2004
2005‐2006
2007‐2008
All Races/Ethnicities 5.4 9.4 11.0 13.8 15.2 16.8 15.3 16.9
White non‐Hispanic 4.7 8.8 9.7 10.5* 13.4 15.7 13.0 15.4
Black non‐Hispanic 7.3 11.2 13.4 18.2 17.9 19.7 20.1 19.9
Mexican‐American 10.7* 13.3 15.6 20.7 19.6 19.4 22.7 21.0
All Other Races/Ethnicities†
6.5 6.9* 11.3* 17.5 16.4 16.0 12.3 16.3
DATA: Centers for Disease Control and Prevention, National Center for Health Statistics and National Center for Environmental Health, National Health and Nutrition Examination Survey
† The “All Other Races/Ethnicities” category includes all other races or ethnicities not specified, together with those individuals who report more than one race.
*The estimate should be interpreted with caution because the standard error of the estimate is relatively large: the relative standard error, RSE, is at least 30% but is less than 40% (RSE = standard error divided by the estimate), or the RSE may be underestimated.
Table H10a. Percentage of children who were obese, by age group, 1976‐2008
1976‐1980
1988‐1991
1991‐1994
1999‐2000
2001‐2002
2003‐2004
2005‐2006
2007‐2008
Ages 2‐ 5 years
4.7 7.3 7.1 10.4 10.5 13.6 10.9 10.1
Ages 6‐ 10 years
6.2 10.1 12.7 14.3 16.0 17.3 14.5 19.3
Ages 11‐15 years
5.5 9.1 13.2 15.9 17.0 18.0 18.1 19.5
Ages 16‐17 years
4.8 12.3 8.8 13.4 16.3 18.1 17.9 18.2
Ages 2‐ 17 years
5.4 9.4 11.0 13.8 15.2 16.8 15.3 16.9
DATA: Centers for Disease Control and Prevention, National Center for Health Statistics, National Health and Nutrition Examination Survey

Appendix A: Data Tables | Appendices
A-60 America’s Children and the Environment | Third Edition
Table H11. Percentage of children ages 2‐17 who were obese, by race/ethnicity and family income, 2005‐2008
Race / Ethnicity All Incomes‡ (n=6654)
< Poverty Level (n=1,955)
≥ Poverty Level (n=4,314)
> Poverty (Detail)
100‐200% of Poverty Level (n=1,691)
> 200% of Poverty Level (n=2,623)
All Races/Ethnicities (n=6,654)
16.1 19.9 15.1 18.4 13.8
White non‐Hispanic (n=1,915)
14.2 17.4 13.7 17.9 12.5
Black non‐Hispanic (n=1,874)
20.0 19.7 19.9 21.6 18.8
Mexican‐American (n=2,012)
21.9 22.3 21.6 21.0 22.3
All Other Races/Ethnicities† (n=853)
14.5 22.7 11.9 11.9 11.9
DATA: Centers for Disease Control and Prevention, National Center for Health Statistics, National Health and Nutrition Examination Survey
† The “All Other Races/Ethnicities” category includes all other races or ethnicities not specified, together with those individuals who report more than one race.
‡ Includes sampled individuals for whom income information is missing.