oak ridge national laboratory - digital library/67531/metadc620548/m2/1/high...basaran oak ridge...
TRANSCRIPT

OAK RIDGE
I
NATIONAL LABORATORY
CRADA Final Report for
CRADA Number ORNL92-0083
A NEW METHOD FOR MEASURING THE i DYNAMICSURFACE TENSION OF COMPLEX-MIXTURE
LIQUID DROPS
Xiaoguang Zhang, M, T. Harris, and 0. A. Basaran Oak Ridge National Laboratory
Spray Drift Task Force
Approved for public release; distribution is unlimited.

DISCLAIMER
Portions of this document may be illegible in electronic image products. Images are produced from the best available original document.

POST OFFICE BOX 2009 MARTIN MARlElTA ENERGY SYSTEMS, INC. OAK RIDGE. TENNESSEE 37831
November 28,1994
Mr. Peter D. Dayton Director, Procurement and Contracts Department of Energy, Oak Ridge Operations Post Office Box 2001 Oak Ridge, Tennessee 37831-2001 Dear Mr. Dayton:
Final Report for CRADA No. ORNL92-0083 with Spray Drift Task Force
The subject CRADA has been completed and enclosed is the Fmal Report for this project.
This report does not contain proprietary information or Protected CRADA Information. Neither Energy Systems nor the participant object to public distribution of this report.
If you have any questions, please feel free to contact me.
Very truly yours,
Brian Bovee Business Manager Office of Technology Transfer
BBB:cav
Enclosure - As Stated.
cc: File - RC
This report was prepared as an account of work sponsored by an agency of the United States Government. Neither the United States Government nor any agency thcreof. nor any of their employees, makes any warranty, express or implied, or assumes any legal liability or responsi- bility for the accuracy, completeness, or usefulness of any information, apparatus, product, or process disclosed, or represents that its use would not infringe privately owned rights. Refer- ence herein to any specific commercial product, process, or service by trade name. trademark, manufacturer, or otherwise does not necessarily constitute or imply its endorsement, ream- mendation, or favoring by the United States Government or any agency thereof. The views and opinions of authors expressed herein do not necessarily state or reflect those of the United States Government or any agency thereof.

Report to be submitted to SPRAY DRIFT TASK FORCE
as part of a CRADA between ORNL/MMES and SDTF entitled: A NEW METHOD FOR MEASURING THE DYNAMIC SURFACE
TENSION OF COMPLEX-MIXTURE LIQVn, DROPSt
Final report due at the end of Phase 4: STANDARD OPERATING PROCEDURES AND SUMMARY
OF KEY MEASUREMENTS AND FINDINGS OF TffE CRADA
Xiaoguang Zhang, Michael T. Harris, and Osman A. Basaran
Chemical Technology Division Oak Ridge National Laboratory
Oak’ Ridge, Tennessee 37831
June 29,1994
EXECUTIVE SUMMARY This report describes a new experimental technique that has been developed to
measure the dynamic surface tension at the interface of a drop of a range finding fluid growing or forming into air from the end of a h e capillary and summarizes key measurements and findings made with the new technique. The report has been written in such a way that it assumes no prior familiarity with the new technique or previous reports issued under this CRADA.
Although this report concludes the formal portion of the work performed under this CRADA, the ORNL researchers shall continue to collaborate with and assist members of the SDTF on an informal basis. Future activities carried out in this manner might include performing limited sets of measurements for the SDTF with the new technique for comparison with other available techniques and makiig our laboratories available to SDTF researchers for short term training on the ORNL equipment.
tCRADA work sponsored by and in collaboration with the Spray Drift Task Force and the Divisions of Chemical Sciences (0. A. Basaran), Advanced Energy Projects (M. T. Harris), and Material Sciences (M. T. Harris), Office of Basic Energy Sciences, U.S. Department of Energy under contract DE-AC05- 840R21400 with Martin Marietta Energy Syntems, Inc.

ABSTRACT
A simple and accurate technique has been developed for measuring dynamic surface
tension. The new technique is based on growing a drop at the end of a fine capillary
into another immiscible fluid and can follow the changes in tension at a freshly formed
interface during its entire period of evolution. When the relative importance of the
surface tension force is large compared to gravitational and viscous forces, shapes of
growing drops are sections of spheres and the difference in pressure between the interior
and the exterior of the drop Ap is related to the surface tension Q and the radius of
curvature R by the static Young-Laplace formula Ap = 2a/R. In contrast to related
work (17-19), the new technique can determine the surface tension of an interface with
a surface age of a few to tens of milliseconds by measuring transient drop shapes and
pressures in 1/6 to 1 millisecond. The capabilities of the new method are demonstrated
by performing tension measurements on liquid systems that do not exhibit dynamic
surface tension as well as ones that exhibit significant dynamic tension effects. Tension
measurements made with surfactant-laden solutions show that variation of surface
tension is nonmonotonic in time. In such system, the dynamic behavior of surface
tension is shown to depend upon both the rate of interfacial dilatation and that of
surfactant transport. A maximum in the surface tension is attained when the lowering
of the surfactant concentration on the drop interface due to its dilatation is balanced by
the addition of fresh surfactant to the interface by convection and diffusion. During
the early stages of drop growth, the newly forming drop undergoes oscillations the
amplitude and frequency of which decrease with time. Consequently, the reported
simple to apply but powerful technique for the measurement of surface tension that
relies on the use of the Young-Laplace formula can be used only after the oscillations
are damped out completely, unless a comprehensive modification is applied.

1. INTRODUCTION
In many separation and extraction processes and spraying and ink-jet printing ap- plications, a fluid is ejected from a nozzle or an orifice into another immiscible fluid.
At low flowrates, the fluid being ejected emanates from the nozzle as discrete droplets
(1). At high flowrates, the fluid is ejected from the nozzle as a jet which subsequently
breaks up into small drops due to the well known Rayleigh instability (1). Surface ten-
sion, as one of key “solution” properties, competes with other relevant forces that may
be operating, e.g., inertial, viscous, viscoelastic or electric, to control the dynamics of
the drop formation or jetting process and set the final drop size distribution.
The tension at a freshly formed interface, as the surface of a forming drop or a
breaking jet, may be quite different from the equilibrium or static value and may vary
as a function of time, if surface active materials are present. The dynamic property
of the surface tension (often referred to as dynamic surface tension) is dependent on
the instant composition of surface active materials accumulated on the interface. The
value of the surface tension usually decreases monotonically with an increase in the
concentration of surfactant absorbed on the interface until an equilibrium concentra-
tion is eventually reached at which point the surface tension tends to its equilibrium
value. Most industrially relevant drop formation and atomization processes 0cc.u in
a time frame on the order of a few milliseconds or less, over which equilibrium condi-
tions are not attained and dynamic tension plays a major role. This short time scale
over which a measurement has to be made and the large amounts of surface area that
are created in these practical situations render inapplicable most existing techniques
of measuring dynamic surface tension. Thus, the major goal of this work is to present
a new technique for measuring dynamic surface tension over an effective surface age
of a few milliseconds and longer under conditions that closely approximate practical
2

conditions,
Efforts for measuring dynamic surface tension have been around for a century. A
recent and comprehensive summary can be found in the book by Edwards et d.
(2). Some of the currently used techniques are based on observations of interfacial
waves at a fluid/fluid interface to measure surface dilatational elasticity and surface
tension. These include the longitudinal wave technique (3, 4), laser light-scattering
( 5 ) , Langmuir trough (6), and the oscillating bubble (7). As the interface is typically
only slightly perturbed from its equilibrium state, these techniques are of little value
in measuring the dynamic surface tension at the interface of a growing drop. A
technique based on the phenomenon of Rayleigh instability is the oscillating jet method
(8, 9) due to the famous physicist Niels Bohr (10). With the many assumptions
that are made in deriving the working equation of this method, the large scatter in
the resultant surface tension data limits its usefulness. In addition, as the interface
wave methods, this technique works best for low viscosity or virtually inviscid fluids.
The viscosities of many practically important fluids can be large enough that the
oscillations can get damped out within a few milliseconds (ll), thereby rendering
measurements based on the oscillating jet method totally impossible. The so-called
maximum bubble pressure method (12-14) and dynamic drop volume methods (15,
16) are other widely used techniques for measuring dynamic surface tension because of
their apparent simplicities. One drawback of these methods is that they only furnish
the value of the dynamic surface tension at one certain instant in time and not during
the entire process of drop/bubble formation. Therefore, these methods are not suitable
to explore the actual transient evolution of tension on a single drop interface. $
Therefore, a more general technique for measuring dynamic surface tension was de-
veloped and is described in this work that is based on growing a drop at the end of a
fine capillary into another immiscible fluid, as shown in figure 1. The technique relies
3

3
on measuring simultaneously the instantaneous pressure inside and the radius of cur-
vature of the drop as it grows. First, the technique is capable of making measurements
in as little as a few milliseconds or in as long as hours. Second, it is capable of moni-
toring the change in tension at the freshly formed interface of a drop during its entire
period of evolution. In this work, we go beyond existing similar techniques proposed
by others (17-19) by focusing on the early times of drop formation, in particular on
the period preceding the hemispherical stage. To make such measurements, advantage
is taken of an ultra high-speed video camera and a data link system. Moreover, use of
the video camera in conjunction with a digital image analysis system allows measure-
ment of the real shape, or size, of a drop as a function of time during drop growth.
This capability makes the determination of the drop size completely independent of
how the pressure varies inside the drop and the manner in which the drop fluid wets
the capillary, which are other advantages of the present technique over the works of
others (17,19). Yet another goal of the present work is to determine the limitations of
the growing drop technique, which have heretofore remained inadequately explored.
In particular, this work examines such issues as the earliest time (measured from zero
surface age) after which the technique can furnish accurate surface tension data and
the effect of drop viscosity on surface tension measurements.
Section 2 presents scaling arguments that set limits on physical properties and c a p illary radii for ensuring that forming drops grow as sections of spheres. Section 3
describes the experimental apparatus, materials and the methods of data acquisition
and analysis. Section 4 shows that the new technique is extremely well suited for
inferring dynamic surface tension. First the accuracy of the new method is demon-
strated by measuring the surface tension of well characterized liquid systems - the
interface between a growing drop of pure water, water plus propanol, and water plus
glycerol and air - that do not exhibit dynamic tension effects. Next the capability
4

of the new method to measure dynamic surface tension is displayed by measuring the
tension at the interface of a drop of water plus a surfactant forming into air. More-
over, oscillations of the interface between air and newly-formed drops of liquids of
different viscosities are discussed in light of the measured drop shape and pressure
data. Concluding remarks are the subject of section 5.
2. PHYSICS OF GROWING DROPS:
SCALING ARGUMENTS AND GOVERNING EQUATIONS
Motion of a Newtonian fluid of viscosity p and density p inside a growing drop
is governed by the Navier-Stokes system, which is nondimensionalized by using the
radius of the capillary a as length scale and the maximum fluid velocity inside the
capillary u as velocity scale: .. v-g=o, 111
where 4 is the dimensionless velocity, - 5 is the dimensionless stress tensor, is the
dimensionless time, and e, denotes the unit vector along the direction of gravity,
which is taken to be the z-direction. In equation [2], Re E is the Reynolds
number, G EZ e is the gravitational Bond number, and Ca G 9 is the capillary
number, where g is the acceleration due to gravity and Q* is a characteristic surface
tension, e.g. that of the pure solvent. Re measures the importance of inertial forces
relative to viscous forces, G measures the importance of gravitational forces relative
to surface tension forces, and Ca measures the importance of viscous forces relative
to surface tension forces. It is well known that the profile of a static drop pendant
from a capillary is a section of a sphere provided that G << 1 (20). By contrast, the
profile of a growing drop is also shaped by the competition between viscous and surface
Ir
5

tension forces. Our recent theoretical studies (21) have shown that Ca << 1 also to
ensure that the profile of a growing drop is a section of a sphere. Under the condition
of small gravitational Bond and capillary numbers, surface tension forces dominate
gravitational and viscous forces and enforce a growing drop to maintain its spherical
shape. With a capillary of small enough radius and, thus, a drop of small enough
radius, the restrictions of small gravitational Bond and capillary numbers are well
satisfied when G < 0.03 and Ca < 0.004 in our experiments, as discussed in sections
3 and 4 of this report. Therefore, the assumption that the shape of a growing drop
is spherical can be safely applied throughout the present work, a fact that is further
reinforced by taking pictures of growing drops in the experiments. As shown below,
the existence of a spherical drop greatly facilitates the analysis of dynamic surface
tension data. Nevertheless, capillaries of large radii, which lead to growing drops that
are nonspherical in shape, can also be used; however, their use would complicate, but
not make impossible, the analysis of experimental results, as we show elsewhere (21,
22).
When the drop grows as a section of a sphere, the surface tension, Q, which is
assumed to be uniform along the interface of a small drop, can be inferred from the
requisite balance of normal stresses on the interface of the spherical drop (cf. (11,
19)), written here in dimensional form:
20 n n : ( r -T.)=- 4 u t = a n R ’ -- [31
where is an outward pointing unit normal to the interface (i.e., it points from the
inside, in, to the outside, out) and R is the radius of curvature of the drop. At a
stretching spherical interface, n g : = -p + 2 p s , where p is the pressure and WR
is the component of the velocity normal to the interface. Therefore, the stress balance
6
-

[3] is reduced to:
where Ap is the viscosity difference between the drop and the ambient fluid. The second term on the right side of [4] represents the effect of bulk viscosity on the stress
balance. For a purely radial flow, a condition which is commonly assumed to hold
when G << 1 (19), $$f = - x v R 2 = -x=, d R where t is the time to form a drop having
a radius of curvature R. The time rate of change of R, normalized by R, can be shown
to be given by Q dR2 - 1
Rdt a3 &(rZ f J7?E.-1)2’ -- - f- dR
[51
- where R 3 R/a is the dimensionless radius of curvature of the growing drop scaled
by the radius of the capillary and Q is the volumetric flow rate. The negative signs in
[5] are used during the pre-hemisphere period and indicate a decrease in the radius of
curvature with time until R reaches its minimum when the drop is a hemisphere. The
positive signs in [5] are used during the post-hemisphere period. Figure 2 shows the
variation of the normalized expansion rate, g, as a function of a dimensionless time
?, which is obtained by scaling the actual time by the time that it takes for the drop
to reach the hemispherical stage. The normalized expansion rate is seen to increase
rapidly from negative infinity during the pre-hemisphere period, to attain a maximum
near the time at which the drop is a hemisphere, and then to asymptotically tend
toward zero during the post-hemisphere period. The large magnitude of the initial
expansion rate can result in significant viscous stresses. However, in the present
experiments, measurements of surface tension start from the time at which the drop
is nearly hemispherical in shape, i.e. f N 0.6 in figure 2, as discussed in detail later.
Thus, the magnitude of the normalized expansion rate in the experiments is always
smaller than 12. By way of example, for a millimeter-sized water drop growing into
7

air, the surface tension induced stresses are about three to four orders of magnitude
as large as viscous stresses. Therefore, viscous stresses can be completely neglected
compared to capillary forces and the pressure excess over ambient in the forming drop
right inside the moving interface is strictly determined by the curvature of the interface
for most low viscosity, Newtonian fluids. For high viscosity fluids, the experimental
results of section 4 and the theoretical results of (21, 22) show that viscous stress can
play a significant role in determining surface tension even though estimating viscous
stress on the assumption of radial flow, d t , would lead to the conclusion that it
is negligible compared to capillary pressure. This too is a point to which we return in
what follows. Therefore, when stresses due to bulk viscosity and also surface Viscosity
(see, e.g., (19)) are negligible, [4] simplifies to the static Young-Laplace formula:
2a Ap= jj-.
With negligible viscous and gravitational forces, the pressure inside a growing drop,
although a function of time, is virtually uniform in space. Hence, the dynamic surface
tension can be readily inferred from equation [6] by simply measuring the radius of
curvature and the pressure inside the growing drop as a function of time.
3. EXPERIMENTAL APPROACH
In the experiments, a liquid drop is grown from the tip of a capillary at constant
volumetric flow rate. This section describes the apparatus used to carry out the
measurements and the liquids used in the experiments.
3.1. Apparatus
Figure 3 shows a schematic sketch of the experimental setup. The experimental
8

apparatus consists essentially of a fine capillary tube from the tip of which a drop is
formed or grown, a liquid pump to supply the drop liquid, a pressure transducer to
gauge the pressure inside the drop, a video camera for capturing images of the growing
drop, and associated hardware for recording, storing and analyzing drop shape and
pressure data. The capillary tube is immersed in a glass cell filled with the ambient
fluid and the whole apparatus, except for the liquid pump, is placed on a vibration
isolation table.
One of the essential pieces of equipment for carrying out the drop formation exper-
iments is an ISCO, Inc. digital syringe pump, model 100DM, that delivers virtually
pulseless flow to a fine capillary tube with outstanding stability and precision. The
pump can deliver flow rates in the range 0.01 pL/min to 25 mL/min with f0.3%
accuracy. Moreover, to ensure that there are no pulsations in flow rate, an Upchurch
Scientific model U-445 backpressure regulator is placed downstream of the syringe
In the experiments carried out to date, two types of capillary tubes have been used.
The first is a stainless steel nozzle with an outer radius of 0.0397 cm and the other
a teflon nozzle with an outer radius of 0.0381 cm. The choice of material for the
capillary is important because if the capillary is preferentially wetted by the drop
liquid instead of the ambient fluid, the location of the three-phase contact line where
the drop, ambient fluid, and the capillary meet is uncertain (19). In particular, the
contact line may be (i) pinned on the inner sharp edge of the capillary wall, (ii) pinned
on the outer sharp edge of the capillary wall, or (iii) may not be pinned at all, but
wet the outer wall of the capillary. The first two situations do not present a problem.
The third one, however, renders determination of the radius of curvature of the drop
difficult due to the inconsistent changes in the radius of curvature as the contact line
moves, and, therefore, was avoided in previous works on growing drops (17, 19). In
9

the present experiments, the radius of curvature is determined by measuring the red
shape of the drop as described below. Therefore, whether the contact line pins on
the edge of the capillary is no longer a restriction for making tension measurements.
Nevertheless, in order to simplify the analyses of radius and pressure data recorded
in the experiments, the materials that the capillary is made of were carefully selected
based upon the properties of the fluids used. With water and other aqueous solutions,
a stainless steel capillary is used in the experiments which ensures that the drop is
pinned to the outer edge of the capillary. Drops of organic liquids wet the outer walls
of steel capillaries. For such drops, teflon tubes have been found to emure that the
contact line remains pinned to the sharp outer edge of the capillary.
Another essential piece of equipment is a pressure transducer. The transducer used
is model 8510B-1 made by Endevco Corp. which has a measuring range 0 to 1 psig,
a response rate of 55 kHz, a sensitivity of 300 mv/psi, and an accuracy of 0.1%. The
output signals from the transducer are amplified by a conditioning unit, Endevco
Corp. model 160. A converter, Kodak Multi-Channel Data Link, digitizes the signals
and transmits them to the motion analysis system described below. The measured
electrical signals are converted into pressure units by a linear calibration formula which
is determined by means of a hydrostatic pressure calibration. There are of course
contributions to the pressure drop measured by the transducer in addition to the Ap
in [6]. These occur in the liquid supply line between the transducer and the drop.
Extreme care is exercised to measure these before any experimental run is carried
out and to subtract the extra pressure drop in determining the tension. Nevertheless,
this calibration procedure is straightforward. It is tantamount to running the pump
at the flow rate of the drop formation experiment, but without forming drops. The
extra pressure drop in the liquid supply lines between the transducer and the tip of
the capillary is then determined by just immersing the tip of the capillary into a large
10

bath that is filled with the same liquid as that of the drop. With these precautions,
the instantaneous pressure inside the drops can be measured within an accuracy of
f0.015 cm H20.
The most important and impressive piece of equipment, which sets our experiments
apart from those of others, is a high-speed motion analysis/video system for capturing
shapes of forming drops. For making tension measurements over very short periods
of time, ranging from as few as a fraction of a milliiecond to as long as seconds (or
longer), a Kodak Ektapro Model EM 1012 Electronic Memory Motion Analyzer and
associated video hardware are employed. The Ektapro system is composed of an
intensified imager, i.e. the camera, and a processor which can record 1,000 full images
or 12,000 partial images per second. Moreover, the Ektapro can display and store side
by side the instantaneous drop shape and pressure data. Images of growing drops,
along with instantaneous pressures, are later recorded and replayed on a Panasonic
model PV-54990 S-VHS recorder. The drop shape and pressure data are viewed on
a Sony color video monitor, model PVM-1341. The images are digitized by means
of a frame grabber, a Data Translation DT2851 board, that is installed in an IBM-
compatible PC, and an edge detection routine is employed to locate the interfacial
profile from the digitized image. The image digitization system allows rapid and
accurate determination of the loci of interfaces from which the radii of curvature of
the growing drops are readily calculated.
In a typical run, the pump and the liquid lines, upon being thoroughly cleaned, are
carefully filled with the drop liquid to avoid any air bubbles in the system, which is
necessary for eliminating any uncertainty in the liquid flow rate (23). The flow rate is
then set to the amount for which the system is calibrated, and the system is allowed
to run for about two hours before measurements are taken. A periodic flow situation
is then reached in which drops form, grow, and detach from the outlet of the capillary
11

tube. The experimental time taken for the whole process is sufficiently small, usually
about 1 sec but always less than 10 sec, that the changes in the drop size and interface
properties due to evaporation of the drop liquid may be safely neglected (24).
3.2. Materials
The drop liquids used in the experiments are either well recognized standards, e.g.
triple distilled water by Millipore Corp., 15% (by weight) n-propanol and 85% (by
weight) glycerol from EM Science in distilled water, or aqueous surfactant solutions.
The surfactants, Triton X-100 and Sodium Dodecyl Sulfate obtained from J. T. Baker
Inc., Sodium Dioctyl Sulfosuccinate from Cyanamid, and Induce AL-2700 from IC1
Americas Inc., are used without further modification and dissolved in distilled water at
the specified concentrations. In all experiments carried out to date, liquid drops form
and grow in air and tensions of liquid/air interfaces are measured. The measurements
are taken within 8 hours of preparation of the surfactant solutions. All experiments
are performed at the room temperature of 22" f 0.5"C.
4. EXPERIMENTAL RESULTS
The typical process of drop formation and growth is illustrated in figure 4 for
a drop of distilled water growing out of a steel capillary into air with a flow rate
Q = 100pL/min. Figure 4(a) shows a drop as it is just starting to fall off the capillary.
The liquid in the capillary and the drop are reluctant to separate and connected by
a throat. A millisecond later, in figure 4(b), the throat is rupturing and the drop is
about to detach, which defines the time of zero surface age. As the drop falls, the
part of the throat that is left
the tube to form a new drop
attached to the liquid in the capillary rebounds toward
and the pendant drop so formed oscillates as shown in
12
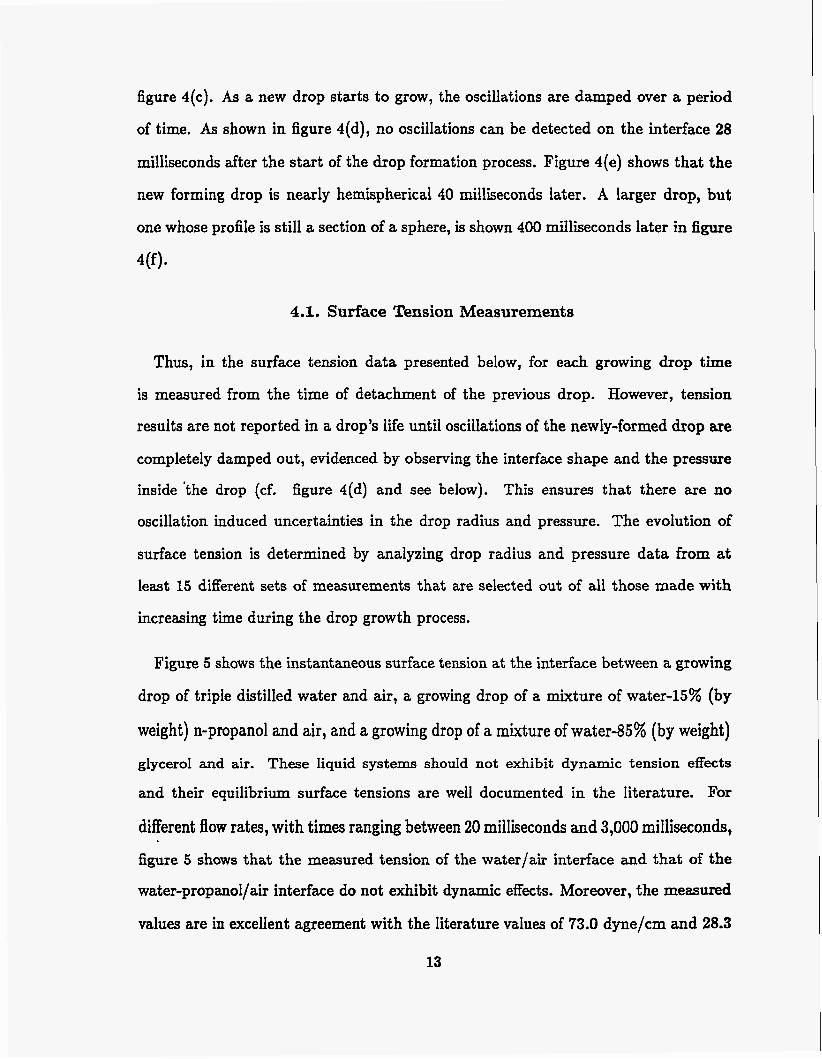
figure 4(c). As a new drop starts to grow, the oscillations are damped over a period
of time. As shown in figure 4(d), no oscillations can be detected on the interface 28
milliseconds after the start of the drop formation process. Figure 4(e) shows that the
new forming drop is nearly hemispherical 40 milliseconds later. A larger drop, but
one whose profile is still a section of a sphere, is shown 400 milliseconds later in figure
4(f)*
4.1. Surface Tension Measurements
Thus, in the surface tension data presented below, for ea& growing drop time
is measured from the time of detachment of the previous drop. However, tension
results are not reported in a drop's life until oscillations of the newly-formed drop are
completely damped out, evidenced by observing the interface shape and the pressure
inside 'the drop (cf. This ensures that there are no
oscillation induced uncertainties in the drop radius and pressure. The evolution of
surface tension is determined by analyzing drop radius and pressure data from at
least 15 different sets of measurements that are selected out of all those made with
increasing time during the drop growth process.
figure 4(d) and see below).
Figure 5 shows the instantaneous surface tension at the interface between a growing
drop of triple distilled water and air, a growing drop of a mixture of water-15% (by
weight) n-propanol and air, and a growing drop of a mixture of water-85% (by weight)
glycerol and air. These liquid systems should not exhibit dynamic tension effects
and their equilibrium surface tensions are well documented in the literature. For
different flow rates, with times ranging between 20 milliseconds and 3,000 milliseconds,
figure 5 shows that the measured tension of the water/air interface and that of the
water-propanol/air interface do not exhibit dynamic effects. Moreover, the measured
values are in excellent agreement with the literature values of 73.0 dyne/cm and 28.3
13

dyne/cm, respectively (25), which are shown as solid lines in figure 5. As a test, these
results demonstrate the capability of the growing drop technique for accurately and
reliably measuring the instantaneous surface tension in a drop’s life. Reproducibility
of the tension data is checked to be within 5% by making measurements with the same
liquid systems under the same conditions and at different times. Indeed, the surface
tension of the water/air interface is measured frequently in order to check the system
calibration and the cleanliness of the liquid lines. Moreover, as shown in figure 5, the
measured tension values for a growing drop of a mixture of 85% glycerol and water
with a viscosity of 112.9 centipoises in air show good agreement with the literature
value of 66 dyne/cm (26), a result that demonstrates the capability of the technique
for measuring even the surface tension at the interface between a drop of a highly
viscous liquid and air during most of the drop growth process.
Figure 6 shows the instantaneous surface tension at the interface between a growing
drop of a mixture of water-0.01% (by weight) Triton X-100 and air. The equilibrium
value of the surface tension is 34 dyne/cm for this system (27), which is shown by
a bar on the right side of figure 6. Dynamic tension measurements were made at
four different liquid flow rates, ranging between 5 pL/min and 200 pL/min. With
the surfactant adsorbing on the continuously expanding interface, the surface tension
changes with time and exhibits a nonmonotonic response. The rate of interfacial
dilatation, $, where A denotes the interfacial area of the drop, is relatively high
at early times, as shown in figure 7. Therefore, if the rate of surfactant transport
to the interface is not high enough to keep up with the rate of interface dilatation,
the concentration of the surfactant on the interface, i.e. coverage per unit area, falls.
The consequence of this fall in the surfactant concentration on the interface is the
rise in the dynamic surface tension that is seen in figure 6. At longer times, the rate
at which the interface dilatates slows as shown in figure 7: this causes the surfactant
14

to repopulate the interface, and the surface tension starts to fall and tends toward
its equilibrium value at long times. A maximum in the value of the surface tension
is attained when the lowering of the surfactant concentration on the interface due to
its dilatation is just balanced by the addition of surfactant to the interface from the
bulk of the drop by convection and diffusion. The results at the higher flow rates are
especially striking because they display the response of the tension of the interface
to the rate of interface dilatation. Similar observations of the response of dynamic
surface tension to changes in rates of interfacial dilatation have also been reported by
others (18, 19). It is also noteworthy that the surface tension of an interface after drop
breakup is not that of a clean water/air interface: the interface that is left behind
after breakup has a tension value that is close to the equilibrium value of an interface
between a mixture of water-triton and air, in particular at low flow rates. This is
because adsorption and equilibration of surfactant on the interface occur before the
previous drop detaches, and accumulated surfactant may remain on the interface of
the newly-formed drop, resulting in a low value of the surface tension at the time of
zero drop age.
Figure 8 shows the variation in time of the radius of curvature and the pressure dif-
ference across the drop/air interface for the four cases shown in figure 6. In contrast
to the commonly used presumption in measuring dynamic surface tension by the pop-
ular maximum bubble pressure method (12-14) and related growing drop techniques
(17, 19), figure 8 makes plain that for surfactant-laden solutions, the time at which
the radius of curvature is a minimum may not necessarily be the same as the time at
which the pressure difference is a maximum. According to the Young-Laplace equa-
tion [6], the pressure difference across a drop’s interface depends upon both the radius
of curvature and the surface tension. Differentiating this expression with respect to
15

time yields: d A p 2 d . u 2adR d-t R d t R2 d t ' -- _---- - [71
At the instant when the drop is going through a hemispherical profile, its radius of
curvature is a minimum and = 0. Therefore, unless the surface tension attains a
maximum ai; that instant or is independent of time - as in the case of surfactant-free
solutions - so that = 0, the maximum in the pressure difference will not occur at
that time. Examination of figures 6 and 8 reveals that the time at which the dynamic
surface tension is a maximum does not correspond to the time at which the radius of
curvature is a minimum or that at which the pressure difference is a maximum. This
is not too surprising as the time for the maximum in the value of the dynamic surface
tension to be attained depends solely upon the surfactant balance on the interface
and not on whether the radius of curvature or the pressure difference is extremized.
Therefore, in general the surface tension is changing with time when the drop becomes
a hemisphere, that is = 0. This finite value of % contributes to the
pressure difference and results in the time for the occurrence of the maximum in the
pressure difference to lead or to lag that for the occurrence of the minimum in the
radius of curvature. Further consequences of this fact are brought out in what follows.
The strong dependence of the dynamic behavior of surface tension on the transport
rate of the surfactant is further reinforced by the results of figure 9, which shows the
evolution in time of the instantaneous surface tension of a mixture of water and Triton
X-100 at various bulk concentrations. In this figure, the tension results shown are from
three runs made at the same liquid flow rate of 10 pL/min. As the bulk concentration
increases, the average of the measured values of the surface tension decreases, a result
that accords with intuition. Moreover, as the bulk concentration increases, the gra-
dient of the surfactant concentration between the bulk of the drop and its interface
increases: this accelerates the transport of the surfactant to the interface by diffusion
# 0 when
16

and, therefore, shifts the occurrence of the maximum in the surface tension to earlier
times. With the slower rate of transport of the surfactant in the less concentrated
solutions, the surface tension of these dilute solutions rise to higher values from their
equilibrium values in comparison to more concentrated solutions, a result the basis for
which is also apparent from the trend in the measurements at high flow rates reported
in figure 6.
The nonmonotonic behavior in time of the dynamic surface tension as measured
by the growing drop technique of course occurs with other surfactant-laden solutions.
Figure 10 shows the evolution in time of the instantaneous surface tension at the
interface between a growing drop of a mixture of water-6 mM Sodium Dodecyl Sul-
fate (SDS), a highly active surfactant, and air. Owing to the fast rate of transport
of this surfactant, the measured surface tension displays rapid changes either early
during its rise or later during its fall, and rapidly tends to its equilibrium value of
46.1 dyne/cm (28). Moreover, the maximum in the dynamic surface tension of the
SDS solution occurs during the pre-hemisphere period as a result of the rapid trans-
port of this surfactant. The latter result stands in contrast to solutions with slowly
transporting surfactants, like Triton X-100 shown in figure 6. This discovery reme-
dies the earlier measurements of drops containing SDS with a similar technique (19),
where the nonmonotonic behavior and, in particular, the maximum of the surface
tension were not detected because the equipment used in (19) was not fast enough
to make measurements during the pre-hemisphere period of drop growth. Otherwise,
the present results of the dynamic surface tension in the post-hemisphere period of
the drop growth are in good agreement with those reported in (19), which provides
yet another check of the validity of the present method.
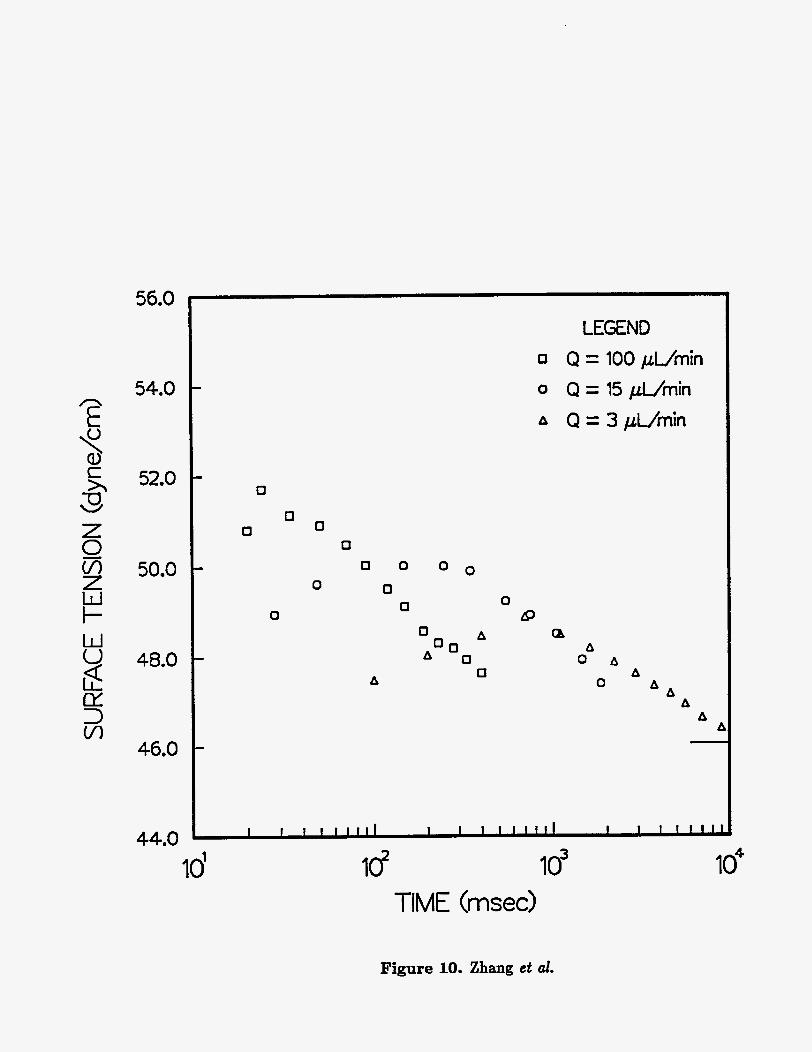
Figures 11 and 12 show the evolution in time of the instantaneous surface tension of
two aqueous solutions with low activity surfactants, 0.01% (by weight) Sodium Dioctyl
17

Sulfosuccinate and 0.01% (by weight) Induce AL-2700. As the rate of interfacial di-
latation greatly exceeds the rate of transport of the surfactant in the early period
of drop growth, a relatively “clean” interface is generated when the surface tension
is extremized. This results in the maximum values of the dynamic surface tension
approaching the tension of the pure solvent (distilled water). Thereafter, a long time
is taben for the tension to reach its equilibrium value. For the Sodium Dioctyl S u h -
succinate solution, a slow rearrangement of equilibrated surfactant molecules on the
interface occurs, resulting in a large departure of the measured surface tension from
its equilibrium value at long time as shown in figure 11. Evidently, extrapolation
from dynamic tension measurements to the equilibrium tension in such systems, as
suggested in (29), is inappropriate. In figures 11 and 12, the equilibrium value of
the surface tension for the 0.01% solution of Sodium Dioctyl Sulfosuccinate of 35.3
dyne/cm is given in the literature (28), and that for the 0.01% solution of Induce of
38.9 dyne/cm was measured with a technique based on the pendant drop method in
our laboratory (30).
4.2. Oscillations of newly-formed drops
Oscillations can occur when a new drop forms, following the detachment of the
previous drop and the rebound of the liquid that is left behind. During the period
of drop oscillations, uncertainties in the drop shape and pressure render the direct
determination of the surface tension by the present technique impossible unless a
comprehensive understanding of the complex hydrodynamics inside the growing drop
is developed (21, 22). However, our observations provide for the first time visual evi-
dence of occurrence, evolution, and disappearance of the oscillations and clarification
of the effects of these oscillations on surface tension measurements.
Figure 13 shows a series of photographs that illustrate the early stages in the for-
18

mation of a water drop into air at a liquid flow rate Q = 100pL/min. Immediately
after the previous drop detaches (figure 13(a)), the liquid left behind in the throat
rebounds toward the capillary with great acceleration owing to the unbalanced force of surface tension (31) and collides with the downfiowing liquid in the pipe. Under the
impact of this rebound and collision, the new drop that is forming at the end of the
capillary looks as shown in figure 13(b) 0.5 millisecond later. The liquid rebound and
impact excite oscillations on the surface of the newly-formed drop. A half of a period
of oscillation is depicted in going from figure 13(c) to (d), where a drop whose bottom
is visibly flattened 1 millisecond after detachment is shown in figure 13(c) and the
same drop whose tip is visibly elongated 1 millisecond later is shown in figure 13(d).
Oscillations of the drop interface continue with gradually decreasing amplitude and
frequency due to viscous damping and increasing drop volume (cf. (11)), as illustrated
in figures 13(e)-(i). After approximately 28 milliseconds have elapsed (figure 13(j)),
the oscillations are completely damped out and the drop begins to grow stably as a
section of a shape.
As the drop interface, the pressure inside the drop too oscillates during the early
times of drop formation. Figure 14 shows the oscillations of the pressure inside a
water drop growing in air at liquid flow rates of Q = lOOpL/min and 10pL/min. The
solid lines in figure 14 are results calculated from the Young-Laplace formula [6] with a
constant surface tension of 73 dyne/cm. Since the drop volume at zero time is nonzero
and composed of a combination of the rebounding liquid and the dowflowing liquid
in the pipe, a finite initial pressure difference across the drop interface is established.
Plainly, the pressure rises and falls dramatically inside the newly formed drop, in
concert with the oscillations of the drop interface. The amplitude and frequency of
the pressure oscillations decrease rapidly and the pressure begins to vary stably as
predicted by [6] after 30 milliseconds.
19

It is well known that the damping of drop oscillations is a function of the properties
of the drop and ambient fluids, in particular of viscosities. For high viscosity fluids, the
oscillations of millimeter-sized drops can be damped out within a few milliseconds or
less or the motion can be nonoscillatory (11). This fact is demonstrated in figure 15 by
our experimental results for a drop of a mixture of 70% (by weight) glycerol and water
with a viscosity of 22.9 centipoises and a surface tension of 69.3 dyne/cm (26) growing
in air. Indeed, oscillations of the drop interface and pressure cannot be observed even
within one millisecond after the previous drop detaches: both the drop shape and the
pressure field evolve aperiodically in time to their forms that are consistent with those
of a drop growing as a section of a sphere. Figure 15 shows that the pressure difference
for the high viscosity drop starts at a very low value and increases monotonically until
approaching that predicted by [6] after about 30 milliseconds. The departure of the
measured initial pressure difference from that predicted by [6] is experimentally found
to increase and last longer as the viscosity of the drop fluid increases. The peculiar
behavior of the pressure inside highly viscous drops can affect the values of the surface
tension measured at short times and, therefore, warrants further attention. This is a
point to which we return in the next subsection. However, it has also been found that
drops of surfactant-laden solutions experience relatively shorter times of oscillations
because the surfactant adsorbed on the interface stagnates the interface and, therefore,
increases the damping of the oscillations.
4.3. Effect of viscosity
The effect of viscosity on surface tension measurements made by the growing drop
technique has heretofore not been explored (cf. (19)). To carry out a systematic
investigation of the effect of viscosity, glycerol-water solutions containing different
amounts of glycerol by weight were prepared and drops of these solutions were formed
20

from the capillary at two different flow rates. The viscosities and surface tensions of
these solutions are: (a) p = 6.0 centipoises, a = 71.1 dyne/cm for the 50% glycerol-
water solution, (b) p = 22.9 centipoises, u = 69.3 dyne/cm for the 70% glycerol-water
solution, and (c ) p = 112.8 centipoise-s, Q = 66.0 dyne/cm for the 85% glycerol-water
solution (26). Figure 16 shows that at short times, the surface tension as determined
by the Young-Laplace formula [6] can be substantially lower than the actual value of
the surface tension. Figure 16 makes plain that the discrepancy between the measured
and expected values of surface tension increases as drop viscosity increases. To account
for this viscous effect, it is at first sight plausible to estimate the viscous contributions
to the normal stress balance by assuming that the flow inside the growing drop is
radial flow. Unfortunately, the viscous corrections made in this manner can be shown
to affect the values of the dynamic surface tension by no more than 2%.
5. CONCLUDING REMARKS
According to the foregoing results, the growing drop technique is a simple, accurate,
and reliable method for determining the evolution in time of the dynamic surface ten-
sion of a single interface between a complex-mixture liquid drop and air on time scales
as early as 20 milliseconds. This is an improvement over related growing drop tech-
niques, e.g. that described in [19], where the earliest times of tension measurement
range between 40 and 70 milliseconds. However, in contrast to the growing tech-
nique as practiced in [19] and elsewhere, the new technique is, in principle, capable
of making measurements in as short as 1/6 of a millisecond of surface age. By using
the unique experimental tools available in this work, insights are also provided here
for the first time into why the growing drop technique as practiced currently is not
capable of furnishing dynamic surface tension data when 1/6 < t < 20 milliseconds.
21

Underdamped oscillations in the case of low viscosity systems and aperiodic decay in
the case of high viscosity systems of the drop interface and pressure render interpre-
tation of tension measurements impossible at these early times with the simple but
easy to use static Young-Laplace formula [Si. Because oscillations on the surface of a
liquid drop forming into another liquid would be damped out more quickly than those
on the surface of a liquid drop forming into a gas (32), the growing drop technique
as it stands should be able to determine the evolution of dynamic surface tension in
liquid-liquid systems starting at earlier times than in liquid-gas systems.
Because a maximum in the surface tension is attained when the lowering of the
surfactant concentration on the interface due to its dilatation is just balanced by the
addition of fresh surfactant to it from the drop bulk by convection and diffusion, it
is demonstrated in this work that surface tension, pressure, and radius of curvature
of the drop may not all be extremized at the same instant in time. This finding has
ramifications for the popular maximum bubble pressure method (12-14) and other
growing drop techniques (17, 19).
A systematic investigation of the effect of drop viscosity has revealed that increasing
viscosity results in an underestimation of the surface tension by the Young-Laplace
formula at small times. However, tension measurements are insignificantly affected
by viscosity for times exceeding about 100 milliseconds. At times earlier than 100
milliseconds, however, the assumption of radial flow inside the drop is unable to ac-
count for the magnitude of the viscous stresses and thus cannot provide the viscous
correction needed to produce correct values of the instantaneous tension.
The growing drop technique is also an important tool to study convection/dif€mion
and kinetics of adsorption/desorption of surfactants to and from moving interfaces.
Theoretical analysis of this problem requires knowledge of the flow inside the drop.
MacLeod and Radke (33) have studied this problem under the assumption that the
22

flow inside the drop is purely radial flow. Recent calculations, however, indicate that
the radial flow assumption may not always hold (22).
Therefore, there is a need to better understand the dynamics of drop formation.
Computational techniques based on the finite element (11, 21, 22) and boundary el*
ment methods (34) can be used to compute rigorously the transient profiles of growing
drops and flow fields inside them. By means of such computations, the early times
after zero surface age, the effects of viscosity, and the validity of the radial flow as-
sumption can all be examined in detail. With the aid of rigorous computations, one
ought to be able to back out the dynamic surface tension without reliance on the sim-
ple but limited Young-Laplace formula. More careful flow visualization experiments
than those carried out to date (see, e.g., (31, 35, 36)) are also needed to complement
the computations and, in particular, to gain insights into the physics of drop formation
during the k s t few milliseconds after drop breakup. Furthermore, the new compu-
tational and experimental studies should emphasize not only liquid-gas systems as in
this work but liquid-liquid systems (cf. (18, 19)) as well because of the importance of
the latter systems in chemical, petrochemical, and pharmaceutical industries.
Acknowledgements
This work was supported by the Spray Drift Task Force and the Divisions of Chem-
ical Sciences (O.A. Basaran), Material Sciences (M.T. Harris), and Advanced Energy
Projects (M.T. Harris), Office of Basic Energy Sciences, US. Department of Energy
under contract DEAC05-840R21400 with Martin Marietta Energy Systems, Inc. The
authors thank Dr. C. Hermansky, Professor C. J. Radke, and C. A. MacLeod for their
valuable comments and suggestions throughout this research, and for continuing stim-
ulating discussions on dynamic surface tension. W e are also indebted to our colleague3
in the ViSCLab at the Oak Ridge National Laboratory for their invaluable assistance
23

in the preparation of the photographs.
24

REFERENCES
1. Clift, R., Grace, J.R., and Weber, M.E., Bubbles, Drops, and Particles. Academic
Press, New York, 1978.
2. Edwards, D.A., Brenner, H., and Wasan, D.T., Interfacial fiansport Processes and
Rheology. Butt emor t h-Heinemann, Boston, 1991.
3. Djabbarah, H.F. and Wasan, D.T., Chern. Eng. Sci. 37, 175 (1982).
4. Lucassen, J. and van den Tempel, M., J. Colloid Interface Sci. 41, 491 (1972).
5. Hard, S. and Neumann, R.D., J. Colloid Interface Sci. 83,315 (1981).
6. Somasundaran, P., Danitz, M., and Mysels, K.J., J. Colloid Interface Sci. 48,410
(1974).
7. Lunkenheimer, K. Hartenstein, C., Miller, R. and Wantke, K.D., Colloids und
Surfaces 8 , 271 (1984).
8. Caskey, J.A. and Barlage, Jr. W.B., J. Colloid Interface Sci. 35,46 (1971).
9. Thomas, W.D.E. and Potter, L., J. Colloid Interface Sci. 50 , 397 (1975).
10. Bohr, N., Phil. 2h.m~. A209, 281 (1909).
11. Basaran, O.A., J. Fluid Mech. 241, 169 (1992).
12. Mysels, K.J., hngrnuir 2, 428 (1986).
13. Hua, X.Y. and Rosen, M.J., J. Colloid Interface Sci. 2 , 652 (1988).
14. Garrett, P.R. and Ward, D.R., J. Colloid Interface Sci. 132,475 (1989).
15. Pierson, F.W. and Whitaker S., J. Colloid Interface Sci. 54, 203 (1976).
16. Henderson, D.C. and Micale, F.J., J. Colloid Interface Sci. 158, 289 (1993).
17. Passerone, A., Liggieri, L., Rando, N., Ravera, F., and Ricci, E., J. Colloid
Interface Sci. 146, 152 (1991).
18. Nagarajan, R. and Wasan, D.T., J. Colloid Interface Sci. 159, 164 (1993).
19. Macleod, C.A. and Radke, C.J., J. Colloid Interface Sci. 160, 435 (1993).
25

20. Michael, D.H., Ann. Rev. Fluid. Mech. 13, 189 (1981).
21. Basaran, O.A., Zhang, X., and Harris, M.T., Paper 51k, presented at the 1993
Winter Annual Meeting of the AIChE, St. Louis, Missouri.
22. Basaran, O.A., Zhang, X., and Harris, M.T., in preparation.
23. Liggieri, L., Ravera, F., and Passerone, A., J. Colloid Interface Sci. 140, 436
(1990).
24. Davies, J.T. and Rideal, E.K., Interfacial Phenomena. Academic Press Inc.,
Boston, 1961.
25. Timermans, J., The Phsico-Chemical Constants of Binary Systems in Concen-
trated Solutions, Vol. 4. Interscience Publishers, New York, 1960.
26. Hodgman, C.D., Handbook of Chemistry and Physics. Chemical Rubber Publiih-
ing Co., Ohio 1951.
27. Lin, S.Y., McKeigue, K., and Maldarelli, C., AIChE J. 36, 1785 (1990).
28. Mysels, K.J., Lungmuir 2 , 423 (1986).
29. Serrien, G. and Joos, P., J. Colloid Interface Sci. 139, 149 (1990).
30. Harris, M.T. and Byers, C. H., An Advanced Technique for Interfacial Tension
Measurement in Liquid-Liquid Systems. ORNL/TM-10734 (1989).
31. Peregrine, D.H., Shokes, G., and Symon, A,, J. Fluid Mech. 212, 25 (1990).
32. Miller, C.A. and Scriven, L.E., J. Fluid Mech. 32,417 (1968).
33. MacLeod, C.C. and Radke, C.J., submitted to J. Colloid Interface Sci. (1993).
34. Wong, H., Rumschitzki, D., and Maldrelli, C., Paper 36g, presented at the 1993
Winter Annual Meeting of the AIChE, St. Louis, Missouri.
35. Humphrey, J.A.C., Hummel, R.L., and Smith, J.W., Chem. Eng. Sci. 29, 1496
(1974).
36. Johnson, G. and Marschall, E., Int. J. Multiphase Flow 12, 127 (1986).
26

Figure Captions
Figure 1. Sequences of drop shapes (1-111) during formation or growth of a drop from
a capillary. As the drop grows, the pressure difference across the drop interface and the radius of curvature of the drop vary in time as shown.
Figure 2. Time rate of change of the radius of curvature of a growing drop dR/&
normalized by the radius of curvature R at various flow rates. The drop is assumed to
grow as a spherical section and the abscissa has been made dimensionless by dividing
the actual time by the time it takes the drop to take on a hemispherical shape.
Figure 3. Experimental setup for measuring the dynamic surface tension of the
interface between a growing drop and an ambient fluid.
Figure 4. Time sequence of shapes of forming or growing drops observed in ex-
periments: (a) necking of drop, (b) rupture of neck or throat, (c) oscillations of
newly-formed drop, (d) pre-hemispherical drop, (e) hemispherical drop, and (d) post-
hemispherical drop.
Figure 5. Surface tension of the interface between growing drops of triple distilled
water, top, water plus glycerol, middle, and water plus propanol, bottom, and air at
different liquid flow rates. Points correspond to the actual dynamic surface tension
measurements and the solid lines are the equilibrium values of the surface tension.
Figure 6. Surface tension of the interface between a growing drop of water plus
0.01% Triton X-100 and air at different liquid flow rates. Points correspond to the
actual dynamic surface tension measurements and the bar on the right side is the
equilibrium value of the surface tension.
27

Figure 7. Interfacial dilatation rate of a growing drop i% at various flow rates.
The drop is assumed to grow as a spherical section and the abscissa has been made
dimensionless by dividing the actual time by the time it takes the drop to take on a
hemispherical shape.
Figure 8. Radius of curvature and pressure difference of a drop of water plus 0.01%
Triton X-100 growing out of a capillary into air at various flow rates.
Figure 9. Surface tension of the interface between water plus Triton X-100 and air at
different Triton concentrations. The liquid flow rate is held fixed at Q = lOpL/min.
Figure 10. Surface tension of the interface between a growing drop of water plus
6 m M Sodium Dodecyl Sulfate (SDS) and air at different liquid flow rates. Points
correspond to the actual dynamic tension measurements and the bar on the right side
is the equilibrium value of the surface tension.
Figure 11. Surface tension of the interface between a growing drop of water plus
0.01% Sodium Dioctyl Sulfosuccinate and air at different liquid flow rates. Points
correspond to the actual dynamic tension measurements and the bar on the right side
is the equilibrium value of the surface tension.
Figure 12. Surface tension of the interface between a growing drop of water plus
0.01% Induce AL-2700 and air at different liquid flow rates. Points correspond to the
actual dynamic tension measurements and the bar on the right side is the equilibrium
value of the surface tension.
Figure 13. Experimental observations of oscillations of a newly-formed water drop
in air at a liquid flow rate Q = lOOpL/min.
28

Figure 14. Instantaneous pressure difference across the interface between a growing
drop of water and air at different liquid flow rates. Points correspond to the actual
pressure measurements and the solid lines axe the theoretical predictions based on the Young-Laplace formula.
Figure 15. Instantaneous pressure difference across the interface between a growing
drop of water plus 70% glycerol and air at different liquid flow rates. Points correspond
to the actual pressure measurements and the solid lines are the theoretical predictions
based on the Young-Laplace formula.
Figure 10. Surface tension of the interface between a growing drop of water plus
different amounts by weight of glycerol and air at two different flow rates. Points
correspond to the actual dynamic surface tension measurements and the solid lines to
the equilibrium values of the surface tension.
29

H - .

6.0
3.0
T E
-6.0
-9.0
-12.0
I I I I I I I I I
- 1 I I I I I I
Q = 200 Mumin Q = 100 purnin Q = 10 ul/min
........................................
Q = 5 uL/min
I 1 I : I I I l l 1 I I 1 I 1 1 1 1 1 1 I 1 1 1 1 1
lo-' loo lo' DIMENSIONLESS TIME
Figure 2. Zhang et uf.

BACK-PRESSURE REGULATOR
KODAK EKTAPRO ELECTRONIC MEMORY
MOTION ANALYZER
CAPILLARY TUBE
MULTICHANNEL , DATA LINK
- I PRESSURE
GROWING DROP
VIDEO MONITOR
€!I SYRINGE
PUMP

C
a d
e
*-
Figure 4. Zhang et al.

100.0
85.0
70.0
55.0
40.0
25.0
10.0
Q=lOOCll/min WATER Q=lOttl/min
85% GLJ'CEROL A A
0 > > .
A A o + Q= 10 OpL/min Q=lOplAmin
Q=lOO~L/min 15% PROPANOL Q=lOLtl/min
10' lo2 TIME (msec)
io3
Figure 6. Zhang et al.

85.0
75.0 7 ? Q)
x U
7 0 7 W I-
65.0 u
55.0
35.0 vi
25.0 Id 10'
TIME (msec) IO"
Figure 6. Zhang et d.

IO2
IO’
IO0
lo-’
- - - LEGEND - Q = 200 pL/min - - Q = 100 pL/min
..........................e.............
Q = 10 pL/min Q = 5 pL/min
. . . . . . . . . . . . . . . . . . . . -.-.-.-.
- -
- - ,
-
lo-’ IO0 IO’ IO‘ DIMENSIONLESS TIME
Figure 7. Zhang et d.

I I 1 I I 1 I 1 1 1 1 1 1 1 1 I l l l 1 1 1 1 I l l l
3500.0 LEGEND
0 Q=200pUmin 0 Q = 100 pL/min A Q = 10pUmin + Q=5pL/min
3000.0 000
0 0 B O O 0 0
0 0 o o 0 0
2500.0 0
0
0 O O
0 0 A 'A
A 68 + W E 3 v, v, w E Q
l? A
+ 4 +
A + A + A
Q + 0 2000.0 A
A A + + A + +
+ +
+ + 1500.0
0.06 0
0 0 0
0 + +
+ 0 0 ? u W
0.05 +
0 + A 0 ~
0 0 0
0 0
A + A + A + A + 0 0
A A + + m03 Bot A 2 A A A + A + + 0.04
0.03 10' 10' 10" IO'
TIME (msec)
Figure 8. Zhang et d.

60.0
54.0
48.0
42.0
36.0
30.0
24.0
b.005%
0 0
0
0 0
0 0.01%
0 0
0 0
0.05%
0
A
I
0 0 0
0 0
0
0
A A
0 0 0 0 0 0 0
0
4
IO' TIME (msec)
Figure 9. Zhang et d.
56.0
54.0
52.0
50.0
48.0
46.0
44.0
LEGEND 0 Q = 100pUmin 0 Q = 1 5 p L h i n A Q=3pl/min
0
0 O O
0
0
0 0 0
0 0
0 0
0 A 00
A . 0
0
A O A
0 A
A A A
1 I 1 I I I l l i 1 I 1 I I I l l l 1 1 1 1 I I I I
10' io3 TIME (msec)
10"
Figure 10. Zhang et al.
90.0
80.0
70.0
60.0
50.0
40.0
30.0
LEGEND Q = 200 u r n i n Q = 100 pUmin- Q = 10 pVmin Q = 5 purnin
0
A
+
1 1 I I I I l l l 1 I I I I l l l l 1 I I 1 I l l \ a - -
IO’ la‘ IO” TIME (msec)
Figure 11. Zhang et d.

90.0
80.0
70.0
60.0
50.0
40.0
30.0
0
0
A
+
LEGEND Q = 200 pVin Q = 100 pUmi Q = 10 u r n i n Q = 5 pl/rnin
0 ~ ~ o o o o o . o 0 0 0 0 0 0
0 OO 0 0 0
0 0 0
0 0
0
- + + +, A AbAAM A
A + + A A + A b +
A + A A +
A +
I 1 1 1 I I I I I I I I I I l l I l 1 I 1 1
lo' 10' TIME (msec)
Figure 12. Zhang et d.

a
b
C V h
d b
1
e
Figure 13. Zhang et d.

5000.0
4500.0
4000.0
3500.0
3000.0
2500.0
2000.0
Q :A
0 Q = 100pUmin A Q = 10pLA'min
.................a . . . . . . . . . . . . . . . . . . . . .
----..---------.--..
- .
- I f ; :
I I
I I
I I
8 I - 8
8 a
I ' a'
* \ \
lo-' loo 10' lo' TIME (msec)
io3 io4
Figure 14. Zhang et d.

6.7 E ? Q) C >\ W W
W E 3 v, v, w E Q
4500.0
4000.0
3500.0
3000.0
2500.0
2000.0
1500.0
LEGEND PREDICTED
o Q = 100pL/min A Q = 10pUmin
....................................... -------------.-I-.-.
1 I 1 I Illll I 1 1 1 t l l l l 1 I I 1 Illll 1 1 1 I IIIll I 1 I I I I I
IO-' IO0 Id lo' TIME (rnsec)
io3 io4
Figure 15. Zhang et d.

76.0
70.0
64.0
58.0
52.0
46.0
40.0
x o + A x o
0 4
X
0
0
A
+ A X
X
0 X
LEGEND 50% - Q=lOOpL/min 50% - Q=lOpL/min 70% - Q=lOOpL/min 70% - Q=lOpL/rnin 85% - Q=lOOpL/min 85% - Q=lOpL/min 50% - REFERENCE 70% - REFERENCE 85% - REFERENCE
IO0 10' TIME hsec)
10' 10"
Figure 16. Zhang et d.