o2 1 technology and product roadmap 20180125...
TRANSCRIPT
GREEN PE
O2.1 TRANSNATIONAL TECHNOLOGY
AND PRODUCT ROADMAP
Status: 25-01-2018 Authors: Mietek Bakowski, Jang-Kwon Lim, Konstantin Kostov (RISE Acreo)
Please note that this roadmap document is a living document and is continuously
further developed and updated.

Transnational Roadmap
Version: 25/01/2018 Page 2 of 72
Document Control Sheet
Project Power Electronics for Green Energy Efficiency (Green PE)
Work package WP2 Transnational Technology and Product Roadmap of Advanced Power Electronics
Key words Electrical energy, energy efficiency, sustainable development, renewable sources of electrical energy, role of wide bandgap semiconductors, Silicon carbide (SiC), Galium Nitride (GaN)
Document history und versions
V1 [2016-08-12] Table of contents
V2 [2017-01-12] Roadmap document to be used for discussion with industry and policy makers
V3 [2017-01-16] References and appendices added
V4 [2017-04-05] Formal adaptions
V5 [2018-01-08] Updated sessions 5.2.1; 7.2.1; 8.2; 8.3; 13.2; 3.3 V6 [2018-01-25] Typographic changes
Distribution The document is open to all partners and external stakeholders

Transnational Roadmap
Version: 25/01/2018 Page 3 of 72
TABLE OF CONTENT
1 Introduction ....................................................................................................... 9
2 Energy perspective .........................................................................................10
2.1 Global challenges .................................................................................................. 10
2.2 New paradigm ....................................................................................................... 10
3 Efficient electric energy conversion ..............................................................12
3.1 Applications of power electronics........................................................................... 12
3.1.1 Saving potential by wide use of PE .................................................................... 12
3.1.2 Efficient energy conversion with WBG electronics – boosted saving potential .... 14
3.1.3 The concept of “Green Electronics” .................................................................... 15
3.2 Value proposition ................................................................................................... 15
3.3 Application opportunities versus maturity of the WBG technology ......................... 15
3.4 PE market ............................................................................................................. 16
4 WBG electronics ..............................................................................................18
4.1 SiC ........................................................................................................................ 18
4.2 GaN ....................................................................................................................... 19
5 WBG substrates ...............................................................................................20
5.1 SiC substrates ....................................................................................................... 20
5.1.1 Status and trends ............................................................................................... 20
5.1.2 Suppliers and market ......................................................................................... 21
5.2 GaN substrates ..................................................................................................... 23
5.2.1 Status and trends ............................................................................................... 23
5.2.2 Suppliers and market ......................................................................................... 23
6 WBG devices ....................................................................................................26
6.1 SiC discretes and power modules ......................................................................... 26
6.1.1 Overall Status and trends................................................................................... 26
6.1.2 Suppliers and market ......................................................................................... 26
6.1.3 Suppliers and market ......................................................................................... 28
6.1.3.1 Discrete devices – Diodes ........................................................................28
Transnational Roadmap
Version: 25/01/2018 Page 4 of 72
6.1.3.2 Discrete devices – MOSFETs ..................................................................29
6.1.3.3 Discrete devices – Transistors .................................................................29
6.1.3.4 Power modules ........................................................................................30
6.2 GaN discretes and power modules ........................................................................ 31
6.2.1 Status and trends ............................................................................................... 31
6.2.2 Suppliers and market ......................................................................................... 32
7 Renewable energy sources ............................................................................33
7.1 PV and wind .......................................................................................................... 33
7.1.1 Photovoltaic (PV) ............................................................................................... 33
7.1.1.1 Power devices & modules ........................................................................34
7.1.1.2 Manufacturers ..........................................................................................37
7.1.1.3 Markets ....................................................................................................38
7.1.2 Wind turbines ..................................................................................................... 40
7.1.2.1 Power devices & modules ........................................................................40
7.1.2.2 Manufacturers ..........................................................................................41
7.1.2.3 Markets ....................................................................................................42
7.2 Marine energy ....................................................................................................... 42
7.2.1 Power devices & modules .................................................................................. 43
7.2.2 Manufacturers .................................................................................................... 43
7.2.3 Markets .............................................................................................................. 44
7.3 Energy storage ...................................................................................................... 44
7.3.1 Power devices & modules .................................................................................. 44
7.3.2 Manufacturers .................................................................................................... 44
7.3.3 Markets .............................................................................................................. 44
8 Switch mode power supplies .........................................................................45
8.1 Power devices & modules ..................................................................................... 45
8.2 Manufacturers ....................................................................................................... 47
8.3 Markets ................................................................................................................. 47
9 Electric and hybrid vehicles ...........................................................................48
9.1 Power devices & modules ..................................................................................... 48
9.2 Manufacturers ....................................................................................................... 50
Transnational Roadmap
Version: 25/01/2018 Page 5 of 72
9.3 Markets ................................................................................................................. 50
10 Industrial motor drives ....................................................................................52
10.1 Power devices & modules ..................................................................................... 52
10.2 Manufacturers ....................................................................................................... 53
10.3 Markets ................................................................................................................. 54
11 Railways ...........................................................................................................55
11.1 Power devices & modules ..................................................................................... 55
11.2 Manufacturers ....................................................................................................... 56
11.3 Markets ................................................................................................................. 57
12 UPS, data centers, base stations for telecom ...............................................58
12.1 Power devices & modules ..................................................................................... 58
12.2 Manufacturers ....................................................................................................... 60
12.3 Markets ................................................................................................................. 60
13 Emerging applications ....................................................................................62
13.1 Power devices & modules ..................................................................................... 62
13.2 Manufacturers ....................................................................................................... 65
13.3 Markets ................................................................................................................. 65
14 WBG market potential .....................................................................................67
14.1 Power devices & modules ..................................................................................... 67
14.2 Inverter market ...................................................................................................... 67
14.3 Technical challenges ............................................................................................. 68
14.4 Price development ................................................................................................. 70
15. List of Literature ................................................................................................71
16. Appendix List .....................................................................................................72
Transnational Roadmap
Version: 25/01/2018 Page 6 of 72
LIST OF FIGURES
Figure 1 Power device positioning by voltage and low-to high-end applications. Based on information from [3]................................................................................................................................................... 15
Figure 2 Power device market (2010-2021) for discrete devices, power modules, and power ICs. Based on information from [3]. .............................................................................................................. 16
Figure 3 Market size for power devices from 2010 to 2021 in M$ (Source: Yole Inverter Technology Trends and Market Expectations May 2016 data). ............................................................................... 16
Figure 4 Market share distribution of power electronic applications (Source: Yole Inverter Technology Trends and Market Expectations May 2016 data). ............................................................................... 17
Figure 5 Market share portion of power electronic applications (Source: Yole Inverter Technology Trends and Market Expectations May 2016 data). ............................................................................... 17
Figure 6 Regional SiC substrate suppliers. © Green Power Electronics 2017. .................................... 21
Figure 7 SiC wafer supplier status considering material polytypes, doping, and orientation. © Green Power Electronics 2017. ........................................................................................................................ 21
Figure 8 Market share estimate for n-type SiC substrate players. Based on information from [1]. ...... 22
Figure 9 Market size projection for SiC n-type substrates 2015-2025, reaching a CAGR of 18 % Based on information from [1]. .......................................................................................................................... 22
Figure 10 Average price estimation for SiC n-type substrate. Based on information from [1]. ............. 23
Figure 11 Regional players map for GaN-on-Si epitaxy. © Green Power Electronics 2017. ................ 24
Figure 12 Outsourcing GaN epiwafers market volume (Unit, 6” equivalent) during 2016-2021. Based on information from [2]. .......................................................................................................................... 24
Figure 13 Market size of outsourcing GaN epi-wafers. Based on information from [2]. ....................... 25
Figure 14 SiC power devices and modules makers according to different types of power devices © Green Power Electronics 2017. ............................................................................................................. 26
Figure 15 Market share comparison of SiC device makers. Based on information from [1]. ................ 27
Figure 16 Expectation of SiC power device market split by applications, reaching a CAGR of 20% (Source: Yole Power SiC Materials Devices Modules Applications June 2016 data). .......................... 27
Figure 17 SiC device market split by diode and transistor during 2015-2025. Based on information from [1]................................................................................................................................................... 28
Figure 18 Commercially-available SiC diode suppliers. © Green Power Electronics 2017. ................. 28
Figure 19 Commercially-available SiC MOSFET suppliers. © Green Power Electronics 2017. ........... 29
Figure 20 Commercially-available SiC transistor suppliers (other types compared to MOSFET). © Green Power Electronics 2017. ............................................................................................................. 29
Figure 21 Estimation of SiC transistor market split by applications. Based on information from [1]. .... 30
Figure 22 Commercially available SiC-based power module suppliers. © Green Power Electronics 2017. ...................................................................................................................................................... 30
Figure 23 Diode market portion split by discrete, hybrid module, and full SiC module. Based on information from [1]. ............................................................................................................................... 31
Figure 24 GaN device market split by voltages (200 and 600 V) during 2015-2021. Based on information from [2]. ............................................................................................................................... 31
Figure 25 GaN power device market split by application 2015-2021, reaching a CAGR of 86 %. Based on information from [2]. .......................................................................................................................... 32
Figure 26 Existing GaN power device suppliers (including devices commercially available, under development, demonstrated, and in sampling). © Green Power Electronics 2017. ............................. 32
Figure 27 Market forecast in units for SiC diodes and transistors in PV during 2015-2021. Based on information from [1]. ............................................................................................................................... 34

Transnational Roadmap
Version: 25/01/2018 Page 7 of 72
Figure 28 Market share for SiC diodes and transistors in PV during 2015-2021. Reproduced from [1]. ............................................................................................................................................................... 35
Figure 29 Market forecast for GaN devices in PV during 2015-2021 in units. Reproduced from [2]. ... 36
Figure 30 Market for GaN devices in PV during 2015-2021. Based on information from [2]. ............... 36
Figure 31 Manufacturers in different parts of the supply chain for PV market. © Green Power Electronics 2017. ................................................................................................................................... 37
Figure 32 Market forecast segmented by inverter size during 2015-2021. Based on information from [3 and 4]. ................................................................................................................................................ 38
Figure 33 Installed PV capacity forecast during 2015-2021. Based on information from [3 and 4]. ..... 38
Figure 34 Market forecast for PV inverter during 2016-2025, showing a CAGR of 3.2 %. Based on information from [3 and 4]...................................................................................................................... 39
Figure 35 PV market split in 2015. Produced by [3]. ............................................................................. 39
Figure 36 Market forecast for SiC diodes in Wind Turbines in units. Based on information from [1]. ... 40
Figure 37 SiC diode market in Wind Turbines. Based on information from [1]. .................................... 41
Figure 38 Regional wind turbines manufacturers © Green Power Electronics 2017. ........................... 41
Figure 39 Comparison of market shares between 2014 and 2015. Based on information from [3]...... 42
Figure 40 Regional manufacturers for tidal turbine converter © Green Power Electronics 2017. ........ 43
Figure 41 SiC device market for PFC in units. Based on information from [1]. .................................... 45
Figure 42 SiC device market for PFC. Based on information from [1]. ................................................. 46
Figure 43 GaN device market for PFC in units. Based on information from [2]. ................................... 46
Figure 44 GaN device market for PFC. Based on information from [2]. ............................................... 47
Figure 45 SiC device market for EV/HEV application in units. Based on information from [1]. ............ 48
Figure 46 SiC device market for EV/HEV application. Based on information from [1]. ......................... 48
Figure 47 GaN device market for EV/HEV application in units. Based on information from [2]. ........... 49
Figure 48 GaN device market for EV/HEV application. Based on information from [2]. ....................... 49
Figure 49 Electric vehicle manufacturers © Green Power Electronics 2017. ....................................... 50
Figure 50 Annual demand for EV/HEV by vehicle type in units. Based on information from [3]. .......... 51
Figure 51 Market forecast for EV/HEV inverter by vehicle type. Based on information from [3]. ......... 51
Figure 52 SiC device market for motor drives in units. Based on information from [1]. ........................ 52
Figure 53 SiC device market for motor drives. Based on information from [1]. .................................... 52
Figure 54 AC motor drive market split in 2015. Based on information from [3]. ................................... 53
Figure 55 AC motor drive inverters market. Based on information from [3]. ......................................... 54
Figure 56 SiC device market for trains in units. Based on information from [1]. ................................... 55
Figure 57 SiC device market for trains. Based on information from [1]. ............................................... 56
Figure 58 Train manufacturers market split in 2015. Based on information from [3]. ........................... 56
Figure 59 Inverter market for different train types. Based on information from [3]................................ 57
Figure 60 Market forecast for SiC diodes and transistors for UPS during 2015-2021 in units. Based on information from [1]. ............................................................................................................................... 58
Figure 61 Market of SiC diodes and transistors for UPS during 2015-2021. Based on information from [1]. .......................................................................................................................................................... 59
Figure 62 GaN device market for UPS in units. Based on information from [2]. ................................... 59
Figure 63 GaN device market for UPS. Based on information from [2]. ............................................... 59

Transnational Roadmap
Version: 25/01/2018 Page 8 of 72
Figure 64 Large UPS manufacturer market split in 2015. Based on information from [3]. ................... 60
Figure 65 Inverter market size for UPS split by power range. Based on information from [3]. ............. 61
Figure 66 GaN device market for wireless power in units. Based on information from [2]. .................. 62
Figure 67 GaN device market for wireless power. Reproduced by [2]. ................................................. 63
Figure 68 GaN device market for envelop tracking in units. Based on information from [2]. ................ 63
Figure 69 GaN device market for envelope tracking. Reproduced by [2]. ............................................ 64
Figure 70 GaN device market for Lidar in units. Based on information from [2]. .................................. 64
Figure 71 GaN market for Lidar. Based on information from [2]. .......................................................... 65
Figure 72 Whole inverter market in units split by application. Based on information from [3]. ............. 67
Figure 73 Inverter market forecast split by application. Based on information from [3]. ....................... 68
Figure 74 Expected benefits from device to system with SiC-based power devices vs issues. © Green Power Electronics 2017. ........................................................................................................................ 69
Figure 75 SiC MOSFET cost breakdown. The cost of the SiC MOSFET is calculated to be 3.05, 3.12 and 3.4 $/device, respectively, counting from left to right. Based on information from [1]. ................... 70
LIST OF TABLE
Table 1 Paradigm shift. © Green Power Electronics 2017. ................................................................... 15
Table 2 Quality of SiC wafers and epilayers © Green Power Electronics 2017.................................... 20

Transnational Roadmap
Version: 25/01/2018 Page 9 of 72
1 Introduction This output document formulates a roadmap for wide bandgap (WBG) electronics in the
perspective of the increasing demand for electric energy and climate change. New WBG
semiconductor materials facilitate revolutionary changes in the power electronics (PE) and enable a drastic increase of electric energy conversion efficiency and an increase in the power
density of electric systems. The implementation of new efficient PE should speed up the
electrification and efficient use of electric energy in many application areas with large energy savings as a result.
This roadmap provides general background information to the localised roadmaps of the
development towards the implementation of green energy in the Baltic Sea Region presented
in a separate document (Regional Mapping of the sectorial specialization for different countries/regions).
This roadmap aims to increase knowledge among industry (firms, component producers,
system providers, consulting and financing, business incubators, business development agencies), research institutes (R&D institutions, technology parks, technology platforms),
governmental organizations (policy maker, regulatory bodies, public procurement), and society about chances and barriers for the market uptake of Advanced Power Electronics.
The roadmap is meant to raise awareness among industry, especially small and medium sized
enterprises (SME), research institutes, governmental bodies, and society in the Baltic Sea
Region and beyond about the importance, market attractiveness and benefits of Advanced Power Electronics.

Transnational Roadmap
Version: 25/01/2018 Page 10 of 72
2 Energy perspective The importance of power electronics and of the new WBG materials has to be seen in the
perspective of the energy demand and climate change. One of the greatest challenges for
mankind is the accelerating global demand for electric energy. Improved efficiency in production, distribution and consumption of electricity is a key factor on the road to a
sustainable energy future. Efficient power electronics and WBG technologies play an important role.
2.1 Global challenges
The individual energy consumption in Europe has been growing almost exponentially in the history of mankind accelerating from the middle ages and throughout the industrial era and it
continues to grow. A similar growth of energy consumption is now taking place in the
developing part of the world. At present, 25 % of the world population is consuming 75 % of
the energy. At the same time the world population is growing rapidly. The world population is predicted to reach 9 billion people in year 2050, which is a 5-fold increase since 1950. Most of
this demographic explosion takes part in the developing countries. Consequently, a large increase in global energy demand is expected in the coming years.
There are two environmental challenges related to the production and consumption of energy.
One is the limited supply of fossil energy resources (oil, gas and coal) and second is the climate warming due mainly to the CO2 emissions.
Moreover, the demand for electricity is growing steadily. The consumption of electrical energy
worldwide is estimated to grow by 160 % by year 2050. Access to this basic commodity is very
unevenly distributed in the world and the biggest increase will take place in the developing world. The electricity is generally thought of as an environmentally friendly and clean energy
source. However, about 70% of the electrical energy generation in 2025 is predicted to rely
still on fossil energy sources, and only about 20 % on renewable energy sources and 10 % on nuclear power.
The focus on energy efficiency comes from two sources - one is the necessity to preserve
natural resources by transforming them into electrical energy in the most efficient way, and
second is saving electrical energy by using it in the most effective way mainly by reducing losses in the electrical power systems.
2.2 New paradigm
Power electronics is the key technology in controlling the flow of electrical energy from the
source to load. The share of total electrical energy in industry, transportation, as well as home
and office appliances, which is controlled by power electronics e.g. in variable speed drives (ac motors) was estimated to increase from 40 % to 80 % since 2000.
Energy saving, improved energy efficiency and environmental protection have become top
priority political issues in Europe. The demand for electricity is expected to grow much faster compared to other energy sources until 2050. The consumption of electrical energy is
predicted to grow from 40% to over 60% of all energy consumption. It becomes urgent to
reduce consumption by increasing efficiency and to improve generation by increased use of renewable energy sources. Power electronics assume a key role in this perspective.

Transnational Roadmap
Version: 25/01/2018 Page 11 of 72
Efficiency of power electronic systems depends on losses in active and passive components.
The efficiency can be greatly improved by replacing the silicon devices by silicon carbide (SiC) or gallium nitride (GaN) ones. The specific material properties of SiC translate into high value
added for electronic power systems. Specifically, high electric field breakdown in combination
with reasonably high electron mobility and high thermal conductivity translate into improved
efficiency, dynamic performance and reliability of electronic and electric systems. It is relatively straight-forward to envisage savings on cooling requirements connected with increased
working temperature of the devices well above the 125 to 150 °C typical of silicon power
devices as well as reduced noise, size and weight of systems due to greatly increased
switching frequency. To overcome both limitations has long been desirable especially in high
voltage applications above 1 kV where bipolar silicon devices must be used. Such devices are necessarily slow and suffer from high switching losses due to substantial recovery charge which makes them the limiting component in the performance of many systems.
The appearance of wide bandgap (WBG) power devices on the market will bring about and accelerate new developments in the areas of packaging, passive components (capacitors),
circuit and system design as well as improvements in construction and operation of electric
motors. It will not be in general most effective just to substitute Si devices by WBG ones in
existing circuits. It will be necessary to adopt new solutions in order to utilize the full potential of increased operational frequency, working temperature and reduced size of active devices.
The advent of WBG power devices will reinforce thinking in terms of the total power system
including electrical, mechanical and electromechanical components. It will provide an incentive
towards an increased integration of electronics with electromagnetic and mechanical parts of the system. The electrical motors will have to be improved as well in order to facilitate the integration and utilisation of the benefits of high frequency operation.
The most dynamic R&D areas in the near future are advanced device concepts and high temperature WBG power semiconductor materials such as SiC, GaN, and diamond, compact
high power density system design for Si and WBG semiconductors, new interconnection
technologies for ultra-high power density systems and high temperature electronics, advanced
materials for isolation, high thermal conductivity, high temperature compact passives and sensors, in lighting smart and simple dimming concepts, high efficiency light sources
(LED/OLED) and their power electronic drivers, load management by power electronics in
distributed energy generation networks, multi-domain/level modeling and simulation, stress analysis and built-in reliability, improved system reliability and fault-tolerant systems.
Transnational Roadmap
Version: 25/01/2018 Page 12 of 72
3 Efficient electric energy conversion Power electronics is the enabling technology for efficient use, distribution and generation of
electrical energy. Advanced power electronics could for example realize savings of more than
50 % in energy losses in converting from mains or battery voltages to that used in electronic equipment.
Power electronics is key technology for sustainable development. Sustainable development
demands increasing use of electric energy. Increasing demand of electric energy demands electric energy saving and efficient use of electric energy. The generation, distribution and use
of electric energy requires electric energy conversion which in turn requires power electronics.
Those are the major drivers for power electronic systems and highly efficient electric energy conversion.
3.1 Applications of power electronics
Use of efficient power electronics is needed in many applications like a) electrification of
transport (automobiles, busses, trains, airplanes, forklift trucks, …), b) industrial electric motor
drives (pumps, funs, compressors, conveyers, steel mills, …), c) elevators and escalators, d) heat pumps and air conditioners, e) home appliances, f) high-frequency industrial applications (resonant converters), g) electric grid (HVDC, flexible AC transmission systems (FACTS)).
3.1.1 Saving potential by wide use of PE
The energy saving potential of widely used modern power electronics is related to highly
efficient variable speed motor drives with energy recovery used in various applications, to
smart power supplies enabling high efficiency over a wide load range and zero-power standby function as well as to energy efficient and low-emission mobility with hybrid and electric vehicles.
Power electronics is, furthermore, enabling a sustainable energy supply based on renewable
energy sources such as wind and solar. Power electronics facilitates efficient transfer of the
energy from these intermittent sources to the electricity grid. It also enables the connection of various energy storing solutions that will help managing the stability of the power grid.
The estimated energy savings potential of wide introduction of power electronics into systems is more than 25 % of the current electricity consumption by 25 EU member states.
Some examples of savings potential and key role of power electronics are:
(a) Electric motor drives including industrial motor drives, elevators and escalators, heat
pumps and air conditioning, home appliances and traction drives are estimated to account for 50% of total electricity consumption in Europe.
The energy savings potential by introducing Variable Speed Drives (VSDs) is estimated
to be 30 – 40 % for most applications. The technical potential for energy savings is relevant for about 40 – 50 % of all motors depending on the application, and given that
VSDs have already been applied to about 15 – 20 % of all motors the remaining
potential is estimated to be about 30 %. There is an additional energy saving of 20 %
through the recuperation of electrical machines during breaking, which is frequently used in elevators and traction application of trains and heavy vehicles with power
electronic converters. Combining all these figures, the total electrical energy-savings
potential of VSDs is about 5 – 6 % of the current electrical energy consumption.
Transnational Roadmap
Version: 25/01/2018 Page 13 of 72
(b) Mobility and transportation is responsible for 30 % of energy consumption and is the fastest growing sector of European economy. Power electronics is an enabling technology for the development of drive trains and battery-charging for the hybrid and electrical vehicles. Hybrid and electric buses using electric vehicle propulsion technology are increasingly becoming part of transportation systems. They offer considerable fuel savings and reduce emissions. Power electronics is a necessary part of the drive train of these buses. Furthermore, the increasing electrification of previously mechanical and hydraulic vehicle functions and introduction of such x-by-wire applications like electric power steering or electric braking, require the use of power electronics. Aviation is responsible for ~12 % of the transport energy consumption and is the
fastest-growing energy consumer in the EU, with an increase of 73 % between 1990
and 2006. Air transport demand is predicted to double in the next 10 - 15 years and
triple in 20 years. Power electronics is also an enabling technology for the more electric aircraft, where various bleed air and hydraulic power functions are replaced with
electrical equivalents. Which enables a significant improvement in efficiency, system flexibility, aircraft reliability and specific fuel consumption.
(c) Smart grid and renewables are on the priority actions list by the European Commission in its Action Plan for Energy Efficiency. One of the priority actions is to make power generation and distribution more efficient. Transmission and distribution (T&D) losses of electrical energy are typically between 6 % and 8 %. A European Task Force T&D Working Group has identified a number of energy-efficient technologies for grids, including power electronics technologies such as HVDC, FACTS, power electronic transformers, distributed generation and micro grids. Power electronics is necessary to interface distributed generators such as wind turbines and solar cells to the grid. Power electronics has been identified as a key technology in all four pillars of Smart Grids: (1) Integration of renewables: wind turbine converters, HVDC for offshore wind park
connection, SVC/STATCOM for grid code compliance, energy storage for improving stability and decreasing power fluctuations, solar inverters,
(2) Integration of electric vehicles: (fast) charging of electric vehicles, traction drive for hybrid electric vehicles, dynamic energy storage to absorb peaks due to simultaneous charging of electric vehicles,
(3) Reliability and efficiency: efficient long distance transmission with HVDC, variable speed drives in industrial plants and pumped hydro stations, energy storage for emergency and peak power, power quality solutions for industry,
(4) Demand response: converter interface to distributed generation with built-in load management capability drives in pumped hydro station with remote control from control center.
(d) Data centers and base stations.
Electrical energy demanded by data centers and servers in Western Europe was 56
TWh in 2007 and is forecast to increase incrementally to 104 TWh in 2020. In a typical data center, less than half of this power is delivered to the compute load, which includes
microprocessors, memory and disk drives. The rest of the power is lost in power
conversion, distribution, and cooling. The use of advanced power electronics
techniques, like new DC distribution networks, can lead to a 10 % reduction of the required energy. The integration of ICT technologies and power electronics and

Transnational Roadmap
Version: 25/01/2018 Page 14 of 72
improving energy management can save an additional 20 %. Further research on reliability, implementation and cost reduction can further improve these numbers.
Estimates indicate that the telecom industry consumes 1 % of the global electricity, and more than 90 % is consumed by network operators. Almost 30 % of electrical energy savings can be achieved in radio base stations (RBS) by employing efficient power electronics technologies such as efficient power amplifiers and techniques for low consumption in standby mode. In ICT applications power supplies require ultra-high power density along with high efficiency at the same time. With the new power devices and optimized passive components this target can be achieved. The annual electricity consumption related to standby functionalities and off-mode losses in the EU was estimated to have been 47 TWh in 2005. It has been estimated
that the total annual energy savings potential for standby consumption in the EU is
35TWh, and power semiconductor manufacturers claim that more than 90 % standby
consumption reduction is feasible.
(e) Lighting in commercial, industrial and residential building, and street lighting
The savings are related to new technologies based on solid-state lighting (light emitting diodes, LED) requiring electronic power conversion. By operating LEDs with pure
digital controlled power converters, the lifetime is significantly longer along with an
additional energy saving potential.
(f) Intelligent buildings by control of lighting and energy consumption and occupancy
sensing.
3.1.2 Efficient energy conversion with WBG electronics – boosted saving potential
WBG materials (primarily SiC and GaN) enable a revolutionary development in the field of
electrical energy conversion. Electronic devices based on these materials enable dramatically
lower losses, higher frequencies and compact highly efficient electrical power systems. The losses can be reduced by at least 50 % in most of the PE applications using WBG technologies.
The total savings potential by introduction of WBG based PE in all the applications is thus estimated to be for
(a) Electric motor drives more than 20 % of the current electrical energy consumption
assuming that WBG based VSDs are used in 50% of applications with additional energy savings of 50%. Other assumptions as in section 3.1.1 including the 20 % recovery of
the energy at breaking.
(b) E-mobility and transportation the total potential depends on the degree and pace of the
electrification. Introduction of WBG electronics should accelerate electrification process enabling 4-6 % increase of efficiency of converters resulting in the increased range on
the same battery charge and in the reduced fuel consumption and thus reduced CO2
emissions from hybrid vehicles due to the compactness and thus reduced weight of the
electric systems. (c) Smart grid and renewables more than 2-4 % of the total transmitted and distributed
electrical energy. Environmental gains are dominant however 50 % savings from the
level of the state of the art inverters is feasible.
(d) Data centers and base stations about 50 % reduction of losses from the levels of the state of the art power electronics seems to be a good estimate.
(e) Lighting and (f) Intelligent buildings saving potential should be significant also in these applications.

Transnational Roadmap
Version: 25/01/2018 Page 15 of 72
3.1.3 The concept of “Green Electronics”
Green Electronics is an interdisciplinary electronic technology for efficient use of electric
energy based on PE, microelectronics, ICT (Information and Communication Technologies) and electronic materials. The concept fits the paradigm shift to the more electricity dependent and electric energy-oriented society.
Table 1 Paradigm shift. © Green Power Electronics 2017.
New Paradigm Enabling technologies
• Energy efficiency • System perspective • System integration • System optimization • System cost • High power density • Heterogeneous integration
• Power electronics • ICT • WBG materials • Magnetic, dielectric & insulating materials • Interconnection materials • 3D & low inductive packaging • HT packaging & efficient cooling
3.2 Value proposition
Development of advanced power electronic products and systems for renewable energy
sources, electrification of vehicles and transportation and smart grids means competitive
advantages for national products on the global market and opportunity of industrial renewal and growth for the national economy.
3.3 Application opportunities versus maturity of the WBG technology
WBG electronics will make gradual intrusions into the PE market dominated today by Si
devices. All different semiconductor materials and technologies will be utilized depending on the application, maturity and price.
The next five years are decisive and very promising for SiC and GaN devices. System manufacturers are developing new prototypes with these devices and in the next several years the results will reach the market. By 2020 WBG materials will be implemented in specific areas in each application segment.
Figure 1 Power device positioning by voltage and low-to high-end applications. Based on information
from [3].
1200V or
more
600V or less
Pro
du
ct r
an
ge
Voltage
IGBTThyristor
IGCT
…
SiC
MOSFET
Triacs
Bipolar
etc.
3.3kV and more200V
GaN GaN

Transnational Roadmap
Version: 25/01/2018 Page 16 of 72
3.4 PE market
The power electronics market is expected to remain steady after 2018.
According to [3], the power electronics market contracted in 2015, despite most indicators pointing towards continuing growth.
Figure 2 Power device market (2010-2021) for discrete devices, power modules, and power ICs. Based on information from [3].
Even though every device will see an increase with CAGR of +3.4 %, power modules & IPMs will have the biggest growth, reaching a CAGR of +9.4 %.
According to [3], modules will increase considerably, while discrete (IGBT & MOSFET) expansion will be slowed down.
Year
20102011
20122013
20142015
20162017
20182019
20202021
Pow
er
Devic
e M
ark
et
in M
$
0
5000
10000
15000
20000
25000
RectifiersThyristors
BipolarX-FET
IGBT
Module & IPMPower IC
Figure 3 Market size for power devices from 2010 to 2021 in M$ (Source: Yole Inverter Technology Trends and Market Expectations May 2016 data).
Year
20102011
20122013
20142015
20162017
20182019
20202021
PE
Ma
rket
Siz
e,
$M
0
5000
10000
15000
20000
25000Discretes
Power Modules
Power IC
An
nu
al G
row
th R
ate
, %
-0,2
-0,1
0,0
0,1
0,2
0,3
0,4
0,5

Transnational Roadmap
Version: 25/01/2018 Page 17 of 72
The global power electronics market is expected to steadily increase during 2015-2021.
Particularly, the automotive industry is expanding with the evolution of electric vehicles (EVs) and hybrid electric vehicles (HEVs).
Year
20122013
20142015
20162017
20182019
20202021
Pow
er
Ele
ctro
nic
Ap
plic
ation
s M
ark
et
Sha
re,
$M
0
5000
10000
15000
20000
25000
IT/Electronics power supply
White goods/large consumer appliances
Industry
Automotive
Lighting
Telecommunication
Medical
Transportation
Energy generation
T&D
Military & Aerospace
Others
Figure 4 Market share distribution of power electronic applications (Source: Yole Inverter Technology Trends and Market Expectations May 2016 data).
In total power electronic market, the applications of automotive, industry, IT/electronics power supply have a big portion in a market share. The decreased market portion of IT/Electronics power supply is due to the increased market of automotive industry.
Year
20122013
20142015
20162017
20182019
20202021
Pow
er
Ele
ctr
onic
Applic
atio
ns M
ark
et S
ha
re, %
0
20
40
60
80
100
IT/Electronics power supplyWhite goods/large consumer appliances
Industry
Automotive
LightingTelecommunication
Medical
Transportation
Energy generationT&D
Military & Aerospace
Others
Figure 5 Market share portion of power electronic applications (Source: Yole Inverter Technology Trends and Market Expectations May 2016 data).

Transnational Roadmap
Version: 25/01/2018 Page 18 of 72
4 WBG electronics
4.1 SiC
The total SiC device market was estimated to be worth more than 200 M$ in 2015 and a projection for 2021 is 600 M$ with a mean growth rate (CAGR) of 20 %.
The growth is fueled by more players entering the market from material to device level, increased availability of SiC devices and increase in number of users of SiC devices.
The switch mode power supply (PFC) market is still leading SiC application with 100 M$ worth in 2015.
The market of Photovoltaic (PV) applications is expected to reach more than 180 M$ in 2021. The modification of micro-inverter topology caused the decrease in the use of SiC diodes,
however the performance and price benefits of SiC on the system level for string PV inverters are now widely acknowledged motivating the use of both SiC diodes and SiC MOSFETs.
For EV and HEV applications the main market increase before 2021 is expected to be in on-
board chargers. Regardless of the fact that many leading OEMs are testing SiC devices, no
significant adoption of the SiC for power train inverter or DC/DC converter is expected before 2021 due to the high cost and relative lack of SiC MOSFET maturity. The pioneers like Toyota, Nissan and Honda will however continue to develop and test SiC based solutions.
The continued intense development and implementation of the SiC solutions is expected in the Traction applications during the coming 5 years in both auxiliary and propulsion systems at 1.7 kV and 3.3 kV. The mainly hybrid solutions (SiC diodes and Si IGBTs) by Hitachi, Mitsubishi Electric, Toshiba and Fuji will be followed by others. The present concerns about the reliability issues must be overcome before a widespread adaptation of SiC technologies can take place. When it comes to SiC devices, the 85 % of the SiC device market worth 170 M$ in 2016 is attributed to SiC diodes. The performance and the value added have been gradually improved and confirmed since the commercialization in 2001. Also, the price has been gradually reduced as more and more suppliers has entered the market since the 2009 reaching a number of 18 suppliers by May 2016. Considering the low integration effort, relative maturity of the diode technology and continued falling price the diode market is estimated to continue grow with a CAGR of 14 % and reach 400 M$ in 2021. The SiC MOSFET has become the switch concept that will dominate the market. Both DMOSFET and Trench MOSFET will be developed and available at the market during the coming years. The strong argument for the DMOSFET is a long-established process guaranteeing the reliability and for Trench MOSFET a better performance at the cost of more difficult process. There are four main issues hindering the market growth of SiC MOSFETs. They are confirmation of long-term reliability, more independent sources of devices, device cost and integration issues (gate drivers). There are at present only four MOSFET suppliers, however more suppliers are expected to enter the market within nearest two years (Infineon, GE, Hestia-Power, Global Power Technologies, Panasonic, and Fairchild). The high device cost is mainly related to the high cost of SiC substrates and the lower yield compared to diodes. Considering all the above the SiC switch market is estimated to be worth only 27 M$ in 2015, representing less than 15 % of the total SiC device market. However, as more suppliers enter
the market after 2018, the market is expected to reach about 200 M$ by 2021, representing more than 30 % of the total SiC device market.

Transnational Roadmap
Version: 25/01/2018 Page 19 of 72
4.2 GaN
The GaN power business was only 6.8 M$ in 2015. A couple of developments during 2015 and 2016 constitute a positive change in market development. Since 2016 not only low voltage GaN (<200V) devices from Efficient Power Conversion (EPC), but also high voltage (600V/650V) components from several players including Transphorm, GaN Systems and Panasonic became available. 2016 has also seen introduction of the GaN power ICs by Navitas Semiconductor and Dialog Semiconductor. Other companies entering the GaN IC market are EPC, GaN Systems and OnSemiconductors.
Power supply applications for datacenters, telecom and AC fast chargers are expected to be the leading applications during the 2016 – 2021 period. The power supply market is expected to grow from 2 M$ in 2015 to more than 170M$ in 2021, representing more than 60% of the total market. The market looks promising also for low voltage GaN. Demand for high efficiency amplifiers in base stations together or without Envelope Tracking (ET) technique becomes more critical
with introduction of 5G. GaN multimode devices are also convenient for system
manufacturers considering development of different wireless charging standards as Qi and
AirFuel. Finally, with development of different robotic and automotive applications, specifically those requiring lidar, GaN devices will play an integral role in offering high switching frequency and high efficiency.
Considering the above, the total GaN power device market is expected to reach 280 M$ in 2021, with a 2015-2021 CAGR of 86 %.
EPC is the leading manufacturer in the total device market, followed by IR (now part of Infineon), Transphorm, and GaNSystems.

Transnational Roadmap
Version: 25/01/2018 Page 20 of 72
5 WBG substrates
5.1 SiC substrates
The increase in substrate size has been dramatic over the last 15 years, motivated by the
prospect for SiC technology to enter production phase. Today 100 mm wafers can be purchased, and 150 mm and 200 mm wafers have been demonstrated. The introduction of
150 mm (6 inch) substrates can be the turning point for SiC device production since much of the equipment used for processing Si can also be used for SiC.
Market introduction of the SiC technology requires in addition to the reasonable wafer size an
adequate quality of the semiconductor material. All the SiC power devices require at least one
epitaxial layer with controlled doping and thickness to be grown on top of the highly doped
substrates. The major limiting factor for the quality of SiC epitaxial films is the substrate material itself. Even if the development of SiC substrates has been successful during the last fifteen years the quality is still much poorer compared to the Si substrates.
Best SiC epitaxial layers still contain a high density of detrimental defects like Threading Edge Dislocations (TEDs) (2000 – 5000 cm-2), Threading Screw Dislocations (TSDs) (300 – 1000
cm-2), Basal Plane Dislocations (BPDs) (0.1 – 10 cm-2), Stacking Faults (SFs) (0.1 – 1 cm-2)
and micropipes (0 - 0.02 cm-2), the majority of which propagate from the bulk of the substrate
into the epi-layers [Kimoto]. In addition, other defects that are generated during epitaxial growth include different growth pits (102 – 104 cm-2) most likely caused by substrate surface damage
introduced during cutting and polishing. The maximum chip size is still about 50% of that for Si
IGBTs. Production of large area power devices requires further significant improvement of substrate quality.
5.1.1 Status and trends
Table 2 Quality of SiC wafers and epilayers © Green Power Electronics 2017.
BPD - Basal plane dislocations TED – Threading edge dislocations TSD – Threading screw dislocations SF – Stacking faults
The state-of-the art of SiC substrates and epilayers is best described by the summary of the
most common defects still present in the device material. The different types of defects are
listed in Table 2 in the order from most detrimental to the device performance to the ones
with minor influence on device performance and device yield and cost. Micropipes are so called “killer defects” ruining voltage blocking capability of devices, BPDs cause instability of
the on-state voltage in the bipolar devices inclusive body diode of MOSFETs, remaining
defects are a cause of softer performance degradation typically increased leakage currents. The concentrations of defects are still orders of magnitude larger compared to silicon.
Extended defects Density in substratets (cm-2) Density in epilayers (cm-2)
Micropipe < 1 0 – 0.02
BPD 300 - 500 0.1 - 10
TED 2000 - 5000 2000 - 5000
TSD 300 - 1000 300 - 1000
SF < 1 0.1 - 1

Transnational Roadmap
Version: 25/01/2018 Page 21 of 72
5.1.2 Suppliers and market
According to [1], the U.S., Europe, and Asia have their own SiC wafer suppliers.
Figure 6 Regional SiC substrate suppliers. © Green Power Electronics 2017.
According to [1], all companies supply 4H n-type substrates for power electronics applications.
Figure 7 SiC wafer supplier status considering material polytypes, doping, and orientation. © Green Power Electronics 2017.

Transnational Roadmap
Version: 25/01/2018 Page 22 of 72
According to [1], Cree still leads the SiC market with approximately 40 % market share in 2014 and 2015.
Figure 8 Market share estimate for n-type SiC substrate players. Based on information from [1].
According to [1], the volume increase was partially offset by a reduction in selling prices, but the market continues to grow.
Figure 9 Market size projection for SiC n-type substrates 2015-2025, reaching a CAGR of 18 % Based
on information from [1].
According to [1], the price of both 4” and 6” substrates continues to decrease. 4” to 6”
transition has begun (about 20 % of wafers in the SiC power business is estimated to be 6”).
The wafer is the major cost contributor and the cost pressure of a SiC power device is
SiC Substrate suppliers
CREE
Dow Corning
SiCrystal (R
OHM included)
II-VI
Nippon Steel
Norstel
TankeBlueSICC
Others
Estim
atio
n o
f m
ark
et
sha
re
of
n-t
ype S
iC s
ub
str
ate
su
pp
liers
, %
0,00
0,05
0,10
0,15
0,20
0,25
0,30
0,35
0,40
0,45
2014
2015
Year
20152016
20172018
20192020
20212022
20232024
2025
SiC
N-t
ype
sub
str
ate
mark
et
siz
e,
$M
0
20
40
60
80
100
120
140
160
180
CAGR 2015 - 2025: 18 %

Transnational Roadmap
Version: 25/01/2018 Page 23 of 72
transferred to the material suppliers. Some players with a strong position ask suppliers to
align with their targets. In addition, some suppliers are willing to provide wafers at pricing 20-40 % lower in large quantities.
Year
2014 2015 2016 2017 2018 2019 2020 2021
Avera
ge P
rice E
stim
ation o
f S
iC N
-type S
ubstr
ate
, $
0
200
400
600
800
1000
1200
1400
n-type (4 inch)
p-type (6 inch)
6"/
4"
ratio
0.0
0.5
1.0
1.5
2.0
2.5
3.0
6"/4" ratio
Figure 10 Average price estimation for SiC n-type substrate. Based on information from [1].
5.2 GaN substrates
GaN substrates for device manufacturing can be obtained by homoepitaxy on bulk GaN substrates or by heteroepitaxy mainly on SiC or Si bulk substrates. The cost and size of the
bulk substrates determines the cost of the GaN substrates for device manufacturing. This is the main driving force behind GaN-on Si epitaxy development.
5.2.1 Status and trends
GaN substrates facilitating homoepitaxy and development and production of GaN-on-GaN
devices are still small in size and contain orders of magnitude higher dislocation densities compared to the SiC substrates. Small size of the GaN substrates is a major factor when it comes to the manufacturing cost.
Alternative way of obtaining GaN substrates for device development and manufacturing is by GaN-on-Si epitaxy. Problems of the lattice and thermal expansion coefficient mismatch
leading to the wafer bow and cracking has been solved to a large extent. Remaining issues
are yield, large dislocation densities and process reproducibility and stability. Reliability
issues are as yet not in focus. However large dislocation densities cause serious device problems influencing blocking capability and reliability and giving rise to excessive leakage
currents and dynamic on-resistance instabilities related to the charge trapping at the defect sites and impurities.
5.2.2 Suppliers and market
According to [2], more and more players are entering the GaN-on-Si field. GaN-on-Si is the dominant solution, however an increasing interest in GaN-on-GaN technology at the R&D level amongst GaN HEMT players and wafer/epi suppliers is observed.
Transnational Roadmap
Version: 25/01/2018 Page 24 of 72
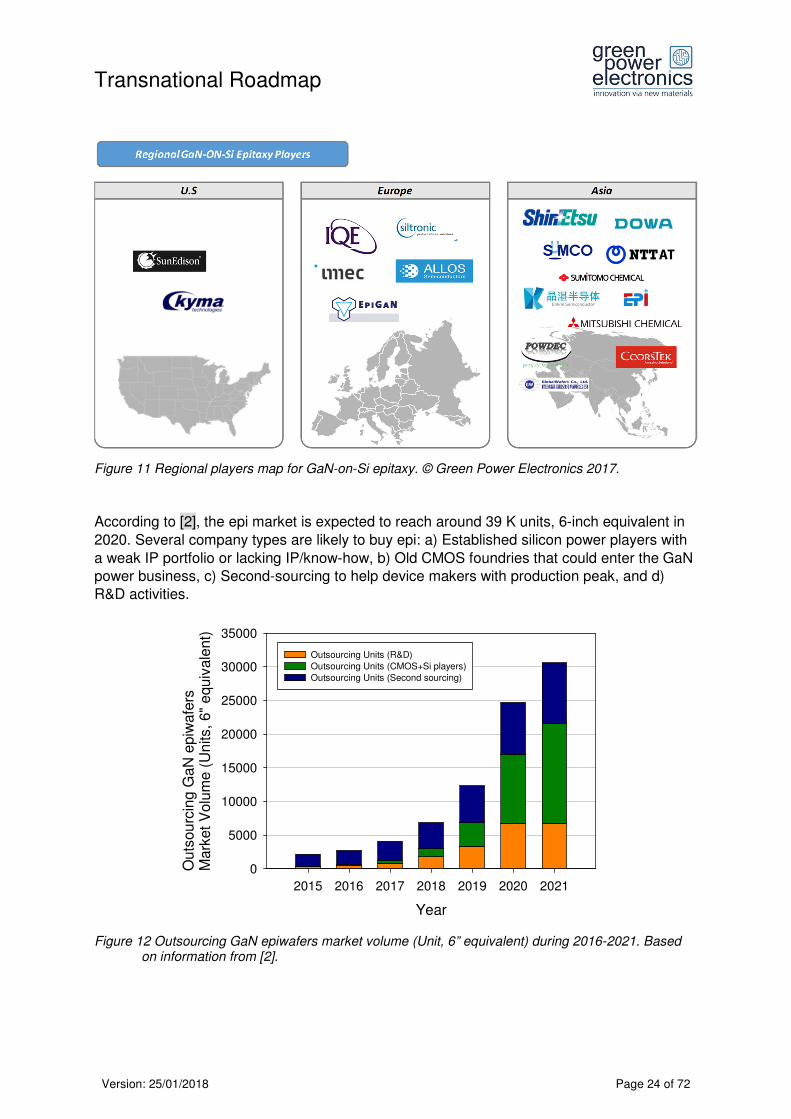
Figure 11 Regional players map for GaN-on-Si epitaxy. © Green Power Electronics 2017.
According to [2], the epi market is expected to reach around 39 K units, 6-inch equivalent in
2020. Several company types are likely to buy epi: a) Established silicon power players with
a weak IP portfolio or lacking IP/know-how, b) Old CMOS foundries that could enter the GaN power business, c) Second-sourcing to help device makers with production peak, and d) R&D activities.
Figure 12 Outsourcing GaN epiwafers market volume (Unit, 6” equivalent) during 2016-2021. Based on information from [2].
Year
2015 2016 2017 2018 2019 2020 2021
Outs
ou
rcin
g G
aN
epiw
afe
rs
Mark
et
Volu
me (
Un
its,
6"
equiv
ale
nt)
0
5000
10000
15000
20000
25000
30000
35000
Outsourcing Units (R&D)
Outsourcing Units (CMOS+Si players)
Outsourcing Units (Second sourcing)

Transnational Roadmap
Version: 25/01/2018 Page 25 of 72
According to [2], the outsourced epi-wafers market is expected to reach $6.7M in 2021.
Year
2015 2016 2017 2018 2019 2020 2021Ou
tsou
rcin
g G
aN
epiw
afe
rs M
ark
et
Siz
e,
$M
0
1
2
3
4
5
6
7
8
6" GaN-on-Si open epi-wafer market
Figure 13 Market size of outsourcing GaN epi-wafers. Based on information from [2].

Transnational Roadmap
Version: 25/01/2018 Page 26 of 72
6 WBG devices
6.1 SiC discretes and power modules
6.1.1 Overall Status and trends
19 suppliers provide commercially-available diodes as of November 2016.
10 suppliers provide commercially-available MOSFET devices, including planar and trench types, as of November 2016. Higher voltage than 1700 V has been released by several
companies, i.e. ROHM, Microsemi, and Wolfspeed.
For other transistors, only 3 suppliers provide commercially-available transistors.
6.1.2 Suppliers and market
Figure 14 SiC power devices and modules makers according to different types of power devices © Green Power Electronics 2017.
According to [1], we are in a growing market with more and more players. Even with revenue
increasing, the leading players’ market share is reducing.
Transnational Roadmap
Version: 25/01/2018 Page 27 of 72
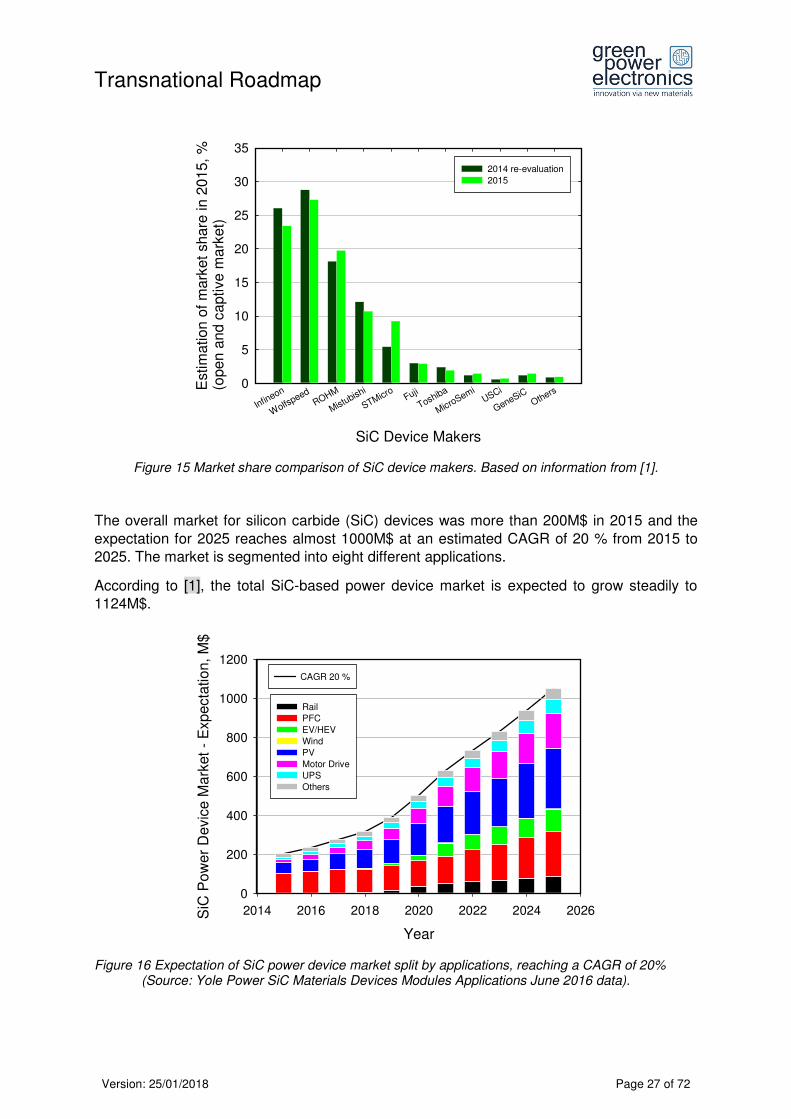
Figure 15 Market share comparison of SiC device makers. Based on information from [1].
The overall market for silicon carbide (SiC) devices was more than 200M$ in 2015 and the
expectation for 2025 reaches almost 1000M$ at an estimated CAGR of 20 % from 2015 to 2025. The market is segmented into eight different applications.
According to [1], the total SiC-based power device market is expected to grow steadily to 1124M$.
Figure 16 Expectation of SiC power device market split by applications, reaching a CAGR of 20% (Source: Yole Power SiC Materials Devices Modules Applications June 2016 data).
SiC Device Makers
Infineon
Wolfs
peed
ROHM
Mistubishi
STMicroFuji
Toshiba
MicroSemiUSCi
GeneSiC
Others
Estim
ation o
f m
ark
et
share
in 2
015,
%(o
pen a
nd
captive
ma
rket)
0
5
10
15
20
25
30
35
2014 re-evaluation
2015
Year
2014 2016 2018 2020 2022 2024 2026SiC
Po
we
r D
evic
e M
ark
et
- E
xp
ecta
tio
n,
M$
0
200
400
600
800
1000
1200
CAGR 20 %
RailPFC
EV/HEV
WindPV
Motor DriveUPS
Others
Transnational Roadmap
Version: 25/01/2018 Page 28 of 72
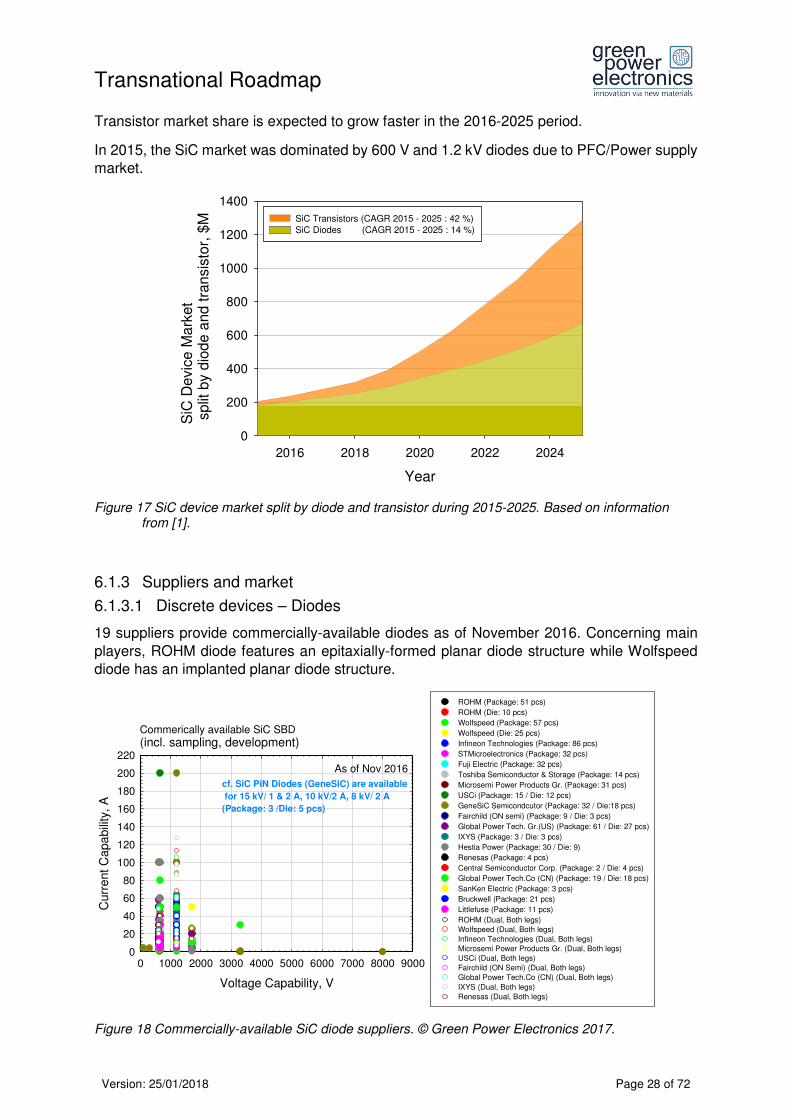
Transistor market share is expected to grow faster in the 2016-2025 period.
In 2015, the SiC market was dominated by 600 V and 1.2 kV diodes due to PFC/Power supply market.
Figure 17 SiC device market split by diode and transistor during 2015-2025. Based on information from [1].
6.1.3 Suppliers and market
6.1.3.1 Discrete devices – Diodes
19 suppliers provide commercially-available diodes as of November 2016. Concerning main
players, ROHM diode features an epitaxially-formed planar diode structure while Wolfspeed diode has an implanted planar diode structure.
Figure 18 Commercially-available SiC diode suppliers. © Green Power Electronics 2017.
Year
2016 2018 2020 2022 2024
SiC
Devic
e M
ark
et
split
by d
iode a
nd t
ransis
tor,
$M
0
200
400
600
800
1000
1200
1400
SiC Transistors (CAGR 2015 - 2025 : 42 %)SiC Diodes (CAGR 2015 - 2025 : 14 %)
Commerically available SiC SBD (incl. sampling, development)
Voltage Capability, V
0 1000 2000 3000 4000 5000 6000 7000 8000 9000
Curr
ent
Ca
pa
bili
ty,
A
0
20
40
60
80
100
120
140
160
180
200
220
ROHM (Package: 51 pcs)
ROHM (Die: 10 pcs)
Wolfspeed (Package: 57 pcs)
Wolfspeed (Die: 25 pcs)
Infineon Technologies (Package: 86 pcs)
STMicroelectronics (Package: 32 pcs)
Fuji Electric (Package: 32 pcs)
Toshiba Semiconductor & Storage (Package: 14 pcs)
Microsemi Power Products Gr. (Package: 31 pcs)
USCi (Package: 15 / Die: 12 pcs)
GeneSiC Semicondcutor (Package: 32 / Die:18 pcs)
Fairchild (ON semi) (Package: 9 / Die: 3 pcs)
Global Power Tech. Gr.(US) (Package: 61 / Die: 27 pcs)
IXYS (Package: 3 / Die: 3 pcs)
Hestia Power (Package: 30 / Die: 9)
Renesas (Package: 4 pcs)
Central Semiconductor Corp. (Package: 2 / Die: 4 pcs)
Global Power Tech.Co (CN) (Package: 19 / Die: 18 pcs)
SanKen Electric (Package: 3 pcs)
Bruckwell (Package: 21 pcs)
Littlefuse (Package: 11 pcs)
ROHM (Dual, Both legs)
Wolfspeed (Dual, Both legs)
Infineon Technologies (Dual, Both legs)
Microsemi Power Products Gr. (Dual, Both legs)
USCi (Dual, Both legs)
Fairchild (ON Semi) (Dual, Both legs)
Global Power Tech.Co (CN) (Dual, Both legs)
IXYS (Dual, Both legs)
Renesas (Dual, Both legs)
As of Nov 2016
cf. SiC PiN Diodes (GeneSiC) are available
for 15 kV/ 1 & 2 A, 10 kV/2 A, 8 kV/ 2 A
(Package: 3 /Die: 5 pcs)

Transnational Roadmap
Version: 25/01/2018 Page 29 of 72
6.1.3.2 Discrete devices – MOSFETs
10 suppliers provide commercially-available MOSFET devices, including planar and trench
types, as of November 2016. Higher voltage than 1700 V has been released by several companies, i.e. ROHM, Microsemi, and Wolfspeed.
Figure 19 Commercially-available SiC MOSFET suppliers. © Green Power Electronics 2017.
6.1.3.3 Discrete devices – Transistors
Only 3 suppliers provide commercially-available transistors of other type than mainstream MOSFETs.
According to [1], Wolfspeed is pre-releasing up to 15 kV MOSFET as well as SiC IGBT and p-GTOs. Mitshubishi is in trial production for 6.5 kV MOSFET.
Figure 20 Commercially-available SiC transistor suppliers (other types compared to MOSFET). © Green Power Electronics 2017.
As of Nov 2016
Voltage Capability, V
200 400 600 800 1000 1200 1400 1600 1800
Cu
rre
nt
Ca
pa
bili
ty,
A a
t 2
5 o
C
0
20
40
60
80
100
120
140ROHM (package: 21 pcs.)
ROHM (bare die: 16 pcs.)
Wolfspeed (package:20 pcs.)
Wolfspeed (bare die: 5 pcs.)
Infineon (package: 2 pcs.)
STMicroelectronics (package: 6 pcs.)
Microsemi (package: 17 pcs.)
Global Power Tech. Gr. (US) (package: 6 pcs.)
IXYS (package: 2 pcs.)
Hestia Power (package: 6 pcs.)
Maplesemi (package: 1 pcs.)
Cissoid (package: 1 pcs.)
Commercially available SiC MOSFET (incl. sampling, development)
As of Nov 2016
Voltage Capability, V
0 200 400 600 800 1000 1200 1400 1600 1800
Curr
en
t C
ap
abili
ty, A
at
25
oC
0
20
40
60
80
100
120
140
160
180MOSFET (103 pcs)
JFET incl. cascode (Total 11 pcs)- Infineon (package: 2 / die: 2)- USCi (package: 5 / die: 2)
SJT (BJT) incl. co-pack - GeneSiC (37 pcs)
Commercially available SiC Transistors (incl. sampling, development)
cf. SiC Thyristors (GeneSiC) are
available for 6.5 kV with 40, 60, 80 A.
(Package: 3 /Die: 3 pcs)

Transnational Roadmap
Version: 25/01/2018 Page 30 of 72
Figure 21 Estimation of SiC transistor market split by applications. Based on information from [1].
6.1.3.4 Power modules
YOLE [1] is expecting more and more full SiC solutions without SiC diode in the future.
In the meantime, the choice of full or hybrid solution will strongly depend on application and the commercial availability of SiC MOSFETs at a certain voltage and power range.
Voltage Capability, V
0 500 1000 1500 2000 2500 3000 3500
Cu
rrent
Ca
pab
ility
, A
0
200
400
600
800
1000
1200
1400
1600
1800
2000ROHM
Wolfspeed
Infineon
Mitsubishi Electric
Microsemi Power Product Gr.
GeneSiC Semiconductor
Global Power Tech. Gr. (US)
IXYS
Panasonic + Sansha Electric
CISSOID
IXYS
Infineon Technologies
Mitsubishi Electric
Fuji Electric.
Microsemi Power Product Gr.
Fairchild (ON semiconductor)
Global Power Tech. Gr. (US)
Hitachi Power Semi. Device, Ltd.
SEMIKRON
Toshiba Semi. & Storage
Commercially available SiC based Module (incl. sampling, development)
As of Nov 2016
empty circle: Full SiC PMfilled circle: Hybrid PM
Figure 22 Commercially available SiC-based power module suppliers. © Green Power Electronics 2017.
Year
2014 2016 2018 2020 2022 2024 2026
SiC
Tra
nsis
tor
Mark
et, M
$
0
100
200
300
400
500
600
700
Rail
PFC
EV/HEV
Wind
Grid
PV
Motor Drive
UPS
Others

Transnational Roadmap
Version: 25/01/2018 Page 31 of 72
According to [1], diode share used as discrete will decrease, while module share will increase.
Figure 23 Diode market portion split by discrete, hybrid module, and full SiC module. Based on information from [1].
6.2 GaN discretes and power modules
6.2.1 Status and trends
According to [2], the GaN device market is mainly dominated by <200 V devices in the whole forecast period. However, 600 V devices are expected to take off and keep growing.
Figure 24 GaN device market split by voltages (200 and 600 V) during 2015-2021. Based on information from [2].
Year
2016 2018 2020 2022 2024
Dio
de u
nit s
plit
s in m
ark
et,
%
0
10
20
30
40
50
60
70
80
90
100
Diode in Full SiC moduleDiode in Hybrid module
Diode in Dscrete
Year
2015 2016 2017 2018 2019 2020 2021
GaN
de
vic
e m
ark
et
split
by
vo
ltag
e,
%
0
20
40
60
80
100
600 V devices
< 200 V devices

Transnational Roadmap
Version: 25/01/2018 Page 32 of 72
6.2.2 Suppliers and market
According to [2], the total GaN-based power device market is expected to reach 280M$ in
2021.
Figure 25 GaN power device market split by application 2015-2021, reaching a CAGR of 86 %. Based on information from [2].
EPC is highly focused on low-voltage GaN devices while most players are working in the 600-
650 V range.
Figure 26 Existing GaN power device suppliers (including devices commercially available, under development, demonstrated, and in sampling). © Green Power Electronics 2017.
Year
2015 2016 2017 2018 2019 2020 2021
GaN
Pow
er
Devic
e M
ark
et, $
M
0
50
100
150
200
250
300
Power Supply
EV/HEV(including Charger and DC-DC)
PV
UPS
Envelop Tracking
Wireless Power
Lidar
Others
Voltage, V
0 100 200 300 400 500 600 700
Curr
ent,
A
0
20
40
60
80
100EPC
GaN Systems
Panasonic
Transphorm
ON Semiconductor
Texas Instruments
Sanken Electric
EXAGAN
VISIC Technologies
Dialog Semiconductor
As of Nov 2016 Commerically
available
In development/
demonstrated/
sampling

Transnational Roadmap
Version: 25/01/2018 Page 33 of 72
7 Renewable energy sources The renewable energy sources consist of solar, wind, hydroelectric, wave, tidal, and
geothermal power sources. However, the hydroelectric and geothermal power are not
considered in the report because they are not so interesting from power electronics point of view. For the same reason, the biomass and biofuels, which are two types of solar energy sources, are not discussed in this document.
The photovoltaic (PV), wind, wave, and tidal power generation are intermittent electricity sources. The electric power grid has a theoretical limit of renewable energy penetration,
beyond which the stability of the grid cannot be guaranteed. This limit can be increased by
adding sufficient energy storage capacity in the grid. Most energy storage technologies require
power electronics and attract the attention of power electronic players. Therefore, we have added a section on energy storage in this chapter.
7.1 PV and wind
There are urgent needs to decrease the CO2 emissions and air pollution, especially those generated by electricity generation and by transportation. The energy transition is already underway, with renewable energy sources dominating the new electricity generation capacities.
Very high, still untapped potential for electricity generation is offered by photovoltaics, wind and marine energies. The systems associated with these renewable energies require power electronic components such as power converters and inverters. The drivers for deployment of renewable energy sources are sustainable, and so are the business opportunities for power electronics players.
Photovoltaics and wind are relatively mature technologies that already have a large market, both in terms of annual new capacities as well as in cumulative installed capacities. The exploitation of marine energies is still in the development stage, with no significant market expected before 2020. Cost and technology challenges are very high for marine energy systems.
Photovoltaics and wind have reached high percentage of electricity generation in several countries of the world. In these more mature markets the needs for demand/response solutions to stabilize the electricity grid are sought. Energy storage, especially battery electricity storage, offer numerous benefits to the grids in high percentage of intermittent PV and/or wind electricity as well as to the new markets with poor grid quality.
The deployment of new PV and wind installations will likely be strongly interlinked with building new battery electricity storage solutions.
The opportunities for power electronics are not limited only to power converters and inverters. The power electronics companies can find opportunities also in providing additional components needed for PV and wind systems (protection devices, electrical connections…) and components and systems used in associated markets (transmission and distribution, energy storage…). The power electronic players can also benefit from the synergies between different applications.
7.1.1 Photovoltaic (PV)
During the last few years the PV system costs have been falling very significantly. The levelised cost of electricity (LCOE) by source is a measure used to compare the cost of electricity from
different power sources. According to [10], the current LCOE of European PV is between 100

Transnational Roadmap
Version: 25/01/2018 Page 34 of 72
and 240 €/MWh. It differs depending on the irradiation at any particular site, operational costs, etc. The projection for 2020 is that it will be between 80 and 190 €/MWh.
In regions with high sunlight potential the LCOE can be much lower. For example, the electricity
from a 200 MW PV plant in Dubai, which will be operational in 2017, is projected to be sold for 58.5 $/MWh. Therefore, the electricity from PV panels is already competitive with conventional sources of electricity.
The key power electronic component in a PV system is the PV inverter and the key semiconductor devices in any PV inverter are the diodes and transistors. Thanks to much
better performance in comparison to Si diodes, the SiC Schottky diodes are already widely
used in PV inverters as discrete devices as well as in power modules for PV inverters. SiC
power transistors are also gaining acceptance in the industry and steadily increasing their market share.
7.1.1.1 Power devices & modules
According to Wolfspeed, SiC-based inverters can reduce the typical installation costs for a PV inverter by 40 % due to a lower overall weight and a higher power density.
SiC MOSFETs are used today for the string inverter’s boost stage (10 kW to 70-80 kW range). Full SiC solutions for central PV inverters are in development.
In low power range (<300 W), the use of SiC diodes is declining due to new topology called as microinverter which does not need high-voltage diodes.
According to [1], PV inverters adopting both SiC diodes and transistors are expected to grow steadily to 2021.
PV will continue to be an important market for SiC devices in the coming years. The SiC device market for PV is forecast to exceed 180M$ in 2021.
SiC diodes and transistor in PV, MUnits
Year
2015 2016 2017 2018 2019 2020 2021
SiC
dio
de
s a
nd
tra
nsis
tor
in P
V,
MU
nits
0
5
10
15
20
25
30
35
40
45
SiC Diodes
SiC Transistors
Figure 27 Market forecast in units for SiC diodes and transistors in PV during 2015-2021. Based on information from [1].
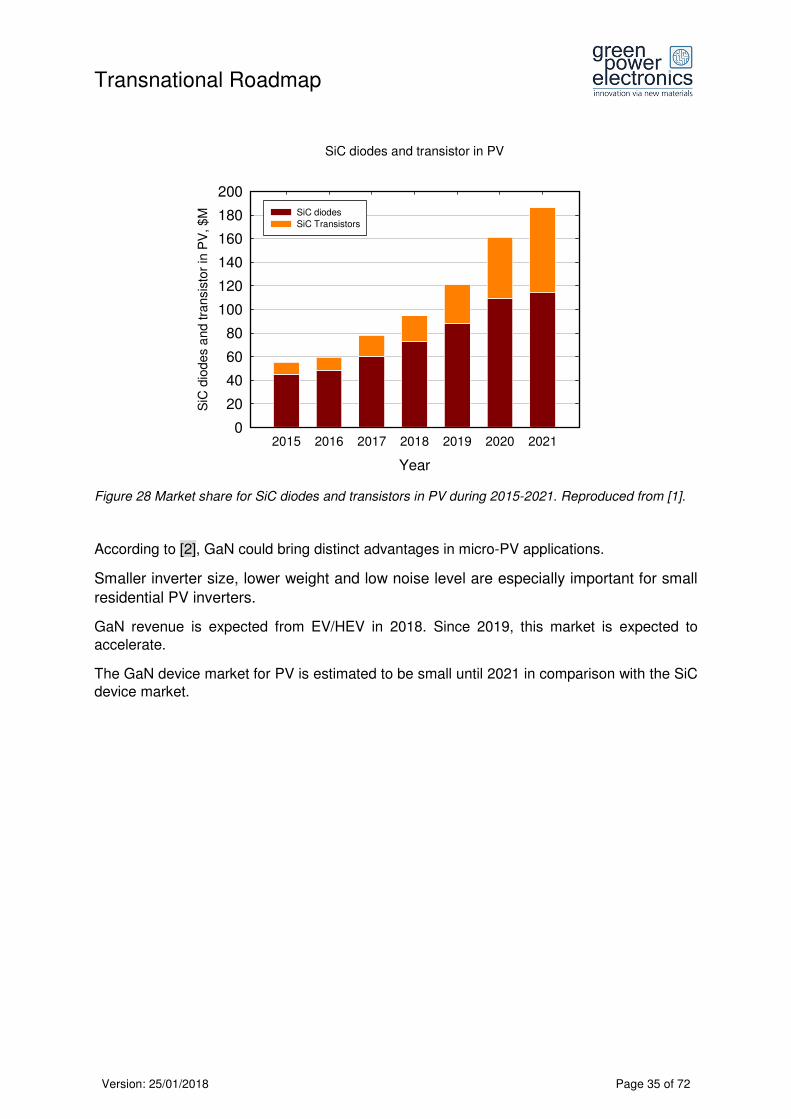
Transnational Roadmap
Version: 25/01/2018 Page 35 of 72
Figure 28 Market share for SiC diodes and transistors in PV during 2015-2021. Reproduced from [1].
According to [2], GaN could bring distinct advantages in micro-PV applications.
Smaller inverter size, lower weight and low noise level are especially important for small
residential PV inverters.
GaN revenue is expected from EV/HEV in 2018. Since 2019, this market is expected to accelerate.
The GaN device market for PV is estimated to be small until 2021 in comparison with the SiC device market.
SiC diodes and transistor in PV
Year
2015 2016 2017 2018 2019 2020 2021
SiC
dio
des
and tra
nsis
tor
in P
V, $M
0
20
40
60
80
100
120
140
160
180
200
SiC diodes
SiC Transistors
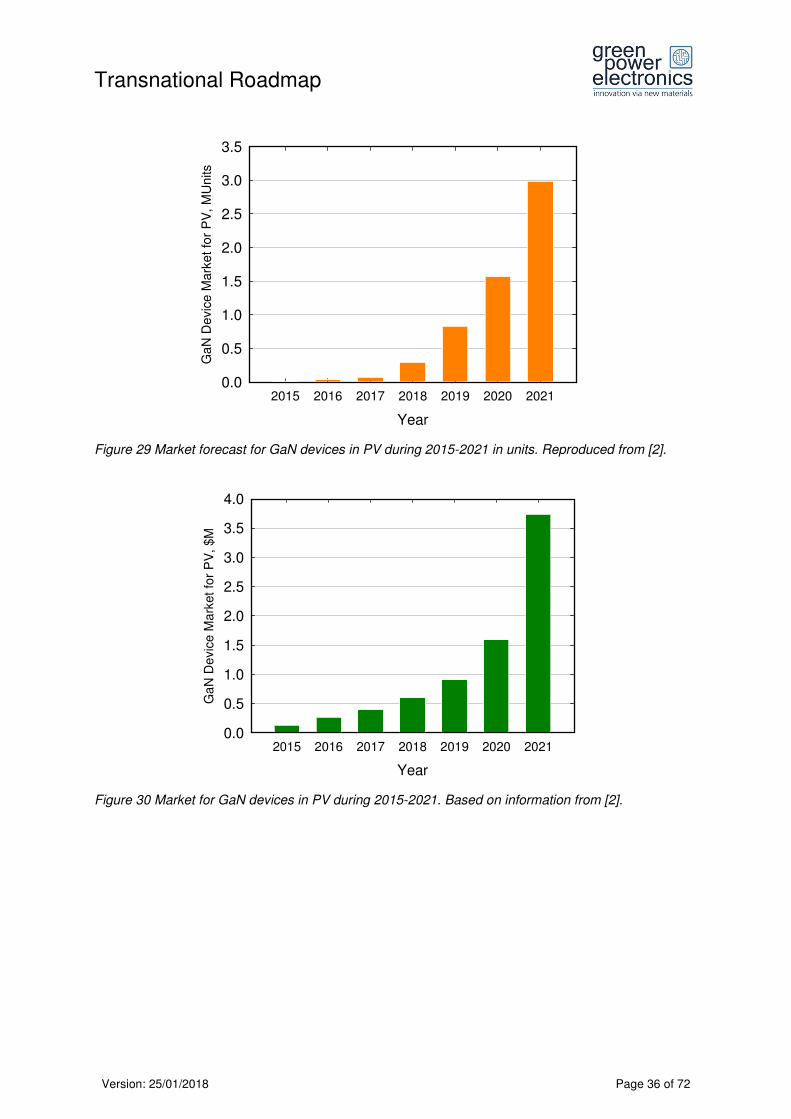
Transnational Roadmap
Version: 25/01/2018 Page 36 of 72
Year
2015 2016 2017 2018 2019 2020 2021
Ga
N D
evic
e M
ark
et
for
PV
, M
Un
its
0.0
0.5
1.0
1.5
2.0
2.5
3.0
3.5
Figure 29 Market forecast for GaN devices in PV during 2015-2021 in units. Reproduced from [2].
Year
2015 2016 2017 2018 2019 2020 2021
Ga
N D
evic
e M
ark
et
for
PV
, $M
0.0
0.5
1.0
1.5
2.0
2.5
3.0
3.5
4.0
Figure 30 Market for GaN devices in PV during 2015-2021. Based on information from [2].
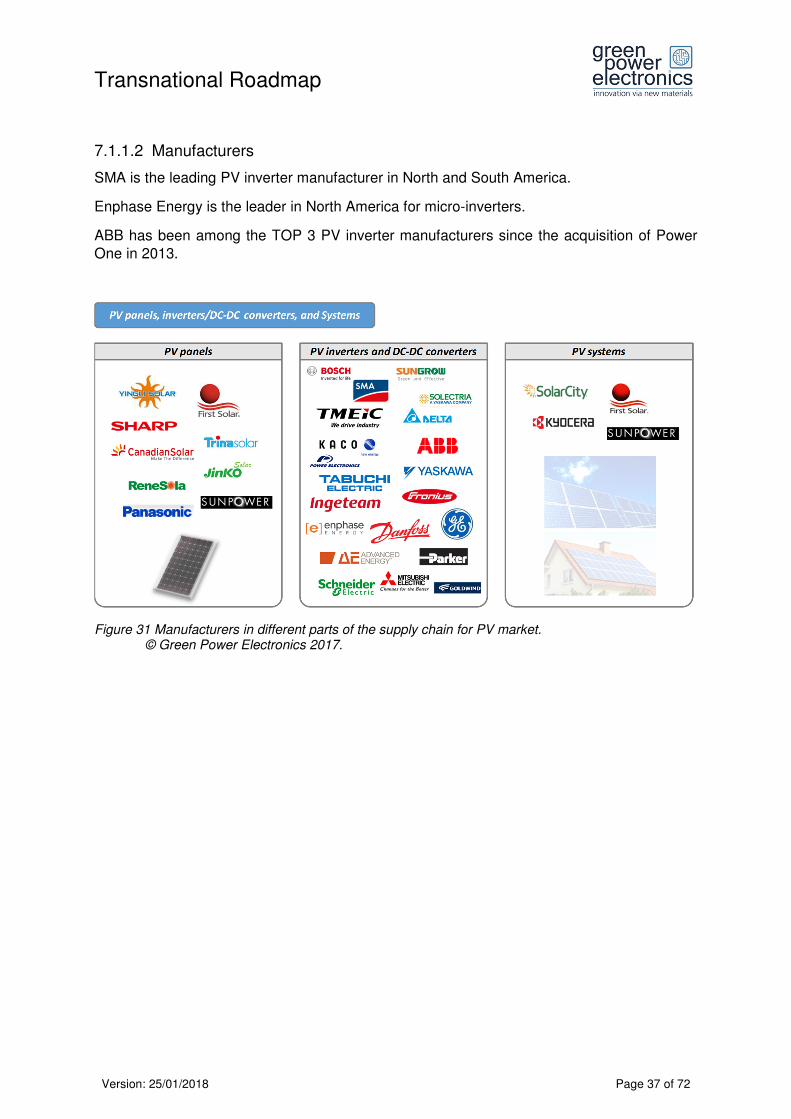
Transnational Roadmap
Version: 25/01/2018 Page 37 of 72
7.1.1.2 Manufacturers
SMA is the leading PV inverter manufacturer in North and South America.
Enphase Energy is the leader in North America for micro-inverters.
ABB has been among the TOP 3 PV inverter manufacturers since the acquisition of Power One in 2013.
Figure 31 Manufacturers in different parts of the supply chain for PV market. © Green Power Electronics 2017.

Transnational Roadmap
Version: 25/01/2018 Page 38 of 72
7.1.1.3 Markets
According to [3 and 4], the PV inverter demand will continue to grow and reach 93.3 GW by 2021.
Figure 32 Market forecast segmented by inverter size during 2015-2021. Based on information from [3 and 4].
According to [3 and 4], approximately 90 GW of solar power capacity will be installed per year. Newly installed PV capacity will continue increasing over the next couple of years.
Figure 33 Installed PV capacity forecast during 2015-2021. Based on information from [3 and 4].
Year
2015 2016 2017 2018 2019 2020 2021
Po
wer
Ca
pa
city,
MW
0
20x103
40x103
60x103
80x103
100x103
< 10 kV
10 to 70 kW
> 70 kW
PV inverter demand (MW)
New PV Installations
Year
2015 2016 2017 2018 2019 2020 2021
Ne
w P
V In
sta
llation
s,
GW
0
10
20
30
40
50
60
70
80
90
100

Transnational Roadmap
Version: 25/01/2018 Page 39 of 72
According [3 and 4], the PV inverter market will grow steadily and will reach approximately 8
billion$ by 2025.
Year
20162017
20182019
20202021
20222023
20242025
PV
Invert
er
Mark
et,
$M
0
2000
4000
6000
8000
10000
< 10 kW
10 to 70 kW
> 70 kW
Figure 34 Market forecast for PV inverter during 2016-2025, showing a CAGR of 3.2 %. Based on information from [3 and 4].
According to [3 and 4], both Sungrow and Huawei have installed more PV inverters with MV
capacity than the leader SMA.
Figure 35 PV market split in 2015. Produced by [3].
2015 PV Inverter Market Shares, %
Others
Enphase Energy (US)
Omron (JP)
TMEIC (JP)
SolarEdge (IL)
ABB (CH)
Huawei (CN)
Sungrow (CN)
SMA (DE)
$ 5.4B3.7 %
22.2 %
4.7 %
5.5 %
6.2 %
10.3 %
13.0 %
13.5 %
20.9 %
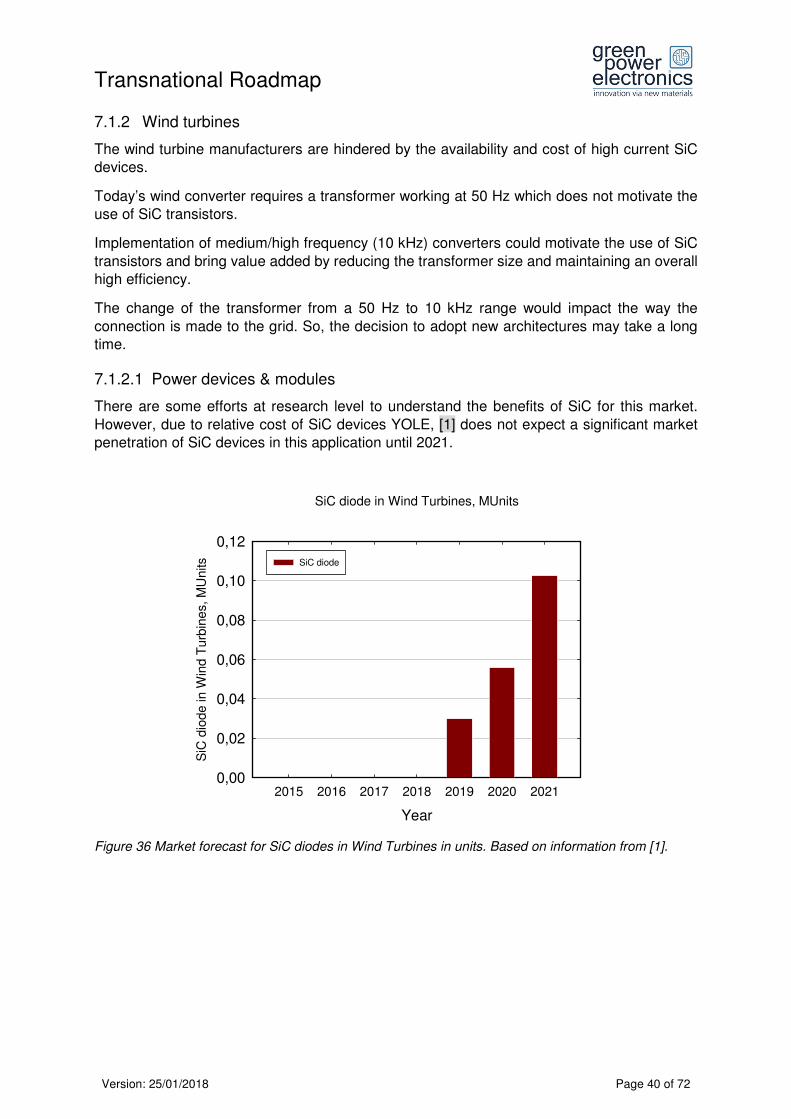
Transnational Roadmap
Version: 25/01/2018 Page 40 of 72
7.1.2 Wind turbines
The wind turbine manufacturers are hindered by the availability and cost of high current SiC
devices.
Today’s wind converter requires a transformer working at 50 Hz which does not motivate the
use of SiC transistors.
Implementation of medium/high frequency (10 kHz) converters could motivate the use of SiC
transistors and bring value added by reducing the transformer size and maintaining an overall
high efficiency.
The change of the transformer from a 50 Hz to 10 kHz range would impact the way the
connection is made to the grid. So, the decision to adopt new architectures may take a long
time.
7.1.2.1 Power devices & modules
There are some efforts at research level to understand the benefits of SiC for this market.
However, due to relative cost of SiC devices YOLE, [1] does not expect a significant market
penetration of SiC devices in this application until 2021.
Figure 36 Market forecast for SiC diodes in Wind Turbines in units. Based on information from [1].
SiC diode in Wind Turbines, MUnits
Year
2015 2016 2017 2018 2019 2020 2021
SiC
dio
de in
Win
d T
urb
ines, M
Units
0,00
0,02
0,04
0,06
0,08
0,10
0,12
SiC diode

Transnational Roadmap
Version: 25/01/2018 Page 41 of 72
Figure 37 SiC diode market in Wind Turbines. Based on information from [1].
7.1.2.2 Manufacturers
According to [4], Chinese players are rapidly growing and looking for foreign markets.
Manufacturers are looking for new market opportunities in a) large turbines with 6MW+ sizes
for off shore applications and b) promising new markets, especially in South America.
Figure 38 Regional wind turbines manufacturers © Green Power Electronics 2017.
SiC diode in Wind Turbines
Year
2015 2016 2017 2018 2019 2020 2021
SiC
dio
de in
Win
d T
urb
ines,
$M
0,0
0,2
0,4
0,6
0,8
1,0
1,2
1,4
SiC Diode

Transnational Roadmap
Version: 25/01/2018 Page 42 of 72
Figure 39 Comparison of market shares between 2014 and 2015. Based on information from [3].
7.1.2.3 Markets
According to [4], positive market development will take place in Brazil.
In Europe, some onshore markets have reached their saturation. Development opportunities
exist predominantly in the offshore wind market.
In Asia, China will start exploiting the offshore wind resources. Low speed turbines in the south are continually installed at present.
Japan is expected to be a new market.
Also India is expected to expand the market.
7.2 Marine energy
There is a large variety of marine energy technologies to generate electricity.
• Tidal turbines • Wave energy converters • Salinity gradient technologies • etc.
These technologies have different principles, very different characteristics and designs, and system sizes.
Tidal turbines convert the kinetic energy of tidal stream to electricity.
Their principle is similar to wind turbines, but they use tidal stream instead of wind. Because of the higher density of water relative to air, an individual tidal turbine can provide greater power at low tidal flow velocities compared to a wind generator with similar wind speed and rotor diameter.
Wind Turbine Manufacturers
Market Shares, %
0 5 10 15 20 25 30 35 40
Win
d T
urb
ine M
anufa
ctu
rers
Vestas (DK)
Siemens (DE)
GE (US)
Goldwind (CN)
Enercon (DE)
Suzlon (IN)
United Power (CN)
Gamesa (SP)
Mingyang (CN)
Others
2015
2014
Market share ininstalled MW
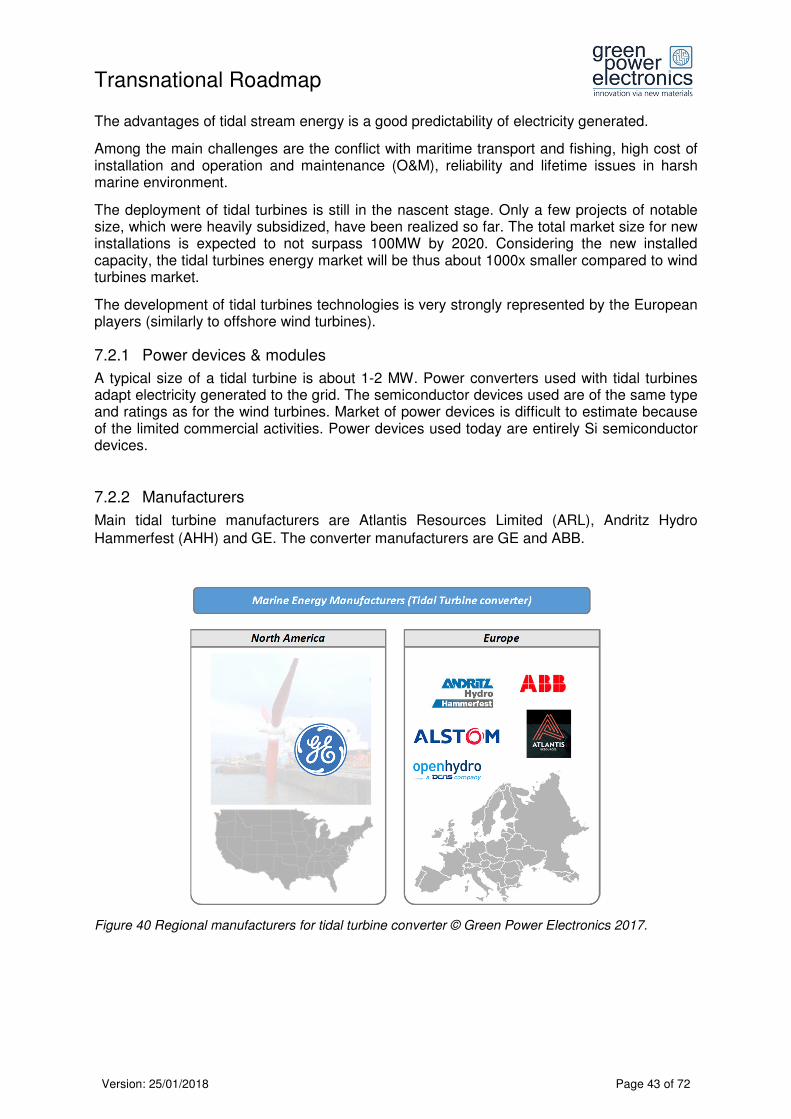
Transnational Roadmap
Version: 25/01/2018 Page 43 of 72
The advantages of tidal stream energy is a good predictability of electricity generated.
Among the main challenges are the conflict with maritime transport and fishing, high cost of installation and operation and maintenance (O&M), reliability and lifetime issues in harsh marine environment.
The deployment of tidal turbines is still in the nascent stage. Only a few projects of notable size, which were heavily subsidized, have been realized so far. The total market size for new installations is expected to not surpass 100MW by 2020. Considering the new installed capacity, the tidal turbines energy market will be thus about 1000x smaller compared to wind turbines market.
The development of tidal turbines technologies is very strongly represented by the European players (similarly to offshore wind turbines).
7.2.1 Power devices & modules
A typical size of a tidal turbine is about 1-2 MW. Power converters used with tidal turbines adapt electricity generated to the grid. The semiconductor devices used are of the same type and ratings as for the wind turbines. Market of power devices is difficult to estimate because of the limited commercial activities. Power devices used today are entirely Si semiconductor devices.
7.2.2 Manufacturers
Main tidal turbine manufacturers are Atlantis Resources Limited (ARL), Andritz Hydro
Hammerfest (AHH) and GE. The converter manufacturers are GE and ABB.
Figure 40 Regional manufacturers for tidal turbine converter © Green Power Electronics 2017.
Transnational Roadmap
Version: 25/01/2018 Page 44 of 72
7.2.3 Markets
The tidal turbines technology is still at the nascent stage. According to [4], the cumulative
installed capacity is expected to remain at relatively low levels until 2020. By comparison, this market is smaller than the cumulative PV or wind installations.
7.3 Energy storage
As the share of renewable, intermittent energy sources increases, the only way to match the
electricity demand and generation is to turn on or off conventional power plants. Every grid,
depending on its robustness, has a theoretical limit for renewable energy penetration. Adding
energy storage in the grid increases this limit.
Battery storage systems are well suited to be used with PV or wind generators, but can also
be connected at critical points in the grid to increase its robustness. The most obvious benefit
of a battery storage is the so-called “load shifting” – the renewable energy is stored in the
battery and fed to the grid during the peak hours when the electricity price or demand are
higher. This reduces the grid saturation at peak hours. Another benefit is the “renewable
firming” – the highly intermittent renewable power is used to charge the batteries, and the grid
connected inverter feeds the electricity to the grid at a steady rate, which also contributes to
the stability of the grid.
7.3.1 Power devices & modules
The power semiconductor devices and modules used for energy storage power electronics are
the same that are used in the equivalent PV and wind power systems.
7.3.2 Manufacturers
The energy storage manufacturers may differ depending on the size and energy storage
technology, but the power electronic converters used in the energy storage systems are from
well-established power converter manufacturers, such as ABB, GE, Danfoss, SMA, and
others.
7.3.3 Markets
The most promising markets for energy storage systems are countries with high penetration
of renewables. These are also the countries that are most likely to give incentives for installing
energy storage systems. One such example is Germany that started promoting battery storage
since May 2013. The second stage of their incentive program (KfW 275) started in March 2016
and will continue until end of 2018.
However, the energy storage technology is seen as important also in countries with low
penetration of renewables. Sweden, for example, started offering 60% rebate for the cost of
energy storage, connected to a renewable source for all installations that have started no
earlier than 2016 and will be completed by the end of 2019.
The German energy storage market is projected to reach $1B by 2021 [11].

Transnational Roadmap
Version: 25/01/2018 Page 45 of 72
8 Switch mode power supplies In most electronics, power supply is an indispensable unit consisting of an AC-DC unit for
converting the electricity, and an isolated DC-DC unit for lowering the voltage for use in device
applications.
In most cases, a MOSFET is needed in PFC and DC/DC converters. In order to prevent device
breakdown from current turbulence, as well as other potential risks, a 600V MOSFET is often
used for 110V/220V AC power.
Power supply requirements differ by application. However, the common trends present in
almost all power supply market segments are: increased efficiency, higher power density, and
cost reduction. Power supply applications can be grouped into following categories: Consumer
electronics, Portable and wireless, Industrial, Medical, Lighting, Computer and office, Telecom
and net, Data Servers.
Power supply efficiency is a key selection criterion. This is supported by legislation in more
and more regions around the world.
8.1 Power devices & modules
PFC was the first application targeted by SiC devices, which it has addressed since 2001. This
application is perfectly matched with SiC diodes because they provide virtually zero reverse
recovery current resulting in: a) reduced losses, b) improved power conversion efficiency, c) smaller modules and d) less EMI noise.
A large volume of SiC diodes is being consumed since in this market.
According to [1], the SiC device market for PFC is estimated to be approximately 100M$ in
2015, especially in the high-end telecom and server and industrial power supply segments.
This market is expected to steadily grow to 140M$ in 2021.
SiC transistors (MOSFETs) could be adopted instead of SiC-based diodes.
SiC diode and FET in PFC, MUints
Year
2015 2016 2017 2018 2019 2020 2021
SiC
dio
de
an
d F
ET
in
PF
C,
MU
nits
0
50
100
150
200
250
300
SiC DiodesSiC Transistors
Figure 41 SiC device market for PFC in units. Based on information from [1].

Transnational Roadmap
Version: 25/01/2018 Page 46 of 72
Figure 42 SiC device market for PFC. Based on information from [1].
The power supply market for GaN devices is expected to consume a large quantity of devices and reach around 173M$ in 2021.
GaN devices can be used in different power supply parts in a) AC-DC inverter, b) isolated DC-
DC converter, and non-isolated POL.
Year
2015 2016 2017 2018 2019 2020 2021GaN
Devic
e M
ark
et
for
Po
we
r S
up
ply
, M
Units
0
20
40
60
80
100
120
140
160
180
Figure 43 GaN device market for PFC in units. Based on information from [2].
SiC diode and FET in PFC
Year
2015 2016 2017 2018 2019 2020 2021
SiC
dio
de a
nd F
ET
in P
FC
, $M
0
20
40
60
80
100
120
140
160
SiC diode
SiC FET
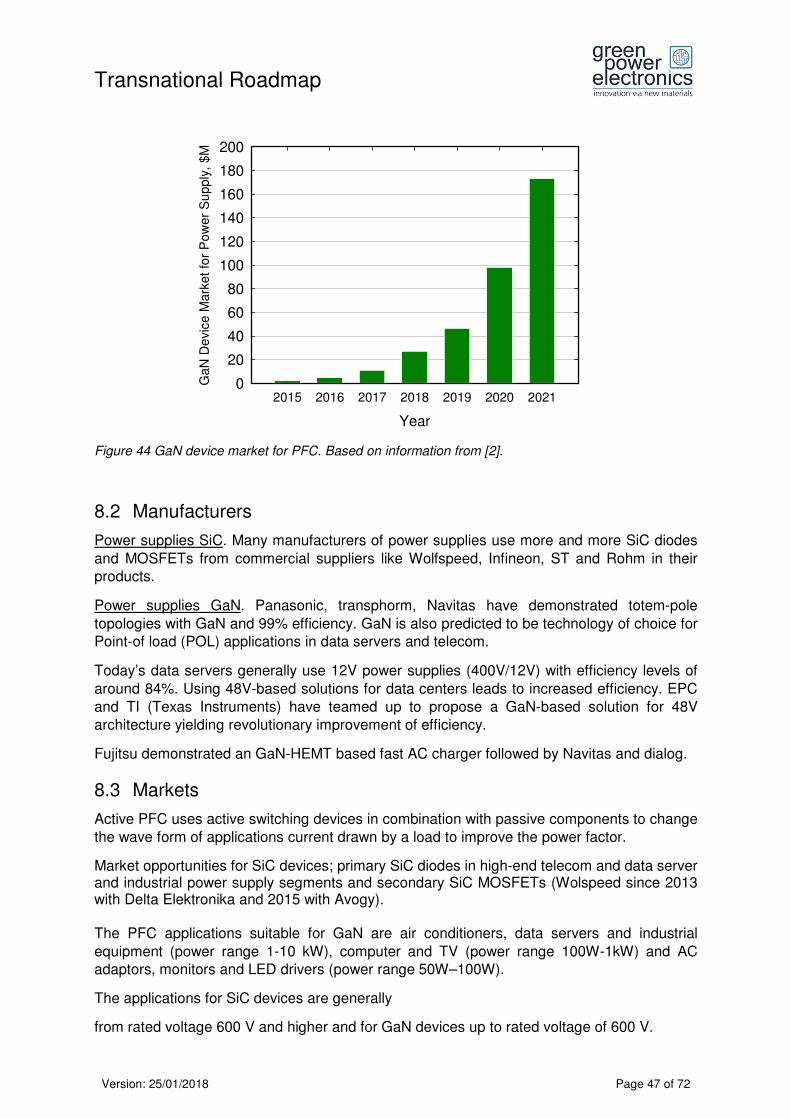
Transnational Roadmap
Version: 25/01/2018 Page 47 of 72
Year
2015 2016 2017 2018 2019 2020 2021
Ga
N D
evi
ce
Ma
rke
t fo
r P
ow
er
Su
pp
ly,
$M
0
20
40
60
80
100
120
140
160
180
200
Figure 44 GaN device market for PFC. Based on information from [2].
8.2 Manufacturers
Power supplies SiC. Many manufacturers of power supplies use more and more SiC diodes
and MOSFETs from commercial suppliers like Wolfspeed, Infineon, ST and Rohm in their products.
Power supplies GaN. Panasonic, transphorm, Navitas have demonstrated totem-pole
topologies with GaN and 99% efficiency. GaN is also predicted to be technology of choice for Point-of load (POL) applications in data servers and telecom.
Today’s data servers generally use 12V power supplies (400V/12V) with efficiency levels of
around 84%. Using 48V-based solutions for data centers leads to increased efficiency. EPC and TI (Texas Instruments) have teamed up to propose a GaN-based solution for 48V architecture yielding revolutionary improvement of efficiency.
Fujitsu demonstrated an GaN-HEMT based fast AC charger followed by Navitas and dialog.
8.3 Markets
Active PFC uses active switching devices in combination with passive components to change the wave form of applications current drawn by a load to improve the power factor.
Market opportunities for SiC devices; primary SiC diodes in high-end telecom and data server and industrial power supply segments and secondary SiC MOSFETs (Wolspeed since 2013 with Delta Elektronika and 2015 with Avogy). The PFC applications suitable for GaN are air conditioners, data servers and industrial
equipment (power range 1-10 kW), computer and TV (power range 100W-1kW) and AC adaptors, monitors and LED drivers (power range 50W–100W).
The applications for SiC devices are generally
from rated voltage 600 V and higher and for GaN devices up to rated voltage of 600 V.
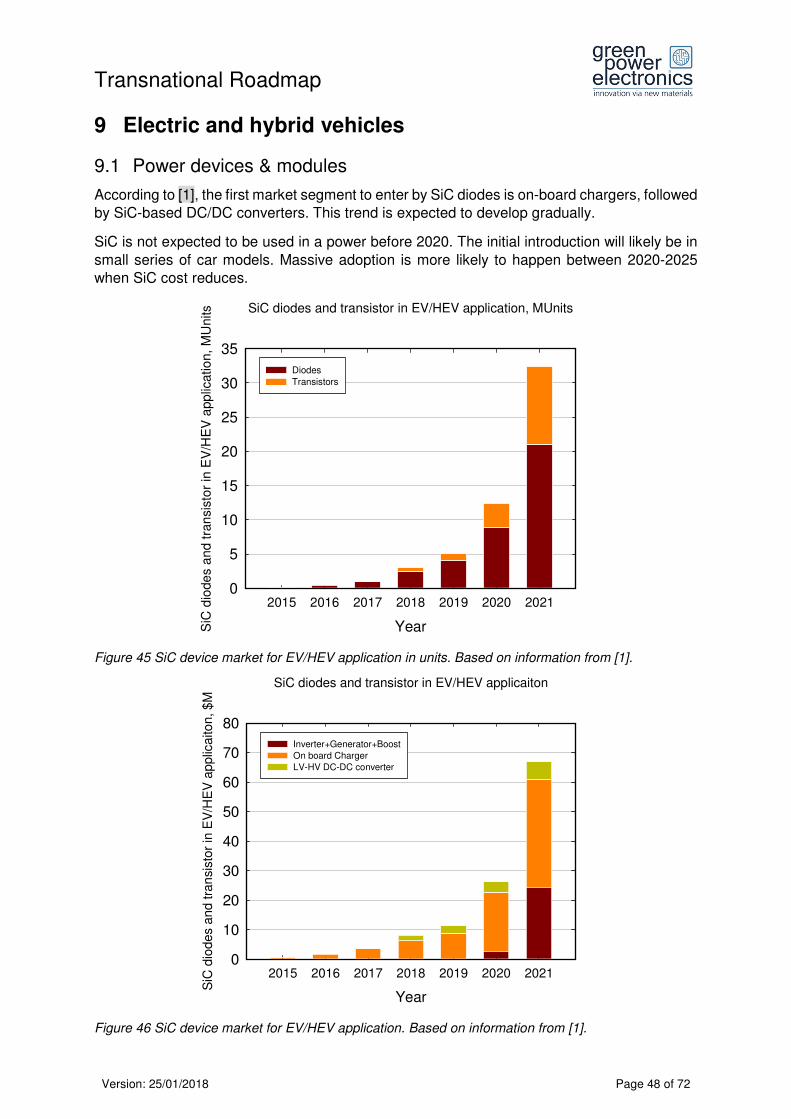
Transnational Roadmap
Version: 25/01/2018 Page 48 of 72
9 Electric and hybrid vehicles
9.1 Power devices & modules
According to [1], the first market segment to enter by SiC diodes is on-board chargers, followed by SiC-based DC/DC converters. This trend is expected to develop gradually.
SiC is not expected to be used in a power before 2020. The initial introduction will likely be in
small series of car models. Massive adoption is more likely to happen between 2020-2025 when SiC cost reduces.
SiC diodes and transistor in EV/HEV application, MUnits
Year
2015 2016 2017 2018 2019 2020 2021
SiC
dio
de
s a
nd t
ran
sis
tor
in E
V/H
EV
app
licatio
n,
MU
nits
0
5
10
15
20
25
30
35
Diodes
Transistors
Figure 45 SiC device market for EV/HEV application in units. Based on information from [1].
Figure 46 SiC device market for EV/HEV application. Based on information from [1].
SiC diodes and transistor in EV/HEV applicaiton
Year
2015 2016 2017 2018 2019 2020 2021
SiC
dio
des
and tra
nsi
sto
r in
EV
/HE
V a
pplic
aito
n, $M
0
10
20
30
40
50
60
70
80
Inverter+Generator+Boost
On board Charger
LV-HV DC-DC converter
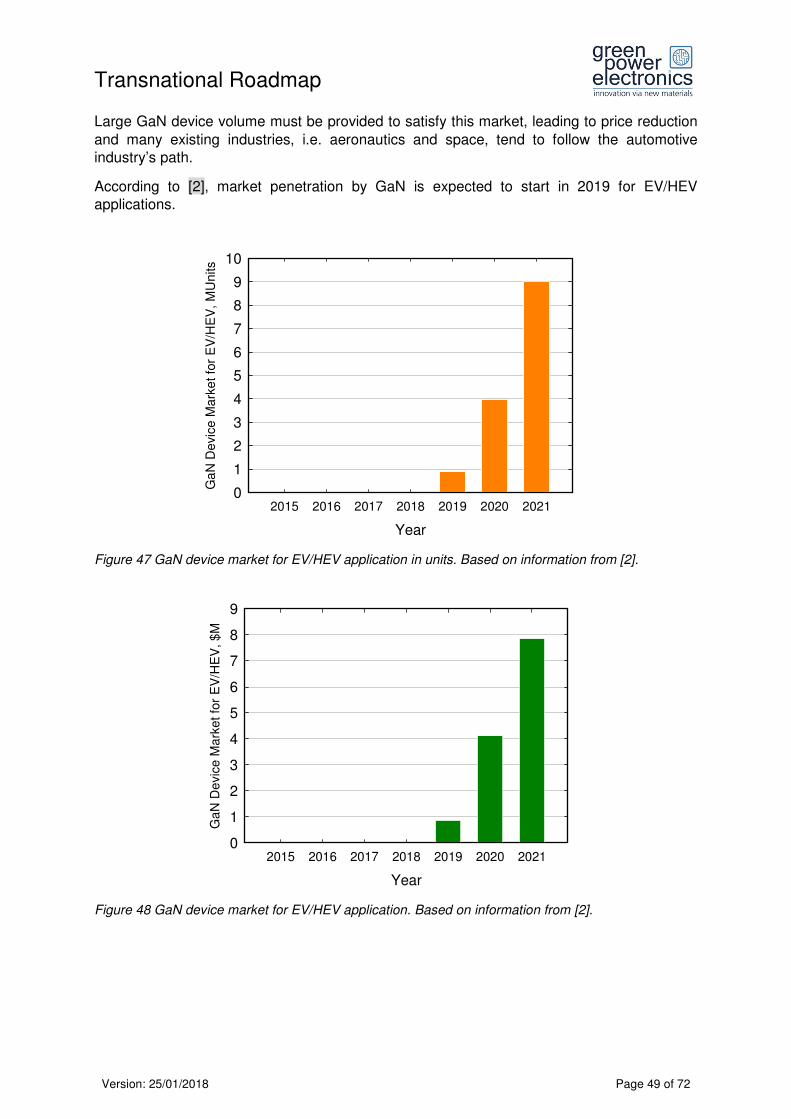
Transnational Roadmap
Version: 25/01/2018 Page 49 of 72
Large GaN device volume must be provided to satisfy this market, leading to price reduction
and many existing industries, i.e. aeronautics and space, tend to follow the automotive industry’s path.
According to [2], market penetration by GaN is expected to start in 2019 for EV/HEV applications.
Year
2015 2016 2017 2018 2019 2020 2021
Ga
N D
evic
e M
ark
et fo
r E
V/H
EV
, M
Un
its
0
1
2
3
4
5
6
7
8
9
10
Figure 47 GaN device market for EV/HEV application in units. Based on information from [2].
Year
2015 2016 2017 2018 2019 2020 2021
Ga
N D
evic
e M
ark
et fo
r E
V/H
EV
, $
M
0
1
2
3
4
5
6
7
8
9
Figure 48 GaN device market for EV/HEV application. Based on information from [2].
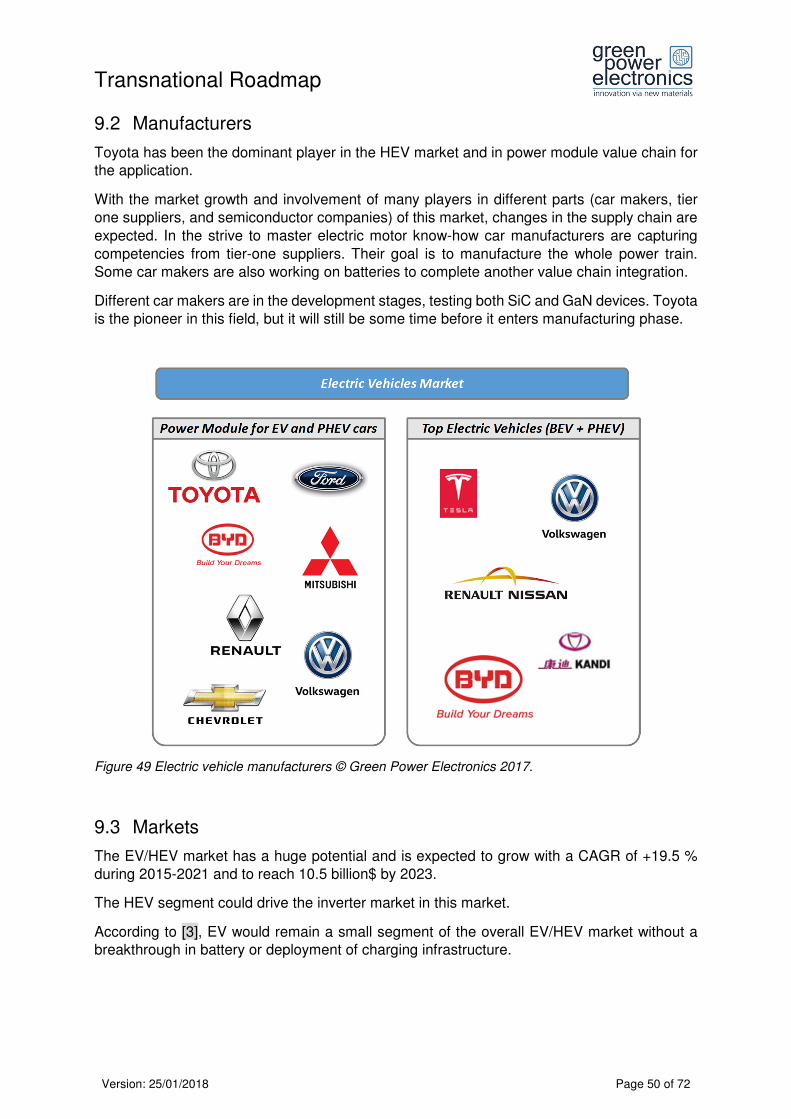
Transnational Roadmap
Version: 25/01/2018 Page 50 of 72
9.2 Manufacturers
Toyota has been the dominant player in the HEV market and in power module value chain for the application.
With the market growth and involvement of many players in different parts (car makers, tier one suppliers, and semiconductor companies) of this market, changes in the supply chain are
expected. In the strive to master electric motor know-how car manufacturers are capturing
competencies from tier-one suppliers. Their goal is to manufacture the whole power train. Some car makers are also working on batteries to complete another value chain integration.
Different car makers are in the development stages, testing both SiC and GaN devices. Toyota is the pioneer in this field, but it will still be some time before it enters manufacturing phase.
Figure 49 Electric vehicle manufacturers © Green Power Electronics 2017.
9.3 Markets
The EV/HEV market has a huge potential and is expected to grow with a CAGR of +19.5 % during 2015-2021 and to reach 10.5 billion$ by 2023.
The HEV segment could drive the inverter market in this market.
According to [3], EV would remain a small segment of the overall EV/HEV market without a breakthrough in battery or deployment of charging infrastructure.

Transnational Roadmap
Version: 25/01/2018 Page 51 of 72
Annual demand for EV/HEV by type in Munits
Year
20152016
20172018
20192020
20212022
2023
Annual dem
and f
or
EV
/HE
V b
y type
, M
Units
0
5
10
15
20Mild HEV
Full HEV
Plug in HEV
BEV
Figure 50 Annual demand for EV/HEV by vehicle type in units. Based on information from [3].
Figure 51 Market forecast for EV/HEV inverter by vehicle type. Based on information from [3].
EV/HEV Inverter Market by Type in US, $M
Year
20152016
20172018
20192020
20212022
2023
EV
/HE
V In
vert
er
Ma
rke
t b
y T
ype
in U
S, $
M
0
2000
4000
6000
8000
10000
12000Stop Start Vehicles
Mild HEV
Full HEV
Plug in HEVBEV
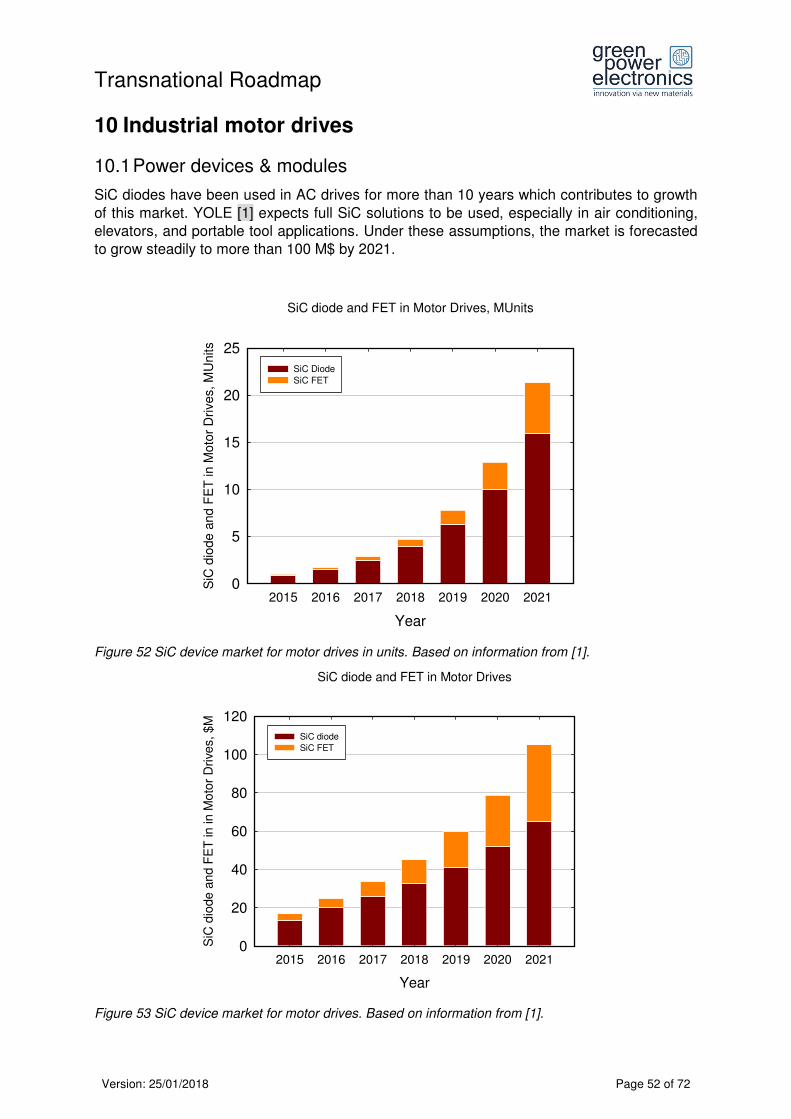
Transnational Roadmap
Version: 25/01/2018 Page 52 of 72
10 Industrial motor drives
10.1 Power devices & modules
SiC diodes have been used in AC drives for more than 10 years which contributes to growth
of this market. YOLE [1] expects full SiC solutions to be used, especially in air conditioning, elevators, and portable tool applications. Under these assumptions, the market is forecasted to grow steadily to more than 100 M$ by 2021.
SiC diode and FET in Motor Drives, MUnits
Year
2015 2016 2017 2018 2019 2020 2021
SiC
dio
de
an
d F
ET
in
Mo
tor
Dri
ve
s,
MU
nits
0
5
10
15
20
25
SiC Diode
SiC FET
Figure 52 SiC device market for motor drives in units. Based on information from [1].
Figure 53 SiC device market for motor drives. Based on information from [1].
SiC diode and FET in Motor Drives
Year
2015 2016 2017 2018 2019 2020 2021
SiC
dio
de
an
d F
ET
in
in
Mo
tor
Dri
ves, $
M
0
20
40
60
80
100
120
SiC diode
SiC FET

Transnational Roadmap
Version: 25/01/2018 Page 53 of 72
10.2 Manufacturers
ABB, Siemens, and Danfoss are the main players which occupy over 40 % of the AC drive market.
The total market for AC motor drive is the largest power converter market reaching around $20.3 billion in 2015.
Small local players are being acquired by bigger global players.
Figure 54 AC motor drive market split in 2015. Based on information from [3].
2015 AC Drives Market Shares, %
Others
Emerson
Yaskawa
Mitsubishi Electric
Schneider Electric
Rockwell
Danfoss/Vacon
Siemens
ABB
20.4 %
14.1 %
4.2 %
7.1%
8.0 %
13.6 %
7.2%
8.6 %
16.8 %
$ 20.3B

Transnational Roadmap
Version: 25/01/2018 Page 54 of 72
10.3 Markets
According to [3], low-power AC drives (≤40 kW) represent just 20 % of the whole market by revenue but occupy more than 80 % by volume.
Figure 55 AC motor drive inverters market. Based on information from [3].
AC Motor Drive Inverters Market, $M
Year
20152016
20172018
20192020
2021
AC
Moto
r D
rive
Inve
rters
Mark
et, $
M
0
5000
10000
15000
20000
25000
30000< 4 kW
5-40 kW
41-200 kW
201-600 kW
600+ kW
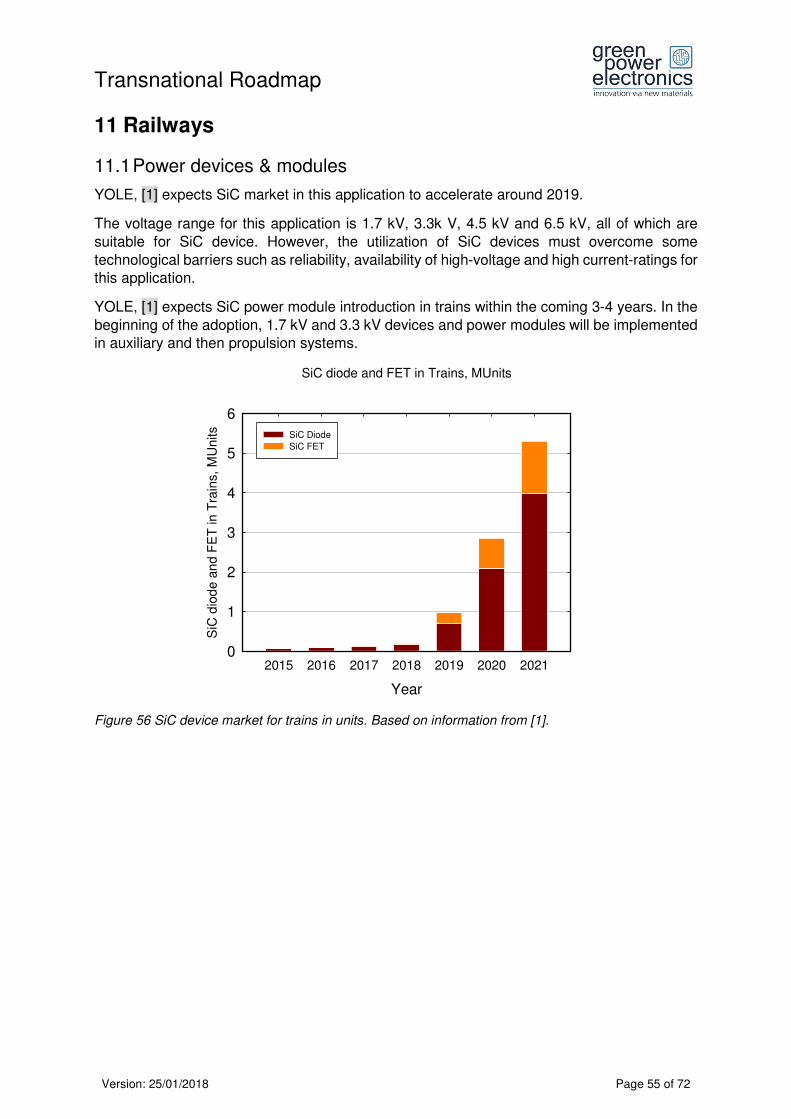
Transnational Roadmap
Version: 25/01/2018 Page 55 of 72
11 Railways
11.1 Power devices & modules
YOLE, [1] expects SiC market in this application to accelerate around 2019.
The voltage range for this application is 1.7 kV, 3.3k V, 4.5 kV and 6.5 kV, all of which are
suitable for SiC device. However, the utilization of SiC devices must overcome some
technological barriers such as reliability, availability of high-voltage and high current-ratings for this application.
YOLE, [1] expects SiC power module introduction in trains within the coming 3-4 years. In the
beginning of the adoption, 1.7 kV and 3.3 kV devices and power modules will be implemented in auxiliary and then propulsion systems.
SiC diode and FET in Trains, MUnits
Year
2015 2016 2017 2018 2019 2020 2021
SiC
dio
de a
nd F
ET
in T
rain
s,
MU
nits
0
1
2
3
4
5
6
SiC Diode
SiC FET
Figure 56 SiC device market for trains in units. Based on information from [1].

Transnational Roadmap
Version: 25/01/2018 Page 56 of 72
Figure 57 SiC device market for trains. Based on information from [1].
11.2 Manufacturers
According to [3], the merger between the two giant Chinese companies CSR & CNR has made
them (CRRC) the leader of the rail traction market which occupies over 40 % of the whole market.
Bombardier, Alstom, and Siemens are in the following positions.
Alstom decided to focus on the rail business and sold its two energy divisions to GE.
Figure 58 Train manufacturers market split in 2015. Based on information from [3].
SiC diode and FET in Trains
Year
2015 2016 2017 2018 2019 2020 2021
SiC
dio
de a
nd F
ET
in T
rain
s, $M
0
10
20
30
40
50
60
SiC diode
SiC FET
2015 Main Train Manufacturer Market Shares, %(Rolling stock market shares)
Others
CAF
GE Transportation
Stadler
Transmashholding
Siemens
Alstom
Bombardier
CRRC
$ 55.2B
$ 22.1B
$ 10.3B
$ 5.9B
$ 4.8B$3.4B
$3.2B$2.3B
$2.2B$1.0B
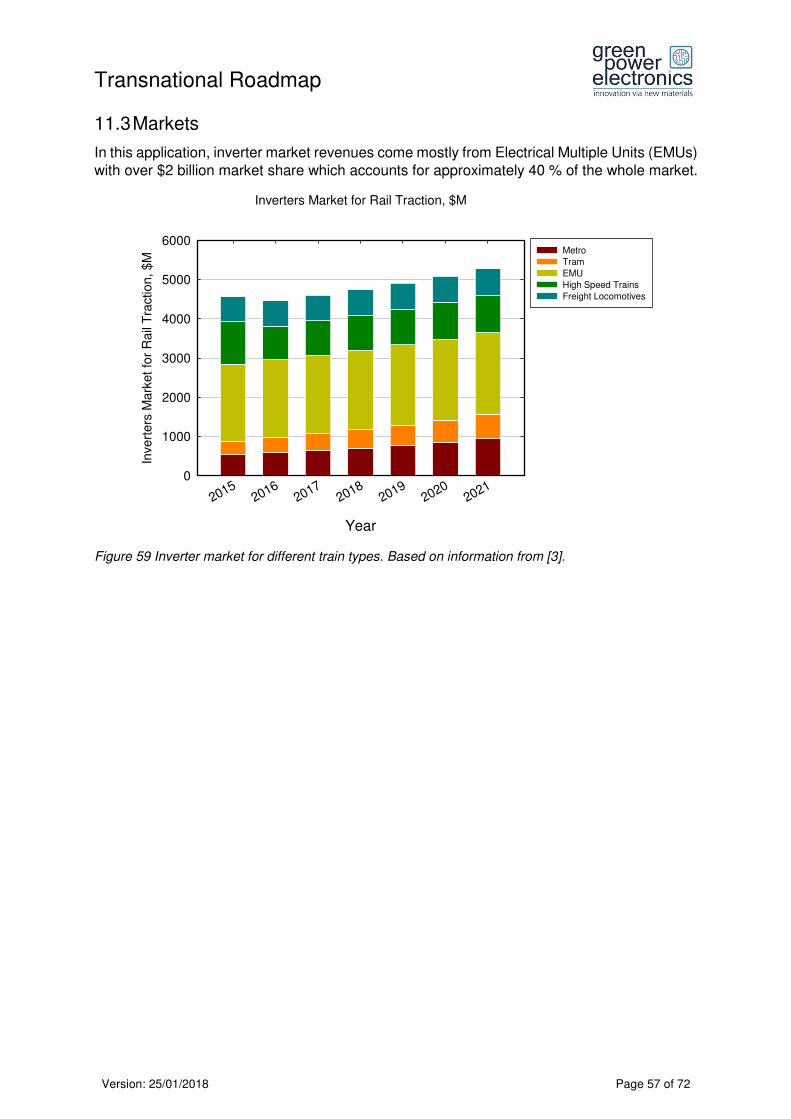
Transnational Roadmap
Version: 25/01/2018 Page 57 of 72
11.3 Markets
In this application, inverter market revenues come mostly from Electrical Multiple Units (EMUs) with over $2 billion market share which accounts for approximately 40 % of the whole market.
Figure 59 Inverter market for different train types. Based on information from [3].
Inverters Market for Rail Traction, $M
Year
20152016
20172018
20192020
2021
Inve
rte
rs M
ark
et
for
Ra
il T
ractio
n, $
M
0
1000
2000
3000
4000
5000
6000Metro
Tram
EMU
High Speed Trains
Freight Locomotives
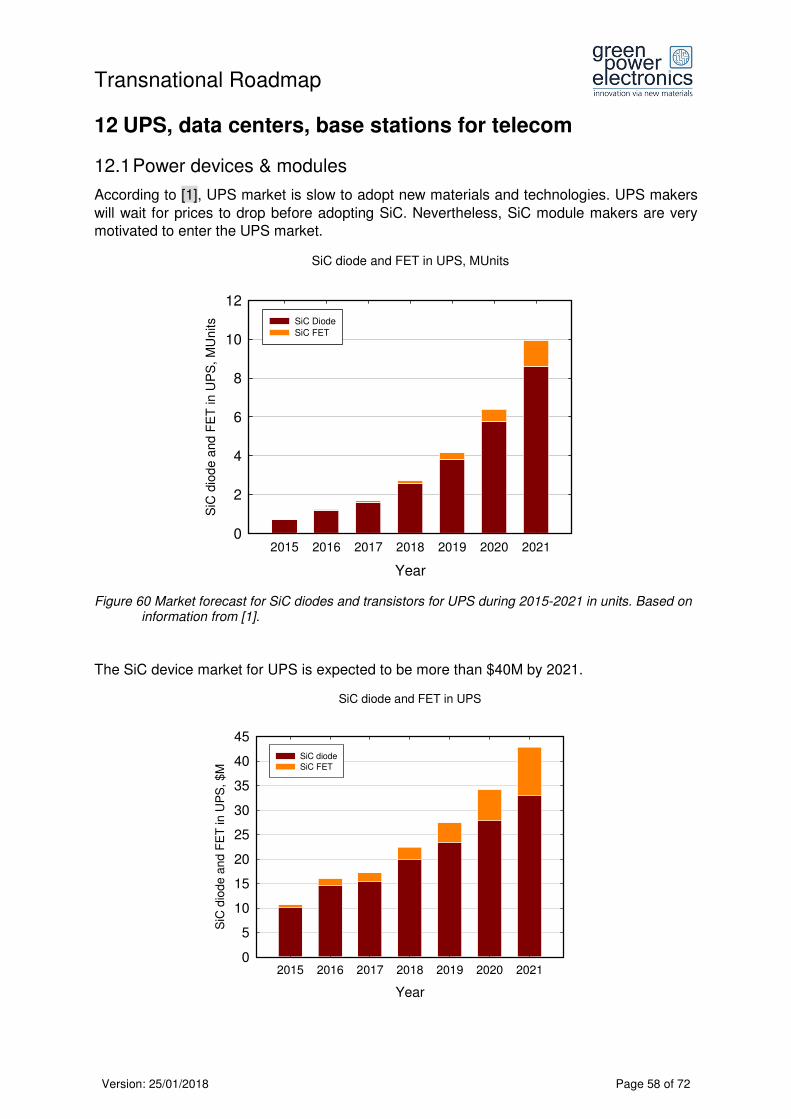
Transnational Roadmap
Version: 25/01/2018 Page 58 of 72
12 UPS, data centers, base stations for telecom
12.1 Power devices & modules
According to [1], UPS market is slow to adopt new materials and technologies. UPS makers
will wait for prices to drop before adopting SiC. Nevertheless, SiC module makers are very motivated to enter the UPS market.
SiC diode and FET in UPS, MUnits
Year
2015 2016 2017 2018 2019 2020 2021
SiC
dio
de a
nd
FE
T in
UP
S,
MU
nits
0
2
4
6
8
10
12
SiC Diode
SiC FET
Figure 60 Market forecast for SiC diodes and transistors for UPS during 2015-2021 in units. Based on information from [1].
The SiC device market for UPS is expected to be more than $40M by 2021.
SiC diode and FET in UPS
Year
2015 2016 2017 2018 2019 2020 2021
SiC
dio
de a
nd F
ET
in U
PS
, $M
0
5
10
15
20
25
30
35
40
45
SiC diode
SiC FET

Transnational Roadmap
Version: 25/01/2018 Page 59 of 72
Figure 61 Market of SiC diodes and transistors for UPS during 2015-2021. Based on information from [1].
According to [2], this market for GaN devices is expected to begin from 2019 with modular
UPS application and to reach $2.5M by 2021.
However, GaN devices are not yet mature enough to support high voltage and current ratings
for this application. Therefore, a limited penetration of GaN devices to UPS market segments
over the next five years is predicted.
Year
2015 2016 2017 2018 2019 2020 2021
GaN
De
vice M
ark
et
for
UP
S, M
Units
0.0
0.1
0.2
0.3
0.4
Figure 62 GaN device market for UPS in units. Based on information from [2].
Year
2015 2016 2017 2018 2019 2020 2021
Ga
N D
evic
e M
ark
et
for
UP
S,
$M
0
1
2
3
Figure 63 GaN device market for UPS. Based on information from [2].

Transnational Roadmap
Version: 25/01/2018 Page 60 of 72
12.2 Manufacturers
Emerson Electric and Schneider Electric own together half of the UPS market for data centres.
Total market was around $8.4 billion in 2015.
Figure 64 Large UPS manufacturer market split in 2015. Based on information from [3].
12.3 Markets
According to [3], the large UPS market will have the strongest growth driven by the expansion
of data centres. Low-power UPS represent over 90 % of the whole market by volume but less
than 50 % of revenues.
UPS is one of the biggest segments for power electronics by annual production volume and market.
2015 Large UPS Market Shares for Data Centers, %
Others
Socomec
Huawei
Eaton Corp
Schneider Electric
Emerson Electric
14.9 %
27.7 %
6.4 %
9.7%
20.3 %
21.1 %
$ 8.4B

Transnational Roadmap
Version: 25/01/2018 Page 61 of 72
Inverter Market for UPS, $M
Year
20152016
20172018
20192020
2021
Inve
rte
r M
ark
et
for
UP
S,
$M
0
2000
4000
6000
8000
10000
12000
14000< 5 kVA
5-100 kVA
> 100 kVA
Figure 65 Inverter market size for UPS split by power range. Based on information from [3].

Transnational Roadmap
Version: 25/01/2018 Page 62 of 72
13 Emerging applications
13.1 Power devices & modules
a) Wireless Power application
The primary target is expected in resonant coupling circuit for wireless communication technology. In particular, GaN-based devices has the benefit of higher frequency than existing MOSFETs and allow a higher efficiency, which are crucial factors for wireless charging application. By using GaN transistors, we can have multi-mode systems that are compatible with different wireless charging standards.
This market is not activated yet. But, YOLE expects the market to grow from 2016, reaching
more than 10M$ by 2021.
Year
2015 2016 2017 2018 2019 2020 2021Ga
N D
evic
e M
ark
et fo
r W
ire
less P
ow
er,
MU
nits
0.0
0.5
1.0
1.5
2.0
2.5
3.0
Figure 66 GaN device market for wireless power in units. Based on information from [2].

Transnational Roadmap
Version: 25/01/2018 Page 63 of 72
Year
2015 2016 2017 2018 2019 2020 2021
Ga
N D
evic
e M
ark
et
for
Wir
ele
ss P
ow
er,
$M
0
2
4
6
8
10
12
Figure 67 GaN device market for wireless power. Reproduced by [2].
b) Envelope tracking (ET)
In this application, power amplifier efficiency with increasing power and limited battery capacity
has been a challenge for industries. GaN devices could be used in adaptive switching power supply in order to save energy and reduce heat dissipation.
Market expectation is still small in 2015. However, market is anticipated to grow to around 18M$ by 2021 due to the increasing number of base stations requiring ET.
Year
2015 2016 2017 2018 2019 2020 2021
Ga
N D
evic
e M
ark
et
for
En
ve
lop
e T
rackin
g,
MU
nits
0
2
4
6
8
10
12
14
16
Figure 68 GaN device market for envelop tracking in units. Based on information from [2].

Transnational Roadmap
Version: 25/01/2018 Page 64 of 72
Year
2015 2016 2017 2018 2019 2020 2021Ga
N D
evic
e M
ark
et
for
En
ve
lop
e T
rackin
g,
$M
0
2
4
6
8
10
12
14
16
18
20
Figure 69 GaN device market for envelope tracking. Reproduced by [2].
c) Lidar applications
Higher switching speed is required in the application because LiDAR uses pulsed lasers to
rapidly create a three-dimensional image of a surrounding area. From this point of view, GaN
devices could give LiDAR systems superior resolution with faster response time and greater accuracy.
This market for GaN devices is still quite small since it is in the initial stage of introduction into the application but is anticipated to reach around 36M$ by 2021.
Year
2015 2016 2017 2018 2019 2020 2021
Ga
N D
evic
e M
ark
et
for
Lid
ar,
MU
nits
0
2
4
6
8
10
Figure 70 GaN device market for Lidar in units. Based on information from [2].

Transnational Roadmap
Version: 25/01/2018 Page 65 of 72
Year
2015 2016 2017 2018 2019 2020 2021
Ga
N D
evic
e M
ark
et
for
Lid
ar,
$M
0
5
10
15
20
25
30
35
40
Figure 71 GaN market for Lidar. Based on information from [2].
13.2 Manufacturers
There are many companies working with wireless charging many belonging to the two international associations for adoption of wireless charging standards AirFuel Alliance and the Wireless Power Consortium. The leading players on the Wireless Charging market for GaN are EPC, Murata and Navitas Semiconductor. The main players on the Envelope Tracking and Lidar markets for GaN are EPC, Velodyne and Quaenergy.
13.3 Markets
Wireless charging. So far, wireless power is mainly for mobile electronics, i.e. smart phones and tablets. Wireless power is expected to extend into numerous domains including toys, home appliances, medical devices, and military devices. Despite several advances, Yole believes that wireless charging for electric vehicle powering is still in an early stage and not likely to become widespread in the near future. Several issues, i.e. cost, safety, charging station-car positioning, efficiency, and worldwide standards compliance still require resolution. Envelope Tracking (ET). The implementation of ET in base stations began several years ago. Since then, it has gained in popularity because it permits a significant reduction in power dissipation and operational temperature, as well as higher total efficiency. •Telecom operators are now demanding radio equipment that offers high flexibility, small size, and above all, high energy efficiency. The availability of broadband PAs with efficiency approaching 50% is critical to meeting these needs, and ET is a key enabling technology. In 5G technology, the efficiency need is even greater. Replacing the switching device with a GaN HEMT, improves in overall ET efficiency and increases system bandwidth.
LiDAR stands for Light Distancing and Ranging, a remote sensing technology that uses a laser to measure the distance to a target. Main LiDAR platforms include aerial, satellite, and
Transnational Roadmap
Version: 25/01/2018 Page 66 of 72
automotive applications. For a long time, LiDAR has been used for military and government applications dedicated to remote measurement and mapping.
Due to various technological advancements and cost-effective solutions, LiDAR is penetrating into commercial sectors like ADAS (advanced driver assistance systems), corridor mapping, mining, wind measurement, augmented reality, and robotics. Since LiDAR permits 3D mapping by sending a laser beam that moves a full 360 degrees, it is also considered the breakthrough technology in autonomous cars.
Since LiDAR uses pulsed lasers to rapidly create a three-dimensional image of a surrounding area, a higher switching speed is demanded in the circuit design. GaN’s high-frequency switching gives LiDAR systems superior resolution, faster response time, and greater accuracy.
As of 2016, LiDAR’s automotive presence is minimal. However, by 2021 the LiDAR automotive market is expected to be as high as that of industrial applications. Recent investments in Velodyne and Quaenergy are very positive signs for the market.

Transnational Roadmap
Version: 25/01/2018 Page 67 of 72
14 WBG market potential
14.1 Power devices & modules
The large power inverter markets (EV/HEV, wind turbines, PV inverters, rail traction, UPS and industrial motor drives), are all promising business opportunities for power electronics.
14.2 Inverter market
The automotive industry is by large the main inverter market in units.
According to [3],
-PV market segment will continue growing and reach approximately 7 billion$ in 2021.
-EV/HEV market segment has largest potential, with the strongest CAGR of 19.5 %
during 2015-2021.
-Wind turbine market segment suffered a painful decrease around 20% in 2013, but had a historical revenue over 4.7 billion$ for 60GW in 2015. Negative market
expectation is estimated with a CAGR of -1.7 % during 2015-2021.
-Rail market segment will increase slowly with a CAGR of +2.4 % during 2015-2021.
New markets can be introduced from Iran or China which will boost this market. -UPS market segment is expected to grow and reach 12 billion$ in 2021, especially in
new data centre installations.
-Industrial AC motor drivers will continue to lead inverter demand with more than 40% of the whole market.
Year
2015 2016 2017 2018 2019 2020 2021
Invert
er
Mark
et, M
Units (
split
by a
pplic
atio
n)
0
20
40
60
80
PV
EV/HEVWind
Rail
UPSMotors
Inverters Market (in Munits)
Figure 72 Whole inverter market in units split by application. Based on information from [3].
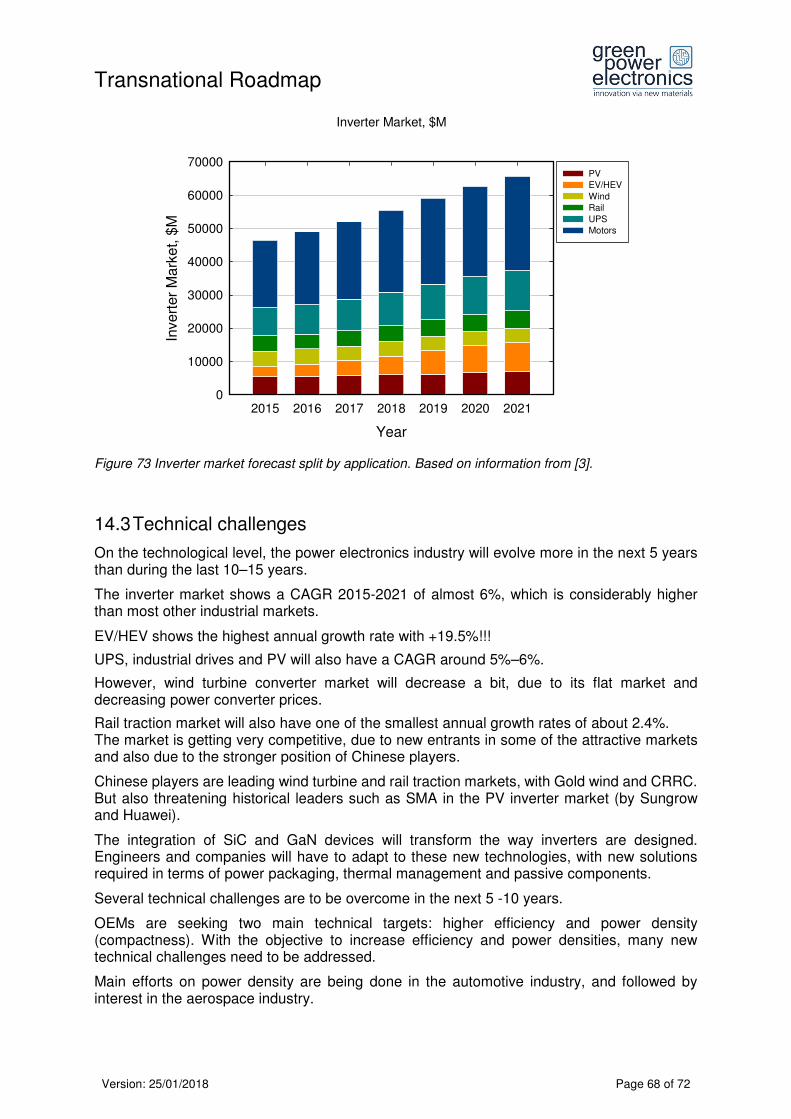
Transnational Roadmap
Version: 25/01/2018 Page 68 of 72
Figure 73 Inverter market forecast split by application. Based on information from [3].
14.3 Technical challenges
On the technological level, the power electronics industry will evolve more in the next 5 years than during the last 10–15 years.
The inverter market shows a CAGR 2015-2021 of almost 6%, which is considerably higher than most other industrial markets.
EV/HEV shows the highest annual growth rate with +19.5%!!!
UPS, industrial drives and PV will also have a CAGR around 5%–6%.
However, wind turbine converter market will decrease a bit, due to its flat market and decreasing power converter prices.
Rail traction market will also have one of the smallest annual growth rates of about 2.4%. The market is getting very competitive, due to new entrants in some of the attractive markets and also due to the stronger position of Chinese players.
Chinese players are leading wind turbine and rail traction markets, with Gold wind and CRRC. But also threatening historical leaders such as SMA in the PV inverter market (by Sungrow and Huawei).
The integration of SiC and GaN devices will transform the way inverters are designed. Engineers and companies will have to adapt to these new technologies, with new solutions required in terms of power packaging, thermal management and passive components.
Several technical challenges are to be overcome in the next 5 -10 years.
OEMs are seeking two main technical targets: higher efficiency and power density (compactness). With the objective to increase efficiency and power densities, many new technical challenges need to be addressed.
Main efforts on power density are being done in the automotive industry, and followed by interest in the aerospace industry.
Inverter Market, $M
Year
2015 2016 2017 2018 2019 2020 2021
Inve
rter
Ma
rke
t, $
M
0
10000
20000
30000
40000
50000
60000
70000PV
EV/HEV
Wind
Rail
UPS
Motors

Transnational Roadmap
Version: 25/01/2018 Page 69 of 72
At the inverter level new trends with shared cooling systems or air-cooled systems will be increasingly used. The objective being to reduce the volume and the cost of the whole system.
At power module level, main innovations are coming from double-sided cooled modules, which improves their thermal management and the performance of the devices. New power packaging technologies, such as silver sintering will also become widespread as well as low inductive designs of power modules and systems.
Silicon carbide devices will enable higher power densities at the device and system level with enhanced performances.
Efficiency improvements are a must in most of applications.
Converter topologies, architecture and their control strategies are also key to efficient power conversion inverters.
For the next 5–10 years most innovations and improvements will come in the field of SiC and GaN device integration in converters.
The possible integration of SiC and GaN devices in the automotive industry will have a major impact on the whole power electronics market.
According to [1], many efforts are still needed by power business players with following issues, in order to take full advantage of SiC power devices.
Figure 74 Expected benefits from device to system with SiC-based power devices vs issues. © Green Power Electronics 2017.

Transnational Roadmap
Version: 25/01/2018 Page 70 of 72
14.4 Price development
An example of the device cost breakdown is given in Figure 14.4.
Figure 75 SiC MOSFET cost breakdown. The cost of the SiC MOSFET is calculated to be 3.05, 3.12 and 3.4 $/device, respectively, counting from left to right. Based on information from [1].
SiC-Based MOSFET DEVICE COST BREAKDOWN
Based on System Plus’ reverse cost analysis
ManufacturerDevice
Type
Breakdown
voltage
Current
@ 25 oC
Wafer
Size
Die
areaPitch
Current
Density
CREE Planar 1200 V 36 A 100 mm 10.4 mm2 9 µm 3.46 A/mm2
ROHM Planar 1200 V 40 A 100 mm 12.7 mm2 12 µm 3.16 A/mm2
ROHM Trench 1200 V 36 A 100 mm 12.9 mm2 6 µm 2.77 A/mm2
SiC
-base
d M
OS
FE
T W
afe
r C
ost
Str
uctu
re,
$
0
200
400
600
800
1000
1200
1400
1600
Raw wafer
Equipment
Clean Room
Labor
Consumable cost
Yield losses
Cree Planar ROHM Planar ROHM Trench
35.0%
22.5%
10.1%
20.0%
10.2%
20.0%
42.0%
19.7%
10.2%
20.0%
39.7%
21.0%
Transnational Roadmap
Version: 25/01/2018 Page 71 of 72
15. List of Literature
[1] Yole Développement, “Power SiC 2016: Materials, Devices, and Applications”, 2016. [2] Yole Développement, “GaN Power Epitaxy, Devices, Applications and Technology
Trends”, 2016.
[3] Yole Développement, “Inverter Technologies Trends & Market Expectations 2016”,
2016. [4] Yole Développement, “Opportunities for Power Electronics in Renewable Electricity
Generation”, 2016.
[5] ECPE Position Paper, ”Energy efficiency - the role of power electronics”, March 2007.
[6] ECPE Position Paper, ”Next Generation Power Electronics based on Wide Bandgap Devices - Challenges and Opportunities for Europe”, May 2016.
[7] EREC, European Renewable Energy Council, ”Technology Roadmap up to 2020”,
January 2017.
[8] H. Ohashi, “Power Devices now and future, strategy of Japan – Role of power electronics for a low carbon society”, Proceedings of the 24th ISPSD, pp.9-12, 2012.
[9] M. Bakowski, “Status and Prospects of SiC Power Devices”, IEEJ, Niigata, 2006.
[10] Hoffmann, W., Solar Photovoltaic Compenting in the Energy Sector, PVSEC Hamburg,
2011. [11] Mike Munsell, German energy storage market to reach $1B by 2021, available at:
https://www.greentechmedia.com/articles/read/german-energy-storage-market-to-reach-1b-by-2021, July 2016,
Transnational Roadmap
Version: 25/01/2018 Page 72 of 72
16. Appendix List [A] H. Ohashi, “Power Devices now and future, strategy of Japan – Role of power electronics
for a low carbon society”, Proceedings of the 24th ISPSD, pp.9-12, 2012.
[B] ECPE Position Paper, “Energy efficiency - the Role of Power Electronics”, March 2007. [C] ECPE Position Paper, “Next Generation Power Electronics based on Wide Bandgap
Devices - Challenges and Opportunities for Europe”, May 2016.
[D] M. Bakowski, “Status and Prospects of SiC Power Devices”, IEEJ, Niigata, 2006.
[E] EREC, European Renewable Energy Council, “Technology Roadmap up to 2020”, January 2017.
[F] Hoffmann, W., 2011. Solar Photovoltaic Competing in the Energy Sector, PVSEC
Hamburg.
[G] Yole presentation ISICPEAW 2016, Hong LIN [H] Yole presentation_CLINT WPE Workshop_2016-06-16_Light
[I] Yole presentation Devices P. GUEGUEN [J] Yole presentation SiCMarket_P. Roussel