(nyse: nm) at 4th invest in international shipping forum...
TRANSCRIPT

Navios Maritime Holdings IncNavios Maritime Holdings Inc.(NYSE: NM)
atat
4th Invest in International Shipping ForumNew York
March 25, 2010

Disclosures
Statements in this presentation which are not statements of historical fact are “forward-looking statements” (as such term is defined in Section 21E of the Securities Exchange Act of 1934, as amended). These forward-looking statements are based on the information available to, and the expectations and assumptions deemed reasonable by, the Company at the time this presentation was made. Although the Company believes that the assumptions underlying such statements are reasonable, it can give no assurance that they will be attained. The Company undertakes no obligation to update any forward-looking statements, whether as a result of new information or future events, unless it is required to do so under the securities laws. The Company makes no prediction or statement about the performance of its common units.p
For the selected financial data presented herein, Navios Holdings compiled consolidated statement of operations for the fiscal years 2008 and 2009 and the three-month periods ended December 31, 2008 and 2009.
EBITDA represents net income plus interest and finance costs plus depreciation and amortization and income taxes, if any, unless otherwise stated. EBITDA is included because it is used by certain investors to measure a company's financial performance. EBITDA is a “non-GAAP financial measure” and should not be considered a substitute for net income, cash flow from operating activities and other operations or cash flow statement data prepared in accordance with accounting principles generally accepted in the United States or as a measure of profitability or liquidity. EBITDA g p p g y p p y q yis presented to provide additional information with respect to the Company's ability to satisfy its obligations including debt service, capital expenditures, working capital requirements and determination of dividends. While EBITDA is frequently used as a measure of operating results and the ability to meet debt service requirements, the definition of EBITDA used here may not be comparable to that used by other companies due to differences in methods of calculation.calculation.

Agendag• Company Overview• Key 2009 Developments
Li idit A l i & O ti B k• Liquidity Analysis & Operating Breakeven• Core Fleet Update• Navios Maritime Partners• Navios South American LogisticsNavios South American Logistics• Navios Maritime Acquisition Corporation• Industry Overview• Q4 and YE 2009 Financial Results• Summary
3

Company Overview

Seasoned Management TeamAngeliki FrangouChairman & CEONavios Maritime
Holdings
George AchniotisCFO
Navios Maritime Holdings
Michael E. McClureEVP - Corporate Affairs
Navios Maritime Holdings
Ted C. PetronePresident
Navios Corp
• 19 years experience in the shipping industry
• Chairman and CEO of Navios since August 2005
P i l f d d t
• CFO since April 2007
• PwC partner in charge of shipping practice in Greece
• UK Chartered Accountant
• 19 years experience in the
• Previously, SVP responsible for the commercial activities and the FFA trading desk
• Over 30 years of experience in the
• Previously CFO since IPO
• Served as SVP Corporate Affairs since April 2007 and before that CFO from October 2005 to April 2007 of Navios Maritime Holdings
• Previously founded two private shipping companies
accounting profession
• Joined Navios in 2006
experience in the shipping industry
• Joined Navios in 1980
• Served as Vice President of Navios Research and Risk Management and Manager of Financial Analysis
• Joined Navios in 1978
Shunji Sasada COO – Navios Corp
Other Key ManagementOther Key Management
Vasiliki Papaefthymiou
EVP - Legal
Anna KalathakisSVP- Legal Risk Mgt
Claudio LopezVice ChairmanNavios South
American Logistics
Ruben MartinezGM - Port Division
Navios South American
• 28 years experience
• 16 years experience with Mitsui O.S.K. Lines Ltd, including 6 years with Trinity Bulk
EVP Legal
• 18 years experience in Maritime Law
• General Counsel for Maritime Enterprises since 2001
• 15 Years experience in Maritime Law
• Graduate of Georgetown University, MBA –
American Logistics
• 26 years experience
• President, Argentinean Shipowners Tanker Association
F f f
Logistics
• Began as a Mechanical Engineer & promoted to General Manager in 2005
• Graduated in M h i lcarriers (Norway) and
Mitsui O.S.K. Bulk Shipping (London)
• Joined Navios in 1997
• 10 years as General Counsel to Franser Shipping
European University and JD - Tulane
• Joined Navios in 2005
• Former professor of Maritime Law at University of Belgrano
5
Mechanical Engineering from Montevideo University
• Joined Navios in 1989
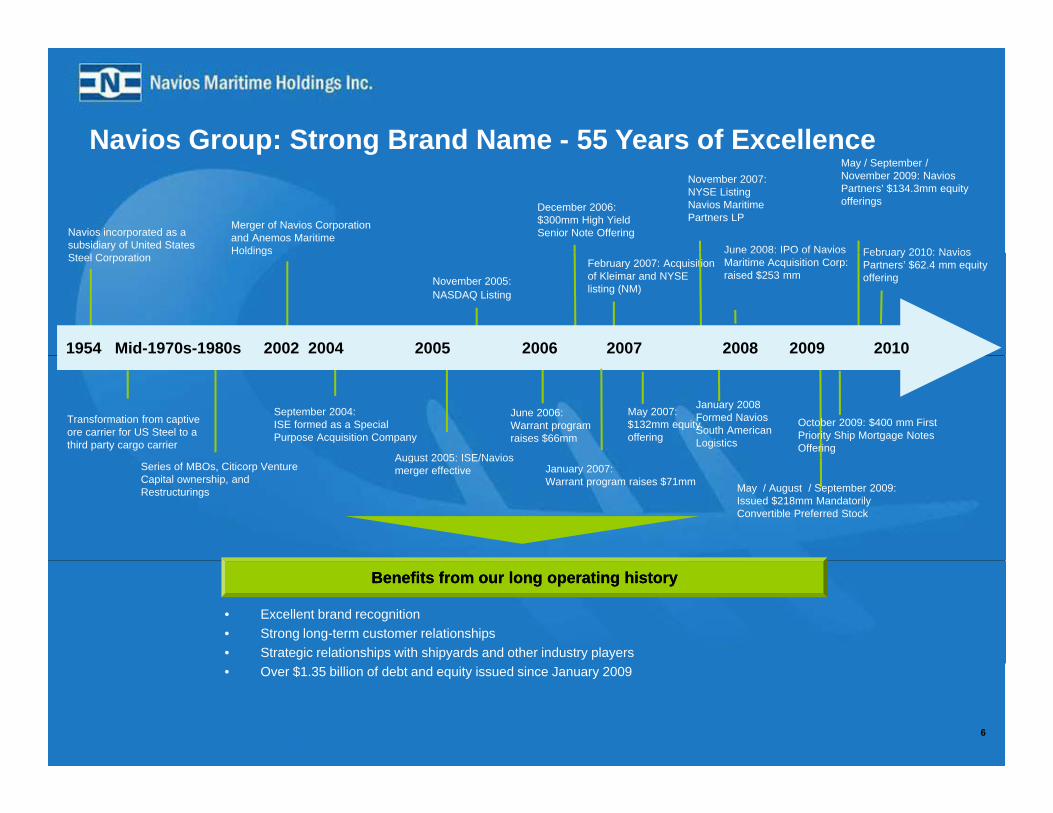
Navios Group: Strong Brand Name - 55 Years of Excellence p g
December 2006:$300mm High YieldSenior Note OfferingNavios incorporated as a
subsidiary of United States
Merger of Navios Corporation and Anemos Maritime Holdings
November 2007:NYSE Listing Navios Maritime Partners LP
June 2008: IPO of Navios
May / September / November 2009: Navios Partners’ $134.3mm equity offerings
February 2010: NaviosFebruary 2007: Acquisition of Kleimar and NYSE listing (NM)
Steel CorporationHoldings
1954 Mid-1970s-1980s 2002 2004 2005 2006 2007 2008 2009 2010
November 2005: NASDAQ Listing
June 2008: IPO of NaviosMaritime Acquisition Corp: raised $253 mm
February 2010: Navios Partners’ $62.4 mm equity offering
Transformation from captive ore carrier for US Steel to a third party cargo carrier
September 2004:ISE formed as a Special Purpose Acquisition Company
August 2005: ISE/Navios
June 2006:Warrant program raises $66mm
May 2007: $132mm equity offering
January 2008Formed NaviosSouth AmericanLogistics
October 2009: $400 mm First Priority Ship Mortgage Notes Offering
Series of MBOs, Citicorp Venture Capital ownership, and Restructurings
August 2005: ISE/Navios merger effective January 2007:
Warrant program raises $71mm May / August / September 2009: Issued $218mm Mandatorily Convertible Preferred Stock
Benefits from our long operating historyBenefits from our long operating history
• Excellent brand recognition• Strong long-term customer relationships• Strategic relationships with shipyards and other industry players• Over $1.35 billion of debt and equity issued since January 2009
6

Flexible Business ModelS C h Fl O t it f k t i t lli M iti i t tSecure Cash Flow + Opportunity from market intelligence + Maritime investments
Core fleet operations and risk management Core fleet operations and risk management
Core fleet - owned and long term chartered-in vesselsFocus – stable cash flow from charter-out contracts >12 months
N i M iti P t L PN i M iti P t L P
Focus stable cash flow from charter out contracts >12 months Insure revenue - AA+ rated EU government backed insurance Contracts of Affreightment , Short-Term Charters, Forward Freight AgreementsFY 2009 EBITDA: $161.7 million
Navios South American LogisticsNavios South American LogisticsNavios Maritime Partners L.P.Navios Maritime Partners L.P.(NYSE:NMM)(NYSE:NMM)
33.2% ownership stake 2.0% General Partner Interest Incentive Distribution Rights Navios
65.5% ownership stakeKey integrated logistics operator in Hidrovia RegionIncentive Distribution Rights
Long Term Stable Cash FlowHigh dividend distribution modelSignificant growth opportunity FY 2009 EBITDA: $64.5 million
GroupEBITDA
Core operations consist of:Storage and Port Terminal facilities (grain and liquid)Cabotage business Barging (wet and dry)
Navios Maritime Acquisition Corp.Navios Maritime Acquisition Corp.(NYSE:NNA.U)(NYSE:NNA.U)
Strong joint venture partnersCommodities / Emerging marketsExpansion possibilities into mineral commodities Significant growth opportunity
19% ownership stake$253.0 million IPO Proceeds$7.6 million NM investment Favorable marine transportation dynamics 7
FY 2009 EBITDA: $29.6 million

Key 2009 Developments

2009 Fundraising Initiatives2009 Fundraising Initiatives• Debt
– Note Issuance: $400.0 million of 8.875% First Preferred Mortgage Notes due 2017Bank Debt: $545 0 million new bank debt raised– Bank Debt: $545.0 million new bank debt raised
• Long-term debt financing secured for the entire new building program• Achieved favorable borrowing terms in difficult environment
• Equity– $221.1 million mandatorily convertible preferred stock (“MCPS”) committed
• $87.0 million issued in 2009• $134.1 million to be issued in 2010/2011• 357,142 common shares issued upon conversion of preferred stock on
December 17, 2009 at $14.0 per share for Navios Celestial – MCPS mandatorily converts between $10 00/$14 00MCPS mandatorily converts between $10.00/$14.00 – No Common Shares issued in the market during credit crisis
• Shareholders protected from immediate dilution through other measures
• Liquidity – Cash of approx. $130.0 million received via dropdown of vessels into NMM
9

2009: Eight New Build Capesize Vessels Delivered$
Vessel Type / DWT Delivery Date Charter-out rate per day (net) Charter Term
Navios Bonavis Capesize /180,022 06/29/2009 $47,400 5 years
Annual EBITDA of $106.1 million
Navios Happiness Capesize / 180,022 07/23/2009 $55,100 5 years
Navios Pollux Capesize / 180,727 07/24/2009 $42,250 10 years
Navios Aurora II * Capesize / 169,031 11/25/2009 $41,325 10 years
Navios Lumen Capesize / 180,661 12/10/2009 $37,500 - years 1 & 2$39 830 3 & 4
8 years$39,830 - years 3 & 4
$39,330 - years 5,6 & 7 + year 8 (Navios) option **
Navios Phoenix Capesize / 180,242 12/21/2009 $36,575 *** 1 year
Navios Stellar Capesize / 169,001 12/23/2009 $35,874 7 years
Navios Antares Capesize / 169,059 01/20/2010 $38,000 - years 1 through 5$47,500 – years 6 through 8
(Navios) Option **
8 years
TOTAL 1,408,765
Vessel Type / DWT Delivery Date Charter-out rate per Charter Term
Two Ultra-Handymax Vessels DeliveredAnnual EBITDA of $7.4 million
* Sold to NMM on March 18, 2010
* * Plus profit sharing – see appendix
*** Subject also to COA - see appendix
10
day (net)
Navios Vega Ultra-Handymax / 58,792 02/18/2009 $12,350 2 years
Navios Celestial Ultra-Handymax / 58,063 09/18/2009 $17,550 2 years

2010: Seven Newbuild Capesize Vessels to be delivered2010: Seven Newbuild Capesize Vessels to be deliveredNew Build Capex Fully Funded
• Nominal Acquisition Price = $521.4 million ($74.5 million per vessel)• Effective Acquisition Price = $423.1 million ($60.4 million per vessel)
A t EBITDA $630 0 illi (1)
V l A ti i t d DWT Ch t t Ch t T P fit Sh
• Aggregate EBITDA = $630.0 million (1)
• Annual EBITDA contribution = $68.0 million• Average Charter-Out Term = 10.1 years• AA+ EU government backed insurance
Vessel Anticipated Delivery Date
DWT Charter-out rate per day
(net)
Charter Term Profit Share
Navios Fulvia 08/2010 180,000 $50,588 5 years N/A
Navios Melodia 07/2010 180 000 $29 356 12 years 50/50 in excess of $37 500Navios Melodia 07/2010 180,000 $29,356 12 years 50/50 in excess of $37,500
Navios Buena Ventura
09/2010 180,000 $29,356 10 years 50/50 in excess of $38,500
Navios Luz 10/2010 180,000 $29,356 10 years 50/50 in excess of $38,500
Navios Etoile 10/2010 180,000 $29,356 10 years 50/50 in excess of $38,500
Navios Bonheur 11/2010 180,000 $29,356 12 years 50/50 in excess of $37,500
Navios TBN: Capesize
03/2011 180,000 $27,431 12 years N/A
1111
p
(1) Aggregate EBITDA over the life of the contract; daily operating expenses of $5,000 per day (growing at 3% annually)

Liquidity Analysis & Operating Breakeven

Strong Liquidity PositionSt o g qu d ty os t o
December 31, 2009(in millions US$)( )
Cash (1) 281.1
Liquidity Position
Revolving Credit Facilities 158.9
Debt (2) 1,622.7
Shareholders' Equity (4) 925.5
Capitalization (4) 2 548 2
g
Drawn Portion(3) (57.9)
Undrawn Portion 101.0
C h 281 1Capitalization (4) 2,548.2
Net Debt / Capitalization 52.6%
Cash 281.1
Total Liquidity 382.1
(1) Includes restricted cash
(2) I l d $120 4 illi d bt f N i L i ti
1313
(2) Includes $120.4 million debt of Navios Logistics
(3) Drawing under the facilities until December 31, 2009
(4) Excludes noncontrolling interest

Substantial Cashflow Cushion from Low Operating p gBreakeven
CostRevenue
$32,913
$28 313
Total Levered Operating Cost
2011 – 65.9% Fixed
2010 – 89.4% Fixed
$
$3,704
$28,313
Operating Breakeven
Operating Breakeven
$19,964
$2,362
$7,722
$6,176
Average Contracted Daily Charter-Out Rate 2010 E
• Breakeven includes operating costs of owned fleet (including drydock), charter-in expenses for charter-in fleet, general and administrative expenses including credit default insurance expenses, interest expense and capital repayments (excludes COAs, short term charters and FFAs)
• Total Available Days of Core Fleet: 12,231 for 2010, 13,710 for 2011
Opex (incl. drydocking) + Charter-in Costs General & Administrative Expenses Interest Expense Capital Repayments
14

Core Fleet Update

Navios Holdings – 59 vessels & 6.4 million DWTNavios Holdings 59 vessels & 6.4 million DWT
Controls 59(1) Vessels (6 4 million dwt)
One of the largest fleets among US-listed dry bulk carriers
14 Panamax 18 Ultra-Handymax
Controls 59( ) Vessels (6.4 million dwt)42 Currently Operating (4.1 million dwt)
Average Age = 4.5 years
24 Capesize 3 Handysize14 Panamax
• 10 vessels
18 Ultra-Handymax
• 5 vessels 27 Long-Term Charter-In
32 Owned Vessels(3.5 million dwt)
24 Capesize
• 14 vessels (2.50 million dwt)
• 10 vessels
3 Handysize
• 2 vessels
• 1 vessel (1)
(0.02 million dwt)• 4 vessels
(0.30 million dwt)• 13 vessels
(0.70 million dwt)
0 esse s(0.78 million dwt) (0.28 million dwt)
• 4 vessels (0.23 million dwt)
g(2.9 million dwt)
12 Purchase Options
(1.2 million dwt)
(1.79 million dwt)
• 4 vessels (0.72 million dwt)
2 vessels (0.07 million dwt)
• 2 vessels (0.07 million dwt)
• 2 vessels (0.16 million dwt)
Charter-in strategy allows fleet expansion with zero capital outlay& future ownership option via purchase options
Navios Group(2) controls 72 vessels and 7 5 million DWT
(1) Includes Product tanker Vanessa, excludes Navios Logistics’ fleet.(2) Navios Group includes Navios Holdings’ (NM) and Navios Partners’ (NMM) Vessels. Excludes Navios Logistics’ fleet.
Navios Group controls 72 vessels and 7.5 million DWT
16

Focus on Long-Term Contracted Revenueocus o o g e Co t acted e e ueAA+ Insurance of Charters-Out
Contracted Revenue(1)Average Daily Charter RateAverage Daily CharterAverage Daily Charter--out Rateout Rate % Days Contracted% Days Contracted% Days Contracted
2009: $243.4 million2010: $291.2 million2011: $285.2 million2012: $269.5 million2013: $231 7 million
$32,562 $33,787 $34,661
$27,953
$25,000
$30,000
$35,000
$40,000 89.2%
65.0%55.8%
46.6%60%
80%
100%
2013: $231.7 million
$10,000
$15,000
$20,000
$25,000
2010 2011 2012 2013
0%
20%
40%
2010 2011 2012 2013
Top Ten Charter PartiesTop Ten Charter Parties
2010 2011 2012 2013
Time CharterTime Charter--out Strategyout Strategy
High utilization ratesCharterer % of Total Charter-Out
Revenue (2)
Korea Line Corp 22 0% Earnings visibilitySteady cash flowDownside protection in challenging markets
Korea Line Corp 22.0%Cosco Bulk Carriers 18.9% Mitsui O.S.K. Lines Ltd. 14.2% Hanjin 8.4% Sanko 7.3% STX 5.5% Emirates Trading Agency 5.0% Sealink 4 8%
(1) Excludes CoAs, Kleimar controlled Fleet and Navios Logistics’ Fleet. (2) Years 2010 through 2012
challenging marketsSealink 4.8%Cargill 2.2% Intermare 1.6%
Total: 89.9%
17

Recent Fleet Developmentsp• Acquisition of Navios Vector
– 2002 built Ultra-Handymax50 296 dwt– 50,296 dwt
– Chartered-in for another 5 years until December 17, 2015– No purchase option in original charter party– Purchase Price: $30.0 millionPurchase Price: $30.0 million
Cancellation of charter-in obligation saves the companyapproximately $5.0 million over the life of the contract
• New long-term chartered-in Capesize vessel– New built Capesize
180 000 dwt– 180,000 dwt– Delivery 2013– Chartered-in for 10 years plus three one-year options– Purchase option p
18

Efficient, Low Cost Operator with Favorable Charters-inEfficient, Low Cost Operator with Favorable Charters in
Opex is approximately 17% less than the industry average due to:
LTM Average Daily Operating Costs / Vessel (Including dryLTM Average Daily Operating Costs / Vessel (Including dry--docking)docking)
average due to:Modern, efficient fleetStrong in-house technical management team Proactive, in-transit repairs Upgraded, customized IT for fleet management
$4,639
$5,607
$4,500
$5,000
$5,500
$6,000
$/Da
y
Navios Holdings benefits from technical management services provided to Navios Partners
$4,0002009 Navios Average per
Vessel2009 Industry Average
per Vessel(1)
Favorable LongFavorable Long-- Term CharterTerm Charter--in Contractsin Contracts (2) (2) Favorable LongFavorable Long-- Term CharterTerm Charter--in Contracts in Contracts ( )( )
Established reputation and strong operating history allow for favorable charter contract terms and rates
$32,562
$27,953$32,500
Strong relationships allow for attractive charter-in rates with no capital outlay, low breakeven
Navios insured for entirety of contracted chartered-out / charter-in spread $10,079
$11,537$10,000
$17,500
$25,000$/
Day
(1) Source: Drewry Shipping Consultants 2009.(2) Excludes Kleimar controlled vessels.
$2,500
$ ,
2010 2011Average Charter-out rate Average Charter-in rate 19

Navios Maritime Partners

Navios Partners Ownership Structurep
100% Membership Interest
Common Unitholders Common Unitholders (1)(1)Navios Maritime Holdings Inc.Navios Maritime Holdings Inc.NYSE: NMNYSE: NM
100% Membership Interest
64.8% Limited Partner Interest33.2% Limited Partner Interest
Navios GP L.L.C.Navios GP L.L.C.(General Partner)(General Partner)
2.0% General Partner InterestIncentive Distribution Rights
Navios Maritime Partners L.P.NYSE: NMM
100% Membership Interest
Navios Maritime Operating L L CNavios Maritime Operating L L C
13 Drybulk Vessels2 Capesize, 10 Panamax and 1 Ultra Handymax drybulk carriers
Navios Maritime Operating L.L.C.Navios Maritime Operating L.L.C.
(1) Refers to publicly traded common units and includes approx. 1.3% of common units purchased by a corporation owned by Angeliki Frangou 21

NM ownership in Navios Partnerso e s p a os a t e s
Market ValueMarch 18, 2010 13.7 million units (35.2% ownership) $219.9 millionDecember 31 2009 12 4 million units (37 0% ownership) $169 0 million
(1,2)
December 31, 2009 12.4 million units (37.0% ownership) $169.0 millionDecember 31, 2008 11.2 million units (51.6% ownership) $ 79.9 millionNovember 12, 2007 (IPO) 7.9 million units (43.2% ownership) $158.0 million
Cash DistributionsFY 2010E $20.8 million (based on announced distribution policy)FY 2009 $18.1 millionFY 2008 $11.9 million
MLP UNITS NAVIOS UNITS MLP UNITS NAVIOS UNITS
December 31, 2008 March 18, 2010Units
MLP UNITS NAVIOS UNITS MLP UNITS NAVIOS UNITSCOMMON 13,631,415.00 3,131,415.00 14.44% 29,491,034.00 4,305,634.00 11.08%SUBORDINATED 7,621,843.00 7,621,843.00 35.14% 7,621,843.00 7,621,843.00 19.61%Subordinated series a units 1,000,000.00 1,000,000.00 2.57%GP 433,740.00 433,740.00 2.00% 753,851.00 753,851.00 1.94%TOTAL 21,686,998.00 11,186,998.00 51.58% 38,866,728.00 13,681,328.00 35.20%
22
(1) Market values exclude 1.0 million subordinated units issued to NM to release NMM from the obligation to acquire Navios Bonavis(2) Book value on NM’s Balance Sheet: $85.6 million (March 18, 2010)

Navios South American Logistics

Navios South American LogisticsNavios South American Logistics
Navios Maritime Holdings Inc.
Navios South American Logistics Inc(Marshall Islands)
Barge and Cabotage Business Port Terminal Operations
• 233 barges & vessels• Dry barges• Oil barges• LPG barges• Pushboats
F i d t t k l d i
Bulk Storage and Transfer BulkTerminal – Nueva Palmira –Uruguay (tax free zone)New Silo operational in August, 2009
• Four ocean going product tankers employed in cabotage business
Drying and conditioning facility under construction
Fuel Terminal - San Antonio Port –Paraguay
New storage tank under construction
24
construction

Fleet Expansion Since Creation of NSAL January 2008 FleetFleet Expansion Since Creation of NSAL• Barge Fleet expansion:
– Acquisition of six convoys • Three & five year agreements with two major commodity
producers • Started operations in Q4 2008
13 pushboats
55 dry barges
28 oil barges• Started operations in Q4 2008
• Cabotage fleet expansion:– Malva H:
• Delivered in Q1 2008
3 LPG barges
2 self-propelled barges
1 small oil tanker
4 i l• Product Oil Tanker, built in 2007, 9,947 dwt • Chartered out since delivery for minimum four years (plus
charterer’s option to extend for two years) – Estefania H:
• Delivered in Q3 2008
4 service vessels
December 2009 Fleet
20 pushboatsDelivered in Q3 2008• Product Oil Tanker, built in 2008, 12,000 dwt • Employed in the Spot Market
– Makenita H: • Delivered in Q2 2009
Product Oil Tanker built in 2009 17 000 dwt
p
157 dry barges
44 oil barges
3 LPG barges
2 lf ll d b• Product Oil Tanker, built in 2009, 17,000 dwt • Chartered out since delivery for three years
– Sara H: • To be delivered into cabotage business in Q1 2010• Product Oil Tanker, built 2010, 9,000 dwt
2 self-propelled barges
2 small oil tankers
3 handysize tanker
2 docking platforms
2525
• Chartered out since delivery for minimum 3 years (plus charterer's option to extend for another 3)
Navios Logistics controls a fleet of 233 barges and vessels transporting wet and dry cargo

Navios Logistics: Earnings Highlights a os og st cs a gs g g tsFourth Quarter and Year ended December 31, 2009
Three months ended Three months ended
(in USD ’000)
Three months ended
Dec 31, 2009
Three months ended
Dec 31, 2008 Y-O-Y Variance
Revenue 35,109 27,232 28.9%
EBITDA 3,760 3,170 18.6%
Net loss (3,145) (4,107) 33.2%
Year ended Dec 31, 2009
Year ended Dec 31, 2008 Y-O-Y Variance
R 138 890 107 778 28 9%Revenue 138,890 107,778 28.9%
EBITDA 29,598 26,959 9.8%
Net income 5,351 3,427 56.1%
26

Navios Logistics: 2009 Balance Sheet Highlightsg g gSelected Balance Sheet Data (in USD ’000)
December 31, 2009 December 31, 2008
Cash & cash equivalents 26,927 11,516 Restricted Cash 1,674 1,050 Accounts Receivable 15,578 13,864
Vessels port terminal and other fixed assets, net 265,850 250,237 Total Assets 504,472 470,531 Current portion of long term debt 5,829 3,137 Long term debt, net of current portion 114,564 78,191 Noncontrolling Interest 35 975 31 512Noncontrolling Interest 35,975 31,512 Stockholders Equity (1) 293,559 288,209
Book Capitalization (1) 413,952 369,537 Net Debt / Book Capitalization 22.2% 18.6%Liquidity 28,601 12,566
(1) Excludes noncontrolling interest.
27

Navios Logistics: EBITDA Breakdown by Business SegmentsNavios Logistics: EBITDA Breakdown by Business Segments
(in USD millions) FY 2007 (1) FY 2008 FY 2009
Barges & Cabotage Business $15.6 $21.0 $15.9
P t T i l O tiPort Terminal Operations:
CNSA (Dry Terminal in Uruguay) $4.7 $5.0 $10.2
Petrosan (Liquid Terminal in Paraguay) $0.8 $1.0 $3.5
Total Port Terminal Operations $5.5 $6.0 $13.7
Total EBITDA $21 1 $27 0 $29 6Total EBITDA $21.1 $27.0 $29.6
2828(1) Pro forma 2007 EBITDA contribution.

Average Water Levels for the Period 1994-2009Average Water Levels for the Period 1994 2009
29Source: Paraguayan Coast Guard

CNSA (Dry Terminal Operations in Uruguay)CNSA (Dry Terminal Operations in Uruguay)Key Operating Metrics
Average Revenue/Ton (USD) Average Revenue/Ton (USD) % Contracted Silo Space % Contracted Silo Space Silo space (in ‘000 tons) Silo space (in ‘000 tons)
4
5
6
708090
100
300
350
400
1
2
3
4
102030405060
50
100
150
200
250
0
2008 2009 2010 2011
010
2009 2010 2011 2012
Silo Space Contracts StrategySilo Space Contracts Strategy
0
2008 2009 2010 2011
Contracted revenueContracted revenue Top contractsTop contracts
• 2010: $ 8.8 million• 2011: $ 9.3 million
• Archer Daniels Midland • Louis Dreyfus • Cargill • Vicentín
• High silo space rotation • Steady cash flow• Downside protection in
challenging markets
30
• Bungechallenging markets

PETROSAN (Liquid Terminal in Paraguay)
Storage: Annual tank capacityStorage: Annual tank capacity(in 000 cubic meters) (in 000 cubic meters)
( q g y)Key Operating Metrics
Storage: Average Revenues/Cubic meters Storage: Average Revenues/Cubic meters (in USD) (in USD)
440
450
460
5 006.007.008.009.00
400
410
420
430
2008 2009 2010 2011-
1.002.003.004.005.00
2008 2009 2010 2011
Top contractsTop contracts
• Esso Standard Paraguay S.R.L.• 2009 spot sales of fuel = 52,000 m3
Additional Revenue: Spot Fuel SalesAdditional Revenue: Spot Fuel Sales
• Petrobras• Petrosur• Trafigura Group
• 2010 spot sales of fuel = 62,500 m3
31

Navios Maritime Acquisition Corp

Navios Maritime Acquisition Corporationa os a t e cqu s t o Co po at o
• Closed on July 1, 2008
$• Net proceeds for acquisition estimated at approximately $240.0 million
• Initial Business Consummation: within 24 months with possibility to extend to up to 36 months provided that there is a letter of intent, agreement in principle or definite agreement subject to shareholders’ approval
• Units trading on NYSE (NYSE: NNA.U)– Common shares trade on NYSE under the symbol NNA– Warrants trade on NYSE under the symbol NNA WS
• 19% ownership position for NM
• Significant return on investment potential to NM– $7.6 million initial risk investment in warrants
33

Industry Overview

Baltic Exchange Dry Index* 2002 – YTDg yBDI 2002 up-to-date
BDI October 2008 up-to-date
* As of March 22, 2010.35

World Dry Bulk Trade 1980–2009 F t U ido d y u ade 980 009
3,500
China admitted to the WTO
Future Upside:
India
2,500
3,000
2 8%2 8%
4.1%4.1%
1 500
2,000
(Mill
ion
Tons
)
1.1%1.1%2.8%2.8%
1,000
1,500
Trad
e
0
500
1980 1984 1988 1992 1996 2000 2004 2008
Source: Drewry Shipping Consultants Ltd. (2009 estimates, Jan 2010)
1980 1984 1988 1992 1996 2000 2004 2008
36

GDP Growth Supported by Emerging EconomiesS pp y g g
4.7 3.85.9 6.1
2 1
6.04.85.1 5.04.1
6.37.5 7.1 7.9 8.3
3 54.5 5.1 5.2
3 0 3 94 03 7 3.62 8
4.92 64 0
6.08.0
10.0
-2.1
2.1
2.5
3.5 2.23.5 3.0
-0.8
3.94.0
2.53.3
3.7 2.83.0
0.5
2.72.63.21.91.6
2.8 3.0
2.6
3.53.5 4.0
1.2
4 0-2.00.02.04.0
6h
-3.2-4.01995 1996 1997 1998 1999 2000 2001 2002 2003 2004 2005 2006 2007 2008 2009 2010
Emerging and developing economies World Advanced economies
123456
ual G
DP
Gro
wt
-2-10
2001 2002 2003 2004 2005 2006 2007 2008 2009 2010
% A
nnu
Actual Oct-08 Nov-08 Jan-09 Mar-09 Jul-09 Sep-09 Jan-10
Changing economic growth expectations: The IMF recently increased (January 2010) its forecast for 2010 World growth to 3.9% from 3.1%
p
Source: IMF, January 26, 2010 37

Changing Trade FlowsChanging Trade Flows
50 50
China becomes net coal importer
20
30
40
ons
10
20
30
40
mill
-10
0
10
Qtr
1Q
tr2
Qtr
3Q
tr4
Qtr
1Q
tr2
Qtr
3Q
tr4
Qtr
1Q
tr2
Qtr
3Q
tr4
Qtr
1Q
tr2
Qtr
3Q
tr4
Qtr
1Q
tr2
Qtr
3Q
tr4
Qtr
1Q
tr2
Qtr
3Q
tr4
Qtr
1Q
tr2
Qtr
3Q
tr4
Qtr
1Q
tr2
Qtr
3Q
tr4
Qtr
1Q
tr2
Qtr
3Q
tr4
Qtr
1Q
tr2
Qtr
3Q
tr4m
illio
n to
-20
-10
0
10
lion tons
-30
-20 2000 2001 2002 2003 2004 2005 2006 2007 2008 2009
-40
-30
Imports Exports Net
As China exports less coal, other Pacific Rim countries source from farther afield locations As China exports less coal, other Pacific Rim countries source from farther afield locations increasing tonincreasing ton--mile requirementsmile requirements
Source: National Bureau of Statistics of China/ Mysteel. 38
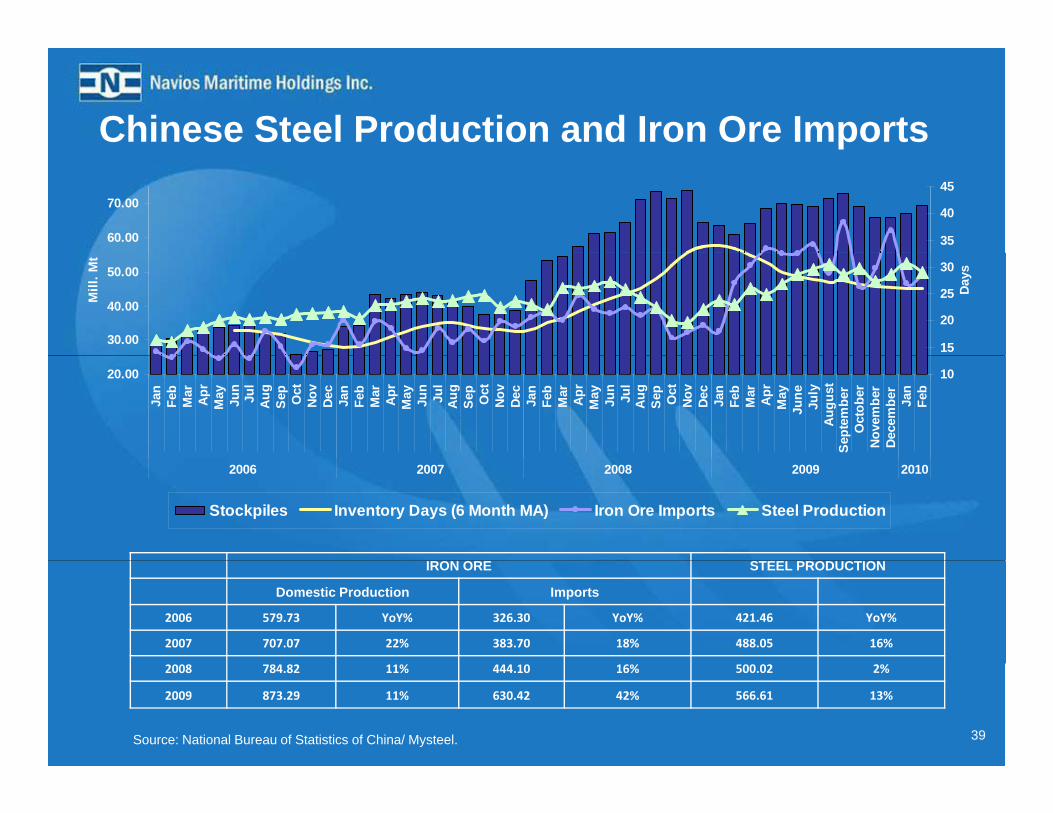
Chinese Steel Production and Iron Ore Imports
60.00
70.00
35
40
45
30.00
40.00
50.00
Mill
. Mt
15
20
25
30
Days
20.00
Jan
Feb
Mar
Apr
May Jun
Jul
Aug
Sep Oct
Nov
Dec
Jan
Feb
Mar
Apr
May Jun
Jul
Aug
Sep Oct
Nov
Dec
Jan
Feb
Mar
Apr
May Jun
Jul
Aug
Sep Oct
Nov
Dec
Jan
Feb
Mar
Apr
May
June
July
Aug
ust
Sep
tem
ber
Oct
ober
Nov
embe
rD
ecem
ber
Jan
Feb
10
2006 2007 2008 2009 2010
Stockpiles Inventory Days (6 Month MA) Iron Ore Imports Steel Production
IRON ORE STEEL PRODUCTION
Domestic Production Imports
2006 579.73 YoY% 326.30 YoY% 421.46 YoY%
2007 707.07 22% 383.70 18% 488.05 16%
Source: National Bureau of Statistics of China/ Mysteel.
2008 784.82 11% 444.10 16% 500.02 2%
2009 873.29 11% 630.42 42% 566.61 13%
39
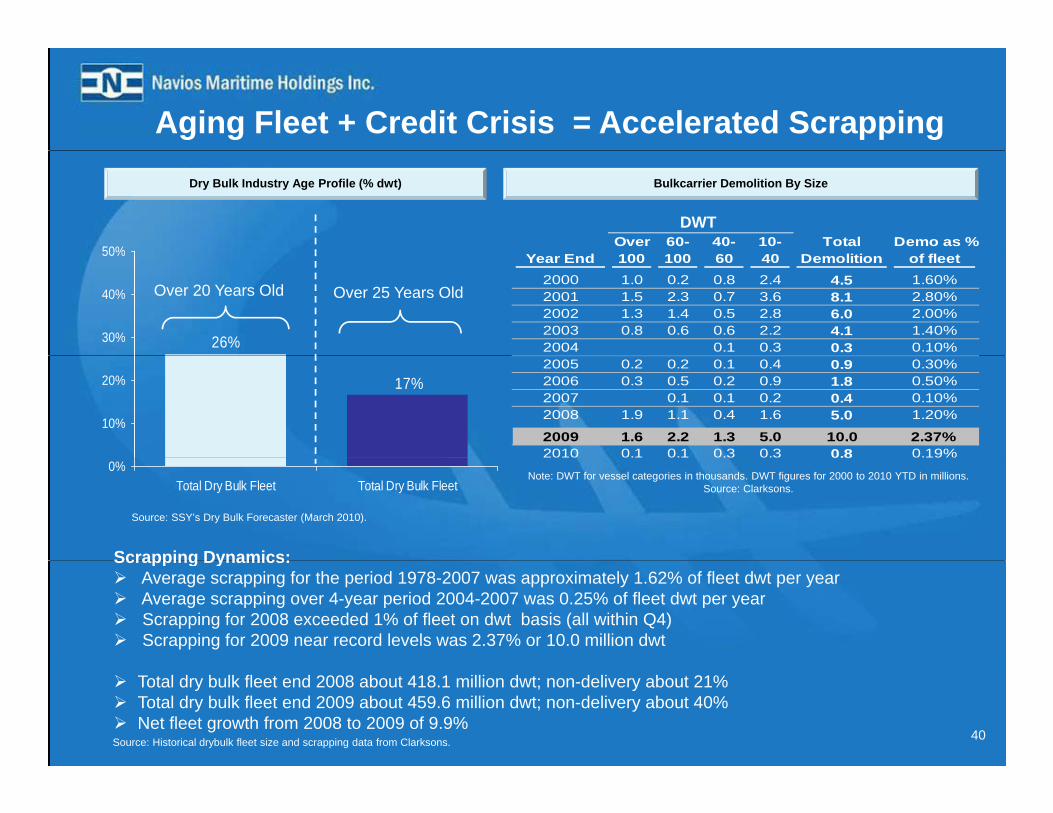
Aging Fleet + Credit Crisis = Accelerated Scrapping
50%
Dry Bulk Industry Age Profile (% dwt)
Over 60- 40- 10- Total Demo as %
Bulkcarrier Demolition By Size
DWT
26%30%
40%
50% Year End 100 100 60 40 Demolition of fleet2000 1.0 0.2 0.8 2.4 4.5 1.60%2001 1.5 2.3 0.7 3.6 8.1 2.80%2002 1.3 1.4 0.5 2.8 6.0 2.00%2003 0.8 0.6 0.6 2.2 4.1 1.40%2004 0.1 0.3 0.3 0.10%
Over 20 Years Old Over 25 Years Old
17%
10%
20%2005 0.2 0.2 0.1 0.4 0.9 0.30%2006 0.3 0.5 0.2 0.9 1.8 0.50%2007 0.1 0.1 0.2 0.4 0.10%2008 1.9 1.1 0.4 1.6 5.0 1.20%
2009 1.6 2.2 1.3 5.0 10.0 2.37%2010 0.1 0.1 0.3 0.3 0.8 0.19%
Scrapping Dynamics:
0%Total Dry Bulk Fleet Total Dry Bulk Fleet
0 8
Source: SSY’s Dry Bulk Forecaster (March 2010).
Note: DWT for vessel categories in thousands. DWT figures for 2000 to 2010 YTD in millions.Source: Clarksons.
Scrapping Dynamics:Average scrapping for the period 1978-2007 was approximately 1.62% of fleet dwt per yearAverage scrapping over 4-year period 2004-2007 was 0.25% of fleet dwt per yearScrapping for 2008 exceeded 1% of fleet on dwt basis (all within Q4)Scrapping for 2009 near record levels was 2.37% or 10.0 million dwt
Total dry bulk fleet end 2008 about 418.1 million dwt; non-delivery about 21%Total dry bulk fleet end 2009 about 459.6 million dwt; non-delivery about 40%Net fleet growth from 2008 to 2009 of 9.9%
Source: Historical drybulk fleet size and scrapping data from Clarksons. 40

Orderbook Projections• Non-deliveries for 2009 = 40% (29.8 m dwt)
• Non-deliveries for 2010 projected at 49% (61.4 m dwt)
112.00
126.50
120.00
140.00Orderbook 2009Orderbook 2010
71.27
82.15
112.00
80.00
100.00
on D
WT
EXPECTEDSLIPPAGE
49%
55.20
42.50
20.00
40.00
60.00Mill
io
Actual Deliveries
0.00as of January 2008 as of January 2009 as of January 2010
Source: Clarksons’
41

Dry Bulk Orderbook: Actual and projected non-deliveries
Non-deliveries for 2009:140 60%
m. DWT % Non Deliveries
40% by dwt (71.3 dwt expected, 42.5 dwt delivered) 45% by number of vessels (962 newbuilds expected, 531 actual 100
120
40%
50%
deliveries) 2010 deliveries on order = 126.5 m dwt (27.5% of fleet)2010 expected deliveries = 65.1 m dwt
60
80
30%
40%
0 0 e pected de e es 65 d tNon-deliveries expected to continue primarily due to more conservative lending requirementsRe-negotiations commonly result in
20
40
10%
20%
Re-negotiations commonly result in delivery postponements and cancellations0
2007 2008 2009 20100%
Orderbook Deliveries % Non Deliveries
Source: Scheduled and actual deliveries data from Clarksons’ (Mar, 2010).
42

Q4 and YE 2009 Financial Results

Fourth Quarter and Year End 2009 Earnings HighlightsTh th d d D b Th th d d D b($ ‘000’ except per share data) Three months ended December
31, 2009Three months ended December
31, 2008 Y-O-Y Variance
Revenue 148,730 214,175 (30.6%)
EBITDA 55,284 24,350 127.0%
Adjusted EBITDA 51 289(1) 25 721(2) 99 4%Adjusted EBITDA 51,289( ) 25,721( ) 99.4%
Net income (loss) 12,486 (5,563) 324.4%
Adjusted Net income (loss) 10,517(1) (4,192)(2) 350.9%
Basic EPS 0.12 (0.06) 300.0%
Adjusted Basic EPS 0 11(1) (0 04)(2) 375 0%Adjusted Basic EPS 0.11( ) (0.04)( ) 375.0%
($ ‘000’ except per share data) Year ended December 31, 2009 Year ended December 31, 2008Y-O-Y Variance
Revenue 598,676 1,246,062 (52.0%)
EBITDA 206,801 165,478 25.0%
Adjusted EBITDA 193,712(3) 139,161(4) 39.2%
Net income 67,934 118,527 (42.7%)
Adjusted Net income 56,871(3) 34,961(4) 62.7%
Basic EPS 0.68 1.14 (40.4%)
Adjusted Basic EPS 0.57(3) 0.34(4) 67.6%
(1) Adjusted EBITDA for the three months ended December 31, 2009, excludes $4.0 million gain on sale of assets. Adjusted Net income and Adjusted Basic EPS for the three months ended December 31, 2009 exclude the above and $2.0 million write-off of deferred finance fees.
(2) Adjusted EBITDA, Adjusted Net income and Adjusted Basic EPS for the three months ended December 31, 2008 exclude a $1.5 million cancellation fee and $0.1 million
44
( ) j , j j , $ $gain on sale of assets.
(3) Adjusted EBITDA for the year ended December 31, 2009, excludes $20.8 million gain on sale of assets, $6.1 million non-cash compensation income received from Navios Partners and $13.8 million MtM losses on available for sale securities. Adjusted Net Income and Adjusted Basic EPS for the year ended December 31, 2009 exclude the above and $2.0 million write-off of deferred finance fees.
(4) Adjusted EBITDA for the year ended December 31, 2008 excludes $27.8 million gain on sale of assets and $1.5 million cancellation fee. Adjusted Net Income and Adjusted Basic EPS for the year ended December 31, 2009 exclude the above and $57.2 million of write-off of deferred taxes.

Strong Balance SheetgSelected Balance Sheet Data (in $'000)
December 31, 2009 December 31, 2008
Cash & cash equivalents 173,933 133,624Restricted Cash 107,158 17,858Other current assets 146,589 353,927Deposits for vessels acquisitions 344,515 404,096p q , ,
Vessels, port terminal and other fixed assets, net 1,577,741 737,094Total Assets 2,935,182 2,253,624Current portion of long term debt 59,804 15,177Other current liabilities 136,276 256,355Senior and ship mortgage notes, net of discount 693,049 298,344Long term debt, net of current portion 869,853 574,194Stockholders Equity (1) 925,480 805,820
Book Capitalization (1) 2,548,186 1,693,535Net Debt / Book Capitalization 52.6% 42.6%
Total Liquidity (2) 382 066 173 815
45
Total Liquidity (2) 382,066 173,815
(1) Excludes noncontrolling interest.(2) Includes undrawn portion of revolving credit facilities.

Returning Capital to Shareholdersetu g Cap ta to S a e o de sDividend Policy:
Q4 2009 Di t ib ti $0 06 h• Q4 2009 Distribution: $0.06 per share– Record date: March 16, 2010– Payment date: April 8, 2010– Shares outstanding on December 31, 2009: 100,874,199Shares outstanding on December 31, 2009: 100,874,199– Total cost = $6.1 million– Annual run rate: $24.2 million
46

Summaryy• One of the largest dry bulk operators• Young fleet of 42 active vessels — average age of 4.5 years, 4.3 million dwt• 32 owned ships
Large, high quality, modern fleet
• Fleet has grown from six to 32 owned vessels and currently has 59 controlled(1) vessels
• Future growth through exercise of 12 purchase options, corporate acquisitions and chartered in vessels
p
Proven ability to grow fleet
• 89.2% of revenue days in 2010 • 65.0% of revenue days in 2011• 55.8% of revenue days in 2012 • 46 6% of revenue days in 2013
acquisitions and chartered-in vessels
Operating visibility through contracted
revenues (2)
• Senior management team has average industry experience of 20+ years
• Operating costs lower than industry average• In-house technical and commercial management
• 46.6% of revenue days in 2013
Low cost, efficient operations
Senior management team has average industry experience of 20+ years• Strategic relationships with shipyards, commercial banks and other industry
players that enable innovative financing for vessel acquisitions
Seasoned management team
• Navios Maritime Partners• Navios South American Logistics
Multiple avenues of
47(1) Includes 17 new deliveries. (2) Includes Navios Holdings’ core fleet
• Navios South American Logistics• Navios Maritime Acquisition
growth

www.navios.comwww.navios.com

Appendix

Core Fleet: Navios Owned Fleet (Panamax – Ul. Handymax)Co e eet a os O ed eet ( a a a U a dy a )Vessels Type Built DWT Charter Rate ($)(1) Expiration Date (2)
Navios Ionian Ultra Handymax 2000 52,067 11,970 04/07/2011Navios Horizon Ultra Handymax 2001 50,346 36,100 08/24/2011Navios Herakles Ultra Handymax 2001 52 061 11 400 03/30/2010Navios Herakles Ultra Handymax 2001 52,061 11,400 03/30/2010Navios Achilles Ultra Handymax 2001 52,063 26,864
13,60911/17/201312/17/2013
Navios Meridian Ultra Handymax 2002 50,316 23,700 10/08/2012Navios Mercator Ultra Handymax 2002 53,553 22,800
31,35008/01/201102/20/2015,
Navios Vector (3) Ultra Handymax 2002 50,296 9,975 (4) 10/17/2010Navios Arc Ultra Handymax 2003 53,514 10,450 02/26/2011Navios Hios Ultra Handymax 2003 55,180 12,588 06/19/2010Navios Kypros Ultra Handymax 2003 55,222 24,063
34,02403/31/201001/28/2011
20,685 01/28/2014Navios Ulysses Ultra Handymax 2007 55,728 31,281 10/12/2013Navios Vega Ultra Handymax 2009 58,792 12,350 02/18/2011Navios Celestial Ultra Handymax 2009 58,063 8,075 12/24/2009
17,550 1/24/2012Navios Magellan Panamax 2000 74 333 21 850 03/06/2010Navios Magellan Panamax 2000 74,333 21,850 03/06/2010Navios Star Panamax 2002 76,662 21,375
19,00011/23/200912/05/2010
Navios Orbiter Panamax 2004 76,602 32,38538,052
02/28/201004/01/2014
Total Total -- 16 vessels 924,79816 vessels 924,798
(1) Daily rate net of commissions(2) Expected Redelivery basis midpoint of full redelivery period(3) Expected delivery in Q2 2010. Currently chartered-in vessel(4) Charterer has right to extend period at similar day rate
50

Core Fleet: Navios Owned Fleet (Capesize)Co e eet a os O ed eet (Capes e)Vessels Type Built DWT Charter Rate ($)(1) Expiration Date (2)
Navios Bonavis Capesize 2009 180,022 47,400 06/29/2014Navios Pollux Capesize 2009 180,727 42,250 07/24/2019
Navios Happiness Capesize 2009 180,022 55,100 07/23/2014Navios Lumen Capesize 2009 180,661 37,500
39,83012/10/201112/10/2013
39,330(3) 12/09/2017Navios Antares Capesize 2010 169,059 38,000 01/19/2015Navios Antares Capesize 2010 169,059 38,000
47,500(4)
01/19/201501/19/2018
Navios Stellar Capesize 2009 169,001 35,874 (5) 12/22/2016Navios Phoenix Capesize 2009 180,242 36,575 12/20/2010 (6)
TotalTotal -- 7 vessels 1 239 7347 vessels 1 239 734Total Total -- 7 vessels 1,239,7347 vessels 1,239,734
(1) Daily rate net of commissions(2) Estimated redelivery basis midpoint of full redelivery period(2) Estimated redelivery basis midpoint of full redelivery period(3) Net daily charter rate = $37,500 for years 1 and 2, $39,830 for years 3 and 4, $39,330 for years 5,6,7 + option (Navios) year 8. Optional year included in the exhibit above.
Profit sharing = 100% to Navios until the net daily rate of $44,850 and 50%/50% thereafter4) Net daily charter rate = $38,000 until expiration of five-year charter; $47,500 net daily rate thereafter for three one year (Navios) options. Optional years included in the exhibit
above. Profit sharing = 60% (Navios) / 40% (charterer) above $40,000 gross for years 1 & 2; 65% (Navios) / 35% (charterer) for years 3,4 and 5 above $40,000 gross & 50%/50% above $50,000 gross for the three one year (Navios) options
(5) Amount represents daily rate of insurance proceeds following the default of the original charterer (6) Subject also to COA of $45,500 for the remaining period until Q1 2015
51

Core Fleet: Chartered-in Fleet (Active)Core Fleet: Chartered in Fleet (Active)• 8 Chartered-in vessels • 2 purchase options• 2010 weighted average charter-in rate = $10,079
Vessels Type Built DWT Purchase Option Charter-out Rate (1) ($) Expiration Date (2)
Navios Astra Ultra Handymax
2006 53,468 Yes 14,012 10/15/2010
Navios Primavera Ultra 2007 53 464 Yes 20 046 05/09/2010Navios Primavera Ultra Handymax
2007 53,464 Yes 20,046 05/09/2010
Navios Armonia Ultra Handymax
2008 55,100 No 23,700 06/07/2013
Navios Cielo Panamax 2003 75,834 No 14,773 06/12/2010
Navios Orion Panamax 2005 76,602 No 49,400 12/14/2012, ,
Navios Titan Panamax 2005 82,936 No 27,100 11/24/2010Navios Altair Panamax 2006 83,001 No 19,238 10/19/2010
Navios Esperanza Panamax 2007 75,200 No 14,513 02/19/2013
Total Total –– 8 vessels8 vessels 555,605555,605
(1) Daily Charter-out rate net of commissions(2) Assumed midpoint of redelivery by charterers
52

Core Fleet: Kleimar Controlled Fleet ProfileCore Fleet: Kleimar Controlled Fleet Profile
Vessels Type % Owned DWT Built
Owned VesselsOwned Vessels
LongLong--Term CharteredTerm Chartered--in Vesselsin Vessels
Navios Asteriks Panamax 100% 76,801 2005Vanessa Product Tanker 100% 19,078 2002
Vessels Type DWT Built Delivery Expiration(1) Purchase Option
Beaufiks Capesize 180,181 2004 06/24/2004 06/2017 Yes Rubena N Capesize 203,233 2006 01/11/2006 01/2018 SA Fortius Capesize 171,595 2001 03/06/2003 03/2010 Belisland Panamax 76,602 2003 11/09/2005 12/2009e s a d a a a 6,60 003 /09/ 005 / 009Golden Heiwa Panamax 76,662 2007 03/14/2007 03/2017 C Utopia Capesize 174,000 2007 11/24/2007 11/2010 Torm Antwerp Panamax 75,250 2008 01/09/2008 03/2012 SC Lotta Capesize 170,500 2009 02/26/2009 12/2013 Pheonix Beauty Capesize 169,150 2010 02/19//2010 11/2012
Total – 11 Vessels (2) 1,653,973
Kleimar TBN Capesize 176,800 2010 04/2010 04/2013 Kleimar TBN Capesize 180,000 2012 07/2012 07/2025 Yes
(1) Assumes vessels redeliver to owners post expiration of extension period(2) Includes new build vessels to be delivered
53

Navios Vessels (to be Delivered)( )Owned Vessels on OrderOwned Vessels on Order
Vessels Type Anticipated Delivery Date DWTNavios Fulvia (1) Capesize 08/2010 180,000pNavios Melodia (2) Capesize 07/2010 180,000Navios Buena Ventura (3) Capesize 09/2010 180,000Navios Luz (4) Capesize 10/2010 180,000Navios Etoile (5) Capesize 10/2010 180,000Navios Bonheur (6) Capesize 11/2010 180,000Navios TBN (7) Capesize 03/2011 180,000Navios TBN Capesize 03/2011 180,000
Total Total –– 7 Vessels 7 Vessels 1,260,0001,260,000
(1) Chartered-out at $50,588 net per day for five years commencing on delivery(2) Chartered-out at $29,356 net per day for 12 years commencing on delivery(3) Chartered-out at $29,356 net per day for ten years commencing on delivery(4) Chartered-out at $29,356 net per day for ten years commencing on delivery(5) Chartered-out at $29,356 net per day for ten years commencing on delivery(6) Chartered-out at $29,356 net per day for 12 years commencing on delivery(7) Chartered-out at $27,431 net per day for 12 years commencing on delivery
Vessels Type Anticipated Delivery Date Purchase Option DWT
LongLong--term Charteredterm Chartered--in Vessels on Orderin Vessels on Order
Navios TBN Handysize 02/2011 Yes (50%) 35,000Navios TBN Handysize 04/2011 Yes (50%) 35,000Navios TBN Ultra-Handymax 03/2012 Yes 61,000Navios TBN Ultra-Handymax 08/2013 Yes 61,000Navios TBN Panamax 09/2011 Yes 80,000N i TBN P 01/2013 Y 82 100Navios TBN Panamax 01/2013 Yes 82,100Navios TBN Capesize 09/2011 Yes 180,200Navios TBN Capesize 06/2013 Yes 180,000
Total Total –– 8 Vessels8 Vessels 714,300714,300 54

www.navios.comwww.navios.com