nwl stock report - amazon s3s3.amazonaws.com/zanran_storage/ · industry performance ... leadership...
TRANSCRIPT

Adrian Chenault – Reid Jonkers – Stephen Mueller
Recommendation: Buy
COMPANY DATA: STOCK DATA: VALUATION DATA: Ticker: NWL Most Recent Price: $31.37 Beta: 0.948 (Bloomberg) Exchange: NYSE 52-Wk Range: $24.04-$32.00 2006 EPS: $1.40 Sector: Consumer Goods Dividend Yield: 2.70% P/E (LTM): 22.69 Industry: Housewares & Market Cap: $8.80 billion PEG: 1.82 Accessories Shares Out: 277.60 million P/B: 4.61 P/S: 1.42 Call Summary – Purchase Full Position: We recommend a buy on Newell Rubbermaid based upon a strong market position and the company’s focus upon generating shareholder returns. • Track record of strong strategic acquisitions and divestitures • Increased focus on building out brands and stimulating consumer demand • Increased efficiencies in product manufacturing, resulting in margin expansion Furthermore, based upon both relative valuation and a discounted cash flow model, Newell Rubbermaid’s shares are attractive at current levels. We recommend a full position of Newell Rubbermaid, or 1,600 shares.

2
TABLE OF CONTENTS
Section 1: Company Overview…………………………………………………………………3
Segment Information ………………………………………………………………………..3
Strategic Initiatives ………………………………………………………………………….5
Growth Strategy ……………………………………………………………………………..7
Operation and Sales Risk …………………………………………………………………..8
Management …………………………………………………………………………………9
Analysis of Recent Performance …………………………………………………………11
Section 2: Industry Analysis …………………………………………………………………..12
Discussion of Competitors ………………………………………………………………..12
Industry Performance ……………………………………………………………………..14
Section 3: Financial Ratio Analysis ………………………………………………………….16
Section 4: Porter’s Five Forces Analysis ……………………………………………………20
Section 5: Valuation……………………………………………………………………………21
Relative Valuation ………………………………………………………………………....21
Pro Forma Income Statement ……………………………………………………………23
Discounted Cash Flow Valuation ………………………………………………………...24
Section 6: Investment Summary and Recommendation …………………………………..26
Appendices ……………………………………………………………………………………..27
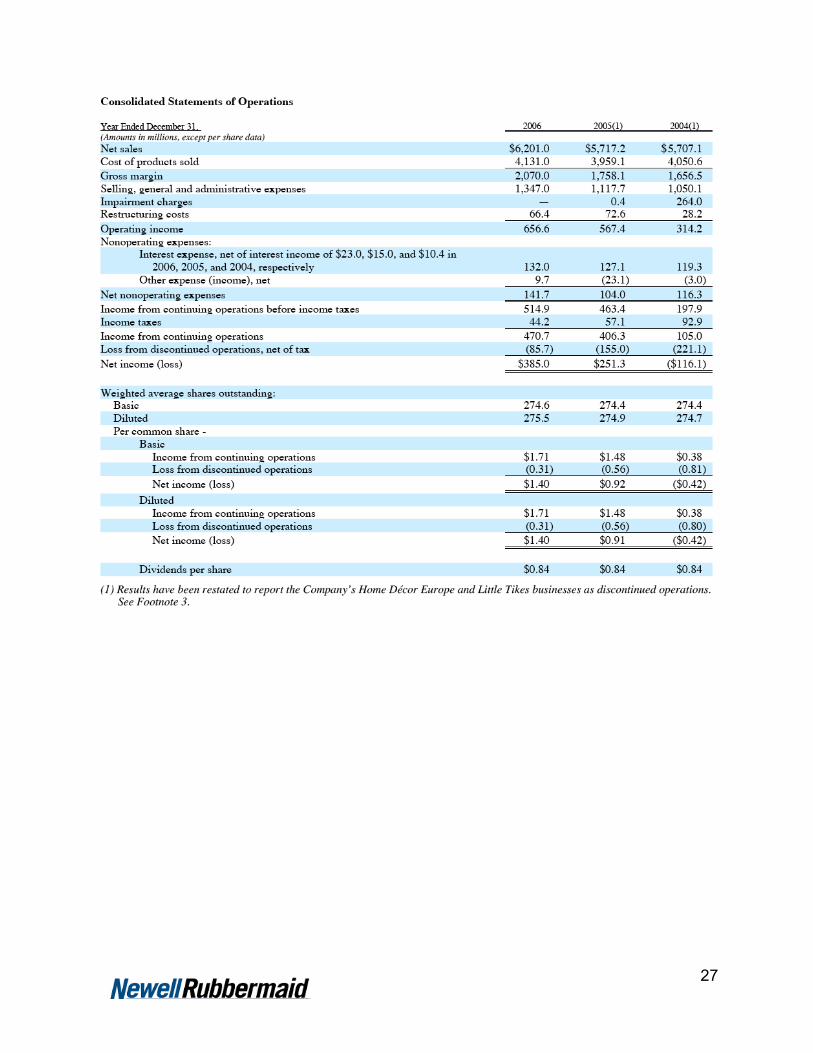
Income Statement …………………………………………………………………………27
Balance Sheet ……………………………………………………………………………..28
Cash Flow Statement ……………………………………………………………………..29
ValueLine Report ………………………………………………………………………….30

3
Section 1: Company Overview
Segment Information NWL operates in four major segments: Cleaning & Organization, Office Products, Tools & Hardware, and Home & Family.
2006 % of
Total 2005 % of
Total 2004 % of
Total Cleaning, Organization $1,995.7 32.2 $1,921.0 33.6 $1,993.4 34.9 Office Products 2,031.6 32.8 1,713.3 30.0 1,686.2 29.5 Tools & Hardware 1,262.2 20.3 1,260.3 22.0 1,218.7 21.4 Home & Family 911.5 14.7 822.6 14.4 808.8 14.2 Total Company 6,201.0 100.0 5,717.2 100.0 5,707.1 100.0 Office Products Office Products businesses represent approximately 30 percent of Newell Rubbermaid's sales. Divisions include Everyday Writing, Markers and Highlighters, Fine Writing, Labeling, Coloring and Office Organization. Well-known brands include Sharpie permanent markers, Paper Mate and Reynolds pens and pencils, EXPO dry erase markers, Sharpie Accent highlighters, DYMO label makers and printers, Waterman and Parker fine writing instruments, Prismacolor art supplies, Rolodex office organization and Liquid Paper correction products. The acquisition of DYMO in November 2005 marked the group's entry into the high-growth on-demand labeling market with a well-known brand and proven leader in new product development and intellectual property. DYMO is a global leader in on-demand labeling solutions for the home, office and jobsite. DYMO has strong market share across Europe, North America and Australia, making this a truly global brand with substantial opportunities for future growth.

4
Tools & Hardware This group offers an extensive collection of premium-quality products, including hand tools, power tool accessories, propane torches, manual paint applicators and cabinet and window hardware. Tools & Hardware represents approximately 22 percent of Newell Rubbermaid's annual sales. Business Units include IRWIN North America Power Tool Accessories, IRWIN North America Hand Tools, IRWIN Latin America, IRWIN Europe, IRWIN Asia Pacific, LENOX, and Amerock. IRWIN's extensive product collection includes MARATHON saw blades, QUICK-GRIP clamping tools, STRAIT-LINE marking and layout tools, SPEEDBOR and UNIBIT drill bits, VISE-GRIP locking tools, and IRWIN wrenches, tap and die sets and related accessories. With a growing presence in the do-it-yourself and home center channel, IRWIN continues to aggressively expand its product offering to drive top-line growth. LENOX is the preferred name in highly engineered hand tools and power tool accessories that offer unparalleled performance and extreme durability. BernzOmatic represents the most respected name in hand torches for plumbing applications and recently expanded into the outdoor heating market. Amerock is a leading supplier of cabinet and window hardware to the retail market and original equipment manufacturers, while Shur-Line delivers an extensive collection of paint applicators and accessories. Home & Family The most trusted names in premium kitchenware, infant and juvenile products and hair care are included in this group. This segment's product offering includes gourmet cookware, bakeware, cutlery, toys, car seats, strollers, highchairs, playards and hair care accessories. Home & Family represents approximately 14 percent of Newell Rubbermaid's annual sales. Leadership in the premium housewares market is built upon Calphalon's reputation for quality innovative cookware, cutlery and bakeware. Calphalon is committed to the research and development of revolutionary cooking surfaces, such as Calphalon One. The recent introduction of Katana Series cutlery delivers high-quality and exceptional sharpness through the use of a special Japanese steel. The Graco brand represents the highest commitment to quality and safety for juvenile products. From the Ouchless Brush Collection to the Revolving Fashion collection of accessories inspired by the latest trends in fashion, Goody is the brand of choice for stylish women. Goody StayPut Elastic bands are favorites among the growing population of active, athletic women.

5
Cleaning, Organization & Decor With some of the most recognized names in its categories, this segment provides high-quality, innovative solutions for home storage, indoor and outdoor organization, food storage, home decorating, and cleaning and refuse. Cleaning, Organization & Decor represents approximately 32 percent of Newell Rubbermaid's annual sales. Home Furnishings News recognizes the Rubbermaid brand as the Top Housewares brand. Rubbermaid Commercial is a leading supplier of highly engineered commercial solutions. Some of its recent innovations include the WaveBrake(tm) mop buckets that enhance productivity and the Microfiber cleaning tools that minimize the risk of cross contamination. Rubbermaid Foodservice is a market leader in home and commercial food preparation and storage. We continue to build upon our success in semi-disposable food storage with our TakeAlong and Collapsible containers. Rubbermaid Home Products is a leader in value-added home organization and storage. Newell Rubbermaid is aggressively pursuing innovation in garage organization and closet storage with our new FastTrack and Configurations lines. Levolor and Kirsch brands capture and deliver home decor trends to consumers.
Strategic Initiatives Create Consumer-Meaningful Brands The Company is moving from its historical focus on customer push marketing and excelling in manufacturing and distributing products, to a new focus on consumer pull marketing and creating competitive advantage through understanding our consumers, innovating to deliver great performance and value, investing in advertising and promotion to create demand and leveraging our brands in adjacent categories around the world. In 2006, the Company made incremental investments in strategic brand building, particularly on the Calphalon, Graco, Goody, LENOX, IRWIN, Sharpie ® and DYMO brands. The Company also initiated a consulting and training partnership with one of the largest worldwide creative and media agencies to create best-in-class branding capabilities across the Company. Leverage One Newell Rubbermaid The Company strives to benefit from the sharing of best practices and the reduction of costs achieved through horizontal integration and economies of scale. Centralization concentrates technical expertise in one location, making it easier to observe overall business trends and manage the Company’s businesses. In addition, the Company has recently created leadership positions to identify and drive synergies across business units. Finally, the Company is in the early stages of migrating multiple legacy systems and users to a common SAP global information platform, which we expect will enable the Company to integrate and manage its worldwide business and reporting process more efficiently.

6
Achieve Best Total Cost The Company’s objective is to reduce the cost of manufacturing, sourcing and supplying product on an ongoing basis, and to leverage the Company’s size and scale, in order to achieve a best total cost position in relevant product categories. The Company has also shifted a portion of its research and development focus to designing lower cost into future product initiatives. A key component of this strategy is the restructuring of the Company’s manufacturing and sourcing network to increase capacity utilization, increase the percentage of manufacturing located in low-cost countries, and achieve a balance of company-owned manufacturing and third party sourcing partners. In the third quarter of 2005, the Company announced a global initiative referred to as Project Acceleration aimed at strengthening and transforming the Company’s portfolio. Nurture 360º Innovation The Company has broadened its definition of innovation beyond product invention. The Company now defines innovation as the successful commercialization of invention. Innovation must be more than product development. Over the last two years, the Company launched a number of innovative new products, including the Sharpie MINI permanent marker; Irwin Speedbor MAX drill bits; the Irwin Quick-Grip XP one handed bar clamp; Lenox Pro Hose Air Acetylene kits; Rubbermaid Collapsibles food storage containers; Rubbermaid Commercial Microfiber cleaning tools and accessories and Wavebreak mop bucket; Calphalon One Infused Anodized, Calphalon One Nonstick and Contemporary Stainless lines of gourmet cookware and Katana Series cutlery line; Goody, Stay Put elastic bands and Ouchless brush collection and Graco Mosaic stroller and travel system and Safe Seat car seats. Divestiture Newell Rubbermaid believes that the business units remaining in their portfolio constitute core businesses; the Company will continue to review its businesses and product offerings and assess their strategic fit to identify any potential divestiture candidates. During 2006 and early 2007, the Company divested its European Cookware, Little Tikes and Home Décor Europe businesses. During 2005, the Company divested its Curver business. In 2004, the Company sold its U.S. picture frame business (Burnes), its Anchor Hocking glassware business, its Mirro cookware business, its Panex Brazilian low-end cookware business, its European picture frames business and its Little Tikes Commercial Play Systems business. In 2006, 2005 and 2004, the Company rationalized $60 million, $195 million and $165 million, respectively, in low-margin product sales, primarily in the former Cleaning & Organization segment. The Company’s decision to exit these low margin product lines is consistent with its strategy to focus on high margin, high potential opportunities that support the Company’s financial objectives.

7
Growth Strategy The Company’s growth strategy emphasizes internal growth and acquisitions. The Company is also increasingly focused on globalization. Internal Growth The Company focuses on internal growth principally by understanding consumers, demand creation through marketing, commercializing innovative new products, entering new domestic and international markets, adding new customers, cross-selling existing product lines to current customers and supporting its US-based customers’ international expansion. Internal growth is defined by the Company as growth from continuing businesses owned more than one year and immaterial acquisitions. Acquisition Strategy Strategic criteria for an acquisition include: the existence of consumer-meaningful brands that respond to differentiation and innovation, global categories, favorable customer and channel dynamics, strong margin and growth potential, focus on non-cyclical, semi-durable products, and synergies with our core categories and competencies. During 2005, the Company acquired DYMO, a global leader in designing, manufacturing and marketing on-demand labeling solutions, from Esselte AB. This acquisition strengthens the Company’s global leadership position in the Office Products segment by expanding and enhancing the Company’s product lines and customer base. See Footnote 2 of the Notes to the Consolidated Financial Statements for further information on acquisitions. Globalization The Company is expanding from a U.S.-centric business model to one that includes international growth as an increasing focus. As a result, the Company pursues selective international opportunities to further its internal growth and acquisition objectives. The Company had sales outside the U.S. of approximately 26%, 24%, and 24% of total sales in 2006, 2005, and 2004, respectively. Finally, the Company is in the early stages of migrating multiple legacy systems and users to a common SAP global information platform, which we expect will enable the Company to integrate and manage its worldwide business and reporting process more efficiently.

8
Operation and Sales Risk Raw Materials The Company has multiple foreign and domestic sources of supply for substantially all of its material requirements. The raw materials and various purchased components required for its products have generally been available in sufficient quantities. The Company’s product offerings require the purchase of resin, glass, corrugate and metals, including steel, stainless steel, zinc, aluminum and gold. The Company has experienced inflation in these raw materials and expects such inflation pressures to continue in 2007. The Company has reduced the volume of its resin purchases through product line rationalization and strategic divestitures. Seasonal Variations The Company’s sales and operating income in the first quarter are generally lower than any other quarter during the year, driven principally by reduced volume and the mix of products sold in the quarter. The Wal-Mart Factor Sales to Wal-Mart Stores, Inc. and subsidiaries amounted to approximately 12%, 13%, and 16% of consolidated net sales for the years ended December 31, 2006, 2005 and 2004, respectively, substantially across all segments. The sales to Wal-Mart constitute risk as Wal-Mart has a history of forcing low prices from its suppliers. With pricing pressure and rising raw materials, this will pressure margins in the future. Customers / Competition The Company’s principal customers are large mass merchandisers, such as discount stores, home centers, warehouse clubs and office superstores, and commercial distributors. The rapid growth of these large mass merchandisers, together with changes in consumer shopping patterns, have contributed to a significant consolidation of the consumer products retail industry and the formation of dominant multi-category retailers that have strong negotiating power with suppliers. This environment limits the Company’s ability to recover cost increases through selling prices. Current trends among retailers include fostering high levels of competition among suppliers, demanding innovative new products and requiring suppliers to maintain or reduce product prices and deliver products with shorter lead times. Other trends, in the absence of a strong new product development effort or strong end-user brands, are for the retailer to import generic products directly from foreign sources and to source and sell products, under their own private label brands, that compete with products of the Company.

9
The Company has also positioned itself to respond to the challenges of this retail environment by developing strong relationships with large, high-volume purchasers. The Company markets its strong multi-product offering through virtually every category of high-volume retailer, including discount, drug, grocery and variety chains, warehouse clubs, department, hardware and specialty stores, home centers, office superstores, contract stationers and military exchanges. The Company’s largest customer, Wal-Mart (which includes Sam’s Club), accounted for approximately 12% of net sales in 2006, across substantially all business units. The Company’s top ten customers included (in alphabetical order): Ace Hardware, Boise Office, Lowe’s, Office Depot, Staples, Target, The Home Depot, Toys ‘R’ Us, United Stationers and Wal-Mart.
Management Mark D. Ketchum – President and CEO
Mr. Ketchum has served in this position since October 2005. Prior to joining the company as a director in 2004, he served at Proctor & Gamble for 33 years, culminating with a post as President of Global Family and Baby Care from 1999 to 2004. Since joining, Mr. Ketchum has focused on transforming Newell Rubbermaid into a global company with a focus on creating consumer demand. Hartley Blaha – President, Corporate Development Mr. Blaha has been serving at Newell Rubbermaid since October 2003. Prior to joining NWL, he served 16 years at Lehman Brothers in corporate acquisitions and divestitures. Mr. Blaha’s focus is upon generating transactions that support and enhance the company’s strategic objectives. Paul G. Boitmann – President, Sales Operations and Global Wal-Mart Mr. Boitmann has been with NWL since 2001 and brings over 18 years of sales and marketing experience to the company. He has brought increased focus to better serving the company’s top clients and produced significant sales growth throughout his tenure.

10
Timothy J. Jahnke – Group President, Home & Family Products Mr. Jahnke has been with Newell Rubbermaid since 1986, serving much of his career in the Human Resource department. In 1999, he moved over to the product side of the business, where he has considerable strategic expertise. He has served in his current position since April 2004. Raymond J. Johnson – President, Global Manufacturing and Supply Chain Mr. Johnson has been at Newell Rubbermaid since 2002, serving in various senior level positions. He has served in his current position since 2005. Prior to that, Mr. Johnson has had experience in Six Sigma, Lean Manufacturing, and TQM while serving in positions at Eaton Corporation, True Temper Sports, Bic Pen Corporation and Black & Decker. Steven G. Marton – Group President, Office Products Prior to joining Newell Rubbermaid in 2004, Mr. Marton served 12 years at Colgate Palmolive. There he was previously president and COO of Hill’s Pet Nutrition, an SBU with over $1 billion in annual sales. James J. Roberts – Group President and COO, Rubbermaid/ IRWIN Mr. Roberts has been with Newell Rubbermaid since 2001, presiding over various groups throughout his tenure. He joined NWL from previous positions at Black & Decker and Stanley Works.

11
Analysis of Recent Performance During 2006, NWL undertook a number of initiatives to further streamline their business and position themselves for growth in the future. During the year, NWL completed an acquisition of DYMO, a manufacturer of on-demand labeling products. In addition, the company substantially completed the sale of its European Cookware, Little Tykes, and Home Décor Europe businesses. These acquisitions and sales reflect the company’s commitment to pursue only businesses that make economic and strategic sense for Newell Rubbermaid as a whole. In 2006, the company saw growth in all four of its business segments, with Office Products and Home & Family showing significant growth and Cleaning, Organization, & Décor and Tools & Hardware showing more moderate growth. Operating margin for the year increased from 9.9% to 10.6%. Newell Rubbermaid is in the midst of a cost cutting initiative called Project Acceleration, which is on track and expected to result in $150 million in annualized cost savings. The company incurred $66.4 million in restructuring charges in 2006 associated with this initiative. Newell Rubbermaid reported total net income from operations of $1.71 per share for 2006, compared to $1.48 per share in 2005. The improvement came from an 8.5% increase in sales, a 260 basis point improvement on gross margin, and some growth attributable to the DYMO acquisition. Looking forward to next year, President and CEO Mark Ketchum comments, “We will build on these accomplishments in 2007 as we continue our multi-year transformation into a global consumer products company with world class talent and processes, best total cost position and brands that matter to the consumer.”

12
Section 2: Industry Analysis Discussion of Competitors1
Tupperware Brands Corporation Tupperware Brands Corporation engages in the manufacture and sale of kitchen products, cosmetics, and personal care products worldwide. It offers food storage, serving, and preparation products, as well as kitchen tools, children’s educational toys, microwave products, and gifts. The company’s cosmetics and personal care products include skin care products, cosmetics, bath and body care, toiletries, fragrances, nutritional products, apparel, and related products. The company offers kitchen and home products under the brand name Tupperware; and beauty and personal care products through Avroy Shlain, BeautiControl, Fuller, NaturCare, Nutrimetics, Nuvo, and Swissgarde brands. It sells its products directly to distributors, directors, managers, and dealers. As of December 30, 2006, its distribution system was comprised of 1,800 distributors, 47,500 managers, and 848,000 dealers. The company was founded in 1996. It was formerly known as Tupperware Corporation and changed its name to Tupperware Brands Corporation in 2005. Tupperware Brands is headquartered in Orlando, Florida.
Jarden Corporation Jarden Corporation engages in the manufacture, sourcing, marketing, and distribution of consumer products used in and around the home. It operates in four segments: Branded Consumables, Consumer Solutions, Outdoor Solutions, and Process
1 Finance.yahoo.com
Market Cap (intraday): 1.50B
Enterprise Value (25-Mar-07)3: 2.08B
Trailing P/E (ttm, intraday): 16.00
Forward P/E (fye 30-Dec-08) 1: 12.56
PEG Ratio (5 yr expected): 1.41
Price/Sales (ttm): 0.87
Price/Book (mrq): 3.74
Enterprise Value/Revenue (ttm)3: 1.19
Enterprise Value/EBITDA (ttm)3: 9.458
Market Cap (intraday): 2.67B
Enterprise Value (25-Mar-07)3: 3.91B
Trailing P/E (ttm, intraday): 23.40
Forward P/E (fye 31-Dec-08) 1: 13.04
PEG Ratio (5 yr expected): 1.24
Price/Sales (ttm): 0.69
Price/Book (mrq): 2.11
Enterprise Value/Revenue (ttm)3: 1.02
Enterprise Value/EBITDA (ttm)3: 9.162

13
Solutions. The Branded Consumables segment offers arts and crafts paint brushes, children’s card games, clothespins, collectible tins, firelogs and firestarters, home safety equipment, home canning jars, jar closures, kitchen matches, other craft items, plastic cutlery, playing cards and accessories, rope, cord and twine, storage and workshop accessories, toothpicks, and other accessories. The Consumer Solutions segment provides coffee makers, bedding, home vacuum packaging machines, heating pads, slow cookers, air cleaning products, fans and heaters, and personal and animal grooming products, as well as related consumable products. The Outdoor Solutions segment provides outdoor leisure products, such as products for camping, backpacking, tailgating, backyard grilling, and other outdoor activities. The Process Solutions segment offers various consumer and medical plastic products, including jar closures, contact lens packaging, plastic cutlery, refrigerator door liners, medical disposables, and rigid packaging, as well as zinc strip and fabricated zinc products, such as coinage blanks. Jarden Corporation sell its products through various retail formats, including club stores, drugstores, grocery retailers, mass merchants, department stores, value retailers, home improvement stores, and craft stores. The company was founded in 1991 and is headquartered in Rye, New York
Avery Dennison Avery Dennison Corporation produces pressure-sensitive materials, office products, tickets, tags, labels, and other converted products. It operates in three segments: Pressure-Sensitive Materials (PSM), Office and Consumer Products (OC), and Retail Information Services (RIS). PSM segment offers pressure-sensitive materials, including papers, plastic films, metal foils, and fabrics to label printers and converters; graphic products to architectural, commercial sign, digital printing, and related markets; durable cast and reflective films to the construction, automotive, fleet transportation markets; scrim-reinforced vinyl material for banner sign applications; and reflective films for traffic and safety applications. OC segment provides printable media and other products, such as copiers, ink-jet and laser printer labels, related computer software, ink-jet and laser printer cards, and index products; and organization, filing, and presentation products, such as binders, dividers, and sheet protectors. This segment also offers writing instruments, markers, adhesives, and specialty products. RIS segment offers price marking and brand identification products, which include woven and printed labels, graphic tags, barcode tags, price tickets, carton labels, RFID
Market Cap (intraday): 7.08B
Enterprise Value (25-Mar-07)3: 7.99B
Trailing P/E (ttm, intraday): 18.17
Forward P/E (fye 30-Dec-08) 1: 14.86
PEG Ratio (5 yr expected): 1.34
Price/Sales (ttm): 1.25
Price/Book (mrq): 3.83
Enterprise Value/Revenue (ttm)3: 1.43
Enterprise Value/EBITDA (ttm)3: 10.851

14
tags, barcode printers, molded plastic fastening, application devices, and security management products for retailers, apparel manufacturers, distributors, and industrial customers. This segment also offers specialty tapes, engineered films, RFID inlays, pressure-sensitive postage stamps, and other converted products. The company, formerly known as Avery International Corporation, was founded in 1935 and changed its name to Avery Dennison Corporation in 1990. The company is headquartered in Pasadena, California with additional offices in Brea and Westlake Village, California; Framingham, Massachusetts; Mentor, Ohio; Hong Kong; Kunshan, China; Leiden, the Netherlands; and Zug, Switzerland.
Industry Performance Industry Outlook2 Newell Rubbermaid competes in the personal and household products industry. The industry is mature and growth is mainly achieved through market-share gains, new product innovations, restructuring efforts, and increased manufacturing efficiencies. All firms operating in this industry have been hit hard recently due to higher costs of production mainly due to increases in the price of raw materials. In the future these pressures should subside which will mean growth throughout the industry. Sector revenues are expected to grow 6% annually between now and 2009 therefore companies that hope to deliver double digit growth will have to rely on cost-cutting and restructuring to meet there goals. Companies are trying to divest non-core assets and acquire new ones that compliment existing operations. Divesting non-core assets has also freed up money to invest in building brand image, new product offerings, and increasing marketing activity. To succeed in this highly competitive industry companies must focus on their strengths. This industry requires a lot of raw materials so maintaining control over suppliers is crucial to any business’s success. Corporate Governance Newell Rubbermaid corporate governance quotient is better than 75.7% of companies that trade on the S&P 500. For the sector consumer durables, which NWL operates in, they have a corporate governance quotient that is better than 95.9% of the companies in the sector.
2 Valueline
15
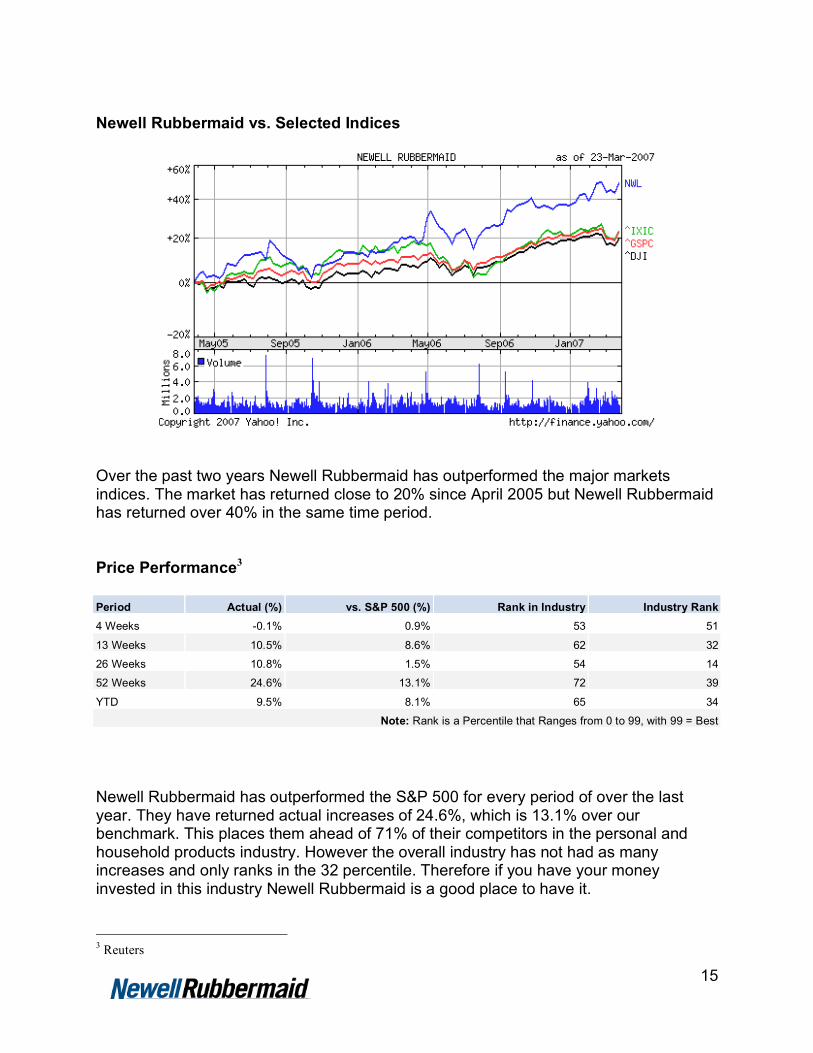
Newell Rubbermaid vs. Selected Indices
Over the past two years Newell Rubbermaid has outperformed the major markets indices. The market has returned close to 20% since April 2005 but Newell Rubbermaid has returned over 40% in the same time period. Price Performance3 Period Actual (%) vs. S&P 500 (%) Rank in Industry Industry Rank
4 Weeks -0.1% 0.9% 53 51
13 Weeks 10.5% 8.6% 62 32
26 Weeks 10.8% 1.5% 54 14
52 Weeks 24.6% 13.1% 72 39
YTD 9.5% 8.1% 65 34
Note: Rank is a Percentile that Ranges from 0 to 99, with 99 = Best
Newell Rubbermaid has outperformed the S&P 500 for every period of over the last year. They have returned actual increases of 24.6%, which is 13.1% over our benchmark. This places them ahead of 71% of their competitors in the personal and household products industry. However the overall industry has not had as many increases and only ranks in the 32 percentile. Therefore if you have your money invested in this industry Newell Rubbermaid is a good place to have it.
3 Reuters
16
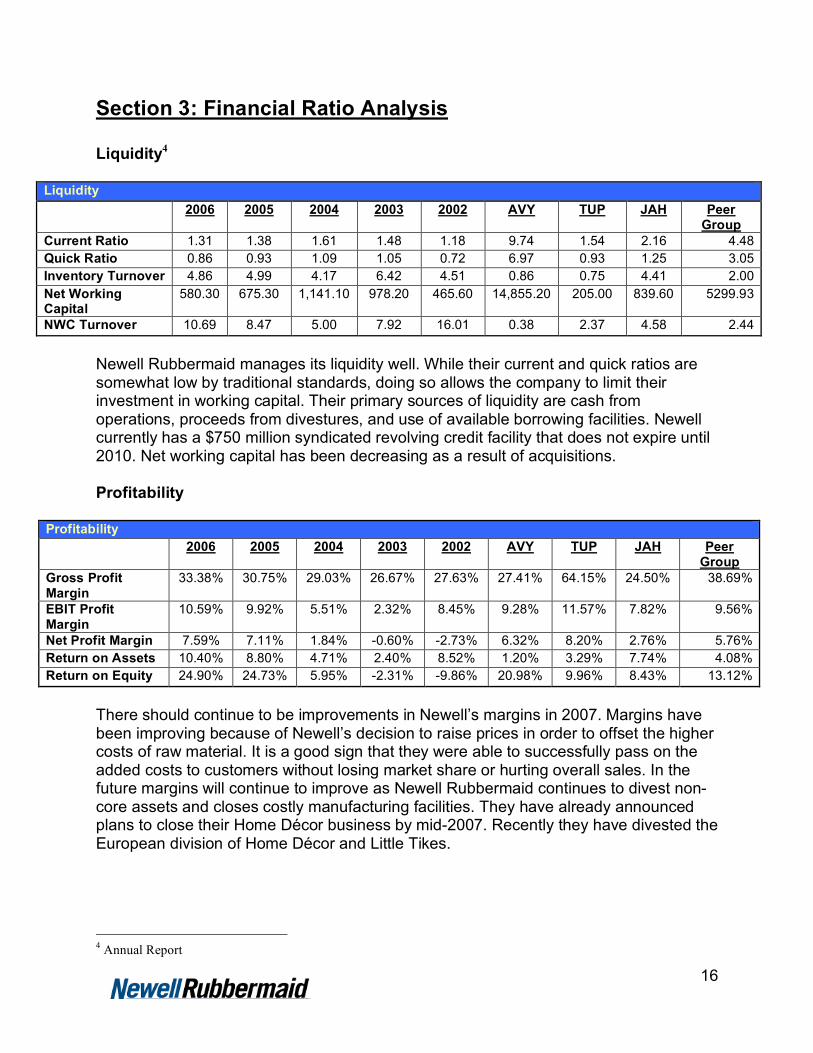
Section 3: Financial Ratio Analysis Liquidity4
Liquidity
2006 2005 2004 2003 2002 AVY TUP JAH Peer Group
Current Ratio 1.31 1.38 1.61 1.48 1.18 9.74 1.54 2.16 4.48 Quick Ratio 0.86 0.93 1.09 1.05 0.72 6.97 0.93 1.25 3.05 Inventory Turnover 4.86 4.99 4.17 6.42 4.51 0.86 0.75 4.41 2.00 Net Working Capital
580.30 675.30 1,141.10 978.20 465.60 14,855.20 205.00 839.60 5299.93
NWC Turnover 10.69 8.47 5.00 7.92 16.01 0.38 2.37 4.58 2.44
Newell Rubbermaid manages its liquidity well. While their current and quick ratios are somewhat low by traditional standards, doing so allows the company to limit their investment in working capital. Their primary sources of liquidity are cash from operations, proceeds from divestures, and use of available borrowing facilities. Newell currently has a $750 million syndicated revolving credit facility that does not expire until 2010. Net working capital has been decreasing as a result of acquisitions. Profitability
Profitability 2006 2005 2004 2003 2002 AVY TUP JAH Peer
Group Gross Profit Margin
33.38% 30.75% 29.03% 26.67% 27.63% 27.41% 64.15% 24.50% 38.69%
EBIT Profit Margin
10.59% 9.92% 5.51% 2.32% 8.45% 9.28% 11.57% 7.82% 9.56%
Net Profit Margin 7.59% 7.11% 1.84% -0.60% -2.73% 6.32% 8.20% 2.76% 5.76% Return on Assets 10.40% 8.80% 4.71% 2.40% 8.52% 1.20% 3.29% 7.74% 4.08% Return on Equity 24.90% 24.73% 5.95% -2.31% -9.86% 20.98% 9.96% 8.43% 13.12%
There should continue to be improvements in Newell’s margins in 2007. Margins have been improving because of Newell’s decision to raise prices in order to offset the higher costs of raw material. It is a good sign that they were able to successfully pass on the added costs to customers without losing market share or hurting overall sales. In the future margins will continue to improve as Newell Rubbermaid continues to divest non-core assets and closes costly manufacturing facilities. They have already announced plans to close their Home Décor business by mid-2007. Recently they have divested the European division of Home Décor and Little Tikes.
4 Annual Report

17
Profitability
-15.00%
-10.00%
-5.00%
0.00%
5.00%
10.00%
15.00%
20.00%
25.00%
30.00%
35.00%
40.00%
2006 2005 2004 2003 2002
Gross Profit Margin
Net Profit Margin
Return on Equity
Asset Management
Asset Management 2006 2005 2004 2003 2002 AVY TUP JAH Peer
Group Average Collection Period
65.55 70.72 81.78 65.80 67.46 658.14 169.33 62.36 296.61
Days Sales in Inventory
50.07 50.68 62.18 41.67 58.58 308.84 174.58 62.56 181.99
Fixed-Asset Turnover 8.30 6.69 4.36 4.82 4.11 0.43 1.90 11.12 4.48 Total-Asset Turnover 0.98 0.89 0.86 1.04 1.01 0.13 0.28 0.99 0.47
Newell Rubbermaid excels in asset management. They have a lower average collection period than their competitors except for JAH and they have been improving over the past three years. Another key advantage is that their sales do not sit in inventory as long as their competitors. This is a significant advantage because it is very costly to keep products in inventory. They have drastically improved both fixed and total asset turnover. Since they are selling off non-core businesses these numbers should continue to see improvement over the upcoming years.

18
Employee Efficiency
Employee Efficiency
NWL AVY TUP JAH Peer
Group Rev./ Emp. $263.87 $245.63 $39.55 $192.32 $159.17 NI/Emp. $16.38 $16.18 $3.24 $5.30 $8.24 # of Employees
23.5 22.7 12.3 20 18.33
Newell Rubbermaid makes good use of its employees. In 2006 they outperformed their competitors in total revenue earned as well as net income per employee. The only company that comes close is Avery Dennison who produces similar office products to Newell but operates in a different business environment. Newell is far superior to both Jarden and Tupperware in employee efficiency. Financial Leverage
Financial Leverage 2006 2005 2004 2003 2002 AVY TUP JAH Peer
Group Debt-to-Asset Ratio
0.35 0.40 0.39 0.39 0.31 0.02 0.40 0.37 0.26
Debt-to-Equity Ratio
1.04 1.48 1.37 1.42 0.90 0.30 1.70 1.13 1.04
Equity Multiplier 3.34 3.92 3.78 3.71 3.58 25.55 4.27 3.09 10.97 TIE Coverage Ratio
4.97 4.46 2.63 1.28 4.59 9.32 4.11 2.67 5.37
Newell Rubbermaid is better compared to its closest competitors when it comes to financing decisions. Avery Dennison has numbers that are too different to be valuably compared to Newell. NWL has chosen to finance their investments with similar amounts of debt compared to TUP and JAH. However this could change in the future as every company in the industry pursues its unique growth strategy. Currently Newell Rubbermaid has not had to borrow too significantly to acquire businesses because they have also been divesting their own. In the future Newell could choose to finance more acquisitions with debt. They can still safely take on more debt and be able to pay the obligations that come due. They have a better TIE Ratio than both TUP and JAH and it should only continue to improve over the upcoming years.

19
Extended Du Pont Model
Extended Du Pont ROE Net Profit
Margin Total Asset
Turnover Equity
Multiplier 2006 24.90% = 7.59% X 0.98 X 3.34 2005 24.73% = 7.11% X 0.89 X 3.92 2004 5.95% = 1.84% X 0.86 X 3.78 2003 -2.31% = -0.60% X 1.04 X 3.71 2002 -9.86% = -2.73% X 1.01 X 3.58
Peer Group 13.12% = 5.76% X 0.47 X 10.97
AVY 20.98% = 6.32% X 0.13 X 25.55 TUP 9.96% = 8.20% X 0.28 X 4.27 JAH 8.43% = 2.76% X 0.99 X 3.09
ROE
-15.00%
-10.00%
-5.00%
0.00%
5.00%
10.00%
15.00%
20.00%
25.00%
30.00%
2006 2005 2004 2003 2002
ROE
Equity Multiplier
3.00
3.10
3.20
3.30
3.40
3.50
3.60
3.70
3.80
3.90
4.00
2006 2005 2004 2003 2002
Equity Multiplier
Newell Rubbermaid has a better return on equity than any of its peers. Their continuing success is a result of greater total asset turnover and continually improving profit margins. This trend should continue into the future, allowing them to operate with a lower equity multiplier than they historically do. Though they do not lead any single category the overall effect is superior to that of their competitors. If the equity multiple returns to historic levels there could be large improvements in ROE.
Net Profit Margin
-4.00%
-2.00%
0.00%
2.00%
4.00%
6.00%
8.00%
10.00%
2006 2005 2004 2003 2002
Net Profit Margin
Total Asset Turnover
0.00
0.20
0.40
0.60
0.80
1.00
1.20
2006 2005 2004 2003 2002
Total Asset Turnover
20
Section 4: Porter’s Five Forces Analysis Buyer Power- Newell Rubbermaid’s customers include retail giants Wal-Mart, Target, Ace Hardware, Home Depot, Lowe’s, and Stables. With so many powerful buyers, Newell experiences difficulty in offsetting higher cost of goods sold through higher prices. Newell is aware of this and has entered hedging agreements to mitigate exposure to higher raw materials. Newell attempts to minimize buyer power by offering products to virtually every high-volume retailer. Rating: Strong Supplier Power- Many of the supplies used by Newell Rubbermaid in production are raw material costs. In 2006, Newell saw inflation related to raw materials and expects this trend to continue. However, gross margins have seen improvement due to favorable pricing, productivity, and favorable mix. Rating: Weak Substitutes- Many of Newell’s products are easily substitutable. For example, instead of using a sharpie, a simple marker will suffice. However, because many of Newell’s products serve basic functions, it is unlikely that new inventions will push aside the product offerings of Newell Rubbermaid. Rating: Moderate Barriers to Entry- With minimal start up cost, barriers to entry are not high. However, creating a distribution network in order to properly compete with Newell is a challenge for any new entrant. Due to the amount of buyer power, new entrants must combat with the challenges of low margins and competing on price. Economies of scale and scope are incredibly important to success. Rating: Weak Competition- Competition is fierce. Retailers have forced suppliers to maintain or reduce prices with short lead times due to no new strong product development. As stated before, many retailers are now creating their own products that compete with Newell’s. Newell has attempted to offset this problem by developing strong relationships with its purchasers. Rating: Strong

21
Section 5: Valuation Relative Valuation Historical Trends
Historical Valuation 1997 1998 1999 2000 2001 2002 2003 2004 2005 2006 Average P/E 23.5 17.3 85.3 14.5 27.9 26.2 N/A N/A 18.3 16.9 20.65 P/B 4 3.5 3 2.6 3.2 4 3.1 3.8 4 4.3 3.55 P/S 2.1 1.9 1.3 0.9 1.1 1.1 0.8 1 1 1.3 1.25 P/CF 17.7 23.6 14.8 10.2 8.5 9.4 8.1 10.1 10.2 12.4 12.5
The graph above represents the yearly average of the trading multiples for the past ten years. Currently, NWL is trading at a discount to its historical P/E but a premium to its other ratios. No simple explanation for this exists other than overall market trends dictate multiples and because of the current market sentiment of a good economy, higher multiples are being used to value stocks. Price/Earnings was calculated taking the forward P/E multiple as most likely and using Standard and Poor’s estimate of the 2007 P/E. Pessimistic, most likely, and optimistic were taken using analyst’s low, average and high estimates.
P/E Pessimistic Most Likely Optimistic 16.33 17.4 19.14 Pessimistic $1.84 $30.05 $32.02 $35.22 Most Likely $1.93 $31.52 $33.58 $36.94 Optimistic $2.03 $33.15 $35.32 $38.85
Using price/earnings valuation we get a trading range of $30.05-$38.85. We find these estimates as reasonable. With a number of analysts covering the stock and transparency in reporting, Newell is a superior long-term investment whereas the P/E valuation focuses on near-term performance. Price/Sales was calculated taking current price/sales and moving 10% in both directions. Applying this valuation we find:
P/S Pessimistic Most Likely Optimistic 1.26 1.4 1.54 Pessimistic $21.44 $27.01 $30.01 $33.01 Most Likely $23.82 $30.01 $33.35 $36.68 Optimistic $26.20 $33.01 $36.68 $40.35

22
Similar to the price/earnings ratio, a trading range of 27.01-40.35 is most likely. Again, most likely scenarios place NWL at $33, representing slight undervaluation from where NWL is currently trading. Price/Book was calculated using the same method as price/sales. Applying this valuation we find:
P/B Pessimistic Most Likely Optimistic 4.095 4.55 5.005 Pessimistic $6.18 $25.32 $28.13 $30.95 Most Likely $6.87 $28.13 $31.26 $34.38 Optimistic $7.56 $30.95 $34.38 $37.82
A trading range of 25.32-37.82 exists for NWL using the P/B multiple. Using the P/B multiple, we find a fair valued stock. Price/Cash flow as calculated using the same method as the previous two multiples. Applying this valuation, we find:
P/CF Pessimistic Most Likely Optimistic 14.058 15.62 17.182 Pessimistic $1.76 $24.80 $27.55 $30.31 Most Likely $1.96 $27.55 $30.62 $33.68 Optimistic $2.16 $30.31 $33.68 $37.04
Just like P/B, we find a reasonably valued stock. Again, multiples tend to focus on the short term trading rather than long-term growth in value. NWL is a superior long-term investment based on its history of creating shareholder value as well as its superior product.

23
Pro Forma Income Statement
Year Ended December 31, 2006 % of 2007E 2008E 2009E 2010E 2011E
(Amounts in millions, except per share data) Sales
Total Sales Growth 4.85% 4.95% 5.05% 5.15% 5.25% Cleaning, Organization & Décor (3.9% Growth) $1,995.7 $2,073.5 $2,154.4 $2,238.4 $2,325.7 $2,416.4
Office Products (6% Growth) 2,031.6 2,153.5 2,282.7 2,419.7 2,564.8 2,718.7
Tools & Hardware (0.2% Growth) 1,262.2 1,264.7 1,267.3 1,269.8 1,272.3 1,274.9
Home & Family (10.8% Growth) 911.5 1,009.9 1,119.0 1,239.9 1,373.8 1,522.1
Net sales 6,201.0 6,501.7 6,823.4 7,167.7 7,536.7 7,932.2
Cost of products sold 4,131.0 4,233.8 4,443.3 4,667.5 4,907.8 5,165.3
Gross Profit 2,070.0 34.88% 2,267.9 2,380.1 2,500.2 2,628.9 2,766.9
Selling, general and administrative expenses 1,347.0 21.72% 1,412.3 1,482.2 1,557.0 1,637.1 1,723.1
Restructuring costs 66.4 115.0 76.2 76.2 0.0 0.0
Goodwill amortization
Operating income 656.6 740.6 821.7 867.0 991.8 1,043.8
Nonoperating expenses:
Interest expense, net of interest income 132.0 2.13% 138.4 145.2 152.6 160.4 168.9
Other expense (income), net 9.7 0.16% 10.2 10.7 11.2 11.8 12.4
Net nonoperating expenses 141.7 2.29% 148.6 155.9 163.8 172.2 181.3
Income from continuing operations before 514.9 8.30% 592.0 665.8 703.2 819.6 862.6
income taxes
Income taxes 44.2 35.00% 207.2 233.0 246.1 286.8 301.9
Income from continuing operations 470.7 7.59% 384.8 432.8 457.1 532.7 560.7
Loss from discontinued operations, net of tax (85.7) 0.0 0.0 0.0 0.0 0.0
Net income (loss) 385.0 384.8 432.8 457.1 532.7 560.7
Weighted average shares outstanding:
Basic 274.60 274.60 274.60 274.60 274.60 274.60
Diluted 275.50 275.50 275.50 275.50 275.50 275.50
Diluted EPS $1.40 $1.40 $1.57 $1.66 $1.93 $2.04
Notes to the Pro Forma Income Statement • Sales growth is calculated by segment, so the variations in annual total sales growth
are reflective of the shifts in product mix from low growth and high growth SBUs. • The gross profit margin reflects a 150 basis point expansion that management
expects to achieve in 2007. While further margin expansion is likely, we assume stable margins throughout the forecast period.
• Restructuring costs reflect remaining spending associated with Project Acceleration as forecasted by management.

24
Discounted Cash Flow Valuation OCF2007 OCF2008 OCF2009 OCF2010 OCF2011 IV2011 EBIT $481.38 $534.12 $563.57 $644.66 $678.49 Less: Incremental NWC
$82.09 $87.82 $94.01 $100.72 $107.97
Less: Incremental PPEnet
- - - - -
Cash Flow $399.29 $446.30 $469.56 $543.94 $570.51 $10,084.32 PV Discount Factor 1.0673 1.1391 1.2157 1.2975 1.3848 1.3848 PV of Cash Flow $374.12 $391.80 $386.24 $419.21 $411.98 $7,282.01 Intrinsic Value $9,466.36 Market Value $8,799.92 % Over/Under Valued -7.04% (Undervalued)
DCF Assumptions Value Drivers: 2007 2008 2009 2010 2011 Growth 4.85% 4.95% 5.05% 5.15% 5.25% EBIT margin 11.39% 12.04% 12.10% 13.16% 13.16% Tax Rate 35.00% 35.00% 35.00% 35.00% 35.00% ∆NWC rate 0.273 ∆P&E rate 0 WACC 6.73% Pre-tax Cost of Debt 5.58% Cost of Debt 3.63% Weight of Debt 51.06% Tax Rate 35.00% Cost of Equity 9.96% Beta 0.948 Bloomberg Risk-free Rate 4.75% Risk Premium 5.50% Weight of Equity 48.94%
• The DCF valuation is based upon the Rappaport method, which is quite
conservative in its calculation of the terminal value. • The WACC and FCF projections were calculated assuming a 35% tax rate. Last
year, NWL’s effective rate of tax was 8.6% in 2006 and 12.3% in 2005. o Based on the fact that in the recent past, NWL has paid much closer to the
statutory rate, for the sake of conservatism we assume a 35% tax rate. o If NWL’s tax rate continues to be much lower, their WACC would increase
slightly but their free cash flows would increase substantially, reflecting even more significant undervaluation.
• The assumed EBIT margin changes reflect the winding down of Project Acceleration, which involve some remaining restructuring charges that should be completed in 2009.
• In the past two years, both PPEnet and NWC have decreased even as sales have increased.

25
o As cost cutting measures associated with Project Acceleration begin to subside, we assume that the NWC investment rate will return to a more normal, historical level. Therefore, we assume an incremental $0.273 investment in NWC for every dollar in incremental sales, based upon the NWC rate seen in 2002, the last year to not be distorted materially by acquisitions and divestitures.
o While P&Enet may continue to decrease somewhat in the short-term and begin increasing again later in the forecast period, we assume these investments will offset and therefore assume no increase in P&Enet during the forecast period.
o Both of these assumptions are likely to have a conservative bias. Sensitivity Analysis – Tax Rate Tax Rate 15% 20% 25% 30% 35% 40% WACC 7.30% 7.16% 7.01% 6.87% 6.73% 6.59% DCF Value $11,418.44 $10,961.14 $10,484.21 $9,986.39 $9,466.36 $8,922.67 % Over/Undervalued -22.93% -19.72% -16.06% -11.88% -7.04% -1.38%
As can be seen from above, if Newell Rubbermaid is able to keep its effective tax rate low as it has in the recent past, it would imply that the stock is even more undervalued at current levels. This could provide some upside from our “baseline” valuation. Sensitivity Analysis – WACC WACC 6.25% 6.50% 6.73% 7.00% 7.25% 7.50% DCF Value $10,228.86 $9,816.05 $9,466.36 $9,079.77 $8,750.13 $8,442.73 % Over/Undervalued -13.97% -10.35% -7.04% -3.08% 0.57% 4.23%
The DCF valuation is somewhat sensitive to the weighted average cost of capital. The above table gives an idea of how the valuation would respond to a change in NWL’s WACC. Given their strength in cash generation, it seems they would be more likely to shift toward more debt in their capital structure, thus lowering their WACC.

26
Section 6: Investment Summary and Recommendation Investment Summary • Track record of strong strategic acquisitions and divestitures • Increased focus on building out brands and stimulating consumer demand • Increased efficiencies in product manufacturing, resulting in margin expansion As outlined in the previous pages, Newell Rubbermaid is focusing heavily upon generating shareholder returns through streamlining its business. The company’s cost cutting measures, coupled with its shift toward higher margin business lines, should result in strong returns going forward. Recommendation Based upon the company’s position as an industry leader and their ability to execute on their business plan, combined with an attractive valuation both in terms relative P/E and the discounted cash flow valuation, we recommend a full position of Newell Rubbermaid, or 1,600 shares.
27

28
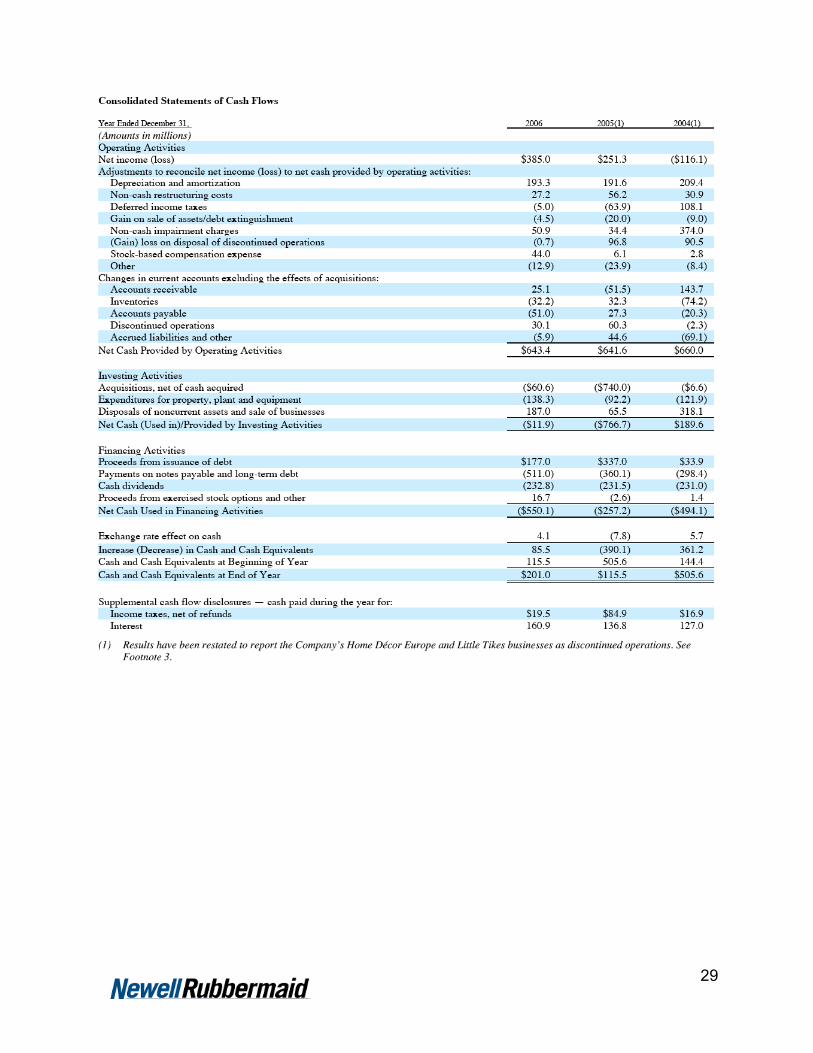
29

30