nutritive value of nutritionally upgraded sunflower meal...
TRANSCRIPT

Nutritive value of nutritionally upgraded sunflower meal for post-juvenile Atlantic
salmon (Salmo salar) in sea water
N. Gill 1/, D. Higgs 2/, B. Skura 1/, M. Rowshandeli 2/, B. Dosanjh 3/, and J. Mann 3
1/ Faculty of Agricultural Sciences, UBC2/ Fisheries and Oceans, Canada, West Vancouver Lab.
3/ Ewos Canada Ltd.

Rationale
• Diets for farmed Atlantic salmon are too costly (contain significant amounts of fishmeal and oil).
• Global supplies of fishmeal and oil are finite. Costs will increase unless suitable alternatives are identified/and or developed.
• Nutritionally upgraded oilseed protein and lipid products offer great potential (economical production procedures need to be used or developed).

Percentage cost breakdown of an Atlantic salmon grower diet (39% protein, 33% fat)

Total global estimates for fishery catches, products produced and used (Hardy et al.,
2000; Tidwell and Allan, 2001, USDA 2002)
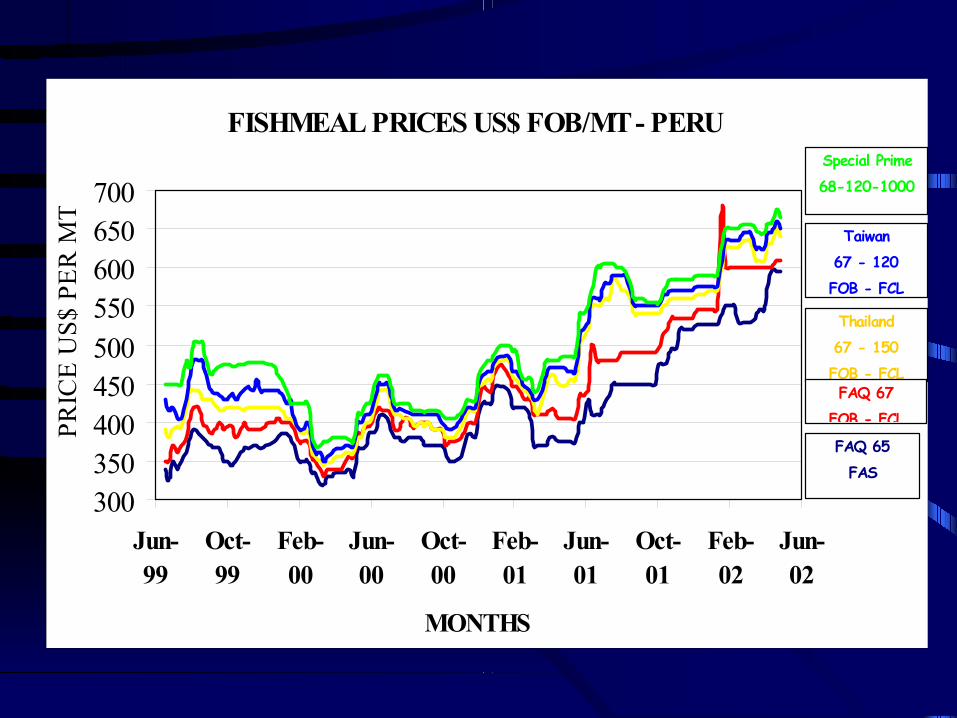
FISHMEAL PRICES US$ FOB/MT - PERU
300350400450500550600650700
Jun-99
Oct-99
Feb-00
Jun-00
Oct-00
Feb-01
Jun-01
Oct-01
Feb-02
Jun-02
MONTHS
PRIC
E U
S$ P
ER M
T
Special Prime 68-120-1000
Taiwan67 - 120FOB - FCL
Thailand67 - 150FOB - FCLFAQ 67
FOB - FCL
FAQ 65FAS

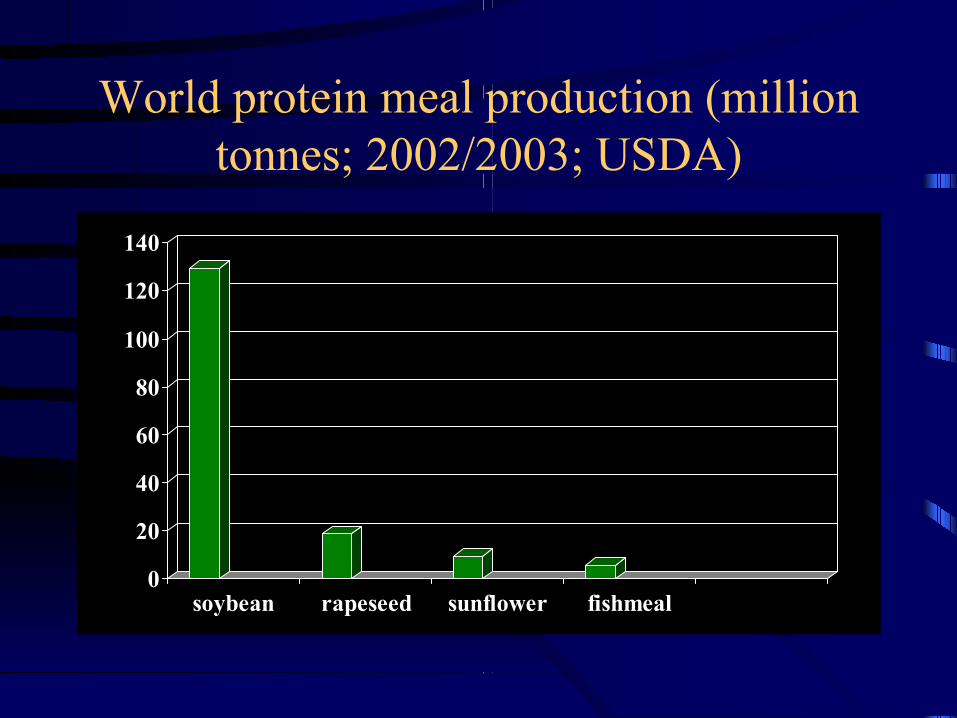
World protein meal production (million tonnes; 2002/2003; USDA)
0
20
40
60
80
100
120
140
soybean rapeseed sunflower fishmeal

Prices (US $/kg protein) of fishmeal (Hamburg) and sunflower meal (Rotterdam; USDA;2001/2002)
00.10.20.30.40.50.60.70.80.9
1
Fishmeal sunflower

Factors limiting sunflower meal (SFM) use in salmonid diets
• Low crude protein content in undehulled SFM (~25%)
• High fibre (>20%) and low bioavailable energy content
• Low lysine content• Chlorogenic acid (tannin-like compound;
may decrease digestive enzyme activity, amino acid availability and possibly diet palatability)

Previous research on sunflower meal in salmonids
• Work so far has focused on trout. No adverse effects on rainbow trout growth noted when partially de-hulled sunflower meal comprised either 33% (Scott et al., 1982), 36.5% (Tacon et al., 1984), 40% (Cardenete et al., 1993) or 41.8% (Sanz et al., 1994) of diet.
• To date no comparable work on salmon

Goal
• To determine the acceptable dietary level (nutritive value) of partially dehulled and extruded sunflower meal for post-juvenile Atlantic salmon in sea water

Screening of sunflower meal

Percent yields of different fractions of sunflower meal
F r a c t i o n 1 / S c r e e no p e n i n g s i z e
( m i c r o n )
Y i e l d ( % )
1 3 8 1 1 5 . 32 5 1 6 1 3 . 43 8 6 4 3 4 . 34 T o p d i s c a r d 3 7 . 1
1 / F r a c t i o n s 1 & 2 w e r e c o m b i n e d a n d p e r c e n t a g e s o f p r o t e i n , l i p i d a n d a s h o n a d r y w e i g h t b a s i s w e r e r e s p e c t i v e l y , 4 0 . 9 , 2 . 8 4 a n d 8 . 0 0 .

Experimental diets• Five steam pelleted dry diets (formulated to be
equal in digestible protein (442 g/kg dry weight) and digestible energy (19.2 MJ/kg dry weight) content were prepared for the study.
• Partially dehulled and extruded (Abernathy FishTechnol. Center, Longview, WA) SFM comprised 0 %, 6.8 %, 13.6 %, 20.4 % or 27.1 % of dry diet by progressive replacement of fish meal protein in basal diet on an equivalent digestible protein basis.

Ingredient compositions of diets DietIngredients
(g/kg dwb) 1/ 0.0 %SFM(Basal)
6.8 % SFM 13.6 % SFM 20.4 % SFM 27.1 % SFM
Austral fishmeal 450.3 413.1 376.0 338.8 301.7Sunflower meal(SFM)
0.0 67.9 135.7 203.5 271.4
Pre-gelatinizedwheat starch
122.3 89.8 77.3 39.8 2.3
Raw wheatstarch
20.0 20.0 0.0 0.0 0.0
Anchovy oil;stabilized
121.8 123.5 125.3 132.0 138.7
DL-methionine 1.82 1.88 1.94 2.00 2.09Santoquin 0.022 0.029 0.036 0.043 0.050Common ingred. 283.8 283.8 283.8 283.8 283.81/ Common ingredients (g/kg) = Blood flour, 50; squid meal, 70; wheat gluten
meal, 80; vitamin/mineral supplement, 40; soya lecithin, 10; choline chloride,(60%), 5.0; vitamin C monophosphate (42%),1.0; carophyll pink (2%), 2.75;permapell, 10; Finnstim, 10; chromic oxide, 5.0.
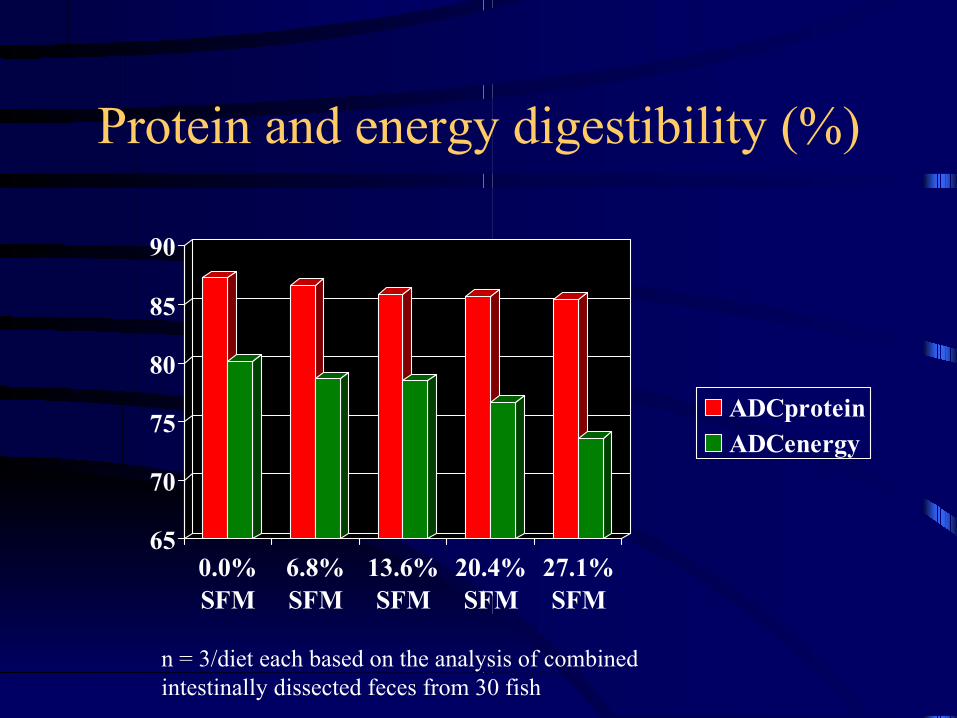
Protein and energy digestibility (%)
65
70
75
80
85
90
0.0%SFM
6.8%SFM
13.6%SFM
20.4%SFM
27.1%SFM
ADCproteinADCenergy
n = 3/diet each based on the analysis of combined intestinally dissected feces from 30 fish

Dietary proximate constituents and energy
DietProximateconstituent(g/kg)/energy(MJ/kg)
0.0 % SFM 6.8 % SFM 13.6 % SFM 20.4% SFM 27.1 % SFM
Dry matter 908 908 911 910 907Crude protein 493 486 487 480 504Digestibleprotein (DP)
430 421 418 411 431
Lipid 182 190 188 187 188Nitrogen-freeextract
228 218 215 213 179
Gross energy 21.0 20.9 20.9 21.1 21.0Digestibleenergy (DE)
16.8 16.4 16.4 16.2 15.5
DP/DE 25.6 25.6 25.5 25.4 27.9

Dietary crude fiber and chlorogenic acid levels (% dwb)
0.000.501.001.502.00
2.503.003.504.00
0.0%SFM
6.8%SFM
13.6%SFM
20.4%SFM
27.1%SFM
crude fiberchlorogenic acid

Experimental conditions• Triplicate groups of 50 (mean initial weight
~116 g) salmon /diet treatment• During study fish held in 4000 L outdoor
fibreglass tanks with running (25-40 L/min), filtered, oxygenated seawater for 84 days
• Water temperature (11.0-12.1 °C), dissolved oxygen (7.0-8.5 ppm), salinity (29.0-31.0 p.p.t.)
• Fish fed prescribed diet to satiation 2X/day

Outdoor tanks

Fish sampling• On day 0, 5 fish sampled for individual
determinations of whole body proximate composition and 5 for muscle proximate composition of whole fillets (L&R).
• On day 84, 30 fish sampled/tank (each intestinally dissected to obtain feces and then samples pooled and freeze-dried). Five fish individually analyzed for body proximate composition and five pools of 2 fish each for muscle proximate analyses.

Weight gain (g) and dry feed intake (g/fish)
0
50
100
150
200
250
300
0.0%SFM
6.8%SFM
13.6%SFM
20.4%SFM
27.1%SFM
WGDFI
n = 3 per diet treatment each based on 50 fish P>0.05 diet & block

Specific Growth Rate (%/day)
1.361.371.381.391.401.411.421.431.441.45
0.0%SFM
6.8%SFM
13.6%SFM
20.4%SFM
27.1%SFM
n = 3 per diet treatment each based on 50 fish P>0.05 diet & block

Feed efficiency and protein efficiency ratio (g/g)
0.00
0.50
1.00
1.50
2.00
2.50
3.00
0.0%SFM
6.8%SFM
13.6%SFM
20.4%SFM
27.1%SFM
FEPER
n = 3 per diet treatment each based on 50 fish P>0.05 diet & block

Percent protein deposited and gross energy utilization (%)
44
45
46
47
48
49
50
0.0%SFM
6.8%SFM
13.6%SFM
20.4%SFM
27.1%SFM
PPDGEU
n = 3 per diet treatment each based on 50 fish P>0.05 diet & block

Fish survival (%)
94
95
96
97
98
99
100
0.0%SFM
6.8%SFM
13.6%SFM
20.4%SFM
27.1%SFM
Survival
n = 3 per diet treatment each based on 50 fish P>0.05 diet & block

Whole body proximate composition (%)
01020304050607080
0.0%SFM
6.8%SFM
13.6%SFM
20.4%SFM
27.1%SFM
proteinlipidmoisture
n = 3 per diet treatment each based on 5 fish per diet replicate P>0.05 diet & block

Muscle proximate composition (%)
01020304050607080
0.0%SFM
6.8%SFM
13.6%SFM
20.4%SFM
27.1%SFM
proteinlipidmoisture
n = 3 per diet treatment each based on 5 composite samples of 2 fish (left fillets) each P>0.05 diet & block

Conclusions
• Nutritionally upgraded SFM – can comprise ≥ 27.1% of the dry diet or ≥
22.6% of the digestible protein in diets for post-juvenile Atlantic salmon
– no adverse effects on growth, feed intake, feed efficiency, health or body or muscle proximate composition noted
• Findings support previous studies on– rainbow trout, and tilapia

Acknowledgements
• We sincerely thank Ewos Canada Limited for funding the study.
• We also thank Dr. Ann Gannam of the Abernathy Fish Technology Center, Longview, Washington for extruding the sunflower meal and Allison Kozdron for technical assistance.