nutrient management guide (rb209) - microsoft...3 using the nutrient management guide (rb209)...
TRANSCRIPT
Section 4 Arable crops
Updated February 2020Nutrient Management Guide (RB209)

2
AcknowledgementsFunding for the production of this section of the Nutrient Management Guide (RB209) is provided by AHDB, BBRO and PGRO.
Revision of the Fertiliser Manual (RB209) to create the Nutrient Management Guide (RB209) has been overseen by the UK Partnership for Crop Nutrient Management which is led by AHDB.
AHDB wishes to thank all those who freely give their time to serve on the Steering Group as well as the Arable, Horticulture and Livestock Technical Working Groups. AHDB also wishes to thank the numerous farmers and growers across the country who host trials.
Arable Technical Working Group: Agrii, AHDB, AIC, BBRO, Bunn Fertiliser Ltd, C F Fertilisers UK Ltd, Catchment Sensitive Farming, Cropwell, DAERA, Defra, Frontier Agriculture Ltd, H. L. Hutchinson Ltd, ICL, iSoils, John Clarke Agronomy, K+S UK & Eire Ltd, Limex, OMEX Agriculture Ltd, PepsiCo International, PGRO, Potash Development Association, Scottish Government, Teagasc, Velcourt Ltd, Welsh Government and Yara UK Ltd.
Steering Group: AHDB, Agricultural Industries Confederation, Association of Independent Crop Consultants, BBRO, Catchment Sensitive Farming, DAERA, Defra, FACTS, PGRO, Professional Nutrient Management Group, Scottish Government and Welsh Government.
Funding for trials was provided by:
Research providers: The revision of this section of the Nutrient Management Guide (RB209) was carried out by ADAS, Bangor University, Frontier Agriculture, Lancaster University, NIAB TAG, Rothamsted Research, SOYL, SRUC and University of Southampton.
Greenhouse Gas Action Plan: The industry-wide Greenhouse Gas Action Plan (GHGAP) for agriculture focuses on improving resource use efficiency in order to enhance business performance while reducing GHG emissions from farming.
Nutrient Management Guide (RB209) contains public-sector information licensed under the Open Government Licence (OGL) v3.0 nationalarchives.gov.uk/doc/open-government-licence/version/3

3
Using the Nutrient Management Guide (RB209)
Section 1 Principles of nutrient management and fertiliser use
Section 2 Organic materials
Section 3 Grass and forage crops
Section 4 Arable crops
Cereals
Oilseeds
Sugar beet
Peas and beans
Biomass crops
Section 5 Potatoes
Section 6 Vegetables and bulbs
Section 7 Fruit, vines and hops
This section provides guidance for arable crops and should be read in conjunction with Sections 1 and 2. For each crop, recommendations for nitrogen (N), phosphate (P2O5) and potash (K2O) are given in kilograms per hectare (kg/ha). Magnesium (as MgO), sulphur (as SO3) and sodium (as Na2O) recommendations, also in kg/ha, are given where these nutrients are needed.
Recommendations are given for the rate and timing of nutrient application. The recommendations are based on the nutrient requirements of the crop being grown, while making allowance for the nutrients supplied by the soil.
Using the Nutrient Management Guide (RB209)The Nutrient Management Guide (RB209) helps you make the most of organic materials and balance the benefits of fertiliser use against the costs – both economic and environmental. The guide outlines the value of nutrients and soil, and explains why good nutrient management is about more than just fertilisers. It can save you money as well as help protect the environment.
AHDB first published the Nutrient Management Guide (RB209) in May 2017. Since its publication, recommendations have been revised, with the latest independent research funded by AHDB and its partners. A list of updates is available at ahdb.org.uk/rb209
To improve the accessibility and relevance of the recommendations and information, the Nutrient Management Guide (RB209) is published as seven sections that are updated individually.
Further informationThe Nutrient Management Guide (RB209) will be updated regularly. Please email your contact details to [email protected] so that we can send you notifications of when they are published.
Always consider your local conditions and consult a FACTS Qualified Adviser if necessary.
RB209: Nutrient ManagementDownload the app for Apple or Android devices to access the current version of the guide. With quick and easy access to videos, information and recommendations, it is practical for use in the field.

4
Contents
Oilseeds 35Oilseed rape and linseed – phosphate, potash, magnesium and sulphur 35Sunflower – phosphate and potash 36Oilseed rape – micronutrients 36Sunflower – micronutrients 37Oilseed rape, autumn-sown – nitrogen 38Oilseed rape and linseed, spring-sown – nitrogen 39Sunflower – nitrogen 39The effect of economic changes on nitrogen rates 40
Peas (dried and vining) and beans 41Sugar beet 41Biomass crops 43
Sources of information 43Miscanthus 43Willow 44
Conversion tables 46Analysis of fertilisers and liming materials 47Glossary 48
Contents Checklist for decision-making 5Calculating Soil Nitrogen Supply 6
Field Assessment Method 6Measurement Method 13
Phosphate, potash and magnesium recommendations 18Taking soil samples for phosphorus, potassium and magnesium 19Classification of soil analysis results into Indices 20Grain analysis to improve phosphate management 21Crop phospate and potash requirements at different Indices 21
Sulphur and sodium recommendations 22Leaf analysis 22Selecting the most appropriate fertiliser 23Cereals 23
All cereals – phosphate, potash, magnesium and sulphur 23All cereals – micronutrients 26Wheat and triticale, sown up to the end of January – nitrogen 28Barley, winter-sown – nitrogen 29Oats and rye, winter-sown – nitrogen 31Wheat, spring-sown – nitrogen 32Barley, spring-sown – nitrogen 32Oats, rye and triticale, spring-sown – nitrogen 34The effect of economic changes on nitrogen rates 34

5
Checklist for decision-making
Checklist for decision-makingIndividual decisions for fertiliser use must be made separately for every field. Where more than one crop is grown in a field, these areas must be considered individually.
1. Confirm the crop to be grown and the intended market. Identify any crop quality requirements for this market. For the purposes of this guide, winter-sown is defined as sown before 1 February and spring-sown as in February or after.
2. Identify the dominant soil type in the cropped area (Section 1: Principles of nutrient management and fertiliser use).
3. Assess soil structure and take action to remove soil compaction if necessary. Poor soil structure can restrict crop growth and results in poor nutrient use efficiency.
4. Carry out soil analysis for pH, P, K and Mg every 3–5 years (page 19). Target values to maintain in arable rotations are:
• Soil pH 6.5 (5.8 on peat soils)
• Soil P Index 2
• Soil K lower Index 2 (2-)
• Soil Mg Index 2
5. Identify the Soil Nitrogen Supply (SNS) Index of the field, either by using the Field Assessment Method (page 6) or the Measurement Method (page 13).
6. Calculate the total and crop-available nutrients from organic materials that have been applied since harvest of the previous crop, or which will be applied to the crop being grown (Section 2: Organic materials). Deduct these nutrients from the recommended rates given in the tables.
7. Decide on the strategy for phosphate and potash use. This will be building up, maintaining or running down the Soil Index (Section 1: Principles for nutrient management and fertiliser use). Allow for any surplus or deficit of phosphate or potash applied to previous crops in the rotation.
8. Calculate the amount of phosphate and potash removed in the harvested crop according to targeted crop yield (Table 4.11). This is the amount of these nutrients that must be replaced in order to maintain the soil at the current Index. Remember that some of these nutrients will also be removed in straw.
9. Using the tables, decide on the required rate of each nutrient. Decide on the optimum timings for fertiliser application, then find the best match for these applications using available fertilisers.
10. Check that the fertiliser spreader or sprayer is in good working order and has been recently calibrated (Section 1: Principles of nutrient management and fertiliser use).
11. Keep an accurate record of the fertilisers and organic materials applied.
Further informationThink soils ahdb.org.uk/knowledge-library/thinksoils
AHDB Field drainage guide ahdb.org.uk/knowledge-library/field-drainage-guide
Return to Contents

6
There are five essential steps to follow to identify the appropriate SNS Index:
Step 1. Identify the soil category for the field Step 2. Identify the previous crop Step 3. Select the rainfall range for the field Step 4. Identify the provisional SNS Index using the appropriate table Step 5. Make any necessary adjustments to the SNS Index
Calculating Soil Nitrogen Supply
Calculating Soil Nitrogen SupplyFields vary widely in the amount of nitrogen available to a crop before any fertiliser or manure is applied. This variation must be taken into account to avoid inadequate or excessive applications of nitrogen.
The Soil Nitrogen Supply (SNS) system assigns an Index of 0 to 6 to indicate the likely extent of this background nitrogen supply (Table 4.6). The Index is used in the recommendation tables to select the amount of nitrogen, as manufactured fertiliser, manure or a combination of both, that typically would need to be applied to ensure optimum yield.
The SNS Index for each field can be estimated either by the Field Assessment Method using records of soil type, previous cropping and winter rainfall, or by the Measurement Method. This uses measurements of Soil Mineral Nitrogen (SMN) plus estimates of nitrogen already in the crop (at the time of soil sampling) and of available nitrogen from the mineralisation of soil organic matter and crop debris during the period of active crop growth.
Field Assessment MethodThe Field Assessment Method does not take account of the nitrogen that will become available to a crop from any organic manures applied since harvest of the previous crop. The available nitrogen from organic materials applied since harvest of the previous crop, or those that will be applied to the current crop, should be calculated separately using the information in Section 2: Organic materials and deducted from the fertiliser nitrogen application rates shown in the recommendation tables.
Return to Contents

7
Calculating Soil Nitrogen Supply
In detail, these steps are:
Step 1. Identify the soil category for the fieldCareful identification of the soil category in each field is very important. The whole soil profile should be assessed to one metre depth for arable crops. Where the soil varies, and nitrogen is to be applied uniformly, select the soil type that occupies the largest part of the field.
The soil type can be identified using Figure 4.1 which categorises soils on their ability to supply and retain mineral nitrogen. The initial selection can then be checked using Table 4.1. Carefully assess the soil organic matter content when deciding if the soil is organic (10–20% organic matter for the purposes of this guide) or peaty (more than 20% organic matter). If necessary, seek professional advice on soil type assessments, remembering this will need to be done only once.
Figure 4.1 Soil category assessment
Return to Contents
Is soil mainly peat?
Is soil dark and stains fingers black or grey?
Does moist soil feel rough and gritty?
Does moist soil feel silty (smooth
and buttery)?
Can moist soil be rolled into a strong ball, or be moulded
like plasticine?
Is subsoil (>40 cm depth)
sand- or sandstone-based?
Is soil silty to 100 cm depth
or more?
Is subsoil (>40 cm depth)
clay-based?
Is soil over chalk, limestone or other
rock (excluding sandstone) which is within 40 cm of the soil surface?
Peaty soil
Organic soil
Light sand soil
Deep silty soil
Medium soils
Deep clayey soil
Shallow soil
YES
YES
YES
YES
YES YES
YES YES
YES
NO
NO
NO
NO
NO
NO
NO
NO

8
Calculating Soil Nitrogen Supply
Table 4.1 Soil category assessment
Return to Contents
Light sand soils Soils which are sand, loamy sand or sandy loam to 40 cm depth and are sand or loamy sand between 40–80 cm, or over sandstone rock.
Soils in this category have poor water-holding capacity and retain little nitrogen.
Soil category Description of soil types within category Properties
Medium soils
Organic soils
Shallow soils
Deep clayey soils
Mostly medium-textured mineral soils that do not fall into any other soil category. These include sandy loams over clay deep loams, and silty or clayey topsoils that have sandy or loamy subsoils.
Soils that are predominantly mineral but with between 10–20% organic matter to depth. These can be distinguished by darker colouring that stains the fingers black or grey.
Soils over impermeable subsoils and those where the parent rock (chalk, limestone or other rock) is within 40 cm of the soil surface. Sandy soils developed over sandstone rock should be regarded as light sand soils.
Soils with predominantly sandy clay loam, silty clay loam, clay loam, sandy clay, silty clay or clay topsoil overlying clay subsoil to more than 40 cm depth. Deep clayey soils normally need artificial field drainage.
Soils in this category have moderate ability to retain nitrogen and allow average rooting depth.
Soils in this category are able to retain more nitrogen than lighter soils and have higher nitrogen mineralisation potential.
Soils in this category are less able to retain or supply nitrogen at depth.
Deep silty soilsSoils of sandy silt loam, silt loam or silty clay loam textures to 100 cm depth or more. Silt soils formed on marine alluvium, warp soils (river alluvium) and brickearth soils are in this category. Silty clays of low fertility should be regarded as other mineral soils.
Soils in this category are able to retain more nitrogen than lighter soils and allow rooting to greater depth.
Soils in this category are able to retain more nitrogen than lighter soils.
Peat soils Soils that contain more than 20% organic matter derived from sedge or similar peat material.
Soils in this category have very high nitrogen mineralisation potential.

9
Calculating Soil Nitrogen Supply
Step 2. Identify the previous cropUsually, this is straightforward, but sometimes clarification may be needed:
High residual nitrogen vegetables (‘high N vegetables’) are leafy, nitrogen-rich brassica crops such as calabrese, Brussels sprouts and some crops of cauliflower where significant amounts of crop debris are returned to the soil, especially in rotations where an earlier brassica crop has been grown within the previous twelve months. To be available for crop uptake, this organic nitrogen must have had time to mineralise but the nitrate produced must not have been at risk to loss by leaching.
Medium residual nitrogen vegetables (‘medium N vegetables’) are crops such as lettuce, leeks and long-season brassicas, e.g. Dutch white cabbage, where a moderate amount of crop debris is returned to the soil.
Low residual nitrogen vegetables (‘low N vegetables’) are crops such as carrots, onions, radish, swedes or turnips where the amount of crop residue is relatively small.
Step 3. Select the rainfall range for the field The appropriate rainfall category should be identified, based on either annual rainfall or excess winter rainfall. Ideally, an estimate of excess winter rainfall is required because this is closely related to drainage by which nitrate will be lost through leaching. Figure 4.2 shows long-term (1981–2010) average excess winter rainfall which, in an average year, can be used to select the rainfall category.
There are three SNS Index tables representing ‘low rainfall’ (annual rainfall less than 600 mm, or less than 150 mm excess winter rainfall), ‘moderate rainfall’ (between 600–700 mm annual rainfall, or 150–250 mm excess winter rainfall), and ‘high rainfall’ areas (over 700 mm annual rainfall, over 250 mm excess winter rainfall).
Figure 4.2 Excess winter rainfall (mm)
Step 4. Identify the provisional SNS Index using the appropriate table Tables 4.2 (low rainfall), 4.3 (moderate rainfall) and 4.4 (high rainfall) should be used where the field has not been in grass within the past three years. Select one of these tables according to rainfall for the field. Take account of the footnotes to the tables.
Higher than typical Indices can occur where there has been a history of grassland or frequent applications of organic manures. The Measurement Method is recommended in these situations (page 13).
If grass has been grown in the previous three years, also look at Table 4.5. Select the higher of the Index levels based on the last crop grown (from Table 4.2, 4.3 or 4.4) and on the grass history (from Table 4.5).
Further informationAHDB provides Excess Winter Rainfall (EWR) data for the current seasonahdb.org.uk/ewr
Return to Contents

10
Calculating Soil Nitrogen Supply
Table 4.2. SNS Indices for low rainfall (500–600 mm annual rainfall, up to 150 mm excess winter rainfall) – based on the last crop grown
Table 4.3. SNS Indices for moderate rainfall (600–700 mm annual rainfall, or 150–250 mm excess winter rainfall) – based on the last crop grown
Return to Contents
Previous crop
Soil category
Lightsand soils or shallow soils over sandstone
Medium soils or
shallow soils not over
sandstone
Deep clayey soils
Deep silty soils
Organic soils
Peatsoils
Beans 1 2 3 3
All cropsin SNS Index 3, 4, 5 or 6. Consult a FACTS Qualified Adviser.
All crops in SNS Index 4, 5 or 6. Consult a FACTS Qualified Adviser.
Cereals 0 1 2 2
Forage crops (cut) 0 1 2 2
Oilseed rape 1 2 3 3
Peas 1 2 3 3
Potatoes 1 2 3 3
Sugar beet 1 1 2 2
Uncropped land 1 2 3 3
Vegetables (low N)a 0 1 2 2
Vegetables (medium N)a 1 3 3b 3b
Vegetables (high N)a 2 4b 4b 4b
Previous crop
Soil category
Lightsand soils or shallow soils over sandstone
Medium soils or
shallow soils not over
sandstone
Deep clayey soils
Deep silty soils
Organic soils
Peatsoils
Beans 1 2 2 3
All cropsin SNS Index 3, 4, 5 or 6. Consult a FACTS Qualified Adviser.
All crops in SNS Index 4, 5 or 6. Consult a FACTS Qualified Adviser.
Cereals 0 1 1 1
Forage crops (cut) 0 1 1 1
Oilseed rape 0 2 2 2
Peas 1 2 2 3
Potatoes 0 2 2 2
Sugar beet 0 1 1 1
Uncropped land 1 2 2 2
Vegetables (low N)a 0 1 1 1
Vegetables (medium N)a 0 2 3 3
Vegetables (high N)a 1 3 4 4
a. Refer to Step 2.
b. Index may need to be increased by up to 1 where significantly larger amounts of leafy residues are incorporated (see Step 5). Where there is uncertainty, soil sampling for SMN may be appropriate.
a. Refer to Step 2.

11
Calculating Soil Nitrogen Supply
Table 4.4. SNS Indices for high rainfall (over 700 mm annual rainfall, or over 250 mm excess winter rainfall) – based on the last crop grown
Table 4.5. SNS Indices following ploughing out of grass leys
Return to Contents
Previous crop
Soil category
Lightsand soils or shallow soils over sandstone
Medium soils or
shallow soils not over
sandstone
Deep clayey soils
Deep silty soils
Organic soils
Peatsoils
Beans 0 1 2 2
All cropsin SNS Index 3, 4, 5 or 6. Consult a FACTS Qualified Adviser.
All crops in SNS Index 4, 5 or 6. Consult a FACTS Qualified Adviser.
Cereals 0 1 1 1
Forage crops (cut) 0 1 1 1
Oilseed rape 0 1 1 2
Peas 0 1 2 2
Potatoes 0 1 1 2
Sugar beet 0 1 1 1
Uncropped land 0 1 1 2
Vegetables (low N)a 0 1 1 1
Vegetables (medium N)a 0 1 1 2
Vegetables (high N)a 1b 2 2 3
a. Refer to Step 2.
b. Index may need to be lowered by 1 where residues are incorporated in the autumn and not followed immediately by an autumn-sown crop.
SNS Index
Light sands or shallow soils over sandstone – all rainfall areas Year 1 Year 2 Year 3All leys with 2 or more cuts annually receiving little or no manure1–2 year leys, low N1–2 year leys, 1 or more cuts3–5 year leys, low N, 1 or more cuts
0 0 0
1–2 year leys, high N, grazed3–5 year leys, low N, grazed3–5 year leys, high N, 1 cut then grazed
1 2 1
3–5 year leys, high N, grazed 3 2 1
Other medium soils and shallow soils – not over sandstone – all rainfall areasAll leys with 2 or more cuts annually receiving little or no manure1–2 year leys, low N1–2 year leys, 1 or more cuts3–5 year leys, low N, 1 or more cuts
1 1 1
1–2 year leys, high N, grazed3–5 year leys, low N, grazed3–5 year leys, high N, 1 cut then grazed
2 2 1
3–5 year leys, high N, grazed 3 3 2
Deep clayey soils and deep silty soils in low rainfall areas (500–600 mm annual rainfall)All leys with 2 or more cuts annually receiving little or no manure1–2 year leys, low N1–2 year leys, 1 or more cuts3–5 year leys, low N, 1 or more cuts
2 2 2
1–2 year leys, high N, grazed3–5 year leys, low N, grazed3–5 year leys, high N, 1 cut then grazed
3 3 2
3–5 year leys, high N, grazed 5 4 3
Deep clayey soils and deep silty soils in moderate (600–700 mm annual rainfall) or high (over 700 mm annual rainfall) rainfall areas
All leys with 2 or more cuts annually receiving little or no manure1–2 year leys, low N1–2 year leys, 1 or more cuts3–5 year leys, low N, 1 or more cuts
1 1 1
1–2 year leys, high N, grazed3–5 year leys, low N, grazed3–5 year leys, high N, 1 cut then grazed
3 2 1
3–5 year leys, high N, grazed 4 3 2

12
Calculating Soil Nitrogen Supply
The Indices shown in Table 4.5 assume that little or no organic manure has been applied. Where silage fields have received the organic manure produced by livestock that have eaten the silage and the manure has been applied in spring, such fields should be regarded as containing nitrogen residues equivalent to a previous grazing history.
‘Low N’ grassland means average annual inputs of less than 250 kg N/ha in fertiliser plus crop-available nitrogen in manure used in the last two years, or swards with little clover.
‘High N’ grassland means average annual applications of more than 250 kg N/ha in fertiliser plus crop-available nitrogen in manure used in the last two years, or clover-rich swards or lucerne.
Step 5. Make any necessary adjustments to the SNS Index When using the Field Assessment Method, it is not necessary to estimate the amount of nitrogen taken up by the crop over winter. This is already taken into account in the tables.
Manure history: Where regular applications of organic manures have been made to previous crops in the rotation, increase the Index value by one or two levels depending on manure type, application rate and frequency of application.
Field vegetables as previous crop: On medium, deep silty or deep clayey soils, nitrogen residues in predominantly vegetable rotations can persist for several years, especially in the drier parts of the country. This is likely to be especially evident following ‘high’ or ‘medium N vegetables’. The SNS tables make some allowance for this long persistency of nitrogen residues, but the Index level may need to be adjusted upwards, particularly where:
• Winter rainfall is low
• Where the history of vegetable cropping is longer than one year
• In circumstances where larger than average amounts of crop residue or unused fertiliser are left behind (see Footnote to Table 4.2)
In rotations where vegetable crops are grown infrequently and when there is uncertainty, soil sampling for SMN may be appropriate.
Fertiliser residues from previous crop: The Index assessments assume that the previous crop grew normally and that it received the recommended rate of nitrogen applied as fertiliser and/or organic manures. The Index should be increased if there is reason to believe nitrogen residues are likely to be greater than normal and these residues will not be lost by leaching. This could occur where a cover crop was sown in autumn and grew well over winter. The Index may need to be adjusted downwards if there is reason to believe nitrogen residues are likely to be smaller than usual.
After any adjustment, the SNS Index can be used in the recommendation tables.Point to consider • The nitrogen contribution from manures applied after harvest of the
previous crop should not be considered when deciding the SNS Index; this contribution should be deducted from the recommended nitrogen application rate using the information in Section 2: Organic Materials
Return to Contents

13
Calculating Soil Nitrogen Supply
Measurement MethodThis method is particularly appropriate where the SNS is likely to be large and uncertain. This includes:
• Fields with a history of organic manure application and vegetable rotations where the timing of residue incorporation can strongly affect Soil Mineral Nitrogen (SMN) for the following crop
• Fields where long leys or permanent pasture have been recently ploughed out (but not in the first year after ploughing out)
• Fields where there have been problems such as regular lodging of cereals, very high grain protein or nitrogen contents, or previous crop failure (for example due to drought or disease)
• Fields where there is significant variation in soil texture and/or large amounts of crop residues are incorporated; nitrogen residues also can be large following outdoor pigs
The SNS Index can be identified using the results of direct measurement of SMN to 90 cm depth in spring, 60 cm depth in autumn/early winter, or to maximum rooting depth in shallow soils over rock. The crop nitrogen content (at the time of soil sampling) and an estimate of net mineralisable nitrogen must be added to the SMN result when calculating the SNS.
SNS is likely to be low on light sand and shallow soils that have not received regular additions of organic manure or crop residues, particularly in moderate to high rainfall areas. In this scenario, prediction of SNS using the Field Assessment Method is advised.
The Measurement Method is not recommended for peat soils, or in the first season after ploughing out long leys or permanent pasture, where net mineralisation can be very large and uncertain and the measured SMN may be a relatively small component of SNS. For these soils, the Field Assessment Method or local experience will be better guides to SNS.
The Measurement Method does not take account of the available nitrogen supplied from organic materials applied after the date of soil sampling for SMN. The available nitrogen from materials applied after sampling should be calculated separately using the information in Section 2: Organic materials and deducted from the nitrogen rate shown in the appropriate recommendation table.
The nitrogen contribution from materials applied before sampling for SMN will be largely taken account of in the measured value and should not be calculated separately.
When using the Measurement Method, there are four steps to follow:
Step 1. Measure Soil Mineral Nitrogen (SMN) Step 2. Estimate nitrogen already in the crop Step 3. Make an adjustment for net mineralisable nitrogen Step 4. Identify Soil Nitrogen Supply (SNS) Index
Points to consider • Do not confuse Soil Nitrogen Supply (SNS) and Soil Mineral
Nitrogen (SMN)
• SMN is the measured amount of mineral nitrogen (nitrate-N plus ammonium-N) in the soil profile
• The Measurement Method is not suitable for organic and peaty soils as SNS (due to mineralisation of soil organic matter) is unpredictable
• SNS = an estimate of crop N (at time of sampling) + a measurement of SMN + an estimate of subsequent N mineralisation
Return to Contents

14
Calculating Soil Nitrogen Supply
In detail, these four steps are:
Step 1. Measure Soil Mineral Nitrogen (SMN)Soil sampling must be done well to avoid misleading results and expensive mistakes.
Guidance on how to collect an SMN sample
• In most situations, sampling in late winter or early spring before nitrogen fertiliser is applied gives slightly better predictions of SNS than sampling in the autumn, because overwinter leaching is accounted for, especially in high rainfall areas or on shallow or light sand soils. On soils less prone to leaching, sampling in autumn or early spring is equally effective
• Avoid sampling within two to three months after application of nitrogen fertiliser or organic manures, or within a month after sowing
• Areas of land known to differ in some important respects (e.g. soil type, previous cropping, manure or nitrogen fertiliser application) should be sampled separately
• Do not sample unrepresentative areas, such as ex-manure heaps or headlands
• Avoid collecting and sending samples immediately before the weekend or a public holiday
• Samples must be taken to be representative of the area sampled. A minimum of 10–15 soil cores should be taken following a ‘W’ pattern across each field/area to be sampled
• In larger fields (10–20 ha), increase the number of cores to 15–20, unless the soil type is not uniform, in which case more than one sample should be taken. This can be done by dividing the field into smaller blocks from each of which 10–15 soil cores are taken
• Each position should be sampled at three depths in the spring: 0–30 cm, 30–60 cm and 60–90 cm. Sampling to 60 cm is adequate in the autumn
• Samples from each depth should be bulked to form a representative sample of that depth. If the bulk sample is too big, take a representative subsample to send to the laboratory; do not stir the sample excessively
• Use appropriate packaging (normally available from the laboratory) and label samples clearly, providing as much information about the field and crop as possible
• Samples should be analysed within three days of sampling. Samples must be kept cool (2–4˚C) but not frozen during storage or transport
It is important to avoid cross-contamination of samples from different depths. Using a mechanised one-metre-long gouge auger (2.5 cm diameter) is a satisfactory and efficient method, but care must be taken to avoid excessive soil compaction and contamination between soil layers. If each depth layer is to be sampled individually by hand, a series of screw or gouge augers should be used where the auger diameter becomes progressively narrower as the sampling depth increases.
Analysis in the laboratorySamples should be analysed for nitrate-N and ammonium-N. Analytical results in mg N/kg should be converted to kg/ha, taking into account the dry bulk density of the soil, then summed to give a value for the whole soil profile. For the majority of mineral soils, a ‘standard’ bulk density of 1.33 g/ml can be used and the calculation can be simplified to:
SMN (kg N/ha) = mg N/kg x 2 (for each 15 cm layer of soil)
SMN (kg N/ha) = mg N/kg x 4 (for each 30 cm layer of soil)
SMN (kg N/ha) = mg N/kg x 8 (for each 60 cm layer of soil)
Return to Contents

15
Calculating Soil Nitrogen Supply
Step 2. Estimate nitrogen already in the cropWhere a crop is present when SMN is measured, the amount of nitrogen already taken up must be estimated. For cereals, this is often a small though important component of the SNS, but for oilseed rape it can be large.
The crop nitrogen content in cereals can be estimated according to the number of shoots present (main shoots and tillers), as follows:
Table 4.6 Estimating cereal crop N using shoot number
Large oilseed rape canopies can contain substantial amounts of nitrogen by the spring (in excess of 100 kg N/ha). Research has shown that even for large canopies all of the N in the crop can be treated as contributing to the SNS.
In oilseed rape, the crop contains around 50 kg N/ha for every unit of Green Area Index (GAI, Table 4.7). For larger canopies (GAI of 2 or more), the crop may contain closer to 40 kg N/ha per unit of GAI. Use Figure 4.3 as a guide for estimating GAI.
Table 4.7 Estimating oilseed rape crop N using GAI
Figure 4.3 Estimating the GAI of an oilseed rape crop
Shoot number/m2
Crop nitrogen content
Autumn Spring
kg N/ha
500 5 15
1,000 15 30
1,500 25 50
Oilseed rape GAICrop N
kg/ha
0.5 25
1.0 50
2.0 80–100
GAI 0.6
GAI 1.6
GAI 0.9
GAI 2.2
GAI 1.2
GAI 2.8
Alternatively, the nitrogen content of an average-density crop can be estimated by measuring the average crop height. This may not be appropriate for semi-dwarf varieties and should not be used on crops that have been flattened by snow.
Table 4.8 Estimating oilseed rape crop N using crop height
Add the estimate of crop N to the measurement of SMN.
Crop heightCrop nitrogen content
Autumn Spring
cm kg N/ha
10 35 45
15 55 65
20 75 85
Return to Contents

16
Calculating Soil Nitrogen Supply
Step 3. Make an allowance for net mineralisable nitrogenNitrogen mineralised from soil organic matter and crop debris after soil sampling is a potentially important source of nitrogen for crop uptake. However, in mineral soils of low to average organic matter content (<4% in England and Wales or <10% in Scotland and Northern Ireland), the amount of net mineralisable nitrogen will be relatively small and, for practical purposes, no further adjustment is needed when using the recommendations in this guide. The only exception being after cold winters, when an estimate of around 20 kg N/ha may be appropriate.
An adjustment may be needed where soil organic matter content is above average or where there has been a history of regular manure applications. In these situations, a commercial measurement of Additionally Available N (AAN) gives the most useful prediction of mineralisation.
As a guide, where measurement is not done, for every 1% organic matter above 4%, a topsoil may release an additional 10 kg N/ha. Therefore, a soil that has a topsoil organic matter content of 10% may release around 60 kg/ha more Soil Mineral Nitrogen than an equivalent soil with 4% organic matter content.
However, some soils with an organic matter content above 4% may release little nitrogen and local knowledge must be used when estimating mineralisable nitrogen. Therefore, it is not possible to specify a routine amount by which to adjust SNS based on soil organic matter level.
Add any adjustment for net mineralisable nitrogen to the total of SMN and nitrogen in the crop to give SNS.
Step 4. Identify Soil Nitrogen Supply (SNS) Index
Table 4.9 Soil Nitrogen Supply (SNS) Indices
Adopting changes to nitrogen useLarge SMN measurements can overestimate SNS and small SMN measurements can underestimate SNS. Uptake of soil N by crops is rarely less than 50 kg N/ha, so SNS estimates less than this should be treated as 50 kg N/ha and no less.
Unless high SNS results (>160 kg N/ha) are confidently expected, they should also be treated with caution. If SNS estimates indicate that large changes (either increases or decreases) in nitrogen fertiliser use are required, crops should be monitored closely through spring for signs of nitrogen deficiency or excess and the planned nitrogen strategy should be adjusted, if necessary. It may be best for changes in nitrogen use to be introduced gradually over a few seasons so that the effect on crop performance can be monitored.
Example 4.1Spring barley (feed) is to be grown on a light sand soil following sugar beet. Annual rainfall is 650 mm. There have been no organic manures applied or grass grown in the last five years.
Select Table 4.3 (page 10). On a light sand soil following sugar beet, the SNS Index is 0. Refer to the spring barley recommendation (Table 4.19, page 32) which gives a recommendation of 140 kg N/ha.
Return to Contents
SNS SNS Index
Less than 60 0
61–80 1
81–100 2
101–120 3
121–160 4
161–240 5
More than 240 6

17
Calculating Soil Nitrogen Supply
Example 4.3Winter wheat is grown on a medium-textured, low organic matter soil after potatoes, which received some FYM. Annual rainfall is 750 mm. The soil is sampled in early February and analysed for SMN.
The analysis report shows that the SMN (0–90 cm) is 115 kg N/ha and the crop nitrogen content is estimated to be 25 kg N/ha. Because the soil contains little organic matter, no extra allowance is made for net mineralisable nitrogen. The SNS is therefore 140 kg N/ha. Refer to Table 4.9 that shows the SNS Index is 4. Refer to the winter wheat recommendation (Table 4.16, page 28) which gives a recommendation of 120 kg N/ha for a medium soil.
Example 4.5Winter wheat is to be sown following spring barley that followed a two-year grazed ley which has been managed using 300 kg/ha/year nitrogen as manufactured fertiliser and crop-available N from manures. The soil is a deep clay in a high rainfall area.
Using Table 4.4, the SNS Index would be 1. Using Table 4.5, the previous grass management is classed as ‘high N, grazed’. The SNS Index from this Table is 2. The higher of these two Indices from Tables 4.4 and 4.5 is 2 and this should be used for the recommendation tables.
Example 4.2Sugar beet is grown on a medium soil after winter wheat; 30 m3/ha of pig slurry (4% DM) was applied in February and incorporated into the soil within six hours. Although the average annual rainfall is 650 mm, in an unusually dry winter the excess winter rainfall was found to be 100 mm.
Since the winter was dry, select Table 4.2 (SNS Indices for low rainfall areas). On a medium soil after winter wheat, the SNS Index is 1. Refer to the sugar beet recommendation (Table 4.30, page 41) which gives a recommendation of 120 kg N/ha.
Since the pig slurry was applied after harvest of the last crop, its nitrogen contribution must be calculated separately. This manure application provides 65 kg/ha of available nitrogen that is equivalent to manufactured nitrogen fertiliser (Section 2: Organic materials).
120 – 65 = 55 kg N/ha as fertiliser should be applied.
Example 4.4Winter barley is to be sown following a three-year pure grass ley which has been managed in the last two years using 280 kg/ha/year nitrogen as manufactured fertiliser and crop-available N from manures. An average application of slurry has been applied in early spring each year, before taking one cut of silage followed by grazing.
The soil is a medium soil in a moderate rainfall area.
The previous grass management is classed as ‘high N’. Using Table 4.5 for medium soils, select the category ‘3–5 year leys, high N, grazed’. The SNS Index appropriate for the winter barley crop is Index 3. If regular applications of bulky organic manures had been applied in previous years, the Index value could be increased by one or two levels. In this case, slurry was applied. The SNS Indices for the next two crops following the winter barley are Index 3 and Index 2, respectively.
Return to Contents

18
Phosphate, potash and magnesium recommendations
Phosphate, potash and magnesium recommendationsCurrent phosphate, potash and magnesium recommendations are based on achieving and maintaining target Soil Indices for each nutrient in the soil throughout the crop rotation. Soil analysis should be done every 3–5 years. This is now a requirement for England under Defra Farming Rules for Water. The use of regular soil analysis as a basis for making fertiliser decisions and the procedure for taking soil samples is described on page 19.
The phosphate and potash recommendations shown at Index 2 and 2-, respectively, are those required to replace the offtake and maintain target Soil Indices. The larger recommended applications for soils at Index 0 and 1 will bring the soil to Index 2 over a number of years. However, top dressing to the soil surface should be avoided where there is a high risk of run-off into neighbouring watercourses. By not applying fertiliser or manures at Index 3 or above, soil will run down over a number of years to the target Index.
Phosphate and potash recommendations shown in this guide are those required to replace the offtake of the yield shown. The recommendation should be increased or decreased where yields are expected to be substantially more or less than this. The amount to apply can be calculated using records of yield and crop nutrient contents per tonne of yield determined by analysis, or assuming guide values given in Table 4.11.
Recommendations are appropriate where the phosphate or potash balance for preceding crops has been close to neutral. Adjustments can be made where the balance for the preceding crop was significantly positive or negative. This might occur where actual yields were substantially different from those expected, or where there was a change of plan on straw removal. A phosphate or potash ‘holiday’ can result in a need for greater than normally recommended amounts for following crops.
Points to consider • Recommendations assume good soil structure, water supply
and pest and disease control
• Recommendations are given as phosphate (P2O5), potash (K2O) and magnesium oxide (MgO). Conversion tables (metric–imperial, oxide–element) are given on page 46
• Organic materials supply phosphate and potash which contribute to crop requirements. Don’t forget to make allowance for the phosphate and potash applied in organic materials (Section 2: Organic materials)
• All recommendations are given for the midpoint of each Index. For some crops, there are different recommendations depending on whether the soil is in the lower half (2-) or upper half (2+) of K Index 2
• Where a soil analysis value (as given by the laboratory) is close to the range of an adjacent Index, the recommendation may be reduced or increased slightly, taking account of the recommendation given for the adjacent Index. Small adjustments of less than 10 kg/ha are generally not justified
• Where more or less phosphate and potash are applied than suggested in the tables, adjustments can be made later in the rotation
Return to Contents

19
Phosphate, potash and magnesium recommendations
Taking soil samples for phosphorus, potassium and magnesiumSoil sampling must be done accurately to avoid misleading results and expensive mistakes.
• The soil in each field should be sampled every 3–5 years
• Collect samples at the same point in the rotation and well before growing a sensitive crop, e.g. sugar beet
• Ideally, sample immediately after the harvest of the previous crop
• Do not sample within six months of a lime or fertiliser application (except nitrogen) and avoid sampling when the soil is very dry
• Do not take samples in headlands, or in the immediate vicinity of hedges, trees or other unusual features
• The soil sample must be representative of the area sampled. Areas of land known to differ in some important respects (e.g. soil type, previous cropping, applications of manure, fertiliser or lime) should be sampled separately. Small areas known to differ from the majority of a field should be excluded from the sample
• Ideally, the sampled area should be no larger than four hectares
• Clean tools before starting and before sampling a new area
• Walk a ‘W’ pattern across the sampling area, stopping at least 25 times
• At each point, collect a subsample (core) to 15 cm depth using a gouge corer or screw auger. However, if the land is min-tilled, phosphate and potash will tend to accumulate near the soil surface and a 15 cm sample will overestimate nutrient concentrations to normal plough depth. In this case, samples are better taken to about 23 cm
• The subsamples should be bulked to form a representative sample and sent to the laboratory for analysis
• Use appropriate packaging (normally available from the laboratory) and label samples clearly, providing as much information about the field and crop as possible
On soils where acidity is known to occur, more frequent testing may be needed than the four-year cycle used for phosphate, potash and magnesium. Since acidity can occur in patches, spot testing with a soil indicator test across the field is often useful. Soil indicator tests can be useful on soils which contain fragments of free lime, since these can give a misleadingly high pH when analysed following grinding in the laboratory.
Most UK laboratories are members of the PAAG that offers farmers and advisers confidence in laboratory analysis.
• Proficiency tests (often called ring tests) carried out by Wageningen University, guarantee that analysis from any member can be trusted wepal.nl
• List of UK laboratories nutrientmanagement.org/what-we-do/support-and-advice/ find-a-laboratory
• Sampling guidelines nutrientmanagement.org/library/sampling
Return to Contents
20
Phosphate, potash and magnesium recommendations
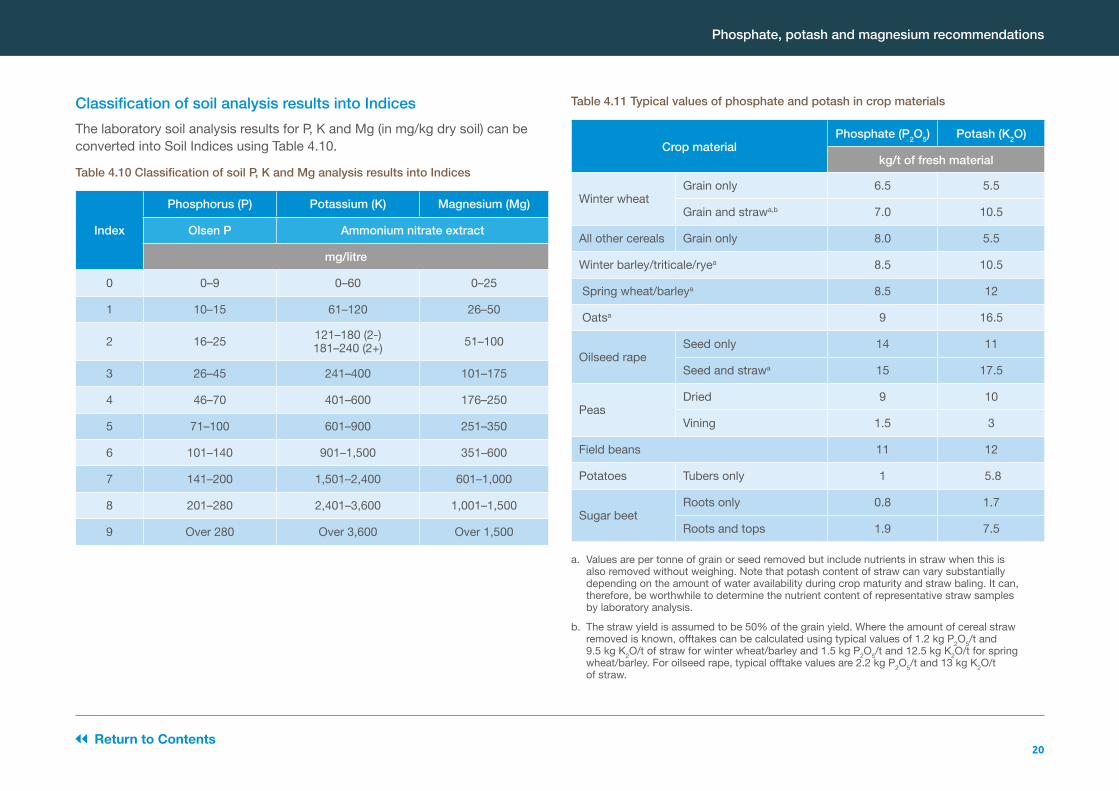
Table 4.11 Typical values of phosphate and potash in crop materialsClassification of soil analysis results into IndicesThe laboratory soil analysis results for P, K and Mg (in mg/kg dry soil) can be converted into Soil Indices using Table 4.10.
Table 4.10 Classification of soil P, K and Mg analysis results into Indices
Index
Phosphorus (P) Potassium (K) Magnesium (Mg)
Olsen P Ammonium nitrate extract
mg/litre
0 0–9 0–60 0–25
1 10–15 61–120 26–50
2 16–25 121–180 (2-) 181–240 (2+) 51–100
3 26–45 241–400 101–175
4 46–70 401–600 176–250
5 71–100 601–900 251–350
6 101–140 901–1,500 351–600
7 141–200 1,501–2,400 601–1,000
8 201–280 2,401–3,600 1,001–1,500
9 Over 280 Over 3,600 Over 1,500
Crop materialPhosphate (P2O5) Potash (K2O)
kg/t of fresh material
Winter wheatGrain only 6.5 5.5
Grain and strawa,b 7.0 10.5
All other cereals Grain only 8.0 5.5
Winter barley/triticale/ryea 8.5 10.5
Spring wheat/barleya 8.5 12
Oatsa 9 16.5
Oilseed rapeSeed only 14 11
Seed and strawa 15 17.5
PeasDried 9 10
Vining 1.5 3
Field beans 11 12
Potatoes Tubers only 1 5.8
Sugar beetRoots only 0.8 1.7
Roots and tops 1.9 7.5
a. Values are per tonne of grain or seed removed but include nutrients in straw when this is also removed without weighing. Note that potash content of straw can vary substantially depending on the amount of water availability during crop maturity and straw baling. It can, therefore, be worthwhile to determine the nutrient content of representative straw samples by laboratory analysis.
b. The straw yield is assumed to be 50% of the grain yield. Where the amount of cereal straw removed is known, offtakes can be calculated using typical values of 1.2 kg P2O5/t and 9.5 kg K2O/t of straw for winter wheat/barley and 1.5 kg P2O5/t and 12.5 kg K2O/t for spring wheat/barley. For oilseed rape, typical offtake values are 2.2 kg P2O5/t and 13 kg K2O/t of straw.
Return to Contents

21
Phosphate, potash and magnesium recommendations
Example 4.6Using typical nutrient contents from Table 4.11, estimate P and K offtake in winter wheat. Winter wheat yields 10 t/ha of grain. Straw is baled and removed from the field.
Offtake = yield (t) x grain and straw offtake (kg of nutrient/t)Phosphate offtake = 10 x 7.0 = 70 kg P2O5/ha Potash offtake = 10 x 10.5 = 105 kg K2O /ha
Crop phosphate and potash requirements at different Indices Soil P and K status is best monitored through soil analysis used alongside crop requirements to generate P and K recommendations. Recommendations in Table 4.12 and 4.13 are based around phosphate and potash offtakes in the harvested crop. If the crop yield or nutrient contents are above average, the crop removed more P and K, which must be replaced if the soil is at or below the target index.
If the soil is at target Index (2 for P and 2- for K), only maintenance applications should be made to replace offtakes (Table 4.11 or from grain analysis). If the soil is above the target Index, phosphate or potash applications can be reduced or omitted to allow the Index to decrease over years. However, yield responses are likely where the Soil Index is lower than target. In such cases, phosphate and/or potash should be applied annually and soil P and K Indices should be built up through application of more phosphate or potash than the crop offtake. Further information on building up or running down soil P and K Indices can be found in Section 1: Principles of nutrient management and fertiliser use.
If the soil analysis shows that a particular field is on the borderline between two Indices, P and K rates can be fine-tuned by interpolation, for example by averaging recommendations for Indices 0 and 1.
Grain analysis to improve phosphate managementGrain P and K analyses can provide better estimates of crop phosphate and potash offtakes than the typical values in Table 4.11. This information also complements soil analyses for P and K. AHDB-funded research on P nutrition has shown that the critical level of grain P in winter wheat is 0.32% (or 3,200 mg/kg). Grain P contents repeatedly below this level indicate crop P uptake was deficient enough to reduce grain yield.
Crop P deficiencies may arise through low soil P supplies, poor rooting and/or poor growing conditions (e.g. dry topsoil). If soil conditions are satisfactory but a field repeatedly shows grain P deficiency, available soil P should be increased for future crops. For example, by applying organic materials or inorganic phosphate more frequently or at increased rates. Subsequent grain analyses should confirm if this strategy was successful.
Collection of grain samples
• Grain samples must be representative of fields or areas from where routine soil analyses are taken
• Samples should not be taken from stores where grain from different fields has been combined
• Representative samples should be taken from each field, by sampling grain from each trailer load
• Sampled grain should be mixed and approximately 200 g should be put in a clearly labelled plastic bag, with sufficient information to identify the farm and field, and sent to the laboratory
Interpretation of grain analysis resultsTo calculate grain phosphate and potash offtakes, grain P and K concentrations should be converted to kg P2O5 and K2O per tonne of grain at 15% moisture using the conversion factors on page 46.
Return to Contents

22
Phosphate, potash and magnesium recommendations/Sulphur and sodium recommendations/Leaf analysis
Sulphur and sodium recommendationsSulphur and sodium recommendations are given for each crop, where appropriate, because they are not required by all crops or in all parts of England and Wales. Farmers are advised to monitor the sulphur requirements of their crops because the risk of sulphur deficiency is increasing as atmospheric deposition of sulphur declines. Organic manures can supply useful amounts of sulphur (Section 2: Organic materials).
All sulphur recommendations are given as SO3 and sodium recommendations as Na2O. Conversion tables (metric–imperial, oxide–element) are given on page 46. If applying liquid fertilisers, manufacturers can supply tables which convert kg/ha of nutrient to litres/ha of product.
Leaf analysisSuspected nutrient deficiencies based on the appearance of symptoms can be confirmed by leaf nutrient analysis. In such cases, the leaf nutrient concentrations will usually be well below the normal range and there should, therefore, be little doubt about the diagnosis.
Interpretation of laboratory results is possible by comparison with normal levels expected for the crop. Values presented in this guide are based on the best information available.
Guidance on how to collect a leaf tissue sampleIt is essential to collect leaf samples that accurately reflect the nutritional status of the crop submitted for analysis. Therefore, to adequately represent any field or smaller area of crop, the following sampling procedure should be followed:
• If possible, collect samples early in the season at stem extension rather than after symptoms become visible
• It is recommended to take two tissue samples approximately two weeks apart to help distinguish between permanent and transient sulphur deficiency
• Samples should not be taken from crops that have recently been sprayed with nutrients or fungicides
• Avoid collecting and sending samples immediately before the weekend or a public holiday
• If areas of fields differ significantly, sample each separately
• Walk a ‘W’ pattern across the sampling area, stopping at least 25 times
• At each point, collect the youngest fully expanded leaf from 2–3 plants
• Ensure there is no soil contamination
• Do not sample diseased or dead plants, those damaged by insects and mechanical equipment or stressed by extremes of cold, heat or moisture
• Dry any wet leaves and immediately send to a laboratory between sheets of paper towel
• Use appropriate packaging (normally available from the laboratory) and label samples clearly, providing as much information about the field and crop as possible
• Do not post fresh material in an airtight container
• Send by overnight courier or deliver directly to the analytical laboratory
Return to Contents
Example 4.7Using nutrient contents from laboratory analysis and conversion factors (on page 46), estimate nutrient removal.
Laboratory analysis shows that the grain P content was 0.45% and grain K was 0.40% from a winter wheat crop yielding 10 t/ha, with straw incorporated.
Nutrient removal = yield x grain P/K content x conversion factorPhosphate = 10 x 0.45 x 19.5 = 88 kg P2O5 /ha Potash = 10 x 0.40 x 10.2 = 41 kg K2O /ha

23
Selecting the most appropriate fertiliser/Cereals
Selecting the most appropriate fertiliserFor a single nutrient, the recommended amount can be applied using a straight fertiliser. Where more than one nutrient is required, a compound or blended fertiliser can be used. In this case, the compound or blend selected will depend on the ratio of the nutrients in the fertiliser and the amount applied should give as near the recommended amount of each nutrient as possible.
Often, it will not be possible to exactly match the recommendations with available fertilisers. In most cases, the first priority is to get the amount of nitrogen correct, because crops respond most to nitrogen.
Slight variation in the rates of phosphate or potash will have less effect on yield, especially on Index 2 soils, and any discrepancy can be corrected in fertiliser applications to future crops. The approximate nutrient content of commonly used fertilisers is described on page 47.
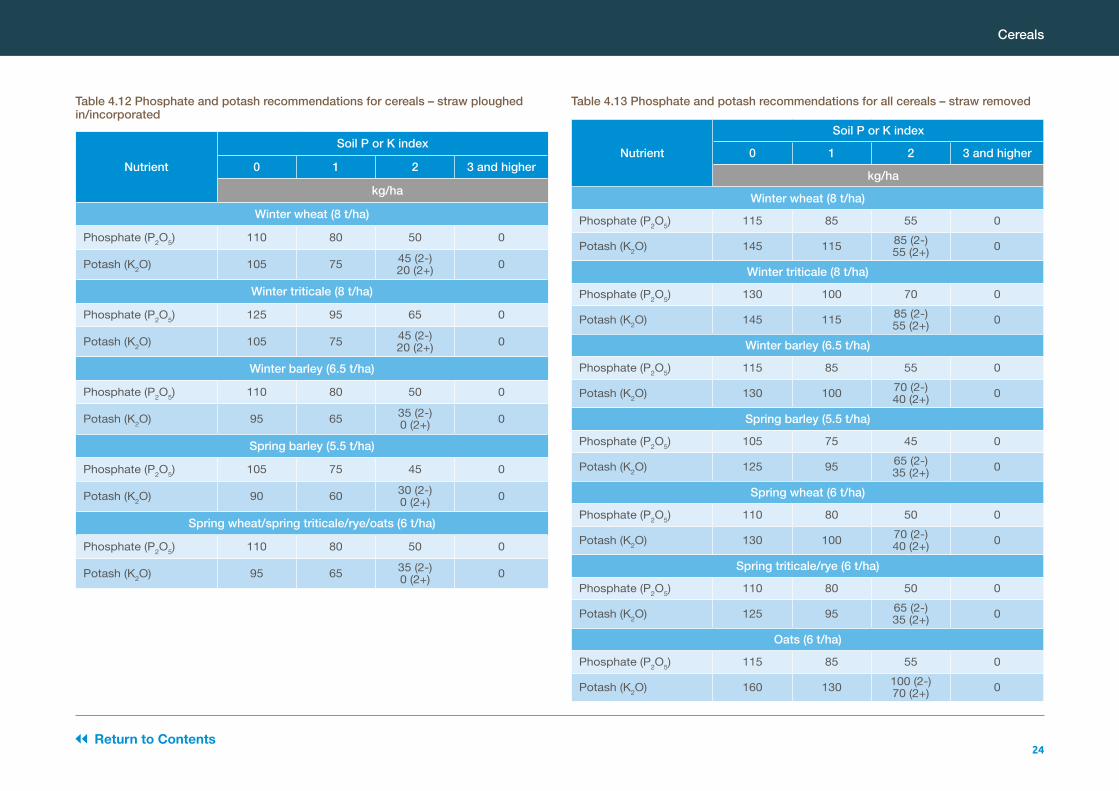
CerealsAll Cereals – phosphate, potash, magnesium and sulphurPhosphate and potashThe amounts of phosphate and potash needed to replace offtake and maintain the soil at the target Index (P Index 2 and K Index 2-) are shown in Table 4.12 and Table 4.13. Table 4.12 shows the maintenance applications for each crop when straw is incorporated. Table 4.13 shows the maintenance applications when straw is removed (and with straw yield assumed to be 50% of grain yield).
The amounts of phosphate and potash are appropriate to the grain yields shown for each crop in the table. The phosphate and potash recommendations can be adjusted if yields are likely to be larger or smaller than those shown.
To adjust the amounts, multiply the difference in expected grain yield by the phosphate and potash content per tonne of grain yield using the appropriate value for where straw is either incorporated or removed, as given in Table 4.11. Then add this value to (for larger yields), or subtract from (for smaller yields), the amounts in Table 4.12.
For example, at P Index 1, the phosphate recommendation for wheat with an expected yield of 10 t/ha where straw is incorporated is 80 + (2 x 6.5) = 93 kg/ha.
Where the weight of straw to be removed can be estimated separately, use the amounts of phosphate and potash per tonne of straw shown in the footnotes of Table 4.11 to calculate the amounts removed in the straw. Add these to the appropriate amounts for grain yield in order to calculate the overall amounts removed.
Crops grown on soil at Index 0 and 1 would be expected to respond to the higher amounts of phosphate and potash shown in the table. Over a number of years, these extra amounts of fertiliser will help to raise most soils, except light sands, to Index 2. At Index 3 and above, no phosphate and potash need be applied, but analyse soil regularly.
At Index 2, phosphate and potash can be applied when convenient during the year, but at Index 0 and 1, they should be applied annually and worked into the seedbed.
To avoid damage to germinating seedlings, do not combine drill more than 150 kg/ha of nitrogen plus potash on sandy soils.
Return to Contents
24
Cereals
Nutrient
Soil P or K index
0 1 2 3 and higher
kg/ha
Winter wheat (8 t/ha)
Phosphate (P2O5) 110 80 50 0
Potash (K2O) 105 75 45 (2-)20 (2+) 0
Winter triticale (8 t/ha)
Phosphate (P2O5) 125 95 65 0
Potash (K2O) 105 75 45 (2-)20 (2+) 0
Winter barley (6.5 t/ha)
Phosphate (P2O5) 110 80 50 0
Potash (K2O) 95 65 35 (2-)0 (2+) 0
Spring barley (5.5 t/ha)
Phosphate (P2O5) 105 75 45 0
Potash (K2O) 90 60 30 (2-)0 (2+) 0
Spring wheat/spring triticale/rye/oats (6 t/ha)
Phosphate (P2O5) 110 80 50 0
Potash (K2O) 95 65 35 (2-)0 (2+) 0
Table 4.12 Phosphate and potash recommendations for cereals – straw ploughed in/incorporated
Table 4.13 Phosphate and potash recommendations for all cereals – straw removed
Return to Contents
Nutrient
Soil P or K index
0 1 2 3 and higher
kg/ha
Winter wheat (8 t/ha)
Phosphate (P2O5) 115 85 55 0
Potash (K2O) 145 115 85 (2-)55 (2+) 0
Winter triticale (8 t/ha)
Phosphate (P2O5) 130 100 70 0
Potash (K2O) 145 115 85 (2-)55 (2+) 0
Winter barley (6.5 t/ha)
Phosphate (P2O5) 115 85 55 0
Potash (K2O) 130 100 70 (2-)40 (2+) 0
Spring barley (5.5 t/ha)
Phosphate (P2O5) 105 75 45 0
Potash (K2O) 125 95 65 (2-)35 (2+) 0
Spring wheat (6 t/ha)
Phosphate (P2O5) 110 80 50 0
Potash (K2O) 130 100 70 (2-)40 (2+) 0
Spring triticale/rye (6 t/ha)
Phosphate (P2O5) 110 80 50 0
Potash (K2O) 125 95 65 (2-)35 (2+) 0
Oats (6 t/ha)
Phosphate (P2O5) 115 85 55 0
Potash (K2O) 160 130 100 (2-)70 (2+) 0

25
Using sulphur to maximise qualityFurther clarity on application rates has been provided by AHDB trials that have shown that acrylamide formation can be minimised by applying 50 kg SO3/ha to sulphur-deficient wheat grown for flour milling or cereal foods.
Acrylamide is a processing contaminant that has been found in cooked foods. It can form during high-temperature cooking and processing of wheat. Acrylamide formation in wheat-based products is linked to the levels of the amino acid asparagine. AHDB trials have shown that asparagine levels, and hence acrylamide formation, can increase if wheat is sulphur-deficient. Processors have modified their methods to minimise the formation of acrylamide, but growers can also minimise formation by applying sulphur where deficiency is likely.
In addition to reducing acrylamide formation, AHDB trials have shown that loaf volume and malting quality of wheat can be improved by correctly fertilising with sulphur.
Cereals
Table 4.14 Estimating the risk of sulphur deficiency for cereal crops
Soil textureWinter rainfall (Nov–Feb)
Low (<175 mm)
Medium(175–375 mm)
High(>375 mm)
Sandy High
Loamy and coarse silty Low High
Clay, fine silty or peaty Low High
Return to Contents
MagnesiumAt Mg Index 0, magnesium fertiliser should be applied every 3–4 years at 50–100 kg MgO/ha.
SulphurNot all cereal crops will require sulphur and the responsiveness of a crop to the application of sulphur is dependent on soil texture and winter rainfall.
Use Table 4.14 to assess the risk of deficiency. If deficiency is suspected, tissue and grain analysis can be used to make a diagnosis and, if necessary, the deficiency should be treated.
There are a number of laboratory analyses that can be used to detect sulphur deficiency in leaf tissue, but AHDB trials have shown that the malate:sulphate test is the most reliable.
Where deficiency has been recognised or is expected in winter- or spring-sown cereals, apply 25–50 kg/ha SO3 as a sulphate-containing fertiliser in early March to early May for wheat and for barley between mid-March and mid-April.
Figure 4.4 The youngest leaves of sulphur-deficient cereals are often yellow
26
Cereals
Nutrient Soil risk factor Soil analysis Leaf analysis
Manganese (Mn)
Under-consolidated seedbeds; low soil temperature; low rainfall; over-liming; any soil with pH above 7.5; sandy soils with pH above 6.5; organic, peaty or marshland soil with pH above 6.0
Not reliable Deficiency is more likely below 20 mg Mn/kg
Copper (Cu) Shallow soils over chalk with high organic matter; sandy and peat soils
EDTA extract: deficiency is more likely below 1.0 mg Cu/l, unless soil organic matter is above 6%, when deficiency is more likely below 2.5 mg Cu/l
Not reliable
Zinc (Zn) Sandy soils with high pH and phosphate Index (Index 5 and higher)
EDTA extract: deficiency is more likely below 1.5 mg Zn/l
Deficiency is more likely below 15 mg Zn/kg
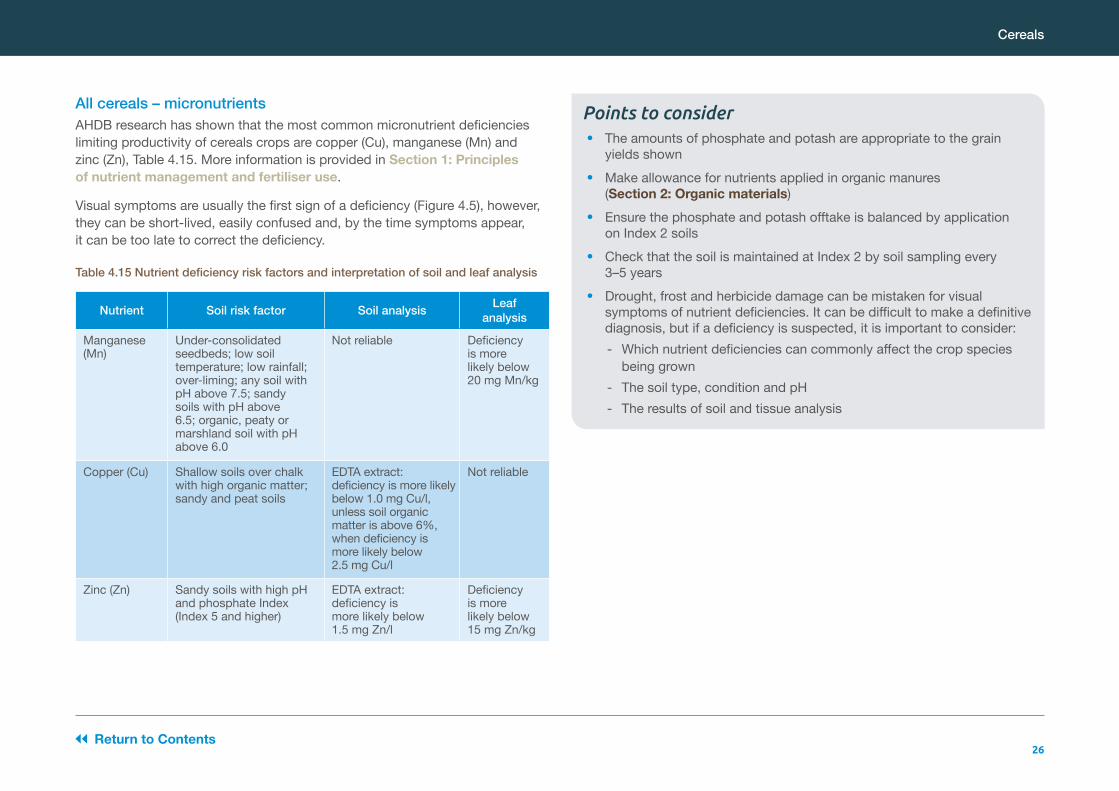
Table 4.15 Nutrient deficiency risk factors and interpretation of soil and leaf analysis
Return to Contents
All cereals – micronutrientsAHDB research has shown that the most common micronutrient deficiencies limiting productivity of cereals crops are copper (Cu), manganese (Mn) and zinc (Zn), Table 4.15. More information is provided in Section 1: Principles of nutrient management and fertiliser use.
Visual symptoms are usually the first sign of a deficiency (Figure 4.5), however, they can be short-lived, easily confused and, by the time symptoms appear, it can be too late to correct the deficiency.
Points to consider • The amounts of phosphate and potash are appropriate to the grain
yields shown
• Make allowance for nutrients applied in organic manures (Section 2: Organic materials)
• Ensure the phosphate and potash offtake is balanced by application on Index 2 soils
• Check that the soil is maintained at Index 2 by soil sampling every 3–5 years
• Drought, frost and herbicide damage can be mistaken for visual symptoms of nutrient deficiencies. It can be difficult to make a definitive diagnosis, but if a deficiency is suspected, it is important to consider:
- Which nutrient deficiencies can commonly affect the crop species being grown - The soil type, condition and pH - The results of soil and tissue analysis

27
ZincSymptoms of zinc deficiency include pale stripes appearing parallel to the midpoint of younger leaves. Affected tissue dies and turns pale brown.
Deficiencies can be treated using seed treatments, or soil- or foliar-applied fertilisers. Foliar nutrients can be applied most cost-efficiently by tank-mixing with other crop inputs, such as fungicides, but check product labels carefully for product compatibility.
©Yara UK Ltd©Yara UK Ltd ©Yara UK Ltd
Cereals
Figure 4.5 Micronutrient deficiency symptoms: copper, manganese and zinc (left to right)
Return to Contents
Treating micronutrient deficienciesOptions largely depend on when the deficiency is diagnosed. If soil analysis confirms a deficiency early in the season, liming, seed treatments, seedbed fertilisers or autumn applications are possible. If tissue analysis confirms a deficiency later in the season, treatments will be limited to foliar-applied fertilisers.
CopperSymptoms of copper deficiency include pale, twisted leaves and stunted plants. Ears are sometimes trapped in the leaf sheath and those that emerge have white tips and blind grain sites. Blackening of the ears and straw occurs in copper-deficient wheat on organic chalk soils. This symptom is not seen in wheat grown on sandy or peat soils. Awns of barley become white and brittle and purpling of the stem and nodes is also possible.
If possible, treat deficiencies using soil-applied fertilisers in the autumn. Depending on soil application rate and soil texture, copper treatments may be effective in raising soil copper levels for up to 10 years; regular soil analysis, every 3–5 years, is recommended. Deficiencies can also be treated using foliar-applied fertilisers at late tillering or early stem extension.
ManganeseSymptoms occur in new leaves, which become pale and limp. This is followed by light grey flecking and striping, which occurs at the base of the youngest fully opened leaf. In time, leaves become paler and eventually become necrotic and collapse.
Deficiencies can be treated using seed treatments or foliar-applied fertilisers.

28
Cereals
Wheat and triticale, sown up to the end of January – nitrogenTable 4.16 Nitrogen for wheat and triticale (sown up to the end of January)
Soil category
SNS Index
0 1 2 3 4 5 6
kg N/ha
Light sand soils 180 150 120 90 60 0–60 0–40
Shallow soils 280a 240 210 180 140 80 0–40
Medium soils 250a 220 190 160 120 60 0–40
Deep clay soils 250a 220 190 160 120 60 0–40
Deep silty soils 240a 210 170 130 100 40 0–40
Organic soils – – – 120 80 40–80 0–40
Peat – – – – – 0–40
a. The N recommendation exceeds the N max limit that applies within NVZs. Note the N max limit is calculated for the whole of the area of a crop type grown on farm and not for individual fields. For more details, see gov.uk/nitrate-vulnerable-zones
Recent research has shown evidence of a correlation between yield and crop nitrogen demand, supporting the adjustment of nitrogen rates for expected yield when site history indicates consistently below- or above-average yields. If you farm in an NVZ, you will be expected to have written evidence from at least two previous crops. If you don’t farm in an NVZ, then a sensible approach would be to take the last five years’ field-specific yields, discard the highest and lowest and take an average of the remaining three years.
Where previous experience of growing wheat indicates that yields above 8 t/ha can be realistically expected, increasing the recommended rate by 10 kg N/ha for each 0.5 t/ha additional yield, up to a maximum of 13 t/ha, could be justified. Similarly, for low-yielding crops, the recommended rate could be reduced by 10 kg N/ha for each 0.5 t/ha reduction in expected yield.
However, it is important to consider factors that limit yield, e.g. varietal choice, soil structural condition, seedbed conditions, supply of other nutrients, weed and disease pressure and growing season/climate. If any factor is limiting, a full response to nitrogen will not be obtained. For further guidance, consult a FACTS Qualified Adviser.
Timing of applicationThere is no requirement for seedbed nitrogen. Depending on the total nitrogen requirement and crop development, it will often be appropriate to apply nitrogen at the following timings.
• Less than 120 kg N/ha: Apply all the recommended amount as a single dressing by early stem extension but not before early April
• 120 kg N/ha or more: Apply about 40 kg N/ha between mid-February and mid-March, except where:
- There is a low risk of take-all, and- Shoot numbers are very high. Well-tillered crops do not need nitrogen at
this stage. Crops with too many tillers will be prone to lodging and higher disease levels. The balance of the application should be applied in one or two dressings during early stem extension. Where more than 120 kg N/ha remains to be applied, half should be applied at the start of stem extension (not before April) and half at least two weeks later (not after early May)
TriticaleThe N requirements of triticale are the same as those of wheat in most situations. Hence N recommendations should be calculated as for feed wheat, including the adjustment for yield potential, with the following exceptions:
• If the variety chosen is known to have a high lodging risk, the total N rate should be reduced by 40 kg N/ha
• If the grain price is expected to be significantly below that which would be received for wheat, N rates should be reduced accordingly
Return to Contents

29
Cereals
Wheat – use of grain nitrogen concentrationFarm nitrogen strategies for wheat can be assessed periodically using information on grain protein concentration. Grain protein at the economic optimum rate of nitrogen is about 11% (1.9% N) for feed wheat and 12% (2.1% N) for bread-making wheat. Where concentrations in yields from a number of adjacent fields are consistently above or below these values during several years, nitrogen fertiliser application rates should be adjusted down or up by 25 kg N/ha per 0.5% difference in grain protein (30 kg N/ha per 0.1% difference in grain %N).
To convert grain %protein to grain %N, divide %protein by 5.7. Both N and protein are reported on a 100% dry matter basis.
The effect of economic changes on nitrogen ratesThe recommendations in the tables for wheat and barley are based on a break-even ratio of 5.0 (cost of fertiliser nitrogen as £/kg N divided by value of grain as £/kg). If the price of nitrogen or the price of grain changes, use Table 4.22 to decide on an amount to add to or subtract from the fertiliser nitrogen application.
Wheat grown for bread makingIn some circumstances, an application of nitrogen may be economically worthwhile to boost the grain protein concentration. Typically, application of an extra 40 kg N/ha could increase grain protein by up to 1%. Application of soil-applied additional nitrogen during stem extension may give a small yield increase, as well as an increase in grain protein. Application as a foliar urea spray during the milky ripe stage will result in a larger increase in grain protein content but cannot be expected to increase yield.
Point to consider • Tables contain the total nutrient required – remember to deduct
nutrients applied as organic materials (Section 2: Organic materials)
Barley, winter-sown – nitrogenTable 4.17 Nitrogen for winter-sown barley
Soil category
SNS Index
0 1 2 3 4 5 6
kg N/ha
Feed barley
Light sand soils 170 140 110 80 60 0–40 0
Shallow soils 220a 190 150 120 60 20–60 0–20
Medium and deep clay soils 190a 170 140 110 60 20–60 0–20
Deep fertile silty soils 170 150 120 80 40 0–30 0
Organic soils – – – 110 60 0–40 0
Peaty soils – – – – – 0–40
Malting barley (1.8% grain N)
Light sand soils 130 90 60 0–40 0 0 0
Other mineral soils 150 120 90 50 0–40 0 0
Organic soils – – – 50 0–40 0 0
Peaty soils – – – – – 0
a. The nitrogen recommendation exceeds the N max limit that applies within NVZs. Note the N max limit is calculated for the whole of the area of a crop type grown on farm and not for individual fields. For more details, see gov.uk/nitrate-vulnerable-zones
Return to Contents
30
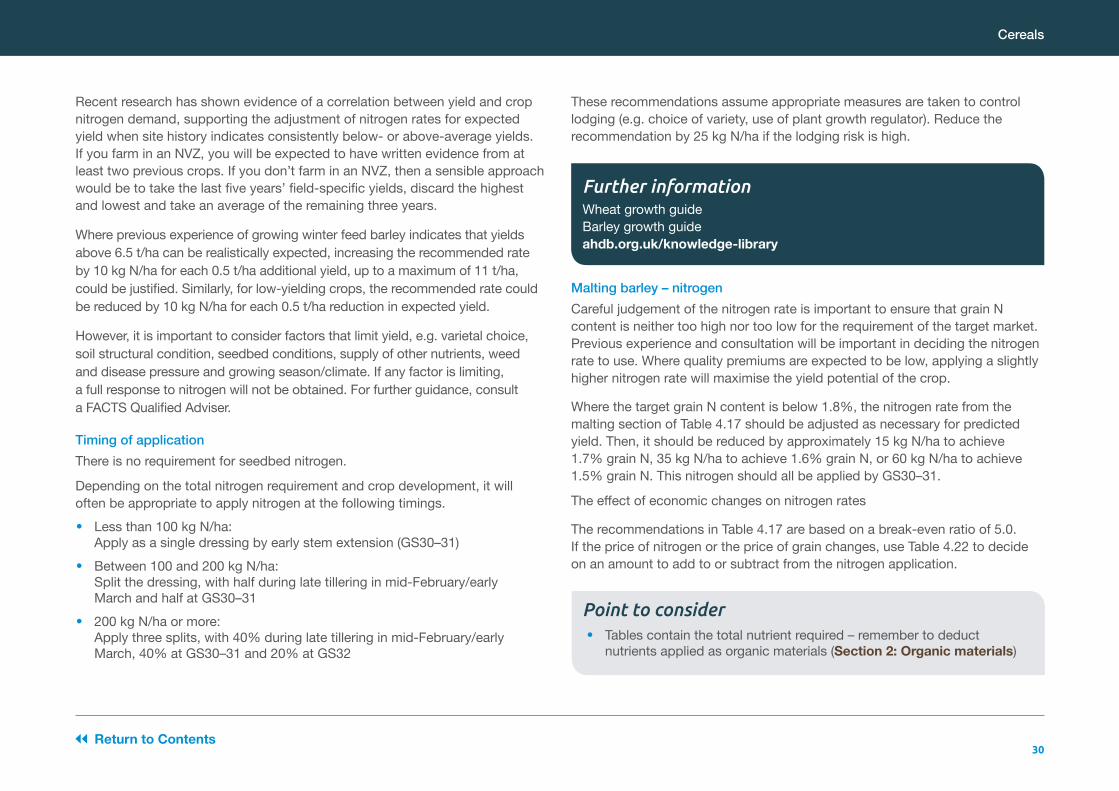
Malting barley – nitrogenCareful judgement of the nitrogen rate is important to ensure that grain N content is neither too high nor too low for the requirement of the target market. Previous experience and consultation will be important in deciding the nitrogen rate to use. Where quality premiums are expected to be low, applying a slightly higher nitrogen rate will maximise the yield potential of the crop.
Where the target grain N content is below 1.8%, the nitrogen rate from the malting section of Table 4.17 should be adjusted as necessary for predicted yield. Then, it should be reduced by approximately 15 kg N/ha to achieve 1.7% grain N, 35 kg N/ha to achieve 1.6% grain N, or 60 kg N/ha to achieve 1.5% grain N. This nitrogen should all be applied by GS30–31.
The effect of economic changes on nitrogen rates
The recommendations in Table 4.17 are based on a break-even ratio of 5.0. If the price of nitrogen or the price of grain changes, use Table 4.22 to decide on an amount to add to or subtract from the nitrogen application.
Cereals
Recent research has shown evidence of a correlation between yield and crop nitrogen demand, supporting the adjustment of nitrogen rates for expected yield when site history indicates consistently below- or above-average yields. If you farm in an NVZ, you will be expected to have written evidence from at least two previous crops. If you don’t farm in an NVZ, then a sensible approach would be to take the last five years’ field-specific yields, discard the highest and lowest and take an average of the remaining three years.
Where previous experience of growing winter feed barley indicates that yields above 6.5 t/ha can be realistically expected, increasing the recommended rate by 10 kg N/ha for each 0.5 t/ha additional yield, up to a maximum of 11 t/ha, could be justified. Similarly, for low-yielding crops, the recommended rate could be reduced by 10 kg N/ha for each 0.5 t/ha reduction in expected yield.
However, it is important to consider factors that limit yield, e.g. varietal choice, soil structural condition, seedbed conditions, supply of other nutrients, weed and disease pressure and growing season/climate. If any factor is limiting, a full response to nitrogen will not be obtained. For further guidance, consult a FACTS Qualified Adviser.
Timing of applicationThere is no requirement for seedbed nitrogen.
Depending on the total nitrogen requirement and crop development, it will often be appropriate to apply nitrogen at the following timings.
• Less than 100 kg N/ha: Apply as a single dressing by early stem extension (GS30–31)
• Between 100 and 200 kg N/ha: Split the dressing, with half during late tillering in mid-February/early March and half at GS30–31
• 200 kg N/ha or more: Apply three splits, with 40% during late tillering in mid-February/early March, 40% at GS30–31 and 20% at GS32
These recommendations assume appropriate measures are taken to control lodging (e.g. choice of variety, use of plant growth regulator). Reduce the recommendation by 25 kg N/ha if the lodging risk is high.
Point to consider • Tables contain the total nutrient required – remember to deduct
nutrients applied as organic materials (Section 2: Organic materials)
Further informationWheat growth guide Barley growth guide ahdb.org.uk/knowledge-library
Return to Contents

31
Cereals
Timing of applicationDepending on the total nitrogen requirement and crop development, it will often be appropriate to apply nitrogen at the following timings.
• Less than 100 kg N/ha: Apply as a single dressing by early stem extension, but not before late March
• 100 kg N/ha or more: Split the dressing, with 40 kg N/ha in mid-February/ early march- If the remaining N is less than 100 kg N/ha, then apply the rest by early
stem extension but not before late March- If the remaining N is 100 kg N/ha or more, then apply in two dressings,
half at early stem extension (not before late March) and half at least two weeks later
These recommendations assume appropriate measures are taken to control lodging (e.g. choice of variety or use of plant growth regulator). Reduce the recommended rate by 40 kg N/ha for oats or 25 kg N/ha for rye if lodging risk is high.
The effect of economic changes on nitrogen ratesThe recommendations in Table 4.18 are based on a break-even ratio of 5.0. If the price of nitrogen or the price of grain changes, use Table 4.22 to decide on an amount to add to or subtract from the nitrogen application.
Point to consider • Tables contain the total nutrient required – remember to deduct
nutrients applied as organic materials (Section 2: Organic materials)
Oats and rye, winter-sown – nitrogenTable 4.18 Nitrogen for winter-sown oats and rye
Soil category
SNS Index
0 1 2 3 4 5 6
kg N/ha
Oats
Light sand soils 150 110 80 20–60 0–40 0 0
All other mineral soils 190 160 130 100 70 0–40 0
Organic soils – – – 100 70 0–40 0
Peaty soils – – – – – 0–40
Rye
Light sand soils 110 70 20–50 0–20 0 0 0
All other mineral soils 150 120 90 60 30 0-20 0
Organic soils – – – 60 30 0-20 0
Peaty soils – – – – – 0–20
Return to Contents

32
Cereals
Wheat, spring-sown – nitrogenTable 4.19 Nitrogen for spring-sown wheat
Soil category
SNS Index
0 1 2 3 4 5 6
kg N/ha
Light sand soils 160 130 100 70 40 0–40 0
All other mineral soils 210a 180 150 120 70 40 0–40
Organic soils – – – 120 70 40 0–40
Peaty soils – – – – – 0–40
a. The N recommendation exceeds the N max limit that applies within NVZs. Note the N max limit is calculated for the whole of the area of a crop type grown on farm and not for individual fields. For more details, see gov.uk/nitrate-vulnerable-zones
Timing of applicationFor crops drilled before March, apply nitrogen at early stem extension but not before early April or after early May. For rates higher than 70 kg N/ha, apply the first 40 kg N/ha of the total in the seedbed, except on light sand soils. On these soils, apply 40 kg N/ha at the three-leaf stage but not before March.
For late-drilled crops, all the nitrogen can be applied in the seedbed, except on light sand soils, where amounts more than 70 kg N/ha should be split, with 40 kg N/ha in the seedbed and the remainder by the three-leaf stage.
Wheat grown for bread makingIn some circumstances, an application of nitrogen in addition to that given in Table 4.19 may be economically worthwhile to boost the grain protein concentration. Typically, application of an extra 40 kg N/ha could increase grain protein by up to 1%. Application of this additional nitrogen during stem extension may give a small yield increase, as well as an increase in grain protein. Application as a foliar urea spray during, but not later than, milky ripe stage will result in a larger increase in grain protein content but cannot be expected to increase yield.
The effect of economic changes on nitrogen ratesThe recommendations in the table are based on a break-even ratio of 5.0. If the price of nitrogen or the price of grain changes, use Table 4.22 to decide on an amount to add to or subtract from the nitrogen application.
Barley, spring-sown – nitrogenTable 4.20 Nitrogen for spring-sown barley
Soil category
SNS Index
0 1 2 3 4 5 6
kg N/ha
Feed
Light sand soils 140 110 70 50 0–40 0 0
Other mineral soils 160a 140 110 70 30 0–30 0
Organic soils – – – 70 30 0–30 0
Peaty soils – – – – – 0–30
Malting barley (1.8% grain N)
Light sand soils 110 80 40 0–40 0 0 0
Other mineral soils 130 110 70 40 0–30 0 0
Organic soils – – – 40 0–30 0 0
Peaty soils – – – – – 0
a. The N recommendation exceeds the N max limit that applies within NVZs. Note the N max limit is calculated for the whole of the area of a crop type grown on farm and not for individual fields. For more details, see gov.uk/nitrate-vulnerable-zones
Return to Contents

33
Malting barley – nitrogen Careful judgement of the nitrogen rate is important to ensure that the grain N content is neither too high nor too low for the requirement of the target market. Market requirements vary widely, from less than 1.65% to more than 1.85% grain N. Previous experience and consultation will be important in deciding the nitrogen rate to use. Where quality premiums are expected to be low, use of a slightly higher nitrogen rate will maximise the yield potential of the crop.
Apply all the nitrogen by early stem extension but not after the end of March. Where target grain N is below 1.8%, the nitrogen rate from the malting section of Table 4.20 should be adjusted as necessary for predicted yield, then reduced by approximately 30 kg N/ha to achieve 1.7% grain N, or 60 kg N/ha to achieve 1.6% grain N. Grain N may be diluted in high-yielding crops. This nitrogen should all be applied by mid-March.
The effect of economic changes on nitrogen ratesThe recommendations in Table 4.20 are based on a break-even ratio of 5.0. If the price of nitrogen or the price of grain changes, use Table 4.22 to decide on an amount to add to or subtract from the nitrogen application.
Cereals
Recent research has shown evidence of a correlation between yield and crop nitrogen demand, supporting the adjustment of nitrogen rates for expected yield when site history indicates consistently below- or above-average yields. If you farm in an NVZ, you will be expected to have written evidence from at least two previous crops. If you don’t farm in an NVZ, then a sensible approach would be to take the last five years’ field-specific yields, discard the highest and lowest and take an average of the remaining three years.
Where previous experience of growing spring feed barley indicates that yields above 5.5 t/ha can be realistically expected, increasing the recommended rate by 10 kg N/ha for each 0.5 t/ha additional yield, up to a maximum of 9 t/ha, could be justified. Similarly, for low-yielding crops, the recommended rate could be reduced by 10 kg N/ha for each 0.5 t/ha reduction in expected yield.
However, it is important to consider factors that limit yield, e.g. varietal choice, soil structural condition, seedbed conditions, supply of other nutrients, weed and disease pressure and growing season/climate. If any factor is limiting, a full response to nitrogen will not be obtained. For further guidance consult a FACTS Qualified Adviser.
Timing of applicationFor crops drilled before March, apply nitrogen at early stem extension but not before early April or after early May. For amounts greater than 70 kg N/ha, apply the first 40 kg N/ha of the total in the seedbed, except on light sand soils. On these soils, apply 40 kg N/ha at the three-leaf stage but not before March.
For late-drilled crops, all the nitrogen can be applied in the seedbed, except on light sand soils, where amounts greater than 70 kg N/ha should be split, with 40 kg N/ha in the seedbed and the remainder by the three-leaf stage.
Further informationMaltsters’ Association of Great Britain (MAGB) barley requirements ukmalt.com/barley-requirements
Return to Contents

34
Cereals
Oats, rye and triticale, spring-sown – nitrogenTable 4.21 Nitrogen for spring-sown oats, rye and triticale
The effect of economic changes on nitrogen ratesThe recommendations in Table 4.21 are based on a break-even ratio of 5.0. If the price of nitrogen or the price of grain changes, use Table 4.22 to decide on an amount to add to or subtract from the nitrogen application.SNS Index
0 1 2 3 4 5 6
kg N/ha
Light sand soils 90 60 30 0–30 0 0 0
All other mineral soils 140 110 70 40 0–30 0 0
Organic soils – – – 40 0–30 0 0
Peaty soils – – – – – 0
Source of NFertiliser N
content Fertiliser cost
% £/tonne product
Ammonium nitrate 34.5 138 207 276 345 414 483
Urea 46.0 184 276 368 460 552 644
Urea-ammonium nitrate liquid 28.0 112 168 224 280 336 392
Cost of fertiliser nitrogen (£/kg N) 0.40 0.60 0.80 1.00 1.20 1.40
Change to recommended N for all cereals
£/t kg N/ha
50 -30 -60 -80 -100 -110 -130
75 0 -30 -50 -70 -80 -90
100 10 -10 -30 -40 -60 -70
125 20 0 -10 -30 -40 -50
150 30 10 0 -10 -20 -30
175 42 20 0 -10 -20 -30
200 40 30 10 0 -10 -20
225 40 30 20 10 0 -10
250 50 30 20 10 0 -10
275 50 40 30 20 10 0
Point to consider • Tables contain the total nutrient required – remember to deduct
nutrients applied as organic materials (Section 2: Organic materials)
Table 4.22 Effect of economic changes on nitrogen rate – all cereals
Further informationAHDB UK fertiliser price series ahdb.org.uk/GB-fertiliser-prices
Return to Contents

35
Oilseeds
OilseedsOilseed rape and linseed – phosphate, potash, magnesium and sulphurPhosphate and potashThe amounts of phosphate and potash needed to replace offtake for the seed yields shown and maintain the soil at the target Index (P Index 2 and K Index 2-) are shown in Table 4.23. The amounts of phosphate and potash are appropriate for the seed yields shown.
The phosphate and potash recommendations can be adjusted if the yields are likely to be larger or smaller than those shown in Table 4.23.
To adjust the amounts, multiply the difference in expected seed yield by the phosphate and potash content per tonne of seed yield using the appropriate value given in Table 4.11 and then add to (for larger yields), or subtract from (for smaller yields), the amounts in Table 4.23.
Crops grown on soil at Index 0 and 1 would be expected to respond to the higher amounts of phosphate and potash shown in Table 4.23. Also, over a number of years, these extra amounts of fertiliser will help raise most soils, except light sands, to Index 2. At Index 3 and above, no phosphate and potash need be applied for a few years, but check soil analyses regularly.
At Index 2, phosphate and potash can be applied when convenient during the year, but at Index 0 and 1 soils, they should be applied and worked into the seedbed.
Example 4.8At P Index 1, the phosphate recommendation for winter oilseed rape with an expected yield of 4.5 t/ha is 80 + (1 x 14) = 94 kg P2O5/ha.
Table 4.23 Phosphate and potash for oilseed rape and linseed
Nutrient
P or K Index
0 1 2 3 and higher
kg/ha
Winter oilseed rape (3.5 t/ha)
Phosphate (P2O5) 110 80 50 0
Potash (K2O) 100 70 40 (2-)20 (2+) 0
Spring oilseed rape (2 t/ha) or linseed (1.5 t/ha)
Phosphate (P2O5) 90 60 30 0
Potash (K2O) 80 50 20 (2-)0 (2+) 0
Alternatively, calculate the required application rates using expected offtake values from Table 4.11 and Soil Index adjustments from Section 1: Principles of nutrient management and fertiliser use.
Point to consider • Ensure the phosphate and potash offtake is balanced by application
on Index 2 soils and check that the soil is maintained at Index 2 by soil sampling every 3–5 years
MagnesiumAt Mg Index 0 and 1, magnesium at a rate of 50 to 100 kg MgO/ha should be applied every three or four years.
Return to Contents

36
Oilseeds
SulphurThe yield of most winter- and spring-sown oilseed rape grown on mineral soils will increase in response to an application of sulphur, which will also help to minimise green seeds. Apply 50–80 kg SO3/ha as a sulphate-containing fertiliser to all winter- and spring-sown oilseed rape crops grown on mineral soils, in late February to early March. The green plant pigment, chlorophyll, can remain in the seed at harvest and create problems for rapeseed crushers. A large proportion of immature seed in a sample, or conditions restricting the natural breakdown of chlorophyll during ripening, can lead to high chlorophyll concentrations.
Extracted with the oil, chlorophyll interferes with subsequent processing. Crushers may be unwilling to accept seed lots with more than 4% immature (green) seed.
While a red seed coat can indicate immaturity, seed coat colour is not a reliable indicator of seed quality. The best test is to crush the seed and examine the cotyledons inside, which, in a good sample, should be yellow.
AHDB trials have shown that application of sulphur fertiliser at deficient sites reduced seed chlorophyll content. It is also worth noting that applying high rates of nitrogen fertiliser (above the recommendation) increased chlorophyll content.
Later, severely sulphur-deficient oilseed rape crops will have pale flowers; however, by this time it will be too late to correct the deficiency.
Figure 4.5 The youngest leaves of sulphur-deficient oilseed rape are often yellow
Sunflower – phosphate and potashPhosphate is required at relatively low levels by the crop. A maintenance application of 40 to 60 kg/ha is usual. Sunflowers require a relatively high level of potassium, but most of this is returned to the soil after harvest. A maintenance application of 40 kg to 60 kg/ha is usual, often as part of a compound fertiliser with phosphate.
Oilseed rape – micronutrientsAHDB research has shown that the most common micronutrient deficiencies limiting productivity of oilseed rape crops are manganese (Mn), boron (B) and molybdenum (Mo) (Table 4.24). More information is provided in Section 1: Principles of nutrient management and fertiliser use.
Visual symptoms are usually the first sign of a deficiency, however, they can be short-lived, easily confused and, by the time symptoms appear, it can be too late to correct the deficiency.
Table 4.24 Micronutrient deficiency risk factors
Micronutrient Soil risk factor Soil analysis Leaf analysis
Manganese (Mn) Under-consolidated seedbeds; low soil temperature; low rainfall; over-liming; any soil with pH above 7.5; sandy soils with pH above 6.5; organic, peaty or marshland soil with pH above 6.0
Not reliable Deficiency is more likely below 20 mg Mn/kg
Boron (B) Sandy soils; high organic matter; pH above 7; over-liming
Hot water extract: deficiency is more likely below 0.8 mg B/l
Deficiency is more likely below 20 mg B/kg
Molybdenum (Mo)
Soil with pH below 6.5
Ammonium oxalate extract: deficiency is more likely below 0.1 mg Mo/l
Insufficient information to be able to recommend this type of analysis
Return to Contents

37
Oilseeds
Points to consider Drought, frost and herbicide damage can also be mistaken for visual symptoms of nutrient deficiencies. It can be difficult to make a definitive diagnosis, but, if a deficiency is suspected, it is important to consider:
• Which nutrient deficiencies can commonly affect the crop species being grown
• The soil type, condition and pH
• The results of soil and tissue analysis
Figure 4.6 Micronutrient deficiency symptoms in oilseed rape: boron, manganese and molybdenum (left to right)
©Yara UK Ltd©Yara UK Ltd ©Yara UK Ltd
Treating micronutrient deficienciesOptions largely depend on when the deficiency is diagnosed. If soil analysis confirms a deficiency early in the season, liming, seed treatments, seedbed or autumn fertiliser applications are possible. If tissue analysis confirms a deficiency later in the season, treatments will be limited to foliar-applied fertilisers.
BoronSymptoms of boron include smaller and puckered young leaves. Margins turn down and tissue becomes brittle and is easily torn. Stems crack and flowering is poor.
Deficiencies can be treated using soil- or foliar-applied fertilisers.
ManganeseManganese symptoms include yellowing and mottling between veins, which remain greener. Symptoms appear first on middle leaves and spread to older leaves.
Deficiencies can be treated using seed treatments or foliar-applied fertilisers.
MolybdenumMolybdenum symptoms include reduced leaf area, pale and limp leaves.
Use a liming material to raise the soil pH of acidic soils to 6.5. When soil pH is more than 7 or when treatment is necessary, a seed treatment, or soil- or foliar-applied fertilisers can be used.
Foliar nutrients can be applied most cost-efficiently by tank-mixing with other crop inputs, such as fungicides, but check product labels carefully for compatibility.
Sunflower – micronutrientsMolybdenum, copper and manganese deficiencies in sunflower can be problems in very acidic soils (<pH 5.0). Sunflowers are also sensitive to boron deficiency, which can be a particular problem on calcareous or sandy soils where boron levels are often naturally low.
Boron is taken up chiefly during the vegetative period prior to heading and signs of deficiency usually become apparent during flowering and seed maturation. A characteristic feature is poor seed-set, with many heads having large areas of hollow seeds. Other symptoms are red-brown necrotic patches and abnormal head and neck development. The timing and rates of boron application are shown in Table 4.25.
Table 4.25 Boron deficiency and its treatment in a sunflower crop
Soil factor Soil boron level (ppm) Treatment
Non-calcareous (pH < 7.5) 0.5 1.2 kg/ha incorporated at drilling
Calcareous (pH > 7.5) 0.5 300–500 g/ha as a foliar spray at GS 2.5–3.2Sandy 0.5
Return to Contents

38
Oilseeds
Oilseed rape, autumn-sown – nitrogenTable 4.26 Nitrogen for autumn- and winter-sown oilseed rape
Soil category
SNS Index
0 1 2 3 4 5 6
kg N/ha
Autumn
All soils 30 30 30 0 0 0 0
Spring
All other mineral soils 220 190 160 120 80 40–80 0–40
Organic soils – – – 120 80 40–80 0–40
Peaty soils – – – – – 40–80
Timing of applicationAutumn nitrogen can be applied to the seedbed or as a top dressing to encourage autumn growth, but research suggests that crops sown after early September are unlikely to respond.
If the green area index (GAI) of the canopy, measured towards the end of winter, is less than 1.5, or less than 2.0 if the SMN in the top 60 cm soil is less than 25 kg N/ha, apply the nitrogen in two equal splits. Apply half at the start of spring growth (end February–early March) and half at green bud (mid-March to early April). Any additional nitrogen for crops yielding above 3.5 t/ha should be applied between yellow bud and early flowering.
Where the GAI of the canopy, measured towards the end of winter, is greater than 2.0, or greater than 1.5 with an SMN in the top 60 cm soil of at least 25 kg N/ha, then the first nitrogen should be reduced to between zero and 40 kg N/ha.
Foliar N applied as a solution of urea (20 kg N per 100 litres) at 40 kg N/ha between mid-flowering and two weeks after the end of flowering will often increase gross output by an average of 0.25 t/ha. This may occur even where the optimum amount of nitrogen has been applied to soil. Temperature at application should be less than 19˚C. The economic benefit of this treatment will depend upon the cost of the product and the price of oilseed rape. Note that this foliar-applied nitrogen contributes towards the N max allowance.
Yield variationThe recommendations are for crops yielding 3.5 t/ha. Where previous experience of growing the crop indicates that yields above 3.5 t/ha can be realistically expected, the recommended rate may be increased by up to 30 kg N/ha per 0.5 t/ha of yield, up to an expected yield of 5.0 t/ha. This adjustment should be used with caution because applying too much early nitrogen to crops with large canopies can increase lodging and possibly reduce yield.
Point to consider • Tables contain the total nutrient required – remember to deduct
nutrients applied as organic materials (Section 2: Organic materials)
Return to Contents

39
Sunflower – nitrogenDue to the deep-rooting nature of sunflower, it can remove nutrients from depth in the soil profile. As a result, the crop will yield satisfactorily at quite low levels of soil nitrogen and nitrogen fertiliser applications may be unnecessary.
High levels of nitrogen can lead to excessive vegetative development, encouraging disease, delaying maturity and reducing seed oil content. UK experience indicates that applications of more than 25–50 kg/ha are rarely required.
Oilseeds
Timing of applicationApply all the nitrogen in the seedbed. On light sand soils where the total rate is more than 80 kg N/ha, the dressing should be split, with 50 kg N/ha in the seedbed and the remainder by early May.
Oilseed rape and linseed, spring-sown – nitrogenTable 4.27 Nitrogen for spring-sown oilseed rape and linseed
SNS Index
0 1 2 3 4 5 6
kg N/ha
Spring oilseed rape
Light sand soils 120 80 50 0–40 0 0 0
Other mineral soils 150 120 80 50 0–40 0 0
Organic soils – – – 50 0–40 0 0
Peaty soils – – – – – 0–40
Spring linseed
Light sand soils 80 50 0–40 0 0 0 0
All other mineral soils 100 80 50 0–40 0 0 0
Organic soils – – – 0–40 0 0 0
Peaty soils – – – – – 0
Point to consider • Tables contain the total nutrient required, remember to deduct
nutrients applied as organic materials (Section 2: Organic materials)
Return to Contents

40
Oilseeds
The effect of economic changes on nitrogen ratesThe recommendations in Table 4.26 and 4.27 are based on a break-even ratio of 2.5. If the price of nitrogen or the value of rapeseed changes, use Table 4.28 to decide on an amount to add or subtract from the nitrogen application.
Table 4.28 Effect of economic changes on nitrogen rate – oilseed rape
Further informationAHDB UK fertiliser price series ahdb.org.uk/GB-fertiliser-prices
Return to Contents
Source of NFertiliser N
content Fertiliser cost
% £/tonne product
Ammonium nitrate 34.5 138 207 276 345 414 483
Urea 46.0 184 276 368 460 552 644
Urea-ammonium nitrate liquid 28.0 112 168 224 280 336 392
Cost of fertiliser nitrogen (£/kg N) 0.40 0.60 0.80 1.00 1.20 1.40
Change to recommended N for oilseed rape
£/t kg N/ha
200 20 -20 -50 -70 -80 -100
225 30 -10 -30 -60 -70 -90
250 40 0 -20 -50 -60 -80
275 50 10 -10 -40 -50 -70
300 60 20 -10 -30 -50 -60
325 70 30 0 -20 -40 -50
350 70 40 10 -10 -30 -50
375 80 40 20 -10 -20 -40
400 90 50 20 0 -20 -30
425 90 50 30 10 -10 -30
425 100 60 30 10 -10 -30

41
Peas (dried and vining) and beans/Sugar beet
Peas (dried and vining) and beansThe amounts of phosphate and potash are appropriate to pea yields of 4 t/ha and bean yields of 3.5 t/ha. Where yields are likely to be greater or smaller, phosphate and potash applications should be adjusted accordingly. Table 4.11 gives typical values of the phosphate and potash content in crop material per tonne of yield.
Table 4.29 Nitrogen, phosphate, potash and magnesium for peas and beans
Sugar beetNitrogenThe recommendations do not vary with yield. Nitrogen fertilisers should be applied in spring: 30–40 kg/ha of the total N required immediately after drilling and the remainder when all the beet seedlings have emerged. If in doubt about the appropriate SNS Index, seek advice from a FACTS Qualified Adviser.
Table 4.30 Nitrogen for sugar beet
Nutrient
SNS, P or K Index
0 1 2 3 4 5 6
kg/ha
Nitrogen (N) 0 0 0 0 0 0 0
Phosphate (P2O5) 100 70 40 0 0 0 0
Potash (K2O) 100 70 40 (2-)20 (2+) 0 0 0 0
Magnesium (MgO) 100 50 0 0 0 0 0
Phosphate and potashSeedbed phosphate and potash is only needed at Index 0 and 1.
SulphurPeas may suffer from sulphur deficiency on sensitive soil types. Where deficiency is possible, apply 25 kg SO3/ha.
Further informationPGRO grower guides pgro.org
Soil category
SNS Index
0 and 1 2 3 4 5
kg N/ha
All mineral soils 120 100 80 0 0
Organic soils 40 0
Peaty soils 0
Phosphate, potash, magnesium and sodiumThe amounts of phosphate and potash shown at target Index 2 are needed to replace the offtakes in a 60 t/ha crop (with tops ploughed in) and maintain the soil at the target Index.
The phosphate and potash recommendations at target or lower Indices can be adjusted if yields are likely to be larger or smaller than 60 t/ha by multiplying the difference in expected yield by the phosphate and potash content per tonne of yield given in Table 4.11.
Crops grown on soil at Index 0 and 1 would be expected to respond to the extra amounts of phosphate, potash and magnesium shown in Table 4.31. Also, over a number of years, these extra amounts of fertiliser will help to raise the Index of most soils, except light sands, to Index 2.
Return to Contents

42
BoronBoron deficiency can adversely affect sugar beet yields. An application of boron may be required where soil analysis indicates that available boron in the soil (hot water extraction) is less than 0.8 mg B/l (ppm B). Deficiency can be corrected by applying 3 kg B/ha. Seek advice from a FACTS Qualified Adviser about form, amount and timing of the application.
SulphurThe uptake of sulphur by well-grown crops is around 50–70 kg S/ha and those of high-yielding crops closer to 100 kg S/ha. Crops may suffer from sulphur deficiency, especially higher-yielding crops grown on sensitive soils (sands, sandy loams and shallow soils) and where there is no routine use of organic manures in the rotation. However, sulphate-containing fertilisers only need be applied if deficiency symptoms consistently appear in other, more sensitive crops within the rotation, such as oilseed rape and barley. Where deficiency is possible, 25 kg SO3/ha is effective.
Sugar beet
Table 4.31 Phosphate, potash, magnesium for sugar beet
Example 4.9At P Index 1, the recommendation for an expected yield of 70 t/ha where tops are incorporated is 80 + (10 x 0.8) = 88 kg P2O5/ha. For potash, growers can access their factory-determined estimates of the amounts of potash removed in their delivered crops from British Sugar Beet Portal as a guide to application rates on Index 2 soils.
P, K or Mg Index
0 1 2 3 4 and higher
kg N/ha
Phosphate (P2O5) 110 80 50 0 0
Potash (K2O) 160 130 100 0 0
Magnesium (MgO) 150 75 0 0 0
Na2O (use K Index)a 200 200 100 0 0
a. Sodium can partly replace potash in the nutrition of sugar beet when soils contain too little crop-available potash. An application of 200 kg Na2O/ha is recommended for beet grown on soils at K Index 0 and 1. On K Index 2 soils, it is only necessary to apply 100 kg Na2O/ha when the soil contains less than 25 mg Na/L. Fen peats, silts and clays usually contain sufficient sodium and no fertiliser sodium is recommended. Sodium at the recommended rate has no adverse effect on soil structure even on soils of low structural stability.
If inorganic fertilisers containing potash and sodium are applied just before sowing and too close to the seed, plant populations can be reduced in dry conditions, especially on sandy soils. To minimise this risk, all inorganic fertilisers should be applied at least two weeks before sowing and incorporated into the soil. They may be applied in autumn or winter and ploughed in, except on light sand soils where there is a risk of some nutrient loss by leaching. On light sand soils, the fertilisers can be applied in January/February, just before ploughing or cultivating.
Points to consider • Make allowance for nutrients applied in organic manures
(Section 2: Organic materials)
• Ensure the phosphate and potash offtake is balanced by application on Index 2 soils
• Check that soil is maintained at Index 2 by soil sampling every 3–5 years
Further informationSugar Beet Reference Book bbro.co.uk/publications/reference-book
British Sugar Beet Portal bsonline.co.uk
Return to Contents

43
Biomass crops
Biomass cropsIn the UK, two crops are being grown commercially specifically for biomass for use as a source of energy – willow (Salix spp.), grown as short-rotation coppice (SRC), and Miscanthus (elephant grass, normally Miscanthus x giganteus). Other possible biomass crops, such as switchgrass and poplar, have only been grown in the UK under experimental conditions.
In addition to these dedicated biomass crops, some normal agricultural crops are also grown for energy purposes. These include wheat grain and sugar beet, both for bioethanol, and oilseed rape for biodiesel. Fertiliser requirements for these crops, if grown for energy use, are covered under the individual crops. Various agricultural by-products may be used for energy generation, such as incineration of cereal straw for electricity generation or anaerobic digestion of animal slurry for biogas generation.
One of the main reasons for growing energy crops is to reduce the use of fossil fuels and decrease greenhouse gas (GHG) emissions. Therefore, it is logical to ensure that GHG emissions associated with growing energy crops, directly or indirectly, are kept to a minimum.
Nitrogen fertilisers lead to large emissions of GHGs, carbon dioxide (CO2) and nitrous oxide (N2O), during manufacture, and additional N2O when applied to soil. N2O is a particularly powerful GHG, each molecule having the same global-warming potential as about 300 molecules of CO2. So it is important to consider the environmental effects of nitrogen fertiliser applications when growing crops for energy.
Sources of informationOnly a small number of studies on the nutrient requirements of either Miscanthus or short-rotation coppice willow have been conducted, either under UK conditions or worldwide. With such a small knowledge base, it is difficult to be certain of the extent to which the individual results can be generalised, or whether they are site-specific. Consequently, the guidance given here is preliminary and based largely on replacing nutrients removed in the harvested crops, unless otherwise stated.
MiscanthusTable 4.32 Typical offtake of nutrients in harvested biomass (excluding the first two years after planting when yields are much lower than in later years)
NutrientPer tonne
dry biomassIn a typical crop yielding 14 tonne
dry biomass per ha
kg/ha
Nitrogen (N) 6 84
Phosphate (P2O5) 1 14
Potash (K2O) 8.5a 120a
a. Potash offtake in Miscanthus is very variable as it is affected by weather and time of harvesting. These values refer to crops harvested in January; it is now common for crops to be harvested later (e.g. April–May) and the offtake of potash then is generally less because rainfall leaches out potash from the standing crop and returns it to the soil.
There have been no published studies to test crop responses to different applications of phosphate or potash, and only a few with nitrogen. Nitrogen and phosphate offtakes are small compared with many other crops, because much nitrogen and phosphate is transferred from stems and leaves to the rhizomes before harvest; these nutrients can be reused in future years.
As well as the nutrients removed in the harvested parts of the crop, an additional amount is required for the growth of rhizomes in the first few years after planting. On the basis of (a) a relatively small number of measured nutrient offtakes by Miscanthus, (b) comparisons with offtakes by other crops on soils at different levels of crop-available phosphate or potash, and (c) experience gained by those growing the crop, the following is proposed:
PhosphateMaintain soil at P Index 1. Check every 3–5 years by soil testing.
PotashMaintain soil at K Index 1–2. Check every 3–5 years by soil testing.
Return to Contents

44
For short-rotation coppice willow, there is even less experimental data on nutrient requirements than for Miscanthus. Therefore, the recommendations given here are based on a combination of nutrient offtakes measured at a very small number of sites and experience of growers.
No fertilisers are required during the establishment year; so the recommendations below refer to the three-year periods after the initial cutback (in the winter after establishment) and the subsequent three-year periods after each harvest.
With short-rotation coppice, it is almost impossible to enter the plantation to apply fertilisers or manures in the second or third year after cutback or harvesting, unless specialist equipment is available. It is, therefore, necessary to determine nutrient requirements, and make any appropriate applications, in the first year after a cutback, normally during spring in preparation for the period of rapid growth.
Biomass crops
NitrogenIn some cases, a biomass yield response to 50–100 kg N/ha has been observed but rarely, if ever, to higher rates and sometimes there is no response for many years (up to 15 years at one UK experiment). For Miscanthus growing on soil previously under arable crops, and with little previous organic manure (i.e. in SNS Index 2 or below), the soil is likely to supply about 40 kg N/ha (depending on soil type and management history). On the basis of current information, annual fertiliser applications in the range of 60–80 kg N/ha (or organic applications estimated to supply this quantity of nitrogen) are likely to provide sufficient nitrogen for maximum production. In soils starting at a higher SNS Index, nitrogen applications are probably not required for some years.
In the first two to three years after planting, some nitrogen is required for the growth of rhizomes in addition to that removed in harvested biomass. However, the quantity of nitrogen removed in these years is less than in subsequent years, so it is likely that no additional nitrogen for rhizome development is required. Thus, in contrast to some earlier suggestions, it is recommended that very little nitrogen (perhaps none) will generally be required in the first two years; nitrogen applications, as inorganic fertiliser or organic manures, only should start for the third year’s crop. There is some evidence that nitrogen applications applied in the first year after planting are subject to large losses and also encourage weed growth.
Applying nitrogen in late May, just before rapid growth begins, is common practice and this seems appropriate – though there has been no work to test the best time to apply nitrogen.
SulphurThere is currently no evidence of sulphur applications being required by Miscanthus in the UK.
WillowTypical offtakes of nutrients in wood harvested from short-rotation coppice willow after three years’ growth following the previous coppicing are shown in Table 4.33.
Table 4.33 Nitrogen, phosphate and potash for willow
Per tonne dry biomass
In a typical crop yielding 30 tonne dry biomass per ha
kg N/ha
Nitrogen (N) 3 90
Phosphate (P2O5) 1.8 55
Potash (K2O) 2.4 72
Return to Contents

45
Biomass crops
In situations where biomass crops are used for bioremediation of biosolids or biofiltration of effluents, levels of nutrient application in excess of those highlighted in Table 4.33 may be justified, recognising the relatively low environmental risks associated with this approach, relative to alternative methods of disposal. In such circumstances, careful monitoring of ground and surface water is required to demonstrate absence of leaching and/or surface run-off of N and P.
PhosphateMaintain soil at P Index 1. Check every three years (i.e. each harvesting cycle) by soil testing.
PotashMaintain soil at K Index 1. Check every three years (i.e. each harvesting cycle) by soil testing.
NitrogenAs with Miscanthus, a combination of nitrogen mineralised from soil organic matter plus that from atmospheric deposition and rain will supply much of the modest nitrogen requirement. The requirement is about 30 kg N/ha per year for a typical UK crop yielding 30 t dry biomass during a three-year cycle, i.e. 90 kg N/ha total offtake. However, larger offtakes have been observed in some situations and, as a grower gains experience of yields in specific soil types and different environments, nitrogen applications can be adjusted using the values in Table 4.33 for nitrogen removed per tonne dry biomass.
Applications of organic materials such as FYM, slurry or sewage sludge are an ideal way of maintaining a suitable supply of nitrogen and other nutrients throughout the three-year growth cycle from a single application made in the first year. The amount applied should be determined on the basis of estimated crop requirement, or within the limits described above for bioremediation or biofiltration systems.
Return to Contents

46
Oxide to elementP2O5 to P Multiply by 0.436K2O to K Multiply by 0.830MgO to Mg Multiply by 0.603SO3 to S Multiply by 0.4Na2O to Na Multiply by 0.742Salt to Na Multiply by 0.393
Fluid fertiliserkg/tonne (w/w basis) to kg/m3 Multiply by specific gravity (w/v basis)
Grain phosphate and potash offtakesP% to kg P2O5 Multiply results by 19.5 K% to kg K2O Multiply results by 10.2 P mg/kg (ppm) to kg P2O5 Multiply by 0.00195 K mg/kg (ppm) to kg K2O Multiply by 0.00102
Conversion tables
Conversion tablesMetric to imperial1 tonne/ha 0.4 tons/acre100 kg/ha 80 units/acre1 kg/tonne 2 units/ton10 cm 4 inches1 m3 220 gallons1 m3/ha 90 gallons/acre1 kg/m3 9 units/1,000 gallons1 kg 2 units
Note: a ‘unit’ is 1% of 1 hundredweight, or 1.12lb.
Imperial to metric1 ton/acre 2.5 tonnes/ha100 units/acre 125 kg/ha1 unit/ton 0.5 kg/tonne1 inch 2.5 cm1,000 gallons 4.5 m3
1,000 gallons/acre 11 m3/ha1 unit/1,000 gallons1 unit 0.5 kg
Element to oxideP to P2O5 Multiply by 2.291K to K2O Multiply by 1.205Mg to MgO Multiply by 1.658S to SO3 Multiply by 2.5Na to Na2O Multiply by 1.348Na to salt Multiply by 2.542
Return to Contents

47
Analysis of fertilisers and liming materials
Analysis of fertilisers and liming materialsThe materials listed below are used individually and some are used as components of compound or multi-nutrient fertilisers. The chemical and physical forms of nutrient sources, as well as growing conditions, can influence the effectiveness of fertilisers. A FACTS Qualified Adviser can give advice on appropriate forms for different soil and crop conditions.
The reactivity, or fineness of grinding, of liming materials determines their speed of action. However, the amount of lime needed is determined mainly by its neutralising value.
Nitrogen fertilisers Typical % nutrient contentAmmonium nitrate 33.5–34.5% NLiquid nitrogen solutions 18–30% N (w/w)Calcium ammonium nitrate (CAN) 26–28% NAmmonium sulphate 21% N, 60% SO3Urea 46% NCalcium nitrate 15.5% N, 26% CaO
Phosphate fertilisersSingle superphosphate (SSP) 18–21% P2O5, typically 30% SO3Triple superphosphate (TSP) 45–46% P2O5Di-ammonium phosphate (DAP) 18% N, 46% P2O5Mono-ammonium phosphate (MAP) 12% N, 52% P2O5Rock phosphate (e.g. Gafsa) 27–33% P2O5
Potash, magnesium and sodium fertilisersMuriate of potash (MOP) 60% K2OSulphate of potash (SOP) 50% K2O, 45% SO3Potassium nitrate 13% N, 45% K2OKainit 11% K2O, 5% MgO, 26% Na2O, 10% SO3Sylvinite Minimum 16% K2O, typically 32% Na2OKieserite (magnesium sulphate) 25% MgO, 50% SO3Calcined magnesite Typically 80% MgOEpsom salts (magnesium sulphate) 16% MgO, 33% SO3Agricultural salt 50% Na2O
Sulphur fertilisersAmmonium sulphate 21% N, 60% SO3Epsom salts (magnesium sulphate) 16% MgO, 33% SO3Elemental sulphur Typically 200–225% SO3 (80–90% S)Quarried gypsum (calcium sulphate) 40% SO3Polyhalite (e.g. Polysulphate) Minimum 48% SO3, 14% K2O, 6% MgO, 17% CaO.
Liming materials Neutralising Value (NV)Ground chalk or limestone 50–55Magnesian limestone 50–55, over 15% MgOHydrated lime c.70Burnt lime c.80Sugar beet lime 22–32 + typically 7–10 kg P2O5, 5–7 kg MgO, 3–5kg SO3/tonne
Return to Contents

48
Glossary
GlossaryAdditionally available Nitrogen that will become available to the crop throughnitrogen (AAN) mineralisation during the growing season.
Available (nutrient) Form of a nutrient that can be taken up by a crop immediately or within a short period so acting as an effective source of that nutrient for the crop.
Biosolids Treated sewage sludge.
Calcareous soil Soil that is alkaline due to the presence of free calcium carbonate or magnesium carbonate or both.
Clay Finely divided inorganic crystalline particles in soils, less than 0.002 mm in diameter.
Content (nutrient) Commonly used instead of the more accurate ‘concentration’ to describe nutrients in fertiliser or organic manure. For example, 6 kg N/t often is described as the nitrogen content of a manure.
Cover crop A crop sown primarily for the purpose of taking up nitrogen from the soil and which is not harvested. Also called green manure.
Crop-available The total nitrogen content of organic manure that isnitrogen available for crop uptake in the growing season in
which it is spread on land.
Crop nitrogen The amount of crop-available nitrogen that must berequirement applied to achieve the economically optimum yield.
Deposition Transfer of nutrients from the atmosphere to soil or to plant surfaces. The nutrients, mainly nitrogen and sulphur, may be dissolved in rainwater (wet deposition) or transferred in particulate or gaseous forms (dry deposition).
Economic optimum Rate of nitrogen application that achieves the greatest (nitrogen rate) economic return from a crop, taking account of crop value and nitrogen cost.
Excess winter Rainfall between the time when the soil profile becomesrainfall fully wetted in the autumn (field capacity) and the end of
drainage in the spring, less evapotranspiration during this period (i.e. water lost through the growing crop).
FACTS UK national certification scheme for advisers on crop nutrition and nutrient management. Membership is renewable annually. A FACTS Qualified Adviser has a certificate and an identity card.
Farmyard manure Livestock excreta that is mixed with straw bedding(FYM) material that can be stacked in a heap without slumping.
Fertiliser See Manufactured fertiliser.
Fluid fertiliser Pumpable fertiliser in which nutrients are dissolved in water (solutions) or held partly as very finely divided particles in suspension (suspensions).
Grassland Land on which the vegetation consists predominantly of grass species.
Return to Contents

49
Glossary
Greenhouse gas Gas such as carbon dioxide, methane or nitrous oxide that contributes to global warming by absorbing infrared radiation that otherwise would escape to space.
Green manure See Cover crop.
Incorporation A technique (discing, rotovating, ploughing or other methods of cultivation) that achieves some mixing between an organic manure and the soil. Helps to minimise loss of nitrogen to the air through volatilisation and nutrient run-off to surface waters.
Inorganic fertiliser Manufactured fertiliser that contains only inorganic ingredients or urea.
Leaching Process by which soluble materials such as nitrate or sulphate are removed from the soil by drainage water passing through it.
Ley Temporary grass, usually ploughed up one to five years (sometimes longer) after sowing.
Liquid fertiliser See Fluid fertiliser.
Livestock manure Dung and urine excreted by livestock or a mixture of litter, dung and urine excreted by livestock, even in processed organic form. Includes FYM, slurry, poultry litter, poultry manure, separated manures, and granular or pelletised manures.
Maintenance Amount of phosphate or potash that must be appliedapplication to replace the amount removed from a field at harvest
(including that in any straw, tops or haulm removed).
Manufactured Any fertiliser that is manufactured by an industrialfertiliser process. Includes conventional straight and NPK
products (solid or fluid), organo-mineral fertilisers, rock phosphates, slags, ashed poultry manure and liming materials that contain nutrients.
Manure See Livestock manure and Organic manure.
Major nutrient Nitrogen, phosphorus and potassium that are needed in relatively large amounts by crops.
Micronutrient Boron, copper, iron, manganese, molybdenum and zinc that are needed in very small amounts by crops (see also Major nutrients). Cobalt and selenium are taken up in small amounts by crops and are needed in human and livestock diets.
Mineral nitrogen Nitrogen in ammonium (NH4) and nitrate (NO3) forms.
Mineralisable Organic nitrogen that is readily converted to ammoniumnitrogen and nitrate by microbes in the soil, for example during
spring.
Mineralisation Microbial breakdown of organic matter in the soil, releasing nutrients in crop-available, inorganic forms.
Nitrate vulnerable Areas designated by Defra as being at risk from zones (NVZs) agricultural nitrate pollution.
Return to Contents

50
Glossary
Nitrous oxide (N2O) A potent greenhouse gas that is emitted naturally from soils. The amount emitted is related to the supply of mineral nitrogen in the soil. It increases with application of manures and fertilisers, incorporation of crop residues and growth of legumes. It is greater in organic and peaty soils than in other soils.
Offtake Amount of a nutrient contained in the harvested crop (including straw, tops or haulm) and removed from the field. Usually applied to phosphate and potash.
Olsen P Concentration of available P in soil determined by a standard method (developed by Olsen) involving extraction with sodium bicarbonate solution at pH 8.5. It is the main method used in England, Wales and Northern Ireland and the basis for the soil Index for P.
Organic manure Any bulky organic nitrogen source of livestock, human or plant origin, including livestock manures.
Organic material Any bulky organic nitrogen source of livestock, human or plant origin, including livestock manures, biosolids (sewage sludge), compost, digestate and waste-derived materials.
Organic soil Soil containing between 10% and 20% organic matter (in this manual). Elsewhere, it sometimes refers to soils with between 6% and 20% organic matter.
Peaty soil (peat) Soil containing more than 20% organic matter.
Placement Application of fertiliser to a zone of the soil usually close to the seed or tuber.
Poultry manure Excreta produced by poultry, including bedding material that is mixed with excreta, but excluding duck manure with a readily available nitrogen content of 30% or less.
Prilled fertiliser Fertiliser in which particles (prills) are formed by allowing molten material to fall as droplets in a tower. Droplets solidify during the fall and tend to be more spherical and somewhat smaller than granules
Removal See Offtake.
Rhizome Horizontal underground plant stem capable of producing the shoot and root systems of a new plant.
Sand Soil mineral particles larger than 0.05 mm.
Silt Soil mineral particles in the 0.002–0.05 mm diameter range.
Slurry Excreta of livestock (other than poultry), including any bedding, rainwater and washings mixed with it, which can be pumped or discharged by gravity. The liquid fraction of separated slurry is also defined as slurry.
SNS Index Soil Nitrogen Supply expressed in seven bands or Indices, each associated with a range in kg N/ha.
Soil Index Concentration of available P, K or Mg, as determined(P, K or Mg) by standard analytical methods, expressed in bands
or Indices.
Return to Contents
51
Glossary
Soil Mineral Ammonium and nitrate nitrogen, measured by theNitrogen (SMN) standard analytical method and expressed in kg N/ha.
Soil Nitrogen The amount of nitrogen (kg N/ha) in the soil thatSupply (SNS) becomes available for uptake by the crop in the growing
season, taking account of nitrogen losses.
Soil organic matter Often referred to as humus. Composed of organic compounds ranging from undecomposed plant and animal tissues to fairly stable brown or black material with no trace of the anatomical structure of the material from which it was derived.
Soil texture Description based on the proportions of sand, silt and clay in the soil.
Soil type Description based on soil texture, depth, chalk content and organic matter content.
Target Soil Index Lowest soil P or K Index at which there is a high probability crop yield will not be limited by phosphorus or potassium supply. See Soil Index (P, K or Mg).
Trace element See Micronutrient.
Volatilisation Loss of nitrogen as ammonia from the soil to the atmosphere.
Return to Contents

52
Produced for you by:AHDB Stoneleigh Park Kenilworth Warwickshire CV8 2TL
W ahdb.org.uk @The_AHDB
If you no longer wish to receive this information, please email us on [email protected]
While the Agriculture and Horticulture Development Board seeks to ensure that the information contained within this document is accurate at the time of printing, no warranty is given in respect thereof and, to the maximum extent permitted by law, the Agriculture and Horticulture Development Board accepts no liability for loss, damage or injury howsoever caused (including that caused by negligence) or suffered directly or indirectly in relation to information and opinions contained in or omitted from this document.
© Agriculture and Horticulture Development Board 2020. All rights reserved.
70022 0221
For specific AHDB Nutrient Management Guide (RB209) enquiries:T 024 7647 8784 E [email protected] order printed publications:T 0845 245 0009 E [email protected]