application management definitions and nutrient · pdf filecrop group nutrient application...
TRANSCRIPT
APPLICATION MANAGEMENT
Definitions and Nutrient and Reduction Efficiencies of Nutrient Application Management
for use in Phase 5.3.2 of the Chesapeake Bay Program Watershed Model
Crop Group Nutrient Application Management Field Level Nutrient Application Management
Adaptive Nutrient Management
Recommendations for Approval by the Water Quality Goal Implementation Team’s Watershed
Technical and Agricultural Workgroups
Submitted by: Greg Albrecht, Tom Basden, Doug Beegle, Chris Brosch, Thomas Bruulsema, Frank Coale, Jim
Cropper, Jason Dalrymple, Curtis Dell, Mark Dubin, Barry Evans, Doug Goodlander, Chris Gross, Peter Kleinman, John Lea-Cox, Rory Maguire, John Majsztrik, Anne S. Marsh, Josh McGrath,
Jack Meisinger, Royden Powell, Aaron Ristow, Tim Sexton, Kim Snell-Zarcone, Ken Staver, Trish Steinhilber, Wade Thomason, Larry Towle
Submitted to: Agriculture Workgroup
Chesapeake Bay Program
Prepared by:
Chris Brosch, Virginia Tech/Virginia Department of Environmental Quality and
Tetra Tech, Inc.
March 2014
Application Management March 2014
1
Contents Summary of Recommendations ......................................................................................................................... 4
1 Introduction ................................................................................................................................................ 5
2 Practice Definitions .................................................................................................................................... 6
3 Effectiveness Estimates .............................................................................................................................. 7
4 Comments on References ........................................................................................................................... 9
5 Application of Practice Effectiveness Estimates ...................................................................................... 10
6 Practice Monitoring and Reporting .......................................................................................................... 11
7 Data Gaps and Research Needs ................................................................................................................ 11
8 References ................................................................................................................................................ 12
Appendix A: Residual Soil Nitrogen related to Nutrient Applications and Yield Estimates Appendix B: Approved Nutrient Management Expert Panel Conference Call Minutes Appendix C: Technical Requirements for Entering Tier 1 and Existing Nutrient Management BMPs into Scenario Builder and the Watershed Model Appendix D: Summary of Survey and Interviews – Agricultural Nutrient Management Expert Panel
Tables Table 1. Nutrient Management Expert Panel Membership ................................................................................ 5
Application Management March 2014
2
Acronyms AgWG Agriculture Workgroup ALF Alfalfa
ANM Adaptive Nutrient Management
BMP Best management practice
BPJ Best professional judgment
CBPWM Chesapeake Bay Program Watershed Model
CGNAM Crop Group Nutrient Application Management
CSNT Corn Stalk Nitrate Test
FLNAM Field Level Nutrient Application Management
HOM High-till without manure
HWM high-till with manure
HYM Hay-receiving nutrients
HYO Hay without nutrients
HYW Hay fertilized
ISNT Illinois Soil Nitrogen Test
LTM Low-till with manure
NAL Nutrient management alfalfa
NASS National Agricultural Statistics Service
NHI Nutrient management high-till with manure
NHO Nutrient management high-till without manure
NHY Nutrient management hay
NLO Nutrient management low-till
NM rate Nitrogen application rate
NM Nutrient management
NPA Nutrient management pasture
Panel Nutrient Management Expert Panel
PAS Pasture
Application Management March 2014
3
PSNT Pre-sidedress Nitrate Test
STP Soil test phosphorus
TN Total nitrogen
TP Total phosphorus
TRP Riparian pasture
URS Nursery
WQGIT Water Quality Goal Implementation Team
WTWG Watershed Technical Workgroup
Application Management March 2014
4
Summary of Recommendations
The Nutrient Management Expert Panel (Panel) determined that the current definition of nutrient management (NM) is vague and inadequate. Furthermore, the current credit for NM is inconsistent and does not reflect the best professional judgment (BPJ) of national experts on the suite of practices regarding the change from a pre-best management practice (BMP) condition and land grant university (LGU) recommendations of the 1970s and early 1980s—a time in agriculture that pre-dates the Chesapeake Bay Program Watershed Model (CBPWM) simulation period.
This document summarizes the Panel’s recommendations for revised definitions and efficiencies for NM. The Panel proposes that NM be replaced by three tiers of management: (1) Crop Group Nutrient Application Management (CGNAM), (2) Field Level Nutrient Application Management (FLNAM), and (3) Adaptive Nutrient Management (ANM). These practices are defined in the body of the report.
The Panel proposes that CGNAM consistent with the definition has an effectiveness of: • 9.25 percent total nitrogen (TN) reduction and 10 percent total phosphorus (TP) reduction from
land uses high-till with manure (HWM) and low-till with manure (LWM). • 5 percent TN and 8 percent TP reduction from land uses high-till without manure (HOM), pasture
(PAS), hay-receiving nutrients (HYM), alfalfa (ALF), and nursery (URS). In addition, the Panel proposes that:
• Riparian pasture (TRP) and hay without nutrients (HYO) are still excluded eligibility for any form of NM.
• Logic written into the CBPWM NM land uses (NHI, NHO, NLO, NHY, NPA and NAL) should be retained for Panel use, but should not be used to calculate any loads related to CGNAM.
The effectiveness estimates will be simulated as edge-of-stream reductions in the reporting county from the non-BMP land use edge-of-stream load. The Panel determined that adjustments to efficiencies based on geography were not warranted for these interim recommendations.
The Panel based the effectiveness solely on LGU recommendation changes over time because of a lack of scientific literature documenting efficiencies of the proposed practice. The Panel was careful to exclude benefits from other practices in combination with CGNAM, like timing and placement and especially manure management structures by using best-case-scenario considerations for timing and placement as the baseline in the model and finding scientific papers where no manure management structures were documented. Model runs to estimate efficiency based on LGU recommendation changes over time only changed nutrient application rates and held all other BMPs consistent with reported acreage and animal units covered. The Panel did not estimate FLNAM and ANM effectiveness because of time constraints.

Application Management March 2014
5
1 Introduction Implementation of Nutrient Management Plans on agricultural lands is a practice counted in the millions of acres across the Chesapeake Bay watershed. It is one of the oldest best management practices (BMPs) in agriculture and is the cornerstone of stewardship efforts by conservation groups, producers and jurisdictions. This document summarizes the Nutrient Management Expert Panel’s (Panel) recommendations for revised definitions and efficiencies for Nutrient Management (NM). The Panel proposes that NM be replaced by Crop Group Nutrient Application Management (CGNAM), Field Level Nutrient Application Management (FLNAM), and Adaptive Nutrient Management (ANM). The new practices are defined below. The latter two new practices only have definitions because the Panel ran out of time to include effectiveness for these practices.
The Agriculture and Watershed Technical Workgroups (AgWG/WTWG) approved this practice for inclusion for Phase 5.3.2 of the Chesapeake Bay Program Watershed Model (CBPWM). Table 1 below lists the table members.
Table 1. Nutrient Management Expert Panel Membership Panelist Jurisdiction Affiliation Chris Brosch, Chair Virginia Virginia Tech/Virginia Department of Environmental Quality Greg Albrecht New York New York Department of Agriculture Tom Basden West Virginia West Virginia University Doug Beegle Pennsylvania Penn State University Thomas Bruulsema Industry International Plant Nutrition Institute Frank Coale Maryland University of Maryland Jim Cropper New York, Pennsylvania, Delaware,
Maryland, Virginia, West Virginia, Industry Northeast Pasture Consortium
Jason Dalrymple West Virginia West Virginia Department of Agriculture Curtis Dell Pennsylvania USDA Agricultural Research Service Barry Evans Pennsylvania Penn State University Doug Goodlander Pennsylvania Pennsylvania Department of Environmental Protection Chris Gross Maryland USDA Natural Resources Conservation Service Peter Kleinman Pennsylvania USDA Agricultural Research Service John Lea-Cox Maryland University of Maryland Rory Maguire Virginia Virginia Tech John Majsztrik Maryland University of Maryland Anne S. Marsh District of Columbia Heinz Center Josh McGrath Maryland University of Maryland Jack Meisinger Maryland USDA Agricultural Research Service Royden Powell Maryland Maryland Department of Agriculture Aaron Ristow New York, Pennsylvania Upper Susquehanna Coalition Tim Sexton Virginia Virginia Department of Conservation and Recreation Kim Snell-Zarcone Pennsylvania Conservation Pennsylvania Ken Staver Maryland University of Maryland Trish Steinhilber Maryland University of Maryland Wade Thomason Virginia Virginia Tech Larry Towle Delaware Delaware Department of Agriculture Mark Dubin Maryland University of Maryland
Application Management March 2014
6
Panelist Jurisdiction Affiliation Technical support by Steve Dressing, Don Meals, and Jennifer Ferrando (Tetra Tech); Jeff Sweeney (EPA CBPO); Matt Johnston (UMD CBPO); and Emma Giese (CRC).
CBPO – Chesapeake Bay Program Office; CRC – Chesapeake Research Consortium; UMD – University of Maryland; USDA – U.S. Department of Agriculture
2 Practice Definitions The new practices are organized into three tiers, each building on the previous tier in succession. Tier 1 - Crop Group Nutrient Application Management (CGNAM): Documentation exists for
manure and/or fertilizer application management activities in accordance with basic land grant university (LGU) recommendations. This documentation supports farm-specific efforts to maximize growth by application of nitrogen (N) and phosphorus (P) with respect to proper nutrient source, rate, timing and placement for optimum crop growth consistent with LGU recommendations. Particular attention is paid to: (1) standard, realistic farm-wide yield goals; (2) credit for N sources (soil, sod, past manure and current-year applications); (3) P application rates consistent with LGU recommendations based on soil tests for fields without manure; and (4) N based application rates consistent with LGU recommendations for fields receiving manure.
Tier 2 – Field Level Nutrient Application Management (FLNAM): Implementation of formal
NM planning is documented and supported with records demonstrating efficient use of nutrients for both crop production and environmental management. Nutrient applications are based on: (1) standard yield goals per soil type, or historic yields within field management units; (2) credit for N sources (soil, sod, past manure, and current-year applications); (3) P application rates consistent with LGU recommendations based on soil tests and LGU guidelines; (4) fields assessed for P loss risk with a LGU P risk assessment tool; and (5) other conservation tools necessary for proper nutrient source, rate, timing and placement to improve nutrient use efficiency.
Tier 3 – Adaptive Nutrient Management (ANM): Implementation of Tier 2 nutrient application
management, plus multiyear monitoring of nutrient use efficiency with the results of this monitoring being integrated into future NM planning. This process evaluates and refines the standard LGU nutrient recommendations using field- and subfield-specific multiple-season records. It further promotes the coordination of amount (rate), source, timing, and placement (application method) of plant nutrients to further reduce nutrient losses while maintaining economic returns. In addition to the field assessments in FLNAM, ANM must include some or all of the following elements:
• Multiyear, ongoing records from tests or trials including field- and subfield-level soil test P (STP). • An N assessment including but not limited to Illinois Soil Nitrogen Test (ISNT), Corn Stalk Nitrate
Test (CSNT), Pre-sidedress Nitrate Test (PSNT) and in-field monitoring/strip trials with yield determination to improve upon the standard LGU recommendations for application.
• Precision application technologies to more accurately deliver and record recommendations.
The CGNAM practice is intended to replace the current version of NM in Phase 5.3.2 of the CBPWM. The Panel determined that the current definition of NM is vague and inadequate. Furthermore, the current credit for NM is inconsistent and does not reflect the best professional judgment (BPJ) of national experts on the suite of practices regarding the change from a pre-BMP condition and LGU recommendations of the 1970s and early 1980s—a time in agriculture that pre-dates the CBPWM simulation period.
Application Management March 2014
7
FLNAM is a new practice that reflects the substantive change in NM that addresses P applications and methods by the LGUs and jurisdictional policies circa 1995. ANM is a new practice consistent with the Natural Resources Conservation Service 590 Practice Standard that will credit the reductions in runoff and subsurface nutrient loss consistent with an adaptive management approach to nutrient applications and management on agricultural lands. This practice captures the future of NM in the watershed and non-cost-shared practices that go beyond FLNAM. This new suite of BMPs will work in tiers where a higher tier practice receives additional nutrient reduction efficiencies exceeding the cumulative effect of the lower tiers.
3 Effectiveness Estimates The Panel proposes that CGNAM consistent with the definition has an effectiveness of:
• 9.25 percent total nitrogen (TN) reduction and 10 percent total phosphorus (TP) reduction from land uses high-till with manure (HWM) and low-till with manure (LWM).
• 5 percent TN and 8 percent TP reduction from land uses high-till without manure (HOM), pasture (PAS), hay-receiving nutrients (HYM), alfalfa (ALF), and nursery (URS).
In addition, the Panel proposes that:
• Riparian pasture (TRP) and Hay without nutrients (HYO) are still excluded eligibility for any
form of NM. • Logic written into the CBPWM NM land uses (NHI, NHO, NLO, NHY, NPA and NAL)
should be retained for Panel use, but should not be used to calculate any loads related to CGNAM.
The effectiveness estimates will be simulated as edge-of-stream reductions in the reporting county from the non-BMP land use edge-of-stream load. The Panel determined that adjustments to efficiencies based on geography were not warranted for these interim recommendations. The Panel did not review these practices for external environmental benefits because of time constraints. In the absence of historic surveys on nutrient applications to crops, bay-wide representative NM and non-NM application rates were determined based on historical (i.e., before the CBPWM simulation period of 1985) and circa 1995 LGU agronomy guides (before FLNAM began appearing in agronomy guides). Historical LGU agronomy guides evaluated by panelists recommended from 15–40 percent more plant-available N than circa 1995 LGU guides. The Panel unanimously agreed to use this change in recommendations as a proxy for pre-NM versus NM conditions on corn acres across the Chesapeake Bay watershed. A 20 percent difference in non-NM and NM N applications was determined to be a conservative estimate based on the literature search. Other crops of significant acreage (i.e. soy, wheat, alfalfa) did not have consistently lower recommended application rates from LGU agronomy guides; therefore, proxy non-NM application rates could not be determined for those crops. The proxy was used in conjunction with Panel-summarized literature comparing application rates, yields and spring or fall residual soil nitrate on corn. First, the NM yield was determined from the LGU agronomy guides. A current LGU N application rate (NM rate) was calculated as well as a proxy non-NM rate of 1.2 times the current NM rate. Study application rates or yields were plotted against residual soil N and a change in soil N resulting from a 20 percent nutrient reduction to NM rates was determined from the plot.
Application Management March 2014
8
Two studies in Maryland (Angle1993; Coale 2000), one study in Virginia (Ditsch 1991) and studies in Pennsylvania and New York (Ketterings et al. 2005; Ketterings et al. 2011; Sogbedji et al. 2000; Swink et al. 2009) were summarized to yield reductions in N loss from a reduction in application rate. Curves were fitted to application rate and fall soil N loss. The Panel considered 15 percent reductions in fall soil N to be expected bay-wide based on the LGU application rate reductions over time and the response in fall soil N (see Appendix A). The Panel considered changing the efficiencies based on geography, but did not deem it necessary or prudent based on the limited timeline for report turnaround and lifespan of this interim recommendation. This will be reconsidered in the Phase 6 CBPWM review. The Panel performed a sensitivity analysis on a 2007 progress scenario, choosing the year 2007 to avoid violating the Phase 5.3.2 CBPWM calibration. Changing the outcomes of scenarios run for the Phase 5.3.2 CBPWM calibration period (1985–2005) would invalidate the model calibration and reduce the accuracy of the results in all runs. Three runs were performed: one run where Phase 5.3.2 acres were modeled with current methods of determining non-NM application rates (see v2.4 Scenario Builder documentation [CBP 2013]); another where Phase 5.3.2 acres were modeled with current NM application rates; and a third where non-NM rates on corn were replaced with rates 1.2 times higher than the current Phase 5.3.2 CBPWM NM rate. These runs were summarized for different land uses in each state and across the whole Chesapeake Bay watershed (see Appendix A). The Panel agreed the most defensible estimate of the NM proxy was to compare the land uses HWM and LWM that simulate row crops across the runs. The average effectiveness estimate calculated in the comparison between NM and current non-NM runs for all other NM-modeled land uses (hay fertilized [HYW], HOM, PAS, ALF) was the only defensible efficiency the Panel could choose before the CBP deadline. The efficiencies described above were chosen to replace the current NM land uses and also to be available to nursery acres (URS). The Panel unanimously chose the corn application rate proxy approach to affect all crops in the HWM land use. The primary reasons for expanding the effectiveness selected for corn to more crops were:
1. The majority of acres in the HWM land use were in corn in 2007. 2. Other crops, like wheat, making up the minority of acres in the land use had even larger reductions
in recommended application rates in the LGU agronomy guides through time. While the Panel agrees that the current method of calculating NM application rates based on yield is consistent with the concept of CGNAM, the yields from the National Agricultural Statistics Service (NASS) Census of Agriculture included in the CBPWM are considered to be far too low. Reduced application rates corresponding to load reduction efficiencies that reflect the BPJ of the Panel would not produce realistic yields on the landscape. The Panel agreed that the NASS yields should be examined for accuracy in the Phase 6.0 CBPWM and other sources of yield data should be used in addition to NASS. The Panel notes that neither this recommendation nor the CBPWM account appropriately for the documented increase in corn grain yields through the simulation period, and they could not identify the reason for the lack of change in N fertilizer use over the same period. The available literature did not identify increases in pollution from CGNAM. Anecdotal evidence of a minority of producers increasing their nutrient application rates in response to LGU agronomy guide recommendations over time was considered to be inconsequential bay-wide, and would be limited to producers that were using commercial fertilizers too conservatively based on cost and had to increase applications to achieve target yields based on the LGU recommendations. Through the period of agronomy guides reviewed, the estimated rate of annual N mineralization from
Application Management March 2014
9
animal manure applied to land increased. The Panel agreed that the change in manure mineralization estimates through post-1995 LGU agronomy guide publications adds a significant amount of conservativeness to the efficiency estimate because it does not account for N loss reductions attributable to more accurate mineralization estimates in post-1995 NM planning. The Panel based the effectiveness solely on LGU recommendation changes over time. The Panel was careful to exclude benefits from other practices in combination with CGNAM, like timing and placement and especially manure management structures by using best-case-scenario considerations for timing and placement as the baseline in the model and finding scientific papers where no manure management structures were documented. Model runs to estimate efficiency based on LGU recommendation changes over time only changed nutrient application rates and held all other BMPs consistent with reported acreage and animal units covered. The literature reviewed did not address the effects of CGNAM on different nutrient loss pathways. The literature reviewed was limited to subsurface loss. The Panel did not estimate FLNAM and ANM effectiveness because of time constraints. The Panel also did not consider relations to the load reduction benefits of other similar practices because replacement BMPs for NM do not exist. NM also does not exclude other BMPs from the acres it covers.
4 Comments on References The Panel determined the results in the references to be sufficiently consistent to use as the basis for model runs to determine the proposed interim efficiencies. The Panel found the Coale (2000), Angle et al. (1993) and Ditsch et al. (1991) data to have consistent results. The Angle et al. (1993) results were slightly lower; however, the study mixed in other BMPs in a different season and therefore was expected to yield results in the magnitude and direction presented when compared to Coale (2000), Ditsch et al. (1991) and anecdotal summaries of Jemison and Fox (1994), van Es et al. (2002) and Sogbedji et al. (2000). The following are considerations from all studies:
• Data for yield were higher than current CBPWM estimates. • Results were multiyear and should reflect an average of this annual practice. • Leaching or soil-test nitrate were evaluated as edge-of-field loss and this was compared to CBPWM
edge-of-stream loss (consistent with efficiency estimates) based on BPJ. Anecdotal evidence from the Jemison and Fox (1994) paper was presented to the Panel in a conference call. Preliminary evidence from van Es et al. (2002) and Sogbedji et al. (2000) was deemed sufficient, and Appendix A reports the findings. Unpublished data were given the same weight as peer-reviewed journal articles and dissertation data. Literature was drawn from across the Chesapeake Bay watershed, extending from New York to Virginia. Literature values for fall soil N related to variable application rates were consistent among the different states.
Application Management March 2014
10
5 Application of Practice Effectiveness Estimates
• All tiers should be reported in acres and credited identically across the CBPWM. • The effectiveness estimates are:
o 9.25 percent total N (TN) reduction and 10 percent total P (TP) reduction from land uses HWM and LWM.
o 5 percent TN and 8 percent TP reduction from land uses HOM, PAS, HYM, ALF, and URS. • TRP and HYO are still excluded from eligibility for any form of NM. • The Panel unanimously agreed that the pre- and post-1995 LGU agronomy guide recommendations
for corn application rates based on yield were a conservative estimate of the application rate differences between real-world non-NM acres and those acres under a real-world plan consistent with the definition for CGNAM.
• The Panel considered only subsurface movement of N to estimate the nutrient reduction benefit of a NM rate on corn. The Panel used model exercises to estimate edge-of-stream P benefit on all HWM land use crops for CGNAM, and well as N and P benefits on the other aforementioned land uses and their associated crops.
• The Panel discussed that coarser, well-drained soils are more susceptible to nutrient loss, even under NM-type BMPs, but no specific recommendation for this case could be made in time for this report.
• The Panel approved continued use of the Enhanced NM and Precision/Decision Agriculture at the current effectiveness and under the current definitions, but cited concern over the inconsistent interpretation of those BMPs by reporting authorities.
• The practice approved in this report is limited to the estimates for effectiveness and land uses stated within this report.
A. Geographic Considerations CGNAM is applicable across all Chesapeake Bay watershed jurisdictions and land types (limited to the land uses described above), and the effectiveness estimates do not vary based on geography. The load reduction benefits are applied at the edge of stream. B. Temporal Considerations CGNAM is intended to be represented as an annual practice effective immediately and covering the entire year. All active plans, whether single or multiyear plans, are intended to be represented as active and on the ground in all the years they can be verified. Other considerations about the useful life are verification questions to be addressed by the Panel. C. Practice Limitations CGNAM is limited to the estimates for effectiveness in land uses stated within this report. CGNAM is applicable with any BMP on the land uses to which this BMP can be applied. Positive interactions with other BMPs could improve a combined effectiveness, but this is not addressed in this report. 5.4 Modeling Considerations
• NM land uses are eliminated as the means for crediting NM. • Non-NM land uses are to be used as the baseline for applying the approved efficiencies. • Approved NM practice efficiencies should be credited in this order: Enhanced Nutrient Application
Management, Decision/Precision Agriculture and CGNAM. This order allows the CBPWM to credit more effective practices before acres available for any NM practice are consumed in the model.
• Acres not reported under a NM tier should be simulated as Phase 5.3.2 CBPWM default non-NM.

Application Management March 2014
11
• Verification considerations were discussed and the discussion has been deferred to its own Expert Panel established by AgWG on September 29, 2013. The Expert Panel intends to yield to the newly created Agricultural Management Plan Expert Panel for developing guidance on how to verify nutrient application management BMPs. The panel notes that verifying active plans in compliance with the approved definitions presents unique challenges compared to BMPs that are visibly implemented.
6 Practice Monitoring and Reporting
• All NM tiers are available for reporting to all jurisdictions that have agricultural acres in crops mapped to an agricultural land use. This condition currently exists for every state in the Chesapeake Bay watershed. The Panel indicated that all three NM tiers likely have acres available for credit in every state.
• Expired plans and acres not in active plans, acres where the plan was not implemented, or acres that could not be verified should not be credited.
• The Panel is prepared to consider questions from the AgWG, WTWG, and the Water Quality Goal Implementation Team (WQGIT) before final approval through ongoing conference calls, but may defer verification questions to the Agricultural Management Plans Expert Panel.
• The Panel commits to continue working on interim efficiency estimates for FLNAM and ANM after WQGIT addresses and approves the comments related to CGNAM.
7 Data Gaps and Research Needs
• Research relating edge-of-stream nutrient loads to leaching or edge-of-field nutrient losses would be valuable to fill a gap the Panel addressed based on its collective BPJ.
• Documentation of efforts related to verifying all NM plans would be useful to develop verification protocols for all three NM tiers, but especially CGNAM.
• Data showing the temporal increase in corn grain yields resulting from genetic improvement related to the apparently steady N fertilizer use over the same period are needed. These data could yield a considerable adjustment in recommendations.
• The inconsistent interpretation of Enhanced NM and Precision/Decision Agriculture among the Chesapeake Bay states should be addressed. Note, however, that FLNAM and ANM will replace those practices.
• The following should be considered for the Phase 6.0 CBPWM review: o Data on geographic differences in N reduction efficiencies resulting from
CGNAM. o Data on differences in N reduction efficiencies resulting from applying NM
practices to different soil types. o Alternative data to reflect more realistic crop yield potential than the NASS data
currently used in the model.
Application Management March 2014
12
8 References
Angle, J.S., C.M. Gross, R.L. Hill, and M.C. McIntosh. 1993. Soil Nitrate concentrations under corn as affected by tillage, manure and fertilizer applications. Journal of Environmental Quality 22:141–147. CBP (Chesapeake Bay Program). 2013. Estimates of County-Level Nitrogen and Phosphorus Data for Use in Modeling Pollutant Reduction —Documentation for Scenario Builder Version 2.4. U.S. Environmental Protection Agency, Chesapeake Bay Program, Annapolis, MD.
Coale, F. J. 2000. Effect of Crop Rotations on the Fate of Residual Soil Nitrogen in Maryland Grain Production Systems. Final project report, MGPUB Grant No. 98022. Maryland Grain Producers Utilization Board, Edgewater, MD.
Ditsch, D. C. 1991. Fate of 15N-depleted Fertilizer N in a Corn-rye Cropping Sequence: Plant Uptake and Soil Distribution. Virginia Polytechnic Institute and State University, Blacksburg, VA
Jemison, J.M., and R.H. Fox. 1994. Nitrate leaching from nitrogen-fertilized and manured corn measured with zero-tension pan lysimeters. Journal of Environment Quality 23.2 (1994):337. CrossRef. Web. September 23, 2013. Ketterings, Q.M., S.N. Swink, G. Godwin, K.J. Czymmek, and G.L. Albrecht. 2005. Maize silage yield and quality response to starter phosphorus fertilizer in high phosphorus soils in New York. Journal of Food, Agriculture and Environment 3:360–365. Ketterings, Q. M., K.J. Czymmek, and S.N. Swink. 2011. Evaluation methods for a combined research and extension program used to address starter phosphorus fertilizer use for corn in New York. Canadian Journal of Soil Science 91:467–477. Sogbedji, J.M., H.M. van Es, C.L.Yang, L.D. Geohring, and F.R. Magdoff. 2000. Nitrate leaching and N budget as affected by maize N fertilizer rate and soil type. Journal of Environmental Quality 29:1813–1820. Swink, S.N., Q.M. Ketterings, L.E. Chase, K.J. Czymmek, and J.C. Mekken. 2009. Past and future phosphorus balances for agricultural cropland in New York State. Journal of Soil and Water Conservation 64(2):120–133. van Es, H.M., K.J. Czymmek, and Q.M. Ketterings. 2002. Management effects on nitrogen leaching and guidelines for a nitrogen leaching index in New York. Journal of Soil and Water Conservation 57(6):499–504.
Appendix A:Residual Soil Nitrogen related to Nutrient Applications and Yield
Estimates
NM Expert Panel 9.23.13
0
20
40
60
80
100
120
140
160
180
200
0 50 100 150 200 250 300
Gra
in Y
ield
, b
u/a
c o
r S
oil
NO
3-N
lb
s N
/ac
Fert. N, lbs N/ac
Corn Grain Yield Fall Soil NO3 0-3 ft
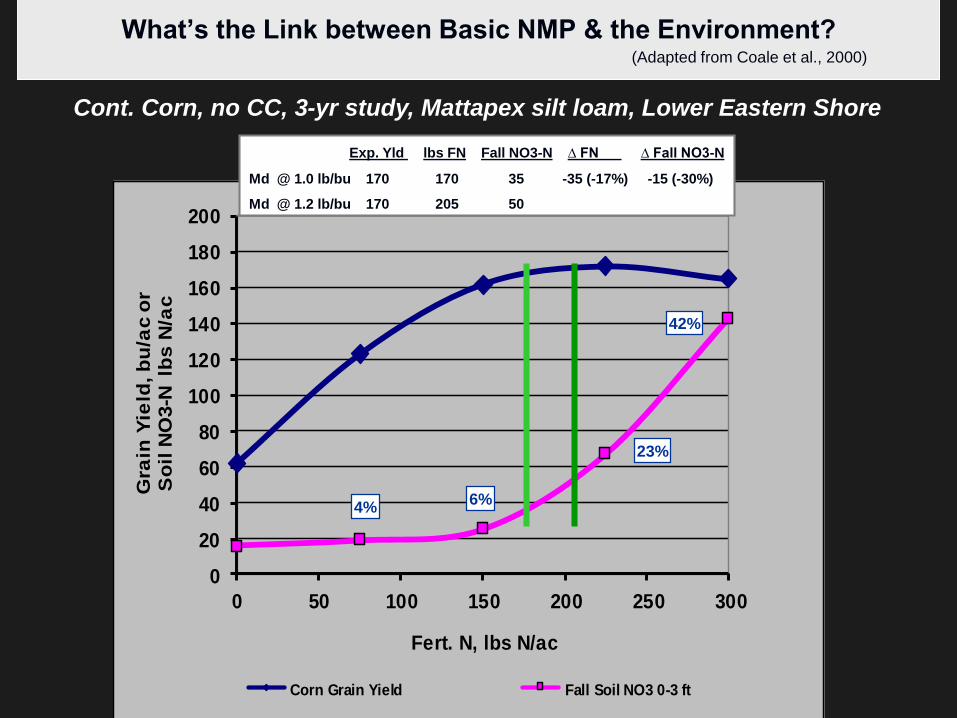
What’s the Link between Basic NMP & the Environment?(Adapted from Coale et al., 2000)
Exp. Yld lbs FN Fall NO3-N ∆ FN ∆ Fall NO3-N
Md @ 1.0 lb/bu 170 170 35 -35 (-17%) -15 (-30%)
Md @ 1.2 lb/bu 170 205 50
4%6%
23%
42%
Cont. Corn, no CC, 3-yr study, Mattapex silt loam, Lower Eastern Shore
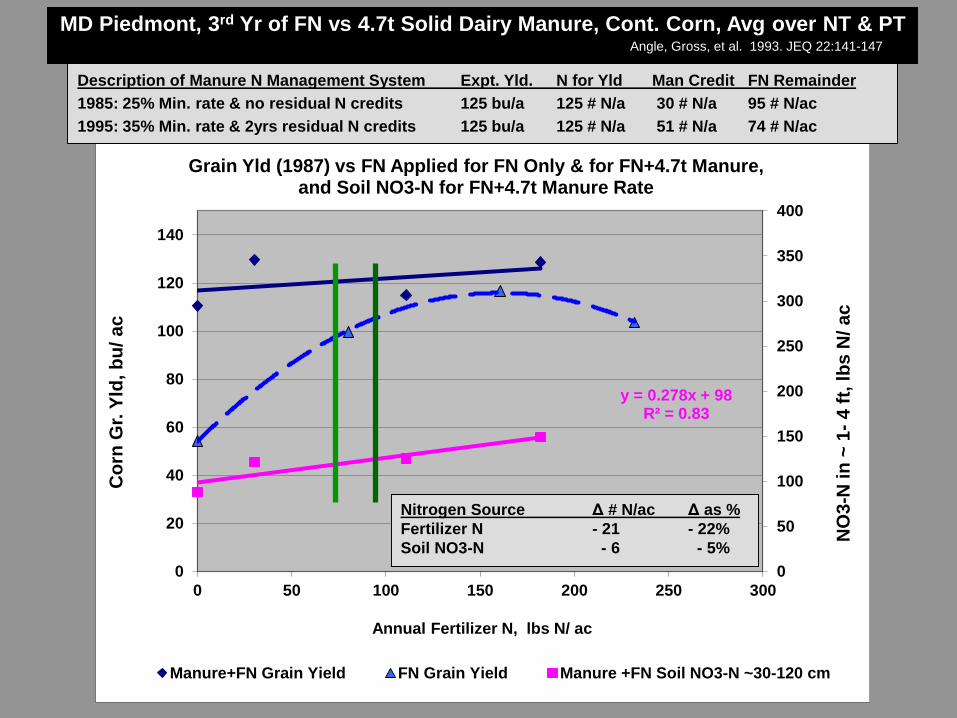
y = 0.278x + 98R² = 0.83
0
50
100
150
200
250
300
350
400
0
20
40
60
80
100
120
140
0 50 100 150 200 250 300
NO
3-N
in
~ 1
-4
ft,
lb
s N
/ a
c
Co
rn G
r. Y
ld, b
u/
ac
Annual Fertilizer N, lbs N/ ac
Grain Yld (1987) vs FN Applied for FN Only & for FN+4.7t Manure,and Soil NO3-N for FN+4.7t Manure Rate
Manure+FN Grain Yield FN Grain Yield Manure +FN Soil NO3-N ~30-120 cm
MD Piedmont, 3rd Yr of FN vs 4.7t Solid Dairy Manure, Cont. Corn, Avg over NT & PTAngle, Gross, et al. 1993. JEQ 22:141-147
Nitrogen Source Δ # N/ac Δ as %
Fertilizer N - 21 - 22%
Soil NO3-N - 6 - 5%
Description of Manure N Management System Expt. Yld. N for Yld Man Credit FN Remainder
1985: 25% Min. rate & no residual N credits 125 bu/a 125 # N/a 30 # N/a 95 # N/ac
1995: 35% Min. rate & 2yrs residual N credits 125 bu/a 125 # N/a 51 # N/a 74 # N/ac
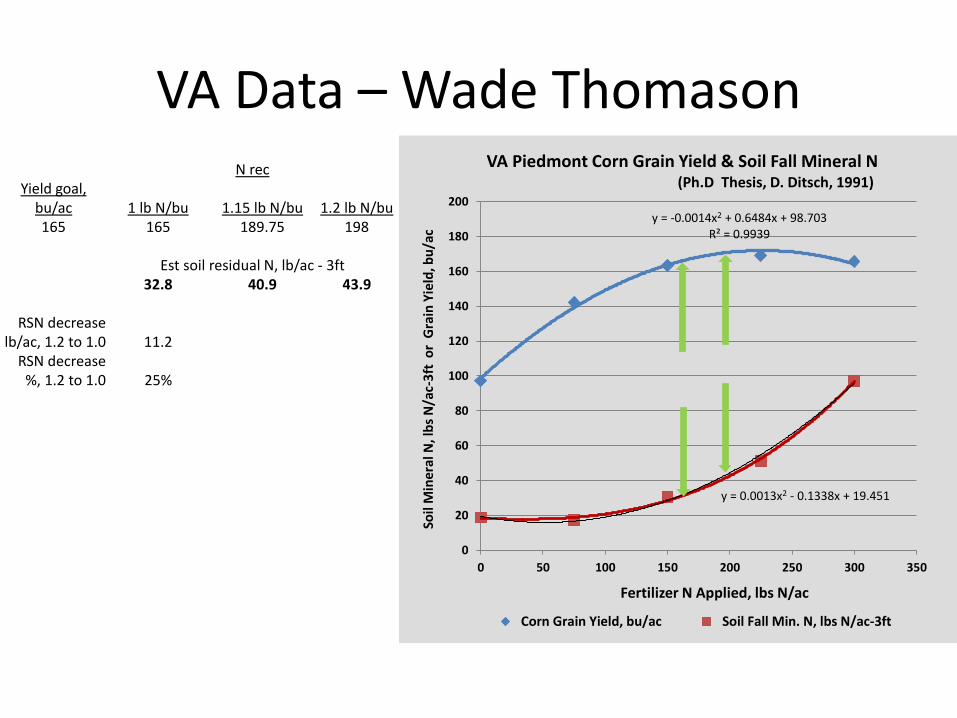
VA Data – Wade ThomasonN rec
Yield goal, bu/ac 1 lb N/bu 1.15 lb N/bu 1.2 lb N/bu165 165 189.75 198
Est soil residual N, lb/ac - 3ft32.8 40.9 43.9
RSN decrease lb/ac, 1.2 to 1.0 11.2
RSN decrease %, 1.2 to 1.0 25%
y = -0.0014x2 + 0.6484x + 98.703R² = 0.9939
y = 0.0013x2 - 0.1338x + 19.451
0
20
40
60
80
100
120
140
160
180
200
0 50 100 150 200 250 300 350
Soil
Min
era
l N, l
bs
N/a
c-3
ft o
r G
rain
Yie
ld, b
u/a
c
Fertilizer N Applied, lbs N/ac
VA Piedmont Corn Grain Yield & Soil Fall Mineral N(Ph.D Thesis, D. Ditsch, 1991)
Corn Grain Yield, bu/ac Soil Fall Min. N, lbs N/ac-3ft
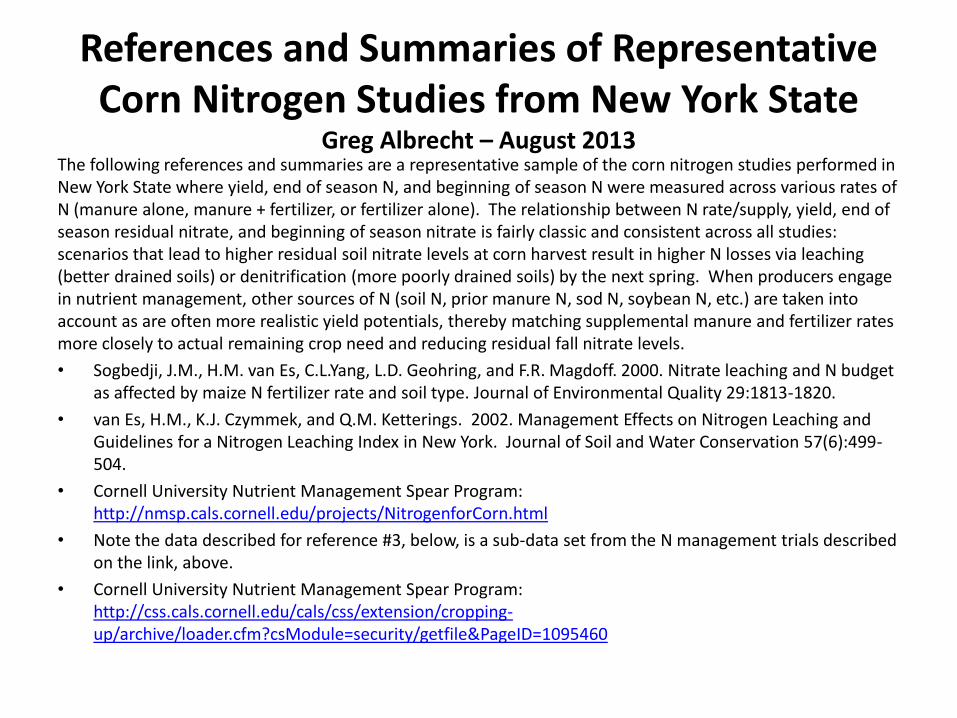
References and Summaries of Representative Corn Nitrogen Studies from New York State
Greg Albrecht – August 2013The following references and summaries are a representative sample of the corn nitrogen studies performed in New York State where yield, end of season N, and beginning of season N were measured across various rates of N (manure alone, manure + fertilizer, or fertilizer alone). The relationship between N rate/supply, yield, end of season residual nitrate, and beginning of season nitrate is fairly classic and consistent across all studies: scenarios that lead to higher residual soil nitrate levels at corn harvest result in higher N losses via leaching (better drained soils) or denitrification (more poorly drained soils) by the next spring. When producers engage in nutrient management, other sources of N (soil N, prior manure N, sod N, soybean N, etc.) are taken into account as are often more realistic yield potentials, thereby matching supplemental manure and fertilizer rates more closely to actual remaining crop need and reducing residual fall nitrate levels.
• Sogbedji, J.M., H.M. van Es, C.L.Yang, L.D. Geohring, and F.R. Magdoff. 2000. Nitrate leaching and N budget as affected by maize N fertilizer rate and soil type. Journal of Environmental Quality 29:1813-1820.
• van Es, H.M., K.J. Czymmek, and Q.M. Ketterings. 2002. Management Effects on Nitrogen Leaching and Guidelines for a Nitrogen Leaching Index in New York. Journal of Soil and Water Conservation 57(6):499-504.
• Cornell University Nutrient Management Spear Program: http://nmsp.cals.cornell.edu/projects/NitrogenforCorn.html
• Note the data described for reference #3, below, is a sub-data set from the N management trials described on the link, above.
• Cornell University Nutrient Management Spear Program: http://css.cals.cornell.edu/cals/css/extension/cropping-up/archive/loader.cfm?csModule=security/getfile&PageID=1095460
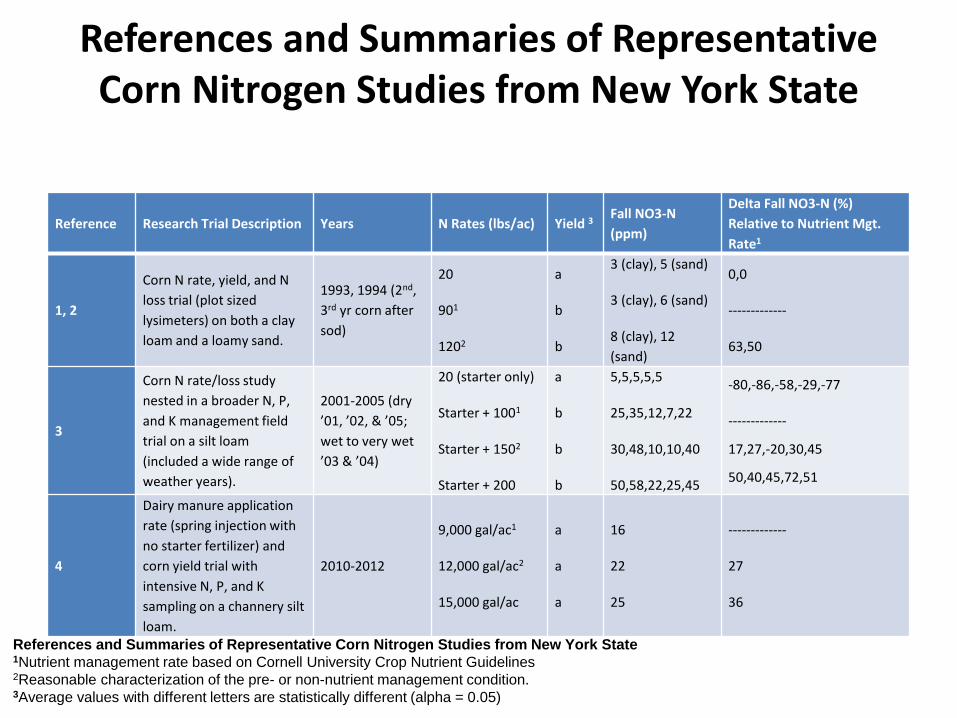
References and Summaries of Representative Corn Nitrogen Studies from New York State
Reference Research Trial Description Years N Rates (lbs/ac) Yield 3Fall NO3-N
(ppm)
Delta Fall NO3-N (%)
Relative to Nutrient Mgt.
Rate1
1, 2
Corn N rate, yield, and N
loss trial (plot sized
lysimeters) on both a clay
loam and a loamy sand.
1993, 1994 (2nd,
3rd yr corn after
sod)
20
901
1202
a
b
b
3 (clay), 5 (sand)
3 (clay), 6 (sand)
8 (clay), 12
(sand)
0,0
-------------
63,50
3
Corn N rate/loss study
nested in a broader N, P,
and K management field
trial on a silt loam
(included a wide range of
weather years).
2001-2005 (dry
’01, ’02, & ’05;
wet to very wet
’03 & ’04)
20 (starter only)
Starter + 1001
Starter + 1502
Starter + 200
a
b
b
b
5,5,5,5,5
25,35,12,7,22
30,48,10,10,40
50,58,22,25,45
-80,-86,-58,-29,-77
-------------
17,27,-20,30,45
50,40,45,72,51
4
Dairy manure application
rate (spring injection with
no starter fertilizer) and
corn yield trial with
intensive N, P, and K
sampling on a channery silt
loam.
2010-2012
9,000 gal/ac1
12,000 gal/ac2
15,000 gal/ac
a
a
a
16
22
25
-------------
27
36
References and Summaries of Representative Corn Nitrogen Studies from New York State1Nutrient management rate based on Cornell University Crop Nutrient Guidelines2Reasonable characterization of the pre- or non-nutrient management condition.3Average values with different letters are statistically different (alpha = 0.05)
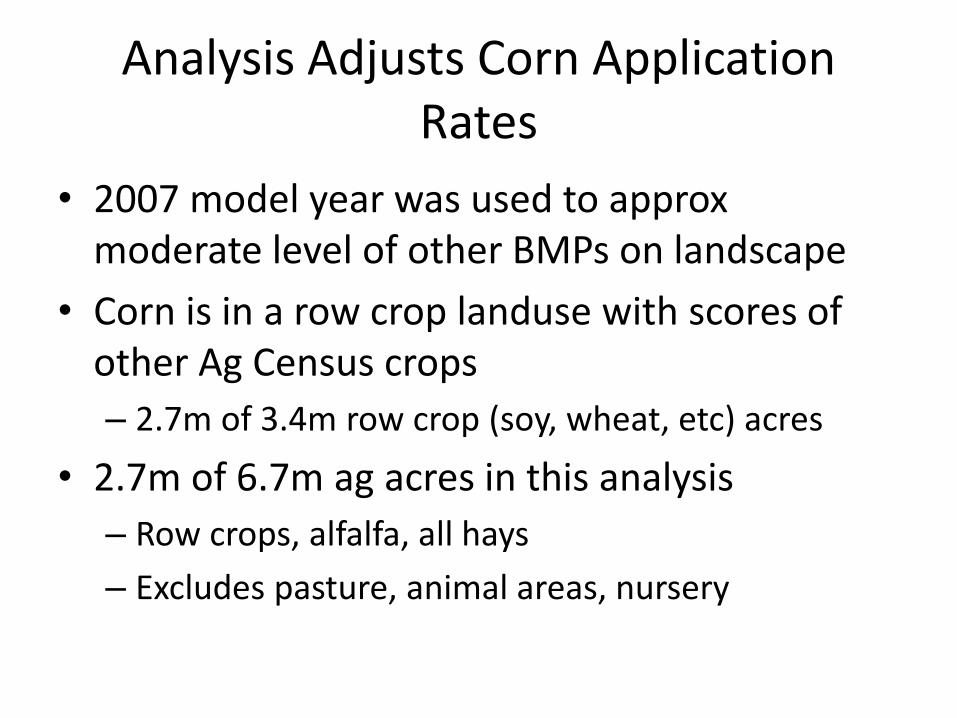
Analysis Adjusts Corn Application Rates
• 2007 model year was used to approx moderate level of other BMPs on landscape
• Corn is in a row crop landuse with scores of other Ag Census crops
– 2.7m of 3.4m row crop (soy, wheat, etc) acres
• 2.7m of 6.7m ag acres in this analysis
– Row crops, alfalfa, all hays
– Excludes pasture, animal areas, nursery

0%
1%
2%
3%
4%
5%
6%
7%
8%
9%
120 130 140 150
Pe
rce
nt
Incr
eas
e f
rom
NM
EO
S
Corn Application Average lbs/ac
Chesapeake Bay Application Rate Sensitivity Run
N Avg
P Avg
Among just row crops:
• N and P EOS loss increase 9.25 and 10%, respectively from NM to 120% N app rate on corn.
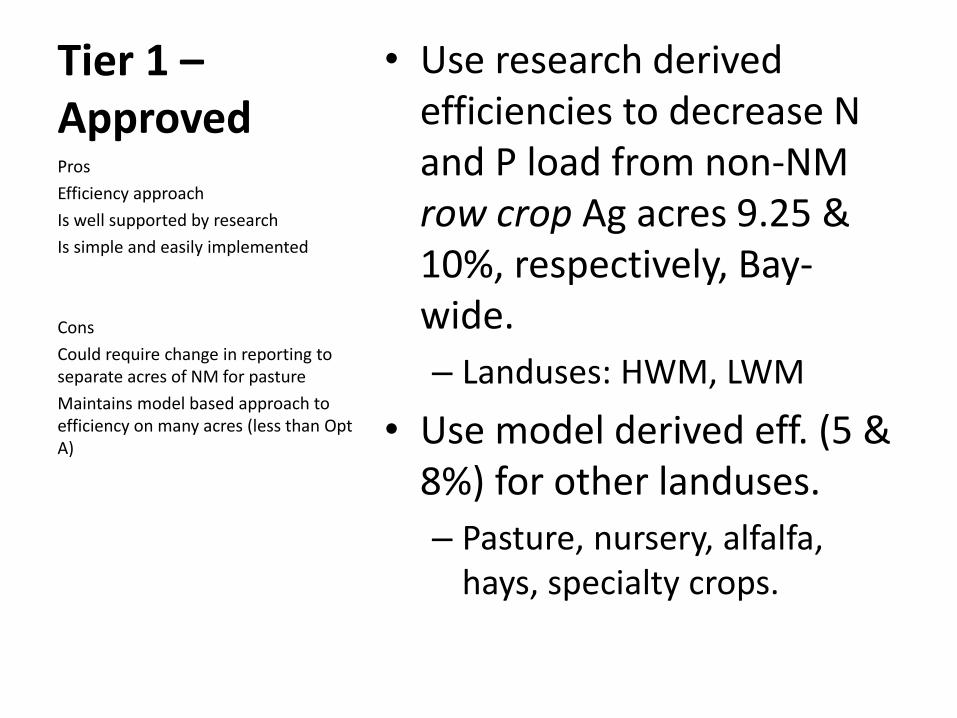
Tier 1 –Approved
• Use research derived efficiencies to decrease N and P load from non-NM row crop Ag acres 9.25 & 10%, respectively, Bay-wide.
– Landuses: HWM, LWM
• Use model derived eff. (5 & 8%) for other landuses.
– Pasture, nursery, alfalfa, hays, specialty crops.
Pros
Efficiency approach
Is well supported by research
Is simple and easily implemented
Cons
Could require change in reporting to separate acres of NM for pasture
Maintains model based approach to efficiency on many acres (less than Opt A)

Application Management March 2014
APPENDIX B: APPROVED NUTRIENT MANAGEMENT EXPERT PANEL
CONFERENCE CALL MINUTES
Agricultural Nutrient Management Expert Panel
Application Management March 2014
Page B1
Nutrient Management Expert Review Panel Conference Call Meeting Notes
March 27, 2013
1. Welcome and Introductions
a. Mark Dubin, Panel coordinator, welcomed everyone to the call and introduced the new panel chair, Chris Brosch (VA DCR).
i. Dubin: October 1 is the current deadline for draft recommendations to the AgWG for obtaining modifications to the P5.3.2 models for the 2013 progress reporting. (decisions by the WQGIT have since revised this schedule to early September at the latest)
ii. Chris Brosch introduced two new panel members; Rory Maguire (VT) and Kim Snell-Zarcone (Conservation PA)
2. Presentation of final Nutrient Management Report
a. Steve Dressing (TetraTech) presented the reviewed final Nutrient Management Report compiled for this panel and the Agriculture Workgroup, highlighting the current state strategies for nutrient management.
i. Dubin recommended including information on the new Maryland P management tool (Frank Coale and Josh Mcgrath) as an addendum to the report.
ACTION: Peter Kleinman will provide P Index presentation and other materials to be added to the panel report.
3. Modeling framework a. Matt Johnston, UMD, presented an overview of the modeling framework with
special emphasis on BMP pathways available for recommendations in Scenario Builder. (Matt's presentation)
i. Clarify how the model counts stored nutrients? ii. Jeff Sweeney: Model is calibrated to monitoring data, so it is capturing
discharge from soils, not capturing the quantified connection between historic applications and storage and nutrients in streams.
iii. Johnston reviewed the BMP options: 1. Land Use change (can change tillage practices, application rates,
application timing) 2. Efficiency (reduce amount of nutrients from runoff, or output ) 3. Nutrient source reduction (shrinks the amount of nutrients
available for application to crops, or input) 4. Watershed load source reduction (e.g. stream restoration, lower
the edge of stream nutrient loads to the simulated river) b. Johnston clarified that land use revisions won’t take effect until Phase 6.0 model,
but this shouldn’t prevent this group from making recommendations. c. Brosch noted that placement type BMPs are currently tracked separately from
NM, and not necessarily a charge of the panel. d. Johnston noted that the model has multiple applications during growing season
for each crop, and include varied amounts.
Application Management March 2014
Page B2
e. Greg Albrecht: For Phase 6.0 is there an opportunity for a sub-calibration from fertilizer sales stats?
f. Dubin: Yes, fertilizer data will be part of the discussion at the Ag modeling workshop hosted by the Ag Workgroup in late May
g. Johnston reviewed NM plan definitions i. Current NM plan is a land use change. (Panel tasked with providing new
definitions of NM.) ii. Current Enhanced NM is an efficiency applied after the NM land use
change. iii. Current decision Ag, no clear definition was ever approved. (task for
this panel) A current efficiency BMP reduces runoff of nitrogen applied after the NM land use change.
4. Next Steps
a. Brosch outlined the panel’s next steps required to develop a recommendation report by Fall of 2013 for AgWG and partnership review and approval.
i. Purpose of the panel is to bring nutrient management up to date in the model.
ii. Panel will evaluate the way NM works on the ground across the bay watershed, come up with recommendations over the next year in terms of how NM should look in the model. (Phase 6.0 and Phase 5.3.2)
iii. Assignment from AgWG for 5.3.2 short term iv. N based NM (credit difference) v. If possible P based management
vi. Assignment from AgWG for Phase 6.0 1. N based NM 2. P based NM 3. Enhanced NM 4. Precision/Decision Ag
ACTION: Complete doodle poll to schedule next call April 8th or 9th Adjourn Participants Chris Brosch- VA Mark Dubin – UMD Matt Johnston – UMD Steve Dressing – TetraTech Don Meals-TetraTech Adam Orndorff-TetraTech Jason Dalrymple-WV Kim Snell-Zarcone – Conservation PA Greg Albrecht -NY Tom Bruulsema Rory Maguire- VT Curtis Dell-USDA Emma Giese-CRC Tim Sexton- VA Jack Meisinger-USDA Larry Towle-DE

Application Management March 2014
Page B3
Ken Staver-MD Aaron Ristow-NY Peter Kleinman-USDA-ARS Glenn Carpenter-USDA John Majsztrik-UMD
Application Management March 2014
Page B4
Nutrient Management Expert Review Panel Conference Call Meeting Notes
April 9, 2013
1. Welcome and Introductions
a. Chris Brosch, Panel Chair, welcomed everyone to the call and confirmed participants.
2. Modeling update
a. Matt Johnston provided a review of the different types and levels of nutrient management by state through the model's reporting period.
i. All land uses except for nursery and vegetable production are available for nutrient management in the current model
ii. Johnston clarified that phosphorus based plans are currently not used in 5.3.2 (although they can be). There are current data limitations on P soil reserves, and P-based NMP's are not reported separately by any jurisdictions.
iii. A suggestion rose to better represent Nutrient Management P-based plans for Phase 6.0 with a P index included.
3. BMPs to be defined
a. Chris Brosch led a discussion on the BMPs for the panel to define in the near term of Phase 5.3.2 of the CBPO Watershed Model, as well as the long-term goals for BMPs to be credited in the Phase 6.0 Watershed Model.
i. An approved report in October allows incorporation into the model for 2013 progress reporting. In order to achieve this deadline, the panel will need to have these discussions and recommendations for a draft report by August 2013.
ii. PA: Suggestion for the panel to define the Nutrient Management practices that are relevant and reportable.
iii. Brosch: If N based NM is tracked, reported and credited in the current model, should that definition be the same as the final Phase 6.0 recommendations, or would it be different?
iv. NY suggested that Phase 6.0 recommendations could be similar for nitrogen but more extensive for phosphorus.
v. MD noted their need for improved NM land use representation; e.g. non-eligible land uses.
vi. Question rose about why states do not report P based management? vii. Brosch: Tracking P separately has not been done before, therefore an
extra work load, and would be a separate efficiency. viii. The current definition: a Nutrient Management plan minimizes nutrient
loss while maintaining yield. ix. MD noted that placement and timing should be separated in the
definition.
4. Phase 5.3.2
Application Management March 2014
Page B5
a. Brosch called for a motion that a new definition is needed, reflecting some level of N-based nutrient management and crediting.
i. PA motioned, NGO second, none opposed.
DECISION: Panel will refine the N based nutrient management definition for Model Phase 5.3.2
5. Phase 6.0
a. NY recommended a three tiered approach b. Dubin recommended developing a draft of definitions, for review by the panel. c. NGO motioned drafting a three tiered approach for both current and Phase 6.0
model recommendations, NY second. None opposed. DECISION: Chris Brosch will distribute a draft of three tiered approach definition to the panel.
ACTION: Chris Brosch will report these decisions at the AgWG meeting on Thursday, April 11.
6. New P management tools
a. Mark Dubin: The information obtained on the new Maryland P management tool, and the regional SERA-17 work on a revised P Index, is currently being developed as addendum document as decided during the last panel call.
Adjourn Participants Chris Brosch Aaron Ristow Curtis Dell Don Meals Doug Beegle Greg Albrecht Kim Snell-Zarcone Steve Dressing Tom Bruulsema Barry Evans John Lea-Cox Jack Meisinger John Majstrik Jason Dalrymple Anne Marsh Wade Thomason Doug Goodlander Jim Cropper Matt Johnston Emma Giese Mark Dubin Ken Staver Tim Sexton
Application Management March 2014
Page B6
Nutrient Management Expert Review Panel
Conference Call Meeting Notes May 6, 2013
1. Welcome, Introductions, Minutes Approval a. Panelists look over March and April minutes, note any corrections to Emma,
minutes will be approved at next call
2. Nutrient Management definitions a. The Panel will discuss benchmarks in nutrient management definitions as
proposed last meeting. See below for working draft. b. Bruulsema: Recommend not repeating management in the definition of Basic
Nutrient Management, include the 4Rs (11:00) c. MD: more detailed from a mechanistic standpoint d. Brosch: the 4 pillars of NM are newer than NM itself e. NRCS: f. USDA: Jack on the record [16:00] for providing data g. Brosch: move (1) (2) (3) currently under 590NM to Basic NM? h. NRCS: offered to review a related Adaptive Management i. Mark Dubin: Noted that title of ‘Nutrient Management’ causes confusion
between the BMP and a NM plan j. USDA-ARS: should animal management be included in definitions? k. NY: For simplification recommend limiting the definition to manure [36:00 two
things] l. MD: Recommend the crediting to be progressive m. Jeff Sweeney: Noting the need for reporting from jurisdictions n. USDA: Does CEAP collect information that would help define NM o. Brosch: Recommendations from Expert Panel to push record keeping as well as
update and approval. Perhaps each tier could have a few boxes to check for crediting purposes (3 out of 4 needed for credit or similar)
p. Dubin: in the past, more credit given for more boxes checked q. USDA: recommend additional specifics for each definition r. Brosch: intended to work in all the comments heard during this discussion today,
then discuss the draft at another call. An alternative would be a smaller working group, that could achieve an initial draft for review by the overall panel. Titles will be addressed as well.
ACTION: Chris Gross, Tim Sexton, Mark Dubin and Chris Gross will establish an initial draft
3. Nutrient Management Options in P5.3.2 WSM a. Chris Brosch, Matt Johnston and Jeff Sweeney will answer questions and guide a
discussion on panel options for credit forms of nutrient management in the current phase of the Watershed Model in preparation for a draft recommendation.

Application Management March 2014
Page B7
b. [1:06] c. Johnston noted the option of changing the 1st definition to an efficiency, and to
redefine d. Brosch: millions of acres of NM have been credited in the past. Credit was based
on recommendations from a different panel. Through the end of 2005, are unchangeable.
e. If new nutrient management plans are written by a state, they may take 3 years to be fully incorporated
f. Brosch: will take panel discussion back to CBP modelers g. Brosch; 2 options that states were already asked to choose between for most
recent WIP planning, current credit for NM (amount of manure in a county est.) [1:21]
h. USDA noted that one efficiency estimate for entire state would not be accurate i. Brosch: Any interest in using outside models to answer the question of whether
effectiveness of nutrient management should change regionally? j. Sweeney clarified that version 6.0 has very few limitations, including that the
sates will have to be able to report it. More constraints with the current version, but not a concern based on discussion today.
Adjourn Working Draft Definitions
Basic Nutrient Management: documentation of manure and fertilizer management activities in accordance with basic state extension recommendations.
590 Nutrient Management: implementation of the NRCS 590 Nutrient Management Standard. That is, following nutrient guidelines, including: (1) standard, realistic yield goals (per soil type); (2) credit for N sources (soil, sod, past manure, and current year applications); (3) P and K recommendations based on soil tests and the sufficiency method (not crop removal); (4) soil erosion controlled to T per RUSLE2; (5) fields assessed for leaching and runoff risk with conservative tools (N Leaching Index and P Runoff Index); etc.
Adaptive Nutrient Management: implementation of the NRCS 590, plus on-going management to improve nutrient use efficiency beyond initial implementation, including tracking performance and managing manure and fertilizer according to tools such as ISNT, CSNT, Mass Nutrient Balance, etc. This practice could also include the use of technology like variable rate applications, satellite guidance systems and/or infield monitoring beyond ISNT and CSNT.
Participants
Chris Brosch, VT/VADCR Matt Johnston, UMD Jeff Sweeney, EPA Mark Dubin, UMD Tim Sexton, VA Greg Albrecht, NY Doug Goodlander, PA
Application Management March 2014
Page B8
Barry Evans, PSU Pete Kleinman, PA Curtis Dell, USDA Kim Snell-Zarcone, Conservation PA Larry Towle, DE Jason Dalrymple, WV Jack Meisinger, USDA John Majsztrik, MD Tom Bruulsema, IPNI Steve Dressing, TetraTech Chris Gross, USDA-NRCS Ken Staver, UMD
Application Management March 2014
Page B9
Nutrient Management Expert Review Panel Conference Call Meeting Notes
June 6, 2013
1. Welcome, Introductions
2. Nutrient Management Definitions
a. Mark Dubin: led a discussion of the draft Nutrient Management definitions
Basic Nutrient Management a. Matt Johnston: Recommend clarifying the definition to ‘basic nutrient
application management’ i. Dubin: This request has been raised in the AgWG as well
b. Suggestion to add ‘annual’ to the definition c. NRCS: How to handle erosion and erosion control in the definition?
i. Dubin: Nutrient application management, if that is what is decided on, is separate from erosion control. Erosion would be addressed through crop residue management systems (separate BMPs in the model).
590 Nutrient Management a. Brosch: Erosion control should be part of 590 Nutrient Management definition,
because it is incorporating all the practices to give benefit in a way that hasn’t been modeled before. The basic tier is replacing all the NM pre 2006, the 590 NM was meant to address and give credit to the extra efforts post 2006.Johnston: Technical and reporting questions would need to be addressed for partnership approval (how to avoid double counting).Dubin: What are the panel’s thoughts on stackable vs. unstackable BMP?
b. NRCS: The definition for 590 Nutrient Management should include erosion control. Some flexibility regarding stackability and how it is credited as a BMP.
c. Brosch: To count 590, would have to include erosion control. 590 gets better N and P reduction because of everything working in unison, which is why it is a better standard. Just need to give credit for the nutrient application management part, which the panel suggests should be higher than basic nutrient management because of consideration for P loss pathways.
d. Dubin: The definition will need to clearly state the separate crediting for reporting through conservation planning and BMPs.
e. Brosch: The credit we’re choosing will be just for the application change. f. Brosch: Panel’s thoughts on the method presented?
i. Note that some conservation practices are systems rather than stand alone practices. Agree that application of nutrients is a separate practice.
ii. The title would then be ‘590 Nutrient Application Management’. d. Dubin: If panel accepts this definition and allows stackable BMPs for
conservation planning and residue management systems, is it possible to tease out the values of 590 from the application system?
e. NY: Recommend a separate category for improved tillage. f. Brosch: Giving credit for manure practices would be an additional credit not
currently in the model.
Application Management March 2014
Page B10
g. Johnston: Reduced N and P from model runs is going to have multiple causes, panel will need to determine how much of the reduction is due to application management.
h. VA: Recommend giving credit for split applications. i. Johnston: Efficiency value would achieve this (reduced runoff due to
application rate and timing). i. Dubin: If APEX runs generate possible values, take a percentage of the
reductions to determine 590 (stack other practices on top of it) OR take the values as they are and assume incorporation of other BMPS?
j. VA: What is the timeframe for these recommendations? i. Dubin: ARS/NRCS Post-doc will be available in 3 months to assist
panels, which will be too late for Phase 5 recommendations k. Dubin: Given the structured timeframe for completing Phase 5 recommendation
in time for 2013 progress run, would need draft panel recommendations in July in order for the AgWG to review them in August/September.
i. VA: Recommend submitting 5.3.2 recommendations in time for 2014. l. NY: How would the new basic nutrient management definition fit in with the
existing NM definitions in the model? i. Dubin: Would create an efficiency BMP for NM, panel could then
submit 590 and adaptive definitions as part of later recommendations. m. NY: How to match the current land use with the proposed efficiency?
i. Johnston: The efficiency version was already built into SB, which mimicked the land use change version of the BMP, and could be used for 2013 Progress Runs.
ii. Dubin: The value could be developed as an interim measure, however it would have to be approved by the panel and the full partnership.
n. Brosch: Efficiency percentage for N and P would need to be calculated at different geographic locations for the panel to review.
o. Dubin: Noted that non-traditional acres (nursery, orchards, etc.) are not eligible currently in the model because there is no land use to represent them as NM is currently represented as a land use change. Some jurisdictions have significant acreage in nurseries, with a high loading rate and no opportunity for reductions. Recommend deciding how to approach this issue in time for 2013 progress.
p. Johnston: The interim value has some questions that would need to be answered by the panel, will look at the modeling options for this method, bring to the panel for review on June 27th (next meeting).
q. USDA: Recommend working backwards, identify the largest problem and work on that one.
r. Brosch: Request that the modelers highlight the most important issues s. Johnston: Is the panel comfortable in 2013 maintaining current definitions of
enhanced and decision Ag? i. Brosch: Address at next meeting, may not be worth redefining them
given the short timeframe.
DECISION: Panel recommends Basic Nutrient Management as an efficiency at the Scenario Builder Growth Region scale.
Adaptive Nutrient Management a. Dubin: How does the panel recommend defining the line between tier 2 and tier
3?
Application Management March 2014
Page B11
i. USDA: Tier 3 if there is a year to year connection (in field yield strip test) between nutrient management.
ii. Recommend a checklist, if for example 4 out of 8 boxes checked promotes to a tier 3.
iii. Brosch: Enough items above and beyond 590 would be tier 3. iv. VA: Noted that 590 already has a multiyear requirement. v. NY: agrees with VA.
vi. Field monitoring, higher level of soil testing, or annual sampling (rather than 3 or 5 year sampling).
b. Brosch: Is anyone reporting what would be in the tier 3 definition? i. VA: Approx 15,000 acres could be reported in VA.
ii. Dubin: MD, PA, VA, DE acres exist. c. Brosch: Are they tracked and reported?
i. Dubin: MD has been for several years. d. Brosch: Recommend writing a definition that matches known existing programs. e. Dubin: Recommend pulling information from these existing programs, to bring
to the panel. f. Brosch: Tim and Mark will bring back list of programs in MD and VA to Chris
and Chris, to rewrite the definition matching the programs. g. Johnston: Possibility to incorporate this definition into enhanced NM or
precision/decision Ag. For 2013 progress? h. Brosch: These definitions have different meanings in different states, hesitate to
match tiers to the existing BMPs. i. USDA: Note that precision/decision has little or no efficiency improvements in
the real world. ACTION: Tim and Mark will provide existing programs in MD and VA to Chris and Chris, to rewrite the definition matching the programs.
3. Nutrient Management Crediting
a. Dubin: Modeling team will report back to the panel at next meeting on crediting options. What scale should be provided?
b. Brosch: Propose using the growth region scale, basin level also helpful (baywide level for comparison).
c. USDA: Growth regions are useful in that they capture the regional cropping differences
d. NRCS: Note that APEX is a field scale model, will need to be ‘scaled up’.
Adjourn Next meeting: June 27th 10:00-12:00 Participants Jim Cropper, NE Pasture Jason Dalrymple, WV Mark Dubin, UMD Emma Giese, CRC Chris Brosch, VT-VADCR Greg Albrecht, NY Matt Johnston, UMD Chris Gross, NRCS

Application Management March 2014
Page B12
Steve Dressing, TetraTech Tim Sexton, VA Jack Meisinger, USDA

Application Management March 2014
Page B13
Nutrient Management Expert Review Panel Conference Call Meeting Notes
July 3, 2013
1. Welcome, Introductions, Minutes Approval
DECISION: Panel approved June 6 minutes.
2. Nutrient Management definitions
a. Panel discussed PA comments and working definitions for P5.3.2 recommendation.
b. Chris Gross: What is the difference between Basic Nutrient Management and 590 Nutrient Management? And are both definitions needed?
i. Doug Goodlander: Basic NM does not have an N leaching component, erosion control or the full P Index as the 590 NM does.
ii. Mark Dubin: Because the current BMP addresses changing nutrient application, and does not address storage or other aspects that are incorporated in state programs, recommend the panel focus on the Nutrient Management application change rather than pulling storage, barnyards and conservation plans into the definition.
c. Gross: What was the background for selecting the three tiers? i. Dubin: Panel was originally charged with determining Nutrient
Management application and crediting for both Phase 5.3.2 and Phase 6.0. There are three tiers of Nutrient Management in the current modeling tools, which makes the 590 three tier system easier to incorporate.
d. Cropper: Recommend including heavy use areas and barnyards in the definitions, because of their high impact.
i. Johnston: Note that other practices may be addressed by other BMPs in the model.
ii. Goodlander: Recommend that if focusing on the field application scenario, the titles of the definitions should be revised. Clearly state that the definitions relate to application.
iii. Brosch: Note that the model does have a way to handle heavy, unfenced areas near streams. Based on the panel’s discussion so far, the recommendation for Basic Nutrient Management is to addressing application rate. For 590 Nutrient Management, address other aspects of the plans including animal areas.
e. Brosch: Should erosion control be in the definitions? i. Goodlander: If erosion is left out of the definition, should be separate
from all the definitions. Recommend focusing on nutrient application management, and having erosion control in a separate plan.
ii. Cropper: Note that drainage also contributes to nutrient loading, not just erosion.
iii. Gross: Recommend that erosion control be a co-requirement, because for nutrient application management to work erosion must be kept in check.
Application Management March 2014
Page B14
iv. Jack Meisinger (USDA): What are the other BMPs that relate to this definition, such as manure or sediment?
1. Johnston: Pasture grazing: stream access control with fencing; prescribed grazing: animal waste management systems; barnyard runoff control.
f. Cropper: Recommend that basic nutrient management does not need timing in the definition.
g. Tom Bruulsema: Recommend buildup maintenance rather than sufficiency method requirement in the definitions, because land grant university recommendations are based on buildup maintenance. Also recommend that the level of documentation define the difference between basic NM and 590 NM.
h. Cropper: Is there enough of a difference between basic NM and 590 NM to require a separate definition?
i. Gross: Basic NM defines the rate of application, 590 NM additionally defines form, timing and placement.
ii. Bruulsema: Is the intent to give credit for basic nutrient management? Recommend that credit not be given for rate alone. Dubin: Note the limitations for Phase 5.3.2; if no credit is available
below 590 there would be many excluded acres. Recommend that the panel define a level of credit for basic nutrient management, which would be lower than credit for 590 NM.
iii. Brosch: Result of the previous panel discussion was that the 590 definition accounted for management changes that took effect after 2006.
iv. Goodlander: Basic NM plans are written by crop group, where 590 NM plans are field specific.
v. Brosch: Should the definitions then account for spatial specificity? Cropper: Spatial specificity will help with deciding which definition
matches. Kim Snell-Zarcone: Recommend considering verification potential,
which for all the definitions would require something in writing. Also recommend the spatial component as the definition, and include the 4Rs along with the spatial specificity.
Dubin: Spatial specificity is consistent with the HighQ programs as well.
Goodlander: Recommend incorporating that the basic definition focuses on the agronomic need of the crop, while higher levels begin to consider environmental concerns.
vi. Ken Staver (UMD): Is there a table of N and P application rates? Johnston: There is a table of reductions for enhanced and decision
nutrient management. Basic NM is a land use change. Staver: The largest driver of N loss is the rate. Each of the three
definitions need to address the rates the model will define. vii. Goodlander: Will the panel be discussing reductions for each defined
tier? Brosch: The three tiered approach was approved by the panel several
meetings ago. The next step was to define the three tiers, so that someone tracking could easily define them. However, based on the big picture discussion today, the group is not comfortable enough with the current definitions to move forward.
viii. Brosch: Will re-draft the definitions to include the spatial component. Recommend that the panel approve the definitions at the next call. Is the
Application Management March 2014
Page B15
panel comfortable with three tiers? Is the spatial piece the important distinction? What is the decision about the ancillary practices? Snell-Zarcone: The ancillary practices seem to be pulled out in other
BMPs, recommend focusing these definitions on application. Goodlander: Recommend spatial component, and title change to
represent application focus. Recommend including the concept that basic is based on crop need, and 590 adds a component of environmental assessment.
Brosch: Will remove sufficiency method from the definition. Larry Towle (DE): Support the spatial approach, and address other
issues at Phase 6.0. Goodlander: Motion to make the changes stated. Snell-Zarcone: Second the motion. Gross: Recommend including language with levels two and three
that explains the ancillary practices are needed for nutrient management to be effective.
None opposed.
DECISION: Panel decided that the nutrient management definition will: 1) include three tiers that highlight a difference in spatial specificity, 2) focus on application rate management, 3) take into account the 4Rs and 4) mention ancillary practices for levels 2 and 3.
3. Nutrient Management WSM Run Results a. Matt Johnston led a discussion on results of runs in the current phase of the
Watershed Model through time and at different scales, which show what the model simulates the reduction in loads to be as a result of NM.
b. Dubin: If converting NM to an efficiency, these analyses can be used to help define the effectiveness values for Phase 5.3.2.
c. Johnston: This analysis was run several ways, consistently hit 5-6% reduction for N and 6-7% for P.
d. Meisinger: Expect that 5% reduction in N due to NM is an underestimate. i. Dubin Clarified that this analysis relates to the Basic Nutrient
Management definition. e. Beegle: Basic NM probably matches the reductions modeled. The higher tiers of NM
have a higher reduction. f. Recommend a data literature search for Phase 6.0 to better define the differences in
Nutrient Management over time. g. Brosch: Is the panel interested in assigning a reduction efficiency for acres under
basic nutrient management (as opposed to no nutrient management,) and are these numbers reasonable?
i. Goodlander: 5% N reduction from basic nutrient management probably low, would expect NM to be closer to 10% reduction.
ii. Recommend that the panel start moving towards efficiency BMPs in Phase 5, and seek additional expertise for the Phase 6.0 recommendations.
iii. Meisinger: Recommend use of literature and real world data, not just model runs to make these decisions.
iv. Brosch: The recommendation from the panel would be either to let the model calculate nutrient management by the previous method, or to adopt this efficiency value. Nutrient Management should have a
Application Management March 2014
Page B16
positive effect everywhere; and in order not to violate calibration we have let the model choose the number.
v. Towle: 5% reduction makes sense in context of the model, will have to make up the difference in DE with the higher tiers.
vi. Goodlander: Can accept 5% reduction for now. vii. Bruulsema: Recommend making the definitions more measurable and
understandable. h. Brosch: Panel will discuss definitions and reductions at the next call on July 18th.
Adjourned Participants Mark Dubin, UMD Doug Beegle, PSU Thomas Bruulsema, IPNI Jim Cropper, NE Pasture Consortium Jason Dalrymple, WV-Agriculture Curtis Dell, USDA-ARS Doug Goodlander, PA-Agriculture Chris Gross, USDA-NRCS Rory Maguire, VT John Majsztrik, UMD Anne S. Marsh, Heinz Center Jack Meisinger, USDA-ARS Kim Snell-Zarcone, Conservation PA Ken Staver, UMD Wade Thomason , VT Larry Towle, DE-Agriculture Chris Brosch, VT/VA DCR Matt Johnston, UMD Emma Giese, CRC Steve Dressing, TetraTech Don Meals, TetraTech Greg Albrecht, NY
Application Management March 2014
Page B17
Nutrient Management Expert Review Panel Conference Call Meeting Notes
July 18, 2013
1. Welcome and Introductions
a. Chris Brosch, chair, welcomed everyone to the call, and confirmed call participants.
2. Review of Draft Definitions
a. Chris Brosch led a discussion of panel comments on the proposed draft of Nutrient Management definitions.
b. Please clarify the difference between Tier 1 and 2. i. Brosch: Tier 2 is at a field scale, while Tier 1 is at crop group scale. ii. Kim Snell-Zarcone: Recommend more prominently stating “fields”. iii. Brosch: Will rename title of Tier 1 to “field level application
management” to clarify. c. Ken Staver: Recommend addressing P based Nutrient Management in the
definitions. i. Albrecht: Addressed by P Index in Tier 2.
d. Staver: Recommend that Tier 1 be based on N only management. i. Brosch: Tier 1 currently allows N based in terms of progress and credit.
e. Recommend that Tier 1, #3 state “recommendations based on soil tests for inorganic plans”.
f. Jack Meisinger: Recommend that Tier 1, #4 states: “N based for organic systems”.
g. Gross: Suggest adding to Tier 2: “maximizing nutrient efficiency and minimizing risk to the environment”.
h. Recommend stating explicitly in Tier 2 that assessments are done at the field level scale.
i. Sexton: Motion to accept definition of Tier 1 and Tier 2 as edited. i. Snell-Zarcone: Second
j. Snell-Zarcone: Recommend removing last sentence from Tier 2: “handling and storage of nutrient sources” because addressed by other BMPs.
i. Sexton: Confirmed that VA reports these separately as BMPs. k. Gross: Recommend defining “substantive” in Tier 1. l. Snell-Zarcone: Recommend keeping verification in mind when crafting the
definitions; be clear in Tier 2 what documentation/proof of implementation is needed.
m. Dressing: Recommend outlining a few potential scenarios and describing how they fit into the definitions.
i. Brosch: These potential scenarios can be included in the panel report as examples.
n. Johnston: Recommend adding ‘application’ to first sentence of Tier 1. o. Brosch: Will allow panelists time to talk with others before fully approving the
definitions. Comments/dissent will be accepted until 1 week from today (8/1/13).
Application Management March 2014
Page B18
p. Meisinger: If anyone encounters a potential problem with these, please provide written detail in order for the panel to best address the issues.
ACTION: Panel members will send any comments on Tier 1 and 2 definitions to Chris Brosch by next Thursday (7/25/13). ACTION: Chris will compile all comments for the group by the next call (8/1/13).
3. Discussion of Adaptive Nutrient Management a. Albrecht: Recommend keeping options open for field and sub-field scale. b. Brosch: Is one adaptive level sufficient?
i. Thomason: Will provide documentation of precision agriculture to panel members.
ii. Meisinger: Current definition allows for flexibility with future implementation. Adaptive NM doesn’t equal precision management.
c. Cropper: Recommend changing first bullet to “multiple sub-field tests”. d. Staver: Distinction is that in this definition, in-field tests are determining the rate
(not just on paper as in Tier 2). e. Staver: Recommend using agronomic recommendations based on crop need for
P. f. Towle: Recommend P testing incorporated with the other tests (rather than its
own bullet). g. For the field tests recommend changing “such as” to “including but not limited
to”. h. Meisinger: Recommend including a field strip test.
i. Field strip tests addressed by in-field monitoring. i. Recommend that precision not required for adaptive NM. j. Goodlander: Note that sub-field may not practically apply to small (1-3 acre)
fields. i. Cropper: Recommend using “field/subfield” to include all possibilities.
k. Sexton: Motion to include Tier 3 in the definitions for final approval by next week.
i. Cropper: Second. l. Brosch: Panel will discuss efficiencies at next meeting on August 1st.
ACTION: Panel members will send any comments on Tier 3 definitions to Chris Brosch by next Thursday (7/25/13) Participants Greg Albrecht, NY Barry Evans, PSU Kim Snell-Zarcone, Conservation PA Doug Goodlander, PA Curt Dell, USDA Larry Towle, DDA Chris Brosch, VT John Majsztrik, UMD Chris Gross, USDA-NRCS Jack Meisinger, USDA Tim Sexton, VA Wade Thomason, VT

Application Management March 2014
Page B19
Mark Dubin, UMD Emma Giese, CRC Matt Johnston, UMD Steve Dressing, TetraTech Don Meals, TetraTech Jennifer Ferrando, TetraTech Jim Cropper, NE Pasture Consortium Ken Staver, UMD
Application Management March 2014
Page B20
Nutrient Management Expert Review Panel Conference Call Meeting Notes
August 1, 2013
1. Welcome and Introductions
2. Current Draft Nutrient Management Definitions
a. Chris Brosch received and incorporated comments from seven panelists since the last conference call.
b. TIER 2 DISCUSSION c. Tom Bruulsema: Recommend Tier 2 bullet 4 be edited to “such as” rather than
“including but not limited to”. d. Brosch: Panel has previously indicated that P risk assessment tool be required for
Tier 2, whether or not it is a part of a resource assessment kit. e. Doug Goodlander: Recommend wording that requires P risk assessment tool,
and allows for additional practices. f. Goodlander: Recommend describing an overall environmental assessment of the
fields, which addresses all concerns including P. g. Bullet 4: “fields assessed for phosphorus loss risk with a LGU phosphorus risk
assessment tool and other conservation tools necessary for proper nutrient rate, timing and placement to optimize nutrient loss and crop nutrient uptake.”
h. Bruulsema: Recommend adding “source” back into the definition for consistency with Tier 1.
i. New wording of Tier 2, bullet 4: “fields assessed for phosphorus loss risk with a LGU phosphorus risk assessment tool and other conservation tools necessary for proper nutrient source, rate, timing and placement to improve crop nutrient use efficiency”.
j. TIER 1 DISCUSSION k. Jim Cropper: Recommend bullet 3 reworded to include application rates
consistent with LGU recommendations. l. New wording of Tier 1, bullet 3: “P and K application rates consistent with LGU
recommendations based on soil tests for fields without manure.” m. New wording of Tier 1, bullet 4: “N based application rates consistent with LGU
recommendations for fields receiving manure.” n. Staver: Recommend removing K requirements from definition, because CBP
does not have goals related to K. o. Dubin: Agreed as K is not currently represented in the Phase 5.3.2 models. p. Panel agreed; references to potassium removed from all three tiers. q. TIER 3 DISCUSSION r. Meisinger: Recommend a separate bullet for strip trials, because it relates to
more than nitrogen. s. Cropper: Recommend replacing “AND/OR” with “AND”.
i. Albrecht: “AND/OR” better aligns with NRCS standards. t. Goodlander: Motion to approve the definitions of three tiers of nutrient
management as edited today. u. Cropper: Second the motion.

Application Management March 2014
Page B21
v. Dubin: Clarified that when these three tiers are incorporated into the model, the Tier 1 definition will replace the existing Basic Nutrient Management definition, Tiers 2 and 3 will become additional options along with existing enhanced and decision/precision options.
w. Staver: Recommend adding a bullet 5 in Tier 2 to separate the two different concepts.
x. Motion to approve the definitions was accepted with one abstention.
DECISION: Panel approved the 8/1 version of the Nutrient Management three tiered definition as final.
3. Efficiencies a. Jack Meisinger presented one approach to calculating reduction efficiencies. b. Dubin: Recommend conducting similar analyses in different regions. c. Albrecht: Study in NY available. d. Meisinger: Panel will have to decide which approach to take to determine
crediting. e. Brosch: Do any other panel members have access to this kind of data sources? f. Staver: Request specific examples of model assumptions for corn.
i. Johnston: Can present this analysis. g. Meisinger: Request that data be synthesized before submitted if possible. h. Brosch: Any data available should be used, whether or not panelists have time to
synthesize. i. Goodlander: Note the possible need for two reduction efficiencies.
i. Brosch: Not feasible in Phase 5 because of the need to separate acres, however can address in Phase 6.
4. Schedule Next Meeting
a. Brosch: At the next call the panel will review model assumptions based on corn production, and compare with synthesized data from the watershed.
b. Dubin: Requested panel input on the scheduling of the September AgWG for panel reports.
c. Brosch: Request a later AgWG meeting in September if possible. d. 20, 21, 23 next call.
ACTION: Panelists will provide documentation on research related to the reduced nutrient losses from corn related to application rate changes in their regions by August 15th. ACTION: Fill out Doodle poll to schedule next call for August 20, 21 or 23. Adjourned Participants Chris Brosch, VT/VA-DEQ Don Meals, TetraTech Jack Meisinger, USDA-ARS Steve Dressing, TetraTech Jennifer Ferrando, TetraTech Jeff Sweeney, EPA Matt Johnston, UMD Emma Giese, CRC
Application Management March 2014
Page B22
Chris Gross, NRCS Jason Dalrymple, WV Doug Goodlander, PA Larry Towle, DE Greg Albrecht, NY Tom Bruulsema, IPNI Jim Cropper, NE Pasture Mark Dubin, UMD Kim Snell-Zarcone, Conservation PA Ken Staver, UMD
Application Management March 2014
Page B23
Nutrient Management Expert Review Panel Conference Call Meeting Notes
August 23, 2013
1. Welcome and Introductions
a. Panel members approved minutes from 7/3, 7/18 and 8/1.
2. Nutrient Management Efficiency Estimates a. Matt Johnston gave an overview of nutrient applications to corn in Scenario
Builder. b. Recommend adjusting the non nutrient management application rate rather that
the nutrient management rate. c. Chris Brosch presented Scenario Builder data from 2007 Progress Run, for
pounds applied on corn. d. Chris reviewed the approach presented at the last call, which analyzes the change
in recommended application rates before and after 1985 to approximate efficiency for non-nutrient management.
i. Panel expressed support for this method. ii. Jack Meisinger: Recommend the panel decide whether to use change in
fertilizer N applied or change in the environment, which has less data to support it.
iii. Brosch: Request a motion to use this method of change in application rate to calculate efficiency.
e. Mark Dubin: Recommend using surveys from MD and VA, presented to the AgWG by Frank Coale.
f. Recommend using nitrate loss data to ground truth the data. g. Meisinger: Note that most of the data is for nitrogen, will also need
recommendations for P. Request that panelists include information for phosphorus in their submissions.
i. Brosch: Most of the phosphorus information will be incorporated in the Tier 2 definition
DECISION: Panel decided to use literature from the states to determine the reduction in recommended rates for nitrogen that existed before 1985 and how that changed in the following years to estimate the efficiency for non nutrient management. Adjourned Participants Chris Brosch, VT/VA-DEQ Rory Maguire, VT John Majsztrik, UMD Curt Dell, ARS Anne Marsh, Heinz Center Tim Sexton, VA Jack Meisinger, USDA-ARS
Application Management March 2014
Page B24
Jennifer Ferrando, TetraTech Jeff Sweeney, EPA Matt Johnston, UMD Emma Giese, CRC Chris Gross, NRCS Doug Goodlander, PA Greg Albrecht, NY Tom Bruulsema, IPNI Jim Cropper, NE Pasture Mark Dubin, UMD Kim Snell-Zarcone, Conservation PA Ken Staver, UMD
Application Management March 2014
Page B25
Nutrient Management Expert Review Panel Conference Call Meeting Notes
September 5, 2013
1. Panel Recommendations: Discussion of Corn Nitrogen Studies
a. Chris Brosch: At the previous call, the panel decided to extract as much literature from states as possible to determine what if any reduction in recommended rates in nitrogen existed before 1985 and how that changed in the following years. Additional sources have been located since the last call, VA and NY will share their summaries today. Chris requested two runs of the watershed model to estimate resulting reductions, which will be presented at the next call.
b. Wade Thomason presented nitrogen recommendations for corn in VA. c. Tom Bruulsema: Support this approach for calculation the nitrogen reductions.
Note the interaction with cover crops. i. Meisinger: The interaction between Nutrient Management and Cover
Crops will likely have to be addressed in Phase 6.0. d. Brosch clarified that the panel previously decided that the non nutrient
management condition will be estimated from the pre 1986 recommendations. e. Greg Albrecht presented summaries of representative corn nitrogen studies from
New York. f. Don Meals: One of the questions from the TetraTech survey asked the panelists
their assessment of the extent to which each practice is implemented as designed. Answers to this question are included in the summary report.
2. Next Steps
a. Brosch: At the next conference call, the panel will discuss the nitrogen reduction efficiencies from the four studies discussed so far, which seem to center around 20%. For the next call, will have information from the latest model fun, which includes what a 20% reduction looks like. How best to use this information to get closer to an efficiency estimate by the next call in two weeks?
i. Tim Sexton: Considering the tight timeline, recommend taking an average of the available data from these four studies.
b. Johnston: As the model lumps row crops together, and Nutrient Management can be applied to all, how best to model this?
i. Staver: Recommend estimating a zero reduction for soybeans and weighted average based on acres of corn vs. acres of soy.
c. Meisinger: What about wheat? i. Brosch: Knowing that the differences between NM app rates and non
were small for corn, can assume that the differences are also small for other crops (in the model). Recommend taking the previous model run,
Application Management March 2014
Page B26
which estimated 5% for the watershed, and using this as the low bookend.
d. Johnston: If changing application rates on corn in the model, that will estimate the weighted average.
e. Meisinger: This last model run is an important piece of information in order to meet the panel recommendation deadline for 2013, request that it be made available to the panel by next week to prepare for the final call.
i. Johnston: Model run is being conducted, and will be available early next week.
f. Sexton: Will the efficiency be applied to the whole watershed? i. Brosch: Without more time, will have to be general with geographic
specificity. g. Meisinger: How would the geographic specificity be defined in the model?
i. Johnston: Could be split up any way the panel recommends, may be difficult to reach consensus on a separate efficiency for every jurisdiction.
ii. Albrecht: Should the panel recommend this as corn only efficiency? Leaving the other crops as they are.
iii. Brosch: That is the most scientifically defensible approach. h. Staver: Are hay and pasture being included in these recommendations?
i. Sexton: Currently counted separately. ii. Johnston: The results of the coming model analysis will be for composite
crop, not possible to isolate corn through the model run. i. Albrecht: Each jurisdiction’s corn acres under nutrient management would have
an updated efficiency, and during the model run would be blended into other row crops. Recommend that corn be assigned one efficiency, and other crops be assigned a separate efficiency.
j. Staver: Recommend one method for dealing with corn, and an approach to deal with the fact that there is insufficient information for soybeans.
k. Brosch: In order to isolate corn, can change the non nutrient management application rate method to estimate. The old method had rates for corn that were different.
l. Johnston: The results of this model run, have taken into account the composite crops.
m. Dubin: Recommend an additional conference call once the model runs are complete.
n. Meisinger: Still need to understand how the model will work with the real world data, studies discussed today.
ACTION: Doug and Greg will summarize their datasets similar to Wade’s and Jack’s for discussion at the next call. ACTION: Emma will send a doodle poll for a short intermediate call on Sept. 16th or 17th.

Application Management March 2014
Page B27
ACTION: The panel will meet at their regularly scheduled call on Sept. 19th 10:00AM-12:00PM.
Participants Chris Brosch, VT-VADEQ Don Meals, TetraTech Doug Goodlander, PA Greg Albrecht, NY Jennifer Ferrando, TetraTech Jim Cropper, NE Pasture John Majsztrik, UMD Tom Bruulsema, IPNI Tim Sexton, VA Jason Dalrymple, WV Doug Beegle, PSU Curt Dell, USDA-ARS Kim Snell-Zarcone, Conservation PA Wade Thomason, VT Matt Johnston, UMD Mark Dubin, UMD Ken Staver, UMD Chris Gross, USDA-NRCS
Application Management March 2014
Page B28
Nutrient Management Expert Review Panel Conference Call Meeting Notes
September 19, 2013
1. Mark Dubin gave an overview of the goal of interim recommendations.
a. Dubin: The recommendations we are attempting to finalize today are interim, the panel has the option of submitting additional recommendations in the future.
b. Chris Brosch: Noted that the panel has future work to do, including defining efficiencies for the upper tiers of nutrient management, and other Phase 6.0 recommendations. The goal for the call today is to better define the first tier of nutrient management.
2. Panel members reviewed the minutes from the past two calls
DECISION: Panel approved the minutes from 8/23/13 and 9/5/13.
3. Chris presented results of the recent sensitivity analysis, and outlined four options for the panel to consider when finalizing their recommendations. a. Greg Albrecht: Support option C. Request explanation of changes in states’
reporting. i. Brosch: The states could report exactly the same way, and the nutrient
management would be proportioned out as defined. ii. Tim Sexton: Could also change the way crops are reported by row crops
vs. alfalfa. iii. Brosch: Recommend addressing the reporting details later with the
watershed technical workgroup. b. Sexton: Support option C, and let the Watershed Technical workgroup address
the reporting details. States could decide whether to report their acres separately, or allow the model defined acres to determine the distribution.
c. Brosch: Clarified that the efficiencies are at edge of stream. d. Meisinger noted that the P index began around the timeframe being considered
for model adjustments, so a phosphorus adjustment makes sense with these recommendations.
e. Staver: Note that the yield inaccuracies should be fixed too. f. Sexton: Motion to approve option C.
i. Jim Cropper: Second. ii. No abstentions or objections.
DECISION: Panel decided to use research derived efficiencies to adjust N and P loads from non Nutrient Management row crop acres (9.25% and 10%, respectively) bay wide and to use model derived efficiencies (5% and 8%) for the other land uses, which include alfalfa, pasture and nursery.
Application Management March 2014
Page B29
4. Chris reviewed the draft Nutrient Management Panel report.
a. Brosch: The next call will focus on working out the details of the panel report. b. Johnston: The AgWG will be reviewing the report at their 9/26 meeting, and the
WTWG will have a meeting on 10/7 for final review. c. Staver: Request chart of historically reported tier 1 nutrient management acres.
ACTION: Matt will provide the panel with a chart of historically reported tier 1 Nutrient Management acres. Participants Mark Dubin, UMD Kim Snell-Zarcone, Conservation PA Tim Sexton, VA Greg Albrecht, NY Jason Dalrymple, WV Rory Maguire, VT Jim Cropper, NE Pasture Don Meals, TetraTech Matt Johnston, UMD Wade Thomason, VT Chris Gross, USDA Dan Baldwin, MDP Ken Staver, UMD Jack Meisinger, USDA-ARS Chris Brosch, VT-VADEQ Emma Giese, CRC
Application Management March 2014
APPENDIX C: TECHNICAL REQUIREMENTS FOR ENTERING TIER 1 AND EXISTING
NUTRIENT MANAGEMENT BMPs INTO SCENARIO BUILDER AND THE WATERSHED MODELS
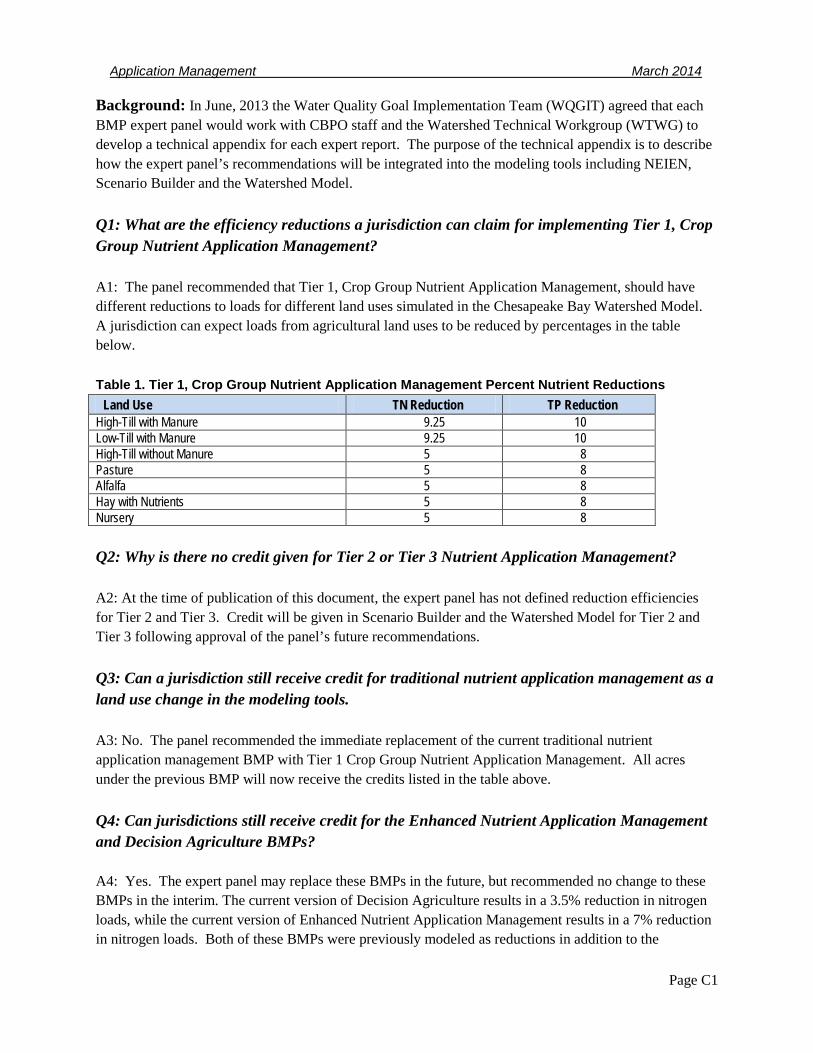
Application Management March 2014
Page C1
Background: In June, 2013 the Water Quality Goal Implementation Team (WQGIT) agreed that each BMP expert panel would work with CBPO staff and the Watershed Technical Workgroup (WTWG) to develop a technical appendix for each expert report. The purpose of the technical appendix is to describe how the expert panel’s recommendations will be integrated into the modeling tools including NEIEN, Scenario Builder and the Watershed Model. Q1: What are the efficiency reductions a jurisdiction can claim for implementing Tier 1, Crop Group Nutrient Application Management? A1: The panel recommended that Tier 1, Crop Group Nutrient Application Management, should have different reductions to loads for different land uses simulated in the Chesapeake Bay Watershed Model. A jurisdiction can expect loads from agricultural land uses to be reduced by percentages in the table below. Table 1. Tier 1, Crop Group Nutrient Application Management Percent Nutrient Reductions
Land Use TN Reduction TP Reduction High-Till with Manure 9.25 10 Low-Till with Manure 9.25 10 High-Till without Manure 5 8 Pasture 5 8 Alfalfa 5 8 Hay with Nutrients 5 8 Nursery 5 8 Q2: Why is there no credit given for Tier 2 or Tier 3 Nutrient Application Management? A2: At the time of publication of this document, the expert panel has not defined reduction efficiencies for Tier 2 and Tier 3. Credit will be given in Scenario Builder and the Watershed Model for Tier 2 and Tier 3 following approval of the panel’s future recommendations. Q3: Can a jurisdiction still receive credit for traditional nutrient application management as a land use change in the modeling tools. A3: No. The panel recommended the immediate replacement of the current traditional nutrient application management BMP with Tier 1 Crop Group Nutrient Application Management. All acres under the previous BMP will now receive the credits listed in the table above. Q4: Can jurisdictions still receive credit for the Enhanced Nutrient Application Management and Decision Agriculture BMPs? A4: Yes. The expert panel may replace these BMPs in the future, but recommended no change to these BMPs in the interim. The current version of Decision Agriculture results in a 3.5% reduction in nitrogen loads, while the current version of Enhanced Nutrient Application Management results in a 7% reduction in nitrogen loads. Both of these BMPs were previously modeled as reductions in addition to the
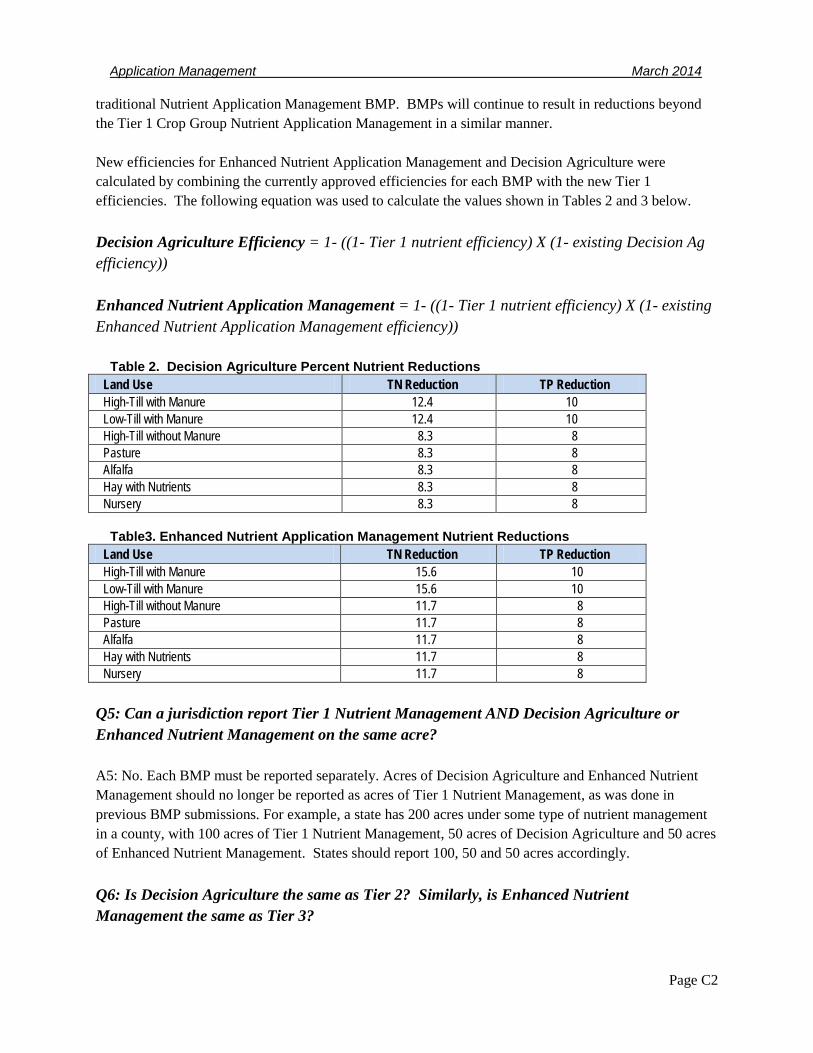
Application Management March 2014
Page C2
traditional Nutrient Application Management BMP. BMPs will continue to result in reductions beyond the Tier 1 Crop Group Nutrient Application Management in a similar manner. New efficiencies for Enhanced Nutrient Application Management and Decision Agriculture were calculated by combining the currently approved efficiencies for each BMP with the new Tier 1 efficiencies. The following equation was used to calculate the values shown in Tables 2 and 3 below. Decision Agriculture Efficiency = 1- ((1- Tier 1 nutrient efficiency) X (1- existing Decision Ag efficiency)) Enhanced Nutrient Application Management = 1- ((1- Tier 1 nutrient efficiency) X (1- existing Enhanced Nutrient Application Management efficiency))
Table 2. Decision Agriculture Percent Nutrient Reductions Land Use TN Reduction TP Reduction High-Till with Manure 12.4 10 Low-Till with Manure 12.4 10 High-Till without Manure 8.3 8 Pasture 8.3 8 Alfalfa 8.3 8 Hay with Nutrients 8.3 8 Nursery 8.3 8 Table3. Enhanced Nutrient Application Management Nutrient Reductions
Land Use TN Reduction TP Reduction High-Till with Manure 15.6 10 Low-Till with Manure 15.6 10 High-Till without Manure 11.7 8 Pasture 11.7 8 Alfalfa 11.7 8 Hay with Nutrients 11.7 8 Nursery 11.7 8
Q5: Can a jurisdiction report Tier 1 Nutrient Management AND Decision Agriculture or Enhanced Nutrient Management on the same acre? A5: No. Each BMP must be reported separately. Acres of Decision Agriculture and Enhanced Nutrient Management should no longer be reported as acres of Tier 1 Nutrient Management, as was done in previous BMP submissions. For example, a state has 200 acres under some type of nutrient management in a county, with 100 acres of Tier 1 Nutrient Management, 50 acres of Decision Agriculture and 50 acres of Enhanced Nutrient Management. States should report 100, 50 and 50 acres accordingly. Q6: Is Decision Agriculture the same as Tier 2? Similarly, is Enhanced Nutrient Management the same as Tier 3?
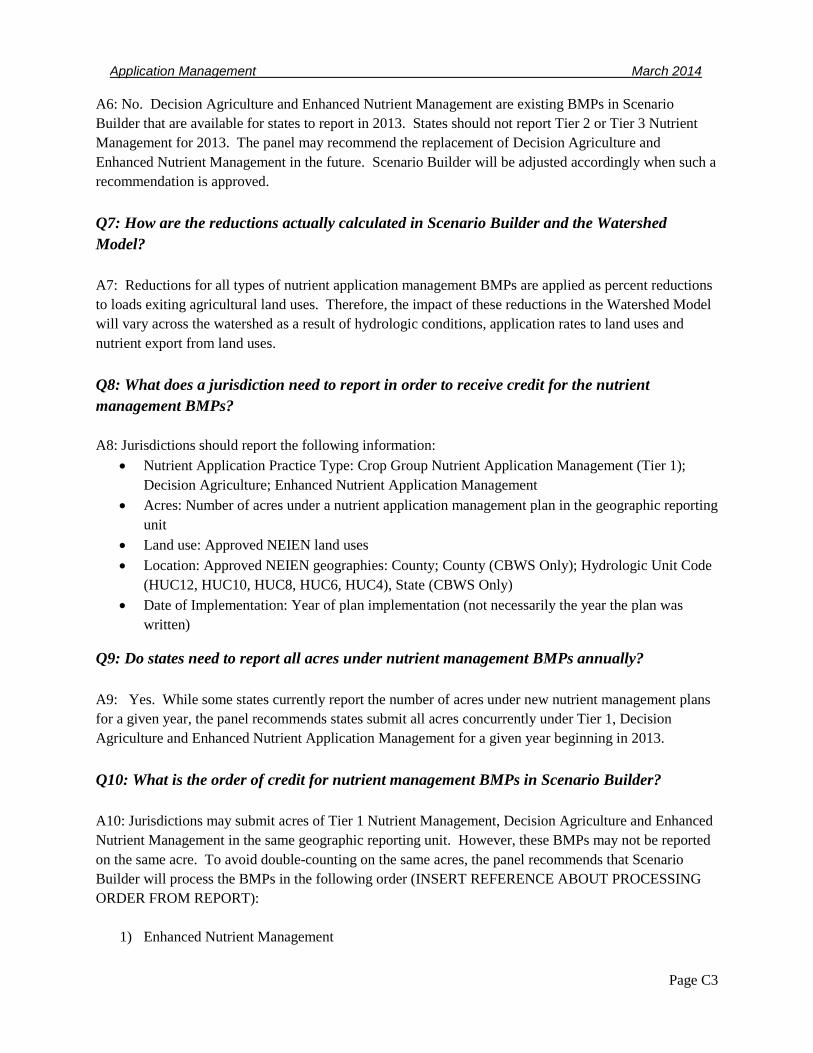
Application Management March 2014
Page C3
A6: No. Decision Agriculture and Enhanced Nutrient Management are existing BMPs in Scenario Builder that are available for states to report in 2013. States should not report Tier 2 or Tier 3 Nutrient Management for 2013. The panel may recommend the replacement of Decision Agriculture and Enhanced Nutrient Management in the future. Scenario Builder will be adjusted accordingly when such a recommendation is approved. Q7: How are the reductions actually calculated in Scenario Builder and the Watershed Model? A7: Reductions for all types of nutrient application management BMPs are applied as percent reductions to loads exiting agricultural land uses. Therefore, the impact of these reductions in the Watershed Model will vary across the watershed as a result of hydrologic conditions, application rates to land uses and nutrient export from land uses. Q8: What does a jurisdiction need to report in order to receive credit for the nutrient management BMPs? A8: Jurisdictions should report the following information:
• Nutrient Application Practice Type: Crop Group Nutrient Application Management (Tier 1); Decision Agriculture; Enhanced Nutrient Application Management
• Acres: Number of acres under a nutrient application management plan in the geographic reporting unit
• Land use: Approved NEIEN land uses • Location: Approved NEIEN geographies: County; County (CBWS Only); Hydrologic Unit Code
(HUC12, HUC10, HUC8, HUC6, HUC4), State (CBWS Only) • Date of Implementation: Year of plan implementation (not necessarily the year the plan was
written)
Q9: Do states need to report all acres under nutrient management BMPs annually? A9: Yes. While some states currently report the number of acres under new nutrient management plans for a given year, the panel recommends states submit all acres concurrently under Tier 1, Decision Agriculture and Enhanced Nutrient Application Management for a given year beginning in 2013. Q10: What is the order of credit for nutrient management BMPs in Scenario Builder? A10: Jurisdictions may submit acres of Tier 1 Nutrient Management, Decision Agriculture and Enhanced Nutrient Management in the same geographic reporting unit. However, these BMPs may not be reported on the same acre. To avoid double-counting on the same acres, the panel recommends that Scenario Builder will process the BMPs in the following order (INSERT REFERENCE ABOUT PROCESSING ORDER FROM REPORT):
1) Enhanced Nutrient Management
Application Management March 2014
Page C4
2) Decision Agriculture 3) Tier 1 Nutrient Management
If there are no agricultural acres available in the geographic reporting unit after a BMP is processed, the next BMP in the processing order will not receive credit.
Application Management March 2014
APPENDIX D: SUMMARY OF SURVEY AND INTERVIEWS
AGRICULTURAL NUTRIENT MANAGEMENT EXPERT PANEL
Application Management March 2014
Page D1
CONTENTS Background ................................................................................................................................................................................ 3
Definitions of Agricultural Nutrient Management ..................................................................................................... 4
General Observations ........................................................................................................................................................ 5
Basic or N-Based NM ....................................................................................................................................................... 28
P-Based NM ......................................................................................................................................................................... 28
ENM ........................................................................................................................................................................................ 28
State Programs ................................................................................................................................................................... 28
Alternative Definitions ................................................................................................................................................... 29
Precision/Decision Agriculture ....................................................................................................................................... 30
N-Based Recommendations .............................................................................................................................................. 30
State Program Requirements for Nutrient Management ...................................................................................... 37
Gaps in Programs for Nutrient Management ............................................................................................................. 42
Program Coordination ......................................................................................................................................................... 46
Nutrient Management Technical Standards ............................................................................................................... 46
Process and Criteria for Determining Level of Nutrient Management Required ........................................ 50
Preparation, Review, Approval, Tracking, Verification and Reporting of Nutrient Management Plans ....................................................................................................................................................................................................... 55
Status of Implementation of Nutrient Management Plans ................................................................................... 60
Nutrient Management Practice Effectiveness ............................................................................................................ 67
Baseline Condition for Assessing Effectiveness ................................................................................................... 67
N-Based NM Effectiveness ............................................................................................................................................ 67
P-Based NM Effectiveness ............................................................................................................................................. 68
P/D Agriculture Effectiveness ..................................................................................................................................... 69
ENM Effectiveness ............................................................................................................................................................ 70
Major Factors Affecting NM Effectiveness .............................................................................................................. 70
Yield Goals: ..................................................................................................................................................................... 70
Timing and form of Application: ............................................................................................................................ 71
Winter Spreading: ........................................................................................................................................................ 71
Cover Crops: ................................................................................................................................................................... 72
Irrigation and Drainage: ............................................................................................................................................ 73
Conservation Tillage: .................................................................................................................................................. 73
Other Factors ................................................................................................................................................................. 73
Recommendations for Improved Tracking, Reporting, and Modeling of Nutrient Management ........ 74
Recommendations for Tracking ................................................................................................................................. 74
Recommendations for Voluntary Plan Tracking. ................................................................................................ 74

Application Management March 2014
Page D2
Recommendations on Modeling ................................................................................................................................. 75
Literature .................................................................................................................................................................................. 75
Abbreviations, Acronyms, and Units ............................................................................................................................. 75
Sources ....................................................................................................................................................................................... 79
Appendix A: Synopses of State Agriculture Programs ........................................................................................... 81
Synopsis of NM Tech Standards for Delaware ...................................................................................................... 82
Synopsis of NM Tech Standards for Maryland ...................................................................................................... 84
Synopsis of NM Tech Standards for New York ..................................................................................................... 86
Synopsis of NM Tech Standards for Pennsylvania .............................................................................................. 89
Synopsis of NM Tech Standards for Virginia ......................................................................................................... 91
Synopsis of NM Tech Standards for West Virginia ............................................................................................. 93
Appendix B: Adaptive Nutrient Management Approach ....................................................................................... 95
Appendix C: Maryland Nutrient Management Regulations (excerpts) ........................................................... 97
Appendix D: Pennsylvania Nutrient Management Regulations (excerpts) ................................................ 105
Appendix E: Virginia Nutrient Management Regulations (excerpts) ........................................................... 113
Appendix F: West Virginia Nutrient Management Regulations (excerpts) ................................................ 115
TABLES Table 1. Default nutrient management definitions used in survey..................................................................... 4 Table 2. Official state nutrient management definitions and NMP content .................................................... 6 Table 3. Additional comments and alternative nutrient management definitions .................................... 19 Table 4. Methods for yield goals and N recommendations .................................................................................. 32 Table 5. Basic requirements for nutrient management ......................................................................................... 38 Table 6. Major gaps in programs for nutrient management ................................................................................ 43 Table 7. Summary of technical standards or requirements for nutrient management ............................ 48 Table 8. P index characterization .................................................................................................................................... 51 Table 9. Computation of P indexes ................................................................................................................................. 54 Table 10. Extracts from Interviews – response to questions concerning responsibilities for various
stages of nutrient management planning and implementation ........................................................ 56 Table 11. Extracts from interviews related to status of nutrient management plan implementation
...................................................................................................................................................................................... 62
Application Management March 2014
Page D3
BACKGROUND The Nutrient Management Expert Panel (EP) is focused on agricultural production in the Chesapeake Bay watershed under the sponsorship of the Agriculture Workgroup. This report will be used by the EP to develop programmatic recommendations to the Chesapeake Bay Program (CBP) Partnership for the improvement of existing model representation of the management of agricultural nutrients, as well as the improved tracking, verification and reporting of implementation information by the partnership. The process followed by the EP will be consistent with Protocol for the Development, Review, and Approval of Loading and Effectiveness Estimates for Nutrient and Sediment Controls in the Chesapeake Bay Watershed Model (March 15, 2010). Tetra Tech (Tt) staff surveyed and interviewed 25 members of the 26-member EP (see Sources on p. 76) to obtain information and recommendations for the CBP Partnership regarding both technical and programmatic aspects of agricultural nutrient management (NM) in the Chesapeake Bay (CB) watershed. State agencies in Delaware (DE), Maryland (MD), New York (NY), Pennsylvania (PA), Virginia (VA), and West Virginia (WV) were all represented in the survey/interview process, as were federal agencies, state land grant universities, and nongovernmental organizations. Interviewees were given a survey form to complete prior to the interview call and Tt staff added information to the survey forms during the interview. These updated survey forms were then sent to the interviewees for review and comment before being finalized by Tt. Fourteen (56%) of the interviewees provided review comments. This summary report is a compilation of these individual surveys, synopses of state agricultural NM programs that were developed by Tt and reviewed by state agriculture program experts with EP membership, and information on state programs obtained by Tt after the interviews. State-specific information summarized here was generally provided by either or both a state agriculture program expert and academic(s) living and working in the particular state. Similarly, information tailored to specific crops or land uses was frequently although not always provided by one or more experts on that subject area. Information presented here that has broader applicability is generally supported by specific input from two or more EP members. Conflicting information or recommendations are highlighted in those cases where such conflicts are readily apparent. Exceptions to these general rules are noted in the report. Overall, the goal was to be as inclusive as possible with the expectation that the EP will ultimately determine the relative merits and applicability of the information provided here.
Application Management March 2014
Page D4
DEFINITIONS OF AGRICULTURAL NUTRIENT MANAGEMENT EP members were asked to provide official (i.e., state) and suggested definitions of the following NM options: nitrogen-based (N-based) NM, phosphorus-based (P-based) NM, precision/decision (P/D) agriculture, and enhanced nutrient management (ENM). The default definitions in Table 1 were provided as an attachment to the survey form and interviewees had the option to either agree with those definitions or suggest alternatives. These default definitions were based primarily on those currently used in Scenario Builder (SB).
TABLE 1. DEFAULT NUTRIENT MANAGEMENT DEFINITIONS USED IN SURVEY
NM Type Default Definition Used in Survey Basic NM Nutrient management plan (NMP) implementation (crop) is a comprehensive plan that describes
the optimum use of nutrients to minimize nutrient loss while maintaining yield. A NMP details the type, rate, timing, and placement of nutrients for each crop. Soil, plant tissue, manure and/or sludge tests are used to assure optimal application rates. Plans should be revised every 2 to 3 years.
N-Based NM Under N-based planning, rates for manure or commercial fertilizer applications are based on the N requirement of the crops to be grown, and, in some cases on other factors, such as soil type and soil test results. When animal waste or other organic sources are used exclusively without N-supplementation, N-based planning usually results in a buildup of P in the soil.
P-Based NM Phosphorus-based plans are normally associated with animal waste or organic nutrient sources. Under P-based planning, rates for manure applications are based on the P requirement of the crops to be grown. P-based planning usually requires supplemental N application in the form of commercial fertilizer N. In some cases where planning indicates minimal environmental impact due to over-application of P, P-based planning may allow application rates exceeding the short-term P requirement of the crops as long as the rate does not exceed the rate allowed by the P Index.
P/D Agriculture
A farm management approach that begins with implementation of all requirements of the federal/state nutrient management standard but then seeks improved nutrient management efficiency based on observing and responding to within-field variations, e.g., in soil fertility, crop yield, soil characteristics. It relies on technology like satellite imagery and geospatial tools; it depends on farmers' ability to locate precise position on a field using GIS/GPS, and to control and vary activities such as fertilizer application by location. Precision agriculture aims to optimize field-level management with respect to crop needs (e.g., nutrient inputs), environmental protection (e.g., excessive soil P, N leaching), and economics (e.g., agrichemical usage, crop yield). Precision/decision agriculture includes analysis of all soil amendments, measurement of all field inputs and outputs, and detailed record-keeping. Decision agriculture is defined in the documentation for Scenario Builder (Brosch 2010) as: “A management system that is information and technology based, is site specific and uses one or more of the following sources of data: soils, crops, nutrients, pests, moisture, or yield for optimum profitability, sustainability, and protection of the environment.”
ENM Based on research, the nutrient management rates of nitrogen application are set approximately 35% higher than what a crop needs to ensure nitrogen availability under optimal growing conditions. In a yield reserve program using enhanced nutrient management, the farmer would reduce the nitrogen application rate by 15%. An incentive or crop insurance 1is used to cover the risk of yield loss. This BMP effectiveness estimate is based on a reduction in nitrogen loss resulting from nutrient application to cropland 15% lower than the nutrient management recommendation.
1 This would not be federally subsidized crop insurance but rather an income guarantee such as that established by the American Farmland Trust for its BMP Challenge for Nutrient Management (http://www.farmland.org/programs/environment/solutions/nutrient-BMP-Challenge.asp).
Application Management March 2014
Page D5
Table 2 summarizes the information obtained regarding official state definitions of NM and NMPs, whereas Table 3 includes a range of alternative definitions and comments provided by interviewees. Information in Table 2 includes responses to survey/interview questions (in black) supplemented as needed by state guidance or regulatory language (in blue). All information in Table 3 is from survey/interview responses.
GENERAL OBSERVATIONS Nutrient management definitions are often not only dissimilar between states but may also be dissimilar between professionals in the same state. For example, participants noted that P-based planning as defined for SB and P-based planning relative to the NRCS 590 practice standard (nutrient management) are somewhat different. The existence of different definitions can cause confusion. Virtually all interviewees believed that NM definitions should be as close to the NRCS 590 practice standard as possible for consistency and to align the CB Watershed Model (the “Bay model”) with the major funding source implementing NM BMPs in the watershed. One expert made the observation that there is an inconsistency in defining basic NM as “a comprehensive plan that describes the optimum use of nutrients to minimize nutrient loss while maintaining yield” when the default definition of ENM includes an assumption that basic NM allows N applications that are 35% higher than crop needs. This interviewee suggested that such definitions should be compatible and show a transition of greater management inputs when going from the basic NMP to ENM, and then to P/D agriculture.
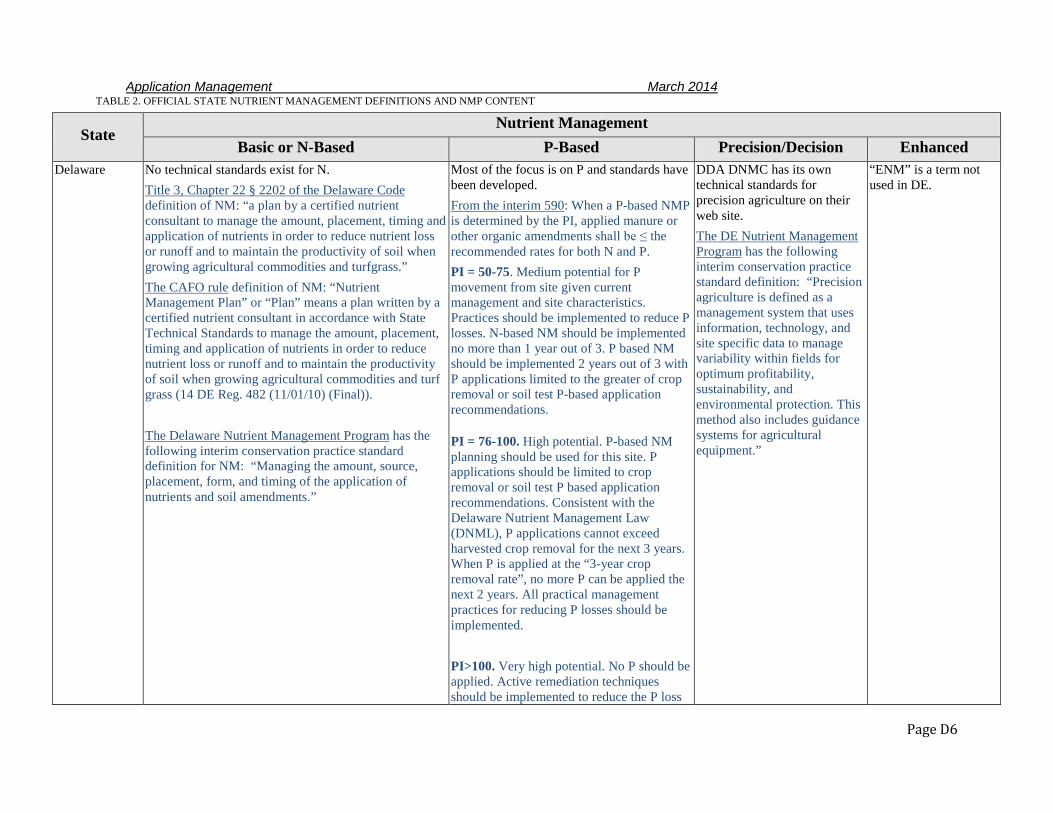
Application Management March 2014
Page D6
TABLE 2. OFFICIAL STATE NUTRIENT MANAGEMENT DEFINITIONS AND NMP CONTENT
State Nutrient Management
Basic or N-Based P-Based Precision/Decision Enhanced Delaware No technical standards exist for N.
Title 3, Chapter 22 § 2202 of the Delaware Code definition of NM: “a plan by a certified nutrient consultant to manage the amount, placement, timing and application of nutrients in order to reduce nutrient loss or runoff and to maintain the productivity of soil when growing agricultural commodities and turfgrass.” The CAFO rule definition of NM: “Nutrient Management Plan” or “Plan” means a plan written by a certified nutrient consultant in accordance with State Technical Standards to manage the amount, placement, timing and application of nutrients in order to reduce nutrient loss or runoff and to maintain the productivity of soil when growing agricultural commodities and turf grass (14 DE Reg. 482 (11/01/10) (Final)). The Delaware Nutrient Management Program has the following interim conservation practice standard definition for NM: “Managing the amount, source, placement, form, and timing of the application of nutrients and soil amendments.”
Most of the focus is on P and standards have been developed. From the interim 590: When a P-based NMP is determined by the PI, applied manure or other organic amendments shall be ≤ the recommended rates for both N and P. PI = 50-75. Medium potential for P movement from site given current management and site characteristics. Practices should be implemented to reduce P losses. N-based NM should be implemented no more than 1 year out of 3. P based NM should be implemented 2 years out of 3 with P applications limited to the greater of crop removal or soil test P-based application recommendations.
PI = 76-100. High potential. P-based NM planning should be used for this site. P applications should be limited to crop removal or soil test P based application recommendations. Consistent with the Delaware Nutrient Management Law (DNML), P applications cannot exceed harvested crop removal for the next 3 years. When P is applied at the “3-year crop removal rate”, no more P can be applied the next 2 years. All practical management practices for reducing P losses should be implemented. PI>100. Very high potential. No P should be applied. Active remediation techniques should be implemented to reduce the P loss
DDA DNMC has its own technical standards for precision agriculture on their web site. The DE Nutrient Management Program has the following interim conservation practice standard definition: “Precision agriculture is defined as a management system that uses information, technology, and site specific data to manage variability within fields for optimum profitability, sustainability, and environmental protection. This method also includes guidance systems for agricultural equipment.”
“ENM” is a term not used in DE.
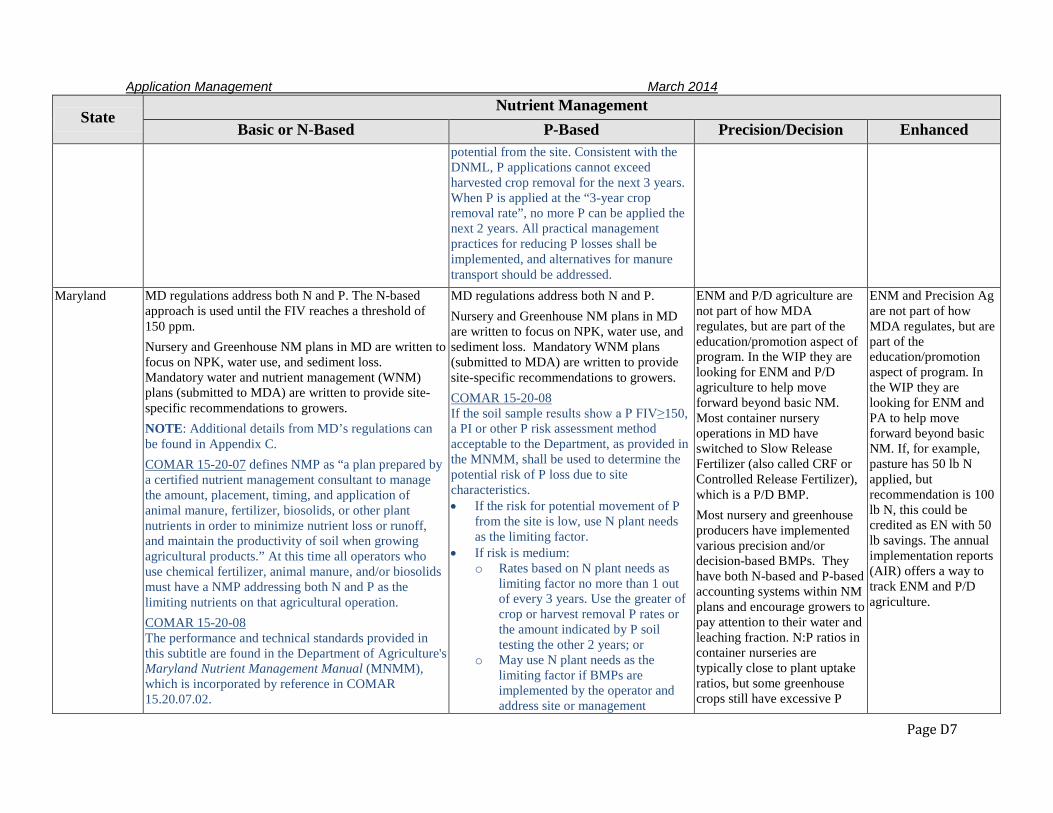
Application Management March 2014
Page D7
State Nutrient Management
Basic or N-Based P-Based Precision/Decision Enhanced potential from the site. Consistent with the DNML, P applications cannot exceed harvested crop removal for the next 3 years. When P is applied at the “3-year crop removal rate”, no more P can be applied the next 2 years. All practical management practices for reducing P losses shall be implemented, and alternatives for manure transport should be addressed.
Maryland MD regulations address both N and P. The N-based approach is used until the FIV reaches a threshold of 150 ppm. Nursery and Greenhouse NM plans in MD are written to focus on NPK, water use, and sediment loss. Mandatory water and nutrient management (WNM) plans (submitted to MDA) are written to provide site-specific recommendations to growers. NOTE: Additional details from MD’s regulations can be found in Appendix C. COMAR 15-20-07 defines NMP as “a plan prepared by a certified nutrient management consultant to manage the amount, placement, timing, and application of animal manure, fertilizer, biosolids, or other plant nutrients in order to minimize nutrient loss or runoff, and maintain the productivity of soil when growing agricultural products.” At this time all operators who use chemical fertilizer, animal manure, and/or biosolids must have a NMP addressing both N and P as the limiting nutrients on that agricultural operation. COMAR 15-20-08 The performance and technical standards provided in this subtitle are found in the Department of Agriculture's Maryland Nutrient Management Manual (MNMM), which is incorporated by reference in COMAR 15.20.07.02.
MD regulations address both N and P. Nursery and Greenhouse NM plans in MD are written to focus on NPK, water use, and sediment loss. Mandatory WNM plans (submitted to MDA) are written to provide site-specific recommendations to growers. COMAR 15-20-08 If the soil sample results show a P FIV≥150, a PI or other P risk assessment method acceptable to the Department, as provided in the MNMM, shall be used to determine the potential risk of P loss due to site characteristics. • If the risk for potential movement of P
from the site is low, use N plant needs as the limiting factor.
• If risk is medium: o Rates based on N plant needs as
limiting factor no more than 1 out of every 3 years. Use the greater of crop or harvest removal P rates or the amount indicated by P soil testing the other 2 years; or
o May use N plant needs as the limiting factor if BMPs are implemented by the operator and address site or management
ENM and P/D agriculture are not part of how MDA regulates, but are part of the education/promotion aspect of program. In the WIP they are looking for ENM and P/D agriculture to help move forward beyond basic NM. Most container nursery operations in MD have switched to Slow Release Fertilizer (also called CRF or Controlled Release Fertilizer), which is a P/D BMP. Most nursery and greenhouse producers have implemented various precision and/or decision-based BMPs. They have both N-based and P-based accounting systems within NM plans and encourage growers to pay attention to their water and leaching fraction. N:P ratios in container nurseries are typically close to plant uptake ratios, but some greenhouse crops still have excessive P
ENM and Precision Ag are not part of how MDA regulates, but are part of the education/promotion aspect of program. In the WIP they are looking for ENM and PA to help move forward beyond basic NM. If, for example, pasture has 50 lb N applied, but recommendation is 100 lb N, this could be credited as EN with 50 lb savings. The annual implementation reports (AIR) offers a way to track ENM and P/D agriculture.
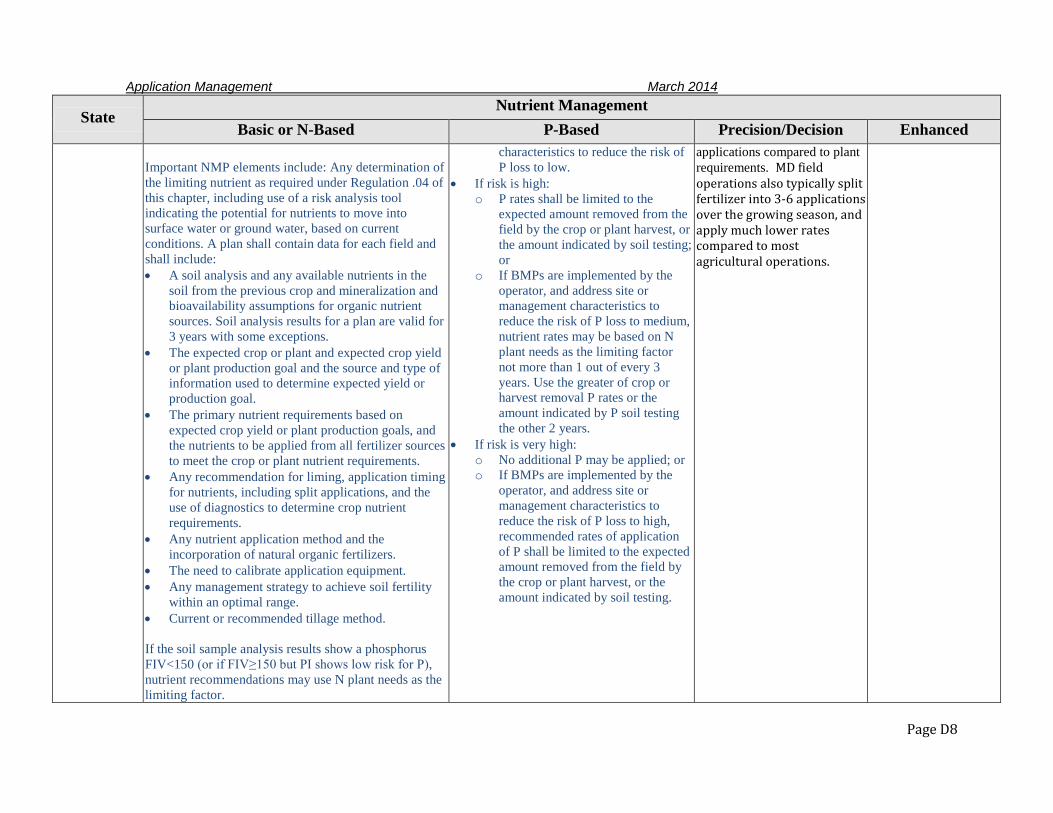
Application Management March 2014
Page D8
State Nutrient Management
Basic or N-Based P-Based Precision/Decision Enhanced Important NMP elements include: Any determination of the limiting nutrient as required under Regulation .04 of this chapter, including use of a risk analysis tool indicating the potential for nutrients to move into surface water or ground water, based on current conditions. A plan shall contain data for each field and shall include: • A soil analysis and any available nutrients in the
soil from the previous crop and mineralization and bioavailability assumptions for organic nutrient sources. Soil analysis results for a plan are valid for 3 years with some exceptions.
• The expected crop or plant and expected crop yield or plant production goal and the source and type of information used to determine expected yield or production goal.
• The primary nutrient requirements based on expected crop yield or plant production goals, and the nutrients to be applied from all fertilizer sources to meet the crop or plant nutrient requirements.
• Any recommendation for liming, application timing for nutrients, including split applications, and the use of diagnostics to determine crop nutrient requirements.
• Any nutrient application method and the incorporation of natural organic fertilizers.
• The need to calibrate application equipment. • Any management strategy to achieve soil fertility
within an optimal range. • Current or recommended tillage method. If the soil sample analysis results show a phosphorus FIV<150 (or if FIV≥150 but PI shows low risk for P), nutrient recommendations may use N plant needs as the limiting factor.
characteristics to reduce the risk of P loss to low.
• If risk is high: o P rates shall be limited to the
expected amount removed from the field by the crop or plant harvest, or the amount indicated by soil testing; or
o If BMPs are implemented by the operator, and address site or management characteristics to reduce the risk of P loss to medium, nutrient rates may be based on N plant needs as the limiting factor not more than 1 out of every 3 years. Use the greater of crop or harvest removal P rates or the amount indicated by P soil testing the other 2 years.
• If risk is very high: o No additional P may be applied; or o If BMPs are implemented by the
operator, and address site or management characteristics to reduce the risk of P loss to high, recommended rates of application of P shall be limited to the expected amount removed from the field by the crop or plant harvest, or the amount indicated by soil testing.
applications compared to plant requirements. MD field operations also typically split fertilizer into 3-6 applications over the growing season, and apply much lower rates compared to most agricultural operations.
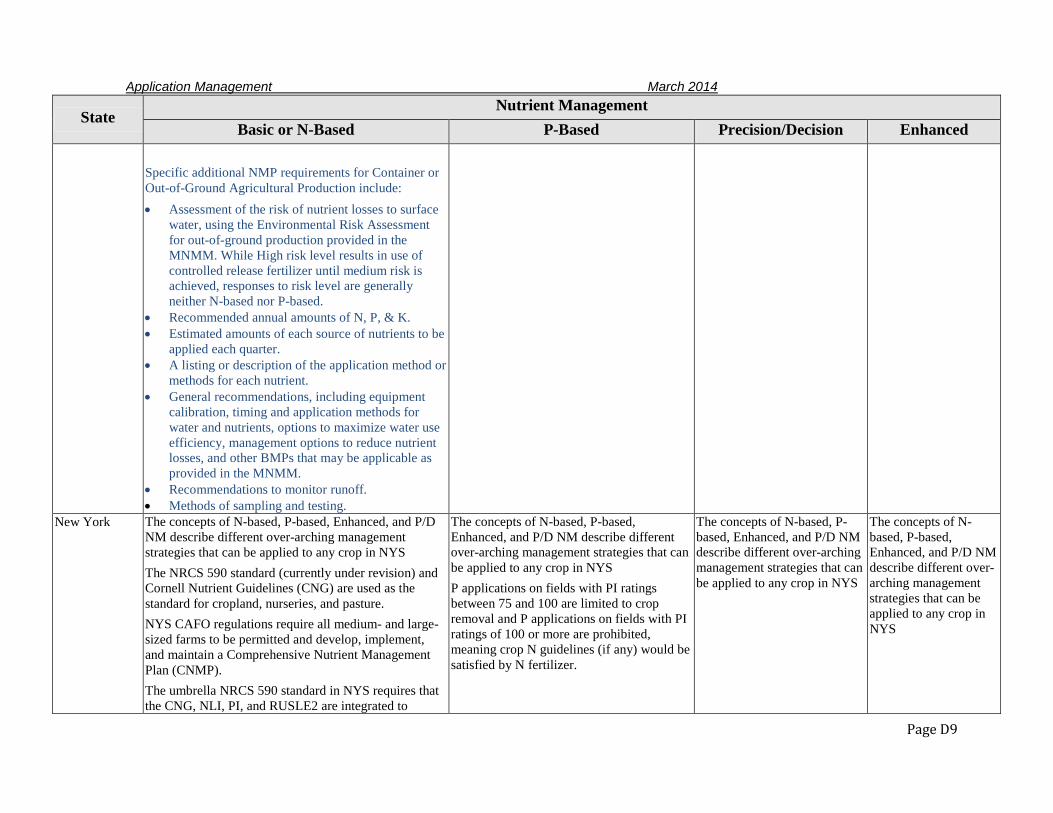
Application Management March 2014
Page D9
State Nutrient Management
Basic or N-Based P-Based Precision/Decision Enhanced Specific additional NMP requirements for Container or Out-of-Ground Agricultural Production include: • Assessment of the risk of nutrient losses to surface
water, using the Environmental Risk Assessment for out-of-ground production provided in the MNMM. While High risk level results in use of controlled release fertilizer until medium risk is achieved, responses to risk level are generally neither N-based nor P-based.
• Recommended annual amounts of N, P, & K. • Estimated amounts of each source of nutrients to be
applied each quarter. • A listing or description of the application method or
methods for each nutrient. • General recommendations, including equipment
calibration, timing and application methods for water and nutrients, options to maximize water use efficiency, management options to reduce nutrient losses, and other BMPs that may be applicable as provided in the MNMM.
• Recommendations to monitor runoff. • Methods of sampling and testing.
New York The concepts of N-based, P-based, Enhanced, and P/D NM describe different over-arching management strategies that can be applied to any crop in NYS The NRCS 590 standard (currently under revision) and Cornell Nutrient Guidelines (CNG) are used as the standard for cropland, nurseries, and pasture. NYS CAFO regulations require all medium- and large-sized farms to be permitted and develop, implement, and maintain a Comprehensive Nutrient Management Plan (CNMP). The umbrella NRCS 590 standard in NYS requires that the CNG, NLI, PI, and RUSLE2 are integrated to
The concepts of N-based, P-based, Enhanced, and P/D NM describe different over-arching management strategies that can be applied to any crop in NYS P applications on fields with PI ratings between 75 and 100 are limited to crop removal and P applications on fields with PI ratings of 100 or more are prohibited, meaning crop N guidelines (if any) would be satisfied by N fertilizer.
The concepts of N-based, P-based, Enhanced, and P/D NM describe different over-arching management strategies that can be applied to any crop in NYS
The concepts of N-based, P-based, Enhanced, and P/D NM describe different over-arching management strategies that can be applied to any crop in NYS

Application Management March 2014
Page D10
State Nutrient Management
Basic or N-Based P-Based Precision/Decision Enhanced determine sound recommendations for manure and fertilizer applications. NY’s recommendation system is comprised of the following key elements. • Every field managed according to the NRCS-NY
590 practice standard must undergo the full set of analyses in the standard (no threshold exists, under which a partial analysis is performed). This includes soil testing (at least every 3 years) and annual manure testing; risk assessment field walks to collect field attributes for the PI, RUSLE2, setbacks, and other resource concerns; collection of field history and management information; and significant analysis to integrate the CNG (based on a database of 600+ soil-specific yield potentials) and various risk assessments into a final recommendation for source, rate, timing, and method of nutrient application (4Rs).
• In addition to the risk assessment tools, above, the “Supplemental Manure Spreading Guidelines to Reduce Water Contamination Risk During Adverse Weather Conditions” is used to further guide fields selection and management during periods of saturated, frozen, and/or snow covered field conditions.
• Crop nutrient guidelines account for existing N credits from past crops, manure, and soil organic matter (OM) and are based on the sufficiency approach, developed through years of crop yield response studies, and not a crop removal approach. No blanket insurance factors exist.
• Additional N conservation BMPs are recommended on fields for NLI ratings of 10 or more.
• RUSLE2 is run on all fields and soil loss must be managed to T.
• Manure application setbacks from watercourses (100’, 35’ vegetated buffer, or 15’ buffer if
Application Management March 2014
Page D11
State Nutrient Management
Basic or N-Based P-Based Precision/Decision Enhanced incorporated within 24 hours) and 100’ from wells.
• Records are kept to drive future management. Pennsylvania ACT 38 technical manual criteria form the basis for NM
definition in PA. All regulatory plans in PA are N-based and P-based. The P management is based on the PI which is used to determine if an N-based, P-based or no P approach must be followed on a given field for a given management scenario. The non-approved plans are based on P removal unless soil tests are less than 200 ppm Mehlich 3P. Then an N-based plan can be used. These plans also have required setbacks from water. The soil test P limitation and the setbacks can be modified if the PI is used. NOTE: Additional details from PA’s regulations can be found in Appendix D. Act 38 Regulations, Subchapter D. Nutrient Management NMP definition: a written site-specific plan which meets the requirements in the act. Important NMP elements include: • The planned nutrient applications for each crop
management unit listing acres; expected yield; nutrients applied as starter chemical fertilizer; planned manure application period, rate, type, and incorporation time; rate of other organic nutrient sources planned to be applied; and other nutrients applied through chemical fertilizer.
• N and P are the only nutrient elements of concern to be addressed by BMPs in the plan, but K crop needs and rates must be included in the plan.
• Manure testing. After approval of the initial plan, manure tests are required to be taken annually for each manure group generated on the operation.
All plans address P but not all are P-indexed or P-limited plans. All regulatory plans in PA are N-based and P-based. The P management is based on the PI which is used to determine if an N-based, P-based or no P approach must be followed on a given field for a given management scenario. The non-approved plans are based on P removal unless soil tests are less than 200 ppm Mehlich 3P. Then an N-based plan can be used. These plans also have required setbacks from water. The soil test P limitation and the setbacks can be modified if the PI is used. Act 38 Regulations, Subchapter D. Nutrient Management Methods for determining and managing the risk of P loss and related water quality impacts must comply with specified criteria; the PI can be used. Appropriate BMPs such as methods, rates and timing of application designed to minimize the effects of P losses from fields are established based on the risks and impacts determined. P-based NM arises from two situations: • P application is limited to the level of P
removal from the soil by the crop, if the application of P to the soil would be expected to pose an immediate risk of impacts to surface water unless the risk is managed by limiting the application based on P.
• P application is completely restricted, if
NM plans are year and field specific for CAFOs and CAOs – more prescriptive. NM plan under the MMM is less intense and more generalized. Calls this P addressed NMP. Everyone who generates or utilizes manure needs to have a NM plan or MM plan which addresses P. Farmers currently not obligated to implement enhanced or precision NM.
PA has no specific definition of ENM. Everyone who generates or utilizes manure needs to have a NM plan or MM plan which addresses P. Farmers currently not obligated to implement enhanced or precision NM.
Application Management March 2014
Page D12
State Nutrient Management
Basic or N-Based P-Based Precision/Decision Enhanced • The amount of N available in the manure, and the
residual N from legume crops and previous applications of manure.
• Acreage and realistic expected crop yields for each crop management unit.
• Soil tests are required for each crop management unit at least every 3 years from the date of the last test.
• Based on the soil tests, the plan must include recommendations for the amount of N, P, and K necessary for realistic expected crop yields.
• The manure application rate shall be the lesser of the following: o A rate equal to or less than the balanced
manure application rate based on N. The rate is ≤N necessary for realistic expected crop yields or the amount of N the crop will use for an individual crop year. The rate will account for available residual N and applied N such as starter fertilizer.
o The rate as determined to minimize the effects of P losses from fields. The rate can be ≤N crop requirements (if P is not expected to pose an immediate risk of impacts to surface water), ≤P removal from the soil by the crop (if P application is expected to pose an immediate risk to surface water unless risk is managed via limiting the application based on P), or P application is completely restricted because P application is expected to pose an immediate risk impacts to surface water which cannot be managed via limiting the application based on P.
• Supplemental N needs can be determined via N availability testing.
the application of P to the soil would be expected to pose an immediate risk of impacts to a surface water which cannot be managed by limiting the nutrients based on P.
• If a pasture has been determined to require total restriction of P application, the risk of P loss shall be addressed by specified BMPs in lieu of total restriction of P application.
Application Management March 2014
Page D13
State Nutrient Management
Basic or N-Based P-Based Precision/Decision Enhanced Nutrients shall be applied to fields during times and conditions that will hold the nutrients in place for crop growth, and protect surface water and groundwater using BMPs as described in the plan. The plan must include intended target spreading periods for the application of manure and a statement indicating that the existing equipment has been calibrated. If manure will be applied using an irrigation system, application rates will be governed by nutrient application rate, soil infiltration capabilities and water holding capacity within the root zone or any restricting feature, depth of the root zone, depth to a shallow impervious soil layer, soil infiltration rate, soil texture and drainage, vegetation and ground slope. Nutrient applications are restricted by several setbacks and buffers. Winter application of manure is allowed but restricted, including a requirement that fields where manure will be applied in winter must have at least 25% residue, or an established cover crop. The NMP shall contain a list of specific stormwater control BMPs to address those critical runoff problem areas. Recordkeeping is required for nutrients, crop yields, soil tests, and manure generation.
Virginia Standards and Criteria/regulations (VADCR. 2005. Virginia Nutrient Management Standards and Criteria –Revised 2005) are incorporated into the regulations by reference. Said answers to most all specific questions about N- and P-based management are in this document. Says VA NM standard criteria meet or exceed NRCS 590 standard. Says new national 590 standard creates no need to change state 590 standard or VA NM standard criteria. N-based NM is a yield-goal based approach in VA.
P-based NM is more restrictive planning based on soil test threshold. PI has to be run if P saturation (Al+Fe) is >35%. No more P is allowed when P saturation is >= 65%. P-based plan is when less P is applied than plant removal. Said that in the Bay model a P-based plan means P is applied at less than crop removal rate, but that no state in CB watershed has yet reported a P-based acre. Hopes to get there. PI, however, would allow up to 1.5xRate depending on conditions.
Precision agriculture is using variable rates for N, P, K and/or lime.
ENM is when less nutrients applied than recommended for N and less P applied than allowed. This probably reduces N application by > 15%. Farmer has to prove he applied nutrients at < crop-removal (based on soil productivity groups for and farmer records for N and farmer records for P). This is not
Application Management March 2014
Page D14
State Nutrient Management
Basic or N-Based P-Based Precision/Decision Enhanced NOTE: Additional details from VA’s regulations can be found in Appendix E. VPA General Permit Regulation for Animal Feeding Operations (9VAC25-192-70) All NMPs must include the most recent P management criteria adopted by Virginia DCR. All NMPs will include P as well as N limits. The operator shall implement a NMP that shall address the form, source, amount, timing, and method of application of nutrients on each field to achieve realistic production goals, while minimizing N and P loss to ground and surface waters. The NMP shall contain the following information: • Site map • Site evaluation and assessment of soil types and
potential productivities • NM sampling including soil and waste monitoring • Storage and land area requirements • Calculation of waste application rates • Waste application schedules • Buffer zones Records shall be maintained to demonstrate where and at what rate waste has been applied, that the application schedule has been followed, and what crops have been planted.
Virginia Nutrient Management Standards and Criteria, (Revised 2005): Section IV. Phosphorus Management P application rates shall be managed to minimize adverse water quality impacts consistent with procedures contained in this section. • P applications from inorganic
nutrient sources shall be ≤ crop nutrient needs over crop rotation based on soil test.
• P applications shall be indicated as 0 in NMPs for soils >65% P saturation levels (>458 ppm for Eastern Shore and Lower Coastal Plain, >375 for Middle and Upper Coastal Plain and Piedmont, and >525 for Ridge and Valley) regardless of the outcome of other procedures specified in this section. Note: Soil Test P values are shown as elemental P, expressed as a Mehlich I VA soil test value.
• A single P application may be recommended to address multiple crops in the crop rotation identified within the NMP if; (a) the single application ≤ the sum of the appropriate application rates for individual crops.
For fields ≤ the maximum P saturation levels listed, the Soil Test, Environmental Threshold (ET), or PI Method must be used to determine maximum organic nutrient source P applications for fields contained in NMPs. The ET and the Virginia PI Version
tracked through c/s – person tracking plan adds to narrative that farmer is doing this.
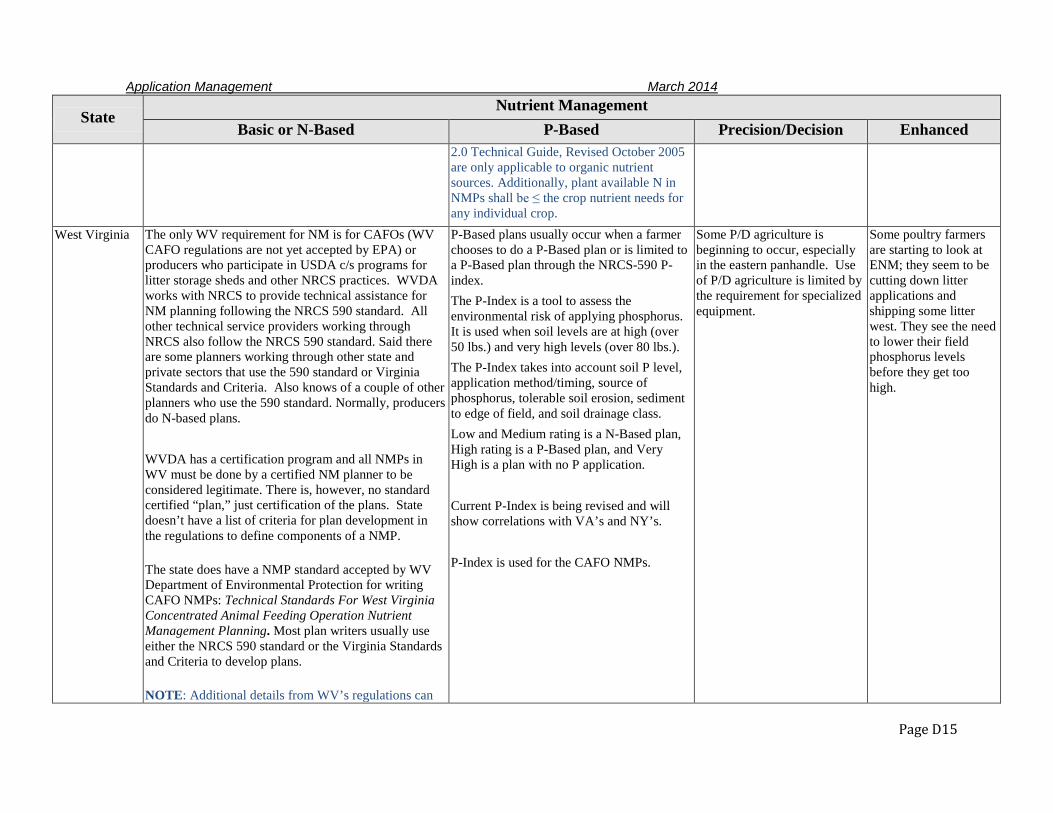
Application Management March 2014
Page D15
State Nutrient Management
Basic or N-Based P-Based Precision/Decision Enhanced 2.0 Technical Guide, Revised October 2005 are only applicable to organic nutrient sources. Additionally, plant available N in NMPs shall be ≤ the crop nutrient needs for any individual crop.
West Virginia The only WV requirement for NM is for CAFOs (WV CAFO regulations are not yet accepted by EPA) or producers who participate in USDA c/s programs for litter storage sheds and other NRCS practices. WVDA works with NRCS to provide technical assistance for NM planning following the NRCS 590 standard. All other technical service providers working through NRCS also follow the NRCS 590 standard. Said there are some planners working through other state and private sectors that use the 590 standard or Virginia Standards and Criteria. Also knows of a couple of other planners who use the 590 standard. Normally, producers do N-based plans. WVDA has a certification program and all NMPs in WV must be done by a certified NM planner to be considered legitimate. There is, however, no standard certified “plan,” just certification of the plans. State doesn’t have a list of criteria for plan development in the regulations to define components of a NMP.
The state does have a NMP standard accepted by WV Department of Environmental Protection for writing CAFO NMPs: Technical Standards For West Virginia Concentrated Animal Feeding Operation Nutrient Management Planning. Most plan writers usually use either the NRCS 590 standard or the Virginia Standards and Criteria to develop plans.
NOTE: Additional details from WV’s regulations can
P-Based plans usually occur when a farmer chooses to do a P-Based plan or is limited to a P-Based plan through the NRCS-590 P-index. The P-Index is a tool to assess the environmental risk of applying phosphorus. It is used when soil levels are at high (over 50 lbs.) and very high levels (over 80 lbs.). The P-Index takes into account soil P level, application method/timing, source of phosphorus, tolerable soil erosion, sediment to edge of field, and soil drainage class. Low and Medium rating is a N-Based plan, High rating is a P-Based plan, and Very High is a plan with no P application. Current P-Index is being revised and will show correlations with VA’s and NY’s. P-Index is used for the CAFO NMPs.
Some P/D agriculture is beginning to occur, especially in the eastern panhandle. Use of P/D agriculture is limited by the requirement for specialized equipment.
Some poultry farmers are starting to look at ENM; they seem to be cutting down litter applications and shipping some litter west. They see the need to lower their field phosphorus levels before they get too high.
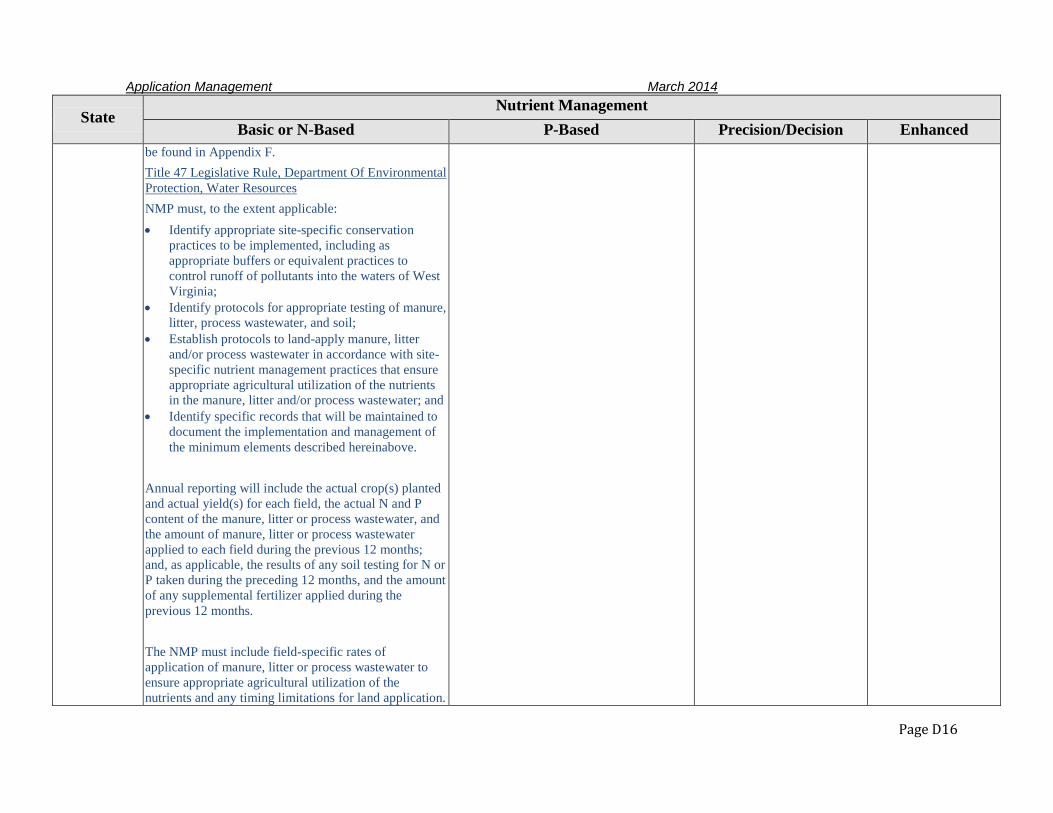
Application Management March 2014
Page D16
State Nutrient Management
Basic or N-Based P-Based Precision/Decision Enhanced be found in Appendix F. Title 47 Legislative Rule, Department Of Environmental Protection, Water Resources NMP must, to the extent applicable: • Identify appropriate site-specific conservation
practices to be implemented, including as appropriate buffers or equivalent practices to control runoff of pollutants into the waters of West Virginia;
• Identify protocols for appropriate testing of manure, litter, process wastewater, and soil;
• Establish protocols to land-apply manure, litter and/or process wastewater in accordance with site-specific nutrient management practices that ensure appropriate agricultural utilization of the nutrients in the manure, litter and/or process wastewater; and
• Identify specific records that will be maintained to document the implementation and management of the minimum elements described hereinabove.
Annual reporting will include the actual crop(s) planted and actual yield(s) for each field, the actual N and P content of the manure, litter or process wastewater, and the amount of manure, litter or process wastewater applied to each field during the previous 12 months; and, as applicable, the results of any soil testing for N or P taken during the preceding 12 months, and the amount of any supplemental fertilizer applied during the previous 12 months. The NMP must include field-specific rates of application of manure, litter or process wastewater to ensure appropriate agricultural utilization of the nutrients and any timing limitations for land application.
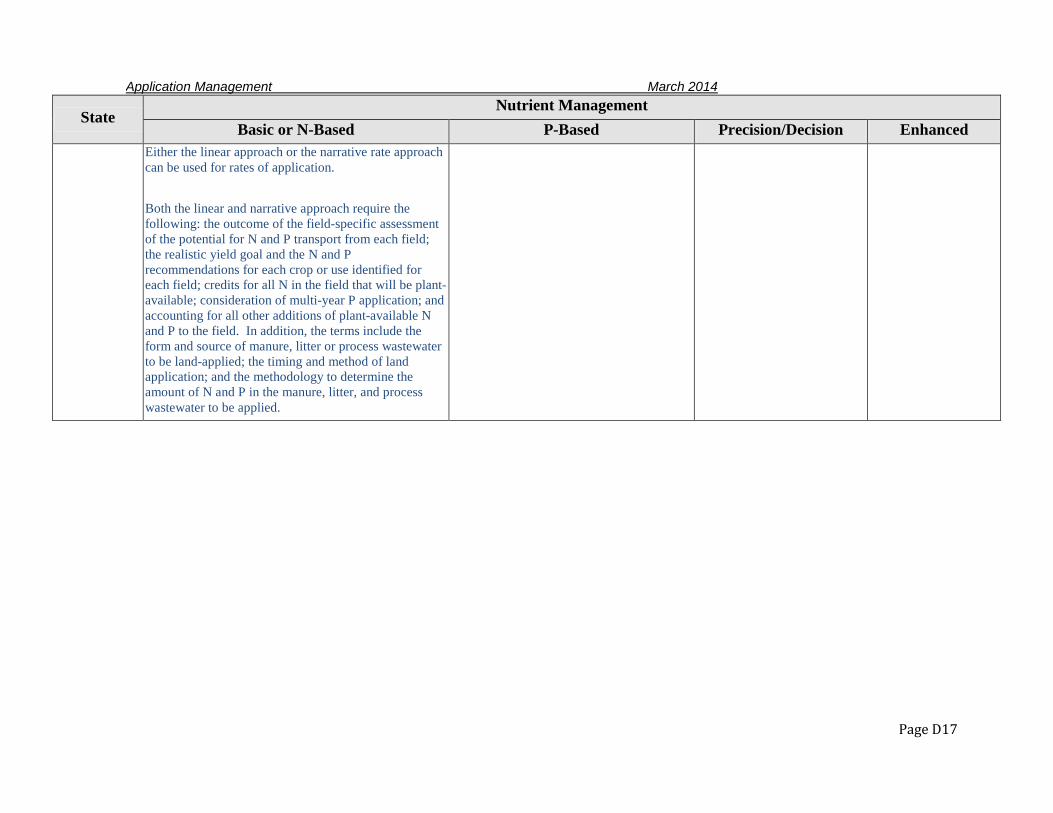
Application Management March 2014
Page D17
State Nutrient Management
Basic or N-Based P-Based Precision/Decision Enhanced Either the linear approach or the narrative rate approach can be used for rates of application. Both the linear and narrative approach require the following: the outcome of the field-specific assessment of the potential for N and P transport from each field; the realistic yield goal and the N and P recommendations for each crop or use identified for each field; credits for all N in the field that will be plant-available; consideration of multi-year P application; and accounting for all other additions of plant-available N and P to the field. In addition, the terms include the form and source of manure, litter or process wastewater to be land-applied; the timing and method of land application; and the methodology to determine the amount of N and P in the manure, litter, and process wastewater to be applied.
Application Management March 2014
Page D18
Several professionals discussed the concept that NM is a “process” rather than an “answer” and that this process is not well specified in state regulations. In addition, several participants suggested that the regulations need to consider newer tools (e.g., CSNT, PSNT, geospatial techniques, etc.) that could address NM in a site-specific fashion. Some participants suggested that NM plans (NMPs) set expectations so high that the farmer cannot meet them, and that the cumbersome procedure can cause farmers to reject plans. Further, several participants believe that regular assessments (and tracking) of management through in-field tests (CSNT, ISNT, variable rate technologies, sensor-based technologies, P and K soil tests, etc.) and adaptive management based on those tests are more likely to improve nutrient use efficiency and production to a greater degree than more prescriptive NMPs. Most participants believed that the focus of NM should be on animal waste and other organic products (e.g. biosolids) because commercial fertilizer was believed to be already applied judiciously due to economic considerations. Most interviewees indicated that the concepts of N-based and P-based NM do not apply when commercial fertilizer is used because commercial fertilizers are ordinarily blended to meet specific levels of N, P and other nutrients recommended for each crop and field. They generally stated that N-based and P-based NM are approaches applicable when organic nutrient sources are used because the needed ratio of N and P is not available in the organic nutrient source. One interviewee strongly disagreed with this consensus, however, stating that P-based NM applies to both manure and inorganic fertilizer management.
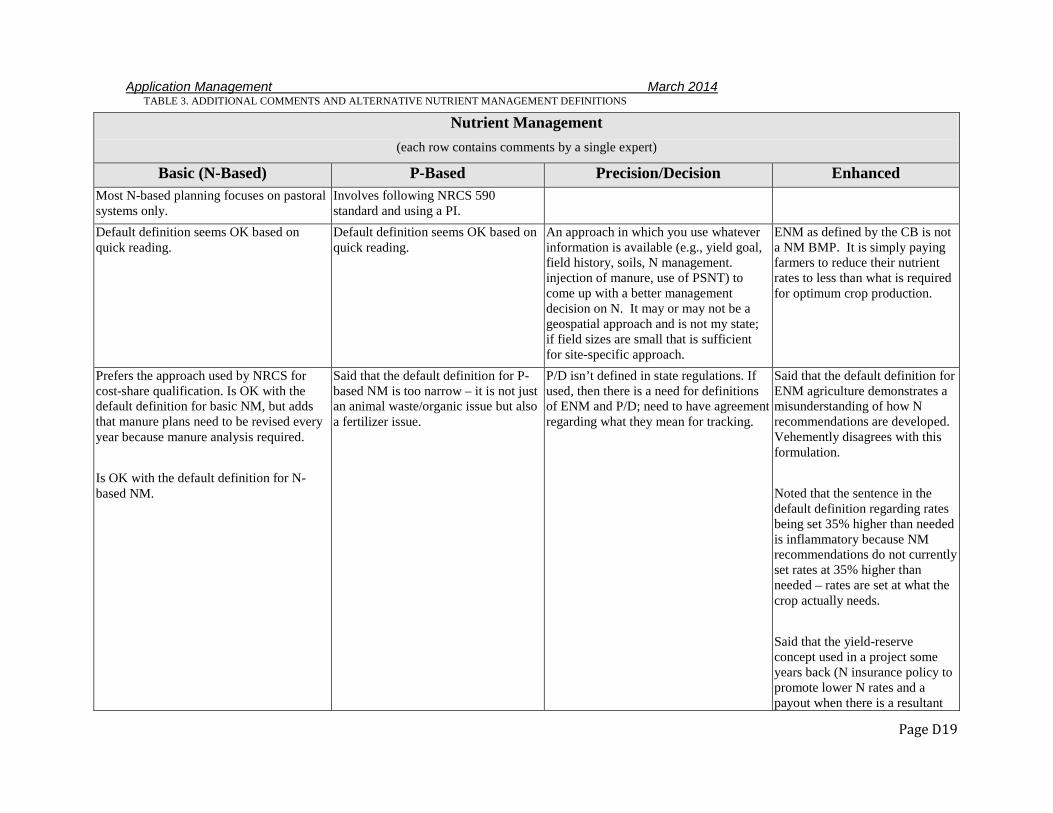
Application Management March 2014
Page D19
TABLE 3. ADDITIONAL COMMENTS AND ALTERNATIVE NUTRIENT MANAGEMENT DEFINITIONS
Nutrient Management (each row contains comments by a single expert)
Basic (N-Based) P-Based Precision/Decision Enhanced Most N-based planning focuses on pastoral systems only.
Involves following NRCS 590 standard and using a PI.
Default definition seems OK based on quick reading.
Default definition seems OK based on quick reading.
An approach in which you use whatever information is available (e.g., yield goal, field history, soils, N management. injection of manure, use of PSNT) to come up with a better management decision on N. It may or may not be a geospatial approach and is not my state; if field sizes are small that is sufficient for site-specific approach.
ENM as defined by the CB is not a NM BMP. It is simply paying farmers to reduce their nutrient rates to less than what is required for optimum crop production.
Prefers the approach used by NRCS for cost-share qualification. Is OK with the default definition for basic NM, but adds that manure plans need to be revised every year because manure analysis required. Is OK with the default definition for N-based NM.
Said that the default definition for P-based NM is too narrow – it is not just an animal waste/organic issue but also a fertilizer issue.
P/D isn’t defined in state regulations. If used, then there is a need for definitions of ENM and P/D; need to have agreement regarding what they mean for tracking.
Said that the default definition for ENM agriculture demonstrates a misunderstanding of how N recommendations are developed. Vehemently disagrees with this formulation. Noted that the sentence in the default definition regarding rates being set 35% higher than needed is inflammatory because NM recommendations do not currently set rates at 35% higher than needed – rates are set at what the crop actually needs. Said that the yield-reserve concept used in a project some years back (N insurance policy to promote lower N rates and a payout when there is a resultant
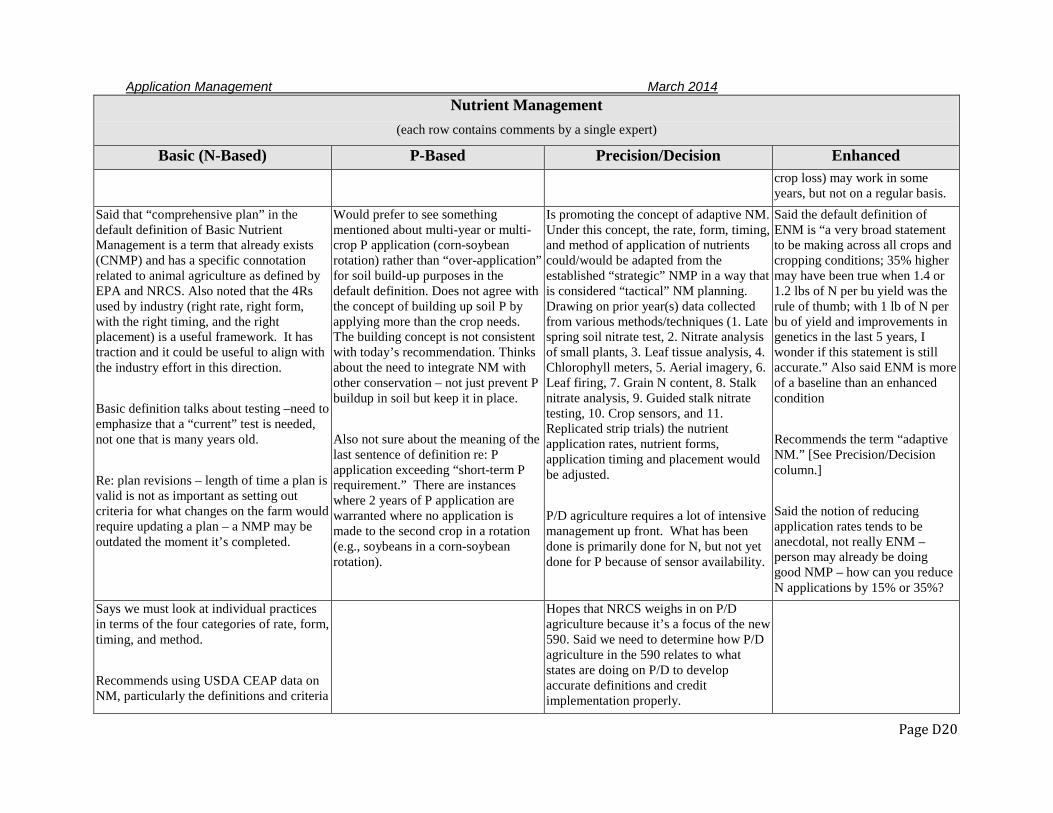
Application Management March 2014
Page D20
Nutrient Management (each row contains comments by a single expert)
Basic (N-Based) P-Based Precision/Decision Enhanced crop loss) may work in some years, but not on a regular basis.
Said that “comprehensive plan” in the default definition of Basic Nutrient Management is a term that already exists (CNMP) and has a specific connotation related to animal agriculture as defined by EPA and NRCS. Also noted that the 4Rs used by industry (right rate, right form, with the right timing, and the right placement) is a useful framework. It has traction and it could be useful to align with the industry effort in this direction. Basic definition talks about testing –need to emphasize that a “current” test is needed, not one that is many years old. Re: plan revisions – length of time a plan is valid is not as important as setting out criteria for what changes on the farm would require updating a plan – a NMP may be outdated the moment it’s completed.
Would prefer to see something mentioned about multi-year or multi-crop P application (corn-soybean rotation) rather than “over-application” for soil build-up purposes in the default definition. Does not agree with the concept of building up soil P by applying more than the crop needs. The building concept is not consistent with today’s recommendation. Thinks about the need to integrate NM with other conservation – not just prevent P buildup in soil but keep it in place. Also not sure about the meaning of the last sentence of definition re: P application exceeding “short-term P requirement.” There are instances where 2 years of P application are warranted where no application is made to the second crop in a rotation (e.g., soybeans in a corn-soybean rotation).
Is promoting the concept of adaptive NM. Under this concept, the rate, form, timing, and method of application of nutrients could/would be adapted from the established “strategic” NMP in a way that is considered “tactical” NM planning. Drawing on prior year(s) data collected from various methods/techniques (1. Late spring soil nitrate test, 2. Nitrate analysis of small plants, 3. Leaf tissue analysis, 4. Chlorophyll meters, 5. Aerial imagery, 6. Leaf firing, 7. Grain N content, 8. Stalk nitrate analysis, 9. Guided stalk nitrate testing, 10. Crop sensors, and 11. Replicated strip trials) the nutrient application rates, nutrient forms, application timing and placement would be adjusted. P/D agriculture requires a lot of intensive management up front. What has been done is primarily done for N, but not yet done for P because of sensor availability.
Said the default definition of ENM is “a very broad statement to be making across all crops and cropping conditions; 35% higher may have been true when 1.4 or 1.2 lbs of N per bu yield was the rule of thumb; with 1 lb of N per bu of yield and improvements in genetics in the last 5 years, I wonder if this statement is still accurate.” Also said ENM is more of a baseline than an enhanced condition Recommends the term “adaptive NM.” [See Precision/Decision column.] Said the notion of reducing application rates tends to be anecdotal, not really ENM – person may already be doing good NMP – how can you reduce N applications by 15% or 35%?
Says we must look at individual practices in terms of the four categories of rate, form, timing, and method. Recommends using USDA CEAP data on NM, particularly the definitions and criteria
Hopes that NRCS weighs in on P/D agriculture because it’s a focus of the new 590. Said we need to determine how P/D agriculture in the 590 relates to what states are doing on P/D to develop accurate definitions and credit implementation properly.

Application Management March 2014
Page D21
Nutrient Management (each row contains comments by a single expert)
Basic (N-Based) P-Based Precision/Decision Enhanced for what counts as good NM. CEAP also identified deficiencies in NMPs that must be considered. Noted that ideas on what can be done better are in the new 590 Standard. Said that the EP needs to be consistent between what USDA tracks and what the Chesapeake Bay Program (CBP) credits for modeling. The EP needs to align practice definitions to the extent feasible, avoiding as much as possible the necessity to cross-walk different components (i.e., the 590, state NM practices, and what is modeled). Noted as an example that the Bay model often has more science-based detail than is found in the 590 standard. A more comprehensive statement of the purpose of basic NM would add clarity to the definition (minimizing nutrient loss to what?) The NRCS 590 standard does a fairly good job at this emphasizing 1) minimization of pollution to surface and groundwater, 2) protecting air quality by reducing odors and the formation of atmospheric particulates, and 3) improving the physical chemical and biological condition of the soil and 4) the use/conservation of nutrients for plant production. The basic NM definition stands alone without the last two sentences, which are more general guidance (not used
Conditions should be determined in which P buildup is no longer acceptable and P based-management (with N supplementation) should be substituted for N-based. “Minimal environmental impact” in the default definition has not been defined – so it is difficult to interpret. P thresholds are more understandable when defined by explicit processes or states rather than a tool (particularly one known to vary widely by state). If there are exceptions, it is important to explain how they will not undermine the
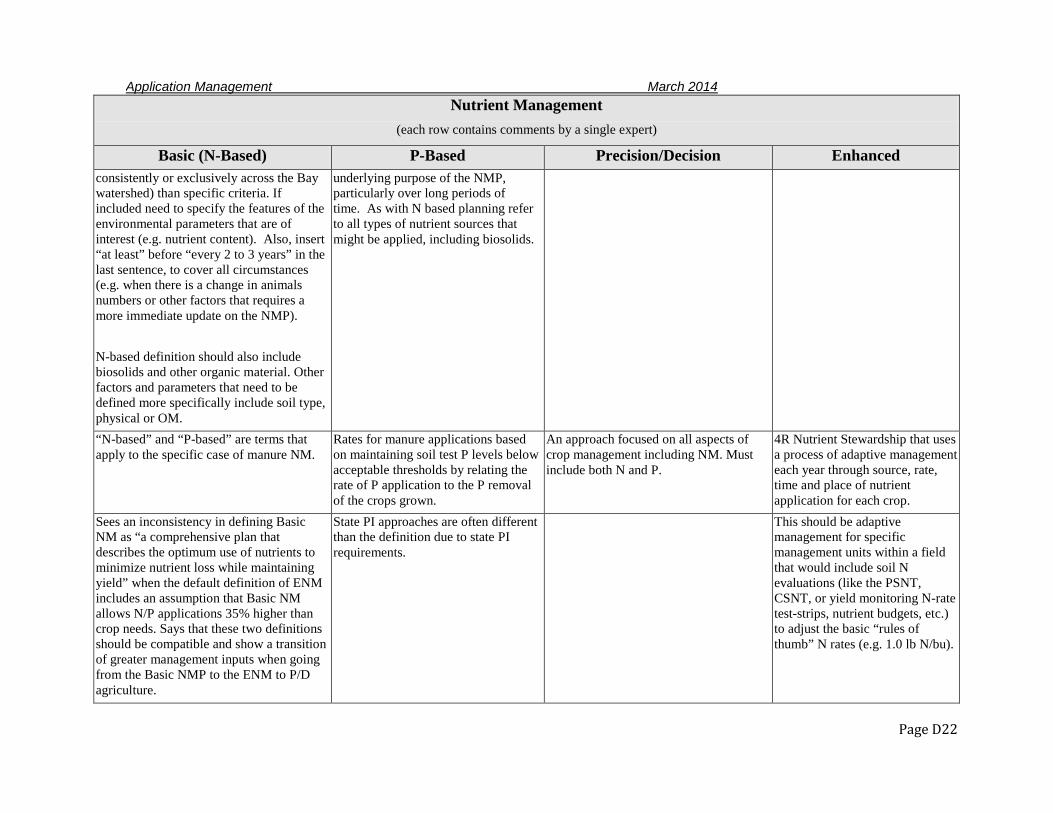
Application Management March 2014
Page D22
Nutrient Management (each row contains comments by a single expert)
Basic (N-Based) P-Based Precision/Decision Enhanced consistently or exclusively across the Bay watershed) than specific criteria. If included need to specify the features of the environmental parameters that are of interest (e.g. nutrient content). Also, insert “at least” before “every 2 to 3 years” in the last sentence, to cover all circumstances (e.g. when there is a change in animals numbers or other factors that requires a more immediate update on the NMP). N-based definition should also include biosolids and other organic material. Other factors and parameters that need to be defined more specifically include soil type, physical or OM.
underlying purpose of the NMP, particularly over long periods of time. As with N based planning refer to all types of nutrient sources that might be applied, including biosolids.
“N-based” and “P-based” are terms that apply to the specific case of manure NM.
Rates for manure applications based on maintaining soil test P levels below acceptable thresholds by relating the rate of P application to the P removal of the crops grown.
An approach focused on all aspects of crop management including NM. Must include both N and P.
4R Nutrient Stewardship that uses a process of adaptive management each year through source, rate, time and place of nutrient application for each crop.
Sees an inconsistency in defining Basic NM as “a comprehensive plan that describes the optimum use of nutrients to minimize nutrient loss while maintaining yield” when the default definition of ENM includes an assumption that Basic NM allows N/P applications 35% higher than crop needs. Says that these two definitions should be compatible and show a transition of greater management inputs when going from the Basic NMP to the ENM to P/D agriculture.
State PI approaches are often different than the definition due to state PI requirements.
This should be adaptive management for specific management units within a field that would include soil N evaluations (like the PSNT, CSNT, or yield monitoring N-rate test-strips, nutrient budgets, etc.) to adjust the basic “rules of thumb” N rates (e.g. 1.0 lb N/bu).
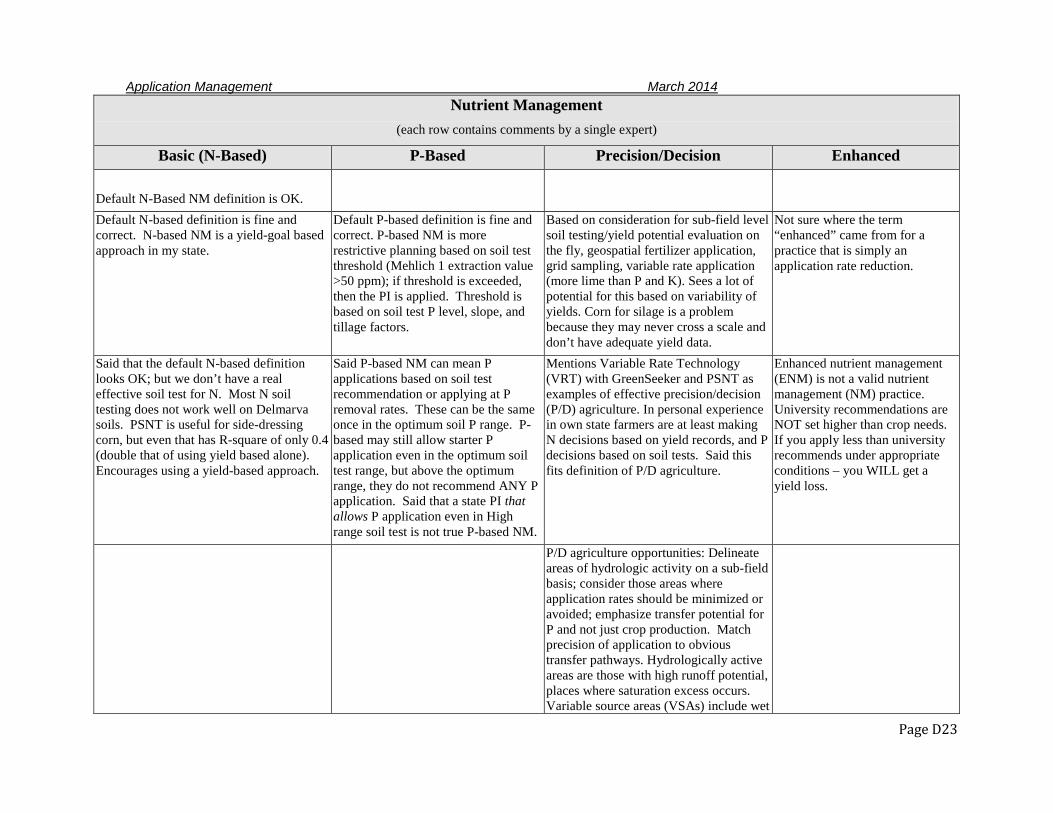
Application Management March 2014
Page D23
Nutrient Management (each row contains comments by a single expert)
Basic (N-Based) P-Based Precision/Decision Enhanced Default N-Based NM definition is OK. Default N-based definition is fine and correct. N-based NM is a yield-goal based approach in my state.
Default P-based definition is fine and correct. P-based NM is more restrictive planning based on soil test threshold (Mehlich 1 extraction value >50 ppm); if threshold is exceeded, then the PI is applied. Threshold is based on soil test P level, slope, and tillage factors.
Based on consideration for sub-field level soil testing/yield potential evaluation on the fly, geospatial fertilizer application, grid sampling, variable rate application (more lime than P and K). Sees a lot of potential for this based on variability of yields. Corn for silage is a problem because they may never cross a scale and don’t have adequate yield data.
Not sure where the term “enhanced” came from for a practice that is simply an application rate reduction.
Said that the default N-based definition looks OK; but we don’t have a real effective soil test for N. Most N soil testing does not work well on Delmarva soils. PSNT is useful for side-dressing corn, but even that has R-square of only 0.4 (double that of using yield based alone). Encourages using a yield-based approach.
Said P-based NM can mean P applications based on soil test recommendation or applying at P removal rates. These can be the same once in the optimum soil P range. P-based may still allow starter P application even in the optimum soil test range, but above the optimum range, they do not recommend ANY P application. Said that a state PI that allows P application even in High range soil test is not true P-based NM.
Mentions Variable Rate Technology (VRT) with GreenSeeker and PSNT as examples of effective precision/decision (P/D) agriculture. In personal experience in own state farmers are at least making N decisions based on yield records, and P decisions based on soil tests. Said this fits definition of P/D agriculture.
Enhanced nutrient management (ENM) is not a valid nutrient management (NM) practice. University recommendations are NOT set higher than crop needs. If you apply less than university recommends under appropriate conditions – you WILL get a yield loss.
P/D agriculture opportunities: Delineate areas of hydrologic activity on a sub-field basis; consider those areas where application rates should be minimized or avoided; emphasize transfer potential for P and not just crop production. Match precision of application to obvious transfer pathways. Hydrologically active areas are those with high runoff potential, places where saturation excess occurs. Variable source areas (VSAs) include wet
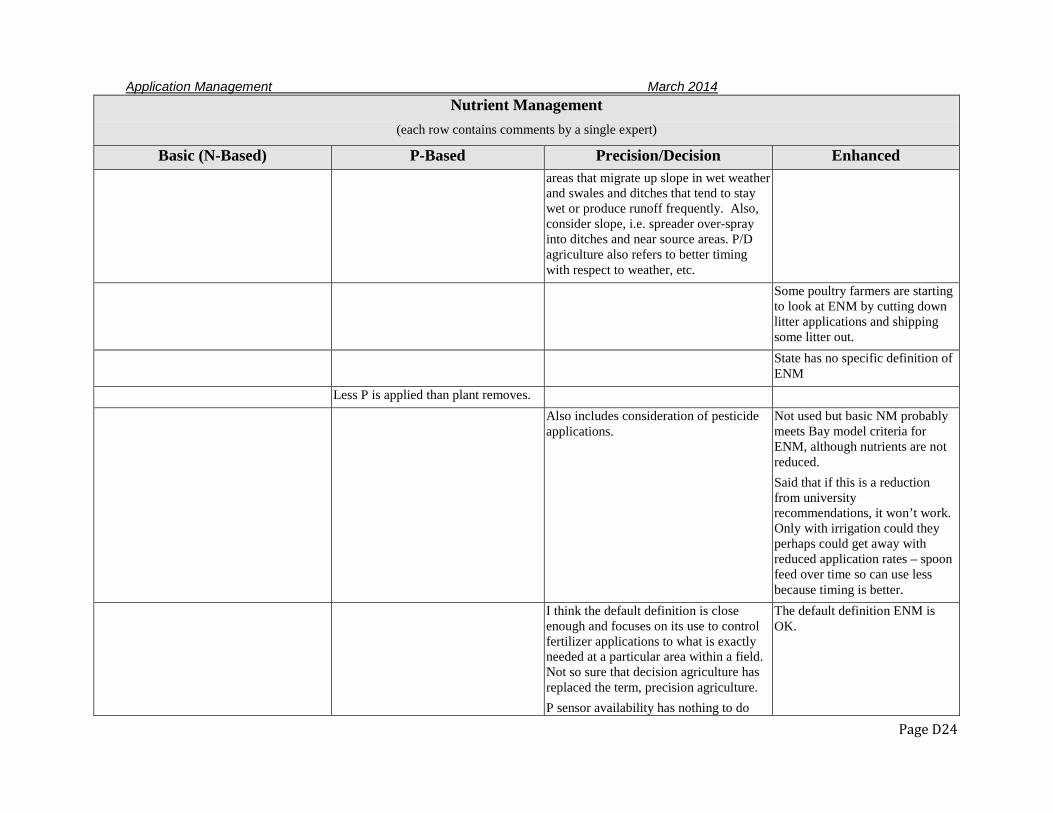
Application Management March 2014
Page D24
Nutrient Management (each row contains comments by a single expert)
Basic (N-Based) P-Based Precision/Decision Enhanced areas that migrate up slope in wet weather and swales and ditches that tend to stay wet or produce runoff frequently. Also, consider slope, i.e. spreader over-spray into ditches and near source areas. P/D agriculture also refers to better timing with respect to weather, etc.
Some poultry farmers are starting to look at ENM by cutting down litter applications and shipping some litter out.
State has no specific definition of ENM
Less P is applied than plant removes. Also includes consideration of pesticide
applications. Not used but basic NM probably meets Bay model criteria for ENM, although nutrients are not reduced. Said that if this is a reduction from university recommendations, it won’t work. Only with irrigation could they perhaps could get away with reduced application rates – spoon feed over time so can use less because timing is better.
I think the default definition is close enough and focuses on its use to control fertilizer applications to what is exactly needed at a particular area within a field. Not so sure that decision agriculture has replaced the term, precision agriculture. P sensor availability has nothing to do
The default definition ENM is OK.
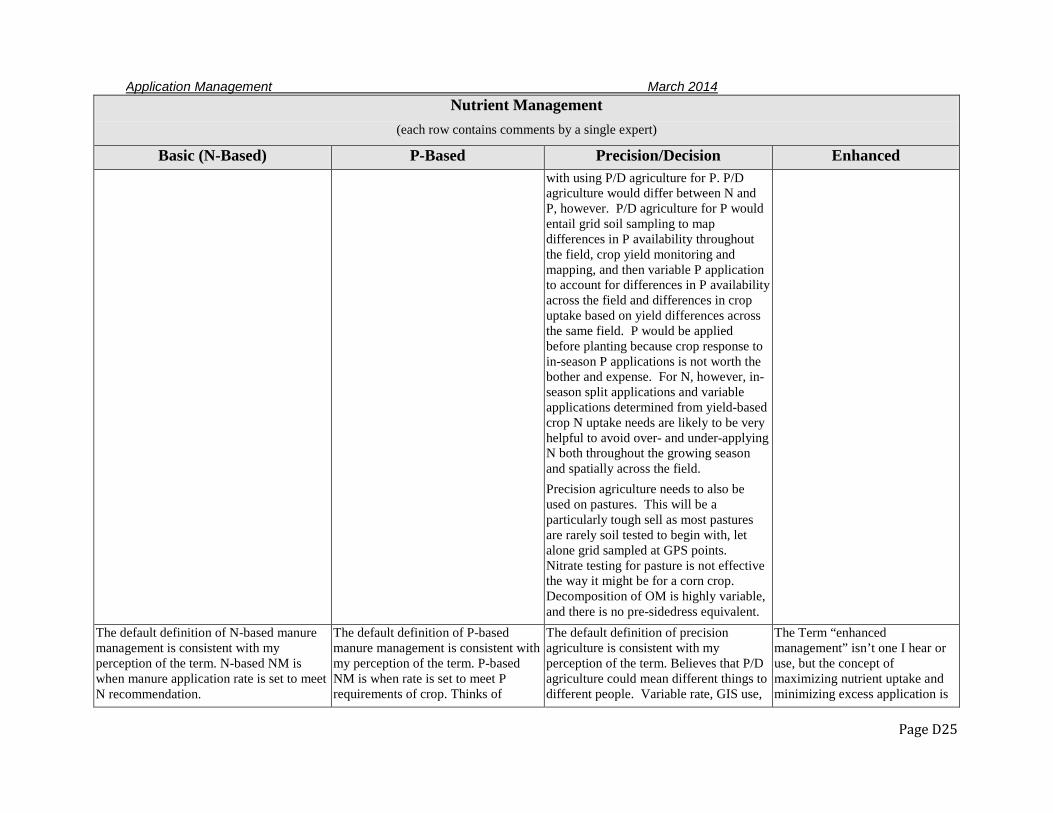
Application Management March 2014
Page D25
Nutrient Management (each row contains comments by a single expert)
Basic (N-Based) P-Based Precision/Decision Enhanced with using P/D agriculture for P. P/D agriculture would differ between N and P, however. P/D agriculture for P would entail grid soil sampling to map differences in P availability throughout the field, crop yield monitoring and mapping, and then variable P application to account for differences in P availability across the field and differences in crop uptake based on yield differences across the same field. P would be applied before planting because crop response to in-season P applications is not worth the bother and expense. For N, however, in-season split applications and variable applications determined from yield-based crop N uptake needs are likely to be very helpful to avoid over- and under-applying N both throughout the growing season and spatially across the field. Precision agriculture needs to also be used on pastures. This will be a particularly tough sell as most pastures are rarely soil tested to begin with, let alone grid sampled at GPS points. Nitrate testing for pasture is not effective the way it might be for a corn crop. Decomposition of OM is highly variable, and there is no pre-sidedress equivalent.
The default definition of N-based manure management is consistent with my perception of the term. N-based NM is when manure application rate is set to meet N recommendation.
The default definition of P-based manure management is consistent with my perception of the term. P-based NM is when rate is set to meet P requirements of crop. Thinks of
The default definition of precision agriculture is consistent with my perception of the term. Believes that P/D agriculture could mean different things to different people. Variable rate, GIS use,
The Term “enhanced management” isn’t one I hear or use, but the concept of maximizing nutrient uptake and minimizing excess application is
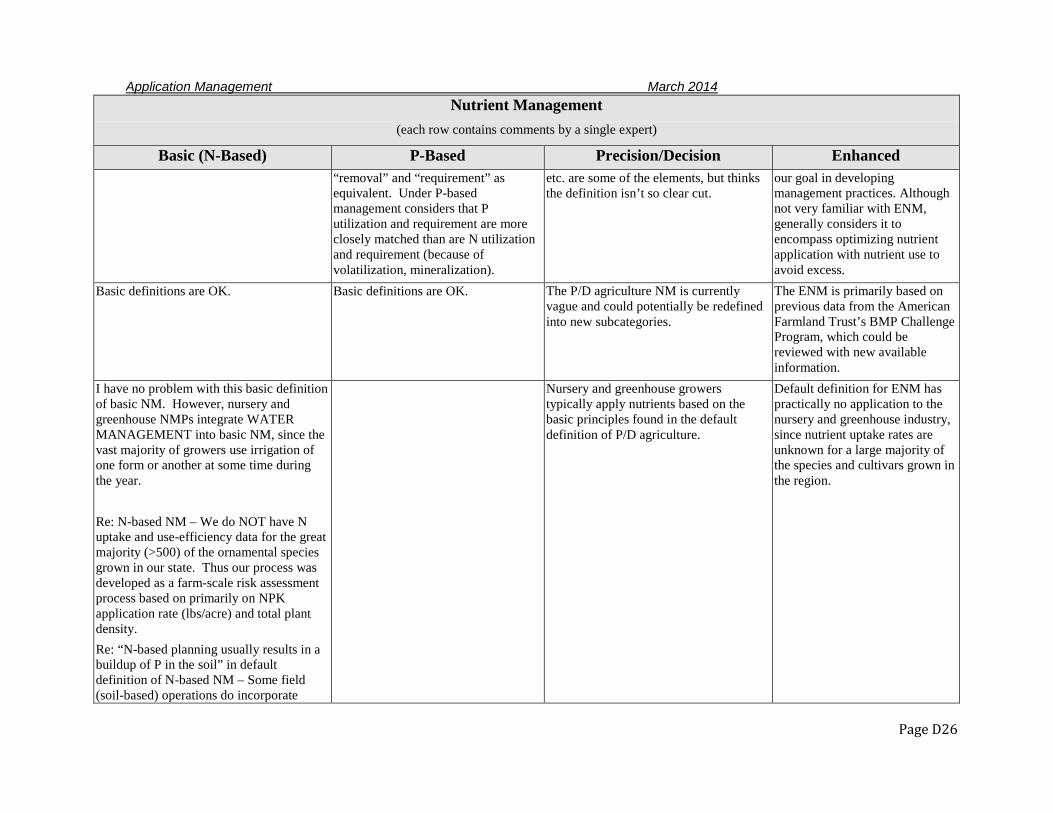
Application Management March 2014
Page D26
Nutrient Management (each row contains comments by a single expert)
Basic (N-Based) P-Based Precision/Decision Enhanced “removal” and “requirement” as equivalent. Under P-based management considers that P utilization and requirement are more closely matched than are N utilization and requirement (because of volatilization, mineralization).
etc. are some of the elements, but thinks the definition isn’t so clear cut.
our goal in developing management practices. Although not very familiar with ENM, generally considers it to encompass optimizing nutrient application with nutrient use to avoid excess.
Basic definitions are OK. Basic definitions are OK. The P/D agriculture NM is currently vague and could potentially be redefined into new subcategories.
The ENM is primarily based on previous data from the American Farmland Trust’s BMP Challenge Program, which could be reviewed with new available information.
I have no problem with this basic definition of basic NM. However, nursery and greenhouse NMPs integrate WATER MANAGEMENT into basic NM, since the vast majority of growers use irrigation of one form or another at some time during the year. Re: N-based NM – We do NOT have N uptake and use-efficiency data for the great majority (>500) of the ornamental species grown in our state. Thus our process was developed as a farm-scale risk assessment process based on primarily on NPK application rate (lbs/acre) and total plant density. Re: “N-based planning usually results in a buildup of P in the soil” in default definition of N-based NM – Some field (soil-based) operations do incorporate
Nursery and greenhouse growers typically apply nutrients based on the basic principles found in the default definition of P/D agriculture.
Default definition for ENM has practically no application to the nursery and greenhouse industry, since nutrient uptake rates are unknown for a large majority of the species and cultivars grown in the region.
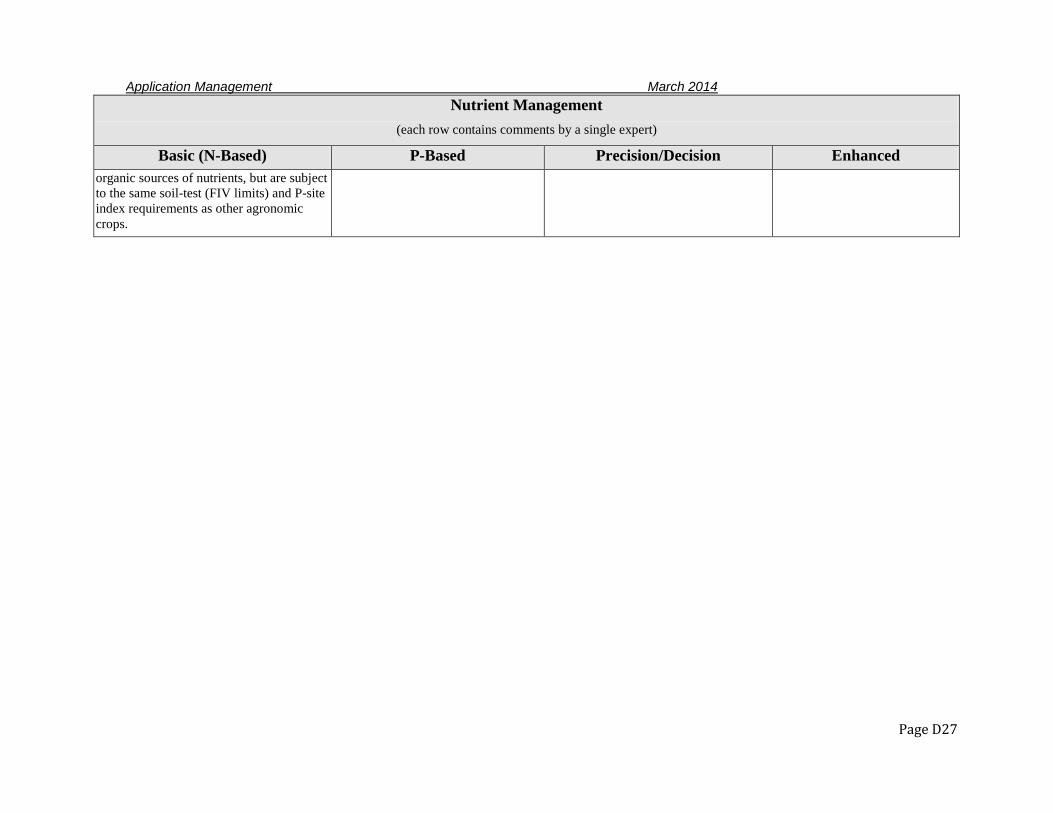
Application Management March 2014
Page D27
Nutrient Management (each row contains comments by a single expert)
Basic (N-Based) P-Based Precision/Decision Enhanced organic sources of nutrients, but are subject to the same soil-test (FIV limits) and P-site index requirements as other agronomic crops.
Application Management March 2014
Page D28
BASIC OR N-BASED NM Several interviewees were satisfied with the default definitions of basic and N-based NM. Two experts suggested that the 4Rs (right rate, right form, with the right timing and the right placement) could serve as a useful framework for basic NM. Greater specificity and a focus on the specific parameters of NM were recommended by two interviewees as means for better understanding of NM objectives and assigning credit. The importance of accurate and current testing was mentioned from varying perspectives by three interviewees, and there was some agreement that plan updates are best triggered by relevant events and information on the farm.
P-BASED NM Accepted notions on application rates for P-based NM included P application less than crop P removal, P application equal to crop P removal, and P application equal to crop P removal or based on soil test recommendation. One expert stated that P-based NM may still allow starter P application even in the optimum soil test range, but above the optimum range, no P application is recommended. Another suggested the inclusion of multi-year or multi-crop P application in the definition. There were several comments addressing soil P buildup and use of the Phosphorus (or Phosphorus Site or Phosphorus Runoff) Index (PI). Concern was expressed that P-based NM as practiced can cause soil P levels to increase, even on very high P soils. This situation is generally attributed to application of the PI. For example, MD regulations allow application at the N-based rate one in three years, with crop removal rate allowed in the other two years, even when the Fertility Index Value (FIV) is above threshold and no P is needed. Under this type of management P soil levels will continue to increase, and one expert commented that this is not true P-based NM.
ENM Several noted that the yield reserve concept in the current ENM definition presupposes that recommended N rates exceed optimum rates and disagreed with that assumption. They further stated that based on results from several areas, it appears that ENM under prescribes N for optimum yield. In short, although N would be used more efficiently under ENM, crop yields would suffer. Three experts stated or otherwise clearly indicated that ENM is not a BMP, while three others suggested that adaptive NM is a better alternative definition. Several recalled or mentioned the American Farmland Trust (AFT) program that paid for yield loss when fertilizer application rate was reduced as the origin of the ENM concept and pointed out that yield losses did occur in most of the cases in that program.
STATE PROGRAMS With the exception of WV, all CB states have regulations pertaining to NM on agricultural lands. The U.S. Environmental Protection Agency (EPA) has not yet accepted the CAFO regulations proposed by WV, and these are the only NM requirements in the state. State definitions of NM that were examined for this report are broad, and all generally address the amount, placement, timing, and application method of nutrients to both maintain the productivity of soil and reduce nutrient loss or runoff. Whereas these NM definitions are often provided as line items in state regulations, NM is truly manifested through the
Application Management March 2014
Page D29
implementation of NMPs. Comparison of specific NMP requirements and the implementation of the various elements of NMPs, therefore, is essential to making decisions regarding crediting and tracking NM across the CB watershed. The general contents required of NMPs are similar across states as well, but those pertaining to regulated animal operations include many elements (e.g., storage of animal waste, mortality composting) that are not applicable to cropland farms. The specific details of state NMP requirements, however, vary from state to state. Differences also exist within states for different land uses, including agronomic field crops versus container or out-of-ground agricultural production in MD, and P-based limitations for pasture versus cropland in PA. While the NRCS 590 practice standard (state or national version) may not be directly incorporated by reference in most of the regulations reviewed, elements of the practice standard (e.g., PI and P-based NM limitations) are often found in the regulations and program directors often identify the 590 practice standard as a guideline or source of acceptable elements of a NMP. Even if each state incorporated by reference the 590 practice standard to identify the basic requirements for NMPs, however, the quality of the supporting information required by the 590 practice standard (e.g., yield expectation data) can vary across the CB watershed, resulting in some differences in the execution of NMPs. An interim conservation practice for P/D agriculture exists in DE, but definitions were not found in the regulations for other CB states. Precision/decision agriculture is being adopted in various locations across the CB watershed, including nurseries and greenhouses in MD and the eastern panhandle of WV. The specific elements of P/D agriculture in these areas are not defined, however, with the exception that the nurseries and greenhouses in MD manage water carefully and have both N-based and P-based accounting systems. A definition of ENM could not be found in any of the regulations reviewed for this report. The concept or principles of ENM, however, were incorporated in limited ways in programs in MD, VA, and WV. Additional details regarding the applicability of state requirements, yield goal estimation, technical standards, and application of the PI can be found in subsequent sections of this report.
ALTERNATIVE DEFINITIONS In additional to the many individual suggestions and comments summarized in Table 3, there was one detailed proposal that suggested three new definitions for NM in place of the current suite in SB:
The new definitions attempt to provide categories of NM that are effective, practical, and accessible for a range of producers and management levels. Each practice has its own, stand-alone efficiency credit, so the practices are progressive, but not stackable.
1. Basic Nutrient Management: documentation of manure and fertilizer management activities identified in state risk assessment tools (such as a low risk rating in the AEM Tier II nutrient management worksheet) and demonstrating an animal density of 0.75 AU/acre or less. This practice would receive an efficiency credit at an equivalent level to the NM land use change in the current version of SB.
Application Management March 2014
Page D30
2. Enhanced Nutrient Management: implementation of the NRCS 590 nutrient management practice standard as defined in NYS. That is, following nutrient guidelines, including: (1) standard, realistic yield goals (per soil type); (2) credit for N sources (soil, sod, past manure, and current year applications); (3) P and K recommendations based on soil tests and the sufficiency method (not crop removal); (4) soil erosion controlled to T per RUSLE2; (5) fields assessed for leaching and runoff risk with conservative tools (N Leaching Index (NLI) and PI); etc. This revised ENM practice would receive an efficiency credit similar to the current efficiency values for ENM.
3. Enhanced Nutrient Management – Continuous Improvement: implementation of the NY NRCS 590 practice standard, plus on-going management to improve nutrient use efficiency beyond initial implementation, including tracking performance and managing manure and fertilizer according to tools such as ISNT, CSNT, Mass Nutrient Balance, etc. This practice would receive a higher efficiency credit than the value currently associated with ENM in SB.
Another interviewee submitted a draft technical note on adaptive management that could serve as a substitute for both P/D agriculture and ENM. This is included as Appendix B.
PRECISION/DECISION AGRICULTURE Interviewees were asked whether P/D agriculture was focused on N and/or P, and to describe any differences for cropland, pasture, or nurseries. One interviewee stated that precision agriculture needs to also be used on pastures but noted that pastures are rarely soil tested and the literature shows pastures to be very variable in nutrient levels. Some nursery crops are grown with a high degree of precision (water and nutrients). Precision/decision agriculture for cropland had multiple definitions, and several interviewees were basically satisfied with the default definition despite noting that it is vague. Most participants were not sure what decision agriculture was and often decision and precision agriculture were separated as they were defined. Some interviewees discussed precision agriculture in terms of geospatial tools and all nutrient inputs. Others defined precision agriculture as improving nutrient decisions through more precision or information with such tools as PSNT or tissue testing. The majority of interviewees stated that P/D agriculture applied to both N and P, but three interviewees said that P/D agriculture has been primarily focused on N. One of these two respondents attributed this to greater sensor availability for N. It is important to note that not all interviewees defined precision agriculture through geospatial technologies. One expert offered Adaptive Nutrient Management as an alternative to both P/D agriculture and ENM. This approach is described in Appendix B.
N-BASED RECOMMENDATIONS Interviewees were asked to describe how N recommendations are developed for crops in their state, program, or area. A description of the method for determining yield goals was also requested. Information on N recommendations and yield goals is presented in Table 4, with responses to survey/interview questions in black and additional information from state guidance or regulatory language in blue.
Application Management March 2014
Page D31
Interviewees generally agreed that N rates are determined based on yield goals. The source of the yield goal, however, can differ from state to state. Yield goals for some states are based on farmer records or experience whereas in other states yield goals are based on university-provided data. In some cases, university data are current and robust (e.g., Cornell University), but in other cases the published soil-based yield capabilities are as much as 30 years old (e.g., PSU) and not really useful today due in part to improved yields from genetics. It is important to recognize that productivity has been increasing over time, and that in the absence of a robust and current yield potential database, university recommendations are general recommendations rather than farm-specific recommendations. Two experts expressed a concern that the yield goal determination for specific plans is one of the weakest parts of the program, particularly when there is uncertainty as to whether the goal is based on actual records or optimism. In an effort to create greater consistency across the CB watershed, one interviewee had the following specific recommendation for the EP:
Pick one crop to document how nutrient decisions are made in all Bay states. Which states use sufficiency vs. crop removal for P and K recommendations? What do states do to capture carryover credit (“other N” – legumes, manure, etc.)? What are the nutrient recommendations and how are they made? What are the thresholds for reduced P application? What are the recommendations for P and K relative to each other across the CB? Would like to see more uniformity across the CB. Consider developing a table of state indicators and policies used in NM.
Application Management March 2014
Page D32
TABLE 4. METHODS FOR YIELD GOALS AND N RECOMMENDATIONS
State Method for N Recommendation Yield Goal Method
Delaware
N-based is applied strictly on the basis of yield goals and university recommendations.
The CAFO rule contains the following definition: “Realistic Yield Goals” means the expected crop yields based on the best four (4) out of seven (7) years of recorded data. Yield goals higher than the average require written justification from a certified nutrient consultant. Without actual crop yield data, use realistic yield goals in accordance with State Technical Standards (14 DE Reg. 482 (11/01/10) (Final)).
Title 3, Chapter 22 § 2247 of the Delaware Code (Nutrient Management) has the following statement regarding yield goal method: Expected yields based on best 4 out of 7 year data or, in the absence thereof, soil productivity charts.
Maryland
For crops grown a lot (e.g., corn, wheat, hay), N recommendation is based on yield goals, a direct function of yield goal. Yield and crop type are the primary consideration but MD also makes minor adjustments based on fertilizer type and management practices. Personal experience in MD indicates that farmers are at least making N decisions based on yield records. We do NOT have N uptake and use-efficiency data for the great majority (>500) of the ornamental species and cultivars grown in MD. Thus, our water and NM planning process was developed as a farm-scale risk assessment process, based primarily on NPK application rate (lbs/acre) and total plant density. NMP process was also based on BMP implementation on site, irrigation type, and the likelihood of operation producing runoff that leaves the site. COMAR 15-20-08 B. Nutrient rates of the primary nutrients shall be calculated for plant growth requirements of the crop based on one of the following: • UMD Plant or Crop Nutrient Recommendations, as provided in
the MNMM, or • Alternative standards, as provided in scientifically validated data
for the development of a NMP acceptable to the Department. A consultant or certified farm operator may recommend nutrient rates based on a single variety tissue sample when used in conjunction with a soil sample. For Container or Out-of-Ground Production, a certified NM consultant or certified farm operator shall make nutrient
Recommendations of yield potential are based on historic performance of farm or yield of similar soil type or county yields. Tech standards are based on UMD agronomic rate and timing recommendations. Yield goals are based on historic performance of farm. Originally allowed yield estimates based on soil types but now use yield history, based on 3 of 5 years. There are good research data on yields for crops grown the most (and with research money for studies). Added that yield goal determination for specific plans is one of the weakest parts of the program. The yield goal for the plan is usually taken from farmers’ words – no idea of how often they’re based on actual records vs. wishes. Using a farmer’s own records is by far the best approach to establish yield goals. State averages are not representative in a lot of cases, and using soil capability parameters is not accurate enough. COMAR 15-20-08 Expected Crop Yield or Production Goal. (1) The calculation of expected crop yield shall be based upon one of the following:
(a) An average of the 3 highest-yielding years for the crop out of the latest consecutive 5-year cropping sequence; or (b) If yield information exists for more than 5 years for a given field or management unit, crop yield calculations may be based on the average of 60 percent of the highest-yielding years for all consecutive years that crop yield information is available.
(2) If field or management unit-specific yield or plant production goal
Application Management March 2014
Page D33
State Method for N Recommendation Yield Goal Method recommendations based on at least one of the following: • Label recommendations on fertilizer products for the plants
being grown or similar plants; • UMD recommendations for plants being grown or for similar
plants; • Recommendation from other state universities for the specific
plants being grown or for similar plants; • The data from research done by accredited universities on the
specific plants being grown or similar plants; • The general nutrition guidelines for similar plants; or • Any generally accepted growing practices for plants under
comparable growing conditions.
information is unavailable or unrepresentative due to the inclusion of new seed varieties, irrigation, or new technologies, a consultant or certified farm operator shall use one of the following:
(a) Any soil productivity information; (b) The average yield based upon an average of the 3 highest-yielding years for the crop out of the latest consecutive 5-year cropping sequence from nearby fields or management units with similar soil type and management conditions; or (c) Any data acceptable to the Department.
New York
All crops of significance in NYS have N and P guidelines established by Cornell University. Crop nutrient guidelines are based on the sufficiency approach, developed through years of crop yield response studies, and not a crop removal approach. The guidelines account for nutrient availabilities and efficiencies throughout the soil/crop environment, so no blanket insurance factors exist.
Crop nutrient guidelines are based on a database of 600+ soil-specific yield potentials (not wishful yield goals) and soil test-based yield response studies.
Pennsylvania
Basic N recommendations in PA are based on crop yield goals supplied by the farmer. N recommendations are adjusted for manure and legumes. The PSNT can be used to further adjust N rates for corn at side-dressing time. Act 38 Regulations- Subchapter D. Nutrient Management Based on soil tests, the plan must include recommendations for the amount of N, P, and K necessary for realistic expected crop yields. If necessary based on the type of crops planned, the recommendations from the initial soil test shall be adjusted to determine the appropriate amount of nutrients necessary to achieve realistic expected crop yields. This adjustment may be satisfied by using the methodologies in the Soil Test Recommendations Handbook for Agronomic Crops published by the Pennsylvania State University Agricultural Analytical Services Laboratory. Other methodologies for this adjustment shall be approved by the Commission.
In our regulatory programs yield goals must be realistic for soils and climate and after the plan is implemented, the yield goal must be based on yield records and actual yields must be at least 80% of planned yields. Act 38 Regulations- Subchapter D. Nutrient Management § 83.292. Determination of nutrients needed for crop production. (a) The plan must include the acreage and realistic expected crop yields for each crop management unit. (b) For the development of the initial plan, expected crop yields may not exceed those considered realistic for the soil type and climatic conditions, as set by the operator and the specialist, and approved by the Commission or delegated conservation district (CD). If actual yield records are available during the development of the initial plan, the expected crop yields shall be based on these records. (c) If after the first 3 years of implementing the plan, the yields do not average at least 80% of the planned expected yield, the plan shall be
Application Management March 2014
Page D34
State Method for N Recommendation Yield Goal Method amended to be consistent with the documented yield levels unless sufficient justification for the use of the higher yields is approved by the Commission or delegated CD. (d) When determining expected crop yields for plan amendments, expected crop yields shall be based on documented yield levels achieved for the operation. Expected crop yields higher than historically achieved may be used if sufficient justification is approved by the Commission or delegated CD for the use of the higher yields.
Virginia
DCR tracks NM plans by crop type (880,000 acres) - the amount of corn, beans, alfalfa, and hay. Have specific rates for every crop. Most of the manure goes on row crops (corn, beans, small grain, cover crops – no fall application on cover crops, early spring application, trap crops in late fall/early winter if crop has reached growth stage 23. Need to withhold enough N to provide N as starter fertilizer. N-based plan uses soil management groups to set N rate. This probably reduces N application by 6-8%. Virginia Nutrient Management Standards and Criteria, (Revised 2005) • The results of soil testing labs approved by the Department must
be correlated to VT Mehlich I using provided table, and the provided conversion procedures. Only the VT soil test scale and the conversion of other approved labs to the VT soil test scale can be used to develop P and K recommendations when developing Virginia NMPs.
• N fertilizer recommendations are developed by identifying the soil productivity group for the crop to be grown in provided table, and selecting a recommended application rate from a provided list of various crops. P and K recommendations are determined based on a table of needs by crop, soil test level, and soil productivity group.
• Use the VT soil test rating (such as M+) to determine P and K recommendations from provided tables. If the soil test level is L, M, or H use the midpoint of the recommended nutrient
N-based yield-goals can be set from actual farm records or by using (primarily) the Virginia Agronomic Land Use Evaluation System (VALUES) Manual, which prescribes an achievable yield goal for a particular soil management group (e.g., soil type, wet, droughty, etc.). If farm records are used the producer would base the yield goal on the average of the best 3 of the previous 5 years. Virginia Nutrient Management Standards and Criteria, (Revised 2005) • When producer records are used to establish expected crop yields,
average the 3 highest yields achieved over the last 5 crop years the particular crop was grown in the field. The corresponding soil productivity group for the field is determined by finding the expected crop yield in provided table that is closest to the above determined yield. These yields must be adjusted to reflect standard moisture levels for grains and forages as indicated in provided table.
• When developing nutrient recommendations using VALUES, first determine the soil map units (soil series) within field boundaries from the soil survey maps of the subject farm. Using this information, the soil productivity group is determined from provided table for each crop to be grown.
• Using VALUES, the expected yield of a crop for any one field may be determined in one of two ways. If any single soil productivity group comprises 67% or more of a field, this is considered a predominant soil group, and it may be used to establish the expected yield for the entire field. The other method is to use a weighted average of all soil productivity groups to determine the expected yield and nutrient recommendations. If several map units make up a field representing multiple productivity groups, none of which account for 67% or more of the field, then the weighted
Application Management March 2014
Page D35
State Method for N Recommendation Yield Goal Method application range. If the soil test level is L-, M-, or H- use the highest value of the recommended nutrient application range. If the soil test level is L+, M+, or H+ use the lowest value of the recommended nutrient application range. Where there is only a single recommendation listed for any soil test rating use the same recommendation for any of the three soil test ratings.
• When using soil productivity groupings to determine expected yields, if a soil is listed in provided table as not suited (NS) for a particular crop, the farmer should be advised that the particular crop is not recommended to be grown on the soil. If the crop will still be grown in that soil type, use the lowest productivity group rating for that crop to determine the expected yield (i.e., if alfalfa will be grown on a soil listed as NS, then the planner would use productivity group III to determine nutrient application rates).
average method to determine the expected crop yield shall be used. • When using the weighted average method, determine expected crop
yield for each soil map unit from provided table, and determine the weighted average yield for the field by summing the fractional yields for each soil map unit. After the weighted average expected yield is calculated and any yield reductions are considered, the soil productivity group of the field is determined by finding the expected crop yield in provided table which is closest to the weighted average yield.
• To establish an expected yield for a soil series complex use a weighted average formula based on the percentages for each complex as specified in the county soil survey OR with percentages of 60%-40% for complexes with two named soils and 50%-30%-20% for complexes with three named soils. In complexes, the percentages shall be applied in descending order in the same order as the soils are denoted in the complex name.
• Once the expected yield for a crop is determined, a yield reduction will need to be applied if certain conditions exist within the soil profile such as eroded topsoil, slope, coarse fragments and rock outcrops.
West Virginia
Nutrient recommendations come from the 2005 VA standards, the PSU agronomy guide, or from the states Land Grant Institute. Title 47 Legislative Rule, Department Of Environmental Protection, Water Resources Both the linear and narrative approach specify that the factors that are terms of the NMP must include the realistic yield goal for each crop or use identified for each field; the N recommendations from sources specified by the Director for each crop or use identified for each field; credits for all N in the field that will be plant-available; and accounting for all other additions of plant-available N to the field. In addition, the terms include the form and source of manure, litter or process wastewater to be land-applied; the timing and method of land application; and the methodology by which the NMP accounts for the amount of N in the manure, litter, and process wastewater to be applied.
Yield goals come from farmer records (average of top 3 of last 5 years), soil surveys if they don’t have records, 2005 VA standards , the PSU agronomy guide, or from the states Land Grant Institute. Says farm records generally result in higher yield goals because soil survey figures do not account for improvements in soil quality (e.g., OM) which tend to raise yields. We use a soil productivity potential table that is identical to VA Nutrient Management Criteria 2005. A second table lists crops, forages and pasture with bu., tons or AU per acre Additional Comments from Interview: Soil productivity yield potential is set by soil type. They have a NM planning software program written by the same person who wrote it for VA. So, their approach is very similar to that of VA. Title 47 Legislative Rule, Department Of Environmental Protection, Water Resources No language found regarding method for determining realistic yield
Application Management March 2014
Page D36
State Method for N Recommendation Yield Goal Method goal.
Not State-Specific
One of the major challenges in using a yield-based approach for determining fertilizer rates is that yield levels are known to vary widely in a given environment from year to year, as well as among growing seasons within a year where multiple cropping is practiced. Crop responsiveness to fertilizer also fluctuates as a result of the environment, independent of crop yield potential. Both yield potential and crop responsiveness affect the annual fertilizer rate requirement. Other factors that are often considered along with yield potential to estimate plant nutrient demand are cropping system, soil productivity, and fertilizer to crop price ratios. Equations and models that predict crop yield and nutrient uptake are also being utilized to fine-tune N rate recommendations.
• A common approach to setting realistic yield goals is targeting 80% of the potential yield (with water and nutrients non-limiting) of a crop in a particular climatic condition. Crop simulation models can help determine potential yield.
• A value somewhere between an above average yield and a maximum yield that has been achieved recently on that specific field, or one of similar production and management history, could be set as the target yield.
• Setting a target of 10% above the 3 to 5-year average of crops not suffering a severe yield loss due to drought, excessive rainfall, or pests is also a commonly suggested method. This method requires that individual field records be maintained, and that only those fields of similar production potential be considered in making estimates. Rationale for using 10% above the 3 to 5-year average as the target is that there is an expectation that a person with that type of guideline is working to increase yield every year. Preference is for producers to do a regression projecting forward from their past 10 years to predict next year’s yield, but this isn’t simple because of weather factors. The 10% over the 3-5 year average approach is sort of more workable fudging of the regression approach.
• The yield goal being fertilized for does not necessarily limit yield in any given year to that level. Unusually favorable weather resulting in exceptional yields also often results in exceptional nutrient release from the soil or unusually high nutrient use efficiency.
Application Management March 2014
Page D37
STATE PROGRAM REQUIREMENTS FOR NUTRIENT MANAGEMENT Interviewees were asked to summarize the requirements for NM on agricultural lands in their state. Table 5 summarizes basic requirements for NMPs, including the thresholds (e.g., number of animal units) that trigger these requirements. Requirements for NMPs vary significantly among jurisdictions in the CB watershed. Nutrient management is currently required of CAFOs in all states. Some states, such as DE and MD require NM of essentially all animal operations, cropland, pasture, and nurseries. At the other end of the spectrum, WV requires NMPs only of permitted and large CAFOs. Most states have some capacity for voluntary NM, facilitated by state programs, required for voluntary participation in state or federal cost-share programs, or promoted through education and outreach. Some states have adopted their own extensive technical standards for NM into their regulations (e.g., DE, MD, PA), while others rely at least partially on the NRCS 590 practice standard (e.g., NY, WV). A synopsis of each CB state’s agricultural program as it pertains to NM is provided in Appendix A.
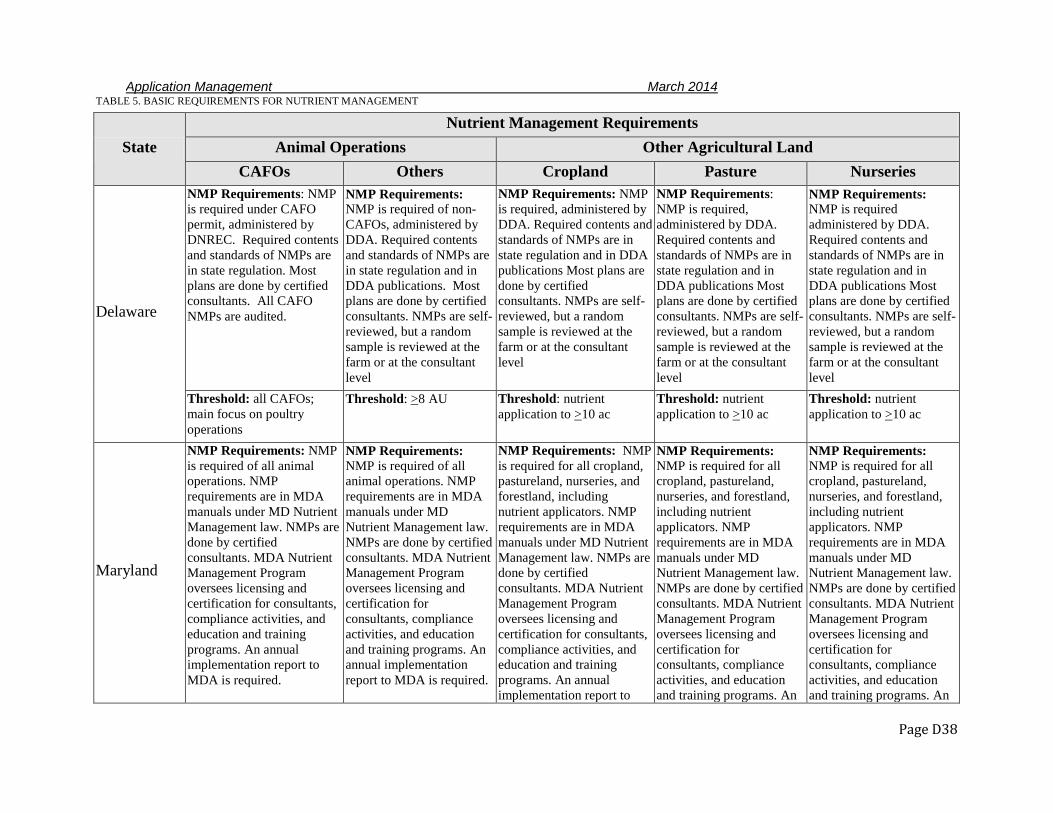
Application Management March 2014
Page D38
TABLE 5. BASIC REQUIREMENTS FOR NUTRIENT MANAGEMENT
State Nutrient Management Requirements
Animal Operations Other Agricultural Land CAFOs Others Cropland Pasture Nurseries
Delaware
NMP Requirements: NMP is required under CAFO permit, administered by DNREC. Required contents and standards of NMPs are in state regulation. Most plans are done by certified consultants. All CAFO NMPs are audited.
NMP Requirements: NMP is required of non-CAFOs, administered by DDA. Required contents and standards of NMPs are in state regulation and in DDA publications. Most plans are done by certified consultants. NMPs are self-reviewed, but a random sample is reviewed at the farm or at the consultant level
NMP Requirements: NMP is required, administered by DDA. Required contents and standards of NMPs are in state regulation and in DDA publications Most plans are done by certified consultants. NMPs are self-reviewed, but a random sample is reviewed at the farm or at the consultant level
NMP Requirements: NMP is required, administered by DDA. Required contents and standards of NMPs are in state regulation and in DDA publications Most plans are done by certified consultants. NMPs are self-reviewed, but a random sample is reviewed at the farm or at the consultant level
NMP Requirements: NMP is required administered by DDA. Required contents and standards of NMPs are in state regulation and in DDA publications Most plans are done by certified consultants. NMPs are self-reviewed, but a random sample is reviewed at the farm or at the consultant level
Threshold: all CAFOs; main focus on poultry operations
Threshold: >8 AU Threshold: nutrient application to >10 ac
Threshold: nutrient application to >10 ac
Threshold: nutrient application to >10 ac
Maryland
NMP Requirements: NMP is required of all animal operations. NMP requirements are in MDA manuals under MD Nutrient Management law. NMPs are done by certified consultants. MDA Nutrient Management Program oversees licensing and certification for consultants, compliance activities, and education and training programs. An annual implementation report to MDA is required.
NMP Requirements: NMP is required of all animal operations. NMP requirements are in MDA manuals under MD Nutrient Management law. NMPs are done by certified consultants. MDA Nutrient Management Program oversees licensing and certification for consultants, compliance activities, and education and training programs. An annual implementation report to MDA is required.
NMP Requirements: NMP is required for all cropland, pastureland, nurseries, and forestland, including nutrient applicators. NMP requirements are in MDA manuals under MD Nutrient Management law. NMPs are done by certified consultants. MDA Nutrient Management Program oversees licensing and certification for consultants, compliance activities, and education and training programs. An annual implementation report to
NMP Requirements: NMP is required for all cropland, pastureland, nurseries, and forestland, including nutrient applicators. NMP requirements are in MDA manuals under MD Nutrient Management law. NMPs are done by certified consultants. MDA Nutrient Management Program oversees licensing and certification for consultants, compliance activities, and education and training programs. An
NMP Requirements: NMP is required for all cropland, pastureland, nurseries, and forestland, including nutrient applicators. NMP requirements are in MDA manuals under MD Nutrient Management law. NMPs are done by certified consultants. MDA Nutrient Management Program oversees licensing and certification for consultants, compliance activities, and education and training programs. An
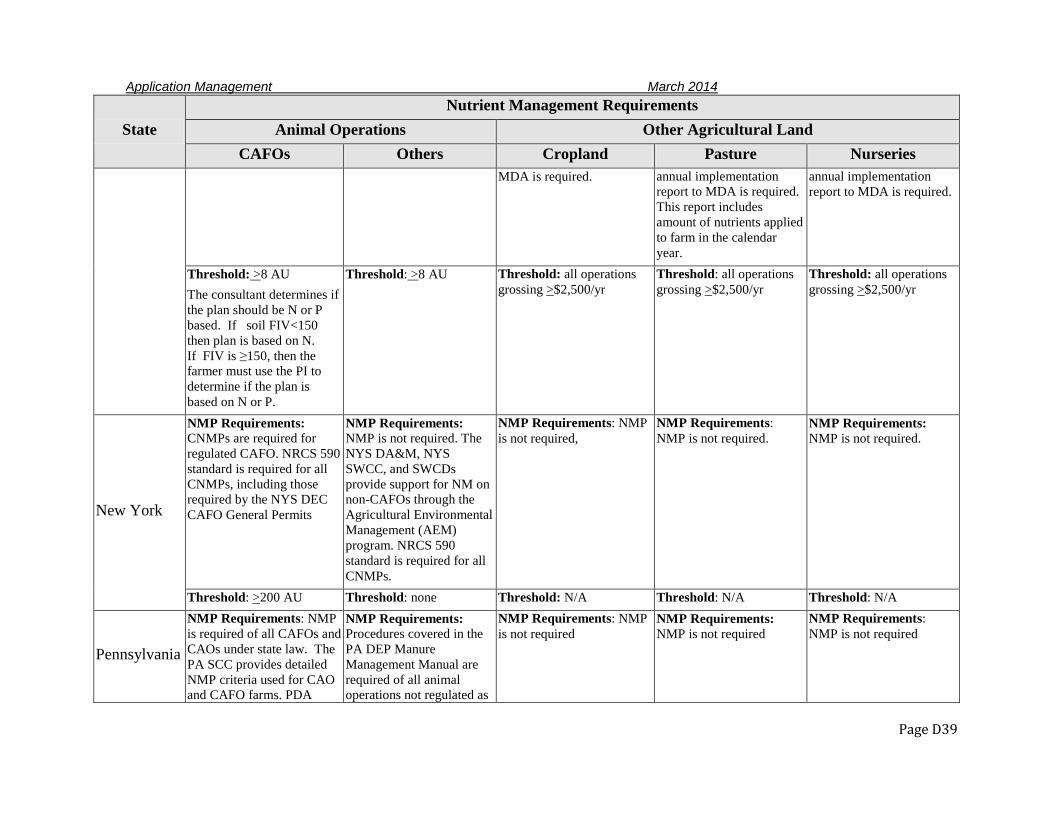
Application Management March 2014
Page D39
State Nutrient Management Requirements
Animal Operations Other Agricultural Land CAFOs Others Cropland Pasture Nurseries
MDA is required. annual implementation report to MDA is required. This report includes amount of nutrients applied to farm in the calendar year.
annual implementation report to MDA is required.
Threshold: >8 AU The consultant determines if the plan should be N or P based. If soil FIV<150 then plan is based on N. If FIV is ≥150, then the farmer must use the PI to determine if the plan is based on N or P.
Threshold: >8 AU Threshold: all operations grossing >$2,500/yr
Threshold: all operations grossing >$2,500/yr
Threshold: all operations grossing >$2,500/yr
New York
NMP Requirements: CNMPs are required for regulated CAFO. NRCS 590 standard is required for all CNMPs, including those required by the NYS DEC CAFO General Permits
NMP Requirements: NMP is not required. The NYS DA&M, NYS SWCC, and SWCDs provide support for NM on non-CAFOs through the Agricultural Environmental Management (AEM) program. NRCS 590 standard is required for all CNMPs.
NMP Requirements: NMP is not required,
NMP Requirements: NMP is not required.
NMP Requirements: NMP is not required.
Threshold: >200 AU Threshold: none Threshold: N/A Threshold: N/A Threshold: N/A
Pennsylvania
NMP Requirements: NMP is required of all CAFOs and CAOs under state law. The PA SCC provides detailed NMP criteria used for CAO and CAFO farms. PDA
NMP Requirements: Procedures covered in the PA DEP Manure Management Manual are required of all animal operations not regulated as
NMP Requirements: NMP is not required
NMP Requirements: NMP is not required
NMP Requirements: NMP is not required
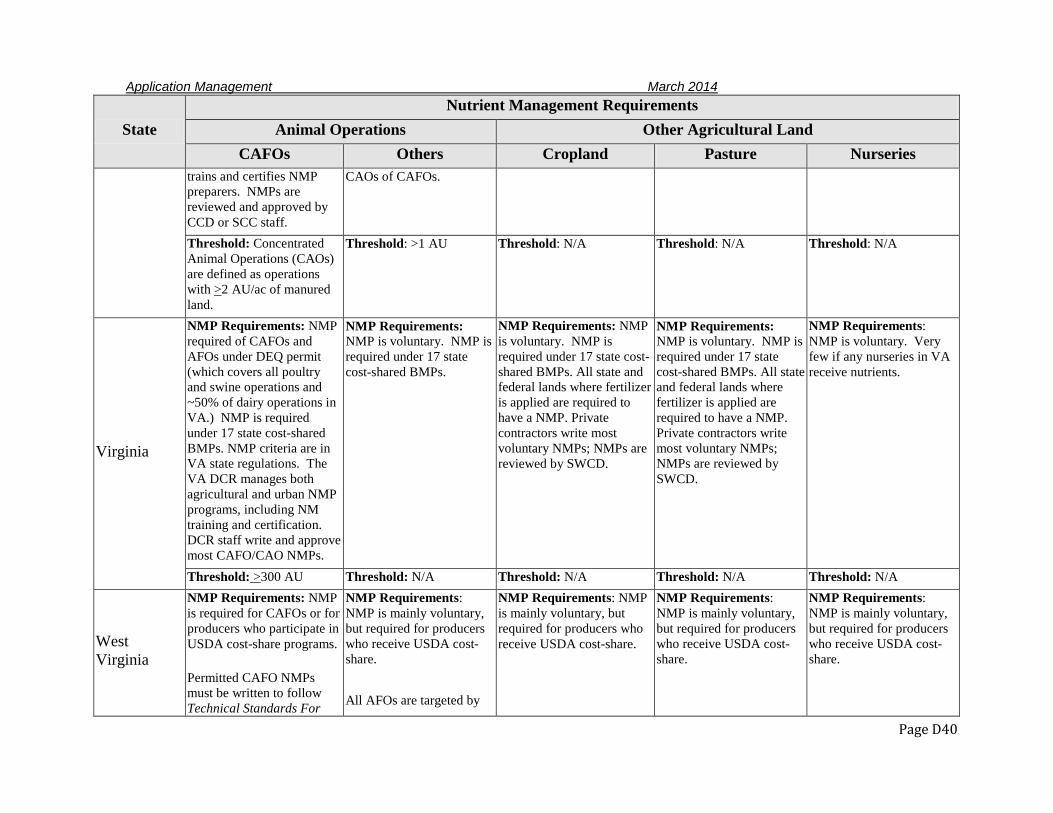
Application Management March 2014
Page D40
State Nutrient Management Requirements
Animal Operations Other Agricultural Land CAFOs Others Cropland Pasture Nurseries
trains and certifies NMP preparers. NMPs are reviewed and approved by CCD or SCC staff.
CAOs of CAFOs.
Threshold: Concentrated Animal Operations (CAOs) are defined as operations with >2 AU/ac of manured land.
Threshold: >1 AU Threshold: N/A Threshold: N/A Threshold: N/A
Virginia
NMP Requirements: NMP required of CAFOs and AFOs under DEQ permit (which covers all poultry and swine operations and ~50% of dairy operations in VA.) NMP is required under 17 state cost-shared BMPs. NMP criteria are in VA state regulations. The VA DCR manages both agricultural and urban NMP programs, including NM training and certification. DCR staff write and approve most CAFO/CAO NMPs.
NMP Requirements: NMP is voluntary. NMP is required under 17 state cost-shared BMPs.
NMP Requirements: NMP is voluntary. NMP is required under 17 state cost-shared BMPs. All state and federal lands where fertilizer is applied are required to have a NMP. Private contractors write most voluntary NMPs; NMPs are reviewed by SWCD.
NMP Requirements: NMP is voluntary. NMP is required under 17 state cost-shared BMPs. All state and federal lands where fertilizer is applied are required to have a NMP. Private contractors write most voluntary NMPs; NMPs are reviewed by SWCD.
NMP Requirements: NMP is voluntary. Very few if any nurseries in VA receive nutrients.
Threshold: >300 AU Threshold: N/A Threshold: N/A Threshold: N/A Threshold: N/A
West Virginia
NMP Requirements: NMP is required for CAFOs or for producers who participate in USDA cost-share programs.
Permitted CAFO NMPs must be written to follow Technical Standards For
NMP Requirements: NMP is mainly voluntary, but required for producers who receive USDA cost-share. All AFOs are targeted by
NMP Requirements: NMP is mainly voluntary, but required for producers who receive USDA cost-share.
NMP Requirements: NMP is mainly voluntary, but required for producers who receive USDA cost-share.
NMP Requirements: NMP is mainly voluntary, but required for producers who receive USDA cost-share.
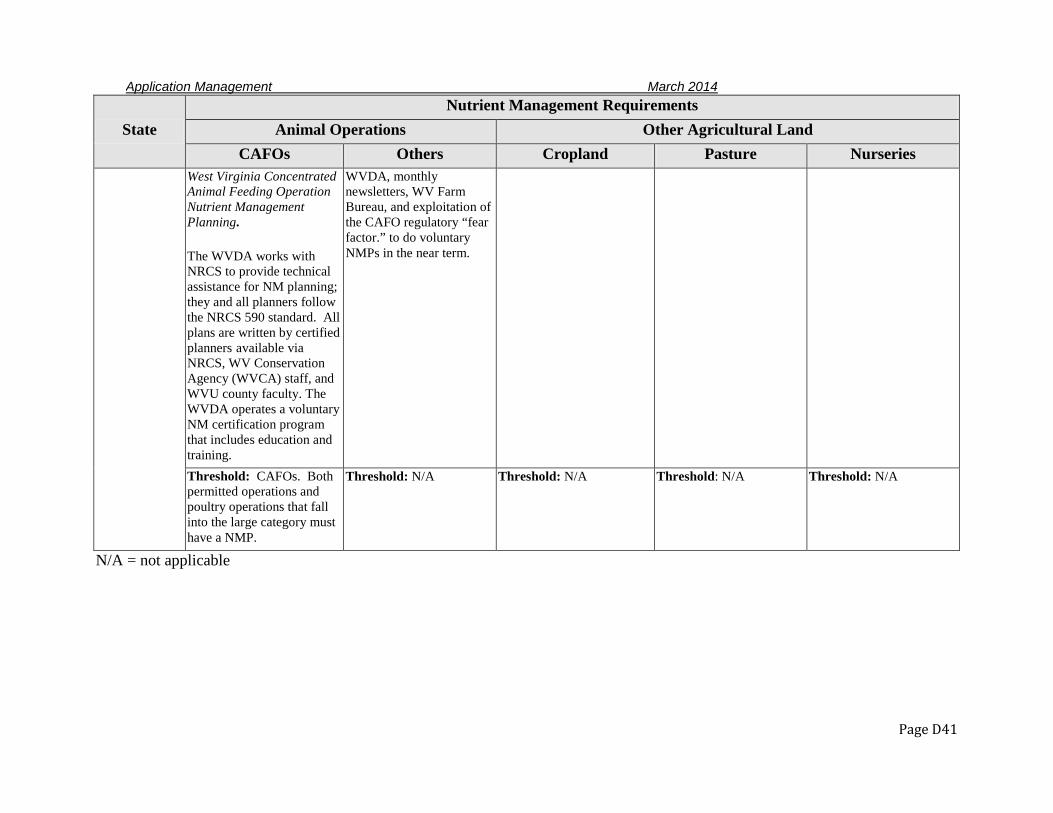
Application Management March 2014
Page D41
State Nutrient Management Requirements
Animal Operations Other Agricultural Land CAFOs Others Cropland Pasture Nurseries
West Virginia Concentrated Animal Feeding Operation Nutrient Management Planning.
The WVDA works with NRCS to provide technical assistance for NM planning; they and all planners follow the NRCS 590 standard. All plans are written by certified planners available via NRCS, WV Conservation Agency (WVCA) staff, and WVU county faculty. The WVDA operates a voluntary NM certification program that includes education and training.
WVDA, monthly newsletters, WV Farm Bureau, and exploitation of the CAFO regulatory “fear factor.” to do voluntary NMPs in the near term.
Threshold: CAFOs. Both permitted operations and poultry operations that fall into the large category must have a NMP.
Threshold: N/A Threshold: N/A Threshold: N/A Threshold: N/A
N/A = not applicable

Application Management March 2014
Page D42
GAPS IN PROGRAMS FOR NUTRIENT MANAGEMENT Interviewees were asked to identify any gaps in their overall programs to require or otherwise achieve NM on agricultural lands. Program gaps varied across the CB states. Authority to specifically address NM for inorganic nutrients is not explicitly defined in most CB states. In DE and MD, where NM is broadly required by statute, both organic and inorganic sources of nutrients come under NM requirements. Both NY and PA, however, lack authority to apply NM when only inorganic fertilizer nutrients are used, except under general discharge prohibitions and fertilizer labeling laws. Except in DE and MD, a full NMP is not required of small unregulated animal operations. NY, however, has the voluntary AEM program that is used by a majority of livestock operations in the state. PA recently included small AFOs in their MMM program, but this program does not require full-scale NM planning at the level required of large animal operations. Nurseries are not covered by NMP requirements in NY, PA, VA, or WV. Many interviewees considered the lack of verification, reporting, and tracking of voluntary NMPs in most CB states to be a significant gap in program coverage. Both DE and MD have formal programs that manage and track manure import/export among farm operations. However, such oversight does not exist in other CB states. One respondent stated that consideration of NM for pasture is a gap because NM planning (especially ENM and P/D agriculture) is less available to pasture than to cropland. Nitrogen availability on pasture is uncertain due to the high variability of OM distribution and mineralization and the lack of an effective soil N test for pasture as for corn (i.e., the PSNT has not been adapted to pasture/grass. No major gaps in application of NM to specific groups of people or land ownership categories were noted. MD NM regulations are crop-specific so do not differentiate on the basis of land ownership. Similarly, VA programs apply to the act of fertilizer application, regardless of land ownership status. One interviewee stated that the variability in the definitions of NM among the CB states contributes to significant gaps across the watershed and urged consistent definitions of NM and component practices among the states. Table 6 lists the significant gaps identified for each state.
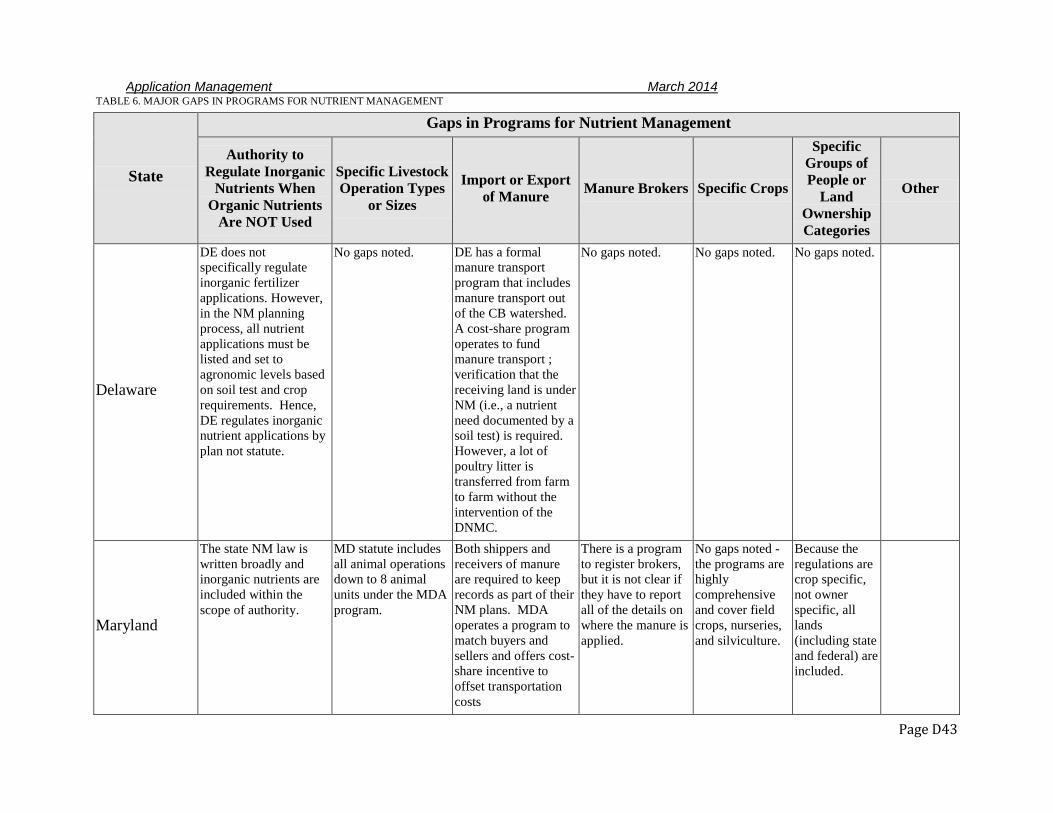
Application Management March 2014
Page D43
TABLE 6. MAJOR GAPS IN PROGRAMS FOR NUTRIENT MANAGEMENT
State
Gaps in Programs for Nutrient Management
Authority to Regulate Inorganic
Nutrients When Organic Nutrients
Are NOT Used
Specific Livestock Operation Types
or Sizes
Import or Export of Manure Manure Brokers Specific Crops
Specific Groups of People or
Land Ownership Categories
Other
Delaware
DE does not specifically regulate inorganic fertilizer applications. However, in the NM planning process, all nutrient applications must be listed and set to agronomic levels based on soil test and crop requirements. Hence, DE regulates inorganic nutrient applications by plan not statute.
No gaps noted. DE has a formal manure transport program that includes manure transport out of the CB watershed. A cost-share program operates to fund manure transport ; verification that the receiving land is under NM (i.e., a nutrient need documented by a soil test) is required. However, a lot of poultry litter is transferred from farm to farm without the intervention of the DNMC.
No gaps noted. No gaps noted. No gaps noted.
Maryland
The state NM law is written broadly and inorganic nutrients are included within the scope of authority.
MD statute includes all animal operations down to 8 animal units under the MDA program.
Both shippers and receivers of manure are required to keep records as part of their NM plans. MDA operates a program to match buyers and sellers and offers cost-share incentive to offset transportation costs
There is a program to register brokers, but it is not clear if they have to report all of the details on where the manure is applied.
No gaps noted - the programs are highly comprehensive and cover field crops, nurseries, and silviculture.
Because the regulations are crop specific, not owner specific, all lands (including state and federal) are included.
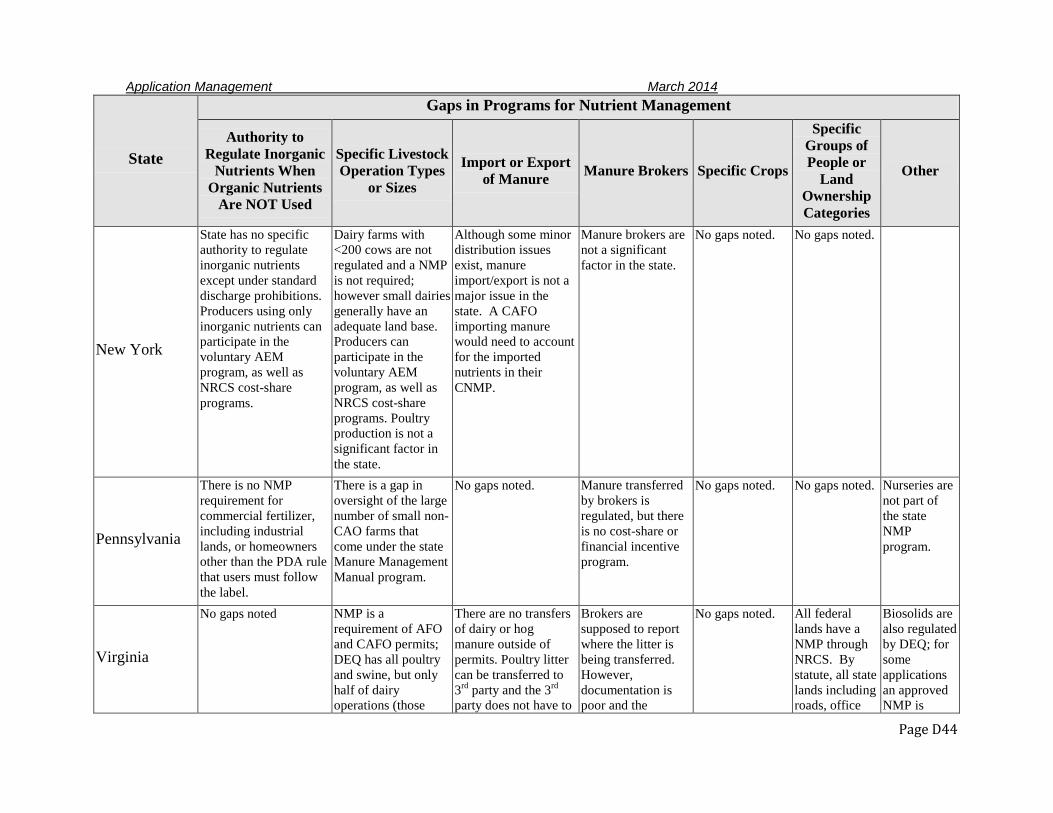
Application Management March 2014
Page D44
State
Gaps in Programs for Nutrient Management
Authority to Regulate Inorganic
Nutrients When Organic Nutrients
Are NOT Used
Specific Livestock Operation Types
or Sizes
Import or Export of Manure Manure Brokers Specific Crops
Specific Groups of People or
Land Ownership Categories
Other
New York
State has no specific authority to regulate inorganic nutrients except under standard discharge prohibitions. Producers using only inorganic nutrients can participate in the voluntary AEM program, as well as NRCS cost-share programs.
Dairy farms with <200 cows are not regulated and a NMP is not required; however small dairies generally have an adequate land base. Producers can participate in the voluntary AEM program, as well as NRCS cost-share programs. Poultry production is not a significant factor in the state.
Although some minor distribution issues exist, manure import/export is not a major issue in the state. A CAFO importing manure would need to account for the imported nutrients in their CNMP.
Manure brokers are not a significant factor in the state.
No gaps noted. No gaps noted.
Pennsylvania
There is no NMP requirement for commercial fertilizer, including industrial lands, or homeowners other than the PDA rule that users must follow the label.
There is a gap in oversight of the large number of small non-CAO farms that come under the state Manure Management Manual program.
No gaps noted. Manure transferred by brokers is regulated, but there is no cost-share or financial incentive program.
No gaps noted. No gaps noted. Nurseries are not part of the state NMP program.
Virginia
No gaps noted NMP is a requirement of AFO and CAFO permits; DEQ has all poultry and swine, but only half of dairy operations (those
There are no transfers of dairy or hog manure outside of permits. Poultry litter can be transferred to 3rd party and the 3rd party does not have to
Brokers are supposed to report where the litter is being transferred. However, documentation is poor and the
No gaps noted. All federal lands have a NMP through NRCS. By statute, all state lands including roads, office
Biosolids are also regulated by DEQ; for some applications an approved NMP is
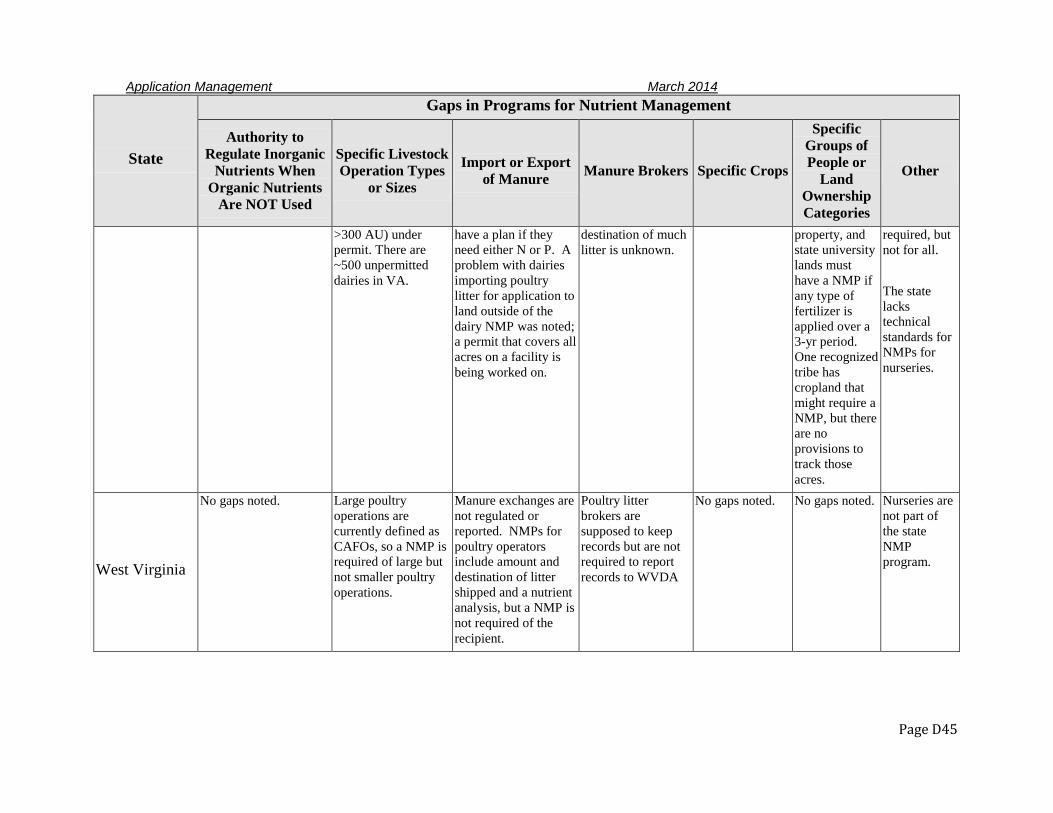
Application Management March 2014
Page D45
State
Gaps in Programs for Nutrient Management
Authority to Regulate Inorganic
Nutrients When Organic Nutrients
Are NOT Used
Specific Livestock Operation Types
or Sizes
Import or Export of Manure Manure Brokers Specific Crops
Specific Groups of People or
Land Ownership Categories
Other
>300 AU) under permit. There are ~500 unpermitted dairies in VA.
have a plan if they need either N or P. A problem with dairies importing poultry litter for application to land outside of the dairy NMP was noted; a permit that covers all acres on a facility is being worked on.
destination of much litter is unknown.
property, and state university lands must have a NMP if any type of fertilizer is applied over a 3-yr period. One recognized tribe has cropland that might require a NMP, but there are no provisions to track those acres.
required, but not for all. The state lacks technical standards for NMPs for nurseries.
West Virginia
No gaps noted. Large poultry operations are currently defined as CAFOs, so a NMP is required of large but not smaller poultry operations.
Manure exchanges are not regulated or reported. NMPs for poultry operators include amount and destination of litter shipped and a nutrient analysis, but a NMP is not required of the recipient.
Poultry litter brokers are supposed to keep records but are not required to report records to WVDA
No gaps noted. No gaps noted. Nurseries are not part of the state NMP program.
Application Management March 2014
Page D46
PROGRAM COORDINATION Interviewees were asked to describe any problems or concerns with NM program coordination. No interviewees expressed major issues with NM program coordination in their states. Coordination between DNREC and DNMC was reported to be the main feature of coordination of DE NM programs. The state Public Health department also serves on the DNMC to address issues of odor, flies, and other public health concerns. In NY, The NYS AEM program provides an umbrella for coordination of local, state, and federal partners and programs (both voluntary and regulatory) in terms of policy, cost-share funding, technical guidelines, conservation training, planner certification, and technical assistance All of the PA NM regulatory programs are said to be fully coordinated. All participants – PA DEP and PDA, PSU, NRCS, and SWCDs – have roles to play in state NM programs and everyone reportedly communicates well with each other. The PA state NM programs have benefited from consistent technical standards that apply to all programs. In VA, where DCR staff write 90% of all animal operation plans and private sector NM planners write 90% of all cost-shared NMPs, coordination among NRCS, DEQ, and Agriculture groups has been improving over the last two years. Differences in compliance concerns between animal operations (striving to avoid notice of violation from DEQ) and crop farmers (some participating only to obtain cost-share money and not implementing NMPs) are a challenge to coordination of NM efforts. In WV, coordination is mainly provided through WVDA working with NRCS to provide technical assistance for NM through the NRCS 590 practice standard. Some coordination is also accomplished through NRCS training of WVDA staff in use of RUSLE2 and through state requirements that NM planners obtain continuing education credits to maintain certification. Different state and federal agencies in WV offer trainings to receive CEUs.
NUTRIENT MANAGEMENT TECHNICAL STANDARDS Interviewees were asked to report whether they had technical standards or requirements in their states for NMPs on cropland, nurseries, and pasture. Where technical standards or requirements exist, they were asked to specify whether N-based NM, P-based NM, P/D agriculture, or ENM were specified. They were also asked to describe any differences in these requirements for cropland, nurseries, and pasture. Several states (DE, MD, and NY) apply the same technical standards for NM to cropland, pasture, and nurseries. The other states apply the same NM standards to cropland and pasture, but lack specific standards for nurseries. With the exception of WV, each of the CB states have adopted laws and regulations that contain most of their technical standards for NM. WV does have an accepted standard for permitted CAFOs. To some extent, all of the CB states include or reference the NRCS 590 practice standard in their NM technical standards. Interviewees from all of the CB states indicated that their technical standards do not themselves distinguish between N- and P-based NM, but use risk-based criteria (e.g., a PI or a soil test P level) to determine whether N- or P-based NM applies. In PA, for example, P-based NM is potentially triggered by a screening step in the PA PI that considers soil test P, proximity to water, and location in a special protection watershed. In general, ENM and P/D agriculture are not specifically part of state technical standards. These approaches are generally not specifically defined or widely used in most states, but are used in educational programs in some states. None of the interviewees commented on the likelihood that their state would adopt specific standards in the future where none exist today, nor on the likelihood of future standards requiring N-based, P-based, or ENM or P/D agriculture.
Application Management March 2014
Page D47
Some specific technical standards for NM for each state are presented in Appendix A. Table 7 summarizes the existence of technical standards or requirements for NM for each CB state.

Application Management March 2014
Page D48
TABLE 7. SUMMARY OF TECHNICAL STANDARDS OR REQUIREMENTS FOR NUTRIENT MANAGEMENT
State
Commodity Group Differences Across
Commodity Groups
Principal sources of state technical standards Notes
Cropland Pasture Nurseries
Delaware
Yes Yes Yes No differences • State regulations • NRCS 590 standard • DDA standards • UD Extension resources • DE PI
Because of the state’s history of high-P soils, most of the focus is on P and standards have been developed. However, no technical standards exist for N; N-based is applied strictly on the basis of yield goals and university recommendations. If the FIV is greater than 150, producer is required to conduct a PI assessment, the results of which determine if application can be N-based vs. P-based vs. no P
Maryland
Yes Yes Yes No differences • State regulations • Maryland Nutrient
Management: Consultant’s Resource Notebook
• MD PI
The state regulatory program requires both N and P to be addressed. The PI is used as risk assessment tool. An FIV >150 triggers the need for a P loss assessment using the PI. If FIV <150, N-based NM is allowed. ENM and P/D agriculture are not part of how MDA regulates, but are part of the education/promotion aspect of program.
New York
Yes Yes Yes No differences • NY General CAFO permit • NYS DEC Agricultural
Environmental Management Program
• NRCS 312 and 590 standards
All NM is based on the NRCS 590 standard and Cornell University crop and manure management guidelines.
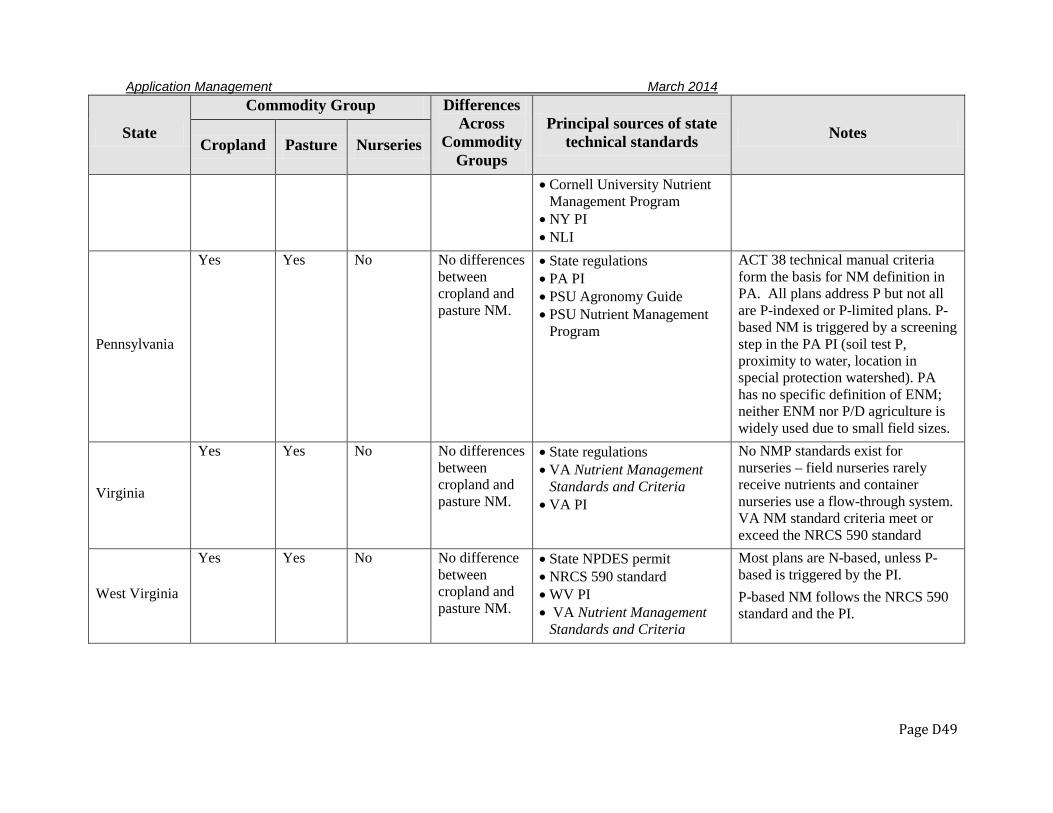
Application Management March 2014
Page D49
State
Commodity Group Differences Across
Commodity Groups
Principal sources of state technical standards Notes
Cropland Pasture Nurseries
• Cornell University Nutrient Management Program
• NY PI • NLI
Pennsylvania
Yes Yes No No differences between cropland and pasture NM.
• State regulations • PA PI • PSU Agronomy Guide • PSU Nutrient Management
Program
ACT 38 technical manual criteria form the basis for NM definition in PA. All plans address P but not all are P-indexed or P-limited plans. P-based NM is triggered by a screening step in the PA PI (soil test P, proximity to water, location in special protection watershed). PA has no specific definition of ENM; neither ENM nor P/D agriculture is widely used due to small field sizes.
Virginia
Yes Yes No No differences between cropland and pasture NM.
• State regulations • VA Nutrient Management
Standards and Criteria • VA PI
No NMP standards exist for nurseries – field nurseries rarely receive nutrients and container nurseries use a flow-through system. VA NM standard criteria meet or exceed the NRCS 590 standard
West Virginia
Yes Yes No No difference between cropland and pasture NM.
• State NPDES permit • NRCS 590 standard • WV PI • VA Nutrient Management
Standards and Criteria
Most plans are N-based, unless P-based is triggered by the PI. P-based NM follows the NRCS 590 standard and the PI.
Application Management March 2014
Page D50
PROCESS AND CRITERIA FOR DETERMINING LEVEL OF NUTRIENT MANAGEMENT REQUIRED While Table 7 identifies whether technical standards or criteria exist for various commodity groups, it sheds no light on how these standards or requirements are applied in the field. Interviewees were asked to specify the set of criteria or circumstances used to determine requirements for N-based, P-based, P/D, ENM in their states. One specific type of risk assessment commonly performed involves application of a PI. Each of the CB states has developed its own PI and the risk assessments are used in different ways. In many of the CB states, a PI is used to make the choice between N-based and P-based NM. In MD and DE, for example, if soil fertility exceeds a threshold value, the PI must be used to determine if a NMP is P-based or N-based. In PA, a preliminary PI screening determines the presence of risk of P loss to a water body and the outcome of the main PI determines P application restrictions. In NY, the PI is used to assess risk for winter manure application, as well as to guide selection of N-based vs. P-based NM. Most tree farms and in-ground nurseries in the CB are believed to use a PI. Interviewees expressed some concerns about the variability of application of the PI to NM in the CB watershed. Some respondents noted that the differences between the state PIs can result in significantly different recommendations for the same set of circumstances and that these disparities need to be evaluated, particularly with respect to how they are accounted for in the Bay model. Several interviewees stated that the PI sometimes allows farmers to replace the nutrients removed by their crops each year even in very high-P soils as long as the risk assessed by the PI permits P to be added. This contributes to continual buildup of P in soils. The VA PI, for example, allows application of 1.5 times crop-removal P even under some High risk conditions. The MD PI also allows P application even in the High risk range soil test; it was noted that even though most MD animal operations apply the PI, only about 4% of the risk assessments disallow additional P application. Such results do not appear to represent true P-based NM. With dairy manure, the added cost of fertilizer N may encourage continued manure application to supply N even if no P is needed. Several interviewees noted that work is needed on how the PI is interpreted. There are states with PIs that will never recommend zero P application, no matter how high the soil test P. A difference between agronomic and environmental thresholds was noted and it was asserted that a PI needs to be able to restrict P application in some set of circumstances to have an environmental benefit. An overview of the characterization and computation of state PIs in the CB states is found in Tables 8 and 9 respectively. It is important to note that many CB state PIs are in a state of flux at present. The WV PI is currently under revision. UMD is revising the MD PI to better deal with transport processes; any transport pathway can be limiting for nutrient application. Use of soil P saturation is under consideration in PA. The revision of the national NRCS 590 practice standard in January, 2012 is giving impetus to broader revision of the PI.
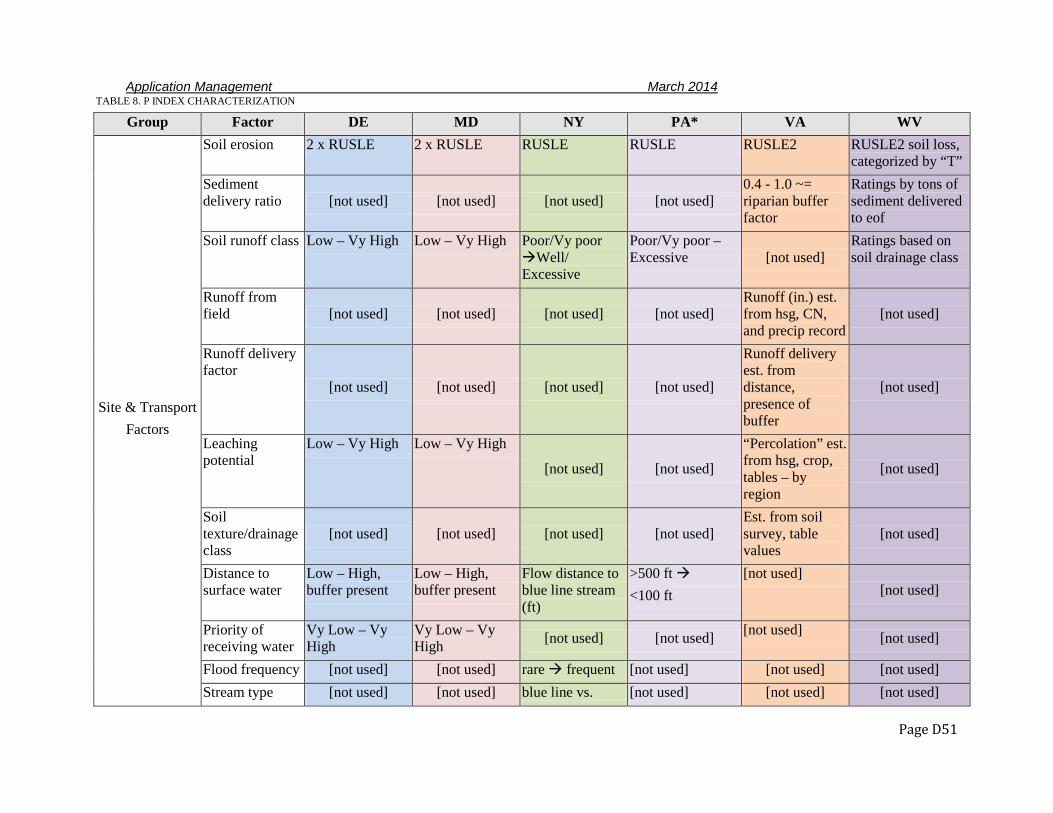
Application Management March 2014
Page D51
TABLE 8. P INDEX CHARACTERIZATION
Group Factor DE MD NY PA* VA WV
Site & Transport Factors
Soil erosion 2 x RUSLE 2 x RUSLE RUSLE RUSLE RUSLE2 RUSLE2 soil loss, categorized by “T”
Sediment delivery ratio [not used] [not used] [not used] [not used]
0.4 - 1.0 ~= riparian buffer factor
Ratings by tons of sediment delivered to eof
Soil runoff class Low – Vy High Low – Vy High Poor/Vy poor Well/ Excessive
Poor/Vy poor –Excessive [not used]
Ratings based on soil drainage class
Runoff from field [not used] [not used] [not used] [not used]
Runoff (in.) est. from hsg, CN, and precip record
[not used]
Runoff delivery factor
[not used] [not used] [not used] [not used]
Runoff delivery est. from distance, presence of buffer
[not used]
Leaching potential
Low – Vy High Low – Vy High
[not used] [not used]
“Percolation” est. from hsg, crop, tables – by region
[not used]
Soil texture/drainage class
[not used] [not used] [not used] [not used] Est. from soil survey, table values
[not used]
Distance to surface water
Low – High, buffer present
Low – High, buffer present
Flow distance to blue line stream (ft)
>500 ft <100 ft
[not used] [not used]
Priority of receiving water
Vy Low – Vy High
Vy Low – Vy High [not used] [not used] [not used] [not used]
Flood frequency [not used] [not used] rare frequent [not used] [not used] [not used] Stream type [not used] [not used] blue line vs. [not used] [not used] [not used]
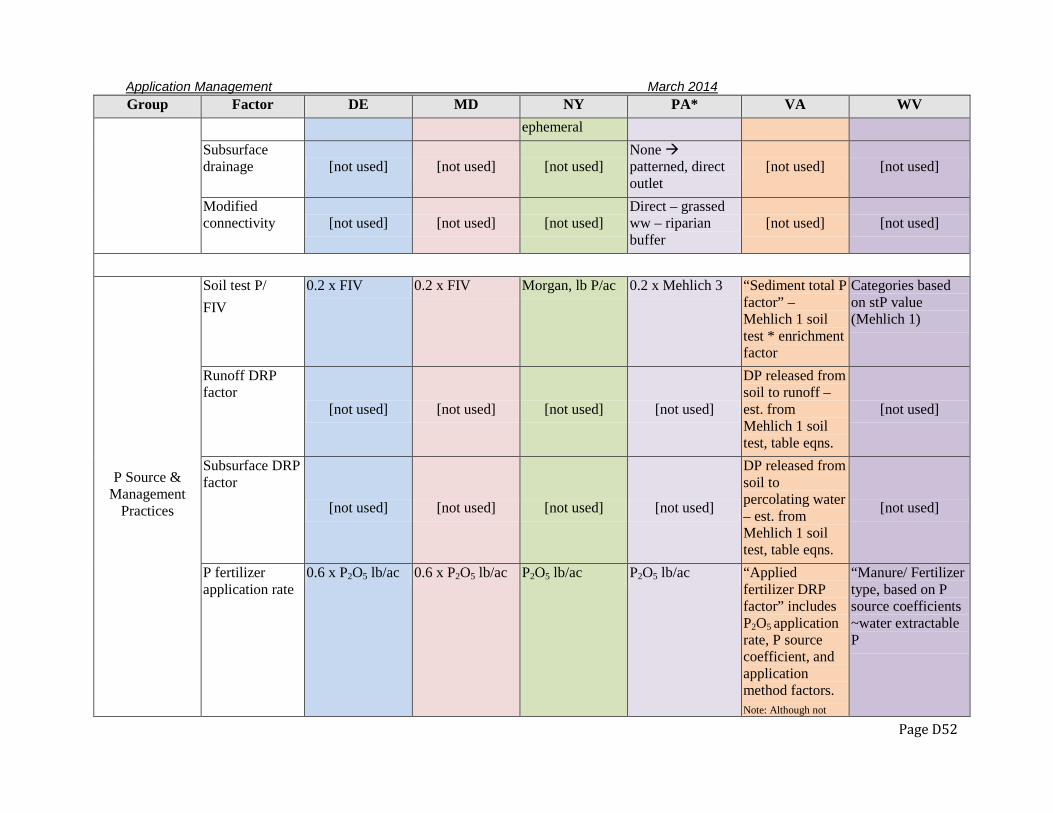
Application Management March 2014
Page D52
Group Factor DE MD NY PA* VA WV ephemeral
Subsurface drainage [not used] [not used] [not used]
None patterned, direct outlet
[not used] [not used]
Modified connectivity [not used] [not used] [not used]
Direct – grassed ww – riparian buffer
[not used] [not used]
P Source & Management
Practices
Soil test P/ FIV
0.2 x FIV 0.2 x FIV Morgan, lb P/ac 0.2 x Mehlich 3 “Sediment total P factor” – Mehlich 1 soil test * enrichment factor
Categories based on stP value (Mehlich 1)
Runoff DRP factor
[not used] [not used] [not used] [not used]
DP released from soil to runoff – est. from Mehlich 1 soil test, table eqns.
[not used]
Subsurface DRP factor
[not used] [not used] [not used] [not used]
DP released from soil to percolating water – est. from Mehlich 1 soil test, table eqns.
[not used]
P fertilizer application rate
0.6 x P2O5 lb/ac 0.6 x P2O5 lb/ac P2O5 lb/ac P2O5 lb/ac “Applied fertilizer DRP factor” includes P2O5 application rate, P source coefficient, and application method factors. Note: Although not
“Manure/ Fertilizer type, based on P source coefficients ~water extractable P

Application Management March 2014
Page D53
Group Factor DE MD NY PA* VA WV explicit in tech guide, VA PI Spreadsheet appears to accept many kinds of fertilizer applications (including manure of different types and inorganic fertilizer)
P fertilizer application method
Injected surface applied
Injected surface applied
Injected surface applied
Injected surface applied
[combined with fertilizer DRP factor]
Injected surface applied
P fertilizer application timing
[combined with method]
[combined with method]
May-Aug Feb-Apr [not used] [not used]
[part of app method rating]
Organic P source application rate
Avail. Coeff x P2O5 lb/ac
PSC x Varies by type of organic source; function of water extractable P
P2O5 lb/ac
P2O5 lb/ac Has capacity to describe two separate organic P applications, re: rate, method, and timing
P2O5 lb/ac Has page to enter multiple capacity to describe two separate organic P applications, re: rate and method
[not used]
[not treated separately from fertilizer]
Organic P source application method
Injected surface applied
Injected surface applied
Injected surface applied
Injected surface applied [not used]
[not treated separately from fertilizer]
Organic P source application timing
[combined with method]
[combined with method]
May-Aug Feb-Apr [not used] [not used]
[not treated separately from fertilizer]
P source coefficient [not used]
[see above under appl. rate] [not used]
0.4 – 1.0, depends on manure type
[see above under applied fert DRP factor]
[see above under application rate]
*In PA, the requirement to use the main PI does not apply unless: (1) special protection watershed; (2) significant farm management change; (3) soil test >200; and (4) distance to water <150 ft
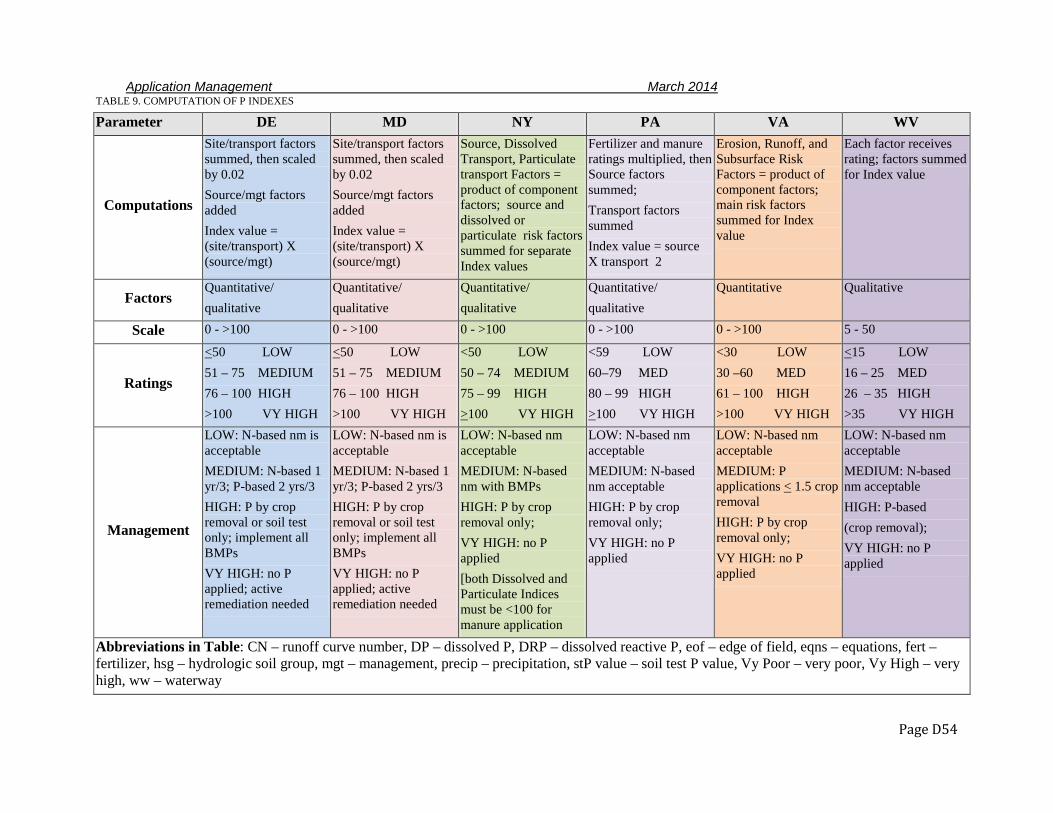
Application Management March 2014
Page D54
TABLE 9. COMPUTATION OF P INDEXES
Parameter DE MD NY PA VA WV
Computations
Site/transport factors summed, then scaled by 0.02 Source/mgt factors added Index value = (site/transport) X (source/mgt)
Site/transport factors summed, then scaled by 0.02 Source/mgt factors added Index value = (site/transport) X (source/mgt)
Source, Dissolved Transport, Particulate transport Factors = product of component factors; source and dissolved or particulate risk factors summed for separate Index values
Fertilizer and manure ratings multiplied, then Source factors summed; Transport factors summed Index value = source X transport 2
Erosion, Runoff, and Subsurface Risk Factors = product of component factors; main risk factors summed for Index value
Each factor receives rating; factors summed for Index value
Factors Quantitative/ qualitative
Quantitative/ qualitative
Quantitative/ qualitative
Quantitative/ qualitative
Quantitative Qualitative
Scale 0 - >100 0 - >100 0 - >100 0 - >100 0 - >100 5 - 50
Ratings
<50 LOW 51 – 75 MEDIUM 76 – 100 HIGH >100 VY HIGH
<50 LOW 51 – 75 MEDIUM 76 – 100 HIGH >100 VY HIGH
<50 LOW 50 – 74 MEDIUM 75 – 99 HIGH >100 VY HIGH
<59 LOW 60–79 MED 80 – 99 HIGH >100 VY HIGH
<30 LOW 30 –60 MED 61 – 100 HIGH >100 VY HIGH
<15 LOW 16 – 25 MED 26 – 35 HIGH >35 VY HIGH
Management
LOW: N-based nm is acceptable MEDIUM: N-based 1 yr/3; P-based 2 yrs/3 HIGH: P by crop removal or soil test only; implement all BMPs VY HIGH: no P applied; active remediation needed
LOW: N-based nm is acceptable MEDIUM: N-based 1 yr/3; P-based 2 yrs/3 HIGH: P by crop removal or soil test only; implement all BMPs VY HIGH: no P applied; active remediation needed
LOW: N-based nm acceptable MEDIUM: N-based nm with BMPs HIGH: P by crop removal only; VY HIGH: no P applied [both Dissolved and Particulate Indices must be <100 for manure application
LOW: N-based nm acceptable MEDIUM: N-based nm acceptable HIGH: P by crop removal only; VY HIGH: no P applied
LOW: N-based nm acceptable MEDIUM: P applications < 1.5 crop removal HIGH: P by crop removal only; VY HIGH: no P applied
LOW: N-based nm acceptable MEDIUM: N-based nm acceptable HIGH: P-based (crop removal); VY HIGH: no P applied
Abbreviations in Table: CN – runoff curve number, DP – dissolved P, DRP – dissolved reactive P, eof – edge of field, eqns – equations, fert – fertilizer, hsg – hydrologic soil group, mgt – management, precip – precipitation, stP value – soil test P value, Vy Poor – very poor, Vy High – very high, ww – waterway
Application Management March 2014
Page D55
PREPARATION, REVIEW, APPROVAL, TRACKING, VERIFICATION AND REPORTING OF NUTRIENT MANAGEMENT PLANS Interviewees were asked several questions about the preparation, review, approval, tracking, verification, and reporting of NMPs in their states or otherwise within their program scope. Table 10 identifies the parties responsible for the various stages of the NM planning and implementation process. A summary of findings is presented below. All the states require submission, approval, and tracking of large CAFO NMPs as part of their NPDES permitting processes, and where federal cost sharing is available, approval and tracking is done by NRCS and the CDs. Only MD and DE require formal NMPs for manure and fertilizer on all cropland, pastures, and nurseries. Pennsylvania changed its law in 2011 to require NMPs for all farms that use or generate manure or have animals at a density of 2 AU/ac. This change requires an additional 39,000 small farms to have NMPs, although the plan writers for the small farms need not be certified, and there is no submittal or approval process. Currently there are very few permitted CAFOs in WV. Most poultry operations in WV already have voluntary plans, written by WVDA or by the poultry companies. Currently there is no approval, review, or tracking process to support the program. Maryland and DE require virtually all users of fertilizer and/or manure to have a NMP prepared by a certified planner and to report annually (AIRs) on the amount of nutrients applied. Virginia, PA, and NY require certified NMPs for all manure systems that receive public money. Although certified planners must approve everything in MD, plans generally are developed in consultation with fertilizer dealers. This is likely to be true in other states as well. The approval processes in the states focus on certification, training, and review of professional planners. Most states run their own training and certification programs, often in conjunction with certified crop advisor (CCA) programs or with NRCS technical service provider (TSP) training. Except for large CAFOs, NMPs are not reviewed or approved by the states Tracking and verification of NMPs is variable across the region. Maryland and DE conduct on-farm QA/QC visits to inspect the planning and implementation of a small sample of farms. Pennsylvania visits all CAFOs annually, and Virginia visits farms on a 3-year rotation as plans are redone. New York’s extensive voluntary AEM program, coordinated by the Upper Susquehanna Coalition (USC), uses an assessment system that includes one-on-one visits and consultation by an environmental professional housed in a SWCD. Virginia tracks all NMPs by GIS, keeping track of beginning and ending dates for all plans. Voluntary programs are not significant in MD and DE as virtually all users of manure or fertilizer are under the mandatory programs. West Virginia is almost entirely voluntary, with NMPs provided to poultry operators by WVDA. New York has a voluntary AEM program, and PA has a large number of farms with NM planning requirement but no verification.
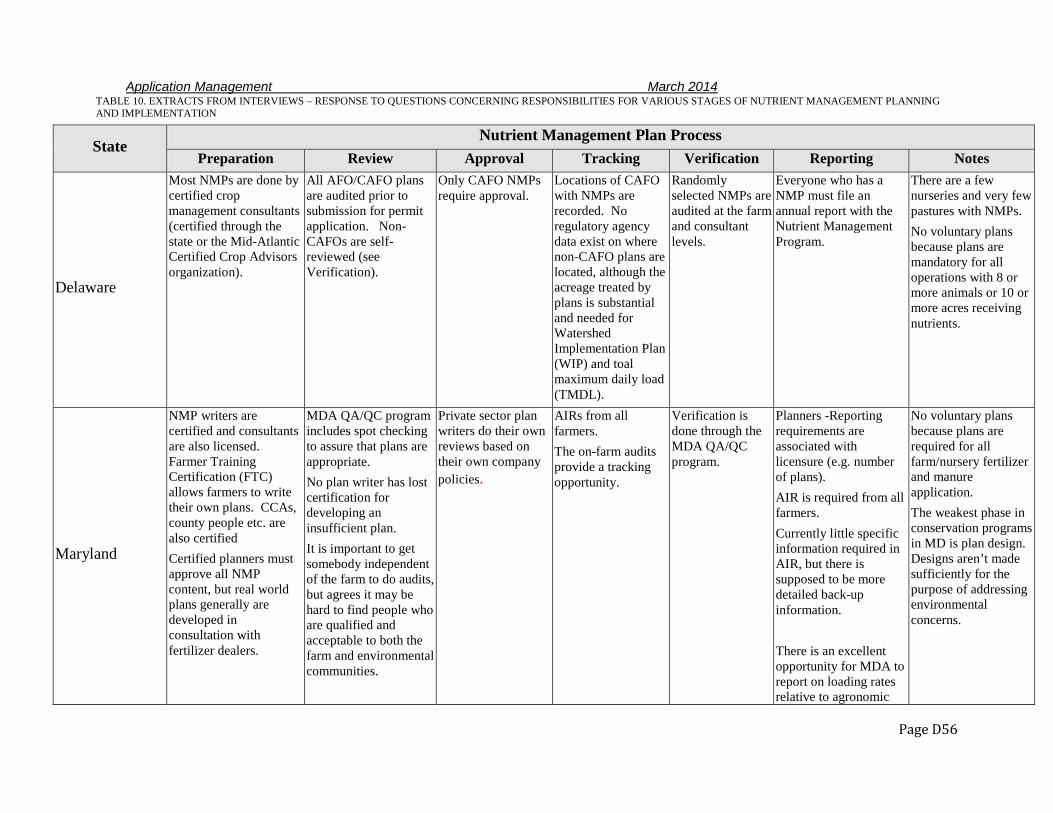
Application Management March 2014
Page D56
TABLE 10. EXTRACTS FROM INTERVIEWS – RESPONSE TO QUESTIONS CONCERNING RESPONSIBILITIES FOR VARIOUS STAGES OF NUTRIENT MANAGEMENT PLANNING AND IMPLEMENTATION
State Nutrient Management Plan Process
Preparation Review Approval Tracking Verification Reporting Notes
Delaware
Most NMPs are done by certified crop management consultants (certified through the state or the Mid-Atlantic Certified Crop Advisors organization).
All AFO/CAFO plans are audited prior to submission for permit application. Non-CAFOs are self-reviewed (see Verification).
Only CAFO NMPs require approval.
Locations of CAFO with NMPs are recorded. No regulatory agency data exist on where non-CAFO plans are located, although the acreage treated by plans is substantial and needed for Watershed Implementation Plan (WIP) and toal maximum daily load (TMDL).
Randomly selected NMPs are audited at the farm and consultant levels.
Everyone who has a NMP must file an annual report with the Nutrient Management Program.
There are a few nurseries and very few pastures with NMPs. No voluntary plans because plans are mandatory for all operations with 8 or more animals or 10 or more acres receiving nutrients.
Maryland
NMP writers are certified and consultants are also licensed. Farmer Training Certification (FTC) allows farmers to write their own plans. CCAs, county people etc. are also certified Certified planners must approve all NMP content, but real world plans generally are developed in consultation with fertilizer dealers.
MDA QA/QC program includes spot checking to assure that plans are appropriate. No plan writer has lost certification for developing an insufficient plan. It is important to get somebody independent of the farm to do audits, but agrees it may be hard to find people who are qualified and acceptable to both the farm and environmental communities.
Private sector plan writers do their own reviews based on their own company policies.
AIRs from all farmers. The on-farm audits provide a tracking opportunity.
Verification is done through the MDA QA/QC program.
Planners -Reporting requirements are associated with licensure (e.g. number of plans). AIR is required from all farmers. Currently little specific information required in AIR, but there is supposed to be more detailed back-up information. There is an excellent opportunity for MDA to report on loading rates relative to agronomic
No voluntary plans because plans are required for all farm/nursery fertilizer and manure application. The weakest phase in conservation programs in MD is plan design. Designs aren’t made sufficiently for the purpose of addressing environmental concerns.
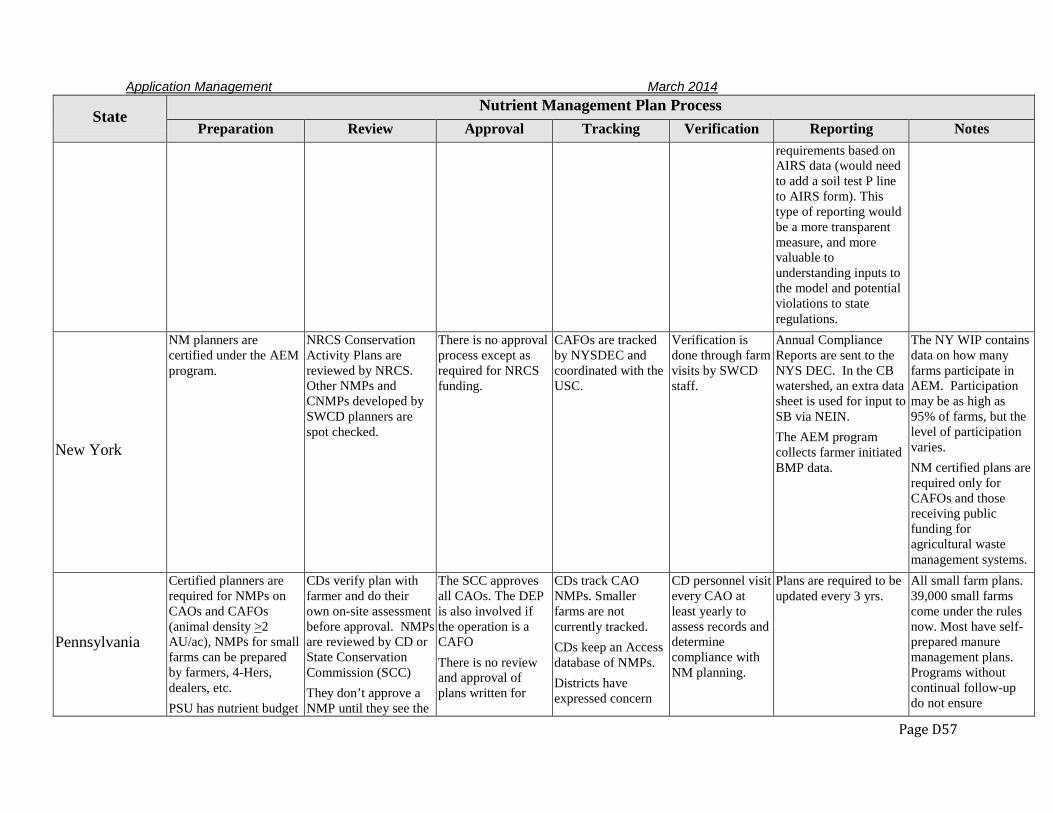
Application Management March 2014
Page D57
State Nutrient Management Plan Process
Preparation Review Approval Tracking Verification Reporting Notes requirements based on AIRS data (would need to add a soil test P line to AIRS form). This type of reporting would be a more transparent measure, and more valuable to understanding inputs to the model and potential violations to state regulations.
New York
NM planners are certified under the AEM program.
NRCS Conservation Activity Plans are reviewed by NRCS. Other NMPs and CNMPs developed by SWCD planners are spot checked.
There is no approval process except as required for NRCS funding.
CAFOs are tracked by NYSDEC and coordinated with the USC.
Verification is done through farm visits by SWCD staff.
Annual Compliance Reports are sent to the NYS DEC. In the CB watershed, an extra data sheet is used for input to SB via NEIN. The AEM program collects farmer initiated BMP data.
The NY WIP contains data on how many farms participate in AEM. Participation may be as high as 95% of farms, but the level of participation varies. NM certified plans are required only for CAFOs and those receiving public funding for agricultural waste management systems.
Pennsylvania
Certified planners are required for NMPs on CAOs and CAFOs (animal density >2 AU/ac), NMPs for small farms can be prepared by farmers, 4-Hers, dealers, etc. PSU has nutrient budget
CDs verify plan with farmer and do their own on-site assessment before approval. NMPs are reviewed by CD or State Conservation Commission (SCC) They don’t approve a NMP until they see the
The SCC approves all CAOs. The DEP is also involved if the operation is a CAFO There is no review and approval of plans written for
CDs track CAO NMPs. Smaller farms are not currently tracked. CDs keep an Access database of NMPs. Districts have expressed concern
CD personnel visit every CAO at least yearly to assess records and determine compliance with NM planning.
Plans are required to be updated every 3 yrs.
All small farm plans. 39,000 small farms come under the rules now. Most have self-prepared manure management plans. Programs without continual follow-up do not ensure
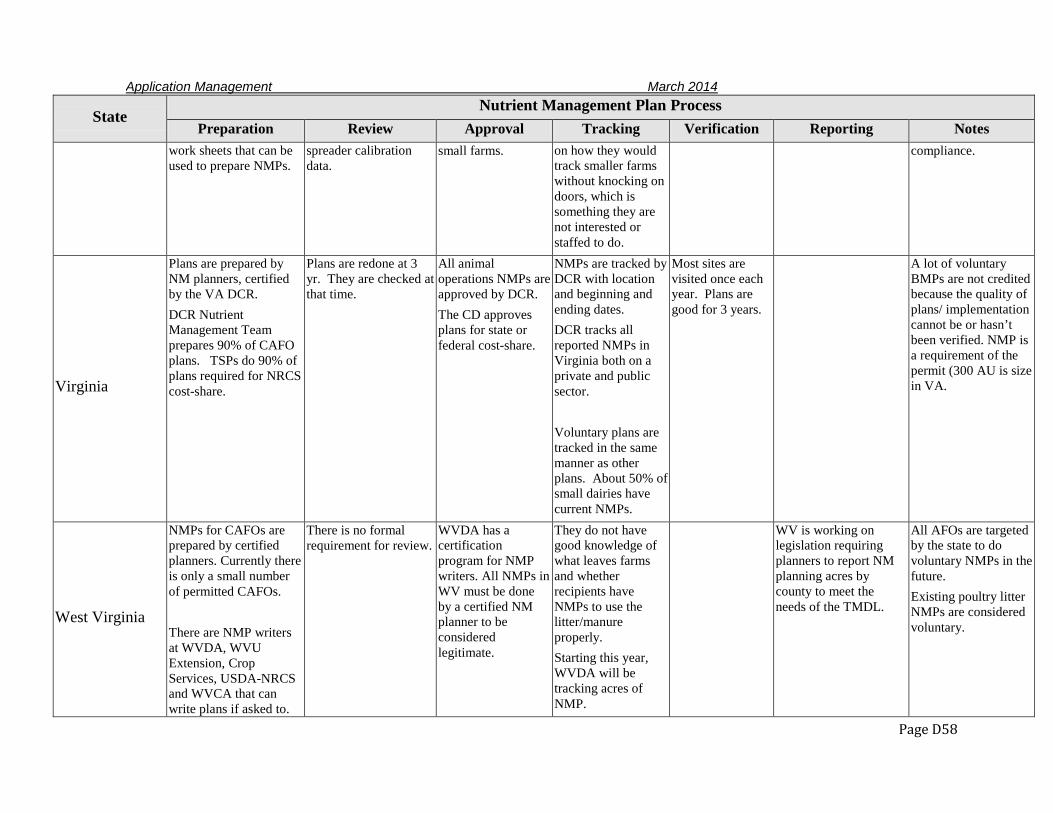
Application Management March 2014
Page D58
State Nutrient Management Plan Process
Preparation Review Approval Tracking Verification Reporting Notes work sheets that can be used to prepare NMPs.
spreader calibration data.
small farms. on how they would track smaller farms without knocking on doors, which is something they are not interested or staffed to do.
compliance.
Virginia
Plans are prepared by NM planners, certified by the VA DCR. DCR Nutrient Management Team prepares 90% of CAFO plans. TSPs do 90% of plans required for NRCS cost-share.
Plans are redone at 3 yr. They are checked at that time.
All animal operations NMPs are approved by DCR. The CD approves plans for state or federal cost-share.
NMPs are tracked by DCR with location and beginning and ending dates. DCR tracks all reported NMPs in Virginia both on a private and public sector. Voluntary plans are tracked in the same manner as other plans. About 50% of small dairies have current NMPs.
Most sites are visited once each year. Plans are good for 3 years.
A lot of voluntary BMPs are not credited because the quality of plans/ implementation cannot be or hasn’t been verified. NMP is a requirement of the permit (300 AU is size in VA.
West Virginia
NMPs for CAFOs are prepared by certified planners. Currently there is only a small number of permitted CAFOs. There are NMP writers at WVDA, WVU Extension, Crop Services, USDA-NRCS and WVCA that can write plans if asked to.
There is no formal requirement for review.
WVDA has a certification program for NMP writers. All NMPs in WV must be done by a certified NM planner to be considered legitimate.
They do not have good knowledge of what leaves farms and whether recipients have NMPs to use the litter/manure properly. Starting this year, WVDA will be tracking acres of NMP.
WV is working on legislation requiring planners to report NM planning acres by county to meet the needs of the TMDL.
All AFOs are targeted by the state to do voluntary NMPs in the future. Existing poultry litter NMPs are considered voluntary.
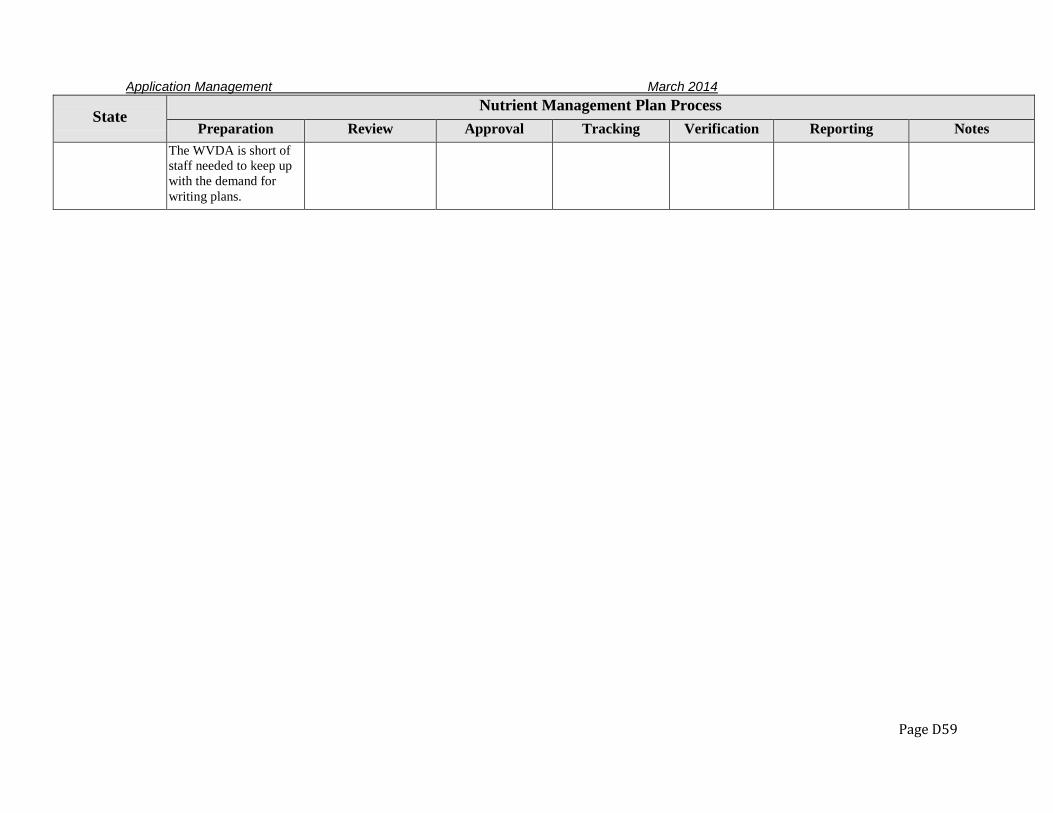
Application Management March 2014
Page D59
State Nutrient Management Plan Process
Preparation Review Approval Tracking Verification Reporting Notes The WVDA is short of staff needed to keep up with the demand for writing plans.
Application Management March 2014
Page D60
STATUS OF IMPLEMENTATION OF NUTRIENT MANAGEMENT PLANS Interviewees were asked to describe the extent to which each practice (N-based NM, P-based NM, P/D agriculture, and ENM) is implemented fully as designed. They were also asked to identify the key factors that determine if the practice is implemented properly and completely, and identify and describe the major reasons for the practice not being fully implemented. Table 11 summarizes responses to these questions. Interviewees in every state reported that most NMPs are implemented as designed. In MD, where virtually all farms and nurseries are regulated, random compliance audits typically find about 30% noncompliance, but most of the noncompliance is due to recordkeeping issues. The great majority of MD audits find compliance on all key provisions. The states that regulate only permitted CAFOs, report even higher compliance rates. New York achieves 95% compliance with NMPs that are part of CNMPs required in some NRCS contracts. New York, which has a strong educational component in their AEM program, reported about 75% incorporating NM planning into their business plans. Where commercial fertilizer was needed for the NM planning, farmers are more likely to under-apply nutrient than to over-apply, due to the high cost of fertilizer. Some concern was expressed that, Bay-wide, the quality of plans may not be as high as needed. One interviewee noted addressing easy targets with the typical Extension and CD clientele is highly effective, but educating the “marginalized” and culturally distinct groups is still a problem. Further, plans that are easily explained and flexible are more effective than those that require a great deal of explanation or cover longer rotations. Several interviewees were concerned that plans were not designed to address environmental needs as much as they address agronomic issues. A specific concern was that the use of a PI allows continued application of manure to already high-P soils, with a consequence that soil P-levels would continue to increase and water quality problems would persist for many years. This view suggests the use of a PI is primarily a means of allowing disposal of P beyond the agronomic rate. Countering this view was the perception that the PI keeps manure application away from the most vulnerable areas thereby reducing off-site impact. (This is discussed further under P-based NM Effectiveness below). The most commonly mentioned factor affecting implementation was economics. The high cost of fertilizer contributes to widespread implementation of NMPs on cropland by limiting the over-application of commercial fertilizer. Conversely, the economic burdens of manure storage and transport were seen as impediments to implementation of NM on animal operations. The high cost of N fertilizer was also noted to contribute to high rates of manure application where N-based application is allowed. Recordkeeping was viewed as both important and somewhat of an obstacle. Plans that called for precise timing in a short window ahead of corn planting were viewed as troublesome. Another factor mentioned as a key ingredient for compliance was continual follow-up between the oversight agency and the farmers. Finally there was concern for the quality of information in use for development of the plan, specifically the calibration of spreader equipment, knowledge of actual amount of litter to be spread, and information available for establishment of proper yield goals. In some cases having sufficient land to utilize manure N and P was the key to compliance. Dairies in NY and some parts of PA were viewed as likely to achieve nutrient balance because
Application Management March 2014
Page D61
most had enough land, whereas poultry operations generally could not achieve on-farm nutrient balance. Litter marketing in MD and VA were viewed as important elements to achieve compliance with NMPs, but Delaware reported still having too much litter in some areas. One interviewee noted that MD farmers reported through AIRs that they had surplus manure in all counties in 2010, totaling 172,673 tons. The major reasons noted for incomplete implementation were plan complexity, lack of available land, lack of flexibility to adjust for adverse weather or management demands, volatility in the commodities market, lack of trust that the nutrients specified would be adequate for the crop, and excessive recordkeeping requirements. Many of these negatives were viewed as being possible to overcome by education and experience with planning, but in some cases the quality of the plan or the ability of the managers were viewed as inadequate. Education was recognized as essential by these interviewees. Nurseries and greenhouses were viewed as a special case of farming. In MD and DE they are required to have NMPs, but interviewees found it difficult to determine the actual extent of implementation because such details are confidential. Interviewees reported that (1) nurseries and greenhouses account for an extremely small part of the CB watershed, (2) nurseries use primarily slow-release fertilizers that generally leave the premises when the plants are sold, (3) field-based nurseries use very little fertilizer, and (4) BMPs are employed widely in the industry. Greenhouses may be more likely to use irrigation-based nutrient application than either containerized nurseries or field-based nurseries.
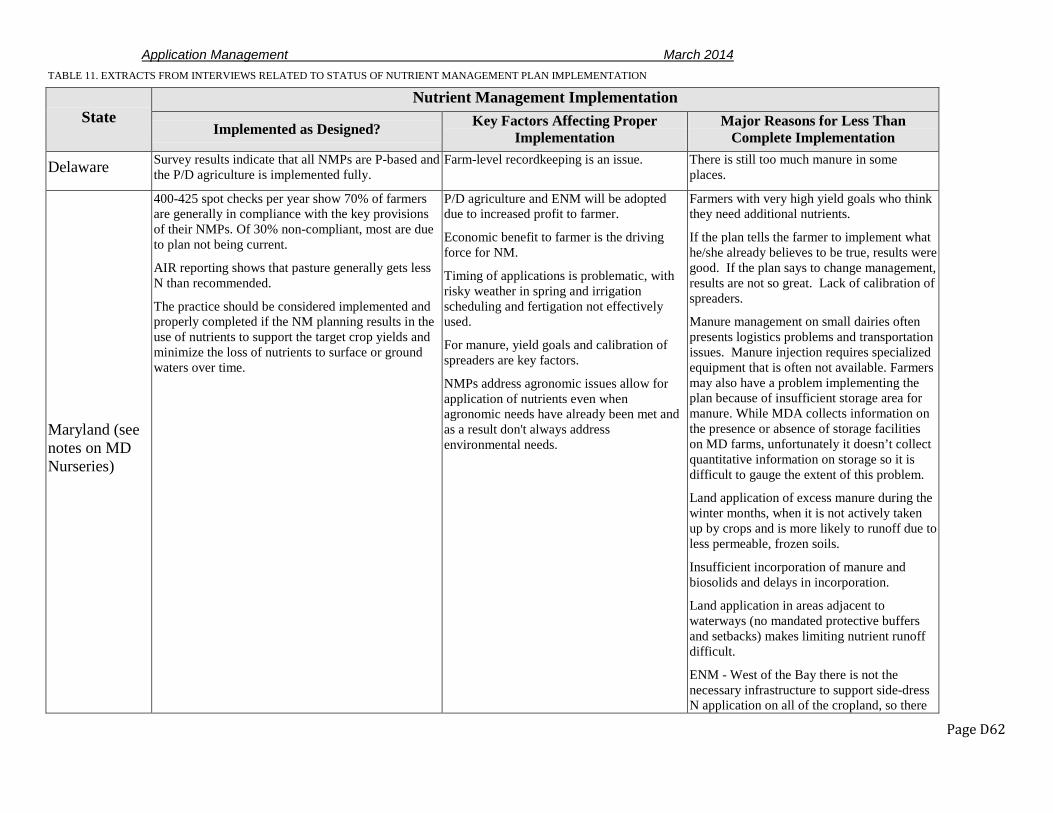
Application Management March 2014
Page D62
TABLE 11. EXTRACTS FROM INTERVIEWS RELATED TO STATUS OF NUTRIENT MANAGEMENT PLAN IMPLEMENTATION
State Nutrient Management Implementation
Implemented as Designed? Key Factors Affecting Proper Implementation
Major Reasons for Less Than Complete Implementation
Delaware Survey results indicate that all NMPs are P-based and the P/D agriculture is implemented fully.
Farm-level recordkeeping is an issue. There is still too much manure in some places.
Maryland (see notes on MD Nurseries)
400-425 spot checks per year show 70% of farmers are generally in compliance with the key provisions of their NMPs. Of 30% non-compliant, most are due to plan not being current.
AIR reporting shows that pasture generally gets less N than recommended.
The practice should be considered implemented and properly completed if the NM planning results in the use of nutrients to support the target crop yields and minimize the loss of nutrients to surface or ground waters over time.
P/D agriculture and ENM will be adopted due to increased profit to farmer.
Economic benefit to farmer is the driving force for NM.
Timing of applications is problematic, with risky weather in spring and irrigation scheduling and fertigation not effectively used.
For manure, yield goals and calibration of spreaders are key factors.
NMPs address agronomic issues allow for application of nutrients even when agronomic needs have already been met and as a result don't always address environmental needs.
Farmers with very high yield goals who think they need additional nutrients.
If the plan tells the farmer to implement what he/she already believes to be true, results were good. If the plan says to change management, results are not so great. Lack of calibration of spreaders.
Manure management on small dairies often presents logistics problems and transportation issues. Manure injection requires specialized equipment that is often not available. Farmers may also have a problem implementing the plan because of insufficient storage area for manure. While MDA collects information on the presence or absence of storage facilities on MD farms, unfortunately it doesn’t collect quantitative information on storage so it is difficult to gauge the extent of this problem.
Land application of excess manure during the winter months, when it is not actively taken up by crops and is more likely to runoff due to less permeable, frozen soils.
Insufficient incorporation of manure and biosolids and delays in incorporation.
Land application in areas adjacent to waterways (no mandated protective buffers and setbacks) makes limiting nutrient runoff difficult.
ENM - West of the Bay there is not the necessary infrastructure to support side-dress N application on all of the cropland, so there

Application Management March 2014
Page D63
State Nutrient Management Implementation
Implemented as Designed? Key Factors Affecting Proper Implementation
Major Reasons for Less Than Complete Implementation
is more pre-plant application. Further, it may be difficult for farmers to hit the 3-week window recommended for pre-plant application.
New York
Regulated CAFOs in NY achieve 95% compliance with NMP elements of their CNMPs, based on farm inspections and annual compliance report information.
Experience with follow-up activities on farms with NMPs suggests that 75% of the practices in NMPs are incorporated into their business routines and implemented as designed.
A combination of applied research, educational programming, economics, environmental regulation, technical and financial assistance, and BMP implementation over the last 15-20 years in the NY portion of the CB watershed has resulted in:
• A significant drop in N and P fertilizer use;
• A drop in stocking densities from 0.53 to 0.43 animal units/acre;
• A drop in soil test P levels in the optimum and very high categories from 54% to 43% of soils tested at Cornell; and
County level N and P balances (lbs/ac of cropland) being negative and, essentially, zero, respectively.
You have to convince the farmer that this is the right thing to do for the farm…that it makes them money and is in their economic best interest. Farmer has to be involved in writing of the plan.
The major barriers to implementation of NM practices include:
• Higher cost or the perception of higher cost.
• Inadequate trust or experience with the practice on one’s farm.
• Requires additional management.
• Requires additional labor.
• Requires additional investment in equipment.
• Has not recognized the value of regularly working with a NM planner.
• Constraints from unpredictable weather conditions (e.g., the recent flooding).
• Volatile economic/market conditions leading to risk aversion.
Pennsylvania
All certified “large operation” NMPs in PA are verified to be fully implemented as designed.
All regulatory plans in PA are N-based and P-based.
Programs without continual follow-up do not ensure compliance.
Use of the PI, to allow application of manure to high P soils. So it’s a less info more restrictive and more info less restrictive (potentially) system.
Manure spreader calibration is a real problem.
Record keeping is challenging for many farmers.
Land shortage for poultry operations.
Programs without continual follow-up do not
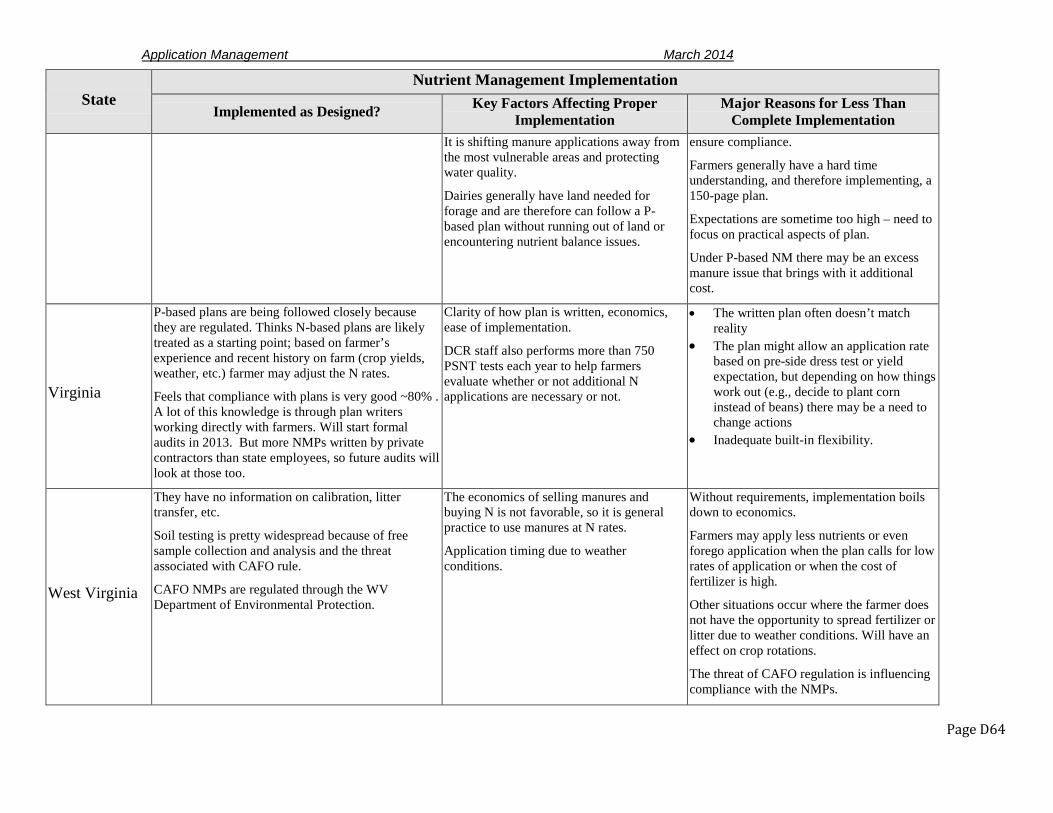
Application Management March 2014
Page D64
State Nutrient Management Implementation
Implemented as Designed? Key Factors Affecting Proper Implementation
Major Reasons for Less Than Complete Implementation
It is shifting manure applications away from the most vulnerable areas and protecting water quality.
Dairies generally have land needed for forage and are therefore can follow a P-based plan without running out of land or encountering nutrient balance issues.
ensure compliance.
Farmers generally have a hard time understanding, and therefore implementing, a 150-page plan.
Expectations are sometime too high – need to focus on practical aspects of plan.
Under P-based NM there may be an excess manure issue that brings with it additional cost.
Virginia
P-based plans are being followed closely because they are regulated. Thinks N-based plans are likely treated as a starting point; based on farmer’s experience and recent history on farm (crop yields, weather, etc.) farmer may adjust the N rates.
Feels that compliance with plans is very good ~80% . A lot of this knowledge is through plan writers working directly with farmers. Will start formal audits in 2013. But more NMPs written by private contractors than state employees, so future audits will look at those too.
Clarity of how plan is written, economics, ease of implementation.
DCR staff also performs more than 750 PSNT tests each year to help farmers evaluate whether or not additional N applications are necessary or not.
• The written plan often doesn’t match reality
• The plan might allow an application rate based on pre-side dress test or yield expectation, but depending on how things work out (e.g., decide to plant corn instead of beans) there may be a need to change actions
• Inadequate built-in flexibility.
West Virginia
They have no information on calibration, litter transfer, etc.
Soil testing is pretty widespread because of free sample collection and analysis and the threat associated with CAFO rule.
CAFO NMPs are regulated through the WV Department of Environmental Protection.
The economics of selling manures and buying N is not favorable, so it is general practice to use manures at N rates.
Application timing due to weather conditions.
Without requirements, implementation boils down to economics.
Farmers may apply less nutrients or even forego application when the plan calls for low rates of application or when the cost of fertilizer is high.
Other situations occur where the farmer does not have the opportunity to spread fertilizer or litter due to weather conditions. Will have an effect on crop rotations.
The threat of CAFO regulation is influencing compliance with the NMPs.
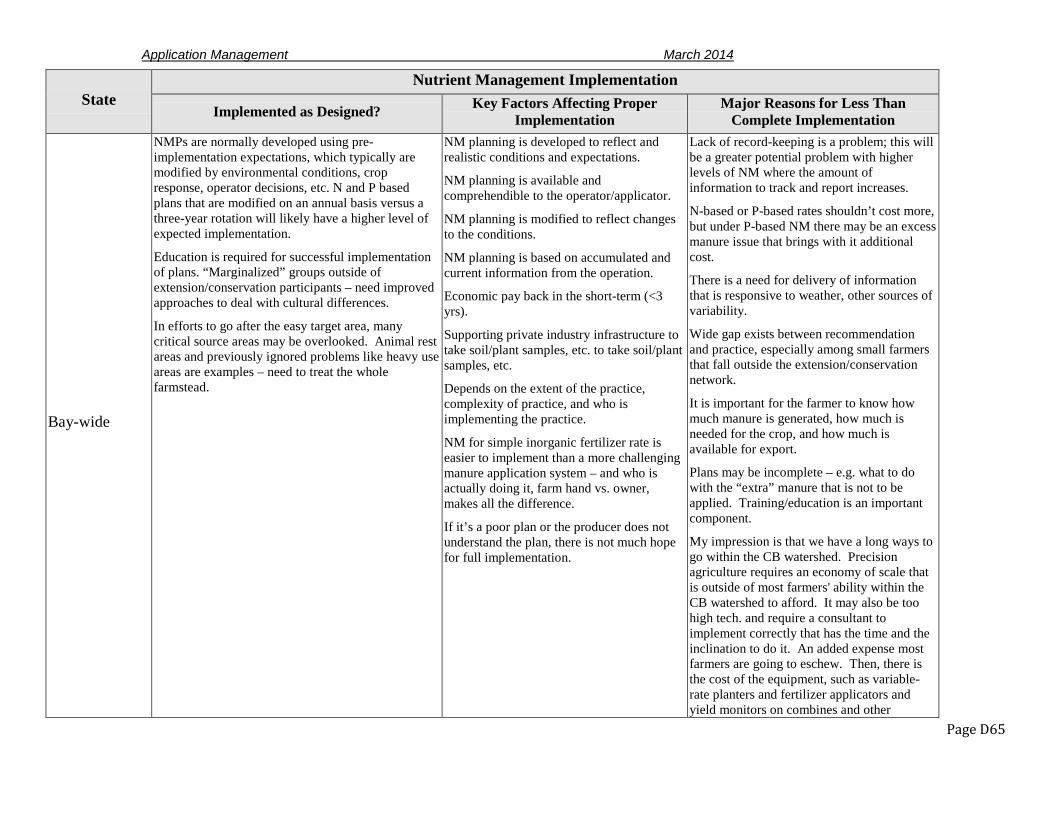
Application Management March 2014
Page D65
State Nutrient Management Implementation
Implemented as Designed? Key Factors Affecting Proper Implementation
Major Reasons for Less Than Complete Implementation
Bay-wide
NMPs are normally developed using pre-implementation expectations, which typically are modified by environmental conditions, crop response, operator decisions, etc. N and P based plans that are modified on an annual basis versus a three-year rotation will likely have a higher level of expected implementation.
Education is required for successful implementation of plans. “Marginalized” groups outside of extension/conservation participants – need improved approaches to deal with cultural differences.
In efforts to go after the easy target area, many critical source areas may be overlooked. Animal rest areas and previously ignored problems like heavy use areas are examples – need to treat the whole farmstead.
NM planning is developed to reflect and realistic conditions and expectations.
NM planning is available and comprehendible to the operator/applicator.
NM planning is modified to reflect changes to the conditions.
NM planning is based on accumulated and current information from the operation.
Economic pay back in the short-term (<3 yrs).
Supporting private industry infrastructure to take soil/plant samples, etc. to take soil/plant samples, etc.
Depends on the extent of the practice, complexity of practice, and who is implementing the practice.
NM for simple inorganic fertilizer rate is easier to implement than a more challenging manure application system – and who is actually doing it, farm hand vs. owner, makes all the difference.
If it’s a poor plan or the producer does not understand the plan, there is not much hope for full implementation.
Lack of record-keeping is a problem; this will be a greater potential problem with higher levels of NM where the amount of information to track and report increases.
N-based or P-based rates shouldn’t cost more, but under P-based NM there may be an excess manure issue that brings with it additional cost.
There is a need for delivery of information that is responsive to weather, other sources of variability.
Wide gap exists between recommendation and practice, especially among small farmers that fall outside the extension/conservation network.
It is important for the farmer to know how much manure is generated, how much is needed for the crop, and how much is available for export.
Plans may be incomplete – e.g. what to do with the “extra” manure that is not to be applied. Training/education is an important component.
My impression is that we have a long ways to go within the CB watershed. Precision agriculture requires an economy of scale that is outside of most farmers' ability within the CB watershed to afford. It may also be too high tech. and require a consultant to implement correctly that has the time and the inclination to do it. An added expense most farmers are going to eschew. Then, there is the cost of the equipment, such as variable-rate planters and fertilizer applicators and yield monitors on combines and other
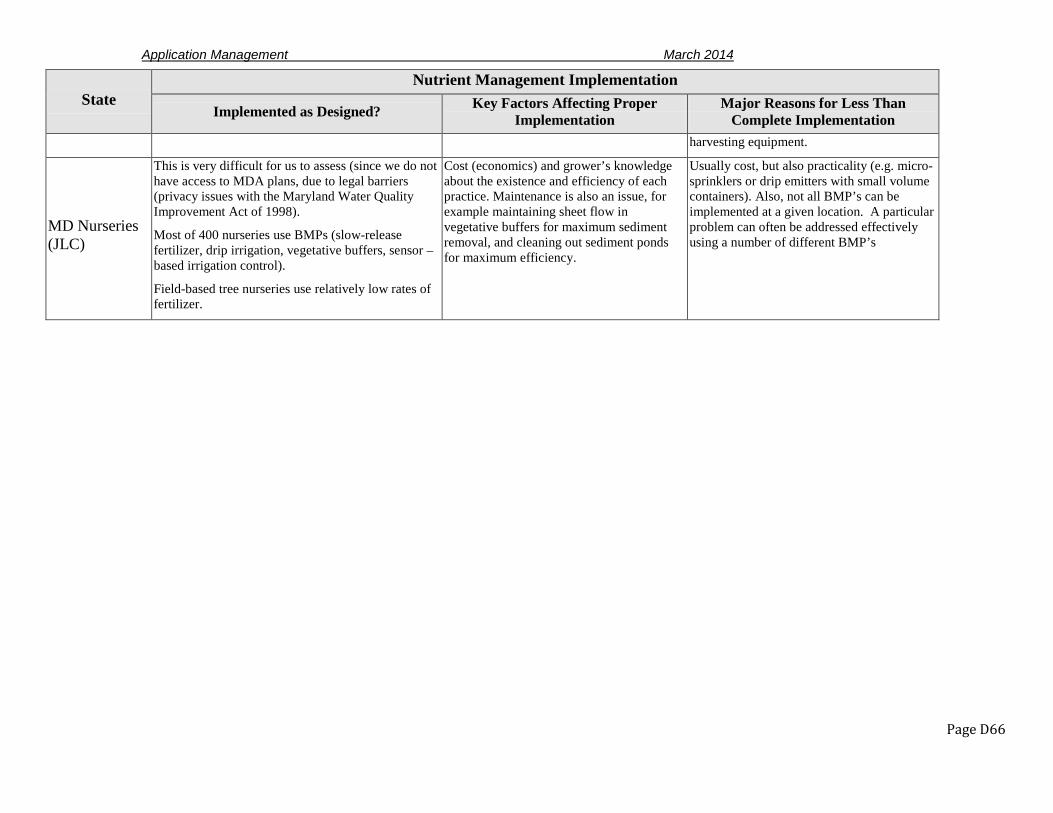
Application Management March 2014
Page D66
State Nutrient Management Implementation
Implemented as Designed? Key Factors Affecting Proper Implementation
Major Reasons for Less Than Complete Implementation
harvesting equipment.
MD Nurseries (JLC)
This is very difficult for us to assess (since we do not have access to MDA plans, due to legal barriers (privacy issues with the Maryland Water Quality Improvement Act of 1998).
Most of 400 nurseries use BMPs (slow-release fertilizer, drip irrigation, vegetative buffers, sensor –based irrigation control).
Field-based tree nurseries use relatively low rates of fertilizer.
Cost (economics) and grower’s knowledge about the existence and efficiency of each practice. Maintenance is also an issue, for example maintaining sheet flow in vegetative buffers for maximum sediment removal, and cleaning out sediment ponds for maximum efficiency.
Usually cost, but also practicality (e.g. micro-sprinklers or drip emitters with small volume containers). Also, not all BMP’s can be implemented at a given location. A particular problem can often be addressed effectively using a number of different BMP’s
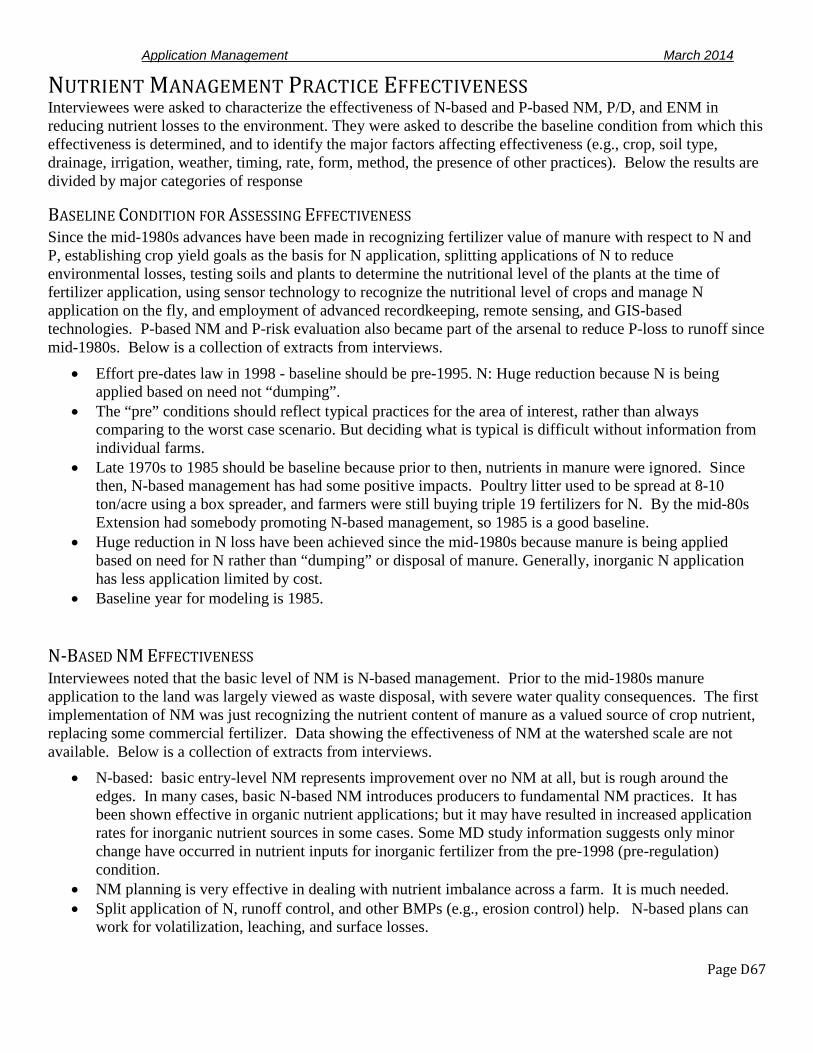
Application Management March 2014
Page D67
NUTRIENT MANAGEMENT PRACTICE EFFECTIVENESS Interviewees were asked to characterize the effectiveness of N-based and P-based NM, P/D, and ENM in reducing nutrient losses to the environment. They were asked to describe the baseline condition from which this effectiveness is determined, and to identify the major factors affecting effectiveness (e.g., crop, soil type, drainage, irrigation, weather, timing, rate, form, method, the presence of other practices). Below the results are divided by major categories of response
BASELINE CONDITION FOR ASSESSING EFFECTIVENESS Since the mid-1980s advances have been made in recognizing fertilizer value of manure with respect to N and P, establishing crop yield goals as the basis for N application, splitting applications of N to reduce environmental losses, testing soils and plants to determine the nutritional level of the plants at the time of fertilizer application, using sensor technology to recognize the nutritional level of crops and manage N application on the fly, and employment of advanced recordkeeping, remote sensing, and GIS-based technologies. P-based NM and P-risk evaluation also became part of the arsenal to reduce P-loss to runoff since mid-1980s. Below is a collection of extracts from interviews.
• Effort pre-dates law in 1998 - baseline should be pre-1995. N: Huge reduction because N is being applied based on need not “dumping”.
• The “pre” conditions should reflect typical practices for the area of interest, rather than always comparing to the worst case scenario. But deciding what is typical is difficult without information from individual farms.
• Late 1970s to 1985 should be baseline because prior to then, nutrients in manure were ignored. Since then, N-based management has had some positive impacts. Poultry litter used to be spread at 8-10 ton/acre using a box spreader, and farmers were still buying triple 19 fertilizers for N. By the mid-80s Extension had somebody promoting N-based management, so 1985 is a good baseline.
• Huge reduction in N loss have been achieved since the mid-1980s because manure is being applied based on need for N rather than “dumping” or disposal of manure. Generally, inorganic N application has less application limited by cost.
• Baseline year for modeling is 1985.
N-BASED NM EFFECTIVENESS Interviewees noted that the basic level of NM is N-based management. Prior to the mid-1980s manure application to the land was largely viewed as waste disposal, with severe water quality consequences. The first implementation of NM was just recognizing the nutrient content of manure as a valued source of crop nutrient, replacing some commercial fertilizer. Data showing the effectiveness of NM at the watershed scale are not available. Below is a collection of extracts from interviews.
• N-based: basic entry-level NM represents improvement over no NM at all, but is rough around the edges. In many cases, basic N-based NM introduces producers to fundamental NM practices. It has been shown effective in organic nutrient applications; but it may have resulted in increased application rates for inorganic nutrient sources in some cases. Some MD study information suggests only minor change have occurred in nutrient inputs for inorganic fertilizer from the pre-1998 (pre-regulation) condition.
• NM planning is very effective in dealing with nutrient imbalance across a farm. It is much needed. • Split application of N, runoff control, and other BMPs (e.g., erosion control) help. N-based plans can
work for volatilization, leaching, and surface losses.
Application Management March 2014
Page D68
• The problem of determining the effect of NM on losses to stream is still not resolved. Re: subsurface N, MD lacks data on effectiveness. They don’t have data on how N applications changed and the resulting changes in N in groundwater. …German Branch watershed (in 90s): everyone had voluntary NMPs and N levels in the stream didn’t go down at all (went up actually).
P-BASED NM EFFECTIVENESS The effectiveness of P-based NM as implemented in the Bay states is controversial. Through the 1980s and 1990s emphasis was on N-based management for manure. This approach is well-known to result in a buildup of P in soils. A P-based plan could mean limiting the manure application rate to the crop’s P requirements (or to crop removal). This approach would limit application rates to a level well below the N-based application rate wherever soil P is at an optimal agronomic level. In all but NY where risk assessment tools are required for all fields, soil test levels ranging from about 100 to 300 ppm (as Mehlich 3) trigger application of a PI. The PI scores determine whether N-based, P-based, or no P application is required. While the stated intent of this approach is to protect water quality by limiting manure application in the most vulnerable locations, several experts expressed concern that use of the PI too often results in manure application to high P soils. Interviewees reported soil-P thresholds based on Mehlich 3 or Mehlich 1 extractions. The Mehlich 3 Phosphorus Saturation Test has been shown effective in predicting dissolved P, but most felt a change to this test was unnecessary for most soils. Several expressed the opinion that transport processes are more important than soil P concentration, so a refined test would not add enough to justify the extra expense. Concerns were raised with this approach because it allows a continued soil-P buildup in most application areas. It may not adequately reflect the risk associated with all transport pathways, particularly subsurface pathways. It may not prevent spreading on variable source areas, hydrologically active areas that vary from season to season, and it may not apply well to no-till crops or pastures where incorporation below the surface is employed. Progress with manure incorporation with a no-till tool was reported by one interviewee. Others noted that incorporation for pastures and no-till were not yet available in an economic system. Several interviewees noted that dairies particularly in WV, parts of PA, and NY generally have enough land to utilize all their manure nutrients. This may not be true, however, in hotspots such as Lancaster County, PA, and a problem was noted with small dairies that may spread manure daily through all seasons. Finally it was suggested that P-based planning is supported by free soil testing in several states, and that the soil test database generated could provide an opportunity to acquire data to evaluate trends in NM planning. Below is a collection of extracts from interviews.
• A conflict between reduced tillage and manure application is not completely resolved. Surface application of manure increases soluble P, but erosion would introduce much more particulate P.
• At high concentrations P moves vertically. New index will address the leaching component. • P-based planning, with the P-index allows application of manure to high P soils can slow the rate of
increase of P in soils. But this approach won’t lead to a stable soil test level. Dairy manure is also a significant issue (not just poultry). Dairies may make 3 applications per year due to crop rotations. Some small dairies have no storage and use daily haul.
• P can be controlled for the most part if you control sediment loss by, for example, using buffers as a component of NMPs. Little dissolved P is generated under current conditions in WV, so the plans are effective.
• The P saturation test is more accurate at estimating environmental risk than using agronomic Mehlich 3 soil test. Soil water extractable P correlates well with Mehlich 3 P saturation ratio throughout its range
Application Management March 2014
Page D69
of concentrations, even below the saturation level. Transport processes dominate P loss risk, even in high P soils. An environmental soil test, such as the Mehlich 3 PSR is one component of risk assessment. Should be used as part of a tool, like the PI, that incorporates both source (soil, fertilizer) and transport factors.
• P-based planning is more effective, but is also more complex (where does extra N come from?) and more demanding. P/D agriculture is more effective still, partially because the expertise required by the farmer implementing P/D agriculture creates good potential for good management. This all assumes proper education/training has been done.
• P-based NM administration appears to allow P applications in some areas to continue that should have been P saturated years ago.
• A problem is that even with a P-based requirement, farmers may end up with a N-based plan (a consequence of using the PI).
• NM planning programs can be excellent in focusing farmers on recommended rates, but when there is a problem of excess manure (no easy market and the expenses associated with storage and transport) and regulations allow for applications well above agronomic demand or at times of limited crop growth (see comments above) they are not always effective means of reducing nutrient losses to the environment.
• Most DE agricultural soils are testing in the moderate range for P, but even so, most planners are writing P-based plans simply because of the history of high-P soils.
• Our lab has worked extensively on application methods and have found that manure injection is very effective in reducing surface runoff and can provide benefits of incorporation in no-till or other conservation tillage systems (although some question remain about impacts of leaching and greenhouse gas emissions).
• USDA-ARS is doing research on low-disturbance injection on no-till with liquid manure (they have a CIG grant putting liquid injectors out with commercial applicators), and are beginning to look at litter injection as an option… (but) Said that injection equipment slows the farmer down too much, increasing the time needed to spread the manure.
P/D AGRICULTURE EFFECTIVENESS P/D agriculture, or at least technologies that are related to P/D Agriculture, were viewed to offer promise, but concerns were expressed due to the cost of implementing some of the technologies, and in many places it was deemed unhelpful because fields are too small and field variability too great to make it cost-effective. In some cases the level of management and recordkeeping required would seem to be an additional barrier, particularly for small farms. Irrigation offers some opportunity as a tool for P/D agriculture, but there is concern that the technology is not currently used to advantage for NM, Below is a collection of extracts from interviews.
• P/D agriculture and ENM will be adopted due to increased profit to farmer. • It is also difficult to know how precision agriculture is impacting water quality because of the wide
range of approaches. There are not many reports of direct measurements of water quality impacts with precision agriculture.
• Probably could reduce N loss by ~20% with P/D agriculture, but we have not addressed the variability, so we don’t know what the benefit really is.
• Precision agriculture is not very effective in most of the CB area because the fields are small. • Application of N with irrigation can reduce losses from the very high yield corn (300 bu/ac corn). These
systems use pre-plant poultry litter with N applied through the center pivot.
Application Management March 2014
Page D70
• We only get better N efficiency with irrigation if irrigation is scheduled on a rational basis; that’s not happing now in MD. In addition MD farmers don’t currently integrate irrigation and N application (i.e., no fertigation).
• P/D agriculture requires a lot of intensive management up front. What has been done is primarily done for N, but not yet done for P because of sensor availability. Sees general reduction of application rates for P/D agriculture, similar to the intent of adaptive NM.
ENM EFFECTIVENESS ENM was viewed by most interviewees as too vague to define a BMP. The SB definition of reducing nutrient applications by 15% was rejected by almost all interviewees. It was pointed out several times that offering crop insurance to cover risk of yield loss due to shorting the fertilizer has already been shown not economically sustainable.
• Original definition was set at 15% below recommended rate, but there were some crop reductions, so AFT may have backed off from the 15% reduction level.
• If farmers cannot get credit for ENM, they will not buy-into the program. • There is extensive research on application timing with mineral fertilizers, but we don’t have the same
flexibility for altering or splitting manure application within the growing season. • Irrigation is increasing in DE – this could cut either way. • Is recommending the term “adaptive NM” (see Appendix B). Adaptive Management comes from work
with Tom Morris. Appendix B is a draft Tech Note on animal waste management. The notion of reducing application rates tends to be anecdotal, not really ENM – person may already be doing good NM planning – how can you reduce N applications by 15% or 35%?
MAJOR FACTORS AFFECTING NM EFFECTIVENESS YIELD GOALS: One key to effective N-based management is to have realistic yield goals so that excessive N is not applied. Many respondents noted that applying fertilizer at a rate below the amount recommended for the yield goal is not acceptable because it would not maintain the high yield of modern agriculture, and it could result in increased erosion in pastures. There was substantial agreement that the recommendations of LGUs do not include excess nutrient that could be saved. One interviewee offered that future improvements in utilization efficiency were likely to achieve higher yield on the same fertilizer rates. Yield goals are established in two basic ways: (1) actual records from producers and (2) research to provide soil-crop capability tables. New York reported having a reliable database for option (2), but most other states either had too little data or research that was outdated. Yield goals have not been identified for ornamental plants. Below is a collection of extracts from interviews.
• Using a farmer’s own records (for yield goal) is by far the best approach to establish yield goals. State averages are not representative in a lot of cases, and using soil capability parameters is not accurate enough.
• All crops of significance in NY have N and P guidelines established by Cornell University – yield goals based on research, rather than farmer records.
• Accurate yield records (rather than yield potential from soil survey) - yields may have come up due to soil organic matter (OM) improvement over years.
• N-based yield-goals can be set from actual farm records or by using (primarily) the VALUES Manual, which prescribes an achievable yield goal for a particular soil management group
Application Management March 2014
Page D71
• A yield goal should be both realistic and challenging. • A common approach to setting realistic yield goals is targeting 80% of the potential yield (with water
and nutrients non-limiting) of a crop in a particular climatic condition. Crop simulation models can help determine potential yield.
• We are working to increase yields each year; preferred method would be projecting past growth in yield into the future by farmer records, but that’s too much to expect of all farmers.
• Penn State’s published soil-based yield capabilities are out of date and not really useful today due to improved yields from genetics. Farmers can exceed those tables (which are more than 30 years old) on a regular basis.
• One of the major challenges in using a yield-based approach for determining fertilizer rates is that yield levels are known to vary widely in a given environment from year to year, as well as among growing seasons within a year where multiple cropping is practiced.
TIMING AND FORM OF APPLICATION: Issues raised here include the need to apply N within a small window near time of planting, use of commercial fertilizer formulations or manure, winter spreading of manure, use of N-stabilizers, and use of cover crops to scavenge excess N. Several interviewees recognized the desirability of limiting the amount of pre-plant N in corn production, applying within a short window, and adjusting side-dress N to meet plant needs. Most recognized the inherent risk associated with each of these recommendations. First is the risk of rainy weather in early spring. Further it was recognized that the busiest time for crop farmers is during the pre-plant window, making it more difficult to get the fertilizer application done when needed. It was pointed out that splitting N applications was particularly important in the Delmarva area because of the coarse-textured soils and not so important west of there and in the Piedmont province, where fine textured soils with lower infiltration rate predominate. It was also pointed out that the infrastructure to apply side-dress N was not available at the scale needed in the Piedmont. Below is a collection of extracts from interviews.
• Rate and timing is the primary concern. Form is secondary except for organics. • Mineralization provides a buffer for available N during good yield years because it is coupled to
growing conditions controlling yields, i.e., the mineralization pool adds more N when growing conditions are good. Thus, what is applied as fertilizer and/or manure each year isn’t all that is available to the crops.
• They may apply a strategy of selective use of the injection systems to focus on problem areas and surface application elsewhere.
WINTER SPREADING: Maryland, DE, and VA are firmly against winter spreading of manure, but MD has a loophole in the regulations that allows for winter spreading if there is insufficient storage. Pennsylvania and NY, on the other hand feel that winter spreading is acceptable and in some cases more desirable than the alternative. The issue is mostly related to small dairies that have limited manure storage. Specialists in PA and NY suggest that the impact of spreading a large slug of manure in late fall and early spring to manage their available storage can be more damaging than applying small amounts frequently throughout the winter. Further they argue the attention is better focused on location of spreading than timing - directing spreading to field areas that are not hydrologically active, runoff contributing areas. Allowing winter application with an N stabilizer can also have the benefit of extending the window for nutrient application and giving more N-credit to the manure that is spread. The result in this case would be a reduction in total N applied to the land and possibly a reduction in N-losses to runoff. Below is a collection of extracts from interviews.
• Winter manure application is a hot-button issue: states’ winter application guidelines that consider slope as a risk factor are misplaced because it is the saturated toe slopes that generate runoff – these guidelines
Application Management March 2014
Page D72
can actually push manure applications to higher risk areas. We should be focusing on source areas with a drainage risk, not simply high slope.
• Not sure how SB deals with winter spreading. Needs to look at how the model spreads out nutrients over the year even when the regulations prohibited winter spreading 12-month application of organic sources as assumed in the SB is a problem.
• With new tools for poultry litter injection, (we) can now inject nitropyrene, a microbial nitrification inhibitor, in the winter and get more farmers to apply in a larger seasonal window – winter application may give a net benefit in this case. Currently, the application of manure is not allowed before March 1.
• Farmers can get more N credit from winter application. Giving more N-credit for winter application can reduce the total manure application because of losses with fall application.
• Nitrification inhibitors may reduce losses, but I remain skeptical. It does not have to be nitrate to leach and ammonia can be far worse to fisheries. Only a dry winter is likely to keep the applied N in place, but a wet spring can quickly cause leaching to occur before the corn crop is of sufficient size to begin using lots of N.
COVER CROPS: are viewed by some as an extremely important element of NM and by others as a secondary aspect. All seem to agree they are particularly important where crop failure has occurred and a large pool of N is still in the soil after harvest. Further they are a benefit to preventing soil erosion, which is viewed as extremely important to water quality. But others point out that it is more important to apply the right amount of fertilizer to feed the crop and not apply for two crops at one time. One interviewee pointed out that cover crops do very little for loss of soluble P and that the crop can be viewed as a slow-release fertilizer. Below is a collection of extracts from interviews.
• Cover crop vs. NM: Our field studies have indicated that the effects of a cover crop on nitrate leaching are much greater than those resulting from relatively minor reductions that are likely with a NMP where inorganic N was used.
• The Bay model puts an emphasis on the wrong practices – cover crops (CCs) are wonderful for soil erosion, but do nothing for dissolved P loads and can exacerbate dissolved P losses from high P soils with low erosion potential. Cover crops should be viewed as a “slow-release P fertilizer.” We should be working toward improving N-use efficiency with P/D agriculture. Thus, P/D agriculture could be more important than CC. CC is just a Band-Aid.
• Some areas use cover crops mostly as a way to apply more manure safely. The Bay model, however, gives no credit if they apply nutrients to cover crops.
• CC may be a benefit for the control of erosion and N, but can mobilize P from high-P soils – this is not picked up in SB or the Bay model because the modeling does not handle carryover/storage.
• Cover crop is important during fall-winter-spring water recharge season. This will be especially important on sites where excess N is likely, e.g. after droughts, after fall manure application (hopefully a modest rate of fall manure), sites with regular manure inputs, and short season crops like vegetables that provide a long fall period for soil N mineralization.
• CC is useful where the next level of management is not available (P/D agriculture), but the right rate and timing of applications is preferred to using CC to scavenge the excess application.
• To be effective in protecting Bay waters, CCs must have enough time and precipitation to grow to a height of at least 4 inches before or near winter dormancy to reduce soil loss and effectively scavenge soil N unutilized by the production crop. Otherwise, the smooth seedbed often produced when planting a cover crop may actually exacerbate N runoff and soil loss.
Application Management March 2014
Page D73
IRRIGATION AND DRAINAGE: Irrigation and drainage offer both concerns and potential benefits for NM in the Bay watershed. Both practices are effective for maintaining high crop yields, but the high yields justify extremely high nutrient application rates. Improved irrigation scheduling and controlled application of N through irrigation systems can reduce nutrient losses. These technologies, however, are not widely employed in the Bay watershed at this time. Similarly, controlled drainage technologies can reduce N losses through tile drain systems. Below is a collection of extracts from interviews.
• Yield goals are set very high (220 bushels/acre) with irrigation, and therefore there is very high nutrient application. This leads to a lot of N application and higher losses if irrigation is not managed carefully.
• Recognition of the different landforms and their typical management practices (i.e., bottomland cropland, bench and upland hay and grazing systems) is important. Most bottomlands are tile-drained and could be significant sources of nutrient to the CB watershed, particularly for loss of N. Permanent sod, pasture, and hayland receive surface applications and get surface enrichment of the top 2 inches.
• There is quite a bit of ditch drainage on the Eastern Shore and tile drainage on the Western Shore. This could be a major N loss mechanism. Ditches are easily seen but not all tiles are mapped.
CONSERVATION TILLAGE: Several interviewees recognized trade-offs necessary in NM when reduced tillage is employed in combination with manure application. This system makes it difficult to incorporate the nutrients, so most are applied pre-plant to the surface. The result is high concentration of P at or near the surface, with an increased potential for runoff. Extracts from interview comments are shown below. Below is a collection of extracts from interviews.
• Tension exists between incorporating manure and the widespread use of conservation tillage in the CB watershed. Trade-offs between sediment and nutrient losses are apparent. Ken Staver’s work shows P in runoff – trade-off between erosion control (sediment) and control of total P (driven largely by soluble P losses).
• Tradeoffs among practices are necessary. For example, manure application and reduced tillage operate in opposite directions and result in major tradeoffs.
• Reduced tillage can reduce sediment-attached P losses, but loss of dissolved P is not necessarily controlled by conservation tillage/no-till and may actually increase. May need to look at new ways to coordinate tillage types with NM practice. Different types of tillage will require different combinations of source-rate-time-place.
OTHER FACTORS that do not fit easily in the categories above are presented below.
• Tillage and soil type affect N from soil, but these considerations seem to not be factored into the planning.
• Soil type, texture – e.g., WV silt loam soils have greater P sorption than eastern CB sandy soils and much lower infiltration rate.
• Timing - The recommendation for corn is to apply N in a short pre-plant window and use side-dress N, but in many places ALL of N is put down as pre-plant.
• Weather - e.g., if a farmer puts down fertilizer and doesn’t get moisture, N won’t get down to the root zone; or big rain after spreading washes it away.
• Record-keeping (e.g., tracking yields and rotations). • Stocking rates and grazing rotations.

Application Management March 2014
Page D74
RECOMMENDATIONS FOR IMPROVED TRACKING, REPORTING, AND MODELING OF NUTRIENT MANAGEMENT Interviewees were asked to provide recommendations for improved tracking, crediting, reporting, and modeling of NM practices at the local, state, and watershed levels. They were asked to consider the practicality of collecting the information, appropriate units of measure, and whether the practice is annual or cumulative. They were specifically asked for recommendations to account for voluntary NM. Those familiar with SB or the Bay model were also asked to provide any recommendations they had that are specific to those modeling tools.
RECOMMENDATIONS FOR TRACKING. Below is a collection of extracts from interviews.
• MDA has six NM specialists who conduct on farm audits and inspections to verify that NM planning is current, records are in line with plans, and that the farmer is using the plan to properly manage nutrients. These 6 specialists audit about 5-10% of regulated farms each year. Concerns have been expressed by environmental organizations that a more transparent process to share audit results is needed in order to provide a much greater degree of confidence that NMPs are being fully implemented over the lifespan of practices functioning. There are a few 3rd party, independent organizations that are providing on-farm assessments. These organizations, due to the nature of the assessment being conducted by an objective assessor, provide a much greater degree of confidence to the public that the NM planning is being fully implemented.
• MD should track input process relative to agronomic requirements rather than plans processed. • There is a very effective soil testing program through WVU. Plans are expected to have 3-yr soil
testing, and since analyses are free, soil testing is widespread. Certified planners take the samples, so that is free too. Results of soil testing are available in county-based summaries on the WVU website. There was a marked jump in soil samples submitted when the CAFO rules were promulgated. This could be used as a source of data for tracking NM progress.
• We need to see how farms change their NM planning when they transport manure/litter off site. County to county transport records could be available for the modeling.
• We need to do a better job of tracking fertilizer usage in agriculture. State chemist records are severely lacking. This is the largest component in tracking meta-trends in nutrient balance.
• The technical nature of the planning process and the tools involved (PI), give the public the appearance that environmental issues are being addressed to a greater extent than they are.
• New York - The process for collecting agricultural BMPs starts with the state funded AEM program. AEM is the “umbrella program” that provides a consistent format to efficiently identify environmental concerns and opportunities through a comprehensive on-farm assessment. NRCS, Extension, AEM Planners, and farmers will coordinate to report their BMP progress.
• Track individual components of NM rather than “NM” as a whole.
RECOMMENDATIONS FOR VOLUNTARY PLAN TRACKING. Below is a collection of extracts from interviews.
• It would be worthwhile considering ways to request such information from agricultural and agri-business organizations. Each will report differently, but interest is increasing in uniform reporting standards, including sustainability reporting.
Application Management March 2014
Page D75
• Could seek reporting from certified NM consultants in MD and DE. They could report total acres they plan – not all of those are mandatory.
• Need trained technical experts to visit the farms to ensure that they meet specific standards so they can be counted properly and modeled properly. State will need a process to prove that these practices are consistent with model definitions or state standards.
• Perhaps the recommendation is to track practices not plans. Perhaps we should shift our focus to which specific practices are implemented?
• Some voluntary NMPs may not meet NRCS or Bay model standards and therefore would likely have a different efficiency associated with them.
RECOMMENDATIONS ON MODELING. Below is a collection of extracts from interviews.
• It is going to be hard to do anything with NM prediction without first knowing the soil production capability matched up the crop actually growing on the field.
• Precision GIS data, even temporal data are available, but the model just averages over the county, losing all of the detail. Aggregating data at the county level isn’t bad, but we don’t know if corn (for example) is on land supporting high or lower yields – we need to know that (where is corn grown relative to the various soil types) to model better.
• The Bay model does not handle storage of P in the watershed – it converts application of fertilizer and manure P into part in the crop, part lost to CB, etc. but there is no carryover to the next year.
• Scenario Builder currently allocates supplemental fertilizer anytime that the crop uptake rate is not met with manure. This represents a fundamental mischaracterization associated with a crop uptake based model that does not consider soil organic N, soil test P, and important aspects of farm management.
• We need to factor in P saturated soils – more of a 2017 thing for the model. We also need consistency in the way that states apply their P Indexes.
• If NM planning is to gain credit under the model, it should reduce N or P flows to the bay, not maintain or increase them. In some cases negative credit should be applied for practices.
• Incorporate more BMPs into the model. Incorporate BMPs that are implemented by growers, but are not accounted for in the model (mostly because growers have paid for them themselves).
LITERATURE Interviewees were asked to identify any literature or other significant information sources on each practice (N-based nutrient management, P-based nutrient management, P/D agriculture, and ENM) that they believed the Nutrient Management Expert Panel should review. These materials have been uploaded to the SharePoint site created for the Agriculture Workgroup.
ABBREVIATIONS, ACRONYMS, AND UNITS 4Rs - Right rate, right form, with the right timing, and the right placement ac – Acre AEM – Agricultural Environmental Management program of NY AFO – Animal feeding operation
Application Management March 2014
Page D76
AFT – American Farmland Trust AEU – Animal equivalent unit ARS – Agricultural Research Service AU – Animal unit Bay model – Chesapeake Bay watershed model BMP – Best management practice bu – Bushel bu/ac – Bushels per acre CAFO – Confined animal feeding operation CAO – Concentrated animal operation (PA). (≥8 AEUs where the animal density >2 AEUs/ac on an annualized basis.) CB – Chesapeake Bay CC – Cover crop CCA – Certified Crop Advisor CCD – County Conservation District CD – Conservation District CEU – Continuing Education Unit CIG – Conservation Innovation Grants CNG – Cornell Nutrient Guidelines CNMP – Comprehensive Nutrient Management Plan COMAR – Code of Maryland Regulations c/s – Cost Sharing CSNT – Corn stalk nitrogen test DA&M – NYS Department of Agriculture & Markets DCR – VA Department of Conservation and Recreation DDA – Delaware Department of Agriculture DEC – NYS Department of Environmental Conservation DEQ – Department of Environmental Quality DNMC – Delaware Nutrient Management Commission DNML – Delaware Nutrient Management Law DNREC – Delaware Department of Natural Resources and Environmental Control ENM – Enhanced nutrient management EP – Nutrient Management Expert Panel under the sponsorship of the Agriculture Workgroup EPA – United States Environmental Protection Agency FIV – Fertility index value GIS – Geographic information system GPS – Global positioning system ISNT – Illinois side-dress nitrogen test

Application Management March 2014
Page D77
lb – Pound lb/ac – Pounds per acre MDA – Maryland Department of Agriculture MM – Manure management MMM - Manure Management Manual authorized under Chapter 91 of PA Code MNMM - Maryland Nutrient Management Manual N – Nitrogen NEIN - National Environmental Information Exchange Network NLI - Nitrate Leaching Index NM – Nutrient management NMP – Nutrient management plan NPDES – National Pollutant Discharge Elimination System NRCS – Natural Resources Conservation Service of USDA OM – Organic matter P – Phosphorus PA DEP – Pennsylvania Department of Environmental Protection P/D Agriculture – Precision/decision agriculture PDA – Pennsylvania Department of Agriculture PI – Phosphorus Index or Phosphorus Site Index or Phosphorus Runoff Index ppm – Parts per million PSNT – Pre-sidedress soil nitrate test PSU – Penn State University QA/QC – Quality assurance/quality control RUSLE/RUSLE2 – Revised universal soil loss equation SB – Scenario Builder SCC – State Conservation Commission SWCC – Soil and Water Conservation Committee SWCD – Soil and Water Conservation District t/ac – Tons per acre TMDL – Total maximum daily load TSP – Technical services provider UD – University of Delaware UMD – University of Maryland USC – Upper Susquehanna Coalition USDA – United States Department of Agriculture VALUES - Virginia Agronomic Land Use Evaluation System VT – Virginia Tech University

Application Management March 2014
Page D78
WIP – Watershed Implementation Plan WNM - Water and nutrient management (plans) WVCA – West Virginia Conservation Agency WVDA – West Virginia Department of Agriculture WVU – West Virginia University yr - Year
Application Management March 2014
Page D79
SOURCES Agricultural operation nutrient management plan requirements, Maryland title 15 Department Of Agriculture,
subtitle 20 soil and water conservation, chapter 07, http://www.dsd.state.md.us/comar/comar.aspx (Accessed 3/15/2012).
Chapter 192 - Virginia pollution abatement (VPA) general permit regulation for animal feeding operations – contents of the general permit. 9VAC25-192-70. http://leg1.state.va.us/cgi-bin/legp504.exe?000+reg+9VAC25-192-70 (Accessed 3/15/2012).
Content and criteria for a nutrient management plan developed for an agricultural operation, Maryland title 15 Department of Agriculture, subtitle 20 soil and water conservation, chapter 08, http://www.dsd.state.md.us/comar/comar.aspx (Accessed 3/15/2012)
DDA. 2002. Delaware conservation practice standard nutrient management code 590, http://www.dda.delaware.gov/nutrients/2011/590_02_Nutrient%20Management.pdf (Accessed 3/13/2012).
Delaware Code. title 3, chapter 22 (nutrient management). http://delcode.delaware.gov/title3/c022/index.shtml (Accessed 3/26/2012)
Delaware nutrient management regulations http://dda.delaware.gov/nutrients/nm_reg.shtml (Accessed 3/26/2012).
Delaware secretary’s order no.: 2010-W-0034 7201 regulations governing the control of water pollution, 9.5 the concentrated animal feeding operation (CAFO), http://www.dnrec.delaware.gov/Admin/Documents/Secretarys%20Order%20No.%202010-W-0034.pdf (Accessed 3/13/2012).
Gilinsky, E. 2005. Guidance memo no. 05-2008 - determining eligibility and issuance of the VPA general permit regulation for animal feeding operations, 9 VAC 25-192-10 et seq., May 17, 2005. Commonwealth of Virginia, Department of Environmental Quality, Division of Water Quality Programs. http://www.deq.virginia.gov/Portals/0/DEQ/Water/Guidance/052008.pdf (Accessed 3/15/2012).
Pennsylvania Act 38 Regulations, subchapter D. nutrient management. http://panutrientmgmt.cas.psu.edu/main_laws_regulations.htm (Accessed 3/15/2012).
Virginia nutrient management standards and criteria, (revised 2005): section iv. phosphorus management. http://www.dcr.virginia.gov/documents/StandardsandCriteria.pdf (Accessed 2/16/2012).
WVDEP. Title 47 legislative rule, series 10, Department Of Environmental Protection, Water Resources. http://apps.sos.wv.gov/adlaw/csr/ruleview.aspx?document=8226 and http://apps.sos.wv.gov/adlaw/csr/readfile.aspx?DocId=22371&Format=PDF (Accessed 3/15/2012).
EP Members Surveyed Aaron Ristow, USC Anne S. Marsh, Heinz Center Barry Evans, PSU Curtis Dell, USDA-ARS Doug Beegle, PSU Doug Goodlander, PA DEP Frank Coale, Chair, UMD (not interviewed)
Application Management March 2014
Page D80
Greg Albrecht, NY DA&M Jack Meisinger, USDA-ARS Jason Dalrymple, WVDA Jim Cropper, Northeast Pasture Consortium John Lea-Cox, UMD John Majsztrik, UMD Josh McGrath, UMD Kelly Shenk, EPA Ken Staver, UMD Larry Towle, DDA Mark Dubin, Coordinator, UMD Peter Kleinman, USDA-ARS Royden Powell, MDA Thomas Bruulsema, International Plant Nutrition Institute Tim Sexton, VA DEQ Tom Basden, WVU Trish Steinhilber, UMD Wade Thomason, VT Chris Gross, USDA-NRCS

Application Management March 2014
Page D81
APPENDIX A: SYNOPSES OF STATE AGRICULTURE PROGRAMS
Application Management March 2014
Page D82
SYNOPSIS OF NM TECH STANDARDS FOR DELAWARE http://dda.delaware.gov/nutrients/index.shtml The Delaware Nutrient Management Program was established in June 1999 as a result of the Delaware Nutrient Management Law. The Delaware Nutrient Management Commission (DNMC members) was established to direct the program and develop regulations pertaining to nutrient management, waste management for Animal Feeding Operations (AFOs) and NPDES permits for CAFOs. DE Department of Agriculture administers:
• Nutrient Management Relocation Program – cost assistance for manure transport • Delaware Manure Matching – identifies manure providers, receivers, and brokers • Nutrient Management Planning Program – cost-share program for NMP implementation • Complaints • Certification of CAFO operators, nutrient applicators, consultants
Source(s) of technical standards for nutrient management:
• The required contents of a NMP are in 9 Delaware Reg. 440, Section 9.5.6.1 • Draft list of 42 standards is presented on a Delaware Department of Agriculture web site titled “DRAFT Delaware
Nutrient Management Program State Technical Standards” (http://dda.delaware.gov/nutrients/NM_TechStandards.shtml).
• Components of technical standard include NRCS 590 standard, other NRCS standards, UD Extension documents Requirements for risk assessment:
• DE NRCS 590 Standard, Field Risk Assessment – Phosphorus Site Index (PSI) Rating (DE and MD share a common adapted PI)
• Specifics of when CAFOs are required to complete all field assessments are clearly articulated in their permit. Nutrient recommendations:
• U. of Delaware Nutrient Management Handbook (Sims and Gartley, 1996) contains specific recommendations for crop nutrient levels and discussion of adjustment factors based on manure, legumes, and other factors.
Crop removal rates: • U. of Delaware Nutrient Management Handbook • UD Extension publication NM-06 Phosphorus Removal by Delaware Crops that includes tabular data on
estimated P removal in the harvested portion of DE crops. Manure and soil testing:
• Manure nutrients must be analyzed prior to land application, as close to the application date as feasible • Nutrient management planning shall be based on current (<3 yrs) soil test results. In addition, the Pre-Sidedress
Soil Nitrate Test is recommended as a late spring soil test for assessment of nitrogen availability. Application restrictions:
• Delay field application if precipitation capable of producing runoff and erosion is forecast within 24 hours of the time of the planned application.
• Nutrients shall not be applied to frozen, snow-covered, or saturated soil. • Nutrients shall not be applied to flooded or saturated soils when the potential for soil compaction and the creation
of ruts is high • For sites with high risk for P transport, P applications cannot exceed the amount of P removed in the harvested
portion of the crops grown for the next three years.
Application Management March 2014
Page D83
Modeling and tracking nutrient management1:
• FSA and NRCS will report data through USGS, for transfer to the Watershed Model (system not yet final) • Other state-funded practices are issued and tracked through the Dept. of Ag., e.g., manure relocation and nutrient
management plan cost-share programs • Cost-shared BMPs reported are aggregated by watershed and reported directly into the Bay model, through FSA
and NRCS; not known if or how practices cost-shared by other programs are geo-referenced • State reviews aerial photography and other records to establish implementing year as possible to avoid reporting
previously existing practices as new; field verifications done by partner agencies • No procedure in place to track operation, maintenance, or continued existence of practices
1 from NAS review Achieving Nutrient and Sediment Reduction Goals in the Chesapeake Bay
Application Management March 2014
Page D84
SYNOPSIS OF NM TECH STANDARDS FOR MARYLAND http://www.mda.state.md.us/resource_conservation/nutrient_management/index.php The 1998 Water Quality Improvement Act requires all Maryland farmers grossing $2,500 or more annually or raising 8,000 pounds or more of live animal weight to run their operations using a nutrient management plan that addresses both nitrogen and phosphorus inputs. Also applies to people who apply nutrients, poultry growers and companies, and Maryland-certified nutrient management consultants, who must write nutrient management plans based on both soil N and P. The MD Dept. of Agriculture Nutrient Management Program oversees a licensing and certification program for consultants, compliance activities and education and training programs. Source(s) of technical standards for nutrient management:
• Part IV.B.8 of the General Permit (Protocols for the Land Application of Manure and Wastewater) states that animal waste shall not be applied at a rate higher than agronomic requirements in accordance with the Maryland Nutrient Management Manual.
• “Law, Regulations and Reference Manual” and “Consultant’s Resource Notebook” constitute the methodology and standards used to develop nutrient management plans that are required of CAFOs and certain AFOs in Maryland.
Requirements for risk assessment: • Maryland Nutrient Management: Law, Regulations and Reference Manual, Section I I-C (Phosphorus Site Index
for Maryland) • Use of the PI for Maryland required when the soil fertility index >150
Nutrient recommendations: • Maryland Nutrient Management: Law, Regulations and Reference Manual, Section I-B (Nutrient
Recommendations by Crop) provides recommended nutrient application rates for various crops based on soil tests and yield goals.
Crop removal rates: • Maryland Nutrient Management: Consultant’s Resource Notebook, Section III (Developing Nutrient
Recommendations), Phosphorus Removal by Crops in the Mid-Atlantic States includes data on crop P removal in lbs P2O5/yield unit.
Manure and soil testing:
• General Permit requires at least annual manure analysis for P and N content. • Maryland Nutrient Management Law specifies that a CAFO/AFO operator shall conduct manure analysis as close
to application time as possible, or a consistent baseline for nutrient content may be established and used from analysis results taken at least twice a year until a uniform value is confirmed, and then for every second year thereafter.
• The General Permit requires that AFOs include analysis of soil samples for pH and P at least once every three years for all fields where animal waste may be applied.
Application restrictions:
• The General Permit states that field application of animal waste shall not take place on frozen ground or snow covered ground without written permission and requires setbacks from waters of the state and property lines.
• The annual average hydraulic loading rate for land application of process wastewater shall not exceed 2 in./week, and application shall not exceed the long-term soil infiltration rate or result in surface runoff or ponding.
Application Management March 2014
Page D85
• Further, distribution of process wastewater shall not take place during periods of precipitation or high winds, or on frozen or snow covered ground or on saturated soil.
• Manure cannot be applied to frozen or snow-covered ground or on specific poorly drained soils. Also, manure application is prohibited from November 16 – February 28) unless the operation has inadequate storage capacity.
Modeling and tracking nutrient management1: • MDA tracks agricultural BMPs and reports the information monthly to BayStat. Nutrient management plans are
submitted monthly by the farmer; the operation, crops grown, fertilizer used, acreage managed, and animal production are tracked to determine the percentage of nutrient management plans in compliance.
• MDA strives to complete ~400 random field inspections annually, which include a review of the plan and all farm records. Plans are also reviewed at MDA headquarters; farmers must have their nutrient management plans reviewed and approved to participate in state incentive programs.
• MD plans to initiate a pilot program where soil conservation districts would conduct on-the-ground inventories of current practices farmers have installed without incentives; this inventory would include an on-farm nutrient calculation tool.
• Once a practice has exceeded its designated maintenance life (~10-15 years for most practices), it is removed from the list
1 from NAS review Achieving Nutrient and Sediment Reduction Goals in the Chesapeake Bay
Application Management March 2014
Page D86
SYNOPSIS OF NM TECH STANDARDS FOR NEW YORK For a more detailed summary, please review the NYS Watershed Implementation Plan (WIP) (www.dec.ny.gov/lands/33279.html). CNMPs are required for CAFO regulated farms (>200 mature dairy cows) per the CAFO General Permits from NYS DEC (http://www.dec.ny.gov/permits/6285.html). The Agricultural Environmental Management (AEM) program from the NYS Department of Agriculture and Markets and the NYS Soil and Water Conservation Committee in partnership with county Soil and Water Conservation Districts also provides support for nutrient management planning and CNMP development and implementation on non-CAFO farms (www.nys-soilandwater.org/aem). USDA-NRCS in NYS also provides support for nutrient management plan and CNMP development and implementation on non-CAFO farms (www.ny.nrcs.usda.gov).
Source(s) of technical standards for nutrient management:
• NY NRCS Conservation Practice Standards 312 (Waste Management System) and 590 (Nutrient Management) are required for all CNMPs, including those required by the NYS DEC CAFO General Permits.
• Numerous resources available from Cornell University and Cornell Cooperative Extension, e.g., Cornell University Nutrient Management Spear Program (http://nmsp.cals.cornell.edu)
Requirements for risk assessment:
• The New York PI, NY NLI, and RUSLE2 must be used to assess nutrient transport, and erosion potential, as well as plan field operations and guide implementation by farms. All are incorporated in the NY NRCS 590 standard.
• The NY PI assesses risk separately for particulate and dissolved P Nutrient recommendations:
• The Cornell Nutrient Management Spear Program provides nutrient guidelines for field crops as referenced in the NY NRCS 590 standard. Cornell’s Nitrogen Guidelines for Field Crops in New York provides detailed descriptions of methods to calculate N recommendations for specific field crops. Phosphorus Guidelines for Field Crops in New York provides P recommendations for specific field crops. http://nmsp.cals.cornell.edu/guidelines/nutrientguide.html
• The umbrella NRCS 590 standard in NYS requires that the Cornell Nutrient Guidelines, NLI, PI, and RUSLE2 are integrated to determine sound recommendations for manure and fertilizer applications. New York’s recommendation system is comprised of the following key elements:
o Every field managed according the NRCS-NY 590 Standard must undergo the full set of analyses in the standard (no threshold exists, under which a partial analysis is performed). This includes risk assessment field walks to collect field attributes for the PI, RUSLE2, setbacks, and other resource concerns; collection of field history and management information; and significant analysis to integrate the Cornell Nutrient Guidelines and various risk assessments into a final recommendation for source, rate, timing, and method of nutrient application (4Rs).
o In addition to the risk assessment tools, the “Supplemental Manure Spreading Guidelines to Reduce Water Contamination Risk During Adverse Weather Conditions” (http://nmsp.cals.cornell.edu/publications/files/WinterSpreadingGuidelines.pdf) is used to further guide fields selection and management during periods of saturated, frozen, and/or snow covered field conditions. Crop nutrient guidelines are based on a database of 600+ soil-specific yield potentials and soil test-based yield response studies.
o Crop nutrient guidelines account for existing N credits from past crops, manure, and soil organic matter. o Crop nutrient guidelines are based on the sufficiency approach, developed through years of crop yield
response studies, and not a crop removal approach. The guidelines account for nutrient availabilities and efficiencies throughout the soil/crop environment, so no blanket insurance factors exist.
Application Management March 2014
Page D87
o The NLI is based on seasonal and annual precipitation and soil hydrologic group. Additional N conservation BMPs are recommended on fields for NLI ratings >10.
o The PI is a unit-less risk rating based on the integration of the pool of P for a field (source) and its potential to be lost from the field via runoff or erosion (dissolved transport and particulate transport, respectively).
o RUSLE2 is run on all fields and soil loss must be managed to T. o Manure application setbacks from watercourses (100’, 35’ vegetated buffer, or 15’ buffer if incorporated
within 24 hours) and 100’ from wells. o Records are kept to drive future management.
Crop removal rates:
• The NY PI provides specific crops’ P concentrations for purposes of calculating actual P removal rates based on crop yield expectations.
Manure and soil testing:
• NRCS 590 and the CAFO General Permits require annual manure sampling for N and P content. • NRCS 590 and the CAFO General Permits require nutrient planning to be based on current soil test results (no
more than 3 years old) developed in accordance with Cornell University guidance or industry practice. Application restrictions for fields guided by CNMPs or 590 Nutrient Management Plans:
• Manure applications on fields guided by CNMPs or 590 nutrient management plans shall have: o 100 foot setbacks from wells, sinkholes, or surface inlets and down-gradient surface waters, or o 35 foot vegetated buffers to down gradient surface waters, or o 15 foot buffers to down gradient surface waters with manure incorporated within 24 hours of application.
• The NY PI restricts P applications to crop removal on fields with PI ratings of “High” (75 – 100) and prohibits all P applications to fields with PI ratings of “Very High” (>100). Additional crop N requirements (if any) would be satisfied by N fertilizer.
• Farmers and planners further manage manure nutrients and risk by following to sets of supplemental guidelines (http://nmsp.cals.cornell.edu/guidelines/nutrientguide.html):
o Supplemental Manure Spreading Guidelines to Reduce Water Contamination Risk During Adverse Weather Conditions
o Manure and Groundwater: the case for protective measures and supporting guidelines • Delay field application of animal manures or organic by-products if precipitation capable of producing runoff and
erosion is forecast within 24 hours of the time of the planned application. • Nutrients shall not be applied to frozen, snow-covered or saturated soil if potential risks for runoff exist. • When tillage can be performed, surface applications of manure that are subject to volatilization on the soil surface
are encouraged to be incorporated into the soil within 24 hours. • When manure or organic by-products are applied to grassland, hayland, pasture or minimum-till areas, the rate,
form and timing of application(s) shall be managed to minimize volatilization losses.
Modeling and tracking nutrient management1: • The Upper Susquehanna Coalition (USC) is charged with tracking agricultural nonpoint source implementation
through their AEM Program work; only practices on-the-ground are reported to the Bay Program (NEIEN Node). • USC field-checks agricultural practices. www.u-s-c.org
1 from NAS review Achieving Nutrient and Sediment Reduction Goals in the Chesapeake Bay

Application Management March 2014
Page D88
Application Management March 2014
Page D89
SYNOPSIS OF NM TECH STANDARDS FOR PENNSYLVANIA
http://panutrientmgmt.cas.psu.edu/ Under 2002 Act 38 and 2006 revised rules, CAOs are required to develop and implement nutrient management plans. The PA Dept. of Agriculture certifies specialists (and farmers) to write and review NMPs; NMPs must be reviewed and approved by county Cons. Dist. or State Cons. Comm. A manure management plan for using excess manure is a required part of the plan; the plan must include nutrient balance sheets and is subject to a review and approval process. Manure importing farms must have a nutrient management plan in place before they accept manure. The PA NM program (web site housed at PSU, administered by PA State Conservation Commission) includes:
• Certification program • Education program • Financial assistance • NM specialist directory
Source(s) of technical standards for nutrient management:
• Title 25, Chapter 83, Subchapter D. Nutrient Management, along with Title 25, Chapter 92.5a CAFO Regulations, and Title 25, Chapter 91 regulations governing agriculture.
• Both Title 25, Chapter 92.5a CAFO Regulations and individual CAFO permits reference the requirement for preparation and implementation of a nutrient management plan meeting the requirements of Chapter 83, Subchapter D.
Requirements for risk assessment:
• Title 25, Chapter 83.293 requires determining the risk of P loss based on soil P level; the method, rate and timing of P application; runoff and soil loss potential for the application area; distance to surface water; and the P source. Parts 5 and 6 of Chapter 293 direct farmers to use the PI and state guidance for risk assessment.
• The PA PI is a two-stage process. Part A is a screening process to determine if a field: 1) is in a special protection watershed, 2) has had a significant management change, 3) has a soil test Mehlich 3 P > 200 ppm, or 4) is within 150 ft of receiving water. If none of these conditions apply, N-based nutrient management is acceptable for the field. If any part of the Part A process is positive, Part B (the full risk assessment) is required and nutrient applications may be restricted, depending on site risk.
Nutrient recommendations:
• Title 25, Chapter 83 requires that the nutrient management plan include crop recommendations based on soil tests, but does not provide a source for the recommendations
• The Penn State Agronomy Guide includes crop recommendations, but is not specifically identified as the source for determining crop nutrient needs
Crop removal rates: • Current guidance points to the PSU Agronomy Guide and other technical documents on the PSU Nutrient
Management Program web page. Manure and soil testing:
• After the approval of the initial plan, manure tests are to be taken annually. • When developing a plan, soil tests are to be conducted for each crop management unit; soil tests every three years
thereafter are acceptable
Application Management March 2014
Page D90
Application restrictions: • The PA 590 standard states that nutrients should not be applied to frozen, snow-covered or saturated soil if the
potential for runoff exists • PA regulations state that plans for manure application must include crop management units where winter
application is planned or restricted. However, no specific criteria for where winter application should be restricted are provided.
• For irrigation systems, and where liquid or semisolid manure will be applied at rates > 9,000 gal/ac at a time, application rates must be limited based on the soil infiltration rate and water holding capacity
• Manure may not be mechanically applied on fields with <25% cover unless: 1) for fall applications, a cover crop is planted in time to control runoff or the manure is injected or incorporated within 5 days using minimal soil disturbance techniques, 2) for spring or summer applications, a cover crop is planted during that growing season, or 3) for winter applications, restrictions, procedures, and appropriate field conditions are described in the plan; setbacks are used; and fields have 25% residue or an established cover crop.
Modeling and tracking nutrient management1: • PA DEP collects data from the PA Act 6 Nutrient Management program electronic spreadsheet reporting to
county level • Verification and quality assurance of BMPs implemented are considered to be the responsibility of the
federal/state/NGO agencies providing the information. 1 from NAS review Achieving Nutrient and Sediment Reduction Goals in the Chesapeake Bay
Application Management March 2014
Page D91
SYNOPSIS OF NM TECH STANDARDS FOR VIRGINIA Tim said this basically looks good. http://www.dcr.virginia.gov/stormwater_management/nutmgt.shtml The VA Dept. of Conservation and Recreation manages both agricultural and urban nm programs. Program activities include:
• NM training and certification • Poultry litter transport incentive program • Tax credit program • Turf and landscape nutrient management
Source(s) of technical standards for nutrient management:
• The regulatory NMP criteria are incorporated into Regulation 4 VAC 5-15 (Virginia Nutrient Management Training and Certification Regulations
• Virginia Nutrient Management Standards and Criteria (2005) • Virginia Nutrient Management Training and Certification Regulations 4VAC-15-10 (2005) • Two separate training programs: one for turf/landscape and one for crops
Requirements for risk assessment:
• If soil P saturation is > 65%, P application is not permitted. • Otherwise, soil test P, P-Environmental Thresholds, or PI to be used to determine maximum P application rate
from organic sources • Virginia P-Index Version 2.0 Technical Guide, Revised 2005
. Nutrient recommendations:
• Virginia Nutrient Management Standards and Criteria, Section V. Crop Nutrient Needs
Crop removal rates: • Virginia Nutrient Management Standards and Criteria, pages 55-59, Table 4-7
Manure and soil testing:
• Nutrient Management Training and Certification Regulations 4 VAC 5-15-150 specify that most recent manure analysis or average of last 3-year period be used to determine manure nutrient content.
• Nutrient Management Training and Certification Regulations and VA Nutrient Management Standards and Criteria require that P and K application recommendations be determined based on soil test results < 3 yrs old.
Application restrictions:
• VA Nutrient Management Standards and Criteria state that no P applications shall be made for soils >65% P saturation regardless of the outcome of the VA PI.
• Applications of inorganic nutrient sources, liquid manure, etc. not to occur on frozen or snow-covered ground.
• When ground is frozen, dry or semi-solid manures may only be applied if the field has: (i) slopes < 6.0%; (ii) 60% uniform ground cover from crop residue or an existing actively growing crop such as a small grain or fescue with exposed plant height of three inches or more; (iii) a minimum of a 200-foot
Application Management March 2014
Page D92
vegetated or adequate crop residue buffer between the application area and all surface water courses; and (iv) soils characterized by USDA as “well drained.”
Modeling and tracking nutrient management1:
• Agricultural BMPs are reported through the Ag Cost Share Program Tracking Database by DCR; DEQ tracks poultry litter transport between counties
• Cost-shared agricultural practices have point locations recorded; system is being developed (as of 2010) for point locations for nutrient management plans
• Soil and Water Conservation Districts certify that installed practices fulfill all BMP requirements; practices that receive state financial incentives are subject to field spot checks. DCR monitors implementation of installed BMPs by randomly selecting 5% of installed practices in a program year and 5% of prior multi-year practices for field inspection. It is not known if this activity includes nutrient management plans.
• Soil and Water Conservation Districts have primary responsibility for collection, verification, and entry of agricultural BMP data; DCR web-based Agricultural BMP Tracking Program used by all SWCDs and will be modified to allow input of data on voluntary BMP installation
1 from NAS review Achieving Nutrient and Sediment Reduction Goals in the Chesapeake Bay
Application Management March 2014
Page D93
SYNOPSIS OF NM TECH STANDARDS FOR WEST VIRGINIA http://www.wvagriculture.org/programs/Nutrient_Management/Introduction.htm WV requires NM for CAFOs (WV CAFO regulations are not yet accepted by EPA) or producers who participate in USDA cost-share programs. Most of the NM plans are written as “voluntary” plans. The WV Department of Ag operates a voluntary NM Certification Program that includes education and training Source(s) of technical standards for nutrient management:
• The WV NPDES permitting program intent is to make reference to the NRCS 590’s PI with WV’s CAFO standard in CAFO permits issued
• The WV CAFO standard refers specifically to the WV Phosphorus Field Risk Assessmen and the 2005 Virginia Standards and Criteria.
Requirements for risk assessment:
• Soil test P levels are used as an initial screening. The WV P Field Risk Assessment (PI) is optional for soils where the P level is high or very high (greater than 50 lbs/acre).
• The WV PI is currently under revision. • The NLI is also required in areas where there are state and/or locally identified or designated nitrogen-related
water quality impairments (e.g., karst and well-head protection areas) Nutrient recommendations:
• NRCS 590 refers to tables in the Penn State Agronomy Guide for N-P-K fertilizer recommendations and N recommendations for agronomic crops. Both tables specify that they provide base recommendations that do not consider manure application and refer to the “Manure Nutrient Management” section of the document for further guidance.
• 2005 Virginia Standards and Criteria • Mid Atlantic Nutrient Planning Manual
Crop removal rates:
• The 590 standard refers to “Typical Crop Nutrient Removal for Phosphorus and Potassium” in the Penn State Agronomy Guide.
• 2005 VA Standards and Criteria Manure and soil testing:
• Manure analysis is required within one year of the initial nutrient management plan and each year following. • A soil test is required every three years, and within one year of the initial nutrient plan date.
Application restrictions:
• Consider delaying application of manure if precipitation capable of producing runoff or erosion is forecast with 24-hours.
Application Management March 2014
Page D94
• Manure cannot be applied to frozen, snow-covered, or saturated ground. Emergency applications on frozen ground per new USDA 590
Modeling and tracking nutrient management1:
• WVDA tracks nutrient management plans, as well as all state cost-shared agricultural practices, as well as those from watershed associations and NGOs
• Some practices (like riparian buffers and stream restorations) have location data recorded on file but these are not transmitted to the CBP as part of the annual data submission; most other practices (probably including nutrient management) are reported by county
• WVDA plans to use nutrient management planners to assist in tracking and reporting activities while they are in the field
1 from NAS review Achieving Nutrient and Sediment Reduction Goals in the Chesapeake Bay
Application Management March 2014
Page D95
APPENDIX B: ADAPTIVE NUTRIENT MANAGEMENT APPROACH The adaptive nutrient management approach can be used to: • improve nutrient use efficiency • decrease the loss of nutrients to the environment while maintaining yields • evaluate the effectiveness and introduce new nutrient management technologies • test and evaluate the performance of tools and/or techniques for nutrient management that are not currently in use • evaluate post-season site-specific data that can be used to establish future optimal nutrient applications Definition of adaptive nutrient management Adaptive nutrient management is a process used to evaluate and adjust nutrient application and utilization strategies over time (multiple seasons). The process allows for continued adjustments of the NRCS-assisted Conservation Practice Standard (CPS) Code 590, Nutrient Management to achieve better nutrient use efficiency. Adaptive nutrient management promotes the coordination of amount (rate), source, timing, and placement (method of application) of plant nutrients to minimize nutrient losses. Nutrient Management Practice (CPS Code 590) and the adaptive nutrient management process State-approved adaptive nutrient management activities are considered in compliance with the operation and maintenance requirements of the CPS Code 590, Nutrient Management, and step 9 of Title 180, National Planning Procedures Handbook (NPPH), Part 600, Subpart A, Section 600.11. The Adaptive Management Process – Plan, review, learn, adapt. Nutrient management plans, including adaptive nutrient management, require periodic reviews involving the grower and a nutrient planning specialist. The goal of planning in nutrient management is to coordinate the amount, source, placement, and timing of nutrient applications to protect the environment, lower production costs, and maximize the realized profit from each field or subfield. While all nutrient management strategies involve initial planning or predicting, most involve only implementation of the plan and do not include a structured or systematic evaluation component. Where adaptive nutrient management is different is in explicitly and systematically incorporating evaluation as part of the process, using those evaluations to guide management in current and future years. With adaptive management, the purpose of the review is to use data collected from the field to evaluate how well the planned or implemented practice worked, identify how it could be improved, and make adjustments to the plan, as needed, to further improve nutrient use efficiency and reduced nutrient losses. In adaptive management, such evaluations are done at least once a year. If in-season adaptive management tools are used, such review is done twice a year. The most critical review of the plan and feedback data from evaluation tools happens during the winter when farmers meet as groups or one-on-one with an advisor to discuss management, collected information, and ways to adapt management in the next season to increase efficiency. How the adaptive nutrient management process works Adaptive nutrient management is a process for evaluating and adjusting nutrient management based on data collected at the field level following a set of protocols. Adaptive management (fig. 1) can help producers make better nutrient management decisions leading to reduced nutrient inputs, higher yields, increased profits, and improved environmental benefits such as water quality.
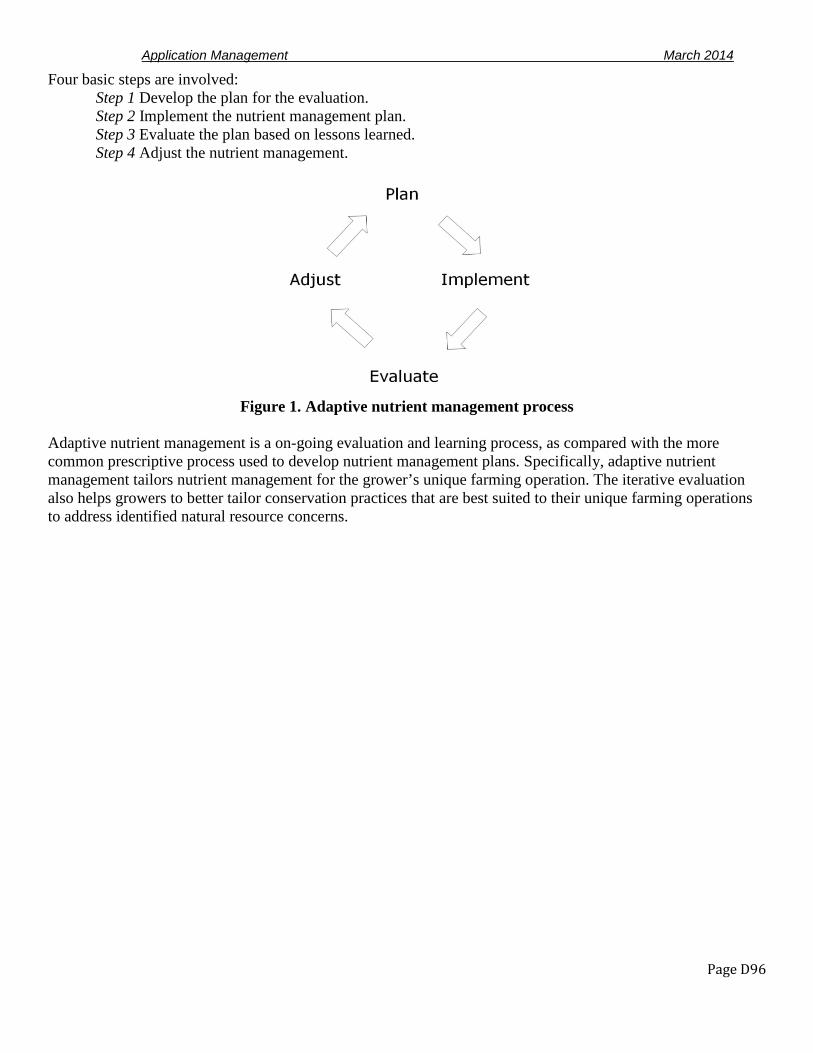
Application Management March 2014
Page D96
Four basic steps are involved: Step 1 Develop the plan for the evaluation. Step 2 Implement the nutrient management plan. Step 3 Evaluate the plan based on lessons learned. Step 4 Adjust the nutrient management.
Figure 1. Adaptive nutrient management process
Adaptive nutrient management is a on-going evaluation and learning process, as compared with the more common prescriptive process used to develop nutrient management plans. Specifically, adaptive nutrient management tailors nutrient management for the grower’s unique farming operation. The iterative evaluation also helps growers to better tailor conservation practices that are best suited to their unique farming operations to address identified natural resource concerns.
Application Management March 2014
Page D97
APPENDIX C: MARYLAND NUTRIENT MANAGEMENT REGULATIONS (EXCERPTS) COMAR 15-20-07 defines NMP as “a plan prepared by a certified nutrient management consultant to manage the amount, placement, timing, and application of animal manure, fertilizer, biosolids, or other plant nutrients in order to minimize nutrient loss or runoff, and maintain the productivity of soil when growing agricultural products.” At this time all operators who use chemical fertilizer, animal manure, and/or biosolids must have a NMP addressing both N and P as the limiting nutrients on that agricultural operation. COMAR 15-20-08 A nutrient management plan prepared for an agricultural operation indicates how primary nutrients are to be managed annually on farm fields for plant and crop production and for the protection of water quality. Plans contain recommendations to the agricultural operator based on expected crop yield or plant production goals, existing nutrient levels in the soil, organic residuals, optimum timing and placement of nutrients, environmental protection, and normal agricultural practices, such as liming, tillage, and crop rotation. The Department certifies and licenses qualified individuals to prepare plans under COMAR 15.20.04 and requires agricultural operations to implement the plans under COMAR 15.20.07.
The performance and technical standards provided in this subtitle are found in the Department of Agriculture's Maryland Nutrient Management Manual, which is incorporated by reference in COMAR 15.20.07.02.
NMPs will contain identification and a map in addition to D. Plan Elements. A plan shall contain the following, when applicable:
(1) All nutrient recommendations for the period the plan is effective, including crop rotations or recommendations for alternative cropping plans, if applicable, within specific field or management unit information, described under §E of this regulation; (2) The type and average number of animals annually raised, maintained, or housed on the agricultural operation; (3) The quantities of animal manure or waste produced and available from animal housing or waste storage structures during the period the plan covers; (4) The total animal manure used as crop nutrients, including manure from on-farm and off-farm sources, and its nutrient analysis; (5) The quantity of animal manure or waste and location of alternative use, including land application off-site, processing, composting, or other uses of unused animal manure or waste; (6) The source and type of information used to determine expected crop yield or plant production goal; (7) Any recommendation to change management, install additional best management practices, or implement alternative technologies to reduce risk potential for nutrient movement; (8) Any recommendation to ensure efficient application of fertilizers; and (9) Any determination of the limiting nutrient as required under Regulation .04 of this chapter, including use of a risk analysis tool indicating the potential for nutrients to move into surface water or ground water, based on current conditions. E. Field or Management Unit Specific Information. A plan shall contain data for each field or area where nutrients will be applied and shall include: (1) The date the recommendations are prepared or updated; (2) An account identification number; (3) The watershed location code; (4) The field or management unit number or identifier and acreage;
Application Management March 2014
Page D98
(5) A soil analysis; (6) The expected crop or plant and expected crop yield or plant production goal for the period covered by the plan; (7) Any crop rotation or recommendation for alternative cropping plans, if applicable, to:
(a) Provide the operator greater flexibility, and (b) Minimize the need for a plan update;
(8) The primary nutrient requirements based on expected crop yield or plant production goals; (9) Any available nutrients in the soil from the previous crop and mineralization and bioavailability assumptions for organic nutrient sources; (10) The nutrients to be applied from all fertilizer sources to meet the crop or plant nutrient requirements; (11) Any recommendation for:
(a) The liming of the soil, (b) The application time for nutrients, including split applications, and the use of diagnostics to determine crop nutrient requirements, (c) Any nutrient application method, (d) The need to calibrate application equipment, (e) The incorporation of natural organic fertilizers, and (f) Any management strategy to achieve soil fertility within an optimal range; and
(12) Current or recommended tillage method. F. Summary of Nutrient Recommendations. A plan shall contain a summary section that lists the following information for each farm field or management unit: (1) The field or management unit identifier or number; (2) The field or management unit acreage; (3) The expected crop or plant; (4) The expected crop yield or plant production goals for the period covered by the plan; (5) Any recommended nutrient rates; (6) The amount and type of nutrients, including chemical fertilizer or natural organic fertilizer, per acre or management unit; (7) The nutrient application method and, if application method requires incorporation of the nutrient, timing for incorporation; and (8) Any liming recommendations, if needed. .05 Nutrient Management—Required Plan Recommendations. A. A certified nutrient management consultant or certified farm operator shall address all of the elements and use the criteria described in §§B—I of this regulation to determine recommendations in a nutrient management plan. A consultant's or certified farm operator's recommendations shall be consistent with the Department technical standards and criteria as provided in the Maryland Nutrient Management Manual, Sections I, II, and III. B. Nutrient Rates. (1) Nutrient rates of the primary nutrients shall be calculated for plant growth requirements of the crop. (2) Plant growth requirements shall be based on one of the following:
(a) University of Maryland Plant or Crop Nutrient Recommendations, as provided in the Maryland Nutrient Management Manual, Section I-B; or (b) Alternative standards, as provided in scientifically validated data for the development of a nutrient management plan acceptable to the Department.
Application Management March 2014
Page D99
(3) A consultant or certified farm operator may recommend the use of lime, secondary nutrients, or micronutrients needed for optimal plant growth. (4) A consultant or certified farm operator may recommend nutrient rates that deviate from University of Maryland Plant or Crop Nutrient Recommendations and alternative standards provided in the Maryland Nutrient Management Manual, Section I-B, for application on farm test plots with prior approval from the Department. (5) A consultant or certified farm operator may recommend nutrient rates based on a single variety tissue sample when used in conjunction with a soil sample. C. Expected Crop Yield or Production Goal. (1) The calculation of expected crop yield shall be based upon one of the following:
(a) An average of the 3 highest-yielding years for the crop out of the latest consecutive 5-year cropping sequence; or (b) If yield information exists for more than 5 years for a given field or management unit, crop yield calculations may be based on the average of 60 percent of the highest-yielding years for all consecutive years that crop yield information is available.
(2) If field or management unit-specific yield or plant production goal information is unavailable or unrepresentative due to the inclusion of new seed varieties, irrigation, or new technologies, a consultant or certified farm operator shall use one of the following:
(a) Any soil productivity information; (b) The average yield based upon an average of the 3 highest-yielding years for the crop out of the latest consecutive 5-year cropping sequence from nearby fields or management units with similar soil type and management conditions; or (c) Any data acceptable to the Department.
(3) A consultant shall document what information was used as the basis for determining expected yield goal as part of the consultant's record-keeping requirements. D. Soil Analysis Results. (1) Soil analysis results for each field or management unit shall be based on standard soil sampling and analysis methods acceptable to the Department. (2) Soil Samples. Variations from the standard sampling process shall be documented by the consultant or certified farm operator and may include:
(a) Soil samples collected from larger fields or acreage with uniform characteristics, including soil types, moisture, or fertility management history; crop rotations may be sampled as one management unit; (b) Soil samples from fields, such as those common to strip cropping, which may be combined if the soils, previous cropping history, and soil fertility management are similar; and (c) Any specialized production unit which may warrant smaller sampling units.
(3) Soil analysis results for a plan are valid for 3 years, except if the following conditions exist and are documented by the consultant or certified farm operator:
(a) A less frequent soil analysis is required to implement a management system based on new technologies; (b) The management system does not require any nutrient application; or (c) The management system requires nutrient application at a frequency less than once every 3 years.
(4) A recommendation for more than one planting season or crop may be made if anticipated soil fertility changes from the following are documented:
(a) Previous and future crop rotations; and (b) Residual soil nutrients and nutrients used for previous crops.
Application Management March 2014
Page D100
E. Determination of Limiting Nutrient. (1) A consultant or certified farm operator shall:
(a) Use the criteria in this section to determine which nutrient is the limiting factor in the application of nutrients; and (b) Recommend subsequent nutrient management strategies consistent with this section.
(2) Soil fertility shall be used as an indicator of whether nutrient recommendations should be adjusted to address potential nutrient pollution problems. (3) If the soil sample analysis results show a phosphorus fertility index value (FIV) of less than 150, nutrient recommendations may use nitrogen plant needs as the limiting factor. (4) Phosphorous.
(a) If the soil sample analysis results show a phosphorus fertility index value (FIV) of 150 or greater, a phosphorus site index or other phosphorus risk assessment method acceptable to the Department, as provided in the Maryland Nutrient Management Manual, Section II-B, shall be used to determine the potential risk of phosphorus loss due to site characteristics. (b) If the risk for potential movement of phosphorus from the site is low according to the phosphorus site index, nutrient recommendations by the consultant or certified farm operator may use nitrogen plant needs as the limiting factor. (c) If the risk for potential movement of phosphorus from the site is medium according to the phosphorus site index:
(i) Nutrient rates shall be based on nitrogen plant needs as the limiting factor no more than 1 out of every 3 years. Phosphorus rates the other 2 years shall be limited to the expected amount removed from the field by the crop or plant harvest, or the amount indicated by soil testing in accordance with the recommendations described in the Maryland Nutrient Management Manual, Section I-B, whichever is greater; or (ii) Nutrient recommendations may use nitrogen plant needs as the limiting factor if BMPs are implemented by the operator and address site or management characteristics to reduce the risk of phosphorus loss to low.
(d) If the risk for potential movement of phosphorus from the site is high according to the phosphorus site index:
(i) Phosphorus rates shall be limited to the expected amount removed from the field by the crop or plant harvest, or the amount indicated by soil testing, in accordance with the recommendations described in the Maryland Nutrient Management Manual, Section I-B; or (ii) If BMPs are implemented by the operator, and address site or management characteristics to reduce the risk of phosphorus loss to medium, nutrient rates may be based on nitrogen plant needs as the limiting factor not more than 1 out of every 3 years. Phosphorus rates the other 2 years shall be limited to the expected amount removed from the field by the crop or plant harvest, or the amount indicated by soil testing or in accordance with recommendations described in the Maryland Nutrient Management Manual, Section I-B, whichever is greater.
(e) If the risk for potential movement of phosphorus from the site is very high according to the phosphorus site index:
(i) No additional phosphorus may be applied; or (ii) If BMPs are implemented by the operator, and address site or management characteristics to reduce the risk of phosphorus loss to high, recommended rates of application of phosphorus shall be limited to the expected amount removed from the field by the crop or plant harvest, or the amount indicated by soil testing in accordance with recommendations described in the Maryland Nutrient Management Manual, Section I-B.
(5) Before the deadlines set forth in COMAR 15.20.07.03 for the development of a phosphorus-based plan, a certified nutrient management consultant or certified farm operator may use:
Application Management March 2014
Page D101
(a) The requirements of §E(1)—(3) of this regulation as a planning tool to determine if future management changes are indicated by the P index, and if development of a phased-in approach to a phosphorus-based plan should be recommended; or (b) §E(1)—(3) of this regulation as a guide to determine nutrient management recommendations.
F. Natural Organic Fertilizer. (1) An agricultural operator who uses natural organic fertilizer shall determine its nutrient value as specified in this section. (2) Test results for natural organic fertilizer shall be determined by an operator, consultant, or certified farm operator using standard sampling and analysis methods acceptable to the Department. (3) The consultant or operator shall conduct animal manure or waste analysis as close to application time as possible, or a consistent baseline for nutrient content may be established and used from analysis results taken at least twice a year until a uniform value is confirmed, and then for every second year thereafter to verify its consistency. If significant changes occur, including feed, management, animals, or storage, a new analysis for nutrient content shall be determined by the consultant or operator for the new manure. (4) Biosolids analysis shall be conducted according to COMAR 26.04.06.09A(13)(d) as close to nutrient application time as possible, but at least once a year. If changes occur in a sewage treatment facility, or routine biosolids analysis reveals a significant change in available nutrient content during the permit period, nutrient application rates shall be adjusted accordingly by the consultant, or certified farm operator, or the operator. (5) Analysis of any other natural organic fertilizer or organic materials shall be conducted by the operator as close to nutrient application time as possible, but at least once a year. (6) Calculations for nutrient content from natural organic fertilizer shall consider mineralization rates and plant availability rates for different forms and sources of organic nutrients. Mineralization of organic nitrogen from the 2 previous years of natural organic fertilizer applications shall be accounted for in the plan. G. Application Method for Nutrients. A consultant or certified farm operator shall consider the following when making recommendations on nutrient application methods in a plan: (1) Nutrient application shall be made to minimize nitrogen and phosphorus losses to waters and nitrogen volatilization losses to the atmosphere; (2) Techniques to achieve accurate and uniform application of nutrients shall be recommended by the consultant or certified farm operator and shall be used by the operator; (3) Split application of nitrogen on soils identified as having a high leaching potential; (4) Measures to minimize or control nutrient movement to sensitive areas, including natural or existing wetlands, sinkholes, and steep slopes; and (5) Recommendations shall ensure efficient application of fertilizers and may include crop rotation, agronomic practices, tillage, and cover crop management. H. Timing of Nutrient Application. Timing for nutrient applications, as recommended by a consultant or certified farm operator and conducted by an operator, shall: (1) Be as close to plant nutrient uptake periods as possible; (2) Maximize plant utilization efficiency and minimize the potential for nutrient movement; and (3) Be consistent with the guidelines contained in the Maryland Nutrient Management Manual, Section I-D. I. Manure Management. When an agricultural operation either produces animals or integrates animal manure use with crop production, a consultant or certified farm operator shall: (1) Take into account the current manure management measures being used to store, stockpile, and handle animal manure and waste nutrients associated with animal production in order to make appropriate recommendations for application rates, timing, and methods;
Application Management March 2014
Page D102
(2) Evaluate existing conditions and procedures and advise the operator when manure management changes, such as improved stockpiling or storage facilities, would minimize the potential for nutrient loss or runoff or improve nutrient use efficiency and proper timing of manure utilization; and (3) Take into account animal manure or waste nutrients associated with animal production and all other sources of nutrients when making recommendations. .06 Nutrient Management for Container or Out-of-Ground Agricultural Production — Additional Required Plan Content. A. A certified nutrient management consultant or certified farm operator shall prepare, and an operator of container or out-of-ground agricultural production shall conform to the requirements of §§B—H of this regulation, in addition to applicable requirements described in this chapter, when developing and implementing, a nutrient management plan. B. Plan Elements. A plan shall contain a summary of planned plant production applicable to the site, including: (1) A listing of plants to be grown by name, species, and variety and cultivar or both; however, if more than 20 different kinds of plants are grown, general plant categories may be used, such as herbaceous, deciduous shrub, coniferous evergreen, broadleaf evergreen, or trees; (2) The estimated greatest number of plants, units, or containers that will be in production at any one time during a calendar year and the month this will occur; (3) The estimated percentages of plants, units, or containers in the following container size categories:
(a) Less than 1 gallon (less than 2,492 cubic centimeters container volume), (b) From 1 to 3 gallons (2,492 to 12,164 cubic centimeters), (c) Greater than 3 gallons and less than 15 gallons (more than 12,164, but less than 45,376 cubic centimeters), or (d) 15 gallons or greater (45,376 cubic centimeters or more);
(4) An inventory, which may include projected changes during the life of the plan, taken by the operator for any purpose within 12 months of completion of the plan, which shall meet the requirements of §B(1), (2), and (3) of this regulation, if the inventory is representative of planned production during the period covered by a nutrient management plan; (5) Total growing area under the plan, which may include projected changes in growing area planned to take place during the life of the plan. C. Summary of Nutrient Recommendations. A plan shall contain summary information on the total amount of primary nutrients recommended for each calendar year covered by the plan, including: (1) The estimated total amounts of nitrogen, phosphorus, and potash; (2) A listing of all sources of nutrients; (3) The estimated amounts of each source of nutrients to be applied for each quarter of the year; and (4) A listing or description of the application method or methods for each nutrient. D. Assessment of Environmental Risk. A nutrient management plan shall contain an assessment of the risk of nutrient losses to surface water, using the Environmental Risk Assessment for out-of-ground production provided in the Maryland Nutrient Management Manual, Section II-D. E. General Management Recommendations. A plan shall contain general recommendations to ensure efficient application of nutrients, including: (1) The calibration of equipment; (2) The timing and application methods for water and nutrients; (3) Management options to maximize the efficient use of water;
Application Management March 2014
Page D103
(4) Any operator management options to reduce nutrient losses; and (5) Any other best management practices that may be applicable as provided in the Maryland Nutrient Management Manual, Section II-E. F. Specific Management Recommendations. A consultant or certified farm operator shall recommend growing area or section-specific management techniques to improve water use efficiency and minimize nutrient losses, including the following: (1) Grouping plants to improve water and nutrient usage; (2) Monitoring water and nutrient needs of plants; (3) Increasing the percentage of water and nutrients entering the plant root zone; (4) Reducing the amount of leachate or runoff; and (5) Reducing or containing the flow of water from growing areas. G. Program for Monitoring Runoff. A nutrient management plan shall include recommendations to monitor runoff, as required in Regulation .07C of this chapter, including recommendations on methods, frequency, and locations of monitoring. H. Plan Maintenance. A plan shall contain information to maintain and update the plan. General comments about plan maintenance may be summarized, but shall include: (1) The length of time the plan is effective, not to exceed 3 years; and (2) Identification of changes in the agricultural operation that would require the original plan to be modified or updated, including a:
(a) Change in area managed of 20 percent or greater, or 5 acres, whichever is less, or (b) Substantial change in a production plan or method.
.07 Nutrient Management—Required Plan Recommendations for Container or Out-of-Ground Production. A. Nutrient Recommendations. A certified nutrient management consultant or certified farm operator shall evaluate production cycles and methods and make nutrient recommendations based on at least one of the following: (1) The label recommendations on fertilizer products for the plants being grown or similar plants; (2) The recommendations of the University of Maryland Cooperative Extension for the specific plants being grown or for similar plants; (3) The recommendation from other state universities for the specific plants being grown or for similar plants; (4) The data from research done by accredited universities on the specific plants being grown or similar plants; (5) The general nutrition guidelines for similar plants; or (6) Any generally accepted growing practices for plants under comparable growing conditions. B. Management Recommendations. (1) A consultant or certified farm operator shall use the Environmental Risk Assessment for out-of-ground production, as provided in the Maryland Nutrient Management Manual, Section II-D, to identify the potential risk to the environment of nutrient movement from out-of-ground growing areas. (2) For growing areas where there is zero or low risk of nutrient movement from the site, recommendations shall be made to maintain this zero or low level of risk. (3) For growing areas where there is medium risk of nutrient movement:
(a) Management recommendations shall be made to minimize the risk of nutrients moving to, or reaching, surface waters; and
Application Management March 2014
Page D104
(b) The consultant or certified farm operator shall recommend that the operator or other person responsible for irrigation and nutrient management attend Department-approved training on best management practices for out-of-ground production to minimize nutrient losses.
(4) For growing areas where there is high risk of nutrient movement: (a) Management recommendations shall be made for individual growing areas, as well as for the operation as a whole, to reduce the risk of nutrients moving to, or reaching, surface waters; (b) The consultant or certified farm operator shall recommend that the operator or other person responsible for irrigation and nutrient management attend Department-approved training on best management practices for out-of-ground production that teaches how to minimize nutrient losses; and (c) Only controlled release fertilizer shall be recommended for use until management changes reduce the risk of nutrient loss to medium.
(5) In recommending field or management unit practices to reduce or minimize nutrient losses, a consultant or certified farm operator shall consider the following:
(a) The appropriate nutrient application methods; (b) Nutrient application timing; and (c) Any plant nutrient needs.
(6) Timing of nutrient application shall be as close to plant nutrient uptake as possible, except in the case of controlled release fertilizer, which may be applied at any time. C. Recommendations for Monitoring Runoff. Unless an operation is assessed as zero risk for nutrient loss from the site, as provided in the Maryland Nutrient Management Manual, Section II-D, the nutrient management consultant shall recommend a monitoring program, including the following: (1) The periods for monitoring when plant nutrients can reasonably be expected to be available; (2) The locations immediately next to growing areas or areas where runoff or overflow from collection basins enters surface water, municipal stormwater, or drainage inlets; and (3) The frequency of sampling for nutrients:
(a) Where the risk of nutrient movement from any growing area is low, monitoring shall include samples for testing a minimum of two different times during each growing season or cycle from each location; and (b) Where the risk of impacting surface water is medium or high, monitoring recommendations shall be conducted monthly when nutrients are being applied.
D. Methods of Sampling and Testing. Samples may be analyzed by the operator or consultant on-site using calibrated electrical conductivity (EC) or nutrient meters. To evaluate the accuracy of on-site test results, at least two samples per year shall be split, with one part being sent to an independent laboratory for analysis.
Application Management March 2014
Page D105
APPENDIX D: PENNSYLVANIA NUTRIENT MANAGEMENT REGULATIONS (EXCERPTS)
Act 38 Regulations Subchapter D. NUTRIENT MANAGEMENT § 83.201. Definitions Plan—Nutrient management plan— (i) A written site-specific plan which meets the requirements in the act, and in § § 83.271, 83.272 and 83.281—83.381. CAO—Concentrated animal operation—Agricultural operations with eight or more animal equivalent units where the animal density exceeds two AEUs per acre on an annualized basis. VAO—Voluntary agricultural operation— (i) Any operation that voluntarily agrees to meet the requirements of this subchapter even though it is not otherwise required under the act or this chapter to submit a nutrient management plan. (ii) The term includes agricultural operations applying for financial assistance under the act. § 83.207. Compliance assistance and enforcement. (a) The Department of Agriculture will assist the Commission in developing programs to assist those engaged in production agriculture to comply with the act and this subchapter. (b) The Department of Agriculture will act as an ombudsman to help resolve issues related to county conservation district implementation of the act and this subchapter for those conservation districts delegated nutrient management program responsibilities under § 83.241 (relating to delegation to local agencies). (c) The Commission will be responsible for taking enforcement actions under the act and this subchapter. In the exercise of its enforcement authority, the Commission will be assisted by the staff of the Department for actions resulting in violations of The Clean Streams Law (35 P. S. § § 691.1—691.1001) and will be assisted by the Department of Agriculture for all other violations. Commission—The State Conservation Commission established by the Conservation District Law (3 P. S. § § 849—864). § 83.241. Delegation to local agencies. (a) The Commission may by written agreement delegate to a conservation district one or more of its administrative or enforcement authorities under the act. (b) The delegation of administrative or enforcement authority may be made to a conservation district when the district demonstrates it has or will have an adequate program and sufficient resources to accept and implement the delegation. § 83.272. Content of plans. (e) The only nutrient elements of concern to be addressed by BMPs in the plan, based on their potential to impact the quality of surface water or groundwater, are nitrogen and phosphorus. Unless the context clearly indicates otherwise, ‘‘nutrients’’ as used in this subchapter means nitrogen and phosphorus. (f) The plan must list potassium crop needs, and potassium application rates, from all nutrient sources, to ensure that adequate soil fertility levels are addressed to meet crop production goals.
Application Management March 2014
Page D106
§ 83.272. Content of plans Required elements of a NMP include:
• The crop rotation planned to be used on the operation. • The total acreage of land of the agricultural operation on which nutrients shall be applied. • The total number of AEUs on the operation, and the number of AEUs per acre on the agricultural
operation. • The identification of all soil types and slopes on the agricultural operation. • The location of areas where manure application is restricted.
Phosphorus. The plan must include an appendix containing information and calculations used to comply with § 83.293(c) (relating to determination of nutrient application rates). If the Phosphorus Index is used, the information must include the completed Phosphorus Index spreadsheet or other similar information summary which lists the individual source and transport factor values, as appropriate, and the final Phosphorus Index result, for each individual area evaluated on the operation, as developed under the Phosphorus Index. Soil test results. § 83.282. Summary of plan. (a) The plan must contain a summary that includes:
(1) A manure summary table listing: (i) The total amount of manure planned to be generated on the operation annually. (ii) The total amount of manure planned to be used on the operation annually. (iii) The total amount of manure planned to be exported from the operation annually.
(2) A nutrient application summary documenting the planned nutrient applications for each crop management unit listing:
(i) Acres. (ii) Expected yield. (iii) Nutrients applied as starter chemical fertilizer. (iv) Planned manure application period. (v) Planned manure application rate and type of manure to be applied. (vi) Planned manure incorporation time. (vii) Rate of other organic nutrient sources planned to be applied. (viii) Other nutrients applied through chemical fertilizer.
NUTRIENT APPLICATION § 83.291. Determination of available nutrients. (a) The plan must address each type of nutrient source generated or planned to be used on the agricultural operation, including: manure, biosolids, compost, commercial fertilizers and other nutrient sources. Nitrogen and phosphorus are the only nutrient elements of concern to be addressed by BMPs in the plan. (b) The plan must list potassium crop needs, and potassium application rates, from all nutrient sources, to ensure that adequate soil fertility levels are addressed to meet crop production goals. (c) The amount and nutrient content of each manure group generated on the agricultural operation shall be documented in the plan as follows:
Application Management March 2014
Page D107
(1) List the average number of animals for each manure group, on the agricultural operation. (2) List the amount of manure generated and when it is available for land application on the agricultural operation or for other planned uses.
(i) If actual manure production records are available for the operation, these records shall be used for determining the manure produced on the operation. (ii) If actual records of manure production do not exist for the operation, the amount of manure produced shall be calculated based on the average number of animal units on the agricultural operation, and the storage capacity of manure storage facilities, if present. The plan must include the calculations or variables used for determining the amount of manure produced on the operation.
(3) Test the nutrient content of manure as follows: (i) Analytical manure testing results shall be used in the development of the plan. These manure tests must include an analysis of the percent solids, total nitrogen (as N), ammonium nitrogen (as NH4-N), total phosphate (as P2O5) and total potash (as K2O), for each manure group generated on the operation, and these analytical results shall be recorded in the plan. (ii) These manure analyses shall be performed using manure sampling and chemical analysis methods which accurately represent the contents of the manure. Methods described in the Pennsylvania Agronomy Guide may be used to meet this requirement. Other methods shall be approved by the Commission. (iii) For newly proposed operations, and for manure groups on existing operations where sampling and analysis are not possible prior to initial plan development, the following applies:
(A) The plan must use either standard book values, or analytical results from a similar facility as approved by the Commission or delegated conservation district. (B) Standard book values contained in the Pennsylvania Agronomy Guide may be used to meet this requirement. Other values shall be approved by the Commission. (C) A similar facility is one that uses similar animal housing, animal groups, feeding practices and wastewater management. (D) The nutrient content of the manure, as determined in clauses (A)—(C), shall be recorded in the plan. (E) Samples and chemical analysis of the manure generated on the operation shall be obtained within 1 year of implementation of the approved plan, and the requirements of § 83.371 (relating to plan amendments) shall be followed as applicable.
(iv) The nutrient content of manure deposited on pastures by grazing animals shall be determined using the methods contained in subparagraph (vi). (v) After approval of the initial plan, manure tests are required to be taken annually for each manure group generated on the operation. (vi) The testing described in this subsection will not be required for manure groups associated with less than five AEUs of livestock or poultry at an operation. For these small quantity manure groups, the nutrient content of the manure may be determined using standard book values which represent the contents of the manure for the operation. Standard book values contained in the Pennsylvania Agronomy Guide may be used to meet this requirement. Other values shall be approved by the Commission or delegated conservation district.
Application Management March 2014
Page D108
(vii) Testing of manure groups may be consolidated when two or more manure groups on the same operation are produced by the same animal type and are managed in a similar manner.
(d) The nitrogen available from manure shall be based on availability factors which accurately represent the characteristics of the manure. Factors described in the Pennsylvania Agronomy Guide may be used to meet this requirement. Other methods shall be approved by the Commission. The plan must include the amount of nitrogen available in the manure, and the planned manure incorporation time used to determine the nitrogen available. (e) The residual nitrogen from legume crops and previous applications of manure shall be determined using values which represent the common nitrogen residuals from the past crops and manure applications at the operation. Standard book values contained in the Pennsylvania Agronomy Guide may be used to meet this requirement. Other values shall be approved by the Commission. The values shall be recorded in the plan and credited when determining nutrient application rates. Acreage and realistic expected crop yields for each crop management unit. When developing the initial NMP, soil tests shall be conducted for each crop management unit on the operation, to determine the level of phosphorus (as P), potassium (as K), and soil pH. Soil tests conducted within the previous 3 years prior to submitting the initial plan are acceptable. After the approval of the initial plan, soil tests are required for each crop management unit at least every 3 years from the date of the last test. Based on the soil tests in subsection (e), the plan must include recommendations for the amount of nitrogen (as total N), phosphorus (as P2O5) and potassium (as K2O) necessary for realistic expected crop yields. § 83.293. Determination of nutrient application rates. (a) Application rate. Application rates shall be developed to protect surface water and groundwater using BMPs as described in the plan. The manure application rate shall be the lesser of the following:
(1) A rate equal to or less than the balanced manure application rate based on nitrogen as determined under subsection (b). (2) The rate as determined under subsection (c).
(b) Nitrogen. Land application of manure and other nutrient sources on cropland, hayland and pastures shall be managed to minimize the effects of nitrogen losses from fields. The rate may not exceed the amount of nitrogen necessary to achieve realistic expected crop yields or the amount of nitrogen the crop will utilize for an individual crop year.
(1) The balanced manure application rate based on nitrogen shall be determined by first subtracting the amount of available residual nitrogen and any applied nitrogen, such as nitrogen applied in starter fertilizer, from the amount of nitrogen necessary for realistic expected crop yields, and then dividing that amount by the available nitrogen content of the manure as determined under § 83.291 (relating to determination of available nutrients). (2) The calculations and variables used for determining the balanced manure application rates based on nitrogen shall be recorded in the plan.
(c) Phosphorus. Land application of manure and other nutrient sources on cropland, hayland and pastures shall be managed to minimize the effects of phosphorus losses from fields. Methods for determining and managing the risk of phosphorus loss, and related water quality impacts, must comply with the following:
(1) Determine the risk of phosphorus loss and related water quality impacts based on relevant factors including the following:
(i) Soil phosphorus levels.
Application Management March 2014
Page D109
(ii) The method, rate and timing of phosphorus application. (iii) Runoff and soil loss potential for the application area. (iv) Distance to surface water. (v) The type of phosphorus source being used.
(2) Based on the risks and impacts determined as described in paragraph (1), establish appropriate BMPs such as methods, rates and timing of application designed to minimize the effects of phosphorus losses from fields. These may be addressed by a range of options, including:
(i) Manure application is limited to nitrogen requirements of the crop, if the application of phosphorus to the soil is not expected to pose an immediate risk of impacts to surface water. (ii) Phosphorus application is limited to the level of phosphorus removal from the soil by the crop, if the application of phosphorus to the soil would be expected to pose an immediate risk of impacts to a surface water unless the risk is managed by limiting the application based on phosphorus. (iii) Phosphorus application is completely restricted, if the application of phosphorus to the soil would be expected to pose an immediate risk of impacts to a surface water which cannot be managed by limiting the nutrients based on phosphorus.
(3) For CAOs and VAOs existing on October 1, 2006, the Commission will allow a phase-in period until December 31, 2010, to fully meet the requirements of paragraph (2).
(i) The phase-in shall allow flexibility in controlling phosphorus loss, as long as the phosphorus application rates on any crop management unit where the phase-in is used do not exceed the levels of phosphorus removal from the soil by the crops. (ii) The phase-in in this paragraph also applies to operations that import manure from NMP operations existing on October 1, 2006.
(4) The phase-in period in paragraph (3) does not apply to the following: (i) An operation that commences after October 1, 2006. (ii) An operation that becomes defined as a CAO, due to an increase in animal numbers, after October 1, 2006. (iii) An operation that increases the total AEUs on the operation by 20% or more after October 1, 2006. (iv) An operation that adds a new animal type after October 1, 2006. (v) Fields where the nearest downgradient stream segment which receives runoff from the fields is classified as a special protection water under Chapter 93 (relating to water quality standards).
(5) The criteria and procedures in the current phosphorus application guidance issued by the Commission may be used to comply with paragraphs (1)—(4), including the use of a Phosphorus Index contained in the guidance. (6) If the criteria and procedures in the phosphorus application guidance issued by the Commission are not followed, an alternative method of meeting paragraphs (1)—(4) will be approved by the Commission. (7) For pastures which require complete restrictions on phosphorus application as determined under this section, § 83.294(j) (relating to nutrient application procedures) applies.
(d) General nutrient calculation. The plan must include calculations for each crop management unit indicating the difference between the amount of nitrogen, phosphorus and potassium necessary for realistic expected crop
Application Management March 2014
Page D110
yields under § 83.292 (relating to determination of nutrients needed for crop production) and the nitrogen, phosphorus and potassium applied through all planned nutrient sources, including, but not limited to, manure, biosolids, starter fertilizer and other fertilizers and residual nitrogen. A nitrogen availability test may be used to determine supplemental nitrogen needs. § 83.294. Nutrient application procedures. (a) General. Nutrients shall be applied to fields during times and conditions that will hold the nutrients in place for crop growth, and protect surface water and groundwater using BMPs as described in the plan. (b) Timing. Intended target spreading periods for the application of manure shall be included in the plan. (c) Equipment capabilities. Manure application rates and procedures must be consistent with the capabilities, including capacity and calibration range, of available application equipment. For existing operations using their own application equipment, the plan must include a statement indicating that the existing equipment has been calibrated to ensure implementation of the application rates described in the plan, and that the equipment has the capacity to meet those application rates. If a commercial manure hauler is used, the hauler shall be responsible for ensuring that the equipment is capable of complying with the application rate contained in the plan. (d) Irrigation systems. If manure will be applied using an irrigation system, the following applies:
(1) Application rates for irrigated liquid manure shall be based on the lesser of the following: (i) The planned application rates in gallons per acre determined in accordance with § 83.293(a) (relating to determination of nutrient application rates). (ii) The combination of the following:
(A) The liquid application rate in inches per hour determined to be within infiltration capabilities of the soil. (B) The liquid application depth in inches not to exceed the soil’s water holding capacity within the root zone or any restricting feature at the time of application.
(2) The allowable liquid application rate and application depth shall be based on appropriate factors such as available water holding capacity of the soil, depth of the root zone, depth to a shallow impervious soil layer, soil infiltration rate, soil texture and drainage, vegetation and ground slope. Application BMPs that are consistent with the current versions of Penn State Fact Sheets F254 through F257, as applicable to the type of irrigation system planned to be used on the operation, and the NRAES-89 Liquid Manure Application System Design Manual, may be used to comply with this subsection. Other BMPs shall be approved by the Commission. (3) The plan must include the computations for the application rate (in inches per hour) and application depth (in total inches) of the various application rates, and these applications may not exceed either the infiltration rate or the water holding capacity of the application sites, as listed in the plan.
(e) Manure application at rates greater than 9,000 gallons per acre. If liquid or semisolid manure is planned to be applied at rates greater than 9,000 gallons per acre at any one application time, the rates and amounts shall be limited based on the infiltration rate and water holding capacity of the application areas as described in subsection (d). In those instances, the plan must include the computations for the application rates in inches per hour, and in total inches, for the various application areas, and these applications may not be allowed to exceed either the infiltration rate or the water holding capacity of the application sites, as listed in the plan. (f) Setbacks and buffers. Manure may not be mechanically applied in the following situations:
Application Management March 2014
Page D111
(1) Within 100 feet of the top of the bank of a perennial or intermittent stream with a defined bed and bank, a lake or a pond, unless a permanent vegetated buffer of at least 35 feet in width is used, to prevent manure runoff into the stream, lake or pond. (2) Within 100 feet of an existing open sinkhole unless a permanent vegetated buffer of at least 35 feet in width is used. (3) Within 100 feet of active private drinking water sources such as wells and springs. (4) Within 100 feet of an active public drinking water source, unless other State or Federal laws or regulations require a greater isolation distance. (5) On crop management units having less than 25% plant cover or crop residue at the time of manure application, unless:
(i) For fall applications, the crop management unit is planted to a cover crop in time to allow for appropriate growth to control runoff until the next growing season, or the manure is injected or mechanically incorporated within 5 days using minimal soil disturbance techniques consistent with no-till farming practices. The Pennsylvania Technical Guide contains practices which may be used to satisfy this requirement. Other practices shall be approved by the Commission. The practices must be consistent with those in the agricultural erosion and sediment control plan. (ii) For applications in the spring or summer, the crop management unit is planted to a crop that growing season. (iii) For winter applications, the crop management unit is addressed under subsection (g).
(g) Winter application. For winter application of manure, the following apply: (1) The application procedures shall be described in the plan. (2) The plan must list the following:
(i) The crop management units where winter application is planned or restricted. (ii) The application procedures that will be utilized at those crop management units. (iii) The field conditions that must exist for winter application.
(3) Setbacks listed in subsection (f) shall be implemented. In addition, during winter manure may not be mechanically applied in the following situations:
(i) Within 100 feet of an above-ground inlet to an agricultural drainage system, if surface flow is toward the aboveground inlet. (ii) Within 100 feet of a wetland that is identified on the National Wetlands Inventory Maps, if the following are met:
(A) The wetland is within the 100-year floodplain of an Exceptional Value stream segment. (B) Surface flow is toward the wetland.
(4) Fields where manure will be applied in winter must have at least 25% residue, or an established cover crop. The BMPs contained in the Pennsylvania Technical Guide may be used to satisfy this requirement. Other practices shall be approved by the Commission.
Pastures requiring phosphorus restrictions. If a pasture has been determined to require total restriction of phosphorus application under § 83.293(c), the risk of phosphorus loss shall be addressed by the following BMPs in lieu of total restriction of phosphorus application:
(1) Grazing may not be conducted within 50 feet of a perennial or intermittent stream, a lake or a pond.
Application Management March 2014
Page D112
(2) A prescribed grazing system shall be used to maintain an established stand of forage on the pasture area. (3) The stocking rate shall be limited to ensure that the level of phosphorus deposited by the animals does not exceed the level of phosphorus removal from the soil by vegetation in the pasture. (4) BMPs contained in the Pennsylvania Technical Guide may be used to meet the requirements in paragraphs (1) and (2). Other BMPs shall be approved by the Commission.
§ 83.321. Stormwater control. (a) In the preparation of a nutrient management plan under this subchapter, the nutrient management specialist shall conduct a review of the adequacy of existing stormwater control practices on croplands, haylands and pastures included in the plan to prevent nutrient pollution of surface water and groundwater. The specialist may confer with NRCS, conservation district staff or others with expertise with nutrient runoff control. Based on this review, the plan must identify critical runoff problem areas. (b) The nutrient management plan shall contain a list of specific stormwater control BMPs to address those critical runoff problem areas identified in the review required under subsection (a). Recordkeeping for nutrients, crop yields, soil tests, and manure generation.
Application Management March 2014
Page D113
APPENDIX E: VIRGINIA NUTRIENT MANAGEMENT REGULATIONS (EXCERPTS) General The VPA General Permit Regulation for Animal Feeding Operations (VPA AFO) General Permit was re-issued on November 16, 2004 after the original 10-year permit expired. The re-issued General Permit will retain the 10-year life, and expires on November 15, 2014. All AFOs with 300 or more confined AUs are covered by the General Permit. 7. Nutrient Management Plans All NMPs must be revised by December 31, 2006 to include the most recent phosphorus management criteria adopted by Virginia DCR. The regulation also specifies that all plans revised after December 31, 2005 will include phosphorus as well as nitrogen limits. Based on this language, a NMP based on nitrogen alone, with no phosphorus application limits specified, will expire on December 31, 2006 regardless of the revision date. VA DCR is expecting to complete amendments to the Nutrient Management Training and Certification regulation in 2005. This regulation will determine the nature of phosphorus limits to be included in the revised NMPs. All NMPs written after December 31, 2005, shall be developed by a certified nutrient management planner in accordance with §10.1-104.2 of the Code of Virginia. This shall be documented by a letter from DCR, and this documentation may be included in the approval letter. The previous permit only specified that the NMP be approved by DCR. Requirements of VA General Permit: 7. The operator shall implement a nutrient management plan (NMP) approved by the Department of Conservation and Recreation. All NMPs written after December 31, 2005, shall be developed by a certified nutrient management planner in accordance with § 10.1-104.2 of the Code of Virginia. The NMP shall be maintained on site. The NMP shall address the form, source, amount, timing, and method of application of nutrients on each field to achieve realistic production goals, while minimizing nitrogen and phosphorus loss to ground and surface waters. NMPs written after December 31, 2005, and NMPs implemented after December 31, 2006, shall also include provisions to minimize phosphorus loss to ground and surface waters according to the most current standards and criteria developed by DCR at the time the plan is written (current version is Virginia Nutrient Management Standards And Criteria Revised October 2005). The NMP shall be enforceable through this permit. The NMP shall contain at a minimum the following information:
a. Site map indicating the location of the waste storage facilities and the fields where waste will be applied; b. Site evaluation and assessment of soil types and potential productivities; c. Nutrient management sampling including soil and waste monitoring; d. Storage and land area requirements; e. Calculation of waste application rates; f. Waste application schedules; and g. A plan for waste utilization in the event the operation is discontinued.
8. Buffer zones shall be maintained as follows: a. Distance from occupied dwellings not on the owner's property ..... 200 feet (unless the occupant of the dwelling signs a waiver of the buffer zone) b. Distance from water supply wells or springs ..... 100 feet c. Distance from surface water courses
Application Management March 2014
Page D114
(1) 100 feet (without a vegetated buffer); or (2) 35-foot wide vegetated buffer; or (3) Other site-specific conservation practices may be approved by the department that will provide pollutant reductions equivalent or better than the reductions that would be achieved by the 100-foot buffer, or 35-foot wide vegetated buffer.
d. Distance from rock outcropping (except limestone) ..... 25 feet e. Distance from limestone outcroppings ..... 50 feet f. Waste shall not be applied in such a matter that it would discharge to sinkholes that may exist in the area.
9. Records shall be maintained to demonstrate where and at what rate waste has been applied, that the application schedule has been followed, and what crops have been planted. From the Virginia Nutrient Management Standards and Criteria, (Revised 2005): In addition to other management practices discussed in this section, animal waste or biosolids shall not be applied within the following setback areas around the specific features listed…
Application Management March 2014
Page D115
APPENDIX F: WEST VIRGINIA NUTRIENT MANAGEMENT REGULATIONS (EXCERPTS)
From Title 47 Legislative Rule, Department Of Environmental Protection, Water Resources: NMP required as part of application: A nutrient management plan that, must, to the extent applicable: • Identify appropriate site-specific conservation practices to be implemented, including as appropriate buffers
or equivalent practices to control runoff of pollutants into the waters of West Virginia; • Identify protocols for appropriate testing of manure, litter, process wastewater, and soil; • Establish protocols to land-apply manure, litter and/or process wastewater in accordance with site-specific
nutrient management practices that ensure appropriate agricultural utilization of the nutrients in the manure, litter and/or process wastewater; and
• Identify specific records that will be maintained to document the implementation and management of the minimum elements described hereinabove.
Annual reporting requirements for CAFOs. The permittee must submit an annual report to the Director, which must include: 13.1.h.4.A. The number and type of animals, as listed in paragraphs 13.1.b.4 and 13.1.b.6 above, whether in
open confinement or housed under roof; 13.1.h.4.B. The estimated amount of total manure, litter or process wastewater generated by the CAFO in
the previous twelve (12) months, measured in tons or gallons; 13.1.h.4.C. The estimated amount of total manure, litter or process wastewater transferred to another person
by the CAFO in the previous twelve (12) months, measured in tons or gallons; 13.1.h.4.D. The total number of acres of land application covered by the NMP developed in accordance
with this rule; 13.1.h.4.E. The total number of acres under the control of the CAFO that were used for land application of
manure, litter or process wastewater in the previous twelve (12) months; 13.1.h.4.F. A summary of all manure, litter or process wastewater discharges from the production area in
the previous twelve (12) months, including date, time, and approximate volume; 13.1.h.4.G. A statement indicating whether the current version of the CAFO’s NMP was developed or
approved by a certified nutrient management planner; and 13.1.h.4.H. The actual crop(s) planted and actual yield(s) for each field, the actual nitrogen and phosphorus
content of the manure, litter or process wastewater, the results of calculations conducted in accordance with parts 13.1.h.5.A.2 and 13.1.h.5.B.4 below, and the amount of manure, litter or process wastewater applied to each field during the previous twelve (12) months; and, for any CAFO that implements a NMP that addresses rates of application in accordance with subparagraph 13.1.h.5.B of this rule, the results of any soil testing for nitrogen or phosphorus taken during the preceding twelve (12) months, the data used in calculations conducted in accordance with part 13.1.h.5.B.4 below, and the amount of any supplemental fertilizer applied during the previous twelve (12) months.
The terms of the NMP with respect to protocols for land application of manure, litter or process wastewater required by subparagraph 13.1.h.1.H above and, if applicable, 40 C.F.R. §412.4(c), must include the fields available for land application; field-specific rates of application, properly developed in accordance with subparagraphs 13.1.h.5.A through 13.1.h.5.B below, to ensure appropriate agricultural utilization of the nutrients in the manure, litter or process wastewater; and any timing limitations identified in the NMP
Application Management March 2014
Page D116
concerning land application on the fields available for such use. The terms must address rates of application using either the linear approach or the narrative rate approach.
13.1.h.5.A. Linear approach. An approach that expresses rates of application as pounds of nitrogen and phosphorus, according to the following specifications: 13.1.h.5.A.1. The terms include maximum application rates from manure, litter or process wastewater for each year of permit coverage for each crop identified in the NMP, in chemical forms determined to be acceptable to the Director, in pounds per acre per year for each field to be used for land application, and certain factors necessary to determine such rates. At a minimum, the factors that are terms must include: the outcome of the field-specific assessment of the potential for nitrogen and phosphorus transport from each field; the crops to be planted in each field or any other uses of a field, such as pasture or fallow fields; the realistic yield goal for each crop or use identified for each field; the nitrogen and phosphorus recommendations from sources specified by the Director for each crop or use identified for each field; credits for all nitrogen in the field that will be plant-available; consideration of multi-year phosphorus application; and accounting for all other additions of plant-available nitrogen and phosphorus to the field. In addition, the terms include the form and source of manure, litter or process wastewater to be land-applied; the timing and method of land application; and the methodology by which the NMP accounts for the amount of nitrogen and phosphorus in the manure, litter, and process wastewater to be applied. 13.1.h.5.A.2. Large CAFOs that use this approach must calculate the maximum amount of manure, litter or process wastewater to be land-applied at least once each year, using the results of the most recent representative manure, litter or process wastewater tests for nitrogen and phosphorus taken within twelve (12) months of the date of land application.
13.1.h.5.B. Narrative rate approach. An approach that expresses rates of application as a narrative rate of application that results in the amount in tons or gallons of manure, litter or process wastewater to be land-applied, according to the following specifications:
13.1.h.5.B.1. The terms include maximum amounts of nitrogen and phosphorus derived from all sources of nutrients for each crop identified in the NMP, in chemical forms determined to be acceptable to the Director, in pounds per acre for each field, and certain factors necessary to determine such amounts. At a minimum, the factors that are terms must include: the outcome of the field-specific assessment of the potential for nitrogen and phosphorus transport from each field; the crops to be planted in each field or any other uses of a field, such as pasture or fallow fields (including alternative crops identified in part 13.1.h.5.B.2 below); the realistic yield goal for each crop or use identified for each field; and the nitrogen and phosphorus recommendations from sources specified by the Director for each crop or use identified for each field. In addition, the terms include the methodology by which the NMP accounts for the following factors when calculating the amounts of manure, litter or process wastewater to be land applied: results of soil tests conducted in accordance with protocols identified in the NMP required by subparagraph 13.1.h.1.G of this rule; credits for all nitrogen in the field that will be plant-available; the amount of nitrogen and phosphorus in the manure, litter or process wastewater to be applied; consideration of multi-year phosphorus application; accounting for all other additions of plant-available nitrogen and phosphorus to the field; the form and source of manure, litter, and process wastewater; the timing and method of land application; and volatilization of nitrogen and mineralization of organic nitrogen. 13.1.h.5.B.2. The terms of the NMP include alternative crops identified in the CAFO’s NMP that are not in the planned crop rotation. Where a CAFO includes alternative crops in its nutrient management plan, the crops must be listed in field, in addition to the crops identified in the planned crop rotation for that field, and the NMP must include realistic crop yield goals and the nitrogen and phosphorus recommendations from sources specified by the Director for each crop. Maximum amounts of nitrogen and phosphorus from all sources of nutrients and the amounts of manure, litter and/or process
Application Management March 2014
Page D117
wastewater to be applied must be determined in accordance with the methodology described in part 13.1.h.5.B.1 above. 13.1.h.5.B.3. For CAFOs using this approach, the following projections must be included in the NMP submitted to the Director, but are not terms of the NMP the CAFO’s planned crop rotations for each field for the period of permit coverage; the projected amount of manure, litter or process wastewater to be applied; projected credits for all nitrogen in the field that will be plant-available; consideration of multi-year phosphorus application; accounting for all other additions of plant-available nitrogen and phosphorus to the field; and the predicted form, source, and method of application of manure, litter or process wastewater for each crop. Timing of application for each field, insofar as it concerns the calculation of rates of application, is not a term of the NMP. 13.1.h.5.B.4. CAFOs that use this approach must calculate maximum amounts of manure, litter or process wastewater to be land-applied at least once each year, using the methodology required by part 13.1.h.5.B.1 above, before land-applying manure, litter or process wastewater and must rely on the following data:
13.1.h.5.B.4.a. A field-specific determination of soil levels of nitrogen and phosphorus, including for nitrogen a concurrent determination of nitrogen that will be plant-available consistent with the methodology required by part 13.1.h.5.B.1 above, and for phosphorus, the results of the most recent soil test conducted in accordance with soil testing requirements approved by the Director; and 13.1.h.5.B.4.b. The results of most recent representative manure litter or process wastewater tests for nitrogen and phosphorus, taken within twelve (12) months of the date of land application, in order to determine the amount of nitrogen and phosphorus in the manure, litter or process wastewater to be applied.