nursing home data compendium 2013 edition€¦ · introduction to the cms nursing home data...
TRANSCRIPT

Nursing Home Data Compendium 2013 Edition


Table of Contents Introduction to the CMS Nursing Home Data Compendium, 2013 .................................... 1
Overview of Contents ....................................................................................................................... 1
Nursing Home Size, Ownership and Certification .............................................................. 1
Survey Findings ................................................................................................................... 2
Nursing Home Residents ..................................................................................................... 2 Methods Used ...................................................................................................................... 3
Data Sources ..................................................................................................................................... 3
CASPER Measures ........................................................................................................................... 3
Number of Nursing Homes and Provider Characteristics ................................................... 3
Average Number of Deficiencies ........................................................................................ 3
Percentage of Surveys with No Deficiencies....................................................................... 3
Percentage of Surveys with Citations for Substandard Quality of Care .............................. 3
Percentage of Surveys with Citations for Abuse ................................................................. 3
Percentage of Surveys with Citations for Improper Restraint Use ...................................... 4
Percentage of Surveys with Citations for Pressure Sores .................................................... 4
Percentage of Surveys with Citations for Actual Harm or Worse ....................................... 4
Percentage of Surveys with Citations for Immediate Jeopardy ........................................... 4
Scope and Severity Distribution by Year ............................................................................ 4
Provider Characteristics for the Resident Section (Section 3) ............................................. 4
United States Census Data................................................................................................................ 4
Resident Characteristics ................................................................................................................... 5
Calculation of Resident-Specific Measures ......................................................................... 5
Number of ADL impairments .............................................................................................. 6
Cognitive Impairment .......................................................................................................... 6
Pain in the Last 5 Days ........................................................................................................ 6
Recent Falls ......................................................................................................................... 6
Pressure Ulcers .................................................................................................................... 6
Any Restraint Use ................................................................................................................ 7
Incontinence ........................................................................................................................ 7
Feeding Tube ....................................................................................................................... 7
Unintended Weight Loss ..................................................................................................... 7
Antipsychotic Use ............................................................................................................... 7
Additional Notes – Changes in Historical Data................................................................................ 7
References ........................................................................................................................................ 7
Nursing Home Data Compendium 2013 i

List of Figures/Tables Section 1.Nursing Home Characteristics
Figure 1.1. Number of Nursing Homes by Year: United States, 2003-2012 ..................................... 11
Figure 1.2. Nursing Homes by Bed Size Category by Year: United States, 2003-2012 ................... 12
Figure 1.3. Nursing Homes by Ownership Type by Year: United States, 2003-2012 .................... 123
Figure 1.4. Nursing Homes by Certification Type by Year: United States, 2003-2012 .................. 134
Figure 1.5. Total Nursing Home Residents, Certified Beds, and Occupancy Rates by Year: United States, 2003-2012 ............................................................................................................ 14
Figure 1.6. Number of Certified Nursing Home Beds Per Thousand Persons Aged 65 Years and Older by State: United States, 2012 ............................................................................... 16
Figure 1.7. Number of Certified Nursing Home Beds Per Thousand Persons Aged 85 Years and Older by State: United States, 2012 ............................................................................... 17
Figure 1.8. Percentage of For Profit Nursing Homes by State: United States, 2012 ......................... 18
Figure 1.9. Percentage of Non-Profit Nursing Homes by State: United States, 2012 ....................... 19
Table 1.1.(a-e) Number of Nursing Homes by Bed Size Category: United States, 2008-2012 .......... 20-24
Table 1.1.f. Number of Nursing Homes by Bed Size Category:United States (2008, 2012 and Change) ........................................................................................................................... 25
Table 1.2.(a-e) Number of Nursing Homes by Ownership Type: United States, 2008-2012 ............. 26-30
Table 1.2.f. Number of Nursing Homes by Ownership Type:United States (2008, 2012 and Change) ................................................................................................ 31
Table 1.3.(a-e) Number of Nursing Homes by Certification Type: United States, 2008-2012 .......... 32-36
Table 1.3.f. Number of Nursing Homes by Certification Type: United States (2008, 2012 and Change) ........................................................................................................................... 37
Table 1.4. Nursing Home Occupancy Rates: United States, 2008-2012 .......................................... 38
Table 1.5. National Population and Number of Certified Nursing Home Beds: United States, 2003-2012 ................................................................................................................................. 39
ii Nursing Home Data Compendium 2013

Section 2. Nursing Home Survey Results
Figure 2.1. Scope and Severity Grid for Rating Nursing Home Deficiencies ............................... 43
Figure 2.2.(a-e) Percentage Distribution of Scope and Severity of Health Deficiency Citations: United States, 2008-2012 ................................................................................................... 44-48
Figure 2.2.f. Percent Change in Distribution of Scope and Severity of Health Deficiency Citations: United States, 2008-2012 ............................................................................................ 49
Figure 2.3. Mean Number of Health Deficiencies Cited in Nursing Home Surveys by Year: United States, 2003-2012 ........................................................................................................ 50
Figure 2.4. Percentage of Nursing Home Surveys Resulting in Zero Health Deficiencies, Actual Harm/Immediate Jeopardy, and Substandard Quality of Care: United States, 2003-2012 ............................................................................................................................. 51
Figure 2.5. Distribution of Scope and Severity of Health Deficiency Citations by Year: United States, 2003-2012 ........................................................................................................ 52
Figure 2.6. Percentage of Nursing Home Surveys Resulting in a Deficiency for Actual Harm or Immediate Jeopardy to Nursing Home Residents by State: United States, 2012 ........ 53
Figure 2.7. Percentage of Nursing Home Surveys Resulting in a Deficiency for Immediate Jeopardy to Nursing Home Residents by State: United States, 2012 .......................... 54
Figure 2.8. Percentage of Nursing Home Surveys Resulting in Zero Deficiencies by State: United States, 2012 ................................................................................................................. 55
Figure 2.9. Percentage of Nursing Home Surveys Resulting in Substandard Quality of Care Deficiencies by State: United States, 2012 ................................................................. 56
Table 2.1.(a-e) Number of Health Deficiencies Cited in Nursing Home Surveys by Bed Size Category: United States, 2008-2012 ....................................................................................... 57-61
Table 2.1.f. Number of Health Deficiencies Cited in Nursing Home Surveys by Bed Size Category: United States (2008, 2012 and Change) ...................................................................... 62
Table 2.2.(a-e) Number of Health Deficiencies Cited in Nursing Home Surveys by Ownership Type: United States, 2008-2012 ....................................................................................... 63-67
Table 2.2.f. Number of Health Deficiencies Cited in Nursing Home Surveys by Ownership Type: United States (2008, 2012 and Change) ...................................................................... 68
Table 2.3.(a-e) Percentage of Nursing Home Surveys Resulting in Zero Health Deficiency Citations by Bed Size Category: United States, 2008-2012 ....................................................... 69-73
Table 2.3.f. Percentage of Nursing Home Surveys Resulting in Zero Health Deficiency Citations by Bed Size Category: United States (2008, 2012 and Change) ................................. 74
Table 2.4. (a-e) Percentage of Nursing Home Surveys Resulting in Zero Health Deficiency Citations by Ownership Type: United States, 2008-2012 .......................................................... 75-79
Table 2.4.f. Percentage of Nursing Home Surveys Resulting in Zero Health Deficiency Citations by Ownership Type: United States (2008, 2012 and Change) .................................... 80
Table 2.5. (a-e) Distribution of Scope and Severity of Health Deficiency Citations: United States, 2008-2012 ........................................................................................................................ 81-85
Nursing Home Data Compendium 2013 iii

Table 2.6. (a-e) Nursing Home Surveys Resulting in a Health Deficiency of Actual Harm or Immediate Jeopardy to Residents by Bed Size Category: United States, 2008-2012 .............. 86-90
Table 2.6.f. Nursing Home Surveys Resulting in a Health Deficiency of Actual Harm or Immediate Jeopardy to Residents by Bed Size Category: United States (2008, 2012 and Change) ...................................................................................................... 91
Table 2.7. (a-e) Nursing Home Surveys Resulting in a Health Deficiency of Actual Harm or Immediate Jeopardy to Residents by Ownership Type: United States, 2008-2012 ................. 92-96
Table 2.7.f. Nursing Home Surveys Resulting in a Health Deficiency of Actual Harm or Immediate Jeopardy to Residents by Ownership Type: United States (2008, 2012 and Change) 97
Table 2.8. (a-e) Nursing Home Surveys Resulting in a Health Deficiency of Immediate Jeopardy to Residents by Bed Size Category: United States, 2008-2012 ................................ 98-102
Table 2.8.f. Nursing Home Surveys Resulting in a Health Deficiency of Immediate Jeopardy to Residents by Bed Size Category: United States (2008, 2012 and Change) .............. 103
Table 2.9. (a-e) Nursing Home Surveys Resulting in a Health Deficiency of Immediate Jeopardy to Residents by Ownership Type: United States, 2008-2012 ................................. 104-108
Table 2.9.f. Nursing Home Surveys Resulting in a Health Deficiency of Immediate Jeopardy to Residents by Ownership Type: United States (2008, 2012 and Change) .................. 109
Table 2.10. (a-e) Nursing Home Surveys Resulting in a Citation for Substandard Quality of Care by Bed Size Category: United States, 2008-2012 .......................................................... 110-114
Table 2.10.f. Nursing Home Surveys Resulting in a Citation for Substandard Quality of Care by Bed Size Category: United States (2008, 2012 and Change) ........................................... 115
Table 2.11. (a-e) Nursing Home Surveys Resulting in a Citation for Substandard Quality of Care by Ownership Type: United States, 2008 ................................................................ 116-120
Table 2.11.f. Nursing Home Surveys Resulting in a Citation for Substandard Quality of Care by Ownership Type: United States (2008, 2012 and Change) ....................................... 121
Table 2.12. (a-e) Nursing Home Surveys Resulting in a Citation for Use of Restraints by Bed Size Category: United States, 2008-2012 .................................................................. 122-126
Table 2.12.f. Nursing Home Surveys Resulting in a Citation for Use of Restraints by Bed Size Category: United States (2008, 2012 and Change) ................................................... 127
Table 2.13. (a-e) Nursing Home Surveys Resulting in a Citation for Use of Restraints by Ownership Type: United States, 2008-2012 ......................................................................... 128-132
Table 2.13.f. Nursing Home Surveys Resulting in a Citation for Use of Restraints by Ownership Type: United States (2008, 2012 and Change).......................................................... 133
Table 2.14. (a-e) Nursing Home Surveys Resulting in a Deficiency for Failure to Treat/Prevent Pressure Ulcers by Bed Size Category: United States, 2008-2012 ................................... 134-138
Table 2.14.f. Nursing Home Surveys Resulting in a Deficiency for Failure to Treat/Prevent Pressure Ulcers by Bed Size Category: United States (2008, 2012 and Change) ................... 139
Table 2.15. (a-e) Nursing Home Surveys Resulting in a Deficiency for Failure to Treat/Prevent Pressure Ulcers by Ownership Type: United States, 2008-2012 ...................................... 140-144
Table 2.15.f. Nursing Home Surveys Resulting in a Deficiency for Failure to Treat/Prevent Pressure Ulcers by Ownership Type: United States (2008, 2012 and Change) ....................... 145
iv Nursing Home Data Compendium 2013

Section 3. Nursing Home Resident Characteristics
Figure 3.1. Percentage of State Residents Aged 65 Years and Older in a Nursing Home: United States ......................................................................................................................... 149
Figure 3.2. Percentage of State Residents Aged 85 Years and Older in a Nursing Home: United States ......................................................................................................................... 150
Figure 3.3. Percentage of Nursing Home Residents Aged 65 Years and Older: United States ... 151
Figure 3.4. Percentage of Nursing Home Residents Aged 85 Years and Older: United States ... 152
Figure 3.5. Percentage of Nursing Home Residents Aged 95 Years and Older: United States ... 153
Figure 3.6. Percentage of Minority Nursing Home Residents: United States ............................. 154
Figure 3.7. Percentage of Nursing Home Residents with Zero ADL Impairments: United States155
Figure 3.8. Percentage of Nursing Home Residents with Four or Five ADL Impairments: United States ......................................................................................................................... 156
Figure 3.9. Percentage of Nursing Home Residents with a Recent Fall: United States .............. 157
Figure 3.10. Percentage of Nursing Home Residents with a Recent Injurious Fall: United States 158
Figure 3.11. Percentage of Nursing Home Residents with Pressure Ulcers: United States .......... 159
Figure 3.12. Percentage of Nursing Home Residents who were Physically Restrained: United States ................................................................................................................................... 160
Figure 3.13. Percentage of Nursing Home Residents with Severe Bowel or Bladder Incontinence: United States ............................................................................................................. 161
Figure 3.14. Percentage of Nursing Home Residents with a Feeding Tube: United States .......... 162
Figure 3.15. Percentage of Nursing Home Residents with Unintended Weight Loss: United States ................................................................................................................................... 163
Figure 3.16. Percentage of Nursing Home Residents Taking Antipsychotic Medication: United States ......................................................................................................................... 164
Table 3.1.a. Percentage of State Residents in a Nursing Home: United States, 2011 ................... 165
Table 3.1.b. Percentage of State Residents in a Nursing Home: United States, 2012 ................... 166
Table 3.2.a. Demographic Characteristics of Nursing Home Residents: United States, 2011...... 167
Table 3.2.b. Demographic Characteristics of Nursing Home Residents: United States, 2012...... 168
Table 3.3.a. Functional Characteristics of Nursing Home Residents: United States, 2011 .......... 169
Table 3.3.b. Functional Characteristics of Nursing Home Residents: United States, 2012 .......... 170
Table 3.4.a. Prevalence of Clinical Measures in Nursing Home Residents: United States, 2011 171
Table 3.4.b. Prevalence of Clinical Measures in Nursing Home Residents: United States, 2012 172
Table 3.5.a. Nursing Home Residents by Sex, Age Group and State: United States, 2011 .......... 173
Table 3.5.b. Nursing Home Residents by Sex, Age Group and State: United States, 2012 .......... 174
Table 3.6.a. Nursing Home Residents by Race/Ethnicity and State: United States, 2011 ............ 175
Table 3.6.b. Nursing Home Residents by Race/Ethnicity and State: United States, 2012 ............ 176
Nursing Home Data Compendium 2013 v

Table 3.7.a. Distribution of Activities of Daily Living Impairment (ADL) in Nursing Home Residents: United States, 2011 .................................................................................. 177
Table 3.7.b. Distribution of Activities of Daily Living Impairment (ADL) in Nursing Home Residents: United States, 2012 .................................................................................. 178
Table 3.8.a. Distribution of Cognitive Impairment in Nursing Home Residents: United States, 2011 ................................................................................................................................... 179
Table 3.8.b. Distribution of Cognitive Impairment in Nursing Home Residents: United States, 2012 ................................................................................................................................... 180
Table 3.9.a. Distribution of Self-Reported Pain in Nursing Home Residents: United States, 2011 ................................................................................................................................... 181
Table 3.9.b. Distribution of Self-Reported Pain in Nursing Home Residents: United States, 2012 ………………………………………………………………………………………..182
Table 3.10.a. Distribution of Recent Falls in Nursing Home Residents: United States, 2011 ........ 183
Table 3.10.b. Distribution of Recent Falls in Nursing Home Residents: United States, 2012 ........ 184
Table 3.11.a. Clinical Characteristics of Nursing Home Residents by State: United States, 2011 . 185
Table 3.11.b. Clinical Characteristics of Nursing Home Residents by State: United States, 2012...186
Table 3.12.a. Functional Characteristics of Nursing Home Residents According to Age: United States, 2011 ............................................................................................................... 187
Table 3.12.b. Functional Characteristics of Nursing Home Residents According to Age: United States, 2012 ............................................................................................................... 187
Table 3.13.a. Prevalence of Clinical Measures in Nursing Home Residents According to Age, 2011 ............................................................................................ 189
Table 3.13.b. Prevalence of Clinical Measures in Nursing Home Residents According to Age, 2012 ............................................................................................ 189
Table 3.14.a. Functional Characteristics of Nursing Home Residents According to Cognitive Status: United States, 2011 ................................................................................................... 190
Table 3.14.b. Functional Characteristics of Nursing Home Residents According to Cognitive Status: United States, 2012 ................................................................................................... 190
Table 3.15.a. Prevalence of Clinical Measures in Nursing Home Residents According to Cognitive Status: United States, 2011........................................................................................ 191
Table 3.15.b. Prevalence of Clinical Measures in Nursing Home Residents According to Cognitive Status: United States, 2012........................................................................................ 191
Table 3.16.a. Joint Distribution of ADL Impairment and Cognitive Status Nursing Home Residents: United States, 2011 ................................................................................................... 192
Table 3.16.b. Joint Distribution of ADL Impairment and Cognitive Status Nursing Home Residents: United States, 2012 ................................................................................................... 192
vi Nursing Home Data Compendium 2013

Nursing Home Data Compendium 2013 i


Introduction to the CMS Nursing Home Data Compendium, 2013 This is the tenth edition of the Centers for Medicare & Medicaid Services’ (CMS) annual Nursing Home Data Compendium. The compendium contains figures and tables presenting data on all Medicare- and Medicaid-certified nursing homes in the United States as well as the residents in these nursing homes. A series of graphs and maps highlights some of the most interesting data, while detailed data are available in accompanying tables. This year the data compendium has three sections. Section 1 presents information on nursing home characteristics; Section 2 focuses on nursing home survey results; and Section 3 presents information on the demographic, functional and clinical characteristics of nursing home residents. The methods for all sections are very similar to those used in the 2012 compendium and are described in detail below.
Overview of Contents
Nursing Home Size, Ownership and Certification
In the fourth quarter of 2012, 15,6431 nursing homes participated in the Medicare and Medicaid programs. Except for a slight increase between 2010 and 2011, the number of nursing homes participating in these programs has decreased steadily since 2003. From 2008 to 2012, the number of nursing homes decreased by 0.7%, somewhat slower than the decline in the prior five years (3.2%). Over the past five years, 14 states have had an increase in the number of nursing homes, and there has been no net change in an additional eight states. The largest increases were in Arizona (9.0%) and South Carolina (8.0%); while the biggest declines were in Montana (8.8%), Vermont (5.0%) and Connecticut (4.9%). While the numbers of nursing homes have been declining, occupancy has been declining as well. Nursing home occupancy has declined gradually but steadily from 85.6% in 2003 to 83.0% in 2012.
There were decreases in the number of the smallest (<50 bed) and largest (>199 beds) nursing homes, while the two intermediate categories (50-99 beds and 100-199 beds), which together constitute more than 80% of the country’s nursing homes, increased slightly in number (0.4 – 0.5%). Non-profit nursing homes have declined in number by 7.1% between 2008 and 2012, while for-profit nursing homes, which now constitute 69% of all nursing homes (and 71% of nursing home beds), increased by 1.9% over the same period. Government-owned nursing homes remain the smallest sector (5.8% of homes; 6.4% of beds) and declined in number by 1.3%. From 2008 to 2012, dually participating nursing homes continued to become more prevalent, as the numbers of both Medicare-only and Medicaid-only nursing homes declined. In 2012, 91.6% of US nursing homes and 95.3% of nursing home beds were dually certified. The number of Medicare-only nursing homes decreased by 3.1% to 777, while the number of Medicaid-only nursing homes saw the greatest decrease, dropping by 25.9% to 536, representing 3.4% of all homes and 2.4% of beds.
1 Excludes nursing homes in Guam, Puerto Rico and the Virgin Islands (N=9)
Nursing Home Data Compendium 2013 1

Survey Findings
Between 2003 and 2008, the likelihood that a nursing home would receive at least one health deficiency on a survey increased steadily, but from 2009 to 2012, this trend has reversed. In 2003, 11.0% of nursing home surveys were deficiency free, and this fell each year to a low of 7.5% in 2008. In 2009, 8.0% were deficiency free, and from 2010 to 2012, this percentage was 8.8%, 9.2%, and 9.5% respectively. In 2012, 55.8% of all health deficiencies were cited at scope and severity “D;” 84.0% of deficiencies were cited at “D” or “E.” The percentage of surveys resulting in a citation for deficiencies at the actual harm level or higher has fallen each year since 2006, reaching a 10-year low in 2012 of 11.2%, which represents a decrease of 10.4% from 2011 and substantially lower than the 10-year high of 18.2% in 2006. Similarly, the percentage of surveys resulting in the determination of substandard quality of care has been declining since 2008, when it was 4.4%; in 2012, it was 3.0%. Additional information about the material highlighted above is available in the figures, maps, and tables that follow.
Nursing Home Residents
The results presented in Section 3 represent two “snapshots” of the US nursing home population – on December 31, 2011 and December 31, 2012. More than 1.4 million residents were living in US nursing homes on December 31, 2012, corresponding to 2.8 % of the over-65 population and 10.2 % of the over-85 population. Fifteen percent of the nursing home population is under age 65, while 7.7 % are over 95 years. Women constitute two-thirds (66.8 %) of the nursing home population, and nearly 4 of 5 nursing home residents (78.7 %) are non-Hispanic Whites. Variations among states in these demographic characteristics are detailed in the tables and figures.
Both cognitive and functional impairment are common among nursing home residents. However, 1 in 5- (20.4%) had no Activities of Daily Living (ADL) impairment and more than one-third (36.6%) had no more than mild cognitive impairment; further, 11.0% had no ADL impairment and little or no cognitive impairment. The most impaired – those with 4 or 5 ADL impairments as well as severe cognitive impairment represent 15.8% of the nursing home population.
Many residents report at least some pain in the last 5 days, with 13.5 % reporting moderate or severe pain and frequent pain and an additional 21.5% reporting pain that is mild or infrequent. A recent fall resulting in injury has been experienced by 5.3% of residents and an additional 11.3% of residents have had a non-injurious fall. Both injurious and non-injurious falls are more common among those with greater cognitive impairment.
More than one-third of residents (35.0%) are severely incontinent of bowel and/or bladder. Pressure ulcers of Stage 2 or greater were present in 5.4% of nursing home residents. Physical restraint use has become quite rare, with 1.7% of residents having any restraints in the past 7 days. Antipsychotic use, however, is quite common, with nearly 1 out of 4 residents (24.2%) receiving an antipsychotic medication at least once in the past 7 days. The variability of these clinical measures according to age, state and cognitive status are shown in the figures and tables in Section 3.
2 Nursing Home Data Compendium 2013

Methods Used
Data Sources
There are three principal sources of data used in this data compendium: (1) CMS’s database for survey and certification information, named Certification and Survey Provider Enhanced Reporting (CASPER); (2) United States population data from the United States Bureau of the Census; and (3) a set of clinical data collected on every resident of every Medicare- and Medicaid-certified nursing home in the country, the Minimum Data Set (MDS).
CASPER Measures
Number of Nursing Homes and Provider Characteristics In Section 1 (Characteristics of Nursing Homes), we include all active certified providers as of the beginning of the fourth quarter (October 1st) of each year. This is a change in methodology introduced in the 2012 compendium and will result in a slightly lower number of nursing homes than in editions prior to 2012. All analyses of Nursing Home Characteristics (Section 1) use this set of nursing homes and their characteristics derived from CASPER. Figures 1.1 – 1.5 include the small number of nursing homes in Puerto Rico, Guam and the Virgin Islands (N= 9 in 2012); these homes are excluded from all other analyses in this Section.
Average Number of Deficiencies In Section 2, the figures and tables report the mean number of health deficiencies cited during an on-site survey nationally and by state by calendar year. Only standard surveys are used in analyses. Health deficiency citations are based on the interpretive guidelines from the “State Operations Manual for Provider Certification.”2 Note that for all of the calendar year tables the weighting scheme is unique. A facility that was not surveyed during the particular calendar year is not counted and a facility that was surveyed twice during the year is doubly counted, giving it a weight of 2. Nursing homes are surveyed once a year on average. Figures 2.2 – 2.5 include surveys for nursing homes in Puerto Rico, Guam and the Virgin Islands; these homes are excluded from all other analyses in this Section.
Percentage of Surveys with No Deficiencies This is defined as the number of surveys during which no deficiencies were cited during a calendar year, divided by the total number of surveys conducted during the year.
Percentage of Surveys with Citations for Substandard Quality of Care These tables and figures report the percentage of surveys that resulted in a citation for Substandard Quality of Care (SSQC) nationally and by state by calendar year. SSQC is defined as any deficiency in 42 CFR 483.13 Resident Behavior and Facility Practices, 42 CFR 483.15 Quality of Life, or 42CFR 483.24 Quality of Care, at a scope and severity level of F, H, I, J, K, or L.
Percentage of Surveys with Citations for Abuse These tables show the percentage of surveys that resulted in a citation for abuse under tag F223 of the interpretive guidelines from the “State Operations Manual for Provider Certification.”
2 http://www.cms.gov/Regulations-and-Guidance/Guidance/Manuals/downloads/som107ap_pp_ltcf.pdf
Nursing Home Data Compendium 2013 3

Percentage of Surveys with Citations for Improper Restraint Use These tables show the percentage of surveys that resulted in a citation for improper restraint under tags F221 or F222 of the interpretive guidelines from the “State Operations Manual for Provider Certification.”
Percentage of Surveys with Citations for Pressure Sores These tables show the percentage of surveys that resulted in a citation for Pressure sores under tag F314 of the interpretive guidelines from the “State Operations Manual for Provider Certification.”
Percentage of Surveys with Citations for Actual Harm or Worse These tables and figures show the percentage of surveys that resulted in a citation for Actual Harm or Immediate Jeopardy. This includes deficiency citations rated at scope and severity ‘G’ or more severe.
Percentage of Surveys with Citations for Immediate Jeopardy These tables and figures show the percentage of surveys that resulted in a citation for Immediate Jeopardy. An Immediate jeopardy deficiency is one that constitutes an immediate threat to the health or life of one or more nursing home residents. It is recorded by the state survey agency at scope and severity of “J” or more severe.
Scope and Severity Distribution by Year It should be noted that for these figures and tables the denominator is the number of citations, not nursing homes or surveys.
Provider Characteristics for the Resident Section (Section 3) In Section 3, (Characteristics of Nursing Home Residents) data about nursing home residents are presented for 2011 and 2012, and the provider characteristics are derived from CASPER, using data from 2011 and 2012 surveys. If a survey was not available in the same year as the resident data, an earlier survey was used. If there were multiple surveys in the year, data from the later one was used. In addition to state, the provider characteristics used in this compendium are ownership (for-profit, not-for-profit, or government owned); type of certification (Medicare-only, Medicaid-only, or both Medicare- and Medicaid-certified); and size (number of beds: fewer than 50 beds, 50-99 beds, 100-199 beds and 200 or more beds).
United States Census Data
Tables and Figures that refer to State or US Population use data from the US Census.3 The Census Bureau's Population Estimates Program (PEP) annually produces estimates of the population for the United States, and its states, as well as other geographic designations. These estimates are based on the last decennial census, and each year the estimates for an entire time series (back to the last decennial census) are revised to incorporate the most up-to-date demographic components of change. Each time series is distinguished by its “Vintage” year, which is the latest year in the time series. For the purposes of this compendium, estimates from each vintage year were used so that the estimates would most closely match those in prior compendia – that is, we do not revise previous years’ population estimates. For example, the 2004 estimates are from Vintage 2004, and 2009 estimates are from Vintage 2009. Data for 2003-2009 are based on the 2000 decennial census, and estimates for 2010-2012 are based on the 2010
3 http://www.census.gov/popest/
4 Nursing Home Data Compendium 2013

census. Some population estimates are broken down by state, gender and age. Puerto Rico, Guam and the Virgin Islands are excluded.
Resident Characteristics
Resident characteristics including demographics, functional and clinical characteristics are derived from the Minimum Data Set (MDS), version 3.0. Specifically, extracts extract for the 4th quarter of 2011 and 2012 MDS data were used, selecting a single record from the MDS Active Resident Episode Table (MARET) for each resident in a Medicare or Medicaid-certified nursing home on December 31 of the given year that had not been discharged and who had an assessment within the last 150 days. If this record was an entry record, and therefore contained no clinical data, the next assessment for that resident was obtained (provided that the assessment was prior to February 28 of the following year). The table below describes the development of the resident sample for each year:
Number of Residents
2011 2012
Original MARET extract 1,446,279 1,416,581
Exclude residents in nursing homes with no matching record in CASPER-derived provider file
648 (0.04%) 951 (0.07%)
Exclude residents in nursing homes in Puerto Rico, Guam and Virgin Islands
907 (0.06%) 157 (0.01%)
Exclude residents with only an entry record in the fourth quarter (records contain no clinical or functional data)
9,920 (0.69%) 5,255 (0.37%)
Exclude residents from nursing homes for which >20% of records were for entry records with no subsequent assessment
3,074 (0.21%) 469 (0.03%)
Remaining resident sample (used for figures and tables in Section3)
1,431,730 1,409,749
Calculation of Resident-Specific Measures The next section provides detail on the definition of specific resident functional and clinical measures used in the tables and figures in this compendium. Note that while some of the clinical measures are similar to some of the MDS-derived Quality Measures (QMs) that are shown on the Nursing Home Compare website, the specification of the measures in this compendium are different from the QMs and are described below. All the measures presented in this volume are based on a single assessment for each resident, without regard to length of stay. Additionally, no facility-level summaries were computed for the tables and figures; that is, the individual resident is considered to be the unit of observation.
Nursing Home Data Compendium 2013 5

Number of ADL impairments This includes bed mobility, dressing, eating, transferring and toileting; a resident is considered dependent in a given activity only if s/he required extensive assistance or required full staff performance of the activity; additionally, if the activity occurred two or fewer times during the seven days prior to the assessment and/or the resident’s family or non-facility staff provided total care during that time, the resident was considered dependent. If one ADL item was missing, a score was calculated assuming that the missing item had the resident’s mean value of the other 4 items. Dressing was the item most commonly missing because this item is not included on all assessment types. If two or more ADL items were missing, the count was scored as missing.
Cognitive Impairment This is based upon the Brief Interview of Mental Status (BIMS; Saliba, Buchanan et al, 2012) if the resident could be interviewed and on the Cognitive Performance Scale (CPS; Morris et al, 1994) if the resident could not be interviewed. For the BIMS, which can range from 0 to15, lower scores indicate greater impairment while on the CPS (range 0-6), higher scores indicate greater impairment. In order to combine results from the BIMS and CPS, cognitive impairment is categorized as follows: None or Mild Impairment (BIMS 13-15 or CPS 0-2); Moderate Impairment (BIMS 8-12 or CPS 3-4); Severe Impairment (BIMS 0-7 or CPS 5-6). A very small number of residents could not be scored on either the BIMS or the CPS and thus are excluded from analyses of cognitive impairment.
Pain in the Last 5 Days This is based upon the resident pain interview (Saliba, Jones et al, 2012), in which the resident is asked if s/he has had pain in the last 5 days. If the response is yes, the resident is asked about frequency and severity of the worst pain, with severity rated on a verbal descriptor scale (VDS) with four levels from mild to very severe/horrible or on a 0-10 numeric rating scale (NRS). A cross-walk between the two severity scales is available (Edelen et al 2010). For the purposes of this compendium pain is grouped into three categories as follows:
Moderate or severe pain – The resident reports at least moderate pain (VDS = ‘Moderate’ or ‘Severe’ or NRS 5 to 9) that is ‘frequent’ or ‘almost constant’ OR the resident reports severe/horrible pain (VDS =’ Severe/Horrible’ or RNS = 10) at any frequency.
Mild /Infrequent– The resident reports some pain in the last 5 days but it is less frequent/severe than as described above.
None – the resident reports no pain in the last 5 days.
This pain measure is available only if the resident can be interviewed.
Recent Falls The MDS assesses whether the resident has experienced any falls since admission or the most recent assessment. Assessments take place approximately quarterly. If the resident has fallen, it is determined whether s/he had any falls resulting in injury; injuries can be major (e.g. bone fracture, joint dislocation or head injury with loss of consciousness) or minor (e.g. lacerations, superficial bruising, sprains).
Pressure Ulcers Indicates that the resident has any pressure ulcers of stage 2 or higher. There are no exclusions.
6 Nursing Home Data Compendium 2013

Any Restraint Use Any use of trunk restraint, limb restraint, or restraining chair at least once in the past seven days. Bed rails are not included. There are no exclusions.
Incontinence Indicates resident was always incontinent of bowel and/or bladder in the past 7 days. Residents are excluded for urinary incontinence if they have a catheter, urinary ostomy or no urine output in the past 7 days. Residents are excluded for bowel incontinence if they have an ostomy or no bowel movement for the entire 7 days.
Feeding Tube Indicates that the resident has a nasogastric or abdominal feeding tube. There are no exclusions.
Unintended Weight Loss Indicates resident weight loss of 5 percent or more in the last month or 10 percent or more in the last 6 months that was not part of a physician-prescribed weight loss plan. Residents are excluded if they are in end-state disease or are receiving hospice care.
Antipsychotic Use Indicates that the resident received an antipsychotic medication at least once in the last 7 days or since admission/re-entry if less than 7 days. There are no exclusions.
Additional Notes – Changes in Historical Data
CASPER is a set of administrative databases that allow users to add, change, and delete data almost continually. In addition, these databases store no more than four standard surveys per provider. The system automatically deletes older surveys as new ones are entered. For these reasons, analysis of the same data elements may yield slightly different results if they use data that were retrieved at different points in time. We have created archival files that we hope will alleviate this problem. Nevertheless, variations in survey results or facility counts may be apparent when comparing measures in this document to the same measures in previous data compendia. Please also note that we have made some changes to methodology over time. These changes have been noted in each volume.
References
Edelen MO, Saliba D. Correspondence of Verbal Descriptor and Numeric Rating Scales for Pain Intensity: An Item Response Theory Calibration. J Gerontol A Biol Sci Med Sci 2010; 65(7): 778-785.
Morris JN, Fries BE, Mehr DR, Hawes C, Phillips C, Mor V, Lipsitz LA. MDS Cognitive Performance Scale. J Gerontol 1994; 49(4): M174-M182.
Saliba D, Buchanan J, Edelen MO, Streim J, Ouslander J, Berlowitz D, Chodosh J. MDS 3.0: Brief Interview for Mental Status. JAMDA 2012; 13: 611-617.
Saliba D, Jones M, Streim J, Ouslander J, Berlowitz D, Buchanan J. Overview of Significant Changes in the Minimum Data Set for Nursing Homes Version 3.0. JAMDA 2012; 13: 595-601
Nursing Home Data Compendium 2013 7

8 Nursing Home Data Compendium 2013

Section 1. Nursing Home Characteristics
Nursing Home Data Compendium 2013 9

10 Nursing Home Data Compendium 2013

Nursing H
ome D
ata Com
pendium 2013
11
Figure 1.1. Number of Nursing Homes by Year: United States, 2003-2012
Source: CASPER - Data includes nursing homes in Guam, Puerto Rico and the Virgin Islands.

12N
ursing Hom
e Data C
ompendium
2013
Figure 1.2. Nursing Homes by Bed Size Category by Year: United States, 2003-2012
Source: CASPER - Data includes nursing homes in Guam, Puerto Rico and the Virgin Islands.

Nursing H
ome D
ata Com
pendium 2013
13
Figure 1.3. Nursing Homes by Ownership Type by Year: United States, 2003-2012
Source: CASPER - Data includes nursing homes in Guam, Puerto Rico and the Virgin Islands.

14N
ursing Hom
e Data C
ompendium
2013
Figure 1.4. Nursing Homes by Certification Type by Year: United States, 2003-2012
Source: CASPER - Data includes nursing homes in Guam, Puerto Rico and the Virgin Islands.

Nursing H
ome D
ata Com
pendium 2013
15
Figure 1.5. Total Nursing Home Residents, Certified Beds, and Occupancy Rates by Year: United States, 2003-2012
Source: CASPER - Data includes nursing homes in Guam, Puerto Rico and the Virgin Islands.

16N
ursing Hom
e Data C
ompendium
2013
Figure 1.6. Number of Certified Nursing Home Beds per Thousand Persons Aged 65 Years and Older by State: United States, 2012
Source: CASPER, U.S. Census Numbers in parentheses in legend indicate number of states in a given category

Nursing H
ome D
ata Com
pendium 2013
17
Figure 1.7. Number of Certified Nursing Home Beds per Thousand Persons Aged 85 Years and Older by State: United States, 2012
Source: CASPER, U.S. Census Numbers in parentheses in legend indicate number of states in a given category

18N
ursing Hom
e Data C
ompendium
2013
Figure 1.8. Percentage of For Profit Nursing Homes by State: United States, 2012
Source: CASPER Numbers in parentheses in legend indicate number of states in a given category

Nursing H
ome D
ata Com
pendium 2013
19
Figure 1.9. Percentage of Non-Profit Nursing Homes by State: United States, 2012
Source: CASPER Numbers in parentheses in legend indicate number of states in a given category

Table 1.1.a. Number of Nursing Homes by Bed Size Category: United States, 2008
Bed Size Category - Number (Percent)
<50 50-99 100-199 >199 All Facilities Nation 2,166 (13.7) 5,717 (36.3) 6,875 (43.6) 995 (6.3) 15,753 Alabama 9 (3.9) 86 (37.1) 121 (52.2) 16 (6.9) 232 Alaska 10 (66.7) 4 (26.7) 0 (0.0) 1 (6.7) 15 Arizona 11 (8.2) 35 (26.1) 77 (57.5) 11 (8.2) 134 Arkansas 12 (5.1) 88 (37.1) 134 (56.5) 3 (1.3) 237 California 223 (17.8) 650 (51.8) 330 (26.3) 52 (4.1) 1,255 Colorado 33 (15.6) 86 (40.6) 85 (40.1) 8 (3.8) 212 Connecticut 14 (5.8) 76 (31.3) 135 (55.6) 18 (7.4) 243 Delaware 8 (17.8) 9 (20.0) 27 (60.0) 1 (2.2) 45 District of Columbia 3 (16.7) 5 (27.8) 5 (27.8) 5 (27.8) 18 Florida 39 (5.7) 125 (18.4) 480 (70.7) 35 (5.2) 679 Georgia 26 (7.2) 110 (30.6) 199 (55.4) 24 (6.7) 359 Hawaii 19 (39.6) 11 (22.9) 15 (31.3) 3 (6.3) 48 Idaho 23 (29.9) 27 (35.1) 27 (35.1) 0 (0.0) 77 Illinois 99 (12.4) 273 (34.3) 298 (37.4) 126 (15.8) 796 Indiana 83 (16.2) 201 (39.3) 213 (41.7) 14 (2.7) 511 Iowa 114 (25.2) 265 (58.6) 69 (15.3) 4 (0.9) 452 Kansas 104 (30.1) 186 (53.9) 53 (15.4) 2 (0.6) 345 Kentucky 47 (16.4) 118 (41.1) 117 (40.8) 5 (1.7) 287 Louisiana 23 (8.1) 43 (15.1) 201 (70.5) 18 (6.3) 285 Maine 42 (37.5) 55 (49.1) 13 (11.6) 2 (1.8) 112 Maryland 28 (12.2) 50 (21.7) 128 (55.7) 24 (10.4) 230 Massachusetts 55 (12.6) 110 (25.3) 253 (58.2) 17 (3.9) 435 Michigan 41 (9.6) 139 (32.5) 223 (52.1) 25 (5.8) 428 Minnesota 77 (19.7) 198 (50.8) 100 (25.6) 15 (3.8) 390 Mississippi 18 (8.8) 98 (48.0) 85 (41.7) 3 (1.5) 204 Missouri 47 (9.1) 225 (43.4) 230 (44.3) 17 (3.3) 519 Montana 34 (37.4) 30 (33.0) 26 (28.6) 1 (1.1) 91 Nebraska 76 (33.8) 105 (46.7) 40 (17.8) 4 (1.8) 225 Nevada 11 (22.9) 9 (18.8) 22 (45.8) 6 (12.5) 48 New Hampshire 9 (11.5) 33 (42.3) 31 (39.7) 5 (6.4) 78 New Jersey 31 (8.6) 57 (15.8) 215 (59.6) 58 (16.1) 361 New Mexico 9 (12.9) 27 (38.6) 33 (47.1) 1 (1.4) 70 New York 47 (7.2) 103 (15.7) 258 (39.4) 246 (37.6) 654 North Carolina 43 (10.2) 151 (35.7) 216 (51.1) 13 (3.1) 423 North Dakota 29 (34.9) 31 (37.3) 21 (25.3) 2 (2.4) 83 Ohio 112 (11.8) 404 (42.4) 408 (42.8) 29 (3.0) 953 Oklahoma 31 (9.6) 152 (47.1) 135 (41.8) 5 (1.5) 323 Oregon 21 (15.2) 61 (44.2) 54 (39.1) 2 (1.4) 138 Pennsylvania 95 (13.4) 176 (24.8) 362 (51.0) 77 (10.8) 710 Rhode Island 13 (15.1) 31 (36.0) 39 (45.3) 3 (3.5) 86 South Carolina 33 (18.9) 56 (32.0) 80 (45.7) 6 (3.4) 175 South Dakota 53 (48.2) 47 (42.7) 10 (9.1) 0 (0.0) 110 Tennessee 31 (9.7) 97 (30.3) 174 (54.4) 18 (5.6) 320 Texas 89 (7.8) 381 (33.3) 637 (55.7) 36 (3.1) 1,143 Utah 25 (26.9) 31 (33.3) 35 (37.6) 2 (2.2) 93 Vermont 12 (30.0) 13 (32.5) 15 (37.5) 0 (0.0) 40 Virginia 35 (12.5) 85 (30.2) 146 (52.0) 15 (5.3) 281 Washington 38 (16.0) 99 (41.6) 97 (40.8) 4 (1.7) 238 West Virginia 22 (16.9) 58 (44.6) 49 (37.7) 1 (0.8) 130 Wisconsin 48 (12.2) 192 (48.9) 141 (35.9) 12 (3.1) 393 Wyoming 11 (28.2) 15 (38.5) 13 (33.3) 0 (0.0) 39
Source: CASPER
20 Nursing Home Data Compendium 2013

Table 1.1.b. Number of Nursing Homes by Bed Size Category: United States, 2009
Bed Size Category - Number (Percent) <50 50-99 100-199 >199 All Facilities
Nation 2,094 (13.3) 5,729 (36.5) 6,890 (43.9) 980 (6.2) 15,693 Alabama 8 (3.5) 86 (37.2) 122 (52.8) 15 (6.5) 231 Alaska 10 (66.7) 4 (26.7) 1 (6.7) 0 (0.0) 15 Arizona 13 (9.6) 37 (27.4) 74 (54.8) 11 (8.1) 135 Arkansas 7 (3.1) 85 (37.3) 133 (58.3) 3 (1.3) 228 California 217 (17.3) 652 (52.1) 330 (26.4) 53 (4.2) 1,252 Colorado 32 (15.2) 85 (40.5) 85 (40.5) 8 (3.8) 210 Connecticut 16 (6.6) 74 (30.7) 134 (55.6) 17 (7.1) 241 Delaware 8 (17.4) 10 (21.7) 27 (58.7) 1 (2.2) 46 District of Columbia 3 (15.8) 5 (26.3) 7 (36.8) 4 (21.1) 19 Florida 40 (5.9) 123 (18.2) 477 (70.6) 36 (5.3) 676 Georgia 24 (6.7) 110 (30.6) 200 (55.7) 25 (7.0) 359 Hawaii 18 (38.3) 11 (23.4) 15 (31.9) 3 (6.4) 47 Idaho 24 (30.4) 27 (34.2) 28 (35.4) 0 (0.0) 79 Illinois 95 (12.0) 269 (34.0) 306 (38.7) 121 (15.3) 791 Indiana 75 (14.9) 203 (40.3) 215 (42.7) 11 (2.2) 504 Iowa 108 (24.2) 265 (59.4) 70 (15.7) 3 (0.7) 446 Kansas 102 (30.0) 183 (53.8) 52 (15.3) 3 (0.9) 340 Kentucky 47 (16.4) 115 (40.1) 119 (41.5) 6 (2.1) 287 Louisiana 21 (7.4) 43 (15.1) 205 (71.9) 16 (5.6) 285 Maine 41 (37.6) 53 (48.6) 13 (11.9) 2 (1.8) 109 Maryland 30 (13.0) 48 (20.8) 131 (56.7) 22 (9.5) 231 Massachusetts 49 (11.4) 109 (25.4) 255 (59.4) 16 (3.7) 429 Michigan 42 (9.9) 135 (31.7) 223 (52.3) 26 (6.1) 426 Minnesota 80 (20.7) 195 (50.5) 97 (25.1) 14 (3.6) 386 Mississippi 16 (7.9) 99 (49.0) 85 (42.1) 2 (1.0) 202 Missouri 40 (7.8) 227 (44.2) 230 (44.8) 16 (3.1) 513 Montana 33 (36.7) 30 (33.3) 26 (28.9) 1 (1.1) 90 Nebraska 78 (34.5) 102 (45.1) 42 (18.6) 4 (1.8) 226 Nevada 11 (22.4) 10 (20.4) 22 (44.9) 6 (12.2) 49 New Hampshire 10 (12.5) 34 (42.5) 31 (38.8) 5 (6.3) 80 New Jersey 29 (8.1) 57 (15.9) 216 (60.2) 57 (15.9) 359 New Mexico 10 (14.3) 26 (37.1) 32 (45.7) 2 (2.9) 70 New York 45 (7.0) 99 (15.4) 251 (39.2) 246 (38.4) 641 North Carolina 43 (10.2) 147 (34.8) 219 (51.8) 14 (3.3) 423 North Dakota 32 (38.1) 30 (35.7) 20 (23.8) 2 (2.4) 84 Ohio 106 (11.0) 434 (45.2) 392 (40.8) 28 (2.9) 960 Oklahoma 31 (9.8) 149 (47.0) 134 (42.3) 3 (0.9) 317 Oregon 20 (14.6) 62 (45.3) 53 (38.7) 2 (1.5) 137 Pennsylvania 89 (12.5) 178 (25.0) 366 (51.5) 78 (11.0) 711 Rhode Island 13 (15.1) 31 (36.0) 39 (45.3) 3 (3.5) 86 South Carolina 35 (19.8) 55 (31.1) 81 (45.8) 6 (3.4) 177 South Dakota 39 (35.8) 60 (55.0) 10 (9.2) 0 (0.0) 109 Tennessee 29 (9.1) 96 (30.1) 175 (54.9) 19 (6.0) 319 Texas 88 (7.6) 377 (32.5) 660 (56.8) 36 (3.1) 1,161 Utah 26 (27.4) 32 (33.7) 35 (36.8) 2 (2.1) 95 Vermont 13 (32.5) 13 (32.5) 14 (35.0) 0 (0.0) 40 Virginia 33 (11.8) 85 (30.4) 147 (52.5) 15 (5.4) 280 Washington 35 (14.9) 100 (42.6) 96 (40.9) 4 (1.7) 235 West Virginia 20 (15.6) 60 (46.9) 47 (36.7) 1 (0.8) 128 Wisconsin 50 (12.8) 195 (49.9) 134 (34.3) 12 (3.1) 391 Wyoming 10 (26.3) 14 (36.8) 14 (36.8) 0 (0.0) 38
Source: CASPER
Nursing Home Data Compendium 2013 21

Table 1.1.c. Number of Nursing Homes by Bed Size Category: United States, 2010
Bed Size Category - Number (Percent)
<50 50-99 100-199 >199 All Facilities Nation 2,052 (13.1) 5,701 (36.5) 6,910 (44.2) 974 (6.2) 15,637 Alabama 5 (2.2) 85 (37.4) 122 (53.7) 15 (6.6) 227 Alaska 10 (66.7) 4 (26.7) 1 (6.7) 0 (0.0) 15 Arizona 12 (8.8) 37 (27.0) 76 (55.5) 12 (8.8) 137 Arkansas 7 (3.0) 85 (36.6) 138 (59.5) 2 (0.9) 232 California 205 (16.6) 646 (52.4) 330 (26.8) 52 (4.2) 1,233 Colorado 31 (14.6) 85 (39.9) 90 (42.3) 7 (3.3) 213 Connecticut 16 (6.7) 72 (30.1) 133 (55.6) 18 (7.5) 239 Delaware 7 (15.2) 11 (23.9) 27 (58.7) 1 (2.2) 46 District of Columbia 3 (15.8) 5 (26.3) 6 (31.6) 5 (26.3) 19 Florida 41 (6.1) 122 (18.1) 476 (70.5) 36 (5.3) 675 Georgia 24 (6.7) 111 (30.9) 199 (55.4) 25 (7.0) 359 Hawaii 18 (37.5) 11 (22.9) 16 (33.3) 3 (6.3) 48 Idaho 23 (29.5) 27 (34.6) 28 (35.9) 0 (0.0) 78 Illinois 91 (11.7) 264 (33.8) 304 (39.0) 121 (15.5) 780 Indiana 72 (14.3) 202 (40.2) 219 (43.5) 10 (2.0) 503 Iowa 113 (25.5) 260 (58.7) 67 (15.1) 3 (0.7) 443 Kansas 102 (30.0) 181 (53.2) 54 (15.9) 3 (0.9) 340 Kentucky 45 (15.9) 116 (41.0) 116 (41.0) 6 (2.1) 283 Louisiana 18 (6.5) 43 (15.4) 202 (72.4) 16 (5.7) 279 Maine 40 (37.0) 52 (48.1) 14 (13.0) 2 (1.9) 108 Maryland 29 (12.6) 54 (23.4) 128 (55.4) 20 (8.7) 231 Massachusetts 49 (11.4) 108 (25.2) 255 (59.6) 16 (3.7) 428 Michigan 44 (10.3) 131 (30.8) 225 (52.8) 26 (6.1) 426 Minnesota 84 (21.9) 194 (50.5) 93 (24.2) 13 (3.4) 384 Mississippi 15 (7.4) 98 (48.5) 87 (43.1) 2 (1.0) 202 Missouri 39 (7.6) 227 (44.2) 231 (44.9) 17 (3.3) 514 Montana 28 (32.9) 30 (35.3) 26 (30.6) 1 (1.2) 85 Nebraska 75 (33.6) 102 (45.7) 42 (18.8) 4 (1.8) 223 Nevada 10 (20.4) 10 (20.4) 23 (46.9) 6 (12.2) 49 New Hampshire 10 (12.7) 33 (41.8) 31 (39.2) 5 (6.3) 79 New Jersey 30 (8.3) 56 (15.6) 215 (59.7) 59 (16.4) 360 New Mexico 10 (14.5) 26 (37.7) 31 (44.9) 2 (2.9) 69 New York 44 (6.9) 99 (15.6) 246 (38.7) 246 (38.7) 635 North Carolina 42 (10.0) 148 (35.2) 216 (51.4) 14 (3.3) 420 North Dakota 30 (35.3) 33 (38.8) 20 (23.5) 2 (2.4) 85 Ohio 108 (11.3) 439 (45.9) 384 (40.2) 25 (2.6) 956 Oklahoma 30 (9.4) 147 (46.2) 137 (43.1) 4 (1.3) 318 Oregon 21 (15.3) 62 (45.3) 53 (38.7) 1 (0.7) 137 Pennsylvania 89 (12.5) 177 (24.9) 367 (51.6) 78 (11.0) 711 Rhode Island 13 (15.1) 31 (36.0) 39 (45.3) 3 (3.5) 86 South Carolina 40 (21.7) 57 (31.0) 81 (44.0) 6 (3.3) 184 South Dakota 38 (34.5) 58 (52.7) 13 (11.8) 1 (0.9) 110 Tennessee 26 (8.3) 93 (29.5) 178 (56.5) 18 (5.7) 315 Texas 79 (6.8) 369 (31.6) 684 (58.6) 36 (3.1) 1,168 Utah 29 (29.3) 31 (31.3) 37 (37.4) 2 (2.0) 99 Vermont 14 (35.0) 12 (30.0) 14 (35.0) 0 (0.0) 40 Virginia 34 (12.0) 88 (31.0) 147 (51.8) 15 (5.3) 284 Washington 31 (13.5) 96 (41.9) 97 (42.4) 5 (2.2) 229 West Virginia 18 (14.3) 60 (47.6) 47 (37.3) 1 (0.8) 126 Wisconsin 50 (12.9) 199 (51.2) 131 (33.7) 9 (2.3) 389 Wyoming 10 (26.3) 14 (36.8) 14 (36.8) 0 (0.0) 38
Source: CASPER
22 Nursing Home Data Compendium 2013

Table 1.1.d. Number of Nursing Homes by Bed Size Category: United States, 2011
Bed Size Category - Number (Percent)
<50 50-99 100-199 >199 All Facilities Nation 2,059 (13.1) 5,733 (36.6) 6,907 (44.1) 967 (6.2) 15,666 Alabama 5 (2.2) 86 (37.9) 122 (53.7) 14 (6.2) 227 Alaska 10 (66.7) 4 (26.7) 1 (6.7) 0 (0.0) 15 Arizona 14 (9.9) 39 (27.5) 77 (54.2) 12 (8.5) 142 Arkansas 6 (2.6) 88 (37.8) 137 (58.8) 2 (0.9) 233 California 202 (16.4) 646 (52.4) 331 (26.9) 53 (4.3) 1,232 Colorado 30 (14.2) 85 (40.1) 90 (42.5) 7 (3.3) 212 Connecticut 16 (6.8) 71 (30.3) 129 (55.1) 18 (7.7) 234 Delaware 7 (15.2) 11 (23.9) 27 (58.7) 1 (2.2) 46 District of Columbia 3 (15.8) 5 (26.3) 6 (31.6) 5 (26.3) 19 Florida 38 (5.6) 128 (18.9) 476 (70.2) 36 (5.3) 678 Georgia 22 (6.2) 111 (31.1) 199 (55.7) 25 (7.0) 357 Hawaii 17 (35.4) 14 (29.2) 14 (29.2) 3 (6.3) 48 Idaho 24 (30.4) 27 (34.2) 28 (35.4) 0 (0.0) 79 Illinois 86 (11.1) 265 (34.3) 301 (38.9) 121 (15.7) 773 Indiana 70 (13.7) 206 (40.4) 224 (43.9) 10 (2.0) 510 Iowa 113 (25.6) 260 (58.8) 66 (14.9) 3 (0.7) 442 Kansas 115 (33.5) 175 (51.0) 50 (14.6) 3 (0.9) 343 Kentucky 42 (14.9) 118 (41.8) 116 (41.1) 6 (2.1) 282 Louisiana 17 (6.1) 44 (15.8) 203 (72.8) 15 (5.4) 279 Maine 40 (37.0) 52 (48.1) 14 (13.0) 2 (1.9) 108 Maryland 28 (12.2) 52 (22.7) 127 (55.5) 22 (9.6) 229 Massachusetts 47 (11.1) 106 (24.9) 256 (60.2) 16 (3.8) 425 Michigan 44 (10.3) 132 (31.0) 226 (53.1) 24 (5.6) 426 Minnesota 86 (22.5) 201 (52.5) 85 (22.2) 11 (2.9) 383 Mississippi 14 (6.9) 99 (49.0) 87 (43.1) 2 (1.0) 202 Missouri 39 (7.6) 230 (44.7) 229 (44.6) 16 (3.1) 514 Montana 26 (31.0) 31 (36.9) 26 (31.0) 1 (1.2) 84 Nebraska 74 (33.3) 103 (46.4) 41 (18.5) 4 (1.8) 222 Nevada 12 (23.5) 9 (17.6) 25 (49.0) 5 (9.8) 51 New Hampshire 9 (11.5) 33 (42.3) 31 (39.7) 5 (6.4) 78 New Jersey 30 (8.3) 56 (15.5) 214 (59.1) 62 (17.1) 362 New Mexico 9 (12.7) 28 (39.4) 32 (45.1) 2 (2.8) 71 New York 43 (6.8) 100 (15.8) 245 (38.7) 245 (38.7) 633 North Carolina 39 (9.2) 149 (35.3) 220 (52.1) 14 (3.3) 422 North Dakota 31 (36.9) 31 (36.9) 19 (22.6) 3 (3.6) 84 Ohio 101 (10.5) 447 (46.7) 388 (40.5) 22 (2.3) 958 Oklahoma 28 (9.0) 145 (46.5) 136 (43.6) 3 (1.0) 312 Oregon 21 (15.2) 64 (46.4) 52 (37.7) 1 (0.7) 138 Pennsylvania 90 (12.7) 176 (24.8) 367 (51.7) 77 (10.8) 710 Rhode Island 11 (12.9) 32 (37.6) 38 (44.7) 4 (4.7) 85 South Carolina 40 (21.4) 58 (31.0) 83 (44.4) 6 (3.2) 187 South Dakota 59 (53.2) 44 (39.6) 8 (7.2) 0 (0.0) 111 Tennessee 30 (9.4) 94 (29.5) 178 (55.8) 17 (5.3) 319 Texas 83 (7.0) 379 (31.8) 692 (58.2) 36 (3.0) 1,190 Utah 30 (30.0) 31 (31.0) 37 (37.0) 2 (2.0) 100 Vermont 13 (32.5) 12 (30.0) 15 (37.5) 0 (0.0) 40 Virginia 34 (11.8) 89 (31.0) 149 (51.9) 15 (5.2) 287 Washington 33 (14.5) 94 (41.2) 96 (42.1) 5 (2.2) 228 West Virginia 17 (13.6) 59 (47.2) 48 (38.4) 1 (0.8) 125 Wisconsin 51 (13.0) 199 (50.6) 133 (33.8) 10 (2.5) 393 Wyoming 10 (26.3) 15 (39.5) 13 (34.2) 0 (0.0) 38
Source: CASPER
Nursing Home Data Compendium 2013 23

Table 1.1.e. Number of Nursing Homes by Bed Size Category: United States, 2012
Bed Size Category - Number (Percent)
<50 50-99 100-199 >199 All Facilities Nation 2,035 (13.0) 5,739 (36.7) 6,911 (44.2) 958 (6.1) 15,643 Alabama 6 (2.6) 85 (37.3) 123 (53.9) 14 (6.1) 228 Alaska 11 (68.8) 4 (25.0) 1 (6.3) 0 (0.0) 16 Arizona 14 (9.6) 41 (28.1) 80 (54.8) 11 (7.5) 146 Arkansas 6 (2.6) 89 (38.4) 135 (58.2) 2 (0.9) 232 California 203 (16.5) 650 (52.8) 325 (26.4) 53 (4.3) 1,231 Colorado 31 (14.5) 85 (39.7) 91 (42.5) 7 (3.3) 214 Connecticut 16 (6.9) 71 (30.7) 127 (55.0) 17 (7.4) 231 Delaware 7 (15.6) 11 (24.4) 26 (57.8) 1 (2.2) 45 District of Columbia 3 (15.8) 5 (26.3) 7 (36.8) 4 (21.1) 19 Florida 37 (5.4) 129 (18.9) 479 (70.2) 37 (5.4) 682 Georgia 21 (5.9) 114 (31.9) 197 (55.2) 25 (7.0) 357 Hawaii 17 (35.4) 14 (29.2) 14 (29.2) 3 (6.3) 48 Idaho 24 (31.2) 26 (33.8) 27 (35.1) 0 (0.0) 77 Illinois 85 (11.0) 262 (34.0) 305 (39.6) 118 (15.3) 770 Indiana 69 (13.4) 213 (41.4) 222 (43.2) 10 (1.9) 514 Iowa 120 (27.0) 257 (57.9) 64 (14.4) 3 (0.7) 444 Kansas 116 (34.1) 171 (50.3) 50 (14.7) 3 (0.9) 340 Kentucky 40 (14.1) 123 (43.3) 115 (40.5) 6 (2.1) 284 Louisiana 17 (6.1) 45 (16.1) 203 (72.5) 15 (5.4) 280 Maine 40 (37.4) 51 (47.7) 14 (13.1) 2 (1.9) 107 Maryland 29 (12.6) 49 (21.3) 132 (57.4) 20 (8.7) 230 Massachusetts 46 (10.9) 106 (25.1) 254 (60.2) 16 (3.8) 422 Michigan 43 (10.1) 132 (31.1) 225 (52.9) 25 (5.9) 425 Minnesota 91 (24.0) 195 (51.5) 83 (21.9) 10 (2.6) 379 Mississippi 16 (7.8) 99 (48.5) 88 (43.1) 1 (0.5) 204 Missouri 36 (7.0) 229 (44.7) 231 (45.1) 16 (3.1) 512 Montana 25 (30.1) 32 (38.6) 25 (30.1) 1 (1.2) 83 Nebraska 72 (32.9) 102 (46.6) 41 (18.7) 4 (1.8) 219 Nevada 12 (23.5) 9 (17.6) 24 (47.1) 6 (11.8) 51 New Hampshire 8 (10.5) 33 (43.4) 30 (39.5) 5 (6.6) 76 New Jersey 31 (8.5) 55 (15.1) 216 (59.3) 62 (17.0) 364 New Mexico 9 (12.5) 29 (40.3) 32 (44.4) 2 (2.8) 72 New York 46 (7.3) 99 (15.7) 244 (38.6) 243 (38.4) 632 North Carolina 35 (8.4) 147 (35.4) 219 (52.8) 14 (3.4) 415 North Dakota 29 (34.9) 33 (39.8) 18 (21.7) 3 (3.6) 83 Ohio 97 (10.2) 449 (47.2) 382 (40.2) 23 (2.4) 951 Oklahoma 26 (8.4) 146 (46.9) 136 (43.7) 3 (1.0) 311 Oregon 21 (15.3) 64 (46.7) 51 (37.2) 1 (0.7) 137 Pennsylvania 88 (12.4) 176 (24.9) 369 (52.1) 75 (10.6) 708 Rhode Island 11 (13.1) 32 (38.1) 36 (42.9) 5 (6.0) 84 South Carolina 41 (21.7) 58 (30.7) 84 (44.4) 6 (3.2) 189 South Dakota 44 (40.0) 57 (51.8) 9 (8.2) 0 (0.0) 110 Tennessee 31 (9.6) 93 (28.9) 181 (56.2) 17 (5.3) 322 Texas 82 (6.9) 374 (31.2) 706 (59.0) 35 (2.9) 1,197 Utah 29 (29.3) 29 (29.3) 39 (39.4) 2 (2.0) 99 Vermont 11 (28.9) 12 (31.6) 15 (39.5) 0 (0.0) 38 Virginia 30 (10.6) 89 (31.3) 149 (52.5) 16 (5.6) 284 Washington 32 (14.1) 95 (41.9) 95 (41.9) 5 (2.2) 227 West Virginia 16 (12.8) 60 (48.0) 48 (38.4) 1 (0.8) 125 Wisconsin 54 (13.8) 195 (50.0) 131 (33.6) 10 (2.6) 390 Wyoming 11 (28.2) 15 (38.5) 13 (33.3) 0 (0.0) 39
Source: CASPER
24 Nursing Home Data Compendium 2013

Table 1.1.f. Number of Nursing Homes by Bed Size Category: United States (2008, 2012 and Change)
Number in 2008, 2012 and Percent Change (% Δ), by Bed Size Category <50 50-99 100-199 >199 All Facilities
2008 2012 % Δ 2008 2012 % Δ 2008 2012 % Δ 2008 2012 % Δ 2008 2012 % Δ Nation 2,166 2,035 -6.0 5,717 5,739 +0.4 6,875 6,911 +0.5 995 958 -3.7 15,753 15,643 -0.7 Alabama 9 6 -33.3 86 85 -1.2 121 123 +1.7 16 14 -12.5 232 228 -1.7 Alaska 10 11 +10.0 4 4 0.0 0 1 n/a 1 0 -100 15 16 +6.7 Arizona 11 14 +27.3 35 41 +17.1 77 80 +3.9 11 11 0.0 134 146 +9.0 Arkansas 12 6 -50.0 88 89 +1.1 134 135 +0.7 3 2 -33.3 237 232 -2.1 California 223 203 -9.0 650 650 0.0 330 325 -1.5 52 53 +1.9 1,255 1,231 -1.9 Colorado 33 31 -6.1 86 85 -1.2 85 91 +7.1 8 7 -12.5 212 214 +0.9 Connecticut 14 16 +14.3 76 71 -6.6 135 127 -5.9 18 17 -5.6 243 231 -4.9 Delaware 8 7 -12.5 9 11 +22.2 27 26 -3.7 1 1 0.0 45 45 0.0 District of Columbia 3 3 0.0 5 5 0.0 5 7 +40.0 5 4 -20.0 18 19 +5.6 Florida 39 37 -5.1 125 129 +3.2 480 479 -0.2 35 37 +5.7 679 682 +0.4 Georgia 26 21 -19.2 110 114 +3.6 199 197 -1.0 24 25 +4.2 359 357 -0.6 Hawaii 19 17 -10.5 11 14 +27.3 15 14 -6.7 3 3 0.0 48 48 0.0 Idaho 23 24 +4.3 27 26 -3.7 27 27 0.0 0 0 0.0 77 77 0.0 Illinois 99 85 -14.1 273 262 -4.0 298 305 +2.3 126 118 -6.3 796 770 -3.3 Indiana 83 69 -16.9 201 213 +6.0 213 222 +4.2 14 10 -28.6 511 514 +0.6 Iowa 114 120 +5.3 265 257 -3.0 69 64 -7.2 4 3 -25.0 452 444 -1.8 Kansas 104 116 +11.5 186 171 -8.1 53 50 -5.7 2 3 +50.0 345 340 -1.4 Kentucky 47 40 -14.9 118 123 +4.2 117 115 -1.7 5 6 +20.0 287 284 -1.0 Louisiana 23 17 -26.1 43 45 +4.7 201 203 +1.0 18 15 -16.7 285 280 -1.8 Maine 42 40 -4.8 55 51 -7.3 13 14 +7.7 2 2 0.0 112 107 -4.5 Maryland 28 29 +3.6 50 49 -2.0 128 132 +3.1 24 20 -16.7 230 230 0.0 Massachusetts 55 46 -16.4 110 106 -3.6 253 254 +0.4 17 16 -5.9 435 422 -3.0 Michigan 41 43 +4.9 139 132 -5.0 223 225 +0.9 25 25 0.0 428 425 -0.7 Minnesota 77 91 +18.2 198 195 -1.5 100 83 -17.0 15 10 -33.3 390 379 -2.8 Mississippi 18 16 -11.1 98 99 +1.0 85 88 +3.5 3 1 -66.7 204 204 0.0 Missouri 47 36 -23.4 225 229 +1.8 230 231 +0.4 17 16 -5.9 519 512 -1.3 Montana 34 25 -26.5 30 32 +6.7 26 25 -3.8 1 1 0.0 91 83 -8.8 Nebraska 76 72 -5.3 105 102 -2.9 40 41 +2.5 4 4 0.0 225 219 -2.7 Nevada 11 12 +9.1 9 9 0.0 22 24 +9.1 6 6 0.0 48 51 +6.3 New Hampshire 9 8 -11.1 33 33 0.0 31 30 -3.2 5 5 0.0 78 76 -2.6 New Jersey 31 31 0.0 57 55 -3.5 215 216 +0.5 58 62 +6.9 361 364 +0.8 New Mexico 9 9 0.0 27 29 +7.4 33 32 -3.0 1 2 +100 70 72 +2.9 New York 47 46 -2.1 103 99 -3.9 258 244 -5.4 246 243 -1.2 654 632 -3.4 North Carolina 43 35 -18.6 151 147 -2.6 216 219 +1.4 13 14 +7.7 423 415 -1.9 North Dakota 29 29 0.0 31 33 +6.5 21 18 -14.3 2 3 +50.0 83 83 0.0 Ohio 112 97 -13.4 404 449 +11.1 408 382 -6.4 29 23 -20.7 953 951 -0.2 Oklahoma 31 26 -16.1 152 146 -3.9 135 136 +0.7 5 3 -40.0 323 311 -3.7 Oregon 21 21 0.0 61 64 +4.9 54 51 -5.6 2 1 -50.0 138 137 -0.7 Pennsylvania 95 88 -7.4 176 176 0.0 362 369 +1.9 77 75 -2.6 710 708 -0.3 Rhode Island 13 11 -15.4 31 32 +3.2 39 36 -7.7 3 5 +66.7 86 84 -2.3 South Carolina 33 41 +24.2 56 58 +3.6 80 84 +5.0 6 6 0.0 175 189 +8.0 South Dakota 53 44 -17.0 47 57 +21.3 10 9 -10.0 0 0 0.0 110 110 0.0 Tennessee 31 31 0.0 97 93 -4.1 174 181 +4.0 18 17 -5.6 320 322 +0.6 Texas 89 82 -7.9 381 374 -1.8 637 706 +10.8 36 35 -2.8 1,143 1,197 +4.7 Utah 25 29 +16.0 31 29 -6.5 35 39 +11.4 2 2 0.0 93 99 +6.5 Vermont 12 11 -8.3 13 12 -7.7 15 15 0.0 0 0 0.0 40 38 -5.0 Virginia 35 30 -14.3 85 89 +4.7 146 149 +2.1 15 16 +6.7 281 284 +1.1 Washington 38 32 -15.8 99 95 -4.0 97 95 -2.1 4 5 +25.0 238 227 -4.6 West Virginia 22 16 -27.3 58 60 +3.4 49 48 -2.0 1 1 0.0 130 125 -3.8 Wisconsin 48 54 +12.5 192 195 +1.6 141 131 -7.1 12 10 -16.7 393 390 -0.8 Wyoming 11 11 0.0 15 15 0.0 13 13 0.0 0 0 0.0 39 39 0.0 Source: CASPER
Nursing Home Data Compendium 2013 25

Table 1.2.a. Number of Nursing Homes by Ownership Type: United States, 2008
Ownership Type - Number (Percent) For-Profit Non-Profit Government All Facilities
Nation 10,621 (67.4) 4,207 (26.7) 925 (5.9) 15,753 Alabama 186 (80.2) 29 (12.5) 17 (7.3) 232 Alaska 4 (26.7) 6 (40.0) 5 (33.3) 15 Arizona 102 (76.1) 29 (21.6) 3 (2.2) 134 Arkansas 197 (83.1) 32 (13.5) 8 (3.4) 237 California 1,007 (80.2) 201 (16.0) 47 (3.7) 1,255 Colorado 145 (68.4) 46 (21.7) 21 (9.9) 212 Connecticut 191 (78.6) 50 (20.6) 2 (0.8) 243 Delaware 23 (51.1) 17 (37.8) 5 (11.1) 45 District of Columbia 6 (33.3) 10 (55.6) 2 (11.1) 18 Florida 487 (71.7) 178 (26.2) 14 (2.1) 679 Georgia 233 (64.9) 104 (29.0) 22 (6.1) 359 Hawaii 25 (52.1) 12 (25.0) 11 (22.9) 48 Idaho 50 (64.9) 13 (16.9) 14 (18.2) 77 Illinois 555 (69.7) 210 (26.4) 31 (3.9) 796 Indiana 345 (67.5) 138 (27.0) 28 (5.5) 511 Iowa 236 (52.2) 194 (42.9) 22 (4.9) 452 Kansas 173 (50.1) 130 (37.7) 42 (12.2) 345 Kentucky 201 (70.0) 80 (27.9) 6 (2.1) 287 Louisiana 216 (75.8) 54 (18.9) 15 (5.3) 285 Maine 79 (70.5) 32 (28.6) 1 (0.9) 112 Maryland 149 (64.8) 74 (32.2) 7 (3.0) 230 Massachusetts 304 (69.9) 124 (28.5) 7 (1.6) 435 Michigan 293 (68.5) 99 (23.1) 36 (8.4) 428 Minnesota 110 (28.2) 235 (60.3) 45 (11.5) 390 Mississippi 141 (69.1) 36 (17.6) 27 (13.2) 204 Missouri 358 (69.0) 123 (23.7) 38 (7.3) 519 Montana 38 (41.8) 38 (41.8) 15 (16.5) 91 Nebraska 106 (47.1) 67 (29.8) 52 (23.1) 225 Nevada 34 (70.8) 8 (16.7) 6 (12.5) 48 New Hampshire 41 (52.6) 26 (33.3) 11 (14.1) 78 New Jersey 236 (65.4) 103 (28.5) 22 (6.1) 361 New Mexico 48 (68.6) 18 (25.7) 4 (5.7) 70 New York 329 (50.3) 280 (42.8) 45 (6.9) 654 North Carolina 317 (74.9) 95 (22.5) 11 (2.6) 423 North Dakota 4 (4.8) 75 (90.4) 4 (4.8) 83 Ohio 725 (76.1) 203 (21.3) 25 (2.6) 953 Oklahoma 277 (85.8) 31 (9.6) 15 (4.6) 323 Oregon 111 (80.4) 20 (14.5) 7 (5.1) 138 Pennsylvania 347 (48.9) 327 (46.1) 36 (5.1) 710 Rhode Island 68 (79.1) 18 (20.9) 0 (0.0) 86 South Carolina 132 (75.4) 26 (14.9) 17 (9.7) 175 South Dakota 37 (33.6) 68 (61.8) 5 (4.5) 110 Tennessee 241 (75.3) 60 (18.8) 19 (5.9) 320 Texas 960 (84.0) 150 (13.1) 33 (2.9) 1,143 Utah 76 (81.7) 14 (15.1) 3 (3.2) 93 Vermont 26 (65.0) 13 (32.5) 1 (2.5) 40 Virginia 185 (65.8) 85 (30.2) 11 (3.9) 281 Washington 168 (70.6) 51 (21.4) 19 (8.0) 238 West Virginia 88 (67.7) 28 (21.5) 14 (10.8) 130 Wisconsin 195 (49.6) 139 (35.4) 59 (15.0) 393 Wyoming 16 (41.0) 8 (20.5) 15 (38.5) 39
Source: CASPER
26 Nursing Home Data Compendium 2013

Table 1.2.b. Number of Nursing Homes by Ownership Type: United States, 2009
Ownership Type - Number (Percent) For-Profit Non-Profit Government All Facilities
Nation 10,639 (67.8) 4,142 (26.4) 912 (5.8) 15,693 Alabama 183 (79.2) 33 (14.3) 15 (6.5) 231 Alaska 2 (13.3) 6 (40.0) 7 (46.7) 15 Arizona 106 (78.5) 27 (20.0) 2 (1.5) 135 Arkansas 187 (82.0) 31 (13.6) 10 (4.4) 228 California 1,008 (80.5) 197 (15.7) 47 (3.8) 1,252 Colorado 147 (70.0) 44 (21.0) 19 (9.0) 210 Connecticut 191 (79.3) 48 (19.9) 2 (0.8) 241 Delaware 24 (52.2) 17 (37.0) 5 (10.9) 46 District of Columbia 9 (47.4) 8 (42.1) 2 (10.5) 19 Florida 485 (71.7) 178 (26.3) 13 (1.9) 676 Georgia 233 (64.9) 105 (29.2) 21 (5.8) 359 Hawaii 24 (51.1) 13 (27.7) 10 (21.3) 47 Idaho 52 (65.8) 13 (16.5) 14 (17.7) 79 Illinois 555 (70.2) 205 (25.9) 31 (3.9) 791 Indiana 333 (66.1) 125 (24.8) 46 (9.1) 504 Iowa 233 (52.2) 193 (43.3) 20 (4.5) 446 Kansas 168 (49.4) 130 (38.2) 42 (12.4) 340 Kentucky 205 (71.4) 76 (26.5) 6 (2.1) 287 Louisiana 216 (75.8) 52 (18.2) 17 (6.0) 285 Maine 75 (68.8) 33 (30.3) 1 (0.9) 109 Maryland 148 (64.1) 75 (32.5) 8 (3.5) 231 Massachusetts 304 (70.9) 120 (28.0) 5 (1.2) 429 Michigan 290 (68.1) 98 (23.0) 38 (8.9) 426 Minnesota 107 (27.7) 236 (61.1) 43 (11.1) 386 Mississippi 144 (71.3) 31 (15.3) 27 (13.4) 202 Missouri 356 (69.4) 122 (23.8) 35 (6.8) 513 Montana 38 (42.2) 37 (41.1) 15 (16.7) 90 Nebraska 106 (46.9) 69 (30.5) 51 (22.6) 226 Nevada 35 (71.4) 8 (16.3) 6 (12.2) 49 New Hampshire 41 (51.3) 27 (33.8) 12 (15.0) 80 New Jersey 242 (67.4) 97 (27.0) 20 (5.6) 359 New Mexico 48 (68.6) 17 (24.3) 5 (7.1) 70 New York 323 (50.4) 275 (42.9) 43 (6.7) 641 North Carolina 318 (75.2) 95 (22.5) 10 (2.4) 423 North Dakota 5 (6.0) 77 (91.7) 2 (2.4) 84 Ohio 732 (76.3) 204 (21.3) 24 (2.5) 960 Oklahoma 272 (85.8) 35 (11.0) 10 (3.2) 317 Oregon 111 (81.0) 20 (14.6) 6 (4.4) 137 Pennsylvania 351 (49.4) 322 (45.3) 38 (5.3) 711 Rhode Island 70 (81.4) 16 (18.6) 0 (0.0) 86 South Carolina 135 (76.3) 27 (15.3) 15 (8.5) 177 South Dakota 37 (33.9) 67 (61.5) 5 (4.6) 109 Tennessee 243 (76.2) 60 (18.8) 16 (5.0) 319 Texas 985 (84.8) 146 (12.6) 30 (2.6) 1,161 Utah 78 (82.1) 14 (14.7) 3 (3.2) 95 Vermont 26 (65.0) 13 (32.5) 1 (2.5) 40 Virginia 187 (66.8) 82 (29.3) 11 (3.9) 280 Washington 171 (72.8) 50 (21.3) 14 (6.0) 235 West Virginia 87 (68.0) 28 (21.9) 13 (10.2) 128 Wisconsin 197 (50.4) 136 (34.8) 58 (14.8) 391 Wyoming 16 (42.1) 4 (10.5) 18 (47.4) 38
Source: CASPER
Nursing Home Data Compendium 2013 27

Table 1.2.c. Number of Nursing Homes by Ownership Type: United States, 2010
Ownership Type - Number (Percent) For-Profit Non-Profit Government All Facilities
Nation 10,736 (68.7) 4,007 (25.6) 894 (5.7) 15,637 Alabama 181 (79.7) 32 (14.1) 14 (6.2) 227 Alaska 2 (13.3) 6 (40.0) 7 (46.7) 15 Arizona 107 (78.1) 27 (19.7) 3 (2.2) 137 Arkansas 194 (83.6) 30 (12.9) 8 (3.4) 232 California 1,002 (81.3) 189 (15.3) 42 (3.4) 1,233 Colorado 152 (71.4) 41 (19.2) 20 (9.4) 213 Connecticut 187 (78.2) 50 (20.9) 2 (0.8) 239 Delaware 25 (54.3) 17 (37.0) 4 (8.7) 46 District of Columbia 8 (42.1) 9 (47.4) 2 (10.5) 19 Florida 490 (72.6) 173 (25.6) 12 (1.8) 675 Georgia 231 (64.3) 108 (30.1) 20 (5.6) 359 Hawaii 23 (47.9) 14 (29.2) 11 (22.9) 48 Idaho 53 (67.9) 11 (14.1) 14 (17.9) 78 Illinois 552 (70.8) 198 (25.4) 30 (3.8) 780 Indiana 339 (67.4) 115 (22.9) 49 (9.7) 503 Iowa 238 (53.7) 185 (41.8) 20 (4.5) 443 Kansas 170 (50.0) 126 (37.1) 44 (12.9) 340 Kentucky 204 (72.1) 72 (25.4) 7 (2.5) 283 Louisiana 221 (79.2) 44 (15.8) 14 (5.0) 279 Maine 75 (69.4) 32 (29.6) 1 (0.9) 108 Maryland 153 (66.2) 72 (31.2) 6 (2.6) 231 Massachusetts 300 (70.1) 123 (28.7) 5 (1.2) 428 Michigan 288 (67.6) 101 (23.7) 37 (8.7) 426 Minnesota 107 (27.9) 237 (61.7) 40 (10.4) 384 Mississippi 156 (77.2) 18 (8.9) 28 (13.9) 202 Missouri 364 (70.8) 116 (22.6) 34 (6.6) 514 Montana 36 (42.4) 34 (40.0) 15 (17.6) 85 Nebraska 108 (48.4) 65 (29.1) 50 (22.4) 223 Nevada 37 (75.5) 7 (14.3) 5 (10.2) 49 New Hampshire 41 (51.9) 26 (32.9) 12 (15.2) 79 New Jersey 247 (68.6) 93 (25.8) 20 (5.6) 360 New Mexico 47 (68.1) 17 (24.6) 5 (7.2) 69 New York 335 (52.8) 257 (40.5) 43 (6.8) 635 North Carolina 319 (76.0) 90 (21.4) 11 (2.6) 420 North Dakota 5 (5.9) 77 (90.6) 3 (3.5) 85 Ohio 742 (77.6) 191 (20.0) 23 (2.4) 956 Oklahoma 273 (85.8) 35 (11.0) 10 (3.1) 318 Oregon 114 (83.2) 19 (13.9) 4 (2.9) 137 Pennsylvania 355 (49.9) 317 (44.6) 39 (5.5) 711 Rhode Island 69 (80.2) 17 (19.8) 0 (0.0) 86 South Carolina 141 (76.6) 28 (15.2) 15 (8.2) 184 South Dakota 37 (33.6) 68 (61.8) 5 (4.5) 110 Tennessee 241 (76.5) 58 (18.4) 16 (5.1) 315 Texas 993 (85.0) 143 (12.2) 32 (2.7) 1,168 Utah 80 (80.8) 15 (15.2) 4 (4.0) 99 Vermont 26 (65.0) 13 (32.5) 1 (2.5) 40 Virginia 192 (67.6) 81 (28.5) 11 (3.9) 284 Washington 171 (74.7) 42 (18.3) 16 (7.0) 229 West Virginia 88 (69.8) 28 (22.2) 10 (7.9) 126 Wisconsin 202 (51.9) 134 (34.4) 53 (13.6) 389 Wyoming 15 (39.5) 6 (15.8) 17 (44.7) 38
Source: CASPER
28 Nursing Home Data Compendium 2013

Table 1.2.d. Number of Nursing Homes by Ownership Type: United States, 2011
Ownership Type - Number (Percent) For-Profit Non-Profit Government All Facilities
Nation 10,818 (69.1) 3,951 (25.2) 897 (5.7) 15,666 Alabama 181 (79.7) 30 (13.2) 16 (7.0) 227 Alaska 2 (13.3) 8 (53.3) 5 (33.3) 15 Arizona 113 (79.6) 28 (19.7) 1 (0.7) 142 Arkansas 192 (82.4) 32 (13.7) 9 (3.9) 233 California 1,006 (81.7) 184 (14.9) 42 (3.4) 1,232 Colorado 155 (73.1) 38 (17.9) 19 (9.0) 212 Connecticut 183 (78.2) 49 (20.9) 2 (0.9) 234 Delaware 26 (56.5) 16 (34.8) 4 (8.7) 46 District of Columbia 8 (42.1) 11 (57.9) 0 (0.0) 19 Florida 489 (72.1) 175 (25.8) 14 (2.1) 678 Georgia 233 (65.3) 103 (28.9) 21 (5.9) 357 Hawaii 24 (50.0) 14 (29.2) 10 (20.8) 48 Idaho 54 (68.4) 11 (13.9) 14 (17.7) 79 Illinois 550 (71.2) 197 (25.5) 26 (3.4) 773 Indiana 317 (62.2) 118 (23.1) 75 (14.7) 510 Iowa 240 (54.3) 184 (41.6) 18 (4.1) 442 Kansas 174 (50.7) 127 (37.0) 42 (12.2) 343 Kentucky 208 (73.8) 68 (24.1) 6 (2.1) 282 Louisiana 224 (80.3) 42 (15.1) 13 (4.7) 279 Maine 76 (70.4) 31 (28.7) 1 (0.9) 108 Maryland 160 (69.9) 64 (27.9) 5 (2.2) 229 Massachusetts 304 (71.5) 116 (27.3) 5 (1.2) 425 Michigan 289 (67.8) 99 (23.2) 38 (8.9) 426 Minnesota 109 (28.5) 238 (62.1) 36 (9.4) 383 Mississippi 155 (76.7) 21 (10.4) 26 (12.9) 202 Missouri 378 (73.5) 100 (19.5) 36 (7.0) 514 Montana 36 (42.9) 32 (38.1) 16 (19.0) 84 Nebraska 108 (48.6) 65 (29.3) 49 (22.1) 222 Nevada 40 (78.4) 7 (13.7) 4 (7.8) 51 New Hampshire 41 (52.6) 25 (32.1) 12 (15.4) 78 New Jersey 251 (69.3) 90 (24.9) 21 (5.8) 362 New Mexico 50 (70.4) 16 (22.5) 5 (7.0) 71 New York 332 (52.4) 257 (40.6) 44 (7.0) 633 North Carolina 322 (76.3) 90 (21.3) 10 (2.4) 422 North Dakota 4 (4.8) 78 (92.9) 2 (2.4) 84 Ohio 748 (78.1) 188 (19.6) 22 (2.3) 958 Oklahoma 266 (85.3) 37 (11.9) 9 (2.9) 312 Oregon 113 (81.9) 21 (15.2) 4 (2.9) 138 Pennsylvania 366 (51.5) 308 (43.4) 36 (5.1) 710 Rhode Island 68 (80.0) 17 (20.0) 0 (0.0) 85 South Carolina 143 (76.5) 30 (16.0) 14 (7.5) 187 South Dakota 39 (35.1) 66 (59.5) 6 (5.4) 111 Tennessee 247 (77.4) 57 (17.9) 15 (4.7) 319 Texas 1,016 (85.4) 142 (11.9) 32 (2.7) 1,190 Utah 81 (81.0) 14 (14.0) 5 (5.0) 100 Vermont 27 (67.5) 12 (30.0) 1 (2.5) 40 Virginia 197 (68.6) 79 (27.5) 11 (3.8) 287 Washington 167 (73.2) 47 (20.6) 14 (6.1) 228 West Virginia 87 (69.6) 28 (22.4) 10 (8.0) 125 Wisconsin 204 (51.9) 134 (34.1) 55 (14.0) 393 Wyoming 15 (39.5) 7 (18.4) 16 (42.1) 38
Source: CASPER
Nursing Home Data Compendium 2013 29

Table 1.2.e. Number of Nursing Homes by Ownership Type: United States, 2012
Ownership Type - Number (Percent) For-Profit Non-Profit Government All Facilities
Nation 10,820 (69.2) 3,910 (25.0) 913 (5.8) 15,643 Alabama 183 (80.3) 29 (12.7) 16 (7.0) 228 Alaska 1 (6.3) 8 (50.0) 7 (43.8) 16 Arizona 118 (80.8) 26 (17.8) 2 (1.4) 146 Arkansas 191 (82.3) 31 (13.4) 10 (4.3) 232 California 1,011 (82.1) 181 (14.7) 39 (3.2) 1,231 Colorado 157 (73.4) 39 (18.2) 18 (8.4) 214 Connecticut 184 (79.7) 44 (19.0) 3 (1.3) 231 Delaware 26 (57.8) 15 (33.3) 4 (8.9) 45 District of Columbia 9 (47.4) 10 (52.6) 0 (0.0) 19 Florida 491 (72.0) 177 (26.0) 14 (2.1) 682 Georgia 233 (65.3) 104 (29.1) 20 (5.6) 357 Hawaii 24 (50.0) 14 (29.2) 10 (20.8) 48 Idaho 53 (68.8) 10 (13.0) 14 (18.2) 77 Illinois 551 (71.6) 191 (24.8) 28 (3.6) 770 Indiana 281 (54.7) 134 (26.1) 99 (19.3) 514 Iowa 245 (55.2) 180 (40.5) 19 (4.3) 444 Kansas 176 (51.8) 123 (36.2) 41 (12.1) 340 Kentucky 207 (72.9) 71 (25.0) 6 (2.1) 284 Louisiana 224 (80.0) 43 (15.4) 13 (4.6) 280 Maine 74 (69.2) 32 (29.9) 1 (0.9) 107 Maryland 159 (69.1) 65 (28.3) 6 (2.6) 230 Massachusetts 299 (70.9) 118 (28.0) 5 (1.2) 422 Michigan 288 (67.8) 99 (23.3) 38 (8.9) 425 Minnesota 112 (29.6) 232 (61.2) 35 (9.2) 379 Mississippi 156 (76.5) 20 (9.8) 28 (13.7) 204 Missouri 382 (74.6) 99 (19.3) 31 (6.1) 512 Montana 37 (44.6) 32 (38.6) 14 (16.9) 83 Nebraska 106 (48.4) 64 (29.2) 49 (22.4) 219 Nevada 38 (74.5) 7 (13.7) 6 (11.8) 51 New Hampshire 41 (53.9) 23 (30.3) 12 (15.8) 76 New Jersey 256 (70.3) 89 (24.5) 19 (5.2) 364 New Mexico 52 (72.2) 15 (20.8) 5 (6.9) 72 New York 336 (53.2) 252 (39.9) 44 (7.0) 632 North Carolina 320 (77.1) 86 (20.7) 9 (2.2) 415 North Dakota 3 (3.6) 78 (94.0) 2 (2.4) 83 Ohio 743 (78.1) 187 (19.7) 21 (2.2) 951 Oklahoma 265 (85.2) 38 (12.2) 8 (2.6) 311 Oregon 112 (81.8) 20 (14.6) 5 (3.6) 137 Pennsylvania 364 (51.4) 308 (43.5) 36 (5.1) 708 Rhode Island 67 (79.8) 17 (20.2) 0 (0.0) 84 South Carolina 144 (76.2) 33 (17.5) 12 (6.3) 189 South Dakota 39 (35.5) 65 (59.1) 6 (5.5) 110 Tennessee 248 (77.0) 58 (18.0) 16 (5.0) 322 Texas 1,036 (86.5) 129 (10.8) 32 (2.7) 1,197 Utah 80 (80.8) 14 (14.1) 5 (5.1) 99 Vermont 26 (68.4) 11 (28.9) 1 (2.6) 38 Virginia 194 (68.3) 79 (27.8) 11 (3.9) 284 Washington 173 (76.2) 41 (18.1) 13 (5.7) 227 West Virginia 88 (70.4) 27 (21.6) 10 (8.0) 125 Wisconsin 201 (51.5) 135 (34.6) 54 (13.8) 390 Wyoming 16 (41.0) 7 (17.9) 16 (41.0) 39
Source: CASPER
30 Nursing Home Data Compendium 2013

Table 1.2.f. Number of Nursing Homes by Ownership Type: United States (2008, 2012 and Change)
Number in 2008, 2012 and Percent Change (% Δ), by Ownership Type For-Profit Non-Profit Government All Facilities
2008 2012 % Δ 2008 2012 % Δ 2008 2012 % Δ 2008 2012 % Δ Nation 10,621 10,820 +1.9 4,207 3,910 -7.1 925 913 -1.3 15,753 15,643 -0.7 Alabama 186 183 -1.6 29 29 0.0 17 16 -5.9 232 228 -1.7 Alaska 4 1 -75.0 6 8 +33.3 5 7 +40.0 15 16 +6.7 Arizona 102 118 +15.7 29 26 -10.3 3 2 -33.3 134 146 +9.0 Arkansas 197 191 -3.0 32 31 -3.1 8 10 +25.0 237 232 -2.1 California 1,007 1,011 +0.4 201 181 -10.0 47 39 -17.0 1,255 1,231 -1.9 Colorado 145 157 +8.3 46 39 -15.2 21 18 -14.3 212 214 +0.9 Connecticut 191 184 -3.7 50 44 -12.0 2 3 +50.0 243 231 -4.9 Delaware 23 26 +13.0 17 15 -11.8 5 4 -20.0 45 45 0.0 District of Columbia 6 9 +50.0 10 10 0.0 2 0 -100 18 19 +5.6 Florida 487 491 +0.8 178 177 -0.6 14 14 0.0 679 682 +0.4 Georgia 233 233 0.0 104 104 0.0 22 20 -9.1 359 357 -0.6 Hawaii 25 24 -4.0 12 14 +16.7 11 10 -9.1 48 48 0.0 Idaho 50 53 +6.0 13 10 -23.1 14 14 0.0 77 77 0.0 Illinois 555 551 -0.7 210 191 -9.0 31 28 -9.7 796 770 -3.3 Indiana 345 281 -18.6 138 134 -2.9 28 99 +254 511 514 +0.6 Iowa 236 245 +3.8 194 180 -7.2 22 19 -13.6 452 444 -1.8 Kansas 173 176 +1.7 130 123 -5.4 42 41 -2.4 345 340 -1.4 Kentucky 201 207 +3.0 80 71 -11.3 6 6 0.0 287 284 -1.0 Louisiana 216 224 +3.7 54 43 -20.4 15 13 -13.3 285 280 -1.8 Maine 79 74 -6.3 32 32 0.0 1 1 0.0 112 107 -4.5 Maryland 149 159 +6.7 74 65 -12.2 7 6 -14.3 230 230 0.0 Massachusetts 304 299 -1.6 124 118 -4.8 7 5 -28.6 435 422 -3.0 Michigan 293 288 -1.7 99 99 0.0 36 38 +5.6 428 425 -0.7 Minnesota 110 112 +1.8 235 232 -1.3 45 35 -22.2 390 379 -2.8 Mississippi 141 156 +10.6 36 20 -44.4 27 28 +3.7 204 204 0.0 Missouri 358 382 +6.7 123 99 -19.5 38 31 -18.4 519 512 -1.3 Montana 38 37 -2.6 38 32 -15.8 15 14 -6.7 91 83 -8.8 Nebraska 106 106 0.0 67 64 -4.5 52 49 -5.8 225 219 -2.7 Nevada 34 38 +11.8 8 7 -12.5 6 6 0.0 48 51 +6.3 New Hampshire 41 41 0.0 26 23 -11.5 11 12 +9.1 78 76 -2.6 New Jersey 236 256 +8.5 103 89 -13.6 22 19 -13.6 361 364 +0.8 New Mexico 48 52 +8.3 18 15 -16.7 4 5 +25.0 70 72 +2.9 New York 329 336 +2.1 280 252 -10.0 45 44 -2.2 654 632 -3.4 North Carolina 317 320 +0.9 95 86 -9.5 11 9 -18.2 423 415 -1.9 North Dakota 4 3 -25.0 75 78 +4.0 4 2 -50.0 83 83 0.0 Ohio 725 743 +2.5 203 187 -7.9 25 21 -16.0 953 951 -0.2 Oklahoma 277 265 -4.3 31 38 +22.6 15 8 -46.7 323 311 -3.7 Oregon 111 112 +0.9 20 20 0.0 7 5 -28.6 138 137 -0.7 Pennsylvania 347 364 +4.9 327 308 -5.8 36 36 0.0 710 708 -0.3 Rhode Island 68 67 -1.5 18 17 -5.6 0 0 0.0 86 84 -2.3 South Carolina 132 144 +9.1 26 33 +26.9 17 12 -29.4 175 189 +8.0 South Dakota 37 39 +5.4 68 65 -4.4 5 6 +20.0 110 110 0.0 Tennessee 241 248 +2.9 60 58 -3.3 19 16 -15.8 320 322 +0.6 Texas 960 1,036 +7.9 150 129 -14.0 33 32 -3.0 1,143 1,197 +4.7 Utah 76 80 +5.3 14 14 0.0 3 5 +66.7 93 99 +6.5 Vermont 26 26 0.0 13 11 -15.4 1 1 0.0 40 38 -5.0 Virginia 185 194 +4.9 85 79 -7.1 11 11 0.0 281 284 +1.1 Washington 168 173 +3.0 51 41 -19.6 19 13 -31.6 238 227 -4.6 West Virginia 88 88 0.0 28 27 -3.6 14 10 -28.6 130 125 -3.8 Wisconsin 195 201 +3.1 139 135 -2.9 59 54 -8.5 393 390 -0.8 Wyoming 16 16 0.0 8 7 -12.5 15 16 +6.7 39 39 0.0 Source: CASPER
Nursing Home Data Compendium 2013 31

Table 1.3.a. Number of Nursing Homes by Certification Type: United States, 2008
Certification Type - Number (Percent)
Dually Certified* Medicare Only Medicaid Only All Facilities Nation 14,228 (90.3) 802 (5.1) 723 (4.6) 15,753 Alabama 219 (94.4) 10 (4.3) 3 (1.3) 232 Alaska 15 (100.0) 0 (0.0) 0 (0.0) 15 Arizona 114 (85.1) 20 (14.9) 0 (0.0) 134 Arkansas 205 (86.5) 13 (5.5) 19 (8.0) 237 California 1,116 (88.9) 71 (5.7) 68 (5.4) 1,255 Colorado 176 (83.0) 20 (9.4) 16 (7.5) 212 Connecticut 234 (96.3) 9 (3.7) 0 (0.0) 243 Delaware 36 (80.0) 3 (6.7) 6 (13.3) 45 District of Columbia 17 (94.4) 0 (0.0) 1 (5.6) 18
Florida 647 (95.3) 29 (4.3) 3 (0.4) 679 Georgia 341 (95.0) 13 (3.6) 5 (1.4) 359 Hawaii 43 (89.6) 2 (4.2) 3 (6.3) 48 Idaho 72 (93.5) 5 (6.5) 0 (0.0) 77 Illinois 654 (82.2) 53 (6.7) 89 (11.2) 796 Indiana 455 (89.0) 35 (6.8) 21 (4.1) 511 Iowa 404 (89.4) 11 (2.4) 37 (8.2) 452 Kansas 259 (75.1) 11 (3.2) 75 (21.7) 345 Kentucky 265 (92.3) 22 (7.7) 0 (0.0) 287 Louisiana 263 (92.3) 22 (7.7) 0 (0.0) 285 Maine 110 (98.2) 2 (1.8) 0 (0.0) 112 Maryland 215 (93.5) 10 (4.3) 5 (2.2) 230 Massachusetts 414 (95.2) 13 (3.0) 8 (1.8) 435 Michigan 392 (91.6) 15 (3.5) 21 (4.9) 428 Minnesota 371 (95.1) 7 (1.8) 12 (3.1) 390 Mississippi 162 (79.4) 11 (5.4) 31 (15.2) 204 Missouri 475 (91.5) 14 (2.7) 30 (5.8) 519 Montana 85 (93.4) 5 (5.5) 1 (1.1) 91 Nebraska 194 (86.2) 1 (0.4) 30 (13.3) 225 Nevada 44 (91.7) 2 (4.2) 2 (4.2) 48 New Hampshire 72 (92.3) 2 (2.6) 4 (5.1) 78 New Jersey 330 (91.4) 31 (8.6) 0 (0.0) 361 New Mexico 63 (90.0) 3 (4.3) 4 (5.7) 70 New York 647 (98.9) 5 (0.8) 2 (0.3) 654 North Carolina 407 (96.2) 15 (3.5) 1 (0.2) 423 North Dakota 80 (96.4) 3 (3.6) 0 (0.0) 83 Ohio 921 (96.6) 31 (3.3) 1 (0.1) 953 Oklahoma 272 (84.2) 14 (4.3) 37 (11.5) 323 Oregon 116 (84.1) 5 (3.6) 17 (12.3) 138 Pennsylvania 622 (87.6) 85 (12.0) 3 (0.4) 710 Rhode Island 85 (98.8) 1 (1.2) 0 (0.0) 86 South Carolina 152 (86.9) 23 (13.1) 0 (0.0) 175 South Dakota 93 (84.5) 1 (0.9) 16 (14.5) 110 Tennessee 274 (85.6) 22 (6.9) 24 (7.5) 320 Texas 1,011 (88.5) 75 (6.6) 57 (5.0) 1,143 Utah 70 (75.3) 15 (16.1) 8 (8.6) 93 Vermont 39 (97.5) 1 (2.5) 0 (0.0) 40 Virginia 250 (89.0) 11 (3.9) 20 (7.1) 281 Washington 225 (94.5) 5 (2.1) 8 (3.4) 238 West Virginia 111 (85.4) 11 (8.5) 8 (6.2) 130 Wisconsin 360 (91.6) 12 (3.1) 21 (5.3) 393 Wyoming 31 (79.5) 2 (5.1) 6 (15.4) 39
Source: CASPER; *Certified by both Medicare and Medicaid
32 Nursing Home Data Compendium 2013

Table 1.3.b. Number of Nursing Homes by Certification Type: United States, 2009
Certification Type - Number (Percent)
Dually Certified* Medicare Only Medicaid Only All Facilities Nation 14,252 (90.8) 782 (5.0) 659 (4.2) 15,693 Alabama 219 (94.8) 10 (4.3) 2 (0.9) 231 Alaska 15 (100.0) 0 (0.0) 0 (0.0) 15 Arizona 114 (84.4) 21 (15.6) 0 (0.0) 135 Arkansas 205 (89.9) 8 (3.5) 15 (6.6) 228 California 1,115 (89.1) 73 (5.8) 64 (5.1) 1,252 Colorado 177 (84.3) 19 (9.0) 14 (6.7) 210 Connecticut 230 (95.4) 11 (4.6) 0 (0.0) 241 Delaware 36 (78.3) 3 (6.5) 7 (15.2) 46 District of Columbia 18 (94.7) 0 (0.0) 1 (5.3) 19
Florida 646 (95.6) 27 (4.0) 3 (0.4) 676 Georgia 343 (95.5) 12 (3.3) 4 (1.1) 359 Hawaii 43 (91.5) 1 (2.1) 3 (6.4) 47 Idaho 74 (93.7) 5 (6.3) 0 (0.0) 79 Illinois 659 (83.3) 52 (6.6) 80 (10.1) 791 Indiana 454 (90.1) 31 (6.2) 19 (3.8) 504 Iowa 406 (91.0) 9 (2.0) 31 (7.0) 446 Kansas 259 (76.2) 11 (3.2) 70 (20.6) 340 Kentucky 265 (92.3) 22 (7.7) 0 (0.0) 287 Louisiana 262 (91.9) 23 (8.1) 0 (0.0) 285 Maine 108 (99.1) 1 (0.9) 0 (0.0) 109 Maryland 216 (93.5) 10 (4.3) 5 (2.2) 231 Massachusetts 410 (95.6) 12 (2.8) 7 (1.6) 429 Michigan 393 (92.3) 17 (4.0) 16 (3.8) 426 Minnesota 369 (95.6) 7 (1.8) 10 (2.6) 386 Mississippi 162 (80.2) 9 (4.5) 31 (15.3) 202 Missouri 477 (93.0) 10 (1.9) 26 (5.1) 513 Montana 84 (93.3) 5 (5.6) 1 (1.1) 90 Nebraska 198 (87.6) 1 (0.4) 27 (11.9) 226 Nevada 45 (91.8) 2 (4.1) 2 (4.1) 49 New Hampshire 73 (91.3) 2 (2.5) 5 (6.3) 80 New Jersey 331 (92.2) 28 (7.8) 0 (0.0) 359 New Mexico 62 (88.6) 4 (5.7) 4 (5.7) 70 New York 633 (98.8) 6 (0.9) 2 (0.3) 641 North Carolina 406 (96.0) 16 (3.8) 1 (0.2) 423 North Dakota 81 (96.4) 3 (3.6) 0 (0.0) 84 Ohio 929 (96.8) 31 (3.2) 0 (0.0) 960 Oklahoma 272 (85.8) 13 (4.1) 32 (10.1) 317 Oregon 115 (83.9) 5 (3.6) 17 (12.4) 137 Pennsylvania 621 (87.3) 81 (11.4) 9 (1.3) 711 Rhode Island 85 (98.8) 1 (1.2) 0 (0.0) 86 South Carolina 153 (86.4) 24 (13.6) 0 (0.0) 177 South Dakota 94 (86.2) 1 (0.9) 14 (12.8) 109 Tennessee 274 (85.9) 24 (7.5) 21 (6.6) 319 Texas 1,033 (89.0) 74 (6.4) 54 (4.7) 1,161 Utah 70 (73.7) 17 (17.9) 8 (8.4) 95 Vermont 39 (97.5) 1 (2.5) 0 (0.0) 40 Virginia 248 (88.6) 13 (4.6) 19 (6.8) 280 Washington 223 (94.9) 6 (2.6) 6 (2.6) 235 West Virginia 111 (86.7) 9 (7.0) 8 (6.3) 128 Wisconsin 366 (93.6) 9 (2.3) 16 (4.1) 391 Wyoming 31 (81.6) 2 (5.3) 5 (13.2) 38
Source: CASPER; *Certified by both Medicare and Medicaid
Nursing Home Data Compendium 2013 33

Table 1.3.c. Number of Nursing Homes by Certification Type: United States, 2010
Certification Type - Number (Percent) Dually Certified* Medicare Only Medicaid Only All Facilities
Nation 14,256 (91.2) 775 (5.0) 606 (3.9) 15,637 Alabama 217 (95.6) 8 (3.5) 2 (0.9) 227 Alaska 15 (100.0) 0 (0.0) 0 (0.0) 15 Arizona 115 (83.9) 22 (16.1) 0 (0.0) 137 Arkansas 206 (88.8) 8 (3.4) 18 (7.8) 232 California 1,106 (89.7) 67 (5.4) 60 (4.9) 1,233 Colorado 178 (83.6) 21 (9.9) 14 (6.6) 213 Connecticut 228 (95.4) 11 (4.6) 0 (0.0) 239 Delaware 37 (80.4) 3 (6.5) 6 (13.0) 46 District of Columbia 18 (94.7) 0 (0.0) 1 (5.3) 19
Florida 645 (95.6) 27 (4.0) 3 (0.4) 675 Georgia 343 (95.5) 12 (3.3) 4 (1.1) 359 Hawaii 44 (91.7) 1 (2.1) 3 (6.3) 48 Idaho 73 (93.6) 5 (6.4) 0 (0.0) 78 Illinois 658 (84.4) 47 (6.0) 75 (9.6) 780 Indiana 455 (90.5) 30 (6.0) 18 (3.6) 503 Iowa 405 (91.4) 10 (2.3) 28 (6.3) 443 Kansas 258 (75.9) 13 (3.8) 69 (20.3) 340 Kentucky 263 (92.9) 20 (7.1) 0 (0.0) 283 Louisiana 259 (92.8) 20 (7.2) 0 (0.0) 279 Maine 107 (99.1) 1 (0.9) 0 (0.0) 108 Maryland 217 (93.9) 10 (4.3) 4 (1.7) 231 Massachusetts 408 (95.3) 13 (3.0) 7 (1.6) 428 Michigan 396 (93.0) 17 (4.0) 13 (3.1) 426 Minnesota 367 (95.6) 7 (1.8) 10 (2.6) 384 Mississippi 164 (81.2) 8 (4.0) 30 (14.9) 202 Missouri 481 (93.6) 10 (1.9) 23 (4.5) 514 Montana 82 (96.5) 2 (2.4) 1 (1.2) 85 Nebraska 198 (88.8) 1 (0.4) 24 (10.8) 223 Nevada 45 (91.8) 2 (4.1) 2 (4.1) 49 New Hampshire 72 (91.1) 2 (2.5) 5 (6.3) 79 New Jersey 329 (91.4) 31 (8.6) 0 (0.0) 360 New Mexico 61 (88.4) 5 (7.2) 3 (4.3) 69 New York 627 (98.7) 6 (0.9) 2 (0.3) 635 North Carolina 402 (95.7) 16 (3.8) 2 (0.5) 420 North Dakota 83 (97.6) 2 (2.4) 0 (0.0) 85 Ohio 929 (97.2) 27 (2.8) 0 (0.0) 956 Oklahoma 280 (88.1) 13 (4.1) 25 (7.9) 318 Oregon 116 (84.7) 5 (3.6) 16 (11.7) 137 Pennsylvania 620 (87.2) 83 (11.7) 8 (1.1) 711 Rhode Island 85 (98.8) 1 (1.2) 0 (0.0) 86 South Carolina 154 (83.7) 30 (16.3) 0 (0.0) 184 South Dakota 95 (86.4) 1 (0.9) 14 (12.7) 110 Tennessee 276 (87.6) 22 (7.0) 17 (5.4) 315 Texas 1,054 (90.2) 73 (6.3) 41 (3.5) 1,168 Utah 72 (72.7) 19 (19.2) 8 (8.1) 99 Vermont 39 (97.5) 1 (2.5) 0 (0.0) 40 Virginia 254 (89.4) 14 (4.9) 16 (5.6) 284 Washington 217 (94.8) 6 (2.6) 6 (2.6) 229 West Virginia 110 (87.3) 8 (6.3) 8 (6.3) 126 Wisconsin 362 (93.1) 12 (3.1) 15 (3.9) 389 Wyoming 31 (81.6) 2 (5.3) 5 (13.2) 38
Source: CASPER; *Certified by both Medicare and Medicaid
34 Nursing Home Data Compendium 2013

Table 1.3.d. Number of Nursing Homes by Certification Type: United States, 2011
Certification Type - Number (Percent) Dually Certified* Medicare Only Medicaid Only All Facilities
Nation 14,330 (91.5) 767 (4.9) 569 (3.6) 15,666 Alabama 217 (95.6) 8 (3.5) 2 (0.9) 227 Alaska 15 (100.0) 0 (0.0) 0 (0.0) 15 Arizona 117 (82.4) 25 (17.6) 0 (0.0) 142 Arkansas 213 (91.4) 7 (3.0) 13 (5.6) 233 California 1,110 (90.1) 66 (5.4) 56 (4.5) 1,232 Colorado 177 (83.5) 21 (9.9) 14 (6.6) 212 Connecticut 223 (95.3) 11 (4.7) 0 (0.0) 234 Delaware 37 (80.4) 3 (6.5) 6 (13.0) 46 District of Columbia 18 (94.7) 0 (0.0) 1 (5.3) 19
Florida 648 (95.6) 27 (4.0) 3 (0.4) 678 Georgia 341 (95.5) 12 (3.4) 4 (1.1) 357 Hawaii 46 (95.8) 1 (2.1) 1 (2.1) 48 Idaho 73 (92.4) 6 (7.6) 0 (0.0) 79 Illinois 661 (85.5) 46 (6.0) 66 (8.5) 773 Indiana 468 (91.8) 25 (4.9) 17 (3.3) 510 Iowa 407 (92.1) 10 (2.3) 25 (5.7) 442 Kansas 263 (76.7) 12 (3.5) 68 (19.8) 343 Kentucky 263 (93.3) 19 (6.7) 0 (0.0) 282 Louisiana 260 (93.2) 19 (6.8) 0 (0.0) 279 Maine 107 (99.1) 1 (0.9) 0 (0.0) 108 Maryland 215 (93.9) 10 (4.4) 4 (1.7) 229 Massachusetts 406 (95.5) 13 (3.1) 6 (1.4) 425 Michigan 399 (93.7) 16 (3.8) 11 (2.6) 426 Minnesota 366 (95.6) 7 (1.8) 10 (2.6) 383 Mississippi 166 (82.2) 7 (3.5) 29 (14.4) 202 Missouri 480 (93.4) 11 (2.1) 23 (4.5) 514 Montana 81 (96.4) 2 (2.4) 1 (1.2) 84 Nebraska 198 (89.2) 1 (0.5) 23 (10.4) 222 Nevada 46 (90.2) 3 (5.9) 2 (3.9) 51 New Hampshire 72 (92.3) 2 (2.6) 4 (5.1) 78 New Jersey 330 (91.2) 32 (8.8) 0 (0.0) 362 New Mexico 64 (90.1) 4 (5.6) 3 (4.2) 71 New York 626 (98.9) 5 (0.8) 2 (0.3) 633 North Carolina 404 (95.7) 16 (3.8) 2 (0.5) 422 North Dakota 82 (97.6) 2 (2.4) 0 (0.0) 84 Ohio 932 (97.3) 26 (2.7) 0 (0.0) 958 Oklahoma 280 (89.7) 13 (4.2) 19 (6.1) 312 Oregon 116 (84.1) 6 (4.3) 16 (11.6) 138 Pennsylvania 620 (87.3) 82 (11.5) 8 (1.1) 710 Rhode Island 84 (98.8) 1 (1.2) 0 (0.0) 85 South Carolina 156 (83.4) 31 (16.6) 0 (0.0) 187 South Dakota 94 (84.7) 1 (0.9) 16 (14.4) 111 Tennessee 276 (86.5) 28 (8.8) 15 (4.7) 319 Texas 1,077 (90.5) 71 (6.0) 42 (3.5) 1,190 Utah 74 (74.0) 19 (19.0) 7 (7.0) 100 Vermont 39 (97.5) 1 (2.5) 0 (0.0) 40 Virginia 260 (90.6) 11 (3.8) 16 (5.6) 287 Washington 216 (94.7) 6 (2.6) 6 (2.6) 228 West Virginia 109 (87.2) 7 (5.6) 9 (7.2) 125 Wisconsin 366 (93.1) 12 (3.1) 15 (3.8) 393 Wyoming 32 (84.2) 2 (5.3) 4 (10.5) 38
Source: CASPER; *Certified by both Medicare and Medicaid
Nursing Home Data Compendium 2013 35

Table 1.3.e. Number of Nursing Homes by Certification Type: United States, 2012 Certification Type - Number (Percent)
Dually Certified* Medicare Only Medicaid Only All Facilities Nation 14,330 (91.6) 777 (5.0) 536 (3.4) 15,643 Alabama 217 (95.2) 9 (3.9) 2 (0.9) 228 Alaska 16 (100.0) 0 (0.0) 0 (0.0) 16 Arizona 117 (80.1) 29 (19.9) 0 (0.0) 146 Arkansas 216 (93.1) 7 (3.0) 9 (3.9) 232 California 1,106 (89.8) 68 (5.5) 57 (4.6) 1,231 Colorado 178 (83.2) 22 (10.3) 14 (6.5) 214 Connecticut 220 (95.2) 11 (4.8) 0 (0.0) 231 Delaware 37 (82.2) 3 (6.7) 5 (11.1) 45 District of Columbia 18 (94.7) 0 (0.0) 1 (5.3) 19
Florida 651 (95.5) 28 (4.1) 3 (0.4) 682 Georgia 341 (95.5) 12 (3.4) 4 (1.1) 357 Hawaii 46 (95.8) 1 (2.1) 1 (2.1) 48 Idaho 72 (93.5) 5 (6.5) 0 (0.0) 77 Illinois 659 (85.6) 44 (5.7) 67 (8.7) 770 Indiana 474 (92.2) 24 (4.7) 16 (3.1) 514 Iowa 410 (92.3) 10 (2.3) 24 (5.4) 444 Kansas 268 (78.8) 12 (3.5) 60 (17.6) 340 Kentucky 265 (93.3) 19 (6.7) 0 (0.0) 284 Louisiana 259 (92.5) 21 (7.5) 0 (0.0) 280 Maine 106 (99.1) 1 (0.9) 0 (0.0) 107 Maryland 216 (93.9) 10 (4.3) 4 (1.7) 230 Massachusetts 402 (95.3) 14 (3.3) 6 (1.4) 422 Michigan 399 (93.9) 17 (4.0) 9 (2.1) 425 Minnesota 362 (95.5) 7 (1.8) 10 (2.6) 379 Mississippi 169 (82.8) 8 (3.9) 27 (13.2) 204 Missouri 479 (93.6) 10 (2.0) 23 (4.5) 512 Montana 80 (96.4) 2 (2.4) 1 (1.2) 83 Nebraska 196 (89.5) 1 (0.5) 22 (10.0) 219 Nevada 46 (90.2) 3 (5.9) 2 (3.9) 51 New Hampshire 70 (92.1) 2 (2.6) 4 (5.3) 76 New Jersey 333 (91.5) 31 (8.5) 0 (0.0) 364 New Mexico 65 (90.3) 4 (5.6) 3 (4.2) 72 New York 624 (98.7) 6 (0.9) 2 (0.3) 632 North Carolina 397 (95.7) 16 (3.9) 2 (0.5) 415 North Dakota 81 (97.6) 2 (2.4) 0 (0.0) 83 Ohio 925 (97.3) 26 (2.7) 0 (0.0) 951 Oklahoma 281 (90.4) 14 (4.5) 16 (5.1) 311 Oregon 116 (84.7) 6 (4.4) 15 (10.9) 137 Pennsylvania 620 (87.6) 81 (11.4) 7 (1.0) 708 Rhode Island 83 (98.8) 1 (1.2) 0 (0.0) 84 South Carolina 155 (82.0) 34 (18.0) 0 (0.0) 189 South Dakota 93 (84.5) 1 (0.9) 16 (14.5) 110 Tennessee 281 (87.3) 28 (8.7) 13 (4.0) 322 Texas 1,091 (91.1) 72 (6.0) 34 (2.8) 1,197 Utah 74 (74.7) 18 (18.2) 7 (7.1) 99 Vermont 37 (97.4) 1 (2.6) 0 (0.0) 38 Virginia 257 (90.5) 11 (3.9) 16 (5.6) 284 Washington 215 (94.7) 6 (2.6) 6 (2.6) 227 West Virginia 110 (88.0) 6 (4.8) 9 (7.2) 125 Wisconsin 364 (93.3) 11 (2.8) 15 (3.8) 390 Wyoming 33 (84.6) 2 (5.1) 4 (10.3) 39
Source: CASPER; *Certified by both Medicare and Medicaid
36 Nursing Home Data Compendium 2013

Table 1.3.f. Number of Nursing Homes by Certification Type: United States (2008, 2012 and Change)
Number in 2008, 2012 and Percent Change (% Δ), by Certification Type Dually Certified* Medicare Only Medicaid Only All Facilities
2008 2012 % Δ 2008 2012 % Δ 2008 2012 % Δ 2008 2012 % Δ Nation 14,228 14,330 +0.7 802 777 -3.1 723 536 -25.9 15,753 15,643 -0.7 Alabama 219 217 -0.9 10 9 -10.0 3 2 -33.3 232 228 -1.7 Alaska 15 16 +6.7 0 0 0.0 0 0 0.0 15 16 +6.7 Arizona 114 117 +2.6 20 29 +45.0 0 0 0.0 134 146 +9.0 Arkansas 205 216 +5.4 13 7 -46.2 19 9 -52.6 237 232 -2.1 California 1,116 1,106 -0.9 71 68 -4.2 68 57 -16.2 1,255 1,231 -1.9 Colorado 176 178 +1.1 20 22 +10.0 16 14 -12.5 212 214 +0.9 Connecticut 234 220 -6.0 9 11 +22.2 0 0 0.0 243 231 -4.9 Delaware 36 37 +2.8 3 3 0.0 6 5 -16.7 45 45 0.0 District of Columbia 17 18 +5.9 0 0 0.0 1 1 0.0 18 19 +5.6 Florida 647 651 +0.6 29 28 -3.4 3 3 0.0 679 682 +0.4 Georgia 341 341 0.0 13 12 -7.7 5 4 -20.0 359 357 -0.6 Hawaii 43 46 +7.0 2 1 -50.0 3 1 -66.7 48 48 0.0 Idaho 72 72 0.0 5 5 0.0 0 0 0.0 77 77 0.0 Illinois 654 659 +0.8 53 44 -17.0 89 67 -24.7 796 770 -3.3 Indiana 455 474 +4.2 35 24 -31.4 21 16 -23.8 511 514 +0.6 Iowa 404 410 +1.5 11 10 -9.1 37 24 -35.1 452 444 -1.8 Kansas 259 268 +3.5 11 12 +9.1 75 60 -20.0 345 340 -1.4 Kentucky 265 265 0.0 22 19 -13.6 0 0 0.0 287 284 -1.0 Louisiana 263 259 -1.5 22 21 -4.5 0 0 0.0 285 280 -1.8 Maine 110 106 -3.6 2 1 -50.0 0 0 0.0 112 107 -4.5 Maryland 215 216 +0.5 10 10 0.0 5 4 -20.0 230 230 0.0 Massachusetts 414 402 -2.9 13 14 +7.7 8 6 -25.0 435 422 -3.0 Michigan 392 399 +1.8 15 17 +13.3 21 9 -57.1 428 425 -0.7 Minnesota 371 362 -2.4 7 7 0.0 12 10 -16.7 390 379 -2.8 Mississippi 162 169 +4.3 11 8 -27.3 31 27 -12.9 204 204 0.0 Missouri 475 479 +0.8 14 10 -28.6 30 23 -23.3 519 512 -1.3 Montana 85 80 -5.9 5 2 -60.0 1 1 0.0 91 83 -8.8 Nebraska 194 196 +1.0 1 1 0.0 30 22 -26.7 225 219 -2.7 Nevada 44 46 +4.5 2 3 +50.0 2 2 0.0 48 51 +6.3 New Hampshire 72 70 -2.8 2 2 0.0 4 4 0.0 78 76 -2.6 New Jersey 330 333 +0.9 31 31 0.0 0 0 0.0 361 364 +0.8 New Mexico 63 65 +3.2 3 4 +33.3 4 3 -25.0 70 72 +2.9 New York 647 624 -3.6 5 6 +20.0 2 2 0.0 654 632 -3.4 North Carolina 407 397 -2.5 15 16 +6.7 1 2 +100 423 415 -1.9 North Dakota 80 81 +1.3 3 2 -33.3 0 0 0.0 83 83 0.0 Ohio 921 925 +0.4 31 26 -16.1 1 0 -100 953 951 -0.2 Oklahoma 272 281 +3.3 14 14 0.0 37 16 -56.8 323 311 -3.7 Oregon 116 116 0.0 5 6 +20.0 17 15 -11.8 138 137 -0.7 Pennsylvania 622 620 -0.3 85 81 -4.7 3 7 +133 710 708 -0.3 Rhode Island 85 83 -2.4 1 1 0.0 0 0 0.0 86 84 -2.3 South Carolina 152 155 +2.0 23 34 +47.8 0 0 0.0 175 189 +8.0 South Dakota 93 93 0.0 1 1 0.0 16 16 0.0 110 110 0.0 Tennessee 274 281 +2.6 22 28 +27.3 24 13 -45.8 320 322 +0.6 Texas 1,011 1,091 +7.9 75 72 -4.0 57 34 -40.4 1,143 1,197 +4.7 Utah 70 74 +5.7 15 18 +20.0 8 7 -12.5 93 99 +6.5 Vermont 39 37 -5.1 1 1 0.0 0 0 0.0 40 38 -5.0 Virginia 250 257 +2.8 11 11 0.0 20 16 -20.0 281 284 +1.1 Washington 225 215 -4.4 5 6 +20.0 8 6 -25.0 238 227 -4.6 West Virginia 111 110 -0.9 11 6 -45.5 8 9 +12.5 130 125 -3.8 Wisconsin 360 364 +1.1 12 11 -8.3 21 15 -28.6 393 390 -0.8 Wyoming 31 33 +6.5 2 2 0.0 6 4 -33.3 39 39 0.0 Source: CASPER; *Certified by both Medicare and Medicaid
Nursing Home Data Compendium 2013 37

Table 1.4. Nursing Home Occupancy Rates: United States, 2008-2012
Percentage of Certified Beds Occupied 2008 2009 2010 2011 2012 % Δ, 2008-2012
Nation 83.9 83.4 83.0 82.7 82.5 -1.7 Alabama 86.6 86.8 86.4 85.7 85.5 -1.3 Alaska 85.5 89.7 93.5 92.2 88.3 +3.3 Arizona 77.8 76.5 73.8 72.3 69.5 -10.6 Arkansas 72.9 73.6 73.6 73.2 73.0 +0.1 California 85.4 84.9 85.6 85.5 85.5 +0.0 Colorado 81.5 81.6 80.8 80.3 79.3 -2.7 Connecticut 90.8 90.4 90.2 89.3 89.8 -1.1 Delaware 86.2 86.9 84.8 86.6 88.3 +2.4 District of Columbia 91.8 93.3 92.2 92.4 92.1 +0.3 Florida 87.7 87.8 87.8 88.0 87.5 -0.2 Georgia 88.8 87.9 86.7 86.4 86.1 -3.1 Hawaii 91.2 91.0 89.7 89.6 87.0 -4.6 Idaho 74.8 73.5 74.0 73.0 72.1 -3.6 Illinois 77.8 77.0 77.1 77.6 77.2 -0.7 Indiana 80.4 80.2 79.4 79.1 78.2 -2.8 Iowa 80.9 80.7 80.7 80.0 80.0 -1.2 Kansas 82.2 82.7 82.4 81.8 82.1 -0.0 Kentucky 89.8 88.9 89.5 89.0 87.8 -2.2 Louisiana 72.9 72.5 73.1 73.7 74.6 +2.2 Maine 91.2 91.1 90.8 89.8 89.8 -1.5 Maryland 86.8 87.2 86.8 86.9 86.1 -0.9 Massachusetts 89.6 89.4 88.7 88.8 88.3 -1.5 Michigan 86.3 85.7 85.6 85.4 84.8 -1.8 Minnesota 92.2 91.1 90.8 89.8 89.8 -2.6 Mississippi 88.0 88.5 88.5 88.1 87.6 -0.5 Missouri 72.8 73.2 73.0 73.0 73.1 +0.3 Montana 73.1 72.9 71.5 69.5 70.3 -3.8 Nebraska 79.3 78.8 79.2 78.0 77.7 -2.0 Nevada 84.9 83.2 82.9 82.4 79.0 -6.9 New Hampshire 88.3 88.7 89.4 89.7 90.8 +2.8 New Jersey 89.4 89.2 88.8 87.1 86.9 -2.8 New Mexico 82.6 81.1 82.5 81.5 81.5 -1.4 New York 92.8 92.7 92.3 91.8 91.6 -1.2 North Carolina 86.5 85.8 85.8 85.6 85.7 -0.9 North Dakota 89.4 89.1 85.6 87.5 89.1 -0.3 Ohio 87.0 86.1 85.0 84.7 84.2 -3.2 Oklahoma 66.9 67.2 67.0 68.0 68.5 +2.3 Oregon 66.2 64.9 63.3 62.9 62.6 -5.5 Pennsylvania 89.7 89.9 90.1 89.3 89.7 +0.1 Rhode Island 89.9 91.3 91.5 91.7 91.1 +1.3 South Carolina 91.3 90.4 89.5 87.7 86.1 -5.8 South Dakota 99.8 92.7 85.6 94.9 91.7 -8.2 Tennessee 87.8 86.6 86.3 85.0 83.9 -4.3 Texas 73.5 71.8 71.7 71.3 72.0 -2.0 Utah 70.8 68.9 67.9 67.2 67.2 -5.1 Vermont 92.6 91.5 90.4 88.7 88.0 -5.0 Virginia 89.3 89.4 88.2 87.6 87.5 -2.0 Washington 83.2 82.9 82.6 81.4 80.5 -3.3 West Virginia 88.8 88.6 89.0 89.8 89.5 +0.7 Wisconsin 86.6 85.9 84.3 83.3 82.7 -4.5 Wyoming 80.8 78.7 81.7 81.4 79.7 -1.3
Source: CASPER
38 Nursing Home Data Compendium 2013

Nursing Home Data Compendium 2013 39
Table 1.5. National Population and Number of Certified Nursing Home Beds: United States, 2003-2012
National Population Beds Per 1000 Population
All Ages Under 65 65 and Over 85 and Over All Ages 65 and Over 85 and Over
2003 290,809,777 254,890,603 35,919,174 4,713,465 5.8 47.3 360.7
2004 293,655,404 257,361,419 36,293,985 4,859,631 5.7 46.5 347.4
2005 296,410,404 259,620,291 36,790,113 5,095,938 5.7 45.7 330.2
2006 299,398,484 262,138,132 37,260,352 5,296,817 5.6 45.0 316.7
2007 301,621,157 263,733,199 37,887,958 5,512,298 5.6 44.3 304.2
2008 304,059,724 265,190,008 38,869,716 5,721,768 5.5 43.0 292.0
2009 307,006,550 267,435,960 39,570,590 5,630,661 5.4 42.2 296.3
2010 309,349,689 268,912,108 40,437,581 5,532,756 5.4 41.2 301.1
2011 311,591,917 270,197,776 41,394,141 5,737,173 5.4 40.3 290.6
2012 313,914,040 270,768,684 43,145,356 5,887,330 5.3 38.6 282.9
Source: CASPER & US Census

40 Nursing Home Data Compendium 2013

Section 2.
Nursing Home Survey Results
Nursing Home Data Compendium 2013 41

42 Nursing Home Data Compendium 2013

Figure 2.1. Scope and Severity Grid for Rating Nursing Home Deficiencies
Nursing Home Data Compendium 2013 43
*A level citations not reported by CMSSource: CASPER

Figure 2.2.a. Percentage Distribution of Scope and Severity of Health Deficiency Citations: United States, 2008
44 Nursing Home Data Compendium 2013
*A level citations not reported by CMSSource: CASPER

Figure 2.2.b. Percentage Distribution of Scope and Severity of Health Deficiency Citations: United States, 2009
Nursing Home Data Compendium 2013 45
*A level citations not reported by CMSSource: CASPER

Figure 2.2.c. Percentage Distribution of Scope and Severity of Health Deficiency Citations: United States, 2010
46 Nursing Home Data Compendium 2013
*A level citations not reported by CMSSource: CASPER

Figure 2.2.d. Percentage Distribution of Scope and Severity of Health Deficiency Citations: United States, 2011
Nursing Home Data Compendium 2013 47
*A level citations not reported by CMSSource: CASPER

Figure 2.2.e. Percentage Distribution of Scope and Severity of Health Deficiency Citations: United States, 2012
48 Nursing Home Data Compendium 2013
*A level citations not reported by CMSSource: CASPER

Figure 2.2.f. Percent Change in Distribution of Scope and Severity of Health Deficiency Citations: United States, 2008-2012
Nursing Home Data Compendium 2013 49
*A level citations not reported by CMS**I level citations are too few to produce meaningful change statistics Source: CASPER

50N
ursing Hom
e Data C
ompendium
2013
Figure 2.3. Mean Number of Health Deficiencies Cited in Nursing Home Surveys by Year: United States, 2003-2012
Source: CASPER

Nursing H
ome D
ata Com
pendium 2013
51
Figure 2.4. Percentage of Nursing Home Surveys Resulting in Zero Health Deficiencies, Actual Harm/Immediate Jeopardy, and Substandard Quality of Care: United States, 2003-2012
Source: CASPER

52N
ursing Hom
e Data C
ompendium
2013
Figure 2.5. Distribution of Scope and Severity of Health Deficiency Citations by Year: United States, 2003-2012
Source: CASPER

Nursing H
ome D
ata Com
pendium 2013
53
Figure 2.6. Percentage of Nursing Home Surveys Resulting in a Deficiency for Actual Harm or Immediate Jeopardy to Nursing Home Residents by State: United States, 2012
Source: CASPER Numbers in parentheses in legend indicate number of states in a given category

54N
ursing Hom
e Data C
ompendium
2013
Figure 2.7. Percentage of Nursing Home Surveys Resulting in a Deficiency for Immediate Jeopardy to Nursing Home Residents by State: United States, 2012
Source: CASPER Numbers in parentheses in legend indicate number of states in a given category

Nursing H
ome D
ata Com
pendium 2013
55
Figure 2.8. Percentage of Nursing Home Surveys Resulting in Zero Deficiencies by State: United States, 2012
Source: CASPER Numbers in parentheses in legend indicate number of states in a given category

56N
ursing Hom
e Data C
ompendium
2013
Figure 2.9. Percentage of Nursing Home Surveys Resulting in Substandard Quality of Care Deficiencies by State: United States, 2012
Source: CASPER Numbers in parentheses in legend indicate number of states in a given category

Table 2.1.a. Number of Health Deficiencies Cited in Nursing Home Surveys by Bed Size Category: United States, 2008
Mean Number by Bed Size Category <50 50-99 100-199 >199 All Facilities
Nation 5.2 6.8 7.7 7.9 7.0 Alabama 4.3 4.3 5.2 5.9 4.9 Alaska 3.7 11.3 n/a 6.0 5.6 Arizona 4.0 6.8 10.1 10.6 8.6 Arkansas 4.6 7.5 8.2 5.5 7.8 California 8.6 11.0 14.3 18.4 11.7 Colorado 6.5 9.9 11.4 17.0 10.1 Connecticut 5.3 6.7 8.6 11.1 8.0 Delaware 9.0 10.7 13.6 20.0 12.3 District of Columbia 7.3 13.2 16.3 23.0 15.8 Florida 7.2 8.0 9.5 9.5 9.1 Georgia 4.8 6.0 6.4 8.4 6.3 Hawaii 6.0 7.2 8.8 10.3 7.4 Idaho 7.7 8.7 11.3 n/a 9.4 Illinois 3.4 5.7 6.5 7.6 6.0 Indiana 5.2 7.3 9.9 11.4 8.0 Iowa 4.8 5.8 10.3 6.3 6.1 Kansas 7.6 10.7 10.5 18.0 9.8 Kentucky 2.9 5.0 6.4 6.2 5.3 Louisiana 3.5 8.5 8.1 8.9 7.8 Maine 7.4 7.2 8.2 10.5 7.4 Maryland 5.0 7.5 11.3 12.4 9.8 Massachusetts 2.9 4.7 6.2 6.1 5.3 Michigan 6.2 8.1 8.8 9.8 8.4 Minnesota 9.6 9.6 11.6 10.7 10.2 Mississippi 4.7 5.0 6.1 6.3 5.4 Missouri 4.4 7.0 9.8 10.2 8.1 Montana 6.6 6.3 9.6 10.0 7.3 Nebraska 6.3 6.3 8.0 9.4 6.7 Nevada 6.4 9.1 9.0 10.7 8.6 New Hampshire 2.7 5.3 6.4 4.2 5.2 New Jersey 2.5 3.2 4.8 5.6 4.5 New Mexico 2.3 8.3 8.2 5.5 7.4 New York 2.6 4.1 5.2 5.0 4.7 North Carolina 1.8 3.8 4.1 4.9 3.8 North Dakota 2.6 3.3 2.9 4.0 2.9 Ohio 4.2 5.6 6.3 6.4 5.7 Oklahoma 7.8 10.0 10.8 15.8 10.2 Oregon 3.5 4.9 4.9 8.5 4.7 Pennsylvania 3.3 3.4 5.5 6.4 4.8 Rhode Island 2.4 3.3 3.6 2.0 3.3 South Carolina 4.6 6.0 7.5 8.8 6.5 South Dakota 4.4 4.4 4.3 n/a 4.4 Tennessee 5.0 5.8 6.2 6.9 6.0 Texas 3.6 5.0 5.8 7.6 5.4 Utah 3.1 6.0 8.0 11.0 6.0 Vermont 6.1 7.5 6.7 n/a 6.8 Virginia 2.7 7.7 9.6 13.3 8.4 Washington 4.5 6.8 7.4 2.8 6.6 West Virginia 6.0 8.1 10.6 13.0 8.6 Wisconsin 4.4 4.8 6.6 7.4 5.5 Wyoming 7.5 12.0 12.0 n/a 10.8
Source: CASPER
Nursing Home Data Compendium 2013 57

Table 2.1.b. Number of Health Deficiencies Cited in Nursing Home Surveys by Bed Size Category: United States, 2009
Mean Number by Bed Size Category <50 50-99 100-199 >199 All Facilities
Nation 5.0 6.6 7.3 7.5 6.7 Alabama 3.4 3.3 3.9 4.1 3.7 Alaska 3.8 7.4 n/a 10.0 5.2 Arizona 8.2 9.8 12.6 14.4 11.4 Arkansas 4.6 7.6 8.0 8.8 7.8 California 7.3 9.9 13.2 17.6 10.6 Colorado 6.7 10.7 11.9 13.6 10.7 Connecticut 4.7 6.6 7.7 9.3 7.3 Delaware 8.5 9.5 14.3 13.0 12.3 District of Columbia 6.0 13.4 16.0 26.0 16.3 Florida 5.4 6.5 7.7 7.1 7.3 Georgia 3.8 5.1 5.5 8.9 5.5 Hawaii 5.0 9.8 12.0 8.5 8.5 Idaho 6.5 10.4 11.6 n/a 9.5 Illinois 3.5 5.6 6.9 7.8 6.1 Indiana 4.2 6.6 8.6 10.1 7.2 Iowa 4.8 5.7 7.6 10.0 5.8 Kansas 8.4 11.8 10.2 8.0 10.5 Kentucky 3.0 5.2 6.0 6.8 5.2 Louisiana 5.1 8.1 7.5 7.6 7.4 Maine 6.5 6.9 7.4 5.0 6.7 Maryland 5.5 6.5 10.2 11.1 8.9 Massachusetts 2.8 3.6 4.7 4.8 4.2 Michigan 6.4 7.4 8.8 8.0 8.0 Minnesota 8.3 8.1 10.1 8.9 8.7 Mississippi 3.5 4.4 6.1 10.0 5.0 Missouri 5.3 7.2 9.4 10.9 8.1 Montana 6.3 6.5 7.7 16.0 7.0 Nebraska 4.4 5.1 6.6 5.3 5.1 Nevada 5.5 7.8 10.6 9.4 8.8 New Hampshire 2.9 4.0 5.2 3.6 4.3 New Jersey 2.5 3.9 6.6 6.6 5.8 New Mexico 1.6 3.5 5.5 2.3 4.1 New York 3.5 4.8 5.5 5.1 5.1 North Carolina 1.4 3.6 4.5 4.6 3.9 North Dakota 5.2 5.8 5.7 3.5 5.5 Ohio 4.4 5.3 6.6 8.2 5.8 Oklahoma 6.9 10.6 9.0 9.3 9.5 Oregon 2.6 5.2 4.1 5.0 4.4 Pennsylvania 3.9 3.6 5.2 5.8 4.7 Rhode Island 4.2 2.6 2.7 4.0 2.9 South Carolina 4.9 5.3 6.6 9.6 5.9 South Dakota 4.6 4.3 6.1 n/a 4.6 Tennessee 4.9 4.0 5.4 7.2 5.1 Texas 3.2 5.3 5.9 6.5 5.5 Utah 2.5 5.4 7.5 7.0 5.5 Vermont 6.6 9.5 6.9 n/a 7.6 Virginia 3.6 7.1 9.8 9.2 8.2 Washington 3.9 7.6 7.2 6.0 6.9 West Virginia 4.5 8.0 11.0 20.0 8.6 Wisconsin 4.7 5.1 7.3 6.3 5.8 Wyoming 7.7 8.1 8.5 n/a 8.1
Source: CASPER
58 Nursing Home Data Compendium 2013

Table 2.1.c. Number of Health Deficiencies Cited in Nursing Home Surveys by Bed Size Category: United States, 2010
Mean Number by Bed Size Category <50 50-99 100-199 >199 All Facilities
Nation 5.0 6.1 6.5 7.0 6.2 Alabama 1.7 3.4 3.9 3.4 3.6 Alaska 6.3 7.0 4.0 n/a 6.3 Arizona 5.5 6.9 9.2 8.7 8.3 Arkansas 3.3 6.1 6.7 10.5 6.4 California 8.7 10.1 12.7 15.6 10.7 Colorado 9.0 10.5 13.2 22.7 11.9 Connecticut 5.7 6.0 7.0 7.5 6.7 Delaware 5.3 14.6 10.9 11.0 11.2 District of Columbia 13.0 16.2 31.2 18.0 20.9 Florida 4.6 6.2 6.3 6.3 6.2 Georgia 2.7 3.9 5.0 6.0 4.5 Hawaii 5.1 9.6 9.1 7.0 7.3 Idaho 7.4 8.8 12.3 n/a 9.6 Illinois 3.7 5.2 6.6 7.6 6.0 Indiana 4.9 5.9 8.0 11.1 6.7 Iowa 4.4 4.5 6.4 6.7 4.8 Kansas 9.0 10.3 10.4 13.3 9.9 Kentucky 4.0 4.9 5.4 5.0 5.0 Louisiana 3.9 8.3 7.2 9.3 7.3 Maine 5.8 5.4 4.0 4.5 5.3 Maryland 3.6 6.6 7.8 10.2 7.1 Massachusetts 3.1 3.5 3.9 5.8 3.8 Michigan 5.4 6.7 7.6 7.6 7.1 Minnesota 7.0 7.2 7.9 7.4 7.3 Mississippi 3.4 4.6 4.9 1.5 4.6 Missouri 3.4 6.0 7.3 6.2 6.4 Montana 5.1 6.2 6.9 10.0 6.2 Nebraska 4.3 5.5 6.1 3.3 5.1 Nevada 5.9 9.5 11.3 12.3 10.0 New Hampshire 4.3 5.5 5.6 9.5 5.6 New Jersey 1.9 3.5 5.2 7.0 4.9 New Mexico 2.1 4.8 4.2 3.0 4.1 New York 3.7 3.9 5.0 5.0 4.7 North Carolina 2.0 3.3 3.8 4.5 3.5 North Dakota 4.1 4.5 4.9 17.0 4.6 Ohio 4.3 5.6 5.3 4.9 5.3 Oklahoma 6.3 9.3 8.6 7.3 8.6 Oregon 2.7 4.3 5.3 3.0 4.3 Pennsylvania 3.7 3.7 5.2 5.3 4.7 Rhode Island 1.6 2.4 2.6 4.0 2.4 South Carolina 5.7 4.3 5.8 4.8 5.3 South Dakota 3.7 3.5 4.5 1.0 3.7 Tennessee 3.6 4.4 4.8 6.6 4.7 Texas 3.0 5.0 5.3 7.8 5.1 Utah 3.1 7.5 7.8 8.0 6.0 Vermont 4.6 6.9 4.2 n/a 5.3 Virginia 1.6 5.4 8.0 7.4 6.3 Washington 5.8 7.1 7.6 7.3 7.1 West Virginia 7.4 13.1 10.0 n/a 10.8 Wisconsin 3.9 5.5 6.4 6.7 5.6 Wyoming 7.6 10.2 12.5 n/a 10.3
Source: CASPER
Nursing Home Data Compendium 2013 59

Table 2.1.d. Number of Health Deficiencies Cited in Nursing Home Surveys by Bed Size Category: United States, 2011
Mean Number by Bed Size Category <50 50-99 100-199 >199 All Facilities
Nation 4.9 6.1 6.3 6.7 6.1 Alabama 1.4 3.2 4.1 3.6 3.7 Alaska 4.9 6.5 8.0 n/a 5.5 Arizona 2.5 5.2 7.0 5.9 6.0 Arkansas 5.0 6.4 6.9 8.5 6.7 California 7.3 9.3 11.0 13.6 9.6 Colorado 7.5 10.5 12.7 16.3 10.9 Connecticut 4.9 4.7 6.3 8.3 5.9 Delaware 4.1 9.4 11.1 16.0 9.6 District of Columbia 7.3 11.2 20.8 14.0 14.4 Florida 3.9 4.5 5.4 5.9 5.1 Georgia 4.6 4.8 4.4 7.5 4.7 Hawaii 5.4 11.3 9.0 16.0 8.6 Idaho 7.8 11.8 11.3 n/a 10.3 Illinois 3.3 5.5 7.5 8.0 6.4 Indiana 5.0 6.8 7.1 9.5 6.7 Iowa 4.7 4.8 6.5 6.3 5.0 Kansas 7.8 10.7 10.9 18.3 9.7 Kentucky 3.3 4.7 5.8 5.8 4.9 Louisiana 3.3 8.4 7.4 10.0 7.5 Maine 4.6 4.6 5.4 0.5 4.6 Maryland 2.5 6.4 7.1 6.3 6.3 Massachusetts 2.4 3.4 4.1 4.1 3.7 Michigan 5.9 7.0 8.4 7.9 7.7 Minnesota 6.6 6.6 7.0 5.8 6.7 Mississippi 3.3 4.0 4.5 5.0 4.2 Missouri 4.0 6.2 6.8 7.4 6.3 Montana 6.2 4.9 7.0 13.0 6.0 Nebraska 4.7 5.8 6.2 3.8 5.4 Nevada 5.2 11.1 8.9 11.6 8.9 New Hampshire 1.5 4.1 4.3 3.4 3.9 New Jersey 1.5 3.2 4.9 5.1 4.4 New Mexico 3.4 4.4 4.1 4.5 4.1 New York 4.2 4.7 6.1 4.9 5.3 North Carolina 2.0 2.9 3.1 3.1 2.9 North Dakota 4.6 5.3 5.8 5.8 5.2 Ohio 4.5 5.3 4.9 4.0 5.0 Oklahoma 8.5 9.3 9.8 8.3 9.4 Oregon 5.0 5.4 5.1 n/a 5.2 Pennsylvania 3.5 4.7 4.5 5.7 4.6 Rhode Island 1.3 1.1 2.1 4.7 1.7 South Carolina 3.7 4.7 5.5 4.3 4.8 South Dakota 3.1 5.3 4.7 n/a 4.0 Tennessee 5.3 5.6 6.1 10.3 6.1 Texas 3.5 4.8 5.3 6.8 5.1 Utah 7.4 12.0 14.8 6.0 11.3 Vermont 5.3 6.2 4.6 n/a 5.3 Virginia 2.7 5.7 7.7 9.5 6.6 Washington 6.6 8.0 9.1 5.5 8.2 West Virginia 4.7 9.8 13.7 n/a 10.1 Wisconsin 5.3 6.0 5.9 7.9 5.9 Wyoming 9.8 11.9 10.3 n/a 10.7
Source: CASPER
60 Nursing Home Data Compendium 2013
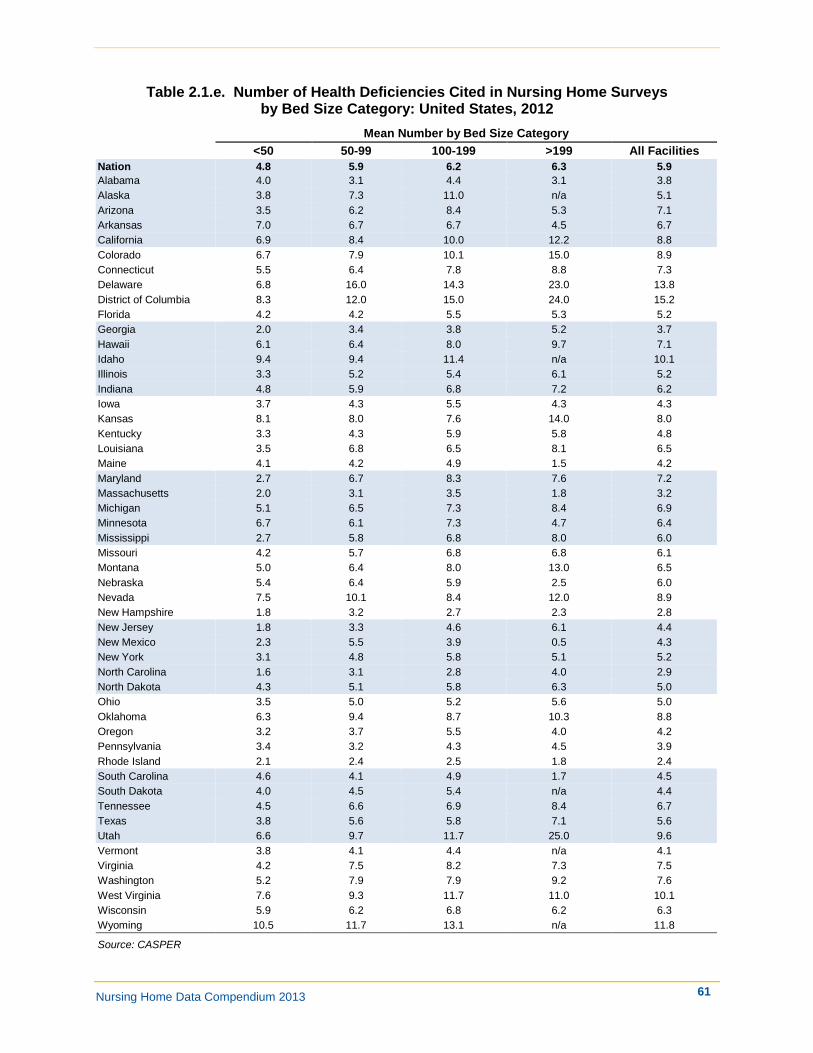
Table 2.1.e. Number of Health Deficiencies Cited in Nursing Home Surveys by Bed Size Category: United States, 2012
Mean Number by Bed Size Category <50 50-99 100-199 >199 All Facilities
Nation 4.8 5.9 6.2 6.3 5.9 Alabama 4.0 3.1 4.4 3.1 3.8 Alaska 3.8 7.3 11.0 n/a 5.1 Arizona 3.5 6.2 8.4 5.3 7.1 Arkansas 7.0 6.7 6.7 4.5 6.7 California 6.9 8.4 10.0 12.2 8.8 Colorado 6.7 7.9 10.1 15.0 8.9 Connecticut 5.5 6.4 7.8 8.8 7.3 Delaware 6.8 16.0 14.3 23.0 13.8 District of Columbia 8.3 12.0 15.0 24.0 15.2 Florida 4.2 4.2 5.5 5.3 5.2 Georgia 2.0 3.4 3.8 5.2 3.7 Hawaii 6.1 6.4 8.0 9.7 7.1 Idaho 9.4 9.4 11.4 n/a 10.1 Illinois 3.3 5.2 5.4 6.1 5.2 Indiana 4.8 5.9 6.8 7.2 6.2 Iowa 3.7 4.3 5.5 4.3 4.3 Kansas 8.1 8.0 7.6 14.0 8.0 Kentucky 3.3 4.3 5.9 5.8 4.8 Louisiana 3.5 6.8 6.5 8.1 6.5 Maine 4.1 4.2 4.9 1.5 4.2 Maryland 2.7 6.7 8.3 7.6 7.2 Massachusetts 2.0 3.1 3.5 1.8 3.2 Michigan 5.1 6.5 7.3 8.4 6.9 Minnesota 6.7 6.1 7.3 4.7 6.4 Mississippi 2.7 5.8 6.8 8.0 6.0 Missouri 4.2 5.7 6.8 6.8 6.1 Montana 5.0 6.4 8.0 13.0 6.5 Nebraska 5.4 6.4 5.9 2.5 6.0 Nevada 7.5 10.1 8.4 12.0 8.9 New Hampshire 1.8 3.2 2.7 2.3 2.8 New Jersey 1.8 3.3 4.6 6.1 4.4 New Mexico 2.3 5.5 3.9 0.5 4.3 New York 3.1 4.8 5.8 5.1 5.2 North Carolina 1.6 3.1 2.8 4.0 2.9 North Dakota 4.3 5.1 5.8 6.3 5.0 Ohio 3.5 5.0 5.2 5.6 5.0 Oklahoma 6.3 9.4 8.7 10.3 8.8 Oregon 3.2 3.7 5.5 4.0 4.2 Pennsylvania 3.4 3.2 4.3 4.5 3.9 Rhode Island 2.1 2.4 2.5 1.8 2.4 South Carolina 4.6 4.1 4.9 1.7 4.5 South Dakota 4.0 4.5 5.4 n/a 4.4 Tennessee 4.5 6.6 6.9 8.4 6.7 Texas 3.8 5.6 5.8 7.1 5.6 Utah 6.6 9.7 11.7 25.0 9.6 Vermont 3.8 4.1 4.4 n/a 4.1 Virginia 4.2 7.5 8.2 7.3 7.5 Washington 5.2 7.9 7.9 9.2 7.6 West Virginia 7.6 9.3 11.7 11.0 10.1 Wisconsin 5.9 6.2 6.8 6.2 6.3 Wyoming 10.5 11.7 13.1 n/a 11.8
Source: CASPER
Nursing Home Data Compendium 2013 61

Table 2.1.f. Number of Health Deficiencies Cited in Nursing Home Surveys by Bed Size Category: United States (2008, 2012 and Change)
Number in 2008, 2012 and Percent Change (% Δ), by Bed Size Category <50 50-99 100-199 >199 All Facilities
2008 2012 % Δ 2008 2012 % Δ 2008 2012 % Δ 2008 2012 % Δ 2008 2012 % Δ Nation 5.2 4.8 -7.9 6.8 5.9 -14.2 7.7 6.2 -19.7 7.9 6.3 -20.9 7.0 5.9 -16.4 Alabama 4.3 4.0 -7.0 4.3 3.1 -28.1 5.2 4.4 -14.9 5.9 3.1 -48.4 4.9 3.8 -21.7 Alaska 3.7 3.8 +4.1 11.3 7.3 -36.0 n/a 11.0 n/a 6.0 n/a n/a 5.6 5.1 -8.7 Arizona 4.0 3.5 -11.4 6.8 6.2 -9.7 10.1 8.4 -16.4 10.6 5.3 -50.6 8.6 7.1 -16.5 Arkansas 4.6 7.0 +52.2 7.5 6.7 -10.3 8.2 6.7 -18.7 5.5 4.5 -18.2 7.8 6.7 -14.0 California 8.6 6.9 -19.1 11.0 8.4 -23.1 14.3 10.0 -30.1 18.4 12.2 -33.6 11.7 8.8 -25.1 Colorado 6.5 6.7 +2.5 9.9 7.9 -20.6 11.4 10.1 -11.5 17.0 15.0 -11.8 10.1 8.9 -12.5 Connecticut 5.3 5.5 +5.4 6.7 6.4 -4.4 8.6 7.8 -9.3 11.1 8.8 -20.8 8.0 7.3 -9.2 Delaware 9.0 6.8 -24.4 10.7 16.0 +50.0 13.6 14.3 +5.3 20.0 23.0 +15.0 12.3 13.8 +12.2 District of Columbia 7.3 8.3 +13.6 13.2 12.0 -9.1 16.3 15.0 -7.7 23.0 24.0 +4.3 15.8 15.2 -3.5 Florida 7.2 4.2 -41.6 8.0 4.2 -47.5 9.5 5.5 -42.6 9.5 5.3 -44.2 9.1 5.2 -43.3 Georgia 4.8 2.0 -58.1 6.0 3.4 -44.1 6.4 3.8 -39.8 8.4 5.2 -38.7 6.3 3.7 -40.7 Hawaii 6.0 6.1 +1.3 7.2 6.4 -10.1 8.8 8.0 -9.1 10.3 9.7 -6.5 7.4 7.1 -3.7 Idaho 7.7 9.4 +21.3 8.7 9.4 +7.9 11.3 11.4 +1.1 n/a n/a n/a 9.4 10.1 +7.1 Illinois 3.4 3.3 -1.8 5.7 5.2 -8.2 6.5 5.4 -17.8 7.6 6.1 -19.8 6.0 5.2 -13.5 Indiana 5.2 4.8 -7.1 7.3 5.9 -19.9 9.9 6.8 -31.2 11.4 7.2 -36.4 8.0 6.2 -23.4 Iowa 4.8 3.7 -23.6 5.8 4.3 -25.9 10.3 5.5 -46.5 6.3 4.3 -31.6 6.1 4.3 -29.9 Kansas 7.6 8.1 +6.7 10.7 8.0 -25.6 10.5 7.6 -27.7 18.0 14.0 -22.2 9.8 8.0 -18.1 Kentucky 2.9 3.3 +12.6 5.0 4.3 -14.9 6.4 5.9 -8.4 6.2 5.8 -7.3 5.3 4.8 -8.8 Louisiana 3.5 3.5 +0.4 8.5 6.8 -19.3 8.1 6.5 -19.4 8.9 8.1 -9.1 7.8 6.5 -17.0 Maine 7.4 4.1 -44.7 7.2 4.2 -42.2 8.2 4.9 -40.7 10.5 1.5 -85.7 7.4 4.2 -43.6 Maryland 5.0 2.7 -46.2 7.5 6.7 -9.9 11.3 8.3 -27.2 12.4 7.6 -39.0 9.8 7.2 -27.0 Massachusetts 2.9 2.0 -33.3 4.7 3.1 -33.3 6.2 3.5 -42.7 6.1 1.8 -71.2 5.3 3.2 -40.5 Michigan 6.2 5.1 -17.0 8.1 6.5 -19.4 8.8 7.3 -17.7 9.8 8.4 -13.8 8.4 6.9 -18.2 Minnesota 9.6 6.7 -29.9 9.6 6.1 -36.7 11.6 7.3 -37.5 10.7 4.7 -55.8 10.2 6.4 -36.7 Mississippi 4.7 2.7 -42.7 5.0 5.8 +16.9 6.1 6.8 +11.6 6.3 8.0 +28.0 5.4 6.0 +10.8 Missouri 4.4 4.2 -4.1 7.0 5.7 -18.1 9.8 6.8 -30.3 10.2 6.8 -33.5 8.1 6.1 -24.1 Montana 6.6 5.0 -24.0 6.3 6.4 +1.5 9.6 8.0 -16.3 10.0 13.0 +30.0 7.3 6.5 -10.8 Nebraska 6.3 5.4 -13.3 6.3 6.4 +1.7 8.0 5.9 -26.2 9.4 2.5 -73.4 6.7 6.0 -10.7 Nevada 6.4 7.5 +18.5 9.1 10.1 +11.0 9.0 8.4 -6.2 10.7 12.0 +12.5 8.6 8.9 +3.0 New Hampshire 2.7 1.8 -34.4 5.3 3.2 -39.9 6.4 2.7 -57.3 4.2 2.3 -44.4 5.2 2.8 -46.8 New Jersey 2.5 1.8 -27.5 3.2 3.3 +3.6 4.8 4.6 -5.2 5.6 6.1 +8.7 4.5 4.4 -2.3 New Mexico 2.3 2.3 -2.6 8.3 5.5 -33.3 8.2 3.9 -52.2 5.5 0.5 -90.9 7.4 4.3 -42.2 New York 2.6 3.1 +19.0 4.1 4.8 +18.5 5.2 5.8 +11.4 5.0 5.1 +3.6 4.7 5.2 +9.3 North Carolina 1.8 1.6 -7.2 3.8 3.1 -16.9 4.1 2.8 -32.2 4.9 4.0 -18.6 3.8 2.9 -23.9 North Dakota 2.6 4.3 +68.1 3.3 5.1 +55.0 2.9 5.8 +105 4.0 6.3 +58.3 2.9 5.0 +70.9 Ohio 4.2 3.5 -18.6 5.6 5.0 -9.3 6.3 5.2 -16.1 6.4 5.6 -11.5 5.7 5.0 -12.4 Oklahoma 7.8 6.3 -19.2 10.0 9.4 -5.8 10.8 8.7 -19.5 15.8 10.3 -34.7 10.2 8.8 -13.6 Oregon 3.5 3.2 -7.5 4.9 3.7 -24.8 4.9 5.5 +11.9 8.5 4.0 -52.9 4.7 4.2 -9.7 Pennsylvania 3.3 3.4 +1.7 3.4 3.2 -3.4 5.5 4.3 -22.8 6.4 4.5 -30.4 4.8 3.9 -18.1 Rhode Island 2.4 2.1 -13.5 3.3 2.4 -26.8 3.6 2.5 -31.3 2.0 1.8 -12.5 3.3 2.4 -27.7 South Carolina 4.6 4.6 +0.5 6.0 4.1 -31.9 7.5 4.9 -34.2 8.8 1.7 -81.1 6.5 4.5 -30.1 South Dakota 4.4 4.0 -9.3 4.4 4.5 +1.5 4.3 5.4 +25.6 n/a n/a n/a 4.4 4.4 -0.5 Tennessee 5.0 4.5 -10.6 5.8 6.6 +12.9 6.2 6.9 +11.6 6.9 8.4 +21.9 6.0 6.7 +11.4 Texas 3.6 3.8 +4.0 5.0 5.6 +13.3 5.8 5.8 -0.8 7.6 7.1 -6.2 5.4 5.6 +3.9 Utah 3.1 6.6 +114 6.0 9.7 +62.5 8.0 11.7 +46.8 11.0 25.0 +127 6.0 9.6 +60.8 Vermont 6.1 3.8 -38.4 7.5 4.1 -45.2 6.7 4.4 -34.7 n/a n/a n/a 6.8 4.1 -39.3 Virginia 2.7 4.2 +56.8 7.7 7.5 -2.2 9.6 8.2 -14.7 13.3 7.3 -45.6 8.4 7.5 -10.5 Washington 4.5 5.2 +15.2 6.8 7.9 +15.9 7.4 7.9 +7.4 2.8 9.2 +235 6.6 7.6 +14.1 West Virginia 6.0 7.6 +25.0 8.1 9.3 +14.7 10.6 11.7 +9.9 13.0 11.0 -15.4 8.6 10.1 +17.0 Wisconsin 4.4 5.9 +35.1 4.8 6.2 +28.4 6.6 6.8 +3.0 7.4 6.2 -16.6 5.5 6.3 +16.2 Wyoming 7.5 10.5 +38.6 12.0 11.7 -2.8 12.0 13.1 +9.0 n/a n/a n/a 10.8 11.8 +9.5 Source: CASPER
62 Nursing Home Data Compendium 2013

Table 2.2.a. Number of Health Deficiencies Cited in Nursing Home Surveys by Ownership Type: United States, 2008
Mean Number by Ownership Type For-Profit Non-Profit Government All Facilities
Nation 7.6 5.8 6.3 7.0 Alabama 4.8 6.3 3.5 4.9 Alaska 10.3 3.8 4.6 5.6 Arizona 9.5 5.8 7.0 8.6 Arkansas 8.0 7.2 5.0 7.8 California 12.4 8.4 10.8 11.7 Colorado 11.2 7.7 8.2 10.1 Connecticut 8.4 6.6 7.5 8.0 Delaware 13.4 9.2 19.2 12.3 District of Columbia 18.8 14.2 13.5 15.8 Florida 9.2 8.8 7.2 9.1 Georgia 6.2 6.2 7.2 6.3 Hawaii 7.4 7.7 7.2 7.4 Idaho 9.9 5.3 10.8 9.4 Illinois 6.8 4.1 4.8 6.0 Indiana 8.5 7.1 7.4 8.0 Iowa 6.4 5.8 6.4 6.1 Kansas 11.0 9.2 7.3 9.8 Kentucky 5.8 3.9 5.6 5.3 Louisiana 8.6 5.8 3.6 7.8 Maine 7.5 7.2 10.0 7.4 Maryland 10.9 7.9 5.7 9.8 Massachusetts 5.7 4.6 3.9 5.3 Michigan 9.0 7.5 6.1 8.4 Minnesota 11.2 9.7 10.6 10.2 Mississippi 5.6 5.1 5.2 5.4 Missouri 8.5 7.2 7.8 8.1 Montana 9.1 5.7 6.4 7.3 Nebraska 6.8 6.3 7.0 6.7 Nevada 9.2 8.6 5.3 8.6 New Hampshire 6.0 4.4 4.8 5.2 New Jersey 4.9 3.5 4.7 4.5 New Mexico 8.4 6.1 2.6 7.4 New York 5.0 4.5 4.0 4.7 North Carolina 4.1 2.7 3.0 3.8 North Dakota 1.8 3.0 2.5 2.9 Ohio 6.2 4.0 5.2 5.7 Oklahoma 10.6 8.5 6.6 10.2 Oregon 5.1 2.9 4.3 4.7 Pennsylvania 5.8 3.7 5.8 4.8 Rhode Island 3.3 3.2 n/a 3.3 South Carolina 6.3 6.3 7.8 6.5 South Dakota 4.4 4.6 2.0 4.4 Tennessee 6.4 4.9 5.2 6.0 Texas 5.7 4.2 3.7 5.4 Utah 6.0 6.4 2.7 6.0 Vermont 7.4 5.5 4.0 6.8 Virginia 9.5 6.4 3.9 8.4 Washington 7.3 5.1 4.6 6.6 West Virginia 9.2 7.8 6.3 8.6 Wisconsin 6.3 4.7 4.5 5.5 Wyoming 13.5 9.9 8.1 10.8
Source: CASPER
Nursing Home Data Compendium 2013 63

Table 2.2.b. Number of Health Deficiencies Cited in Nursing Home Surveys by Ownership Type: United States, 2009
Mean Number by Ownership Type For-Profit Non-Profit Government All Facilities
Nation 7.2 5.6 6.3 6.7 Alabama 3.6 4.5 2.7 3.7 Alaska 9.0 5.6 3.3 5.2 Arizona 11.7 10.5 10.7 11.4 Arkansas 8.0 6.8 6.5 7.8 California 11.3 7.7 8.9 10.6 Colorado 11.1 9.8 9.2 10.7 Connecticut 7.9 4.8 2.5 7.3 Delaware 13.2 9.7 15.2 12.3 District of Columbia 17.3 13.9 22.5 16.3 Florida 7.6 6.7 5.4 7.3 Georgia 5.5 4.9 7.8 5.5 Hawaii 8.2 9.5 8.3 8.5 Idaho 9.2 9.7 10.3 9.5 Illinois 7.0 4.1 5.0 6.1 Indiana 7.9 5.6 6.1 7.2 Iowa 6.0 5.5 5.5 5.8 Kansas 12.2 8.5 9.7 10.5 Kentucky 5.6 4.0 4.9 5.2 Louisiana 7.9 6.4 4.6 7.4 Maine 6.7 6.8 4.0 6.7 Maryland 9.9 7.6 3.8 8.9 Massachusetts 4.6 3.2 5.0 4.2 Michigan 8.7 6.8 5.9 8.0 Minnesota 9.4 8.4 8.4 8.7 Mississippi 5.1 5.6 4.2 5.0 Missouri 8.7 7.0 6.4 8.1 Montana 7.6 6.6 6.3 7.0 Nebraska 5.4 4.6 5.2 5.1 Nevada 8.3 14.4 4.8 8.8 New Hampshire 5.0 3.6 3.3 4.3 New Jersey 6.4 4.1 6.8 5.8 New Mexico 4.3 4.0 2.3 4.1 New York 5.3 4.8 5.7 5.1 North Carolina 4.2 3.0 1.9 3.9 North Dakota 5.3 5.6 4.3 5.5 Ohio 6.1 4.5 6.5 5.8 Oklahoma 9.7 9.0 7.3 9.5 Oregon 4.7 3.8 1.0 4.4 Pennsylvania 5.4 3.9 4.9 4.7 Rhode Island 3.1 2.3 n/a 2.9 South Carolina 5.6 5.3 9.0 5.9 South Dakota 5.1 4.4 3.6 4.6 Tennessee 5.3 4.2 4.4 5.1 Texas 5.7 4.8 4.8 5.5 Utah 5.6 5.0 7.5 5.5 Vermont 7.9 6.3 12.0 7.6 Virginia 9.1 6.2 7.4 8.2 Washington 7.5 4.4 6.7 6.9 West Virginia 9.0 7.4 8.2 8.6 Wisconsin 6.8 4.5 5.3 5.8 Wyoming 9.2 10.3 6.9 8.1
Source: CASPER
64 Nursing Home Data Compendium 2013
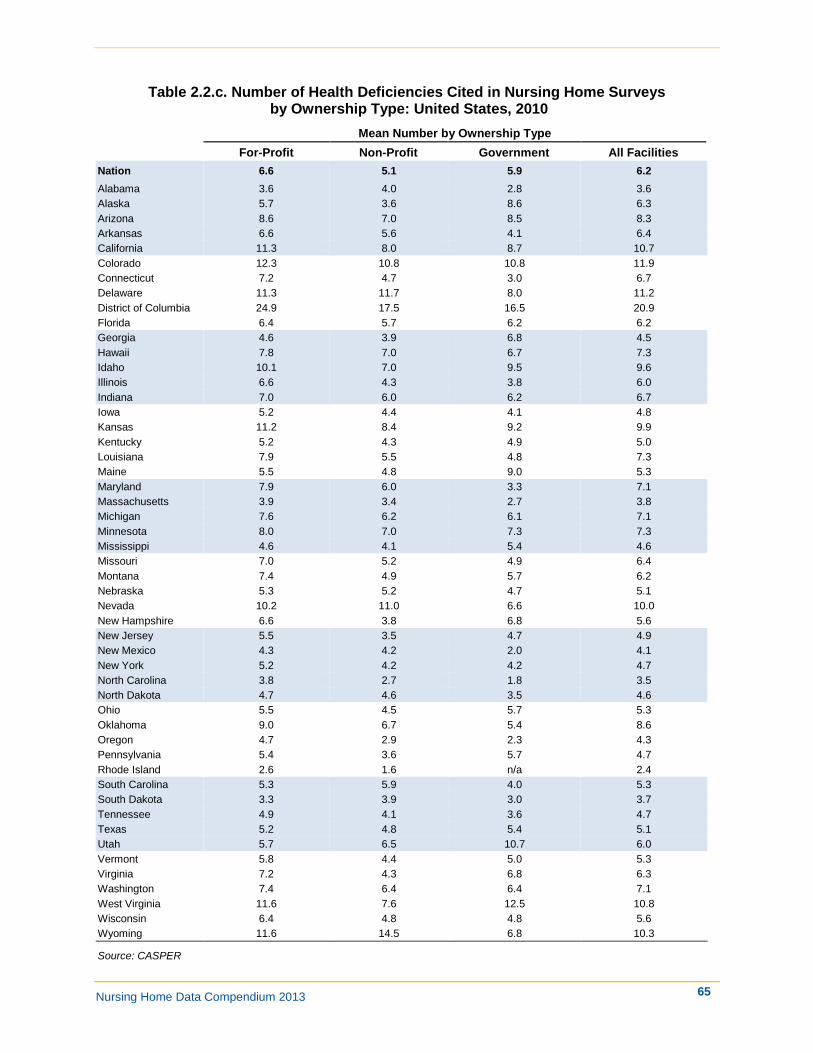
Table 2.2.c. Number of Health Deficiencies Cited in Nursing Home Surveys by Ownership Type: United States, 2010
Mean Number by Ownership Type For-Profit Non-Profit Government All Facilities
Nation 6.6 5.1 5.9 6.2 Alabama 3.6 4.0 2.8 3.6 Alaska 5.7 3.6 8.6 6.3 Arizona 8.6 7.0 8.5 8.3 Arkansas 6.6 5.6 4.1 6.4 California 11.3 8.0 8.7 10.7 Colorado 12.3 10.8 10.8 11.9 Connecticut 7.2 4.7 3.0 6.7 Delaware 11.3 11.7 8.0 11.2 District of Columbia 24.9 17.5 16.5 20.9 Florida 6.4 5.7 6.2 6.2 Georgia 4.6 3.9 6.8 4.5 Hawaii 7.8 7.0 6.7 7.3 Idaho 10.1 7.0 9.5 9.6 Illinois 6.6 4.3 3.8 6.0 Indiana 7.0 6.0 6.2 6.7 Iowa 5.2 4.4 4.1 4.8 Kansas 11.2 8.4 9.2 9.9 Kentucky 5.2 4.3 4.9 5.0 Louisiana 7.9 5.5 4.8 7.3 Maine 5.5 4.8 9.0 5.3 Maryland 7.9 6.0 3.3 7.1 Massachusetts 3.9 3.4 2.7 3.8 Michigan 7.6 6.2 6.1 7.1 Minnesota 8.0 7.0 7.3 7.3 Mississippi 4.6 4.1 5.4 4.6 Missouri 7.0 5.2 4.9 6.4 Montana 7.4 4.9 5.7 6.2 Nebraska 5.3 5.2 4.7 5.1 Nevada 10.2 11.0 6.6 10.0 New Hampshire 6.6 3.8 6.8 5.6 New Jersey 5.5 3.5 4.7 4.9 New Mexico 4.3 4.2 2.0 4.1 New York 5.2 4.2 4.2 4.7 North Carolina 3.8 2.7 1.8 3.5 North Dakota 4.7 4.6 3.5 4.6 Ohio 5.5 4.5 5.7 5.3 Oklahoma 9.0 6.7 5.4 8.6 Oregon 4.7 2.9 2.3 4.3 Pennsylvania 5.4 3.6 5.7 4.7 Rhode Island 2.6 1.6 n/a 2.4 South Carolina 5.3 5.9 4.0 5.3 South Dakota 3.3 3.9 3.0 3.7 Tennessee 4.9 4.1 3.6 4.7 Texas 5.2 4.8 5.4 5.1 Utah 5.7 6.5 10.7 6.0 Vermont 5.8 4.4 5.0 5.3 Virginia 7.2 4.3 6.8 6.3 Washington 7.4 6.4 6.4 7.1 West Virginia 11.6 7.6 12.5 10.8 Wisconsin 6.4 4.8 4.8 5.6 Wyoming 11.6 14.5 6.8 10.3
Source: CASPER
Nursing Home Data Compendium 2013 65

Table 2.2.d. Number of Health Deficiencies Cited in Nursing Home Surveys by Ownership Type: United States, 2011
Mean Number by Ownership Type For-Profit Non-Profit Government All Facilities
Nation 6.5 5.1 5.9 6.1 Alabama 3.6 4.0 2.7 3.7 Alaska 3.5 4.7 7.8 5.5 Arizona 6.0 6.3 4.5 6.0 Arkansas 6.7 6.6 5.6 6.7 California 10.1 7.0 8.3 9.6 Colorado 11.7 9.2 8.0 10.9 Connecticut 6.2 4.5 4.0 5.9 Delaware 10.4 7.4 12.8 9.6 District of Columbia 14.4 14.4 n/a 14.4 Florida 5.4 4.4 4.9 5.1 Georgia 4.7 4.1 6.8 4.7 Hawaii 9.8 7.3 8.1 8.6 Idaho 10.4 8.5 11.5 10.3 Illinois 7.1 4.5 5.5 6.4 Indiana 7.0 6.0 6.3 6.7 Iowa 5.2 4.7 5.4 5.0 Kansas 11.8 7.5 7.5 9.7 Kentucky 5.2 3.8 8.0 4.9 Louisiana 7.9 5.5 6.6 7.5 Maine 4.9 4.3 1.0 4.6 Maryland 7.1 4.6 3.0 6.3 Massachusetts 3.8 3.5 2.0 3.7 Michigan 8.3 6.6 5.4 7.7 Minnesota 7.0 6.5 6.6 6.7 Mississippi 4.1 4.6 3.8 4.2 Missouri 6.7 4.9 5.8 6.3 Montana 7.0 4.0 7.7 6.0 Nebraska 5.6 5.8 4.6 5.4 Nevada 9.0 8.8 7.8 8.9 New Hampshire 4.9 3.0 2.1 3.9 New Jersey 4.8 3.1 5.2 4.4 New Mexico 3.7 4.8 6.0 4.1 New York 5.5 4.9 6.2 5.3 North Carolina 3.1 2.4 1.6 2.9 North Dakota 6.8 5.1 4.0 5.2 Ohio 5.3 3.7 4.8 5.0 Oklahoma 9.6 8.8 6.9 9.4 Oregon 5.3 4.7 5.3 5.2 Pennsylvania 5.1 3.9 5.1 4.6 Rhode Island 1.8 1.5 n/a 1.7 South Carolina 4.8 4.8 4.3 4.8 South Dakota 4.2 3.9 3.6 4.0 Tennessee 6.4 4.6 6.9 6.1 Texas 5.1 4.7 4.5 5.1 Utah 12.0 10.5 4.0 11.3 Vermont 5.4 4.8 7.0 5.3 Virginia 7.2 5.2 5.8 6.6 Washington 8.8 6.2 6.9 8.2 West Virginia 12.3 7.0 8.8 10.1 Wisconsin 6.4 5.3 5.4 5.9 Wyoming 10.3 13.9 9.9 10.7
Source: CASPER
66 Nursing Home Data Compendium 2013

Table 2.2.e. Number of Health Deficiencies Cited in Nursing Home Surveys by Ownership Type: United States, 2012
Mean Number by Ownership Type For-Profit Non-Profit Government All Facilities
Nation 6.3 4.8 5.7 5.9 Alabama 3.9 3.7 3.1 3.8 Alaska 20.0 3.9 4.4 5.1 Arizona 7.5 5.4 3.5 7.1 Arkansas 6.8 6.5 6.0 6.7 California 9.2 6.3 8.2 8.8 Colorado 9.3 7.5 7.6 8.9 Connecticut 7.6 6.2 5.0 7.3 Delaware 12.7 13.7 23.0 13.8 District of Columbia 16.2 14.3 n/a 15.2 Florida 5.5 4.3 4.4 5.2 Georgia 4.0 3.1 3.7 3.7 Hawaii 7.9 5.2 8.4 7.1 Idaho 10.1 7.9 12.1 10.1 Illinois 5.6 4.0 6.4 5.2 Indiana 6.7 5.5 5.4 6.2 Iowa 4.4 4.1 5.0 4.3 Kansas 9.1 6.6 7.5 8.0 Kentucky 5.1 3.9 3.0 4.8 Louisiana 6.9 4.2 6.6 6.5 Maine 4.2 4.3 3.0 4.2 Maryland 8.1 5.0 4.8 7.2 Massachusetts 3.5 2.3 4.0 3.2 Michigan 7.5 5.4 5.9 6.9 Minnesota 7.4 6.0 6.2 6.4 Mississippi 6.2 6.3 5.0 6.0 Missouri 6.8 4.5 3.9 6.1 Montana 7.5 6.2 4.7 6.5 Nebraska 5.7 6.2 6.4 6.0 Nevada 9.2 8.7 7.2 8.9 New Hampshire 3.3 2.6 1.5 2.8 New Jersey 4.7 3.3 5.2 4.4 New Mexico 4.5 4.2 2.2 4.3 New York 5.3 5.0 5.3 5.2 North Carolina 3.0 2.3 2.5 2.9 North Dakota 5.7 5.1 1.5 5.0 Ohio 5.3 4.0 3.3 5.0 Oklahoma 9.1 7.8 6.7 8.8 Oregon 4.4 3.4 3.8 4.2 Pennsylvania 4.4 3.4 3.8 3.9 Rhode Island 2.7 1.2 n/a 2.4 South Carolina 4.6 4.5 3.6 4.5 South Dakota 4.7 4.4 2.0 4.4 Tennessee 6.7 7.1 6.3 6.7 Texas 5.8 4.5 4.7 5.6 Utah 9.8 8.2 8.5 9.6 Vermont 4.5 3.1 7.0 4.1 Virginia 8.4 5.8 4.9 7.5 Washington 8.0 6.5 5.7 7.6 West Virginia 10.5 7.9 10.5 10.1 Wisconsin 6.3 6.5 6.3 6.3 Wyoming 13.2 16.5 8.8 11.8 Source: CASPER
Nursing Home Data Compendium 2013 67

Table 2.2.f. Number of Health Deficiencies Cited in Nursing Home Surveys by Ownership Type: United States (2008, 2012 and Change)
Number in 2008, 2012 and Percent Change (% Δ), by Ownership Type For-Profit Non-Profit Government All Facilities
2008 2012 % Δ 2008 2012 % Δ 2008 2012 % Δ 2008 2012 % Δ Nation 7.6 6.3 -17.1 5.8 4.8 -17.3 6.3 5.7 -10.5 7.0 5.9 -16.4 Alabama 4.8 3.9 -18.3 6.3 3.7 -41.4 3.5 3.1 -12.2 4.9 3.8 -21.7 Alaska 10.3 20.0 +93.5 3.8 3.9 +2.0 4.6 4.4 -3.7 5.6 5.1 -8.7 Arizona 9.5 7.5 -20.1 5.8 5.4 -8.3 7.0 3.5 -50.0 8.6 7.1 -16.5 Arkansas 8.0 6.8 -15.4 7.2 6.5 -10.0 5.0 6.0 +20.0 7.8 6.7 -14.0 California 12.4 9.2 -25.6 8.4 6.3 -25.6 10.8 8.2 -23.9 11.7 8.8 -25.1 Colorado 11.2 9.3 -17.4 7.7 7.5 -2.5 8.2 7.6 -6.7 10.1 8.9 -12.5 Connecticut 8.4 7.6 -9.7 6.6 6.2 -5.8 7.5 5.0 -33.3 8.0 7.3 -9.2 Delaware 13.4 12.7 -5.3 9.2 13.7 +49.8 19.2 23.0 +19.8 12.3 13.8 +12.2 District of Columbia 18.8 16.2 -13.9 14.2 14.3 +0.5 13.5 n/a n/a 15.8 15.2 -3.5 Florida 9.2 5.5 -40.9 8.8 4.3 -50.9 7.2 4.4 -39.1 9.1 5.2 -43.3 Georgia 6.2 4.0 -36.0 6.2 3.1 -49.4 7.2 3.7 -48.5 6.3 3.7 -40.7 Hawaii 7.4 7.9 +7.9 7.7 5.2 -31.8 7.2 8.4 +17.8 7.4 7.1 -3.7 Idaho 9.9 10.1 +2.2 5.3 7.9 +47.9 10.8 12.1 +12.0 9.4 10.1 +7.1 Illinois 6.8 5.6 -18.1 4.1 4.0 -2.0 4.8 6.4 +34.5 6.0 5.2 -13.5 Indiana 8.5 6.7 -20.6 7.1 5.5 -22.1 7.4 5.4 -27.5 8.0 6.2 -23.4 Iowa 6.4 4.4 -31.0 5.8 4.1 -29.7 6.4 5.0 -22.2 6.1 4.3 -29.9 Kansas 11.0 9.1 -17.2 9.2 6.6 -28.6 7.3 7.5 +3.4 9.8 8.0 -18.1 Kentucky 5.8 5.1 -10.8 3.9 3.9 -1.1 5.6 3.0 -46.4 5.3 4.8 -8.8 Louisiana 8.6 6.9 -20.1 5.8 4.2 -28.1 3.6 6.6 +83.8 7.8 6.5 -17.0 Maine 7.5 4.2 -44.2 7.2 4.3 -41.0 10.0 3.0 -70.0 7.4 4.2 -43.6 Maryland 10.9 8.1 -25.4 7.9 5.0 -36.8 5.7 4.8 -16.0 9.8 7.2 -27.0 Massachusetts 5.7 3.5 -37.5 4.6 2.3 -50.8 3.9 4.0 +3.2 5.3 3.2 -40.5 Michigan 9.0 7.5 -16.6 7.5 5.4 -28.2 6.1 5.9 -3.9 8.4 6.9 -18.2 Minnesota 11.2 7.4 -34.3 9.7 6.0 -37.7 10.6 6.2 -40.8 10.2 6.4 -36.7 Mississippi 5.6 6.2 +10.7 5.1 6.3 +25.1 5.2 5.0 -4.3 5.4 6.0 +10.8 Missouri 8.5 6.8 -20.1 7.2 4.5 -37.4 7.8 3.9 -50.1 8.1 6.1 -24.1 Montana 9.1 7.5 -17.4 5.7 6.2 +9.6 6.4 4.7 -26.7 7.3 6.5 -10.8 Nebraska 6.8 5.7 -16.8 6.3 6.2 -0.8 7.0 6.4 -8.9 6.7 6.0 -10.7 Nevada 9.2 9.2 -0.4 8.6 8.7 +1.0 5.3 7.2 +34.4 8.6 8.9 +3.0 New Hampshire 6.0 3.3 -45.4 4.4 2.6 -40.7 4.8 1.5 -68.3 5.2 2.8 -46.8 New Jersey 4.9 4.7 -4.0 3.5 3.3 -6.4 4.7 5.2 +9.7 4.5 4.4 -2.3 New Mexico 8.4 4.5 -46.6 6.1 4.2 -31.5 2.6 2.2 -15.4 7.4 4.3 -42.2 New York 5.0 5.3 +5.3 4.5 5.0 +11.2 4.0 5.3 +32.1 4.7 5.2 +9.3 North Carolina 4.1 3.0 -26.6 2.7 2.3 -13.9 3.0 2.5 -16.7 3.8 2.9 -23.9 North Dakota 1.8 5.7 +224 3.0 5.1 +67.9 2.5 1.5 -40.0 2.9 5.0 +70.9 Ohio 6.2 5.3 -14.8 4.0 4.0 +0.0 5.2 3.3 -36.7 5.7 5.0 -12.4 Oklahoma 10.6 9.1 -14.2 8.5 7.8 -8.3 6.6 6.7 +1.3 10.2 8.8 -13.6 Oregon 5.1 4.4 -12.8 2.9 3.4 +17.9 4.3 3.8 -12.5 4.7 4.2 -9.7 Pennsylvania 5.8 4.4 -23.8 3.7 3.4 -7.4 5.8 3.8 -33.2 4.8 3.9 -18.1 Rhode Island 3.3 2.7 -19.5 3.2 1.2 -62.6 n/a n/a n/a 3.3 2.4 -27.7 South Carolina 6.3 4.6 -27.3 6.3 4.5 -27.5 7.8 3.6 -54.3 6.5 4.5 -30.1 South Dakota 4.4 4.7 +5.7 4.6 4.4 -4.2 2.0 2.0 0.0 4.4 4.4 -0.5 Tennessee 6.4 6.7 +4.5 4.9 7.1 +43.2 5.2 6.3 +22.6 6.0 6.7 +11.4 Texas 5.7 5.8 +2.2 4.2 4.5 +6.8 3.7 4.7 +25.9 5.4 5.6 +3.9 Utah 6.0 9.8 +62.7 6.4 8.2 +27.9 2.7 8.5 +219 6.0 9.6 +60.8 Vermont 7.4 4.5 -40.0 5.5 3.1 -43.5 4.0 7.0 +75.0 6.8 4.1 -39.3 Virginia 9.5 8.4 -11.2 6.4 5.8 -10.4 3.9 4.9 +26.2 8.4 7.5 -10.5 Washington 7.3 8.0 +9.0 5.1 6.5 +26.6 4.6 5.7 +23.8 6.6 7.6 +14.1 West Virginia 9.2 10.5 +13.2 7.8 7.9 +2.0 6.3 10.5 +67.4 8.6 10.1 +17.0 Wisconsin 6.3 6.3 -0.3 4.7 6.5 +39.3 4.5 6.3 +40.7 5.5 6.3 +16.2 Wyoming 13.5 13.2 -2.5 9.9 16.5 +67.1 8.1 8.8 +8.5 10.8 11.8 +9.5 Source: CASPER
68 Nursing Home Data Compendium 2013

Table 2.3.a. Percentage of Nursing Home Surveys Resulting in Zero Health Deficiency Citations by Bed Size Category: United States, 2008
Percentage by Bed Size Category <50 50-99 100-199 >199 All Facilities
Nation 13.9 8.1 5.4 4.8 7.5 Alabama 0.0 15.8 9.9 5.6 11.4 Alaska 11.1 0.0 n/a 0.0 7.7 Arizona 20.0 2.8 0.0 0.0 3.0 Arkansas 10.0 2.8 2.5 0.0 2.8 California 2.8 0.8 0.0 0.0 0.9 Colorado 8.6 1.1 0.0 0.0 1.9 Connecticut 12.5 3.9 2.3 0.0 3.3 Delaware 11.1 0.0 3.3 0.0 4.1 District of Columbia 0.0 0.0 0.0 0.0 0.0 Florida 5.0 3.9 2.5 0.0 2.8 Georgia 22.2 8.1 8.9 4.0 9.3 Hawaii 0.0 8.3 0.0 0.0 2.0 Idaho 0.0 4.8 0.0 n/a 1.6 Illinois 26.3 7.7 4.8 2.4 8.1 Indiana 19.1 14.7 6.1 0.0 11.7 Iowa 8.6 9.6 1.8 0.0 8.2 Kansas 8.0 6.5 8.2 0.0 7.1 Kentucky 25.5 10.7 7.6 0.0 11.6 Louisiana 12.5 2.4 2.1 5.6 3.2 Maine 2.3 3.5 10.0 0.0 3.6 Maryland 8.3 2.0 0.8 0.0 1.9 Massachusetts 33.9 17.0 7.8 21.4 14.2 Michigan 2.5 4.9 2.2 6.7 3.4 Minnesota 1.4 4.3 0.0 0.0 2.4 Mississippi 21.1 18.9 2.4 0.0 12.2 Missouri 11.1 6.4 1.3 10.0 4.7 Montana 6.5 0.0 0.0 0.0 2.4 Nebraska 5.1 2.7 0.0 0.0 2.9 Nevada 0.0 0.0 0.0 0.0 0.0 New Hampshire 33.3 5.3 12.9 0.0 11.6 New Jersey 31.4 15.3 6.5 1.7 9.4 New Mexico 11.1 3.7 3.2 0.0 4.3 New York 25.5 12.5 6.2 9.0 9.6 North Carolina 36.7 14.1 12.4 0.0 15.4 North Dakota 3.4 6.7 5.0 0.0 4.9 Ohio 19.8 13.2 9.2 8.3 12.2 Oklahoma 25.8 3.2 3.3 0.0 5.4 Oregon 27.3 14.5 12.8 0.0 15.8 Pennsylvania 14.3 12.2 4.9 7.2 8.2 Rhode Island 8.3 12.1 17.9 33.3 14.9 South Carolina 14.3 12.7 2.6 20.0 8.8 South Dakota 7.1 9.4 10.0 n/a 8.4 Tennessee 0.0 4.3 1.3 0.0 2.0 Texas 29.0 12.3 11.6 0.0 13.0 Utah 24.0 3.4 0.0 0.0 8.0 Vermont 9.1 0.0 0.0 n/a 2.7 Virginia 25.0 8.3 6.4 0.0 8.8 Washington 10.3 2.1 5.7 25.0 5.3 West Virginia 8.7 3.6 2.4 0.0 4.1 Wisconsin 15.1 13.6 7.0 0.0 11.1 Wyoming 0.0 0.0 0.0 n/a 0.0
Source: CASPER
Nursing Home Data Compendium 2013 69

Table 2.3.b. Percentage of Nursing Home Surveys Resulting in Zero Health Deficiency Citations by Bed Size Category: United States, 2009
Percentage by Bed Size Category <50 50-99 100-199 >199 All Facilities
Nation 16.5 8.1 6.0 3.8 8.0 Alabama 14.3 18.3 12.0 7.1 14.1 Alaska 0.0 0.0 n/a 0.0 0.0 Arizona 9.1 0.0 0.0 0.0 0.8 Arkansas 0.0 4.5 0.7 0.0 2.1 California 3.6 2.0 0.0 0.0 1.7 Colorado 5.7 0.0 0.0 0.0 0.9 Connecticut 28.6 5.7 2.3 0.0 4.8 Delaware 0.0 0.0 3.8 0.0 2.3 District of Columbia 0.0 0.0 0.0 0.0 0.0 Florida 9.5 6.6 3.4 0.0 4.2 Georgia 16.0 11.4 10.9 4.0 10.9 Hawaii 5.3 0.0 0.0 0.0 2.1 Idaho 4.2 0.0 4.3 n/a 2.7 Illinois 23.2 7.5 4.2 0.9 7.2 Indiana 29.9 13.0 6.7 0.0 12.5 Iowa 7.3 6.5 1.3 0.0 5.8 Kansas 8.0 6.0 4.8 0.0 6.4 Kentucky 26.7 10.5 3.1 0.0 10.3 Louisiana 22.7 0.0 4.4 0.0 4.9 Maine 11.6 2.0 0.0 0.0 5.7 Maryland 10.7 4.1 1.6 0.0 3.0 Massachusetts 35.1 27.4 16.1 21.1 21.5 Michigan 6.4 5.9 2.1 0.0 3.7 Minnesota 6.3 3.0 1.9 0.0 3.3 Mississippi 17.6 12.7 4.8 0.0 9.8 Missouri 11.9 5.2 4.0 0.0 5.0 Montana 5.9 2.9 10.3 0.0 6.1 Nebraska 19.0 5.3 0.0 0.0 9.2 Nevada 0.0 10.0 0.0 0.0 2.0 New Hampshire 27.3 11.4 12.9 20.0 14.6 New Jersey 28.6 9.8 1.9 3.6 5.6 New Mexico 20.0 14.3 3.2 0.0 9.7 New York 11.9 7.3 7.0 7.7 7.6 North Carolina 45.0 18.4 11.5 14.3 17.2 North Dakota 14.3 0.0 5.0 0.0 6.2 Ohio 25.5 10.1 7.9 4.0 10.7 Oklahoma 28.1 3.3 5.2 0.0 6.5 Oregon 33.3 8.2 21.8 0.0 17.3 Pennsylvania 18.1 14.8 4.5 1.1 8.4 Rhode Island 23.1 29.0 31.6 0.0 28.2 South Carolina 15.9 15.7 11.7 0.0 13.6 South Dakota 15.7 6.0 0.0 n/a 9.8 Tennessee 17.4 5.1 3.3 11.8 5.6 Texas 33.0 12.2 11.6 0.0 13.0 Utah 45.0 12.5 0.0 0.0 15.6 Vermont 0.0 0.0 6.3 n/a 2.6 Virginia 18.8 7.4 1.4 0.0 5.3 Washington 15.2 4.8 2.0 0.0 4.9 West Virginia 5.0 1.6 0.0 0.0 1.6 Wisconsin 14.0 11.4 7.3 16.7 10.5 Wyoming 18.2 7.1 0.0 n/a 8.3
Source: CASPER
70 Nursing Home Data Compendium 2013

Table 2.3.c. Percentage of Nursing Home Surveys Resulting in Zero Health Deficiency Citations by Bed Size Category: United States, 2010
Percentage by Bed Size Category <50 50-99 100-199 >199 All Facilities
Nation 15.3 9.1 7.2 4.8 8.8 Alabama 33.3 17.0 15.4 6.3 15.9 Alaska 0.0 0.0 0.0 n/a 0.0 Arizona 0.0 7.7 6.3 0.0 5.4 Arkansas 0.0 10.6 3.6 0.0 6.2 California 2.0 1.9 1.0 0.0 1.6 Colorado 3.8 1.3 0.0 0.0 1.0 Connecticut 13.3 8.3 4.0 0.0 5.6 Delaware 0.0 0.0 0.0 0.0 0.0 District of Columbia 0.0 0.0 0.0 0.0 0.0 Florida 22.0 2.5 3.2 0.0 4.0 Georgia 34.8 18.1 16.8 5.6 18.0 Hawaii 0.0 0.0 0.0 0.0 0.0 Idaho 8.7 0.0 0.0 n/a 2.6 Illinois 20.4 8.5 4.2 3.8 7.4 Indiana 20.3 15.5 8.7 11.1 13.3 Iowa 9.4 11.6 0.0 0.0 9.2 Kansas 10.0 4.6 5.8 0.0 6.4 Kentucky 17.6 5.6 3.1 0.0 6.5 Louisiana 17.6 4.8 6.9 0.0 6.8 Maine 7.9 8.0 16.7 50.0 9.8 Maryland 13.8 6.7 2.8 0.0 5.0 Massachusetts 27.1 25.2 23.1 0.0 23.3 Michigan 2.2 3.5 2.9 0.0 2.8 Minnesota 2.4 3.5 2.1 0.0 2.8 Mississippi 14.3 5.5 7.3 0.0 6.9 Missouri 13.2 7.8 4.2 0.0 6.3 Montana 12.0 9.7 8.3 0.0 9.8 Nebraska 11.8 5.2 5.3 0.0 7.5 Nevada 0.0 0.0 12.5 0.0 6.0 New Hampshire 11.1 15.6 3.6 0.0 9.6 New Jersey 30.3 8.9 2.7 5.3 6.6 New Mexico 14.3 7.7 6.1 0.0 7.4 New York 21.4 13.5 9.4 8.4 10.5 North Carolina 33.3 20.6 13.1 15.4 17.8 North Dakota 3.2 8.8 0.0 0.0 4.7 Ohio 20.2 12.7 8.5 20.8 12.2 Oklahoma 25.0 5.0 4.2 0.0 6.8 Oregon 27.3 16.7 2.3 0.0 13.4 Pennsylvania 15.9 12.6 6.3 5.1 8.8 Rhode Island 30.8 51.5 15.4 0.0 30.7 South Carolina 11.1 17.0 14.9 50.0 15.4 South Dakota 8.0 8.9 0.0 0.0 7.4 Tennessee 24.0 14.8 3.7 0.0 8.5 Texas 34.5 9.0 11.7 3.1 12.2 Utah 29.4 7.4 6.9 0.0 15.2 Vermont 21.4 6.7 15.4 n/a 14.3 Virginia 38.9 12.1 7.1 0.0 12.3 Washington 6.3 1.0 6.1 0.0 3.9 West Virginia 14.3 0.0 0.0 n/a 2.1 Wisconsin 21.3 9.6 8.8 0.0 10.7 Wyoming 11.1 0.0 0.0 n/a 3.0
Source: CASPER
Nursing Home Data Compendium 2013 71

Table 2.3.d. Percentage of Nursing Home Surveys Resulting in Zero Health Deficiency Citations by Bed Size Category: United States, 2011
Percentage by Bed Size Category <50 50-99 100-199 >199 All Facilities
Nation 14.7 8.9 8.3 6.0 9.2 Alabama 28.6 20.2 7.3 0.0 12.5 Alaska 9.1 0.0 0.0 n/a 6.3 Arizona 27.3 13.5 2.8 0.0 7.6 Arkansas 0.0 4.3 3.6 0.0 3.7 California 2.7 1.4 0.3 0.0 1.2 Colorado 8.0 3.1 0.0 0.0 2.8 Connecticut 22.2 6.0 7.5 0.0 7.7 Delaware 0.0 0.0 0.0 0.0 0.0 District of Columbia 0.0 0.0 0.0 0.0 0.0 Florida 10.5 6.8 2.9 2.7 4.1 Georgia 12.5 12.7 15.7 0.0 13.6 Hawaii 0.0 0.0 0.0 0.0 0.0 Idaho 0.0 0.0 0.0 n/a 0.0 Illinois 23.6 6.6 4.4 3.2 7.1 Indiana 12.7 10.0 10.5 0.0 10.4 Iowa 7.9 8.0 1.6 0.0 7.0 Kansas 5.4 3.9 4.8 0.0 4.5 Kentucky 10.8 5.8 4.4 0.0 5.9 Louisiana 6.3 4.4 7.7 0.0 6.7 Maine 11.4 11.1 0.0 50.0 10.6 Maryland 26.9 6.1 4.1 0.0 6.8 Massachusetts 33.3 36.2 24.9 35.7 29.3 Michigan 4.4 4.4 4.4 0.0 4.2 Minnesota 5.8 4.9 3.3 0.0 4.6 Mississippi 14.3 7.3 3.5 0.0 6.1 Missouri 25.6 5.5 4.3 0.0 6.5 Montana 11.1 16.1 4.0 0.0 10.7 Nebraska 10.6 6.5 5.4 0.0 7.5 Nevada 10.0 0.0 0.0 0.0 2.0 New Hampshire 12.5 20.0 22.9 20.0 20.5 New Jersey 44.1 14.0 8.2 5.0 11.9 New Mexico 25.0 10.0 12.5 0.0 12.9 New York 21.7 12.2 7.3 12.4 11.0 North Carolina 32.5 21.8 22.0 14.3 22.7 North Dakota 9.1 0.0 14.3 0.0 6.7 Ohio 19.8 12.5 11.3 16.7 12.9 Oklahoma 26.7 6.8 6.9 0.0 8.7 Oregon 13.3 2.4 13.2 n/a 8.4 Pennsylvania 15.7 10.7 7.6 1.2 8.7 Rhode Island 53.8 45.7 35.7 0.0 40.9 South Carolina 22.5 13.0 11.1 16.7 14.4 South Dakota 16.4 10.0 0.0 n/a 13.2 Tennessee 10.7 10.0 5.3 0.0 6.9 Texas 24.7 13.0 12.6 5.3 13.4 Utah 16.7 0.0 8.3 0.0 7.7 Vermont 13.3 0.0 11.1 n/a 8.9 Virginia 17.1 6.7 6.5 0.0 7.5 Washington 9.1 1.1 7.2 16.7 5.2 West Virginia 23.1 0.0 0.0 n/a 5.1 Wisconsin 14.9 11.6 12.9 0.0 12.2 Wyoming 0.0 0.0 0.0 n/a 0.0
Source: CASPER
72 Nursing Home Data Compendium 2013

Table 2.3.e. Percentage of Nursing Home Surveys Resulting in Zero Health Deficiency Citations by Bed Size Category: United States, 2012
Percentage by Bed Size Category <50 50-99 100-199 >199 All Facilities
Nation 15.7 9.5 8.0 7.3 9.5 Alabama 0.0 16.3 11.5 6.7 12.7 Alaska 18.2 0.0 0.0 n/a 12.5 Arizona 18.2 13.8 4.5 0.0 7.9 Arkansas 16.7 4.7 1.6 0.0 3.2 California 5.5 2.9 0.9 1.9 2.8 Colorado 12.9 6.9 1.0 0.0 5.0 Connecticut 0.0 3.0 2.6 0.0 2.3 Delaware 20.0 0.0 0.0 0.0 3.0 District of Columbia 0.0 0.0 0.0 0.0 0.0 Florida 8.8 6.7 4.6 3.1 5.2 Georgia 20.0 18.4 19.7 0.0 17.6 Hawaii 7.7 0.0 0.0 0.0 2.6 Idaho 10.5 0.0 0.0 n/a 3.6 Illinois 22.8 6.4 4.0 0.8 6.5 Indiana 20.3 12.9 6.6 0.0 10.9 Iowa 10.2 9.4 4.8 0.0 8.9 Kansas 6.4 6.5 6.5 0.0 6.4 Kentucky 8.3 9.0 2.9 0.0 6.3 Louisiana 35.3 6.7 7.8 0.0 8.8 Maine 10.5 7.8 6.7 50.0 9.4 Maryland 17.9 9.1 1.6 0.0 5.1 Massachusetts 36.2 31.3 26.2 62.5 30.0 Michigan 2.0 2.1 3.6 0.0 2.8 Minnesota 8.9 8.0 5.1 9.1 7.7 Mississippi 0.0 4.5 2.6 0.0 3.3 Missouri 14.3 5.4 4.2 6.3 5.4 Montana 20.0 6.1 4.0 0.0 9.5 Nebraska 6.8 5.5 13.9 0.0 7.4 Nevada 0.0 0.0 0.0 0.0 0.0 New Hampshire 25.0 11.8 25.0 16.7 18.4 New Jersey 50.0 15.1 10.7 5.4 14.1 New Mexico 63.6 15.6 16.7 50.0 24.0 New York 18.8 15.6 7.1 11.6 11.0 North Carolina 34.3 24.4 15.1 30.8 20.6 North Dakota 6.5 2.9 5.3 0.0 4.5 Ohio 36.4 14.6 12.6 16.0 15.8 Oklahoma 16.7 3.3 5.5 0.0 5.4 Oregon 19.0 20.0 13.6 0.0 17.4 Pennsylvania 23.5 18.8 11.5 7.3 14.1 Rhode Island 18.2 38.7 33.3 25.0 32.9 South Carolina 22.5 13.0 14.0 33.3 16.1 South Dakota 14.3 14.3 0.0 n/a 13.0 Tennessee 0.0 6.7 5.2 0.0 5.0 Texas 25.5 8.7 8.5 2.9 9.7 Utah 13.6 0.0 8.7 0.0 8.5 Vermont 25.0 16.7 6.7 n/a 15.4 Virginia 10.7 6.0 2.8 6.3 4.8 Washington 23.3 4.7 7.7 0.0 8.5 West Virginia 0.0 5.3 0.0 0.0 2.5 Wisconsin 9.4 9.9 9.9 9.1 9.8 Wyoming 0.0 0.0 0.0 n/a 0.0
Source: CASPER
Nursing Home Data Compendium 2013 73

Table 2.3.f. Percentage of Nursing Home Surveys Resulting in Zero Health Deficiency Citations by Bed Size Category: United States (2008, 2012 and Change)
Percentage in 2008, 2012 and Percent Change (% Δ), by Bed Size Category <50 50-99 100-199 >199 All Facilities
2008 2012 % Δ 2008 2012 % Δ 2008 2012 % Δ 2008 2012 % Δ 2008 2012 % Δ Nation 13.9 15.7 +12.5 8.1 9.5 +17.7 5.4 8.0 +47.2 4.8 7.3 +54.3 7.5 9.5 +25.9 Alabama 0.0 0.0 n/a 15.8 16.3 +3.1 9.9 11.5 +15.6 5.6 6.7 +20.0 11.4 12.7 +10.9 Alaska 11.1 18.2 +63.6 0.0 0.0 n/a n/a 0.0 n/a 0.0 n/a n/a 7.7 12.5 +62.5 Arizona 20.0 18.2 -9.1 2.8 13.8 +397 0.0 4.5 n/a 0.0 0.0 n/a 3.0 7.9 +164 Arkansas 10.0 16.7 +66.7 2.8 4.7 +67.8 2.5 1.6 -36.7 0.0 0.0 n/a 2.8 3.2 +12.0 California 2.8 5.5 +99.8 0.8 2.9 +259 0.0 0.9 n/a 0.0 1.9 n/a 0.9 2.8 +201 Colorado 8.6 12.9 +50.5 1.1 6.9 +548 0.0 1.0 n/a 0.0 0.0 n/a 1.9 5.0 +169 Connecticut 12.5 0.0 -100 3.9 3.0 -24.4 2.3 2.6 +14.0 0.0 0.0 n/a 3.3 2.3 -28.4 Delaware 11.1 20.0 +80.0 0.0 0.0 n/a 3.3 0.0 -100 0.0 0.0 n/a 4.1 3.0 -25.8 District of Columbia 0.0 0.0 n/a 0.0 0.0 n/a 0.0 0.0 n/a 0.0 0.0 n/a 0.0 0.0 n/a Florida 5.0 8.8 +76.5 3.9 6.7 +70.8 2.5 4.6 +86.6 0.0 3.1 n/a 2.8 5.2 +85.4 Georgia 22.2 20.0 -10.0 8.1 18.4 +127 8.9 19.7 +120 4.0 0.0 -100 9.3 17.6 +87.8 Hawaii 0.0 7.7 n/a 8.3 0.0 -100 0.0 0.0 n/a 0.0 0.0 n/a 2.0 2.6 +31.6 Idaho 0.0 10.5 n/a 4.8 0.0 -100 0.0 0.0 n/a n/a n/a n/a 1.6 3.6 +129 Illinois 26.3 22.8 -13.1 7.7 6.4 -16.4 4.8 4.0 -15.5 2.4 0.8 -67.4 8.1 6.5 -20.4 Indiana 19.1 20.3 +6.3 14.7 12.9 -12.1 6.1 6.6 +7.9 0.0 0.0 n/a 11.7 10.9 -7.3 Iowa 8.6 10.2 +18.0 9.6 9.4 -1.8 1.8 4.8 +176 0.0 0.0 n/a 8.2 8.9 +8.3 Kansas 8.0 6.4 -20.2 6.5 6.5 +0.5 8.2 6.5 -20.1 0.0 0.0 n/a 7.1 6.4 -10.3 Kentucky 25.5 8.3 -67.4 10.7 9.0 -15.5 7.6 2.9 -61.4 0.0 0.0 n/a 11.6 6.3 -45.7 Louisiana 12.5 35.3 +182 2.4 6.7 +180 2.1 7.8 +275 5.6 0.0 -100 3.2 8.8 +172 Maine 2.3 10.5 +353 3.5 7.8 +124 10.0 6.7 -33.3 0.0 50.0 n/a 3.6 9.4 +164 Maryland 8.3 17.9 +114 2.0 9.1 +345 0.8 1.6 +90.3 0.0 0.0 n/a 1.9 5.1 +166 Massachusetts 33.9 36.2 +6.8 17.0 31.3 +84.2 7.8 26.2 +237 21.4 62.5 +192 14.2 30.0 +112 Michigan 2.5 2.0 -18.4 4.9 2.1 -58.3 2.2 3.6 +62.7 6.7 0.0 -100 3.4 2.8 -19.6 Minnesota 1.4 8.9 +559 4.3 8.0 +86.9 0.0 5.1 n/a 0.0 9.1 n/a 2.4 7.7 +221 Mississippi 21.1 0.0 -100 18.9 4.5 -76.2 2.4 2.6 +10.5 0.0 0.0 n/a 12.2 3.3 -72.7 Missouri 11.1 14.3 +28.6 6.4 5.4 -16.1 1.3 4.2 +228 10.0 6.3 -37.5 4.7 5.4 +16.6 Montana 6.5 20.0 +210 0.0 6.1 n/a 0.0 4.0 n/a 0.0 0.0 n/a 2.4 9.5 +305 Nebraska 5.1 6.8 +33.9 2.7 5.5 +101 0.0 13.9 n/a 0.0 0.0 n/a 2.9 7.4 +155 Nevada 0.0 0.0 n/a 0.0 0.0 n/a 0.0 0.0 n/a 0.0 0.0 n/a 0.0 0.0 n/a New Hampshire 33.3 25.0 -25.0 5.3 11.8 +124 12.9 25.0 +93.8 0.0 16.7 n/a 11.6 18.4 +58.4 New Jersey 31.4 50.0 +59.1 15.3 15.1 -1.0 6.5 10.7 +65.5 1.7 5.4 +221 9.4 14.1 +49.7 New Mexico 11.1 63.6 +473 3.7 15.6 +322 3.2 16.7 +417 0.0 50.0 n/a 4.3 24.0 +452 New York 25.5 18.8 -26.6 12.5 15.6 +25.0 6.2 7.1 +13.7 9.0 11.6 +28.5 9.6 11.0 +14.0 North Carolina 36.7 34.3 -6.7 14.1 24.4 +72.6 12.4 15.1 +21.1 0.0 30.8 n/a 15.4 20.6 +33.8 North Dakota 3.4 6.5 +87.1 6.7 2.9 -57.1 5.0 5.3 +5.3 0.0 0.0 n/a 4.9 4.5 -8.0 Ohio 19.8 36.4 +83.5 13.2 14.6 +10.3 9.2 12.6 +36.6 8.3 16.0 +92.0 12.2 15.8 +29.4 Oklahoma 25.8 16.7 -35.4 3.2 3.3 +1.6 3.3 5.5 +69.5 0.0 0.0 n/a 5.4 5.4 +0.7 Oregon 27.3 19.0 -30.2 14.5 20.0 +37.8 12.8 13.6 +6.8 0.0 0.0 n/a 15.8 17.4 +9.9 Pennsylvania 14.3 23.5 +64.2 12.2 18.8 +54.3 4.9 11.5 +133 7.2 7.3 +1.2 8.2 14.1 +73.0 Rhode Island 8.3 18.2 +118 12.1 38.7 +219 17.9 33.3 +85.7 33.3 25.0 -25.0 14.9 32.9 +120 South Carolina 14.3 22.5 +57.5 12.7 13.0 +1.9 2.6 14.0 +430 20.0 33.3 +66.7 8.8 16.1 +83.9 South Dakota 7.1 14.3 +100 9.4 14.3 +51.4 10.0 0.0 -100 n/a n/a n/a 8.4 13.0 +54.3 Tennessee 0.0 0.0 n/a 4.3 6.7 +56.7 1.3 5.2 +304 0.0 0.0 n/a 2.0 5.0 +146 Texas 29.0 25.5 -12.0 12.3 8.7 -29.5 11.6 8.5 -26.5 0.0 2.9 n/a 13.0 9.7 -25.0 Utah 24.0 13.6 -43.2 3.4 0.0 -100 0.0 8.7 n/a 0.0 0.0 n/a 8.0 8.5 +6.5 Vermont 9.1 25.0 +175 0.0 16.7 n/a 0.0 6.7 n/a n/a n/a n/a 2.7 15.4 +469 Virginia 25.0 10.7 -57.1 8.3 6.0 -28.6 6.4 2.8 -56.5 0.0 6.3 n/a 8.8 4.8 -45.8 Washington 10.3 23.3 +128 2.1 4.7 +121 5.7 7.7 +35.9 25.0 0.0 -100 5.3 8.5 +59.4 West Virginia 8.7 0.0 -100 3.6 5.3 +47.4 2.4 0.0 -100 0.0 0.0 n/a 4.1 2.5 -39.5 Wisconsin 15.1 9.4 -37.5 13.6 9.9 -26.7 7.0 9.9 +40.8 0.0 9.1 n/a 11.1 9.8 -11.3 Wyoming 0.0 0.0 n/a 0.0 0.0 n/a 0.0 0.0 n/a n/a n/a n/a 0.0 0.0 n/a Source: CASPER
74 Nursing Home Data Compendium 2013
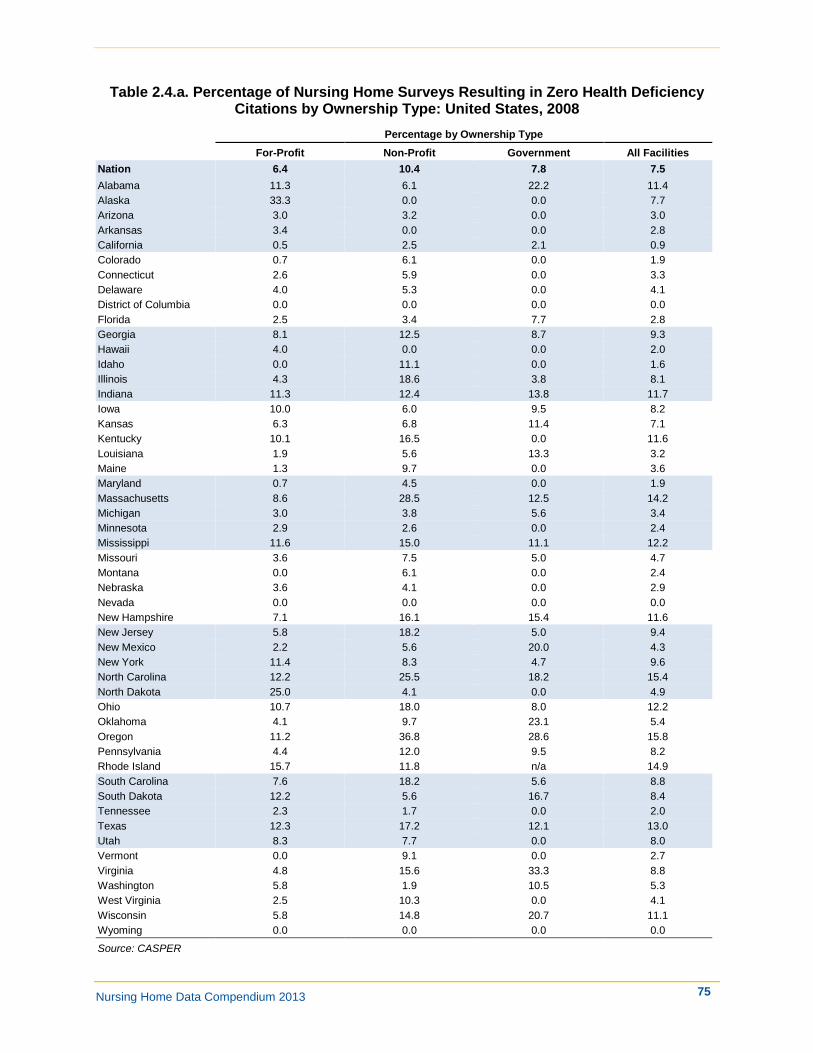
Table 2.4.a. Percentage of Nursing Home Surveys Resulting in Zero Health Deficiency Citations by Ownership Type: United States, 2008
Percentage by Ownership Type For-Profit Non-Profit Government All Facilities
Nation 6.4 10.4 7.8 7.5 Alabama 11.3 6.1 22.2 11.4 Alaska 33.3 0.0 0.0 7.7 Arizona 3.0 3.2 0.0 3.0 Arkansas 3.4 0.0 0.0 2.8 California 0.5 2.5 2.1 0.9 Colorado 0.7 6.1 0.0 1.9 Connecticut 2.6 5.9 0.0 3.3 Delaware 4.0 5.3 0.0 4.1 District of Columbia 0.0 0.0 0.0 0.0 Florida 2.5 3.4 7.7 2.8 Georgia 8.1 12.5 8.7 9.3 Hawaii 4.0 0.0 0.0 2.0 Idaho 0.0 11.1 0.0 1.6 Illinois 4.3 18.6 3.8 8.1 Indiana 11.3 12.4 13.8 11.7 Iowa 10.0 6.0 9.5 8.2 Kansas 6.3 6.8 11.4 7.1 Kentucky 10.1 16.5 0.0 11.6 Louisiana 1.9 5.6 13.3 3.2 Maine 1.3 9.7 0.0 3.6 Maryland 0.7 4.5 0.0 1.9 Massachusetts 8.6 28.5 12.5 14.2 Michigan 3.0 3.8 5.6 3.4 Minnesota 2.9 2.6 0.0 2.4 Mississippi 11.6 15.0 11.1 12.2 Missouri 3.6 7.5 5.0 4.7 Montana 0.0 6.1 0.0 2.4 Nebraska 3.6 4.1 0.0 2.9 Nevada 0.0 0.0 0.0 0.0 New Hampshire 7.1 16.1 15.4 11.6 New Jersey 5.8 18.2 5.0 9.4 New Mexico 2.2 5.6 20.0 4.3 New York 11.4 8.3 4.7 9.6 North Carolina 12.2 25.5 18.2 15.4 North Dakota 25.0 4.1 0.0 4.9 Ohio 10.7 18.0 8.0 12.2 Oklahoma 4.1 9.7 23.1 5.4 Oregon 11.2 36.8 28.6 15.8 Pennsylvania 4.4 12.0 9.5 8.2 Rhode Island 15.7 11.8 n/a 14.9 South Carolina 7.6 18.2 5.6 8.8 South Dakota 12.2 5.6 16.7 8.4 Tennessee 2.3 1.7 0.0 2.0 Texas 12.3 17.2 12.1 13.0 Utah 8.3 7.7 0.0 8.0 Vermont 0.0 9.1 0.0 2.7 Virginia 4.8 15.6 33.3 8.8 Washington 5.8 1.9 10.5 5.3 West Virginia 2.5 10.3 0.0 4.1 Wisconsin 5.8 14.8 20.7 11.1 Wyoming 0.0 0.0 0.0 0.0
Source: CASPER
Nursing Home Data Compendium 2013 75

Table 2.4.b. Percentage of Nursing Home Surveys Resulting in Zero Health Deficiency Citations by Ownership Type: United States, 2009
Percentage by Ownership Type
For-Profit Non-Profit Government All Facilities Nation 6.7 11.3 8.0 8.0 Alabama 14.6 11.4 14.3 14.1 Alaska 0.0 0.0 0.0 0.0 Arizona 1.1 0.0 0.0 0.8 Arkansas 1.5 6.7 0.0 2.1 California 1.0 4.8 2.3 1.7 Colorado 0.0 4.3 0.0 0.9 Connecticut 1.6 17.8 0.0 4.8 Delaware 4.2 0.0 0.0 2.3 District of Columbia 0.0 0.0 0.0 0.0 Florida 4.0 5.0 0.0 4.2 Georgia 9.4 17.2 0.0 10.9 Hawaii 0.0 0.0 10.0 2.1 Idaho 4.3 0.0 0.0 2.7 Illinois 4.5 14.6 3.3 7.2 Indiana 9.3 19.7 16.2 12.5 Iowa 5.2 7.1 0.0 5.8 Kansas 4.4 10.3 2.6 6.4 Kentucky 9.2 11.3 28.6 10.3 Louisiana 2.3 9.1 25.0 4.9 Maine 4.1 10.0 0.0 5.7 Maryland 0.7 6.8 12.5 3.0 Massachusetts 18.5 28.7 28.6 21.5 Michigan 2.8 6.7 2.6 3.7 Minnesota 1.9 4.5 0.0 3.3 Mississippi 12.1 2.9 6.9 9.8 Missouri 2.1 13.1 7.5 5.0 Montana 7.0 5.1 5.9 6.1 Nebraska 3.9 12.3 16.0 9.2 Nevada 2.7 0.0 0.0 2.0 New Hampshire 9.3 22.2 16.7 14.6 New Jersey 2.9 12.4 4.8 5.6 New Mexico 8.3 11.1 16.7 9.7 New York 6.5 9.2 6.1 7.6 North Carolina 14.4 23.3 50.0 17.2 North Dakota 25.0 5.4 0.0 6.2 Ohio 9.4 15.6 8.0 10.7 Oklahoma 4.8 15.8 18.2 6.5 Oregon 15.9 15.8 42.9 17.3 Pennsylvania 5.9 12.0 2.3 8.4 Rhode Island 25.4 38.9 n/a 28.2 South Carolina 14.0 12.9 11.8 13.6 South Dakota 8.1 8.6 40.0 9.8 Tennessee 4.5 10.7 0.0 5.6 Texas 12.4 17.0 12.9 13.0 Utah 16.9 10.0 0.0 15.6 Vermont 3.7 0.0 0.0 2.6 Virginia 4.0 9.1 0.0 5.3 Washington 3.8 11.1 0.0 4.9 West Virginia 1.2 3.4 0.0 1.6 Wisconsin 7.0 15.4 11.5 10.5 Wyoming 0.0 0.0 15.8 8.3
Source: CASPER
76 Nursing Home Data Compendium 2013

Table 2.4.c. Percentage of Nursing Home Surveys Resulting in Zero Health Deficiency Citations by Ownership Type: United States, 2010
Percentage by Ownership Type For-Profit Non-Profit Government All Facilities
Nation 7.5 12.2 9.2 8.8 Alabama 15.6 12.9 25.0 15.9 Alaska 0.0 0.0 0.0 0.0 Arizona 5.7 4.5 0.0 5.4 Arkansas 6.5 5.9 0.0 6.2 California 1.1 4.7 0.0 1.6 Colorado 0.7 2.7 0.0 1.0 Connecticut 4.2 11.6 0.0 5.6 Delaware 0.0 0.0 0.0 0.0 District of Columbia 0.0 0.0 0.0 0.0 Florida 3.7 5.2 0.0 4.0 Georgia 17.0 21.3 7.7 18.0 Hawaii 0.0 0.0 0.0 0.0 Idaho 1.9 10.0 0.0 2.6 Illinois 5.7 10.5 20.7 7.4 Indiana 13.9 11.0 14.9 13.3 Iowa 9.6 7.8 16.7 9.2 Kansas 2.0 13.2 4.9 6.4 Kentucky 4.1 12.3 14.3 6.5 Louisiana 4.1 15.9 20.0 6.8 Maine 8.6 12.9 0.0 9.8 Maryland 4.6 4.6 16.7 5.0 Massachusetts 20.3 29.9 33.3 23.3 Michigan 2.6 2.7 5.4 2.8 Minnesota 0.9 3.9 2.2 2.8 Mississippi 4.8 25.0 7.1 6.9 Missouri 4.5 8.1 20.0 6.3 Montana 11.1 12.9 0.0 9.8 Nebraska 6.9 9.2 6.4 7.5 Nevada 8.1 0.0 0.0 6.0 New Hampshire 8.6 14.8 0.0 9.6 New Jersey 3.6 14.9 5.3 6.6 New Mexico 4.2 12.5 25.0 7.4 New York 8.5 14.2 2.5 10.5 North Carolina 14.3 26.1 50.0 17.8 North Dakota 0.0 5.2 0.0 4.7 Ohio 10.9 18.2 5.0 12.2 Oklahoma 5.2 15.2 18.2 6.8 Oregon 8.7 36.8 25.0 13.4 Pennsylvania 5.2 13.5 5.6 8.8 Rhode Island 26.4 50.0 n/a 30.7 South Carolina 15.6 7.1 30.8 15.4 South Dakota 2.5 7.9 40.0 7.4 Tennessee 5.4 17.9 21.4 8.5 Texas 12.4 12.5 6.5 12.2 Utah 13.2 30.8 0.0 15.2 Vermont 11.5 20.0 0.0 14.3 Virginia 6.4 25.0 16.7 12.3 Washington 2.3 9.1 7.1 3.9 West Virginia 0.0 9.1 0.0 2.1 Wisconsin 7.3 16.1 8.7 10.7 Wyoming 0.0 0.0 7.7 3.0
Source: CASPER
Nursing Home Data Compendium 2013 77

Table 2.4.d. Percentage of Nursing Home Surveys Resulting in Zero Health Deficiency Citations by Ownership Type: United States, 2011
Percentage by Ownership Type
For-Profit Non-Profit Government All Facilities Nation 8.2 12.3 8.5 9.2 Alabama 13.0 8.8 15.4 12.5 Alaska 50.0 0.0 0.0 6.3 Arizona 8.7 4.0 0.0 7.6 Arkansas 3.5 0.0 22.2 3.7 California 1.1 2.6 0.0 1.2 Colorado 2.9 3.8 0.0 2.8 Connecticut 6.4 12.8 0.0 7.7 Delaware 0.0 0.0 0.0 0.0 District of Columbia 0.0 0.0 n/a 0.0 Florida 3.6 5.1 7.1 4.1 Georgia 9.7 23.3 12.5 13.6 Hawaii 0.0 0.0 0.0 0.0 Idaho 0.0 0.0 0.0 0.0 Illinois 5.5 12.2 3.3 7.1 Indiana 10.8 10.4 7.4 10.4 Iowa 7.0 7.5 0.0 7.0 Kansas 4.4 5.6 2.4 4.5 Kentucky 4.6 10.3 0.0 5.9 Louisiana 5.2 15.9 0.0 6.7 Maine 7.7 17.9 0.0 10.6 Maryland 5.1 12.1 0.0 6.8 Massachusetts 27.4 33.6 40.0 29.3 Michigan 2.5 8.7 5.1 4.2 Minnesota 3.6 5.0 5.4 4.6 Mississippi 4.5 5.9 16.0 6.1 Missouri 4.3 12.6 13.9 6.5 Montana 13.5 9.7 6.3 10.7 Nebraska 8.5 6.8 6.5 7.5 Nevada 2.5 0.0 0.0 2.0 New Hampshire 9.5 26.1 46.2 20.5 New Jersey 8.2 22.3 10.0 11.9 New Mexico 15.6 8.3 0.0 12.9 New York 9.7 13.7 6.4 11.0 North Carolina 19.4 29.2 63.6 22.7 North Dakota 0.0 6.1 33.3 6.7 Ohio 11.2 19.5 16.7 12.9 Oklahoma 8.0 12.8 12.5 8.7 Oregon 9.1 7.1 0.0 8.4 Pennsylvania 7.4 11.3 0.0 8.7 Rhode Island 37.8 52.6 n/a 40.9 South Carolina 12.4 20.0 21.4 14.4 South Dakota 7.1 18.5 0.0 13.2 Tennessee 6.3 9.4 7.1 6.9 Texas 13.5 13.2 11.8 13.4 Utah 6.9 0.0 50.0 7.7 Vermont 6.5 15.4 0.0 8.9 Virginia 5.5 13.4 0.0 7.5 Washington 4.2 8.3 7.7 5.2 West Virginia 0.0 14.3 0.0 5.1 Wisconsin 6.6 20.0 13.5 12.2 Wyoming 0.0 0.0 0.0 0.0
Source: CASPER
78 Nursing Home Data Compendium 2013

Table 2.4.e. Percentage of Nursing Home Surveys Resulting in Zero Health Deficiency Citations by Ownership Type: United States, 2012
Percentage by Ownership Type
For-Profit Non-Profit Government All Facilities Nation 8.3 13.0 8.9 9.5 Alabama 13.4 10.7 7.1 12.7 Alaska 0.0 0.0 28.6 12.5 Arizona 7.4 5.9 50.0 7.9 Arkansas 2.8 6.5 0.0 3.2 California 2.0 7.0 2.4 2.8 Colorado 4.8 5.7 5.3 5.0 Connecticut 2.4 2.4 0.0 2.3 Delaware 4.3 0.0 0.0 3.0 District of Columbia 0.0 0.0 n/a 0.0 Florida 4.5 7.4 0.0 5.2 Georgia 15.6 22.7 14.3 17.6 Hawaii 0.0 7.7 0.0 2.6 Idaho 2.6 11.1 0.0 3.6 Illinois 5.0 11.0 3.4 6.5 Indiana 10.7 12.8 8.8 10.9 Iowa 10.4 7.1 5.6 8.9 Kansas 4.7 10.9 0.0 6.4 Kentucky 5.3 8.3 20.0 6.3 Louisiana 7.0 14.3 23.1 8.8 Maine 9.3 10.0 0.0 9.4 Maryland 2.7 11.1 0.0 5.1 Massachusetts 27.9 36.4 0.0 30.0 Michigan 2.8 1.8 5.1 2.8 Minnesota 4.3 8.9 10.8 7.7 Mississippi 3.0 5.3 3.8 3.3 Missouri 3.4 10.8 13.3 5.4 Montana 5.4 15.2 7.1 9.5 Nebraska 8.4 9.6 2.4 7.4 Nevada 0.0 0.0 0.0 0.0 New Hampshire 11.9 19.0 38.5 18.4 New Jersey 11.5 21.2 15.8 14.1 New Mexico 24.1 18.8 40.0 24.0 New York 11.7 10.4 9.5 11.0 North Carolina 17.5 29.9 40.0 20.6 North Dakota 0.0 4.8 0.0 4.5 Ohio 13.3 25.2 20.0 15.8 Oklahoma 3.0 19.4 10.0 5.4 Oregon 16.0 29.4 0.0 17.4 Pennsylvania 10.4 19.5 7.7 14.1 Rhode Island 25.8 62.5 n/a 32.9 South Carolina 14.9 21.2 16.7 16.1 South Dakota 8.3 11.9 60.0 13.0 Tennessee 5.7 0.0 8.3 5.0 Texas 9.4 13.2 6.3 9.7 Utah 9.8 0.0 0.0 8.5 Vermont 7.7 33.3 0.0 15.4 Virginia 4.8 2.7 18.2 4.8 Washington 8.8 5.0 16.7 8.5 West Virginia 3.2 0.0 0.0 2.5 Wisconsin 8.0 13.4 8.3 9.8 Wyoming 0.0 0.0 0.0 0.0
Source: CASPER
Nursing Home Data Compendium 2013 79

Table 2.4.f. Percentage of Nursing Home Surveys Resulting in Zero Health Deficiency Citations by Ownership Type: United States (2008, 2012 and Change)
Percentage in 2008, 2012 and Percent Change (% Δ), by Ownership Type
For-Profit Non-Profit Government All Facilities 2008 2012 % Δ 2008 2012 % Δ 2008 2012 % Δ 2008 2012 % Δ
Nation 6.4 8.3 +29.7 10.4 13.0 +25.0 7.8 8.9 +14.2 7.5 9.5 +25.9 Alabama 11.3 13.4 +18.0 6.1 10.7 +76.8 22.2 7.1 -67.9 11.4 12.7 +10.9 Alaska 33.3 0.0 -100 0.0 0.0 n/a 0.0 28.6 n/a 7.7 12.5 +62.5 Arizona 3.0 7.4 +146 3.2 5.9 +82.4 0.0 50.0 n/a 3.0 7.9 +164 Arkansas 3.4 2.8 -18.1 0.0 6.5 n/a 0.0 0.0 n/a 2.8 3.2 +12.0 California 0.5 2.0 +280 2.5 7.0 +177 2.1 2.4 +11.9 0.9 2.8 +201 Colorado 0.7 4.8 +595 6.1 5.7 -6.7 0.0 5.3 n/a 1.9 5.0 +169 Connecticut 2.6 2.4 -9.0 5.9 2.4 -59.5 0.0 0.0 n/a 3.3 2.3 -28.4 Delaware 4.0 4.3 +8.7 5.3 0.0 -100 0.0 0.0 n/a 4.1 3.0 -25.8 District of Columbia 0.0 0.0 n/a 0.0 0.0 n/a 0.0 n/a n/a 0.0 0.0 n/a Florida 2.5 4.5 +85.2 3.4 7.4 +121 7.7 0.0 -100 2.8 5.2 +85.4 Georgia 8.1 15.6 +92.2 12.5 22.7 +81.3 8.7 14.3 +64.3 9.3 17.6 +87.8 Hawaii 4.0 0.0 -100 0.0 7.7 n/a 0.0 0.0 n/a 2.0 2.6 +31.6 Idaho 0.0 2.6 n/a 11.1 11.1 0.0 0.0 0.0 n/a 1.6 3.6 +129 Illinois 4.3 5.0 +14.6 18.6 11.0 -40.7 3.8 3.4 -10.3 8.1 6.5 -20.4 Indiana 11.3 10.7 -5.4 12.4 12.8 +3.2 13.8 8.8 -36.3 11.7 10.9 -7.3 Iowa 10.0 10.4 +4.6 6.0 7.1 +18.8 9.5 5.6 -41.7 8.2 8.9 +8.3 Kansas 6.3 4.7 -25.3 6.8 10.9 +59.7 11.4 0.0 -100 7.1 6.4 -10.3 Kentucky 10.1 5.3 -47.3 16.5 8.3 -49.4 0.0 20.0 n/a 11.6 6.3 -45.7 Louisiana 1.9 7.0 +265 5.6 14.3 +157 13.3 23.1 +73.1 3.2 8.8 +172 Maine 1.3 9.3 +647 9.7 10.0 +3.3 0.0 0.0 n/a 3.6 9.4 +164 Maryland 0.7 2.7 +268 4.5 11.1 +144 0.0 0.0 n/a 1.9 5.1 +166 Massachusetts 8.6 27.9 +224 28.5 36.4 +27.8 12.5 0.0 -100 14.2 30.0 +112 Michigan 3.0 2.8 -7.5 3.8 1.8 -53.2 5.6 5.1 -7.7 3.4 2.8 -19.6 Minnesota 2.9 4.3 +49.4 2.6 8.9 +246 0.0 10.8 n/a 2.4 7.7 +221 Mississippi 11.6 3.0 -74.6 15.0 5.3 -64.9 11.1 3.8 -65.4 12.2 3.3 -72.7 Missouri 3.6 3.4 -5.2 7.5 10.8 +43.4 5.0 13.3 +167 4.7 5.4 +16.6 Montana 0.0 5.4 n/a 6.1 15.2 +150 0.0 7.1 n/a 2.4 9.5 +305 Nebraska 3.6 8.4 +136 4.1 9.6 +134 0.0 2.4 n/a 2.9 7.4 +155 Nevada 0.0 0.0 n/a 0.0 0.0 n/a 0.0 0.0 n/a 0.0 0.0 n/a New Hampshire 7.1 11.9 +66.7 16.1 19.0 +18.1 15.4 38.5 +150 11.6 18.4 +58.4 New Jersey 5.8 11.5 +98.4 18.2 21.2 +16.5 5.0 15.8 +216 9.4 14.1 +49.7 New Mexico 2.2 24.1 +1007 5.6 18.8 +238 20.0 40.0 +100 4.3 24.0 +452 New York 11.4 11.7 +2.1 8.3 10.4 +25.3 4.7 9.5 +105 9.6 11.0 +14.0 North Carolina 12.2 17.5 +43.3 25.5 29.9 +17.2 18.2 40.0 +120 15.4 20.6 +33.8 North Dakota 25.0 0.0 -100 4.1 4.8 +17.3 0.0 0.0 n/a 4.9 4.5 -8.0 Ohio 10.7 13.3 +24.6 18.0 25.2 +39.5 8.0 20.0 +150 12.2 15.8 +29.4 Oklahoma 4.1 3.0 -25.0 9.7 19.4 +101 23.1 10.0 -56.7 5.4 5.4 +0.7 Oregon 11.2 16.0 +42.7 36.8 29.4 -20.2 28.6 0.0 -100 15.8 17.4 +9.9 Pennsylvania 4.4 10.4 +137 12.0 19.5 +62.0 9.5 7.7 -19.2 8.2 14.1 +73.0 Rhode Island 15.7 25.8 +63.9 11.8 62.5 +431 n/a n/a n/a 14.9 32.9 +120 South Carolina 7.6 14.9 +95.1 18.2 21.2 +16.7 5.6 16.7 +200 8.8 16.1 +83.9 South Dakota 12.2 8.3 -31.7 5.6 11.9 +115 16.7 60.0 +260 8.4 13.0 +54.3 Tennessee 2.3 5.7 +152 1.7 0.0 -100 0.0 8.3 n/a 2.0 5.0 +146 Texas 12.3 9.4 -23.7 17.2 13.2 -23.4 12.1 6.3 -48.4 13.0 9.7 -25.0 Utah 8.3 9.8 +17.6 7.7 0.0 -100 0.0 0.0 n/a 8.0 8.5 +6.5 Vermont 0.0 7.7 n/a 9.1 33.3 +267 0.0 0.0 n/a 2.7 15.4 +469 Virginia 4.8 4.8 0.0 15.6 2.7 -82.9 33.3 18.2 -45.5 8.8 4.8 -45.8 Washington 5.8 8.8 +50.5 1.9 5.0 +165 10.5 16.7 +58.3 5.3 8.5 +59.4 West Virginia 2.5 3.2 +30.6 10.3 0.0 -100 0.0 0.0 n/a 4.1 2.5 -39.5 Wisconsin 5.8 8.0 +38.0 14.8 13.4 -9.1 20.7 8.3 -59.7 11.1 9.8 -11.3 Wyoming 0.0 0.0 n/a 0.0 0.0 n/a 0.0 0.0 n/a 0.0 0.0 n/a
80 Nursing Home Data Compendium 2013

Table 2.5.a. Distribution of Scope and Severity of Health Deficiency Citations: United States, 2008
*Distribution by Scope and Severity - PercentB C D E F G H I J K L
Nation 5.7 4.0 54.2 27.0 4.6 3.1 0.4 0.0 0.4 0.5 0.1 Alabama 3.5 8.1 61.0 13.4 11.2 2.2 0.0 0.0 0.6 0.1 0.0 Alaska 1.4 2.7 30.1 30.1 27.4 2.7 2.7 0.0 0.0 0.0 2.7 Arizona 9.2 0.7 64.9 19.4 2.4 2.5 0.2 0.0 0.3 0.4 0.1 Arkansas 1.5 1.3 32.2 56.5 5.3 0.8 1.0 0.0 0.4 1.0 0.0 California 12.9 3.5 56.5 22.4 2.7 1.2 0.1 0.0 0.2 0.3 0.2 Colorado 4.7 0.7 52.9 28.7 7.6 4.8 0.2 0.0 0.2 0.2 0.0 Connecticut 3.2 5.7 72.5 10.0 2.1 6.0 0.2 0.1 0.2 0.1 0.1 Delaware 11.9 3.8 52.6 23.3 6.6 1.8 0.0 0.0 0.0 0.0 0.0 District of Columbia 0.7 3.0 68.7 16.4 7.8 2.6 0.7 0.0 0.0 0.0 0.0 Florida 2.2 3.6 71.6 13.8 7.2 1.0 0.0 0.0 0.3 0.1 0.1 Georgia 8.2 6.3 58.8 15.3 5.0 4.7 0.0 0.0 0.9 0.8 0.0 Hawaii 6.0 4.6 53.1 26.0 5.7 4.1 0.0 0.0 0.0 0.5 0.0 Idaho 5.5 5.3 60.0 20.7 4.5 3.2 0.0 0.0 0.7 0.2 0.0 Illinois 4.5 8.4 49.1 25.8 4.0 6.3 0.3 0.0 0.7 0.8 0.2 Indiana 1.6 0.5 67.7 23.3 0.5 5.2 0.3 0.0 0.6 0.2 0.0 Iowa 5.3 4.0 52.4 31.3 3.8 2.9 0.1 0.0 0.1 0.0 0.0 Kansas 1.1 3.9 43.5 38.9 8.1 4.0 0.2 0.0 0.2 0.0 0.0 Kentucky 2.8 3.5 52.8 25.5 5.9 3.4 0.7 0.4 2.3 2.9 0.0 Louisiana 7.0 1.5 41.0 43.7 1.7 2.7 0.2 0.0 1.1 1.1 0.1 Maine 20.1 4.8 42.4 29.3 0.6 0.6 1.2 0.5 0.0 0.1 0.4 Maryland 5.7 9.0 67.0 15.2 1.0 1.7 0.0 0.0 0.0 0.3 0.0 Massachusetts 3.6 1.3 62.7 22.7 2.9 6.6 0.2 0.0 0.0 0.0 0.0 Michigan 5.1 2.0 47.6 35.7 5.5 3.4 0.1 0.0 0.4 0.2 0.1 Minnesota 7.0 4.7 64.8 18.8 2.4 1.9 0.1 0.0 0.4 0.1 0.0 Mississippi 0.3 3.2 66.1 14.8 6.1 3.6 0.2 0.0 3.3 1.2 1.2 Missouri 1.0 1.5 55.3 32.4 5.5 3.3 0.2 0.0 0.7 0.1 0.0 Montana 6.6 7.1 33.3 39.9 9.3 3.4 0.3 0.0 0.0 0.2 0.0 Nebraska 1.1 1.9 48.4 35.1 9.3 3.4 0.4 0.0 0.0 0.2 0.0 Nevada 9.5 3.8 65.5 18.0 0.7 2.4 0.2 0.0 0.0 0.0 0.0 New Hampshire 13.7 8.4 47.5 18.0 4.4 4.9 1.6 0.0 0.2 1.1 0.2 New Jersey 4.7 1.0 56.1 25.7 6.2 4.2 1.0 0.0 0.8 0.3 0.1 New Mexico 3.1 4.9 37.7 34.8 2.8 12.2 2.8 0.4 0.4 0.8 0.2 New York 7.0 2.1 59.8 25.5 1.3 2.7 0.2 0.0 0.1 1.1 0.2 North Carolina 11.2 5.4 58.7 18.4 2.4 2.9 0.1 0.0 0.8 0.1 0.0 North Dakota 10.1 8.4 52.9 20.2 2.9 5.0 0.0 0.0 0.4 0.0 0.0 Ohio 4.5 7.0 60.1 20.8 4.3 3.0 0.0 0.0 0.2 0.1 0.0 Oklahoma 3.2 3.3 29.4 50.5 8.1 2.6 1.9 0.0 0.1 0.7 0.4 Oregon 4.0 3.4 57.0 24.9 3.8 5.0 0.6 0.0 0.8 0.5 0.0 Pennsylvania 3.6 4.2 56.4 27.4 4.9 3.4 0.0 0.0 0.0 0.1 0.0 Rhode Island 9.8 4.9 29.7 46.5 4.2 3.8 1.0 0.0 0.0 0.0 0.0 South Carolina 2.3 5.1 63.0 21.6 3.4 1.7 0.0 0.0 0.5 1.8 0.5 South Dakota 4.4 5.9 48.4 33.1 1.3 6.9 0.0 0.0 0.0 0.0 0.0 Tennessee 0.0 1.0 67.3 16.6 4.7 4.2 0.7 0.1 2.2 1.5 1.6 Texas 7.3 7.4 22.5 50.9 6.9 1.1 1.7 0.0 0.0 2.1 0.2 Utah 23.5 4.4 35.9 31.7 0.6 2.5 0.6 0.0 1.0 0.0 0.0 Vermont 1.2 1.2 75.6 14.0 6.8 1.2 0.0 0.0 0.0 0.0 0.0 Virginia 3.8 2.7 68.2 16.4 5.7 2.9 0.0 0.0 0.1 0.1 0.1 Washington 9.3 1.6 49.3 29.7 4.8 4.3 0.5 0.0 0.2 0.2 0.0 West Virginia 6.4 7.3 51.0 23.1 10.0 1.5 0.4 0.0 0.1 0.2 0.0
Wisconsin 4.0 6.6 58.0 19.8 2.8 6.4 0.3 0.0 1.6 0.3 0.2
Wyoming 6.5 0.9 56.4 24.8 6.7 3.0 0.5 0.0 0.2 0.2 0.7
Source: CASPER; *=A Level Citations are not reported by CMS
Nursing Home Data Compendium 2013 81

Table 2.5.b. Distribution of Scope and Severity of Health Deficiency Citations: United States, 2009
*Distribution by Scope and Severity - PercentB C D E F G H I J K L
Nation 4.5 3.4 55.9 27.7 4.7 2.6 0.3 0.0 0.3 0.4 0.2 Alabama 1.5 6.5 69.2 10.8 10.8 0.7 0.0 0.0 0.4 0.0 0.0 Alaska 0.0 0.0 50.6 22.5 23.6 1.1 0.0 1.1 0.0 1.1 0.0 Arizona 7.4 1.8 59.6 25.4 2.5 2.4 0.6 0.0 0.1 0.1 0.0 Arkansas 2.4 1.6 28.7 56.0 7.8 0.5 2.2 0.0 0.1 0.5 0.1 California 9.6 2.9 61.9 20.9 3.1 1.2 0.1 0.0 0.1 0.2 0.1 Colorado 0.9 0.3 54.7 32.3 7.4 4.0 0.1 0.0 0.0 0.2 0.0 Connecticut 2.7 5.1 73.4 10.5 2.7 5.0 0.3 0.0 0.1 0.1 0.2 Delaware 16.3 2.5 55.5 18.4 3.4 4.0 0.0 0.0 0.0 0.0 0.0 District of Columbia 0.6 1.2 79.6 16.3 0.9 1.5 0.0 0.0 0.0 0.0 0.0 Florida 2.3 2.6 76.6 10.8 6.3 1.0 0.0 0.0 0.1 0.2 0.1 Georgia 7.0 4.7 62.9 14.5 6.9 2.5 0.1 0.0 0.8 0.6 0.1 Hawaii 3.2 3.2 64.5 22.2 5.6 1.2 0.0 0.0 0.0 0.0 0.0 Idaho 2.6 3.3 56.4 25.8 7.4 4.0 0.0 0.0 0.3 0.1 0.0 Illinois 3.7 7.1 47.5 29.9 5.5 5.3 0.2 0.0 0.5 0.2 0.1 Indiana 1.7 0.3 69.2 24.1 0.4 3.8 0.1 0.0 0.2 0.1 0.0 Iowa 5.7 4.5 52.3 31.0 4.5 2.0 0.0 0.0 0.0 0.0 0.0 Kansas 0.6 4.0 51.0 32.8 7.7 3.5 0.1 0.0 0.2 0.1 0.0 Kentucky 2.6 1.8 59.2 25.9 5.4 3.4 0.0 0.0 0.6 1.1 0.0 Louisiana 4.8 1.1 43.8 44.3 1.8 2.8 0.2 0.0 0.8 0.2 0.0 Maine 12.4 4.2 47.1 33.0 2.7 0.6 0.0 0.0 0.0 0.0 0.0 Maryland 4.6 7.8 65.8 19.8 1.0 0.9 0.0 0.0 0.1 0.0 0.0 Massachusetts 4.1 0.9 64.4 21.5 3.6 5.4 0.1 0.0 0.0 0.0 0.0 Michigan 4.3 1.7 50.8 35.4 3.9 3.3 0.1 0.0 0.3 0.2 0.0 Minnesota 4.2 3.0 69.9 17.1 3.5 1.7 0.1 0.0 0.2 0.2 0.0 Mississippi 0.3 2.5 73.3 17.3 4.1 1.8 0.0 0.0 0.2 0.5 0.0 Missouri 1.0 1.6 55.9 32.6 5.3 2.8 0.1 0.0 0.5 0.1 0.1 Montana 11.5 8.0 33.1 38.2 7.0 1.9 0.1 0.0 0.1 0.1 0.0 Nebraska 0.5 2.0 53.7 32.2 9.2 2.1 0.2 0.0 0.1 0.0 0.0 Nevada 7.3 7.3 58.0 18.5 4.1 3.2 1.1 0.0 0.2 0.0 0.2 New Hampshire 16.1 5.9 61.5 12.5 2.0 2.0 0.0 0.0 0.0 0.0 0.0 New Jersey 3.0 1.1 54.2 26.2 8.2 3.8 0.3 0.0 1.0 1.5 0.8 New Mexico 2.7 1.7 39.9 43.7 1.7 6.5 1.0 0.0 1.7 1.0 0.0 New York 5.7 2.1 60.5 25.8 1.7 2.2 0.0 0.0 0.1 1.0 0.8 North Carolina 7.6 5.3 66.6 14.9 2.6 2.2 0.1 0.0 0.7 0.0 0.0 North Dakota 3.4 5.6 56.4 23.3 6.5 3.6 1.1 0.0 0.2 0.0 0.0 Ohio 3.2 6.1 63.9 19.0 4.7 2.8 0.0 0.0 0.2 0.0 0.0 Oklahoma 2.5 2.5 28.4 54.8 6.2 1.8 2.3 0.0 0.3 1.0 0.2 Oregon 6.4 2.8 56.5 24.9 4.3 3.9 0.0 0.0 0.2 1.0 0.2 Pennsylvania 3.8 5.1 55.7 25.7 5.5 4.0 0.1 0.0 0.0 0.0 0.1 Rhode Island 8.0 3.6 33.6 36.0 3.2 1.6 5.2 0.0 0.4 8.4 0.0 South Carolina 1.5 4.4 57.9 24.6 6.0 1.3 0.0 0.0 1.2 2.6 0.4 South Dakota 5.2 3.1 49.1 34.4 1.0 6.6 0.0 0.0 0.2 0.4 0.0 Tennessee 0.2 0.7 74.6 14.5 3.7 2.2 0.2 0.0 1.9 0.7 1.2 Texas 6.1 6.0 19.7 56.1 7.1 1.0 1.5 0.0 0.3 1.7 0.6 Utah 14.3 1.6 37.6 43.2 0.9 2.1 0.0 0.0 0.2 0.0 0.0 Vermont 3.5 4.2 68.8 16.0 6.3 0.3 0.0 0.0 0.0 0.0 1.0 Virginia 2.3 2.1 67.2 21.5 4.3 2.3 0.1 0.0 0.2 0.0 0.0 Washington 6.8 1.4 54.8 29.6 3.9 3.0 0.1 0.0 0.3 0.1 0.0 West Virginia 3.3 5.6 53.0 25.0 10.9 2.0 0.0 0.0 0.0 0.1 0.0 Wisconsin 4.0 4.4 60.8 18.3 5.2 5.5 0.1 0.0 0.7 0.4 0.5 Wyoming 3.4 1.4 53.1 33.9 5.1 1.4 0.0 0.0 0.0 1.7 0.0
Source: CASPER; *=A Level Citations are not reported by CMS
82 Nursing Home Data Compendium 2013

Table 2.5.c. Distribution of Scope and Severity of Health Deficiency Citations: United States, 2010
*Distribution by Scope and Severity - PercentB C D E F G H I J K L
Nation 4.2 3.2 55.6 28.1 5.4 2.3 0.2 0.0 0.3 0.5 0.1 Alabama 1.5 4.2 65.0 13.2 13.4 1.2 0.0 0.0 0.9 0.6 0.0 Alaska 0.0 4.2 47.4 17.9 23.2 1.1 0.0 0.0 3.2 2.1 1.1 Arizona 6.4 0.9 64.1 24.5 2.0 1.7 0.2 0.0 0.1 0.0 0.0 Arkansas 2.1 1.5 24.0 59.2 7.5 0.1 1.0 0.0 0.7 3.5 0.3 California 9.0 3.1 59.1 23.7 3.6 0.8 0.2 0.0 0.1 0.2 0.1 Colorado 0.7 0.1 53.1 32.1 10.0 3.5 0.0 0.0 0.0 0.3 0.0 Connecticut 1.7 5.2 69.5 13.8 3.5 5.2 0.3 0.0 0.2 0.2 0.4 Delaware 8.9 1.4 61.6 19.2 5.1 3.8 0.0 0.0 0.0 0.0 0.0 District of Columbia 0.0 1.0 80.1 11.6 3.3 3.3 0.5 0.0 0.0 0.0 0.3 Florida 2.2 2.1 76.2 11.3 6.0 0.8 0.1 0.0 0.7 0.4 0.2 Georgia 4.8 3.5 63.8 16.0 5.8 3.1 0.1 0.0 0.6 2.1 0.2 Hawaii 1.5 2.2 62.0 24.4 7.7 1.1 0.7 0.0 0.4 0.0 0.0 Idaho 3.0 3.0 55.0 30.1 5.7 3.1 0.0 0.0 0.0 0.1 0.0 Illinois 3.0 7.0 46.3 29.7 7.8 4.9 0.1 0.0 0.6 0.5 0.2 Indiana 1.7 3.1 63.9 22.8 4.5 3.3 0.0 0.0 0.4 0.1 0.2 Iowa 6.3 4.5 50.2 31.7 5.1 2.1 0.0 0.0 0.0 0.0 0.0 Kansas 0.4 3.5 52.4 32.6 7.8 3.1 0.0 0.0 0.1 0.1 0.0 Kentucky 2.5 1.8 59.1 26.1 6.7 1.9 0.1 0.0 1.0 0.6 0.3 Louisiana 3.2 1.0 51.6 40.1 1.6 2.0 0.1 0.0 0.1 0.2 0.0 Maine 8.6 2.4 45.5 40.0 1.5 0.7 0.9 0.0 0.2 0.2 0.0 Maryland 5.1 5.6 72.8 14.5 0.8 1.1 0.1 0.0 0.1 0.0 0.0 Massachusetts 4.0 0.4 66.8 18.4 3.3 6.3 0.4 0.0 0.5 0.1 0.0 Michigan 3.7 1.5 50.6 35.4 5.3 2.9 0.1 0.0 0.2 0.2 0.1 Minnesota 2.0 2.2 72.3 15.9 5.2 1.5 0.0 0.0 0.3 0.5 0.0 Mississippi 0.8 4.1 66.8 20.4 5.5 0.9 0.0 0.0 1.1 0.1 0.2 Missouri 2.9 1.7 54.3 32.0 6.3 2.1 0.1 0.0 0.5 0.1 0.0 Montana 21.2 8.9 34.7 26.9 5.3 3.0 0.0 0.0 0.0 0.0 0.0 Nebraska 0.2 0.8 52.5 34.1 9.8 2.6 0.0 0.0 0.0 0.0 0.0 Nevada 2.4 5.4 61.9 25.3 3.2 0.8 0.0 0.0 0.4 0.4 0.2 New Hampshire 5.6 3.4 61.5 14.4 5.9 7.6 0.0 0.0 0.5 0.7 0.5 New Jersey 3.3 0.6 59.4 24.9 6.9 3.0 0.2 0.0 0.6 0.8 0.3 New Mexico 3.2 1.4 34.8 45.0 2.8 7.8 2.1 0.0 1.4 1.1 0.4 New York 4.9 2.2 62.5 25.1 1.6 1.9 0.2 0.0 0.0 1.2 0.4 North Carolina 6.3 2.3 68.3 17.5 1.8 2.8 0.1 0.0 0.7 0.1 0.0 North Dakota 5.6 5.1 60.2 25.9 0.8 2.5 0.0 0.0 0.0 0.0 0.0 Ohio 3.3 5.7 63.6 19.9 4.7 2.5 0.0 0.0 0.1 0.1 0.0 Oklahoma 2.9 2.3 29.0 55.1 6.4 1.2 1.4 0.0 0.2 1.3 0.2 Oregon 6.0 3.1 56.4 24.7 5.8 2.4 0.0 0.0 1.3 0.4 0.0 Pennsylvania 5.8 4.2 55.1 26.5 4.8 3.5 0.0 0.0 0.0 0.0 0.0 Rhode Island 7.1 5.7 33.5 38.2 3.8 0.0 1.4 0.0 0.0 7.5 2.8 South Carolina 2.0 6.9 47.0 28.3 11.5 1.7 0.0 0.0 0.3 2.2 0.0 South Dakota 3.4 4.7 45.2 38.2 4.0 4.5 0.0 0.0 0.0 0.0 0.0 Tennessee 0.1 0.6 81.9 11.7 3.1 1.7 0.1 0.0 0.2 0.5 0.0 Texas 5.2 5.4 19.9 57.2 8.5 0.9 1.0 0.0 0.0 1.3 0.5 Utah 5.3 2.0 41.4 42.5 4.9 2.9 0.5 0.0 0.0 0.2 0.4 Vermont 3.6 2.3 69.8 18.0 3.2 1.8 0.0 0.0 1.4 0.0 0.0 Virginia 4.2 1.3 67.9 20.0 3.6 2.5 0.1 0.0 0.3 0.0 0.0 Washington 4.2 1.6 59.2 26.8 4.6 2.7 0.1 0.0 0.6 0.2 0.0 West Virginia 1.9 3.7 54.2 22.5 11.3 3.8 0.0 0.0 0.6 1.3 0.6 Wisconsin 3.1 4.6 59.0 20.5 7.7 3.6 0.2 0.0 0.9 0.4 0.2 Wyoming 1.5 1.2 51.9 34.8 5.9 3.8 0.3 0.0 0.6 0.0 0.0
Source: CASPER; *=A Level Citations are not reported by CMS
Nursing Home Data Compendium 2013 83

Table 2.5.d. Distribution of Scope and Severity of Health Deficiency Citations: United States, 2011
*Distribution by Scope and Severity - PercentB C D E F G H I J K L
Nation 3.6 3.4 55.8 27.6 6.2 2.4 0.3 0.0 0.3 0.4 0.1 Alabama 1.8 5.5 64.8 10.9 13.7 0.9 0.0 0.0 1.4 0.6 0.4 Alaska 0.0 1.1 29.5 27.3 35.2 3.4 0.0 0.0 0.0 2.3 1.1 Arizona 3.9 1.9 66.0 23.1 0.9 3.9 0.0 0.0 0.0 0.3 0.0 Arkansas 1.2 2.9 21.5 61.3 9.6 0.4 2.0 0.0 0.4 0.7 0.0 California 7.2 2.6 60.7 24.4 4.0 0.8 0.1 0.0 0.1 0.1 0.1 Colorado 1.5 1.2 56.3 29.4 7.9 3.5 0.0 0.0 0.0 0.3 0.0 Connecticut 1.5 4.6 72.2 11.7 2.7 6.3 0.1 0.0 0.5 0.2 0.2 Delaware 5.1 3.2 56.7 28.9 4.8 1.3 0.0 0.0 0.0 0.0 0.0 District of Columbia 1.5 1.5 68.9 21.2 2.2 2.2 0.0 0.0 0.4 1.8 0.4 Florida 1.4 1.9 75.4 13.1 6.7 1.3 0.0 0.0 0.0 0.0 0.2 Georgia 4.1 2.8 68.3 16.5 4.1 2.5 0.0 0.0 0.9 0.9 0.0 Hawaii 0.3 4.1 69.7 17.7 6.8 1.4 0.0 0.0 0.0 0.0 0.0 Idaho 2.6 3.0 55.3 29.3 3.9 5.7 0.1 0.0 0.3 0.0 0.0 Illinois 3.1 7.8 48.9 25.4 8.9 4.8 0.2 0.0 0.2 0.4 0.3 Indiana 2.4 4.7 64.2 20.1 4.9 3.0 0.0 0.0 0.3 0.3 0.1 Iowa 5.9 3.4 51.8 32.4 3.7 2.5 0.0 0.0 0.1 0.0 0.0 Kansas 0.3 2.4 54.5 30.9 8.4 3.3 0.0 0.0 0.1 0.1 0.0 Kentucky 1.3 1.8 57.4 27.6 7.9 1.7 0.0 0.0 1.2 1.0 0.0 Louisiana 4.3 1.2 50.4 38.8 1.4 1.9 0.1 0.0 0.9 0.8 0.1 Maine 6.4 5.0 42.8 40.7 3.0 0.7 1.4 0.0 0.0 0.0 0.0 Maryland 6.9 5.5 67.2 19.2 0.6 0.4 0.0 0.0 0.2 0.0 0.0 Massachusetts 2.8 0.7 65.0 21.5 3.6 5.8 0.1 0.0 0.5 0.1 0.0 Michigan 3.7 1.8 52.6 29.4 7.8 3.9 0.2 0.0 0.3 0.2 0.1 Minnesota 1.0 4.4 71.2 14.6 6.1 2.3 0.0 0.0 0.1 0.3 0.1 Mississippi 0.5 1.6 65.3 21.0 8.6 2.6 0.0 0.0 0.1 0.4 0.0 Missouri 3.1 1.7 51.1 35.1 6.2 2.3 0.2 0.0 0.4 0.1 0.0 Montana 14.4 5.3 35.9 32.0 9.7 1.8 0.0 0.0 0.2 0.8 0.0 Nebraska 0.3 1.5 55.2 31.6 9.0 2.4 0.0 0.0 0.0 0.0 0.1 Nevada 0.9 2.7 73.2 15.9 3.1 3.8 0.0 0.0 0.4 0.0 0.0 New Hampshire 10.0 2.0 68.4 9.6 4.7 3.3 0.0 0.0 1.3 0.0 0.7 New Jersey 2.2 0.4 62.0 22.9 8.6 2.6 0.3 0.0 0.6 0.2 0.1 New Mexico 2.7 2.7 17.3 51.0 13.3 7.8 0.4 0.0 3.1 1.6 0.0 New York 5.9 2.6 66.3 21.1 1.5 1.5 0.1 0.0 0.0 0.8 0.2 North Carolina 5.5 3.1 68.8 17.4 1.0 2.2 0.0 0.0 1.7 0.2 0.0 North Dakota 8.1 5.7 59.5 21.6 2.0 3.3 0.0 0.0 0.0 0.0 0.0 Ohio 2.7 5.3 66.0 18.1 5.7 2.0 0.0 0.0 0.0 0.1 0.0 Oklahoma 2.1 2.3 27.1 57.5 5.6 1.4 2.5 0.0 0.2 1.1 0.1 Oregon 8.3 4.1 61.6 18.1 4.3 2.6 0.0 0.0 0.8 0.0 0.2 Pennsylvania 4.8 3.3 57.7 26.2 5.9 2.0 0.0 0.0 0.0 0.1 0.0 Rhode Island 12.7 3.8 39.9 31.6 5.1 1.9 0.0 0.0 0.0 1.3 3.8 South Carolina 1.0 2.6 55.5 24.6 11.4 1.8 0.0 0.0 0.2 2.3 0.5 South Dakota 2.0 4.6 53.2 29.7 4.8 4.4 0.9 0.0 0.0 0.4 0.0 Tennessee 0.1 0.8 78.7 11.8 3.9 2.7 0.0 0.0 1.1 0.7 0.1 Texas 4.1 6.6 19.4 52.6 13.8 0.9 1.0 0.0 0.2 1.2 0.2 Utah 3.9 0.9 42.0 45.6 1.6 5.4 0.2 0.0 0.2 0.2 0.0 Vermont 7.6 2.5 68.4 16.9 2.5 0.8 0.0 0.0 1.3 0.0 0.0 Virginia 3.1 1.9 64.6 22.6 5.2 2.2 0.2 0.0 0.1 0.1 0.0 Washington 3.8 2.1 59.8 24.1 4.4 4.1 0.3 0.0 0.6 0.4 0.5 West Virginia 1.5 4.4 51.9 26.1 10.2 4.0 0.0 0.0 0.7 0.7 0.5 Wisconsin 2.5 5.6 59.6 20.8 7.2 3.2 0.0 0.0 0.8 0.2 0.1 Wyoming 2.1 1.6 57.3 31.0 5.6 2.3 0.0 0.0 0.0 0.0 0.0
Source: CASPER; *=A Level Citations are not reported by CMS
84 Nursing Home Data Compendium 2013

Table 2.5.e. Distribution of Scope and Severity of Health Deficiency Citations: United States, 2012
*Distribution by Scope and Severity - PercentB C D E F G H I J K L
Nation 3.1 3.2 55.8 28.2 6.6 2.0 0.2 0.0 0.3 0.4 0.1 Alabama 1.8 3.5 68.4 10.5 14.0 0.9 0.0 0.0 0.2 0.3 0.3 Alaska 0.0 0.0 50.0 22.0 19.5 0.0 2.4 0.0 2.4 1.2 2.4 Arizona 2.8 0.2 64.3 27.5 1.3 3.4 0.2 0.0 0.1 0.0 0.0 Arkansas 2.0 1.8 19.1 63.3 11.2 0.4 1.0 0.0 0.1 1.0 0.1 California 6.1 2.3 60.6 26.0 4.0 0.7 0.1 0.0 0.0 0.1 0.1 Colorado 1.4 0.6 57.8 28.3 8.6 2.9 0.1 0.0 0.2 0.2 0.0 Connecticut 1.1 1.9 68.7 17.0 4.1 6.7 0.1 0.0 0.3 0.1 0.0 Delaware 1.5 1.5 65.4 24.9 5.0 1.3 0.0 0.0 0.0 0.2 0.0 District of Columbia 0.3 2.4 66.1 24.2 4.2 2.4 0.0 0.0 0.0 0.0 0.3 Florida 1.4 1.1 76.7 13.5 5.9 1.0 0.1 0.0 0.3 0.0 0.0 Georgia 3.6 2.9 66.4 18.4 5.9 0.9 0.0 0.0 0.8 1.0 0.0 Hawaii 4.1 4.8 64.8 22.6 3.0 0.7 0.0 0.0 0.0 0.0 0.0 Idaho 2.5 1.6 56.3 28.1 5.0 5.8 0.0 0.0 0.5 0.2 0.0 Illinois 2.3 8.7 51.6 23.1 10.3 3.3 0.1 0.0 0.4 0.0 0.2 Indiana 3.6 5.9 64.1 17.4 6.3 2.2 0.0 0.0 0.2 0.1 0.1 Iowa 4.0 2.8 53.8 31.8 4.8 2.5 0.0 0.0 0.2 0.0 0.0 Kansas 0.5 3.6 56.6 29.3 7.8 2.1 0.0 0.0 0.1 0.1 0.0 Kentucky 2.6 2.1 56.5 25.6 6.5 3.0 0.2 0.0 2.2 0.7 0.6 Louisiana 3.1 0.7 47.7 44.5 0.6 0.3 0.4 0.0 1.0 1.4 0.2 Maine 6.8 1.4 44.4 44.8 0.9 0.2 0.0 0.5 0.0 0.0 1.1 Maryland 6.1 4.0 68.0 20.5 0.3 0.8 0.0 0.0 0.1 0.2 0.1 Massachusetts 1.6 0.6 64.9 19.7 4.3 8.5 0.3 0.0 0.0 0.0 0.1 Michigan 4.8 2.0 55.7 25.1 9.2 2.6 0.0 0.0 0.5 0.1 0.0 Minnesota 1.0 5.5 69.5 14.7 7.1 1.6 0.1 0.0 0.3 0.2 0.0 Mississippi 0.3 1.6 64.8 19.9 9.1 1.3 0.0 0.0 1.5 0.7 0.8 Missouri 2.3 1.4 53.3 34.7 5.5 2.2 0.1 0.0 0.4 0.0 0.0 Montana 7.6 4.5 43.6 34.7 8.0 1.3 0.0 0.0 0.2 0.0 0.0 Nebraska 0.3 1.3 53.1 33.4 8.9 2.2 0.5 0.0 0.1 0.2 0.0 Nevada 1.0 1.4 66.7 27.0 2.0 1.6 0.0 0.0 0.2 0.0 0.0 New Hampshire 9.9 6.1 68.4 12.3 0.0 3.3 0.0 0.0 0.0 0.0 0.0 New Jersey 3.2 1.1 65.7 21.2 5.4 2.9 0.0 0.0 0.1 0.4 0.0 New Mexico 2.8 2.5 19.7 46.6 7.5 9.1 2.8 0.0 2.8 5.0 1.3 New York 5.4 1.6 66.8 22.0 1.1 1.2 0.0 0.0 0.0 1.5 0.3 North Carolina 4.6 3.9 70.8 16.8 0.8 1.5 0.0 0.0 1.2 0.5 0.0 North Dakota 2.9 4.8 57.2 28.1 2.3 4.8 0.0 0.0 0.0 0.0 0.0 Ohio 2.0 4.2 65.8 19.0 6.3 2.3 0.1 0.0 0.2 0.0 0.0 Oklahoma 3.7 2.8 26.6 57.2 5.2 1.2 1.7 0.0 0.2 1.0 0.3 Oregon 6.8 2.3 61.7 23.0 3.9 1.6 0.0 0.0 0.8 0.0 0.0 Pennsylvania 3.4 2.7 59.3 28.1 5.4 1.1 0.0 0.0 0.0 0.0 0.0 Rhode Island 8.2 6.2 42.6 27.7 6.7 0.5 0.0 0.0 0.0 8.2 0.0 South Carolina 0.5 4.8 50.6 28.7 6.4 3.6 0.1 0.0 1.7 1.8 1.9 South Dakota 1.5 5.1 48.7 32.1 6.1 6.3 0.0 0.0 0.2 0.0 0.0 Tennessee 0.0 1.6 76.2 11.9 4.5 2.2 0.0 0.0 1.8 1.5 0.3 Texas 3.0 5.5 16.5 54.8 16.9 0.8 0.6 0.0 0.1 1.7 0.1 Utah 1.9 2.8 40.0 45.8 4.2 3.9 0.4 0.0 0.7 0.2 0.0 Vermont 3.1 1.3 66.9 24.4 1.3 3.1 0.0 0.0 0.0 0.0 0.0 Virginia 2.7 1.8 66.7 21.3 5.1 2.4 0.0 0.0 0.0 0.0 0.0 Washington 3.2 2.7 59.7 26.1 4.6 3.4 0.0 0.0 0.1 0.1 0.0 West Virginia 2.2 3.7 53.8 25.7 11.5 2.6 0.1 0.0 0.0 0.2 0.0 Wisconsin 1.2 5.0 62.6 18.8 7.7 3.3 0.2 0.0 0.7 0.3 0.2 Wyoming 2.8 1.3 54.1 36.1 4.8 0.4 0.0 0.0 0.0 0.0 0.4
Source: CASPER; *=A Level Citations are not reported by CMS
Nursing Home Data Compendium 2013 85

Table 2.6.a. Nursing Home Surveys Resulting in a Health Deficiency of Actual Harm or Immediate Jeopardy to Residents by Bed Size Category: United States, 2008
Percentage by Bed Size Category <50 50-99 100-199 >199 All Facilities
Nation 10.9 15.9 18.2 22.5 16.6 Alabama 0.0 9.5 11.5 11.1 10.2 Alaska 11.1 33.3 n/a 0.0 15.4 Arizona 6.7 25.0 20.8 27.3 20.9 Arkansas 10.0 15.9 9.3 0.0 11.7 California 8.7 10.1 17.8 19.6 12.2 Colorado 11.4 28.7 40.7 33.3 30.6 Connecticut 6.3 19.7 35.4 40.9 29.1 Delaware 0.0 33.3 23.3 100 22.4 District of Columbia 0.0 20.0 25.0 40.0 23.5 Florida 2.5 5.5 5.4 3.2 5.1 Georgia 11.1 18.0 17.4 32.0 18.1 Hawaii 10.0 8.3 26.7 33.3 16.0 Idaho 16.7 19.0 48.0 n/a 29.7 Illinois 9.1 24.5 26.0 36.8 25.1 Indiana 16.9 28.4 31.0 72.7 28.3 Iowa 6.0 14.0 33.3 0.0 14.3 Kansas 27.0 25.9 16.3 0.0 24.7 Kentucky 4.3 13.9 14.4 20.0 12.7 Louisiana 8.3 7.1 15.5 27.8 14.4 Maine 9.3 7.0 0.0 0.0 7.1 Maryland 4.2 12.2 16.9 10.5 13.8 Massachusetts 3.2 9.8 21.8 42.9 16.9 Michigan 22.5 19.7 26.2 23.3 23.6 Minnesota 20.3 16.7 16.5 23.1 17.6 Mississippi 10.5 19.8 28.6 0.0 22.1 Missouri 15.6 16.2 27.1 15.0 20.9 Montana 16.1 10.0 30.4 0.0 17.6 Nebraska 15.2 17.3 23.9 20.0 17.9 Nevada 18.2 22.2 8.7 16.7 14.3 New Hampshire 0.0 18.4 29.0 0.0 18.6 New Jersey 8.6 8.5 14.7 21.7 14.3 New Mexico 22.2 40.7 35.5 50.0 36.2 New York 2.1 8.7 13.2 15.2 12.4 North Carolina 4.1 11.0 7.6 16.7 8.7 North Dakota 10.3 16.7 20.0 0.0 14.8 Ohio 9.9 14.2 15.8 20.8 14.5 Oklahoma 25.8 23.2 30.9 66.7 27.3 Oregon 4.5 14.5 25.5 50.0 17.3 Pennsylvania 8.2 7.2 15.3 20.5 13.0 Rhode Island 0.0 9.1 10.3 0.0 8.0 South Carolina 5.7 9.1 13.2 20.0 10.5 South Dakota 25.0 18.9 20.0 n/a 21.8 Tennessee 12.9 18.1 16.1 16.7 16.4 Texas 3.0 10.2 12.8 17.6 11.3 Utah 8.0 10.3 18.2 0.0 12.5 Vermont 9.1 9.1 0.0 n/a 5.4 Virginia 3.1 16.7 16.3 33.3 15.8 Washington 5.1 23.2 21.7 50.0 20.1 West Virginia 4.3 12.5 14.6 0.0 11.6 Wisconsin 20.8 25.6 31.0 33.3 27.1 Wyoming 27.3 20.0 35.7 n/a 27.5
Source: CASPER
86 Nursing Home Data Compendium 2013

Table 2.6.b. Nursing Home Surveys Resulting in a Health Deficiency of Actual Harm or Immediate Jeopardy to Residents by Bed Size Category: United States, 2009
Percentage by Bed Size Category <50 50-99 100-199 >199 All Facilities
Nation 8.4 13.5 16.0 17.5 14.2 Alabama 0.0 2.4 1.7 7.1 2.3 Alaska 0.0 0.0 n/a 100 5.9 Arizona 0.0 10.8 27.4 50.0 21.2 Arkansas 0.0 11.2 15.7 0.0 13.3 California 5.1 7.8 15.8 17.1 9.8 Colorado 20.0 31.0 30.3 11.1 28.1 Connecticut 7.1 28.6 23.8 31.3 24.8 Delaware 37.5 25.0 34.6 0.0 32.6 District of Columbia 0.0 20.0 12.5 40.0 19.0 Florida 14.3 0.8 4.3 0.0 4.0 Georgia 8.0 11.4 7.1 20.0 9.4 Hawaii 0.0 0.0 6.7 0.0 2.1 Idaho 20.8 42.3 39.1 n/a 34.2 Illinois 9.1 20.9 28.4 27.4 23.2 Indiana 10.4 15.7 27.8 35.7 20.6 Iowa 5.5 10.0 17.1 25.0 10.2 Kansas 19.5 27.2 16.7 0.0 23.0 Kentucky 4.4 11.6 10.2 0.0 9.5 Louisiana 9.1 12.2 13.2 12.5 12.7 Maine 2.3 2.0 9.1 0.0 2.9 Maryland 3.6 10.2 7.0 24.0 9.1 Massachusetts 3.5 15.4 12.1 26.3 12.4 Michigan 10.6 21.6 24.7 26.9 22.4 Minnesota 11.3 11.5 21.4 0.0 13.6 Mississippi 5.9 4.9 10.7 0.0 7.3 Missouri 4.8 15.2 24.7 15.4 18.8 Montana 8.8 14.7 10.3 50.0 12.1 Nebraska 8.9 8.4 7.3 33.3 8.7 Nevada 9.1 10.0 40.9 28.6 26.0 New Hampshire 0.0 11.4 6.5 0.0 7.3 New Jersey 7.1 11.5 19.8 21.4 17.6 New Mexico 20.0 14.3 25.8 0.0 19.4 New York 2.4 8.3 12.9 13.3 11.6 North Carolina 0.0 7.1 7.3 14.3 6.8 North Dakota 14.3 12.9 5.0 0.0 11.1 Ohio 4.9 15.9 15.4 24.0 14.7 Oklahoma 12.5 26.3 25.9 66.7 25.2 Oregon 14.3 16.4 16.4 0.0 15.8 Pennsylvania 10.6 10.4 14.4 16.1 13.2 Rhode Island 23.1 9.7 13.2 0.0 12.9 South Carolina 4.5 7.8 11.7 0.0 8.5 South Dakota 25.5 14.0 27.3 n/a 20.5 Tennessee 8.7 11.5 11.2 5.9 10.7 Texas 3.4 7.6 12.3 12.8 10.2 Utah 0.0 8.3 18.8 0.0 10.4 Vermont 9.1 9.1 0.0 n/a 5.3 Virginia 0.0 7.4 23.7 7.7 15.1 Washington 3.0 21.0 17.6 0.0 16.8 West Virginia 10.0 14.8 15.9 0.0 14.3 Wisconsin 11.6 25.1 33.1 33.3 26.6 Wyoming 9.1 21.4 9.1 n/a 13.9
Source: CASPER
Nursing Home Data Compendium 2013 87

Table 2.6.c. Nursing Home Surveys Resulting in a Health Deficiency of Actual Harm or Immediate Jeopardy to Residents by Bed Size Category: United States, 2010
Percentage by Bed Size Category <50 50-99 100-199 >199 All Facilities
Nation 9.2 12.3 13.6 15.3 12.6 Alabama 0.0 2.3 7.3 6.3 5.2 Alaska 30.0 25.0 0.0 n/a 26.7 Arizona 9.1 7.7 15.9 0.0 11.7 Arkansas 12.5 13.8 11.6 100 13.2 California 6.9 7.1 8.8 14.6 7.8 Colorado 26.9 25.3 36.8 66.7 32.0 Connecticut 26.7 25.0 25.6 30.8 25.8 Delaware 0.0 71.4 20.0 0.0 30.8 District of Columbia 33.3 40.0 66.7 40.0 47.4 Florida 4.9 2.5 4.5 2.9 4.0 Georgia 8.7 10.6 14.0 11.1 12.2 Hawaii 0.0 25.0 18.2 0.0 10.8 Idaho 17.4 18.5 37.0 n/a 24.7 Illinois 10.8 18.5 27.2 25.4 22.1 Indiana 11.4 15.0 20.7 11.1 16.7 Iowa 10.4 8.8 10.3 0.0 9.4 Kansas 24.4 21.1 23.1 33.3 22.6 Kentucky 9.8 6.5 5.5 28.6 7.1 Louisiana 0.0 4.8 10.3 12.5 9.0 Maine 10.5 2.0 0.0 0.0 4.9 Maryland 3.4 11.1 6.5 10.0 7.4 Massachusetts 12.5 11.7 14.1 18.8 13.5 Michigan 6.5 18.4 22.3 39.3 20.6 Minnesota 11.9 12.9 13.8 7.1 12.7 Mississippi 14.3 7.7 7.3 0.0 7.9 Missouri 10.5 13.8 15.1 5.3 13.8 Montana 4.0 19.4 12.5 0.0 12.2 Nebraska 7.9 13.5 7.9 0.0 10.3 Nevada 10.0 10.0 12.5 16.7 12.0 New Hampshire 0.0 12.5 21.4 50.0 16.4 New Jersey 0.0 5.4 15.5 17.5 12.8 New Mexico 0.0 26.9 18.2 50.0 20.6 New York 2.4 10.4 11.0 10.0 10.0 North Carolina 2.2 6.4 8.1 15.4 7.1 North Dakota 6.5 8.8 5.0 0.0 7.0 Ohio 5.8 13.7 10.3 0.0 11.0 Oklahoma 12.5 22.3 20.2 0.0 20.1 Oregon 13.6 11.7 9.1 0.0 11.0 Pennsylvania 9.8 9.2 15.0 12.8 12.7 Rhode Island 0.0 6.1 5.1 0.0 4.5 South Carolina 6.7 7.5 6.0 25.0 7.1 South Dakota 4.0 15.2 12.5 0.0 12.4 Tennessee 4.0 6.8 8.0 5.6 7.1 Texas 4.6 7.4 10.5 15.6 9.2 Utah 5.9 14.8 13.8 0.0 10.9 Vermont 0.0 13.3 7.7 n/a 7.1 Virginia 0.0 12.1 15.6 12.5 12.3 Washington 15.6 17.3 18.4 25.0 17.7 West Virginia 28.6 26.3 31.8 n/a 29.2 Wisconsin 12.8 23.2 19.5 50.0 21.3 Wyoming 22.2 30.8 27.3 n/a 27.3
Source: CASPER
88 Nursing Home Data Compendium 2013

Table 2.6.d. Nursing Home Surveys Resulting in a Health Deficiency of Actual Harm or Immediate Jeopardy to Residents by Bed Size Category: United States, 2011
Percentage by Bed Size Category <50 50-99 100-199 >199 All Facilities
Nation 9.0 12.7 13.0 14.9 12.5 Alabama 0.0 3.4 4.9 15.4 4.7 Alaska 18.2 0.0 0.0 n/a 12.5 Arizona 18.2 10.8 21.1 33.3 19.1 Arkansas 33.3 9.7 9.3 0.0 10.0 California 5.3 7.6 7.0 8.7 7.1 Colorado 20.0 29.7 27.1 50.0 27.7 Connecticut 16.7 26.9 29.2 31.3 27.6 Delaware 0.0 11.1 9.1 100 10.3 District of Columbia 33.3 40.0 50.0 40.0 42.1 Florida 2.6 5.3 4.8 5.4 4.8 Georgia 12.5 12.7 5.5 33.3 10.0 Hawaii 0.0 22.2 15.4 0.0 11.8 Idaho 37.5 37.5 44.4 n/a 40.0 Illinois 9.0 20.9 27.1 21.6 22.2 Indiana 14.1 19.0 15.0 20.0 16.6 Iowa 8.9 8.4 26.6 0.0 11.3 Kansas 17.0 27.6 19.0 66.7 23.0 Kentucky 8.1 8.7 8.8 20.0 8.9 Louisiana 0.0 11.1 10.5 26.7 10.9 Maine 5.7 2.2 0.0 0.0 3.2 Maryland 0.0 4.1 4.1 4.8 3.7 Massachusetts 2.1 14.3 15.0 21.4 13.5 Michigan 4.4 17.5 31.5 48.1 25.6 Minnesota 14.0 14.3 8.8 9.1 12.8 Mississippi 7.1 10.4 5.9 0.0 8.1 Missouri 7.0 12.6 17.4 13.3 14.3 Montana 7.4 3.2 12.0 100 8.3 Nebraska 7.6 10.9 8.1 0.0 9.0 Nevada 0.0 30.0 23.1 40.0 21.6 New Hampshire 0.0 6.7 11.4 0.0 7.7 New Jersey 2.9 7.0 12.3 11.7 10.5 New Mexico 37.5 15.0 31.3 50.0 27.4 New York 0.0 10.2 6.2 8.0 7.0 North Carolina 2.5 10.9 6.0 7.1 7.4 North Dakota 9.1 22.6 9.5 25.0 14.6 Ohio 6.6 9.5 7.5 4.2 8.2 Oklahoma 16.7 19.7 33.6 33.3 25.4 Oregon 13.3 14.3 10.5 n/a 12.6 Pennsylvania 5.9 7.5 7.0 14.3 7.8 Rhode Island 0.0 2.9 2.4 0.0 2.2 South Carolina 2.5 9.3 12.3 0.0 8.8 South Dakota 14.9 17.5 14.3 n/a 15.8 Tennessee 10.7 12.5 15.2 33.3 15.0 Texas 4.3 7.9 9.9 5.3 8.7 Utah 25.0 28.6 33.3 0.0 28.2 Vermont 6.7 8.3 0.0 n/a 4.4 Virginia 8.6 11.1 13.7 20.0 12.6 Washington 21.2 19.4 21.6 0.0 20.1 West Virginia 30.8 41.7 27.3 n/a 33.9 Wisconsin 6.4 17.5 16.7 20.0 15.9 Wyoming 10.0 14.3 25.0 n/a 17.5
Source: CASPER
Nursing Home Data Compendium 2013 89
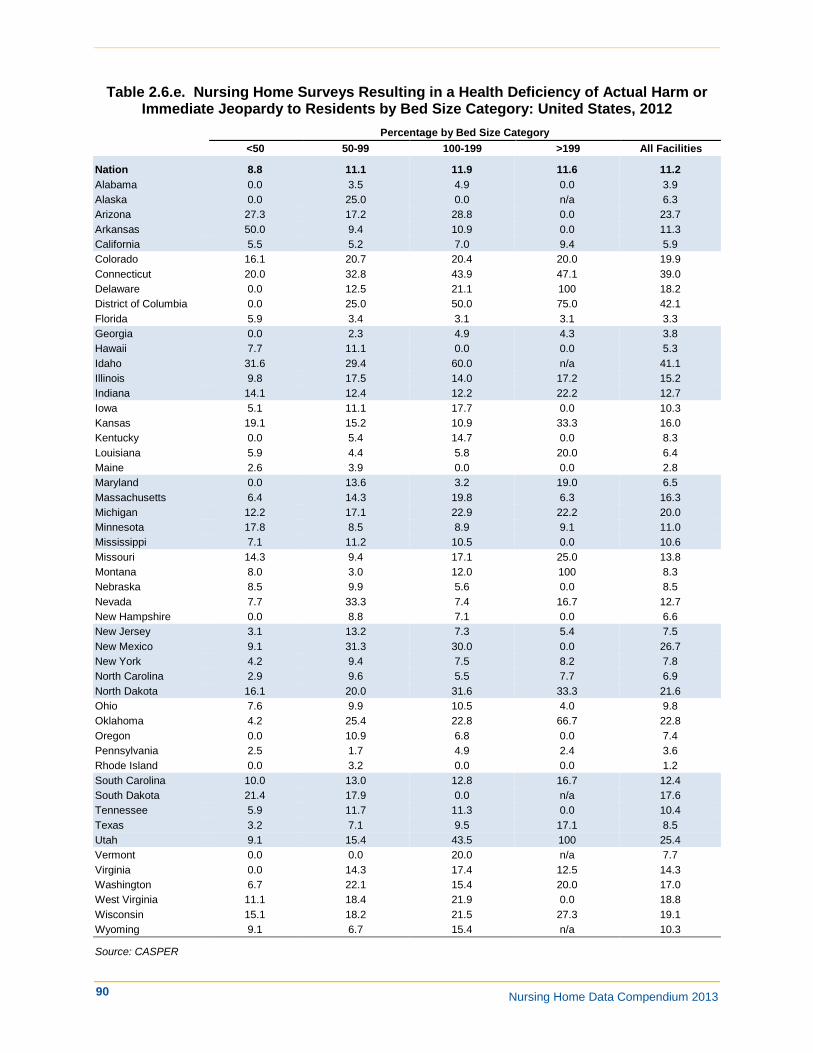
Table 2.6.e. Nursing Home Surveys Resulting in a Health Deficiency of Actual Harm or Immediate Jeopardy to Residents by Bed Size Category: United States, 2012
Percentage by Bed Size Category <50 50-99 100-199 >199 All Facilities
Nation 8.8 11.1 11.9 11.6 11.2 Alabama 0.0 3.5 4.9 0.0 3.9 Alaska 0.0 25.0 0.0 n/a 6.3 Arizona 27.3 17.2 28.8 0.0 23.7 Arkansas 50.0 9.4 10.9 0.0 11.3 California 5.5 5.2 7.0 9.4 5.9 Colorado 16.1 20.7 20.4 20.0 19.9 Connecticut 20.0 32.8 43.9 47.1 39.0 Delaware 0.0 12.5 21.1 100 18.2 District of Columbia 0.0 25.0 50.0 75.0 42.1 Florida 5.9 3.4 3.1 3.1 3.3 Georgia 0.0 2.3 4.9 4.3 3.8 Hawaii 7.7 11.1 0.0 0.0 5.3 Idaho 31.6 29.4 60.0 n/a 41.1 Illinois 9.8 17.5 14.0 17.2 15.2 Indiana 14.1 12.4 12.2 22.2 12.7 Iowa 5.1 11.1 17.7 0.0 10.3 Kansas 19.1 15.2 10.9 33.3 16.0 Kentucky 0.0 5.4 14.7 0.0 8.3 Louisiana 5.9 4.4 5.8 20.0 6.4 Maine 2.6 3.9 0.0 0.0 2.8 Maryland 0.0 13.6 3.2 19.0 6.5 Massachusetts 6.4 14.3 19.8 6.3 16.3 Michigan 12.2 17.1 22.9 22.2 20.0 Minnesota 17.8 8.5 8.9 9.1 11.0 Mississippi 7.1 11.2 10.5 0.0 10.6 Missouri 14.3 9.4 17.1 25.0 13.8 Montana 8.0 3.0 12.0 100 8.3 Nebraska 8.5 9.9 5.6 0.0 8.5 Nevada 7.7 33.3 7.4 16.7 12.7 New Hampshire 0.0 8.8 7.1 0.0 6.6 New Jersey 3.1 13.2 7.3 5.4 7.5 New Mexico 9.1 31.3 30.0 0.0 26.7 New York 4.2 9.4 7.5 8.2 7.8 North Carolina 2.9 9.6 5.5 7.7 6.9 North Dakota 16.1 20.0 31.6 33.3 21.6 Ohio 7.6 9.9 10.5 4.0 9.8 Oklahoma 4.2 25.4 22.8 66.7 22.8 Oregon 0.0 10.9 6.8 0.0 7.4 Pennsylvania 2.5 1.7 4.9 2.4 3.6 Rhode Island 0.0 3.2 0.0 0.0 1.2 South Carolina 10.0 13.0 12.8 16.7 12.4 South Dakota 21.4 17.9 0.0 n/a 17.6 Tennessee 5.9 11.7 11.3 0.0 10.4 Texas 3.2 7.1 9.5 17.1 8.5 Utah 9.1 15.4 43.5 100 25.4 Vermont 0.0 0.0 20.0 n/a 7.7 Virginia 0.0 14.3 17.4 12.5 14.3 Washington 6.7 22.1 15.4 20.0 17.0 West Virginia 11.1 18.4 21.9 0.0 18.8 Wisconsin 15.1 18.2 21.5 27.3 19.1 Wyoming 9.1 6.7 15.4 n/a 10.3
Source: CASPER
90 Nursing Home Data Compendium 2013

Table 2.6.f. Nursing Home Surveys Resulting in a Health Deficiency of Actual Harm or Immediate Jeopardy to Residents by Bed Size Category:
United States (2008, 2012 and Change)
Percentage in 2008, 2012 and Percent Change (% Δ), by Bed Size Category <50 50-99 100-199 >199 All Facilities
2008 2012 % Δ 2008 2012 % Δ 2008 2012 % Δ 2008 2012 % Δ 2008 2012 % Δ Nation 10.9 8.8 -19.6 15.9 11.1 -30.1 18.2 11.9 -34.6 22.5 11.6 -48.6 16.6 11.2 -32.7 Alabama 0.0 0.0 n/a 9.5 3.5 -63.2 11.5 4.9 -57.0 11.1 0.0 -100 10.2 3.9 -61.6 Alaska 11.1 0.0 -100 33.3 25.0 -25.0 n/a 0.0 n/a 0.0 n/a n/a 15.4 6.3 -59.4 Arizona 6.7 27.3 +309 25.0 17.2 -31.0 20.8 28.8 +38.2 27.3 0.0 -100 20.9 23.7 +13.3 Arkansas 10.0 50.0 +400 15.9 9.4 -40.8 9.3 10.9 +18.1 0.0 0.0 n/a 11.7 11.3 -3.0 California 8.7 5.5 -36.9 10.1 5.2 -48.2 17.8 7.0 -60.9 19.6 9.4 -51.9 12.2 5.9 -51.7 Colorado 11.4 16.1 +41.1 28.7 20.7 -28.0 40.7 20.4 -49.9 33.3 20.0 -40.0 30.6 19.9 -34.8 Connecticut 6.3 20.0 +220 19.7 32.8 +66.4 35.4 43.9 +24.0 40.9 47.1 +15.0 29.1 39.0 +33.9 Delaware 0.0 0.0 n/a 33.3 12.5 -62.5 23.3 21.1 -9.8 100 100 0.0 22.4 18.2 -19.0 District of Columbia 0.0 0.0 n/a 20.0 25.0 +25.0 25.0 50.0 +100 40.0 75.0 +87.5 23.5 42.1 +78.9 Florida 2.5 5.9 +135 5.5 3.4 -39.0 5.4 3.1 -42.6 3.2 3.1 -3.1 5.1 3.3 -36.0 Georgia 11.1 0.0 -100 18.0 2.3 -87.2 17.4 4.9 -71.6 32.0 4.3 -86.4 18.1 3.8 -78.9 Hawaii 10.0 7.7 -23.1 8.3 11.1 +33.3 26.7 0.0 -100 33.3 0.0 -100 16.0 5.3 -67.1 Idaho 16.7 31.6 +89.5 19.0 29.4 +54.4 48.0 60.0 +25.0 n/a n/a n/a 29.7 41.1 +38.3 Illinois 9.1 9.8 +7.6 24.5 17.5 -28.7 26.0 14.0 -46.1 36.8 17.2 -53.3 25.1 15.2 -39.3 Indiana 16.9 14.1 -16.6 28.4 12.4 -56.2 31.0 12.2 -60.6 72.7 22.2 -69.4 28.3 12.7 -55.1 Iowa 6.0 5.1 -15.7 14.0 11.1 -21.0 33.3 17.7 -46.8 0.0 0.0 n/a 14.3 10.3 -28.0 Kansas 27.0 19.1 -29.1 25.9 15.2 -41.3 16.3 10.9 -33.4 0.0 33.3 n/a 24.7 16.0 -35.2 Kentucky 4.3 0.0 -100 13.9 5.4 -61.2 14.4 14.7 +2.1 20.0 0.0 -100 12.7 8.3 -34.5 Louisiana 8.3 5.9 -29.4 7.1 4.4 -37.8 15.5 5.8 -62.5 27.8 20.0 -28.0 14.4 6.4 -56.0 Maine 9.3 2.6 -71.7 7.0 3.9 -44.1 0.0 0.0 n/a 0.0 0.0 n/a 7.1 2.8 -60.4 Maryland 4.2 0.0 -100 12.2 13.6 +11.4 16.9 3.2 -81.0 10.5 19.0 +81.0 13.8 6.5 -53.3 Massachusetts 3.2 6.4 +97.9 9.8 14.3 +45.5 21.8 19.8 -9.3 42.9 6.3 -85.4 16.9 16.3 -3.2 Michigan 22.5 12.2 -45.6 19.7 17.1 -13.2 26.2 22.9 -12.7 23.3 22.2 -4.8 23.6 20.0 -15.3 Minnesota 20.3 17.8 -12.1 16.7 8.5 -48.7 16.5 8.9 -46.3 23.1 9.1 -60.6 17.6 11.0 -37.2 Mississippi 10.5 7.1 -32.1 19.8 11.2 -43.3 28.6 10.5 -63.2 0.0 0.0 n/a 22.1 10.6 -52.2 Missouri 15.6 14.3 -8.2 16.2 9.4 -42.0 27.1 17.1 -37.0 15.0 25.0 +66.7 20.9 13.8 -34.0 Montana 16.1 8.0 -50.4 10.0 3.0 -69.7 30.4 12.0 -60.6 0.0 100 n/a 17.6 8.3 -52.8 Nebraska 15.2 8.5 -44.2 17.3 9.9 -42.7 23.9 5.6 -76.8 20.0 0.0 -100 17.9 8.5 -52.5 Nevada 18.2 7.7 -57.7 22.2 33.3 +50.0 8.7 7.4 -14.8 16.7 16.7 0.0 14.3 12.7 -10.9 New Hampshire 0.0 0.0 n/a 18.4 8.8 -52.1 29.0 7.1 -75.4 0.0 0.0 n/a 18.6 6.6 -64.6 New Jersey 8.6 3.1 -63.5 8.5 13.2 +55.8 14.7 7.3 -50.6 21.7 5.4 -75.3 14.3 7.5 -47.6 New Mexico 22.2 9.1 -59.1 40.7 31.3 -23.3 35.5 30.0 -15.5 50.0 0.0 -100 36.2 26.7 -26.4 New York 2.1 4.2 +95.8 8.7 9.4 +8.3 13.2 7.5 -43.3 15.2 8.2 -46.2 12.4 7.8 -37.4 North Carolina 4.1 2.9 -30.0 11.0 9.6 -12.9 7.6 5.5 -27.5 16.7 7.7 -53.8 8.7 6.9 -21.1 North Dakota 10.3 16.1 +55.9 16.7 20.0 +20.0 20.0 31.6 +57.9 0.0 33.3 n/a 14.8 21.6 +45.7 Ohio 9.9 7.6 -23.6 14.2 9.9 -30.4 15.8 10.5 -33.2 20.8 4.0 -80.8 14.5 9.8 -32.9 Oklahoma 25.8 4.2 -83.9 23.2 25.4 +9.4 30.9 22.8 -26.1 66.7 66.7 0.0 27.3 22.8 -16.4 Oregon 4.5 0.0 -100 14.5 10.9 -24.8 25.5 6.8 -73.3 50.0 0.0 -100 17.3 7.4 -57.0 Pennsylvania 8.2 2.5 -69.8 7.2 1.7 -76.3 15.3 4.9 -67.6 20.5 2.4 -88.1 13.0 3.6 -72.3 Rhode Island 0.0 0.0 n/a 9.1 3.2 -64.5 10.3 0.0 -100 0.0 0.0 n/a 8.0 1.2 -84.8 South Carolina 5.7 10.0 +75.0 9.1 13.0 +42.6 13.2 12.8 -2.8 20.0 16.7 -16.7 10.5 12.4 +17.5 South Dakota 25.0 21.4 -14.3 18.9 17.9 -5.4 20.0 0.0 -100 n/a n/a n/a 21.8 17.6 -19.5 Tennessee 12.9 5.9 -54.4 18.1 11.7 -35.5 16.1 11.3 -29.9 16.7 0.0 -100 16.4 10.4 -36.8 Texas 3.0 3.2 +6.4 10.2 7.1 -31.0 12.8 9.5 -25.8 17.6 17.1 -2.9 11.3 8.5 -24.7 Utah 8.0 9.1 +13.6 10.3 15.4 +48.7 18.2 43.5 +139 0.0 100 n/a 12.5 25.4 +103 Vermont 9.1 0.0 -100 9.1 0.0 -100 0.0 20.0 n/a n/a n/a n/a 5.4 7.7 +42.3 Virginia 3.1 0.0 -100 16.7 14.3 -14.3 16.3 17.4 +6.4 33.3 12.5 -62.5 15.8 14.3 -9.3 Washington 5.1 6.7 +30.0 23.2 22.1 -4.6 21.7 15.4 -29.1 50.0 20.0 -60.0 20.1 17.0 -15.4 West Virginia 4.3 11.1 +156 12.5 18.4 +47.4 14.6 21.9 +49.5 0.0 0.0 n/a 11.6 18.8 +62.1 Wisconsin 20.8 15.1 -27.3 25.6 18.2 -28.9 31.0 21.5 -30.7 33.3 27.3 -18.2 27.1 19.1 -29.4 Wyoming 27.3 9.1 -66.7 20.0 6.7 -66.7 35.7 15.4 -56.9 n/a n/a n/a 27.5 10.3 -62.7 Source: CASPER
Nursing Home Data Compendium 2013 91

Table 2.7.a. Nursing Home Surveys Resulting in a Health Deficiency of Actual Harm or Immediate Jeopardy to Residents by Ownership Type: United States, 2008
Percentage by Ownership Type
For-Profit Non-Profit Government All Facilities Nation 17.1 14.8 19.2 16.6 Alabama 8.4 21.2 11.1 10.2 Alaska 33.3 0.0 20.0 15.4 Arizona 23.0 6.5 100 20.9 Arkansas 11.9 10.8 10.0 11.7 California 13.7 4.5 14.9 12.2 Colorado 36.6 18.4 18.2 30.6 Connecticut 31.4 21.6 0.0 29.1 Delaware 20.0 15.8 60.0 22.4 District of Columbia 50.0 11.1 0.0 23.5 Florida 4.7 6.1 7.7 5.1 Georgia 15.8 19.8 34.8 18.1 Hawaii 12.0 25.0 15.4 16.0 Idaho 27.3 22.2 45.5 29.7 Illinois 26.8 18.6 42.3 25.1 Indiana 31.3 21.7 24.1 28.3 Iowa 15.4 14.1 4.8 14.3 Kansas 19.4 28.8 31.8 24.7 Kentucky 13.5 11.4 0.0 12.7 Louisiana 16.8 9.3 0.0 14.4 Maine 6.3 9.7 0.0 7.1 Maryland 16.1 10.6 0.0 13.8 Massachusetts 16.6 17.9 12.5 16.9 Michigan 24.6 21.2 22.2 23.6 Minnesota 17.3 18.8 10.5 17.6 Mississippi 20.5 27.5 22.2 22.1 Missouri 20.7 21.1 22.5 20.9 Montana 23.7 12.1 14.3 17.6 Nebraska 18.8 15.1 20.0 17.9 Nevada 14.3 12.5 16.7 14.3 New Hampshire 19.0 9.7 38.5 18.6 New Jersey 12.9 15.5 25.0 14.3 New Mexico 39.1 33.3 20.0 36.2 New York 13.2 11.2 14.0 12.4 North Carolina 8.3 8.8 18.2 8.7 North Dakota 25.0 13.7 25.0 14.8 Ohio 14.4 14.9 16.0 14.5 Oklahoma 26.6 32.3 30.8 27.3 Oregon 17.8 10.5 28.6 17.3 Pennsylvania 16.4 8.8 16.7 13.0 Rhode Island 10.0 0.0 n/a 8.0 South Carolina 9.9 9.1 16.7 10.5 South Dakota 14.6 26.4 16.7 21.8 Tennessee 17.2 16.9 5.6 16.4 Texas 12.2 7.0 3.0 11.3 Utah 12.5 15.4 0.0 12.5 Vermont 4.0 9.1 0.0 5.4 Virginia 18.3 10.4 11.1 15.8 Washington 21.5 17.0 15.8 20.1 West Virginia 12.3 13.8 0.0 11.6 Wisconsin 29.6 23.2 27.6 27.1 Wyoming 47.1 12.5 13.3 27.5
Source: CASPER
92 Nursing Home Data Compendium 2013

Table 2.7.b. Nursing Home Surveys Resulting in a Health Deficiency of Actual Harm or Immediate Jeopardy to Residents by Ownership Type: United States, 2009
Percentage by Ownership Type For-Profit Non-Profit Government All Facilities
Nation 14.9 12.2 14.8 14.2 Alabama 2.3 2.9 0.0 2.3 Alaska 0.0 14.3 0.0 5.9 Arizona 23.9 8.7 33.3 21.2 Arkansas 12.5 16.7 20.0 13.3 California 11.1 4.3 4.7 9.8 Colorado 30.0 30.4 9.5 28.1 Connecticut 28.4 11.1 0.0 24.8 Delaware 29.2 35.7 40.0 32.6 District of Columbia 40.0 0.0 0.0 19.0 Florida 4.8 1.7 9.1 4.0 Georgia 9.0 7.5 21.7 9.4 Hawaii 0.0 8.3 0.0 2.1 Idaho 32.6 46.2 28.6 34.2 Illinois 25.3 18.8 16.7 23.2 Indiana 22.8 16.8 13.5 20.6 Iowa 8.8 12.1 9.5 10.2 Kansas 22.6 20.6 31.6 23.0 Kentucky 11.6 4.8 0.0 9.5 Louisiana 12.7 14.5 6.3 12.7 Maine 1.4 6.7 0.0 2.9 Maryland 8.7 10.8 0.0 9.1 Massachusetts 13.3 10.1 14.3 12.4 Michigan 23.4 17.1 28.2 22.4 Minnesota 16.7 12.6 11.9 13.6 Mississippi 7.1 11.4 3.4 7.3 Missouri 20.3 13.1 22.5 18.8 Montana 7.0 15.4 17.6 12.1 Nebraska 8.7 9.2 8.0 8.7 Nevada 24.3 42.9 16.7 26.0 New Hampshire 7.0 11.1 0.0 7.3 New Jersey 18.4 13.4 28.6 17.6 New Mexico 22.9 16.7 0.0 19.4 New York 10.3 10.2 28.6 11.6 North Carolina 8.0 3.3 0.0 6.8 North Dakota 0.0 12.2 0.0 11.1 Ohio 15.4 11.6 20.0 14.7 Oklahoma 24.5 28.9 27.3 25.2 Oregon 18.6 5.3 0.0 15.8 Pennsylvania 14.3 12.0 11.6 13.2 Rhode Island 13.4 11.1 n/a 12.9 South Carolina 8.5 3.2 17.6 8.5 South Dakota 24.3 20.0 0.0 20.5 Tennessee 11.4 10.7 0.0 10.7 Texas 10.7 8.2 3.2 10.2 Utah 12.3 0.0 0.0 10.4 Vermont 3.7 10.0 0.0 5.3 Virginia 16.4 13.0 9.1 15.1 Washington 19.7 4.4 18.8 16.8 West Virginia 14.1 17.2 8.3 14.3 Wisconsin 29.2 23.9 23.1 26.6 Wyoming 0.0 50.0 15.8 13.9
Source: CASPER
Nursing Home Data Compendium 2013 93

Table 2.7.c. Nursing Home Surveys Resulting in a Health Deficiency of Actual Harm or Immediate Jeopardy to Residents by Ownership Type: United States, 2010
Percentage by Ownership Type
For-Profit Non-Profit Government All Facilities
Nation 13.1 11.2 13.4 12.6 Alabama 4.3 9.7 6.3 5.2 Alaska 0.0 20.0 42.9 26.7 Arizona 13.8 4.5 0.0 11.7 Arkansas 13.1 11.8 22.2 13.2 California 8.2 7.1 2.3 7.8 Colorado 33.3 24.3 37.5 32.0 Connecticut 28.0 18.6 0.0 25.8 Delaware 18.2 38.5 50.0 30.8 District of Columbia 55.6 50.0 0.0 47.4 Florida 4.6 2.9 0.0 4.0 Georgia 10.2 13.5 30.8 12.2 Hawaii 11.1 7.7 16.7 10.8 Idaho 22.2 20.0 38.5 24.7 Illinois 22.6 20.0 27.6 22.1 Indiana 19.3 12.7 8.5 16.7 Iowa 10.9 7.8 5.6 9.4 Kansas 23.3 19.8 26.8 22.6 Kentucky 6.8 8.6 0.0 7.1 Louisiana 9.1 11.4 0.0 9.0 Maine 4.3 6.5 0.0 4.9 Maryland 7.6 7.7 0.0 7.4 Massachusetts 14.3 11.8 0.0 13.5 Michigan 25.5 10.0 10.8 20.6 Minnesota 12.9 11.6 17.8 12.7 Mississippi 8.3 12.5 3.6 7.9 Missouri 14.2 13.7 10.0 13.8 Montana 16.7 9.7 6.7 12.2 Nebraska 8.8 12.3 10.6 10.3 Nevada 16.2 0.0 0.0 12.0 New Hampshire 17.1 3.7 45.5 16.4 New Jersey 14.2 9.6 10.5 12.8 New Mexico 14.6 37.5 25.0 20.6 New York 11.2 8.8 7.5 10.0 North Carolina 7.8 5.7 0.0 7.1 North Dakota 0.0 7.8 0.0 7.0 Ohio 11.6 9.4 5.0 11.0 Oklahoma 20.1 18.2 27.3 20.1 Oregon 11.5 5.3 25.0 11.0 Pennsylvania 15.3 10.3 8.3 12.7 Rhode Island 5.6 0.0 n/a 4.5 South Carolina 7.0 7.1 7.7 7.1 South Dakota 12.5 13.2 0.0 12.4 Tennessee 5.8 14.3 0.0 7.1 Texas 9.2 7.6 16.1 9.2 Utah 9.2 7.7 66.7 10.9 Vermont 7.7 6.7 0.0 7.1 Virginia 12.2 9.5 33.3 12.3 Washington 19.0 15.9 7.1 17.7 West Virginia 32.3 18.2 33.3 29.2 Wisconsin 26.6 16.9 13.0 21.3 Wyoming 35.7 33.3 15.4 27.3
Source: CASPER
94 Nursing Home Data Compendium 2013

Table 2.7.d. Nursing Home Surveys Resulting in a Health Deficiency of Actual Harm or Immediate Jeopardy to Residents by Ownership Type: United States, 2011
Percentage by Ownership Type
For-Profit Non-Profit Government All Facilities Nation 12.9 10.9 14.6 12.5 Alabama 4.9 5.9 0.0 4.7 Alaska 0.0 0.0 40.0 12.5 Arizona 21.2 12.0 0.0 19.1 Arkansas 9.5 12.1 11.1 10.0 California 8.0 3.9 0.0 7.1 Colorado 27.5 23.1 38.5 27.7 Connecticut 28.3 23.4 100 27.6 Delaware 9.5 7.1 25.0 10.3 District of Columbia 50.0 36.4 n/a 42.1 Florida 5.3 3.4 7.1 4.8 Georgia 9.0 10.0 18.8 10.0 Hawaii 0.0 10.0 37.5 11.8 Idaho 38.0 18.2 64.3 40.0 Illinois 23.4 18.3 23.3 22.2 Indiana 16.9 16.5 14.8 16.6 Iowa 11.0 10.9 18.8 11.3 Kansas 25.6 22.2 14.6 23.0 Kentucky 8.0 10.3 25.0 8.9 Louisiana 9.2 15.9 25.0 10.9 Maine 4.6 0.0 0.0 3.2 Maryland 4.5 1.7 0.0 3.7 Massachusetts 14.2 12.1 0.0 13.5 Michigan 29.3 21.2 7.7 25.6 Minnesota 14.3 12.0 13.5 12.8 Mississippi 5.8 0.0 28.0 8.1 Missouri 14.4 13.7 13.9 14.3 Montana 13.5 0.0 12.5 8.3 Nebraska 10.6 11.9 2.2 9.0 Nevada 25.0 16.7 0.0 21.6 New Hampshire 11.9 4.3 0.0 7.7 New Jersey 9.4 10.6 25.0 10.5 New Mexico 24.4 16.7 80.0 27.4 New York 6.0 5.9 21.3 7.0 North Carolina 7.5 7.9 0.0 7.4 North Dakota 0.0 14.6 33.3 14.6 Ohio 9.0 5.3 5.6 8.2 Oklahoma 24.2 35.9 12.5 25.4 Oregon 11.7 21.4 0.0 12.6 Pennsylvania 10.2 5.5 2.5 7.8 Rhode Island 2.7 0.0 n/a 2.2 South Carolina 10.2 3.3 7.1 8.8 South Dakota 16.7 15.4 14.3 15.8 Tennessee 15.9 9.4 21.4 15.0 Texas 9.3 4.6 8.8 8.7 Utah 31.0 25.0 0.0 28.2 Vermont 6.5 0.0 0.0 4.4 Virginia 10.0 18.3 18.2 12.6 Washington 23.2 6.3 30.8 20.1 West Virginia 39.4 28.6 20.0 33.9 Wisconsin 16.3 16.9 11.5 15.9 Wyoming 12.5 28.6 17.6 17.5
Source: CASPER
Nursing Home Data Compendium 2013 95

Table 2.7.e. Nursing Home Surveys Resulting in a Health Deficiency of Actual Harm or Immediate Jeopardy to Residents by Ownership Type: United States, 2012
Percentage by Ownership Type
For-Profit Non-Profit Government All Facilities Nation 11.4 10.5 11.4 11.2 Alabama 3.7 7.1 0.0 3.9 Alaska 100 0.0 0.0 6.3 Arizona 25.3 17.6 0.0 23.7 Arkansas 9.4 16.1 30.0 11.3 California 6.4 3.2 7.1 5.9 Colorado 19.2 17.1 31.6 19.9 Connecticut 38.1 42.9 33.3 39.0 Delaware 17.4 0.0 66.7 18.2 District of Columbia 44.4 40.0 n/a 42.1 Florida 3.2 3.1 7.1 3.3 Georgia 3.5 4.0 7.1 3.8 Hawaii 5.6 7.7 0.0 5.3 Idaho 39.5 33.3 55.6 41.1 Illinois 13.9 15.3 41.4 15.2 Indiana 12.5 14.4 11.0 12.7 Iowa 10.4 10.7 5.6 10.3 Kansas 20.0 13.9 3.3 16.0 Kentucky 8.5 6.7 20.0 8.3 Louisiana 5.7 7.1 15.4 6.4 Maine 4.0 0.0 0.0 2.8 Maryland 7.4 4.8 0.0 6.5 Massachusetts 18.5 10.7 25.0 16.3 Michigan 21.2 17.1 17.9 20.0 Minnesota 14.7 10.5 2.7 11.0 Mississippi 11.1 21.1 0.0 10.6 Missouri 14.6 10.8 13.3 13.8 Montana 10.8 6.1 7.1 8.3 Nebraska 7.4 9.6 9.8 8.5 Nevada 14.3 0.0 16.7 12.7 New Hampshire 9.5 4.8 0.0 6.6 New Jersey 6.2 9.4 15.8 7.5 New Mexico 25.9 25.0 40.0 26.7 New York 5.8 9.6 11.9 7.8 North Carolina 7.7 4.6 0.0 6.9 North Dakota 0.0 22.9 0.0 21.6 Ohio 9.8 9.8 6.7 9.8 Oklahoma 24.8 16.7 0.0 22.8 Oregon 9.0 0.0 0.0 7.4 Pennsylvania 2.9 3.9 7.7 3.6 Rhode Island 1.5 0.0 n/a 1.2 South Carolina 13.5 9.1 8.3 12.4 South Dakota 11.1 20.9 20.0 17.6 Tennessee 12.0 6.3 0.0 10.4 Texas 9.2 4.7 0.0 8.5 Utah 27.5 16.7 0.0 25.4 Vermont 3.8 8.3 100 7.7 Virginia 14.5 16.0 0.0 14.3 Washington 18.8 12.5 8.3 17.0 West Virginia 22.6 8.3 0.0 18.8 Wisconsin 18.1 21.8 16.7 19.1 Wyoming 6.3 0.0 17.6 10.3
Source: CASPER
96 Nursing Home Data Compendium 2013

Table 2.7.f. Nursing Home Surveys Resulting in a Health Deficiency of Actual Harm or Immediate Jeopardy to Residents by Ownership Type:
United States (2008, 2012 and Change) Percentage in 2008, 2012 and Percent Change (% Δ), by Ownership Type
For-Profit Non-Profit Government All Facilities 2008 2012 % Δ 2008 2012 % Δ 2008 2012 % Δ 2008 2012 % Δ
Nation 17.1 11.4 -33.3 14.8 10.5 -28.9 19.2 11.4 -40.7 16.6 11.2 -32.7 Alabama 8.4 3.7 -55.3 21.2 7.1 -66.3 11.1 0.0 -100 10.2 3.9 -61.6 Alaska 33.3 100 +200 0.0 0.0 n/a 20.0 0.0 -100 15.4 6.3 -59.4 Arizona 23.0 25.3 +9.8 6.5 17.6 +174 100 0.0 -100 20.9 23.7 +13.3 Arkansas 11.9 9.4 -20.4 10.8 16.1 +49.2 10.0 30.0 +200 11.7 11.3 -3.0 California 13.7 6.4 -53.6 4.5 3.2 -29.1 14.9 7.1 -52.0 12.2 5.9 -51.7 Colorado 36.6 19.2 -47.6 18.4 17.1 -6.7 18.2 31.6 +73.7 30.6 19.9 -34.8 Connecticut 31.4 38.1 +21.3 21.6 42.9 +98.7 0.0 33.3 n/a 29.1 39.0 +33.9 Delaware 20.0 17.4 -13.0 15.8 0.0 -100 60.0 66.7 +11.1 22.4 18.2 -19.0 District of Columbia 50.0 44.4 -11.1 11.1 40.0 +260 0.0 n/a n/a 23.5 42.1 +78.9 Florida 4.7 3.2 -31.0 6.1 3.1 -49.8 7.7 7.1 -7.1 5.1 3.3 -36.0 Georgia 15.8 3.5 -78.1 19.8 4.0 -79.8 34.8 7.1 -79.5 18.1 3.8 -78.9 Hawaii 12.0 5.6 -53.7 25.0 7.7 -69.2 15.4 0.0 -100 16.0 5.3 -67.1 Idaho 27.3 39.5 +44.7 22.2 33.3 +50.0 45.5 55.6 +22.2 29.7 41.1 +38.3 Illinois 26.8 13.9 -48.1 18.6 15.3 -17.6 42.3 41.4 -2.2 25.1 15.2 -39.3 Indiana 31.3 12.5 -59.9 21.7 14.4 -33.7 24.1 11.0 -54.5 28.3 12.7 -55.1 Iowa 15.4 10.4 -32.3 14.1 10.7 -24.6 4.8 5.6 +16.7 14.3 10.3 -28.0 Kansas 19.4 20.0 +3.2 28.8 13.9 -51.8 31.8 3.3 -89.5 24.7 16.0 -35.2 Kentucky 13.5 8.5 -36.8 11.4 6.7 -41.5 0.0 20.0 n/a 12.7 8.3 -34.5 Louisiana 16.8 5.7 -66.1 9.3 7.1 -22.9 0.0 15.4 n/a 14.4 6.4 -56.0 Maine 6.3 4.0 -36.0 9.7 0.0 -100 0.0 0.0 n/a 7.1 2.8 -60.4 Maryland 16.1 7.4 -54.0 10.6 4.8 -55.1 0.0 0.0 n/a 13.8 6.5 -53.3 Massachusetts 16.6 18.5 +11.4 17.9 10.7 -39.9 12.5 25.0 +100 16.9 16.3 -3.2 Michigan 24.6 21.2 -13.8 21.2 17.1 -19.1 22.2 17.9 -19.2 23.6 20.0 -15.3 Minnesota 17.3 14.7 -15.3 18.8 10.5 -43.9 10.5 2.7 -74.3 17.6 11.0 -37.2 Mississippi 20.5 11.1 -45.9 27.5 21.1 -23.4 22.2 0.0 -100 22.1 10.6 -52.2 Missouri 20.7 14.6 -29.2 21.1 10.8 -48.8 22.5 13.3 -40.7 20.9 13.8 -34.0 Montana 23.7 10.8 -54.4 12.1 6.1 -50.0 14.3 7.1 -50.0 17.6 8.3 -52.8 Nebraska 18.8 7.4 -60.7 15.1 9.6 -36.2 20.0 9.8 -51.2 17.9 8.5 -52.5 Nevada 14.3 14.3 0.0 12.5 0.0 -100 16.7 16.7 0.0 14.3 12.7 -10.9 New Hampshire 19.0 9.5 -50.0 9.7 4.8 -50.8 38.5 0.0 -100 18.6 6.6 -64.6 New Jersey 12.9 6.2 -52.0 15.5 9.4 -39.1 25.0 15.8 -36.8 14.3 7.5 -47.6 New Mexico 39.1 25.9 -33.7 33.3 25.0 -25.0 20.0 40.0 +100 36.2 26.7 -26.4 New York 13.2 5.8 -55.9 11.2 9.6 -14.2 14.0 11.9 -14.7 12.4 7.8 -37.4 North Carolina 8.3 7.7 -8.0 8.8 4.6 -47.9 18.2 0.0 -100 8.7 6.9 -21.1 North Dakota 25.0 0.0 -100 13.7 22.9 +67.1 25.0 0.0 -100 14.8 21.6 +45.7 Ohio 14.4 9.8 -31.6 14.9 9.8 -34.5 16.0 6.7 -58.3 14.5 9.8 -32.9 Oklahoma 26.6 24.8 -6.7 32.3 16.7 -48.3 30.8 0.0 -100 27.3 22.8 -16.4 Oregon 17.8 9.0 -49.3 10.5 0.0 -100 28.6 0.0 -100 17.3 7.4 -57.0 Pennsylvania 16.4 2.9 -82.2 8.8 3.9 -55.7 16.7 7.7 -53.8 13.0 3.6 -72.3 Rhode Island 10.0 1.5 -84.8 0.0 0.0 n/a n/a n/a n/a 8.0 1.2 -84.8 South Carolina 9.9 13.5 +35.8 9.1 9.1 0.0 16.7 8.3 -50.0 10.5 12.4 +17.5 South Dakota 14.6 11.1 -24.1 26.4 20.9 -20.8 16.7 20.0 +20.0 21.8 17.6 -19.5 Tennessee 17.2 12.0 -30.1 16.9 6.3 -63.1 5.6 0.0 -100 16.4 10.4 -36.8 Texas 12.2 9.2 -24.6 7.0 4.7 -33.6 3.0 0.0 -100 11.3 8.5 -24.7 Utah 12.5 27.5 +120 15.4 16.7 +8.3 0.0 0.0 n/a 12.5 25.4 +103 Vermont 4.0 3.8 -3.8 9.1 8.3 -8.3 0.0 100 n/a 5.4 7.7 +42.3 Virginia 18.3 14.5 -20.6 10.4 16.0 +54.0 11.1 0.0 -100 15.8 14.3 -9.3 Washington 21.5 18.8 -12.8 17.0 12.5 -26.4 15.8 8.3 -47.2 20.1 17.0 -15.4 West Virginia 12.3 22.6 +82.9 13.8 8.3 -39.6 0.0 0.0 n/a 11.6 18.8 +62.1 Wisconsin 29.6 18.1 -38.9 23.2 21.8 -6.0 27.6 16.7 -39.6 27.1 19.1 -29.4 Wyoming 47.1 6.3 -86.7 12.5 0.0 -100 13.3 17.6 +32.4 27.5 10.3 -62.7
Source: CASPER
Nursing Home Data Compendium 2013 97

Table 2.8.a. Nursing Home Surveys Resulting in a Health Deficiency of Immediate Jeopardy to Residents by Bed Size Category: United States, 2008
Percentage by Bed Size Category <50 50-99 100-199 >199 All Facilities
Nation 2.0 3.2 3.7 3.1 3.3 Alabama 0.0 0.0 3.1 0.0 1.6 Alaska 11.1 33.3 n/a 0.0 15.4 Arizona 6.7 5.6 8.3 0.0 6.7 Arkansas 10.0 5.6 3.7 0.0 4.6 California 4.1 4.1 6.6 3.9 4.7 Colorado 0.0 4.3 4.9 0.0 3.7 Connecticut 0.0 0.0 1.5 4.5 1.2 Delaware 0.0 0.0 0.0 0.0 0.0 District of Columbia 0.0 0.0 0.0 0.0 0.0 Florida 0.0 0.8 1.7 0.0 1.3 Georgia 7.4 1.8 2.6 0.0 2.5 Hawaii 0.0 0.0 6.7 0.0 2.0 Idaho 5.6 4.8 12.0 n/a 7.8 Illinois 1.0 3.7 3.4 5.6 3.5 Indiana 4.5 3.6 4.6 9.1 4.3 Iowa 0.0 0.0 3.5 0.0 0.5 Kansas 2.0 3.8 0.0 0.0 2.7 Kentucky 2.1 4.9 5.9 0.0 4.8 Louisiana 0.0 0.0 5.7 5.6 4.3 Maine 2.3 1.8 0.0 0.0 1.8 Maryland 0.0 6.1 4.2 0.0 3.8 Massachusetts 0.0 0.0 0.0 0.0 0.0 Michigan 5.0 2.8 4.0 6.7 3.9 Minnesota 5.4 3.8 3.9 7.7 4.3 Mississippi 0.0 6.6 16.7 0.0 9.9 Missouri 2.2 4.3 6.8 10.0 5.4 Montana 0.0 3.3 0.0 0.0 1.2 Nebraska 1.3 0.9 2.2 0.0 1.3 Nevada 0.0 0.0 0.0 0.0 0.0 New Hampshire 0.0 5.3 3.2 0.0 3.5 New Jersey 0.0 3.4 3.2 0.0 2.4 New Mexico 0.0 7.4 3.2 0.0 4.3 New York 0.0 1.9 3.5 2.0 2.5 North Carolina 2.0 1.2 2.2 8.3 2.0 North Dakota 0.0 0.0 5.0 0.0 1.2 Ohio 0.0 1.6 2.1 0.0 1.6 Oklahoma 6.5 5.8 9.8 16.7 7.6 Oregon 0.0 4.8 4.3 0.0 3.8 Pennsylvania 0.0 1.1 0.3 2.4 0.7 Rhode Island 0.0 0.0 0.0 0.0 0.0 South Carolina 2.9 1.8 5.3 20.0 4.1 South Dakota 0.0 0.0 0.0 n/a 0.0 Tennessee 3.2 11.7 3.9 0.0 6.0 Texas 2.0 4.5 4.8 5.9 4.5 Utah 0.0 3.4 0.0 0.0 1.1 Vermont 0.0 0.0 0.0 n/a 0.0 Virginia 0.0 3.6 2.1 0.0 2.2 Washington 0.0 2.1 1.9 0.0 1.6 West Virginia 0.0 3.6 2.4 0.0 2.5 Wisconsin 7.5 5.0 9.2 16.7 7.1 Wyoming 18.2 6.7 0.0 n/a 7.5
Source: CASPER
98 Nursing Home Data Compendium 2013

Table 2.8.b. Nursing Home Surveys Resulting in a Health Deficiency of Immediate Jeopardy to Residents by Bed Size Category: United States, 2009
Percentage by Bed Size Category <50 50-99 100-199 >199 All Facilities
Nation 1.3 2.3 3.2 3.2 2.6 Alabama 0.0 1.2 0.9 0.0 0.9 Alaska 0.0 0.0 n/a 100 5.9 Arizona 0.0 2.7 3.2 0.0 2.5 Arkansas 0.0 3.4 3.6 0.0 3.3 California 0.5 1.9 3.0 7.3 2.1 Colorado 2.9 2.4 1.1 0.0 1.8 Connecticut 0.0 0.0 1.5 6.3 1.3 Delaware 0.0 0.0 0.0 0.0 0.0 District of Columbia 0.0 0.0 0.0 0.0 0.0 Florida 0.0 0.0 1.1 0.0 0.7 Georgia 0.0 3.8 1.6 4.0 2.4 Hawaii 0.0 0.0 0.0 0.0 0.0 Idaho 8.3 0.0 4.3 n/a 4.1 Illinois 0.0 1.5 3.5 5.1 2.6 Indiana 1.3 2.3 2.2 0.0 2.1 Iowa 0.0 0.0 0.0 0.0 0.0 Kansas 0.0 4.6 2.4 0.0 2.8 Kentucky 2.2 2.1 3.1 0.0 2.5 Louisiana 9.1 0.0 2.9 6.3 3.2 Maine 0.0 0.0 0.0 0.0 0.0 Maryland 0.0 0.0 2.3 0.0 1.3 Massachusetts 0.0 0.0 0.0 0.0 0.0 Michigan 0.0 3.9 4.6 0.0 3.7 Minnesota 1.3 2.0 6.8 0.0 3.0 Mississippi 0.0 1.0 2.4 0.0 1.5 Missouri 0.0 2.2 7.2 0.0 4.3 Montana 2.9 0.0 3.4 0.0 2.0 Nebraska 0.0 1.1 0.0 0.0 0.5 Nevada 0.0 0.0 4.5 14.3 4.0 New Hampshire 0.0 0.0 0.0 0.0 0.0 New Jersey 7.1 3.3 8.0 5.4 6.7 New Mexico 10.0 3.6 12.9 0.0 8.3 New York 0.0 2.8 3.7 3.6 3.3 North Carolina 0.0 0.0 2.3 7.1 1.5 North Dakota 0.0 3.2 0.0 0.0 1.2 Ohio 1.0 1.7 0.8 0.0 1.2 Oklahoma 6.3 11.8 10.4 0.0 10.6 Oregon 4.8 3.3 3.6 0.0 3.6 Pennsylvania 2.1 0.0 0.3 0.0 0.4 Rhode Island 7.7 0.0 5.3 0.0 3.5 South Carolina 4.5 2.0 6.5 0.0 4.5 South Dakota 2.0 0.0 9.1 n/a 1.8 Tennessee 0.0 3.8 4.6 5.9 4.1 Texas 3.4 3.4 4.4 5.1 4.0 Utah 0.0 4.2 0.0 0.0 1.3 Vermont 0.0 9.1 0.0 n/a 2.6 Virginia 0.0 1.2 2.9 0.0 1.9 Washington 0.0 2.9 1.0 0.0 1.6 West Virginia 0.0 1.6 0.0 0.0 0.8 Wisconsin 2.3 6.9 10.5 8.3 7.6 Wyoming 9.1 0.0 9.1 n/a 5.6
Source: CASPER
Nursing Home Data Compendium 2013 99

Table 2.8.c. Nursing Home Surveys Resulting in a Health Deficiency of Immediate Jeopardy to Residents by Bed Size Category: United States, 2010
Percentage by Bed Size Category <50 50-99 100-199 >199 All Facilities
Nation 2.1 2.8 3.0 3.0 2.8 Alabama 0.0 1.1 3.3 6.3 2.6 Alaska 30.0 25.0 0.0 n/a 26.7 Arizona 0.0 0.0 1.6 0.0 0.9 Arkansas 0.0 11.7 8.7 50.0 9.9 California 3.4 3.2 2.4 2.1 3.0 Colorado 3.8 1.3 3.4 33.3 3.6 Connecticut 6.7 0.0 3.2 0.0 2.3 Delaware 0.0 0.0 0.0 0.0 0.0 District of Columbia 0.0 0.0 16.7 0.0 5.3 Florida 0.0 0.8 1.9 0.0 1.5 Georgia 0.0 3.2 5.6 0.0 4.0 Hawaii 0.0 0.0 9.1 0.0 2.7 Idaho 0.0 0.0 3.7 n/a 1.3 Illinois 4.3 3.1 4.5 5.4 4.2 Indiana 2.5 3.0 2.4 0.0 2.6 Iowa 0.0 0.0 2.9 0.0 0.5 Kansas 2.2 2.0 3.8 0.0 2.4 Kentucky 2.0 4.0 0.8 0.0 2.3 Louisiana 0.0 0.0 2.0 6.3 1.8 Maine 5.3 0.0 0.0 0.0 2.0 Maryland 3.4 0.0 0.0 0.0 0.5 Massachusetts 2.1 1.8 0.8 0.0 1.2 Michigan 0.0 4.3 3.7 0.0 3.3 Minnesota 6.0 4.0 8.5 0.0 5.3 Mississippi 14.3 3.3 4.9 0.0 4.8 Missouri 2.6 3.0 4.2 5.3 3.6 Montana 0.0 0.0 0.0 0.0 0.0 Nebraska 0.0 0.0 0.0 0.0 0.0 Nevada 10.0 0.0 4.2 16.7 6.0 New Hampshire 0.0 3.1 3.6 25.0 4.1 New Jersey 0.0 0.0 4.1 5.3 3.3 New Mexico 0.0 11.5 6.1 0.0 7.4 New York 0.0 3.1 3.5 1.7 2.5 North Carolina 0.0 0.7 1.8 7.7 1.4 North Dakota 0.0 0.0 0.0 0.0 0.0 Ohio 0.0 1.5 0.6 0.0 0.9 Oklahoma 0.0 8.6 13.4 0.0 9.6 Oregon 4.5 3.3 2.3 0.0 3.1 Pennsylvania 0.0 0.6 0.0 0.0 0.1 Rhode Island 0.0 6.1 5.1 0.0 4.5 South Carolina 2.2 1.9 4.5 0.0 3.0 South Dakota 0.0 0.0 0.0 0.0 0.0 Tennessee 0.0 1.1 1.2 0.0 1.0 Texas 1.1 3.2 3.5 3.1 3.2 Utah 5.9 3.7 0.0 0.0 3.3 Vermont 0.0 6.7 0.0 n/a 2.4 Virginia 0.0 1.1 2.1 6.3 1.8 Washington 6.3 2.0 3.1 0.0 3.0 West Virginia 0.0 21.1 4.5 n/a 10.4 Wisconsin 2.1 6.8 6.2 20.0 6.3 Wyoming 0.0 7.7 0.0 n/a 3.0
Source: CASPER
100 Nursing Home Data Compendium 2013

Table 2.8.d. Nursing Home Surveys Resulting in a Health Deficiency of Immediate Jeopardy to Residents by Bed Size Category: United States, 2011
Percentage by Bed Size Category <50 50-99 100-199 >199 All Facilities
Nation 1.6 2.5 2.8 2.6 2.5 Alabama 0.0 2.2 3.3 7.7 3.0 Alaska 9.1 0.0 0.0 n/a 6.3 Arizona 0.0 2.7 0.0 8.3 1.5 Arkansas 0.0 3.2 3.6 0.0 3.3 California 0.5 2.5 1.3 2.2 1.9 Colorado 0.0 3.1 0.0 0.0 1.4 Connecticut 11.1 0.0 3.3 0.0 2.7 Delaware 0.0 0.0 0.0 0.0 0.0 District of Columbia 0.0 0.0 33.3 40.0 21.1 Florida 0.0 0.0 0.4 0.0 0.3 Georgia 6.3 4.8 0.8 0.0 2.3 Hawaii 0.0 0.0 0.0 0.0 0.0 Idaho 0.0 4.2 3.7 n/a 2.7 Illinois 2.2 2.9 3.7 5.6 3.6 Indiana 2.8 5.0 2.3 0.0 3.4 Iowa 2.0 0.8 0.0 0.0 1.0 Kansas 0.9 2.6 2.4 0.0 1.9 Kentucky 5.4 4.9 3.3 0.0 4.2 Louisiana 0.0 6.7 5.3 6.7 5.3 Maine 0.0 0.0 0.0 0.0 0.0 Maryland 0.0 2.0 1.6 0.0 1.4 Massachusetts 0.0 0.0 1.3 0.0 0.8 Michigan 2.2 1.5 6.0 7.4 4.4 Minnesota 1.2 3.0 2.2 0.0 2.3 Mississippi 0.0 2.1 0.0 0.0 1.0 Missouri 0.0 1.7 3.9 6.7 2.7 Montana 3.7 0.0 0.0 0.0 1.2 Nebraska 1.5 0.0 0.0 0.0 0.5 Nevada 0.0 0.0 7.7 0.0 3.9 New Hampshire 0.0 3.3 5.7 0.0 3.8 New Jersey 2.9 3.5 1.8 1.7 2.2 New Mexico 25.0 10.0 9.4 0.0 11.3 New York 0.0 4.1 2.3 1.2 2.0 North Carolina 0.0 5.4 3.2 0.0 3.6 North Dakota 0.0 0.0 0.0 0.0 0.0 Ohio 1.1 0.3 0.8 4.2 0.7 Oklahoma 0.0 6.8 14.5 33.3 9.6 Oregon 6.7 0.0 2.6 n/a 2.1 Pennsylvania 0.0 0.5 0.5 1.2 0.5 Rhode Island 0.0 0.0 2.4 0.0 1.1 South Carolina 2.5 3.7 3.7 0.0 3.3 South Dakota 1.5 2.5 0.0 n/a 1.8 Tennessee 10.7 3.8 2.6 6.7 4.0 Texas 2.2 3.6 2.5 2.6 2.8 Utah 0.0 0.0 8.3 0.0 2.6 Vermont 6.7 0.0 0.0 n/a 2.2 Virginia 0.0 0.0 2.0 0.0 1.0 Washington 3.0 2.2 10.3 0.0 5.7 West Virginia 7.7 8.3 9.1 n/a 8.5 Wisconsin 0.0 4.8 6.1 0.0 4.5 Wyoming 0.0 0.0 0.0 n/a 0.0
Source: CASPER
Nursing Home Data Compendium 2013 101

Table 2.8.e. Nursing Home Surveys Resulting in a Health Deficiency of Immediate Jeopardy to Residents by Bed Size Category: United States, 2012
Percentage by Bed Size Category <50 50-99 100-199 >199 All Facilities
Nation 1.7 2.2 2.6 2.2 2.3 Alabama 0.0 0.0 1.6 0.0 0.9 Alaska 0.0 25.0 0.0 n/a 6.3 Arizona 9.1 0.0 0.0 0.0 0.9 Arkansas 16.7 4.7 3.9 0.0 4.5 California 2.5 1.1 1.3 0.0 1.3 Colorado 0.0 0.0 7.1 0.0 3.2 Connecticut 0.0 1.5 2.6 5.9 2.3 Delaware 0.0 12.5 0.0 0.0 3.0 District of Columbia 0.0 25.0 0.0 0.0 5.3 Florida 0.0 0.8 0.4 3.1 0.6 Georgia 0.0 2.3 1.4 4.3 1.9 Hawaii 0.0 0.0 0.0 0.0 0.0 Idaho 10.5 0.0 5.0 n/a 5.4 Illinois 1.1 1.8 2.5 0.0 1.7 Indiana 4.7 2.0 1.9 0.0 2.3 Iowa 0.0 0.8 3.2 0.0 0.9 Kansas 3.2 0.7 0.0 0.0 1.4 Kentucky 0.0 2.7 7.8 0.0 4.3 Louisiana 0.0 4.4 3.9 13.3 4.2 Maine 2.6 3.9 0.0 0.0 2.8 Maryland 0.0 4.5 0.0 4.8 1.4 Massachusetts 0.0 0.0 0.4 0.0 0.2 Michigan 2.0 3.4 4.8 7.4 4.2 Minnesota 3.0 2.5 2.5 0.0 2.6 Mississippi 0.0 4.5 5.3 0.0 4.4 Missouri 0.0 1.3 4.6 0.0 2.7 Montana 0.0 0.0 4.0 0.0 1.2 Nebraska 1.7 1.1 0.0 0.0 1.1 Nevada 0.0 0.0 3.7 0.0 1.8 New Hampshire 0.0 0.0 0.0 0.0 0.0 New Jersey 0.0 1.9 0.5 1.8 0.9 New Mexico 0.0 15.6 16.7 0.0 13.3 New York 2.1 2.1 2.9 2.1 2.4 North Carolina 0.0 3.8 3.2 0.0 3.1 North Dakota 0.0 0.0 0.0 0.0 0.0 Ohio 0.0 0.6 1.4 4.0 1.0 Oklahoma 0.0 10.7 8.7 33.3 9.1 Oregon 0.0 3.6 0.0 0.0 1.7 Pennsylvania 0.0 0.0 0.0 0.0 0.0 Rhode Island 0.0 3.2 0.0 0.0 1.2 South Carolina 5.0 5.6 5.8 0.0 5.4 South Dakota 2.4 0.0 0.0 n/a 0.9 Tennessee 0.0 6.7 3.5 0.0 4.0 Texas 2.1 2.7 4.1 5.7 3.6 Utah 4.5 0.0 4.3 100 5.1 Vermont 0.0 0.0 0.0 n/a 0.0 Virginia 0.0 0.0 0.7 0.0 0.4 Washington 3.3 2.3 0.0 0.0 1.4 West Virginia 0.0 0.0 3.1 0.0 1.3 Wisconsin 1.9 4.4 5.8 18.2 4.9 Wyoming 9.1 0.0 7.7 n/a 5.1
Source: CASPER
102 Nursing Home Data Compendium 2013

Table 2.8.f. Nursing Home Surveys Resulting in a Health Deficiency of Immediate Jeopardy to Residents by Bed Size Category: United States (2008, 2012 and Change)
Percentage in 2008, 2012 and Percent Change (% Δ), by Bed Size Category <50 50-99 100-199 >199 All Facilities
2008 2012 % Δ 2008 2012 % Δ 2008 2012 % Δ 2008 2012 % Δ 2008 2012 % Δ Nation 2.0 1.7 -18.4 3.2 2.2 -32.8 3.7 2.6 -29.8 3.1 2.2 -28.8 3.3 2.3 -29.5 Alabama 0.0 0.0 n/a 0.0 0.0 n/a 3.1 1.6 -46.3 0.0 0.0 n/a 1.6 0.9 -44.5 Alaska 11.1 0.0 -100 33.3 25.0 -25.0 n/a 0.0 n/a 0.0 n/a n/a 15.4 6.3 -59.4 Arizona 6.7 9.1 +36.4 5.6 0.0 -100 8.3 0.0 -100 0.0 0.0 n/a 6.7 0.9 -86.9 Arkansas 10.0 16.7 +66.7 5.6 4.7 -16.1 3.7 3.9 +5.5 0.0 0.0 n/a 4.6 4.5 -1.5 California 4.1 2.5 -39.4 4.1 1.1 -73.6 6.6 1.3 -80.8 3.9 0.0 -100 4.7 1.3 -72.2 Colorado 0.0 0.0 n/a 4.3 0.0 -100 4.9 7.1 +44.6 0.0 0.0 n/a 3.7 3.2 -14.5 Connecticut 0.0 0.0 n/a 0.0 1.5 n/a 1.5 2.6 +71.1 4.5 5.9 +29.4 1.2 2.3 +90.9 Delaware 0.0 0.0 n/a 0.0 12.5 n/a 0.0 0.0 n/a 0.0 0.0 n/a 0.0 3.0 n/a District of Columbia 0.0 0.0 n/a 0.0 25.0 n/a 0.0 0.0 n/a 0.0 0.0 n/a 0.0 5.3 n/a Florida 0.0 0.0 n/a 0.8 0.8 +6.7 1.7 0.4 -73.3 0.0 3.1 n/a 1.3 0.6 -52.6 Georgia 7.4 0.0 -100 1.8 2.3 +27.6 2.6 1.4 -46.5 0.0 4.3 n/a 2.5 1.9 -25.1 Hawaii 0.0 0.0 n/a 0.0 0.0 n/a 6.7 0.0 -100 0.0 0.0 n/a 2.0 0.0 -100 Idaho 5.6 10.5 +89.5 4.8 0.0 -100 12.0 5.0 -58.3 n/a n/a n/a 7.8 5.4 -31.4 Illinois 1.0 1.1 +7.6 3.7 1.8 -51.3 3.4 2.5 -27.2 5.6 0.0 -100 3.5 1.7 -51.9 Indiana 4.5 4.7 +4.3 3.6 2.0 -44.0 4.6 1.9 -58.9 9.1 0.0 -100 4.3 2.3 -46.9 Iowa 0.0 0.0 n/a 0.0 0.8 n/a 3.5 3.2 -8.1 0.0 0.0 n/a 0.5 0.9 +99.5 Kansas 2.0 3.2 +59.6 3.8 0.7 -80.8 0.0 0.0 n/a 0.0 0.0 n/a 2.7 1.4 -46.9 Kentucky 2.1 0.0 -100 4.9 2.7 -45.0 5.9 7.8 +32.2 0.0 0.0 n/a 4.8 4.3 -9.3 Louisiana 0.0 0.0 n/a 0.0 4.4 n/a 5.7 3.9 -31.9 5.6 13.3 +140 4.3 4.2 -2.1 Maine 2.3 2.6 +13.2 1.8 3.9 +124 0.0 0.0 n/a 0.0 0.0 n/a 1.8 2.8 +58.5 Maryland 0.0 0.0 n/a 6.1 4.5 -25.8 4.2 0.0 -100 0.0 4.8 n/a 3.8 1.4 -63.7 Massachusetts 0.0 0.0 n/a 0.0 0.0 n/a 0.0 0.4 n/a 0.0 0.0 n/a 0.0 0.2 n/a Michigan 5.0 2.0 -59.2 2.8 3.4 +21.6 4.0 4.8 +20.5 6.7 7.4 +11.1 3.9 4.2 +9.2 Minnesota 5.4 3.0 -45.0 3.8 2.5 -33.2 3.9 2.5 -34.8 7.7 0.0 -100 4.3 2.6 -39.7 Mississippi 0.0 0.0 n/a 6.6 4.5 -31.9 16.7 5.3 -68.4 0.0 0.0 n/a 9.9 4.4 -54.9 Missouri 2.2 0.0 -100 4.3 1.3 -68.5 6.8 4.6 -32.4 10.0 0.0 -100 5.4 2.7 -49.8 Montana 0.0 0.0 n/a 3.3 0.0 -100 0.0 4.0 n/a 0.0 0.0 n/a 1.2 1.2 +1.2 Nebraska 1.3 1.7 +33.9 0.9 1.1 +20.9 2.2 0.0 -100 0.0 0.0 n/a 1.3 1.1 -14.9 Nevada 0.0 0.0 n/a 0.0 0.0 n/a 0.0 3.7 n/a 0.0 0.0 n/a 0.0 1.8 n/a New Hampshire 0.0 0.0 n/a 5.3 0.0 -100 3.2 0.0 -100 0.0 0.0 n/a 3.5 0.0 -100 New Jersey 0.0 0.0 n/a 3.4 1.9 -44.3 3.2 0.5 -85.0 0.0 1.8 n/a 2.4 0.9 -64.4 New Mexico 0.0 0.0 n/a 7.4 15.6 +111 3.2 16.7 +417 0.0 0.0 n/a 4.3 13.3 +207 New York 0.0 2.1 n/a 1.9 2.1 +8.3 3.5 2.9 -16.7 2.0 2.1 +4.7 2.5 2.4 -0.9 North Carolina 2.0 0.0 -100 1.2 3.8 +213 2.2 3.2 +43.8 8.3 0.0 -100 2.0 3.1 +53.3 North Dakota 0.0 0.0 n/a 0.0 0.0 n/a 5.0 0.0 -100 0.0 0.0 n/a 1.2 0.0 -100 Ohio 0.0 0.0 n/a 1.6 0.6 -62.5 2.1 1.4 -35.4 0.0 4.0 n/a 1.6 1.0 -38.1 Oklahoma 6.5 0.0 -100 5.8 10.7 +83.5 9.8 8.7 -11.2 16.7 33.3 +100 7.6 9.1 +18.9 Oregon 0.0 0.0 n/a 4.8 3.6 -24.8 4.3 0.0 -100 0.0 0.0 n/a 3.8 1.7 -56.0 Pennsylvania 0.0 0.0 n/a 1.1 0.0 -100 0.3 0.0 -100 2.4 0.0 -100 0.7 0.0 -100 Rhode Island 0.0 0.0 n/a 0.0 3.2 n/a 0.0 0.0 n/a 0.0 0.0 n/a 0.0 1.2 n/a South Carolina 2.9 5.0 +75.0 1.8 5.6 +206 5.3 5.8 +10.5 20.0 0.0 -100 4.1 5.4 +31.3 South Dakota 0.0 2.4 n/a 0.0 0.0 n/a 0.0 0.0 n/a n/a n/a n/a 0.0 0.9 n/a Tennessee 3.2 0.0 -100 11.7 6.7 -43.0 3.9 3.5 -10.1 0.0 0.0 n/a 6.0 4.0 -34.4 Texas 2.0 2.1 +6.4 4.5 2.7 -39.1 4.8 4.1 -14.0 5.9 5.7 -2.9 4.5 3.6 -20.0 Utah 0.0 4.5 n/a 3.4 0.0 -100 0.0 4.3 n/a 0.0 100 n/a 1.1 5.1 +347 Vermont 0.0 0.0 n/a 0.0 0.0 n/a 0.0 0.0 n/a n/a n/a n/a 0.0 0.0 n/a Virginia 0.0 0.0 n/a 3.6 0.0 -100 2.1 0.7 -67.4 0.0 0.0 n/a 2.2 0.4 -83.3 Washington 0.0 3.3 n/a 2.1 2.3 +10.5 1.9 0.0 -100 0.0 0.0 n/a 1.6 1.4 -13.7 West Virginia 0.0 0.0 n/a 3.6 0.0 -100 2.4 3.1 +28.1 0.0 0.0 n/a 2.5 1.3 -49.6 Wisconsin 7.5 1.9 -75.0 5.0 4.4 -12.0 9.2 5.8 -36.8 16.7 18.2 +9.1 7.1 4.9 -31.1 Wyoming 18.2 9.1 -50.0 6.7 0.0 -100 0.0 7.7 n/a n/a n/a n/a 7.5 5.1 -31.6 Source: CASPER
Nursing Home Data Compendium 2013 103

Table 2.9.a. Nursing Home Surveys Resulting in a Health Deficiency of Immediate Jeopardy to Residents by Ownership Type: United States, 2008
Percentage by Ownership Type
For-Profit Non-Profit Government All Facilities Nation 3.6 2.4 3.3 3.3 Alabama 2.0 0.0 0.0 1.6 Alaska 33.3 0.0 20.0 15.4 Arizona 8.0 3.2 0.0 6.7 Arkansas 4.2 5.4 10.0 4.6 California 5.4 1.5 4.3 4.7 Colorado 3.4 6.1 0.0 3.7 Connecticut 0.5 3.9 0.0 1.2 Delaware 0.0 0.0 0.0 0.0 District of Columbia 0.0 0.0 0.0 0.0 Florida 1.2 1.7 0.0 1.3 Georgia 1.7 4.2 4.3 2.5 Hawaii 0.0 0.0 7.7 2.0 Idaho 6.8 0.0 18.2 7.8 Illinois 3.8 2.9 3.8 3.5 Indiana 4.5 3.1 6.9 4.3 Iowa 0.5 0.5 0.0 0.5 Kansas 1.3 4.5 2.3 2.7 Kentucky 5.3 3.8 0.0 4.8 Louisiana 5.8 0.0 0.0 4.3 Maine 2.5 0.0 0.0 1.8 Maryland 5.1 1.5 0.0 3.8 Massachusetts 0.0 0.0 0.0 0.0 Michigan 4.7 2.9 0.0 3.9 Minnesota 5.8 3.8 2.6 4.3 Mississippi 12.3 5.0 3.7 9.9 Missouri 5.5 6.0 2.5 5.4 Montana 0.0 3.0 0.0 1.2 Nebraska 1.8 0.0 1.8 1.3 Nevada 0.0 0.0 0.0 0.0 New Hampshire 4.8 0.0 7.7 3.5 New Jersey 2.5 2.7 0.0 2.4 New Mexico 2.2 11.1 0.0 4.3 New York 2.7 2.2 2.3 2.5 North Carolina 1.8 2.9 0.0 2.0 North Dakota 0.0 1.4 0.0 1.2 Ohio 1.6 1.5 0.0 1.6 Oklahoma 7.7 0.0 23.1 7.6 Oregon 4.7 0.0 0.0 3.8 Pennsylvania 0.5 0.9 0.0 0.7 Rhode Island 0.0 0.0 n/a 0.0 South Carolina 3.8 0.0 11.1 4.1 South Dakota 0.0 0.0 0.0 0.0 Tennessee 5.9 8.5 0.0 6.0 Texas 5.0 1.9 0.0 4.5 Utah 1.4 0.0 0.0 1.1 Vermont 0.0 0.0 0.0 0.0 Virginia 3.2 0.0 0.0 2.2 Washington 1.7 1.9 0.0 1.6 West Virginia 3.7 0.0 0.0 2.5 Wisconsin 6.8 6.3 10.3 7.1 Wyoming 5.9 12.5 6.7 7.5
Source: CASPER
104 Nursing Home Data Compendium 2013

Table 2.9.b. Nursing Home Surveys Resulting in a Health Deficiency of Immediate Jeopardy to Residents by Ownership Type: United States, 2009
Percentage by Ownership Type
For-Profit Non-Profit Government All Facilities Nation 2.9 2.0 2.5 2.6 Alabama 1.2 0.0 0.0 0.9 Alaska 0.0 14.3 0.0 5.9 Arizona 3.3 0.0 0.0 2.5 Arkansas 3.5 3.3 0.0 3.3 California 2.3 1.1 2.3 2.1 Colorado 1.3 4.3 0.0 1.8 Connecticut 1.1 2.2 0.0 1.3 Delaware 0.0 0.0 0.0 0.0 District of Columbia 0.0 0.0 0.0 0.0 Florida 1.1 0.0 0.0 0.7 Georgia 2.2 3.2 0.0 2.4 Hawaii 0.0 0.0 0.0 0.0 Idaho 6.5 0.0 0.0 4.1 Illinois 3.2 0.9 3.3 2.6 Indiana 2.5 1.5 0.0 2.1 Iowa 0.0 0.0 0.0 0.0 Kansas 2.2 4.7 0.0 2.8 Kentucky 3.5 0.0 0.0 2.5 Louisiana 2.8 3.6 6.3 3.2 Maine 0.0 0.0 0.0 0.0 Maryland 1.3 1.4 0.0 1.3 Massachusetts 0.0 0.0 0.0 0.0 Michigan 4.0 3.8 0.0 3.7 Minnesota 3.7 2.8 2.4 3.0 Mississippi 1.4 2.9 0.0 1.5 Missouri 4.8 2.5 5.0 4.3 Montana 0.0 2.6 5.9 2.0 Nebraska 1.0 0.0 0.0 0.5 Nevada 5.4 0.0 0.0 4.0 New Hampshire 0.0 0.0 0.0 0.0 New Jersey 7.1 5.2 9.5 6.7 New Mexico 10.4 5.6 0.0 8.3 New York 2.9 2.8 8.2 3.3 North Carolina 1.9 0.0 0.0 1.5 North Dakota 0.0 1.4 0.0 1.2 Ohio 1.5 0.5 0.0 1.2 Oklahoma 10.3 13.2 9.1 10.6 Oregon 4.4 0.0 0.0 3.6 Pennsylvania 0.3 0.3 2.3 0.4 Rhode Island 4.5 0.0 n/a 3.5 South Carolina 5.4 0.0 5.9 4.5 South Dakota 2.7 1.4 0.0 1.8 Tennessee 5.4 0.0 0.0 4.1 Texas 4.1 3.4 3.2 4.0 Utah 1.5 0.0 0.0 1.3 Vermont 0.0 10.0 0.0 2.6 Virginia 1.1 3.9 0.0 1.9 Washington 2.2 0.0 0.0 1.6 West Virginia 1.2 0.0 0.0 0.8 Wisconsin 6.5 9.4 7.7 7.6 Wyoming 0.0 0.0 10.5 5.6
Source: CASPER
Nursing Home Data Compendium 2013 105

Table 2.9.c. Nursing Home Surveys Resulting in a Health Deficiency of Immediate Jeopardy to Residents by Ownership Type: United States, 2010
Percentage by Ownership Type
For-Profit Non-Profit Government All Facilities Nation 3.0 2.2 3.4 2.8 Alabama 2.2 6.5 0.0 2.6 Alaska 0.0 20.0 42.9 26.7 Arizona 1.1 0.0 0.0 0.9 Arkansas 10.1 5.9 22.2 9.9 California 3.3 2.4 0.0 3.0 Colorado 2.1 5.4 12.5 3.6 Connecticut 3.0 0.0 0.0 2.3 Delaware 0.0 0.0 0.0 0.0 District of Columbia 11.1 0.0 0.0 5.3 Florida 1.7 1.2 0.0 1.5 Georgia 2.8 6.7 0.0 4.0 Hawaii 0.0 0.0 16.7 2.7 Idaho 1.9 0.0 0.0 1.3 Illinois 4.3 3.0 10.3 4.2 Indiana 2.7 1.7 4.3 2.6 Iowa 0.4 0.6 0.0 0.5 Kansas 2.0 2.8 2.4 2.4 Kentucky 1.8 3.7 0.0 2.3 Louisiana 2.3 0.0 0.0 1.8 Maine 1.4 3.2 0.0 2.0 Maryland 0.0 1.5 0.0 0.5 Massachusetts 1.3 0.8 0.0 1.2 Michigan 4.8 0.0 0.0 3.3 Minnesota 3.4 6.0 6.7 5.3 Mississippi 4.1 12.5 3.6 4.8 Missouri 4.0 3.2 0.0 3.6 Montana 0.0 0.0 0.0 0.0 Nebraska 0.0 0.0 0.0 0.0 Nevada 8.1 0.0 0.0 6.0 New Hampshire 5.7 0.0 9.1 4.1 New Jersey 4.3 1.1 0.0 3.3 New Mexico 4.2 18.8 0.0 7.4 New York 2.4 2.7 2.5 2.5 North Carolina 1.9 0.0 0.0 1.4 North Dakota 0.0 0.0 0.0 0.0 Ohio 1.0 0.6 0.0 0.9 Oklahoma 9.6 12.1 0.0 9.6 Oregon 3.8 0.0 0.0 3.1 Pennsylvania 0.0 0.3 0.0 0.1 Rhode Island 5.6 0.0 n/a 4.5 South Carolina 3.9 0.0 0.0 3.0 South Dakota 0.0 0.0 0.0 0.0 Tennessee 1.3 0.0 0.0 1.0 Texas 3.1 2.1 9.7 3.2 Utah 3.9 0.0 0.0 3.3 Vermont 3.8 0.0 0.0 2.4 Virginia 2.1 0.0 8.3 1.8 Washington 2.9 4.5 0.0 3.0 West Virginia 12.9 0.0 16.7 10.4 Wisconsin 7.3 5.6 4.3 6.3 Wyoming 0.0 0.0 7.7 3.0
Source: CASPER
106 Nursing Home Data Compendium 2013

Table 2.9.d. Nursing Home Surveys Resulting in a Health Deficiency of Immediate Jeopardy to Residents by Ownership Type: United States, 2011
Percentage by Ownership Type
For-Profit Non-Profit Government All Facilities Nation 2.8 1.7 2.7 2.5 Alabama 3.2 2.9 0.0 3.0 Alaska 0.0 0.0 20.0 6.3 Arizona 0.0 8.0 0.0 1.5 Arkansas 3.5 3.0 0.0 3.3 California 2.3 0.0 0.0 1.9 Colorado 2.0 0.0 0.0 1.4 Connecticut 1.7 6.4 0.0 2.7 Delaware 0.0 0.0 0.0 0.0 District of Columbia 12.5 27.3 n/a 21.1 Florida 0.4 0.0 0.0 0.3 Georgia 2.8 1.7 0.0 2.3 Hawaii 0.0 0.0 0.0 0.0 Idaho 4.0 0.0 0.0 2.7 Illinois 4.0 2.0 6.7 3.6 Indiana 4.2 1.7 1.9 3.4 Iowa 1.3 0.6 0.0 1.0 Kansas 1.3 3.7 0.0 1.9 Kentucky 3.4 6.9 0.0 4.2 Louisiana 3.9 11.4 8.3 5.3 Maine 0.0 0.0 0.0 0.0 Maryland 1.9 0.0 0.0 1.4 Massachusetts 1.0 0.0 0.0 0.8 Michigan 5.4 1.9 2.6 4.4 Minnesota 1.8 2.1 5.4 2.3 Mississippi 1.3 0.0 0.0 1.0 Missouri 3.0 1.1 2.8 2.7 Montana 0.0 0.0 6.3 1.2 Nebraska 0.0 1.7 0.0 0.5 Nevada 5.0 0.0 0.0 3.9 New Hampshire 7.1 0.0 0.0 3.8 New Jersey 2.3 2.1 0.0 2.2 New Mexico 6.7 8.3 60.0 11.3 New York 2.0 2.0 2.1 2.0 North Carolina 3.8 3.4 0.0 3.6 North Dakota 0.0 0.0 0.0 0.0 Ohio 0.7 0.6 0.0 0.7 Oklahoma 9.8 10.3 0.0 9.6 Oregon 2.6 0.0 0.0 2.1 Pennsylvania 1.0 0.0 0.0 0.5 Rhode Island 1.4 0.0 n/a 1.1 South Carolina 2.9 3.3 7.1 3.3 South Dakota 2.4 1.5 0.0 1.8 Tennessee 3.9 3.8 7.1 4.0 Texas 3.1 0.0 5.9 2.8 Utah 3.4 0.0 0.0 2.6 Vermont 3.2 0.0 0.0 2.2 Virginia 1.5 0.0 0.0 1.0 Washington 7.7 0.0 0.0 5.7 West Virginia 9.1 4.8 20.0 8.5 Wisconsin 5.1 2.3 7.7 4.5 Wyoming 0.0 0.0 0.0 0.0
Source: CASPER
Nursing Home Data Compendium 2013 107

Table 2.9.e. Nursing Home Surveys Resulting in a Health Deficiency of Immediate Jeopardy to Residents by Ownership Type: United States, 2012
Percentage by Ownership Type
For-Profit Non-Profit Government All Facilities Nation 2.6 1.6 1.4 2.3 Alabama 1.1 0.0 0.0 0.9 Alaska 100 0.0 0.0 6.3 Arizona 1.1 0.0 0.0 0.9 Arkansas 3.9 9.7 0.0 4.5 California 1.3 0.5 4.8 1.3 Colorado 3.6 2.9 0.0 3.2 Connecticut 2.4 2.4 0.0 2.3 Delaware 4.3 0.0 0.0 3.0 District of Columbia 0.0 10.0 n/a 5.3 Florida 0.9 0.0 0.0 0.6 Georgia 2.3 1.3 0.0 1.9 Hawaii 0.0 0.0 0.0 0.0 Idaho 2.6 0.0 22.2 5.4 Illinois 1.7 1.9 0.0 1.7 Indiana 2.6 3.2 0.0 2.3 Iowa 1.3 0.6 0.0 0.9 Kansas 1.3 2.0 0.0 1.4 Kentucky 4.3 5.0 0.0 4.3 Louisiana 4.4 2.4 7.7 4.2 Maine 4.0 0.0 0.0 2.8 Maryland 2.0 0.0 0.0 1.4 Massachusetts 0.3 0.0 0.0 0.2 Michigan 5.6 0.9 2.6 4.2 Minnesota 4.3 2.1 0.0 2.6 Mississippi 3.7 15.8 0.0 4.4 Missouri 3.4 0.0 3.3 2.7 Montana 0.0 3.0 0.0 1.2 Nebraska 1.1 0.0 2.4 1.1 Nevada 2.4 0.0 0.0 1.8 New Hampshire 0.0 0.0 0.0 0.0 New Jersey 0.8 1.2 0.0 0.9 New Mexico 16.7 6.3 0.0 13.3 New York 1.8 2.8 4.8 2.4 North Carolina 3.7 1.1 0.0 3.1 North Dakota 0.0 0.0 0.0 0.0 Ohio 1.1 0.7 0.0 1.0 Oklahoma 9.6 8.3 0.0 9.1 Oregon 2.0 0.0 0.0 1.7 Pennsylvania 0.0 0.0 0.0 0.0 Rhode Island 1.5 0.0 n/a 1.2 South Carolina 7.1 0.0 0.0 5.4 South Dakota 0.0 1.5 0.0 0.9 Tennessee 4.4 3.1 0.0 4.0 Texas 3.9 1.6 0.0 3.6 Utah 5.9 0.0 0.0 5.1 Vermont 0.0 0.0 0.0 0.0 Virginia 0.5 0.0 0.0 0.4 Washington 1.3 2.5 0.0 1.4 West Virginia 1.6 0.0 0.0 1.3 Wisconsin 4.0 7.6 2.1 4.9 Wyoming 6.3 0.0 5.9 5.1
Source: CASPER
108 Nursing Home Data Compendium 2013

Table 2.9.f. Nursing Home Surveys Resulting in a Health Deficiency of Immediate Jeopardy to Residents by Ownership Type: United States (2008, 2012 and Change)
Percentage in 2008, 2012 and Percent Change (% Δ), by Ownership Type For-Profit Non-Profit Government All Facilities
2008 2012 % Δ 2008 2012 % Δ 2008 2012 % Δ 2008 2012 % Δ Nation 3.6 2.6 -27.5 2.4 1.6 -31.8 3.3 1.4 -56.7 3.3 2.3 -29.5 Alabama 2.0 1.1 -45.7 0.0 0.0 n/a 0.0 0.0 n/a 1.6 0.9 -44.5 Alaska 33.3 100 +200 0.0 0.0 n/a 20.0 0.0 -100 15.4 6.3 -59.4 Arizona 8.0 1.1 -86.8 3.2 0.0 -100 0.0 0.0 n/a 6.7 0.9 -86.9 Arkansas 4.2 3.9 -8.2 5.4 9.7 +79.0 10.0 0.0 -100 4.6 4.5 -1.5 California 5.4 1.3 -75.8 1.5 0.5 -64.5 4.3 4.8 +11.9 4.7 1.3 -72.2 Colorado 3.4 3.6 +4.2 6.1 2.9 -53.3 0.0 0.0 n/a 3.7 3.2 -14.5 Connecticut 0.5 2.4 +355 3.9 2.4 -39.3 0.0 0.0 n/a 1.2 2.3 +90.9 Delaware 0.0 4.3 n/a 0.0 0.0 n/a 0.0 0.0 n/a 0.0 3.0 n/a District of Columbia 0.0 0.0 n/a 0.0 10.0 n/a 0.0 n/a n/a 0.0 5.3 n/a Florida 1.2 0.9 -29.4 1.7 0.0 -100 0.0 0.0 n/a 1.3 0.6 -52.6 Georgia 1.7 2.3 +35.3 4.2 1.3 -68.0 4.3 0.0 -100 2.5 1.9 -25.1 Hawaii 0.0 0.0 n/a 0.0 0.0 n/a 7.7 0.0 -100 2.0 0.0 -100 Idaho 6.8 2.6 -61.4 0.0 0.0 n/a 18.2 22.2 +22.2 7.8 5.4 -31.4 Illinois 3.8 1.7 -54.8 2.9 1.9 -33.0 3.8 0.0 -100 3.5 1.7 -51.9 Indiana 4.5 2.6 -42.1 3.1 3.2 +3.2 6.9 0.0 -100 4.3 2.3 -46.9 Iowa 0.5 1.3 +176 0.5 0.6 +8.9 0.0 0.0 n/a 0.5 0.9 +99.5 Kansas 1.3 1.3 +6.7 4.5 2.0 -56.4 2.3 0.0 -100 2.7 1.4 -46.9 Kentucky 5.3 4.3 -19.5 3.8 5.0 +31.7 0.0 0.0 n/a 4.8 4.3 -9.3 Louisiana 5.8 4.4 -24.0 0.0 2.4 n/a 0.0 7.7 n/a 4.3 4.2 -2.1 Maine 2.5 4.0 +60.0 0.0 0.0 n/a 0.0 0.0 n/a 1.8 2.8 +58.5 Maryland 5.1 2.0 -60.6 1.5 0.0 -100 0.0 0.0 n/a 3.8 1.4 -63.7 Massachusetts 0.0 0.3 n/a 0.0 0.0 n/a 0.0 0.0 n/a 0.0 0.2 n/a Michigan 4.7 5.6 +19.0 2.9 0.9 -68.8 0.0 2.6 n/a 3.9 4.2 +9.2 Minnesota 5.8 4.3 -25.3 3.8 2.1 -45.1 2.6 0.0 -100 4.3 2.6 -39.7 Mississippi 12.3 3.7 -70.0 5.0 15.8 +216 3.7 0.0 -100 9.9 4.4 -54.9 Missouri 5.5 3.4 -38.4 6.0 0.0 -100 2.5 3.3 +33.3 5.4 2.7 -49.8 Montana 0.0 0.0 n/a 3.0 3.0 0.0 0.0 0.0 n/a 1.2 1.2 +1.2 Nebraska 1.8 1.1 -41.1 0.0 0.0 n/a 1.8 2.4 +34.1 1.3 1.1 -14.9 Nevada 0.0 2.4 n/a 0.0 0.0 n/a 0.0 0.0 n/a 0.0 1.8 n/a New Hampshire 4.8 0.0 -100 0.0 0.0 n/a 7.7 0.0 -100 3.5 0.0 -100 New Jersey 2.5 0.8 -66.9 2.7 1.2 -56.9 0.0 0.0 n/a 2.4 0.9 -64.4 New Mexico 2.2 16.7 +667 11.1 6.3 -43.7 0.0 0.0 n/a 4.3 13.3 +207 New York 2.7 1.8 -31.9 2.2 2.8 +29.3 2.3 4.8 +105 2.5 2.4 -0.9 North Carolina 1.8 3.7 +106 2.9 1.1 -60.9 0.0 0.0 n/a 2.0 3.1 +53.3 North Dakota 0.0 0.0 n/a 1.4 0.0 -100 0.0 0.0 n/a 1.2 0.0 -100 Ohio 1.6 1.1 -34.7 1.5 0.7 -54.8 0.0 0.0 n/a 1.6 1.0 -38.1 Oklahoma 7.7 9.6 +23.4 0.0 8.3 n/a 23.1 0.0 -100 7.6 9.1 +18.9 Oregon 4.7 2.0 -57.2 0.0 0.0 n/a 0.0 0.0 n/a 3.8 1.7 -56.0 Pennsylvania 0.5 0.0 -100 0.9 0.0 -100 0.0 0.0 n/a 0.7 0.0 -100 Rhode Island 0.0 1.5 n/a 0.0 0.0 n/a n/a n/a n/a 0.0 1.2 n/a South Carolina 3.8 7.1 +85.8 0.0 0.0 n/a 11.1 0.0 -100 4.1 5.4 +31.3 South Dakota 0.0 0.0 n/a 0.0 1.5 n/a 0.0 0.0 n/a 0.0 0.9 n/a Tennessee 5.9 4.4 -24.7 8.5 3.1 -63.1 0.0 0.0 n/a 6.0 4.0 -34.4 Texas 5.0 3.9 -21.8 1.9 1.6 -18.9 0.0 0.0 n/a 4.5 3.6 -20.0 Utah 1.4 5.9 +324 0.0 0.0 n/a 0.0 0.0 n/a 1.1 5.1 +347 Vermont 0.0 0.0 n/a 0.0 0.0 n/a 0.0 0.0 n/a 0.0 0.0 n/a Virginia 3.2 0.5 -83.3 0.0 0.0 n/a 0.0 0.0 n/a 2.2 0.4 -83.3 Washington 1.7 1.3 -28.3 1.9 2.5 +32.5 0.0 0.0 n/a 1.6 1.4 -13.7 West Virginia 3.7 1.6 -56.5 0.0 0.0 n/a 0.0 0.0 n/a 2.5 1.3 -49.6 Wisconsin 6.8 4.0 -40.8 6.3 7.6 +19.3 10.3 2.1 -79.9 7.1 4.9 -31.1 Wyoming 5.9 6.3 +6.3 12.5 0.0 -100 6.7 5.9 -11.8 7.5 5.1 -31.6
Source: CASPER
Nursing Home Data Compendium 2013 109

Table 2.10.a. Nursing Home Surveys Resulting in a Citation for Substandard Quality of Care by Bed Size Category: United States, 2008
Percentage by Bed Size Category <50 50-99 100-199 >199 All Facilities
Nation 2.9 4.3 5.0 5.0 4.4 Alabama 0.0 1.1 3.1 0.0 2.0 Alaska 11.1 33.3 n/a 0.0 15.4 Arizona 6.7 5.6 11.1 0.0 8.2 Arkansas 10.0 10.3 6.2 0.0 7.8 California 4.1 3.3 5.3 5.9 4.1 Colorado 2.9 5.3 4.9 0.0 4.6 Connecticut 0.0 0.0 3.8 4.5 2.5 Delaware 0.0 0.0 0.0 0.0 0.0 District of Columbia 0.0 20.0 0.0 20.0 11.8 Florida 0.0 2.4 2.5 0.0 2.2 Georgia 11.1 2.7 3.2 4.0 3.7 Hawaii 0.0 0.0 6.7 0.0 2.0 Idaho 5.6 4.8 12.0 n/a 7.8 Illinois 1.0 4.4 4.8 7.2 4.6 Indiana 5.6 4.6 4.6 18.2 5.1 Iowa 0.0 0.8 5.3 0.0 1.2 Kansas 8.0 5.4 2.0 0.0 5.7 Kentucky 2.1 9.0 10.2 0.0 8.2 Louisiana 0.0 2.4 5.7 5.6 4.7 Maine 4.7 1.8 0.0 0.0 2.7 Maryland 0.0 6.1 1.7 0.0 2.4 Massachusetts 0.0 0.9 0.0 0.0 0.2 Michigan 5.0 3.5 5.8 10.0 5.3 Minnesota 5.4 4.8 3.9 7.7 4.8 Mississippi 0.0 10.4 19.0 25.0 13.1 Missouri 4.4 4.7 8.1 10.0 6.3 Montana 0.0 0.0 8.7 0.0 2.4 Nebraska 2.5 1.8 2.2 0.0 2.1 Nevada 0.0 0.0 0.0 16.7 2.0 New Hampshire 8.3 2.6 12.9 0.0 7.0 New Jersey 2.9 5.1 5.5 6.7 5.4 New Mexico 0.0 14.8 12.9 0.0 11.6 New York 0.0 1.0 3.1 2.9 2.5 North Carolina 2.0 1.2 2.2 16.7 2.2 North Dakota 0.0 0.0 5.0 0.0 1.2 Ohio 0.9 1.8 2.1 0.0 1.8 Oklahoma 6.5 10.3 20.3 33.3 14.3 Oregon 0.0 4.8 2.1 0.0 3.0 Pennsylvania 0.0 1.7 0.5 2.4 0.9 Rhode Island 0.0 6.1 2.6 0.0 3.4 South Carolina 2.9 1.8 5.3 20.0 4.1 South Dakota 0.0 0.0 0.0 n/a 0.0 Tennessee 12.9 13.8 6.5 0.0 9.1 Texas 4.0 7.6 8.3 8.8 7.7 Utah 4.0 3.4 0.0 0.0 2.3 Vermont 0.0 9.1 0.0 n/a 2.7 Virginia 0.0 3.6 1.4 0.0 1.8 Washington 0.0 3.2 3.8 0.0 2.9 West Virginia 4.3 3.6 4.9 0.0 4.1 Wisconsin 7.5 6.0 9.9 16.7 7.9 Wyoming 0.0 6.7 0.0 n/a 2.5
Source: CASPER
110 Nursing Home Data Compendium 2013

Table 2.10.b. Nursing Home Surveys Resulting in a Citation for Substandard Quality of Care by Bed Size Category: United States, 2009
Percentage by Bed Size Category <50 50-99 100-199 >199 All Facilities
Nation 2.5 3.0 4.6 4.1 3.7 Alabama 0.0 1.2 0.9 0.0 0.9 Alaska 0.0 0.0 n/a 100 5.9 Arizona 0.0 5.4 9.7 0.0 6.8 Arkansas 0.0 9.0 13.6 0.0 11.3 California 2.6 2.0 3.7 12.2 2.9 Colorado 2.9 2.4 2.2 0.0 2.3 Connecticut 0.0 1.4 3.8 6.3 3.0 Delaware 0.0 0.0 0.0 0.0 0.0 District of Columbia 0.0 0.0 0.0 0.0 0.0 Florida 0.0 0.0 0.9 0.0 0.6 Georgia 0.0 6.7 3.3 12.0 4.7 Hawaii 0.0 0.0 0.0 0.0 0.0 Idaho 8.3 0.0 4.3 n/a 4.1 Illinois 0.0 3.0 5.5 5.1 3.9 Indiana 1.3 1.9 3.6 0.0 2.5 Iowa 0.0 0.0 0.0 0.0 0.0 Kansas 4.6 7.3 2.4 0.0 5.7 Kentucky 2.2 5.3 5.1 0.0 4.5 Louisiana 9.1 0.0 2.9 6.3 3.2 Maine 4.7 2.0 9.1 0.0 3.8 Maryland 7.1 0.0 2.3 0.0 2.2 Massachusetts 1.8 0.0 1.8 0.0 1.3 Michigan 0.0 5.2 5.0 7.7 4.7 Minnesota 5.0 3.5 8.7 0.0 5.0 Mississippi 0.0 1.0 3.6 0.0 2.0 Missouri 0.0 3.0 8.0 0.0 5.0 Montana 5.9 0.0 3.4 0.0 3.0 Nebraska 0.0 2.1 0.0 0.0 0.9 Nevada 0.0 0.0 9.1 14.3 6.0 New Hampshire 9.1 0.0 0.0 0.0 1.2 New Jersey 3.6 3.3 11.3 10.7 9.2 New Mexico 10.0 3.6 12.9 0.0 8.3 New York 0.0 2.8 3.3 3.2 3.0 North Carolina 0.0 0.7 2.3 7.1 1.7 North Dakota 0.0 3.2 0.0 0.0 1.2 Ohio 2.0 1.9 1.6 0.0 1.8 Oklahoma 9.4 20.4 20.7 33.3 19.6 Oregon 4.8 3.3 1.8 0.0 2.9 Pennsylvania 3.2 0.5 0.5 1.1 0.9 Rhode Island 23.1 6.5 5.3 0.0 8.2 South Carolina 6.8 2.0 6.5 0.0 5.1 South Dakota 2.0 0.0 9.1 n/a 1.8 Tennessee 8.7 3.8 5.3 5.9 5.2 Texas 1.1 4.4 8.5 5.1 6.5 Utah 0.0 4.2 0.0 0.0 1.3 Vermont 0.0 9.1 0.0 n/a 2.6 Virginia 0.0 1.2 2.2 0.0 1.5 Washington 0.0 2.9 1.0 0.0 1.6 West Virginia 0.0 1.6 0.0 0.0 0.8 Wisconsin 2.3 2.3 9.7 0.0 4.8 Wyoming 9.1 0.0 9.1 n/a 5.6
Source: CASPER
Nursing Home Data Compendium 2013 111

Table 2.10.c. Nursing Home Surveys Resulting in a Citation for Substandard Quality of Care by Bed Size Category: United States, 2010
Percentage by Bed Size Category <50 50-99 100-199 >199 All Facilities
Nation 2.0 3.3 3.7 4.1 3.4 Alabama 0.0 3.4 0.8 6.3 2.1 Alaska 10.0 25.0 0.0 n/a 13.3 Arizona 9.1 3.8 4.8 0.0 4.5 Arkansas 25.0 13.8 10.9 50.0 12.8 California 1.5 3.4 2.7 8.3 3.1 Colorado 7.7 1.3 3.4 33.3 4.1 Connecticut 6.7 5.0 4.0 7.7 4.7 Delaware 0.0 0.0 0.0 0.0 0.0 District of Columbia 0.0 0.0 50.0 0.0 15.8 Florida 0.0 0.8 2.3 0.0 1.8 Georgia 4.3 3.2 2.8 0.0 2.9 Hawaii 0.0 0.0 18.2 0.0 5.4 Idaho 0.0 0.0 3.7 n/a 1.3 Illinois 2.2 2.3 3.9 6.9 3.7 Indiana 2.5 2.0 2.4 0.0 2.2 Iowa 0.0 0.0 2.9 0.0 0.5 Kansas 5.6 3.3 5.8 0.0 4.4 Kentucky 0.0 4.0 2.3 0.0 2.6 Louisiana 0.0 0.0 1.5 6.3 1.4 Maine 10.5 4.0 0.0 0.0 5.9 Maryland 0.0 0.0 0.9 0.0 0.5 Massachusetts 0.0 2.7 1.2 0.0 1.4 Michigan 0.0 4.3 4.1 7.1 3.9 Minnesota 3.6 4.5 5.3 0.0 4.3 Mississippi 0.0 1.1 3.7 0.0 2.1 Missouri 2.6 3.4 5.4 5.3 4.4 Montana 0.0 0.0 0.0 0.0 0.0 Nebraska 0.0 0.0 0.0 0.0 0.0 Nevada 0.0 0.0 8.3 16.7 6.0 New Hampshire 0.0 6.3 3.6 25.0 5.5 New Jersey 0.0 0.0 5.0 7.0 4.1 New Mexico 0.0 15.4 9.1 0.0 10.3 New York 0.0 3.1 3.9 2.1 2.9 North Carolina 0.0 0.7 1.8 7.7 1.4 North Dakota 0.0 0.0 0.0 0.0 0.0 Ohio 0.0 2.0 0.9 0.0 1.3 Oklahoma 6.3 12.2 12.6 0.0 11.6 Oregon 4.5 0.0 2.3 0.0 1.6 Pennsylvania 0.0 0.6 0.0 0.0 0.1 Rhode Island 0.0 6.1 7.7 0.0 5.7 South Carolina 2.2 1.9 6.0 0.0 3.6 South Dakota 0.0 0.0 0.0 0.0 0.0 Tennessee 0.0 2.3 2.5 0.0 2.0 Texas 2.3 5.3 6.8 9.4 6.0 Utah 5.9 7.4 0.0 0.0 4.3 Vermont 0.0 6.7 0.0 n/a 2.4 Virginia 0.0 1.1 2.1 0.0 1.4 Washington 6.3 2.0 4.1 0.0 3.4 West Virginia 0.0 21.1 4.5 n/a 10.4 Wisconsin 4.3 7.9 8.8 20.0 8.1 Wyoming 11.1 7.7 0.0 n/a 6.1
Source: CASPER
112 Nursing Home Data Compendium 2013

Table 2.10.d. Nursing Home Surveys Resulting in a Citation for Substandard Quality of Care by Bed Size Category: United States, 2011
Percentage by Bed Size Category <50 50-99 100-199 >199 All Facilities
Nation 2.0 3.4 3.8 3.0 3.4 Alabama 0.0 1.1 3.3 0.0 2.2 Alaska 9.1 0.0 0.0 n/a 6.3 Arizona 0.0 0.0 0.0 8.3 0.8 Arkansas 0.0 9.7 7.9 0.0 8.3 California 0.5 2.9 1.0 2.2 2.0 Colorado 0.0 3.1 0.0 0.0 1.4 Connecticut 11.1 1.5 5.0 0.0 4.1 Delaware 0.0 0.0 0.0 0.0 0.0 District of Columbia 0.0 0.0 16.7 0.0 5.3 Florida 0.0 0.0 0.4 0.0 0.3 Georgia 6.3 1.6 0.8 0.0 1.4 Hawaii 0.0 0.0 0.0 0.0 0.0 Idaho 0.0 8.3 3.7 n/a 4.0 Illinois 2.2 4.8 5.0 8.8 5.2 Indiana 2.8 5.0 1.8 0.0 3.2 Iowa 2.0 0.0 0.0 0.0 0.5 Kansas 1.8 5.9 2.4 0.0 3.9 Kentucky 0.0 4.9 2.2 0.0 3.0 Louisiana 0.0 6.7 5.7 6.7 5.6 Maine 2.9 6.7 0.0 0.0 4.3 Maryland 0.0 2.0 1.6 0.0 1.4 Massachusetts 0.0 1.0 1.7 0.0 1.3 Michigan 4.4 2.9 8.1 7.4 6.1 Minnesota 2.3 4.9 4.4 0.0 4.1 Mississippi 0.0 2.1 1.2 0.0 1.5 Missouri 0.0 2.1 5.2 6.7 3.4 Montana 3.7 0.0 0.0 0.0 1.2 Nebraska 1.5 0.0 0.0 0.0 0.5 Nevada 0.0 0.0 7.7 0.0 3.9 New Hampshire 0.0 3.3 5.7 0.0 3.8 New Jersey 2.9 3.5 3.7 5.0 3.8 New Mexico 25.0 15.0 15.6 0.0 16.1 New York 0.0 4.1 1.9 0.8 1.7 North Carolina 0.0 4.1 2.3 0.0 2.6 North Dakota 0.0 0.0 0.0 0.0 0.0 Ohio 3.3 0.8 1.1 4.2 1.3 Oklahoma 10.0 13.6 26.0 33.3 18.6 Oregon 6.7 0.0 2.6 n/a 2.1 Pennsylvania 1.0 0.5 0.8 1.2 0.8 Rhode Island 0.0 0.0 2.4 0.0 1.1 South Carolina 0.0 1.9 4.9 0.0 2.8 South Dakota 1.5 5.0 0.0 n/a 2.6 Tennessee 7.1 2.5 1.3 6.7 2.6 Texas 2.2 6.4 6.3 5.3 6.0 Utah 0.0 0.0 16.7 0.0 5.1 Vermont 6.7 0.0 0.0 n/a 2.2 Virginia 0.0 0.0 2.6 6.7 1.7 Washington 3.0 3.2 9.3 0.0 5.7 West Virginia 0.0 12.5 9.1 n/a 8.5 Wisconsin 4.3 3.7 6.8 0.0 4.8 Wyoming 0.0 0.0 0.0 n/a 0.0
Source: CASPER
Nursing Home Data Compendium 2013 113

Table 2.10.e. Nursing Home Surveys Resulting in a Citation for Substandard Quality of Care by Bed Size Category: United States, 2012
Percentage by Bed Size Category <50 50-99 100-199 >199 All Facilities
Nation 2.3 3.0 3.4 2.4 3.1 Alabama 0.0 0.0 0.8 0.0 0.4 Alaska 0.0 25.0 0.0 n/a 6.3 Arizona 9.1 0.0 3.0 0.0 2.6 Arkansas 50.0 9.4 6.3 0.0 8.6 California 3.0 0.8 1.6 0.0 1.3 Colorado 0.0 0.0 6.1 0.0 2.7 Connecticut 0.0 1.5 2.6 11.8 2.8 Delaware 0.0 12.5 5.3 0.0 6.1 District of Columbia 0.0 0.0 0.0 0.0 0.0 Florida 0.0 0.8 0.9 3.1 0.9 Georgia 0.0 2.3 1.4 4.3 1.9 Hawaii 0.0 0.0 0.0 0.0 0.0 Idaho 10.5 0.0 5.0 n/a 5.4 Illinois 4.3 5.0 3.4 0.0 3.5 Indiana 4.7 2.0 2.3 0.0 2.5 Iowa 0.0 0.8 1.6 0.0 0.7 Kansas 3.2 0.7 0.0 0.0 1.4 Kentucky 0.0 3.6 6.9 0.0 4.3 Louisiana 0.0 4.4 4.4 13.3 4.6 Maine 0.0 2.0 0.0 0.0 0.9 Maryland 0.0 2.3 0.0 4.8 0.9 Massachusetts 0.0 0.9 1.2 0.0 0.9 Michigan 4.1 5.5 6.0 7.4 5.7 Minnesota 5.9 4.5 6.3 9.1 5.4 Mississippi 0.0 5.6 6.6 0.0 5.6 Missouri 0.0 1.8 5.8 0.0 3.5 Montana 0.0 0.0 4.0 0.0 1.2 Nebraska 3.4 1.1 2.8 0.0 2.1 Nevada 7.7 0.0 3.7 0.0 3.6 New Hampshire 0.0 0.0 0.0 0.0 0.0 New Jersey 0.0 1.9 0.5 1.8 0.9 New Mexico 0.0 18.8 10.0 0.0 12.0 New York 2.1 2.1 2.5 2.1 2.3 North Carolina 0.0 2.6 2.7 0.0 2.4 North Dakota 0.0 0.0 0.0 0.0 0.0 Ohio 1.5 1.2 2.0 4.0 1.6 Oklahoma 4.2 15.6 18.1 33.3 15.9 Oregon 0.0 3.6 0.0 0.0 1.7 Pennsylvania 0.0 0.0 0.3 0.0 0.1 Rhode Island 9.1 3.2 2.8 0.0 3.7 South Carolina 2.5 3.7 5.8 0.0 4.3 South Dakota 2.4 1.8 0.0 n/a 1.9 Tennessee 0.0 6.7 3.5 0.0 4.0 Texas 2.1 6.0 6.5 8.6 6.1 Utah 4.5 7.7 4.3 100 6.8 Vermont 0.0 0.0 0.0 n/a 0.0 Virginia 0.0 1.2 0.7 0.0 0.7 Washington 3.3 1.2 0.0 0.0 0.9 West Virginia 0.0 7.9 3.1 0.0 5.0 Wisconsin 3.8 5.0 6.6 9.1 5.5 Wyoming 0.0 0.0 0.0 n/a 0.0
Source: CASPER
114 Nursing Home Data Compendium 2013

Table 2.10.f. Nursing Home Surveys Resulting in a Citation for Substandard Quality of Care by Bed Size Category: United States (2008, 2012 and Change)
Percentage in 2008, 2012 and Percent Change (% Δ), by Bed Size Category <50 50-99 100-199 >199 All Facilities
2008 2012 % Δ 2008 2012 % Δ 2008 2012 % Δ 2008 2012 % Δ 2008 2012 % Δ
Nation 2.9 2.3 -20.5 4.3 3.0 -30.5 5.0 3.4 -31.1 5.0 2.4 -50.7 4.4 3.1 -31.0 Alabama 0.0 0.0 n/a 1.1 0.0 -100 3.1 0.8 -73.2 0.0 0.0 n/a 2.0 0.4 -77.8 Alaska 11.1 0.0 -100 33.3 25.0 -25.0 n/a 0.0 n/a 0.0 n/a n/a 15.4 6.3 -59.4 Arizona 6.7 9.1 +36.4 5.6 0.0 -100 11.1 3.0 -72.7 0.0 0.0 n/a 8.2 2.6 -67.9 Arkansas 10.0 50.0 +400 10.3 9.4 -8.4 6.2 6.3 +1.3 0.0 0.0 n/a 7.8 8.6 +10.6 California 4.1 3.0 -27.3 3.3 0.8 -76.4 5.3 1.6 -70.0 5.9 0.0 -100 4.1 1.3 -67.6 Colorado 2.9 0.0 -100 5.3 0.0 -100 4.9 6.1 +24.0 0.0 0.0 n/a 4.6 2.7 -41.4 Connecticut 0.0 0.0 n/a 0.0 1.5 n/a 3.8 2.6 -31.6 4.5 11.8 +159 2.5 2.8 +14.6 Delaware 0.0 0.0 n/a 0.0 12.5 n/a 0.0 5.3 n/a 0.0 0.0 n/a 0.0 6.1 n/a District of Columbia 0.0 0.0 n/a 20.0 0.0 -100 0.0 0.0 n/a 20.0 0.0 -100 11.8 0.0 -100 Florida 0.0 0.0 n/a 2.4 0.8 -64.4 2.5 0.9 -64.5 0.0 3.1 n/a 2.2 0.9 -57.3 Georgia 11.1 0.0 -100 2.7 2.3 -14.9 3.2 1.4 -55.4 4.0 4.3 +8.7 3.7 1.9 -48.2 Hawaii 0.0 0.0 n/a 0.0 0.0 n/a 6.7 0.0 -100 0.0 0.0 n/a 2.0 0.0 -100 Idaho 5.6 10.5 +89.5 4.8 0.0 -100 12.0 5.0 -58.3 n/a n/a n/a 7.8 5.4 -31.4 Illinois 1.0 4.3 +330 4.4 5.0 +13.8 4.8 3.4 -28.5 7.2 0.0 -100 4.6 3.5 -22.6 Indiana 5.6 4.7 -16.6 4.6 2.0 -56.4 4.6 2.3 -48.6 18.2 0.0 -100 5.1 2.5 -51.3 Iowa 0.0 0.0 n/a 0.8 0.8 +2.5 5.3 1.6 -69.4 0.0 0.0 n/a 1.2 0.7 -40.1 Kansas 8.0 3.2 -60.1 5.4 0.7 -86.6 2.0 0.0 -100 0.0 0.0 n/a 5.7 1.4 -74.8 Kentucky 2.1 0.0 -100 9.0 3.6 -60.0 10.2 6.9 -32.5 0.0 0.0 n/a 8.2 4.3 -47.1 Louisiana 0.0 0.0 n/a 2.4 4.4 +86.7 5.7 4.4 -23.3 5.6 13.3 +140 4.7 4.6 -2.1 Maine 4.7 0.0 -100 1.8 2.0 +11.8 0.0 0.0 n/a 0.0 0.0 n/a 2.7 0.9 -64.8 Maryland 0.0 0.0 n/a 6.1 2.3 -62.9 1.7 0.0 -100 0.0 4.8 n/a 2.4 0.9 -61.3 Massachusetts 0.0 0.0 n/a 0.9 0.9 0.0 0.0 1.2 n/a 0.0 0.0 n/a 0.2 0.9 +321 Michigan 5.0 4.1 -18.4 3.5 5.5 +55.6 5.8 6.0 +4.3 10.0 7.4 -25.9 5.3 5.7 +8.9 Minnesota 5.4 5.9 +9.9 4.8 4.5 -6.5 3.9 6.3 +63.0 7.7 9.1 +18.2 4.8 5.4 +12.5 Mississippi 0.0 0.0 n/a 10.4 5.6 -45.9 19.0 6.6 -65.5 25.0 0.0 -100 13.1 5.6 -57.7 Missouri 4.4 0.0 -100 4.7 1.8 -61.9 8.1 5.8 -27.5 10.0 0.0 -100 6.3 3.5 -44.9 Montana 0.0 0.0 n/a 0.0 0.0 n/a 8.7 4.0 -54.0 0.0 0.0 n/a 2.4 1.2 -49.4 Nebraska 2.5 3.4 +33.9 1.8 1.1 -39.6 2.2 2.8 +27.8 0.0 0.0 n/a 2.1 2.1 +2.1 Nevada 0.0 7.7 n/a 0.0 0.0 n/a 0.0 3.7 n/a 16.7 0.0 -100 2.0 3.6 +78.2 New Hampshire 8.3 0.0 -100 2.6 0.0 -100 12.9 0.0 -100 0.0 0.0 n/a 7.0 0.0 -100 New Jersey 2.9 0.0 -100 5.1 1.9 -62.9 5.5 0.5 -91.2 6.7 1.8 -73.2 5.4 0.9 -84.0 New Mexico 0.0 0.0 n/a 14.8 18.8 +26.6 12.9 10.0 -22.5 0.0 0.0 n/a 11.6 12.0 +3.5 New York 0.0 2.1 n/a 1.0 2.1 +117 3.1 2.5 -19.7 2.9 2.1 -25.2 2.5 2.3 -7.5 North Carolina 2.0 0.0 -100 1.2 2.6 +109 2.2 2.7 +23.3 16.7 0.0 -100 2.2 2.4 +6.1 North Dakota 0.0 0.0 n/a 0.0 0.0 n/a 5.0 0.0 -100 0.0 0.0 n/a 1.2 0.0 -100 Ohio 0.9 1.5 +68.2 1.8 1.2 -35.7 2.1 2.0 -3.1 0.0 4.0 n/a 1.8 1.6 -7.2 Oklahoma 6.5 4.2 -35.4 10.3 15.6 +50.9 20.3 18.1 -10.9 33.3 33.3 0.0 14.3 15.9 +11.6 Oregon 0.0 0.0 n/a 4.8 3.6 -24.8 2.1 0.0 -100 0.0 0.0 n/a 3.0 1.7 -45.0 Pennsylvania 0.0 0.0 n/a 1.7 0.0 -100 0.5 0.3 -49.7 2.4 0.0 -100 0.9 0.1 -85.2 Rhode Island 0.0 9.1 n/a 6.1 3.2 -46.8 2.6 2.8 +8.3 0.0 0.0 n/a 3.4 3.7 +6.1 South Carolina 2.9 2.5 -12.5 1.8 3.7 +104 5.3 5.8 +10.5 20.0 0.0 -100 4.1 4.3 +5.1 South Dakota 0.0 2.4 n/a 0.0 1.8 n/a 0.0 0.0 n/a n/a n/a n/a 0.0 1.9 n/a Tennessee 12.9 0.0 -100 13.8 6.7 -51.8 6.5 3.5 -46.1 0.0 0.0 n/a 9.1 4.0 -56.3 Texas 4.0 2.1 -46.8 7.6 6.0 -21.5 8.3 6.5 -21.7 8.8 8.6 -2.9 7.7 6.1 -21.5 Utah 4.0 4.5 +13.6 3.4 7.7 +123 0.0 4.3 n/a 0.0 100 n/a 2.3 6.8 +198 Vermont 0.0 0.0 n/a 9.1 0.0 -100 0.0 0.0 n/a n/a n/a n/a 2.7 0.0 -100 Virginia 0.0 0.0 n/a 3.6 1.2 -66.7 1.4 0.7 -51.0 0.0 0.0 n/a 1.8 0.7 -60.0 Washington 0.0 3.3 n/a 3.2 1.2 -63.2 3.8 0.0 -100 0.0 0.0 n/a 2.9 0.9 -67.1 West Virginia 4.3 0.0 -100 3.6 7.9 +121 4.9 3.1 -35.9 0.0 0.0 n/a 4.1 5.0 +21.0 Wisconsin 7.5 3.8 -50.0 6.0 5.0 -17.5 9.9 6.6 -32.9 16.7 9.1 -45.5 7.9 5.5 -30.7 Wyoming 0.0 0.0 n/a 6.7 0.0 -100 0.0 0.0 n/a n/a n/a n/a 2.5 0.0 -100
Source: CASPER
Nursing Home Data Compendium 2013 115

Table 2.11.a. Nursing Home Surveys Resulting in a Citation for Substandard Quality of Care by Ownership Type: United States, 2008
Percentage by Ownership Type
For-Profit Non-Profit Government All Facilities Nation 4.9 3.2 4.8 4.4 Alabama 2.5 0.0 0.0 2.0 Alaska 33.3 0.0 20.0 15.4 Arizona 10.0 3.2 0.0 8.2 Arkansas 7.6 8.1 10.0 7.8 California 4.8 1.0 2.1 4.1 Colorado 4.8 6.1 0.0 4.6 Connecticut 1.6 5.9 0.0 2.5 Delaware 0.0 0.0 0.0 0.0 District of Columbia 16.7 11.1 0.0 11.8 Florida 2.0 2.8 0.0 2.2 Georgia 2.6 5.2 8.7 3.7 Hawaii 0.0 0.0 7.7 2.0 Idaho 6.8 0.0 18.2 7.8 Illinois 4.7 3.3 11.5 4.6 Indiana 5.4 3.9 6.9 5.1 Iowa 1.8 0.5 0.0 1.2 Kansas 3.1 7.6 9.1 5.7 Kentucky 8.7 6.3 20.0 8.2 Louisiana 5.8 1.9 0.0 4.7 Maine 3.8 0.0 0.0 2.7 Maryland 3.6 0.0 0.0 2.4 Massachusetts 0.3 0.0 0.0 0.2 Michigan 6.4 3.8 0.0 5.3 Minnesota 6.7 4.3 2.6 4.8 Mississippi 13.7 10.0 14.8 13.1 Missouri 6.6 6.0 5.0 6.3 Montana 5.3 0.0 0.0 2.4 Nebraska 2.7 0.0 3.6 2.1 Nevada 2.9 0.0 0.0 2.0 New Hampshire 11.9 0.0 7.7 7.0 New Jersey 4.6 7.3 5.0 5.4 New Mexico 13.0 11.1 0.0 11.6 New York 2.7 1.8 4.7 2.5 North Carolina 1.8 2.9 9.1 2.2 North Dakota 0.0 1.4 0.0 1.2 Ohio 1.9 1.5 0.0 1.8 Oklahoma 14.8 9.7 15.4 14.3 Oregon 3.7 0.0 0.0 3.0 Pennsylvania 0.8 1.2 0.0 0.9 Rhode Island 4.3 0.0 n/a 3.4 South Carolina 3.8 0.0 11.1 4.1 South Dakota 0.0 0.0 0.0 0.0 Tennessee 9.5 8.5 5.6 9.1 Texas 8.2 5.7 3.0 7.7 Utah 1.4 7.7 0.0 2.3 Vermont 4.0 0.0 0.0 2.7 Virginia 2.7 0.0 0.0 1.8 Washington 3.5 1.9 0.0 2.9 West Virginia 4.9 3.4 0.0 4.1 Wisconsin 8.3 6.3 10.3 7.9 Wyoming 5.9 0.0 0.0 2.5
Source: CASPER
116 Nursing Home Data Compendium 2013

Table 2.11.b. Nursing Home Surveys Resulting in a Citation for Substandard Quality of Care by Ownership Type: United States, 2009
Percentage by Ownership Type
For-Profit Non-Profit Government All Facilities Nation 4.2 2.7 3.2 3.7 Alabama 1.2 0.0 0.0 0.9 Alaska 0.0 14.3 0.0 5.9 Arizona 8.7 0.0 0.0 6.8 Arkansas 11.0 16.7 0.0 11.3 California 3.0 2.2 4.7 2.9 Colorado 2.0 4.3 0.0 2.3 Connecticut 3.3 2.2 0.0 3.0 Delaware 0.0 0.0 0.0 0.0 District of Columbia 0.0 0.0 0.0 0.0 Florida 0.8 0.0 0.0 0.6 Georgia 4.9 5.4 0.0 4.7 Hawaii 0.0 0.0 0.0 0.0 Idaho 6.5 0.0 0.0 4.1 Illinois 4.5 2.3 3.3 3.9 Indiana 2.8 2.2 0.0 2.5 Iowa 0.0 0.0 0.0 0.0 Kansas 3.6 7.5 7.9 5.7 Kentucky 6.4 0.0 0.0 4.5 Louisiana 2.8 3.6 6.3 3.2 Maine 4.1 3.3 0.0 3.8 Maryland 1.3 4.1 0.0 2.2 Massachusetts 1.8 0.0 0.0 1.3 Michigan 5.6 3.8 0.0 4.7 Minnesota 3.7 5.7 4.8 5.0 Mississippi 2.1 2.9 0.0 2.0 Missouri 5.3 4.1 5.0 5.0 Montana 0.0 5.1 5.9 3.0 Nebraska 1.0 1.5 0.0 0.9 Nevada 5.4 14.3 0.0 6.0 New Hampshire 0.0 3.7 0.0 1.2 New Jersey 10.9 5.2 9.5 9.2 New Mexico 10.4 5.6 0.0 8.3 New York 2.7 2.5 8.2 3.0 North Carolina 2.2 0.0 0.0 1.7 North Dakota 0.0 1.4 0.0 1.2 Ohio 2.2 0.5 0.0 1.8 Oklahoma 19.4 23.7 9.1 19.6 Oregon 3.5 0.0 0.0 2.9 Pennsylvania 1.1 0.6 2.3 0.9 Rhode Island 7.5 11.1 n/a 8.2 South Carolina 5.4 0.0 11.8 5.1 South Dakota 2.7 1.4 0.0 1.8 Tennessee 6.9 0.0 0.0 5.2 Texas 7.0 4.1 3.2 6.5 Utah 1.5 0.0 0.0 1.3 Vermont 3.7 0.0 0.0 2.6 Virginia 1.7 1.3 0.0 1.5 Washington 2.2 0.0 0.0 1.6 West Virginia 1.2 0.0 0.0 0.8 Wisconsin 3.8 5.1 7.7 4.8 Wyoming 0.0 0.0 10.5 5.6
Source: CASPER
Nursing Home Data Compendium 2013 117

Table 2.11.c. Nursing Home Surveys Resulting in a Citation for Substandard Quality of Care by Ownership Type: United States, 2010
Percentage by Ownership Type
For-Profit Non-Profit Government All Facilities Nation 3.7 2.3 3.5 3.4Alabama 1.1 6.5 6.3 2.1 Alaska 0.0 20.0 14.3 13.3 Arizona 4.6 4.5 0.0 4.5 Arkansas 12.6 14.7 11.1 12.8 California 3.3 2.9 0.0 3.1 Colorado 2.1 8.1 12.5 4.1 Connecticut 6.0 0.0 0.0 4.7 Delaware 0.0 0.0 0.0 0.0 District of Columbia 22.2 12.5 0.0 15.8 Florida 1.7 2.3 0.0 1.8 Georgia 2.3 4.5 0.0 2.9 Hawaii 5.6 0.0 16.7 5.4 Idaho 1.9 0.0 0.0 1.3 Illinois 4.4 1.0 6.9 3.7 Indiana 2.1 1.7 4.3 2.2 Iowa 0.4 0.6 0.0 0.5 Kansas 3.3 4.7 7.3 4.4 Kentucky 1.8 4.9 0.0 2.6 Louisiana 1.8 0.0 0.0 1.4 Maine 5.7 6.5 0.0 5.9 Maryland 0.8 0.0 0.0 0.5 Massachusetts 1.3 1.6 0.0 1.4 Michigan 5.5 0.0 2.7 3.9 Minnesota 3.4 4.3 6.7 4.3 Mississippi 1.4 6.3 3.6 2.1 Missouri 4.8 4.0 0.0 4.4 Montana 0.0 0.0 0.0 0.0 Nebraska 0.0 0.0 0.0 0.0 Nevada 8.1 0.0 0.0 6.0 New Hampshire 8.6 0.0 9.1 5.5 New Jersey 5.5 1.1 0.0 4.1 New Mexico 8.3 18.8 0.0 10.3 New York 2.4 3.5 2.5 2.9 North Carolina 1.9 0.0 0.0 1.4 North Dakota 0.0 0.0 0.0 0.0 Ohio 1.5 0.6 0.0 1.3 Oklahoma 12.9 6.1 0.0 11.6 Oregon 1.9 0.0 0.0 1.6 Pennsylvania 0.0 0.3 0.0 0.1 Rhode Island 6.9 0.0 n/a 5.7 South Carolina 4.7 0.0 0.0 3.6 South Dakota 0.0 0.0 0.0 0.0 Tennessee 2.2 0.0 7.1 2.0 Texas 6.5 2.8 6.5 6.0 Utah 5.3 0.0 0.0 4.3 Vermont 3.8 0.0 0.0 2.4 Virginia 1.6 0.0 8.3 1.4 Washington 3.4 4.5 0.0 3.4 West Virginia 12.9 0.0 16.7 10.4 Wisconsin 9.6 6.5 6.5 8.1 Wyoming 7.1 0.0 7.7 6.1
Source: CASPER
118 Nursing Home Data Compendium 2013

Table 2.11.d. Nursing Home Surveys Resulting in a Citation for Substandard Quality of Care by Ownership Type: United States, 2011
Percentage by Ownership Type
For-Profit Non-Profit Government All Facilities
Nation 3.8 2.2 3.4 3.4 Alabama 2.7 0.0 0.0 2.2 Alaska 0.0 0.0 20.0 6.3 Arizona 0.0 4.0 0.0 0.8 Arkansas 9.0 3.0 11.1 8.3 California 2.4 0.0 0.0 2.0 Colorado 2.0 0.0 0.0 1.4 Connecticut 2.9 8.5 0.0 4.1 Delaware 0.0 0.0 0.0 0.0 District of Columbia 0.0 9.1 n/a 5.3 Florida 0.4 0.0 0.0 0.3 Georgia 1.4 1.7 0.0 1.4 Hawaii 0.0 0.0 0.0 0.0 Idaho 6.0 0.0 0.0 4.0 Illinois 5.9 2.5 10.0 5.2 Indiana 4.2 1.7 0.0 3.2 Iowa 0.9 0.0 0.0 0.5 Kansas 3.8 4.6 2.4 3.9 Kentucky 3.4 1.7 0.0 3.0 Louisiana 4.4 11.4 8.3 5.6 Maine 4.6 3.6 0.0 4.3 Maryland 1.9 0.0 0.0 1.4 Massachusetts 1.7 0.0 0.0 1.3 Michigan 6.4 5.8 5.1 6.1 Minnesota 1.8 4.1 10.8 4.1 Mississippi 1.9 0.0 0.0 1.5 Missouri 3.8 2.1 2.8 3.4 Montana 0.0 0.0 6.3 1.2 Nebraska 0.0 1.7 0.0 0.5 Nevada 5.0 0.0 0.0 3.9 New Hampshire 7.1 0.0 0.0 3.8 New Jersey 4.3 2.1 5.0 3.8 New Mexico 11.1 16.7 60.0 16.1 New York 1.1 2.3 2.1 1.7 North Carolina 3.1 1.1 0.0 2.6 North Dakota 0.0 0.0 0.0 0.0 Ohio 1.3 1.2 0.0 1.3 Oklahoma 17.8 25.6 12.5 18.6 Oregon 2.6 0.0 0.0 2.1 Pennsylvania 1.3 0.3 0.0 0.8 Rhode Island 1.4 0.0 n/a 1.1 South Carolina 3.6 0.0 0.0 2.8 South Dakota 2.4 3.1 0.0 2.6 Tennessee 2.9 0.0 7.1 2.6 Texas 6.2 4.0 8.8 6.0 Utah 6.9 0.0 0.0 5.1 Vermont 3.2 0.0 0.0 2.2 Virginia 2.0 1.2 0.0 1.7 Washington 7.7 0.0 0.0 5.7 West Virginia 12.1 0.0 20.0 8.5 Wisconsin 5.6 3.1 5.8 4.8 Wyoming 0.0 0.0 0.0 0.0
Source: CASPER
Nursing Home Data Compendium 2013 119

Table 2.11.e. Nursing Home Surveys Resulting in a Citation for Substandard Quality of Care by Ownership Type: United States, 2012
Percentage by Ownership Type
For-Profit Non-Profit Government All Facilities Nation 3.4 2.2 2.6 3.1 Alabama 0.5 0.0 0.0 0.4 Alaska 100 0.0 0.0 6.3 Arizona 3.2 0.0 0.0 2.6 Arkansas 7.2 16.1 10.0 8.6 California 1.4 0.0 4.8 1.3 Colorado 3.0 2.9 0.0 2.7 Connecticut 3.0 2.4 0.0 2.8 Delaware 8.7 0.0 0.0 6.1 District of Columbia 0.0 0.0 n/a 0.0 Florida 1.1 0.6 0.0 0.9 Georgia 2.3 1.3 0.0 1.9 Hawaii 0.0 0.0 0.0 0.0 Idaho 2.6 0.0 22.2 5.4 Illinois 3.6 3.3 3.4 3.5 Indiana 2.6 4.0 0.0 2.5 Iowa 0.8 0.6 0.0 0.7 Kansas 1.3 2.0 0.0 1.4 Kentucky 4.8 3.3 0.0 4.3 Louisiana 4.4 4.8 7.7 4.6 Maine 1.3 0.0 0.0 0.9 Maryland 1.3 0.0 0.0 0.9 Massachusetts 1.3 0.0 0.0 0.9 Michigan 7.2 1.8 5.1 5.7 Minnesota 5.2 5.1 8.1 5.4 Mississippi 4.4 15.8 3.8 5.6 Missouri 4.2 1.0 3.3 3.5 Montana 0.0 3.0 0.0 1.2 Nebraska 3.2 0.0 2.4 2.1 Nevada 0.0 0.0 33.3 3.6 New Hampshire 0.0 0.0 0.0 0.0 New Jersey 0.8 1.2 0.0 0.9 New Mexico 14.8 6.3 0.0 12.0 New York 1.5 2.8 4.8 2.3 North Carolina 2.8 1.1 0.0 2.4 North Dakota 0.0 0.0 0.0 0.0 Ohio 1.8 1.4 0.0 1.6 Oklahoma 16.5 16.7 0.0 15.9 Oregon 2.0 0.0 0.0 1.7 Pennsylvania 0.0 0.3 0.0 0.1 Rhode Island 4.5 0.0 n/a 3.7 South Carolina 5.7 0.0 0.0 4.3 South Dakota 0.0 3.0 0.0 1.9 Tennessee 4.4 3.1 0.0 4.0 Texas 6.8 1.6 0.0 6.1 Utah 7.8 0.0 0.0 6.8 Vermont 0.0 0.0 0.0 0.0 Virginia 1.1 0.0 0.0 0.7 Washington 0.6 2.5 0.0 0.9 West Virginia 4.8 8.3 0.0 5.0 Wisconsin 4.5 6.7 6.3 5.5 Wyoming 0.0 0.0 0.0 0.0
Source: CASPER
120 Nursing Home Data Compendium 2013

Table 2.11.f. Nursing Home Surveys Resulting in a Citation for Substandard Quality of Care by Ownership Type: United States (2008, 2012 and Change)
Percentage in 2008, 2012 and Percent Change (% Δ), by Ownership Type For-Profit Non-Profit Government All Facilities
2008 2012 % Δ 2008 2012 % Δ 2008 2012 % Δ 2008 2012 % Δ Nation 4.9 3.4 -30.6 3.2 2.2 -30.5 4.8 2.6 -45.9 4.4 3.1 -31.0 Alabama 2.5 0.5 -78.3 0.0 0.0 n/a 0.0 0.0 n/a 2.0 0.4 -77.8 Alaska 33.3 100 +200 0.0 0.0 n/a 20.0 0.0 -100 15.4 6.3 -59.4 Arizona 10.0 3.2 -68.4 3.2 0.0 -100 0.0 0.0 n/a 8.2 2.6 -67.9 Arkansas 7.6 7.2 -5.3 8.1 16.1 +98.9 10.0 10.0 0.0 7.8 8.6 +10.6 California 4.8 1.4 -70.5 1.0 0.0 -100 2.1 4.8 +124 4.1 1.3 -67.6 Colorado 4.8 3.0 -38.0 6.1 2.9 -53.3 0.0 0.0 n/a 4.6 2.7 -41.4 Connecticut 1.6 3.0 +89.5 5.9 2.4 -59.5 0.0 0.0 n/a 2.5 2.8 +14.6 Delaware 0.0 8.7 n/a 0.0 0.0 n/a 0.0 0.0 n/a 0.0 6.1 n/a District of Columbia 16.7 0.0 -100 11.1 0.0 -100 0.0 n/a n/a 11.8 0.0 -100 Florida 2.0 1.1 -47.1 2.8 0.6 -77.9 0.0 0.0 n/a 2.2 0.9 -57.3 Georgia 2.6 2.3 -9.8 5.2 1.3 -74.4 8.7 0.0 -100 3.7 1.9 -48.2 Hawaii 0.0 0.0 n/a 0.0 0.0 n/a 7.7 0.0 -100 2.0 0.0 -100 Idaho 6.8 2.6 -61.4 0.0 0.0 n/a 18.2 22.2 +22.2 7.8 5.4 -31.4 Illinois 4.7 3.6 -23.4 3.3 3.3 +0.5 11.5 3.4 -70.1 4.6 3.5 -22.6 Indiana 5.4 2.6 -51.8 3.9 4.0 +3.2 6.9 0.0 -100 5.1 2.5 -51.3 Iowa 1.8 0.8 -54.0 0.5 0.6 +8.9 0.0 0.0 n/a 1.2 0.7 -40.1 Kansas 3.1 1.3 -57.3 7.6 2.0 -73.9 9.1 0.0 -100 5.7 1.4 -74.8 Kentucky 8.7 4.8 -44.7 6.3 3.3 -47.3 20.0 0.0 -100 8.2 4.3 -47.1 Louisiana 5.8 4.4 -24.0 1.9 4.8 +157 0.0 7.7 n/a 4.7 4.6 -2.1 Maine 3.8 1.3 -64.4 0.0 0.0 n/a 0.0 0.0 n/a 2.7 0.9 -64.8 Maryland 3.6 1.3 -63.2 0.0 0.0 n/a 0.0 0.0 n/a 2.4 0.9 -61.3 Massachusetts 0.3 1.3 +321 0.0 0.0 n/a 0.0 0.0 n/a 0.2 0.9 +321 Michigan 6.4 7.2 +12.0 3.8 1.8 -53.2 0.0 5.1 n/a 5.3 5.7 +8.9 Minnesota 6.7 5.2 -23.2 4.3 5.1 +18.5 2.6 8.1 +208 4.8 5.4 +12.5 Mississippi 13.7 4.4 -67.6 10.0 15.8 +57.9 14.8 3.8 -74.0 13.1 5.6 -57.7 Missouri 6.6 4.2 -36.8 6.0 1.0 -83.7 5.0 3.3 -33.3 6.3 3.5 -44.9 Montana 5.3 0.0 -100 0.0 3.0 n/a 0.0 0.0 n/a 2.4 1.2 -49.4 Nebraska 2.7 3.2 +17.9 0.0 0.0 n/a 3.6 2.4 -32.9 2.1 2.1 +2.1 Nevada 2.9 0.0 -100 0.0 0.0 n/a 0.0 33.3 n/a 2.0 3.6 +78.2 New Hampshire 11.9 0.0 -100 0.0 0.0 n/a 7.7 0.0 -100 7.0 0.0 -100 New Jersey 4.6 0.8 -82.0 7.3 1.2 -83.8 5.0 0.0 -100 5.4 0.9 -84.0 New Mexico 13.0 14.8 +13.6 11.1 6.3 -43.7 0.0 0.0 n/a 11.6 12.0 +3.5 New York 2.7 1.5 -43.3 1.8 2.8 +55.1 4.7 4.8 +2.4 2.5 2.3 -7.5 North Carolina 1.8 2.8 +54.6 2.9 1.1 -60.9 9.1 0.0 -100 2.2 2.4 +6.1 North Dakota 0.0 0.0 n/a 1.4 0.0 -100 0.0 0.0 n/a 1.2 0.0 -100 Ohio 1.9 1.8 -8.0 1.5 1.4 -9.6 0.0 0.0 n/a 1.8 1.6 -7.2 Oklahoma 14.8 16.5 +11.9 9.7 16.7 +72.2 15.4 0.0 -100 14.3 15.9 +11.6 Oregon 3.7 2.0 -46.5 0.0 0.0 n/a 0.0 0.0 n/a 3.0 1.7 -45.0 Pennsylvania 0.8 0.0 -100 1.2 0.3 -72.3 0.0 0.0 n/a 0.9 0.1 -85.2 Rhode Island 4.3 4.5 +6.1 0.0 0.0 n/a n/a n/a n/a 3.4 3.7 +6.1 South Carolina 3.8 5.7 +48.7 0.0 0.0 n/a 11.1 0.0 -100 4.1 4.3 +5.1 South Dakota 0.0 0.0 n/a 0.0 3.0 n/a 0.0 0.0 n/a 0.0 1.9 n/a Tennessee 9.5 4.4 -53.4 8.5 3.1 -63.1 5.6 0.0 -100 9.1 4.0 -56.3 Texas 8.2 6.8 -17.0 5.7 1.6 -73.0 3.0 0.0 -100 7.7 6.1 -21.5 Utah 1.4 7.8 +465 7.7 0.0 -100 0.0 0.0 n/a 2.3 6.8 +198 Vermont 4.0 0.0 -100 0.0 0.0 n/a 0.0 0.0 n/a 2.7 0.0 -100 Virginia 2.7 1.1 -60.0 0.0 0.0 n/a 0.0 0.0 n/a 1.8 0.7 -60.0 Washington 3.5 0.6 -82.1 1.9 2.5 +32.5 0.0 0.0 n/a 2.9 0.9 -67.1 West Virginia 4.9 4.8 -2.0 3.4 8.3 +142 0.0 0.0 n/a 4.1 5.0 +21.0 Wisconsin 8.3 4.5 -45.2 6.3 6.7 +6.1 10.3 6.3 -39.6 7.9 5.5 -30.7 Wyoming 5.9 0.0 -100 0.0 0.0 n/a 0.0 0.0 n/a 2.5 0.0 -100
Source: CASPER
Nursing Home Data Compendium 2013 121

Table 2.12.a. Nursing Home Surveys Resulting in a Citation for Use of Restraints by Bed Size Category: United States, 2008
Percentage by Bed Size Category <50 50-99 100-199 >199 All Facilities
Nation 7.2 10.0 10.6 13.2 10.0 Alabama 0.0 3.2 3.1 11.1 3.5 Alaska 11.1 0.0 n/a 0.0 7.7 Arizona 0.0 2.8 2.8 9.1 3.0 Arkansas 0.0 15.9 20.4 25.0 18.0 California 10.6 16.8 26.1 39.2 19.0 Colorado 11.4 13.8 22.2 16.7 16.7 Connecticut 6.3 7.9 4.6 13.6 6.6 Delaware 11.1 11.1 13.3 100 14.3 District of Columbia 0.0 20.0 25.0 20.0 17.6 Florida 2.5 3.9 4.6 9.7 4.6 Georgia 14.8 9.0 8.4 24.0 10.2 Hawaii 15.0 16.7 26.7 33.3 20.0 Idaho 5.6 9.5 20.0 n/a 12.5 Illinois 5.1 11.7 18.2 18.4 14.3 Indiana 12.4 20.8 17.3 36.4 18.2 Iowa 3.4 7.2 14.0 33.3 7.3 Kansas 13.0 9.7 4.1 0.0 9.8 Kentucky 6.4 9.0 9.3 0.0 8.6 Louisiana 0.0 7.1 10.9 11.1 9.4 Maine 2.3 0.0 0.0 50.0 1.8 Maryland 0.0 4.1 10.2 5.3 7.1 Massachusetts 3.2 1.8 2.3 0.0 2.2 Michigan 2.5 5.6 9.3 26.7 8.7 Minnesota 14.9 12.9 15.5 23.1 14.4 Mississippi 15.8 8.5 10.7 25.0 10.3 Missouri 17.8 20.9 22.0 35.0 21.6 Montana 12.9 0.0 8.7 0.0 7.1 Nebraska 5.1 2.7 4.3 20.0 4.2 Nevada 18.2 22.2 34.8 16.7 26.5 New Hampshire 0.0 2.6 0.0 0.0 1.2 New Jersey 0.0 0.0 3.7 1.7 2.4 New Mexico 11.1 3.7 19.4 0.0 11.6 New York 4.3 8.7 7.4 7.8 7.5 North Carolina 0.0 4.3 9.3 0.0 6.2 North Dakota 0.0 6.7 5.0 0.0 3.7 Ohio 9.9 13.0 12.4 0.0 12.0 Oklahoma 19.4 25.2 20.3 33.3 22.9 Oregon 9.1 4.8 4.3 0.0 5.3 Pennsylvania 4.1 3.9 7.5 10.8 6.6 Rhode Island 8.3 0.0 0.0 0.0 1.1 South Carolina 0.0 7.3 2.6 20.0 4.1 South Dakota 10.7 9.4 10.0 n/a 10.1 Tennessee 6.5 8.5 12.9 5.6 10.4 Texas 3.0 7.6 7.7 11.8 7.4 Utah 4.0 0.0 6.1 0.0 3.4 Vermont 9.1 27.3 26.7 n/a 21.6 Virginia 0.0 4.8 5.7 6.7 4.8 Washington 2.6 1.1 4.7 0.0 2.9 West Virginia 8.7 3.6 17.1 0.0 9.1 Wisconsin 9.4 3.5 7.0 0.0 5.4 Wyoming 0.0 13.3 0.0 n/a 5.0
Source: CASPER
122 Nursing Home Data Compendium 2013

Table 2.12.b. Nursing Home Surveys Resulting in a Citation for Use of Restraints by Bed Size Category: United States, 2009
Percentage by Bed Size Category <50 50-99 100-199 >199 All Facilities
Nation 5.8 9.7 9.0 11.5 9.0 Alabama 0.0 0.0 6.8 21.4 5.0 Alaska 0.0 0.0 n/a 0.0 0.0 Arizona 0.0 0.0 14.5 12.5 8.5 Arkansas 0.0 20.2 14.3 0.0 15.8 California 12.2 21.4 24.8 29.3 21.0 Colorado 8.6 10.7 11.2 11.1 10.6 Connecticut 0.0 7.1 2.3 6.3 3.9 Delaware 0.0 12.5 7.7 0.0 7.0 District of Columbia 0.0 20.0 12.5 60.0 23.8 Florida 0.0 0.8 3.2 2.7 2.5 Georgia 4.0 5.7 7.1 12.0 6.8 Hawaii 10.5 33.3 13.3 50.0 18.8 Idaho 0.0 3.8 4.3 n/a 2.7 Illinois 3.0 9.3 13.5 13.7 10.7 Indiana 6.5 13.4 16.1 28.6 14.0 Iowa 3.6 4.7 7.9 25.0 5.1 Kansas 14.9 10.6 2.4 0.0 10.6 Kentucky 4.4 9.5 5.1 0.0 6.6 Louisiana 4.5 9.8 9.3 12.5 9.2 Maine 2.3 2.0 0.0 0.0 1.9 Maryland 3.6 4.1 6.2 4.0 5.2 Massachusetts 0.0 2.6 4.4 5.3 3.4 Michigan 2.1 7.2 7.9 7.7 7.1 Minnesota 12.5 10.5 6.8 0.0 9.6 Mississippi 0.0 7.8 11.9 50.0 9.3 Missouri 11.9 17.0 17.9 23.1 17.2 Montana 5.9 5.9 13.8 50.0 9.1 Nebraska 1.3 3.2 7.3 0.0 3.2 Nevada 18.2 10.0 22.7 28.6 20.0 New Hampshire 0.0 2.9 0.0 0.0 1.2 New Jersey 0.0 0.0 1.9 1.8 1.4 New Mexico 0.0 0.0 9.7 0.0 4.2 New York 9.5 14.7 9.6 11.7 11.2 North Carolina 0.0 9.2 8.3 14.3 8.0 North Dakota 7.1 12.9 10.0 0.0 9.9 Ohio 10.8 10.1 12.7 20.0 11.5 Oklahoma 9.4 22.4 20.0 33.3 20.2 Oregon 4.8 8.2 5.5 0.0 6.5 Pennsylvania 2.1 2.2 5.9 11.5 5.2 Rhode Island 7.7 0.0 0.0 33.3 2.4 South Carolina 4.5 5.9 5.2 20.0 5.6 South Dakota 11.8 4.0 9.1 n/a 8.0 Tennessee 0.0 14.1 11.2 0.0 10.4 Texas 2.3 8.1 4.7 0.0 5.5 Utah 5.0 0.0 9.4 100 6.5 Vermont 18.2 18.2 6.3 n/a 13.2 Virginia 0.0 2.5 7.2 0.0 4.5 Washington 0.0 2.9 2.9 0.0 2.5 West Virginia 0.0 1.6 4.5 100 3.2 Wisconsin 4.7 5.1 10.5 0.0 6.8 Wyoming 9.1 7.1 9.1 n/a 8.3
Source: CASPER
Nursing Home Data Compendium 2013 123

Table 2.12.c. Nursing Home Surveys Resulting in a Citation for Use of Restraints by Bed Size Category: United States, 2010
Percentage by Bed Size Category <50 50-99 100-199 >199 All Facilities
Nation 5.1 7.4 7.1 8.7 7.1 Alabama 0.0 3.4 0.8 0.0 1.7 Alaska 0.0 0.0 0.0 n/a 0.0 Arizona 0.0 3.8 9.5 18.2 8.1 Arkansas 0.0 7.4 15.2 0.0 11.6 California 13.3 15.1 19.6 20.8 16.2 Colorado 15.4 12.0 14.9 50.0 14.9 Connecticut 0.0 6.7 5.6 0.0 5.2 Delaware 0.0 14.3 6.7 0.0 7.7 District of Columbia 0.0 0.0 33.3 20.0 15.8 Florida 0.0 0.0 1.9 0.0 1.3 Georgia 0.0 2.1 4.9 11.1 4.0 Hawaii 5.9 25.0 45.5 0.0 21.6 Idaho 4.3 3.7 14.8 n/a 7.8 Illinois 5.4 10.8 13.3 18.5 12.4 Indiana 10.1 9.0 10.6 33.3 10.3 Iowa 2.8 4.4 8.8 33.3 4.9 Kansas 5.6 8.6 9.6 0.0 7.7 Kentucky 7.8 5.6 3.9 14.3 5.5 Louisiana 0.0 11.9 2.9 12.5 4.7 Maine 0.0 2.0 0.0 0.0 1.0 Maryland 0.0 4.4 1.9 10.0 3.0 Massachusetts 0.0 3.6 2.4 0.0 2.3 Michigan 6.5 6.4 9.9 10.7 8.5 Minnesota 9.5 5.9 6.4 0.0 6.6 Mississippi 0.0 5.5 6.1 0.0 5.3 Missouri 5.3 9.9 10.9 15.8 10.2 Montana 4.0 12.9 8.3 0.0 8.5 Nebraska 1.3 3.1 5.3 0.0 2.8 Nevada 10.0 0.0 8.3 0.0 6.0 New Hampshire 0.0 6.3 7.1 25.0 6.8 New Jersey 0.0 1.8 1.8 0.0 1.4 New Mexico 0.0 3.8 3.0 0.0 2.9 New York 4.8 11.5 8.7 5.4 7.6 North Carolina 4.4 0.7 1.4 7.7 1.7 North Dakota 3.2 2.9 5.0 100 4.7 Ohio 7.7 10.5 9.1 4.2 9.5 Oklahoma 3.1 13.7 13.4 0.0 12.3 Oregon 0.0 5.0 0.0 0.0 2.4 Pennsylvania 1.2 4.0 5.0 5.1 4.3 Rhode Island 0.0 0.0 0.0 0.0 0.0 South Carolina 4.4 5.7 3.0 0.0 4.1 South Dakota 12.0 3.8 12.5 0.0 6.6 Tennessee 8.0 5.7 11.7 22.2 10.2 Texas 3.4 4.0 5.6 3.1 4.9 Utah 8.8 11.1 10.3 0.0 9.8 Vermont 0.0 6.7 0.0 n/a 2.4 Virginia 0.0 3.3 5.0 0.0 3.5 Washington 0.0 2.0 2.0 0.0 1.7 West Virginia 0.0 10.5 4.5 n/a 6.3 Wisconsin 0.0 7.3 6.2 0.0 5.8 Wyoming 11.1 0.0 9.1 n/a 6.1
Source: CASPER
124 Nursing Home Data Compendium 2013

Table 2.12.d. Nursing Home Surveys Resulting in a Citation for Use of Restraints by Bed Size Category: United States, 2011
Percentage by Bed Size Category <50 50-99 100-199 >199 All Facilities
Nation 4.7 6.4 6.0 6.6 6.0 Alabama 0.0 5.6 4.9 7.7 5.2 Alaska 0.0 0.0 0.0 n/a 0.0 Arizona 0.0 2.7 8.5 0.0 5.3 Arkansas 0.0 9.7 7.1 0.0 7.9 California 9.1 10.5 12.3 17.4 11.0 Colorado 4.0 6.3 8.3 0.0 6.4 Connecticut 5.6 1.5 0.0 0.0 0.9 Delaware 0.0 0.0 13.6 0.0 7.7 District of Columbia 0.0 0.0 16.7 0.0 5.3 Florida 0.0 2.3 0.8 0.0 1.0 Georgia 0.0 0.0 0.0 13.3 0.9 Hawaii 18.2 11.1 0.0 100 11.8 Idaho 12.5 12.5 3.7 n/a 9.3 Illinois 5.6 12.5 15.6 16.8 13.6 Indiana 8.5 4.0 5.9 10.0 5.6 Iowa 5.9 2.4 9.4 0.0 4.3 Kansas 9.8 7.9 11.9 66.7 9.7 Kentucky 0.0 4.9 6.6 0.0 4.7 Louisiana 0.0 6.7 1.9 6.7 2.8 Maine 0.0 0.0 0.0 0.0 0.0 Maryland 0.0 0.0 1.6 0.0 0.9 Massachusetts 4.2 2.9 3.0 0.0 3.0 Michigan 11.1 12.4 15.7 7.4 13.8 Minnesota 7.0 1.5 2.2 0.0 2.8 Mississippi 0.0 4.2 8.2 0.0 5.6 Missouri 7.0 12.6 11.3 13.3 11.6 Montana 0.0 0.0 0.0 0.0 0.0 Nebraska 0.0 3.3 5.4 0.0 2.5 Nevada 0.0 20.0 11.5 20.0 11.8 New Hampshire 0.0 6.7 0.0 0.0 2.6 New Jersey 0.0 1.8 1.4 3.3 1.6 New Mexico 0.0 5.0 0.0 0.0 1.6 New York 6.5 6.1 4.6 2.8 4.3 North Carolina 5.0 2.7 2.8 7.1 3.1 North Dakota 3.0 16.1 19.0 0.0 11.2 Ohio 6.6 7.0 4.4 0.0 5.7 Oklahoma 3.3 12.2 14.5 33.3 12.5 Oregon 6.7 4.8 7.9 n/a 6.3 Pennsylvania 2.0 7.0 3.6 8.3 4.8 Rhode Island 0.0 0.0 0.0 0.0 0.0 South Carolina 0.0 3.7 4.9 0.0 3.3 South Dakota 4.5 0.0 0.0 n/a 2.6 Tennessee 3.6 6.3 16.6 6.7 11.7 Texas 0.0 6.4 4.4 2.6 4.6 Utah 8.3 0.0 25.0 0.0 10.3 Vermont 0.0 16.7 11.1 n/a 8.9 Virginia 2.9 1.1 3.9 0.0 2.7 Washington 0.0 3.2 1.0 0.0 1.7 West Virginia 0.0 4.2 4.5 n/a 3.4 Wisconsin 8.5 3.7 5.3 10.0 5.0 Wyoming 0.0 7.1 0.0 n/a 2.5
Source: CASPER
Nursing Home Data Compendium 2013 125

Table 2.12.e. Nursing Home Surveys Resulting in a Citation for Use of Restraints by Bed Size Category: United States, 2012
Percentage by Bed Size Category <50 50-99 100-199 >199 All Facilities
Nation 4.0 5.5 5.7 8.2 5.6 Alabama 0.0 4.7 4.1 6.7 4.4 Alaska 0.0 0.0 0.0 n/a 0.0 Arizona 0.0 3.4 7.6 12.5 6.1 Arkansas 0.0 10.6 8.6 0.0 9.0 California 6.5 10.0 12.0 18.9 10.3 Colorado 6.5 3.4 4.1 20.0 4.5 Connecticut 0.0 4.5 5.3 11.8 5.2 Delaware 0.0 0.0 0.0 100 3.0 District of Columbia 0.0 0.0 0.0 0.0 0.0 Florida 0.0 0.8 0.4 0.0 0.5 Georgia 0.0 0.0 0.0 0.0 0.0 Hawaii 0.0 0.0 15.4 0.0 5.3 Idaho 5.3 11.8 0.0 n/a 5.4 Illinois 5.4 16.8 14.3 19.5 15.0 Indiana 7.8 2.5 4.2 11.1 4.1 Iowa 2.5 1.2 4.8 0.0 2.1 Kansas 8.5 4.3 4.3 0.0 5.7 Kentucky 2.8 2.7 5.9 0.0 4.0 Louisiana 5.9 8.9 5.3 6.7 6.0 Maine 0.0 5.9 0.0 0.0 2.8 Maryland 0.0 2.3 0.0 0.0 0.5 Massachusetts 2.1 2.7 4.0 0.0 3.3 Michigan 4.1 11.6 16.1 37.0 14.6 Minnesota 8.9 4.0 5.1 0.0 5.4 Mississippi 0.0 4.5 3.9 0.0 3.9 Missouri 8.6 10.7 10.0 18.8 10.5 Montana 0.0 6.1 12.0 0.0 6.0 Nebraska 0.0 3.3 5.6 0.0 2.7 Nevada 0.0 0.0 3.7 16.7 3.6 New Hampshire 0.0 0.0 0.0 0.0 0.0 New Jersey 0.0 0.0 4.4 3.6 3.2 New Mexico 0.0 3.1 3.3 0.0 2.7 New York 0.0 3.1 3.7 2.1 2.8 North Carolina 2.9 0.0 1.8 15.4 1.7 North Dakota 0.0 8.6 15.8 33.3 8.0 Ohio 4.5 1.7 4.8 4.0 3.3 Oklahoma 12.5 9.0 9.4 0.0 9.4 Oregon 0.0 3.6 2.3 0.0 2.5 Pennsylvania 2.5 1.1 3.4 8.5 3.3 Rhode Island 0.0 0.0 5.6 0.0 2.4 South Carolina 0.0 3.7 3.5 0.0 2.7 South Dakota 4.8 5.4 0.0 n/a 4.6 Tennessee 0.0 11.7 10.4 0.0 9.4 Texas 6.4 3.5 3.8 2.9 3.9 Utah 9.1 0.0 13.0 0.0 8.5 Vermont 0.0 0.0 0.0 n/a 0.0 Virginia 3.6 1.2 4.9 0.0 3.3 Washington 0.0 1.2 4.4 0.0 2.4 West Virginia 11.1 2.6 9.4 0.0 6.3 Wisconsin 3.8 9.9 9.1 9.1 8.7 Wyoming 0.0 0.0 7.7 n/a 2.6
Source: CASPER
126 Nursing Home Data Compendium 2013

Table 2.12.f. Nursing Home Surveys Resulting in a Citation for Use of Restraints by Bed Size Category: United States (2008, 2012 and Change)
Percentage in 2008, 2012 and Percent Change (% Δ), by Bed Size Category <50 50-99 100-199 >199 All Facilities
2008 2012 % Δ 2008 2012 % Δ 2008 2012 % Δ 2008 2012 % Δ 2008 2012 % Δ
Nation 7.2 4.0 -44.4 10.0 5.5 -44.8 10.6 5.7 -45.7 13.2 8.2 -38.2 10.0 5.6 -44.4 Alabama 0.0 0.0 n/a 3.2 4.7 +47.3 3.1 4.1 +34.2 11.1 6.7 -40.0 3.5 4.4 +23.2 Alaska 11.1 0.0 -100 0.0 0.0 n/a n/a 0.0 n/a 0.0 n/a n/a 7.7 0.0 -100 Arizona 0.0 0.0 n/a 2.8 3.4 +24.1 2.8 7.6 +173 9.1 12.5 +37.5 3.0 6.1 +106 Arkansas 0.0 0.0 n/a 15.9 10.6 -33.4 20.4 8.6 -57.8 25.0 0.0 -100 18.0 9.0 -49.8 California 10.6 6.5 -38.4 16.8 10.0 -40.4 26.1 12.0 -53.9 39.2 18.9 -51.9 19.0 10.3 -45.5 Colorado 11.4 6.5 -43.5 13.8 3.4 -75.1 22.2 4.1 -81.6 16.7 20.0 +20.0 16.7 4.5 -72.9 Connecticut 6.3 0.0 -100 7.9 4.5 -43.3 4.6 5.3 +14.0 13.6 11.8 -13.7 6.6 5.2 -21.2 Delaware 11.1 0.0 -100 11.1 0.0 -100 13.3 0.0 -100 100 100 0.0 14.3 3.0 -78.8 District of Columbia 0.0 0.0 n/a 20.0 0.0 -100 25.0 0.0 -100 20.0 0.0 -100 17.6 0.0 -100 Florida 2.5 0.0 -100 3.9 0.8 -78.7 4.6 0.4 -90.3 9.7 0.0 -100 4.6 0.5 -89.7 Georgia 14.8 0.0 -100 9.0 0.0 -100 8.4 0.0 -100 24.0 0.0 -100 10.2 0.0 -100 Hawaii 15.0 0.0 -100 16.7 0.0 -100 26.7 15.4 -42.3 33.3 0.0 -100 20.0 5.3 -73.7 Idaho 5.6 5.3 -5.3 9.5 11.8 +23.5 20.0 0.0 -100 n/a n/a n/a 12.5 5.4 -57.1 Illinois 5.1 5.4 +7.6 11.7 16.8 +43.2 18.2 14.3 -21.0 18.4 19.5 +6.1 14.3 15.0 +4.6 Indiana 12.4 7.8 -36.8 20.8 2.5 -88.0 17.3 4.2 -75.5 36.4 11.1 -69.4 18.2 4.1 -77.5 Iowa 3.4 2.5 -26.3 7.2 1.2 -82.9 14.0 4.8 -65.5 33.3 0.0 -100 7.3 2.1 -71.0 Kansas 13.0 8.5 -34.5 9.7 4.3 -55.3 4.1 4.3 +6.5 0.0 0.0 n/a 9.8 5.7 -42.0 Kentucky 6.4 2.8 -56.5 9.0 2.7 -70.0 9.3 5.9 -36.9 0.0 0.0 n/a 8.6 4.0 -53.8 Louisiana 0.0 5.9 n/a 7.1 8.9 +24.4 10.9 5.3 -50.9 11.1 6.7 -40.0 9.4 6.0 -36.0 Maine 2.3 0.0 -100 0.0 5.9 n/a 0.0 0.0 n/a 50.0 0.0 -100 1.8 2.8 +58.5 Maryland 0.0 0.0 n/a 4.1 2.3 -44.3 10.2 0.0 -100 5.3 0.0 -100 7.1 0.5 -93.5 Massachusetts 3.2 2.1 -34.0 1.8 2.7 +50.0 2.3 4.0 +72.7 0.0 0.0 n/a 2.2 3.3 +47.3 Michigan 2.5 4.1 +63.3 5.6 11.6 +107 9.3 16.1 +72.1 26.7 37.0 +38.9 8.7 14.6 +68.5 Minnesota 14.9 8.9 -40.1 12.9 4.0 -68.8 15.5 5.1 -67.4 23.1 0.0 -100 14.4 5.4 -62.5 Mississippi 15.8 0.0 -100 8.5 4.5 -47.1 10.7 3.9 -63.2 25.0 0.0 -100 10.3 3.9 -62.3 Missouri 17.8 8.6 -51.8 20.9 10.7 -48.6 22.0 10.0 -54.6 35.0 18.8 -46.4 21.6 10.5 -51.6 Montana 12.9 0.0 -100 0.0 6.1 n/a 8.7 12.0 +38.0 0.0 0.0 n/a 7.1 6.0 -15.7 Nebraska 5.1 0.0 -100 2.7 3.3 +20.9 4.3 5.6 +27.8 20.0 0.0 -100 4.2 2.7 -36.2 Nevada 18.2 0.0 -100 22.2 0.0 -100 34.8 3.7 -89.4 16.7 16.7 0.0 26.5 3.6 -86.3 New Hampshire 0.0 0.0 n/a 2.6 0.0 -100 0.0 0.0 n/a 0.0 0.0 n/a 1.2 0.0 -100 New Jersey 0.0 0.0 n/a 0.0 0.0 n/a 3.7 4.4 +18.5 1.7 3.6 +114 2.4 3.2 +30.7 New Mexico 11.1 0.0 -100 3.7 3.1 -15.6 19.4 3.3 -82.8 0.0 0.0 n/a 11.6 2.7 -77.0 New York 4.3 0.0 -100 8.7 3.1 -63.9 7.4 3.7 -49.3 7.8 2.1 -72.4 7.5 2.8 -63.3 North Carolina 0.0 2.9 n/a 4.3 0.0 -100 9.3 1.8 -80.4 0.0 15.4 n/a 6.2 1.7 -73.5 North Dakota 0.0 0.0 n/a 6.7 8.6 +28.6 5.0 15.8 +216 0.0 33.3 n/a 3.7 8.0 +115 Ohio 9.9 4.5 -54.1 13.0 1.7 -86.5 12.4 4.8 -61.5 0.0 4.0 n/a 12.0 3.3 -72.5 Oklahoma 19.4 12.5 -35.4 25.2 9.0 -64.2 20.3 9.4 -53.5 33.3 0.0 -100 22.9 9.4 -58.8 Oregon 9.1 0.0 -100 4.8 3.6 -24.8 4.3 2.3 -46.6 0.0 0.0 n/a 5.3 2.5 -52.9 Pennsylvania 4.1 2.5 -39.5 3.9 1.1 -70.6 7.5 3.4 -54.9 10.8 8.5 -21.3 6.6 3.3 -49.3 Rhode Island 8.3 0.0 -100 0.0 0.0 n/a 0.0 5.6 n/a 0.0 0.0 n/a 1.1 2.4 +112 South Carolina 0.0 0.0 n/a 7.3 3.7 -49.1 2.6 3.5 +32.6 20.0 0.0 -100 4.1 2.7 -34.3 South Dakota 10.7 4.8 -55.6 9.4 5.4 -43.2 10.0 0.0 -100 n/a n/a n/a 10.1 4.6 -54.1 Tennessee 6.5 0.0 -100 8.5 11.7 +37.1 12.9 10.4 -19.1 5.6 0.0 -100 10.4 9.4 -9.6 Texas 3.0 6.4 +113 7.6 3.5 -53.6 7.7 3.8 -50.4 11.8 2.9 -75.7 7.4 3.9 -47.1 Utah 4.0 9.1 +127 0.0 0.0 n/a 6.1 13.0 +115 0.0 0.0 n/a 3.4 8.5 +149 Vermont 9.1 0.0 -100 27.3 0.0 -100 26.7 0.0 -100 n/a n/a n/a 21.6 0.0 -100 Virginia 0.0 3.6 n/a 4.8 1.2 -75.0 5.7 4.9 -14.3 6.7 0.0 -100 4.8 3.3 -30.8 Washington 2.6 0.0 -100 1.1 1.2 +10.5 4.7 4.4 -6.8 0.0 0.0 n/a 2.9 2.4 -17.8 West Virginia 8.7 11.1 +27.8 3.6 2.6 -26.3 17.1 9.4 -45.1 0.0 0.0 n/a 9.1 6.3 -31.3 Wisconsin 9.4 3.8 -60.0 3.5 9.9 +183 7.0 9.1 +29.1 0.0 9.1 n/a 5.4 8.7 +61.4 Wyoming 0.0 0.0 n/a 13.3 0.0 -100 0.0 7.7 n/a n/a n/a n/a 5.0 2.6 -48.7
Source: CASPER
Nursing Home Data Compendium 2013 127

Table 2.13.a. Nursing Home Surveys Resulting in a Citation for Use of Restraints by Ownership Type: United States, 2008
Percentage by Ownership Type
For-Profit Non-Profit Government All Facilities Nation 10.8 8.0 11.1 10.0 Alabama 3.0 9.1 0.0 3.5 Alaska 0.0 0.0 20.0 7.7 Arizona 3.0 3.2 0.0 3.0 Arkansas 20.8 5.4 0.0 18.0 California 21.0 10.1 17.0 19.0 Colorado 15.2 18.4 22.7 16.7 Connecticut 5.8 9.8 0.0 6.6 Delaware 8.0 5.3 80.0 14.3 District of Columbia 16.7 22.2 0.0 17.6 Florida 4.3 5.6 0.0 4.6 Georgia 10.3 8.3 17.4 10.2 Hawaii 16.0 16.7 30.8 20.0 Idaho 15.9 0.0 9.1 12.5 Illinois 16.5 8.6 15.4 14.3 Indiana 18.8 18.6 10.3 18.2 Iowa 7.7 4.9 23.8 7.3 Kansas 7.5 12.9 9.1 9.8 Kentucky 10.1 3.8 20.0 8.6 Louisiana 9.6 11.1 0.0 9.4 Maine 0.0 6.5 0.0 1.8 Maryland 8.0 6.1 0.0 7.1 Massachusetts 1.6 4.1 0.0 2.2 Michigan 9.8 7.7 2.8 8.7 Minnesota 15.4 15.0 7.9 14.4 Mississippi 11.0 5.0 14.8 10.3 Missouri 22.3 20.3 20.0 21.6 Montana 7.9 6.1 7.1 7.1 Nebraska 1.8 4.1 9.1 4.2 Nevada 22.9 50.0 16.7 26.5 New Hampshire 0.0 3.2 0.0 1.2 New Jersey 3.3 0.0 5.0 2.4 New Mexico 10.9 11.1 20.0 11.6 New York 8.1 5.4 16.3 7.5 North Carolina 7.1 3.9 0.0 6.2 North Dakota 0.0 4.1 0.0 3.7 Ohio 13.0 8.2 12.0 12.0 Oklahoma 23.6 25.8 0.0 22.9 Oregon 5.6 5.3 0.0 5.3 Pennsylvania 7.7 3.8 19.0 6.6 Rhode Island 0.0 5.9 n/a 1.1 South Carolina 3.1 0.0 16.7 4.1 South Dakota 12.2 9.7 0.0 10.1 Tennessee 10.9 10.2 5.6 10.4 Texas 7.6 5.7 9.1 7.4 Utah 4.2 0.0 0.0 3.4 Vermont 28.0 9.1 0.0 21.6 Virginia 4.8 5.2 0.0 4.8 Washington 2.3 3.8 5.3 2.9 West Virginia 6.2 17.2 9.1 9.1 Wisconsin 4.9 4.9 8.6 5.4 Wyoming 5.9 0.0 6.7 5.0
Source: CASPER
128 Nursing Home Data Compendium 2013

Table 2.13.b. Nursing Home Surveys Resulting in a Citation for Use of Restraints by Ownership Type: United States, 2009
Percentage by Ownership Type
For-Profit Non-Profit Government All Facilities Nation 9.7 7.2 9.5 9.0 Alabama 5.8 0.0 7.1 5.0 Alaska 0.0 0.0 0.0 0.0 Arizona 10.9 0.0 0.0 8.5 Arkansas 16.0 16.7 10.0 15.8 California 22.5 15.6 14.0 21.0 Colorado 9.3 15.2 9.5 10.6 Connecticut 4.4 2.2 0.0 3.9 Delaware 8.3 7.1 0.0 7.0 District of Columbia 10.0 22.2 100 23.8 Florida 2.1 3.9 0.0 2.5 Georgia 6.7 8.6 0.0 6.8 Hawaii 26.9 8.3 10.0 18.8 Idaho 2.2 0.0 7.1 2.7 Illinois 12.5 6.6 10.0 10.7 Indiana 14.6 10.9 18.9 14.0 Iowa 5.2 5.6 0.0 5.1 Kansas 9.5 10.3 15.8 10.6 Kentucky 6.9 4.8 14.3 6.6 Louisiana 9.4 9.1 6.3 9.2 Maine 2.7 0.0 0.0 1.9 Maryland 6.0 4.1 0.0 5.2 Massachusetts 3.0 3.9 14.3 3.4 Michigan 9.0 3.8 0.0 7.1 Minnesota 10.2 8.1 16.7 9.6 Mississippi 10.6 2.9 10.3 9.3 Missouri 17.6 13.9 22.5 17.2 Montana 11.6 2.6 17.6 9.1 Nebraska 3.9 3.1 2.0 3.2 Nevada 18.9 28.6 16.7 20.0 New Hampshire 0.0 0.0 8.3 1.2 New Jersey 1.7 1.0 0.0 1.4 New Mexico 4.2 5.6 0.0 4.2 New York 10.3 12.0 12.2 11.2 North Carolina 8.9 4.4 10.0 8.0 North Dakota 0.0 10.8 0.0 9.9 Ohio 12.6 7.5 12.0 11.5 Oklahoma 21.2 13.2 18.2 20.2 Oregon 8.0 0.0 0.0 6.5 Pennsylvania 5.1 4.3 11.6 5.2 Rhode Island 1.5 5.6 n/a 2.4 South Carolina 4.7 9.7 5.9 5.6 South Dakota 13.5 4.3 20.0 8.0 Tennessee 8.9 14.3 16.7 10.4 Texas 5.0 7.5 9.7 5.5 Utah 6.2 10.0 0.0 6.5 Vermont 11.1 20.0 0.0 13.2 Virginia 5.1 2.6 9.1 4.5 Washington 2.7 2.2 0.0 2.5 West Virginia 4.7 0.0 0.0 3.2 Wisconsin 8.6 4.3 5.8 6.8 Wyoming 15.4 0.0 5.3 8.3
Source: CASPER
Nursing Home Data Compendium 2013 129

Table 2.13.c. Nursing Home Surveys Resulting in a Citation for Use of Restraints by Ownership Type: United States, 2010
Percentage by Ownership Type
For-Profit Non-Profit Government All Facilities
Nation 7.7 5.5 6.3 7.1 Alabama 1.6 3.2 0.0 1.7 Alaska 0.0 0.0 0.0 0.0 Arizona 6.9 13.6 0.0 8.1 Arkansas 12.1 11.8 0.0 11.6 California 17.3 12.4 7.0 16.2 Colorado 17.0 13.5 0.0 14.9 Connecticut 6.0 2.3 0.0 5.2 Delaware 9.1 7.7 0.0 7.7 District of Columbia 11.1 12.5 50.0 15.8 Florida 1.7 0.6 0.0 1.3 Georgia 4.0 4.5 0.0 4.0 Hawaii 16.7 30.8 16.7 21.6 Idaho 11.1 0.0 0.0 7.8 Illinois 14.0 9.0 3.4 12.4 Indiana 11.2 8.5 8.5 10.3 Iowa 5.7 3.9 5.6 4.9 Kansas 9.3 7.5 2.4 7.7 Kentucky 6.3 2.5 14.3 5.5 Louisiana 3.6 11.4 0.0 4.7 Maine 1.4 0.0 0.0 1.0 Maryland 3.1 3.1 0.0 3.0 Massachusetts 2.3 2.4 0.0 2.3 Michigan 9.4 4.5 13.5 8.5 Minnesota 8.6 3.9 15.6 6.6 Mississippi 6.2 0.0 3.6 5.3 Missouri 10.7 9.7 6.7 10.2 Montana 11.1 6.5 6.7 8.5 Nebraska 3.9 1.5 2.1 2.8 Nevada 5.4 12.5 0.0 6.0 New Hampshire 5.7 3.7 18.2 6.8 New Jersey 1.6 1.1 0.0 1.4 New Mexico 4.2 0.0 0.0 2.9 New York 6.9 8.8 5.0 7.6 North Carolina 1.6 1.1 8.3 1.7 North Dakota 0.0 5.2 0.0 4.7 Ohio 10.6 4.7 10.0 9.5 Oklahoma 12.9 9.1 9.1 12.3 Oregon 2.9 0.0 0.0 2.4 Pennsylvania 3.8 4.2 11.1 4.3 Rhode Island 0.0 0.0 n/a 0.0 South Carolina 3.1 7.1 7.7 4.1 South Dakota 5.0 7.9 0.0 6.6 Tennessee 8.9 14.3 14.3 10.2 Texas 5.0 4.2 3.2 4.9 Utah 11.8 0.0 0.0 9.8 Vermont 3.8 0.0 0.0 2.4 Virginia 4.3 1.2 8.3 3.5 Washington 1.7 2.3 0.0 1.7 West Virginia 6.5 0.0 16.7 6.3 Wisconsin 5.1 5.6 8.7 5.8 Wyoming 7.1 0.0 7.7 6.1
Source: CASPER
130 Nursing Home Data Compendium 2013

Table 2.13.d. Nursing Home Surveys Resulting in a Citation for Use of Restraints by Ownership Type: United States, 2011
Percentage by Ownership Type
For-Profit Non-Profit Government All Facilities Nation 6.5 4.7 6.5 6.0 Alabama 6.5 0.0 0.0 5.2 Alaska 0.0 0.0 0.0 0.0 Arizona 5.8 4.0 0.0 5.3 Arkansas 8.0 9.1 0.0 7.9 California 11.1 11.6 7.3 11.0 Colorado 7.8 3.8 0.0 6.4 Connecticut 1.2 0.0 0.0 0.9 Delaware 9.5 0.0 25.0 7.7 District of Columbia 0.0 9.1 n/a 5.3 Florida 0.6 2.3 0.0 1.0 Georgia 0.7 1.7 0.0 0.9 Hawaii 12.5 10.0 12.5 11.8 Idaho 8.0 9.1 14.3 9.3 Illinois 16.4 6.1 10.0 13.6 Indiana 4.5 6.1 11.1 5.6 Iowa 4.4 4.0 6.3 4.3 Kansas 12.5 6.5 7.3 9.7 Kentucky 5.7 0.0 25.0 4.7 Louisiana 2.6 4.5 0.0 2.8 Maine 0.0 0.0 0.0 0.0 Maryland 1.3 0.0 0.0 0.9 Massachusetts 2.4 4.7 0.0 3.0 Michigan 15.6 8.7 12.8 13.8 Minnesota 1.8 3.3 2.7 2.8 Mississippi 4.5 5.9 12.0 5.6 Missouri 12.4 7.4 13.9 11.6 Montana 0.0 0.0 0.0 0.0 Nebraska 3.2 3.4 0.0 2.5 Nevada 10.0 16.7 20.0 11.8 New Hampshire 2.4 4.3 0.0 2.6 New Jersey 2.0 1.1 0.0 1.6 New Mexico 2.2 0.0 0.0 1.6 New York 3.7 5.5 2.1 4.3 North Carolina 3.4 2.2 0.0 3.1 North Dakota 0.0 12.2 0.0 11.2 Ohio 6.1 4.1 5.6 5.7 Oklahoma 12.1 17.9 0.0 12.5 Oregon 7.8 0.0 0.0 6.3 Pennsylvania 5.4 2.5 17.5 4.8 Rhode Island 0.0 0.0 n/a 0.0 South Carolina 2.2 6.7 7.1 3.3 South Dakota 2.4 3.1 0.0 2.6 Tennessee 11.6 9.4 21.4 11.7 Texas 4.8 4.0 2.9 4.6 Utah 13.8 0.0 0.0 10.3 Vermont 9.7 7.7 0.0 8.9 Virginia 3.0 2.4 0.0 2.7 Washington 1.8 2.1 0.0 1.7 West Virginia 0.0 4.8 20.0 3.4 Wisconsin 4.1 5.4 7.7 5.0 Wyoming 0.0 14.3 0.0 2.5
Source: CASPER
Nursing Home Data Compendium 2013 131

Table 2.13.e. Nursing Home Surveys Resulting in a Citation for Use of Restraints by Ownership Type: United States, 2012
Percentage by Ownership Type
For-Profit Non-Profit Government All Facilities Nation 6.0 4.2 6.2 5.6Alabama 3.7 7.1 7.1 4.4 Alaska 0.0 0.0 0.0 0.0 Arizona 7.4 0.0 0.0 6.1 Arkansas 7.8 16.1 10.0 9.0 California 10.8 9.1 4.8 10.3 Colorado 4.2 5.7 5.3 4.5 Connecticut 5.4 4.8 0.0 5.2 Delaware 0.0 0.0 33.3 3.0 District of Columbia 0.0 0.0 n/a 0.0 Florida 0.4 0.6 0.0 0.5 Georgia 0.0 0.0 0.0 0.0 Hawaii 5.6 0.0 14.3 5.3 Idaho 5.3 0.0 11.1 5.4 Illinois 16.6 9.1 24.1 15.0 Indiana 4.4 4.0 3.3 4.1 Iowa 1.7 1.8 11.1 2.1 Kansas 6.7 4.0 6.7 5.7 Kentucky 4.3 3.3 0.0 4.0 Louisiana 7.0 2.4 0.0 6.0 Maine 4.0 0.0 0.0 2.8 Maryland 0.7 0.0 0.0 0.5 Massachusetts 3.7 2.5 0.0 3.3 Michigan 15.9 12.6 10.3 14.6 Minnesota 6.0 3.8 13.5 5.4 Mississippi 3.7 5.3 3.8 3.9 Missouri 11.7 6.9 6.7 10.5 Montana 5.4 9.1 0.0 6.0 Nebraska 3.2 0.0 4.9 2.7 Nevada 4.8 0.0 0.0 3.6 New Hampshire 0.0 0.0 0.0 0.0 New Jersey 3.3 3.5 0.0 3.2 New Mexico 3.7 0.0 0.0 2.7 New York 2.5 2.8 4.8 2.8 North Carolina 1.2 2.3 10.0 1.7 North Dakota 0.0 8.4 0.0 8.0 Ohio 3.7 2.1 0.0 3.3 Oklahoma 9.6 8.3 10.0 9.4 Oregon 3.0 0.0 0.0 2.5 Pennsylvania 4.3 1.9 5.1 3.3 Rhode Island 3.0 0.0 n/a 2.4 South Carolina 3.5 0.0 0.0 2.7 South Dakota 2.8 6.0 0.0 4.6 Tennessee 8.2 15.6 8.3 9.4 Texas 4.0 2.3 6.3 3.9 Utah 7.8 0.0 50.0 8.5 Vermont 0.0 0.0 0.0 0.0 Virginia 3.8 2.7 0.0 3.3 Washington 3.1 0.0 0.0 2.4 West Virginia 6.5 8.3 0.0 6.3 Wisconsin 8.5 6.7 14.6 8.7 Wyoming 0.0 16.7 0.0 2.6
Source: CASPER
132 Nursing Home Data Compendium 2013

Table 2.13.f. Nursing Home Surveys Resulting in a Citation for Use of Restraints by Ownership Type: United States (2008, 2012 and Change)
Percentage in 2008, 2012 and Percent Change (% Δ), by Ownership Type For-Profit Non-Profit Government All Facilities
2008 2012 % Δ 2008 2012 % Δ 2008 2012 % Δ 2008 2012 % Δ
Nation 10.8 6.0 -44.0 8.0 4.2 -47.5 11.1 6.2 -43.8 10.0 5.6 -44.4 Alabama 3.0 3.7 +26.6 9.1 7.1 -21.4 0.0 7.1 n/a 3.5 4.4 +23.2 Alaska 0.0 0.0 n/a 0.0 0.0 n/a 20.0 0.0 -100 7.7 0.0 -100 Arizona 3.0 7.4 +146 3.2 0.0 -100 0.0 0.0 n/a 3.0 6.1 +106 Arkansas 20.8 7.8 -62.5 5.4 16.1 +198 0.0 10.0 n/a 18.0 9.0 -49.8 California 21.0 10.8 -48.4 10.1 9.1 -9.5 17.0 4.8 -72.0 19.0 10.3 -45.5 Colorado 15.2 4.2 -72.4 18.4 5.7 -68.9 22.7 5.3 -76.8 16.7 4.5 -72.9 Connecticut 5.8 5.4 -7.0 9.8 4.8 -51.4 0.0 0.0 n/a 6.6 5.2 -21.2 Delaware 8.0 0.0 -100 5.3 0.0 -100 80.0 33.3 -58.3 14.3 3.0 -78.8 District of Columbia 16.7 0.0 -100 22.2 0.0 -100 0.0 n/a n/a 17.6 0.0 -100 Florida 4.3 0.4 -89.9 5.6 0.6 -89.0 0.0 0.0 n/a 4.6 0.5 -89.7 Georgia 10.3 0.0 -100 8.3 0.0 -100 17.4 0.0 -100 10.2 0.0 -100 Hawaii 16.0 5.6 -65.3 16.7 0.0 -100 30.8 14.3 -53.6 20.0 5.3 -73.7 Idaho 15.9 5.3 -66.9 0.0 0.0 n/a 9.1 11.1 +22.2 12.5 5.4 -57.1 Illinois 16.5 16.6 +1.1 8.6 9.1 +6.1 15.4 24.1 +56.9 14.3 15.0 +4.6 Indiana 18.8 4.4 -76.4 18.6 4.0 -78.5 10.3 3.3 -68.1 18.2 4.1 -77.5 Iowa 7.7 1.7 -78.3 4.9 1.8 -63.7 23.8 11.1 -53.3 7.3 2.1 -71.0 Kansas 7.5 6.7 -11.1 12.9 4.0 -69.2 9.1 6.7 -26.7 9.8 5.7 -42.0 Kentucky 10.1 4.3 -57.9 3.8 3.3 -12.2 20.0 0.0 -100 8.6 4.0 -53.8 Louisiana 9.6 7.0 -27.0 11.1 2.4 -78.6 0.0 0.0 n/a 9.4 6.0 -36.0 Maine 0.0 4.0 n/a 6.5 0.0 -100 0.0 0.0 n/a 1.8 2.8 +58.5 Maryland 8.0 0.7 -91.6 6.1 0.0 -100 0.0 0.0 n/a 7.1 0.5 -93.5 Massachusetts 1.6 3.7 +132 4.1 2.5 -39.0 0.0 0.0 n/a 2.2 3.3 +47.3 Michigan 9.8 15.9 +62.7 7.7 12.6 +64.0 2.8 10.3 +269 8.7 14.6 +68.5 Minnesota 15.4 6.0 -60.8 15.0 3.8 -74.6 7.9 13.5 +71.2 14.4 5.4 -62.5 Mississippi 11.0 3.7 -66.2 5.0 5.3 +5.3 14.8 3.8 -74.0 10.3 3.9 -62.3 Missouri 22.3 11.7 -47.3 20.3 6.9 -66.2 20.0 6.7 -66.7 21.6 10.5 -51.6 Montana 7.9 5.4 -31.5 6.1 9.1 +50.0 7.1 0.0 -100 7.1 6.0 -15.7 Nebraska 1.8 3.2 +76.8 4.1 0.0 -100 9.1 4.9 -46.3 4.2 2.7 -36.2 Nevada 22.9 4.8 -79.2 50.0 0.0 -100 16.7 0.0 -100 26.5 3.6 -86.3 New Hampshire 0.0 0.0 n/a 3.2 0.0 -100 0.0 0.0 n/a 1.2 0.0 -100 New Jersey 3.3 3.3 -0.8 0.0 3.5 n/a 5.0 0.0 -100 2.4 3.2 +30.7 New Mexico 10.9 3.7 -65.9 11.1 0.0 -100 20.0 0.0 -100 11.6 2.7 -77.0 New York 8.1 2.5 -69.7 5.4 2.8 -48.3 16.3 4.8 -70.7 7.5 2.8 -63.3 North Carolina 7.1 1.2 -82.8 3.9 2.3 -41.4 0.0 10.0 n/a 6.2 1.7 -73.5 North Dakota 0.0 0.0 n/a 4.1 8.4 +105 0.0 0.0 n/a 3.7 8.0 +115 Ohio 13.0 3.7 -71.8 8.2 2.1 -74.6 12.0 0.0 -100 12.0 3.3 -72.5 Oklahoma 23.6 9.6 -59.5 25.8 8.3 -67.7 0.0 10.0 n/a 22.9 9.4 -58.8 Oregon 5.6 3.0 -46.5 5.3 0.0 -100 0.0 0.0 n/a 5.3 2.5 -52.9 Pennsylvania 7.7 4.3 -44.5 3.8 1.9 -48.9 19.0 5.1 -73.1 6.6 3.3 -49.3 Rhode Island 0.0 3.0 n/a 5.9 0.0 -100 n/a n/a n/a 1.1 2.4 +112 South Carolina 3.1 3.5 +16.1 0.0 0.0 n/a 16.7 0.0 -100 4.1 2.7 -34.3 South Dakota 12.2 2.8 -77.2 9.7 6.0 -38.6 0.0 0.0 n/a 10.1 4.6 -54.1 Tennessee 10.9 8.2 -24.2 10.2 15.6 +53.6 5.6 8.3 +50.0 10.4 9.4 -9.6 Texas 7.6 4.0 -46.9 5.7 2.3 -59.4 9.1 6.3 -31.3 7.4 3.9 -47.1 Utah 4.2 7.8 +88.2 0.0 0.0 n/a 0.0 50.0 n/a 3.4 8.5 +149 Vermont 28.0 0.0 -100 9.1 0.0 -100 0.0 0.0 n/a 21.6 0.0 -100 Virginia 4.8 3.8 -22.2 5.2 2.7 -48.7 0.0 0.0 n/a 4.8 3.3 -30.8 Washington 2.3 3.1 +34.4 3.8 0.0 -100 5.3 0.0 -100 2.9 2.4 -17.8 West Virginia 6.2 6.5 +4.5 17.2 8.3 -51.7 9.1 0.0 -100 9.1 6.3 -31.3 Wisconsin 4.9 8.5 +76.0 4.9 6.7 +36.4 8.6 14.6 +69.2 5.4 8.7 +61.4 Wyoming 5.9 0.0 -100 0.0 16.7 n/a 6.7 0.0 -100 5.0 2.6 -48.7
Source: CASPER
Nursing Home Data Compendium 2013 133

Table 2.14.a. Nursing Home Surveys Resulting in a Deficiency for Failure to Treat/Prevent Pressure Ulcers by Bed Size Category: United States, 2008
Percentage by Bed Size Category <50 50-99 100-199 >199 All Facilities
Nation 12.5 17.5 18.4 22.4 17.5 Alabama 30.0 6.3 8.4 16.7 9.1 Alaska 0.0 33.3 n/a 0.0 7.7 Arizona 6.7 13.9 12.5 54.5 15.7 Arkansas 10.0 36.4 42.6 0.0 38.5 California 13.3 18.6 22.8 39.2 19.6 Colorado 8.6 11.7 24.7 66.7 17.6 Connecticut 12.5 19.7 23.8 50.0 24.2 Delaware 22.2 22.2 26.7 0.0 24.5 District of Columbia 0.0 20.0 25.0 60.0 29.4 Florida 15.0 7.9 10.8 6.5 10.3 Georgia 14.8 25.2 18.9 40.0 22.1 Hawaii 5.0 0.0 13.3 0.0 6.0 Idaho 22.2 9.5 28.0 n/a 20.3 Illinois 14.1 22.7 20.9 30.4 22.2 Indiana 15.7 24.9 29.4 27.3 25.1 Iowa 11.2 16.0 33.3 0.0 16.9 Kansas 29.0 46.5 38.8 0.0 39.9 Kentucky 0.0 9.0 7.6 0.0 6.8 Louisiana 12.5 2.4 10.9 27.8 10.8 Maine 23.3 17.5 20.0 50.0 20.5 Maryland 0.0 2.0 11.9 10.5 8.1 Massachusetts 1.6 5.4 7.8 21.4 6.7 Michigan 10.0 15.5 20.4 13.3 17.4 Minnesota 41.9 47.8 57.3 61.5 49.7 Mississippi 5.3 6.6 7.1 25.0 7.0 Missouri 24.4 25.5 29.7 30.0 27.4 Montana 3.2 3.3 4.3 0.0 3.5 Nebraska 12.7 19.1 19.6 60.0 17.9 Nevada 0.0 22.2 8.7 0.0 8.2 New Hampshire 8.3 7.9 3.2 0.0 5.8 New Jersey 11.4 6.8 14.3 13.3 12.7 New Mexico 0.0 11.1 29.0 50.0 18.8 New York 6.4 10.6 14.3 14.3 13.2 North Carolina 0.0 10.4 9.3 16.7 8.9 North Dakota 10.3 6.7 5.0 0.0 7.4 Ohio 9.9 19.9 25.5 20.8 21.1 Oklahoma 9.7 16.8 28.5 33.3 21.0 Oregon 4.5 8.1 12.8 50.0 9.8 Pennsylvania 8.2 7.2 12.2 16.9 11.0 Rhode Island 8.3 15.2 7.7 0.0 10.3 South Carolina 8.6 18.2 27.6 20.0 20.5 South Dakota 3.6 1.9 0.0 n/a 2.5 Tennessee 12.9 6.4 8.4 0.0 7.7 Texas 6.0 7.1 10.0 20.6 9.0 Utah 0.0 3.4 18.2 0.0 8.0 Vermont 18.2 9.1 6.7 n/a 10.8 Virginia 9.4 16.7 29.1 26.7 22.8 Washington 20.5 21.1 21.7 25.0 21.3 West Virginia 13.0 17.9 19.5 0.0 17.4 Wisconsin 15.1 21.1 33.8 66.7 26.1 Wyoming 27.3 13.3 42.9 n/a 27.5
Source: CASPER
134 Nursing Home Data Compendium 2013

Table 2.14.b. Nursing Home Surveys Resulting in a Deficiency for Failure to Treat/Prevent Pressure Ulcers by Bed Size Category: United States, 2009
Percentage by Bed Size Category <50 50-99 100-199 >199 All Facilities
Nation 11.7 16.2 17.0 15.1 15.9 Alabama 0.0 12.2 13.7 0.0 11.8 Alaska 0.0 0.0 n/a 0.0 0.0 Arizona 27.3 18.9 24.2 0.0 21.2 Arkansas 14.3 36.0 33.6 25.0 33.8 California 8.2 15.9 24.5 19.5 16.9 Colorado 25.7 16.7 20.2 33.3 20.3 Connecticut 7.1 30.0 20.8 37.5 23.9 Delaware 50.0 12.5 23.1 0.0 25.6 District of Columbia 0.0 0.0 37.5 40.0 23.8 Florida 9.5 13.1 7.3 5.4 8.4 Georgia 12.0 14.3 19.0 20.0 17.1 Hawaii 5.3 16.7 26.7 0.0 14.6 Idaho 25.0 50.0 43.5 n/a 39.7 Illinois 8.1 20.5 20.8 21.4 19.1 Indiana 6.5 19.4 24.2 28.6 19.8 Iowa 9.1 10.8 21.1 25.0 12.2 Kansas 33.3 43.0 23.8 0.0 36.9 Kentucky 6.7 8.4 8.2 0.0 7.9 Louisiana 13.6 14.6 11.7 0.0 11.6 Maine 14.0 14.3 0.0 0.0 12.4 Maryland 3.6 8.2 15.5 16.0 12.6 Massachusetts 1.8 3.4 7.7 5.3 5.8 Michigan 8.5 15.7 23.4 34.6 20.0 Minnesota 43.8 36.0 35.0 42.9 37.5 Mississippi 0.0 3.9 6.0 0.0 4.4 Missouri 11.9 19.6 35.1 30.8 26.5 Montana 2.9 5.9 10.3 50.0 7.1 Nebraska 11.4 13.7 22.0 33.3 14.7 Nevada 0.0 0.0 18.2 14.3 10.0 New Hampshire 9.1 8.6 12.9 0.0 9.8 New Jersey 14.3 6.6 15.1 12.5 13.2 New Mexico 0.0 10.7 6.5 0.0 6.9 New York 4.8 15.6 18.0 10.5 14.0 North Carolina 0.0 8.5 7.3 7.1 7.0 North Dakota 7.1 9.7 5.0 0.0 7.4 Ohio 11.8 20.2 23.6 20.0 20.6 Oklahoma 9.4 14.5 16.3 33.3 14.9 Oregon 9.5 14.8 18.2 0.0 15.1 Pennsylvania 10.6 5.5 12.6 13.8 10.7 Rhode Island 0.0 19.4 5.3 0.0 9.4 South Carolina 15.9 17.6 14.3 20.0 15.8 South Dakota 7.8 2.0 0.0 n/a 4.5 Tennessee 8.7 6.4 7.2 5.9 7.0 Texas 5.7 8.9 10.3 10.3 9.5 Utah 0.0 8.3 3.1 0.0 3.9 Vermont 9.1 9.1 6.3 n/a 7.9 Virginia 9.4 12.3 20.1 30.8 17.0 Washington 15.2 22.9 24.5 0.0 22.1 West Virginia 10.0 11.5 13.6 0.0 11.9 Wisconsin 14.0 20.6 25.0 8.3 20.9 Wyoming 27.3 21.4 18.2 n/a 22.2
Source: CASPER
Nursing Home Data Compendium 2013 135

Table 2.14.c. Nursing Home Surveys Resulting in a Deficiency for Failure to Treat/Prevent Pressure Ulcers by Bed Size Category: United States, 2010
Percentage by Bed Size Category <50 50-99 100-199 >199 All Facilities
Nation 11.4 14.1 14.9 14.1 14.1 Alabama 0.0 9.1 10.6 6.3 9.4 Alaska 0.0 0.0 0.0 n/a 0.0 Arizona 27.3 19.2 22.2 9.1 20.7 Arkansas 25.0 29.8 36.2 50.0 33.5 California 14.8 16.0 20.9 22.9 17.3 Colorado 34.6 16.0 23.0 83.3 23.7 Connecticut 26.7 18.3 28.0 30.8 25.4 Delaware 0.0 14.3 26.7 0.0 19.2 District of Columbia 33.3 0.0 33.3 20.0 21.1 Florida 7.3 7.4 6.2 0.0 6.1 Georgia 4.3 9.6 13.3 22.2 11.9 Hawaii 5.9 50.0 9.1 0.0 16.2 Idaho 21.7 29.6 33.3 n/a 28.6 Illinois 17.2 19.2 24.6 16.9 20.7 Indiana 15.2 17.5 16.3 44.4 17.1 Iowa 6.6 9.2 13.2 0.0 9.2 Kansas 27.8 27.6 36.5 33.3 29.3 Kentucky 7.8 4.8 1.6 0.0 3.9 Louisiana 23.5 7.1 9.3 12.5 10.0 Maine 13.2 8.0 25.0 50.0 12.7 Maryland 0.0 8.9 11.1 25.0 10.4 Massachusetts 6.3 7.2 8.6 18.8 8.4 Michigan 2.2 13.5 22.7 39.3 18.8 Minnesota 17.9 20.3 26.6 21.4 21.3 Mississippi 7.1 5.5 4.9 0.0 5.3 Missouri 18.4 18.5 26.4 10.5 21.8 Montana 0.0 16.1 0.0 0.0 6.1 Nebraska 7.9 15.6 13.2 0.0 12.1 Nevada 0.0 10.0 25.0 0.0 14.0 New Hampshire 0.0 12.5 10.7 25.0 11.0 New Jersey 0.0 0.0 9.1 14.0 7.7 New Mexico 0.0 15.4 3.0 0.0 7.4 New York 14.3 13.5 14.2 7.9 11.7 North Carolina 6.7 5.0 6.3 7.7 5.9 North Dakota 6.5 8.8 10.0 0.0 8.1 Ohio 15.4 22.2 16.2 12.5 18.8 Oklahoma 9.4 13.7 14.3 0.0 13.3 Oregon 9.1 10.0 6.8 0.0 8.7 Pennsylvania 6.1 6.3 13.7 10.3 10.6 Rhode Island 0.0 0.0 7.7 0.0 3.4 South Carolina 15.6 9.4 16.4 25.0 14.2 South Dakota 0.0 7.6 0.0 0.0 5.0 Tennessee 0.0 8.0 7.4 0.0 6.5 Texas 5.7 6.9 8.5 6.3 7.7 Utah 0.0 22.2 20.7 0.0 13.0 Vermont 0.0 6.7 7.7 n/a 4.8 Virginia 5.6 11.0 18.4 31.3 15.1 Washington 18.8 21.4 19.4 25.0 20.3 West Virginia 0.0 5.3 9.1 n/a 6.3 Wisconsin 12.8 20.3 27.4 30.0 21.9 Wyoming 11.1 7.7 45.5 n/a 21.2
Source: CASPER
136 Nursing Home Data Compendium 2013

Table 2.14.d. Nursing Home Surveys Resulting in a Deficiency for Failure to Treat/Prevent Pressure Ulcers by Bed Size Category: United States, 2011
Percentage by Bed Size Category <50 50-99 100-199 >199 All Facilities
Nation 11.4 15.5 14.7 15.2 14.6 Alabama 14.3 11.2 11.4 7.7 11.2 Alaska 0.0 0.0 0.0 n/a 0.0 Arizona 9.1 8.1 19.7 16.7 15.3 Arkansas 16.7 33.3 36.4 50.0 34.9 California 15.0 13.8 17.3 26.1 15.4 Colorado 20.0 23.4 22.9 25.0 22.7 Connecticut 16.7 23.9 25.8 25.0 24.4 Delaware 0.0 33.3 22.7 0.0 20.5 District of Columbia 0.0 40.0 16.7 20.0 21.1 Florida 5.3 7.6 5.5 5.4 5.9 Georgia 25.0 17.5 4.7 40.0 12.2 Hawaii 18.2 11.1 15.4 100 17.6 Idaho 25.0 37.5 37.0 n/a 33.3 Illinois 10.1 19.8 26.5 22.4 21.8 Indiana 15.5 23.0 21.4 20.0 21.2 Iowa 13.9 10.0 17.2 0.0 12.0 Kansas 19.6 25.0 19.0 100 23.0 Kentucky 2.7 5.8 6.6 20.0 5.9 Louisiana 0.0 17.8 9.1 6.7 9.8 Maine 11.4 11.1 16.7 0.0 11.7 Maryland 0.0 12.2 9.8 4.8 8.7 Massachusetts 4.2 3.8 7.7 14.3 6.5 Michigan 15.6 24.8 33.5 33.3 29.1 Minnesota 26.7 25.1 23.1 27.3 25.1 Mississippi 0.0 4.2 1.2 0.0 2.5 Missouri 11.6 25.2 25.7 40.0 24.7 Montana 0.0 0.0 0.0 0.0 0.0 Nebraska 9.1 19.6 32.4 0.0 18.1 Nevada 0.0 10.0 11.5 20.0 9.8 New Hampshire 0.0 6.7 8.6 0.0 6.4 New Jersey 0.0 1.8 7.8 10.0 6.5 New Mexico 0.0 5.0 6.3 0.0 4.8 New York 4.3 12.2 13.9 7.6 10.6 North Carolina 2.5 8.2 5.0 0.0 5.7 North Dakota 21.2 9.7 23.8 25.0 18.0 Ohio 13.2 16.8 13.0 12.5 14.7 Oklahoma 10.0 16.3 16.8 0.0 15.8 Oregon 20.0 7.1 23.7 n/a 15.8 Pennsylvania 6.9 8.0 8.3 15.5 8.9 Rhode Island 0.0 2.9 4.8 33.3 4.3 South Carolina 12.5 13.0 13.6 0.0 12.7 South Dakota 4.5 10.0 14.3 n/a 7.0 Tennessee 7.1 8.8 15.9 26.7 13.5 Texas 3.2 8.7 7.7 7.9 7.7 Utah 25.0 28.6 33.3 0.0 28.2 Vermont 0.0 16.7 0.0 n/a 4.4 Virginia 8.6 12.2 14.4 13.3 13.0 Washington 12.1 17.2 13.4 0.0 14.4 West Virginia 23.1 12.5 18.2 n/a 16.9 Wisconsin 17.0 28.0 30.3 50.0 28.0 Wyoming 30.0 21.4 37.5 n/a 30.0
Source: CASPER
Nursing Home Data Compendium 2013 137

Table 2.14.e. Nursing Home Surveys Resulting in a Deficiency for Failure to Treat/Prevent Pressure Ulcers by Bed Size Category: United States, 2012
Percentage by Bed Size Category <50 50-99 100-199 >199 All Facilities
Nation 10.8 14.3 14.2 15.3 13.9 Alabama 33.3 15.1 13.1 6.7 14.0 Alaska 0.0 25.0 0.0 n/a 6.3 Arizona 0.0 10.3 19.7 12.5 14.9 Arkansas 16.7 41.2 34.4 0.0 36.2 California 12.0 14.8 18.4 28.3 15.8 Colorado 19.4 21.8 15.3 40.0 19.0 Connecticut 20.0 32.8 24.6 29.4 27.2 Delaware 0.0 12.5 15.8 100 15.2 District of Columbia 0.0 0.0 75.0 75.0 47.4 Florida 5.9 11.8 6.2 6.3 7.2 Georgia 20.0 5.7 6.3 8.7 6.9 Hawaii 7.7 11.1 15.4 0.0 10.5 Idaho 63.2 29.4 50.0 n/a 48.2 Illinois 12.0 21.1 19.0 21.1 19.2 Indiana 9.4 14.9 13.1 33.3 13.8 Iowa 7.6 9.8 16.1 33.3 10.3 Kansas 17.0 14.5 21.7 33.3 16.7 Kentucky 5.6 6.3 12.7 25.0 9.1 Louisiana 11.8 2.2 11.2 20.0 10.2 Maine 15.8 11.8 0.0 0.0 11.3 Maryland 7.1 11.4 3.2 0.0 5.1 Massachusetts 2.1 6.3 8.5 6.3 7.1 Michigan 14.3 30.1 26.9 40.7 27.4 Minnesota 18.8 20.6 26.6 27.3 21.5 Mississippi 0.0 1.1 6.6 0.0 3.3 Missouri 14.3 21.9 29.2 37.5 25.2 Montana 4.0 6.1 4.0 100 6.0 Nebraska 3.4 11.0 13.9 0.0 9.0 Nevada 15.4 0.0 0.0 0.0 3.6 New Hampshire 0.0 11.8 3.6 16.7 7.9 New Jersey 6.3 9.4 11.7 17.9 11.8 New Mexico 0.0 15.6 0.0 0.0 6.7 New York 4.2 14.6 14.1 10.3 12.0 North Carolina 5.7 7.7 5.9 0.0 6.4 North Dakota 19.4 5.7 21.1 33.3 14.8 Ohio 9.1 13.1 11.2 8.0 11.8 Oklahoma 8.3 9.8 11.8 33.3 10.9 Oregon 4.8 7.3 6.8 0.0 6.6 Pennsylvania 4.9 4.0 10.4 4.9 7.6 Rhode Island 0.0 6.5 5.6 0.0 4.9 South Carolina 12.5 7.4 8.1 0.0 8.6 South Dakota 14.3 16.1 0.0 n/a 13.9 Tennessee 5.9 6.7 16.5 0.0 11.9 Texas 2.1 7.1 8.5 8.6 7.6 Utah 0.0 15.4 17.4 0.0 10.2 Vermont 8.3 0.0 13.3 n/a 7.7 Virginia 14.3 22.6 22.9 18.8 21.7 Washington 3.3 9.3 16.5 40.0 12.3 West Virginia 11.1 7.9 12.5 0.0 10.0 Wisconsin 30.2 29.3 37.2 27.3 32.0 Wyoming 9.1 40.0 7.7 n/a 20.5
Source: CASPER
138 Nursing Home Data Compendium 2013

Table 2.14.f. Nursing Home Surveys Resulting in a Deficiency for Failure to Treat/Prevent Pressure Ulcers by Bed Size Category: United States (2008, 2012 and Change)
Percentage in 2008, 2012 and Percent Change (% Δ), by Bed Size Category <50 50-99 100-199 >199 All Facilities
2008 2012 % Δ 2008 2012 % Δ 2008 2012 % Δ 2008 2012 % Δ 2008 2012 % Δ
Nation 12.5 10.8 -13.6 17.5 14.3 -18.4 18.4 14.2 -22.9 22.4 15.3 -31.8 17.5 13.9 -20.8 Alabama 30.0 33.3 +11.1 6.3 15.1 +139 8.4 13.1 +56.2 16.7 6.7 -60.0 9.1 14.0 +54.3 Alaska 0.0 0.0 n/a 33.3 25.0 -25.0 n/a 0.0 n/a 0.0 n/a n/a 7.7 6.3 -18.8 Arizona 6.7 0.0 -100 13.9 10.3 -25.5 12.5 19.7 +57.6 54.5 12.5 -77.1 15.7 14.9 -4.8 Arkansas 10.0 16.7 +66.7 36.4 41.2 +13.0 42.6 34.4 -19.3 0.0 0.0 n/a 38.5 36.2 -6.0 California 13.3 12.0 -9.8 18.6 14.8 -20.5 22.8 18.4 -19.4 39.2 28.3 -27.8 19.6 15.8 -19.1 Colorado 8.6 19.4 +126 11.7 21.8 +86.6 24.7 15.3 -38.0 66.7 40.0 -40.0 17.6 19.0 +8.0 Connecticut 12.5 20.0 +60.0 19.7 32.8 +66.4 23.8 24.6 +3.0 50.0 29.4 -41.2 24.2 27.2 +12.6 Delaware 22.2 0.0 -100 22.2 12.5 -43.7 26.7 15.8 -40.8 0.0 100 n/a 24.5 15.2 -38.1 District of Columbia 0.0 0.0 n/a 20.0 0.0 -100 25.0 75.0 +200 60.0 75.0 +25.0 29.4 47.4 +61.1 Florida 15.0 5.9 -60.8 7.9 11.8 +49.4 10.8 6.2 -42.6 6.5 6.3 -3.1 10.3 7.2 -29.9 Georgia 14.8 20.0 +35.0 25.2 5.7 -77.2 18.9 6.3 -66.5 40.0 8.7 -78.3 22.1 6.9 -68.9 Hawaii 5.0 7.7 +53.8 0.0 11.1 n/a 13.3 15.4 +15.4 0.0 0.0 n/a 6.0 10.5 +75.4 Idaho 22.2 63.2 +184 9.5 29.4 +209 28.0 50.0 +78.6 n/a n/a n/a 20.3 48.2 +137 Illinois 14.1 12.0 -15.5 22.7 21.1 -7.2 20.9 19.0 -9.0 30.4 21.1 -30.6 22.2 19.2 -13.2 Indiana 15.7 9.4 -40.4 24.9 14.9 -40.0 29.4 13.1 -55.4 27.3 33.3 +22.2 25.1 13.8 -45.2 Iowa 11.2 7.6 -31.9 16.0 9.8 -38.5 33.3 16.1 -51.6 0.0 33.3 n/a 16.9 10.3 -39.0 Kansas 29.0 17.0 -41.3 46.5 14.5 -68.8 38.8 21.7 -43.9 0.0 33.3 n/a 39.9 16.7 -58.1 Kentucky 0.0 5.6 n/a 9.0 6.3 -30.1 7.6 12.7 +67.1 0.0 25.0 n/a 6.8 9.1 +32.7 Louisiana 12.5 11.8 -5.9 2.4 2.2 -6.7 10.9 11.2 +2.6 27.8 20.0 -28.0 10.8 10.2 -5.4 Maine 23.3 15.8 -32.1 17.5 11.8 -32.9 20.0 0.0 -100 50.0 0.0 -100 20.5 11.3 -44.9 Maryland 0.0 7.1 n/a 2.0 11.4 +457 11.9 3.2 -72.8 10.5 0.0 -100 8.1 5.1 -37.4 Massachusetts 1.6 2.1 +31.9 5.4 6.3 +16.7 7.8 8.5 +8.8 21.4 6.3 -70.8 6.7 7.1 +5.2 Michigan 10.0 14.3 +42.9 15.5 30.1 +94.5 20.4 26.9 +31.6 13.3 40.7 +206 17.4 27.4 +57.5 Minnesota 41.9 18.8 -55.1 47.8 20.6 -56.9 57.3 26.6 -53.6 61.5 27.3 -55.7 49.7 21.5 -56.7 Mississippi 5.3 0.0 -100 6.6 1.1 -83.0 7.1 6.6 -7.9 25.0 0.0 -100 7.0 3.3 -52.7 Missouri 24.4 14.3 -41.6 25.5 21.9 -14.3 29.7 29.2 -1.7 30.0 37.5 +25.0 27.4 25.2 -8.0 Montana 3.2 4.0 +24.0 3.3 6.1 +81.8 4.3 4.0 -8.0 0.0 100 n/a 3.5 6.0 +68.7 Nebraska 12.7 3.4 -73.2 19.1 11.0 -42.4 19.6 13.9 -29.0 60.0 0.0 -100 17.9 9.0 -49.5 Nevada 0.0 15.4 n/a 22.2 0.0 -100 8.7 0.0 -100 0.0 0.0 n/a 8.2 3.6 -55.5 New Hampshire 8.3 0.0 -100 7.9 11.8 +49.0 3.2 3.6 +10.7 0.0 16.7 n/a 5.8 7.9 +35.8 New Jersey 11.4 6.3 -45.3 6.8 9.4 +39.2 14.3 11.7 -18.4 13.3 17.9 +33.9 12.7 11.8 -6.7 New Mexico 0.0 0.0 n/a 11.1 15.6 +40.6 29.0 0.0 -100 50.0 0.0 -100 18.8 6.7 -64.6 New York 6.4 4.2 -34.7 10.6 14.6 +37.9 14.3 14.1 -1.6 14.3 10.3 -28.2 13.2 12.0 -9.1 North Carolina 0.0 5.7 n/a 10.4 7.7 -26.2 9.3 5.9 -36.4 16.7 0.0 -100 8.9 6.4 -28.4 North Dakota 10.3 19.4 +87.1 6.7 5.7 -14.3 5.0 21.1 +321 0.0 33.3 n/a 7.4 14.8 +99.4 Ohio 9.9 9.1 -8.3 19.9 13.1 -34.2 25.5 11.2 -56.0 20.8 8.0 -61.6 21.1 11.8 -44.0 Oklahoma 9.7 8.3 -13.9 16.8 9.8 -41.4 28.5 11.8 -58.5 33.3 33.3 0.0 21.0 10.9 -48.1 Oregon 4.5 4.8 +4.8 8.1 7.3 -9.8 12.8 6.8 -46.6 50.0 0.0 -100 9.8 6.6 -32.4 Pennsylvania 8.2 4.9 -39.5 7.2 4.0 -44.6 12.2 10.4 -14.5 16.9 4.9 -71.1 11.0 7.6 -30.6 Rhode Island 8.3 0.0 -100 15.2 6.5 -57.4 7.7 5.6 -27.8 0.0 0.0 n/a 10.3 4.9 -52.8 South Carolina 8.6 12.5 +45.8 18.2 7.4 -59.3 27.6 8.1 -70.5 20.0 0.0 -100 20.5 8.6 -58.0 South Dakota 3.6 14.3 +300 1.9 16.1 +752 0.0 0.0 n/a n/a n/a n/a 2.5 13.9 +451 Tennessee 12.9 5.9 -54.4 6.4 6.7 +4.4 8.4 16.5 +97.0 0.0 0.0 n/a 7.7 11.9 +53.9 Texas 6.0 2.1 -64.5 7.1 7.1 -0.3 10.0 8.5 -15.1 20.6 8.6 -58.4 9.0 7.6 -16.1 Utah 0.0 0.0 n/a 3.4 15.4 +346 18.2 17.4 -4.3 0.0 0.0 n/a 8.0 10.2 +27.8 Vermont 18.2 8.3 -54.2 9.1 0.0 -100 6.7 13.3 +100 n/a n/a n/a 10.8 7.7 -28.8 Virginia 9.4 14.3 +52.4 16.7 22.6 +35.7 29.1 22.9 -21.2 26.7 18.8 -29.7 22.8 21.7 -4.8 Washington 20.5 3.3 -83.8 21.1 9.3 -55.8 21.7 16.5 -24.0 25.0 40.0 +60.0 21.3 12.3 -42.5 West Virginia 13.0 11.1 -14.8 17.9 7.9 -55.8 19.5 12.5 -35.9 0.0 0.0 n/a 17.4 10.0 -42.4 Wisconsin 15.1 30.2 +100 21.1 29.3 +38.7 33.8 37.2 +10.0 66.7 27.3 -59.1 26.1 32.0 +22.4 Wyoming 27.3 9.1 -66.7 13.3 40.0 +200 42.9 7.7 -82.1 n/a n/a n/a 27.5 20.5 -25.4
Source: CASPER
Nursing Home Data Compendium 2013 139

Table 2.15.a. Nursing Home Surveys Resulting in a Deficiency for Failure to Treat/Prevent Pressure Ulcers by Ownership Type: United States, 2008
Percentage by Ownership Type
For-Profit Non-Profit Government All Facilities
Nation 17.8 16.9 16.4 17.5 Alabama 7.4 18.2 11.1 9.1 Alaska 33.3 0.0 0.0 7.7 Arizona 17.0 9.7 33.3 15.7 Arkansas 39.8 32.4 30.0 38.5 California 20.8 16.1 10.6 19.6 Colorado 18.6 12.2 22.7 17.6 Connecticut 24.1 25.5 0.0 24.2 Delaware 28.0 26.3 0.0 24.5 District of Columbia 16.7 33.3 50.0 29.4 Florida 11.2 8.4 0.0 10.3 Georgia 20.5 24.0 30.4 22.1 Hawaii 0.0 8.3 15.4 6.0 Idaho 20.5 11.1 27.3 20.3 Illinois 23.7 19.0 15.4 22.2 Indiana 28.3 18.6 17.2 25.1 Iowa 17.6 16.3 14.3 16.9 Kansas 43.8 39.4 27.3 39.9 Kentucky 8.2 2.5 20.0 6.8 Louisiana 12.0 7.4 6.7 10.8 Maine 18.8 25.8 0.0 20.5 Maryland 10.2 4.5 0.0 8.1 Massachusetts 6.7 7.3 0.0 6.7 Michigan 18.9 12.5 19.4 17.4 Minnesota 42.3 52.6 52.6 49.7 Mississippi 7.5 7.5 3.7 7.0 Missouri 28.4 23.3 32.5 27.4 Montana 5.3 3.0 0.0 3.5 Nebraska 17.9 21.9 12.7 17.9 Nevada 8.6 12.5 0.0 8.2 New Hampshire 4.8 6.5 7.7 5.8 New Jersey 14.1 11.8 0.0 12.7 New Mexico 21.7 16.7 0.0 18.8 New York 11.7 14.4 16.3 13.2 North Carolina 9.8 6.9 0.0 8.9 North Dakota 0.0 5.5 50.0 7.4 Ohio 22.1 19.1 8.0 21.1 Oklahoma 22.1 16.1 7.7 21.0 Oregon 12.1 0.0 0.0 9.8 Pennsylvania 11.8 8.2 26.2 11.0 Rhode Island 8.6 17.6 n/a 10.3 South Carolina 19.1 27.3 22.2 20.5 South Dakota 2.4 2.8 0.0 2.5 Tennessee 8.1 5.1 11.1 7.7 Texas 9.8 5.1 6.1 9.0 Utah 8.3 0.0 33.3 8.0 Vermont 12.0 9.1 0.0 10.8 Virginia 24.2 20.8 11.1 22.8 Washington 20.3 28.3 10.5 21.3 West Virginia 22.2 6.9 9.1 17.4 Wisconsin 28.6 26.1 17.2 26.1 Wyoming 47.1 25.0 6.7 27.5
Source: CASPER
140 Nursing Home Data Compendium 2013

Table 2.15.b. Nursing Home Surveys Resulting in a Deficiency for Failure to Treat/Prevent Pressure Ulcers by Ownership Type: United States, 2009
Percentage by Ownership Type
For-Profit Non-Profit Government All Facilities Nation 16.4 14.6 15.7 15.9 Alabama 12.9 11.4 0.0 11.8 Alaska 0.0 0.0 0.0 0.0 Arizona 21.7 21.7 0.0 21.2 Arkansas 34.0 33.3 30.0 33.8 California 19.0 10.2 2.3 16.9 Colorado 20.7 23.9 9.5 20.3 Connecticut 25.1 20.0 0.0 23.9 Delaware 20.8 28.6 40.0 25.6 District of Columbia 40.0 11.1 0.0 23.8 Florida 8.4 8.8 0.0 8.4 Georgia 17.9 15.1 17.4 17.1 Hawaii 15.4 16.7 10.0 14.6 Idaho 37.0 53.8 35.7 39.7 Illinois 21.1 15.0 13.3 19.1 Indiana 22.2 16.1 10.8 19.8 Iowa 13.6 11.1 4.8 12.2 Kansas 44.5 24.3 44.7 36.9 Kentucky 8.7 6.5 0.0 7.9 Louisiana 10.8 16.4 6.3 11.6 Maine 12.2 13.3 0.0 12.4 Maryland 14.1 9.5 12.5 12.6 Massachusetts 6.7 3.1 14.3 5.8 Michigan 19.9 21.9 15.4 20.0 Minnesota 29.6 38.9 50.0 37.5 Mississippi 3.5 8.6 3.4 4.4 Missouri 28.1 21.3 27.5 26.5 Montana 9.3 5.1 5.9 7.1 Nebraska 14.6 12.3 18.0 14.7 Nevada 10.8 14.3 0.0 10.0 New Hampshire 9.3 11.1 8.3 9.8 New Jersey 13.4 10.3 23.8 13.2 New Mexico 8.3 5.6 0.0 6.9 New York 12.4 15.5 16.3 14.0 North Carolina 8.0 4.4 0.0 7.0 North Dakota 0.0 8.1 0.0 7.4 Ohio 21.1 18.1 28.0 20.6 Oklahoma 15.8 13.2 0.0 14.9 Oregon 16.8 10.5 0.0 15.1 Pennsylvania 12.4 8.3 14.0 10.7 Rhode Island 9.0 11.1 n/a 9.4 South Carolina 14.0 22.6 17.6 15.8 South Dakota 5.4 4.3 0.0 4.5 Tennessee 7.9 5.4 0.0 7.0 Texas 9.7 8.2 9.7 9.5 Utah 4.6 0.0 0.0 3.9 Vermont 11.1 0.0 0.0 7.9 Virginia 18.1 16.9 0.0 17.0 Washington 26.2 8.9 12.5 22.1 West Virginia 11.8 13.8 8.3 11.9 Wisconsin 24.3 17.9 15.4 20.9 Wyoming 23.1 25.0 21.1 22.2
Source: CASPER
Nursing Home Data Compendium 2013 141

Table 2.15.c. Nursing Home Surveys Resulting in a Deficiency for Failure to Treat/Prevent Pressure Ulcers by Ownership Type: United States, 2010
Percentage by Ownership Type
For-Profit Non-Profit Government All Facilities Nation 14.6 12.8 14.0 14.1 Alabama 9.7 9.7 6.3 9.4 Alaska 0.0 0.0 0.0 0.0 Arizona 21.8 13.6 50.0 20.7 Arkansas 34.2 38.2 0.0 33.5 California 18.1 16.5 4.7 17.3 Colorado 24.1 24.3 18.8 23.7 Connecticut 26.2 23.3 0.0 25.4 Delaware 27.3 15.4 0.0 19.2 District of Columbia 22.2 25.0 0.0 21.1 Florida 6.4 5.2 7.7 6.1 Georgia 11.9 11.2 15.4 11.9 Hawaii 22.2 15.4 0.0 16.2 Idaho 25.9 20.0 46.2 28.6 Illinois 21.5 18.5 20.7 20.7 Indiana 18.1 15.3 14.9 17.1 Iowa 9.6 8.9 5.6 9.2 Kansas 37.3 17.0 31.7 29.3 Kentucky 3.6 4.9 0.0 3.9 Louisiana 11.4 2.3 13.3 10.0 Maine 8.6 19.4 100 12.7 Maryland 10.7 9.2 16.7 10.4 Massachusetts 8.3 8.7 0.0 8.4 Michigan 20.0 16.4 16.2 18.8 Minnesota 24.1 19.7 22.2 21.3 Mississippi 5.5 6.3 3.6 5.3 Missouri 22.7 18.5 23.3 21.8 Montana 8.3 0.0 13.3 6.1 Nebraska 10.8 10.8 17.0 12.1 Nevada 10.8 37.5 0.0 14.0 New Hampshire 8.6 7.4 27.3 11.0 New Jersey 9.1 4.3 5.3 7.7 New Mexico 2.1 25.0 0.0 7.4 New York 10.9 13.5 7.5 11.7 North Carolina 5.0 6.8 25.0 5.9 North Dakota 0.0 7.8 50.0 8.1 Ohio 18.5 20.6 15.0 18.8 Oklahoma 15.3 0.0 9.1 13.3 Oregon 9.6 5.3 0.0 8.7 Pennsylvania 12.8 7.4 16.7 10.6 Rhode Island 4.2 0.0 n/a 3.4 South Carolina 15.6 10.7 7.7 14.2 South Dakota 7.5 3.9 0.0 5.0 Tennessee 6.3 8.9 0.0 6.5 Texas 7.8 8.3 3.2 7.7 Utah 13.2 7.7 33.3 13.0 Vermont 3.8 6.7 0.0 4.8 Virginia 13.3 17.9 25.0 15.1 Washington 20.7 22.7 7.1 20.3 West Virginia 9.7 0.0 0.0 6.3 Wisconsin 26.0 18.5 15.2 21.9 Wyoming 42.9 0.0 7.7 21.2
Source: CASPER
142 Nursing Home Data Compendium 2013

Table 2.15.d. Nursing Home Surveys Resulting in a Deficiency for Failure to Treat/Prevent Pressure Ulcers by Ownership Type: United States, 2011
Percentage by Ownership Type
For-Profit Non-Profit Government All Facilities Nation 14.9 13.7 13.7 14.6 Alabama 11.9 8.8 7.7 11.2 Alaska 0.0 0.0 0.0 0.0 Arizona 17.3 8.0 0.0 15.3 Arkansas 34.7 36.4 33.3 34.9 California 16.5 12.3 2.4 15.4 Colorado 24.5 26.9 0.0 22.7 Connecticut 24.9 21.3 100 24.4 Delaware 19.0 21.4 25.0 20.5 District of Columbia 25.0 18.2 n/a 21.1 Florida 5.9 6.3 0.0 5.9 Georgia 13.1 10.0 12.5 12.2 Hawaii 6.3 30.0 25.0 17.6 Idaho 32.0 18.2 50.0 33.3 Illinois 23.2 17.3 23.3 21.8 Indiana 22.3 20.9 14.8 21.2 Iowa 10.6 13.8 12.5 12.0 Kansas 30.0 13.9 19.5 23.0 Kentucky 6.9 3.4 0.0 5.9 Louisiana 9.2 13.6 8.3 9.8 Maine 12.3 10.7 0.0 11.7 Maryland 10.3 5.2 0.0 8.7 Massachusetts 6.3 7.5 0.0 6.5 Michigan 32.8 23.1 15.4 29.1 Minnesota 25.9 24.8 24.3 25.1 Mississippi 1.3 5.9 8.0 2.5 Missouri 24.8 23.2 27.8 24.7 Montana 0.0 0.0 0.0 0.0 Nebraska 19.1 23.7 8.7 18.1 Nevada 10.0 16.7 0.0 9.8 New Hampshire 4.8 8.7 7.7 6.4 New Jersey 6.3 4.3 20.0 6.5 New Mexico 2.2 16.7 0.0 4.8 New York 9.7 10.2 19.1 10.6 North Carolina 5.0 9.0 0.0 5.7 North Dakota 25.0 18.3 0.0 18.0 Ohio 14.6 14.2 22.2 14.7 Oklahoma 14.8 25.6 0.0 15.8 Oregon 15.6 14.3 25.0 15.8 Pennsylvania 11.3 6.1 7.5 8.9 Rhode Island 4.1 5.3 n/a 4.3 South Carolina 14.6 10.0 0.0 12.7 South Dakota 7.1 7.7 0.0 7.0 Tennessee 15.0 7.5 14.3 13.5 Texas 8.0 6.0 5.9 7.7 Utah 27.6 37.5 0.0 28.2 Vermont 3.2 7.7 0.0 4.4 Virginia 13.0 12.2 18.2 13.0 Washington 16.1 10.4 7.7 14.4 West Virginia 15.2 23.8 0.0 16.9 Wisconsin 30.6 27.7 19.2 28.0 Wyoming 31.3 57.1 17.6 30.0
Source: CASPER
Nursing Home Data Compendium 2013 143

Table 2.15.e. Nursing Home Surveys Resulting in a Deficiency for Failure to Treat/Prevent Pressure Ulcers by Ownership Type: United States, 2012
Percentage by Ownership Type
For-Profit Non-Profit Government All Facilities Nation 14.2 13.1 12.5 13.9 Alabama 11.8 28.6 14.3 14.0 Alaska 100 0.0 0.0 6.3 Arizona 17.9 0.0 0.0 14.9 Arkansas 37.2 35.5 20.0 36.2 California 17.2 10.7 7.1 15.8 Colorado 19.2 20.0 15.8 19.0 Connecticut 29.2 21.4 0.0 27.2 Delaware 13.0 0.0 66.7 15.2 District of Columbia 55.6 40.0 n/a 47.4 Florida 8.0 5.6 0.0 7.2 Georgia 7.5 6.7 0.0 6.9 Hawaii 16.7 7.7 0.0 10.5 Idaho 52.6 33.3 44.4 48.2 Illinois 19.0 19.1 24.1 19.2 Indiana 15.1 12.0 12.1 13.8 Iowa 9.6 12.4 0.0 10.3 Kansas 22.7 10.9 6.7 16.7 Kentucky 9.6 6.7 20.0 9.1 Louisiana 10.1 9.5 15.4 10.2 Maine 12.0 10.0 0.0 11.3 Maryland 6.0 3.2 0.0 5.1 Massachusetts 7.0 7.4 0.0 7.1 Michigan 28.0 20.7 41.0 27.4 Minnesota 22.4 21.5 18.9 21.5 Mississippi 4.4 0.0 0.0 3.3 Missouri 26.4 16.7 40.0 25.2 Montana 10.8 3.0 0.0 6.0 Nebraska 9.5 5.8 12.2 9.0 Nevada 4.8 0.0 0.0 3.6 New Hampshire 14.3 0.0 0.0 7.9 New Jersey 11.1 12.9 15.8 11.8 New Mexico 5.6 12.5 0.0 6.7 New York 12.3 12.8 4.8 12.0 North Carolina 6.4 5.7 10.0 6.4 North Dakota 33.3 14.5 0.0 14.8 Ohio 12.6 9.1 6.7 11.8 Oklahoma 10.9 13.9 0.0 10.9 Oregon 8.0 0.0 0.0 6.6 Pennsylvania 8.5 7.5 0.0 7.6 Rhode Island 4.5 6.3 n/a 4.9 South Carolina 8.5 12.1 0.0 8.6 South Dakota 8.3 17.9 0.0 13.9 Tennessee 13.3 9.4 0.0 11.9 Texas 7.9 7.0 0.0 7.6 Utah 9.8 16.7 0.0 10.2 Vermont 3.8 16.7 0.0 7.7 Virginia 21.0 25.3 9.1 21.7 Washington 13.8 7.5 8.3 12.3 West Virginia 11.3 8.3 0.0 10.0 Wisconsin 30.2 35.3 31.3 32.0 Wyoming 12.5 50.0 17.6 20.5
Source: CASPER
144 Nursing Home Data Compendium 2013

Table 2.15.f. Nursing Home Surveys Resulting in a Deficiency for Failure to Treat/Prevent Pressure Ulcers by Ownership Type: United States (2008, 2012 and Change)
Percentage in 2008, 2012 and Percent Change (% Δ), by Ownership Type For-Profit Non-Profit Government All Facilities
2008 2012 % Δ 2008 2012 % Δ 2008 2012 % Δ 2008 2012 % ΔNation 17.8 14.2 -20.1 16.9 13.1 -22.7 16.4 12.5 -24.0 17.5 13.9 -20.8 Alabama 7.4 11.8 +59.2 18.2 28.6 +57.1 11.1 14.3 +28.6 9.1 14.0 +54.3 Alaska 33.3 100 +200 0.0 0.0 n/a 0.0 0.0 n/a 7.7 6.3 -18.8 Arizona 17.0 17.9 +5.3 9.7 0.0 -100 33.3 0.0 -100 15.7 14.9 -4.8 Arkansas 39.8 37.2 -6.5 32.4 35.5 +9.4 30.0 20.0 -33.3 38.5 36.2 -6.0 California 20.8 17.2 -17.2 16.1 10.7 -33.5 10.6 7.1 -32.9 19.6 15.8 -19.1 Colorado 18.6 19.2 +2.9 12.2 20.0 +63.3 22.7 15.8 -30.5 17.6 19.0 +8.0 Connecticut 24.1 29.2 +21.1 25.5 21.4 -15.9 0.0 0.0 n/a 24.2 27.2 +12.6 Delaware 28.0 13.0 -53.4 26.3 0.0 -100 0.0 66.7 n/a 24.5 15.2 -38.1 District of Columbia 16.7 55.6 +233 33.3 40.0 +20.0 50.0 n/a n/a 29.4 47.4 +61.1 Florida 11.2 8.0 -28.8 8.4 5.6 -33.7 0.0 0.0 n/a 10.3 7.2 -29.9 Georgia 20.5 7.5 -63.4 24.0 6.7 -72.2 30.4 0.0 -100 22.1 6.9 -68.9 Hawaii 0.0 16.7 n/a 8.3 7.7 -7.7 15.4 0.0 -100 6.0 10.5 +75.4 Idaho 20.5 52.6 +157 11.1 33.3 +200 27.3 44.4 +63.0 20.3 48.2 +137 Illinois 23.7 19.0 -19.6 19.0 19.1 +0.5 15.4 24.1 +56.9 22.2 19.2 -13.2 Indiana 28.3 15.1 -46.5 18.6 12.0 -35.5 17.2 12.1 -29.9 25.1 13.8 -45.2 Iowa 17.6 9.6 -45.7 16.3 12.4 -23.8 14.3 0.0 -100 16.9 10.3 -39.0 Kansas 43.8 22.7 -48.2 39.4 10.9 -72.4 27.3 6.7 -75.6 39.9 16.7 -58.1 Kentucky 8.2 9.6 +17.1 2.5 6.7 +163 20.0 20.0 0.0 6.8 9.1 +32.7 Louisiana 12.0 10.1 -16.1 7.4 9.5 +28.6 6.7 15.4 +131 10.8 10.2 -5.4 Maine 18.8 12.0 -36.0 25.8 10.0 -61.3 0.0 0.0 n/a 20.5 11.3 -44.9 Maryland 10.2 6.0 -40.9 4.5 3.2 -30.2 0.0 0.0 n/a 8.1 5.1 -37.4 Massachusetts 6.7 7.0 +5.4 7.3 7.4 +1.7 0.0 0.0 n/a 6.7 7.1 +5.2 Michigan 18.9 28.0 +48.7 12.5 20.7 +65.8 19.4 41.0 +111 17.4 27.4 +57.5 Minnesota 42.3 22.4 -47.0 52.6 21.5 -59.1 52.6 18.9 -64.1 49.7 21.5 -56.7 Mississippi 7.5 4.4 -41.0 7.5 0.0 -100 3.7 0.0 -100 7.0 3.3 -52.7 Missouri 28.4 26.4 -7.1 23.3 16.7 -28.5 32.5 40.0 +23.1 27.4 25.2 -8.0 Montana 5.3 10.8 +105 3.0 3.0 0.0 0.0 0.0 n/a 3.5 6.0 +68.7 Nebraska 17.9 9.5 -46.9 21.9 5.8 -73.7 12.7 12.2 -4.2 17.9 9.0 -49.5 Nevada 8.6 4.8 -44.4 12.5 0.0 -100 0.0 0.0 n/a 8.2 3.6 -55.5 New Hampshire 4.8 14.3 +200 6.5 0.0 -100 7.7 0.0 -100 5.8 7.9 +35.8 New Jersey 14.1 11.1 -21.2 11.8 12.9 +9.5 0.0 15.8 n/a 12.7 11.8 -6.7 New Mexico 21.7 5.6 -74.4 16.7 12.5 -25.0 0.0 0.0 n/a 18.8 6.7 -64.6 New York 11.7 12.3 +4.8 14.4 12.8 -11.4 16.3 4.8 -70.7 13.2 12.0 -9.1 North Carolina 9.8 6.4 -34.4 6.9 5.7 -16.3 0.0 10.0 n/a 8.9 6.4 -28.4 North Dakota 0.0 33.3 n/a 5.5 14.5 +164 50.0 0.0 -100 7.4 14.8 +99.4 Ohio 22.1 12.6 -42.9 19.1 9.1 -52.3 8.0 6.7 -16.7 21.1 11.8 -44.0 Oklahoma 22.1 10.9 -50.9 16.1 13.9 -13.9 7.7 0.0 -100 21.0 10.9 -48.1 Oregon 12.1 8.0 -34.2 0.0 0.0 n/a 0.0 0.0 n/a 9.8 6.6 -32.4 Pennsylvania 11.8 8.5 -27.8 8.2 7.5 -9.1 26.2 0.0 -100 11.0 7.6 -30.6 Rhode Island 8.6 4.5 -47.0 17.6 6.3 -64.6 n/a n/a n/a 10.3 4.9 -52.8 South Carolina 19.1 8.5 -55.4 27.3 12.1 -55.6 22.2 0.0 -100 20.5 8.6 -58.0 South Dakota 2.4 8.3 +242 2.8 17.9 +545 0.0 0.0 n/a 2.5 13.9 +451 Tennessee 8.1 13.3 +63.2 5.1 9.4 +84.4 11.1 0.0 -100 7.7 11.9 +53.9 Texas 9.8 7.9 -19.3 5.1 7.0 +36.9 6.1 0.0 -100 9.0 7.6 -16.1 Utah 8.3 9.8 +17.6 0.0 16.7 n/a 33.3 0.0 -100 8.0 10.2 +27.8 Vermont 12.0 3.8 -67.9 9.1 16.7 +83.3 0.0 0.0 n/a 10.8 7.7 -28.8 Virginia 24.2 21.0 -13.3 20.8 25.3 +21.9 11.1 9.1 -18.2 22.8 21.7 -4.8 Washington 20.3 13.8 -32.4 28.3 7.5 -73.5 10.5 8.3 -20.8 21.3 12.3 -42.5 West Virginia 22.2 11.3 -49.2 6.9 8.3 +20.8 9.1 0.0 -100 17.4 10.0 -42.4 Wisconsin 28.6 30.2 +5.3 26.1 35.3 +35.5 17.2 31.3 +81.2 26.1 32.0 +22.4 Wyoming 47.1 12.5 -73.4 25.0 50.0 +100 6.7 17.6 +165 27.5 20.5 -25.4 Source: CASPER
Nursing Home Data Compendium 2013 145

146 Nursing Home Data Compendium 2013

Section 3. Nursing Home Resident Characteristics
Nursing Home Data Compendium 2013 147

148 Nursing Home Data Compendium 2013

Figure 3.1. Percentage of State Residents Aged 65 Years and Older in a Nursing Home: United States
Nursing Home Data Compendium 2013 149
Source: U.S. Census, MDS; measures are fully described in the Methods section Numbers in parentheses in legend indicate number of states in a given category

Figure 3.2. Percentage of State Residents Aged 85 Years and Older in a Nursing Home: United States
150 Nursing Home Data Compendium 2013
Source: U.S. Census, MDS; measures are fully described in the Methods section Numbers in parentheses in legend indicate number of states in a given category

Figure 3.3. Percentage of Nursing Home Residents Aged 65 Years and Older: United States
Nursing Home Data Compendium 2013 151
Source: MDS; measures are fully described in the Methods section Numbers in parentheses in legend indicate number of states in a given category

Figure 3.4. Percentage of Nursing Home Residents Aged 85 Years and Older: United States
152 Nursing Home Data Compendium 2013
Source: MDS; measures are fully described in the Methods section Numbers in parentheses in legend indicate number of states in a given category

Figure 3.5. Percentage of Nursing Home Residents Aged 95 Years and Older: United States
Nursing Home Data Compendium 2013 153
Source: MDS; measures are fully described in the Methods section Numbers in parentheses in legend indicate number of states in a given category

Figure 3.6. Percentage of Minority Nursing Home Residents: United States
154 Nursing Home Data Compendium 2013
Source: MDS; measures are fully described in the Methods section Numbers in parentheses in legend indicate number of states in a given category

Figure 3.7. Percentage of Nursing Home Residents with Zero ADL Impairments: United States
Nursing Home Data Compendium 2013 155
Source: MDS; measures are fully described in the Methods section Numbers in parentheses in legend indicate number of states in a given category

Figure 3.8. Percentage of Nursing Home Residents with Four or Five ADL Impairments: United States
156 Nursing Home Data Compendium 2013
Source: MDS; measures are fully described in the Methods section Numbers in parentheses in legend indicate number of states in a given category

Figure 3.9. Percentage of Nursing Home Residents with a Recent Fall: United States
Nursing Home Data Compendium 2013 157
Source: MDS; measures are fully described in the Methods section Numbers in parentheses in legend indicate number of states in a given category

Figure 3.10. Percentage of Nursing Home Residents with a Recent Injurious Fall: United States
158 Nursing Home Data Compendium 2013
Source: MDS; measures are fully described in the Methods section Numbers in parentheses in legend indicate number of states in a given category

Figure 3.11. Percentage of Nursing Home Residents with Pressure Ulcers: United States
Nursing Home Data Compendium 2013 159
Source: MDS; measures are fully described in the Methods section Numbers in parentheses in legend indicate number of states in a given category

Figure 3.12. Percentage of Nursing Home Residents who were Physically Restrained: United States
160 Nursing Home Data Compendium 2013
Source: MDS; measures are fully described in the Methods section Numbers in parentheses in legend indicate number of states in a given category
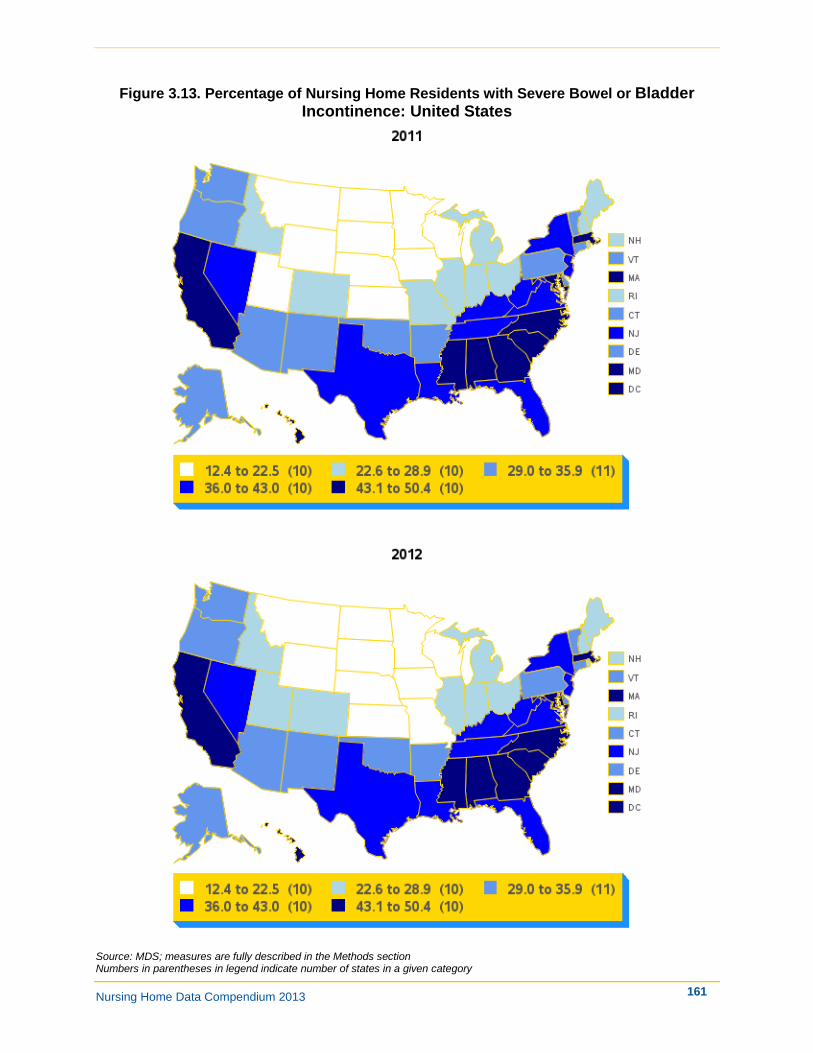
Figure 3.13. Percentage of Nursing Home Residents with Severe Bowel or Bladder Incontinence: United States
Nursing Home Data Compendium 2013 161
Source: MDS; measures are fully described in the Methods section Numbers in parentheses in legend indicate number of states in a given category

Figure 3.14. Percentage of Nursing Home Residents with a Feeding Tube: United States
162 Nursing Home Data Compendium 2013
Source: MDS; measures are fully described in the Methods section Numbers in parentheses in legend indicate number of states in a given category

Figure 3.15. Percentage of Nursing Home Residents with Unintended Weight Loss: United States
Nursing Home Data Compendium 2013 163
Source: MDS; measures are fully described in the Methods section Numbers in parentheses in legend indicate number of states in a given category

Figure 3.16. Percentage of Nursing Home Residents Taking Antipsychotic Medication: United States
164 Nursing Home Data Compendium 2013
Source: MDS; measures are fully described in the Methods section Numbers in parentheses in legend indicate number of states in a given category

Table 3.1.a. Percentage of State Residents in a Nursing Home: United States, 2011
Percentage of State Residents in a Nursing Home Men and Women Men Women
All Ages 65+ 85+ All Ages 65+ 85+ All Ages 65+ 85+ Nation 0.5 2.9 10.7 0.3 2.0 6.8 0.6 3.7 12.6 Alabama 0.5 2.9 11.4 0.3 1.7 5.9 0.7 3.8 13.9 Alaska 0.1 0.8 3.4 0.1 0.6 2.3 0.1 1.0 4.0 Arizona 0.2 1.1 3.8 0.1 0.8 2.6 0.2 1.3 4.5 Arkansas 0.6 3.7 14.8 0.4 2.3 8.5 0.9 4.8 17.9 California 0.3 1.9 6.4 0.2 1.5 4.2 0.3 2.3 7.5 Colorado 0.3 2.4 9.8 0.2 1.6 6.6 0.4 3.1 11.4 Connecticut 0.7 4.4 15.0 0.4 2.9 9.3 1.0 5.6 17.6 Delaware 0.5 2.7 11.6 0.3 1.8 7.4 0.6 3.5 13.7 District of Columbia 0.4 3.0 8.3 0.3 2.4 5.0 0.5 3.4 9.8 Florida 0.4 2.0 6.9 0.3 1.4 4.3 0.5 2.4 8.4 Georgia 0.4 2.7 10.6 0.2 1.7 5.7 0.5 3.4 12.7 Hawaii 0.3 1.7 6.3 0.2 1.2 4.2 0.4 2.1 7.6 Idaho 0.3 1.8 6.7 0.2 1.3 5.3 0.3 2.1 7.5 Illinois 0.6 3.6 12.2 0.4 2.5 8.0 0.7 4.4 14.2 Indiana 0.6 4.0 14.8 0.4 2.5 9.3 0.8 5.2 17.3 Iowa 0.8 5.0 18.3 0.5 3.3 12.8 1.1 6.4 20.8 Kansas 0.7 4.3 15.3 0.4 2.9 11.0 0.9 5.4 17.5 Kentucky 0.5 3.5 13.6 0.3 2.1 8.1 0.8 4.5 16.1 Louisiana 0.6 3.6 12.9 0.4 2.5 8.0 0.7 4.4 15.3 Maine 0.5 2.7 10.3 0.3 1.7 6.9 0.7 3.4 12.0 Maryland 0.4 2.9 10.2 0.3 2.1 6.6 0.6 3.6 11.9 Massachusetts 0.7 4.2 14.5 0.4 2.7 9.3 0.9 5.2 16.9 Michigan 0.4 2.6 9.6 0.3 1.7 6.0 0.6 3.4 11.3 Minnesota 0.5 3.7 13.8 0.3 2.4 9.8 0.7 4.6 15.8 Mississippi 0.5 3.5 12.8 0.3 2.2 6.5 0.7 4.4 15.5 Missouri 0.6 3.7 13.6 0.4 2.4 8.1 0.9 4.8 16.2 Montana 0.5 2.8 10.7 0.3 2.0 7.4 0.6 3.5 12.5 Nebraska 0.7 4.5 15.6 0.4 3.0 11.0 0.9 5.6 17.9 Nevada 0.2 1.2 4.9 0.1 0.9 3.5 0.2 1.4 5.7 New Hampshire 0.5 3.5 14.2 0.3 2.0 8.1 0.8 4.8 17.2 New Jersey 0.5 3.3 11.1 0.4 2.3 7.4 0.7 4.0 12.9 New Mexico 0.3 1.9 7.5 0.2 1.4 5.2 0.4 2.3 8.9 New York 0.6 3.6 12.4 0.4 2.6 8.3 0.7 4.3 14.3 North Carolina 0.4 2.6 10.2 0.2 1.6 6.0 0.5 3.3 12.1 North Dakota 0.8 5.3 19.1 0.5 3.6 13.8 1.2 6.7 21.8 Ohio 0.7 4.0 13.4 0.5 2.6 8.6 0.9 5.0 15.7 Oklahoma 0.5 3.2 11.7 0.3 1.9 6.3 0.7 4.1 14.4 Oregon 0.2 1.2 3.7 0.2 0.9 2.9 0.3 1.4 4.2 Pennsylvania 0.6 3.6 12.5 0.4 2.4 7.9 0.9 4.6 14.6 Rhode Island 0.8 4.9 16.6 0.5 3.0 10.2 1.1 6.3 19.5 South Carolina 0.4 2.3 10.0 0.2 1.5 6.1 0.5 3.0 11.6 South Dakota 0.8 5.0 17.9 0.5 3.3 12.8 1.1 6.2 20.3 Tennessee 0.5 3.1 12.0 0.3 1.9 6.9 0.7 4.0 14.2 Texas 0.4 3.2 12.2 0.3 2.2 7.9 0.5 3.9 14.4 Utah 0.2 1.8 5.7 0.2 1.3 4.1 0.3 2.2 6.7 Vermont 0.5 2.7 10.7 0.3 1.9 7.9 0.6 3.4 12.1 Virginia 0.4 2.5 9.6 0.2 1.6 6.0 0.5 3.2 11.2 Washington 0.3 1.7 6.1 0.2 1.3 4.3 0.3 2.1 7.0 West Virginia 0.5 2.8 10.9 0.3 1.6 6.0 0.7 3.7 13.2 Wisconsin 0.5 3.5 13.0 0.3 2.4 9.5 0.7 4.3 14.7 Wyoming 0.4 3.1 13.3 0.3 1.9 8.6 0.6 4.1 15.8
Source: MDS and US Census
Nursing Home Data Compendium 2013 165

Table 3.1.b. Percentage of State Residents in a Nursing Home: United States, 2012
Percentage of State Residents in a Nursing Home Men and Women Men Women
All Ages 65+ 85+ All Ages 65+ 85+ All Ages 65+ 85+ Nation 0.4 2.8 10.2 0.3 1.9 6.5 0.6 3.5 12.1 Alabama 0.5 2.7 10.7 0.3 1.6 5.3 0.7 3.6 13.1 Alaska 0.1 0.7 3.1 0.1 0.5 2.0 0.1 1.0 3.7 Arizona 0.2 1.0 3.6 0.1 0.8 2.4 0.2 1.2 4.3 Arkansas 0.6 3.5 13.9 0.4 2.1 7.9 0.8 4.5 16.9 California 0.3 1.8 6.0 0.2 1.4 4.0 0.3 2.2 7.0 Colorado 0.3 2.3 9.4 0.2 1.6 6.3 0.4 2.9 10.9 Connecticut 0.7 4.2 14.4 0.4 2.7 9.0 1.0 5.3 17.0 Delaware 0.5 2.6 11.2 0.3 1.7 7.3 0.6 3.3 13.1 District of Columbia 0.4 2.9 8.4 0.3 2.3 5.3 0.5 3.3 9.8 Florida 0.4 1.9 6.6 0.3 1.3 4.2 0.5 2.3 8.1 Georgia 0.3 2.5 10.0 0.2 1.6 5.6 0.5 3.2 11.9 Hawaii 0.3 1.6 5.8 0.2 1.1 4.1 0.4 2.0 6.8 Idaho 0.3 1.7 6.1 0.2 1.3 4.6 0.3 2.0 6.9 Illinois 0.6 3.4 11.8 0.4 2.4 7.7 0.7 4.2 13.8 Indiana 0.6 3.9 14.6 0.4 2.5 9.1 0.8 5.0 17.1 Iowa 0.8 4.8 17.9 0.5 3.2 12.7 1.1 6.1 20.5 Kansas 0.6 4.1 14.7 0.4 2.7 10.3 0.9 5.2 17.0 Kentucky 0.5 3.3 13.0 0.3 1.9 7.4 0.7 4.3 15.5 Louisiana 0.6 3.4 12.2 0.4 2.4 7.5 0.7 4.2 14.5 Maine 0.5 2.6 10.4 0.3 1.7 7.4 0.6 3.3 11.9 Maryland 0.4 2.7 9.6 0.3 1.9 6.4 0.5 3.3 11.1 Massachusetts 0.6 4.0 14.1 0.4 2.6 9.0 0.9 5.0 16.5 Michigan 0.4 2.5 9.2 0.3 1.6 5.6 0.6 3.2 10.9 Minnesota 0.5 3.4 13.1 0.3 2.3 9.0 0.7 4.3 15.2 Mississippi 0.5 3.3 11.9 0.4 2.1 6.3 0.7 4.1 14.4 Missouri 0.6 3.6 13.1 0.4 2.2 7.9 0.8 4.6 15.7 Montana 0.5 2.6 10.1 0.3 1.9 7.4 0.6 3.2 11.6 Nebraska 0.7 4.2 15.1 0.4 2.8 10.6 0.9 5.3 17.4 Nevada 0.2 1.1 4.3 0.1 0.8 3.1 0.2 1.3 5.1 New Hampshire 0.5 3.3 13.6 0.3 1.9 7.7 0.8 4.5 16.4 New Jersey 0.5 3.2 11.0 0.4 2.3 7.3 0.7 3.9 12.8 New Mexico 0.3 1.7 6.6 0.2 1.3 4.5 0.4 2.1 7.8 New York 0.6 3.4 11.8 0.4 2.5 7.9 0.7 4.1 13.6 North Carolina 0.4 2.4 9.6 0.2 1.5 5.5 0.5 3.1 11.4 North Dakota 0.8 5.2 19.1 0.5 3.4 13.8 1.1 6.5 21.7 Ohio 0.7 3.8 12.8 0.5 2.5 8.2 0.9 4.7 15.1 Oklahoma 0.5 3.0 11.3 0.3 1.8 6.2 0.7 3.9 14.0 Oregon 0.2 1.1 3.6 0.2 0.9 2.9 0.2 1.3 4.0 Pennsylvania 0.6 3.5 12.3 0.4 2.3 8.0 0.9 4.4 14.3 Rhode Island 0.8 4.7 16.5 0.5 2.9 10.6 1.1 6.1 19.2 South Carolina 0.4 2.2 9.3 0.2 1.4 5.6 0.5 2.8 10.9 South Dakota 0.8 4.8 17.3 0.5 3.2 12.6 1.0 6.0 19.7 Tennessee 0.5 2.9 11.5 0.3 1.9 6.9 0.6 3.7 13.6 Texas 0.4 2.9 11.3 0.3 2.0 7.3 0.5 3.6 13.4 Utah 0.2 1.6 5.1 0.1 1.2 3.8 0.2 1.9 5.8 Vermont 0.4 2.6 10.4 0.3 1.8 7.5 0.6 3.3 11.8 Virginia 0.4 2.4 9.1 0.2 1.6 5.7 0.5 3.0 10.8 Washington 0.3 1.6 5.9 0.2 1.2 4.2 0.3 2.0 6.8 West Virginia 0.5 2.7 10.6 0.3 1.6 5.7 0.7 3.6 13.0 Wisconsin 0.5 3.2 12.2 0.3 2.2 8.8 0.7 3.9 13.8 Wyoming 0.4 2.9 12.7 0.2 1.7 7.9 0.6 3.9 15.6
Source: MDS and US Census
166 Nursing Home Data Compendium 2013

Nursing H
ome D
ata Com
pendium 2013
167
Table 3.2.a. Demographic Characteristics of Nursing Home Residents: United States, 2011
Percentage of Nursing Home Residents All Residents Facility Ownership Certification Bed Size
Resident Characteristic Number Percentage For Profit Non-Profit Government
Medicare & Medicaid Medicare Medicaid <50 50-99 100-199 >200
Number 1,431,730 1,010,386 333,411 87,933 1,367,486 31,921 32,323 61,259 360,876 782,610 226,985
Percentage 100.0 70.6 23.3 6.1 95.5 2.2 2.3 4.3 25.2 54.7 15.9
Sex Male 469,454 32.8 34.0 27.7 38.7 32.5 33.8 44.4 31.3 31.3 32.6 36.3 Female 962,129 67.2 66.0 72.3 61.3 67.5 66.2 55.6 68.7 68.7 67.4 63.7
Age 0-21 years 3,027 0.2 0.2 0.3 0.1 0.2 0.1 2.6 0.8 0.3 0.2 0.2 22-30 years 4,705 0.3 0.4 0.2 0.4 0.3 0.1 2.3 0.4 0.3 0.3 0.5 31-64 years 206,719 14.4 16.4 8.3 14.5 14.2 6.0 31.8 10.7 12.7 14.6 17.8 65-74 years 209,209 14.6 16.1 10.4 13.6 14.7 11.6 13.4 11.6 13.6 15.1 15.5 75-84 years 393,983 27.5 27.9 26.5 27.4 27.7 28.0 18.7 25.9 27.1 28.1 26.5 85-95 years 504,799 35.3 32.5 43.3 36.7 35.3 45.2 25.3 40.5 37.4 34.6 32.8 95+ years 109,279 7.6 6.6 10.9 7.3 7.6 9.0 5.8 10.2 8.7 7.1 6.9
Race/Ethnicity American Indian/
Alaska Native 5,499 0.4 0.4 0.4 0.4 0.4 0.1 1.0 1.1 0.6 0.3 0.2 Asian 21,743 1.6 1.7 1.0 1.6 1.6 0.6 1.9 1.5 1.6 1.3 2.5 Black, not Hispanic
origin 193,700 13.8 15.5 9.8 10.3 14.0 5.1 13.4 4.8 9.2 14.5 21.3 Hispanic or Latino 68,216 4.9 5.7 3.1 2.8 4.9 1.5 5.1 3.1 4.3 4.5 7.5 Native Hawaiian/
Pacific Islander 1,865 0.1 0.2 0.1 0.1 0.1 0.1 0.2 0.2 0.1 0.1 0.2 White, not Hispanic
origin 1,103,978 78.9 76.2 85.4 84.6 78.6 92.4 78.1 89.0 84.0 79.0 67.7 More than one
Race 4,439 0.3 0.3 0.3 0.2 0.3 0.2 0.2 0.2 0.3 0.3 0.6
Source: CASPER and MDS; measures are fully described in Methods

168N
ursing Hom
e Data C
ompendium
2013
Table 3.2.b. Demographic Characteristics of Nursing Home Residents: United States, 2012
Percentage of Nursing Home Residents All Residents Facility Ownership Certification Bed Size
Resident Characteristic Number Percentage For Profit Non-Profit Government
Medicare & Medicaid Medicare Medicaid <50 50-99 100-199 >200
Number 1,409,749 993,773 327,687 88,289 1,348,507 30,968 30,274 58,577 357,290 772,036 221,846
Percentage 100.0 70.5 23.2 6.3 95.7 2.2 2.1 4.2 25.3 54.8 15.7
Sex Male 468,050 33.2 34.5 27.8 38.7 32.9 34.5 45.2 31.2 31.8 33.0 36.7 Female 941,561 66.8 65.5 72.2 61.3 67.1 65.5 54.8 68.8 68.2 67.0 63.3
Age 0-21 years 2,974 0.2 0.2 0.3 0.2 0.2 0.1 2.8 0.9 0.3 0.2 0.2 22-30 years 4,492 0.3 0.3 0.2 0.4 0.3 0.1 2.3 0.3 0.3 0.3 0.4 31-64 years 204,966 14.5 16.7 8.1 14.0 14.3 6.2 32.9 10.7 12.8 14.8 17.6 65-74 years 214,176 15.2 16.7 10.8 14.3 15.3 11.9 14.1 12.0 14.1 15.7 16.0 75-84 years 381,446 27.1 27.3 26.2 27.0 27.2 27.8 18.0 25.4 26.8 27.6 26.1 85-95 years 492,857 35.0 32.1 43.3 36.8 35.0 44.3 24.3 40.1 37.1 34.3 32.6 95+ years 108,799 7.7 6.6 11.1 7.4 7.7 9.6 5.6 10.5 8.8 7.2 7.1
Race/Ethnicity American Indian/
Alaska Native 5,529 0.4 0.4 0.4 0.4 0.4 0.1 0.9 1.1 0.6 0.3 0.2 Asian 22,221 1.6 1.8 0.9 1.5 1.6 0.7 2.0 1.6 1.7 1.3 2.6 Black, not
Hispanic origin 191,631 13.9 15.6 9.6 10.4 14.0 5.3 14.3 4.9 9.2 14.6 21.1 Hispanic or Latino 69,609 5.0 5.9 3.1 2.7 5.1 1.8 5.6 3.0 4.4 4.7 7.8 Native Hawaiian/
Pacific Islander 1,859 0.1 0.2 0.1 0.1 0.1 0.0 0.2 0.2 0.1 0.1 0.2 White, not
Hispanic origin 1,087,253 78.7 75.8 85.6 84.6 78.4 91.9 76.7 89.0 83.8 78.7 67.5 More than one
Race 4,149 0.3 0.3 0.2 0.2 0.3 0.2 0.4 0.3 0.3 0.2 0.6
Source: CASPER and MDS; measures are fully described in Methods

Nursing H
ome D
ata Com
pendium 2013
169
Table 3.3.a. Functional Characteristics of Nursing Home Residents: United States, 2011
Percentage of Nursing Home Residents All Residents Facility Ownership Certification Bed Size
Resident Characteristic Number Percentage For Profit Non-Profit Government Medicare & Medicaid Medicare Medicaid <50 50-99 100-199 >200
Number 1,431,730 1,010,386 333,411 87,933 1,367,486 31,921 32,323 61,259 360,876 782,610 226,985 Percentage 100.0 70.6 23.3 6.1 95.5 2.2 2.3 4.3 25.2 54.7 15.9
Number of ADL Impairments 0 310,800 21.7 22.4 18.9 24.3 21.1 21.0 47.4 25.4 22.8 20.8 22.1 1 88,079 6.2 6.0 6.5 7.2 6.1 7.0 6.0 7.5 6.3 6.0 6.2 2 79,917 5.6 5.3 6.0 7.3 5.6 6.2 5.8 6.2 5.6 5.3 6.3 3 96,622 6.8 6.6 6.9 7.4 6.7 8.4 5.9 7.4 6.7 6.7 6.8 4 526,033 36.8 36.6 38.9 30.0 37.1 42.6 16.6 33.9 36.4 38.0 33.7 5 329,533 23.0 23.0 22.8 23.7 23.3 14.8 18.3 19.6 22.1 23.2 24.9
Cognitive Impairment None to Mild 503,909 35.2 35.8 34.1 32.4 34.8 51.3 38.1 38.5 34.7 35.2 35.0 Moderate 375,542 26.2 26.4 25.8 25.4 26.3 23.4 24.6 25.1 26.4 26.2 26.4 Severe 552,234 38.6 37.8 40.0 42.3 38.9 25.2 37.3 36.4 38.8 38.6 38.6
Pain in Past 5 days None 717,785 63.4 63.6 62.5 64.9 63.6 48.7 69.7 54.6 61.1 63.1 70.8 Mild/Infrequent 241,361 21.3 21.1 22.2 19.8 21.2 29.2 17.6 26.1 22.5 21.5 17.5 Moderate or Severe 173,114 15.3 15.3 15.3 15.3 15.2 22.1 12.8 19.3 16.4 15.5 11.7
Falls Since Admission or Most Recent Assessment No falls 1,187,988 83.1 83.9 81.3 80.4 83.0 87.1 81.0 82.6 82.3 83.0 84.5 1+ Falls, no injury 165,079 11.5 11.2 12.4 12.4 11.6 8.4 11.5 11.0 11.7 11.7 10.9 1+ Injurious falls 77,239 5.4 5.0 6.3 7.2 5.4 4.5 7.6 6.4 6.0 5.3 4.6
Source: CASPER and MDS; measures are fully described in Methods

170N
ursing Hom
e Data C
ompendium
2013
Table 3.3.b. Functional Characteristics of Nursing Home Residents: United States, 2012
Percentage of Nursing Home Residents All Residents Facility Ownership Certification Bed Size
Resident Characteristic Number Percentage For Profit Non-Profit Government Medicare & Medicaid Medicare Medicaid <50 50-99 100-199 >200
Number 1,409,749 993,773 327,687 88,289 1,348,507 30,968 30,274 58,577 357,290 772,036 221,846 Percentage 100.0 70.5 23.2 6.3 95.7 2.2 2.1 4.2 25.3 54.8 15.7
Number of ADL Impairments 0 287,566 20.4 21.1 17.6 22.4 19.8 18.8 47.7 24.2 21.6 19.5 20.6 1 84,080 6.0 5.8 6.3 7.0 5.9 6.5 6.2 7.2 6.2 5.8 6.0 2 75,449 5.4 5.0 5.8 7.0 5.3 5.7 5.8 6.3 5.4 5.1 6.0 3 89,439 6.3 6.2 6.6 7.0 6.3 8.1 5.5 7.2 6.3 6.3 6.5 4 544,093 38.6 38.5 40.9 31.2 39.0 45.1 16.8 35.4 38.3 39.9 35.6 5 328,546 23.3 23.3 22.8 25.3 23.6 15.7 17.9 19.7 22.3 23.5 25.4
Cognitive Impairment None to Mild 515,866 36.6 37.2 35.7 33.4 36.2 52.3 39.2 40.2 36.1 36.7 35.9 Moderate 362,816 25.7 25.9 25.5 25.1 25.8 22.8 24.7 24.5 26.0 25.7 25.9 Severe 531,062 37.7 37.0 38.8 41.5 38.0 24.9 36.2 35.3 37.9 37.6 38.2
Pain in Past 5 days None 721,208 65.0 65.2 63.9 67.0 65.3 48.8 71.6 56.4 62.8 64.9 71.6 Mild/Infrequent 238,059 21.5 21.4 22.4 19.1 21.3 31.0 16.6 25.7 22.8 21.6 17.6 Moderate or Severe 150,160 13.5 13.4 13.7 13.9 13.4 20.2 11.8 17.9 14.5 13.6 10.7
Falls Since Admission or Most Recent Assessment No falls 1,174,830 83.4 84.2 81.8 80.4 83.3 87.2 81.3 82.5 82.5 83.4 84.8 1+ Falls, no injury 159,365 11.3 11.0 12.0 12.6 11.4 8.4 11.2 11.2 11.6 11.4 10.7 1+ Injurious falls 74,770 5.3 4.9 6.1 7.0 5.3 4.5 7.5 6.3 5.9 5.2 4.5
Source: CASPER and MDS; measures are fully described in Methods

Nursing H
ome D
ata Com
pendium 2013
171
Table 3.4.a. Prevalence of Clinical Measures in Nursing Home Residents: United States, 2011
Percentage of Nursing Home Residents
All Facilities Facility Ownership Certification Bed Size
Clinical Measure Percentage For Profit Non-Profit Government Medicare & Medicaid Medicare Medicaid <50 50-99 100-199 >200
Pressure Ulcers 5.9 6.1 5.5 4.9 5.9 7.3 2.6 5.2 5.5 5.9 6.6
Any Restraint Use 2.2 2.4 1.7 2.6 2.2 0.8 3.2 1.9 2.3 2.2 2.2
Incontinence 35.6 37.2 31.3 33.8 36.2 21.4 27.2 24.5 31.9 36.9 40.3
Feeding Tube 5.9 6.4 4.7 5.6 6.0 3.3 6.8 4.6 5.0 6.0 7.6
Unintended Weight Loss 5.9 5.8 6.2 5.8 5.9 7.5 3.7 6.3 5.8 6.0 5.5
Antipsychotic Use 25.5 27.0 20.8 26.2 25.3 12.2 46.9 21.4 24.9 25.5 27.7
Source: CASPER and MDS; clinical measures are fully described in the Methods

172N
ursing Hom
e Data C
ompendium
2013
Table 3.4.b. Prevalence of Clinical Measures in Nursing Home Residents: United States, 2012
Percentage of Nursing Home Residents
All Facilities Facility Ownership Certification Bed Size
Clinical Measure Percentage For Profit Non-Profit Government Medicare & Medicaid Medicare Medicaid <50 50-99 100-199 >200
Pressure Ulcers 5.4 5.6 5.2 4.5 5.5 6.6 2.3 4.9 5.0 5.5 6.0
Any Restraint Use 1.7 1.8 1.3 2.1 1.7 0.7 2.9 1.4 1.8 1.7 1.8
Incontinence 35.0 36.6 30.8 33.3 35.6 21.0 26.2 24.3 31.3 36.2 39.9
Feeding Tube 5.7 6.2 4.4 5.3 5.7 3.3 6.8 4.5 4.8 5.7 7.3
Unintended Weight Loss 5.8 5.7 6.2 5.8 5.9 6.8 3.6 5.9 5.7 5.9 5.7
Antipsychotic Use 24.2 25.9 19.1 24.8 24.0 11.6 46.9 20.5 23.6 24.2 26.3
Source: CASPER and MDS; clinical measures are fully described in the Methods

Table 3.5.a. Nursing Home Residents by Sex, Age Group and State: United States, 2011
Percentage of Residents Residents Sex Age Group (Number) Male Female 0-21 22-30 31-64 65-74 75-84 85-94 95+
Nation 1,431,730 32.8 67.2 0.2 0.3 14.4 14.6 27.5 35.3 7.6 Alabama 23,428 29.0 71.0 0.5 0.5 14.6 16.6 29.9 31.8 6.1 Alaska 608 39.1 60.9 0.0 0.5 22.2 19.9 28.8 24.5 4.1 Arizona 12,467 38.4 61.6 0.3 0.5 19.7 17.9 28.3 28.4 5.0 Arkansas 18,427 30.3 69.7 0.1 0.2 12.9 15.4 28.8 35.2 7.4 California 106,348 37.6 62.4 0.5 0.7 18.6 16.3 26.1 31.3 6.6 Colorado 16,317 33.7 66.3 0.0 0.2 14.6 14.0 27.0 36.3 7.8 Connecticut 25,955 30.2 69.8 0.1 0.2 11.7 12.5 25.3 39.6 10.7 Delaware 4,253 31.3 68.7 0.5 0.3 13.4 14.4 27.0 36.1 8.3 District of Columbia 2,625 38.1 61.9 0.1 0.1 20.6 19.7 25.8 26.6 7.2 Florida 76,390 34.3 65.7 0.3 0.2 13.3 15.3 28.4 35.0 7.5 Georgia 34,692 31.4 68.6 0.1 0.3 16.4 17.9 28.9 30.2 6.2 Hawaii 3,842 34.2 65.8 0.8 0.3 8.8 11.4 24.8 43.7 10.3 Idaho 4,235 37.4 62.6 0.1 0.4 15.2 15.4 27.6 33.8 7.5 Illinois 75,983 36.4 63.6 0.1 0.7 21.7 14.1 24.3 32.0 7.1 Indiana 39,834 29.6 70.4 0.3 0.3 12.5 13.8 28.5 36.9 7.6 Iowa 25,293 29.8 70.2 0.2 0.2 8.2 10.2 25.9 43.8 11.6 Kansas 18,846 32.2 67.8 0.0 0.2 12.0 11.5 26.2 40.3 9.7 Kentucky 23,378 28.6 71.4 0.4 0.2 11.7 15.5 30.6 34.6 6.9 Louisiana 25,768 35.4 64.6 0.1 0.2 19.6 17.4 28.3 29.4 4.9 Maine 6,410 30.8 69.2 0.1 0.1 9.4 12.1 30.2 40.0 8.1 Maryland 25,665 34.1 65.9 0.1 0.3 16.7 15.3 26.8 33.5 7.3 Massachusetts 43,463 30.7 69.3 0.2 0.3 11.1 11.9 26.4 40.2 9.8 Michigan 41,961 30.3 69.7 0.1 0.1 12.2 14.2 27.8 37.6 7.9 Minnesota 28,416 31.8 68.2 0.0 0.2 9.6 10.8 25.5 42.1 11.8 Mississippi 16,128 31.4 68.6 0.0 0.3 16.4 18.0 29.1 29.9 6.2 Missouri 38,843 31.9 68.1 0.1 0.6 16.8 14.3 27.0 33.7 7.4 Montana 4,801 35.1 64.9 0.1 0.3 12.0 14.6 27.0 37.1 9.0 Nebraska 12,663 31.9 68.1 0.3 0.3 11.0 11.9 26.6 39.7 10.2 Nevada 5,024 40.2 59.8 0.5 0.6 19.6 18.6 28.6 27.9 4.3 New Hampshire 7,090 27.5 72.5 0.2 0.1 7.8 12.4 28.2 41.7 9.6 New Jersey 47,141 33.7 66.3 0.7 0.4 14.4 14.1 26.6 35.7 8.2 New Mexico 6,240 36.4 63.6 0.1 0.3 14.3 15.4 29.1 33.9 6.8 New York 112,846 34.1 65.9 0.5 0.3 13.7 14.1 27.0 36.0 8.4 North Carolina 38,438 30.4 69.6 0.0 0.2 13.5 15.9 29.5 34.0 6.8 North Dakota 5,719 31.4 68.6 0.1 0.2 7.8 8.9 25.4 44.8 12.8 Ohio 80,011 32.4 67.6 0.1 0.4 17.5 14.9 27.1 33.6 6.5 Oklahoma 19,547 29.9 70.1 0.1 0.3 15.9 16.1 28.9 32.5 6.1 Oregon 7,808 37.2 62.8 0.8 0.3 15.6 16.9 27.5 32.1 6.8 Pennsylvania 80,903 30.1 69.9 0.0 0.2 10.6 12.7 27.6 40.4 8.5 Rhode Island 8,348 28.0 72.0 0.0 0.1 8.7 10.9 25.5 44.5 10.3 South Carolina 17,302 30.4 69.6 0.0 0.1 10.8 16.7 30.0 35.5 6.9 South Dakota 6,394 31.3 68.7 0.0 0.1 7.9 10.0 26.4 43.1 12.4 Tennessee 31,852 30.1 69.9 0.1 0.2 13.4 16.5 30.6 33.2 6.0 Texas 101,411 33.8 66.2 0.1 0.3 15.4 15.9 29.3 32.8 6.1 Utah 5,990 37.4 62.6 0.6 0.6 22.4 18.8 26.4 27.1 4.1 Vermont 2,857 33.1 66.9 0.1 0.1 9.1 12.7 27.8 40.1 10.1 Virginia 29,606 31.6 68.4 0.3 0.3 14.1 15.4 28.6 34.5 6.8 Washington 17,898 35.5 64.5 0.1 0.4 15.3 15.6 26.9 34.4 7.3 West Virginia 9,696 27.9 72.1 0.0 0.2 13.2 15.1 30.2 34.6 6.7 Wisconsin 30,117 31.8 68.2 0.0 0.1 8.9 11.4 26.8 42.3 10.4 Wyoming 2,453 30.9 69.1 0.0 0.1 8.4 13.4 29.8 39.7 8.6
Source: MDS
Nursing Home Data Compendium 2013 173

Table 3.5.b. Nursing Home Residents by Sex, Age Group and State: United States, 2012
Percentage of Residents Residents Sex Age Group (Number) Male Female 0-21 22-30 31-64 65-74 75-84 85-94 95+
Nation 1,409,749 33.2 66.8 0.2 0.3 14.5 15.2 27.1 35.0 7.7 Alabama 22,884 29.3 70.7 0.5 0.5 15.0 17.0 29.7 31.3 6.0 Alaska 582 36.3 63.7 0.2 0.2 20.3 20.6 30.1 24.4 4.3 Arizona 12,424 38.7 61.3 0.3 0.5 19.6 19.2 27.2 28.0 5.2 Arkansas 17,816 30.5 69.5 0.0 0.2 13.3 15.6 28.6 34.9 7.3 California 105,541 38.4 61.6 0.5 0.7 19.1 17.0 25.6 30.5 6.5 Colorado 16,378 34.4 65.6 0.0 0.2 14.4 15.2 26.5 35.9 7.9 Connecticut 25,313 30.7 69.3 0.1 0.2 11.8 13.1 24.7 39.3 10.8 Delaware 4,264 32.3 67.7 0.6 0.3 12.9 14.6 27.6 36.0 8.0 District of Columbia 2,624 37.8 62.2 0.1 0.2 19.8 20.3 24.2 27.7 7.7 Florida 76,276 34.9 65.1 0.3 0.2 13.4 15.9 28.2 34.7 7.3 Georgia 34,067 31.8 68.2 0.1 0.2 16.2 18.8 28.5 30.1 6.1 Hawaii 3,772 34.3 65.7 0.8 0.3 9.0 12.8 23.8 42.5 10.8 Idaho 4,184 37.5 62.5 0.1 0.4 15.1 17.1 28.6 32.1 6.5 Illinois 74,326 36.5 63.5 0.1 0.7 21.2 14.7 23.9 32.1 7.3 Indiana 40,103 30.0 70.0 0.4 0.3 12.4 14.6 28.1 36.5 7.7 Iowa 24,963 30.5 69.5 0.2 0.2 8.5 10.6 24.9 43.9 11.7 Kansas 18,485 32.0 68.0 0.0 0.2 12.1 12.1 26.0 39.9 9.7 Kentucky 23,129 28.5 71.5 0.4 0.2 12.3 16.2 30.0 33.9 6.9 Louisiana 25,505 35.8 64.2 0.1 0.3 19.4 18.0 28.4 28.9 4.8 Maine 6,409 31.6 68.4 0.1 0.1 9.1 12.4 28.8 41.6 7.9 Maryland 25,346 34.3 65.7 0.1 0.4 16.9 16.1 26.6 32.7 7.3 Massachusetts 43,156 31.0 69.0 0.2 0.2 11.0 12.6 25.9 40.1 10.0 Michigan 40,766 30.6 69.4 0.1 0.1 12.3 14.6 27.1 37.5 8.4 Minnesota 27,797 31.8 68.2 0.1 0.2 9.8 11.5 25.2 41.3 11.8 Mississippi 15,884 32.1 67.9 0.1 0.3 16.9 18.4 28.9 29.7 5.8 Missouri 38,180 32.1 67.9 0.1 0.6 17.0 14.6 26.3 33.7 7.7 Montana 4,681 36.1 63.9 0.1 0.2 12.1 15.3 26.9 36.9 8.6 Nebraska 12,288 31.8 68.2 0.3 0.3 11.4 11.8 25.8 40.0 10.5 Nevada 4,839 40.3 59.7 0.4 0.6 20.3 20.0 27.5 27.0 4.2 New Hampshire 6,960 27.2 72.8 0.2 0.2 7.6 12.5 28.1 41.4 10.1 New Jersey 47,227 34.0 66.0 0.7 0.3 14.3 14.6 26.1 35.9 8.2 New Mexico 5,990 37.3 62.7 0.0 0.3 15.6 16.5 29.0 32.6 6.1 New York 109,830 34.4 65.6 0.5 0.3 13.5 14.6 26.6 35.8 8.7 North Carolina 37,604 30.7 69.3 0.0 0.2 13.6 16.7 28.9 33.9 6.8 North Dakota 5,662 31.0 69.0 0.0 0.2 7.9 9.2 24.4 45.2 13.2 Ohio 78,785 33.1 66.9 0.1 0.3 17.8 15.5 26.7 33.1 6.6 Oklahoma 19,228 30.3 69.7 0.1 0.3 16.4 16.4 28.2 32.4 6.2 Oregon 7,947 38.1 61.9 0.8 0.3 16.1 18.2 27.4 30.8 6.4 Pennsylvania 81,276 30.9 69.1 0.1 0.2 11.0 13.1 26.9 40.0 8.7 Rhode Island 8,221 27.9 72.1 0.0 0.1 8.6 11.3 24.5 44.2 11.3 South Carolina 17,033 31.2 68.8 0.0 0.1 11.2 17.3 29.8 34.8 6.8 South Dakota 6,347 31.4 68.6 0.0 0.1 8.3 10.5 26.1 42.7 12.3 Tennessee 31,083 30.9 69.1 0.0 0.3 13.5 16.9 30.0 33.3 6.0 Texas 98,195 34.0 66.0 0.1 0.3 15.5 16.5 28.9 32.5 6.3 Utah 5,616 37.8 62.2 0.5 0.6 23.0 19.0 26.6 26.1 4.1 Vermont 2,804 32.5 67.5 0.1 0.1 8.1 13.2 28.6 40.3 9.7 Virginia 29,309 32.0 68.0 0.3 0.3 13.9 16.1 28.3 34.3 6.9 Washington 17,590 35.6 64.4 0.1 0.3 15.4 16.5 25.9 34.0 7.7 West Virginia 9,669 28.7 71.3 0.1 0.2 13.4 15.5 29.6 35.1 6.2 Wisconsin 29,004 32.6 67.4 0.0 0.2 9.2 12.0 26.3 41.6 10.7 Wyoming 2,387 30.4 69.6 0.1 0.0 9.0 12.3 29.2 39.1 10.1
Source: MDS
174 Nursing Home Data Compendium 2013

Table 3.6.a. Nursing Home Residents by Race/Ethnicity and State: United States, 2011
Percentage of Residents
Residents (Number)
American Indian or Alaska Native Asian
Black, not Hispanic
origin Hispanic or
Latino
Native Hawaiian or Pacific Islander
White, not Hispanic
origin More than one Race
Nation 1,431,730 0.4 1.6 13.8 4.9 0.1 78.9 0.3 Alabama 23,428 0.1 0.1 25.2 0.2 0.1 74.3 0.0 Alaska 608 20.8 3.3 4.5 1.5 1.2 67.7 1.2 Arizona 12,467 6.8 0.7 4.6 12.7 0.2 74.5 0.5 Arkansas 18,427 0.1 0.1 13.6 0.3 0.1 85.7 0.1 California 106,348 0.3 9.7 11.0 16.5 0.4 60.9 1.1 Colorado 16,317 0.4 1.0 4.3 9.5 0.1 84.5 0.3 Connecticut 25,955 0.1 0.3 8.8 4.3 0.2 86.1 0.2 Delaware 4,253 0.2 0.4 21.9 2.0 0.1 75.4 0.0 District of Columbia 2,625 0.1 1.2 84.0 1.3 0.0 13.3 0.0 Florida 76,390 0.1 0.4 15.7 9.9 0.1 73.4 0.4 Georgia 34,692 0.0 0.4 32.4 0.6 0.0 66.5 0.0 Hawaii 3,842 0.1 64.5 0.4 1.8 8.6 20.7 3.9 Idaho 4,235 0.9 0.5 0.2 2.1 0.1 95.7 0.4 Illinois 75,983 0.1 1.5 17.5 3.5 0.1 77.1 0.3 Indiana 39,834 0.1 0.1 7.7 0.7 0.0 91.1 0.2 Iowa 25,293 0.1 0.2 1.3 0.4 0.0 97.9 0.1 Kansas 18,846 0.3 0.4 4.8 1.5 0.0 92.8 0.2 Kentucky 23,378 0.0 0.1 7.8 0.2 0.1 91.6 0.1 Louisiana 25,768 0.1 0.2 28.8 0.8 0.0 70.0 0.1 Maine 6,410 0.1 0.1 0.3 0.1 0.0 99.1 0.1 Maryland 25,665 0.1 1.4 33.2 1.1 0.1 63.9 0.2 Massachusetts 43,463 0.1 1.0 4.9 2.5 0.1 91.1 0.3 Michigan 41,961 0.2 0.3 16.3 0.9 0.0 82.2 0.1 Minnesota 28,416 0.8 0.5 2.4 0.6 0.1 95.5 0.1 Mississippi 16,128 0.2 0.1 34.8 0.2 0.0 64.6 0.0 Missouri 38,843 0.1 0.3 11.6 0.5 0.1 87.3 0.1 Montana 4,801 4.8 0.1 0.2 0.6 0.1 93.8 0.4 Nebraska 12,663 0.6 0.1 3.2 1.0 0.0 94.9 0.1 Nevada 5,024 0.7 2.5 9.2 6.2 0.4 80.1 0.9 New Hampshire 7,090 0.0 0.2 0.3 0.3 0.1 98.9 0.1 New Jersey 47,141 0.1 1.9 16.8 6.7 0.2 74.0 0.4 New Mexico 6,240 9.3 0.2 2.0 29.5 0.1 58.8 0.1 New York 112,846 0.2 2.0 18.2 7.9 0.1 70.6 0.9 North Carolina 38,438 0.6 0.2 25.4 0.5 0.1 73.1 0.1 North Dakota 5,719 1.9 0.1 0.1 0.1 0.0 97.8 0.1 Ohio 80,011 0.0 0.2 13.6 0.6 0.0 85.4 0.1 Oklahoma 19,547 3.8 0.3 7.1 1.0 0.1 87.2 0.4 Oregon 7,808 0.5 0.9 2.1 1.4 0.1 94.2 0.7 Pennsylvania 80,903 0.1 0.4 10.0 1.2 0.1 88.2 0.1 Rhode Island 8,348 0.3 0.2 3.4 1.8 0.0 93.9 0.3 South Carolina 17,302 0.1 0.1 29.9 0.3 0.0 69.6 0.1 South Dakota 6,394 4.6 0.1 0.2 0.2 0.0 94.8 0.0 Tennessee 31,852 0.1 0.1 15.0 0.3 0.0 84.4 0.1 Texas 101,411 0.1 0.7 13.1 16.2 0.1 69.6 0.2 Utah 5,990 1.4 1.0 1.3 4.0 0.6 91.4 0.4 Vermont 2,857 0.1 0.0 0.6 0.2 0.0 98.8 0.1 Virginia 29,606 0.1 1.2 24.2 0.9 0.0 73.4 0.1 Washington 17,898 1.0 3.0 3.7 2.0 0.4 89.5 0.5 West Virginia 9,696 0.0 0.0 3.5 0.2 0.0 96.2 0.0 Wisconsin 30,117 0.5 0.2 3.4 0.7 0.0 94.9 0.2 Wyoming 2,453 1.7 0.1 0.7 3.2 0.1 93.9 0.3 Source: MDS
Nursing Home Data Compendium 2013 175

Table 3.6.b. Nursing Home Residents by Race/Ethnicity and State: United States, 2012
Percentage of Residents
Residents (Number)
American Indian or Alaska Native Asian
Black, not Hispanic
origin Hispanic or
Latino
Native Hawaiian or Pacific Islander
White, not Hispanic
origin More than one Race
Nation 1,409,749 0.4 1.6 13.9 5.0 0.1 78.7 0.3 Alabama 22,884 0.1 0.2 25.6 0.2 0.1 73.9 0.0 Alaska 582 22.2 2.7 4.0 1.7 1.4 66.5 1.5 Arizona 12,424 6.5 0.7 4.5 13.2 0.1 74.3 0.6 Arkansas 17,816 0.1 0.1 13.5 0.4 0.0 85.8 0.0 California 105,541 0.3 10.0 11.2 17.1 0.4 60.0 1.0 Colorado 16,378 0.4 1.1 4.5 9.6 0.1 84.0 0.3 Connecticut 25,313 0.1 0.4 9.2 4.5 0.2 85.5 0.2 Delaware 4,264 0.2 0.4 21.4 1.7 0.0 76.2 0.0 District of Columbia 2,624 0.2 1.2 84.0 1.3 0.0 13.3 0.1 Florida 76,276 0.1 0.5 15.6 10.3 0.1 73.3 0.2 Georgia 34,067 0.0 0.4 32.8 0.7 0.1 66.0 0.1 Hawaii 3,772 0.0 64.4 0.5 1.8 8.2 21.5 3.6 Idaho 4,184 0.9 0.3 0.2 1.9 0.1 96.4 0.2 Illinois 74,326 0.1 1.5 17.3 3.6 0.1 77.1 0.3 Indiana 40,103 0.1 0.1 7.9 0.8 0.0 90.9 0.2 Iowa 24,963 0.1 0.2 1.2 0.4 0.0 98.0 0.1 Kansas 18,485 0.3 0.3 4.6 1.6 0.0 92.9 0.2 Kentucky 23,129 0.0 0.1 8.0 0.2 0.1 91.6 0.1 Louisiana 25,505 0.1 0.3 28.9 0.7 0.0 69.9 0.0 Maine 6,409 0.2 0.2 0.3 0.2 0.0 99.0 0.2 Maryland 25,346 0.1 1.6 33.5 1.1 0.1 63.3 0.2 Massachusetts 43,156 0.1 1.0 5.1 2.7 0.1 90.8 0.3 Michigan 40,766 0.2 0.3 16.0 0.9 0.0 82.4 0.1 Minnesota 27,797 0.8 0.5 2.7 0.6 0.1 95.1 0.2 Mississippi 15,884 0.2 0.1 34.7 0.2 0.0 64.7 0.0 Missouri 38,180 0.1 0.2 11.5 0.5 0.1 87.5 0.1 Montana 4,681 4.9 0.1 0.2 0.7 0.1 93.6 0.5 Nebraska 12,288 0.6 0.2 3.2 1.0 0.0 94.8 0.1 Nevada 4,839 0.8 2.7 10.1 6.0 0.5 79.1 0.8 New Hampshire 6,960 0.0 0.2 0.3 0.3 0.0 99.1 0.1 New Jersey 47,227 0.1 2.1 16.7 7.0 0.2 73.6 0.3 New Mexico 5,990 9.2 0.2 2.1 31.3 0.1 57.0 0.1 New York 109,830 0.3 2.1 18.0 8.2 0.1 70.4 0.9 North Carolina 37,604 0.7 0.2 25.7 0.5 0.0 72.7 0.1 North Dakota 5,662 2.0 0.1 0.1 0.1 0.0 97.6 0.2 Ohio 78,785 0.1 0.2 13.8 0.7 0.1 85.1 0.1 Oklahoma 19,228 3.7 0.3 7.2 1.1 0.1 87.4 0.3 Oregon 7,947 0.7 0.8 2.1 1.4 0.2 94.0 0.8 Pennsylvania 81,276 0.1 0.4 10.2 1.3 0.1 87.9 0.1 Rhode Island 8,221 0.2 0.3 3.7 2.0 0.0 93.4 0.3 South Carolina 17,033 0.0 0.1 29.7 0.3 0.0 69.8 0.1 South Dakota 6,347 5.0 0.1 0.2 0.2 0.1 94.3 0.0 Tennessee 31,083 0.0 0.2 15.2 0.3 0.0 84.3 0.1 Texas 98,195 0.1 0.8 13.1 16.5 0.1 69.2 0.2 Utah 5,616 1.6 1.1 1.2 4.1 0.8 91.0 0.3 Vermont 2,804 0.1 0.0 0.5 0.3 0.0 99.1 0.1 Virginia 29,309 0.1 1.2 24.4 0.9 0.0 73.3 0.1 Washington 17,590 1.0 3.3 3.6 2.0 0.5 89.1 0.4 West Virginia 9,669 0.0 0.1 3.3 0.2 0.1 96.4 0.0 Wisconsin 29,004 0.5 0.2 3.5 0.7 0.0 94.8 0.2 Wyoming 2,387 1.5 0.2 0.7 3.1 0.2 94.0 0.3 Source: MDS
176 Nursing Home Data Compendium 2013

Table 3.7.a. Distribution of Activities of Daily Living Impairment (ADL) in Nursing Home Residents: United States, 2011
Residents Number of ADL Impairments – Percentage of Residents (Number) 0 1 2 3 4 5
Nation 1,431,730 21.7 6.2 5.6 6.8 36.8 23.0 Alabama 23,428 23.3 6.1 5.6 8.0 31.4 25.5 Alaska 608 21.7 5.8 5.4 6.6 37.4 23.1 Arizona 12,467 20.6 6.0 5.6 7.2 40.4 20.2 Arkansas 18,427 31.3 6.3 6.2 8.1 28.2 19.9 California 106,348 19.2 5.3 5.5 7.1 33.4 29.5 Colorado 16,317 24.2 6.1 5.2 6.0 40.1 18.4 Connecticut 25,955 20.6 7.0 5.9 6.6 38.0 22.0 Delaware 4,253 18.2 7.2 6.0 6.5 38.7 23.5 District of Columbia 2,625 22.5 5.5 5.7 6.7 32.5 27.1 Florida 76,390 17.4 5.1 4.6 6.6 42.2 24.1 Georgia 34,692 20.7 6.0 5.6 7.1 34.3 26.3 Hawaii 3,842 10.6 4.6 4.9 5.1 36.5 38.2 Idaho 4,235 19.2 5.0 4.1 6.1 42.9 22.7 Illinois 75,983 37.2 6.0 5.3 6.1 29.1 16.4 Indiana 39,834 20.6 6.8 4.4 6.4 36.2 25.6 Iowa 25,293 27.2 8.3 7.1 7.6 34.1 15.7 Kansas 18,846 33.1 7.1 5.2 6.3 31.9 16.5 Kentucky 23,378 16.0 6.1 4.6 6.1 39.6 27.5 Louisiana 25,768 35.8 7.2 4.9 7.6 23.3 21.2 Maine 6,410 5.0 4.3 5.9 5.6 51.7 27.5 Maryland 25,665 14.8 6.2 6.5 7.1 38.6 26.8 Massachusetts 43,463 15.3 7.4 6.7 7.7 43.8 19.1 Michigan 41,961 20.5 6.6 6.5 7.8 39.2 19.3 Minnesota 28,416 18.4 6.7 5.8 5.4 43.5 20.2 Mississippi 16,128 26.9 5.6 4.7 6.4 30.7 25.8 Missouri 38,843 38.1 6.3 5.7 7.0 28.1 14.8 Montana 4,801 28.6 7.2 6.1 5.7 35.1 17.4 Nebraska 12,663 25.9 7.4 6.3 6.4 36.6 17.4 Nevada 5,024 19.3 5.8 4.3 6.9 37.4 26.4 New Hampshire 7,090 20.0 8.2 7.7 6.4 39.7 18.0 New Jersey 47,141 19.7 6.4 6.1 7.0 38.3 22.6 New Mexico 6,240 28.3 6.6 6.2 6.9 36.2 15.8 New York 112,846 18.2 5.9 6.5 7.3 36.4 25.8 North Carolina 38,438 16.3 5.7 4.9 6.8 39.5 26.8 North Dakota 5,719 20.3 10.4 8.0 6.3 35.6 19.4 Ohio 80,011 20.4 6.3 5.2 5.7 42.7 19.8 Oklahoma 19,547 39.8 5.7 5.1 7.9 25.0 16.4 Oregon 7,808 15.5 5.8 6.1 8.4 43.5 20.6 Pennsylvania 80,903 13.0 5.6 5.0 5.7 42.8 27.8 Rhode Island 8,348 23.0 10.2 8.6 7.5 35.1 15.5 South Carolina 17,302 13.4 5.7 6.3 9.2 37.6 27.7 South Dakota 6,394 26.0 8.3 7.0 5.2 35.3 18.2 Tennessee 31,852 18.9 5.3 5.0 6.4 38.1 26.3 Texas 101,411 26.3 5.9 5.0 7.1 31.9 23.8 Utah 5,990 17.0 5.6 4.6 5.6 42.7 24.5 Vermont 2,857 12.1 6.9 8.4 7.1 43.4 22.0 Virginia 29,606 18.9 6.0 5.8 6.7 37.9 24.8 Washington 17,898 12.4 5.1 4.6 5.6 47.0 25.3 West Virginia 9,696 20.1 6.6 5.5 6.0 38.1 23.8 Wisconsin 30,117 18.5 7.0 6.1 6.2 42.3 19.9 Wyoming 2,453 32.0 7.0 7.1 6.5 31.4 16.0
Source: MDS; measures are fully described in Methods
Nursing Home Data Compendium 2013 177

Table 3.7.b. Distribution of Activities of Daily Living Impairment (ADL) in Nursing Home Residents: United States, 2012
Residents Number of ADL Impairments – Percentage of Residents (Number) 0 1 2 3 4 5
Nation 1,409,749 20.4 6.0 5.4 6.3 38.6 23.3 Alabama 22,884 22.2 6.1 5.4 7.0 33.5 25.7 Alaska 582 24.2 5.8 5.7 4.5 36.8 23.0 Arizona 12,424 18.9 5.7 5.0 6.7 43.1 20.6 Arkansas 17,816 30.2 6.2 6.1 7.4 30.9 19.3 California 105,541 18.6 5.0 5.2 6.6 34.9 29.7 Colorado 16,378 22.8 5.9 5.4 5.6 41.7 18.7 Connecticut 25,313 19.2 6.8 5.6 6.1 39.1 23.1 Delaware 4,264 18.6 5.3 6.2 6.2 41.0 22.7 District of Columbia 2,624 19.5 6.2 5.8 5.8 33.1 29.7 Florida 76,276 15.9 4.7 4.3 6.1 44.2 24.8 Georgia 34,067 20.0 6.0 5.6 6.9 36.1 25.4 Hawaii 3,772 10.1 4.9 4.5 4.5 37.9 38.2 Idaho 4,184 16.9 5.2 4.8 5.9 45.4 21.9 Illinois 74,326 34.1 5.8 5.0 5.7 32.5 17.0 Indiana 40,103 18.0 6.3 4.4 5.9 36.7 28.7 Iowa 24,963 26.2 8.3 7.1 6.7 35.7 15.9 Kansas 18,485 32.6 6.8 5.4 5.7 33.5 15.9 Kentucky 23,129 16.1 6.1 4.5 5.7 40.1 27.5 Louisiana 25,505 34.1 6.8 4.3 7.4 24.5 23.0 Maine 6,409 5.4 3.9 5.6 5.8 54.8 24.6 Maryland 25,346 13.4 6.2 6.1 6.5 40.4 27.4 Massachusetts 43,156 13.9 7.5 6.2 7.4 45.9 19.0 Michigan 40,766 18.2 6.4 6.3 7.4 42.5 19.3 Minnesota 27,797 18.1 6.5 5.8 5.3 44.6 19.7 Mississippi 15,884 25.8 5.6 4.3 6.2 32.3 25.8 Missouri 38,180 37.3 5.9 5.5 6.8 30.2 14.4 Montana 4,681 27.9 6.9 6.9 5.2 36.4 16.8 Nebraska 12,288 26.2 6.9 6.2 6.0 38.0 16.6 Nevada 4,839 18.9 5.5 4.9 6.1 37.3 27.3 New Hampshire 6,960 19.3 8.5 7.4 5.7 41.2 17.9 New Jersey 47,227 18.3 6.0 5.6 6.6 40.4 23.2 New Mexico 5,990 28.3 6.1 6.5 6.7 36.9 15.6 New York 109,830 16.6 5.7 6.3 7.1 38.4 25.9 North Carolina 37,604 15.5 5.3 4.6 6.5 40.7 27.4 North Dakota 5,662 18.3 9.4 7.8 6.5 38.1 19.9 Ohio 78,785 19.4 6.3 5.1 5.7 44.1 19.5 Oklahoma 19,228 38.5 5.5 5.1 7.1 27.4 16.4 Oregon 7,947 15.4 5.6 5.5 7.5 47.3 18.7 Pennsylvania 81,276 12.8 5.5 5.0 5.6 44.0 27.2 Rhode Island 8,221 21.0 10.0 8.0 6.7 38.0 16.4 South Carolina 17,033 12.1 5.5 6.1 8.3 40.4 27.7 South Dakota 6,347 27.1 7.5 7.4 5.5 35.0 17.4 Tennessee 31,083 16.8 5.3 4.5 6.2 40.1 27.1 Texas 98,195 24.4 5.9 4.9 6.4 33.7 24.7 Utah 5,616 15.1 5.0 4.9 5.4 45.0 24.6 Vermont 2,804 11.1 6.7 7.5 5.5 46.3 23.0 Virginia 29,309 17.5 6.0 5.3 5.9 40.1 25.2 Washington 17,590 11.6 4.7 4.2 5.1 47.7 26.7 West Virginia 9,669 19.6 6.3 5.3 6.2 38.0 24.5 Wisconsin 29,004 17.1 6.9 5.6 5.5 44.3 20.5 Wyoming 2,387 31.1 7.0 6.5 6.0 34.2 15.2
Source: MDS; measures are fully described in Methods
178 Nursing Home Data Compendium 2013

Table 3.8.a. Distribution of Cognitive Impairment in Nursing Home Residents: United States, 2011
Residents Cognitive Impairment - Percentage of Residents (Number) None to Mild Moderate Severe
Nation 1,431,730 35.2 26.2 38.6 Alabama 23,428 32.6 24.8 42.6 Alaska 608 36.2 26.5 37.3 Arizona 12,467 45.8 24.2 30.0 Arkansas 18,427 30.3 27.3 42.5 California 106,348 36.1 25.5 38.3 Colorado 16,317 36.6 29.3 34.1 Connecticut 25,955 33.8 26.8 39.4 Delaware 4,253 35.8 25.5 38.7 District of Columbia 2,625 36.5 26.2 37.3 Florida 76,390 36.8 24.9 38.3 Georgia 34,692 27.9 27.0 45.1 Hawaii 3,842 26.1 24.8 49.2 Idaho 4,235 38.8 27.6 33.6 Illinois 75,983 40.5 27.6 32.0 Indiana 39,834 36.0 26.5 37.6 Iowa 25,293 35.9 27.8 36.3 Kansas 18,846 36.9 26.6 36.5 Kentucky 23,378 33.2 25.8 41.0 Louisiana 25,768 35.3 25.7 39.0 Maine 6,410 29.5 25.6 45.0 Maryland 25,665 37.4 23.9 38.7 Massachusetts 43,463 33.8 24.5 41.7 Michigan 41,961 36.2 24.7 39.1 Minnesota 28,416 38.5 25.8 35.7 Mississippi 16,128 33.1 26.6 40.3 Missouri 38,843 38.3 26.1 35.5 Montana 4,801 35.6 26.7 37.6 Nebraska 12,663 38.6 25.4 36.1 Nevada 5,024 43.8 23.4 32.8 New Hampshire 7,090 36.8 24.0 39.2 New Jersey 47,141 36.5 24.9 38.6 New Mexico 6,240 34.0 28.4 37.6 New York 112,846 34.4 26.9 38.7 North Carolina 38,438 33.2 25.6 41.2 North Dakota 5,719 33.5 27.8 38.7 Ohio 80,011 38.7 26.7 34.6 Oklahoma 19,547 37.4 25.8 36.8 Oregon 7,808 41.5 25.9 32.5 Pennsylvania 80,903 34.7 26.8 38.4 Rhode Island 8,348 34.2 27.0 38.8 South Carolina 17,302 28.4 25.0 46.6 South Dakota 6,394 36.1 26.1 37.8 Tennessee 31,852 30.8 25.2 43.9 Texas 101,411 27.6 28.8 43.6 Utah 5,990 46.2 24.4 29.5 Vermont 2,857 30.8 28.4 40.8 Virginia 29,606 36.0 25.5 38.4 Washington 17,898 37.9 27.4 34.6 West Virginia 9,696 32.1 25.9 42.0 Wisconsin 30,117 37.8 24.5 37.7 Wyoming 2,453 32.9 26.4 40.7
Source: MDS; measures are fully described in Methods
Nursing Home Data Compendium 2013 179

Table 3.8.b. Distribution of Cognitive Impairment in Nursing Home Residents: United States, 2012
Residents Cognitive Impairment - Percentage of Residents (Number) None to Mild Moderate Severe
Nation 1,409,749 36.6 25.7 37.7 Alabama 22,884 33.4 25.8 40.7 Alaska 582 37.8 25.9 36.3 Arizona 12,424 48.1 23.3 28.6 Arkansas 17,816 31.8 27.3 40.9 California 105,541 37.7 24.9 37.4 Colorado 16,378 38.9 27.7 33.4 Connecticut 25,313 35.4 25.4 39.1 Delaware 4,264 39.2 24.9 35.9 District of Columbia 2,624 36.8 25.0 38.2 Florida 76,276 38.4 24.2 37.3 Georgia 34,067 30.1 26.4 43.4 Hawaii 3,772 27.3 24.1 48.6 Idaho 4,184 42.2 26.8 31.0 Illinois 74,326 41.8 27.0 31.2 Indiana 40,103 37.4 25.8 36.8 Iowa 24,963 37.2 27.5 35.2 Kansas 18,485 38.2 25.7 36.1 Kentucky 23,129 34.8 24.9 40.3 Louisiana 25,505 37.2 25.6 37.2 Maine 6,409 30.8 26.1 43.2 Maryland 25,346 38.5 23.3 38.1 Massachusetts 43,156 34.9 23.4 41.7 Michigan 40,766 36.7 25.5 37.8 Minnesota 27,797 40.9 25.3 33.8 Mississippi 15,884 35.3 25.8 38.9 Missouri 38,180 39.8 25.4 34.8 Montana 4,681 36.3 27.2 36.5 Nebraska 12,288 41.3 24.2 34.6 Nevada 4,839 44.4 24.8 30.8 New Hampshire 6,960 37.1 24.4 38.6 New Jersey 47,227 38.3 24.2 37.5 New Mexico 5,990 36.0 27.1 36.9 New York 109,830 35.3 26.3 38.4 North Carolina 37,604 35.3 25.1 39.6 North Dakota 5,662 35.3 26.2 38.4 Ohio 78,785 40.1 25.9 34.0 Oklahoma 19,228 38.8 25.5 35.7 Oregon 7,947 45.1 25.4 29.5 Pennsylvania 81,276 36.7 26.1 37.3 Rhode Island 8,221 35.4 26.9 37.7 South Carolina 17,033 30.6 24.7 44.7 South Dakota 6,347 38.3 26.2 35.4 Tennessee 31,083 32.0 25.4 42.5 Texas 98,195 27.4 29.3 43.3 Utah 5,616 45.0 24.4 30.6 Vermont 2,804 33.0 26.5 40.5 Virginia 29,309 37.1 24.5 38.4 Washington 17,590 40.3 25.7 33.9 West Virginia 9,669 33.6 25.7 40.7 Wisconsin 29,004 38.8 24.3 36.9 Wyoming 2,387 34.1 25.6 40.3
Source: MDS; measures are fully described in Methods
180 Nursing Home Data Compendium 2013

Table 3.9.a. Distribution of Self-Reported Pain in Nursing Home Residents: United States, 2011
Residents Pain - Percentage of Residents (Number) None Mild/Infrequent Moderate or Severe
Nation 1,431,730 63.4 21.3 15.3 Alabama 23,428 64.6 21.8 13.6 Alaska 608 44.5 28.4 27.0 Arizona 12,467 50.3 24.9 24.8 Arkansas 18,427 65.5 19.6 15.0 California 106,348 65.6 19.4 15.0 Colorado 16,317 57.2 25.1 17.7 Connecticut 25,955 68.4 19.2 12.4 Delaware 4,253 65.2 21.2 13.6 District of Columbia 2,625 80.0 13.8 6.1 Florida 76,390 62.9 22.1 15.1 Georgia 34,692 61.6 22.7 15.6 Hawaii 3,842 69.0 20.0 11.0 Idaho 4,235 52.9 23.6 23.5 Illinois 75,983 67.6 20.5 11.8 Indiana 39,834 63.4 21.7 15.0 Iowa 25,293 62.1 23.0 15.0 Kansas 18,846 58.8 23.5 17.7 Kentucky 23,378 60.6 22.7 16.7 Louisiana 25,768 68.9 16.9 14.2 Maine 6,410 57.6 24.2 18.1 Maryland 25,665 67.9 20.7 11.3 Massachusetts 43,463 68.2 19.1 12.8 Michigan 41,961 59.4 24.5 16.1 Minnesota 28,416 57.4 24.1 18.6 Mississippi 16,128 62.7 20.3 17.1 Missouri 38,843 60.3 23.4 16.2 Montana 4,801 54.1 24.5 21.4 Nebraska 12,663 58.2 23.8 18.0 Nevada 5,024 58.7 20.8 20.5 New Hampshire 7,090 61.4 23.4 15.2 New Jersey 47,141 69.5 19.4 11.1 New Mexico 6,240 59.1 20.9 20.0 New York 112,846 71.6 17.6 10.8 North Carolina 38,438 60.9 21.9 17.2 North Dakota 5,719 59.6 24.4 16.0 Ohio 80,011 58.2 22.3 19.4 Oklahoma 19,547 55.3 23.2 21.5 Oregon 7,808 44.2 30.0 25.7 Pennsylvania 80,903 65.8 19.4 14.7 Rhode Island 8,348 65.8 20.2 14.0 South Carolina 17,302 66.9 19.7 13.4 South Dakota 6,394 60.7 22.4 16.9 Tennessee 31,852 63.4 22.6 13.9 Texas 101,411 64.1 20.9 14.9 Utah 5,990 39.8 27.0 33.2 Vermont 2,857 55.0 24.9 20.1 Virginia 29,606 62.0 22.4 15.7 Washington 17,898 51.3 26.6 22.1 West Virginia 9,696 58.1 24.2 17.7 Wisconsin 30,117 57.8 25.3 17.0 Wyoming 2,453 54.2 25.8 20.0
Source: MDS; measures are fully described in Methods
Nursing Home Data Compendium 2013 181

Table 3.9.b. Distribution of Self-Reported Pain in Nursing Home Residents: United States, 2012
Residents Pain - Percentage of Residents (Number) None Mild/Infrequent Moderate or Severe
Nation 1,409,749 65.0 21.5 13.5 Alabama 22,884 66.3 21.7 12.0 Alaska 582 44.2 29.5 26.3 Arizona 12,424 50.6 27.1 22.2 Arkansas 17,816 68.1 19.2 12.7 California 105,541 68.1 19.8 12.0 Colorado 16,378 56.8 26.7 16.5 Connecticut 25,313 70.0 18.3 11.7 Delaware 4,264 64.0 23.2 12.8 District of Columbia 2,624 83.3 12.1 4.6 Florida 76,276 64.7 23.1 12.1 Georgia 34,067 64.0 22.5 13.5 Hawaii 3,772 72.1 17.9 10.0 Idaho 4,184 50.9 28.9 20.3 Illinois 74,326 68.9 20.2 10.9 Indiana 40,103 64.5 21.7 13.8 Iowa 24,963 63.9 22.1 14.0 Kansas 18,485 59.9 23.9 16.3 Kentucky 23,129 62.0 22.9 15.2 Louisiana 25,505 71.5 16.5 12.0 Maine 6,409 61.3 22.3 16.4 Maryland 25,346 69.4 20.6 10.0 Massachusetts 43,156 68.8 19.2 12.0 Michigan 40,766 61.3 24.1 14.6 Minnesota 27,797 58.1 24.5 17.4 Mississippi 15,884 64.0 19.5 16.5 Missouri 38,180 62.5 23.3 14.2 Montana 4,681 54.0 26.1 19.9 Nebraska 12,288 59.6 23.8 16.6 Nevada 4,839 59.8 22.1 18.1 New Hampshire 6,960 62.7 23.5 13.8 New Jersey 47,227 72.3 18.7 9.1 New Mexico 5,990 60.7 22.1 17.2 New York 109,830 72.7 17.7 9.7 North Carolina 37,604 62.2 22.9 14.9 North Dakota 5,662 60.5 24.0 15.5 Ohio 78,785 61.1 22.9 16.0 Oklahoma 19,228 56.9 23.0 20.2 Oregon 7,947 42.6 32.9 24.5 Pennsylvania 81,276 66.4 19.7 13.9 Rhode Island 8,221 67.6 19.3 13.1 South Carolina 17,033 67.7 20.5 11.8 South Dakota 6,347 62.4 22.1 15.5 Tennessee 31,083 64.5 23.4 12.1 Texas 98,195 66.1 20.8 13.1 Utah 5,616 39.3 30.4 30.3 Vermont 2,804 57.6 25.3 17.2 Virginia 29,309 65.0 20.8 14.1 Washington 17,590 52.7 26.9 20.3 West Virginia 9,669 59.7 24.2 16.0 Wisconsin 29,004 58.4 25.3 16.2 Wyoming 2,387 58.5 24.0 17.5
Source: MDS; measures are fully described in Methods
182 Nursing Home Data Compendium 2013

Table 3.10.a. Distribution of Recent Falls in Nursing Home Residents: United States, 2011
Residents Falls - Percentage of Residents (Number) None 1+ Falls, No Injury 1+ Injurious Falls
Nation 1,431,730 83.1 11.5 5.4 Alabama 23,428 84.2 10.9 5.0 Alaska 608 81.9 13.8 4.3 Arizona 12,467 83.4 11.1 5.6 Arkansas 18,427 80.7 11.8 7.5 California 106,348 88.5 8.1 3.4 Colorado 16,317 78.1 14.5 7.4 Connecticut 25,955 83.8 11.7 4.5 Delaware 4,253 79.0 15.4 5.6 District of Columbia 2,625 85.8 11.6 2.6 Florida 76,390 85.5 10.3 4.1 Georgia 34,692 81.2 13.0 5.7 Hawaii 3,842 86.4 8.5 5.1 Idaho 4,235 79.8 12.3 7.9 Illinois 75,983 84.1 11.2 4.7 Indiana 39,834 81.6 12.3 6.1 Iowa 25,293 78.4 13.7 7.8 Kansas 18,846 77.1 14.3 8.6 Kentucky 23,378 81.7 12.4 5.8 Louisiana 25,768 81.5 12.2 6.3 Maine 6,410 75.0 15.4 9.6 Maryland 25,665 84.3 11.5 4.2 Massachusetts 43,463 85.4 10.7 3.9 Michigan 41,961 83.1 12.0 4.9 Minnesota 28,416 78.3 14.2 7.5 Mississippi 16,128 84.7 10.5 4.8 Missouri 38,843 78.9 14.0 7.1 Montana 4,801 75.6 14.4 10.0 Nebraska 12,663 77.2 15.1 7.7 Nevada 5,024 84.2 11.3 4.5 New Hampshire 7,090 79.2 14.4 6.4 New Jersey 47,141 86.3 10.2 3.5 New Mexico 6,240 78.1 14.1 7.8 New York 112,846 85.9 9.9 4.2 North Carolina 38,438 82.2 12.7 5.0 North Dakota 5,719 74.6 14.8 10.6 Ohio 80,011 83.2 11.9 4.9 Oklahoma 19,547 76.8 13.4 9.9 Oregon 7,808 82.7 11.7 5.7 Pennsylvania 80,903 82.7 12.2 5.2 Rhode Island 8,348 79.0 15.1 6.0 South Carolina 17,302 82.1 12.3 5.6 South Dakota 6,394 73.2 16.6 10.3 Tennessee 31,852 83.1 11.1 5.9 Texas 101,411 83.8 10.4 5.8 Utah 5,990 80.5 11.0 8.5 Vermont 2,857 77.4 13.9 8.7 Virginia 29,606 82.2 12.7 5.1 Washington 17,898 83.0 10.9 6.2 West Virginia 9,696 79.9 13.4 6.8 Wisconsin 30,117 80.3 12.6 7.1 Wyoming 2,453 73.9 15.5 10.5 Source: MDS; recent falls are those that have occurred since admission or most recent assessment; measures are fully described in Methods
Nursing Home Data Compendium 2013 183

Table 3.10.b. Distribution of Recent Falls in Nursing Home Residents: United States, 2012
Residents Falls - Percentage of Residents (Number) None 1+ Falls, No Injury 1+ Injurious Falls
Nation 1,409,749 83.4 11.3 5.3 Alabama 22,884 84.6 10.1 5.3 Alaska 582 83.7 10.8 5.5 Arizona 12,424 84.1 10.8 5.2 Arkansas 17,816 80.3 12.6 7.1 California 105,541 89.0 7.7 3.4 Colorado 16,378 78.7 13.8 7.5 Connecticut 25,313 83.6 11.8 4.6 Delaware 4,264 80.7 14.1 5.2 District of Columbia 2,624 87.1 10.4 2.5 Florida 76,276 86.0 9.9 4.1 Georgia 34,067 81.7 12.7 5.6 Hawaii 3,772 89.1 7.0 3.9 Idaho 4,184 81.2 11.7 7.0 Illinois 74,326 83.9 11.4 4.6 Indiana 40,103 81.7 12.2 6.1 Iowa 24,963 79.0 13.5 7.4 Kansas 18,485 77.6 14.2 8.3 Kentucky 23,129 82.6 11.6 5.8 Louisiana 25,505 82.4 11.6 6.0 Maine 6,409 76.2 14.9 8.8 Maryland 25,346 84.2 11.8 4.0 Massachusetts 43,156 85.4 10.6 4.0 Michigan 40,766 83.8 11.7 4.4 Minnesota 27,797 78.6 13.9 7.5 Mississippi 15,884 85.0 10.4 4.7 Missouri 38,180 78.5 14.6 6.9 Montana 4,681 75.4 14.7 9.9 Nebraska 12,288 78.3 14.1 7.5 Nevada 4,839 84.9 10.9 4.2 New Hampshire 6,960 79.3 14.2 6.5 New Jersey 47,227 86.9 9.6 3.4 New Mexico 5,990 80.1 12.1 7.8 New York 109,830 86.2 9.7 4.1 North Carolina 37,604 82.6 12.4 5.0 North Dakota 5,662 73.8 16.3 9.9 Ohio 78,785 83.2 11.6 5.2 Oklahoma 19,228 77.3 13.1 9.6 Oregon 7,947 83.8 10.8 5.4 Pennsylvania 81,276 83.3 11.7 5.1 Rhode Island 8,221 80.6 13.1 6.2 South Carolina 17,033 82.9 12.1 5.0 South Dakota 6,347 73.9 16.5 9.6 Tennessee 31,083 82.9 11.2 5.9 Texas 98,195 83.6 10.5 5.8 Utah 5,616 80.3 11.9 7.8 Vermont 2,804 77.3 14.1 8.6 Virginia 29,309 83.1 12.0 5.0 Washington 17,590 82.8 11.3 5.9 West Virginia 9,669 78.3 14.0 7.8 Wisconsin 29,004 81.2 12.1 6.8 Wyoming 2,387 74.2 15.4 10.4 Source: MDS; recent falls are those that have occurred since admission or most recent assessment; measures are fully described in Methods
184 Nursing Home Data Compendium 2013

Table 3.11.a. Clinical Characteristics of Nursing Home Residents by State: United States, 2011
Percentage of Residents Pressure
Ulcers Restraints Incontinence Feeding Tube Weight Loss Antipsychotic
Medication Nation 5.9 2.2 35.6 5.9 5.9 25.5 Alabama 5.2 1.6 43.5 7.8 6.1 28.7 Alaska 5.8 0.7 34.6 7.6 7.5 15.5 Arizona 6.3 1.1 34.9 5.0 5.1 23.4 Arkansas 5.2 2.6 35.8 5.2 5.1 27.7 California 6.9 4.1 47.2 11.4 5.1 24.6 Colorado 4.2 2.0 28.0 2.4 5.8 22.4 Connecticut 4.3 1.5 34.7 3.2 5.9 27.5 Delaware 4.5 1.1 34.8 5.3 5.5 23.0 District of Columbia 7.8 1.4 44.0 11.1 5.7 24.6 Florida 6.4 2.7 42.4 7.5 6.3 24.6 Georgia 5.7 1.9 45.8 7.1 6.6 30.4 Hawaii 4.8 3.6 47.8 11.4 7.0 13.1 Idaho 4.6 1.8 26.4 3.6 6.2 25.2 Illinois 5.0 2.2 23.5 4.9 5.8 32.0 Indiana 5.3 1.3 26.7 4.4 6.0 24.4 Iowa 3.3 1.0 15.9 1.9 4.6 22.6 Kansas 4.3 0.5 18.6 2.4 5.0 28.0 Kentucky 6.0 3.7 38.1 7.1 7.2 26.7 Louisiana 6.3 4.8 39.2 7.7 5.8 34.1 Maine 5.4 0.6 26.4 2.0 6.7 26.8 Maryland 7.3 1.4 45.8 7.8 6.0 20.8 Massachusetts 5.0 2.2 47.1 3.3 5.1 27.6 Michigan 6.2 2.5 28.9 5.6 6.7 18.0 Minnesota 4.1 1.1 18.6 2.3 6.0 21.1 Mississippi 6.0 4.3 44.3 8.9 6.1 29.6 Missouri 4.6 1.9 23.3 3.4 5.4 28.6 Montana 3.9 1.8 20.2 2.1 7.0 22.6 Nebraska 3.7 0.8 15.9 3.4 5.5 23.8 Nevada 7.7 2.2 43.0 10.8 6.4 21.0 New Hampshire 3.7 0.8 25.2 1.6 5.8 26.4 New Jersey 7.5 2.6 38.2 7.1 6.3 21.5 New Mexico 5.6 1.7 35.9 3.2 6.2 23.5 New York 7.7 2.0 40.8 7.2 5.5 24.1 North Carolina 6.7 2.2 45.9 6.5 7.0 22.4 North Dakota 3.9 1.3 13.0 2.7 6.3 21.5 Ohio 5.5 2.7 26.1 5.3 6.5 27.6 Oklahoma 5.1 1.4 30.6 4.5 5.3 28.6 Oregon 6.4 1.8 32.0 3.9 7.3 21.2 Pennsylvania 6.0 1.8 33.6 4.8 5.6 23.9 Rhode Island 4.7 0.9 28.5 2.3 5.2 24.2 South Carolina 6.3 3.8 50.4 6.8 6.8 22.8 South Dakota 4.5 1.0 13.0 1.3 5.2 21.9 Tennessee 5.8 4.4 42.2 5.6 7.3 30.3 Texas 6.0 1.8 42.9 7.1 4.5 28.9 Utah 5.6 2.7 22.5 3.9 6.2 26.4 Vermont 3.9 0.6 29.7 2.5 6.6 25.7 Virginia 6.6 0.8 42.5 6.2 7.3 24.1 Washington 5.9 1.1 31.9 4.8 6.1 22.3 West Virginia 5.9 2.3 39.8 3.9 7.4 23.1 Wisconsin 4.5 0.8 19.3 2.8 6.4 19.4 Wyoming 4.4 2.3 17.3 1.3 7.6 18.4
Source: MDS; clinical measures are fully described in Methods
Nursing Home Data Compendium 2013 185

Table 3.11.b. Clinical Characteristics of Nursing Home Residents by State: United States, 2012
Percentage of Residents Pressure
Ulcers Restraints Incontinence Feeding Tube Weight Loss Antipsychotic
Medication Nation 5.4 1.7 35.0 5.7 5.8 24.2 Alabama 4.9 1.3 44.3 7.6 6.2 26.2 Alaska 6.5 0.9 34.4 7.6 6.6 14.4 Arizona 5.9 0.7 33.0 5.2 4.9 21.6 Arkansas 4.4 2.0 35.4 4.8 5.5 27.4 California 6.3 2.9 46.1 11.2 5.1 23.2 Colorado 3.9 1.4 27.2 2.3 5.4 21.2 Connecticut 4.0 1.4 33.6 3.0 5.8 25.6 Delaware 5.0 0.7 35.0 5.4 5.6 21.9 District of Columbia 7.2 0.9 44.4 10.9 5.9 22.6 Florida 6.0 1.9 41.7 7.1 6.2 23.3 Georgia 5.4 1.3 45.4 6.7 6.9 26.7 Hawaii 4.3 2.2 46.5 11.2 7.2 12.3 Idaho 4.1 1.1 27.7 3.6 6.3 22.7 Illinois 4.9 1.6 23.5 4.6 5.6 31.2 Indiana 5.0 1.0 26.2 4.2 6.2 22.5 Iowa 3.3 0.8 15.0 1.9 4.8 21.2 Kansas 3.7 0.4 17.9 2.4 4.7 27.2 Kentucky 5.8 2.8 36.9 6.8 6.7 24.5 Louisiana 6.0 3.9 38.3 7.3 6.3 33.1 Maine 4.9 0.4 25.8 1.8 6.6 23.8 Maryland 6.5 1.2 45.0 7.7 6.1 19.5 Massachusetts 4.5 1.8 46.1 3.1 5.1 26.0 Michigan 5.6 2.1 28.7 5.6 6.2 17.2 Minnesota 3.6 0.8 18.3 2.3 5.4 20.3 Mississippi 5.6 4.1 44.5 9.1 6.3 28.1 Missouri 4.2 1.3 22.5 3.1 5.0 27.8 Montana 3.4 1.4 19.5 2.0 7.4 21.1 Nebraska 3.4 0.7 16.0 3.2 4.9 24.0 Nevada 7.1 1.2 41.7 10.1 5.6 21.2 New Hampshire 3.2 0.8 24.9 1.9 6.2 25.1 New Jersey 7.1 2.1 37.5 6.9 6.1 21.0 New Mexico 4.9 1.0 35.6 2.6 5.6 21.9 New York 7.1 1.9 40.7 6.8 5.7 22.4 North Carolina 6.2 1.6 45.4 6.0 7.3 19.8 North Dakota 4.0 1.1 12.4 2.4 6.0 21.1 Ohio 5.1 1.8 25.9 5.1 6.1 26.9 Oklahoma 5.3 1.1 30.2 4.2 5.9 27.3 Oregon 6.0 1.2 30.7 3.5 6.9 19.3 Pennsylvania 5.5 1.3 32.5 4.6 5.9 22.6 Rhode Island 4.5 0.6 28.9 2.2 5.0 21.7 South Carolina 5.7 2.9 49.3 6.7 6.9 20.2 South Dakota 3.6 0.6 12.4 1.3 5.7 21.3 Tennessee 5.1 3.3 42.0 5.7 7.1 27.4 Texas 5.5 1.3 41.6 6.7 4.4 28.5 Utah 5.1 2.1 23.9 3.8 5.4 25.6 Vermont 4.4 0.6 30.9 2.2 6.9 23.6 Virginia 5.8 0.8 41.8 5.9 6.7 23.1 Washington 5.8 1.2 31.2 4.8 6.0 21.5 West Virginia 6.1 1.5 37.9 3.5 7.2 23.0 Wisconsin 4.3 0.7 19.0 2.6 6.4 18.7 Wyoming 3.7 1.2 16.2 1.1 7.1 18.6
Source: MDS; clinical measures are fully described in Methods
186 Nursing Home Data Compendium 2013

Table 3.12.a. Functional Characteristics of Nursing Home Residents According to Age: United States, 2011
Percentage of Nursing Home Residents All Residents Age Group
Resident Characteristic Number Percentage 0-21 22-30 31-64 65-74 75-84 85-94 95+ Mean Age
Number 1,431,721 3,027 4,705 206,719 209,209 393,983 504,799 109,279 79.2
Percentage 100.0 0.2 0.3 14.4 14.6 27.5 35.3 7.6
Number of ADL Impairments 0 310,798 21.7 9.2 30.6 33.5 25.5 20.3 17.9 14.8 75.9 1 88,079 6.2 1.6 3.0 6.0 6.4 6.1 6.2 6.1 79.5 2 79,917 5.6 2.3 2.4 4.9 5.7 5.7 5.7 5.6 80.0 3 96,621 6.8 3.6 3.7 6.2 6.9 6.7 7.0 6.8 79.8 4 526,030 36.8 13.7 13.6 28.2 35.8 37.9 39.3 40.6 80.8 5 329,530 23.0 69.6 46.6 21.2 19.6 23.2 23.9 26.1 79.4
Cognitive Impairment None to Mild 503,908 35.2 19.7 50.2 55.4 48.3 34.6 25.6 18.4 74.9 Moderate 375,542 26.2 7.3 11.7 21.7 25.0 26.9 27.9 28.2 80.5 Severe 552,226 38.6 73.0 38.1 22.9 26.7 38.6 46.5 53.4 82.3
Pain in Past 5 days None 717,779 63.4 56.6 59.2 55.6 57.3 62.3 68.1 73.5 80.3 Mild/Infrequent 241,361 21.3 25.3 17.5 20.5 22.7 22.5 20.8 18.4 78.9 Moderate or Severe 173,114 15.3 18.2 23.3 23.9 20.1 15.2 11.2 8.0 74.9
Falls Since Admission or Most Recent Assessment No falls 1,187,979 83.1 95.8 92.6 86.7 85.2 83.1 81.2 79.5 78.8 1+ Falls, no injury 165,079 11.5 2.9 5.9 9.7 10.5 11.5 12.4 13.3 80.7 1+ Injurious falls 77,239 5.4 1.2 1.5 3.6 4.3 5.4 6.3 7.1 82.1
Source: MDS; measures are fully described in Methods
Nursing Home Data Compendium 2013 187

Table 3.12.b. Functional Characteristics of Nursing Home Residents According to Age: United States, 2012
Percentage of Nursing Home Residents All Residents Age Group
Resident Characteristic Number Percentage 0-21 22-30 31-64 65-74 75-84 85-94 95+ Mean Age
Number 1,409,710 2,974 4,492 204,966 214,176 381,446 492,857 108,799 79.1
Percentage 100.0 0.2 0.3 14.5 15.2 27.1 35.0 7.7
Number of ADL Impairments 0 287,553 20.4 8.9 29.8 32.1 24.2 18.9 16.6 13.7 75.6 1 84,079 6.0 1.4 2.7 6.0 6.4 5.9 6.0 5.6 79.2 2 75,445 5.4 2.4 1.9 4.8 5.5 5.5 5.4 5.2 79.7 3 89,438 6.3 4.0 3.4 5.8 6.6 6.4 6.4 6.4 79.6 4 544,084 38.6 15.4 14.8 29.5 37.4 39.8 41.4 42.8 80.7 5 328,535 23.3 67.9 47.5 21.8 19.9 23.4 24.2 26.4 79.3
Cognitive Impairment None to Mild 515,860 36.6 20.8 50.7 56.6 49.8 36.0 26.7 19.5 74.9 Moderate 362,802 25.7 8.0 11.4 21.1 24.4 26.4 27.5 27.7 80.5 Severe 531,043 37.7 71.2 37.9 22.3 25.9 37.5 45.8 52.8 82.3
Pain in Past 5 days None 721,184 65.0 61.9 59.8 57.1 58.9 64.0 69.7 75.0 80.3 Mild/Infrequent 238,058 21.5 21.9 19.4 21.3 23.1 22.7 20.6 18.1 78.8 Moderate or Severe 150,158 13.5 16.2 20.8 21.6 18.0 13.3 9.7 6.9 74.7
Falls Since Admission or Most Recent Assessment No falls 1,174,796 83.4 96.0 92.6 86.8 85.6 83.5 81.5 79.9 78.7 1+ Falls, no injury 159,360 11.3 2.6 5.6 9.7 10.2 11.3 12.2 13.1 80.6 1+ Injurious falls 74,770 5.3 1.4 1.8 3.5 4.2 5.3 6.2 7.0 82.1
Source: MDS; measures are fully described in Methods
188 Nursing Home Data Compendium 2013

Table 3.13.a. Prevalence of Clinical Measures in Nursing Home Residents According to Age, 2011
Percentage of Nursing Home Residents
All Residents Age Group Clinical Measure 0-21 22-30 31-64 65-74 75-84 85-94 95+
Number of Residents 1,431,721 3,027 4,705 206,719 209,209 393,983 504,799 109,279
Pressure Ulcers 5.9 5.3 10.1 7.3 6.6 6.0 5.1 4.6
Any Restraint Use 2.2 12.6 5.8 2.3 1.8 2.2 2.3 2.3
Incontinence 35.6 80.7 54.0 34.9 34.7 36.5 35.1 36.0
Feeding Tube 5.9 69.9 35.4 11.2 7.4 5.6 3.6 2.1
Unintended Weight Loss 5.9 3.9 4.3 4.8 5.7 6.1 6.2 6.1
Antipsychotic Use 25.5 11.7 34.0 38.2 32.0 25.5 19.9 15.1
Source: CASPER and MDS; clinical measures are fully described in Methods
Table 3.13.b. Prevalence of Clinical Measures in Nursing Home Residents According to Age, 2012
Percentage of Nursing Home Residents
All Residents Age Group
Clinical Measure 0-21 22-30 31-64 65-74 75-84 85-94 95+
Number of Residents 1,409,710 2,974 4,492 204,966 214,176 381,446 492,857 108,799
Pressure Ulcers 5.4 3.9 10.6 6.9 6.1 5.6 4.7 4.2
Any Restraint Use 1.7 10.1 4.9 1.8 1.4 1.7 1.7 1.7
Incontinence 35.0 79.3 54.7 34.6 34.3 35.9 34.4 35.2
Feeding Tube 5.7 68.5 36.1 11.1 7.2 5.3 3.3 1.9
Unintended Weight Loss 5.8 3.0 4.1 4.8 5.7 6.0 6.1 6.2
Antipsychotic Use 24.2 10.9 32.9 37.0 30.6 24.1 18.5 13.5
Source: CASPER and MDS; clinical measures are fully described in Methods
Nursing Home Data Compendium 2013 189

Table 3.14.a. Functional Characteristics of Nursing Home Residents According to Cognitive Status: United States, 2011
Percentage of Nursing Home Residents All Residents Cognitive Status
Resident Characteristic Number Percentage None to Mild Impairment
Moderate Impairment
Severe Impairment
Number 1,431,685 503,909 375,542 552,234 Percentage 100.0 35.2 26.2 38.6
Number of ADL Impairments 0 310,795 21.7 32.2 22.3 11.8 1 88,077 6.2 7.5 6.5 4.7 2 79,917 5.6 5.6 5.9 5.4 3 96,620 6.8 7.7 7.1 5.7 4 526,010 36.8 40.0 40.4 31.3 5 329,520 23.0 7.0 17.8 41.2
Pain in Past 5 days None 717,785 63.4 48.3 66.8 80.7 Mild/Infrequent 241,361 21.3 27.7 20.7 13.3 Moderate or Severe 173,114 15.3 24.1 12.6 6.0
Falls Since Admission or Most Recent Assessment No falls 1,187,988 83.1 88.2 81.0 79.8 1+ Falls, no injury 165,079 11.5 8.1 13.0 13.7 1+ Injurious falls 77,239 5.4 3.7 6.0 6.5
Source: MDS; measures are fully described in Methods
Table 3.14.b. Functional Characteristics of Nursing Home Residents According to Cognitive Status: United States, 2012
Percentage of Nursing Home Residents All Residents Cognitive Status
Resident Characteristic Number Percentage None to Mild Impairment
Moderate Impairment
Severe Impairment
Number 1,409,744 515,866 362,816 531,062 Percentage 100.0 36.6 25.7 37.7
Number of ADL Impairments 0 287,566 20.4 30.2 20.6 10.8 1 84,080 6.0 7.3 6.2 4.5 2 75,449 5.4 5.4 5.6 5.1 3 89,439 6.3 7.3 6.7 5.2 4 544,088 38.6 42.3 42.4 32.5 5 328,546 23.3 7.5 18.5 42.0
Pain in Past 5 days None 721,208 65.0 50.0 68.5 82.4 Mild/Infrequent 238,059 21.5 28.5 20.5 12.7 Moderate or Severe 150,160 13.5 21.5 11.0 4.9
Falls Since Admission or Most Recent Assessment No falls 1,174,830 83.4 88.3 81.2 80.0 1+ Falls, no injury 159,365 11.3 7.9 12.8 13.6 1+ Injurious falls 74,770 5.3 3.7 6.0 6.4
Source: MDS; measures are fully described in Methods
190 Nursing Home Data Compendium 2013

Table 3.15.a. Prevalence of Clinical Measures in Nursing Home Residents According to Cognitive Status: United States, 2011
Percentage of Nursing Home Residents All Residents Cognitive Status
Clinical Measure None to Mild Impairment
Moderate Impairment
Severe Impairment
Number of Residents 1,431,685 503,909 375,542 552,234
Pressure Ulcers 5.9 6.2 5.3 5.9
Any Restraint Use 2.2 0.4 1.8 4.2
Incontinence 35.6 17.2 32.2 53.9
Feeding Tube 5.9 2.7 4.4 9.9
Unintended Weight Loss 5.9 5.2 6.0 6.4
Antipsychotic Use 25.5 19.0 27.0 30.5
Source: CASPER and MDS; clinical measures are fully described in Methods
Table 3.15.b. Prevalence of Clinical Measures in Nursing Home Residents According to Cognitive Status: United States, 2012
Percentage of Nursing Home Residents All Residents Cognitive Status
Clinical Measure None to Mild Impairment
Moderate Impairment
Severe Impairment
Number of Residents 1,409,744 515,866 362,816 531,062
Pressure Ulcers 5.4 5.8 5.0 5.4
Any Restraint Use 1.7 0.3 1.3 3.3
Incontinence 35.0 17.3 32.1 53.4
Feeding Tube 5.7 2.7 4.3 9.6
Unintended Weight Loss 5.8 5.1 6.0 6.4
Antipsychotic Use 24.2 18.5 25.7 28.7
Source: CASPER and MDS; clinical measures are fully described in Methods
Nursing Home Data Compendium 2013 191

Table 3.16.a. Joint Distribution of ADL Impairment and Cognitive Status Nursing Home Residents: United States, 2011
Number and Percentage of Nursing Home Residents
Cognitive Status
All Residents None to Mild Impairment Moderate Impairment Severe Impairment
Number Percentage Number Percentage Number Percentage Number Percentage
All Residents 1,430,939 100.0 503,329 35.2 375,454 26.2 552,156 38.6
Number of ADL Impairments
0 310,795 21.7 162,058 11.3 83,550 5.8 65,187 4.6
1 88,077 6.2 37,925 2.7 24,311 1.7 25,841 1.8
2 79,917 5.6 28,002 2.0 22,310 1.6 29,605 2.1
3 96,620 6.8 38,737 2.7 26,684 1.9 31,199 2.2
4 526,010 36.8 201,293 14.1 151,738 10.6 172,979 12.1
5 329,520 23.0 35,314 2.5 66,861 4.7 227,345 15.9
Source: MDS; ADL=Activities of Daily Living; measures are fully described in Methods
Table 3.16.b. Joint Distribution of ADL Impairment and Cognitive Status Nursing Home Residents: United States, 2012
Number and Percentage of Nursing Home Residents Cognitive Status
All Residents None to Mild Impairment Moderate Impairment Severe Impairment
Number Percentage Number Percentage Number Percentage Number Percentage
All Residents 1,409,168 100.0 515,423 36.6 362,741 25.7 531,004 37.7
Number of ADL Impairments
0 287,566 20.4 155,455 11.0 74,544 5.3 57,567 4.1
1 84,080 6.0 37,716 2.7 22,610 1.6 23,754 1.7
2 75,449 5.4 27,956 2.0 20,489 1.5 27,004 1.9
3 89,439 6.3 37,594 2.7 24,316 1.7 27,529 2.0
4 544,088 38.6 218,110 15.5 153,660 10.9 172,318 12.2
5 328,546 23.3 38,592 2.7 67,122 4.8 222,832 15.8
Source: MDS; ADL=Activities of Daily Living; measures are fully described in Methods
192 Nursing Home Data Compendium 2013