nur syazwani binti mohtar · thermostable glycogen branching enzyme that is active at high...
TRANSCRIPT

UNIVERSITI PUTRA MALAYSIA
IDENTIFICATION OF THERMOSTABLE GLYCOGEN BRANCHING ENZYME FROM GEOBACILLUS SP. GEO5 BY GENOME MINING
NUR SYAZWANI BINTI MOHTAR
FS 2013 15

© COPYRIG
HT UPM
IDENTIFICATION OF THERMOSTABLE
GLYCOGEN BRANCHING ENZYME FROM
GEOBACILLUS SP. GEO5 BY GENOME MINING
NUR SYAZWANI BINTI MOHTAR
MASTER OF SCIENCE
UNIVERSITI PUTRA MALAYSIA
2013

© COPYRIG
HT UPM
IDENTIFICATION OF THERMOSTABLE GLYCOGEN BRANCHING
ENZYME FROM GEOBACILLUS SP. GEO5 BY GENOME MINING
By
NUR SYAZWANI BINTI MOHTAR
Thesis Submitted to the School of Graduate Studies, Universiti Putra Malaysia,
in Fulfilment of the Requirements for the Degree of Master of Science
July 2013

© COPYRIG
HT UPM
COPYRIGHT
All material contained within the thesis, including without limitation text, logos,
icons, photographs and all other artwork, is copyright material of Universiti Putra
Malaysia unless otherwise stated. Use may be made of any material contained within
the thesis for non-commercial purposes from the copyright holder. Commercial use
of material may only be made with the express, prior, written permission of
Universiti Putra Malaysia.
Copyright © Universiti Putra Malaysia

© COPYRIG
HT UPM
ii
Abstract of thesis presented to the Senate of Universiti Putra Malaysia in fulfilment
of the requirement for the degree of Master of Science
IDENTIFICATION OF THERMOSTABLE GLYCOGEN BRANCHING
ENZYME FROM GEOBACILLUS SP. GEO5 BY GENOME MINING
By
NUR SYAZWANI BINTI MOHTAR
July 2013
Chairman: Professor Mohd Basyarudin Bin Abdul Rahman, PhD
Faculty: Science
Glycogen branching enzyme (EC 2.4.1.18) has increasing demand from food and
beverages processing industries. This enzyme, which catalyses the formation of α-
1,6-glycosidic branch points in glycogen structure, is used to enhance nutritional
value and quality of food and beverages. To be applicable in industries, enzymes that
are stable and active at high temperature are much desired. A thermophilic
bacterium, Geobacillus sp. Geo5, was isolated from Sungai Klah Hot Springs at
97°C and therefore it was postulated that this bacterium species would produce
thermostable glycogen branching enzyme that is active at high temperature. The
objectives of this research are to identify the branching enzyme gene (glgB) of
Geobacillus sp. Geo5, to produce the enzyme using Escherichia coli and to
characterise the biochemical properties of the enzyme. Using genome data mining,
the nucleotide sequence of glgB was fished out from Geobacillus sp. Geo5 genome
sequence provided by Malaysia Genome Institute. The size of the gene is 2013 bp
and the theoretical molecular weight of the protein is 78.43 kDa. The gene sequence
was then used to predict the three dimensional structure of the enzyme using an
online software, I-TASSER. The percentage sequence identity of the template

© COPYRIG
HT UPM
iii
(Mycobacterium tuberculosis H37RV; PDB ID: 3K1D) in the threading aligned
region with the Geobacillus sp. Geo5 sequence was only 45%. Subsequently, glgB
from Geobacillus sp. Geo5 was isolated using polymerase chain reaction (PCR). To
study the enzyme, the gene was cloned into pET102/D-TOPO®
vector by PCR
cloning and overexpressed in BL21 Star TM
(DE3) E. coli. The expression of active
enzyme was the highest when the expression was induced with 0.75 mM of IPTG, at
30°C for 8 hours. The recombinant protein was also expressed together with
bacteriocin release protein to secrete the protein into E. coli culture medium. The
study shown that induction with 5 ng/mL of mitomycin C for 8 hour was enough to
secrete the recombinant protein to extracellular environment (34.1 U/mL) although
not entirely since 43.0 U/mL of the activity was still in the cell. Therefore, the
intracellular expression system was chosen for further studies on the enzyme. The
recombinant protein from intracellular expression was then purified by affinity
chromatography using HisTrap HP column with the recovery of 84%. The purified
enzyme was used to study the effect of temperature and pH on enzyme activity and
stability, and the inhibitory effect by metal ion on enzyme activity. This thermostable
glycogen branching enzyme was found to be most active at 55°C and the half-life at
60°C and 70°C was 24 hours and 5 hours, respectively. The enzyme was stable at pH
5 to pH 9 and the optimum pH for enzyme activity was at pH 6. Metal ions, Mn2+
,
Zn2+
, Cu2+
, Fe2+
and Ca2+
seem to inhibit the activity of this enzyme. Mg2+
however
does not affect the enzyme activity. From this research, a thermostable glycogen
branching enzyme was successfully isolated from Geobacillus sp. Geo5 by genome
mining together with molecular biology technique. The stability of this enzyme
would be very practical for industrial applications especially in carbohydrates
processing such as nutraceutical, food and beverages industries.

© COPYRIG
HT UPM
iv
Abstrak tesis yang dikemukakan kepada Senat Universiti Putra Malaysia sebagai
memenuhi keperluan untuk ijazah Master Sains
IDENTIFIKASI ENZIM PENCABANG GLYCOGEN TERMOSTABIL
DARIPADA GEOBACILLUS SP. GEO5 MELALUI PERLOMBONGAN
GENOM
Oleh
NUR SYAZWANI BINTI MOHTAR
Julai 2013
Pengerusi: Professor Mohd Basyarudin Bin Abdul Rahman, PhD
Fakulti: Sains
Enzim pencabang glikogen (EC 2.4.1.18) mendapat permintaan yang meningkat
daripada industri pemprosesan makanan dan minuman. Enzim ini yang memangkin
pembentukan titik cabangan α-1,6-glikosida dalam struktur glikogen, digunakan
untuk meningkatkan nilai pemakanan dan kualiti makanan dan minuman. Untuk
diguna pakai dalam industri, enzim yang stabil dan aktif pada suhu tinggi sangat
diingini. Satu bakteria termofilik, Geobacillus sp. Geo5, telah dipencilkan dari
Kolam Air Panas Sungai Klah pada 97°C dan oleh itu ia diandaikan bahawa spesis
bakteria ini akan menghasilkan enzim pencabang glikogen yang termostabil and aktif
pada suhu tinggi. Objektif kajian ini adalah untuk mengenal pasti gen enzim
pencabang (glgB) daripada Geobacillus sp. Geo5, menghasilkan enzim tersebut
menggunakan Escherichia coli dan mencirikan sifat-sifat biokimia enzim tersebut.
Menggunakan kaedah perlombongan data genom, jujukan nukleotida gen enzim
pencabang (glgB) dipancing keluar daripada genom Geobacillus sp. Geo5 yang telah
dijujuk oleh Institut Genom Malaysia. Saiz gen adalah 2013 bp dan berat molekul
teori protein adalah 78.43 kDa. Jujukan gen kemudiannya digunakan untuk meramal
struktur tiga dimensi enzim mengunakan perisian dalam talian, I-TASSER. Peratusan
identiti jujukan bagi templat (Mycobacterium tuberculosis H37RV; PDB ID: 3K1D)

© COPYRIG
HT UPM
v
di kawasan yang sejajar dengan jujukan Geobacillus sp. Geo5 adalah hanya 45%.
Seterusnya, glgB daripada Geobacillus sp. Geo5 telah dipencilkan menggunakan
tindak balas berantai polimerase (PCR). Untuk mengkaji enzim tersebut, gen diklon
ke dalam vektor pET102/D-TOPO®
melalui pengklonan PCR dan diekspres di dalam
E. coli BL21 Star TM (DE3). Penghasilan enzim yang aktif adalah paling banyak
apabila ekspresi diaruh dengan 0.75 mM IPTG, pada 30°C selama 8 jam. Protein
rekombinan juga diekspres bersama-sama dengan protein pelepasan bakteriosin
untuk merembeskan protein tersebut ke dalam media kultur E. coli. Kajian ini
menunjukkan bahawa induksi dengan 5 ng/mL mitomycin C cukup untuk
merembeskan protein rekombinan ke persekitaran ekstrasel (34.1 U/mL) walaupun
tidak keseluruhannya memandangkan aktiviti sebanyak 43.0 U/mL masih di dalam
sel. Disebabkan itu, sistem pengekspresan intrasel dipilih untuk kajian lanjut ke atas
enzim. Protein rekombinan daripada pengekspresas intrasel seterusnya ditulenkan
melalui kromatografi afiniti menggunakan turus HisTrap HP dengan pemulihan
sebanyak 84%. Enzim yang telah ditulenkan digunakan untuk mengkaji kesan suhu
dan pH ke atas aktiviti dan kestabilan enzim, dan kesan rencatan oleh ion logam pada
aktiviti enzim. Enzim pencabang glikogen didapati paling aktif pada 55°C dan
separuh hayat pada 60°C dan 70°C masing-masing adalah 24 jam dan 5 jam. Enzim
stabil pada pH 5 hingga pH 9 dan pH optimum bagi aktiviti enzim adalah pada pH 6.
Ion-ion logam, Mn2+
, Zn2+
, Cu2+
, Fe2+
dan Ca2+
didapati telah merencat aktiviti
enzim ini. Mg2+
bagaimanapun tidak menjejaskan aktiviti enzim. Daripada kajian ini,
enzim pencabang glikogen yang termostabil telah berjaya dipencil daripada
Geobacillus sp. Geo5 melalui kaedah perlombongan genom bersama-sama dengan
teknik biologi molekul. Kestabilan enzim ini akan menjadi sangat praktikal untuk
aplikasi perindustrian terutamanya dalam pemprosesan karbohidrat seperti industri
nutraseutikal, makanan dan minuman.
© COPYRIG
HT UPM
vi
ACKNOWLEDGEMENTS
Alhamdulillah, all praises and thanks to Allah, The Most Gracious and The Most
Merciful. I would like to express my gratitude to MGI and their personnel who were
generous enough provide this research with the Geobacillus sp. Geo5 isolate and its
genome sequence. I would also like to express my utmost appreciation to my
supervisors Professor Dr. Mohd Basyaruddin Abdul Rahman, Professor Dr. Raja
Noor Zaliha Raja Abdul Rahman and Professor Dato’ Dr. Abu Bakar Salleh, for their
dedication, guidance and encouragement through the course of this project. Dr Adam
Leow Thean Chor and Dr. Mohd. Syukuri, I really appreciate their generous ideas
and guidance.
I would like to give special thanks to my friends from Enzyme Technology Lab, IBS
and 140 Lab, Faculty of Biotechnology and Biomolecular Sciences who have been
together with me throughout the course. To all who has helped me and gave me the
possibility to complete this thesis, thank you very much. I also thank National
Science Fellowship for sponsoring my Master degree.
Most importantly, I am forever grateful to family for their endless love and support,
they always believe in me and stay by my side. May we always be in His blessings.

© COPYRIG
HT UPM
vii
I certify that a Thesis Examination Committee has met on 12 July 2013 to conduct the final examination of Nur Syazwani Binti Mohtar on her thesis entitled "Identification of thermostable glycogen branching enzyme from Geobacillus sp. Geo5 by genome mining" in accordance with the Universities and University Colleges Act 1971 and the Constitution of the Universiti Putra Malaysia [P.U.(A) 106] 15 March 1998. The Committee recommends that the student be awarded the Master of Science. Members of the Thesis Examination Committee were as follows: Emilia Binti Abdul Malik, PhD Faculty of Science Universiti Putra Malaysia (Chairman) Janna Ong Binti Abdullah, PhD Associate Professor Faculty of Biotechnology and Biomolecular Sciences Universiti Putra Malaysia (Internal Examiner) Rosimah Binti Nulit, PhD Faculty of Science Universiti Putra Malaysia (Internal Examiner) Abdul Munir Bin Abdul Murad, PhD Faculty of Science and Technology Universiti Kebangsaan Malaysia Malaysia (External Examiner)
NORITAH OMAR, PhD Assoc. Professor and Deputy Dean School of Graduate Studies Universiti Putra Malaysia Date: 16 August 2013

© COPYRIG
HT UPM
viii
This thesis was submitted to the Senate of Universiti Putra Malaysia and has been
accepted as fulfilment of the requirement for the degree of Master of Science. The
members of the Supervisory Committee were as follows:
Mohd Basyaruddin Bin Abdul Rahman, PhD
Professor
Faculty of Science
Universiti Putra Malaysia
(Chairman)
Raja Noor Zaliha Binti Raja Abdul Rahman, PhD
Professor
Faculty of Biotechnology and Biomolecular Sciences
Universiti Putra Malaysia
(Member)
________________________________
BUJANG BIN KIM HUAT, PhD
Professor and Dean
School of Graduate Studies
Universiti Putra Malaysia
Date:

© COPYRIG
HT UPM
ix
DECLARATION
I declare that the thesis is my original work except for quotations and citations,
which have been duly acknowledged. I also declare that it has not been previously,
and is not concurrently, submitted for any other degree at Universiti Putra Malaysia
or at any other institutions.
________________________________
NUR SYAZWANI BINTI MOHTAR
Date: 12 July 2013

© COPYRIG
HT UPM
x
TABLE OF CONTENTS
Page
ABSTRACT ii
ABSTRAK iv
ACKNOWLEDGEMENTS vi
APPROVAL vii
DECLARATION ix
LIST OF TABLES xiii
LIST OF FIGURES xiv
LIST OF ABBREVIATIONS xvi
CHAPTER
1 INTRODUCTION 1
2 LITERATURE REVIEW 4
2.1 Glycogen 4
2.2 Glycogen branching enzyme 6
2.2.1 Mechanism of action of glycogen branching enzyme 10
2.2.2 Thermostable glycogen branching enzyme 12
2.2.3 Applications of glycogen branching enzyme 14
2.3 Genome mining 17
2.4 Structural studies of glycogen branching enzyme 19
2.4.1 Crystal structures of branching enzyme 20
2.4.2 Protein structure prediction 24
2.5 Lab-scale production of GBE in Escherichia coli expression
system
29
2.5.1 Cloning of PCR product 31
2.5.2 Transformation of Escherichia coli with plasmid 31
2.5.3 Expression of recombinant protein 32
2.5.4 Secretory expression of recombinant protein 33
2.6 Purification of recombinant protein 34
3 MATERIALS AND METHODS 36
3.1 Materials 36
3.2 Genome mining 36
3.3 Enzyme structure prediction 37
3.4 Culturing Geobacillus sp. Geo5 37
3.4.1 Thermus broth preparation 38
3.4.2 Thermus agar preparation 38
3.5 Genomic DNA extraction of Geobacillus sp. Geo5 38
3.6 Polymerase chain reaction of glgB 39

© COPYRIG
HT UPM
xi
3.7 Polymerase chain assembly 40
3.8 PCR purification by gel extraction 42
3.9 Cloning of PCR product 42
3.10 Recombinant plasmid purification 43
3.11 Analysing transformed recombinant plasmids 43
3.11.1 PCR of recombinant plasmid DNA 44
3.11.2 PstI and BglII digestion 44
3.11.3 DNA sequencing of recombinant plasmid DNA 45
3.12 Intracellular expression of G5GBE 45
3.13 Determination of G5GBE expression level 46
3.13.1 Iodine stain assay 46
3.13.2 Branching linkage assay 47
3.13.3 SDS-PAGE 48
3.14 Secretory expression of G5GBE 48
3.14.1 Co-transformation of pSW1 vector 49
3.14.2 Analysis of positive transformants 49
3.14.3 Quasi-lysis test 49
3.14.4
Effect of mitomycin C concentration on secretory
expression
50
3.15 Purification of G5GBE 50
3.15.1 MALDI TOF/TOF analysis 51
3.16 Characterisation of purified GBE 52
3.16.1 Effect of temperature on enzyme activity 52
3.16.2 Effect of temperature on enzyme stability 52
3.16.3 Effect of pH on enzyme activity 53
3.16.4 Effect of pH on enzyme stability 53
3.16.5 Effect of metal ions on enzyme activity 53
4 RESULTS AND DISCUSSIONS 54
4.1 Genome mining 54
4.2 Enzyme structure prediction 59
4.3 Culturing Geobacillus sp. Geo5 66
4.4 Genomic DNA extraction of Geobacillus sp. Geo5 66
4.5 Polymerase chain reaction of glgB 67
4.5.1 DNA sequencing of PCR product 68
4.6 Polymerase chain assembly 69
4.7 Cloning of PCR product 70
4.8 Analysing transformed recombinant plasmids 71
4.9 Expression of G5GBE in Escherichia coli 73
4.9.1 Intracellular expression of G5GBE 74
4.9.1.1 Effect of IPTG concentration 74
4.9.1.2 Effect of induction temperature 77
4.9.1.3 Effect of induction time 79

© COPYRIG
HT UPM
xii
4.9.2 Secretory expression of G5GBE 81
4.9.2.1 Analysis of positive transformants 81
4.9.2.2 Quasi-lysis test 81
4.9.2.3 Effect of mitomycin C concentration on
secretory expression
82
4.10 Purification of G5GBE 87
4.10.1 MALDI TOF/TOF analysis 89
4.11 Biochemical characterisation of purified G5GBE 91
4.11.1
Effect of temperature on enzyme activity and
stability
91
4.11.2 Effect of pH on enzyme activity and stability 94
4.11.3 Effect of metal ions on enzyme activity 97
5 CONCLUSION AND RECOMMENDATIONS 99
5.1 Conclusion 99
5.2 Recommendations 100
REFERENCES 101
APPENDICES 113

© COPYRIG
HT UPM
xiii
LIST OF TABLES
Table
Page
1 Four conserved regions of amino acid sequence of α-amylase
family enzymes
7
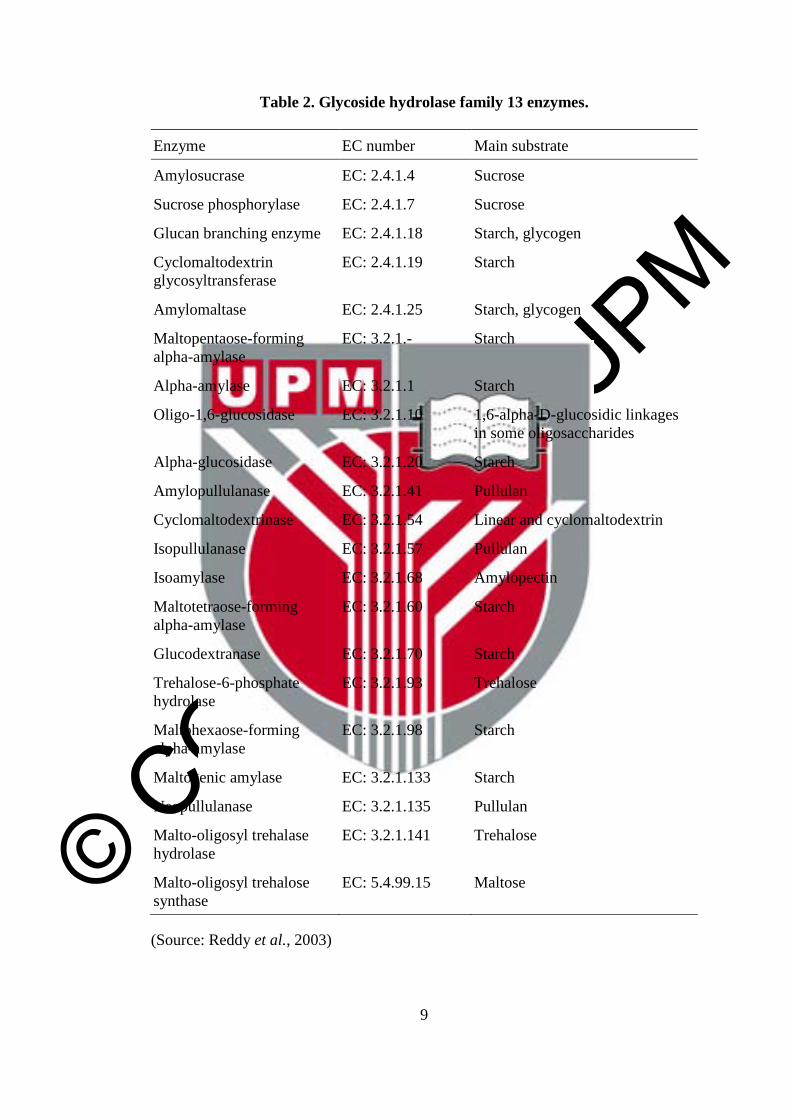
2 Glycoside hydrolase family 13 enzymes 9
3 Conserved regions in glycogen branching enzyme from
Geobacillus spp., Escherichia coli and Mycobacterium
tuberculosis
57
4 Percentage of aromatic amino acids, glutamine and asparagine in
relation to the temperature optimum for activity and stability of
three bacterial and two maize branching enzymes
59
5 C-score of the predicted models by I-TASSER 60
6 Summary of the PROCHECK analysis 64
7 Purification of GBE from Geobacillus sp. Geo5 using affinity
chromatography
89
© COPYRIG
HT UPM
xiv
LIST OF FIGURES
Figure Page
1 Structural formula of glycogen 5
2 Reaction mechanism of glycogen branching enzyme 11
3 X-ray crystal structure of truncated Escherichia coli branching
enzyme
21
4 X-ray crystal structure of Mycobacterium tuberculosis
branching enzyme
23
5 X-ray crystal structure of Thermus thermophilus branching
enzyme
25
6 Accuracy and applications of protein models 27
7 PCR and PCA 41
8 Nucleotide and amino acid sequence of glgB from Geobacillus
sp. Geo5
56
9 Five predicted structures of glycogen branching enzyme by
I-TASSER
61
10 Ramachandran plots 63
11 The catalytic site of glycogen branching enzyme from
Geobacillus sp. Geo5
65
12 Gel electrophoresis of PCR products 68
13 Gel electrophoresis of PCR and PCA products 71
14 Gel electrophoresis of PCR product from pET/GBE 72
15 Gel electrophoresis of restriction enzyme digestion of pET/GBE 73
16 Expression of G5GBE by Escherichia coli BL21 StarTM
(DE3)
when induced with different concentrations of IPTG
76
17 SDS-PAGE of expressed G5GBE when induced with different
concentrations of IPTG
76
18 Expression of G5GBE by Escherichia coli BL21 StarTM
(DE3)
when induced at different temperatures
78
19 SDS-PAGE of expressed G5GBE when induced at different 78
© COPYRIG
HT UPM
xv
temperatures
20 Expression of G5GBE by Escherichia coli BL21 StarTM
(DE3)
when induced up to 28 hours and the growth curve of the
Escherichia coli
80
21 Gel electrophoresis of restriction enzyme digestion of pSW1
and pET/GBE
82
22 Quasi-lysis test done on Escherichia coli BL21 (DE3) StarTM
harbouring pSW1 and pET/GBE
83
23 Effect of mitomycin C concentration on secretory expression of
G5GBE
84
24 Secretory expression of G5GBE 85
25 Chromatogram of affinity chromatography performed using
Äkta Explorer
88
26 SDS-PAGE of purified enzyme 88
27 Hits from the MALDI TOF/TOF analysis 90
28 Effect of temperature on enzyme activity 92
29 Effect of temperature on enzyme stability 93
30 Effect of pH on enzyme activity 95
31 Effect of pH on enzyme stability 96
32 Effect of metal ion on enzyme activity 98
© COPYRIG
HT UPM
xvi
LIST OF ABBREVIATIONS
3D Three-dimensional
A260 Absorbance at 260 nm
A260/280 Ratio of absorbance at 260 nm and 280 nm
A600 Absorbance at 600 nm
ADP Adenosine diphosphate
bp Base pair
BRP Bacteriocin release protein
CASP Critical Assessment of Structure Prediction
DMSO Dimethyl sulfoxide
DNA Deoxyribonucleic acid
EC Enzyme classification
G5GBE Recombinant GBE from Geobacillus sp. Geo5
GBE Glycogen branching enzyme
GH Glycoside hydrolase
HCl Hydrochloric acid
I2 Iodine
IPTG Isopropyl-β-D-thiogalactopyranoside
kb Kilo base pair
kDa Kilo Dalton
KI Potassium iodide
LB Luria-Bertani
M Molar
MALDI TOF/TOF Matrix-assisted laser desorption ionization tandem time-of-flight
mg Milligram
MGI Malaysia Genome Institute
© COPYRIG
HT UPM
xvii
mL Millilitre
mL/min Millilitre per minute
mm Millimetre
mM Millimolar
NaCl Sodium chloride
NaOH Sodium hydroxide
ng Nanogram
ng/mL Nanogram per millilitre
ORF Open reading frame
PCA Polymerase chain assembly
PCR Polymerase chain reaction
PDB Protein Data Bank
pET/GBE Recombinant plasmid; glgB of Geobacillus sp. Geo5 in pET102
rpm Rotations per minute
SDS Sodium dodecyl sulphate
SDS-PAGE Sodium dodecyl sulphate polyacrylamide gel electrophoresis
× g Gravitational force
U Unit
U/mg Unit per milligram
U/mL Unit per millilitre
UV Ultraviolet
v/v Volume per volume
w/v Weight per volume
μg/mL Microgram per millilitre
μL Microlitre
μM Micromolar
μmol Micromole

© COPYRIG
HT UPM
CHAPTER 1
INTRODUCTION
Enzymes are amazing catalysts that are naturally occurring in all living organisms,
efficiently catalyse from simple to complex reactions by accepting selectively a wide
range of molecules as substrates. As an alternative to conventional chemical
catalysts, enzymatic reactions produce fewer by-products that are mostly harmless,
hence making enzymes as an environmentally friendly choice (Schmid et al., 2001).
Efficient selective catalysis is essential and therefore has enormous potential
especially in the industrial processing and synthesis of fine chemicals, food and
pharmaceuticals (Burton et al., 2002). BCC Research reported that in 2010, the value
of global market for industrial enzymes was US$3.6 billion and the largest segment
of the industrial enzymes industry comes from food and beverage enzymes with
revenues of nearly US$1.2 billion (BCC Research, 2012). These enzymes are used
either to increase the nutritional value or to make the food and drinks more
appealing. Therefore enzymes like amylase, lipase and protease have gained a lot of
interest in the research field. Other than aforementioned enzymes, one of the
enzymes that have a rising demand in food and beverages industries is branching
enzyme (van der Maarel, 2009).
Branching enzyme (EC 2.4.1.18) is a type of transferase that is found naturally in
plants, animals and microorganisms. This enzyme carries out the transglycosylation
reaction of starch and glycogen. The transglycosylation reaction transfers

© COPYRIG
HT UPM
2
an α-1,4-glycosidic linkage to α-1,6 making the starch and glycogen structure
branched out. These branches in starch and glycogen structures help the digestion of
the polysaccharides as they are more soluble and easier to be absorbed by the cells
(Abad et al., 2002). As glycogen branching enzyme produces more branches than
starch branching enzymes, many studies are focusing on commercialisation of
glycogen branching enzymes for applications in beverage, food processing and
nutraceutical industries. In order to be practical in industries, enzymes that can
withstand high temperature would be very sought after. One of the major concerns is
to find enzymes that are naturally active and stable in high temperature. For that
reason, researchers have been isolating thermostable glycogen branching enzymes
from thermophilic microorganisms. However, the production of this enzyme in its
thermophilic host is very low. Therefore recombinant DNA technology, such as
Escherichia coli cloning and expression systems, were often utilised in order to
maximise enzyme production to supply for industries and studies on the enzyme. E.
coli system often preferred as this system is easy to manipulate, capable to produce
enzyme rapidly and reasonably cheap.
Studies on branching enzymes have made the gene sequence of the enzyme
accessible (van der Maarel et al., 2002). On top of that, the venture in genome
sequencing is contributing vast information on new genetic sequences and therefore
abundance of novel enzymes and proteins remain to be explored. When put together,
that knowledge can be exploited in the search for novel biocatalysts by a technique
called genome mining. The term ‘genome mining’ brings the meaning of a post
genome analysis where the desired gene is fished out of a genome sequence using
bioinformatics tools and databases. However, genetic sequence alone cannot be used
© COPYRIG
HT UPM
3
to predict the exact catalytic function of putative enzymes unless their structural
information is analysed and then verified through molecular biology
experimentation. Nevertheless, this genetic codes can be use to generate 3D
structures of the proteins through computational prediction by protein threading and
homology modelling methods (Zhang and Skolnick, 2005; Bowie et al., 1991). From
the structural information, the enzyme characteristics such as enzyme stability,
substrate preference and mechanism of the enzyme can be predicted. From there,
further studies can be done to improve the enzyme. Although about 90% of protein
structures deposited in Protein Databank (PDB) were elucidated by X-ray
crystallography, this technique takes time and requires a big budget. Therefore
researchers often use protein structure prediction as a foundation to study the
characteristic and structure of the desired protein.
In this research, genome mining was used to isolate glycogen branching enzyme
gene (glgB) from Geobacillus sp. Geo5 genome, which was sequenced by Malaysia
Genome Institute (MGI) under their Whole Genome Sequencing Project. This
Geobacillus sp. Geo5 was isolated from a 97°C hot spring in Sungai Klah, Perak and
therefore the enzyme isolated is likely to be thermostable and active at high
temperature. Thus, this research is conducted with the following objectives:
1. To identify thermostable glycogen branching enzyme gene from Geobacillus sp.
Geo5 genome sequence.
2. To produce thermostable recombinant glycogen branching enzyme in Escherichia
coli expression system.
3. To characterise the biochemical properties of the purified recombinant glycogen
branching enzyme.

© COPYRIG
HT UPM
4
CHAPTER 2
LITERATURE REVIEW
2.1 Glycogen
Glycogen is a type of polysaccharide made up of glucose residues linked by α-1,4-
glycosodic linkages and is branched by α-1,6-glycosidic linkages. For animals,
glycogen is the major form of stored carbohydrate and can be found in the muscle
cells. Microorganisms, especially bacteria, utilise glycogen as a storage compound
that would provide carbon and energy source. Bacteria accumulate glycogen when
growth condition is limited and carbon source is in excess. Therefore, glycogen
synthesis usually happens during the slow growth and stationary phase (Preiss,
1984). The synthesis of glycogen in bacteria is mainly catalysed by three enzymes.
Glycogen synthase (EC 2.4.1.21) and adenosine diphosphate (ADP) glucose
pyrophosphorylase (EC 2.7.7.27) catalyses the reaction where a glucosyl unit, ADP-
glucose, is linked to a pre-existing α-1,4-glucan by an α-1,4-glycosidic linkage. The
product of these reactions will produce a rather linear type of glycogen. Then,
branching enzyme (EC 2.4.1.18) will branch out the linear form of glycogen by
transferring the α-1,4-glycosidic linkage to an α-1,6-glycosidic linkage. The
positions of the linkages and the branching point are depicted in Figure 1. In E. coli,
glycogen synthase, branching enzyme and ADP-glucose pyrophosphorylase are
encoded by genes named glgA, glgB and glgC, respectively (Romeo et al., 1988).

© COPYRIG
HT UPM
5
Figure 1. Structural formula of glycogen. Branching enzyme transfers an α-1,4-
glycosidic linkage to an α-1,6-glycosidic linkage in every 5 to 16 glucans in chain.
Circled in blue are the non-reducing ends. (Adapted from Voet and Voet, 2011)
α-1,4-glycosidic linkage
α-1,6-glycosidic linkage
α-1,6-glycosidic linkage

© COPYRIG
HT UPM
6
2.2 Glycogen branching enzyme
This research is mainly focused on branching enzyme, particularly glycogen
branching enzyme (GBE) produced in bacteria. Studies that are related to GBE
mostly highlighted on the properties and applications of the enzyme (Takata et al.,
2010; Terada et al., 1997; Takata et al., 1994). Only until recently, researchers are
venturing on the structural and mechanism studies of the enzyme (Palomo, et al.,
2011; Pal et al., 2010). Therefore, there are still a lot of potential researches can be
conducted on GBE in many areas, for example to study the enzyme on its catalytic
and substrate promiscuity and to widen the application of this enzyme into
pharmaceutical industry other than agricultural and food industries.
Branching enzyme is classified under α-amylase family (Kuriki and Imanaka, 1999).
There are two types of branching enzymes classified into this family, glycogen
branching enzyme (GBE) and starch branching enzyme (SBE). α-amylases are
predominantly found in plants, bacteria and fungi (Reddy et al., 2003). These
enzymes shared three common properties. Firstly, their activities involve in
hydrolysis and formation of α-1,4 and α-1,6 glycosidic linkages in the α-
conformation. Secondly, they have a similar structure of their active sites that is the
α/β-barrel structure. Finally, they share four conserved regions in their active sites
(Table 1). These conserved regions involve in the catalysis and stabilised the α/β-
barrel structure (Reddy et al., 2003).

© COPYRIG
HT UPM
7
Table 1. Four conserved regions of amino acid sequence of α-amylase family enzymes.
Note: Highlighted are the four conserved regions and the corresponding β-sheets found in the amino acid sequence
of α-amylase family enzymes. (Source: van der Maarel et al., 2002)
© COPYRIG
HT UPM
8
Under classification of Henrissat (1991), most of α-amylases fall under glycoside
hydrolase family 13 (GH-13 family). This includes both GBE and SBE. Henrissat
compared and classified 301 of glycoside hydrolases and related enzymes according
to their similarity in amino acid sequences. Among those enzymes, about 20 other
enzymes are also classified under GH-13 family (Table 2). These enzymes catalyse
hydrolysis and transglycosylation of α-1,4 and α-1,6 glycosidic linkages using
various substrates as mentioned in Table 2 (Reddy et al., 2003).
However, a novel branching enzyme that has a different structure from other reported
branching enzymes was discovered. This novel enzyme, which was isolated from
Thermococcus kodakaraensis KOD1, is classified in the GH-57 family (Murakami et
al., 2006). Compared to GH-13 family, the structure of this novel branching enzyme
has longer N-terminal region and two copies of helix-hairpin-helix motif at the C-
terminal. Although the structure is totally different from GH-13 family branching
enzyme, the function remains the same. According to Murakami et al. (2006), this
enzyme is optimum at 70°C, pH 7.0 and stable up to 90°C. This enzyme has 44%
identity with GH-57 branching enzyme ortholog, TT1467 protein, which was
isolated from Thermus thermophilus HB8. The crystal structure of TT1467 (PDB:
1UFA) was therefore used as the template for homology modelling to predict the 3D
structure of the T. kodakaraensis KOD1 branching enzyme. The results showed that
five residues (His10
, His145
, Trp270
, Trp407
and Trp416
) near the catalytic site were
conserved between the two models (Murakami et al., 2006).
© COPYRIG
HT UPM
9
Table 2. Glycoside hydrolase family 13 enzymes.
Enzyme EC number Main substrate
Amylosucrase EC: 2.4.1.4 Sucrose
Sucrose phosphorylase EC: 2.4.1.7 Sucrose
Glucan branching enzyme EC: 2.4.1.18 Starch, glycogen
Cyclomaltodextrin
glycosyltransferase
EC: 2.4.1.19 Starch
Amylomaltase EC: 2.4.1.25 Starch, glycogen
Maltopentaose-forming
alpha-amylase
EC: 3.2.1.- Starch
Alpha-amylase EC: 3.2.1.1 Starch
Oligo-1,6-glucosidase EC: 3.2.1.10 1,6-alpha-D-glucosidic linkages
in some oligosaccharides
Alpha-glucosidase EC: 3.2.1.20 Starch
Amylopullulanase EC: 3.2.1.41 Pullulan
Cyclomaltodextrinase EC: 3.2.1.54 Linear and cyclomaltodextrin
Isopullulanase EC: 3.2.1.57 Pullulan
Isoamylase EC: 3.2.1.68 Amylopectin
Maltotetraose-forming
alpha-amylase
EC: 3.2.1.60 Starch
Glucodextranase EC: 3.2.1.70 Starch
Trehalose-6-phosphate
hydrolase
EC: 3.2.1.93 Trehalose
Maltohexaose-forming
alpha-amylase
EC: 3.2.1.98 Starch
Maltogenic amylase EC: 3.2.1.133 Starch
Neopullulanase EC: 3.2.1.135 Pullulan
Malto-oligosyl trehalase
hydrolase
EC: 3.2.1.141 Trehalose
Malto-oligosyl trehalose
synthase
EC: 5.4.99.15 Maltose
(Source: Reddy et al., 2003)

© COPYRIG
HT UPM
10
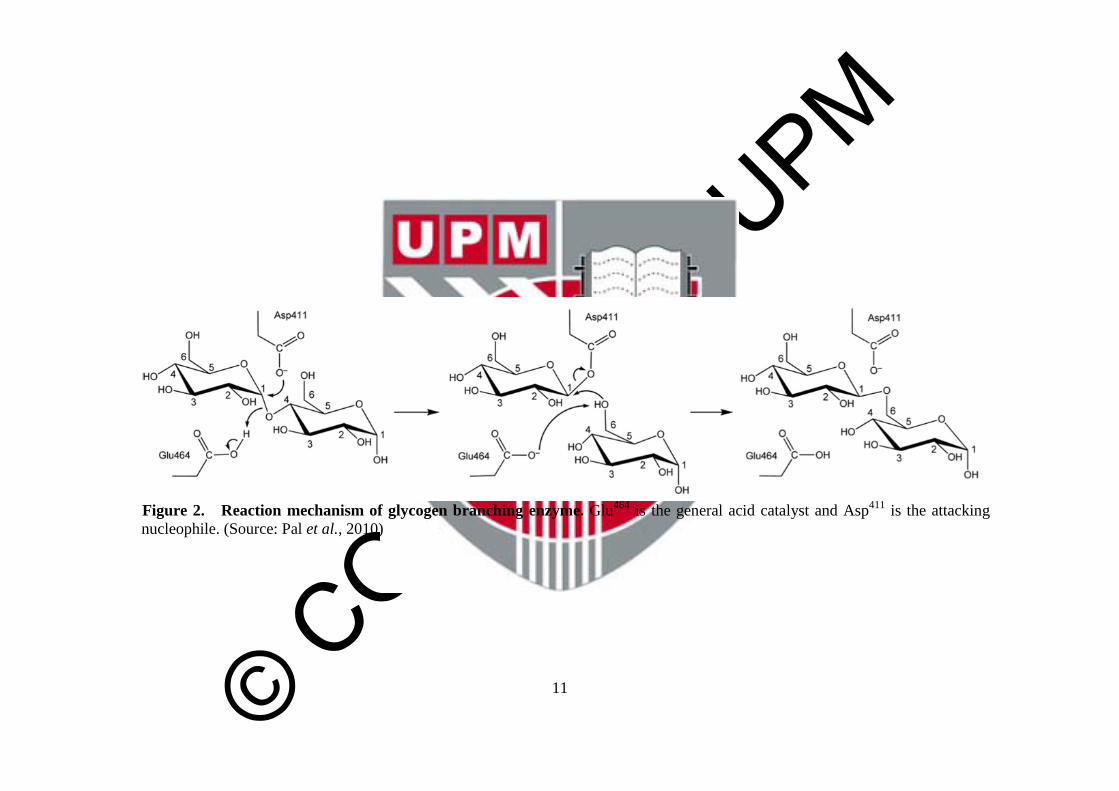
2.2.1 Mechanism of action of glycogen branching enzyme
Branching enzyme catalyses the reaction of transglycosylation where it transfers an
α-1,4 glycosidic linkage to α-1,6-glycosidic branch point during the glycogen and
starch synthesis. Pal et al. (2010) proposed that the glycogen branching enzyme
reaction is a two-step mechanism, namely, an amylase reaction and isomerisation. In
the amylase reaction, α-1,4 glycosidic linkage was broken and followed by
isomerisation reaction where a new α-1,6 glycosidic linkage was then formed (Figure
2). Both of the reactions are believed to occur in the same catalytic pocket. As shown
in Figure 2, Glu464
acts as a general acid catalyst to protonate approximately the 7th
glycosidic oxygen of an α-1,4 glycosidic linkage from a non-reducing end. This
happens during the amylase reaction. Following that, Asp411
, which acts as the
attacking nucleophile, forms a bond with C1 to creating a β-glucosyl-enzyme
intermediate. The substrate is then transferred to the hydroxyl group at C6 of a
glucose unit on the same or another chain to form the α-1,6 glycosidic linkage (Pal
et al., 2010).
Although made up of the same monomers, glycogen and starch molecules differ
slightly in their molecular structure. One of the reasons is believed due to the
differences between GBE and SBE in their substrate preferences primarily due to the
specificity for the substrate chain length (Guan et al., 1997). Substrate chain length
is the minimum length of glucan chain used by branching enzymes for the
transglycosylation process. GBE favoured short chain length (5 to 16 glucans) to
form the branches. As for SBE, there are two types, SBEI and SBEII. SBEI mainly
transfer long chains (larger than 10 glucans) and takes up amylose as the substrate.
© COPYRIG
HT UPM
11
Figure 2. Reaction mechanism of glycogen branching enzyme. Glu
464 is the general acid catalyst and Asp
411 is the attacking
nucleophile. (Source: Pal et al., 2010)

© COPYRIG
HT UPM
12
On the other hand, SBEII predominantly transfers short chains (three to nine glucans)
and therefore using amylopectin as the substrate (Guan et al., 1997). The substrate
chain length preference by those enzymes causes glycogen to have more branches
than starch (Sasangka et al., 2002). That is why branching enzyme is essential in
determining the structure of glycogen and starch. The significance of those branches
is that they increase the number of non-reducing ends, which make the branched
polysaccharides more soluble and easier to be absorbed by the cells and thus
accelerate the synthesis and digestion of the polysaccharides (Abad et al., 2002).
2.2.2 Thermostable glycogen branching enzyme
Microorganisms live almost anywhere on earth and that includes even the most
extreme places that no other organism can survive. Those microorganisms that
tolerate extreme environment are called extremophiles. These organisms can adapt in
various milieus where temperature, pH, salinity and pressure are extreme
(van den Burg, 2003). One of the reasons these organisms are able to adapt harsh
conditions is because their proteins are stable and functional in those conditions
(Demirjian et al., 2001). Therefore, extremophiles can be a valuable source for novel
enzymes that can withstand the extreme reaction conditions in industrial processing
(van den Burg, 2003).
Among all extremophiles, research society is mostly interested in thermophiles (van
den Burg, 2003; Fujiwara, 2002). Thermophiles are microorganisms that live in high
temperature. Thermophiles normally grow between 65°C to 80°C while moderate
thermophiles can grow in temperature between 45°C to 65°C, and microorganisms

© COPYRIG
HT UPM
13
that can live in temperature beyond 80°C are considered as hyperthermophiles
(Demirjian et al., 2001; Madigan and Marrs, 1997). These thermophiles are mostly
isolated from hot springs and hydrothermal vents (Madigan and Marrs, 1997).
Enzymes produced by thermophiles would tolerate high temperature and thus are
referred to as thermostable enzymes. Thermostable enzymes that are active at high
temperature are very useful in industrial applications because reactions at high
temperature would help with the mixing process and substrate solubilisation, with
less risk of reaction contamination (Turner et al., 2007). In addition, they have long
shelf life in room temperature. Thermostable enzymes are widely applied in
industries like chemical, food, beverages, pharmaceutical, paper and textile
(Fujiwara, 2002). Thermostable enzymes that are used in these industries are, for
example, amylases, glycosidases, lipases, xylanases, proteases and DNA
polymerases (Fujiwara, 2002; Schiraldi and De Rosa, 2002; Demirjian et al., 2001).
In the eyes of consumers, enzymes usage is more preferred than chemical catalysts as
enzymes are nature products and so is believed to be less harmful (Turner et al.,
2007; van der Maarel et al., 2002).
Quite a number of studies have been done to discover thermostable branching
enzyme. Takata et al. (1994) claimed to be the first to purify a thermostable
branching enzyme, which is from Geobacillus stearothermophilus that have the
optimum temperature at 50°C. GBE that is stable at highest temperature was isolated
form Aquifex aeolicus (van der Maarel et al., 2003). This bacteria, which was found
near underwater volcanoes have the optimum temperature for activity at 80°C and
stable up to 90°C (van der Maarel et al., 2003). Other than bacteria, thermostable
GBE was also isolated from hyperthermophilic archaeon, which was from

© COPYRIG
HT UPM
14
T. kodakaraensis KOD1 (Murakami et al., 2006). This enzyme showed an optimal
temperature of 70°C and also stable up to 90°C (Murakami et al., 2006). Some other
potential candidates with high enzyme optimum temperatures that researchers have
focused on were Anaerobranca gottschalkii (Thiemann et al., 2006) and
Rhodothermus obamensis (Shinohara et al., 2001). The optimum temperatures for
the GBE activity from those microorganisms are at 50°C and 65°C (Thiemann et al.,
2006; Shinohara et al., 2001).
For this research, GBE was isolated form Geobacillus sp. Geo5 genome. As in the
name, “Geobacillus” means earth or soil bacillus (Nazina et al., 2001). Geobacillus
sp., which is also known as thermophilic bacilli is an obligate thermophile that grows
in temperature range between 37°C to 75°C and the optimum temperature for growth
is around 55°C to 65°C (Nazina et al., 2001; Zeigler, 2001). Since the bacteria form
endospores, therefore, the bacteria are still able to survive in temperature out of that
range and in adverse conditions, although not rapidly (Marchant and Banat, 2010;
Marchant, et al., 2008). The vegetative cells are rod-shaped that occur either singly
or in short chains and the cell wall is generally Gram-positive (Nazina et al., 2001).
Geobacillus sp. Geo5 used in this research was sampled from Sungai Klah Hot
Springs, Sungkai, Perak. The bacterium was sampled at 97°C, therefore the GBE
isolated was postulated to be thermostable and active at high temperature.
2.2.3 Applications of glycogen branching enzyme
Glycogen branching enzyme is mainly applied in food and beverages processing
industries and also in nutraceutical industries. Studies have been done to utilise this

© COPYRIG
HT UPM
15
enzyme either in vivo or in vitro in order to boost up the quality of starchy food by
increasing the branches in starch molecules (Lee et al., 2008; Kim et al., 2005;
Kawabata et al., 2002; Kortstee et al., 1996).
Plants, which use starch as the main storage of carbohydrate, would have starch
branching enzyme. However, to further increase the branching in the starch structure,
GBE gene from bacteria was introduced into the plants. Starch producing crops, such
as potato and rice, were targeted for the research to construct transgenic plants as an
approach to enhance our food source. For example, Kortstee et al. (1996) has studied
the expression of E. coli glycogen branching enzyme in potatoes. A decade after that,
Kim et al. (2005) modified rice plant by inserting multiple copies of GBE gene from
E. coli so that the rice starch would have elevated degree of branching. GBE would
increase the degree of branching in starch by producing many short branches that
made up of 5 to 16 glucans. Compared to the wild-type plants, the genetically
engineered plants showed lower gelatinise temperature, thus minimised the chances
of retrogradation and therefore hold a potential to boost up nutritional value in those
crops (Kim et al., 2005). Retrogradation happens when gelatinised starch is cooled
down and so the molecules rearrange themselves into a more crystalline structure
forming a stiff gel as water is expelled from the structure. Retrograded starch, which
often causes faulty food products like bread staling and loss of viscosity in sauces
and soups, is hard to digest by our system (van der Maarel et al., 2002). As Malaysia
is a rice producer, therefore this kind of research would gain the interest of local
researchers as the research and technology of transgenic crops may be more develop
in this country in near future.

© COPYRIG
HT UPM
16
Rather than doing starch modification in vivo by producing transgenic crop that
expressed GBE, highly branched starch was also produced by treating the starch with
GBE. One example is the treatment of waxy corn starch with GBE isolated from a
type of mould, Neurospora crassa (Kawabata et al., 2002). The result showed that
GBE changed the molecular structure of the corn starch and the highly branched
starched produced showed low tendency of retrogradation (Kawabata et al., 2002). A
similar research to this was done by Lee et al. (2008) where rice starch was modified
to be highly branched by enzymatic reactions using GBE in addition to another
enzyme, maltogenic amylase.
Another application of branching enzyme in industry is the manufacturing of a
compound called highly branched cyclodextrin. Cyclodexterin is another name for
cyclic α-1,4-glucans, a compound results mainly from the reaction of cyclodextrin
glucanotransferase (EC2.4.1.19). Terada et al. (1997) reported that other than
cyclodextrin glucanotransferase, a thermostable GBE from G. stearothermophilus
that have optimum temperature for enzyme activity of 50°C, can also catalyse the
formation of this branched cyclic glucans by introducing intramolecular
transglycosylation when amylose and amylopectin were used as the substrate. The
properties of cyclodextrin that makes it favourable in starch processing are that it is
highly soluble in water, low viscosity and also low tendency for retrogradation
(Takata et al., 1996). A Japan company, Glico, used branching enzyme from Bacillus
strearothermophilus to produce cyclodextrin with a trade name of Cluster Dextrin.
This product is used as an ingredient in sports drinks, to enhance the taste of food
and also as a spray-drying aid (Takata et al., 2010).

© COPYRIG
HT UPM
17
Other than those mentioned above, there are several other applications of GBE that
have been patented. Those patents describe that branching enzymes potentially can
be used of in bread as an anti-staling agent, produce low viscosity and high
molecular weight starch, use for paper coating and even warp sizing textile fibers to
make the fibers stronger (van der Maarel et al., 2001). Studies of GBE is also
emerging into therapeutics application, for example, against tuberculosis and
glycogen branching enzyme deficiency disease (Pal et al., 2010; Garg et al., 2007;
Bruno et al., 1993).
2.3 Genome mining
Genome mining is a term given to a technique that uses basic bioinformatic tools and
databases to search for genes with a specific function, such as enzymes, natural
products and metabolites, from genome sequences of numerous kinds of organisms
(Challis, 2008; Banskota et al., 2006; Ferrer et al., 2005; Berger, 2004). This
technique exploits the readily accessible public databases that stores gene and
genome sequences, for example, Genbank at the National Center for Biotechnology
Information (http://www.ncbi.nlm.nih.gov), UCSC Genome Browser
(http://genome.ucsc.edu) and Ensembl Genome Browser (http://www.ensembl.org)
(Schattner, 2009; Corre and Challis, 2007).
Examples of enzymes that were discovered by genome mining are a thermostable
Baeyer–Villiger monooxygenase from the genome of a thermophilic actinomycete,
Thermobifida fusca and mandelonitrile hydrolase bll6402 from Bradyrhizobium
japonicum USDA110 (Zhu et al., 2007; Fraaije et al., 2004). Genome mining too has

© COPYRIG
HT UPM
18
been applied to discover novel natural products, for example, the isolation of
orfamide A, a novel cyclic lipopeptide that involves in biological control of plant
disease from Pseudomonas fluorescens Pf-5 and an antifungal agent, ECO-02301
from Streptomyces aizunensis (Loper and Gross, 2007; McAlpine et al., 2005).
Another example where genome mining was used is the discovery of novel
prenylated quinolin-2-one alkaloids, a mebolite that involves in a rare
benzodiazepine–quinolinone pathway from Aspergillus nidulans (Scherlach and
Hertweck, 2007).
In this research, genome mining technique was utilised where GBE was mined from
the genome sequence of Geobacillus sp. Geo5 elucidated by MGI together with
genome sequences from other Geobacillus sp. using glgB sequences from other
bacteria species and bioinformatic tools like ClustalW and BLAST. Other genome
sequences of Geobacillus sp. that are available to date according to GenBank are
from Geobacillus sp. Y412MC61 (NC_013411), Geobacillus sp. C56-T3
(NC_014206), Geobacillus sp. Y412MC52 (NC_014915), Geobacillus sp. Y4.1MC1
(NC_014650), Geobacillus sp. WCH70 (NC_012793), Geobacillus
thermoglucosidasius (NC_015660), Geobacillus kaustophilus (NC_006510),
Geobacillus thermodenitrificans NG80-2 (NC_009328) and Geobacillus
thermoleovorans (NC_016593). The availability of these genome sequences would
facilitate the isolation of GBE by genome mining.
One of the main objectives of doing genome mining is to determine the function of
the gene of interest, may it be an enzyme, a metabolite or a natural product with drug
properties like antifungal, antibacterial or antitumor. Genome mining will provide

© COPYRIG
HT UPM
19
the sequence for the gene of interest. From the sequence, the function of the protein
can be predicted by two approaches, namely, sequence alignment and sequence-
motif methods using tools like Prosite, Blocks, Prints and Emotif (Skolnick and
Fetrow, 2000). However, protein function prediction using only sequence-based
methods is insufficient, especially when the proteins have a tendency to be
multifunctional. Therefore, functional prediction techniques that use protein
sequence in combination with structural information have been successfully
developed (Skolnick and Fetrow, 2000).
2.4 Structural studies of glycogen branching enzyme
Structural study of an enzyme is very important. There are a lot of information about
the enzyme can be known by studying its structure. From the structure of an enzyme,
we can know about the function and the reaction mechanism, the characteristics and
also the substrate preference. Using that knowledge as a platform, further studies can
be done on the enzyme to improve the enzyme activity and stability and also to
explore on substrate promiscuity. These can be achieved by doing enzyme
modifications either via rational design that uses site directed mutagenesis technique,
or directed evolution by performing random mutagenesis to the enzyme. It can be
said that the structural studies of branching enzymes are just emerging. Up until now
the crystal structures deposited in Protein Databank (PDB) for branching enzymes
come from only four species. Two of the structures are glycogen branching enzymes
from GH-13 family, isolated from Escherichia coli and Mycobacterium tuberculosis,
and two other structures are branching enzymes from GH-57 family, which were
isolated from T. thermophiles and T. kodakaraensis KOD1 (Palomo et al., 2011;
© COPYRIG
HT UPM
20
Santos et al., 2011; Pal et al., 2010; Abad et al., 2002). The availability of these
crystal structures would rapidly expand the knowledge on this enzyme. These
structures would also help to improve the accuracy in structural predictions of GBEs
from other sources as they can be use as the template for the structure determination.
2.4.1 Crystal structures of branching enzymes
The first crystal structure of branching enzyme reported was GBE from E. coli. The
crystal structure that was reported by Hilden et al. (2000) however was not deposited
in Protein Databank (PDB) because the X-ray diffraction data was not adequate for
X-ray structure determination as the resolution achieved was only 4.1 Å. The first X-
ray structure of GBE deposited in PDB was by Abad et al. (2002), which was also a
GBE from E. coli (PDB ID: 1M7X). However that crystal structure was not from a
full-length enzyme, it was in fact missing the first 113 amino acids (Abad et al.,
2002). This is because when compared to a full length enzyme, the truncated enzyme
was able to overexpress more amount of soluble protein that are active at protein
concentration above 1 mg/mL and therefore has let the diffracting crystals of the
enzyme to be produced (Hilden et al., 2000).
The resolution of the branching enzyme structure (PDB ID: 1M7X) is 2.3 Å. It
consists of three major domains; the N-terminal, C-terminal and central α/β-barrel
domain, which locates the catalytic residues; Asp405
, Asp526
and Glu458
(Figure 3)
(Abad et al., 2002). N-terminal domain that consists of 128 amino acid residues is
organised into seven stranded β-sandwich fold, while the C-terminal, which is made
up of 116 amino acid residues is arranged into seven β-strands (Abad et al., 2002).

© COPYRIG
HT UPM
21
Figure 3. X-ray crystal structure of truncated Escherichia coli branching
enzyme. PDB ID: 1M7X. The resolution is 2.3 Å. Red indicates the N-terminal
domain; orange indicates the central α/β-barrel catalytic domain; and blue indicates
the C-terminal domain. (Source: Abad et al., 2002).

© COPYRIG
HT UPM
22
Studies on the enzyme with truncated N-terminal domain has proven that this domain
determines the length of glucan chain transferred to form a branch, while the C-
terminal domain plays a role in substrate preference and specificity (Devillers et al.,
2003; Binderup et al., 2002). The central α/β-barrel domain have a dimension of 30.5
x 17.7 x 17.7 Å acts as a cavity to accommodate and bind branched glucose chains
during the enzymatic reaction (Abad et al., 2002). This cavity surface is
electronegative as it harbours four negatively charged amino acids, Asp335
, Asp405
,
Asp526
and Glu458
, which are involved in sugar-protein interaction during the
substrate binding and catalysis (Abad et al., 2002).
Another structure of GBE from GH-13 family was from M. tuberculosis. Pal et al.
(2010) reported a full-length crystal structure of the enzyme with the resolution of
2.33Å (PDB ID: 3K1D). The structure consists of four domains; the N1 β-sandwich,
N2 β-sandwich, a central α/β-barrel domain and a C-terminal β-sandwich (Figure 4),
the structure showed good homology when compared with GBE structure from E.
coli (Pal et al., 2010). Apart from a few insertions and deletions in both E. coli and
M. tuberculosis GBE sequences, the E. coli crystal structure does not have the N1
domain in the N-terminal, which involves in substrate specificity, recognition and
binding.
T. thermophilus and T. kodakaraensis KOD1 produce GH-57 famlily branching
enzyme, which has a completely different structure from branching enzyme of GH-
13 family. The reported crystal structure from T. thermophilus (PDB ID: 3P0B) and
T. kodakaraensis KOD1 (PDB ID: 3N8T) have a resolution of 1.35 Å and 2.4 Å,
respectively (Palomo et al., 2011; Santos et al., 2011). The structure shows

© COPYRIG
HT UPM
23
Figure 4. X-ray crystal structure of Mycobacterium tuberculosis branching
enzyme. PDB ID: 3K1D. The four domains, N1 β-sandwich, N2 β-sandwich, α/β-
barrel and C-terminal β-sandwich, were labelled. (Source: Pal et al., 2010)
© COPYRIG
HT UPM
24
that N-terminal domain of the enzyme has a distorted α/β-barrel domain A with an
inserted domain B between β2 and α5 while the C-terminal domain made up of five
α-helices (Figure 5) (Palomo et al., 2011; Santos et al., 2011). The active site is made
up of three loops, which are located in the N-terminal domain and next to the C-
terminal domain, which creates the entrance to the active site. The C-terminal has
shown to be necessary for substrate binding and catalysis. Even though the GH-57
GBE has the same catalytic mechanism as GH-13 GBE, the differences are that GH-
57 GBE produces less branching points and makes shorter branches, therefore the
structure of the product is slightly different (Palomo et al., 2011).
2.4.2 Protein structure prediction
Protein structure prediction now becomes a very useful method to discover
information on protein of interest. This technique has been used to study proteins
since two decades ago. Some of the examples where structural prediction has been
applied are as follows. Structural prediction has been used to test theories on the
function of the protein by designing mutants. Wu et al., (1999) did site-directed
mutagenesis to change one particular amino acid selected based on the predicted
structure in order to convert lactate dehydrogenase from Trichomonas vaginalis to
malate dehydrogenase. Structural prediction has also been used to identify active
sites and to study on substrate specificity of many proteins including branching
enzyme and α-amylase (Kuriki and Imanaka, 1999; Kuriki et al., 1996; Jespersen et
al., 1993). The study done by Ring et al. (1993) used structural prediction to
determine the binding site of ligands for serine and cysteine proteases, where they
identified the previously unknown inhibitors from protease family enzymes to

© COPYRIG
HT UPM
25
Figure 5. X-ray crystal structure of Thermus thermophilus branching enzyme.
The catalytic residues are shown in stick representation. Domain A: purple with core
β-strands in red and additional β-strands in orange; domain B: blue; domain C: green.
(Source: Palomo et al., 2011)

© COPYRIG
HT UPM
26
develop antiparasitic agents for drug-designing experiment. Also, structural
prediction could assist in molecular replacement in X-ray structure and to justify
known experimental observations, as in the experiment done on the determination of
δ’ subunit of the clamp-loader complex of E. coli DNA polymerase III (Marti-
Renom et al., 2000; Guenther et al., 1997).
Protein structure prediction is very suitable for those who cannot afford to generate
protein crystals due to the limitations on expertise or expenses (Baker and Sali,
2001). Although the possibility of inter-atomic interactions of polypeptide chains of
a protein are millions, the basis of protein folding may not be as complex as expected
and therefore new methods and advances in computer algorithms have shown great
promise in predicting protein folding mechanisms, 3D structures and protein
functions (Roy et al., 2010; Baker, 2000). There are three methods to do
computational modelling of protein structure; comparative modelling, threading
methods and ab initio modelling. The method to be used is selected based on the
availability of known protein structures that are related to the protein of interest in
the PDB library. Four basic steps are use to model a protein structure from its amino
acid sequence. The steps are finding templates, aligning the sequence with the
templates, constructing a model and finally assessing the model (Baker and Sali,
2001).
The accuracy of a protein model built is correlated to the percentage of sequence
identity between template and query (Figure 6) (Baker and Sali, 2001). Comparative
modelling is used when evolutionary related homologous protein template is
accessible and this method often generates high-resolution models (Roy et al., 2010;

© COPYRIG
HT UPM
27
Figure 6. Accuracy and applications of protein models. Shown are the methods to
produce protein structures, the corresponding accuracy of protein structure models
and their applications. Predicted structures are in red and actual structures are in blue.
The sequence identity of samples to their template structures are about 60% for A,
40% for B, and 30% for C. D and E are examples of Rosetta de novo structure
predictions for the CASP4 structure prediction experiment. (Source: Baker and Sali,
2001)

© COPYRIG
HT UPM
28
Marti-Renom et al., 2000). If the protein of interest comes from a different
evolutionary origin, threading method will generate protein models by matching the
query protein sequence with similar protein folds of other proteins that are in the
PDB library (Roy et al., 2010; Zhang, 2008). For proteins that are not structurally
related to any of solved protein structures in PDB library, the model has to be built
from scratch and this is called de novo or ab initio modelling (Wu et al., 2007).
According to the 7th
Critical Assessment of Structure Prediction (CASP), the
designed experiments that assess the latest method of protein structure prediction,
Iterative Threading Assembly Refinement (I-TASSER) was ranked as the best
automated structure prediction among other servers (Zhang, 2008). This server,
which is available online at http://zhang.bioinformatics.ku.edu/I-TASSER, is very
suitable for non-experts to construct structural models of their protein of interest. I-
TASSER server provides free service to generate 3D structure of a protein from an
amino acid sequence provided by the user using multiple threading alignments and
iterative structural assembly simulations (Roy et al., 2010; Zhang, 2009; Zhang,
2008). It is highly recommended that the results from structural prediction are
evaluated and verified using softwares like PROCHECK, Verify3D and PROSAII to
ensure the accuracy and reliability of the predicted structures (Laskowski et al.,
1993; Sippl, 1993; Luthy et al., 1992). Other than providing 3D atomic models of a
protein, I-TASSER also does functional prediction and provides amino acid sequence
that involves in the binding site for that particular protein.
© COPYRIG
HT UPM
29
2.5 Lab-scale production of GBE in Escherichia coli expression system
Application in industries requires the enzyme to be produce in abundance. Mass
production of enzyme can be achieved by optimizing the lab-scale fermentation and
then scaled up the production to industrial size. Almost all lab-scale productions of
enzymes use recombinant DNA technology and heterologous protein expression
(Makrides, 1996; Hanahan et al., 1991; Hanahan, 1983). In order to use recombinant
DNA, the gene of the enzyme has first to be identified and then isolated from the
chromosomal DNA by polymerase chain reaction (PCR). The isolated gene is then
ligated to a plasmid vector and transformed into a microbial host to express the gene.
There are various options of plasmid vectors and hosts can be used depending on the
protein expression strategies. Those vectors and hosts are commercially available
although some researchers preferred to construct those themselves for novelty
especially when they require extra or special features (Hanahan et al., 1991;
Hanahan, 1983).
It is safe to say that bacterial system, especially E. coli, is the most favoured cloning
and expression host for recombinant DNA for heterologous protein expression. The
reasons for this are due to the ability of E. coli to grow rapidly on economical
substrates and they are able to host and express foreign DNA even of complex
eukaryotic proteins. On top of that, having a small genome, E. coli genetic is so well
characterised than any other microorganisms and therefore a variation of cloning
vectors and mutant host strains are largely available (Baneyx, 1999). The current
knowledge of transcription, translation and protein folding mechanisms of E. coli,

© COPYRIG
HT UPM
30
together with new and improved genetic tools and databases are making this
bacterium more precious than ever.
E. coli has been used to clone and express GBE from many other organisms. One of
many examples is the GBE isolated from G. stearothermophilus, which had an
optimum temperature for enzyme activity of 50°C (Takata et al., 1994). Research
done by Murakami et al. (2006) discovered a novel branching enzyme from GH-57
family in the hyperthermophilic archaeon T. kodakaraensis KOD1. In order to study
the enzyme, they cloned and expressed the enzyme in E. coli DH5α and E. coli
BL21-CodonPlus (DE3), respectively. Another example is the cloning and
expression of GBE from M. tuberculosis in E. coli DH5α and E. coli BL21 (DE3),
respectively (Garg et al., 2007).
Although E. coli system was generally used to express GBE, other bacterial systems
were also used to express GBE. For example, Thiemann et al. (2006) expressed a
novel branching enzyme from the thermoalkaliphilic anaerobic bacterium A.
gottschalkii in Staphylococus caenosus. Another example is the expression of
branching enzyme from cyanobacterium Synechococcus sp. PCC7942 in Bacillus
subtilis (Kiel, 1990). On top of all, there is no limitation or a standard procedure for
choosing the cloning and expression vectors and hosts. It all depends on the strategy
and creativity of the researchers to produce the expected outcome.
© COPYRIG
HT UPM
31
2.5.1 Cloning of PCR product
To clone a gene into bacterial system, the gene sequence has first to be isolated from
the chromosomal genome using PCR. PCR is a technique used to generate thousands
to millions copies of a specific DNA sequence. This technique was developed by
Kary Mulkis in 1983 (Bartlett and Stirling, 2003). This PCR product, which encodes
the gene of interest, will then be ligated into a cloning vector, which is a plasmid
DNA. Depending on the DNA polymerase used, the PCR product will have either
blunt ends or with A overhangs. These features are utilised in the cloning of the PCR
product into the plasmid vector like in blunt end cloning, TA cloning, directional
cloning or cloning using restriction enzymes. The PCR product will be integrated
into cloning vector by using either DNA ligase or DNA topoisomerase I (Cheng and
Shuman, 2000).
2.5.2 Transformation of Escherichia coli with plasmid
Transformation is a process where the bacteria take up and establish exogenous DNA
stably in their system. In the context of recombinant DNA, it is the uptake of
recombinant plasmid by the cloning and expression host, E. coli. The efficiency of
the transformation depends on two major parameters, the method used to induce the
competency of the host cells and the genetic constitution of the host strain.
Competence is defined as the ability to identify and transfer DNA material into cells.
The cells competency can be induced in two ways, chemical induction and
electroporation, depends on the characteristic of the cells being transformed and the
purpose of the transformation (Hanahan et al., 1991). The transformation efficiency

© COPYRIG
HT UPM
32
is not affected by the presence of multiple plasmids or the conformation of the
plasmids, either relaxed or supercoiled. However, the efficiency of transformation
declines when size of plasmid increases (Hanahan, 1983).
2.5.3 Expression of recombinant protein
Gene cloning is done mainly to express the gene of interest, which will produce the
recombinant protein. Exogenous gene expression in the expression host is not always
a success. Although E. coli is known to give high level expression of recombinant
protein, this organism does not promise that every recombinant proteins can be
expressed efficiently. Expression level is very much affected by cell growth
characteristics of the host, composition of the gene sequence, post-translational
modifications, protein folding, proteases produced by the host, major differences in
codon usage and the effect of toxic recombinant protein on host (Makrides, 1996).
Therefore, the selection of expression system is very critical in order to ensure high
expression level of the recombinant protein.
Apart of expression level, solubility of the expressed protein must also be
considered. When the recombinant protein is over-expressed, the host would triggers
stress response, which often cause the protein produced to aggregates as inclusion
bodies. This phenomenon is not desired as when the protein is in the form of
inclusion bodies, the folding of the protein in not precise, hence the protein is not
functional (Villaverde and Cario, 2003). When the recombinant protein is expressed
in E. coli, the parameters that affect the protein solubility are the aeration of the
culture media, culture temperature, E. coli strains and the timing of induction

© COPYRIG
HT UPM
33
(Berrow et al., 2006). That is why the researchers have to optimise those parameters
in order to achieve not only high level of expression but also high level of soluble
proteins.
2.5.4 Secretory expression of recombinant protein
The secretion of proteins into the culture medium has advantages especially when
heterologous recombinant proteins have to be isolated from Gram-negative bacteria
like E. coli. Secretion of target protein into culture medium would facilitate protein
purification as there would be less of contaminating bacterial proteins in the medium.
Other than that, proteolytic activity is lesser as the proteinases presence is fewer in
the culture medium, which provides a better folding environment for the protein
(Ni and Chen, 2009).
One way to release heterelogous proteins from E. coli periplasm and cytoplasm is by
using bacteriocin release protein (BRP). BRP is a small lipoprotein made up of only
28 amino acids, synthesised with a signal peptide to transport bacteriocin across the
cell. The presence of BRP together with phospholipase A will cause the release of
bacteriocin, a toxin that kills bacteria by increasing the permeability of inner and
outer membrane of the bacteria (van der Wal et al., 1995). Utilising the ability to
increase cell permeability, studies has shown that BRP expression is capable to
promote the leakage of heterologous protein from both E. coli periplasm and
cytoplasm into the culture medium (Lloubes et al., 1993).
© COPYRIG
HT UPM
34
BRP-mediated protein release is done by co-transforming the plasmid that encodes
for BRP into host cells that are harbouring the recombinant plasmid, which encodes
for the protein of interest. Both BRP plasmid and recombinant plasmid can be
expressed in the same host by using either the same inducer or different inducers,
depending on the promoter of those plasmids. Nonetheless, high expression of BRP
will lyse the cells. This effect, quasi-lysis and lethality, can be seen in liquid cultures
and in agar plates as well (van der Wal et al., 1998). Therefore the amount of BPR
produced has to be controlled wisely.
2.6 Purification of recombinant protein
There are various ways to isolate the expressed recombinant protein from other
proteins that are naturally produced by the host cells. To purely obtain the
recombinant protein, affinity-tagged fusion protein expression systems are often
chose because these systems offer a very simple and convenient method to purify the
recombinant protein by using affinity chromatography. Some of the advantages of
these affinity-tagged systems include adsorption purification from just a single step,
have insignificant effects on tertiary structure as well as biological activity, easy and
precise removal of the tag to get the native protein, simple and accurate assay for the
fusion recombinant protein detection and finally adaptable by different types of
proteins (Terpe, 2003). There are many tags to choose from like HIS, CBP, CYD,
FLAG, Strep II and MBP. The yield and purity achieved using this tags varies
depend on the characteristics of the tags, such as, the binding capacity and
specificity, and the source of the protein to be purified (Arnau et al., 2005; Litchi et
al., 2005).

© COPYRIG
HT UPM
35
Mainly, protein purification consists of a primary isolation process followed by
clarification or cleaning up. Isolation of intracellular protein involves harvesting,
breaking the cell pellet, removing cell debris and finally applying the enzymes to the
chromatography systems (Amersham Pharmacia Biotech, 1999). Co-expression of
BRP secretes out recombinant protein into the culture medium and therefore, the
protein harvested is in the supernatant instead of the cell pellet. The protein has first
to be concentrated by ammonium sulphate precipitation, ultrafiltration or extraction
using organic solvents (Saxena et al., 2003). The objectives of this isolation step are
to rapidly remove proteases that might degrade the protein, to remove impurities and
particles that may affect the following chromatographic purification steps and also to
concentrate the protein sample (Jonasson et al., 2002).
However, if higher protein purity is required, for example, in pharmaceuticals
(>99%) and protein crystallization (95-99%), a single chromatography step is often
not sufficient. Following the first affinity chromatography, an intermediate
purification step and polishing step have to be done so that the remaining impurities
are totally removed. Frequently used methods for these steps are ion-exchange
chromatography, hydrophobic interaction chromatography, size-exclusion
chromatography and reversed phase chromatography (Jonasson et al., 2002).
© COPYRIG
HT UPM
36
CHAPTER 3
MATERIALS AND METHODS
3.1 Materials
The chemicals and solutions used in this project are listed down in Appendix A.
3.2 Genome mining
The genome sequence of Geobacillus sp. Geo5 used in this research was contributed
by Malaysia Genome Institute (MGI). MGI has started the Whole Genome
Sequencing Project of Geobacillus sp. Geo5 in the year 2007. The genome sequence
consists of contiguous sequences that were not yet assembled and annotated. These
sequences were then used to create the database for local BLAST using BioEdit
software. Known glgB nucleotide sequences from other Geobacillus sp. were
obtained from GenBank (www.ncbi.nlm.nih.gov/genbank/ ) and were used in
sequence alignment softwares, local BLAST and ClustalW, to locate the position of
the open reading frame (ORF) of glgB in the Geobacillus sp. Geo5 genome. glgB
sequences of Geobacillus sp. obtained from GenBank that were used are as follows:
Bacillus sp. NBRC 15315 (AB294568)
Geobacillus stearothermophilus (M35089)
Geobacillus sp. Y412MC10 (YP003251719)
Geobacillus sp. Y412MC61 (CP001794)
Geobacillus thermodenitrificans NG80-2 (NC_009328)

© COPYRIG
HT UPM
37
3.3 Enzyme structure prediction
Once the nucleotide sequence of the gene was obtained, the nucleotide sequence was
translated into amino acid sequence using BioEdit and confirmed with ExPaSy
Translate tool (http://expasy.org/tools/dna.html). The amino acid sequence of the
enzyme was then submitted to I-TASSER server at
http://zhanglab.ccmb.med.umich.edu/I-TASSER/ to predict the 3D structure of the
enzyme. I-TASSER built 3D models based on multiple-threading alignments of
secondary structure called Profile-Profile Threading Alignment (PPA) and iterative
implementation of the Threading Assembly Refinement (TASSER) program (Zhang,
2008). Other than structural prediction, I-TASSER also predicted Enzyme
Classification (EC) number, the amino acids in the binding site of the enzyme and
the function of the protein by matching the predicted models with protein function
databases. The predicted models of the enzyme were then evaluated using
PROCHECK to determine the stereochemistry of the structures and results are
presented in Ramachandran plots (Laskowski et al., 1993). Using visualisation tool,
PyMOL, the position of conserved amino acids that involve in the catalysis were
located in the predicted model.
3.4 Culturing Geobacillus sp. Geo5
The glycerol stock of Geobacillus sp. Geo5 was acquired from MGI. From the
glycerol stock, a loop was streaked onto thermus agar plate and nutrient agar plate.
The plates were incubated at 70°C for 18 hours. To avoid the plates from drying out
when incubated at such high temperature, the inoculated plates were sealed in a

© COPYRIG
HT UPM
38
plastic bag during the incubation. After incubation, an isolated single colony was
picked and inoculated into 10 mL thermus broth and nutrient broth. The culture was
incubated at 60°C with 250 rpm shaking, for 18 hours, in INFORS HP (Ecotron)
incubator shaker. Although Geobacillus sp. Geo5 was isolated at 97°C, the
experiment done by MGI showed that the optimum temperature for growing this
bacterium in laboratory was at 60°C.
3.4.1 Thermus broth preparation
Thermus broth comprised of 0.4% yeast extract, 0.8% peptone and 0.2% NaCl. Broth
was aliquoted (10 mL) into universal bottles and autoclaved at 121°C for 20 minutes
to sterilise (Yurieva et al., 1997).
3.4.2 Thermus agar preparation
Thermus agar comprised of 0.4% yeast extract, 0.8% peptone and 0.2% NaCl and
3% bacteriological agar (Yurieva et al., 1997). The agar mixture was autoclaved at
121°C for 20 minutes. Sterilised agar was poured into sterile petri dishes.
3.5 Genomic DNA extraction of Geobacillus sp. Geo5
A single colony of the bacterium was inoculated into 10 mL of thermus broth in
universal bottle and incubated at 60°C with 250 rpm shaking, for 18 hours, in
INFORS HP (Ecotron) incubator shaker. The cell culture (3mL) was centrifuged at
10,000 × g for 10 minutes. The cell pellet was subjected to purification procedure.

© COPYRIG
HT UPM
39
Genomic DNA from Geobacillus sp. Geo5 was extracted using Qiagen DNeasy®
Blood and Tissue Kit according to the manufacturer’s instructions. The DNA
concentration was determined by measuring the optical density at A260. The purified
DNA solution was kept at -20°C.
3.6 Polymerase chain reaction of glgB
glgB from Geobacillus sp. Geo5 were amplified using PCR. PCR primers, F1 (5’–
ATG CGA TCC AGC TTG ATT GC– 3’) and R1 (5’–TCA ATG ATC CGG TAC
TTC CC– 3’), were designed starting from the start codon until the stop codon of the
open reading frame (ORF) based on the result from genome mining.
Amplification process was carried out in a reaction mixture containing 20-50 ng
DNA template, 0.2 μM forward and reverse primers, 0.2 mM dNTP mix, 1.2 U Pfu
DNA polymerase and 1× Pfu Buffer with MgSO4 (Roux, 1995). The genes were
amplified using a thermocycler (MyCyclerTM
, BioRad) with the temperature program
of predenaturation at 95°C for 5 minutes; 35 cycles of 30 seconds denaturation at
95°C, 30 seconds annealing at 57°C and 4 minutes extension at 72°C; followed by
final elongation step at 72°C for 7 minutes and hold at 10°C. Detection of PCR
product was carried out by gel electrophoresis, where 3 μL of PCR product was run
in agarose gel electrophoresis (1% (w/v) agarose gel stained with GelRedTM
(Biotium), run at 100 volts for 35 minutes) and visualised under UV radiation (302
nm).

© COPYRIG
HT UPM
40
3.7 Polymerase chain assembly
Polymerase chain assembly (PCA) was done to amplify glgB from Geobacillus sp.
Geo5 without the integrated transposase (Wu et al., 2006; TerMaat et al., 2009;
Marchand and Piccoud, 2012). Three steps of PCR were done using four different
primers (Figure 7). Step 1 was to amplify the gene upstream to the transposase using
these primers:
Forward primer, F1: 5’–ATG CGA TCC AGC TTG ATT GC– 3’
Reverse primer, R2: 5’–TTC CGA ATA CGC ATA AAG GAG GGA
AAA ACT GAC TTG GTT ATG GGC GTA TT– 3’
Step 2 was to amplify the gene downstream to the transposase using these primers:
Forward primer, F2: 5’–CTC CTT TAT GCG TAT TCG GAA– 3’
Reverse primer, R1: 5’–TCA ATG ATC CGG TAC TTC CC– 3’
Primer R2 and F2 were designed in such that they were complementary and
overlapping each other (Figure 7) by at least 20 bp to ensure that the PCR products
from both steps are able to be assembled. In step 1 and step 2 PCR, Geobacillus sp.
Geo5 genomic DNA was used as the DNA template.
Finally, step 3 was the PCA. This is where the PCR products from the previous two
steps were assembled to construct the whole gene using primer F1 and R1. In this
step, the purified PCR products from the previous two steps were used as the DNA
template instead of the genomic DNA. All the three steps of amplification process
were carried out in a reaction mixture containing 20-50 ng DNA template,

© COPYRIG
HT UPM
41
Forward primer, F2: 5’–CTC CTT TAT GCG TAT TCG GAA– 3’
||| ||| ||| ||| ||| ||| |||
Reverse primer, R2: 3’–....GAG GAA ATA CGC ATA AGC CTT- 5’
Figure 7. PCR and PCA. F1 and F2 are forward primers. R1 and R2 are reverse
primers. () represents the direction of DNA synthesis by DNA polymerase; ()
and () represent DNA strands.
F1
F1
R2
R1
R1
F2 Step 1 PCR
Step 2 PCR
Step 3 (PCA)
Final PCR product
5’
3’
5’
5’
3’
3’
5’
5’
3’
5’

© COPYRIG
HT UPM
42
0.2 μM forward and reverse primers, 0.2 mM dNTP mix, 1.2 U Pfu DNA polymerase
and 1× Pfu Buffer with MgSO4. The reactions were amplified using a thermocycler
(MyCyclerTM
, BioRad) with the temperature program of predenaturation at 95°C for
5 minutes; 35 cycles of 30 seconds denaturation at 95°C, 30 seconds annealing at
57°C and 4 minutes extension at 72°C; followed by final elongation step at 72°C for
7 minutes and hold at 10°C. Detection of PCR products was carried out by gel
electrophoresis, where 3μL of PCR products was run in agarose gel electrophoresis
(1% (w/v) agarose gel stained with GelRedTM
(Biotium), run at 100 volts for 35
minutes) and visualised under UV radiation (302 nm).
3.8 PCR purification by gel extraction
PCR product (150 μL) was electrophorised on 1% agarose gel electrophoresis at 100
volts for 35 minutes and then stained with GelRedTM
(Biotium). The desired band
was excised with a sterile scalpel. The DNA was extracted using QIAquick Gel
Extraction Kit according to the manufacturer’s instructions. The DNA concentration
of the purified PCR product was determined by measuring the optical density at A260
and was verified by DNA sequencing. For DNA sequencing, the samples were sent
to First BASE Laboratories Sdn Bhd.
3.9 Cloning of PCR products
To prepare the insert for cloning reaction, the forward primer used in PCR was
primer F3, instead of primer F1. This primer has additional four bases (CACC) at
the 5’ end as the requirement for cloning into pET102/D-TOPO®
vector. Fresh PCR
© COPYRIG
HT UPM
43
products of glgB from Geobacillus sp. Geo5 was cloned into pET102/D-TOPO®
vector from Champion™ pET Directional TOPO® Expression Kit (Appendix B).
Cloning reactions were prepared and transformed into One Shot® TOP10 chemically
competent E. coli according to manufacturer’s instructions. The gene cloned in
pET102/D-TOPO®
vector will be expressed as a fusion protein to His-Patch
thioredoxin. His-Patch thioredoxin, which is a mutated thioredoxin protein, have
metal binding site and therefore it has high affinity towards divalent cations (Lu et
al., 1996). This characteristic can be used to purify the fusion protein using metal
chelating resins.
3.10 Recombinant plasmid purification
An isolated colony harbouring the recombinant plasmid, pET/GBE, was picked and
cultured in 10 mL LB broth containing 100 μg/mL of ampicillin at 37°C with 250
rpm shaking, for 16 hours in INFORS HP (Ecotron) incubator shaker. The
recombinant plasmid was purified from 5 mL culture using QIAprep® Spin Miniprep
Kit according to the manufacturer’s instructions.
3.11 Analysing transformed recombinant plasmids
The plasmids were analysed to ensure that the gene was successfully integrated into
the vector and to confirm that the gene was in frame with the His-Patch thioredoxin
at the N-terminal of the pET102/D-TOPO®
vector.
© COPYRIG
HT UPM
44
3.11.1 PCR of recombinant plasmid DNA
Amplification process was carried out in a reaction mixture containing 1-10 ng
plasmid DNA, 0.2 μM forward and reverse primers (set 1: F1 and R1, set 2: TrxFus
forward and T7 reverse) 0.2 mM dNTP mix, 1.2 U Taq DNA polymerase and 1× Taq
Buffer with MgSO4. For TrxFus forward and T7 reverse priming sites, refer to
Appendix C. The genes were amplified using a thermocycler (MyCyclerTM
, BioRad)
with the temperature program of predenaturation at 95°C for 5 minutes; 35 cycles of
30 seconds denaturation at 95°C, 30 seconds annealing at 57°C and 2 minutes
extension at 72°C; followed by final elongation step at 72°C for 7 minutes and hold
at 10°C. Detection of PCR product was carried out by gel electrophoresis, where
3 μL of PCR product was run in agarose gel electrophoresis (1% (w/v) agarose gel
stained with GelRedTM
(Biotium), run at 100 volts for 35 minutes) and visualised
under UV radiation (302 nm). If the gene would be successfully integrated into the
vector, both sets of PCR would be successful and if the gene integrated was not in
frame, PCR using set 2 primers would fail.
3.11.2 PstI and BglII digestion
The digestion reaction contains 50-100 ng of plasmid DNA, 0.2 μL of restriction
enzyme (FastDigest® BglII and, or PstI) and 1× FastDigest
® Buffer in a 10 μL
reaction. The reaction components were incubated at 37°C for 20 minutes. Then, the
digestion product was run in agarose gel electrophoresis (1% (w/v) agarose gel
stained with GelRedTM
(Biotium), run at 100 volts for 35 minutes) and visualised
under UV radiation (302 nm). The expected sizes for a single digestion of empty

© COPYRIG
HT UPM
45
pET102/D-TOPO®
vector and pET/GBE are 6315 bp and 8328 bp, respectively.
Since these sizes are quite close to each other especially when viewed in agarose gel,
therefore a double digestion using both BglII and PstI was performed so that the size
difference could be viewed clearly. For double digestion, two fragments were
expected. Empty vector would give 1826 bp and 4489 bp fragments, while pET/GBE
would give 3839 bp and 4489 bp fragments.
3.11.3 DNA sequencing of recombinant plasmid DNA
The purified plasmids were sent for DNA sequencing to First BASE Laboratories
Sdn Bhd. The sequencing was done using PCR primers F1 and R1, TrxFus forward
and T7 reverse.
3.12 Intracellular expression of G5GBE
Heterologous expression of GBE from Geobacillus sp. Geo5 in E. coli was studied.
Recombinant plasmid harbouring glgB from Geobacillus sp. Geo5 was purified as in
section 3.10. The purified plasmid (10 ng/µL) was transformed into the expression
host, E. coli BL21 StarTM
(DE3) according to the manufacturer’s instructions.
A colony of the positive transformant was picked and inoculated into 10 mL LB
broth containing 100 µg/mL ampicillin and grew at 37°C with 250 rpm shaking, for
16 hours in INFORS HP (Ecotron) incubator shaker. The broth (2 mL) was then
transferred into 200 mL LB broth containing 100 µg/mL ampicillin in 1 L Schott
bottle and incubated at 37°C with 250 rpm shaking in INFORS HP (Ecotron)

© COPYRIG
HT UPM
46
incubator shaker. The expression was induced with IPTG when optical density A600
reached 0.5. The expression was done in various induction conditions (IPTG
concentration: 0 to 1 mM, induction temperature: 20°C to 37°C and induction time: 0
to 28 hours) in order to achieve the highest expression level.
After induction, 10 mL of culture was centrifuged at 12,000 × g for 20 minutes at
4°C. The cell pellet was resuspended in 10 mL of 50 mM sodium phosphate buffer
(pH 7.0), sonicated (Branson Digital Sonifier; 2 minutes with 30 seconds lapse;
amplitude: 30%) and cleared by centrifugation (12,000 × g, 20 minutes, 4°C). Cell
lysate was subjected to iodine stain assay and SDS-PAGE. The recombinant protein,
G5GBE, was expressed as a fusion protein with His-Patch thioredoxin at the N-
terminal. The theoretical molecular weight of GBE was 78 kDa and with the addition
of His-Patch thioredoxin, the expected size of the fusion protein would be 91 kDa.
3.13 Determination of G5GBE expression level
The expression level of G5GBE was represented by GBE activity. There are two
methods used to determine GBE activity quantitatively, namely, iodine stain assay
and branching linkage assay (Takata et al., 1994). On top of that, the expression level
of G5GBE was determined qualitatively by SDS-PAGE.
3.13.1 Iodine stain assay
Iodine stain assay was done as in the method provided by Takata et al. (1994).
Enzyme solution in 50 mM sodium phosphate buffer, pH 7.0 (50 µL) was incubated

© COPYRIG
HT UPM
47
with 50 µL of substrate at 50°C for 30 minutes. The substrate was 0.1% amylose
from potato (Sigma) dissolved in 50 mM sodium phosphate buffer (pH 7.0) and 10%
(v/v) of DMSO. The reaction was terminated by the addition of 1 mL of iodine
reagent. Iodine reagent was prepared fresh from 0.5 mL of stock solution (0.26 g of
I2 and 2.6 g of KI in 10 mL of distilled water), 0.5 mL of 1 M HCl and diluted to 130
mL in distilled water. One unit (U) of enzyme activity was defined as the decreased
of A660 reading by 1% per minute. The decreased of A660 reading represents the
amylose-iodine complex (Shinohara et al., 2001).
Amylose, which was used as the substrate, is the linear component of starch.
Amylose retains iodine molecules within its hydrophobic helical coils, where the
reaction of branching enzyme will disrupts the coils by introducing the branches to
amylose, converting amylose to amylopectin (van der Maarel et al., 2003). Hence,
less iodine molecules held inside the hydrophobic helical coils and consequently
decrease the optical reading of amylose-iodine complex at A660.
3.13.2 Branching linkage assay.
This assay quantitated the amount of α-1,6-glycosidic linkages synthesised. As
described by Takata et al. (1994), the branching enzyme was incubated with reduced
amylose as the substrate. The substrate was prepared using the method provided by
Takeda et al. (1993). The branched product was then debranched by using
isoamylase. This enzyme specifically hydrolysed the α-1,6 branch point. Then, the
liberated reducing ends were determined by 2,2’-bicinchoninate (BCA) assay
(Utsumi et al., 2009; Thiemann et al., 2006). One unit of enzyme activity was

© COPYRIG
HT UPM
48
defined as the quantity of branching enzyme that gives 1 µmol of the branch linkage
per minute, where the amount of branch linkage is correlative to the amount of the
reducing sugars obtained (Takata et al., 1994).
However, the results of GBE activity shown in this thesis are all based on iodine
stain assay, not branching linkage assay. Branching linkage assay is very tedious to
perform and would take longer time to give the results compared to iodine stain
assay and therefore it was not preferred. Branching linkage assay was done only to
confirm the results obtained by iodine stain assay only when necessary.
3.13.3 SDS-PAGE
SDS-PAGE (12% running gel, 6% stacking gel) was done using Laemmli’s method
(Laemmli, 1970). Sample, 90 µL, was mixed with 10 µL of 10× sample buffer and
boiled for 10 minutes. The sample (10 μL) was loaded into the gel and run at 180
volts for 1 hour. The gel was then stained with Coomassie Brilliant Blue R-250
solution (0.1% (w/v) Coomassie Brilliant Blue R-250, 45% (v/v) methanol and 5%
(v/v) acetic acid). This staining method can detect as little as 0.1 μg of protein in the
band (Wang et al., 2007).
3.14 Secretory expression of G5GBE
pSW1 vector (Mobitec, Germany) was used for BRP expression (Appendix D).
This vector is resistant towards tetracyclin and use mitomycin C as the inducer for
the secretory expression system.
© COPYRIG
HT UPM
49
3.14.1 Co-transformation of pSW1 vector
BRP expression vector, pSW1, was co-transformed into competent cells E. coli
BL21 StarTM
(DE3) (Invitrogen) that harbours pET/GBE. Competent cells
preparation and plasmid transformation was done using calcium/manganese-based
(CCMB) buffer and transformation method by Hanahan et al. (1991).
3.14.2 Analysis of positive transformants
The positive transformants were analysed by digesting the purified plasmid with
restriction enzyme HindIII. The plasmids were purified as in section 3.10. The
digestion reaction (50-100 ng plasmid DNA, 0.2 µL FastDigest® HindIII and 1×
FastDigest® Buffer in 10 µL reaction) was incubated at 37°C for 20 minutes. The
digested DNA was run in agarose gel electrophoresis (1% (w/v) agarose gel stained
with GelRedTM
(Biotium), run at 100 volts for 35 minutes) and two bands were
expected when gel was visualised under UV radiation (302 nm). The size of pSW1
vector and pET/GBE is 3.9 kb and 8.3 kb, respectively.
3.14.3 Quasi-lysis test
An overnight culture (1 mL) was inoculated into 100 mL of LB broth containing
20 µg/mL of tetracycline and 100 µg/mL of ampicillin in 500 mL Schott bottle. The
culture was incubated at 37°C with 250 rpm shaking in INFORS HP (Ecotron)
incubator shaker until optical density at A600 reached about 0.1. Then, the expression
was fully induced with 0.5 µg/mL of mitomycin C. Two controls were done where

© COPYRIG
HT UPM
50
the expression was induced with advised concentration of mitomycin C (20 ng/mL)
according to the pSW1 vector mafacturers instructions and the other one was not
induced. A600 reading was read every one hour for 6 hours.
3.14.4 Effect of mitomycin C concentration on secretory expression
The expression of G5GBE was induced with 0.75 mM of IPTG when optical density
at A600 reached about 0.5. At the same time point, the co-expressed BRP was induced
with various concentrations of mitomycin C, from 0 to 25 ng/mL. A control for
expression with the same condition was done with expression host that has BRP
plasmid in absent and therefore only contains pET/GBE. The expression with the
optimum concentration of mitomycin C was studied for 28 hours in order to achieve
the highest expression level.
After induction, 10 mL of culture was centrifuged at 12,000 × g for 20 minutes at
4°C. Both the supernatant and the cell pellet were subjected to iodine stain assay.
The cell pellet was resuspended in 10 mL of 50 mM phosphate buffer (pH 7.0),
sonicated using Branson Digital Sonifier (2 minutes with 30 seconds lapse;
amplitude: 30%) and cleared by centrifugation (12,000 × g, 20 minutes, 4°C) prior to
assay.
3.15 Purification of G5GBE
G5GBE expressed in E. coli BL21 StarTM
(DE3) was purified by affinity
chromatography technique using Äkta Explorer (GE Healthcare, Sweden). Cell

© COPYRIG
HT UPM
51
culture (200 mL) was harvested by centrifugation (15,600 × g, 30 minutes, 4°C) and
the cell pellet was resuspended in 10 mL of binding buffer (20 mM sodium
phosphate, 0.5 m NaCl, 30 mM imidazole, pH 7.4). The cell suspension was
sonicated using Branson Digital Sonifier (2 minutes with 30 seconds lapse;
amplitude: 30%) and cleared by centrifugation (12,000 × g, 20 minutes, 4°C). The
crude protein (10 mL) was loaded into 1 mL HisTrap HP column (GE Healthcare) at
flowrate of 1 mL/min. The column was then washed with 20 column volume of
binding buffer. Finally, the bound enzyme was eluted with elution buffer (20 mM
sodium phosphate, 0.5 M NaCl, 0.5 M imidazole, pH 7.4) by a linear gradient.
Protein fractions that were collected were run in SDS-PAGE as in section 3.13.3.
The protein content was determined by Quick StartTM
Bradford protein assay
(Biorad) according to manufacturer’s instructions, and enzyme activity was tested
out by iodine stain assay as in section 3.13.1.
3.15.1 MALDI TOF/TOF analysis
In order to verify that the purified protein is the protein of interest, GBE, the purified
protein was run through SDS-PAGE as in section 3.13.3. The gel band was excised
and sent for protein sequencing using a tandem mass spectrometry technique, which
is matrix-assisted laser desorption ionization time-of-flight (MALDI TOF/TOF).
This process was outsourced to First BASE Laboratories Sdn Bhd.
© COPYRIG
HT UPM
52
3.16 Characterisation of purified GBE
The general biochemical properties of GBE were characterised based on the effect of
temperature on the enzyme activity and stability, the effect of pH on enzyme activity
and stability, and the effect of metal ions on enzyme activity. These properties were
chosen to be characterised since the U. S. Food and Drug Administration (FDA) has
listed them in the guideline of enzyme preparations for enzymes to be used in food
processing industries (U. S. Food and Drug Administration, 2010). Since GBE is
most likely would be applied in food and beverages industries, therefore those
characterisation parameters were taken into consideration.
3.16.1 Effect of temperature on the enzyme activity
The effect of temperature on GBE activity was studied at temperatures from 30°C to
80°C with 5°C intervals. GBE activity was assayed using iodine stain assay (refer to
section 3.13.1).
3.16.2 Effect of temperature on enzyme stability
The enzyme stability test was done by incubating the enzymes at 40°C to 80°C.
Enzyme activity was assayed every 4 hours for 24 hours. After the incubation, the
enzyme was immediately cooled in an ice bath prior to iodine stain assay, which was
done at 50°C for 30 minutes (refer to section 3.13.1).

© COPYRIG
HT UPM
53
3.16.3 Effect of pH on enzyme activity
The effect of pH on GBE activity was studied at pH 4 to pH 10. GBE activity was
assayed in a few buffers with different pHs; 50 mM acetate buffer for pH 4-6, 50
mM potassium phosphate buffer for pH 6-8, 50 mM Tris-Cl buffer for pH 8-9 and
50 mM glycine-NaOH for pH 9-10. The iodine stain assay was done at 50°C for 30
minutes (refer to section 3.13.1).
3.16.4 Effect of pH on enzyme stability
The effect of pH on GBE stability was studied for pH 4 to pH 10. The enzyme was
incubated in various buffers with different pHs at 25°C for 1 hour. The buffers used
were 50 mM acetate buffer for pH 4-6, 50 mM potassium phosphate buffer for
pH 6-8, 50 mM Tris-Cl buffer for pH 8-9 and 50 mM glycine-NaOH for pH 9-10.
GBE activity was assayed using iodine stain assay at 50°C, pH 7.0 as in section
3.13.1 straightaway after the treatment.
3.16.5 Effect of metal ions on enzyme activity
Metal ions may have either enhancement or inhibition effect on GBE activity. To
see if these effects occur, GBE was treated with 1 mM and 5 mM of metal ions
(Mg2+
, Ca2+
, Fe2+
, Mn2+
, Zn2+
and Cu2+
) for 30 minutes at 25°C. Immediately after
the treatment, GBE activity was assayed using iodine stain assay at 50°C as in
section 3.13.1.
© COPYRIG
HT UPM
54
CHAPTER 4
RESULTS AND DISCUSSIONS
4.1 Genome mining
The sequence of glgB was determined by a technique called genome mining where
the genome sequence of Geobacillus sp. Geo5 was aligned with known nucleotide
sequences of glgB from other Geobacillus spp., which were obtained from GenBank,
using local BLAST and ClustalW (Appendix E). As the genome sequence was not
yet assembled and annotated, the position of the gene in the Geobacillus sp. Geo5
genome was found fragmented into two contiguous sequences. The sequences were
joined to make up the gene, which has the size of 2013 bp that codes for 630 amino
acids (Figure 8). The theoretical molecular weight is 78.43 kDa, was predicted using
the “Compute pI/Mw tool” from ExPASy Bioinformatics Resource Portal
(http://web.expasy.org/compute_pi/).
The four conserved regions of α-amylase family enzymes as reported by Abad et al.
(2002) and van der Maarel et al. (2003) were determined by aligning the amino acid
sequences of glgB from Geobacillus sp. Geo5 with five other Geobacillus spp., E.
coli and M. tuberculosis using ClustalW (Table 3). Within the four conserved
regions, there are seven highly conserved amino acids that have important roles in
the catalysis and substrate binding. Three of the conserved residues are the catalytic
residues; Asp313
in region II, Glu356
in region III and Asp424
in region IV. These
residues corresponded to Asp405
, Glu458
and Asp526
of the E. coli branching enzyme

© COPYRIG
HT UPM
55
PCR primer F1______ ATGCGATCCAGCTTGATTGCGGCGAATCCGACAGATTTAGAAGTGTATTTGTTTCATGAA
M R S S L I A A N P T D L E V Y L F H E
GGCCGTTTGTATCAAAGTTATGAGCTGTTCGGCGCTCATGTCATCCGCGACGGCGGAGCG
G R L Y Q S Y E L F G A H V I R D G G A
GTCGGCACTCGCTTTTGCGTGTGGGCGCCCCATGCGCGGGAAGTCCGTCTTGTCGGCAGT
V G T R F C V W A P H A R E V R L V G S
TTCAACGATTGGAATGGGGCGAATTCCCCCCTGACGAAGGTGAACGACGAAGGGGTATGG
F N D W N G A N S P L T K V N D E G V W
ACGATCGTTGTTCCAGAAAACTTGGAAGGGCATCTCTATAAATATGAGATCATCACACCG
T I V V P E N L E G H L Y K Y E I I T P
GATGGCCGTGTTCTGTTGAAAGCCGACCCGTACGCCTTTTACTCCGAATTGCGCCCTCAT
D G R V L L K A D P Y A F Y S E L R P H
ACCGCCTCGATTGTCTACGATTTGAAAGGATACGAGTGGAATGATTCATCTTGGCAGCGG
T A S I V Y D L K G Y E W N D S S W Q R
AAGAAACGGCGAAAGCGGATTTATGACCAACCGATGGTCATTTATGAACTTCATTTCGGT
K K R R K R I Y D Q P M V I Y E L H F G
TCGTGGAAAAAGAAACCGGACGGCCGCTTTTATACGTACCGTGAGATGGCCGACGAACTC
S W K K K P D G R F Y T Y R E M A D E L
ATTCCGTACGTGCTGGAGCGCGGATTTACGCACATTGAGCTGCTTCCGCTTGTCGAGCAT
I P Y V L E R G F T H I E L L P L V E H
PCR primer F4__ CCGCTCGATCGTTCGTGGGGATATCAAGGGACCGGCTATTATTCGGTGACAAGCCGCTAT
P L D R S W G Y Q G T G Y Y S V T S R Y
____
GGCACGCCGCACGATTTCATGTATTTCGTCGACCGCTGCCATCAAGCGGGGCTTGGCGTC
G T P H D F M Y F V D R C H Q A G L G V
ATCATCGACTGGGTGCCGGGGCATTTTTGCAAGGACGCCCACGGGCTGTACATGTTTGAC
I I D W V P G H F C K D A H G L Y M F D
GGCGCACCGACGTATGAATACGCGAATGAAAAAGACCGAGAAAATTACGTCTGGGGGACG
G A P T Y E Y A N E K D R E N Y V W G T
GCGAATTTTGACTTGGGCAAGCCGGAAGTGCGCAGTTTTCTGATCTCCAATGCGTTGTTT
A N F D L G K P E V R S F L I S N A L F
TGGCTGGAGTATTACCATGTGGACGGGTTTCGCGTCGATGCGGTCGCCAATATGCTTTAT
W L E Y Y H V D G F R V D A V A N M L Y
TGGCCGAACAACGACCGGCTCTATGAAAATCCGTATGCGGTCGAGTTTTTGCGCCAGTTG
W P N N D R L Y E N P Y A V E F L R Q L
AATGAGGCGGTGTTTGCCTATGACCCGAACGTCTTGATGATCGCTGAAGATTCGACCGAC
N E A V F A Y D P N V L M I A E D S T D
TGGCCTCGGGTGACCGCGCCGACGTACGATGGCGGCCTTGGGTTTAACTACAAGTGGAAC
W P R V T A P T Y D G G L G F N Y K W N
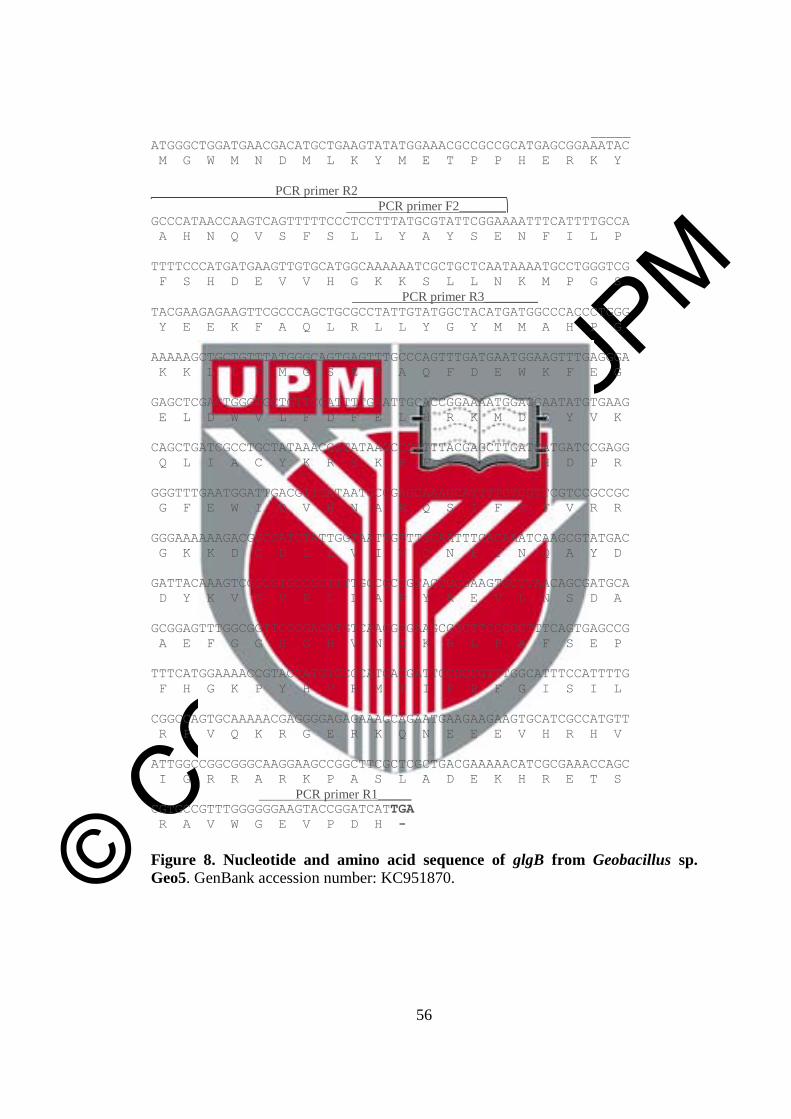
© COPYRIG
HT UPM
56
_____
ATGGGCTGGATGAACGACATGCTGAAGTATATGGAAACGCCGCCGCATGAGCGGAAATAC
M G W M N D M L K Y M E T P P H E R K Y
PCR primer R2
PCR primer F2_______ GCCCATAACCAAGTCAGTTTTTCCCTCCTTTATGCGTATTCGGAAAATTTCATTTTGCCA
A H N Q V S F S L L Y A Y S E N F I L P
TTTTCCCATGATGAAGTTGTGCATGGCAAAAAATCGCTGCTCAATAAAATGCCTGGGTCG
F S H D E V V H G K K S L L N K M P G S
PCR primer R3________ TACGAAGAGAAGTTCGCCCAGCTGCGCCTATTGTATGGCTACATGATGGCCCACCCTGGG
Y E E K F A Q L R L L Y G Y M M A H P G
AAAAAGCTGCTGTTTATGGGCAGTGAGTTTGCCCAGTTTGATGAATGGAAGTTTGAGGGA
K K L L F M G S E F A Q F D E W K F E G
GAGCTCGACTGGGTGCTGTTCGATTTTGAATTGCACCGGAAAATGGACGAATATGTGAAG
E L D W V L F D F E L H R K M D E Y V K
CAGCTGATCGCCTGCTATAAACGGTATAAGCCGTTTTACGAGCTTGATCATGATCCGAGG
Q L I A C Y K R Y K P F Y E L D H D P R
GGGTTTGAATGGATTGACGTTCATAATGCCGAGCAAAGCATTTTCTCGTTCGTCCGCCGC
G F E W I D V H N A E Q S I F S F V R R
GGGAAAAAAGACGGCGATCTATTGGTAATTGTTTGCAATTTCACAAATCAAGCGTATGAC
G K K D G D L L V I V C N F T N Q A Y D
GATTACAAAGTCGGCGTGCCGCTTTTGGCGCCGTACCGCGAAGTGCTTAACAGCGATGCA
D Y K V G V P L L A P Y R E V L N S D A
GCGGAGTTTGGCGGTTCGGGACATGTCAACGGGAAGCGGCTTCCCGCTTTCAGTGAGCCG
A E F G G S G H V N G K R L P A F S E P
TTTCATGGAAAACCGTACCATGTGCGCATGACGATTCCGCCGTTTGGCATTTCCATTTTG
F H G K P Y H V R M T I P P F G I S I L
CGGCCAGTGCAAAAACGAGGGGAGAGAAAGCAGAATGAAGAAGAAGTGCATCGCCATGTT
R P V Q K R G E R K Q N E E E V H R H V
ATTGGCCGGCGGGCAAGGAAGCCGGCTTCGCTCGCTGACGAAAAACATCGCGAAACCAGC
I G R R A R K P A S L A D E K H R E T S
PCR primer R1_____ CGTGCCGTTTGGGGGGAAGTACCGGATCATTGA
R A V W G E V P D H -
Figure 8. Nucleotide and amino acid sequence of glgB from Geobacillus sp.
Geo5. GenBank accession number: KC951870.

© COPYRIG
HT UPM
57
Table 3. Conserved regions in glycogen branching enzyme from Geobacillus spp., Escherichia coli and Mycobacterium tuberculosis.
Note: 1
Refer to p. 36 for accession number. The conserved amino acids are highlighted.
Conserved region
I II III IV
Geobacillus sp. Geo5 1
HQAGLGVIIDWVPGHFCK HVDGFRVDAVAN VLMIAEDSTDW FILPFSHDEVV
Geobacillus sp. Y412MC10 1
HQAGIGVLLDWVPAHFAK HIDGLRVDAVTS ALMMAEESSAW FTLPLSHDEVV
Geobacillus sp. Y412MC61 1
HQAGLGVIIDWVPGHFCK HVDGFRVDAVAN VLMIAEDSTDW FILPFSHDEVV
Geobacillus sp. NBRC 15315 1
HQAGIGVILDWVPGHFCK HVDGFRVDAVAN VLMIAEDSTDW FILPFSHDEVV
Geobacillus stearothermophilus 1
HQQGIGVILDWVPGHFCK HVDGFRVDAVAN ILMIAEDSTDW FILPFSHDEVV
Geobacillus thermodenitrificans NG80-2 1
HQAGIGVIMDWVPGHFCK HIDGFRVDAVAN VLMIAEDSTDW FILPFSHDEVV
Escherichia coli (PDB ID: 1M7X) HAAGLNVIMDWVPGHFPT GIDALRVDAVAS AVTMAEESTDF FILPFSHDEVV
Mycobacterium tuberculosis (PDB ID: 3K1D1) HQAGIGVIVDWVPAHFPK HIDGLRVDAVAS IVTIAEESTPW YVLPLSHDEVV

© COPYRIG
HT UPM
58
and Asp411
, Glu464
and Asp532
of the M. tuberculosis branching enzyme (refer to
section 2.3.1) (Pal et al., 2010; Abad et al., 2002). Four other conserved residues;
Asp243
and His248
in region I, Arg311
in region II and His423
in region IV are
responsible for substrate binding (van der Maarel et al., 2003; Abad et al., 2002).
van der Maarel et al. (2003) demonstrated that thermostability of an enzyme can be
presumed from its primary sequence information. Somehow, there are correlations
between the number of aromatic amino acids (phenylalanine, tryptophan and
tyrosine), glutamine and asparagine with the thermostability (Vieille et al., 2001;
Serrano et al., 1991; Burley and Petsko, 1985). Enzymes with high number of
aromatic residues in combination with low number of glutamine and asparagine
would show higher temperature stability. The reason behind this is that the
hydrophobic interactions between the aromatic groups are responsible for the
stability of a thermophilic protein. Also, the deamination of thermolabile amino
acids, asparagine and glutamine, resulted the inactivation of enzymes at elevated
temperature and therefore, less number of asparagine and glutamine would minimize
the chances of enzyme inactivation and so contribute to thermostability (Vieille et
al., 2001).
The percentage of aromatic residues in GBE is 15% and the percentage of asparagine
and glutamine is 6.3%. Placing those values in Table 4, those percentages are
comparable to GBE from B. stearothermophilus, which has 16.3% of aromatic
residues and 7.7% of asparagine and glutamine. Thus it is postulated that GBE from
Geobacillus sp. Geo5 would have optimum temperature for enzyme activity at
around 50°C and stable at about 60°C.

© COPYRIG
HT UPM
59
Table 4. Percentage of aromatic amino acids, glutamine and asparagine in
relation to the temperature optimum for activity and stability of three bacterial
and two maize branching enzymes.
Source %FWY1
%QN2 Optimum
temperature (°C)
Temperature
stability (°C)
A. aeolicus 17.4 4.8 80 90
R. obamensis 16.8 5.2 65 80
B. stearothermophilus 16.3 7.7 55 60
E. coli 13.2 7.6 30 nd
Maize I 12.2 6.6 30 nd
Maize II 13.4 6.8 20 nd
Note: 1 F: phenylalanine, W: tryptophan, Y: tyrosine;
2 Q: glutamine, N: asparagine;
nd, not determined. (Source: van der Maarel et al., 2003)
4.2 Enzyme structure prediction
Visualisation of the 3D structure of an enzyme is important to understand the enzyme
features and mechanism of action. The distinctive construction of the domains can be
observed and compared with other similar enzymes. Also, features like disulphide
bond formation, the position of the conserved amino acids and the catalytic triad can
be localised and evaluated. However, the determination of protein structure does not
necessarily reveal its function. This is because proteins with similar folds might
always have different functions and therefore it is best to test out the protein
functions by biochemical experimentation (Skolnick and Fetrow, 2000).
Amino acid sequence of glgB was submitted to I-TASSER server to get the 3D
structure of the enzyme predicted. I-TASSER gave five predicted models of the
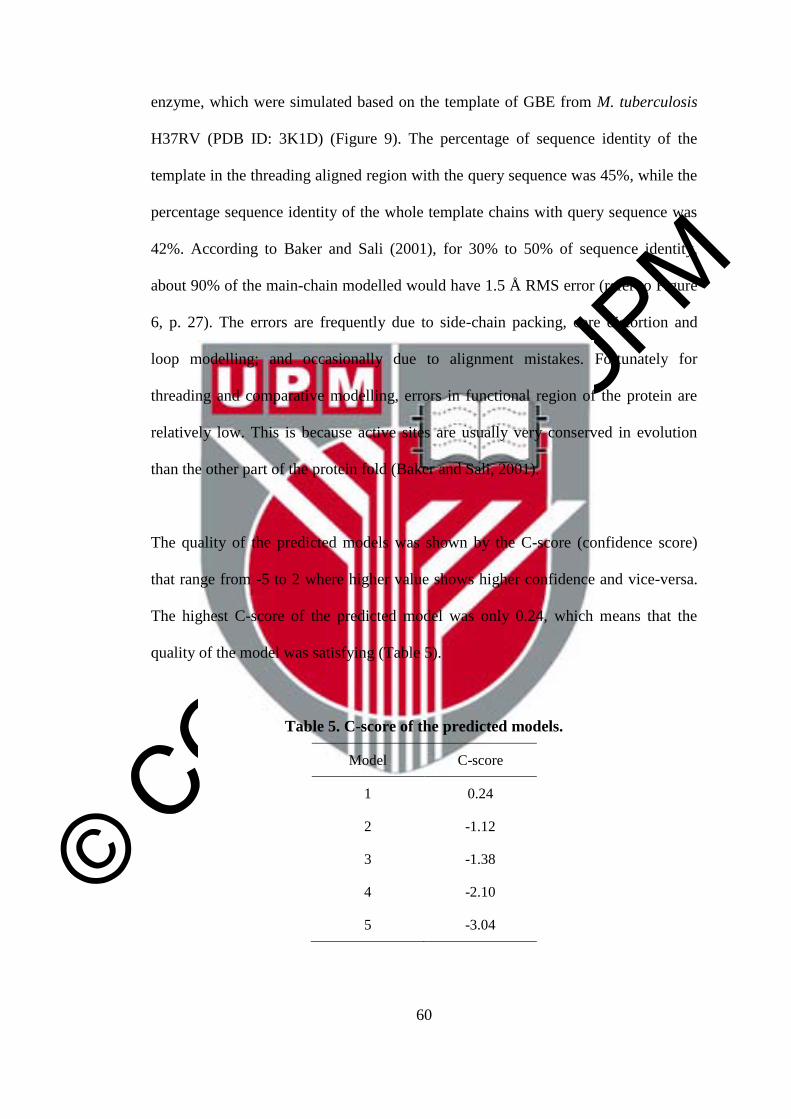
© COPYRIG
HT UPM
60
enzyme, which were simulated based on the template of GBE from M. tuberculosis
H37RV (PDB ID: 3K1D) (Figure 9). The percentage of sequence identity of the
template in the threading aligned region with the query sequence was 45%, while the
percentage sequence identity of the whole template chains with query sequence was
42%. According to Baker and Sali (2001), for 30% to 50% of sequence identity,
about 90% of the main-chain modelled would have 1.5 Å RMS error (refer to Figure
6, p. 27). The errors are frequently due to side-chain packing, core distortion and
loop modelling; and occasionally due to alignment mistakes. Fortunately for
threading and comparative modelling, errors in functional region of the protein are
relatively low. This is because active sites are usually very conserved in evolution
than the other part of the protein fold (Baker and Sali, 2001).
The quality of the predicted models was shown by the C-score (confidence score)
that range from -5 to 2 where higher value shows higher confidence and vice-versa.
The highest C-score of the predicted model was only 0.24, which means that the
quality of the model was satisfying (Table 5).
Table 5. C-score of the predicted models.
Model C-score
1 0.24
2 -1.12
3 -1.38
4 -2.10
5 -3.04
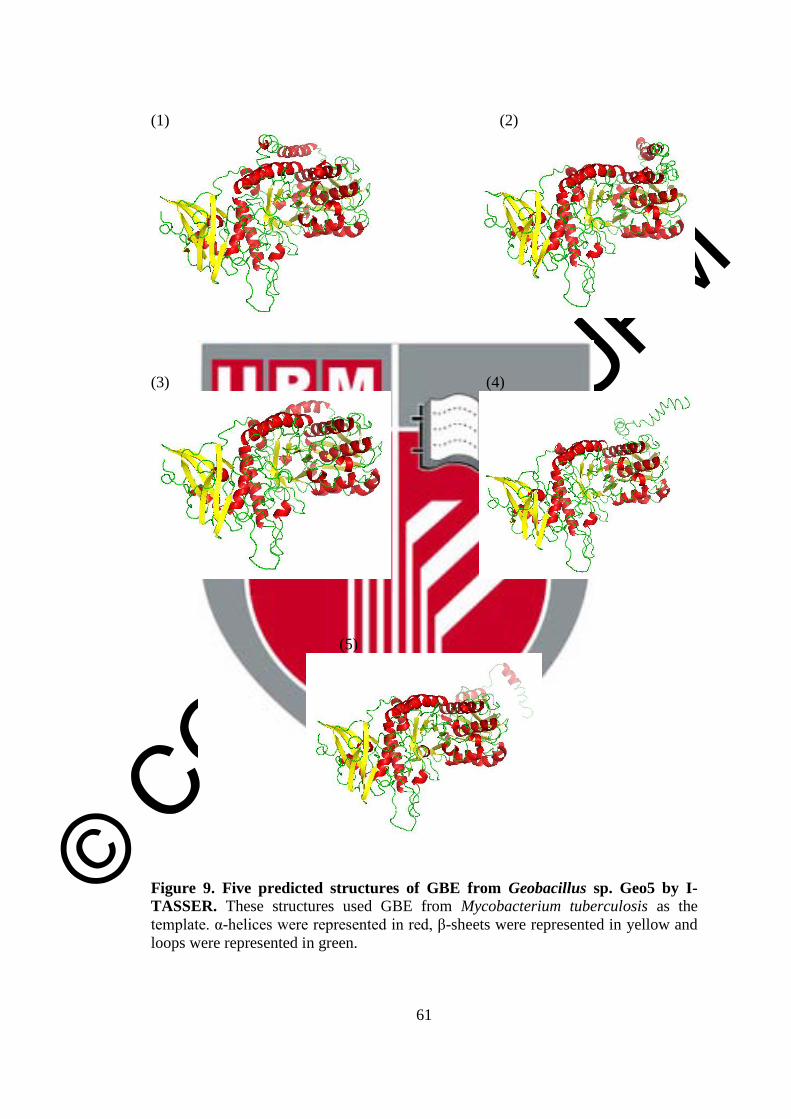
© COPYRIG
HT UPM
61
(1) (2)
(3) (4)
(5)
Figure 9. Five predicted structures of GBE from Geobacillus sp. Geo5 by I-
TASSER. These structures used GBE from Mycobacterium tuberculosis as the
template. α-helices were represented in red, β-sheets were represented in yellow and
loops were represented in green.

© COPYRIG
HT UPM
62
To estimate the accuracy of the model, I-TASSER provided the TM-score, but only
for model 1, which is 0.75 ± 0.11. That value indicates that the two protein
structures, GBE from Geobacillus sp. Geo5 and M. tuberculosis, are similar. TM-
score, which is short for Template Modelling score, is used to measure similarity
between two protein structures by a score range of 0 to 1, where 1 means that both
structures are a perfect match (Zhang and Skolnick, 2004). Looking at all five of the
predicted structures given, the three distinctive domains of branching enzyme were
observed; the central catalytic domain, which is made up of eight α/β helices that
forms a barrel, and seven β-strands in both N and C-terminals (Figure 9) (Pal et al.,
2010; Abad et al., 2002). There was no disulphide bond predicted for this structure.
Both crystal structures of GH-13 family GBE also did not show any disulphide bond
formation. I-TASSER also stated that the predicted Enzyme Classification (EC)
number to the queried sequence is 2.4.1.18, which is the EC number for 1,4-α-glucan
branching enzyme.
The five predicted structures were evaluated further using PROCHECK software
(Laskowski et al., 1993). PROCHECK would evaluate the stereochemistry of protein
structures using Ramachandran plot by calculating the backbone dihedral angles psi
(ψ) against phi (φ) of amino acid residues in a protein structure. The Ramachandran
plots for all five of the predicted models by I-TASSER are shown in Figure 10 and
the summary of the outcome is displayed in Table 6. Evaluating those data, model 1
is supposed to be the best model although amino acids that lied in the most favoured
regions was only 68.6%, lower than model 2, 4 and 5, but the percentage of amino
acids in the disallowed region was the lowest. A good quality model however, would
be expected to have over 90% of amino acid residues in the most favoured regions.

© COPYRIG
HT UPM
63
Model 1 Model 2
Model 3 Model 4
Model 5
Figure 10. Ramachandran plots. These plots were produced by PROCHECK for
the five models of GBE from Geobacillus sp. Geo5 predicted by I-TASSER. The
red, dark yellow, light yellow and white regions represent the favoured, additionally
allowed, generously allowed and disallowed region. ▲: glycine residues. ■: other
amino acid residues.

© COPYRIG
HT UPM
64
Table 6. Summary of the PROCHECK analysis.
Models
Most
favoured
region (%)
Additionally
allowed
region (%)
Generously
allowed
region (%)
Disallowed
region (%)
1 68.6 26.4 3.4 1.6
2 72.1 20.9 4.8 2.2
3 68.1 25.9 2.9 3.1
4 69.7 24.1 4.3 1.9
5 70.2 24.3 2.6 2.9
Note: the values represent the percentage of amino acid residues in respected regions.
Looking back at the predicted structures, I-TASSER suggested that the residues
involved in the binding site of the enzyme are Try208
, His248
, Asp313
, Ala314
, Glu356
and Asp424
. Three of these residues, Asp313
, Glu356
and Asp424
, were the conserved
residues that ought to be in charge of the catalysis reaction of the enzyme. The
corresponding residues in M. tuberculosis branching enzyme are Asp411
, Glu464
and
Asp532
(Pal et al., 2010). These residues were located in model 1 of the predicted
structure given by I-TASSER using a visualization tool, PyMOL (Figure 11).
These negatively charged amino acids in the catalytic cavity are important for sugar-
protein interactions (Pal et al., 2010; Abad et al., 2002). As proposed by Pal et al.
(2010), Glu356
(Glu464
in M. tuberculosis numbering) acts as the acid catalyst that
protonates the oxygen of the 1,4-glycosidic bond while Asp313
(Asp411
in M.
tuberculosis numbering) acts as the attacking nucleophile, which reacts with the OH
group of C6 of the neighbouring glucose residue and thus forming the 1,6- glycosidic
bond (refer to Figure 2, p. 11). Three other residues that are proposed by
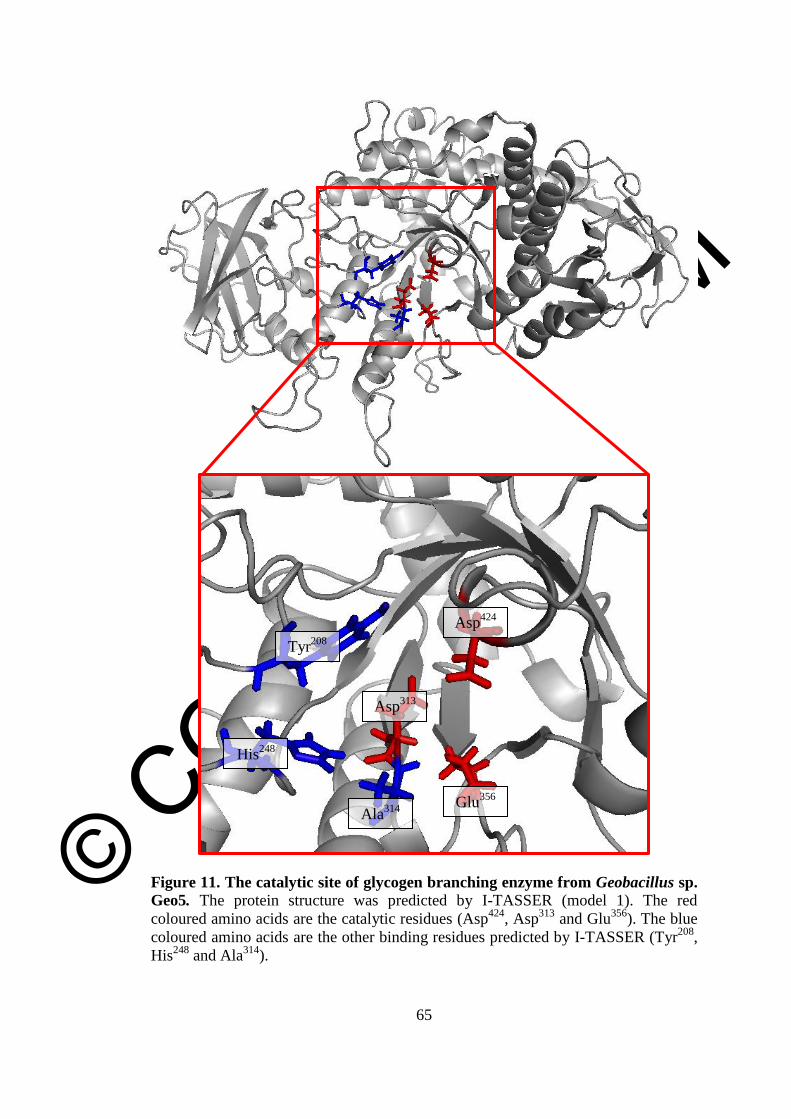
© COPYRIG
HT UPM
65
Figure 11. The catalytic site of glycogen branching enzyme from Geobacillus sp.
Geo5. The protein structure was predicted by I-TASSER (model 1). The red
coloured amino acids are the catalytic residues (Asp424
, Asp313
and Glu356
). The blue
coloured amino acids are the other binding residues predicted by I-TASSER (Tyr208
,
His248
and Ala314
).
Asp424
Glu356
Asp313
Ala314
Tyr208
His248

© COPYRIG
HT UPM
66
I-TASSERT, Tyr208
, His248
and Ala314
are possibly involve in the substrate binding
and specificity since they are located near the entrance of the catalytic α/β-barrel
domain (Figure 11), and His248
is one of the conserved residues in region IV (Table
3, p. 57) (van der Maarel et al., 2003; Abad et al., 2002).
4.3 Culturing Geobacillus sp. Geo5
Geobacillus sp. Geo5 was subcultured in nutrient agar, thermus agar, nutrient broth,
and thermus broth from the stock provided by MGI. On nutrient agar plate, the
morphology of the Geobacillus sp. Geo5 colonies were round, mucoid and
tranluscent white with a diameter of about 5 mm. These descriptions correlate with
colony morphology of Geobacillus sp. (Nazina et al., 2001; Zeigler, 2001).
4.4 Genomic DNA extraction of Geobacillus sp. Geo5
Genomic DNA of Geobacillus sp. Geo5 was successfully extracted using Qiagen
DNeasy® Blood and Tissue Kit. The gel electrophoresis result showed that the DNA
purified was pure as a single intact band was observed. The concentration of the
purified genomic DNA was 50 µg/mL and the optical density ratio of A260/280 was
1.88. The ratio of 1.8 to 2.0 means that the extracted genomic DNA was pure from
contaminations, such as proteins and residual chemicals from the extraction protocol
(Wilfinger et al., 1997).

© COPYRIG
HT UPM
67
4.5 Polymerase chain reaction of glgB
glgB was amplified from genomic DNA of Geobacillus sp. Geo5 by PCR. PCR was
carried out using Pfu DNA polymerase, an enzyme found in the hyperthermophilic
archaeon Pyrococcus furiosus. Pfu DNA polymerase has 3' to 5' exonuclease
proofreading capability, which would produce blunt end products. This proofreading
activity also makes PCR products by Pfu DNA polymerase having lower error rate
that is 1 in 1.3 million base pairs compared to frequently used Taq DNA polymerase
(isolated from Thermus aquaticus), 1 in 9000 base pairs (Cline et al., 1996).
Therefore, Pfu DNA polymerase was chosen as the PCR products would be suitable
for directional TOPO cloning later on.
PCR primers were designed based on the open reading frame sequence of glgB
obtained from genome mining. Based on the genome mining result, the expected size
of the amplification product was 2013 bp. However, the result from PCR showed
larger size than what was expected, that is around 3500 bp (Figure 12). From the gel
electrophoresis result, it can be seen that the PCR products gave a single band,
meaning that both forward and reverse PCR primers designed were specifically
bound to the template and able to amplify the gene. Therefore, the PCR products
were purified and sent for DNA sequencing.

© COPYRIG
HT UPM
68
Figure 12. Gel electrophoresis of PCR products. M: GeneRuler 1 kb DNA Ladder.
Lane 1: PCR product with the size of about 3.5 kb.
4.5.1 DNA sequencing of PCR product
Both forward and reverse PCR primers were used to sequence the purified PCR
products. Due to the large size of the PCR product, additional two primers were
designed to sequence the PCR product by primer walking. The forward primer (F4)
was designed at nucleotides 647 to 664 and the reverse primer (R3) was designed at
nucleotide 1346 to 1369.
Forward primer, F4: 5’– TGA CAA GCC GCT ATG GCA –3’
Reverse primer, R3: 5’– CCA TCA TGT AGC CAT ACA ATA GGC –3’
The results were analysed by aligning the DNA sequencing results with the expected
gene sequence in Figure 8, p. 56. The sequencing result shows 1226 bp from the 5’
end of the gene and 775 bp from 3’ end of gene have 99% identities when compared
to the putative gene sequence. However, the sequence in the middle of the gene,
which made up of about 2000 bp, was foreign to the glycogen branching enzyme
gene. The DNA sequencing results were BLAST in NCBI database and show that the
foreign sequence was a transposase IS116/IS110/IS902 family protein (GenBank:
M 1
5 kb
4 kb
3.5 kb
3 kb
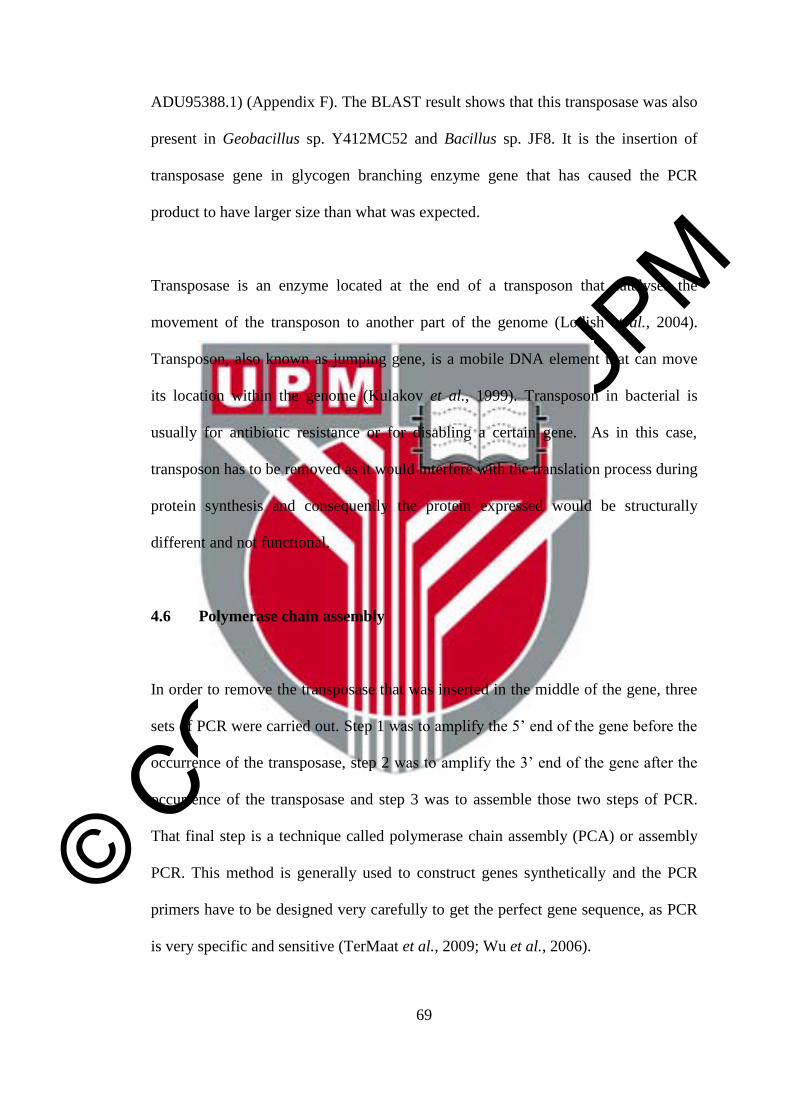
© COPYRIG
HT UPM
69
ADU95388.1) (Appendix F). The BLAST result shows that this transposase was also
present in Geobacillus sp. Y412MC52 and Bacillus sp. JF8. It is the insertion of
transposase gene in glycogen branching enzyme gene that has caused the PCR
product to have larger size than what was expected.
Transposase is an enzyme located at the end of a transposon that catalyses the
movement of the transposon to another part of the genome (Lodish et al., 2004).
Transposon, also known as jumping gene, is a mobile DNA element that can move
its location within the genome (Kulakov et al., 1999). Transposon in bacterial is
usually for antibiotic resistance or for disabling a certain gene. As in this case,
transposon has to be removed as it would interfere with the translation process during
protein synthesis and consequently the protein expressed would be structurally
different and not functional.
4.6 Polymerase chain assembly
In order to remove the transposase that was inserted in the middle of the gene, three
sets of PCR were carried out. Step 1 was to amplify the 5’ end of the gene before the
occurrence of the transposase, step 2 was to amplify the 3’ end of the gene after the
occurrence of the transposase and step 3 was to assemble those two steps of PCR.
That final step is a technique called polymerase chain assembly (PCA) or assembly
PCR. This method is generally used to construct genes synthetically and the PCR
primers have to be designed very carefully to get the perfect gene sequence, as PCR
is very specific and sensitive (TerMaat et al., 2009; Wu et al., 2006).

© COPYRIG
HT UPM
70
The PCR products of step 1, step 2 and PCA gave the expected size of 1239 bp, 788
bp and 2013 bp, respectively (Figure 13). These PCR products were sent for DNA
sequencing for verification. Primers F1, F4, R1 and R3 were used to sequence the
PCR products. The DNA sequencing results were aligned with the predicted gene
sequence (refer to Figure 8, p. 56) and it is confirmed that the gene, glgB, has been
amplified without the transposase integration as the sequences matched the predicted
gene sequence. The gene sequence was deposited to GenBank (accession number:
KC951870).
4.7 Cloning of PCR products
The PCR product, which was the amplified glgB, was cloned into pET102/D-TOPO®
vector in E. coli TOP10. To use this system, the PCR product must have 5’ overhang
that was made by adding four bases (CACC) to the forward primer, F3. The PCR
product was directionally cloned into the vector as the 5’ overhang of the PCR
product annealed to the 3’ overhang of the vector by topoisomerase. When the
cloning reaction was spread on LB/Ampicillin plates, less than 10 colonies were
observed. According to the manufacturer’s instructions, it is expected that the
colonies obtained would be 2 to 5-fold fewer compared to traditional bidirectional
TOPO TA cloning and high-copy number TOPO® plasmids. This is because
pET102/D-TOPO®
vector has a pBR322 origin for low-copy replication. The
manufacturer also stated that even though only a few colonies were obtained, more
than 90% of these colonies contain plasmid with the gene insert in the correct
orientation. All these colonies were isolated and subcultured in LB/Ampicillin
broths. The recombinant plasmids were extracted and used for further analysis.

© COPYRIG
HT UPM
71
Figure 13. Gel electrophoresis of PCR and PCA products. M: GeneRuler 1 kb
DNA Ladder. Lane 1: Second step PCR product. Lane 2: First step PCR product.
Lane 3: PCA product.
4.8 Analysing transformed recombinant plasmids
Recombinant plasmid DNA was purified from 5 mL LB/Ampicillin broth and
analysed to ensure that the gene was successfully cloned into the vector in the correct
orientation. PCR was done using pET/GBE as the DNA template. Two sets of PCR
primers were used, set 1 (PCR primers, F1 and R1) and set 2 (TrxFus forward and T7
reverse). The expected sizes of the amplification product were 2013 bp and 2249 bp,
respectively. The PCR product using the primers provided by the kit was larger as
these primers would anneal to the sites on the vector and therefore would amplify
some part of the vector together with the gene (Appendix C). The results from
agarose gel electrophoresis meet the expected sizes (Figure 14).
M 1 2 M 3

© COPYRIG
HT UPM
72
Figure 14. Gel electrophoresis of PCR product from pET/GBE. M: GeneRuler 1
kb DNA Ladder. Lane 1: PCR product using PCR primers from set 1. Lane 2: PCR
product using primers from set 2.
Another way to analyse the recombinant plasmid was done by restriction enzyme
digestion. Restriction enzymes would digest specific sites on the DNA and the
digestion pattern could be observed from gel electrophoresis. Plasmid DNA might
exist in circular, nicked, supercoiled and linear form. Each form of DNA would
migrate at a different rate in gel electrophoresis although they have the same size.
The digested plasmid DNA would have a linear DNA structure and therefore the
estimation of the DNA size on the gel electrophoresis would be better compared to
circular plasmid DNA. This is because the DNA ladder used as the size guideline is
also in linear form. To see if the cloned plasmid harbours the gene of interest, glgB,
restriction enzymes PstI and BglII was used.
The agarose gel electrophoresis results show the expected patterns of the pET/GBE
digestion where single a digestion with PstI was 8328 bp and double digestion with
PstI and BglII gave the products of 3839 bp and 4489 bp (lane 2 and 3 in Figure 15).
Instead, single digestion of an empty plasmid gave the size of
M 1 2
2.5 kb
2 kb
1.5 kb
1 kb
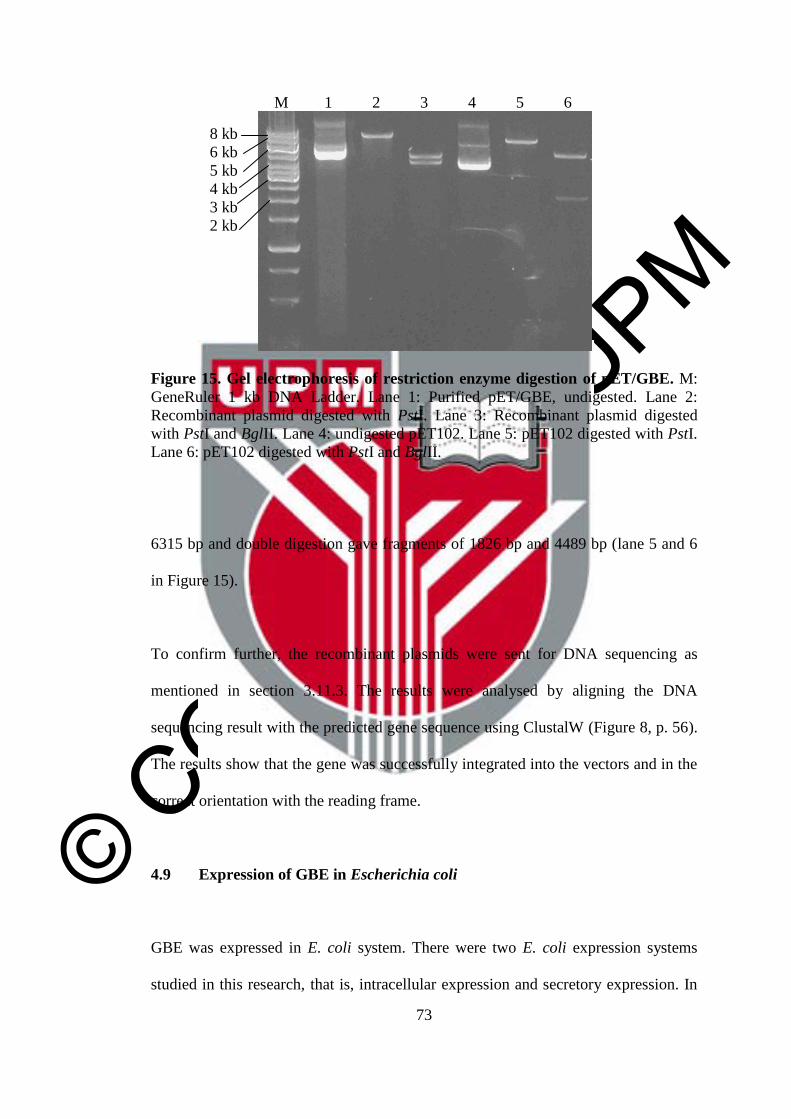
© COPYRIG
HT UPM
73
Figure 15. Gel electrophoresis of restriction enzyme digestion of pET/GBE. M:
GeneRuler 1 kb DNA Ladder. Lane 1: Purified pET/GBE, undigested. Lane 2:
Recombinant plasmid digested with PstI. Lane 3: Recombinant plasmid digested
with PstI and BglII. Lane 4: undigested pET102. Lane 5: pET102 digested with PstI.
Lane 6: pET102 digested with PstI and BglII.
6315 bp and double digestion gave fragments of 1826 bp and 4489 bp (lane 5 and 6
in Figure 15).
To confirm further, the recombinant plasmids were sent for DNA sequencing as
mentioned in section 3.11.3. The results were analysed by aligning the DNA
sequencing result with the predicted gene sequence using ClustalW (Figure 8, p. 56).
The results show that the gene was successfully integrated into the vectors and in the
correct orientation with the reading frame.
4.9 Expression of GBE in Escherichia coli
GBE was expressed in E. coli system. There were two E. coli expression systems
studied in this research, that is, intracellular expression and secretory expression. In
M 1 2 3 4 5 6
8 kb
6 kb
5 kb
4 kb
3 kb
2 kb

© COPYRIG
HT UPM
74
intracellular expression, the expressed G5GBE would be accumulated in the cell
cytoplasm, while in secretory expression, G5GBE would be secreted to the
extracellular environment, that is the culture medium, with the help from BRP. Since
the intracellular expression produced higher enzyme expression in shorter time,
therefore the enzyme produced by this system was chosen to be purified and used for
enzyme characterisation.
4.9.1 Intracellular expression of G5GBE
Recombinant plasmid was transformed into E. coli BL21 StarTM
(DE3) to express the
GBE. Protein expression using expression vector pET102/D-TOPO® is regulated by
a strong bacteriophage T7 promoter that have a lac operator sequence. For the gene
of interest to be expressed, T7 RNA polymerase that was supplied by E. coli BL21
StarTM
(DE3) will bind to the promoter and initiate the transcription of the gene of
interest. Three parameters that prominently affect the level of protein expression
have been optimised to achieve a high level of protein expression; the inducer
concentration, induction temperature and induction time (Berrow et al., 2006;
Baneyx, 1999; Markrides, 1996).
4.9.1.1 Effect of IPTG concentration
Isopropylthio-β-galactoside (IPTG) was used as the inducer that allows the
expression of T7 RNA polymerase. T7 RNA polymerase is very selective for T7
promoter that is naturally absent in E. coli (Studier and Moffatt, 1986). Therefore it
can be used to regulate the expression of the gene of interest. The E. coli BL21

© COPYRIG
HT UPM
75
StarTM
(DE3) harbouring pET/GBE was induced with different concentrations of
IPTG up to 1 mM of final concentration to optimise GBE production (Figure 16).
Expression was done for 12 hours of induction at 37°C.
The expression was found to be at the highest level when induced with 0.75 mM
IPTG with the enzyme activity of 50.18 U/mL and went down to 48 U/mL when the
IPTG was increased to 1 mM. The activity, which indicates the amount of active
enzyme produced, was slightly lower when 1 mM of IPTG was used. This might due
to the inclusion bodies formation. Inclusion bodies are the proteins that are
incorrectly folded due to high rate of protein synthesis (Gonzalez-Montalban et al.,
2007; Berrow et al., 2006). The possibility of protein to misfold is high with the use
of strong promoters and also with high inducer concentration (Baneyx and Mujacic,
2004). Basal expression was detected since 12 U/mL of branching enzyme activity
was observed during the absence of inducer. This basal expression is common in T7
promoter and will not cause any problem unless the recombinant protein expressed is
toxic and that may cause plasmid instability or even cell death (Studier and Moffatt,
1986).
The expressed protein was visualised in SDS-PAGE (Figure 17). There are obvious
bands near the 116 kDa marker that could be G5GBE as the expected size of the
fusion protein was 91 kDa. The band appears the brightest when expression was
induced with 0.75 mM, but the expression level of active enzyme cannot be
determined accurately. Therefore the expression level had to be confirmed by doing
enzyme assay.
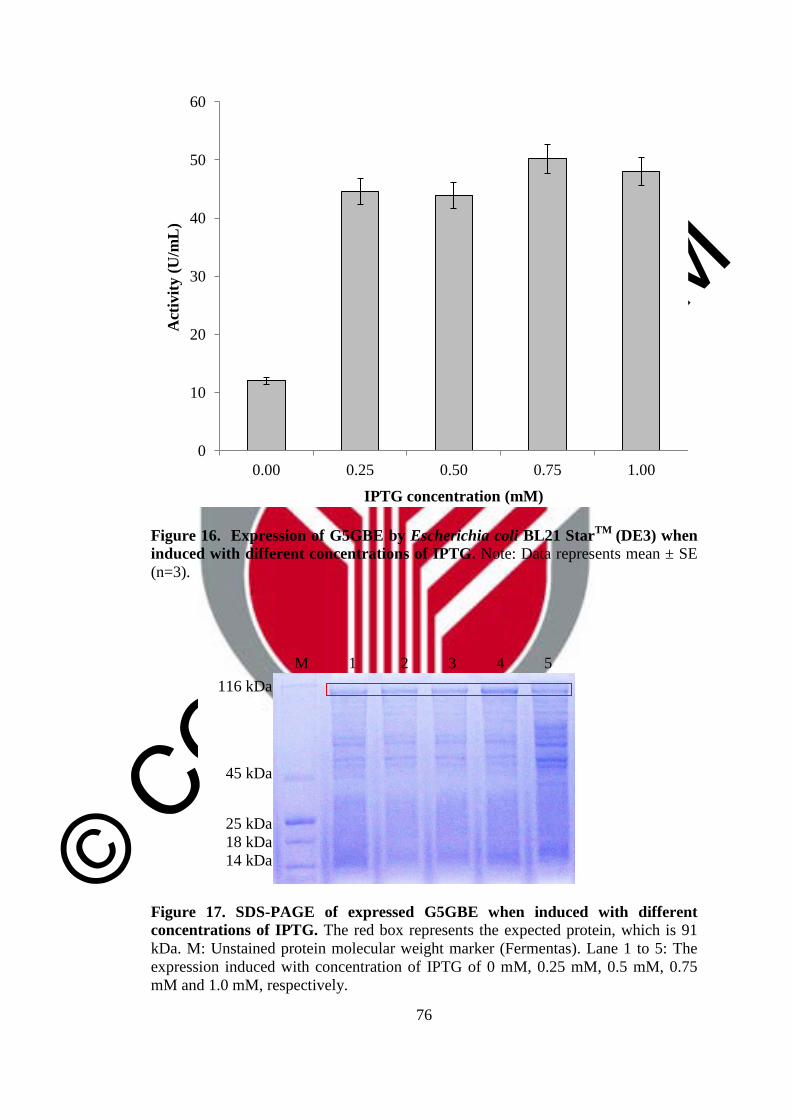
© COPYRIG
HT UPM
76
Figure 16. Expression of G5GBE by Escherichia coli BL21 StarTM
(DE3) when
induced with different concentrations of IPTG. Note: Data represents mean ± SE
(n=3).
Figure 17. SDS-PAGE of expressed G5GBE when induced with different
concentrations of IPTG. The red box represents the expected protein, which is 91
kDa. M: Unstained protein molecular weight marker (Fermentas). Lane 1 to 5: The
expression induced with concentration of IPTG of 0 mM, 0.25 mM, 0.5 mM, 0.75
mM and 1.0 mM, respectively.
0
10
20
30
40
50
60
0.00 0.25 0.50 0.75 1.00
Act
ivit
y (
U/m
L)
IPTG concentration (mM)
116 kDa
45 kDa
25 kDa
18 kDa
14 kDa
M 1 2 3 4 5

© COPYRIG
HT UPM
77
4.9.1.2 Effect of induction temperature
To investigate the effect of induction temperature on the level of active enzyme
production, expression was induced with 0.75 mM of IPTG for 12 hours. The effect
of induction temperature on G5GBE expression is shown in Figure 18. Cultivation
at 30°C resulted in the best of G5GBE production where 51.7 U/mL of enzyme
activity was detected. Cultivation at 37°C however hampered the expression level of
active enzyme to 48.6 U/mL.
The induction temperature is known to affect the synthesis of recombinant protein.
The growth of E. coli is optimum at 37°C. The cells grow rapidly at this temperature
and therefore the rate of recombinant protein expression is high. However, the rapid
protein expression at this temperature may cause the expressed protein to misfold
and aggregates (Baneyx and Mujacic, 2004). The misfolded proteins, also called as
inclusion bodies, are not active. As a result, expression level of active enzyme, which
is determined by enzyme activity, at temperature above 30°C is usually lower when
compared to expression level at lower temperature. The reason behind this is at lower
temperature, the synthesis rate is slower and that would promote proper protein
folding. Nonetheless, expression at temperature lower than 20°C seems to have no
significant effect (Berrow et al., 2006). This phenomenon was also observed in the
expression of preS2-S’-β-galactosidase in E. coli where the level of active enzyme
obtained was higher when the induction temperature was shifted from 37°C to 25°C
and 20°C (Vasina and Baneyx, 1996). Thus, for the purpose of this research, the
cultivation temperature of 30°C was chosen for further optimisation study. The
expressed proteins were visualised in SDS-PAGE (Figure 19). The bands that

© COPYRIG
HT UPM
78
Figure 18. Expression of G5GBE by Escherichia coli BL21 StarTM
(DE3) when
induced at different temperatures. Note: Data represents mean ± SE (n=3).
Figure 19. SDS-PAGE of expressed G5GBE when induced at different
temperatures. The red box represents the expected size of the protein, which is 91
kDa. M: Broad Range Prestained Protein Marker (Nacalai). Lane 1 to 4: The
expression induced at temperature of 20°C, 25°C, 30°C and 37°C, respectively.
0
10
20
30
40
50
60
20°C 25°C 30°C 37°C
Act
ivit
y (
U/m
L)
Induction temperature
1 2 3 4 M
200 kDa
116 kDa
89 kDa
62 kDa
46 kDa
38 kDa
26 kDa
19 kDa

© COPYRIG
HT UPM
79
represent expression at 30°C and 37°C appear to be thicker than expression at 20°C
and 25°C. However, the SDS-PAGE result is not as conclusive as the enzyme assay.
4.9.1.3 Effect of induction time
The effect of induction time was determined by inducing the culture with 0.75 mM
of IPTG at 30°C. The expression of active enzyme and cell growth was determined
every 4 hours for 28 hours (Figure 20). Basal protein expression was observed as
enzyme activity was detected at 0 hour of induction. The expression increased almost
2-fold from 17.7 U/mL to 32.5 U/mL after 4 hours of induction. The enzyme activity
continued to increase drastically to 39.6 U/mL when expression was induced for 8
hours. The expression reached a maximum level at 12 hours of induction with the
activity of 41.6 U/mL.
Even that so, 8 hours was chosen as the optimum expression level with enzyme
activity of 39.6 U/mL as the growth curve shows that the culture was still in log
phase at that hour and already gone to stationary phase at 12 hours. Moreover, there
was not much difference in enzyme activity at 8 hours and 12 hours. As the growth
entered the stationary phase after 12 hours of induction, the expression level
gradually dropped. This is probably caused by the depletion of oxygen and nutrient
in the medium and to adapt to that condition, the cells focus on their metabolisms to
maintain their viability. Therefore, protein expression is decreased (Sezonov et al.,
2007; Studier, 2005).
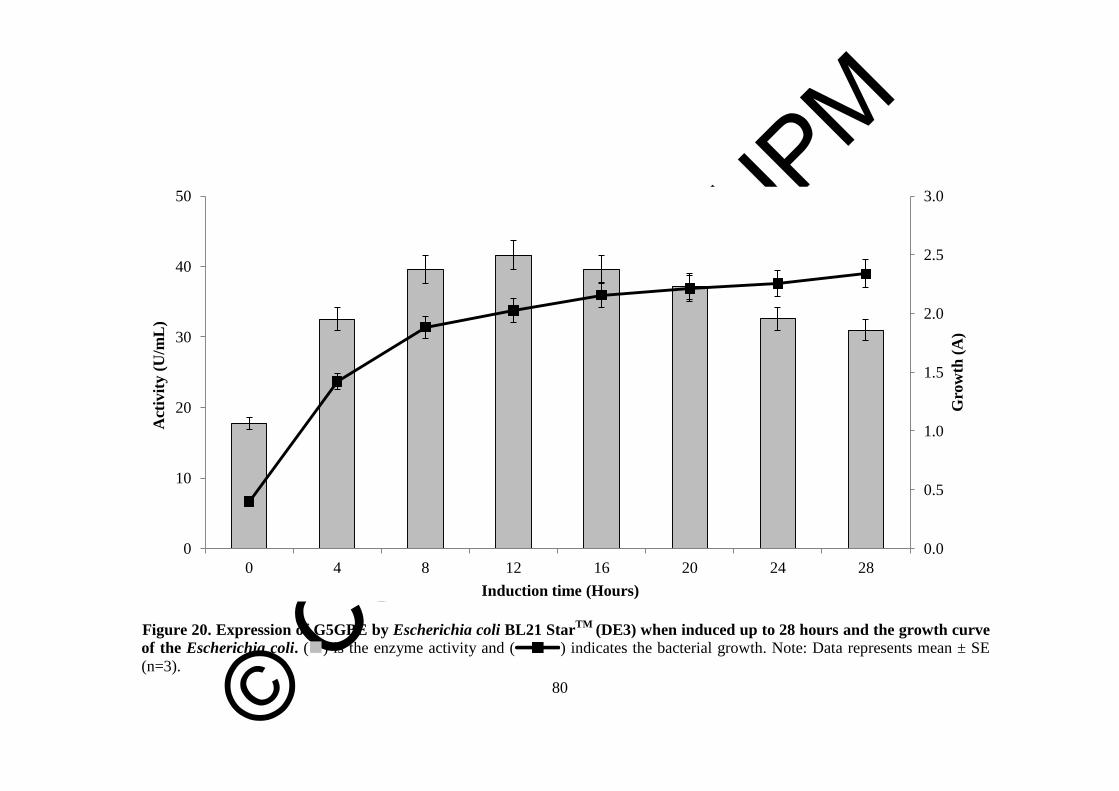
© COPYRIG
HT UPM
80
Figure 20. Expression of G5GBE by Escherichia coli BL21 StarTM
(DE3) when induced up to 28 hours and the growth curve
of the Escherichia coli. () is the enzyme activity and ( ) indicates the bacterial growth. Note: Data represents mean ± SE
(n=3).
0.0
0.5
1.0
1.5
2.0
2.5
3.0
0 4 8 12 16 20 24 28
0
10
20
30
40
50
Gro
wth
(A
)
Induction time (Hours)
Act
ivit
y (
U/m
L)

© COPYRIG
HT UPM
81
4.9.2 Secretory expression of G5GBE
When both pET/GBE and pSW1 were expressed in the same host (E. coli BL21
(DE3) StarTM
), BRP, which was expressed by pSW1 vector, would form permeable
zones allowing the secretion of GBE into the extracellular environment (van der Wal
et al., 1995).
4.9.2.1 Analysis of positive transformants
To confirm that the host cells are harbouring pET/GBE and pSW1 vector, the
positive transformants were analysed by digesting the purified plasmids with
restriction enzyme HindIII so that the plasmids became linear. Linear plasmids
would give better accuracy of size estimation on gel electrophoresis compared to
circular plasmids. From the digestion reactions, two bands are seen on the gel
electrophoresis result (Figure 21). The sizes of the bands meet the expectation, 8.3 kb
for pET/GBE and 4 kb for pSW1 vector.
4.9.2.2 Quasi-lysis test
Growth of transformed cells in media containing the appropriate antibiotics for
selection did not confirm that pSW1 vector would be expressing a functional BRP.
The vectors that were transformed into the host cells have to be checked for
inducible BRP function using a quasi-lysis test (van der Wal et al., 1995). The basis
of this test is the decline in culture turbidity and cell viability when BRP is expressed
in the absence of divalent metal ions (van der Wal et al., 1998).

© COPYRIG
HT UPM
82
Figure 21. Gel electrophoresis of restriction enzyme digestion of pSW1 and
pET/GBE. M: GeneRuler 1 kb DNA Ladder. Lane 1 and 2: Undigested pSW1
vector and pET/GBE. Lane 3 and 4: pSW1 and pET/GBE digested with HindIII.
In Figure 22, it is shown that BRP was expressed and functional as the fully induced
culture declined in turbidity right after an hour of induction. The growth of the
culture induced with 20 ng/mL of mitomycin C also declined but after 4 hours of
induction. The control culture, which harboured pSW1 vector but was not induced
with mitomycin C, continued to grow during the 6 hours studied period. These
results show that induction with mitomycin C affects the expression of BRP and
consequently hampers the cell growth by inducing cell lysis.
4.9.2.3 Effect of mitomycin C concentration on secretory expression
The E. coli BL21 StarTM
(DE3) harbouring both pET/GBE and pSW1 vector was
induced with both IPTG and mitomycin C at the same time when optical density at
A600 reached 0.5. In order to see the effect of mitomycin C on secretory
10 kb 8 kb
6 kb
3 kb
M 1 2 M 3 4
pET/GBE
pSW1
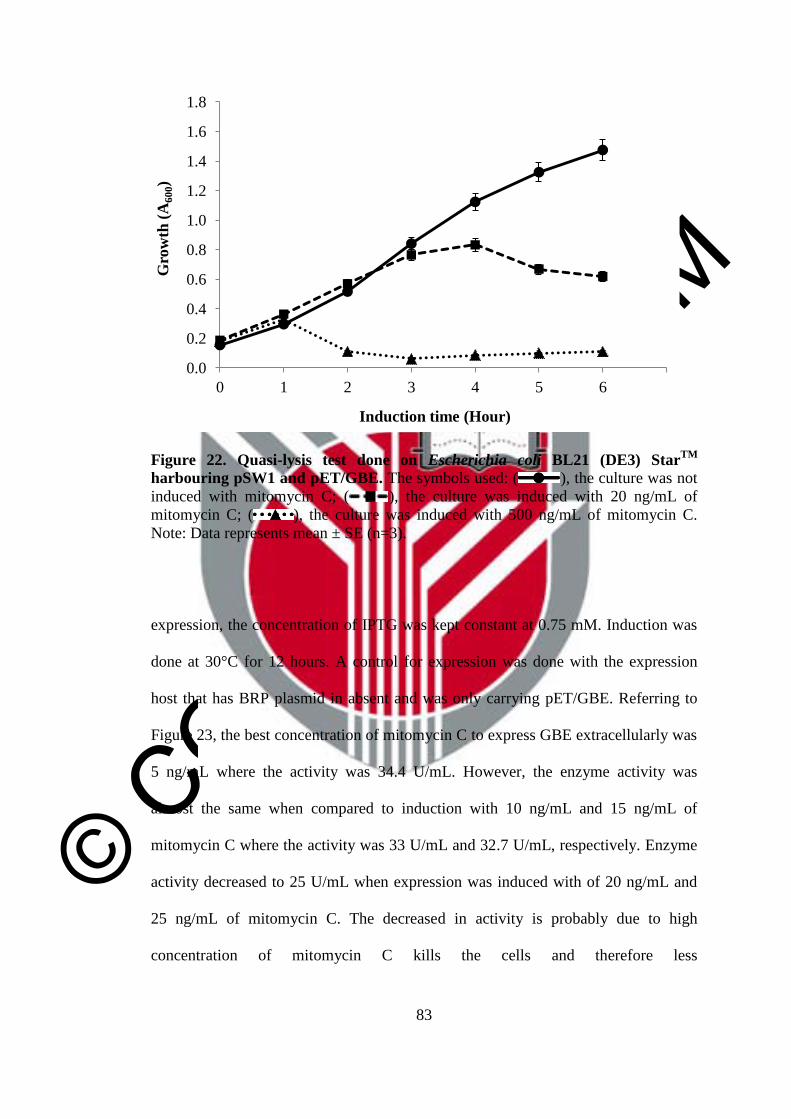
© COPYRIG
HT UPM
83
Figure 22. Quasi-lysis test done on Escherichia coli BL21 (DE3) StarTM
harbouring pSW1 and pET/GBE. The symbols used: ( ), the culture was not
induced with mitomycin C; ( ), the culture was induced with 20 ng/mL of
mitomycin C; ( ), the culture was induced with 500 ng/mL of mitomycin C.
Note: Data represents mean ± SE (n=3).
expression, the concentration of IPTG was kept constant at 0.75 mM. Induction was
done at 30°C for 12 hours. A control for expression was done with the expression
host that has BRP plasmid in absent and was only carrying pET/GBE. Referring to
Figure 23, the best concentration of mitomycin C to express GBE extracellularly was
5 ng/mL where the activity was 34.4 U/mL. However, the enzyme activity was
almost the same when compared to induction with 10 ng/mL and 15 ng/mL of
mitomycin C where the activity was 33 U/mL and 32.7 U/mL, respectively. Enzyme
activity decreased to 25 U/mL when expression was induced with of 20 ng/mL and
25 ng/mL of mitomycin C. The decreased in activity is probably due to high
concentration of mitomycin C kills the cells and therefore less
0.0
0.2
0.4
0.6
0.8
1.0
1.2
1.4
1.6
1.8
0 1 2 3 4 5 6
Gro
wth
(A
60
0)
Induction time (Hour)
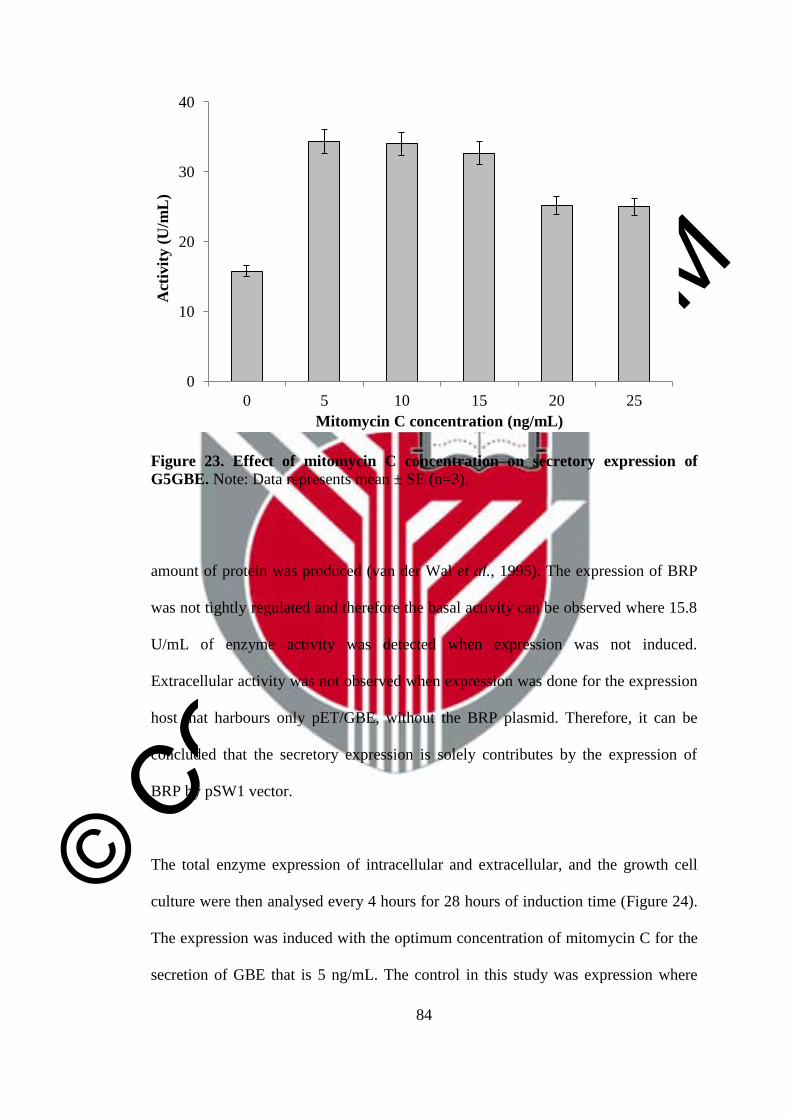
© COPYRIG
HT UPM
84
Figure 23. Effect of mitomycin C concentration on secretory expression of
G5GBE. Note: Data represents mean ± SE (n=3).
amount of protein was produced (van der Wal et al., 1995). The expression of BRP
was not tightly regulated and therefore the basal activity can be observed where 15.8
U/mL of enzyme activity was detected when expression was not induced.
Extracellular activity was not observed when expression was done for the expression
host that harbours only pET/GBE, without the BRP plasmid. Therefore, it can be
concluded that the secretory expression is solely contributes by the expression of
BRP by pSW1 vector.
The total enzyme expression of intracellular and extracellular, and the growth cell
culture were then analysed every 4 hours for 28 hours of induction time (Figure 24).
The expression was induced with the optimum concentration of mitomycin C for the
secretion of GBE that is 5 ng/mL. The control in this study was expression where
0
10
20
30
40
0 5 10 15 20 25
Act
ivit
y (
U/m
L)
Mitomycin C concentration (ng/mL)

© COPYRIG
HT UPM
85
A
B
Figure 24. Secretory expression of G5GBE. A: Secretory expression was induced
with 5 ng/mL of mitomycin C. B: Secretory expression was not induced with
mitomycin C as a control. The symbols used: (), enzyme activity from intracellular
protein; (), enzyme activity from extracellular protein; ( ), bacterial growth. The
values inside the bars are the values of Y-axis, activity (U/mL). Note: Data
represents mean ± SE (n=3).
14
.8
20
.0
43
.0
43
.9
40
.0
36
.4
35
.0
35
.7
1.3
1.1
34
.1
35
.6
37
.0
38
.9
38
.6
39
.5
0.0
0.2
0.4
0.6
0.8
1.0
1.2
1.4
0
10
20
30
40
50
0 4 8 12 16 20 24 28
Gro
wth
(A
60
0)
Act
ivit
y (
U/m
L)
Induction time (Hours)
7.6
30
.0
45
.4
44
.6
42
.9
37
.7
36
.7
35
.6
0.0
0.0
20
.5
21
.0
37
.0
40
.9
39
.2
40
.4
0.0
0.4
0.8
1.2
1.6
2.0
0
10
20
30
40
50
0 4 8 12 16 20 24 28
Gro
wth
(A
60
0)
Act
ivit
y (
U/m
L)
Induction time (Hours)
© COPYRIG
HT UPM
86
only pET/GBE was induced while the BRP plasmid was not (Figure 24B). The
protein started to be secreted into the extracellular environment after 8 hours of
induction when expression was induced with mitomycin C. The extracellular enzyme
activity was 34.1 U/mL, which is 66% more than activity obtained when the
expression was not induced with mitomycin C, 20.5 U/mL. The secretion of enzyme
increased gradually parallel with the induction time. The highest expression was
achieved at 20 hours of induction with the enzyme activity of 39.5 U/ mL.
As shown in Figure 24A, the induced expression was going down after 8 hours. This
indicates that cell lysis has occurred (van der Wal et al., 1995). The effect of this cell
lysis was reflected in the enzyme expression as the total of intracellular and
extracellular enzyme activity decreased. As more cells died, fewer amount of enzyme
was produced. As seen in Figure 24A, although secretory expression was induced,
the enzyme was still entrapped in the cell since intracellular expression was present.
However, the intracellular enzyme became lessen as time prolonged while
extracellular enzyme increase. The cell lysis, which represented in the drop of the
growth curve, promotes the release of recombinant protein into the culture media
(van der Wal et al., 1995).
As for the control (Figure 24B), the total activity (79.9 U/mL) was higher compared
to the induced expression (77.0 U/mL) when induction was done for 16 hours and
more. The reason behind this is that the total viable cells are more in the non-induced
expression compared to the induced expression where the cell growth was declining.
Hence, the amount of protein produced by the control expression, which was
detected as the enzyme activity, was higher. Although the control expression was not
© COPYRIG
HT UPM
87
induced with mitomycin C, the expressed protein was still secreted out of the cell. As
mentioned before, this is the basal expression of BRP since the expression of BRP is
not tightly regulated (van der Wal et al., 1995). In conclusion, secretory expression
using pSW1 vector was not very successful in secreting all the expressed
recombinant protein to the extracellular environment.
4.10 Purification of G5GBE
G5GBE produced by pET102/D-TOPO®
expression vector has His-Patch
thioredoxin fused to the protein. His-Patch thioredoxin is a mutated thioredoxin that
have metal binding domain, which has been shown to have high affinity for divalent
cations. Therefore the fusion protein can be purified using metal chelating resins like
nickel sepharose. Fusion GBE was purified using HisTrap HP column by affinity
chromatography performed using Äkta Explorer system (GE Healthcare). As
presented in the chromatogram, the enzyme was eluted at about 25%B, which means
25% of elution buffer (Figure 25). The pooled fractions (fraction B5 and B6) was run
in SDS-PAGE and assayed for enzyme activity and protein content. As shown in
Table 7, the recovery obtained was 84% with a purification fold of 10. Figure 26
shows the SDS-PAGE result where a single band is observed for the purified enzyme
(lane 3). This means that the enzyme was successfully purified. It is important to
purify the enzyme before proceeds to enzyme characterisation to ensure the accuracy
and validity of the results because the contaminants might affect the enzyme activity
and stability.

© COPYRIG
HT UPM
88
Figure 25. Chromatogram of affinity chromatography performed using Äkta
Explorer. The blue line indicates the absorbance reading at A280 in milli absorbance
unit (mAU) and the green line indicates the %B (% of elution buffer).
Figure 26. SDS-PAGE of purified enzyme. M: Broad Range Prestained Protein
Marker (Nacalai). Lane 1: Crude enzyme. Lane 2: Protein in flowthrough fractions.
Lane 3: Purified enzyme.
200 kDa
116 kDa
89 kDa
62 kDa
46 kDa
38 kDa
26 kDa
19 kDa
M 1 2 3
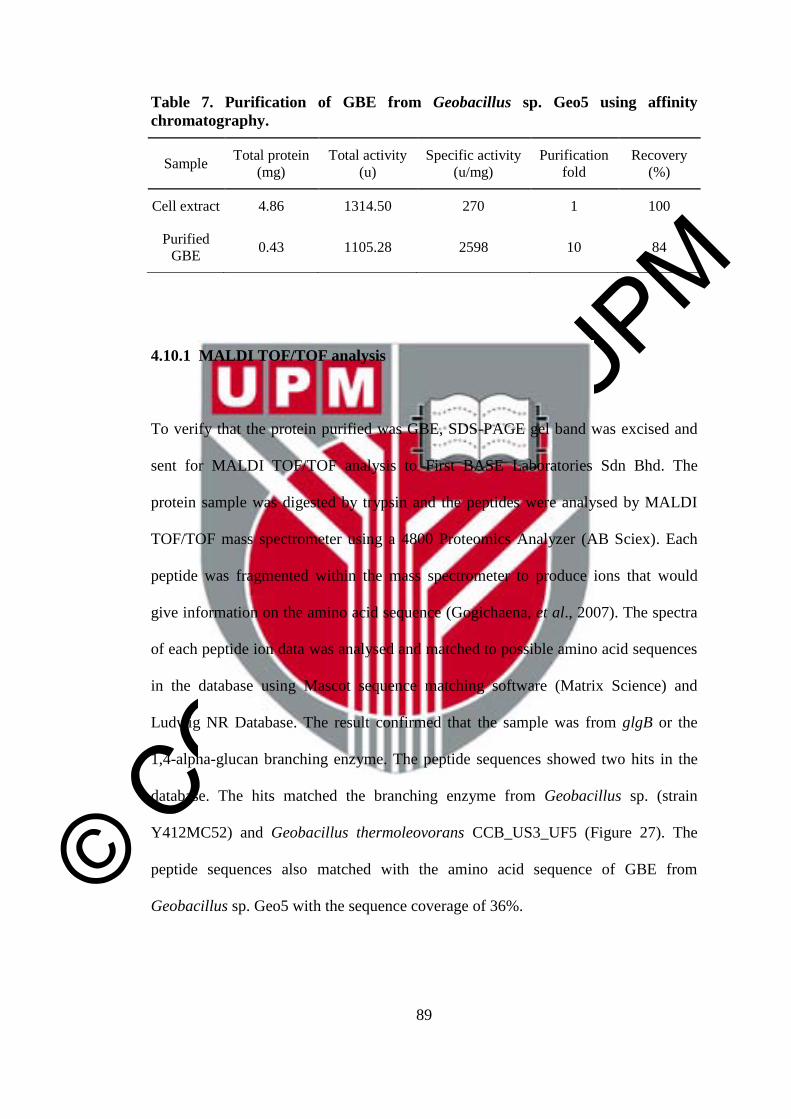
© COPYRIG
HT UPM
89
Table 7. Purification of GBE from Geobacillus sp. Geo5 using affinity
chromatography.
Sample Total protein
(mg)
Total activity
(u)
Specific activity
(u/mg)
Purification
fold
Recovery
(%)
Cell extract 4.86 1314.50 270 1 100
Purified
GBE 0.43 1105.28 2598 10 84
4.10.1 MALDI TOF/TOF analysis
To verify that the protein purified was GBE, SDS-PAGE gel band was excised and
sent for MALDI TOF/TOF analysis to First BASE Laboratories Sdn Bhd. The
protein sample was digested by trypsin and the peptides were analysed by MALDI
TOF/TOF mass spectrometer using a 4800 Proteomics Analyzer (AB Sciex). Each
peptide was fragmented within the mass spectrometer to produce ions that would
give information on the amino acid sequence (Gogichaena, et al., 2007). The spectra
of each peptide ion data was analysed and matched to possible amino acid sequences
in the database using Mascot sequence matching software (Matrix Science) and
Ludwig NR Database. The result confirmed that the sample was from glgB or the
1,4-alpha-glucan branching enzyme. The peptide sequences showed two hits in the
database. The hits matched the branching enzyme from Geobacillus sp. (strain
Y412MC52) and Geobacillus thermoleovorans CCB_US3_UF5 (Figure 27). The
peptide sequences also matched with the amino acid sequence of GBE from
Geobacillus sp. Geo5 with the sequence coverage of 36%.

© COPYRIG
HT UPM
90
Geobacillus sp. Geo5. Protein sequence coverage: 36%
1 MRSSLIAANP TDLEVYLFHE GRLYQSYELF GAHVIRDGGA VGTRFCVWAP
51 HAREVRLVGS FNDWNGANSP LTKVNDEGVW TIVVPENLEG HLYKYEIITP
101 DGRVLLKADP YAFYSELRPH TASIVYDLKG YEWNDSSWQR KKRRKRIYDQ
151 PMVIYELHFG SWKKKPDGRF YTYREMADEL IPYVLERGFT HIELLPLVEH
201 PLDRSWGYQG TGYYSVTSRY GTPHDFMYFV DRCHQAGLGV IIDWVPGHFC
251 KDAHGLYMFD GAPTYEYANE KDRENYVWGT ANFDLGKPEV RSFLISNALF
301 WLEYYHVDGF RVDAVANMLY WPNNDRLYEN PYAVEFLRQL NEAVFAYDPS
351 VLMIAEDSTD WPRVTAPTYD GGLGFNYKWN MGWMNDMLKY METPPHERKY
401 AHNQVSFSLL YAYSENFILP FSHDEVVHGK KSLLNKMPGS YEEKFAQLRL
451 LYGYMMAHPG KKLLFMGSEF AQFDEWKFEG ELDWVLFDFE LHRKMDEYVK
501 QLIACYKRYK PFYELDHDPR GFEWIDVHNA EQSIFSFIRR GKKEGDVLVI
551 VCNFTNQAYD DYKVGVPLLA PYREVLNSDA AEFGGSGHVN GKRLPAFHEP
601 FHGKPYHVRM TIPPFGISIL RPVQKRGERK QNEEEVHRHV IGRRARKPAS
651 LADEKHRETG RAVWGEVPDH
Geobacillus sp. (strain Y412MC52). Protein sequence coverage: 32%
1 MYGHHFASER MRSSLIAANP TDLEVYLFHE GRLYQSYELF GAHVIRDGGA
51 VGTRFCVWAP HAREVRLVGS FNDWNGANSP LTKVNDEGVW TIVVPENLEG
101 HLYKYEIITP DGRVLLKADP YAFYSELRPH TASIVYDLKG YEWNDSSWQR
151 KKRRKRIYDQ PMVIYELHFG SWKKKPDGRF YTYREMADEL IPYVLERGFT
201 HIELLPLVEH PLDRSWGYQG TGYYSVTSRY GTPHDFMYFV DRCHQAGLGV
251 IIDWVPGHFC KDAHGLYMFD GAPTYEYANE KDRENYVWGT ANFDLGKPEV
301 RSFLISNALF WLEYYHVDGF RVDAVANMLY WPNNDRLYEN PYAVEFLRQL
351 NEAVFAYDPN VLMIAEDSTD WPRVTAPTYD GGLGFNYKWN MGWMNDMLKY
401 METPPHERKY AHNQVSFSLL YAYSENFILP FSHDEVVHGK KSLLNKMPGS
451 YEEKFAQLRL LYGYMMAHPG KKLLFMGSEF AQFDEWKFEG ELDWVLFDFE
501 LHRKMDEYVK QLIACYKRYK PFYELDHDPR GFEWIDVHNA EQSIFSFVRR
551 GKKDGDLLVI VCNFTNQAYD DYKVGVPLLA PYREVLNSDA AEFGGSGHVN
601 GKRLPAFSEP FHGKPYHVRM TIPPFGISIL RPVQKRGERK QNEEEVHRHV
651 IGRRARKPAS LADEKHRETS RAVWGEVPDH
Geobacillus thermoleovorans CCB_US3_UF5. Protein sequence coverage: 33%
1 MIAANPTDLE VYLFHEGRLY QSYELFGAHV IRGGGAVGTR FCVWAPHARE
51 VRLVGSFNDW NGANSSLTKV NDEGVWTIVV PENLEGHLYK YEIITPDGRV
101 LLKADPYAFY SELRPHTASI VYDLKGYEWN DSSWQRKKRR KRIYDQPMVI
151 YELHFGSWKK KPDGRFYTYR EMADELIPYV LERGFTHIEL LPLVEHPLDR
201 SWGYQGTGYY SVTSRYGTPH DFMYFVDRCH QAGLGVIIDW VPGHFCKDAH
251 GLYMFDGAPT YEYANEKDRE NYVWGTANFD LGKPEVRSFL ISNALFWLEY
301 YHVDGFRVDA VANMLYWPNN DRLYENPYAV EFLRQLNEAV FAYDPNVWMI
351 AEDSTDWPRV TAPTYDGGLG FNYKWNMGWM NDMLKYMETP PHERKYAHNQ
401 VSFSLLYAYS ENFILPFSHD EVVHGKKSLL NKMPGSYEEK FAQLRLLYGY
451 MMAHPGKKLL FMGSEFAQFD EWKFAEELDW VLFDFELHRK MDEYVKQLIA
501 CYKRYKPFYE LDHDPRGFEW IDVHNAEQSI FSFIRRGKKE GDVLVIVCNF
551 TNQAYDDYKV GVPLLAPYRE VLNSDAAEFG GSGHVNGKRL PAFSEPFHGK
601 PYHVRMTIPP FGISILRPVQ KRGERKQNEE EVHRHVIGRR ARKPASLADE
651 KHRETSRAVW GEVPDH
Figure 27. Hits from the MALDI TOF/TOF analysis. Matched peptides shown in
red.

© COPYRIG
HT UPM
91
4.11 Biochemical characterisation of purified GBE
Three basic biochemical properties (temperature, pH and metal ions) of fusion GBE
were characterised. GBE, which was isolated from a thermophilic bacterium,
Geobacillus sp. Geo5, was stable and active at high temperature. Apart from
temperature, pH and metal ions too affected the enzyme activity.
4.11.1 Effect of temperature on GBE activity and stability
As seen on Figure 28, GBE was generally active at 45°C to 60°C as more than 80%
of GBE activity was obtained and enzyme activity was highest at 55°C. This
optimum temperature of GBE from Geobacillus sp. Geo5 was higher than GBEs
isolated from other thermophilic bacteria, G. stearothermophilus and Anaerobranca
gottschalkii which has the optimum temperature of 50°C (Thiemann et al., 2006;
Takata et al., 1994). However, GBEs isolated from extreme thermophilic bacteria,
Rhodothermus obamensis, Rhodothermus marinus and Aquifex aeolicus showed
higher optimum temperature, that is between 65°C to 80°C (Yoon et al., 2007; van
der Maarel et al., 2003; Shinohara et al., 2001). These bacteria produce enzymes that
are active at higher temperature because the optimal growth temperatures for these
bacteria are higher than Geobacillus sp. Geo5, that is between 65°C to 80°C.
The activation energy of the enzyme was achieved as the assay temperature rise and
therefore, the rates of reactions catalysed by the enzyme increase (Voet and Voet,
2011). But as temperature increased further, GBE activity decreased drastically. The
residual enzyme activity was only about 20% when enzyme was assayed at 70°C and

© COPYRIG
HT UPM
92
Figure 28. Effect of temperature on enzyme activity. GBE activity was assayed at
temperature between 30°C to 80°C. Note: Data represents mean ± SE (n=3).
80°C. This must be due to protein denaturation. As an enzyme is a protein, in an
elevated temperature, the structure of the enzyme including its active site would be
disrupted and therefore the denatured enzyme is not functional and consequently
causes the lost in enzyme activity (Bischof and He, 2005).
To test the thermal stability, the enzyme was heated at 40°C to 80°C. Enzyme
activity was assayed every 4 hours. Referring to Figure 29, enzyme was stable up to
60°C for 24 hours. The enzyme maintained almost all of its activity for 16 hours
when treated at 40°C and 50°C. For 24 hours, the enzyme manage to retained 78%
and 70% when incubated at 40°C and 50°C, respectively. Nonetheless, enzyme
activity drastically drop within 12 hours when treated at 70°C and was
totallyinhibited at 80°C. The half-life of the enzyme at 60°C was 24 hours while at
70°C, 5 hours.
0
20
40
60
80
100
30 40 50 60 70 80
Rel
ati
ve
act
ivit
y (
%)
Temperature (°C)

© COPYRIG
HT UPM
93
Figure 29. Effect of temperature on enzyme stability. GBE was incubated at 40°C
( ), 50°C ( ), 60°C ( ), 70°C ( ) and 80°C ( ) prior to
enzyme assay. Note: Data represents mean ± SE (n=3).
Since this enzyme does not have any disulphide bonds, therefore the stability of this
enzyme is possibly due to the high composition of aromatic amino acid residues.
This GBE is more stable compared to GBE from G. stearothermophilus that has lost
20% of enzyme activity at 60°C in just 30 minutes and A. gottschalkii that has a half-
life of only 55 minutes at 55°C (Thiemann et al., 2006; Takata et al., 1994).
According to the composition of aromatic amino acid residues, G.
stearothermophilus has more, which is 16.3% while Geobacillus sp. Geo5 has only
15.3%. However, the composition of asparagine and glutamine, which often result in
inactivation of an enzyme exposed to high temperature, in G. stearothermophilus is
more, which is 7.7% while Geobacillus sp. Geo5 has only 6.3% (van der Maarel et
al., 2003). This could be the reason why GBE from Geobacillus sp. Geo5 survives
longer in high temperature compared to G. stearothermophilus.
0
20
40
60
80
100
0 2 4 6 8 10 12 14 16 18 20 22 24
Rel
ati
ve
act
ivit
y (
%)
Incubation time (Hours)

© COPYRIG
HT UPM
94
However, if compared to GBE isolated from hyperthermophilic bacteria, R.
obamensis and R. marinus, at 80°C, their half-life was 16 hours and 73.7 minutes,
respectively, while A. aeolicus retained 70% of its activity at 90°C. (Yoon et al.,
2007; van der Maarel et al., 2003; Shinohara et al., 2001). This could also be related
to the composition of aromatic amino acid residues, asparagine and glutamine; as
GBEs isolated from those bacteria have more aromatic amino acid residues and less
asparagine and glutamine residues compared to Geobacillus sp. Geo5. Therefore, this
result confirmed the genome mining result discussed in section 4.1.
4.11.2 Effect of pH on GBE activity and stability
Enzymes are pH sensitive. pH affect the enzyme on four factors that would influence
the enzyme activity; substrate binding, catalytic reaction, ionisation of substrate and
the protein structure (Voet and Voet, 2011). pH can change the ionization state of the
side chains of acidic and basic amino acids, Asp, Glu, Lys, Arg, and His, that made
up the enzyme. The change in ionization state will alter the ionic bonds that establish
the 3D structure of the enzyme and consequently affect the enzyme activity. The
change in pH not only affects the enzyme but it may have effect on the properties of
the substrate too that could inhibit the enzyme-substrate binding.
To determine the effect of pH on GBE activity, iodine stain assay was done at
various pHs. GBE displayed relatively high activity with more than 60% of enzyme
activity in a broad pH range, which is from pH 5 to pH 9 (Figure 30). GBE was
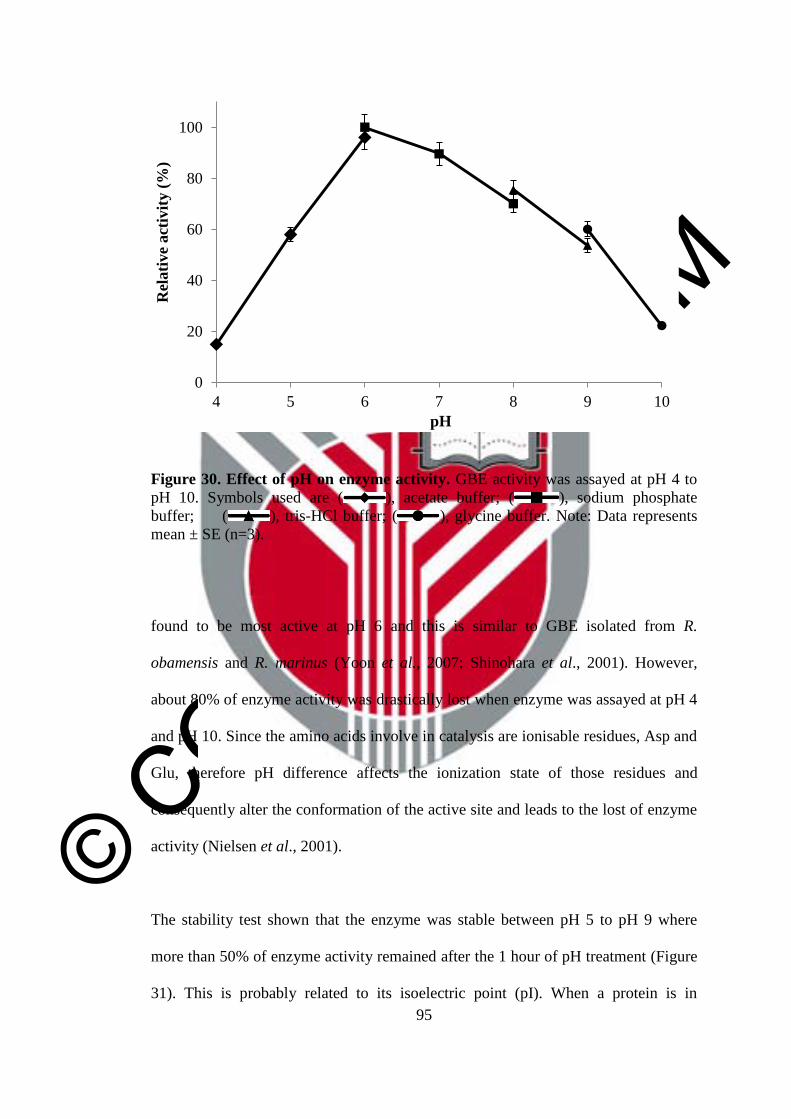
© COPYRIG
HT UPM
95
Figure 30. Effect of pH on enzyme activity. GBE activity was assayed at pH 4 to
pH 10. Symbols used are ( ), acetate buffer; ( ), sodium phosphate
buffer; ( ), tris-HCl buffer; ( ), glycine buffer. Note: Data represents
mean ± SE (n=3).
found to be most active at pH 6 and this is similar to GBE isolated from R.
obamensis and R. marinus (Yoon et al., 2007; Shinohara et al., 2001). However,
about 80% of enzyme activity was drastically lost when enzyme was assayed at pH 4
and pH 10. Since the amino acids involve in catalysis are ionisable residues, Asp and
Glu, therefore pH difference affects the ionization state of those residues and
consequently alter the conformation of the active site and leads to the lost of enzyme
activity (Nielsen et al., 2001).
The stability test shown that the enzyme was stable between pH 5 to pH 9 where
more than 50% of enzyme activity remained after the 1 hour of pH treatment (Figure
31). This is probably related to its isoelectric point (pI). When a protein is in
0
20
40
60
80
100
4 5 6 7 8 9 10
Rel
ati
ve
act
ivit
y (
%)
pH

© COPYRIG
HT UPM
96
Figure 31. Effect of pH on enzyme stability. GBE was incubated for 1 hour at pH 4
to pH 10 prior to assay at pH 7.0. Symbols used are ( ), acetate buffer;
( ), sodium phosphate buffer; ( ), tris-HCl buffer; ( ), glycine
buffer. Note: Data represents mean ± SE (n=3).
an environment with pH too far from its pI, the protein tends to aggregates due to the
lost of electrostatic repulsions (Nielsen et al., 2001; Voet and Voet, 2011). This
aggregation, which is irreversible, impairs the active site and thus causes the protein
to lose its activity. This recombinant GBE, G5GBE, has a theoretical pI of 6.1 and
therefore it can be the reason why enzyme cannot tolerates pH lower than pH 5 and
greater that pH 9. GBEs isolated from other sources in general are also active in this
pH range, pH 5 to 9 (Lee et al., 2008; Garg et al., 2007; Thiemann et al., 2006;
Takata et al., 2005; van der Maarel et al., 2003; Takata et al., 1994). It is important
for GBE to be active in wide range of pH if this enzyme were to be applied in
industries.
0
20
40
60
80
100
4 5 6 7 8 9 10
Rel
ati
ve
act
ivit
y (
%)
pH

© COPYRIG
HT UPM
97
4.11.3 Effect of metal ions on GBE activity
Metals can participate in catalysis whether it is bound to the enzyme or acquired
from the reaction solution along with the substrate (Nelson and Cox, 2005). GBE is
not a metalloenzyme and so does not have metal binding site in its structure.
However, the presence of metal ions could act as an inorganic cofactor to enhance
enzyme activity. There are three properties of metal ions that involve in enzyme
mechanism of reaction (Berg, 1987). Firstly, the electrophilic nature of metal ions
could act as Lewis acids for substrate binding and substrate activation. Secondly,
metal ions can engage in different types of oxidation-reduction processes since they
are stable in various oxidation states. Finally, metal ions can act as cross-linking
agents by binding several protein side chains and consequently enhance the stability
of the enzyme. On the other hand, metal ion may also interrupt the ionic interaction
of a readily stable structure of an enzyme and thus changing the conformation of the
enzyme. In this case, metal ions would show inhibitory effect on the enzyme activity.
Metal ions had different effects on GBE activity but none of the metal ions
experimented enhanced the enzyme activity (Figure 32). Two alkaline earth metals
of group 2 elements (Mg2+
and Ca2+
) were tested. Mg2+
had no effect on enzyme
activity. Also, there was no change in enzyme activity when the enzyme was
incubated with 1 mM Ca2+
. However, the activity was slightly lowered to 73% when
the concentration of Ca2+
increased to 5 mM. Similar results are also observed in
GBE from M. tuberculosis as well as R. marinus, although Mg2+
seems to enhance
the activity of GBE by 15% for R. marinus (Garg et al., 2007; Yoon et al., 2007).
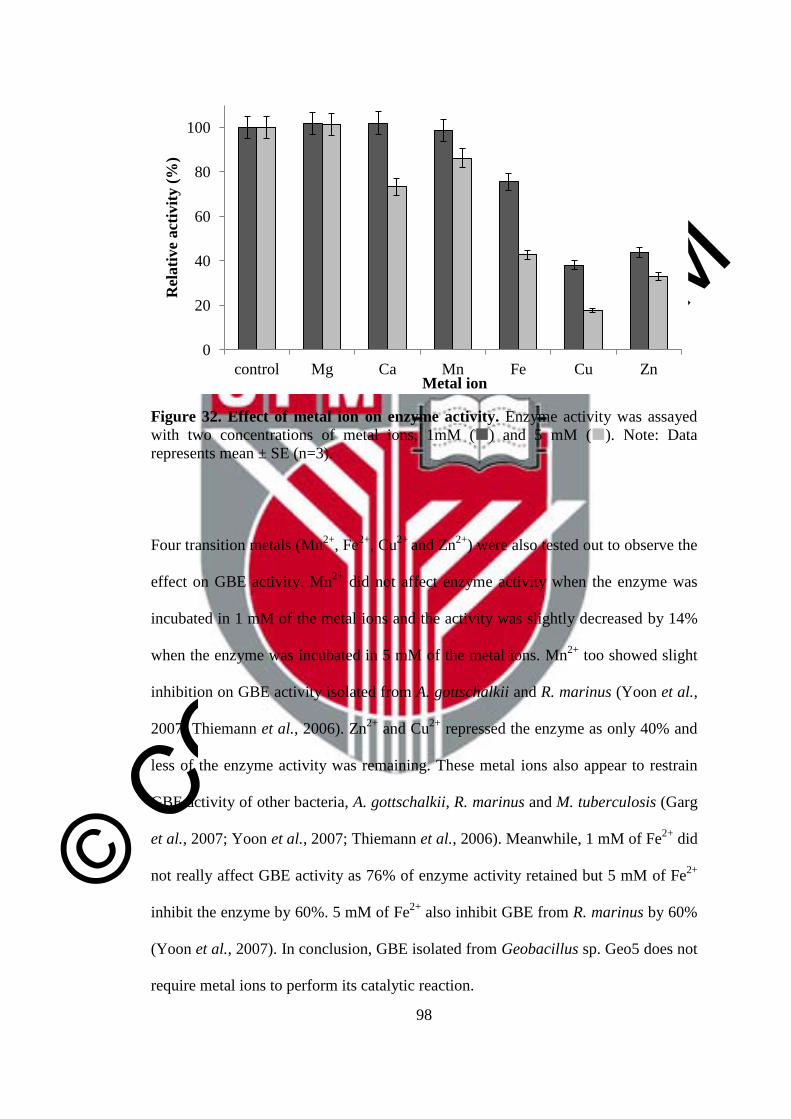
© COPYRIG
HT UPM
98
Figure 32. Effect of metal ion on enzyme activity. Enzyme activity was assayed
with two concentrations of metal ions, 1mM () and 5 mM (). Note: Data
represents mean ± SE (n=3).
Four transition metals (Mn2+
, Fe2+
, Cu2+
and Zn2+
) were also tested out to observe the
effect on GBE activity. Mn2+
did not affect enzyme activity when the enzyme was
incubated in 1 mM of the metal ions and the activity was slightly decreased by 14%
when the enzyme was incubated in 5 mM of the metal ions. Mn2+
too showed slight
inhibition on GBE activity isolated from A. gottschalkii and R. marinus (Yoon et al.,
2007; Thiemann et al., 2006). Zn2+
and Cu2+
repressed the enzyme as only 40% and
less of the enzyme activity was remaining. These metal ions also appear to restrain
GBE activity of other bacteria, A. gottschalkii, R. marinus and M. tuberculosis (Garg
et al., 2007; Yoon et al., 2007; Thiemann et al., 2006). Meanwhile, 1 mM of Fe2+
did
not really affect GBE activity as 76% of enzyme activity retained but 5 mM of Fe2+
inhibit the enzyme by 60%. 5 mM of Fe2+
also inhibit GBE from R. marinus by 60%
(Yoon et al., 2007). In conclusion, GBE isolated from Geobacillus sp. Geo5 does not
require metal ions to perform its catalytic reaction.
0
20
40
60
80
100
control Mg Ca Mn Fe Cu Zn
Rel
ati
ve
act
ivit
y (
%)
Metal ion

© COPYRIG
HT UPM
99
CHAPTER 5
CONCLUSION AND RECOMMENDATIONS
5.1 Conclusion
One of the criteria sought after in industrial enzymes are enzymes that are able to
withstand and active at high temperature. That is why thermophiles are targeted in
the search for biocatalysts that are functional in hot environment. The aim of this
study is achieved as a thermostable glycogen branching enzyme was successfullly
isolated from Geobacillus sp. Geo5 by genome mining. Although the genome
sequence used was not fully assembled and annotated, it was good enough for
obtaining the gene sequence and to be used for structural prediction. The result that
was analysed by computational method postulated that the enzyme is thermostable
and this was confirmed by the results produced by molecular biology experiments.
With the help from genome mining result, the gene for GBE was easily isolated
using PCR. Without the genome mining result, a gene of an unknown sequence has
to be isolated by primer walking, which would take longer time and more effort.
From there, GBE was successfully expressed in E. coli system. Two systems were
tested, intracellular expression system and secretory expression system using BRP.
Although secretory expression system is expected to be advantageous especially for
protein purification, it was found less performing than the intracellular expression
system. For that reason, the enzyme produced by intracellular expression system was
used for subsequent experiments.
© COPYRIG
HT UPM
100
The characterisation of the purified enzyme shown that the enzyme was most active
at 55°C and stable up to 60°C for 24 hours. The optimum pH for enzyme activity
was at pH 6 and stable in pH 5 to pH 9. Metal ions, Zn2+
, Cu2+
, Mn2+
, Fe2+
and Ca2+
,
seem to have inhibitory effect on enzyme activity while Mg2+
does not. The
characteristics of this enzyme would make it very applicable for industrial use
particularly those engaging in food and beverages other than in paper and textile
industries. This enzyme also has potential to be use in medical research regarding the
treatment for branching enzyme deficiency disease, a rare hereditary metabolic
disorder in human and animals.
5.2 Recommendations
This research can be used as a basis to further study the thermostable glycogen
branching enzyme. This enzyme has a potential to be crystallised since there are no
crystal structure of thermostable branching enzyme to date. The crystal structure of
this enzyme, which would be more accurate compared to the predicted models,
would bring more knowledge on factors that determine the enzyme stability,
information on enzyme mechanism and factors that can improve enzyme activity and
stability. On the contrary, the study can also focus on inactivation of this enzyme in
order to disable pathogenic microorganisms for the purpose of medical research.
Another prospective research that can be done on this particular thermostable GBE
isolated from Geobacillus sp. Geo5 is to experiment the enzyme for different
chemical reactions, using substrates other than starch components. This might lead to
the discovery of novel compounds that are potentially valuable.

© COPYRIG
HT UPM
101
REFERENCES
Abad, M., Binderup, K., Rios-Steiner, J., Arni, R. and Preiss, J. (2002). The X-ray
crystallographic structure of Escherichia coli branching enzyme. The
Journal of Biological Chemistry. 277 (44): 42164–42170.
Amersham Pharmacia Biotech (1999). Protein Purification Handbook. Upsala:
Amersham Pharmacia Biotech AB.
Arnau, J., Lauritzen, C., Petersen, G. and Pedersen, J. (2006). Current strategies for
the use of affinity tags and tag removal for the purification of
recombinant proteins. Protein Expression and Purification. 48:1-13.
Arner, E. and Holmgren, A. (2000). Physiological functions of thioredoxin and
thioredoxin reductase. European Journal of Biochemistry. 267: 6102-
6109.
Baker, D. (2000). A surprising simplicity to protein folding. Nature. 405: 39-42.
Baker, D. and Sali, A. (2001). Protein structure prediction and structural genomics.
Science. 294: 93-96.
Baneyx, F. (1999). Recombinant protein expression in Escherichia coli. Current
Opinion in Biotechnology. 10(5): 411-421.
Baneyx, F. and Mujacic, M. (2004). Recombinant protein folding and misfolding.
Nature Biotechnology. 22(11): 1139-1408.
Banskota, A., McAlpine, J., Sørensen, D., Ibrahim, A., Aouidate, M., Piraee, M.,
Alarco, A., Farnet, C. and Zazopoulos, E. (2006). Genomic Analyses
Lead to Novel Secondary Metabolites. Journal of Antibiotics. 59(9):
533–542.
Bartlett, J. and Sterling, D. (2003). A short history of the polymerase chain reaction.
Methods in Molecular Biology. 226: 3-6.
BCC Research. (2012). Global Markets for Enzymes in Industrial Applications
(Publication no. BIO030G). Wellesley, MA: BCC Research. Retrieved
from: http://www.bccresearch.com/report/enzymes-industrial-
applications-markets-bio030g.html.
Berg, J. (1987). Metal ions in proteins: Structural and functional roles. Cold Spring
Harbour Symposia on Quantitative Biology. 52: 579-585.

© COPYRIG
HT UPM
102
Berger, D. (2004). Gene-mining the Arabidopsis thaliana genome: Applications
for biotechnology in Africa. South African Journal of Botany. 70(1): 173-
180.
Berrow, N., Bussow, K., Coutard, B., Diprose, J., Ekberg, M., Folkers, G., Levy, N.,
Lieu, V., Owens, R., Peleg, Y., Pinaglia, C., Quevillon-Cheruel, S.,
Salim, L., Scheich, C., Vincentellic R. and Bussoh, D. (2006).
Recombinant protein expression and solubility screening in Escherichia
coli: A comparative study. Acta Crystallographica Section D. D62:1218-
1226.
Binderup, K., Mikkelsen, R., and Preiss, J. (2002). Truncation of the amino terminus
of branching enzyme changes its chain transfer pattern. Archives of
Biochemistry and Biophysics. 397 (2): 279-285.
Bischof, J. and He, X. (2005). Thermal Stability of Proteins. Annals of the New York
Academy of Sciences. 1066: 12–33.
Bowie, J., Luthy, R. and Eisenberg, D. (1991). A method to identify protein
sequences that fold into a known three-dimensional structure. Science.
253 (5016): 164-170.
Bruno, C., Servidei, S., Shanske, S., Karpati, G., Carpenter, S., McKee, D., Barohn,
R., Hirano., Rtfai, Z. and DiMauro, S. (1993). Glycogen branching
enzyme deficiency in adult polyglucosan body disease. Annals of
Neurology. 33(1): 88-93.
Burley, S. and Petsko, G. (1985). Aromatic-aromatic interaction: A mechanism of
protein structure stabilization. Science. 229: 23-28.
Burton, S., Cowen, D. and Woodley, J. (2002). The search for the ideal biocatalyst.
Nature Biotechnology. 20: 37-45.
Challis, G. (2008). Genome mining for novel natural product discovery. Journal of
Medicinal Chemistry. 51: 2618–2628.
Cheng, C., and Shuman, S. (2000). Recombinogenic flap ligation pathway for
intrinsic repair of topoisomerase IB-induced double-strand breaks.
Molecular and Cellular Biolology. 20: 8059-8068.
Corre, C. and Challis, G. (2007). Heavy tools for genome mining. Chemistry &
Biology. 14: 7-9.
Demirjian, D. C., Morís-Varas, F., and Cassidy, C. S. (2001). Enzymes from
extremophiles. Current Opinion in Chemical Biology. 5(2): 144-151.
© COPYRIG
HT UPM
103
Devillers, C., Piper, M., Ballicora, M., and Preiss, J. (2003). Characterization of the
branching patterns of glycogen branching enzyme truncated on the N-
terminus. Archives of Biochemistry and Biophysics. 418: 34–38.
Ferrer, M., Martínez-Arbaca, F. and Golyshin, P. (2005). Mining genomes and
‘metagenomes’ for novel catalysts. Current Opinion in Biotechnology.
16:588–593.
Fraaije, M., Wu, J., Heuts, D., van Hellemond, E., Spelberg, J. and Janssen, D.
(2005). Discovery of a thermostable Baeyer–Villiger monooxygenase by
genome mining. Applied Microbiology and Biotechnology. 66: 393–400.
Fujiwara, S. (2002). Extremophiles: Developments of their special functions and
potential resources. Journal of Bioscience and Bioengineering. 94(6):
518-525.
Garg, S., Alam, S., Kishan, R. and Agrawal, P. (2007). Expression and
characterization of α-(1,4)-glucan branching enzyme Rv1326c of
Mycobacterium tuberculosis H37Rv. Protein Expression and Purication.
51: 198–208.
Gogichaena, N., Williams, T. and Alterman, M. (2007). MALDI TOF/TOF tandem
mass spectrometry as a new tool for amino acid analysis. Journal of the
American Society for Mass Spectrometry. 18: 279-284.
González-Montalbán, N., García-Fruitós, E. and Villaverde, A. (2007). Recombinant
protein solubility- does more mean better? Nature Biotechnology. 25 (7):
718-720.
Guan, H., Li, P., Imparl-Radosevich, J., Preiss, J. and Keeling, P. (1997). Comparing
the properties of Escherichia coli branching enzyme and maize branching
enzyme. Archives of Biochemistry and Biophysics. 342 (1): 92–98.
Guenther, B., Onrust, R., Sali, A., O’Donnell, M. and Kuriyan, J. (1997). Crystal
structure of the δ’ subunit of the clamp-loader complex of E. coli DNA
polymerase III. Cell. 91: 335–345.
Hanahan, D. (1983). Studies on transformation of Escherichia coli with plasmids.
Journal of Molecular Biology. 166: 557-580.
Hanahan, D., Jesse, J and Bloom, F. (1991). Plasmid transformation of Escherichia
coli and other bacteria. Methods in Enzymology. 204: 63-113.
Henrissat, B. (1991). A classification of glycosyl hydrolases based on amino acid
sequence similarities. Biochemical Journal. 280: 309-316.

© COPYRIG
HT UPM
104
Hilden, I., Leggio, L., Larsen, S., and Poulsen, P. (2000). Characterization and
crystallization of an active N-terminally truncated form of the
Escherichia coli glycogen branching enzyme. European Journal of
Biochemistry. 267: 2510-2155.
Jespersen, H., MacGregor, A., Henrissat, B., Sierks, M. and Svensson, B. (1993).
Starch- and glycogen-debranching and branching enzymes: Prediction of
structural features of the catalytic (β/α)8-barrel domain and evolutionary
relationship to other amylolytic enzymes. Journal of Protein Chemistry.
12(6): 791-805.
Jonasson, P., Liljeqvist, S., Nygren, P.A. and Stahl, S. (2002). Genetic design
for facilitated production and recovery of recombinant proteins in
Escherichia coli. Biotechnology and Applied Biochemistry. 35: 91-105.
Kawabata, Y., Toeda, k., Takahashi, T., Shibamoto, M. and Kobayashi, M. (2002).
Preparation of highly branch starch by glycogen branching enzyme from
Neurospora crassa N2-44 and its characterization. Journal of Applied
Glycoscience. 49 (3): 273-279.
Kiel, J., Boels, J., Beldman, G. and Venema, G. (1990). Nucleotide sequence of the
Synechococcus sp. PCC7942 branching enzyme gene (glgB):
expression in Bacillus subtilis. Gene. 89: 77-84.
Kim, W. S., Kim, J., Krishnan, H. and Nahm, B. H. (2005). Expression of
Escherichia coli branching enzyme in caryopses of transgenic rice results
in amylopectin with an increased degree of branching. Planta. 220: 689–
695.
Kortstee, A., Vermeesch, A., de Vries, B., Jacobsen, E., and Visser, R. (1996).
Expression of Escherichia coli branching enzyme in tubers of amylose-
free transgenic potato leads to an increased branching degree of the
amylopectin . The Plant Journal. 10(1): 83-90 .
Kulakov,L., Poelarends,G., Janssen, D. and Larkin, M. (1999). Characterization of
IS2112, a new insertion sequence from Rhodococcus, and its relationship
with mobile elements belonging to the IS110 family. Microbiology. 145:
561-568.
Kuriki, T. and Imanaka, T. (1999). The concept of the α-amylase family: Structural
similarity and common catalytic mechanism. Journal of Bioscience and
Bioengineering. 87(5): 557-565.
Kuriki, T., Guan, H., Sivak, M. and Preiss, J. (1996). Analysis of the active center of
branching enzyme II from maize endosperm. Journal of Protein
Chemistry. 15(3): 305-313.

© COPYRIG
HT UPM
105
Laemmli, U. (1970). Cleavage of structural proteins during the assembly of the head
of bacteriophage T4. Nature. 227: 680-685.
Laskowski, R., MacArthur, M., Moss, D. and Thornton, J. (1993). PROCHECK: A
program to check the stereochemical quality of protein structures.
Journal of Applied Crystallography. 26: 283-291.
Laurent, T., Moore, E. and Reichard, P. (1964). Enzymatic synthesis of
deoxyribonucleotides. The Journal of Biological Chemistry. 239(10):
3436-34444.
LaVallie, E., DiBlasio, E., Kovacic, S., Grant, K., Schendel, P. and McCoy, J.
(1993). A thioredoxin gene fusion expression system that circumvents
inclusion body formation in the E. coli cytoplasm. Biotechnology.
11(2):187-93.
Lee, C., Le, Q., Kim, Y., Shim, J., Lee, S., Park, J., Lee, K., Song, S., Auh, J., Lee, S.
and Park, K. (2008). Enzymatic synthesis and properties of highly
branched rice starch amylose and amylopectin cluster. Journal of
Agriculture and Food Chemistry. 56: 126-131.
Lichty, J., Malecki, J., Agnew, H. Michelson-Horowitz, D. and Tan, S. (2005).
Comparison of affnity tags for protein purification. Protein Expression
and Purification. 41:98-105.
Lloubes, R., Vitab, N., Bernadaca, A., Shireb, D., Leplatoisb, P., G1ia, V., Frenette,
M, Knibiehler, M., Lazdunski, C. and Baty, D. (1993). Colicin A lysis
protein promotes extracellular release of active human growth hormone
accumulated in Escherichia coli cytoplasm. Biochimie. 75(6): 451-8.
Lodish, H., Berk, A., Matsudaira, P., Kaiser, C., Krieger, M., Scott, M., Zippursky,
S. and Darnel, J. (2004). Molecular cell biology: Fifth edition. New
York: W. H. Freeman and Company.
Loper, J., and Gross, H. (2007). Genomic analysis of antifungal metabolite
production by Pseudomonas fluorescens Pf-5. European Journal of Plant
Pathology. 119:265–278.
Lu, Z., DiBlasio-Smith, E., Grant, K., Warne, N., LaVallie, E., Collins-Racie, L.,
Follettie, M., Williamson, M. and McCoy, J. (1996). Histidine patch
thioredoxins. Journal of Biological Chemistry. 271,5059-5065
Luthy, R., James, U. and David, E. (1992). Assessment of protein models with three
dimesional profiles. Nature. 356: 83–85.
© COPYRIG
HT UPM
106
Madigan, M. T. and Marrs, B. L. (1997). Extremophiles. Scientific American. 276(4):
82-87.
Makrides, S. (1996). Strategies for achieving high-level expression of genes in
Escherichia coli. Microbiological Reviews. 60(3): 512-538.
Marchand, J. and Peccoud, J. (2012). Building block synthesis using the polymerase
chain assembly method. Methods in Molecular Biology. 852: 3-10.
Marchant, M., Franzetti, A., Pavlostathis, S., Tas, D., Erdbr gger, I., nyayar, A.,
Mazmanci, M. and Banat, I. (2008). Thermophilic bacteria in cool
temperate soils: Are they metabolically active or continually added by
global atmospheric transport? Applied Microbiology and Biotechnology.
78: 841-852.
Marchant, R. and Banat, I. (2010). The genus Geobacillus and hydrocarbon
utilization. Handbook of Hydrocarbon and Lipid Microbiology. 1888-
1896.
Marti-Renom, M.A., Stuart, A.C., Fiser, A., Sánchez, R., Melo, F. and Šali, A.
(2000). Comparative protein structure modeling of genes and genomes.
Annual Review of Biophysics and Biomolecular Structure. 29: 291-325.
McAlpine, J., Bachmann, B., Piraee, M., Tremblay, S., Alarco, A., Zazopoulos, E.
and Farnet, C. (2005). Microbial genomics as a guide to drug discovery
and structural elucidation: ECO-02301, a novel antifungal agent, as an
example. Journal of Natural Products. 68, 493-496.
McCoy, J. and LaVallie, E. (2001). Expression and purification of thioredoxin fusion
proteins. Current Protocols in Molecular Biology.
Murakami, T., Kanai, T., Takata, H., Kuriki, T. and Imanaka, T. (2006). A novel
branching enzyme of the GH-57 Family in the hyperthermophilic
archaeon Thermococcus kodakaraensis KOD1. Journal of Bacteriology.
188(16): 5915–5924.
Nazina, T., Tourova, T., Poltaraus, A., Novikova, E., Grigoryan, A., Ivanova, A.,
Lysenko, A., Petrunyaka, V., Osipov, G., Belyaev, S. and Ivanov, M. V.
(2001). Taxonomic study of aerobic thermophilic bacilli: Descriptions of
Geobacillus subterraneus gen. nov., sp. nov. and Geobacillus uzenensis
sp. nov. from petroleum reservoirs and transfer of Bacillus
stearothermophilus, Bacillus thermocatenulatus, Bacillus
thermoleovorans, Bacillus kaustophilus, Bacillus thermodenitrificans to
Geobacillus as the new combinations G. stearothermophilus, G.
thermocatenulatus, G. thermoleovorans, G. kaustophilus, G.
Thermoglucosidasius and G. thermodenitrificans. International Journal
of Systematic and Evolutionary Microbiology. 51(2): 433-446.

© COPYRIG
HT UPM
107
Nelson, D. and Cox, M. (2005). Lehninger Principles of Biochemistry: Fourth
edition. New York: W. H. Freeman and Company.
Ni, Y. and Chen, R. (2009). Extracellular recombinant protein production from
Escherichia coli. Biotechnology Letters. 31: 1661–1670
Nielsen, J., Borchert, T. and Vriend, G. (2001). The determinants of α-amylase pH-
activity profiles. Protein Engineering. 14(7): 505-512.
Pal, K., Kumar, S., Sharma, S., Garg, S. , Alam, M. , Xu, H., Agrawal P. and
Swaminathan, K. (2010). Crystal structure of full-length Mycobacterium
tuberculosis H37Rv glycogen branching enzyme: insights of N-terminal
beta-sandwich in substrate specificity and enzymatic activity. The
Journal of Biological Chemistry. 285 (27): 20897-20903.
Palomo, M., Pijning, T. Booiman, T., Dobruchowska, J., van der Vlist, J., Kralj, S.,
Planas, A., Loos, K., Kamerling, J., Dijkstra, B., van der Maarel, M.,
Dijkhuizen, L. and Leemhuis, H.(2011). Thermus thermophilus glycoside
hydrolase family 57 branching enzyme: Crystal structure, mechanism of
action, and products formed. The Journal of Biological Chemistry.
286(5): 3520-30
Preiss, J. (1984). Bacterial glycogen synthesis and its regulation. Annual Review of
Microbiology. 38: 419-458.
Reddy, N., Nimmagada, A. and Rao, K. (2003). An overview of the microbial α-
amylase family. African Journal of Biotechnology. 2(12): 645-648.
Ring, C., Sunt, E., Mckerrow, J., Leet, G., Rosenthalt, P., Kuntz, I. and Cohen, F.
(1993). Structure-based inhibitor design by using protein models for the
development of antiparasitic agents. Proc Natl Acad Science. 90: 3583-
3587.
Romeo, T., Kumar, A., and Preiss, J. (1988). Analysis of the Escherichia coli
glycogen gene cluster suggests that catabolic enzymes are encoded
among the biosynthetic genes. Gene. 70: 363-376.
Roux, k. (1995). Optimization and troubleshooting in PCR. Genome Research. 4:
S185-S194.
Roy, A., Kucukural, A and Zhang, Y. (2010). I-TASSER: A unified platform for
automated protein structure and function prediction. Nature Protocol.
5(4): 725-738.

© COPYRIG
HT UPM
108
Santos, C., Tonoli, C., Trindade, D., Betzel, C., Takata, H., Kuriki, T., Kanai, T.,
Imanaka, T., Arni, R. and Murakami, M. (2011). Structural basis for
branching-enzyme activity of glycoside hydrolase family 57: Structure
and stability studies of a novel branching enzyme from the
hyperthermophilic archaeon Thermococcus Kodakaraensis KOD1.
Proteins; 79: 547–557.
Sasangka, P., Matsuno, A., Tanaka, A., Akasaka, Y., Suyama, S., Kano, S.,
Miyazaki, M., Akao, T., Kato, M., Kobayashi, T. and Tsukagoshi, N.
(2002). Structural features of the glycogen branching enzyme encoding
genes from aspergilli. Microbiological Research. 157: 337–344.
Saxena, R., Sheoran, A., Giri, B. and Davidson, W. (2003). Purification strategies for
microbial lipases. Journal of Microbiological Methods. 52: 1-18.
Schattner, P. (2009). Genomics made easier: An introductory tutorial to genome
datamining. Genomics. 93: 187–195.
Scherlach, K. and Hertweck, C. (2006). Discovery of aspoquinolones A–D,
prenylated quinoline-2-one alkaloids from Aspergillus nidulans,
motivated by genome mining. Organic & Biomolecular Chemistry. 4,
3517–3520.
Schiraldi, C. and De Rosa, M. (2002). The production of biocatalysts and
biomolecules from extremophiles. Trends in Biotechnology. 20(12): 515-
521.
Schmid, A., Dordick, J., Hauer, B., Wubbolts, M. and Witholt, B. (2001). Industrial
biocatalysis today and tomorrow. Nature, 409, 258-268.
Serrano, L., Bycroft, M. and Fersht, A. (1991). Aromatic-aromatic interactions and
protein stability investigation by double-mutant cycles. Journal of
Molecular Biology. 218: 465-475.
Sezonov,G., Joseleau-Petit, D. and D’Ari, R. (2007). Escherichia coli physiology in
luria-bertani broth. Journal of Bacteriology. 189 (23): 8746–8749.
Shinohara, M., Ihara, M., Abo, M., Hashida, M., Takagi, S. and Beck, T. (2001). A
novel thermostable branching enzyme from an extremely thermophilic
bacterial species, Rhodothermus obamensis. Applied Microbiology and
Biotechnology. 57. 653–659.
Sippl, M. (1993). Recognition of errors in three-dimensional structures of proteins.
Proteins. 17: 355-362.
© COPYRIG
HT UPM
109
Skolnick, J. and Fetrow, S. (2000). From genes to protein structure and function:
novel applications of computational approaches in the genomic era.
Trends in Biotechology. 18: 34-39.
Studier, F. (2005). Protein production by auto-induction in high-density shaking
cultures. Protein Expression and Purification. 41(1):207-234.
Studier, F. and Moffatt, B. (1986). Use of bacteriophage T7 RNA polymerase to
direct selective high-level expression of cloned genes. Journal of
Molecular Biology. 189:113-130.
Takata, H., Akiyama, T., Kajiura, H., Kakutani, R., Furuyashiki, T., Tomioka, E.,
Kojima, I. and Kuriki, T. (2010). Application of branching enzyme in
starch processing. Biocatalysis and Biotransformation. 28 (1): 60–63.
Takata, H., Kato, T., Takagi, M. and Imanaka, T. (2005). Cyclization reaction
catalyzed by Bacillus cereus branching enzyme, and the structure of
cyclic glucan produced by the enzyme from amylose. Journal of Applied
Glycoscience. 52: 359-365.
Takata, H., Takaha, T., Kuriki, T., Okada, S., Takagi, M. and Imanaka, T. (1994).
Properties and active center of the thermostable branching enzyme from
Bacillus stearothermophilus. Applied and Environmental Microbiology.
60 (9): 3096-3104.
Takata, H., Takaha, T., Okada, S., Takagi, M., and Imanaka, T. (1996). Cyclization
reaction catalyzed by branching enzyme. Journal of Bacteriology. 178
(6): 1600-1606.
Takeda, Y., Guan, H. and Preiss, J. (1993). Branching of amylose by the branching
isoenzymes of maize endosperm. Carbohydrate Research. 240: 253-263.
Terada, Y., Yanase, M., Takata, H., Takaha, T., and Okada, S. (1997). Cyclodextrins
are not the major cyclic α-1,4-glucans produced by the initial action of
cyclodextrin glucanotransferase on amylose. The Journal of Biological
Chemistry. 272 (25): 15729-15733.
TerMaat, J., Pienaar, E., Whitney, S., Mamedov, T., and Subramanian, A. (2009).
Gene synthesis by integrated polymerase chain assembly and PCR
amplification using a high-speed thermocycler. Journal of
Microbiological Methods. 79: 295-300.
Terpe, K. (2003). Overview of tag protein fusions: from molecular and
biochemical fundamentals to commercial systems. Applied Microbiology
and Biotechnology. 60: 523-533.

© COPYRIG
HT UPM
110
Thiemann, V., Saake, B., Vollstedt, A., Schafer, T., Puls, J., Bertoldo, C., Freudl, R
and Antranikian, G. (2006). Heterologous expression and
characterization of a novel branching enzyme from the thermoalkaliphilic
anaerobic bacterium Anaerobranca gottschalkii. Applied Microbiology
and Biotechnology. 72: 60–71.
Turner, P., Mamo, G., and Karlsson, E. (2007). Potential and utilization of
thermophiles and thermostable enzymes in biorefining. Microbial Cell
Factories. 6(1): 9.
U.S. Food and Drug Administration. (2010). Guidance for Industry: Enzyme
Preparations: Recommendations for Submission of Chemical and
Technological Data for Food Additive Petitions and GRAS Notices.
Silver Spring, MD: U.S. Department of Health and Human Services.
Retrieved from: http://www.fda.gov/Food/GuidanceCompliance
RegulatoryInformation/GuidanceDocuments/FoodIngredientsandPackagi
ng/ucm083345.htm
Utsumi, Y., Yoshida, M., Francisco, Jr., P., Sawada, T., Kitamura, S. and Nakamura,
Y. (2009). Quantitative assay method for starch branching enzyme with
bicinchoninic acid by measuring the reducing terminals of glucans.
Journal of Applied Glicoscience. 56: 215-222.
van den Burg, B. (2003). Extremophiles as a source for novel enzymes. Current
Opinion in Microbiology. 6(3): 213-218.
van der Maarel, M. (2009). Starch-Processing Enzymes. Enzymes in Food
Technology, 320-331.
van der Maarel, M., van der Veen, B., Uitdehaag, J., Leemhuis, H., and Dijkhuizen,
L. (2002). Properties and applications of starch-converting enzymes of
the alpha-amylase family. Journal of Biotechnology. 94: 137–55.
van der Maarel, M., Vos, A., Sanders, P., and Dijkhuizen, L. (2003). Properties of
the glucan branching enzyme of the hyperthermophilic bacterium
Aquifex aeolicus. Biocatalysis and Biotransformation. 21 (4): 199- 207.
van der Wal, F. J., Koningstein, G., ten Hagen, C. M., Oudega, B., and Luirink, J.
(1998). Optimization of bacteriocin release protein (BRP)-mediated
protein release by Escherichia coli: Random mutagenesis of the
pCloDF13-derived BRP gene to uncouple lethality and quasi-lysis from
protein release. Applied and Environmental Microbiology. 64(2): 392-
398.
van der Wal, F. J., ten Hagen-Jongman, C. M., Oudega, B., and Luirink, J. (1995).
Optimization of bacteriocin-release-protein-induced protein release by
© COPYRIG
HT UPM
111
Escherichia coli: Extracellular production of the periplasmic molecular
chaperone FaeE. Applied Microbiology and Biotechnology. 44: 459-465.
Vasina, J. and Baneyx, F. (1997). Expression of aggregation-prone recombinant
proteins at low temperatures: A comparative study of the Escherichia
coli cspA and tac promoter systems. Protein Expression and Purification.
9: 211-218.
Vieille, C., Epting, K., Kelly, R. and Zeikus, J. (2001). Bivalent cations and amino-
acid composition contribute to the thermostability of Bacillus
licheniformis xylose isomerase. European Journal of Biochemistry. 268:
6291-6301.
Villaverde, A., and Carrio, M. (2003). Protein aggregation in recombinant bacteria:
Biological role of inclusion bodies. Biotechnology letters. 25(17): 1385-
1395.
Voet, D. and Voet, J. (2011). Biochemistry: Fourth edition. Hoboken, NJ: John
Wiley & Sons, Inc.
Wang, X., Li, X. and Li, Y. (2007). A modified Coomassie Brilliant Blue staining
method at nanogram sensitivity compatible with proteomic analysis.
Biotechnology Letters. 29:1599–1603.
Wilfinger, W. , Mackey, K. and Chomczynski, P. (1997). Effect of pH and ionic
strength on the spectrophotometric assessment of nucleic acid purity.
BioTechniques. 22: 474-481.
Wu, G., Fiser, A., ter Kuile, B., Sali, A. and Müller M. (1999). Convergent evolution
of Trichomonas vaginalis lactate dehydrogenase from malate
dehydrogenase. Proceedings of the National Academy of Sciences of the
United States of America. 96: 6285-6290.
Wu, G., Wolf, J., Ibraheem, A., Vadasz, S., Gunasinghe, M. and Freeland, S. (2006).
Simplified gene synthesis: A one-step approach to PCR-based gene
construction. Journal of Biotechnology. 124(3): 496503.
Wu, S., Skolnick, J. and Zhang, Y. (2007). Ab initio modeling of small proteins by
iterative TASSER simulations. BMC Biology. 5(17).
Yoon, S., Ryu, S., Lee, S. and Moon, T. (2008). Purification and characterization of
branching specificity of a novel extracellular amylolytic enzyme from
marine hyperthermophilic Rhodothermus marinus. Journal of
Microbiology and Biotechnology. 18(3): 457-464.
© COPYRIG
HT UPM
112
Yurieva, O., Skangalis, M., Kuriyan, J. and O’Donnel, M. (1997). Thermus
thermophilis dnaX homolog encoding γ- and τ-like proteins of the
chromosomal replicase. The Journal of Biological Chemistry. 272:
27131-27139.
Zeigler, D (2001). The Genus Geobacillus. Bacillus Genetic Stock Center 3: 7-11.
Zhang, Y. (2008). I-TASSER server for protein 3D structure prediction. BMC
Bioinformatics. 9(40).
Zhang, Y. (2009). -TASSER: Fully automated protein structure prediction in CASP8.
Proteins. 77(9): 100-113.
Zhang, Y. and Skolnick, J. (2004). Scoring function for automated assessment of
protein structure template quality. Proteins. 57 (4): 702–710.
Zhang, Y. and Skolnick, J. (2005). The protein structure prediction problem could be
solved using the current PDB library. Proceedings of the National
Academy of Sciences of the USA. 102(4): 1029-1034.
Zhu, D., Mukherjee, C., Biehl, E. and Hua, L. (2007). Discovery of a mandelonitrile
hydrolase from Bradyrhizobium japonicum USDA110 by rational
genome mining. Journal of Biotechnology. 129: 645–650.

© COPYRIG
HT UPM
113
APPENDICES
Appendix A
Materials Manufacturers
Chemicals
Acetic acid Merck, Germany
Agarose Seakem, USA
Amylose, from potato Sigma, USA
Ampicillin Calbiochem, Germany
Ammonium persulfate Sigma, USA
Bis-acrylamide, 40% solution Merck, Germany
Calcium chloride dihydrate Merck, Germany
Calsium sulfate R & M Chemicals, UK
Copper (II) sulfate R & M Chemicals, UK
Di-Sodium hydrogen phosphate Merck, Germany
Dimethyl sulfoxide Sigma, USA
dNTP mix Fermentas, Canada
Glycerol R & M Chemicals, UK
Glycine Merck, Germany
Hydrochloric acid Merck, Germany
Imidazole Merck, Germany
Iodine Sigma, USA
IPTG Merck, Germany

© COPYRIG
HT UPM
114
Iron (II) sulfhate R & M Chemicals, UK
Magnesium sulfate R & M Chemicals, UK
Manganese (II) sulfate R & M Chemicals, UK
Methanol Fisher scientific, UK
Mitomycin C Sigma, USA
Pfu DNA polymerase Fermentas, Canada
Potassium iodide Sigma, USA
Proteinase K Promega, USA
Quick StartTM
Bradford 1× reagent Bio-Rad, USA
FastDigest®
Restriction enzymes Fermentas, Canada
Sodium acetate Merck, Germany
Sodium chloride Merck, Germany
Sodium dihydrogen phosphate Merck, Germany
Sodium dodecyl sulphate Merck, Germany
Sodium hydroxide Merck, Germany
Taq DNA Polymerase Fermentas, Canada
TEMED Sigma, USA
Tetracycline Sigma, USA
Tris Invitrogen, USA
Zinc sulphate R & M Chemicals, UK
β-mercaptoethanol Merck, Germany
DNA and protein ladder
Broad Range Prestained Protein Marker Nacalai Tesque, Japan
GeneRuler 1 kb DNA Ladder Fermentas, USA

© COPYRIG
HT UPM
115
Lambda DNA/HindIII marker Fermentas, USA
Unstained protein molecular weight marker Fermentas, USA
Media
Bacteriological agar Merck, Germany
Luria-Bertani agar Merck, Germany
Luria-Bertani broth Merck, Germany
Nutrient agar Oxoid, England
Nutrient broth Merck, Germany
Peptone Oxoid, England
Yeast extracts Oxoid, England
Kits
Champion™ pET Directional Invitrogen, USA
TOPO® Expression Kit
DNeasy® Blood and Tissue Kit Qiagen, Germany
QIAquick® Gel Extraction Kit Qiagen, Germany
QIAprep® Spin Miniprep Kit Qiagen, Germany

© COPYRIG
HT UPM
116
Appendix B
pET102/D-TOPO ® (6315 bp) vector map and features.

© COPYRIG
HT UPM
117
Appendix C
Cloning site and priming sites (TrxFus forward and T7 reverse) of
pET102/D-TOPO®

© COPYRIG
HT UPM
118
Appendix D
Bacteriocin release protein (BRP) expression plasmid pSW1 map and features.

© COPYRIG
HT UPM
119
Appendix E
Result of multiple alignment using ClustalW.
Geobacillus_sp._MGI_ G---CTACTGGCGAATAGGAATCAATGTTGTGTATGGCCATCATTTTGCT
G._thermodenitrificans_NG80-2 -----------------------------ATGTGTGGCCATCATCTTGCT
Geobacillus_sp._Y412MC10 ------------------------------------TTGAACCAAGCAGT
Bacillus_sp._NBRC_15313 --------------------------------------------------
Geobacillus_sp._Y412MC61 -----------------------------GTGTATGGCCATCATTTTGCT
G.stearothermophilus GGAATTTATGGAATCGCTGTGGAATATAAGTAACAACGGTAAGAAACTTT
Geobacillus_sp._MGI_ TCGGAAAGGATGCGATCCAGCTTGATTGCGGCGAATCCGACAGATTTAGA
G._thermodenitrificans_NG80-2 TTGGAAAGGATGCGATACGGTTTGATTGCGGCGAATCCGACGGATTTGGA
Geobacillus_sp._Y412MC10 TAGGGAAGGAAACATGACTCCGG-----------------------AACA
Bacillus_sp._NBRC_15313 TCGGAAAGGATGCGATCCAGCTTGATTGCGGCGAATCCGACAGATTTAGA
Geobacillus_sp._Y412MC61 TCGGAAAGGATGCGATCCAGCTTGATTGCGGCGAATCCGACAGATTTAGA
G.stearothermophilus AAGGAAAGGATGCGATACAGATTGATCGCCGTCGGTCCCACTGATTTAGA
: **.*****:.*.: .* :. *
Geobacillus_sp._MGI_ AGTGTATTTGTTTCATGAAGGCCGTTTGTATCAAAGTTATGAGCTGTTCG
G._thermodenitrificans_NG80-2 AGTGTATTTGTTTCATGAAGGCAGCTTGTATAAAAGTTACGAGCTGTTTG
Geobacillus_sp._Y412MC10 AGTGTATTTATTTCATGAAGGAACCTGGTTTCACAGTTACCAATGTATGG
Bacillus_sp._NBRC_15313 AGTGTATTTGTTTCATGAAGGCCGTTTGTATCAAAGTTATGAGTTGTTCG
Geobacillus_sp._Y412MC61 AGTGTATTTGTTTCATGAAGGCCGTTTGTATCAAAGTTATGAGCTGTTCG
G.stearothermophilus AATCTATTTATTTCATGAAGGCAGCTTATATAAAAGTTATGAATTGTTTG
*.* *****.***********.. * .*:*.*.***** *. :* *
Geobacillus_sp._MGI_ GCGCTCATGTCATCCGCGACGGCGGAGCGGTCGGCACTCGCTTTTGCGTG
G._thermodenitrificans_NG80-2 GCGCCCATGTGATTAATGAGGGCGGGAAGGTCGGCACCCGTTTTTGTGTT
Geobacillus_sp._Y412MC10 GTGCACACCTTGCCACAGAAGAAGGAGAAGAGGGCGTGCGTTTTACGGTG
Bacillus_sp._NBRC_15313 GCGCTCATGTCATCCGCGACGGCGGAGCGGTCGGCACTCGCTTTTGCGTG
Geobacillus_sp._Y412MC61 GCGCTCATGTCATCCGCGACGGCGGAGCGGTCGGCACTCGCTTTTGCGTG
G.stearothermophilus GTGCACATGTGATAAAGAAAAATGGCATGGTCGGAACCCGGTTTTGTGTA
* ** ** * . . .* .. ** . .*: **.. ** ***: **
Geobacillus_sp._MGI_ TGGGCGCCCCATGCGCGGGAAGTCCGTCTTGTCGGCAGTTTCAACGATTG
G._thermodenitrificans_NG80-2 TGGGCGCCGCACGCGCGCGAGGTGCGTCTTGTCGGCAGTTTCAACGATTG
Geobacillus_sp._Y412MC10 TGGGCTCCGAATGCCAGGCAGGTAGGACTTGCCGGAGACTGGAACGGCTG
Bacillus_sp._NBRC_15313 TGGGCGCCCCATGCGCGGGAAGTCCGTCTTGTCGGCAGTTTCAACGATTG
Geobacillus_sp._Y412MC61 TGGGCGCCCCATGCGCGGGAAGTCCGTCTTGTCGGCAGTTTCAACGATTG
G.stearothermophilus TGGGCACCCCATGCGCGGGAAGTGCGATTAGTCGGCAGTTTTAATGAATG
***** ** .* ** .* *.** *: *:* ***... * ** *. **
Geobacillus_sp._MGI_ GAATGGGGCGAATTCCCCCCTGACGAAGGTGAACGACGAAGGGGTATGGA
G._thermodenitrificans_NG80-2 GGACGGGACGGATTTTCGCCTTGAGAAAGTGAATGATGAAGGGGTATGGA
Geobacillus_sp._Y412MC10 GGATGGTTCCCAAGACCCGTTATATAGGATGCCCGATTCGGGAATTTGGA
Bacillus_sp._NBRC_15313 GAATGGGGCGAATTCCCCCCTGACGAAGGTGAACGACGAAGGGGTATGGA
Geobacillus_sp._Y412MC61 GAATGGGGCGAATTCCCCCCTGACGAAGGTGAACGACGAAGGGGTATGGA
G.stearothermophilus GAACGGAACTAATTTTAACCTTATGAAAGTAAGTAATCAAGGCGTATGGA
*.* ** * *: . * *...*.. .* ..** .*:****
Geobacillus_sp._MGI_ CGATCGTTGTTCCAGAAAACTTGGAAGGGCATCTCTATAAATATGAGATC
G._thermodenitrificans_NG80-2 CGATTGTTGTCCCCGAAAACTTGGAAGGGCATTTATATAAGTATGAGATT
Geobacillus_sp._Y412MC10 GTCGGTTTTTCCCTGGGATGGAGACTGGAACTTTTTACAAATATCAGATC
Bacillus_sp._NBRC_15313 CGATCGTTGTTCCAGAAAACTTGGAAGGGCATCTCTATAAATATGAGATC
Geobacillus_sp._Y412MC61 CGATCGTTGTTCCAGAAAACTTGGAAGGGCATCTCTATAAATATGAGATC
G.stearothermophilus TGATTTTTATTCCTGAAAACTTAGAAGGGCATTTATATAAATACGAAATT
. ** * ** *..*: :...:**...* * ** **.** *.**
Geobacillus_sp._MGI_ ATCACACCGGATGGCCGTGTTCTGTTGAAAGCCGACCCGTACGCCTTTTA
G._thermodenitrificans_NG80-2 GTTACGCCGGACGGACAGGTGCTGTTCAAAGCCGACCCGTACGCTTTTTA
Geobacillus_sp._Y412MC10 ACGGGGCCCTTCGGAGAAACATTCCTAAAGGCCGATCCTTATGCATTTCA
Bacillus_sp._NBRC_15313 ATCACACCGGATGGCCGTGTTCTGTTGAAAGCCGACCCGTACGCCTTTTA
Geobacillus_sp._Y412MC61 ATCACACCGGATGGCCGTGTTCTGTTGAAAGCCGACCCGTACGCCTTTTA
G.stearothermophilus ACGACGAACGATGGGAATGTTCTGTTAAAATCGGATCCATACGCGTTTTA
. . ... : ** . . * * **. * ** ** ** ** *** *
© COPYRIG
HT UPM
120
Geobacillus_sp._MGI_ CTCCGAATTGCGCCCTCATACCGCCTCGATTGTCTACGATTTGAAAGGAT
G._thermodenitrificans_NG80-2 CTCCGAATTGCGTCCTCATACCGCCTCGATTGCCTACGATCTGAAAGGAT
Geobacillus_sp._Y412MC10 TGCCGAAGTACGACCTGCGACGGCATCGGTGGTGACCGACCTCTCAGGAT
Bacillus_sp._NBRC_15313 CTCCGAATTGCGCCCTCATACCGCCTCGATTGTCTACGATTTGAAAGGAT
Geobacillus_sp._Y412MC61 CTCCGAATTGCGCCCTCATACCGCCTCGATTGTCTACGATTTGAAAGGAT
G.stearothermophilus CTCCGAGTTGCGTCCCCATACTGCTTCCATTGTCTACAACATAAAAGGAT
****. *.** ** . ** ** ** .* * :.*.* * :.*****
Geobacillus_sp._MGI_ ACGAGTGGAATGATTCATCTTGGCAGCGGAAGAAACGGCGAAAGCGGATT
G._thermodenitrificans_NG80-2 ACCAGTGGAACGATCAATCTTGGAAGCGGAAGAAGCGACGAAAACGGATT
Geobacillus_sp._Y412MC10 ATCGCTGGAATGATGCCGCATGGAGAAGGAAGAACAAAT------CCCCA
Bacillus_sp._NBRC_15313 ACCAGTGGAATGATTCATCTTGGCAGCGGAAGAAACGGCGAAAGCGGATT
Geobacillus_sp._Y412MC61 ACGAGTGGAATGATTCATCTTGGCAGCGGAAGAAACGGCGAAAGCGGATT
G.stearothermophilus ATCAATGGAATGACCAGACATGGCGACGGAAGAAACAGCGAAAGCGAATT
* . ***** ** . *:***....******* ... . :
Geobacillus_sp._MGI_ TATGACCAACCGATGGTCATTTATGAACTTCATTTCGGTTCGTGGAAAAA
G._thermodenitrificans_NG80-2 TATGATCAGCCCATGGTGATTTATGAACTCCATTTCGGTTCGTG---GAA
Geobacillus_sp._Y412MC10 TATGCCAAGCCGGTGAACATTTATGAAATGCACTTCGGAACCTGGCGGCA
Bacillus_sp._NBRC_15313 TATGACCAACCGATGGTCATTTATGAACTTCATTTCGGTTCGTGGAAAAA
Geobacillus_sp._Y412MC61 TATGACCAACCGATGGTCATTTATGAACTTCATTTCGGTTCGTGGAAAAA
G.stearothermophilus TATGACCAGCCTTTGTTCATTTATGAACTTCACTTTGGTTCGTGGAAAAA
****. .*.** ** : *********.* ** ** **::* ** ..*
Geobacillus_sp._MGI_ GAAACCGGACGGCCGCTTTTATACGTACCGTGAGATGGCCGACGAACTCA
G._thermodenitrificans_NG80-2 GAAAAAAGATGGGCGTTTTTATACGTACCGTGAGATGGCCGATGAACTGA
Geobacillus_sp._Y412MC10 AAAAGAGGACGGTTCGTTCTTTACATATCGGGAATTGGCCGATCAGCTGA
Bacillus_sp._NBRC_15313 GAAACCGGACGGCCGCTTTTATACGTACCGTGAGATGGCCGACGAACTCA
Geobacillus_sp._Y412MC61 GAAACCGGACGGCCGCTTTTATACGTACCGTGAGATGGCCGACGAACTCA
G.stearothermophilus GAAAGAGGACGGCAGTTTTTATACATATCAAGAGATGGCAGAGGAGCTAA
.*** ..** ** ** *:***.** *. **.:****.** *.** *
Geobacillus_sp._MGI_ TTCCGTACGTGCTGGAGCGCGGATTTACGCACATTGAGCTGCTTCCGCTT
G._thermodenitrificans_NG80-2 TCCCGTATGTGCTCGATCATGGGTTTACGCACATTGAGTTGCTTCCTCTT
Geobacillus_sp._Y412MC10 TTCCTTATTTGCAGGAAATGAGTTATACCCACGTAGAATTTATGCCCTTG
Bacillus_sp._NBRC_15313 TTCCGTACGTGCTGGAGCGCGGATTTACGCACATTGAGCTGCTTCCGCTT
Geobacillus_sp._Y412MC61 TTCCGTACGTGCTGGAGCGCGGATTTACGCACATTGAGCTGCTTCCGCTT
G.stearothermophilus TCCCTTATGTTCTCGAACATGGGTTTACTCATATTGAGCTGCTCCCACTC
* ** ** * *: ** . .* *:*** ** .*:**. * .* ** *
Geobacillus_sp._MGI_ GTCGAGCATCCGCTCGATCGTTCGTGGGGATATCAAGGGACCGGCTATTA
G._thermodenitrificans_NG80-2 GTCGAGCATCCGCTCGACCGCTCGTGGGGCTATCAAGGAACAGGGTATTA
Geobacillus_sp._Y412MC10 GCGGAGCATCCCTACGATCTTTCGTGGGGCTATCAGGGCACAGGATTTTA
Bacillus_sp._NBRC_15313 GTCGAGCATCCGCTCGATCGTTCGTGGGGATATCAAGGGACCGGCTATTA
Geobacillus_sp._Y412MC61 GTCGAGCATCCGCTCGATCGTTCGTGGGGATATCAAGGGACCGGCTATTA
G.stearothermophilus GTCGAGCATCCGTTCGATCGTTCTTGGGGATATCAGGGAATAGGTTATTA
* ******** :*** * ** *****.*****.** * .** *:***
Geobacillus_sp._MGI_ TTCGGTGACAAGCCGCTATGGCACGCCGCACGATTTCATGTATTTCGTCG
G._thermodenitrificans_NG80-2 TGCGGTAACGAGTCGCTATGGTACGCCACACGACTTCATGTACTTCGTCG
Geobacillus_sp._Y412MC10 TGCGCTGACGAGCAGATACGGAACTCCCCATGATTTCATGTTTCTCGTCG
Bacillus_sp._NBRC_15313 TTCGGTGACAAGCCGCTATGGCACGCCGCACGATTTCATGTATTTCGTCG
Geobacillus_sp._Y412MC61 TTCGGTGACAAGCCGCTATGGCACGCCGCACGATTTCATGTATTTCGTCG
G.stearothermophilus TTCAGCAACAAGCCGCTACGGAACACCGCATGATTTGATGTATTTTATTG
* *. .**.** .*.** ** ** ** ** ** ** ****: * .* *
Geobacillus_sp._MGI_ ACCGCTGCCATCAAGCGGGGCTTGGCGTCATCATCGACTGGGTGCCGGGG
G._thermodenitrificans_NG80-2 ACCGTTGCCATCAGGCGGGAATCGGGGTCATTATGGACTGGGTGCCGGGG
Geobacillus_sp._Y412MC10 ACCAGCTGCACCAAGCCGGCATCGGCGTGCTGCTCGACTGGGTGCCCGCA
Bacillus_sp._NBRC_15313 ACCGCTGCCATCAAGCGGGGCTTGGCGTCATCATCGACTGGGTGCCGGGG
Geobacillus_sp._Y412MC61 ACCGCTGCCATCAAGCGGGGCTTGGCGTCATCATCGACTGGGTGCCGGGG
G.stearothermophilus ACCGCTGTCACCAAGCTGGAATAGGCGTCATTCTCGATTGGGTTCCTGGC
***. ** **.** ** .* ** ** .* .* ** ***** ** *
Geobacillus_sp._MGI_ CATTTTTGCAAGGACGCCCACGGGCTGTACATGTTTGACGGCGCACCGAC
G._thermodenitrificans_NG80-2 CATTTTTGCAAGGACGCCCATGGGTTATATATGTTTGATGGCGCCCCGAC
Geobacillus_sp._Y412MC10 CATTTTGCCAAGGATGCCCACGGGCTTCGGCAGTTTGACGGGGCGCCTCT
Bacillus_sp._NBRC_15313 CATTTTTGCAAGGACGCCCACGGGCTGTACATGTTTGACGGCGCACCGAC
Geobacillus_sp._Y412MC61 CATTTTTGCAAGGACGCCCACGGGCTGTACATGTTTGACGGCGCACCGAC
G.stearothermophilus CACTTTTGTAAAGATTCCCATGGGTTATATATGTTTGATGGCGCACCGGC
** *** **.** **** *** * . .:****** ** ** **

© COPYRIG
HT UPM
121
Geobacillus_sp._MGI_ GTATGAATACGCGAATGAAAAAGACCGAGAAAATTACGTCTGGGGGACGG
G._thermodenitrificans_NG80-2 GTATGAATACGCGAATGAAAAAGACCGAGAAAATTACGTTTGGGGGACGG
Geobacillus_sp._Y412MC10 TTATGAGTATGCAGACCCCCAAAAAGCCGAGAAACCTGGCTGGGGAACAT
Bacillus_sp._NBRC_15313 GTATGAATACGCGAATGAAAAAGACCGAGAAAATTACGTCTGGGGGACGG
Geobacillus_sp._Y412MC61 GTATGAATACGCGAATGAAAAAGACCGAGAAAATTACGTCTGGGGGACGG
G.stearothermophilus ATATGAATATGCCAACATGCAAGACCGGGAAAATTACGTATGGGGAACGG
*****.** ** .* .**.*. **.**: . * *****.**.
Geobacillus_sp._MGI_ CGAATTTTGACTTGGGCAAGCCGGAAGTGCGCAGTTTTCTGATCTCCAAT
G._thermodenitrificans_NG80-2 CCAATTTTGATTTAGGCAAGCCGGAAGTGCGCAGTTTTCTCATCTCGAAC
Geobacillus_sp._Y412MC10 TGTCTTTCGATTATGCCAAGCCGGAGGTAATTTCATTCCTCATCTCCAAT
Bacillus_sp._NBRC_15313 CGAATTTTGACTTGGGCAAGCCGGAAGTGCGCAGTTTTCTGATCTCCAAT
Geobacillus_sp._Y412MC61 CGAATTTTGACTTGGGCAAGCCGGAAGTGCGCAGTTTTCTGATCTCCAAT
G.stearothermophilus CAAACTTTGACCTTGGCAAGCCGGAAGTCCGCAGCTTTTTGATTTCCAAT
:. ** ** : * *********.** . : ** * ** ** **
Geobacillus_sp._MGI_ GCGTTGTTTTGGCTGGAGTATTACCATGTGGACGGGTTTCGCGTCGATGC
G._thermodenitrificans_NG80-2 GCATTGTTTTGGCTCGAGTATTACCATATCGACGGGTTCCGGGTCGATGC
Geobacillus_sp._Y412MC10 GCCTTATTTTGGATGGATATGTATCATATTGATGGTCTTCGCGTTGATGC
Bacillus_sp._NBRC_15313 GCGTTGTTTTGGCTGGAGTATTACCATGTGGACGGGTTTCGCGTCGATGC
Geobacillus_sp._Y412MC61 GCGTTGTTTTGGCTGGAGTATTACCATGTGGACGGGTTTCGCGTCGATGC
G.stearothermophilus GCGTTATTTTGGATGGAATATTTCCATGTGGACGGGTTTCGTGTAGATGC
** **.******.* ** :: *: ***.* ** ** * ** ** *****
Geobacillus_sp._MGI_ GGTCGCTAATATG------------------------------CTTTATT
G._thermodenitrificans_NG80-2 GGTTGCCAATATG------------------------------CTTTATT
Geobacillus_sp._Y412MC10 CGTGACGAGCATGATCCGTCTTGATTTTGAGAAGCGTGAGGGTCAGTACA
Bacillus_sp._NBRC_15313 GGTCGCCAATATG------------------------------CTTTATT
Geobacillus_sp._Y412MC61 GGTCGCCAATATG------------------------------CTTTATT
G.stearothermophilus TGTTGCCAATATG------------------------------TTATATT
** .* *. *** : ** :
Geobacillus_sp._MGI_ GGCCGAACAACGACCGGCTCTATGAAAATCCGTATGCGGTCGAGTTTTTG
G._thermodenitrificans_NG80-2 GGCCGAACAATGACAGGCTGTACGAGAACCCGTATGCGGTCGAGTTTTTG
Geobacillus_sp._Y412MC10 GCCTTAACGAGCACGGAGGCTTGGAAAACCTTGAGGCGATATCCTTTCTG
Bacillus_sp._NBRC_15313 GGCCGAACAATGACCGGCTCTATGAAAATCCGTATGCGGTCGAGTTTTTG
Geobacillus_sp._Y412MC61 GGCCGAACAACGACCGGCTCTATGAAAATCCGTATGCGGTCGAGTTTTTG
G.stearothermophilus GGCCAAACAGCGACGTACTATACAAAAATACGTATGCCGTGGAGTTCTTG
* * ***.. ** . *: .*.** . * ** .* . ** **
Geobacillus_sp._MGI_ CGCCAGTTGAATGAGGCGGTGTTTGCCTATGACCCGAGCGTCTTGATGAT
G._thermodenitrificans_NG80-2 CGCAAGTTAAACGAAGCGGTGTTTGCCTATGATCCGAATGTGCTGATGAT
Geobacillus_sp._Y412MC10 CAGGAATTGAATAAAGCCGTGTTTCGATATTACCCGAATGCCTTGATGAT
Bacillus_sp._NBRC_15313 CGCCAGTTGAATGAGGCGGTGTTTGCCTATGACCCGAACGTCTTGATGAT
Geobacillus_sp._Y412MC61 CGCCAGTTGAATGAGGCGGTGTTTGCCTATGACCCGAACGTCTTGATGAT
G.stearothermophilus CAAAAATTAAATGAAACGGTATTCGCCTATGATCCGAACATATTAATGAT
*. *.**.** .*..* **.** .*** * ****. . *.*****
Geobacillus_sp._MGI_ CGCTGAAGATTCGACCGACTGGCCTCGGGTGACCGCGCCGACGTACGATG
G._thermodenitrificans_NG80-2 TGCGGAAGATTCGACTGACTGGCCGAAGGTGACCGCGCCGACGTATGAAG
Geobacillus_sp._Y412MC10 GGCCGAGGAGTCGAGCGCATGGGCGGGGGTTACGGCACCTGTGCATGAAG
Bacillus_sp._NBRC_15313 CGCTGAAGATTCGACCGACTGGCCTCGGGTGACCGCGCCGACGTACGATG
Geobacillus_sp._Y412MC61 CGCTGAAGATTCGACCGACTGGCCTCGGGTGACCGCGCCGACGTACGATG
G.stearothermophilus TGCCGAAGATTCGACAGACTGGCCGCGCGTCACTGCTCCAACATACGACG
** **.** **** *..*** * . ** ** ** ** . . * ** *
Geobacillus_sp._MGI_ GCGGCCTTGGGTTTAACTACAAGTGGAACATGGGCTGGATGAACGACATG
G._thermodenitrificans_NG80-2 GCGGACTCGGCTTTAATTATAAATGGAACATGGGCTGGATGAACGACATG
Geobacillus_sp._Y412MC10 GGGGTCTTGGCTTCAATTACAAATGGAATATGGGCTGGATGAACGACACG
Bacillus_sp._NBRC_15313 GCGGCCTTGGGTTTAACTACAAGTGGAACATGGGCTGGATGAACGACATG
Geobacillus_sp._Y412MC61 GCGGCCTTGGGTTTAACTACAAGTGGAACATGGGCTGGATGAACGACATG
G.stearothermophilus GAGGATTAGGATTTAACTATAAATGGAACATGGGATGGATGAACGATATT
* ** * ** ** ** ** **.***** *****.*********** *
Geobacillus_sp._MGI_ CTGAAGTATATGGAAACGCCGCCGCATGAGCGGAAATACGCCCATAACCA
G._thermodenitrificans_NG80-2 CTGAAGTACATGGAAACACCGCCGTATGAGCGGAGGCATGTGCATAACCA
Geobacillus_sp._Y412MC10 CTGTCTTATATTGAACAAGAGTTCGATCAGCGGCCTACCCATCATAATTT
Bacillus_sp._NBRC_15313 CTGAAGTATATGGAAACGCCGCCGCATGAGCGGAAATACGCCCATAACCA
Geobacillus_sp._Y412MC61 CTGAAGTATATGGAAACGCCGCCGCATGAGCGGAAATACGCCCATAACCA
G.stearothermophilus TTAACTTATATGGAAACGCCGCCTGAACATCGAAAATACGTGCACAATAA
*.:. ** ** ***... .* *: * **.. . ** ** :

© COPYRIG
HT UPM
122
Geobacillus_sp._MGI_ AGTCAGTTTTTCCCTCCTTTATGCGTATTCGGAAAATTTCATTTTGCCAT
G._thermodenitrificans_NG80-2 AGTAACGTTCTCCCTCCTTTATGCGTATTCGGAAAATTTCATTTTGCCGT
Geobacillus_sp._Y412MC10 ACTGACATTTCCCATTTGTTATGCCTATTCGGAGAATTTTACATTGCCGC
Bacillus_sp._NBRC_15313 AGTCAGTTTTTCCCTCCTTTATGCGTATTCGGAAAATTTCATTTTGCCAT
Geobacillus_sp._Y412MC61 AGTCAGTTTTTCCCTCCTTTATGCGTATTCGGAAAATTTCATTTTGCCAT
G.stearothermophilus AGTAACATTTTCCCTCTTGTATGCGTATTCGGAAAATTTCATTTTACCTT
* * * ** **.* ***** ********.***** * :**.**
Geobacillus_sp._MGI_ TTTCCCATGATGAAGTTGTGCATGGCAAAAAATCGCTGCTCAATAAAATG
G._thermodenitrificans_NG80-2 TTTCCCACGATGAAGTCGTGCATGGCAAAAAATCGCTGCTCAATAAAATG
Geobacillus_sp._Y412MC10 TTTCACACGATGAAGTCGTCCATGGAAAGAAATCGCTGCTTAATAAAATG
Bacillus_sp._NBRC_15313 TTTCCCATGATGAAGTTGTGCATGGCAAAAAATCGCTGCTCAATAAAATG
Geobacillus_sp._Y412MC61 TTTCCCATGATGAAGTTGTGCATGGCAAAAAATCGCTGCTCAATAAAATG
G.stearothermophilus TTTCCCATGACGAGGTCGTACATGGAAAAAAATCGCTGTTAAGTAAAATG
****.** ** **.** ** *****.**.********* * *.*******
Geobacillus_sp._MGI_ CCTGGGTCGTACGAAGAGAAGTTCGCCCAGCTGCGCCTATTGTATGGCTA
G._thermodenitrificans_NG80-2 CCAGGGTCGTATGAAGAGAAGTTCGCCCAGCTGCGCCTCTTGTACGGCTA
Geobacillus_sp._Y412MC10 CCGGGAAGCTACGAACAAAAGTTTGCGGGACTGCGGATTTTGCTTGGATA
Bacillus_sp._NBRC_15313 CCTGGGTCGTACGAAGAGAAGTTCGCCCAGCTGCGCCTATTGTATGGCTA
Geobacillus_sp._Y412MC61 CCTGGGTCGTACGAAGAGAAGTTCGCCCAGCTGCGCCTATTGTATGGCTA
G.stearothermophilus CCGGGGACATATGAGGAAAAGTTTGCGCAATTAAGGTTGCTGTATGGATA
** **.: ** **. *.***** ** .. *..* * ** : **.**
Geobacillus_sp._MGI_ CATGATGGCCCACCCTGGGAAAAAGCTGCTGTTTATGGGCAGTGAGTTTG
G._thermodenitrificans_NG80-2 CATGATGGCTCATCCGGGGAAAAAGCTGTTGTTTATGGGCAATGAATTTG
Geobacillus_sp._Y412MC10 CCAGATCACCCAGCCCGGGAAGAATCTGCTGTTCATGGGGGGAGAGTTCG
Bacillus_sp._NBRC_15313 CATGATGGCCCACCCTGGGAAAAAGCTGCTGTTTATGGGCAGTGAGTTTG
Geobacillus_sp._Y412MC61 CATGATGGCCCACCCTGGGAAAAAGCTGCTGTTTATGGGCAGTGAGTTTG
G.stearothermophilus TTTGTTGACGCATCCTGGTAAGAAATTATTGTTTATGGGCGGCGAATTTG
:*:* .* ** ** ** **.** *. **** ***** .. **.** *
Geobacillus_sp._MGI_ CCCAGTTTGATGAATGGAAGTTTGAGGGAGAGCTCGACTGGGTGCTGTTC
G._thermodenitrificans_NG80-2 CTCAGTTTGATGAATGGAAGTTTGAGGATGAACTCGATTGGGTGCTGTTT
Geobacillus_sp._Y412MC10 GCCAGTTTATCGAATGGAAGGATCAGGAGCAGCTCGACTGGCTGCTGCTG
Bacillus_sp._NBRC_15313 CCCAGTTTGATGAATGGAAGTTTGAGGGAGAGCTCGACTGGGTGCTGTTC
Geobacillus_sp._Y412MC61 CCCAGTTTGATGAATGGAAGTTTGAGGGAGAGCTCGACTGGGTGCTGTTC
G.stearothermophilus GCCAGTTTGATGAATGGAAAGATTTAGAGCAGCTGGATTGGATGCTTTTT
******.: ********. :* :.*. *.** ** *** **** *
Geobacillus_sp._MGI_ GATTTTGAATTGCACCGGAAAATGGACGAATATGTGAAGCAGCTGATCGC
G._thermodenitrificans_NG80-2 GATTTTGAGCTGCACCGGAAGATGAACGATTACATGAAAGAGTTAATCGC
Geobacillus_sp._Y412MC10 GACTATGAAAGCCACCGCAAGCAGTTGGCATATACGGCAGCTCTAAACCG
Bacillus_sp._NBRC_15313 GATTTTGAATTGCACTGGAAAATGGACGAATATGTGAAGCAGCTGATCGC
Geobacillus_sp._Y412MC61 GATTTTGAATTGCACCGGAAAATGGACGAATATGTGAAGCAGCTGATCGC
G.stearothermophilus GATTTTGATATGCATCGGAATATGAATATGTATGTGAAAGAATTGTTGAA
** *:*** ** * ** .:* : . ** . *... . *.::
Geobacillus_sp._MGI_ CTGCTATAAACGGTATAAGCCGTTTTACGAGCTTGATCATGATCCGAGGG
G._thermodenitrificans_NG80-2 CTGCTATAAACGGTATAAGCCGTTTTACGAATTGGATCATGACCCGCAAG
Geobacillus_sp._Y412MC10 CATGTACGTGGATGAAAAGGCGCTATGGGAGCAGGATCACCGATGGGAAG
Bacillus_sp._NBRC_15313 CTGCTATAAACGGTATAAGCCGTTTTACGAGCTTGATCATGATCCGAGGG
Geobacillus_sp._Y412MC61 CTGCTATAAACGGTATAAGCCGTTTTACGAGCTTGATCATGATCCGAGGG
G.stearothermophilus ATGTTATAAGCGCTATAAACCGCTTTATGAGTTAGACCACTCTCCAGATG
.: ** .:. . *:**. ** *:*. **. : ** ** . . *
Geobacillus_sp._MGI_ GGTTTGAATGGATTGACGTTCATAATGCCGAGCAAAGTATTTTCTCATTC
G._thermodenitrificans_NG80-2 GATTTGAATGGATTGACGTTCACAACGCTGAACAAAGCATTTTCTCATTC
Geobacillus_sp._Y412MC10 GCTTCGAATGGCTCAGCGCCGATGATCATGAGCAGAGTGTCGTATCGTAT
Bacillus_sp._NBRC_15313 GGTTTGAATGGATTGACGTTCATAATGCCGAGCAAAGTATTTTCTCATTC
Geobacillus_sp._Y412MC61 GGTTTGAATGGATTGACGTTCATAATGCCGAGCAAAGCATTTTCTCGTTC
G.stearothermophilus GATTCGAGTGGATTGATGTTCATAACGCCGAACAAAGTATTTTCTCATTC
* ** **.***.* .. * * .* . **.**.** .* *.**.*:
Geobacillus_sp._MGI_ ATCCGCCGGGGGAAAAAAGAAGGTGATGTGCTGGTCATTGTTTGTAATTT
G._thermodenitrificans_NG80-2 ATCCGCCGCGGGAAAAAAGAAGATGATGTGCTTGTTATTGTTTGCAATTT
Geobacillus_sp._Y412MC10 ATGAGAATGGGCACCAAGCCCGGCGATACGCTGATCATCGTCATTAATTT
Bacillus_sp._NBRC_15313 ATCCGCCGGGGGAAAAAAGAAGGTGATGTGCTGGTCATTGTTTGTAATTT
Geobacillus_sp._Y412MC61 GTCCGCCGCGGGAAAAAAGACGGCGATCTATTGGTAATTGTTTGCAATTT
G.stearothermophilus ATTCGCAGAGGAAAAAAAGAGGATGATTTGCTTATTGTTGTGTGTAATTT
.* .*.. ** *..**. . *. *** . * .* .* ** : *****

© COPYRIG
HT UPM
123
Geobacillus_sp._MGI_ CACAAATCAGGCGTATGACGATTACAAAGTCGGTGTGCCGCTTTTGGCGC
G._thermodenitrificans_NG80-2 CACAAATCAGGCGTATGACGACTACAAAGTTGGAGTGCCGTTGCTCGTAC
Geobacillus_sp._Y412MC10 TCAGCCAAAGGCATATGACCAATATCGGGTCGGTTTGCCGAGAGCGGGGC
Bacillus_sp._NBRC_15313 CACAAATCAGGCGTATGACGATTACAAAGTCGGCGTGCCGCTTTTGGCGC
Geobacillus_sp._Y412MC61 CACAAATCAAGCGTATGACGATTACAAAGTCGGCGTGCCGCTTTTGGCGC
G.stearothermophilus CACAAATAAAGTATACCACGGTTATAAAGTTGGTGTTCCGTTATTTACAA
.....:.*.* .** ** . ** ...** ** * *** . ..
Geobacillus_sp._MGI_ CGTACCGCGAAGTGCTGAACAGCGATGCAGCGGAGTTTGGCGGTTCGGGA
G._thermodenitrificans_NG80-2 CGTATCGGGAAGTGCTGAATAGCGATGCGGTCACGTTTGGTGGATCGGGG
Geobacillus_sp._Y412MC10 AATATGTGGAAATTCTGAATTCCGATCATGCCGATTACGGCGGCTCCGGA
Bacillus_sp._NBRC_15313 CGTACCGCGAAGTGCTGAACAGCGATGCAGCGGAGTTTGGCGGATCAGGG
Geobacillus_sp._Y412MC61 CGTACCGCGAAGTGCTTAACAGCGATGCAGCGGAGTTTGGCGGTTCGGGA
G.stearothermophilus GATATCGGGAAGTAATCAATAGCGATGCAATCCAATTCGGCGGCTTTGGG
.** ***.* .* ** : **** . . . *: ** ** * **.
Geobacillus_sp._MGI_ CATGTCAACGGGAAGCGGCTTCCCGCTTTCCATGAGCCGTTTCATGGAAA
G._thermodenitrificans_NG80-2 CATGTCAATGGGAAACGGCTTTCCGCCTTCAATGAGCCGTTTCATGGTAA
Geobacillus_sp._Y412MC10 CTGCTGAACGACGGTGAGATGAAAGCGGAGAAGAAGACCTGGCATGGCCA
Bacillus_sp._NBRC_15313 CATGTCAATTCGAAGCGGCTTTCCGCTTTCCATGAGCCGTTTCATGGAAA
Geobacillus_sp._Y412MC61 CATGTCAACGGGAAGCGGCTTCCCGCTTTCAGTGAGCCGTTTCATGGAAA
G.stearothermophilus AATATCAATCCAAAACCGATTGCGGCGATGGAAGGGCCGTTTCACGGAAA
.: * ** .. *.* . ** : . ..*.* * ** ** .*
Geobacillus_sp._MGI_ ACCGTACCATGTGCGCATGACGATTCCGCCGTTTGGCATTTCCATTTTGC
G._thermodenitrificans_NG80-2 ACCATACCACGTGCGCATGACGATTCCGCCATTTGGCATTTCCATTTTAC
Geobacillus_sp._Y412MC10 AACCCACAGCCTGGAGATCAAGCTGCCTCCATTAGGCATGGTTGTTTTAA
Bacillus_sp._NBRC_15313 ACCGTACCATGTGCGCATGACGATTCCGCCGTTTGGCATTTCCATTTTGC
Geobacillus_sp._Y412MC61 ACCGTACCATGTGCGCATGACGATTCCGCCGTTTGGCATTTCCATTTTGC
G.stearothermophilus GCCATATCATATTCAGATGACGATCCCGCCGTTTGGCATTTCTATTTTAA
..* * .. * . ** *.*.* ** **.**:***** .****..
Geobacillus_sp._MGI_ GGCCAGTGCAAAAACGAG--------------------------------
G._thermodenitrificans_NG80-2 GGCCAGTGCAAAAACGAG--------------------------------
Geobacillus_sp._Y412MC10 AGAAAAAGCCGCCTCGAT--------------------------------
Bacillus_sp._NBRC_15313 GGCCAGTGCAAAAACGAG--------------------------------
Geobacillus_sp._Y412MC61 GGCCAGTGCAAAAACGAG--------------------------------
G.stearothermophilus GACCAGTAAAAAAAGGTAGCGTCAAAAGTTTTATGAAAACTCCACATCCG
....*.:......: *:
Geobacillus_sp._MGI_ --------------------------------------------------
G._thermodenitrificans_NG80-2 --------------------------------------------------
Geobacillus_sp._Y412MC10 --------------------------------------------------
Bacillus_sp._NBRC_15313 --------------------------------------------------
Geobacillus_sp._Y412MC61 --------------------------------------------------
G.stearothermophilus CCATCCCATGGAGCATCGTAAGGCATCCTTGGAGCCGGATTCGCCCTTGA
Geobacillus_sp._MGI_ --------------GGGAGAGAAAG-------------------------
G._thermodenitrificans_NG80-2 --------------GGGAGAGAAAG-------------------------
Geobacillus_sp._Y412MC10 --------------CGAGGAAATCG-------------------------
Bacillus_sp._NBRC_15313 --------------GGGAGAGAAAG-------------------------
Geobacillus_sp._Y412MC61 --------------GGGAGAGAAAG-------------------------
G.stearothermophilus CCAACACCCGCCAAAGGTGTGAAAGGGACGTCAAGGGCGACGGGGACAAA
*. *:.*:.*
Geobacillus_sp._MGI_ --------------------------------------------------
G._thermodenitrificans_NG80-2 --------------------------------------------------
Geobacillus_sp._Y412MC10 --------------------------------------------------
Bacillus_sp._NBRC_15313 --------------------------------------------------
Geobacillus_sp._Y412MC61 --------------------------------------------------
G.stearothermophilus AAAGAGGGCATAGGAAAGCCGCCCTTGCCCTTACCGAATTTTACCTTTGA
Geobacillus_sp._MGI_ -------CAGAATGAAGAAGAAGTGCATCGCCATGTTATTGG--------
G._thermodenitrificans_NG80-2 -------CGAAATGAAAAAGAAATGCATCGCCATGTTATTGG--------
Geobacillus_sp._Y412MC10 -------CAAGATCGATCG--GACGCGTCGCTGAAGGCGGCA--------
Bacillus_sp._NBRC_15313 -------CAGAATGAAGAAGAAGTGCATCGCCATGTTATTGG--------
Geobacillus_sp._Y412MC61 -------CAGAATGAAGAAGAAGTGCATCGCCATGTTATTGG--------
G.stearothermophilus CGAGGTTCGGTTGGTCAAGGGTTCGCTTCGCCGAATCCGGCTGTTCTTCT
*.. : . .. ** **** .:. .
© COPYRIG
HT UPM
124
Geobacillus_sp._MGI_ ------------CCGGCGGGCAAGGAAGCCGGCTTCGCTCGCTGACGAAA
G._thermodenitrificans_NG80-2 ------------CCGGCGGGCAAGGAAGTCGGCTTCGCTCGCTGACGACA
Geobacillus_sp._Y412MC10 ------------GCGGCAAGAGAGAAAACAGAACAAAAAACGAAACGGAG
Bacillus_sp._NBRC_15313 ------------CCGGCGGGCAAGGAAGCCGGCTTCGCTCGCTGACGAAA
Geobacillus_sp._Y412MC61 ------------CCGGCGGGCAAGGAAGCCGGCTTCGCTCGCTGACGAAA
G.stearothermophilus GATCCATGGGCTCCGGCGGACAAAAAAGTTAGGCTGCCTCTTG-TTGGAG
****.....*..**. .. : .:. : *...
Geobacillus_sp._MGI_ AACATCGCGAAACCGGCCGTGCCGTTTGGGGGGAAGTACCGGATCATTGA
G._thermodenitrificans_NG80-2 AACATCGCTAA---------------------------------------
Geobacillus_sp._Y412MC10 CAAAAGGGGGAAGCAGGATTGA----------------------------
Bacillus_sp._NBRC_15313 AACATCGCGAAACCAGCCGTGCCGTTTGGGGGGAAGTACCGGATCATTGA
Geobacillus_sp._Y412MC61 AACATCGCGAAACCAGCCGTGCCGTTTGGGGGGAAGTACCGGATCATTGA
G.stearothermophilus GAAATCTTGAGCCATGGCGATCAGCTTCGTCCACCGGGCCGGCATATGGG
*.*: ..
Geobacillus_sp._MGI_ TTTTACGTTGAGCAATTGCACGAACTCGGGTATTGACACAGTCGGGGTGT
G._thermodenitrificans_NG80-2 --------------------------------------------------
Geobacillus_sp._Y412MC10 --------------------------------------------------
Bacillus_sp._NBRC_15313 TTTTAC--------------------------------------------
Geobacillus_sp._Y412MC61 --------------------------------------------------
G.stearothermophilus GCAGATCGG-----------CGAGCTC-----------------------
(*)indicates positions which have a single, fully conserved residue.
(:)indicates conservation between groups of strongly similar properties - scoring >
0.5 in the Gonnet PAM 250 matrix.
(.) indicates conservation between groups of weakly similar properties - scoring =<
0.5 in the Gonnet PAM 250 matrix.
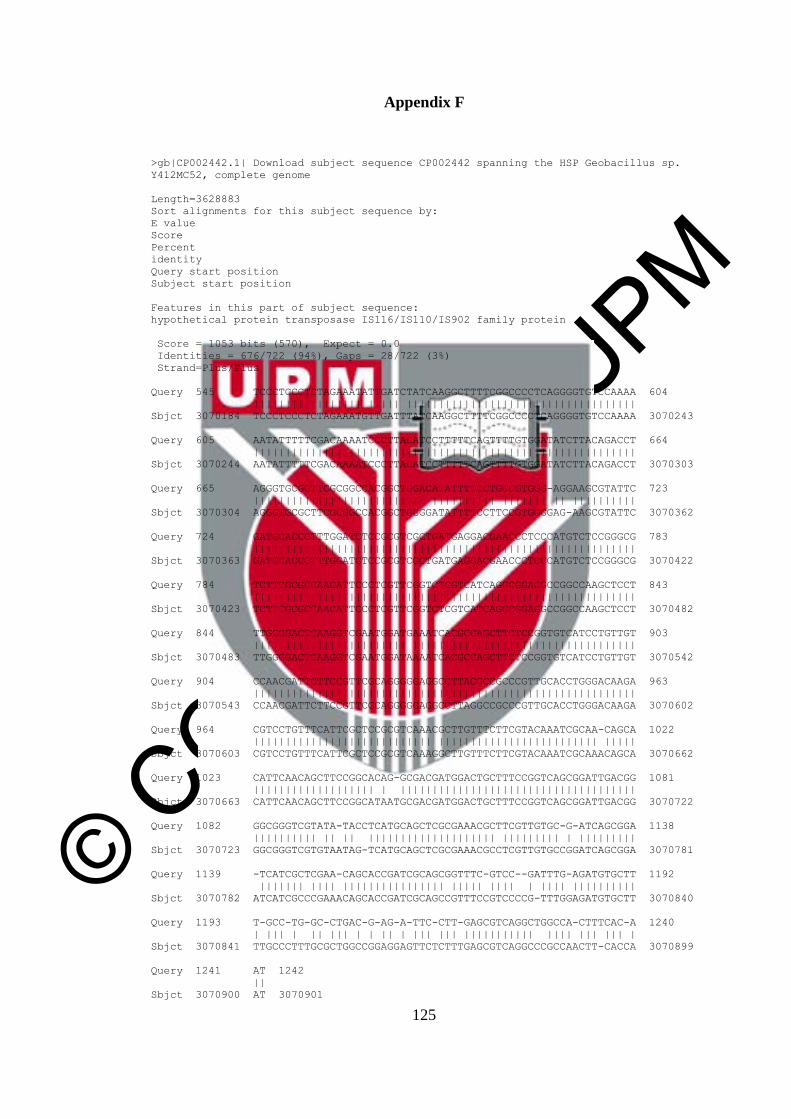
© COPYRIG
HT UPM
125
Appendix F
>gb|CP002442.1| Download subject sequence CP002442 spanning the HSP Geobacillus sp.
Y412MC52, complete genome
Length=3628883
Sort alignments for this subject sequence by:
E value
Score
Percent
identity
Query start position
Subject start position
Features in this part of subject sequence:
hypothetical protein transposase IS116/IS110/IS902 family protein
Score = 1053 bits (570), Expect = 0.0
Identities = 676/722 (94%), Gaps = 28/722 (3%)
Strand=Plus/Plus
Query 545 TCCCTCCCTCTAGAAATATTGATCTATCAAGGCTTTTCGGCCCCTCAGGGGTGTCCAAAA 604
||||||||||||||||| ||||| ||||||||||||||||||||||||||||||||||||
Sbjct 3070184 TCCCTCCCTCTAGAAATGTTGATTTATCAAGGCTTTTCGGCCCCTCAGGGGTGTCCAAAA 3070243
Query 605 AATATTTTTCGACAAAATCCCTTACATCCTTTTTCAGTTTTGTGGATATCTTACAGACCT 664
||||||||||||||||||||||||||||||||||||||||||||||||||||||||||||
Sbjct 3070244 AATATTTTTCGACAAAATCCCTTACATCCTTTTTCAGTTTTGTGGATATCTTACAGACCT 3070303
Query 665 AGGGTGCGCTTCGCGGCCACGGCTGGACATATTTTCCTGCCGTGGG-AGGAAGCGTATTC 723
|||||||||||||||||||||||||| |||||||||| ||||||| || ||||||||||
Sbjct 3070304 AGGGTGCGCTTCGCGGCCACGGCTGGGGATATTTTCCTTCCGTGGGGAG-AAGCGTATTC 3070362
Query 724 GATGCACCCTTTGGATCTCCGCGTCGCTGATGAGGACGAACCCTCCCATGTCTCCGGGCG 783
||||||||||||||||||||||||||||||||||||||||||||||||||||||||||||
Sbjct 3070363 GATGCACCCTTTGGATCTCCGCGTCGCTGATGAGGACGAACCCTCCCATGTCTCCGGGCG 3070422
Query 784 TCTTCGCGCCAACATTCCCTCGTTCGGTCTCGTCATCAGGCGGAGGCCGGCCAAGCTCCT 843
||||||||||||||||||||||||||||||||||||||||||||||||||||||||||||
Sbjct 3070423 TCTTCGCGCCAACATTCCCTCGTTCGGTCTCGTCATCAGGCGGAGGCCGGCCAAGCTCCT 3070482
Query 844 TTGGGGACTCAAGGTCGAATGGATGAAATCACGCCAGCTTCTCCGGTGTCATCCTGTTGT 903
|||||||||||||||||||||||| |||||||||||||||||||||||||||||||||||
Sbjct 3070483 TTGGGGACTCAAGGTCGAATGGATAAAATCACGCCAGCTTCTCCGGTGTCATCCTGTTGT 3070542
Query 904 CCAACGATTCTTCCGTTCGCAGGGGGAGGCCTTAGGCCGCCCGTTGCACCTGGGACAAGA 963
||||||||||||||||||||||||||||||||||||||||||||||||||||||||||||
Sbjct 3070543 CCAACGATTCTTCCGTTCGCAGGGGGAGGCCTTAGGCCGCCCGTTGCACCTGGGACAAGA 3070602
Query 964 CGTCCTGTTTCATTCGCTCCGCGTCAAACGCTTGTTTCTTCGTACAAATCGCAA-CAGCA 1022
|||||||||||||||||||||||||||| ||||||||||||||||||||||||| |||||
Sbjct 3070603 CGTCCTGTTTCATTCGCTCCGCGTCAAAGGCTTGTTTCTTCGTACAAATCGCAAACAGCA 3070662
Query 1023 CATTCAACAGCTTCCGGCACAG-GCGACGATGGACTGCTTTCCGGTCAGCGGATTGACGG 1081
||||||||||||||||||| | |||||||||||||||||||||||||||||||||||||
Sbjct 3070663 CATTCAACAGCTTCCGGCATAATGCGACGATGGACTGCTTTCCGGTCAGCGGATTGACGG 3070722
Query 1082 GGCGGGTCGTATA-TACCTCATGCAGCTCGCGAAACGCTTCGTTGTGC-G-ATCAGCGGA 1138
|||||||||| || || |||||||||||||||||||| ||||||||| | |||||||||
Sbjct 3070723 GGCGGGTCGTGTAATAG-TCATGCAGCTCGCGAAACGCCTCGTTGTGCCGGATCAGCGGA 3070781
Query 1139 -TCATCGCTCGAA-CAGCACCGATCGCAGCGGTTTC-GTCC--GATTTG-AGATGTGCTT 1192
||||||| |||| |||||||||||||||| ||||| |||| | |||| ||||||||||
Sbjct 3070782 ATCATCGCCCGAAACAGCACCGATCGCAGCCGTTTCCGTCCCCG-TTTGGAGATGTGCTT 3070840
Query 1193 T-GCC-TG-GC-CTGAC-G-AG-A-TTC-CTT-GAGCGTCAGGCTGGCCA-CTTTCAC-A 1240
| ||| | || ||| | | || | ||| ||| ||||||||||| |||| ||| ||| |
Sbjct 3070841 TTGCCCTTTGCGCTGGCCGGAGGAGTTCTCTTTGAGCGTCAGGCCCGCCAACTT-CACCA 3070899
Query 1241 AT 1242
||
Sbjct 3070900 AT 3070901

© COPYRIG
HT UPM
126
BIODATA OF STUDENT
The student was born in Alor Setar, Kedah on May 10th 1984. She studied in
Sekolah Rendah Kebangsaan Treacher Methodist, Taiping and Sekolah Rendah
Seafield, Subang Jaya for primary education. She went to Sekolah Kebangsaan
Seafield in 1999 for lower secodary and continued in MRSM Balik Pulau in 2002 for
her upper secondary education. She received her degree of Bachelor of Science
majoring in Biotechnology, Biochemistry and Molecular Biology from University of
Melbourne, Australia in 2007. She then continued her study for Master of Science in
the field of catalysis and molecular biology under Faculty of Science. After the
completion of her Master degree, she plans to pursue her study for PhD for her
passion in research.