numerical simulation of underground coal · media flow approach as in hydrocarbon reservoir...
TRANSCRIPT
NUMERICAL SIMULATION OF UNDERGROUND COALGASIFICATION USING THE CRIP METHOD
Mojtaba Seifi, Zhangxin Chen and Jalal Abedi*
Department of Chemical & Petroleum Engineering, University of Calgary, Calgary, Alberta, Canada T2N 1N4
A three-dimensional simulation of the Underground coal gasification (UCG) process is studied in terms of the heat and mass transport phenomenaand chemical kinetics in a coal seam during coal combustion by applying the controlled retracting injection point technique. The STARS moduleof the Computer Modelling Group software is used in this study. The gas species flow rate, cavity shapes, and temperature profile in the coal seamduring gasification are investigated. The main motivation behind this study is to provide a simulation methodology by using a comprehensiveporous media flow approach to understand the critical aspects of the UCG process.
Une simulation tridimensionnelle du processus de gazeification in situ du charbon (UCG) est etudiee en fonction de la chaleur, des phenomenesde transport de la matiere ainsi que de la cinetique chimique dans une veine de charbon lors de sa combustion en appliquant la technique deretraction controlee du point d’injection. Le module STARS du logiciel informatique de modelisation du groupe est utilise dans cette etude. Ledebit de l’espece de gaz, les formes de cavites, et profil de temperature dans la veine de charbon lors de la gazeification sont etudies. La principalemotivation de cette etude est de fournir une methodologie de simulation en utilisant une approche globale de l’ecoulement en milieu poreux afinde comprendre les aspects critiques du processus de UCG.
Keywords: underground coal gasification, CRIP, pyrolysis, cavity, chemical reaction kinetics
INTRODUCTION
Coal as one of the fossil fuels currently provides 25% of thetotal energy demand of the world. It is being used eitherdirectly as a fuel in the furnaces or being gasified to a mix-
ture of flammable gases that are mostly composed of H2, CO, CH4,CO2, and slightly of H2O, N2, and H2S. The product gas can be usedeither as a fuel for power generation or a chemical feedstock forvarious chemical products (e.g., hydrogen and ammonia; Perkins,2005).
Most current technologies of coal gasification such as entrainedflow, fluidised bed, and moving bed use a surface reactor for gasi-fication. The main differences between these technologies relateto the gas flow configuration, coal particle size, ash handling, andprocess conditions. An alternative for surface gasifier is an under-ground coal gasifier that eliminates the need for mining and can beused in deep or steeply dipping, unminable coal seam. It also low-ers the capital investment by eliminating the need for specialisedcoal processing (transporting and stocking) and gasification reac-tors. Underground coal gasification (UCG) has other advantagessuch as increased work safety, no surface disposal of ash, low dust,and noise pollution. It can be operated at high pressure to increasethe reaction intensity and improve the efficiency of the process.
A comprehensive environmental assessment and risk analysis isrequired prior to embarking the UCG process because of possi-bility of land subsidence and ground water pollution, the UCGdisadvantages (Lowry, 1963; Perkins, 2005; Khadse et al., 2006).
Several field designs have been operated in order to make UCGfunctional regarding different operating aspects such as a linkingtechnique, avoiding heat and gas loss into adjacent formation, pro-ducing constant high-quality gas, minimising the inhibitor effectof ash, and reducing the environmental effects (Perkins, 2005).Figure 1 illustrates the most applied field designs of the UCGprocess. Linked vertical wells (LVW) require drilling two verticalwells as the producer and injector and establishing a linking chan-nel between them using various technologies, including hydraulicfracturing, explosive fracture, reverse combustion, and direction-ally drilling. In the gasification of steeply dipping coal seams, the
∗Author to whom correspondence may be addressed.E-mail address: [email protected]. J. Chem. Eng. 89:1528–1535, 2011© 2011 Canadian Society for Chemical EngineeringDOI 10.1002/cjce.20496Published online 9 March 2011 in Wiley Online Library(wileyonlinelibrary.com).
| 1528 | THE CANADIAN JOURNAL OF CHEMICAL ENGINEERING | | VOLUME 89, DECEMBER 2011 |

Figure 1. Schematics of most applied field designs of UCG: (a) linkedvertical wells, LVW; (b) controlled retracting injection point, CRIP; and (c)steeply dipping coal seams.
injector is drilled at an angle in a lower part of the coal seam andthe producer is drilled vertically in an upper part. Also, in orderto access fresh coal and minimise the effect of deposited ash dregsover the injection point, a series of injection wells are drilled at anangle over the course of the UCG process. Another technique, thecontrolled retracting injection point (CRIP) is the most favourabletechnique of gasification of coal in situ. In the CRIP process, theproduction well is drilled vertically, and the injector is drilled hor-izontally close enough to the producer to have considerable flowconnection. When the linking channel is established, the coal isignited at the end of the horizontal well and a cavity is initiated.Once the coal near this cavity is burnt up, the injection point isretracted to a new location to access fresh coal and begin the nextcavity. This procedure carries on until the majority of coal betweenthe wells is consumed (Perkins, 2005; Yang, 2005; Burton et al.,2008).
In this work, three-dimensional numerical simulation of theUCG process is studied by using the CRIP technique and a porousmedia flow approach as in hydrocarbon reservoir simulation. TheSTARS module of the Computer Modelling Group software (CMG)is used in this study. The major approach is to apply heat and masstransport phenomena in conjunction with chemical reactions inorder to investigate the cavity shapes, temperature variation, prod-uct gas composition, and flow rates that are the critical aspects ofthe UCG process.
The modelling of the UCG process has mostly been done byusing the computational fluid dynamics (CFD) approach (Shir-sat, 1989; Burton et al., 2008). They used complicated velocityequations, included the turbulent gas flow inside a cavity, andutilised chemical engineering correlations for particle sizes, theporosity of a reactor, and an equilibrium controlled formulationfor reversible reactions. A porous media approach, which is basedon mass conservation, Darcy’s law, and energy conservation andaccounts for the change in porosity and permeability due to therock strength change, is more appropriate for the description ofUCG. Furthermore, in this approach the reversible reactions arereplaced with two irreversible reactions with effective kineticsmechanisms. The focus of this work is to establish this porousmedia approach for the description of UCG and show that thefindings from this approach are in agreement with those in theliterature using the CFD approach.
MODEL FORMULATION AND PROPERTIES
Model StructureThe modelling of UCG can generally be divided into two cate-gories: the geomechanic part that deals with cavity shapes, cavitygrowth mechanisms, subsidence, and other mechanical aspectsand the geochemistry part that deals with the fluid flow, prod-uct gas composition and calorific value, chemical reactions, andheat and mass transport phenomena. Therefore, the modellingof the UCG process is very complex and involves comprehen-sive simulation of coupled fluid, chemical, thermal transport, andmechanical deformation processes (Shirsat, 1989). In our model,the cavity growth is caused by char combustion and gasificationreactions. Thus, the rate of cavity growth depends on the progressrate of these reactions. Other types of mechanisms such as thermo-mechanical failure, rock spalling, sidewall regression, and bulkcollapse of coal need to be included in the future work as a sepa-rate module in addition to the STARS module of the CMG software(Britten and Thorsness, 1988).
In this study, a rectangular coal seam with dimensions of 25 mlength, 12.5 m width, and 9 m height is used. It is divided into99 intervals in the x-direction, 49 intervals in the y-direction, and35 layers in the z-direction numbered downwards. A vertical welllocated at one extremity of the seam and in the middle of widthis considered as the production well. It is extended from the toplayer to layer 31 and perforated at the last layer. The injectionwell is placed horizontally at layer 31 from blocks 2 to 84 inthe x-direction and in the same block as the producer in the y-direction. The injector is initially perforated at the toe which is3 m away from the producer. All boundaries of the seam domainare considered to be no flow. Despite of increasing the runtime ofsimulation, the grid blocks have been taken to have a very smallsize (0.25 m × 0.25 m × 0.25 m) so that the temperature gradientwill be more distinguishable and also because STARS uses theaverage temperature of each block to calculate the chemical reac-tion constants, having small blocks increases the accuracy of thereaction rates. Figure 2 delineates the structure of the applied coalseam.
Conservation EquationsFor investigation of the geochemical behaviour of coal gasifica-tion, the momentum balance law for determination of the flowvelocity, the mass conservation law for composition prediction,and the energy conservation law for temperature profile predictionare generally considered. In the model, the momentum conser-vation is approximated by Darcy’s law due to the porous mediaapproach used, and all conservation equations are defined in
Figure 2. Geological structure of applied coal seam model.
| VOLUME 89, DECEMBER 2011 | | THE CANADIAN JOURNAL OF CHEMICAL ENGINEERING | 1529 |

three-dimensional spaces as follows. The radiation effect betweenincandescent coal surfaces and gas molecules is ignored in heattransport phenomenon.
The momentum balance equation is:
�g = − k
�g
(∇P−�gg∇Z)
(1)
The mass balance equation for flowing component i is:
nb∑l=1
np∑j=1
�Dji�j�yij +nb∑l=1
np∑j=1
Tj�jyij��j+V
nr∑l=1
(s′li−sli)rl
+np∑j=1
�jqjkyji + ıiw
nb∑l=1
�wqaqwk
=(
V
�t
)(
�f
np∑j=1
(�jSjyji)
)(n+1)
−(
�f
np∑j=1
(�jSjyji)
)(n) (2)
The first and second expressions are flowing terms, diffusion,and convection, respectively. The mass transfer caused by chemi-cal reactions during the process is illustrated by the third term. Thefourth and fifth terms account for the external injection of com-ponent i via an injection well or an aquifer influx, respectively.The only term on the right-hand side describes the accumulationof component i in a gird block with the volume of V. The phase jtransmissibility, Tj, is defined as:
Tj =(
A
�l
)(kj
�j
)j = 1, . . . , np (3)
which is a function of the effective permeability, viscosity, cross-sectional area, and node spacing.
The conservation equation of solid component i is:
V
nr∑l=1
(s′li−sli)rl =
(V
�t
)((��Ci)(n+1)−(��Ci)(n)
)(4)
Equation (4) describes the variation of concentration of solidcomponent i with time which is only caused by chemical reac-tions. The left-hand side describes the consumption rate of solidcomponent i during the gasification and the right-hand side isthe accumulation term. In our model, two solid components oforiginal coal and char are considered.
The energy conservation equation is:
nb∑l=1
np∑j=1
Tj�jHj��j +nb∑l=1
K�T + V
nr∑l=1
Hrlrl
+np∑j=1
�jHjqjk(well−layer−k)
=(
V
�t
)(�(n+1)−�(n)
)(5)
Energy transfer by convection and conduction mechanisms areillustrated by the first and second terms, respectively. The thirdterm accounts for the reaction source/sink term and the last termdescribes the well source/sink for energy. In the model, neitherwell term for solid nor heat loss is considered. The accumulationterm of energy is included on the right-hand side in which � isdefined as:
� = �f
np∑j=1
�jSjUj + ��CsUs + (1−��)Ur (6)
Chemical ProcessesDuring in situ combustion of coal different processes of vaporisa-tion (drying), pyrolysis, and combustion and gasification of chartake place. Figure 3 illustrates different chemical regions of gasifi-cation of coal in situ. In the drying zone, surface water in the wetcoal is vaporised at temperatures above the saturation tempera-ture of seam water at a specified pressure, which makes the coalmore porous. The dried coal undergoes the pyrolysis process uponmore heating in the next phase. During pyrolysis, coal loses about40–50% of its dry weight as low molecular weight gases, chemicalwater, light hydrocarbons and heavy tars, and after evolving thevolatile matters, a more permeable solid substance called charwill be combusted and gasified by the injected oxidant agentsand exhausted gases from the previous steps (Campbell, 1976;Merrick, 1983).
The pyrolysis process is a complex thermal decomposition pro-cess at the typical temperature range of 400–900◦C which resultsin a series of reactions releasing volatile matters from the porouscoal matrix and changes the chemical and physical structure of thecoal. Several kinetic models of coal pyrolysis such as the consec-utive decomposition, multi-step consecutive-competitive model,simultaneous independent reaction model for each species, andsingle step decomposition (or overall first-order reaction model)have been proposed in the literature (Tsang, 1980; Perkins, 2005).In this study, the latter model is applied to describe the pyrolysis
Figure 3. Thermal wave propagation through coal seam during in situgasification which demonstrates the different regions.
| 1530 | THE CANADIAN JOURNAL OF CHEMICAL ENGINEERING | | VOLUME 89, DECEMBER 2011 |

process. It is assumed that the dried coal is decomposed to CO,CO2, H2, CH4, and char as shown in reactions (7) and (8). Forsimplicity, the char is assumed to be pure carbon. Thus, the effectof ash dreg residuals in the porous medium will be eliminated inthis model.
Dry−Coal → Char + Volatile matter + Ash + Chemical water (7)
Volatile matter → ˛1CO + ˛2CO2 + ˛3H2 + ˛4CH4 (8)
The stoichiometry coefficients have been calculated by usingmaterial balance on each element in the reaction and applying theelemental analysis of sub-bituminous coal under study as shownin Table 1. Thus, the final form of the pyrolysis reaction used inthe model is:
Dry−Coal → 4.63 Char + 0.12CO + 0.18CO2 + 0.43H2
+0.79CH4 �H0298
≈ 0.0 (9)
The kinetics of the volatile matter releasing is described duringthe pyrolysis process in the model by a first-order reaction on theconcentration of coal for which the rate varies with temperatureaccording to an Arrhenius relationship below where the valuesof 1.9e17/day and 180 kJ/mole are used for the pre-exponentialfactor, �0, and activation energy, E, respectively (Merrick, 1983;Vargas and Perimutter, 1985; Ma et al., 1991; Nourozieh et al.,2010)
� = �0 exp(−E/RT) (10)
A set of heterogeneous reactions between char and gas speciesmostly on the surface of cavities and homogeneous reactionsamong gas species inside the cavities take place. The rate ofprogress of these heterogeneous reactions determines the rate ofconsumption of carbon and cavity growth, and these homoge-neous reactions play the main role in the ultimate composition ofthe product syngas, particularly the water–gas shift and methanesteam reforming reactions. The most important reactions are sum-marised as follows (Thorsness and Rozsa, 1976; Perkins, 2005;Nourozieh et al., 2010):
C + O2 → CO2 �H0298
= −393 kJ/mole (11)
C + H2O → H2 + CO �H0298
= +131 kJ/mole (12)
C + CO2 → 2CO �H0298
= +172 kJ/mole (13)
Table 1. Coal analysis results
Ultimate analysisMoisture 0.89Ash 9.66H 3.55C 73.76N 1.07S 0.43O 10.64
Proximate analysisMoisture 4.72Ash 9.29Volatile matter 30.46Fixed carbon 55.54
C + 2H2 → CH4 �H0298
= −75 kJ/mole (14)
CO + 1/2O2 → CO2 �H0298
= −283 kJ/mole (15)
CO + H2O ↔ CO2 + H2 �H0298
= −41 kJ/mole (16)
CH4 + H2O ↔ CO + 3H2 �H0298
= +206 kJ/mole (17)
Except reaction (14) which is more effective at high pressures,other reactions are more common for the surface coal gasifiersand shallow UCG processes.
In order to model these reactions that appear as the source/sinkterms in the conservation equations, all are treated as first-orderreactions based on the concentration of the reactants and using thepower law as shown in Equation (18), and the temperature depen-dent rates are described by the Arrhenius correlation. Reversiblereactions are divided into two separate forward and backwardreactions when introduced into the STARS simulator. The rele-vant frequency factors, �l, and activation energies, El, for thesereactions are summarised in Table 2. These are effective kineticparameters that include the intrinsic kinetics and gas-film diffu-sion resistance (Nourozieh et al., 2010).
rl = �l
nc∏i=1
C�ii (18)
Model PropertiesIn the UCG process, the porosity of a block can be divided intotwo categories: void porosity, ��, which is defined as the volumefraction of solid and fluid in the block and fluid porosity, �f , whichis the volume fraction of the fluids. Both porosities vary with timeas the solid components in the block are consumed. In the model,these parameters are calculated using Equations (19) and (20):
�v = �0
(1 + Cp(P−Pr)−CT(T−Tr)
)(19)
�f = �v
(1−
ns∑i=1
(Csi/�si)
)(20)
Permeability is a strong function of the porosity, especially inthe case of the UCG process with a high amount of solid consump-tion; the large change in the void porosity causes a considerablechange in the permeability. Large permeability at the same oper-ating conditions makes an easy production of gas species and
Table 2. Kinetics parameters of heterogeneous and homogeneousreactions
Reaction El (kJ/ �l
no. (l ) Reaction name gmol) (1/day)
11 Coal combustion 100 1.80E+0612 Steam gasification 156 4.70E+0713 Boudouard 249 6.40E+0914 Hydrogen gasification 200 1.50E+1415 Carbon monoxide oxidation 247 6.48E+0316 Forward water shift 126 2.40E+0516 Reverse water shift 126 2.40E+0317 Forward methane steam reforming 30 2.70E+0717 Reverse methane steam reforming 30 2.70E+08
| VOLUME 89, DECEMBER 2011 | | THE CANADIAN JOURNAL OF CHEMICAL ENGINEERING | 1531 |
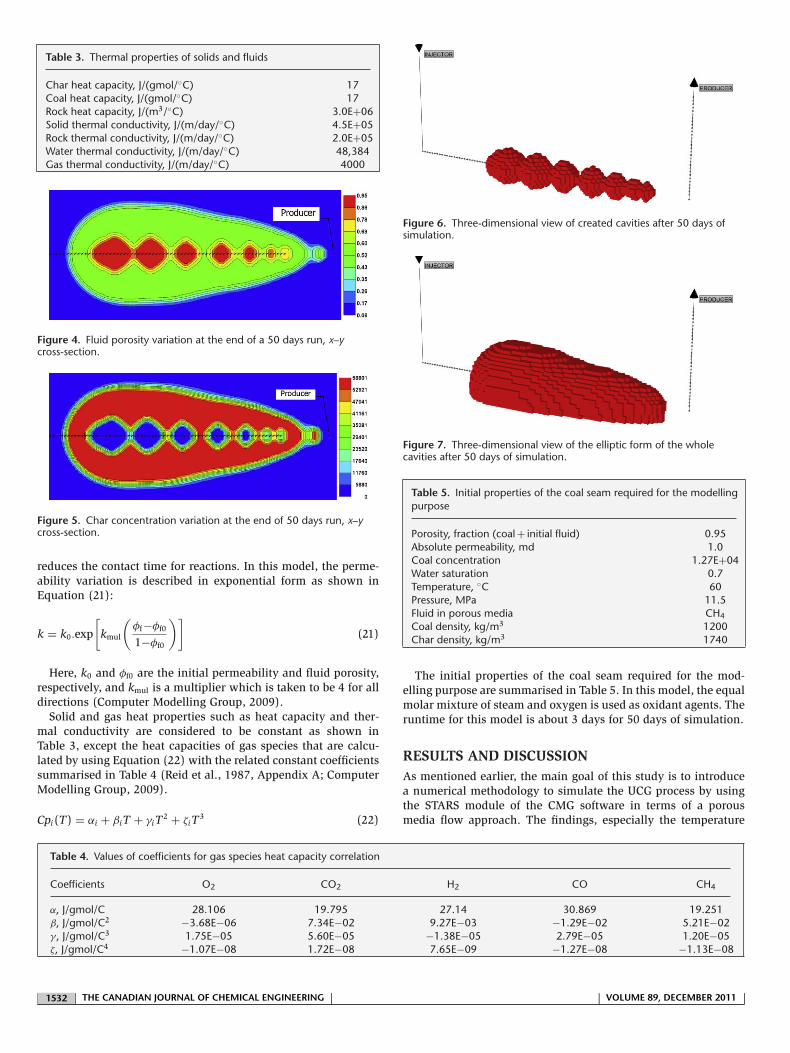
Table 3. Thermal properties of solids and fluids
Char heat capacity, J/(gmol/◦C) 17Coal heat capacity, J/(gmol/◦C) 17Rock heat capacity, J/(m3/◦C) 3.0E+06Solid thermal conductivity, J/(m/day/◦C) 4.5E+05Rock thermal conductivity, J/(m/day/◦C) 2.0E+05Water thermal conductivity, J/(m/day/◦C) 48,384Gas thermal conductivity, J/(m/day/◦C) 4000
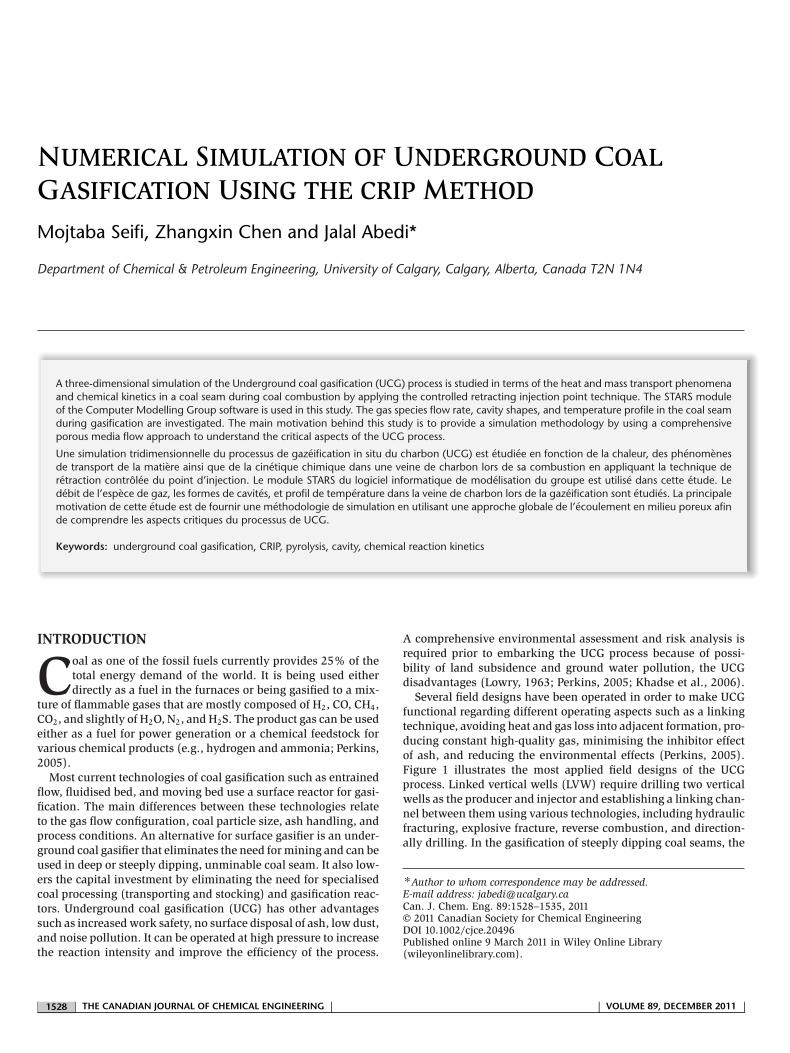
Figure 4. Fluid porosity variation at the end of a 50 days run, x–ycross-section.
Figure 5. Char concentration variation at the end of 50 days run, x–ycross-section.
reduces the contact time for reactions. In this model, the perme-ability variation is described in exponential form as shown inEquation (21):
k = k0.exp
[kmul
(�f−�f0
1−�f0
)](21)
Here, k0 and �f0 are the initial permeability and fluid porosity,respectively, and kmul is a multiplier which is taken to be 4 for alldirections (Computer Modelling Group, 2009).
Solid and gas heat properties such as heat capacity and ther-mal conductivity are considered to be constant as shown inTable 3, except the heat capacities of gas species that are calcu-lated by using Equation (22) with the related constant coefficientssummarised in Table 4 (Reid et al., 1987, Appendix A; ComputerModelling Group, 2009).
Cpi(T) = ˛i + ˇiT + iT2 + iT
3 (22)
Figure 6. Three-dimensional view of created cavities after 50 days ofsimulation.
Figure 7. Three-dimensional view of the elliptic form of the wholecavities after 50 days of simulation.
Table 5. Initial properties of the coal seam required for the modellingpurpose
Porosity, fraction (coal + initial fluid) 0.95Absolute permeability, md 1.0Coal concentration 1.27E+04Water saturation 0.7Temperature, ◦C 60Pressure, MPa 11.5Fluid in porous media CH4Coal density, kg/m3 1200Char density, kg/m3 1740
The initial properties of the coal seam required for the mod-elling purpose are summarised in Table 5. In this model, the equalmolar mixture of steam and oxygen is used as oxidant agents. Theruntime for this model is about 3 days for 50 days of simulation.
RESULTS AND DISCUSSIONAs mentioned earlier, the main goal of this study is to introducea numerical methodology to simulate the UCG process by usingthe STARS module of the CMG software in terms of a porousmedia flow approach. The findings, especially the temperature
Table 4. Values of coefficients for gas species heat capacity correlation
Coefficients O2 CO2 H2 CO CH4
˛, J/gmol/C 28.106 19.795 27.14 30.869 19.251ˇ, J/gmol/C2 −3.68E−06 7.34E−02 9.27E−03 −1.29E−02 5.21E−02�, J/gmol/C3 1.75E−05 5.60E−05 −1.38E−05 2.79E−05 1.20E−05�, J/gmol/C4 −1.07E−08 1.72E−08 7.65E−09 −1.27E−08 −1.13E−08
| 1532 | THE CANADIAN JOURNAL OF CHEMICAL ENGINEERING | | VOLUME 89, DECEMBER 2011 |
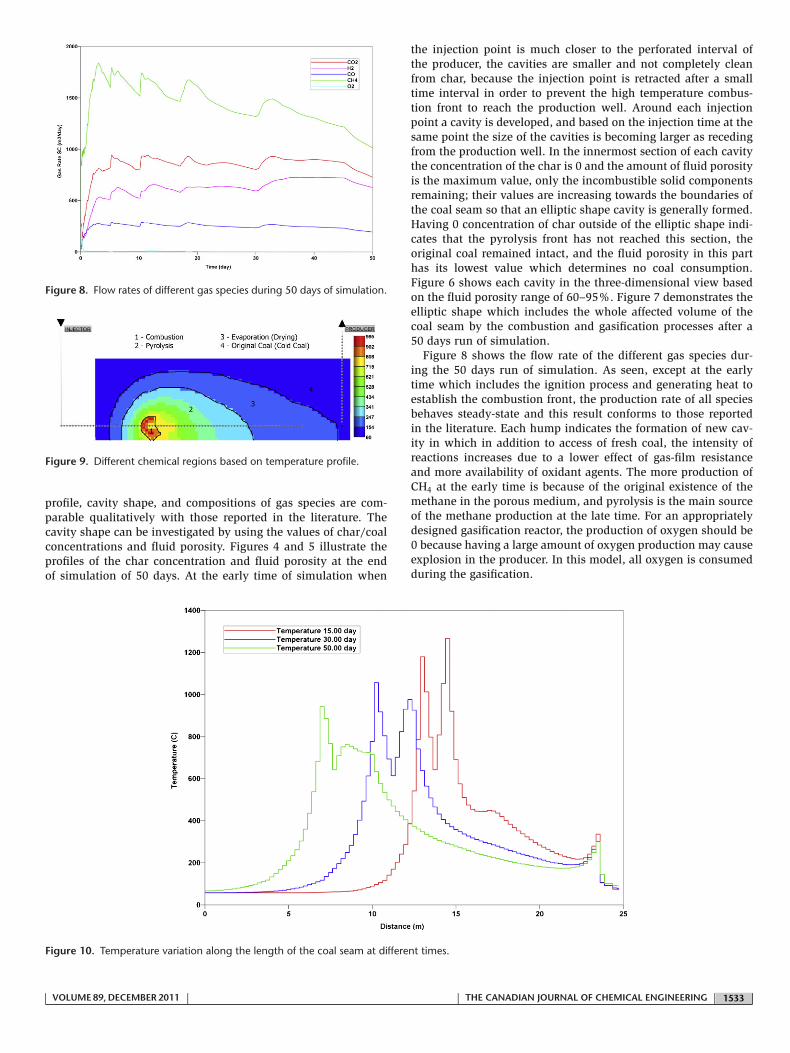
Figure 8. Flow rates of different gas species during 50 days of simulation.
Figure 9. Different chemical regions based on temperature profile.
profile, cavity shape, and compositions of gas species are com-parable qualitatively with those reported in the literature. Thecavity shape can be investigated by using the values of char/coalconcentrations and fluid porosity. Figures 4 and 5 illustrate theprofiles of the char concentration and fluid porosity at the endof simulation of 50 days. At the early time of simulation when
the injection point is much closer to the perforated interval ofthe producer, the cavities are smaller and not completely cleanfrom char, because the injection point is retracted after a smalltime interval in order to prevent the high temperature combus-tion front to reach the production well. Around each injectionpoint a cavity is developed, and based on the injection time at thesame point the size of the cavities is becoming larger as recedingfrom the production well. In the innermost section of each cavitythe concentration of the char is 0 and the amount of fluid porosityis the maximum value, only the incombustible solid componentsremaining; their values are increasing towards the boundaries ofthe coal seam so that an elliptic shape cavity is generally formed.Having 0 concentration of char outside of the elliptic shape indi-cates that the pyrolysis front has not reached this section, theoriginal coal remained intact, and the fluid porosity in this parthas its lowest value which determines no coal consumption.Figure 6 shows each cavity in the three-dimensional view basedon the fluid porosity range of 60–95%. Figure 7 demonstrates theelliptic shape which includes the whole affected volume of thecoal seam by the combustion and gasification processes after a50 days run of simulation.
Figure 8 shows the flow rate of the different gas species dur-ing the 50 days run of simulation. As seen, except at the earlytime which includes the ignition process and generating heat toestablish the combustion front, the production rate of all speciesbehaves steady-state and this result conforms to those reportedin the literature. Each hump indicates the formation of new cav-ity in which in addition to access of fresh coal, the intensity ofreactions increases due to a lower effect of gas-film resistanceand more availability of oxidant agents. The more production ofCH4 at the early time is because of the original existence of themethane in the porous medium, and pyrolysis is the main sourceof the methane production at the late time. For an appropriatelydesigned gasification reactor, the production of oxygen should be0 because having a large amount of oxygen production may causeexplosion in the producer. In this model, all oxygen is consumedduring the gasification.
Figure 10. Temperature variation along the length of the coal seam at different times.
| VOLUME 89, DECEMBER 2011 | | THE CANADIAN JOURNAL OF CHEMICAL ENGINEERING | 1533 |
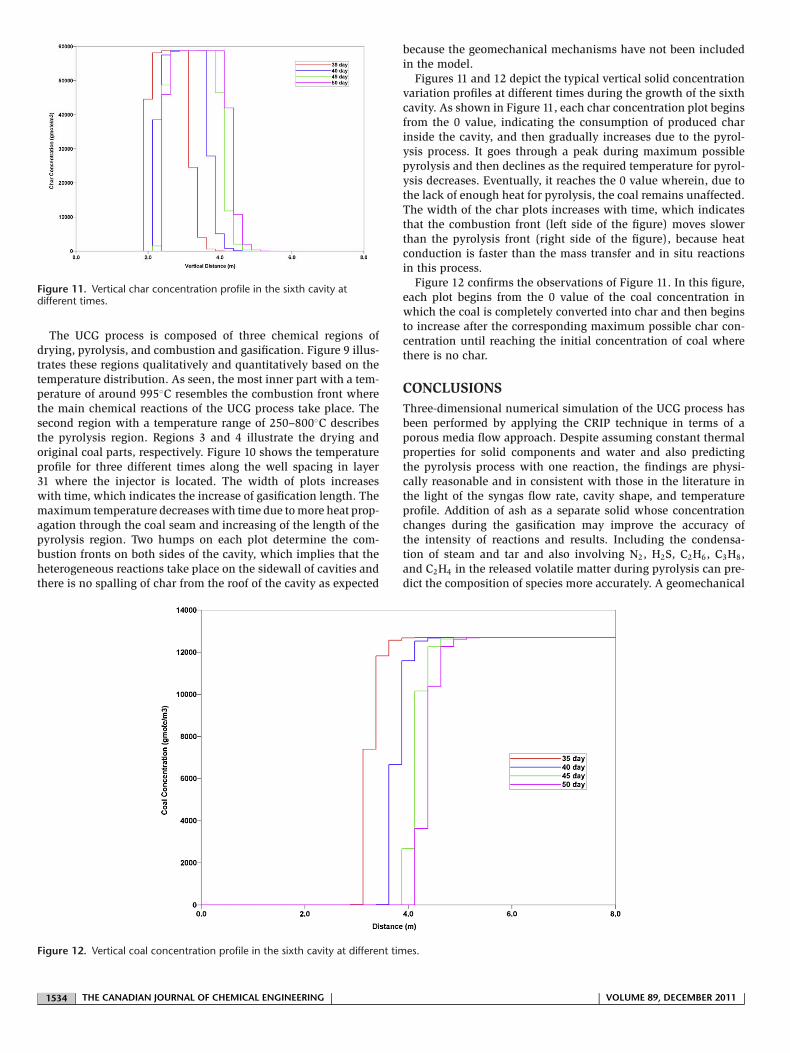
Figure 11. Vertical char concentration profile in the sixth cavity atdifferent times.
The UCG process is composed of three chemical regions ofdrying, pyrolysis, and combustion and gasification. Figure 9 illus-trates these regions qualitatively and quantitatively based on thetemperature distribution. As seen, the most inner part with a tem-perature of around 995◦C resembles the combustion front wherethe main chemical reactions of the UCG process take place. Thesecond region with a temperature range of 250–800◦C describesthe pyrolysis region. Regions 3 and 4 illustrate the drying andoriginal coal parts, respectively. Figure 10 shows the temperatureprofile for three different times along the well spacing in layer31 where the injector is located. The width of plots increaseswith time, which indicates the increase of gasification length. Themaximum temperature decreases with time due to more heat prop-agation through the coal seam and increasing of the length of thepyrolysis region. Two humps on each plot determine the com-bustion fronts on both sides of the cavity, which implies that theheterogeneous reactions take place on the sidewall of cavities andthere is no spalling of char from the roof of the cavity as expected
because the geomechanical mechanisms have not been includedin the model.
Figures 11 and 12 depict the typical vertical solid concentrationvariation profiles at different times during the growth of the sixthcavity. As shown in Figure 11, each char concentration plot beginsfrom the 0 value, indicating the consumption of produced charinside the cavity, and then gradually increases due to the pyrol-ysis process. It goes through a peak during maximum possiblepyrolysis and then declines as the required temperature for pyrol-ysis decreases. Eventually, it reaches the 0 value wherein, due tothe lack of enough heat for pyrolysis, the coal remains unaffected.The width of the char plots increases with time, which indicatesthat the combustion front (left side of the figure) moves slowerthan the pyrolysis front (right side of the figure), because heatconduction is faster than the mass transfer and in situ reactionsin this process.
Figure 12 confirms the observations of Figure 11. In this figure,each plot begins from the 0 value of the coal concentration inwhich the coal is completely converted into char and then beginsto increase after the corresponding maximum possible char con-centration until reaching the initial concentration of coal wherethere is no char.
CONCLUSIONSThree-dimensional numerical simulation of the UCG process hasbeen performed by applying the CRIP technique in terms of aporous media flow approach. Despite assuming constant thermalproperties for solid components and water and also predictingthe pyrolysis process with one reaction, the findings are physi-cally reasonable and in consistent with those in the literature inthe light of the syngas flow rate, cavity shape, and temperatureprofile. Addition of ash as a separate solid whose concentrationchanges during the gasification may improve the accuracy ofthe intensity of reactions and results. Including the condensa-tion of steam and tar and also involving N2, H2S, C2H6, C3H8,and C2H4 in the released volatile matter during pyrolysis can pre-dict the composition of species more accurately. A geomechanical
Figure 12. Vertical coal concentration profile in the sixth cavity at different times.
| 1534 | THE CANADIAN JOURNAL OF CHEMICAL ENGINEERING | | VOLUME 89, DECEMBER 2011 |
module for UCG, including the modelling of spalling of rock andcoal, is being developed by our group. With an appropriate cou-pling of the model developed in this study and the geomechanicalmodule, the UCG process can more accurately be simulated byusing the porous media approach, which will appear in a subse-quent article.
NOMENCLATURECi molar concentration of component i, mole/m3
Cp compressibility, MPa−1
Cr thermal compressibility, ◦C−1
Dji molecular diffusion coefficient of component i in phase j,m2/s
E activation energy, kJ/moleG gravity, m/s2
Hj enthalpy of phase j, kJ/kgHrl enthalpy of reaction l, kJ/kgk absolute permeability, mdk0 initial absolute permeability, mdP fluid phase pressure, MPaPr reference pressure, MPaqjk injection/production flow rate of phase j in layer k of well,
m3/dayrl rate of reaction l, day−1
sli stoichiometry coefficient of component i in the reactantsof reaction l
s′li stoichiometry coefficient of component i in the products
of reaction lsj saturation of phase j, fractionT temperature, ◦CTj transmissibility term of phase j,Tj = (A/�l)
(kj/�j
)Tr reference temperature, ◦CUj internal energy of phase j, kJ/kgV grid block volume, m3
yij mole fraction of component i in phase j, fractionZ depth, m
Greek Symbols� reaction constant, day−1
�0 pre-exponential factor (frequency factor), day−1
�g gas viscosity, cp�f fluid porosity, fraction�v void porosity, fraction�j density of phase j = g, w, solid component, kg/m3
˚j fluid potential, MPaıiw mole fraction of component i in aquifer influx, fraction
ACKNOWLEDGEMENTSThis study was supported by the Department of Chemical andPetroleum Engineering at the University of Calgary, Natural Sci-ences and Engineering Research Council of Canada, AlbertaInnovates, and Foundation CMG. Authors also thank HosseinNourozieh and Mohammad Kariznovi for their constructive com-ments.
REFERENCESBritten, J. A. and C. B. Thorsness, “A Mechanistic Model for
Axisymmetric Cavity Growth During Underground CoalGasification,” Am. Chem. Soc. 33, 126–133 (1988).
Burton, E., J. Friedmann and R. Upadhye, “Best Practices inUnderground Coal Gasification,” Lawrence LivermoreNational Laboratory, Contract No. W-7405-Eng-48, accessedon: www.purdue.edu/discoverypark/energy/pdfs/cctr/BestPracticesinUCG-draft.pdf Livermore, CA, USA.
Campbell, J. H., “Pyrolysis of Sub-Bituminous Coal As it Relatesto In-Situ Gasification (Part 1: Gas Evolution),” University ofCalifornia, Livermore, CA (1976).
Computer Modelling Group. STARS Technical Manual,”Computer Modelling Group LTD., Calgary, Alberta, Canada(2009).
Khadse, A. N., S. M. Mahajani, M. Qayyumi and P. Aghalayam,“Reactor Model for the Underground Coal Gasification (UCG)Channel,” Indian Institute of Technology, Bombay (2006).
Lowry, H., “Chemistry of Coal Utilisation,” John Wiley andSons, Inc., New York (1963).
Ma, S., J. O. Hill and S. Heng, “A Kinetic Analysis of thePyrolysis of Some Australian Coals by Non-IsothermalThermogravimetry,” J. Therm. Anal. 37, 1161–1177 (1991).
Merrick, D., “Mathematical Models of the ThermalDecomposition of Coal (1. The Evolution of Volatile Matter),”Fuel 62, 534 (1983).
Nourozieh, H., M. Kariznovi, Z. Chen and J. Abedi, “SimulationStudy of Underground Coal Gasification in Alberta Reservoirs:Geological Structure and Process Modelling,” Energy Fuels24, 3540–3550 (2010).
Perkins, G., “Mathematical modelling of underground coalgasification,” PhD Dissertation, The University of New SouthWales (2005).
Reid, R. C., J. M. Prausnitz and B. E. Poling, “The Properties ofGases and Liquids,” 4th ed., McGraw-Hill, Inc. New York,USA (1987).
Shirsat, V. A., “Modelling of cavity growth in underground coalgasification,” MSc. Thesis, Texas Tech University (1989).
Thorsness, C. B. and R. B. Rozsa, “In-situ coal gasification:model calculations and laboratory experiments,” SPE Paper,No. 6182, 51st Annual Fall Technical Conference andExhibition, New Orleans, Oct. 3–6 (1976).
Tsang, T. H. T., “Modelling of heat and mass transfer during coalblock gasification,” PhD Dissertation, The University of Texasat Austin (1980).
Vargas, J. M. and D. D. Perimutter, “Interpretation of CoalPyrolysis Kinetics,” Ind. Eng. Chem. 25, 49–54 (1985).
Yang, L. H., “Numerical Study on the Underground CoalGasification for Inclined Seams,” AIChE J. 51(11), 3059–3071(2005).
Manuscript received August 10, 2010; revised manuscriptreceived October 4, 2010; accepted for publication October 7, 2010.
| VOLUME 89, DECEMBER 2011 | | THE CANADIAN JOURNAL OF CHEMICAL ENGINEERING | 1535 |