numerical modeling of wave propagation in functionally graded materials using time-domain spectral...
TRANSCRIPT

Journal of Computational Physics 258 (2014) 381–404
Contents lists available at ScienceDirect
Journal of Computational Physics
www.elsevier.com/locate/jcp
Numerical modeling of wave propagation in functionallygraded materials using time-domain spectral Chebyshevelements
Saeid Hedayatrasa a, Tinh Quoc Bui b,∗, Chuanzeng Zhang b, Chee Wah Lim c
a School of Engineering, University of South Australia, Mawson Lakes, SA 5095, Australiab Department of Civil Engineering, University of Siegen, Paul-Bonatz Str. 9-11, 57076, Siegen, Germanyc Department of Civil and Architectural Engineering, City University of Hong Kong, Tat Chee Avenue, Kowloon, Hong Kong, China
a r t i c l e i n f o a b s t r a c t
Article history:Received 27 July 2012Received in revised form 13 August 2013Accepted 20 October 2013Available online 25 October 2013
Keywords:Functionally graded materialsLamb wave propagationChebyshev polynomialsSpectral finite elementFinite element method
Numerical modeling of the Lamb wave propagation in functionally graded materials (FGMs)by a two-dimensional time-domain spectral finite element method (SpFEM) is presented.The high-order Chebyshev polynomials as approximation functions are used in the presentformulation, which provides the capability to take into account the through thicknessvariation of the material properties. The efficiency and accuracy of the present modelwith one and two layers of 5th order spectral elements in modeling wave propagationin FGM plates are analyzed. Different excitation frequencies in a wide range of 28–350 kHzare investigated, and the dispersion properties obtained by the present model are verifiedby reference results. The through thickness wave structure of two principal Lamb modesare extracted and analyzed by the symmetry and relative amplitude of the verticaland horizontal oscillations. The differences with respect to Lamb modes generated inhomogeneous plates are explained. Zero-crossing and wavelet signal processing–spectrumdecomposition procedures are implemented to obtain phase and group velocities and theirdispersion properties. So it is attested how this approach can be practically employed forsimulation, calibration and optimization of Lamb wave based nondestructive evaluationtechniques for the FGMs. The capability of modeling stress wave propagation through thethickness of an FGM specimen subjected to impact load is also investigated, which showsthat the present method is highly accurate as compared with other existing reference data.
© 2013 Elsevier Inc. All rights reserved.
1. Introduction
Advanced functional composite materials comprised of two or more material phases have been widely and extensivelyused in a broad range of engineering applications. One important disadvantage associated with composites is the interfa-cial problem arisen from the sudden change in material properties at the interface of different phases, which may result inresidual stresses due to unequal thermal expansions or stress intensity, crack initiation, and debonding due to different stiff-nesses. With the development of advanced manufacturing technology, functionally graded materials (FGMs), with graduallyvarying material properties tailored to particular applications, have been emerged resolving the aforementioned interfacialproblems. The FGMs have been increasingly used in many disciplines including thermal barriers, energy absorbers, wear-,and corrosion-resistant coatings. In some works as a simplified approach the FGMs are assumed to be a multilayer plate of
* Corresponding author. Tel.: +49 2717402836; fax: +49 2717404074.E-mail address: [email protected] (T.Q. Bui).
0021-9991/$ – see front matter © 2013 Elsevier Inc. All rights reserved.http://dx.doi.org/10.1016/j.jcp.2013.10.037

382 S. Hedayatrasa et al. / Journal of Computational Physics 258 (2014) 381–404
homogeneous layers as a simplified approach, and in other works the FGMs are modeled as single or multiple inhomoge-neous layers.
Characterizing wave propagation phenomena in FG materials and structures is highly demanding since they have beenused frequently as energy absorbers subjected to transient loading. Furthermore elastic wave propagation has been reliablyimplemented for estimating their mechanical properties and evaluating their integrity. Much attention has thus been ded-icated to studying wave propagation in FGM plates with through thickness material gradation by analytical, numerical andexperimental methods. Analytical models for the wave propagation analysis in FGMs, however, are often restricted to verysimple problems and not feasible for modeling structures with complex geometry, and multiple defects. Numerical solu-tions, e.g., the finite element method (FEM), have to be applied for this purpose as an efficient simulation tool for modelingcomplex problems.
A number of works on the FEM developments for wave propagation problems in FGMs were studied. Liu et al. [1] de-veloped a finite layer element method for modeling Lamb waves in FGMs while Ohyoshi [2] presented a modified linearlyinhomogeneous element. Han et al. [3] proposed a quadratic inhomogeneous layer element to investigate wave propagationin FGM plates, and a new beam element was developed by Chakraborty et al. [4] premised on the first-order shear defor-mation theory. Chakraborty and Gopalakrishnan presented frequency-domain spectral element models for wave propagationin FGM beams based on first-order [5] and high-order [6] shear deformation theories, respectively, assuming constant andlinear through thickness variation of the displacement field. More detailed information can be found, e.g., in [7].
The spectral finite element method (SpFEM) is a special type of the FEM but particularly suitable for wave propagationproblems. The essential advantage of the SpFEM is that it combines the geometrical flexibility of the conventional FEMand the rapid convergence of the spectral methods. In essence, time-domain and frequency-domain formulations are oftentermed as two primary spectral element approaches. The frequency-domain approach relies on the basis of converting FEMto frequency-domain through synthesis of waves using the fast Fourier transform [7]. Although the frequency-domain SpFEMprovides exact mass and stiffness matrices, reliable constitutive equations are required describing the dynamic response ofelements to be used in relevant integrations. But the time-domain SpFEM takes the advantage of high-order orthogonalLagrangian polynomials as interpolating functions. This method was pioneered by Pateras [8] using Chebyshev polynomialsto study computational fluid dynamics. These orthogonal trigonometric polynomials have the same exponential convergenceas Fourier series. Dauksher and Emery [9] investigated the accuracy of Chebyshev polynomials-based SpFEM in modelingacoustic wave propagation and the effect of the modeling parameters. Recently, Zak [10] developed a novel SpFEM based onChebyshev polynomials to study Lamb wave propagation in isotropic homogeneous plates via a linear approximation of thedisplacement field through the thickness.
The main objective of the present work is to accurately model Lamb wave propagation through the thickness of FGMspecimens by using an efficiently two-dimensional (2D) time-domain SpFEM. The proposed SpFEM essentially benefits fromthe convergence rate of Chebyshev polynomials of the first kind, which are capable for accurately describing longitudinaland in-plane transversal oscillations with high-order approximation functions. The capability and the accuracy of the methodare investigated and verified through a number of numerical experiments. The interpolating nodes of the developed SpFEMadequately describe the through thickness variation of the material properties in the appropriate mass and stiffness matrices.An accurate evaluation of the wave structure along the thickness is highly appreciated since the Lamb wave dispersion iscontrolled by the relative size of the thickness and the wave length traveling the plate’s thickness. Extracting the profile ofdifferent wave modes would help us in wave tuning for nondestructive evaluation (NDE) purposes. Furthermore, high-orderinterpolation of the through thickness displacement gradients provides adequate flexibility to model various modes of failurein different orientations and study wave–fault interaction. Although the application of Lamb waves for NDE of thin-walledstructures is attractive, its precision depends on accurate measurement of related parameters. So one major challenge in theimplementation of the FEM is how to extract phase and group velocities and determine their dispersion properties fromtransmitted time-domain signals.
The time-domain SpFEM formulation for wave propagation in FGM structures is presented in Section 2 in which constitu-tive equations for modeling FGMs are described. Numerical results of the proposed approach are presented and investigatedin Section 3. Phase and group velocity dispersion properties and the effect of the gradient parameters of FGMs through thesignal processing techniques are presented. In-plane wave propagation in an FGM specimen subjected to lateral impact loadis also simulated and explored. Finally, some conclusions drawn from the present work are presented in the last section.
2. SpFEM for wave propagation in functionally graded materials
Normal (P), shear-horizontal (SH) and shear-vertical (SV) modes with longitudinal, out of plane transversal and in-planetransversal oscillations, respectively, are three types of elastic waves that propagate in each principal direction in a bulkmaterial. In this manuscript we consider an FGM plate subjected to in-plane excitation in the Z X plane with uniformdistribution along the Y direction as depicted in Fig. 1. So, by the assumption of plain-strain condition, the anti-plane motionin the Y direction u y = v is zero and no SH wave exists. This simplification enables us to reduce the three-dimensional (3D)problem to a two-dimensional (2D) one, and concentrate on the investigation of Lamb wave propagation in FGM plates withpotential applications in NDE techniques.

S. Hedayatrasa et al. / Journal of Computational Physics 258 (2014) 381–404 383
Fig. 1. Geometrical notation of an FGM plate and typical in-plane loading in Z X plane with uniform distribution along Y direction.
Fig. 2. Typical 2D Chebyshev spectral element of 5th order in local (a) and global (b) coordinate system.
2.1. Chebyshev spectral element and its shape functions
Considering the cross-section of an FGM plate in the Z X plane as depicted in Fig. 1, the corresponding 2D displacementfield U can be explained as U = [ux uz]T = [u w]T. Hence, 2D Lagrangian–Chebyshev spectral element formulation is devel-oped for the analysis of the present problem. Rectangular 2D Chebyshev spectral element is sketched in Fig. 2 that is in theorder of Nξ = 5 and Nη = 5 in the two local coordinate directions ξ and η with Nξ + 1 and Nη + 1 nodes, respectively. Theselection of nodal coordinates when using polynomial interpolants is of great importance to avoid Runge’s phenomenon,which refers to the propensity of polynomial interpolants to oscillate biasedly near the boundaries when nodes are equi-spaced in a uniform grid. Following [7], the best local coordinates of the nodes for the Chebyshev spectral elements aredetermined by
ξi = − cos
(π i
nξ
); i = 0,1, . . . ,nξ (1)
ηi = − cos
(π j
nη
); j = 0,1, . . . ,nη (2)
where nξ and nη are assumed orders of polynomials in ξ and η directions, respectively.The corresponding interpolant of the displacement u in the local coordinates (ξ,η) is
u(ξ,η) =nξ∑
i=0
nη∑j=0
uij Ni(ξ)N j(η) (3)
with Ni being the shape function in 1D and for Lagrangian interpolation of order n, it is expressed as
Ni(ξ) = 2
n
n∑p=0
1
si spT p(ξi)T p(ξ);
{si, sp = 1, 0 < i, p < nsi, sp = 2, i, p = 0,n
(4)
in which T p is the pth Chebyshev polynomial of the first kind and pth order. By assuming the same order of interpolationsin the two local directions nξ = nη = n, for a set of m = (n + 1)2 nodes in 2D spectral element the corresponding 2D shapefunction can be formed as
Nk(ξ,η) = Ni(ξ)N j(η) ={
2
n
n∑p=0
1
si spT p(ξi)T p(ξ)
}×
{2
n
n∑q=0
1
si spTq(ηi)Tq(η)
}
k = 1, . . . ,m = (n + 1)2; i, j = 1, . . . ,n + 1 (5)

384 S. Hedayatrasa et al. / Journal of Computational Physics 258 (2014) 381–404
For the strain-displacement field, the element displacement matrix q of the spectral element of order n including m =(n + 1)2 nodes is developed as:
q = [u1 w2 u2 w2 · · · um wm
]T2m (6)
and the displacement field U in the local coordination can be written as
[u(ξ,η) w(ξ,η)
]T =m∑
k=1
Nk(ξ,η)
[ukwk
]or U = N.q (7)
where N denotes the element matrix of the shape functions and takes the form
N(ξ,η) =[
N1(ξ,η) 0 N2(ξ,η) 0 · · · Nm(ξ,η) 00 N1(ξ,η) 0 N2(ξ,η) · · · 0 Nm(ξ,η)
]2×2m
(8)
The B matrix satisfying the kinematic equation ε = Bq for small deformations can be obtained as follows
B =⎡⎢⎣
∂N1∂x 0 ∂N2
∂x 0 · · · ∂Nm∂x 0
0 ∂N1∂z 0 ∂N2
∂z · · · 0 ∂Nm∂z
∂N1∂z
∂N1∂x
∂N2∂z
∂N2∂x · · · ∂Nm
∂z∂Nm∂x
⎤⎥⎦
3×2m
(9)
The relevant mass and stiffness matrices M and K per unit length of element in the depth direction W can be calculatedby the well-known FEM procedure
M =+1∫
−1
+1∫−1
ρ(η)NT(ξ,η)N(ξ,η)det( J )dξ dη (10)
K =+1∫
−1
+1∫−1
BTDB det( J )dξ dη (11)
where ρ , D and J are density, elastic material property matrix and Jacobian matrix, respectively. Since the material proper-ties of the FGM plate change through the thickness, so the density ρ and the material property matrix D are functions ofthe global coordinate Z or its corresponding local coordinate η.
2.2. Effective material properties in FGM plates
The variation of the material properties in FGM plates is usually defined by two well-known laws namely exponentialand power laws. The exponential law is given by [5,7,12–14]
Peff(λ) = P1 exp(−δ(1 − λ)
); with δ = 1
2log
(P1
P2
)(12)
where P1 and P2 represent the material properties of the top (phase-1) and bottom (phase-2) sides of the plate, respectively.The power law, which is implemented in this paper, expresses the volume fraction of the material g as a function of thenormalized vertical coordinate λ, as follows [5]
g(λ) =(
λ + 1
2
)d
; 0 � d � +∞ with λ = z − h
h; −1 � λ � 1 (13)
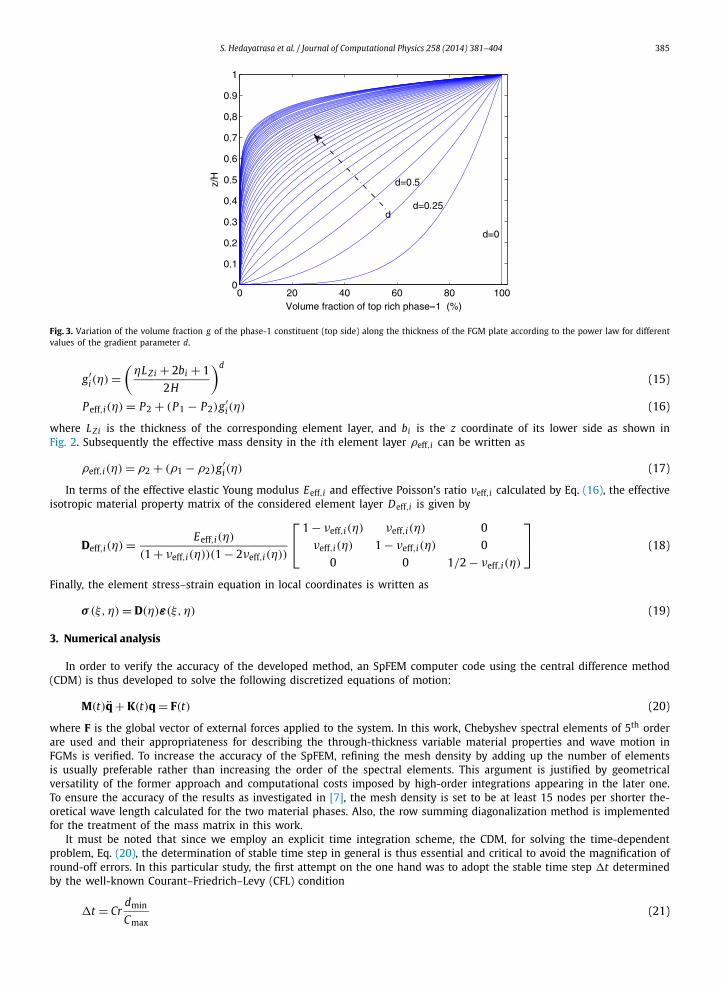
where d is a constant determining the rate of changing in the volume fraction through the thickness and h is the halfthickness of the FGM plate. The variation of the volume fraction g along the thickness of the FGM plate according to thepower law is illustrated in Fig. 3 for different values of d. As shown in this figure, for d = 0 the FGM is a homogeneousplate of phase-1 and for d = 1 the material properties vary linearly.
Then the effective material property Peff, i.e., elastic properties and density, is determined using the following rule ofmixtures
Peff(λ) = P2 + (P1 − P2)g(λ) (14)
Hence, by considering several element layers through the plate thickness and after substituting λ with its equivalent inlocal coordinate η using simple transformation relations, Eqs. (13) and (14) for the ith element layer take the forms:
S. Hedayatrasa et al. / Journal of Computational Physics 258 (2014) 381–404 385
Fig. 3. Variation of the volume fraction g of the phase-1 constituent (top side) along the thickness of the FGM plate according to the power law for differentvalues of the gradient parameter d.
g′i(η) =
(ηL Zi + 2bi + 1
2H
)d
(15)
Peff,i(η) = P2 + (P1 − P2)g′i(η) (16)
where L Z i is the thickness of the corresponding element layer, and bi is the z coordinate of its lower side as shown inFig. 2. Subsequently the effective mass density in the ith element layer ρeff,i can be written as
ρeff,i(η) = ρ2 + (ρ1 − ρ2)g′i(η) (17)
In terms of the effective elastic Young modulus Eeff,i and effective Poisson’s ratio νeff,i calculated by Eq. (16), the effectiveisotropic material property matrix of the considered element layer Deff,i is given by
Deff,i(η) = Eeff,i(η)
(1 + νeff,i(η))(1 − 2νeff,i(η))
⎡⎣ 1 − νeff,i(η) νeff,i(η) 0
νeff,i(η) 1 − νeff,i(η) 0
0 0 1/2 − νeff,i(η)
⎤⎦ (18)
Finally, the element stress–strain equation in local coordinates is written as
σ (ξ,η) = D(η)ε(ξ,η) (19)
3. Numerical analysis
In order to verify the accuracy of the developed method, an SpFEM computer code using the central difference method(CDM) is thus developed to solve the following discretized equations of motion:
M(t)q + K(t)q = F(t) (20)
where F is the global vector of external forces applied to the system. In this work, Chebyshev spectral elements of 5th orderare used and their appropriateness for describing the through-thickness variable material properties and wave motion inFGMs is verified. To increase the accuracy of the SpFEM, refining the mesh density by adding up the number of elementsis usually preferable rather than increasing the order of the spectral elements. This argument is justified by geometricalversatility of the former approach and computational costs imposed by high-order integrations appearing in the later one.To ensure the accuracy of the results as investigated in [7], the mesh density is set to be at least 15 nodes per shorter the-oretical wave length calculated for the two material phases. Also, the row summing diagonalization method is implementedfor the treatment of the mass matrix in this work.
It must be noted that since we employ an explicit time integration scheme, the CDM, for solving the time-dependentproblem, Eq. (20), the determination of stable time step in general is thus essential and critical to avoid the magnification ofround-off errors. In this particular study, the first attempt on the one hand was to adopt the stable time step t determinedby the well-known Courant–Friedrich–Levy (CFL) condition
t = Crdmin (21)
Cmax
386 S. Hedayatrasa et al. / Journal of Computational Physics 258 (2014) 381–404
Fig. 4. One layer of 5th order Chebyshev SpFEM mesh of a 1.5 m long and 10 mm thick FGM plate.
Table 1Material parameters of an FGM plate [14].
Parameter Phase-1 top Phase-2 bottom
Ceramic Chrome (Cr)
E (GPa) 300 248ν 0.27 0.21ρ (kg/m3) 3900 7190
where Cmax is the larger theoretical elastic wave speed of the two material phases and dmin the smallest distance betweentwo neighboring nodes of the SpFEM model. The dimensionless Courant number Cr < 1 is then defined by the conditionof ensuring the stability and smooth gradients. On the other hand, another criterion for the definition of stable time stepbased on Ref. [15] as
t �tcr = 2
fmax(22)
was also considered and applied in such a way. In Eq. (22), tcr denotes the critical stable time step, and fmax is themaximum natural frequency of the finite element model which is defined in the following. Prescribing the time harmonicdisplacement field q(t) = q0eiωt with circular frequency ω = 2π f and substituting it into Eq. (20), the equations of freevibration are obtained as:(−Mω2 + K
)q0eiωt = 0 (23)
The maximum natural frequency of the SpFEM model fmax and so tcr are calculated by the eigenvalue analysis of Eq. (23)for nontrivial solutions. The determination of the stable time step was then made by comparison of the time steps obtainedby Eq. (21) and that derived from Eq. (22). In view of that, the implementation of Eq. (21) demands the determination ofthe Courant number Cr in order to ensure stability case by case, whereas the condition delivered in Eq. (22) safely satisfiesstability in a definitive way. Based on our numerical experiments and the advantages addressed in [15], Eq. (22) was finallydecided to use as the criterion for the determination of stable time step. All results were examined and proved regardingtheir stability along with smooth gradients by setting t = 0.5tcr .
In the following subsections the numerical results of the developed SpFEM for simulation of wave propagation in FGMsare presented. The reliability of the obtained results is evaluated by comparing with existing solutions. The Lamb wave prop-agation characteristics, phase and group velocities, and impact induced wave propagation, etc. throughout FGM specimensare investigated.
3.1. Phase velocity dispersion in FGM plates
A 10 mm thick Cr–ceramic FGM plate as depicted in Fig. 4 with material properties given in Table 1 [14] is modeledusing the developed SpFEM. The obtained results are then used for phase velocity dispersion analysis via zero-crossingtechnique [16,17] and verified with relevant solutions [14]. The material gradient parameter used in this investigation isassumed to be d = 1, which implies that the material properties vary linearly along the thickness. The FGM is discretizedby one layer of the spectral elements as shown in Fig. 4, which should capably approximate the linear material gradient,as verified later on in the next section. Due to the nonsymmetrical structure in the nature of FGMs, a nonsymmetrical loadfor opportune excitation of Lamb waves by applying an evenly distributed vertical load on nodes as shown in the picture isconsidered. Natural free boundary condition is considered for all other peripheral nodes. The length of the plate is L = 1.5 mto let Lamb waves traveling enough space and making wave packets of different modes more recognizable in the absenceof reflected waves from the second edge.
A 3-cycle sinusoidal tone burst windowed by Hanning function is used as the excitation signal in this study, whichreduces the signal dispersion in frequency-domain and leads to low energy in frequencies other than the central frequency(e.g., see Fig. 5). The Hanning function for ns sampling points of the signal is defined by
h(n) = 1[
1 − cos
(2π
n)]
(n = 1,2, . . . ,ns) (24)
2 ns − 1
S. Hedayatrasa et al. / Journal of Computational Physics 258 (2014) 381–404 387
Fig. 5. An optional 3-cycle 300 kHz sinusoid modified by Hanning-window in time-domain (a), frequency-domain (b).
Though increasing the number of cycles of the excitation signal narrows its bandwidth and thus power concentrationaround the central frequency, it oppositely increases the accumulation and overlap of the excited wave packets. This causesdifficulties in signal processing, especially for high frequencies in which the gap between the speeds of wave modes isnarrow.
If a wave mode propagates with a single frequency (phase), the wave speed is called phase velocity. Although a modulatedexcitation signal boosts a specific phase, however it is impossible in practice to excite a single frequency (monochromatic)wave mode. Any wave mode in a frequency range is thus excited, which forms a wave packet and transfers the energy fromone point to another. The velocity of the amplitude envelope of this wave packet is called group velocity. The phase velocityC P and group velocity C g of a harmonic wave in terms of wave number k and circular frequency ω are determined by:
C P = ω
κand C g = dω
dκ(25)
and after substitution, we arrive at
C g = C p + kdC p
dκ(26)
where the term dC Pdκ essentially determines the dispersion properties of the wave. When dC P
dκ < 0, then the group velocity isless than the phase velocity (normal dispersion) and vice versa (anomalous dispersion).
In this section, phase velocity dispersion analysis of Lamb waves is performed via zero-crossing technique [16,17]. Forthat purpose, the transmitted signal in two different points along the plate is collected. The time delay in the arrival of anyhalf cycle, defined by two subsequent zero amplitude cross points, and its frequency are then calculated. Indeed half cyclesof the signal are representatives of different wave phases propagating at a single frequency. A complete explanation of thismethod and parameters affecting its accuracy can be found in [16,17]. Hence by processing the time history of the signalof a wave packet containing a number of half cycles, the corresponding frequencies and traveling velocities are estimated.In this way the localized phase velocity dispersion of the wave around the central frequency is calculated reliably. Theprocedure is then repeated for a set of excitation frequencies to obtain other segments of the dispersion curves in a widerange of frequencies. In this section the SpFEM is applied to 7 different excitation frequencies involving 28, 50, 90, 165, 230,300 and 350 kHz, respectively. Taking into account the reference analytical results of [14] for phase velocity dispersion ofthe first wave mode (mode-1) in the FGM plate with d = 1, the frequencies 28, 50, 90, 165 and 230 kHz are selected sothat they correspond to the dimensionless wave numbers 1.0, 1.5, 2.0, 3.0 and 4.0, respectively. High frequency cases 300and 350 kHz locate in dispersion less zone of this mode closed to the dimensionless wave numbers 5 and 6 (Fig. 16). Theoptional loading amplitude of 106 N per m of depth is also considered, making oscillations of the order 0–15 μm.
3.1.1. Excitation frequency of 50 kHzIn this subsection the results obtained for 50 kHz excitation frequency for both distributed vertical and horizontal load
cases are investigated to show the differences of the related dynamic responses. Contours of oscillations across the longitu-dinal section of the plate after 175 μs are illustrated in Figs. 6 and 7, respectively, for the horizontal and vertical excitations.For wave dispersion analysis, the topmost left nodes of two subsequent elements in the middle of the plate’s length (far

388 S. Hedayatrasa et al. / Journal of Computational Physics 258 (2014) 381–404
Fig. 6. (a) Longitudinal and (b) transversal oscillations and propagation of Lamb wave modes along the longitudinal direction of the 10 mm thick FGM plateafter 175 μs, subjected to 50 kHz horizontal excitation tone burst; the first (left-side) and the second (right-side) wave packets for low velocity first mode(mode-1) and high velocity second mode (mode-2), respectively.
Fig. 7. (a) Longitudinal and (b) transversal oscillations and propagation of Lamb wave modes along the longitudinal direction of the 10 mm thick FGM plateafter 175 μs, subjected to 50 kHz vertical excitation tone burst; the first (left-side) and the second (right-side) wave packets for low velocity first mode(mode-1) and high velocity second mode (mode-2), respectively.
Fig. 8. Schematic sketch of selected measuring points of elements at the middle of the plate’s length for extraction of transmitted waves and performingdispersion analysis.
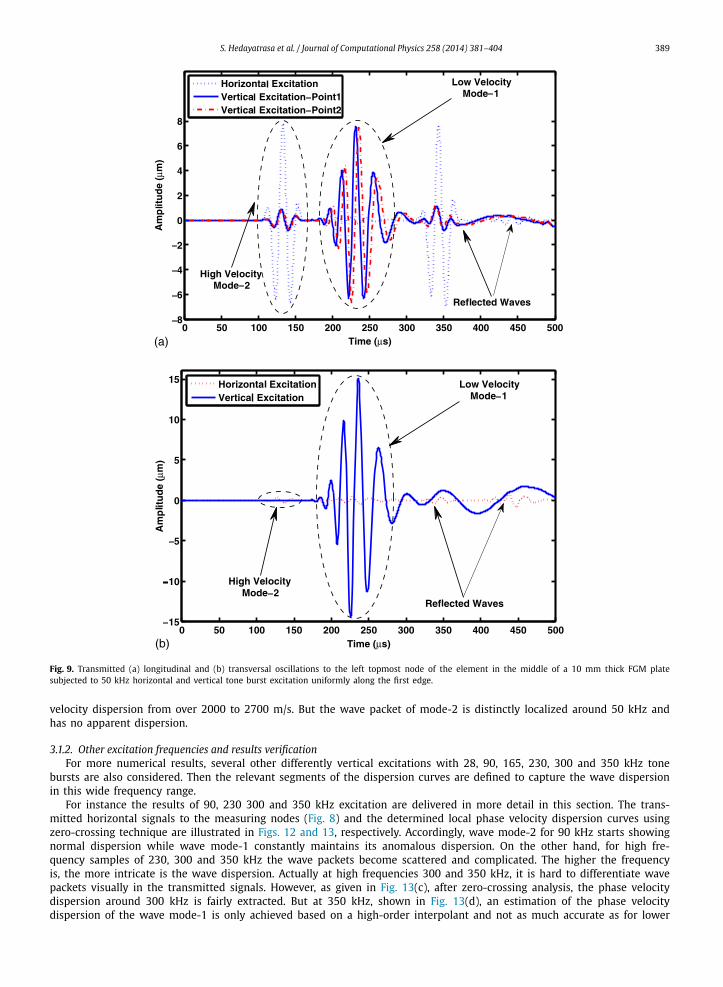
from the second edge and thus isolated from reflected waves) are selected as shown in Fig. 8. Then transmitted longitudinaland in-plane transversal oscillations, u and w , are extracted at these measuring points as illustrated in Fig. 9.
From the results in Figs. 6, 7 and 9, it is easily understood that the horizontal excitation strengthens the wave mode-2and the vertical excitation does the same for mode-1. This phenomenon is justified by obvious dominant longitudinal en-ergy of mode-2 and dominant transversal energy of mode-1. Elastic wave propagation in modes 2 and 1 is governed byhigh longitudinal normal stiffness and low transversal shear stiffness respectively, explaining their different speeds of prop-agation. However, due to the nonsymmetrical structure of the FGM plate either uniform vertical and horizontal excitationsof the first edge generate both principal modes simultaneously. But for a homogeneous plate mode-1 vanishes by a uniformhorizontal excitation and similarly mode-2 vanishes by a uniform vertical excitation.
For dispersion analysis, the transmitted longitudinal (horizontal) signal caused by a uniform vertical excitation of the firstedge is used in which both wave modes are better recognizable due to their relative amplitude (see Fig. 9(a)). This advantageis especially observed when examining the results in high frequencies with integrated wave packets. An accurate distinctionof wave packets is a key point in phase velocity calculation using zero-crossing method. The importance is to select thecorresponding cycles of transmitted signals to two measuring points while waves’ evolution. The propagation, evolution,reflection and interaction of longitudinal Lamb modes and relevant wave packets through the FGM plate at different timesfrom the beginning of vertical excitation are displayed in Fig. 10.
Following the aforementioned procedure, the longitudinal signals transmitted to points #1 and #2 shown in Fig. 9(a)are analyzed for determining the phase velocity dispersion in the vicinity of 50 kHz central frequency. The obtained localdispersion curves are then illustrated in Fig. 11 for both modes 1 and 2. With regard to these results it is evident that wavepacket pertaining to mode-1 is highly dispersive. It includes a relatively wide frequency range of 35–80 kHz with steep
S. Hedayatrasa et al. / Journal of Computational Physics 258 (2014) 381–404 389
Fig. 9. Transmitted (a) longitudinal and (b) transversal oscillations to the left topmost node of the element in the middle of a 10 mm thick FGM platesubjected to 50 kHz horizontal and vertical tone burst excitation uniformly along the first edge.
velocity dispersion from over 2000 to 2700 m/s. But the wave packet of mode-2 is distinctly localized around 50 kHz andhas no apparent dispersion.
3.1.2. Other excitation frequencies and results verificationFor more numerical results, several other differently vertical excitations with 28, 90, 165, 230, 300 and 350 kHz tone
bursts are also considered. Then the relevant segments of the dispersion curves are defined to capture the wave dispersionin this wide frequency range.
For instance the results of 90, 230 300 and 350 kHz excitation are delivered in more detail in this section. The trans-mitted horizontal signals to the measuring nodes (Fig. 8) and the determined local phase velocity dispersion curves usingzero-crossing technique are illustrated in Figs. 12 and 13, respectively. Accordingly, wave mode-2 for 90 kHz starts showingnormal dispersion while wave mode-1 constantly maintains its anomalous dispersion. On the other hand, for high fre-quency samples of 230, 300 and 350 kHz the wave packets become scattered and complicated. The higher the frequencyis, the more intricate is the wave dispersion. Actually at high frequencies 300 and 350 kHz, it is hard to differentiate wavepackets visually in the transmitted signals. However, as given in Fig. 13(c), after zero-crossing analysis, the phase velocitydispersion around 300 kHz is fairly extracted. But at 350 kHz, shown in Fig. 13(d), an estimation of the phase velocitydispersion of the wave mode-1 is only achieved based on a high-order interpolant and not as much accurate as for lower

390 S. Hedayatrasa et al. / Journal of Computational Physics 258 (2014) 381–404
Fig. 10. Different snapshots of longitudinal oscillations and Lamb wave modes generation, evolution and reflection along the longitudinal cross section of the10 mm thick and 1.5 m long FGM plate subjected to 50 kHz vertical excitation tone burst, after different time spans from the beginning of the excitation.
Fig. 11. Phase velocity dispersion curves segments for mode-1 (a) and mode-2 (b) Lamb wave modes around 50 kHz central frequency obtained fromzero-crossing signal analysis for FGM plate of 10 mm thickness.
frequency samples. A reliable extraction of wave mode-2 dispersion curve was impossible at this frequency. This is due tomultiple model shapes inherent of the relevant oscillations.
In fact, at high frequencies the wavelength of the traveling tone burst becomes smaller and its relative size to the plate’sthickness reduces. Wave propagation is thus less dominated by free boundaries resulting in a more scattered guided wave.In other words, the higher wave modes appear and interact with principal wave modes 1 and 2. Also, the gap betweenthe speeds of different wave modes in higher frequencies is narrower. All these conditions may show us the difficulty inanalyzing the oscillating signals in high frequencies. Moreover, extraction and analysis of higher wave modes appearing in

S. Hedayatrasa et al. / Journal of Computational Physics 258 (2014) 381–404 391
Fig. 12. Transmitted longitudinal oscillations to the corresponding topmost nodes of two subsequent middle elements of a 10 mm thick FGM plate subjectedto (a) 90, (b) 230, (c) 300 and (d) 350 kHz tone burst excitations.
high frequencies would be hard or impractical using the FEM method. That is because the propagating speeds of high-orderwave modes are close together and considering an adequately long plate model is necessary to let them become separated.
An additional 5 mm thin FGM plate subjected to 350 kHz excitation is thus modeled to first study the effects of therelative wavelength and wave guide’s thickness on wave propagation in FGMs, and to show the capability of the developedSpFEM in analyzing high frequency excitations. The results obtained for the transmitted longitudinal oscillations are pre-sented in Fig. 14. By comparing the oscillations pertaining to 5 and 10 mm thick plates in this figure, it is apparent thatfor the same excitation frequency, the wave modes are distinctively formed and propagating in thinner specimen. For thisreason, the wave dispersion is usually presented as a function of the dimensionless wave number k.H = H/λ (rather thanfrequency f ), which actually is the relative size of wave length λ to the thickness H . The same zero-crossing analysis isthen performed for this 5 mm thick plate around 350 kHz. The relevant results delivered in Fig. 15 prove the competencyof the proposed SpFEM for wave dispersion analysis at these high frequencies. In contrast to the poor results of Fig. 13(d),the dispersion curves are now clearly extracted at 350 kHz, of course for a thinner plate leading to a lower value of thedimensionless wave number kH .
To summarize the results of this section, similar snapshots of longitudinal oscillations relating to all considered frequencycases of 28, 50, 90, 165, 230, 300 and 350 kHz after 190 μs are put together in Fig. 16. The specific sampling time 190 μs ischosen to extract contours of wave oscillations at which both principal modes appear clearly along the plate model prior tointeraction of high velocity wave mode-2 with the second edge.
The presented snapshots of oscillations visualize the generation and propagation of Lamb wave modes and the throughthickness pattern of the related displacement fields at various frequency levels. Fig. 16 clearly represents the larger differ-

392 S. Hedayatrasa et al. / Journal of Computational Physics 258 (2014) 381–404
Fig. 13. Phase velocity dispersion curves of Lamb wave modes 1 and 2 around (a) 90, (b) 230, (c) 300 and (d) 350 kHz central frequencies obtained fromzero-crossing signal analysis for FGM plate of 10 mm thickness.
Fig. 14. Transmitted longitudinal oscillations to corresponding topmost nodes of middle elements of 5 and 10 mm thick FGM plates subjected to 350 kHzvertical tone burst excitation.
ence in the propagation speeds of the principal Lamb modes 1, 2 and poorer wave scattering in lower frequency cases. Atlow frequencies cases the wave packets are more distinctive in the absence of minor oscillations and also more far away.
Subsequently, the calculated phase velocities of Lamb wave modes 1 and 2 for all considered excitation frequency casesare integrated together in Fig. 17 to present the overall dispersion curve versus the dimensionless wave number kH . As

S. Hedayatrasa et al. / Journal of Computational Physics 258 (2014) 381–404 393
Fig. 15. Phase velocity dispersion curve segments of Lamb wave (a) mode-1 and (b) mode-2, around 350 kHz central frequencies obtained from zero-crossingsignal analysis for the FGM plate of 5 mm thickness.
Fig. 16. Snapshots of longitudinal oscillations and Lamb wave modes propagation along the longitudinal direction of the 10 mm thick and 1.5 m long FGMplate subjected to different vertical excitation frequencies, after the specified time 190 μs.
shown in this figure the results satisfactorily describe the anomalous dispersion of wave mode-1 and normal dispersion ofwave mode-2. They have negligible deviation from the reference analytical results of Ref. [14] and are in good agreementin the selected frequency range. For sure by modeling longer plate and allowing higher modes to separate and appear, thesame signal processing method is capable to extract their propagation speed and dispersion properties. Premised on therelevant reference dispersion curves given in [14], the secondary Lamb wave mode starts to appear from just over kH = 2for the considered FGM plate. However the frequency range including the area before the cut-off frequency of the secondarywave mode possesses specific features and is reliably used in particular nondestructive evaluation purposes.
3.1.3. Effects of the gradient parameter d, element layers and mesh resolutionThe aim of this subsection is to evaluate the effect of the modeling parameters on the accuracy of results of the present
SpFEM for the analysis of wave propagation in FGM plates. The investigation presented in the preceding section uses onelayer of elements in modeling a linearly graded FGM plate with d = 1. Now, it is interesting to see how the material gradient

394 S. Hedayatrasa et al. / Journal of Computational Physics 258 (2014) 381–404
Fig. 17. Phase velocity C p dispersion curves of first and second Lamb wave modes from reference results of [14] and numerical results of the developedSpFEM.
Fig. 18. Two layers of 5th order Chebyshev SpFEM for a 1.5 m long and 10 mm thick FGM plate.
factor d affects the wave propagation in FGMs. Moreover, high values of d cause larger material gradient along the thicknessof the FGM plate as depicted in Fig. 3. Hence it is of particular interest to know whether just a single layer SpFEM model isable to reliably characterize the wave propagation in such FGM plates. Another important aspect of this study is to explorethe sensitivity of the results with respect to the number of the element layers in the transversal direction with a materialgradient, and also to the longitudinal mesh resolution. To serve this purpose, Cr–ceramic FGM plate of the previous sectionis modeled for 3 cases: (i) one element layer (Fig. 4), (ii) two element layers (Fig. 18) both with the default longitudinalmesh resolutions of 15 nodes per shortest wave length, and (iii) one element layer with finer longitudinal mesh resolutionof 35 nodes per shortest wave length. In addition, different values 0, 0.25, 0.5, 1, 2, 4, 6, 8 and 10 are considered for thematerial gradient factor d. Optional excitation frequencies 50, 90 and 165 kHz, generating both principal wave modes 1 and2 properly, are used in this part.
The results of the phase velocity analysis for all these cases are synthesized for each excitation frequency and thenpresented in Fig. 19. Accordingly, the phase velocity of the wave modes is diminished gradually by raising the factor d.That is due to lower overall volume fraction of the reinforcing ceramic phase for larger d values. Furthermore, neither usingtwo element layers nor increasing longitudinal mesh resolution shows significant effect on the extracted phase velocities,at different excitation frequencies and material gradient cases. The relative deviations of the phase velocities in two layermodel compared to single layer one are in the ranges 0.18–0.88% and 0.00–0.22% for wave modes 1 and 2, respectively.The reference results for the material gradient factor d equal to 1 and 10 [14] are also presented to confirm the accuracyof the method. Compared to the reference data, the two layer model does not necessarily improve the results in all cases.The relative deviation of the results from the reference results is in the range 0.4–5.0% for one layer model and in therange 0.3–5.9% for two layers model. All in all from the results it can be concluded that one layer of the proposed spectralelements of 5th order with a default longitudinal mesh resolution of 15 nodes per shortest wavelength is sufficient toaccurately describe the dispersion properties of Lamb wave propagation in FGMs even for high material gradients.

S. Hedayatrasa et al. / Journal of Computational Physics 258 (2014) 381–404 395
Fig. 19. Variation of the phase velocity versus the gradient parameter d for FGM plate subjected to (a) 50, (b) 90 and (c) 165 kHz vertical tone bursts,respectively obtained from models with one and two element layers having 15 nodes per wave length, and an additional one layer model with a finelongitudinal mesh consisting of 35 nodes per wave length.

396 S. Hedayatrasa et al. / Journal of Computational Physics 258 (2014) 381–404
Fig. 20. Transmitted longitudinal oscillation at the topmost left node of the top middle element of the 10 mm thick FGM plate with the gradient parameterd = 4 subjected to 165 kHz vertical tone burst excitation.
3.2. Lamb wave structure in FGM plates
Using the SpFEM model with two element layers for the FGM plate, adequate interpolating nodes are provided to performLamb wave structure analysis. The Lamb wave structure is defined by the profile of the particle’s oscillations through thethickness for Lamb wave modes 1 and 2. In this analysis, the results of the FGM model in the previous section with d = 4are chosen for this analysis. Selective time steps corresponding to the passage of middle cycle of wave mode-1 and mode-2from the topmost left node of the top middle element, as shown in Fig. 20, are used for extracting oscillations. All 11 nodeslocated on the vertical cross section of the plate at this reference node are taken into account. In detail, the 11 nodes consistof 5 nodes for the top layer element, 5 nodes for the bottom layer element and 1 common node on the mid-plane of theplate.
The following results indicate how the normalized wave oscillations and their relative amplitudes vary with the non-dimensional through thickness position of nodes during the middle cycle of the two principal Lamb wave modes. FromFig. 21(a) and (b) it is shown that in the wave mode-1 the longitudinal oscillations tend to make an almost symmetricalprofile with respect to the mid-plane of the plate, while in contrary the transversal oscillations are almost asymmetric(inversely symmetric). However, due to the nonsymmetric structure of the FGM plate and higher stiffness of the ceramicphase, the oscillations on the ceramic-rich top side are generally lower than that on the metal-rich bottom one. In view ofthe reference results of [11], it is fundamentally understood that the mode-1 is equivalent to the asymmetric Lamb modeforming in homogeneous plates, losing its perfect symmetry. Likewise the structure of mode-2, shown in Fig. 21(c) and (d),resembles approximately the symmetric Lamb mode of homogeneous plates with symmetric transversal and nonsymmetriclongitudinal motion. Consequently, the wave structure in FGM plates is partially symmetric/asymmetric (inversely symmet-ric) versus a plane away from the geometrical plane of symmetry. Unlike the Lamb wave structure of Lamb wave modes ina homogeneous plate which is fully symmetric/asymmetric versus the geometrical mid-plane of the plate. The deviation ofthis secondary plane depends on the material gradient function and as shown in Fig. 21 not necessarily the same for bothoscillations and both modes.
Fig. 22 presents the relative amplitude of the longitudinal u and transversal w displacements for wave modes 1 and 2.Accordingly, the relative amplitudes u/|w| of mode-1 and w/|u| of mode-2 show a slightly inverse symmetry with respectto a deviated axis away from the geometrical axis of symmetry. In wave mode-1, the relation −1 � u/|w| � 1 is observed,expressing the dominant vertical oscillation of particles in this mode mainly in the interior planes along the plate’s thick-ness. On the contrary, the horizontal displacement u is prevailing since −1 � w/|u| � 1 in wave mode-2, and this ratio ishigher near the surface as well. Obviously, this behavior is valid for the central part of the wave packets which are goodrepresentatives of pure Lamb wave modes. When analyzing time steps far from the middle cycle of wave packets, ratiosexceeding 1.0 appear like the alternate ones displayed in Fig. 22.
3.3. Group velocity dispersion in FGM plates
We next analyze the Lamb wave propagation in an Al–Zr FGM plate using the proposed SpFEM. Group velocities arecalculated numerically through wavelet spectrum decomposition and evaluated compared with reference results [20]. Char-acterizing group velocity dispersion as another quantity of Lamb waves is worthwhile due to its potential applications in the

S. Hedayatrasa et al. / Journal of Computational Physics 258 (2014) 381–404 397
Fig. 21. Normalized amplitudes of the oscillations versus the dimensionless thickness for longitudinal (a) and transversal (b) for selective time steps duringthe middle cycle of mode-1 Lamb wave and (c), (d) mode-2 for the 10 mm thick FGM plate with the gradient parameter d = 4 subjected to 165 kHz verticaltone burst excitation.
Fig. 22. The amplitude ratios of longitudinal and transversal oscillations u and w versus the dimensionless thickness for selective time steps during themiddle cycle of Lamb wave (a) mode-1 and (b) mode-2.
398 S. Hedayatrasa et al. / Journal of Computational Physics 258 (2014) 381–404
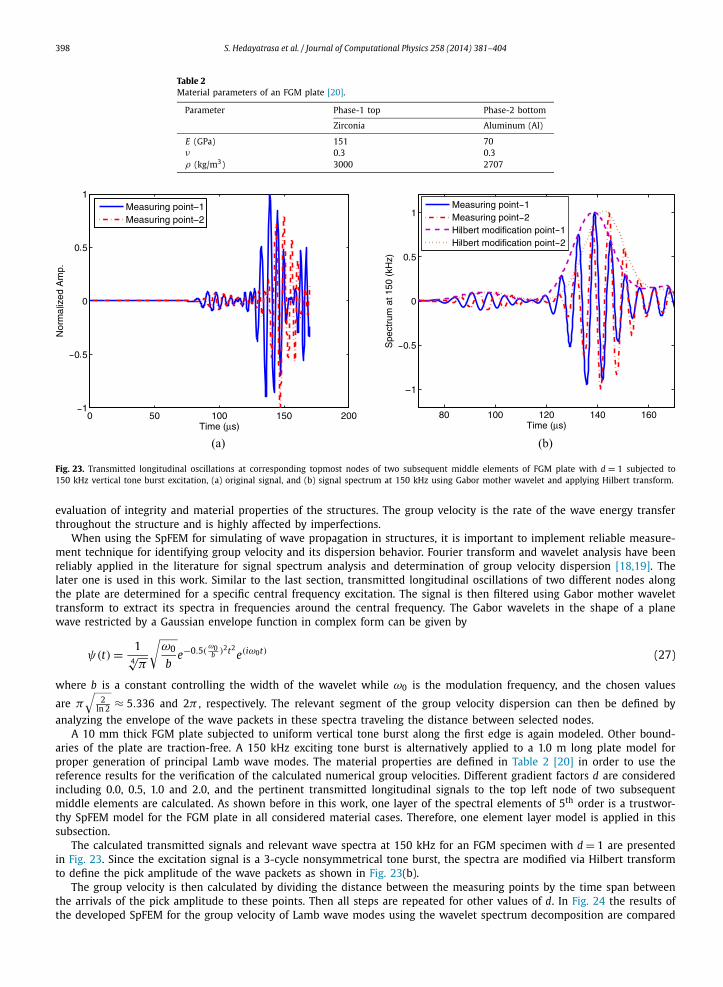
Table 2Material parameters of an FGM plate [20].
Parameter Phase-1 top Phase-2 bottom
Zirconia Aluminum (Al)
E (GPa) 151 70ν 0.3 0.3ρ (kg/m3) 3000 2707
Fig. 23. Transmitted longitudinal oscillations at corresponding topmost nodes of two subsequent middle elements of FGM plate with d = 1 subjected to150 kHz vertical tone burst excitation, (a) original signal, and (b) signal spectrum at 150 kHz using Gabor mother wavelet and applying Hilbert transform.
evaluation of integrity and material properties of the structures. The group velocity is the rate of the wave energy transferthroughout the structure and is highly affected by imperfections.
When using the SpFEM for simulating of wave propagation in structures, it is important to implement reliable measure-ment technique for identifying group velocity and its dispersion behavior. Fourier transform and wavelet analysis have beenreliably applied in the literature for signal spectrum analysis and determination of group velocity dispersion [18,19]. Thelater one is used in this work. Similar to the last section, transmitted longitudinal oscillations of two different nodes alongthe plate are determined for a specific central frequency excitation. The signal is then filtered using Gabor mother wavelettransform to extract its spectra in frequencies around the central frequency. The Gabor wavelets in the shape of a planewave restricted by a Gaussian envelope function in complex form can be given by
ψ(t) = 14√
π
√ω0
be−0.5(
ω0b )2t2
e(iω0t) (27)
where b is a constant controlling the width of the wavelet while ω0 is the modulation frequency, and the chosen values
are π√
2ln 2 ≈ 5.336 and 2π , respectively. The relevant segment of the group velocity dispersion can then be defined by
analyzing the envelope of the wave packets in these spectra traveling the distance between selected nodes.A 10 mm thick FGM plate subjected to uniform vertical tone burst along the first edge is again modeled. Other bound-
aries of the plate are traction-free. A 150 kHz exciting tone burst is alternatively applied to a 1.0 m long plate model forproper generation of principal Lamb wave modes. The material properties are defined in Table 2 [20] in order to use thereference results for the verification of the calculated numerical group velocities. Different gradient factors d are consideredincluding 0.0, 0.5, 1.0 and 2.0, and the pertinent transmitted longitudinal signals to the top left node of two subsequentmiddle elements are calculated. As shown before in this work, one layer of the spectral elements of 5th order is a trustwor-thy SpFEM model for the FGM plate in all considered material cases. Therefore, one element layer model is applied in thissubsection.
The calculated transmitted signals and relevant wave spectra at 150 kHz for an FGM specimen with d = 1 are presentedin Fig. 23. Since the excitation signal is a 3-cycle nonsymmetrical tone burst, the spectra are modified via Hilbert transformto define the pick amplitude of the wave packets as shown in Fig. 23(b).
The group velocity is then calculated by dividing the distance between the measuring points by the time span betweenthe arrivals of the pick amplitude to these points. Then all steps are repeated for other values of d. In Fig. 24 the results ofthe developed SpFEM for the group velocity of Lamb wave modes using the wavelet spectrum decomposition are compared

S. Hedayatrasa et al. / Journal of Computational Physics 258 (2014) 381–404 399
Fig. 24. Dimensionless group velocity calculated using wavelet spectrum decomposition for various values of the gradient parameter d for wave modes 1and 2 at 150 kHz excitation and comparison with reference results [20].
with the reference solutions [20]. The dimensionless velocity noted in this figure is actually the ratio of the Lamb wavegroup velocity C g in FGMs to the theoretical wave velocity in metallic material Cm , defined by
Cm =√
Em
ρm= 5085 (m/s) (28)
According to Fig. 24, the calculated group velocities are in good agreement with those given in [20], especially formode-1. However, the maximum deviation of the numerical results for mode-2 from the analytical results is around 3.5%.More importantly, insignificant effect on the accuracy of the results when increasing the gradient factor d is observed here.The reduced accuracy of the results for Lamb wave mode-2 is presumably caused by the higher velocity of the wave mode-2.Indeed, the shorter wavelength of this wave mode using the same interpolating nodes as for the wave mode-1 results in alower accuracy in simulating the related oscillations.
The frequency spectrum of the transmitted signal of Fig. 23(a) pertaining to the first measuring point, using Gabormother wavelet. Hilbert transform and the time span concerning the passage of the wave mode-2 is displayed in Figs. 25(a)and 25(b), respectively. The frequency range is 0–500 kHz and the total sampling time is 170 μs. From the computedfrequency spectrum the wide dispersion of the low velocity wave mode-1 and the narrow dispersion of the high velocitywave mode-2 are apparent.
3.4. Impact stress wave propagation throughout an FGM specimen
The above sections are dedicated to the simulation of the Lamb wave propagation in long FGM plates and relateddispersion properties, with potential applications in NDE techniques. However, FGM structures have been widely used asenergy absorbers to impact loads. Thus it is of great interest to verify the accuracy and efficiency of the present SpFEM forthe analysis of impact stress wave propagation through the FGM structures. Obviously, the present method can be appliedalso for the simulation of the C-scan pulse echo method for the through thickness damage detection.
To serve that purpose, an FGM specimen similar to the one used in the numerical investigation of [21] is consideredhere. This reference provides sufficient numerical results to verify the accuracy of the developed SpFEM. Analysis of thestress wave propagation in FGM specimen was carried out in [21] numerically by means of the composite wave-propagationalgorithm; and two models of FGMs were considered: (i) a multilayered metal–ceramic composite with averaged propertieswithin each layer and (ii) randomly embedded ceramic particles in a metal matrix with a prescribed volume fraction.
Table 3 lists the mechanical properties of the FGM specimen studied in this subsection. The FGM specimen is a rect-angular block with height H = 24.5 mm and width L = 49 mm subjected to an impulsive normal stress over the lengtha = 12.25 mm in the center of the top surface, as depicted in Fig. 26. The applied impulsive vertical stress is defined as:
σ22(x, z, t) = σ0 sin2(π
t − 2tr
2tr
), z = H, −a
2< x <
a
2, 0 < t < 2tr (29)
wherein σ0 = 125 MPa and the time duration of the half load cycle tr = 0.75 μs. As illustrated in Fig. 27 the simulation isperformed for t = 3 μs, so the FGM block is subjected to an impulsive stress for the first 1.5 μs and then the applied stressis set to be zero for the remaining time.

400 S. Hedayatrasa et al. / Journal of Computational Physics 258 (2014) 381–404
Fig. 25. The frequency spectrum of the transmitted longitudinal wave to the middle element of the FGM plate with d = 1 subjected to 150 kHz verticaltone burst using Gabor mother wavelet, for (a) the whole signal and (b) the time span pertaining to the arrival of the wave mode-2.
Table 3Material parameters of the considered FGM [21].
Parameter Phase-1 top Phase-2 bottom
Alumina Metal
E (GPa) 420 70ν 0.17 0.3ρ (kg/m3) 3200 2800
The material gradient function g defined by Eq. (30) is used for the volume fraction of the reinforcing ceramic phase.
g(λ) = g0
(λ + 1
2
)d
; 0 � d � +∞ (30)
The only difference between the gradient function g (Eq. (30)) and the previous one g (Eq. (13)) is that in the newgradient function the maximum volume fraction of the reinforcing phase is limited to g0. Hence the top surface of the FGMspecimen is not a pure ceramic phase and includes also a metallic phase with the volume fraction (1 − g0). The problemis solved in this work for three distinct cases A, C and D which are detailed in Table 4 and taken from the previous work

S. Hedayatrasa et al. / Journal of Computational Physics 258 (2014) 381–404 401
Fig. 26. An FGM specimen modeled by a 16×8 SpFEM mesh with the corresponding nodes. An impulsive normal stress is applied on the 4 central elementsof the top surface.
Fig. 27. Impulsive normal stress load applied vertically to the reinforced top surface of the FGM specimen with 125 MPa amplitude and 1.5 μs time durationas defined by Eq. (29).
Table 4Characteristics of FGM cases [22].
Case Description g0 d g
A Uniform reinforcement 0.36 0 0.360C High reinforced front 0.6 0.25 0.475D Low reinforced front 0.6 4 0.120
by Li et al. [22]. Note that the case B in [22] pertains to a multilayer FGM model and actually not applicable to verify thepresent SpFEM.
An SpFEM model with 16 longitudinal elements along the length and 4, 8 and 16 element layers along the thickness isapplied. Considering different mesh resolutions through the thickness of the plate enables us to compare the accuracy of theresults when the material gradient is approximated by fewer interpolating nodes in the proposed SpFEM. The normal stressis applied in the model by a uniform distribution of the equivalent force over a length a = 12.5 mm between all 21 nodes

402 S. Hedayatrasa et al. / Journal of Computational Physics 258 (2014) 381–404
Fig. 28. Through the thickness distribution of the normal stress σz along the centerline of the FGM specimen for different material gradient cases andvertical mesh resolutions after 3 μs.
Fig. 29. Through the thickness distribution of (a) normal stress σx and (b) shear stress τxz along the centerline of the FGM specimen with ceramic rein-forcement for different material gradient cases after 3 μs.
of the 4 central elements of the top surface. For instance, the model including 8 SpFEM element layers and the assumedload distribution is depicted in Fig. 27.
The calculated distributions of the normal stress σz through the thickness of FGM specimen along the center line aredemonstrated in Fig. 28, for the 3 assumed mesh resolutions having different element layers. It is apparent that by reducingthe mesh resolution through the thickness, the results are not penalized and show insignificant nonconformity. Furthermore,the results in Fig. 28 are compared with the numerical results in [21]. Accordingly, the developed SpFEM provides a stresswave amplitude close to the one estimated by the case with randomly embedded ceramic particles into the metal matrix.In contrast, the profile of the stress gradient along the thickness is more similar to the multilayer case. However, the SpFEMdoes not follow either these approaches exactly and would have to provide a more precise simulation of the stress wavepropagation in FGMs due to its appropriate description of the through thickness material gradient. Further results deliveredin Fig. 29 show the gradient of other stresses σz and τxz through the vertical centerline of the FGM specimen for cases A, Cand D.
Fig. 30 also presents the contour of the horizontal displacement u and the vertical displacement w for the consideredmaterial gradient cases after 3 μs. By comparing the results, it is well recognized that by reducing the mean volume fractionof the reinforcing ceramic phase, the wave propagation speed is reduced as expected. But the amplitude of the maximumstress does not change remarkably. The case D with a minimum average volume fraction equal to 0.12 for the ceramic phase

S. Hedayatrasa et al. / Journal of Computational Physics 258 (2014) 381–404 403
Fig. 30. Contours of the vertical displacement u and the horizontal displacement w for FGM specimens subjected to a lateral impulsive load and therelevant wave front after 3 μs: (a) and (d) for case A; (b) and (e) for case C, and (c) and (f) for case D.
has the lowest wave speed. In contrast, the case A with a maximum average ceramic volume fraction of 0.475 has thehighest wave speed. This is obvious from the front edge of both horizontal and vertical displacement contours.
4. Conclusions
An efficient numerical approach is presented for modeling elastic wave propagation in 2D FGMs using the time-domainspectral finite element method based on Chebyshev Lagrangian expansion. The developed SpFEM is verified and comparedto previously published analytical and numerical methods for wave propagation analysis in FGMs. The outcomes prove itscapability in simulation of in-plane normal (P) and transversal (SV) oscillations in such structures. The results clearly demon-strate that the present SpFEM can efficiently and accurately model the Lamb wave propagation in functionally graded plateswith various material gradient profiles using just one layer of 5th order spectral elements with 6 interpolating nodes alongthe thickness. The through thickness wave structure of the first two principal Lamb wave modes are extracted and analyzedin terms of the symmetry and the relative amplitude of the vertical and horizontal oscillations. This is to realize the differ-ences with respect to Lamb modes generated in homogeneous plates. Zero-crossing and wavelet signal processing–spectrumdecomposition procedures are implemented to achieve the phase and group velocities and their dispersion properties. Theadopted numerical procedures can be practically employed for the simulation, calibration and optimization of Lamb wavebased NDE techniques for the FGMs. Additionally, the suitability of the present SpFEM model for the analysis of the impactstress wave propagation in FGM structures is confirmed. As future works, it is worthwhile to extend the developed SpFEMfor wave–crack interaction analysis and crack propagation simulation in FGMs, and so on.
Acknowledgement
Financial supports by the German Research Foundation (DFG) under the project-no. ZH 15/14-1 and the German Aca-demic Exchange Service (DAAD) under the project-id. 54368781 are gratefully acknowledged.

404 S. Hedayatrasa et al. / Journal of Computational Physics 258 (2014) 381–404
References
[1] G.R. Liu, J. Tani, Surface waves in functionally gradient piezoelectric plates, J. Vib. Acoust. 116 (1994) 440–448.[2] T. Ohyoshi, Linearly inhomogeneous layer element for reflectance evaluation of inhomogeneous layers, in: Proc. Symp. ASME Int. Mech. Eng. Congr.
Expo., San Francisco, USA, 12–17 Nov., 46 (1995) 121–126.[3] X. Han, G.R. Liu, K.Y. Lam, A quadratic layer element for analyzing stress waves in FGMs and its application in material characterization, J. Sound Vib.
236 (2000) 307–321.[4] A. Chakraborty, S. Gopalakrishnan, J.N. Reddy, A new beam finite element for the analysis of functionally graded materials, Int. J. Mech. Sci. 45 (2003)
519–539.[5] A. Chakraborty, S. Gopalakrishnan, A spectrally formulated finite element for wave propagation analysis in functionally graded beams, Int. J. Solids
Struct. 40 (2003) 2421–2448.[6] A. Chakraborty, S. Gopalakrishnan, A higher-order spectral element for wave propagation analysis in functionally graded materials, Acta Mech. 172
(2004) 17–43.[7] S. Gopalakrishnan, A. Chakraborty, D. Roy Mahapatra, Spectral Finite Element Method – Wave Propagation, Diagnostics and Control in Anisotropic and
Inhomogeneous Structures, Springer-Verlag London Limited, 2007.[8] A.T. Patera, A spectral element method for fluid dynamics—laminar flow in a channel expansion, J. Comput. Phys. 54 (1984) 468–488.[9] W. Dauksher, A.F. Emery, Accuracy in modeling the acoustic wave equation with Chebyshev spectral finite elements, Finite Elem. Anal. Des. 26 (1997)
115–128.[10] A. Zak, A novel formulation of a spectral plate element for wave propagation in isotropic structures, Finite Elem. Anal. Des. 45 (2009) 650–658.[11] T. Kundu, Ultrasonic Nondestructive Evaluation—Engineering and Biological Material Characterization, CRC Press, LLC, USA, 2004.[12] M.V. Golub, S.I. Fomenko, T.Q. Bui, Ch. Zhang, Y.S. Wang, Transmission and band gaps of elastic SH waves in functionally graded periodic laminates,
Int. J. Solids Struct. 49 (2012) 344–354.[13] T.Q. Bui, A. Khosravifard, Ch. Zhang, M.R. Hematiyan, M.V. Golub, Dynamic analysis of sandwich beams with functionally graded core using a truly
meshfree radial point interpolation method, Eng. Struct. 47 (2013) 90–104.[14] X.S. Cao, F. Jin, I. Jeon, Calculation of propagation properties of Lamb waves in a functionally graded material (FGM) plate by power series technique,
Nondestruct. Test. Eval. Int. 44 (2011) 84–92.[15] K.C. Park, Practical aspects of numerical time integration, Comput. Struct. 7 (1977) 343–353.[16] L. Mažeika, L. Draudviliene, Analysis of the zero-crossing technique in relation to measurements of phase velocities of the Lamb waves, Ultragarsas
(Ultrasound) 65 (2010) 7–12.[17] L. Mažeika, L. Draudviliene, A. Vladišauskas, A. Jankauskas, Comparison of modelling and experimental results of the phase velocity measurement of
Lamb wave in aluminium plate, Ultragarsas (Ultrasound) 65 (2010) 15–19.[18] L. Draudviliene, L. Mažeika, Investigation of the spectrum decomposition technique for estimation of the group velocity Lamb waves, Ultragarsas
(Ultrasound) 64 (2009) 13–16.[19] F. Song, G.L. Huang, K. Hudson, Guided wave propagation in honeycomb sandwich structures using a piezoelectric actuator/sensor system, Smart Mater.
Struct. 18 (2009) 125007.[20] D. Sun, S.N. Luo, Wave propagation and transient response of a FGM plate under a point impact load based on higher-order shear deformation theory,
Compos. Struct. 93 (2011) 1474–1484.[21] A. Berezovski, J. Engelbrecht, G.A. Maugin, Numerical simulation of two-dimensional wave propagation in functionally graded materials, Eur. J. Mech.
A, Solids 22 (2003) 257–265.[22] Y. Li, K.T. Ramesh, E.S.C. Chin, Dynamic characterization of layered and graded structures under impulsive loading, Int. J. Solids Struct. 38 (2001)
6045–6061.