nuclear engineering and design - collapse-prevention.net - 2013 lib... · nuclear engineering and...
TRANSCRIPT
Sd
Sa
b
h
����
a
ARRA
1
ndphlipagrti
0h
Nuclear Engineering and Design 259 (2013) 14– 28
Contents lists available at SciVerse ScienceDirect
Nuclear Engineering and Design
j ourna l ho me pag e: www.elsev ier .com/ locate /nucengdes
trength and behavior in shear of reinforced concrete deep beams underynamic loading conditions
atadru Das Adhikarya, Bing Lia,∗, Kazunori Fujikakeb
School of Civil and Environmental Engineering, Nanyang Technological University, 639798, SingaporeDepartment of Civil and Environmental Engineering, National Defense Academy, Yokosuka 239 8686, Japan
i g h l i g h t s
Effects of wider range of loading rates on dynamic shear behavior of RC deep beams.Experimental investigation of RC deep beam with and without shear reinforcements.Verification of experimental results with truss model and FE simulation results.Empirical equations are proposed to predict the dynamic increase factor of maximum resistance.
r t i c l e i n f o
rticle history:eceived 14 April 2012eceived in revised form 29 January 2013ccepted 1 February 2013
a b s t r a c t
Research on reinforced concrete (RC) deep beams has seen considerable headway over the past threedecades; however, information on the dynamic shear strength and behavior of RC deep beams under vary-ing rates of loads remains limited. This paper describes the experimental results of 24 RC deep beams withand without shear reinforcements under varying rates of concentrated loading. Results obtained serve asuseful data on shear resistance, failure patterns and strain rates corresponding to varying loading rates.An analytical truss model approach proves its efficacy in predicting the dynamic shear resistance under
varying loading rates. Furthermore, three-dimensional nonlinear finite element (FE) model is describedand the simulation results are verified with the experimental results. A parametric study is then con-ducted to investigate the influence of longitudinal reinforcement ratio, transverse reinforcement ratioand shear span to effective depth ratio on shear behavior. Subsequently, two empirical equations wereproposed by integrating the various parameters to assess the dynamic increase factor (DIF) of maximumresistance under varying rates of concentrated loading.. Introduction
During their service life, reinforced concrete structures inuclear power plants (NPPs) may be subjected to various types ofynamic loading in terms of earthquakes, impact and blast. Nuclearower plants could be situated in earthquake-prone regions andence may be subjected to dynamic loading due to ground oscil-
ations. Moreover, impact loads may be imposed on RC structuresn the NPPs from tornado-borne objects such as steel rods, steelipes and wooden poles or from objects flown during an internalccident such as turbine failure or pipe breakage. Therefore, thelobal safety of existing or next generation NPPs depends on the
esistance of internal and external reinforced concrete structures tohe above-mentioned dynamic loadings. However, dynamic load-ng in terms of accidental and intentional blast loading is out of∗ Corresponding author. Tel.: +65 67905090.E-mail address: [email protected] (B. Li).
029-5493/$ – see front matter © 2013 Elsevier B.V. All rights reserved.ttp://dx.doi.org/10.1016/j.nucengdes.2013.02.016
© 2013 Elsevier B.V. All rights reserved.
scope of this research. The main objective of the research is toimprove the understanding of the response of RC deep beam underwide range of loading rates (4 × 10⁻⁴ to 2 m/s). Measurement ofstrain at the midspan of longitudinal tensile reinforcements indi-cates that peak strain rate induced from these loading rates werein the range of 10−3 to 10 s−1. Strain rates induced from low(4 × 10⁻² m/s) to medium (4 × 10⁻¹ m/s) loading rates are analo-gous to the earthquake-range of strain rates whereas the samefrom high (2 m/s) loading rates are similar to impact-range of strainrate up to 10 s−1. Many researchers have investigated the behav-ior of RC slender beams under drop weight impact (Kishi et al.,2001, 2002; Bhatti et al., 2009; Saatci and Vecchio, 2009) and vary-ing rates of concentrated loading (Mutsuyoshi and Machida, 1984;Kulkarni and Shah, 1998; Fujikake et al., 2009; Adhikary et al.,2012). However, limited literature exists pertaining to resistance
and behavior of RC deep beams under varying rates of concen-trated loading in displacement control. Displacement control isknown to be indispensable for obtaining the entire post-peakresponse of RC structural elements. In varying loading rate testing,
ineering and Design 259 (2013) 14– 28 15
ditR4pitswimtsincwpomritrtdblai
2
2i
(1rrsafwscrrtswdmctcto3mric
S.D. Adhikary et al. / Nuclear Eng
isplacement control is even useful to reduce inertia effects dur-ng the pre-peak stage. With the aim of shedding some light inhis area, an extensive experimental program was undertaken forC deep beams subjected to a wide range of loading rates (static:
× 10−4; low: 4 × 10⁻²; medium: 4 × 10⁻¹; high: 2 × 100 m/s). Thisaper summarizes the details of the test program; including spec-
men and material properties, test setup, instrumentations andest procedures. The test results and major observations are pre-ented and critically discussed. Then, a simplified analytical methodas developed using a truss model where the beam was ideal-
zed by longitudinal, transverse and diagonal truss elements. Thisodel predicted the experimental dynamic shear resistance and
he load–deformation response up to ultimate resistance quiteuccessfully. Moreover, three-dimensional nonlinear FE analysiss performed using LS-DYNA software (LS-DYNA, 2007) for theumerical simulation of the RC deep beams under varying rates ofoncentrated loading. Simulation results from FE model is verifiedith the experimental results. FE models are deemed successful toredict the dynamic shear resistance and shear failure mechanismf RC deep beams under the varying loading environments. Thisakes finite element modeling an attractive alternative when high
ates and/or impact testing facility is not available or feasible. Thiss followed by a parametric study to investigate the influence ofhe longitudinal reinforcement ratio, the transverse reinforcementatio and the shear span to effective depth ratio. Empirical equa-ions are proposed in terms of various parameters to predict theynamic increase factor (DIF) of maximum resistance of RC deepeams (with and without transverse reinforcements) under varying
oading rates. DIF was calculated as a ratio of maximum resistancet any loading rates (i.e. low, medium and high) to the correspond-ng static maximum resistance at a loading rate of 4 × 10⁻⁴ m/s.
. Outline of experiment
.1. Specimen details, material characteristics andnstrumentation
The test specimens consisted of twenty-four RC deep beamstotal span length 1100 mm), having rectangular cross-sections of50 mm width and 250 mm depth. Shear-span to effective-depthatio of all the beams was 1.9. The layout of the longitudinaleinforcements, spacing of transverse reinforcements and the mea-uring points (acceleration and strain for steel reinforcing bars)re shown in Fig. 1. Longitudinal reinforcements consisted ofour deformed steel bars of D22 mm while D6 deformed barsere used for shear reinforcements. All the specimens had the
ame degree (2.4%) of longitudinal reinforcements. 40 mm concreteover was provided in all the specimens. There was no transverseeinforcement in RC1.9 S0 whereas 0.42% and 0.84% transverseeinforcements were provided in RC1.9 S42 and RC1.9 S84, respec-ively. Ready mix concrete was used to cast the specimens. Thepecified concrete compressive strength at 28 days was 40 MPaith maximum aggregate size of 20 mm for all specimens. 150 mmiameter and 300 mm high concrete cylinders were used to deter-ine the compressive strength of concrete. It is to be noted that the
oncrete cylinders were cast together with the specimens usinghe same batch of concrete mix and were cured under identicalonditions. Standard coupon tests were carried out to determinehe mechanical properties of steel reinforcements. Yield strengthf longitudinal and shear reinforcements were determined to be71 MPa and 342 MPa, respectively. All specimens were well instru-
ented to capture the load, displacements, accelerations and steeleinforcement strains. The instrumentation for this test programncluded a load cell, strain gauges and accelerometers. A load cell ofapacity of 980 kN and measuring frequency of 5 kHz was attached
Fig. 1. Dimensions of RC deep beams, layout of reinforcements, location of straingauges and accelerometers.
to the actuator to measure the load. 2 mm strain gauges wereinstalled in the midspan of the longitudinal tensile reinforcementsand in the mid-point of the two legs of the transverse reinforce-ments. Five accelerometers (capacity of 1000 times gravity andresonance frequency more than 70 kHz) were mounted for eachtest (except static loading) on the specimens to measure the accel-erations for low, medium and high rates of concentrated loading.The midspan deflection was measured by laser-type variable dis-placement transducers (LVDTs) which have a measuring range of80 mm and sampling rate of 50 kHz. Data from the sensors werecollected by a digital data acquisition system which has a samplingrate of 100 Hz, 10 kHz, 100 kHz, and 200 kHz for static, low, mediumand high loading rates, respectively. The specific locations of thestrain gauges and accelerometers are shown in Fig. 1. A steel plate(40 mm thickness) was placed on the top of the beam at loadingpoint to transfer well-distributed force to the specimens. The useof digital photography and high-speed video recording proved to bevaluable in providing insights into the cracking patterns and failuremodes of the beams, particularly the spalling of concrete, and thebending of the longitudinal reinforcing bars.
2.2. Shear resistance of deep beams in code provisions
Empirical formulae have been given in ACI 318-99 (ACICommittee, 1999) and CIRIA Guide 2 (CIRIA, 1977) to calculate
16 S.D. Adhikary et al. / Nuclear Engineering and Design 259 (2013) 14– 28
tGrla3etsp(wt0te2b
2
0titffsctch
3
3
aes
0
50
100
150
200
250
300
350
400
0 5 10 15 20 25 30
RC1.9_S0_S
RC1.9_S0_L
RC1.9_S0_M
RC1.9_S0_H
Lo
ad (
kN
)
Midspa n de flection (mm)
2VACI 318-08
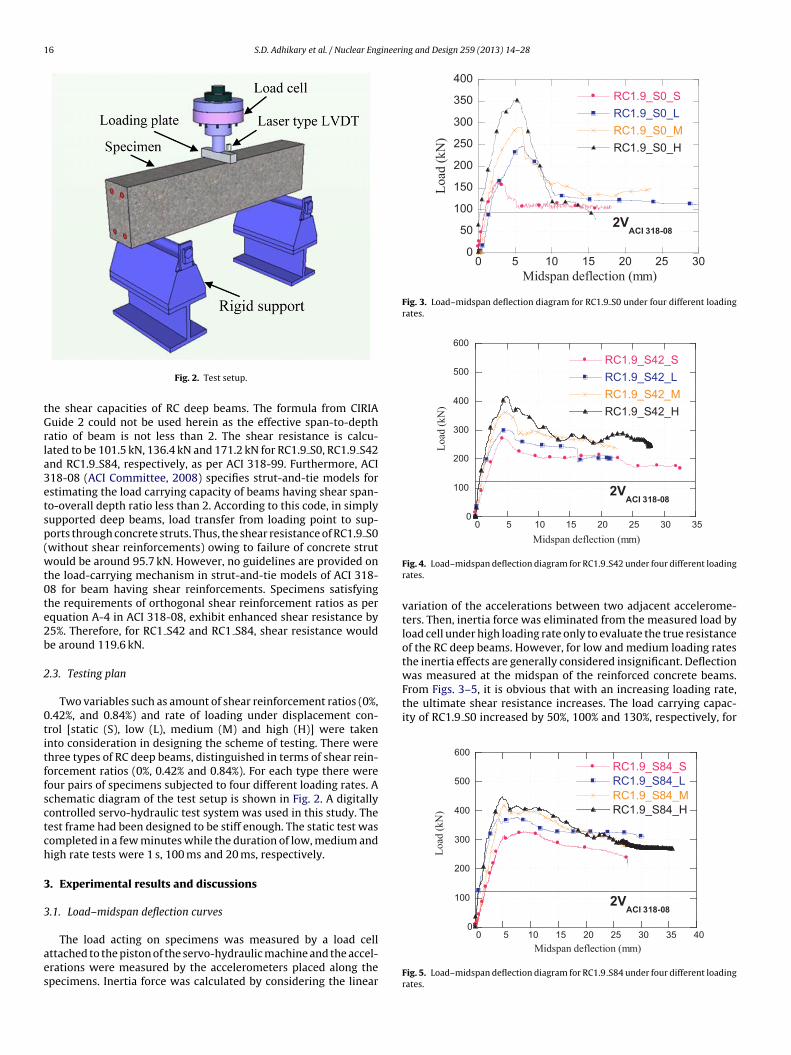
Fig. 3. Load–midspan deflection diagram for RC1.9 S0 under four different loadingrates.
0
100
200
300
400
500
600
0 5 10 15 20 25 30 35
RC1.9_S42_S
RC1.9_S42_L
RC1.9_S42_M
RC1.9_S42_H
Load
(kN
)
Midspan de flection (mm)
2VACI 318-08
From Figs. 3–5, it is obvious that with an increasing loading rate,the ultimate shear resistance increases. The load carrying capac-ity of RC1.9 S0 increased by 50%, 100% and 130%, respectively, for
0
100
200
300
400
500
600
RC1.9_S84_S
RC1.9_S84_L
RC1.9_S84_M
RC1.9_S84_H
Lo
ad (
kN
)
2VACI 318-08
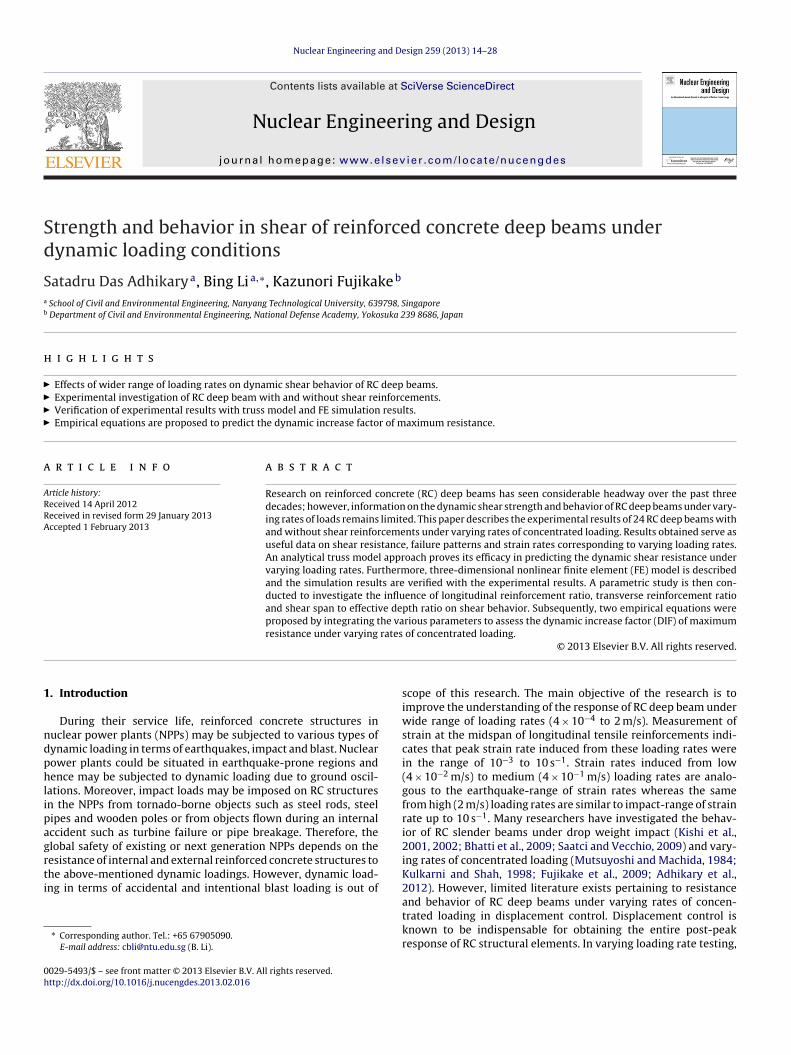
Fig. 2. Test setup.
he shear capacities of RC deep beams. The formula from CIRIAuide 2 could not be used herein as the effective span-to-depth
atio of beam is not less than 2. The shear resistance is calcu-ated to be 101.5 kN, 136.4 kN and 171.2 kN for RC1.9 S0, RC1.9 S42nd RC1.9 S84, respectively, as per ACI 318-99. Furthermore, ACI18-08 (ACI Committee, 2008) specifies strut-and-tie models forstimating the load carrying capacity of beams having shear span-o-overall depth ratio less than 2. According to this code, in simplyupported deep beams, load transfer from loading point to sup-orts through concrete struts. Thus, the shear resistance of RC1.9 S0without shear reinforcements) owing to failure of concrete strutould be around 95.7 kN. However, no guidelines are provided on
he load-carrying mechanism in strut-and-tie models of ACI 318-8 for beam having shear reinforcements. Specimens satisfyinghe requirements of orthogonal shear reinforcement ratios as perquation A-4 in ACI 318-08, exhibit enhanced shear resistance by5%. Therefore, for RC1 S42 and RC1 S84, shear resistance woulde around 119.6 kN.
.3. Testing plan
Two variables such as amount of shear reinforcement ratios (0%,.42%, and 0.84%) and rate of loading under displacement con-rol [static (S), low (L), medium (M) and high (H)] were takennto consideration in designing the scheme of testing. There werehree types of RC deep beams, distinguished in terms of shear rein-orcement ratios (0%, 0.42% and 0.84%). For each type there wereour pairs of specimens subjected to four different loading rates. Achematic diagram of the test setup is shown in Fig. 2. A digitallyontrolled servo-hydraulic test system was used in this study. Theest frame had been designed to be stiff enough. The static test wasompleted in a few minutes while the duration of low, medium andigh rate tests were 1 s, 100 ms and 20 ms, respectively.
. Experimental results and discussions
.1. Load–midspan deflection curves
The load acting on specimens was measured by a load cellttached to the piston of the servo-hydraulic machine and the accel-rations were measured by the accelerometers placed along thepecimens. Inertia force was calculated by considering the linear
Fig. 4. Load–midspan deflection diagram for RC1.9 S42 under four different loadingrates.
variation of the accelerations between two adjacent accelerome-ters. Then, inertia force was eliminated from the measured load byload cell under high loading rate only to evaluate the true resistanceof the RC deep beams. However, for low and medium loading ratesthe inertia effects are generally considered insignificant. Deflectionwas measured at the midspan of the reinforced concrete beams.
0 5 10 15 20 25 30 35 40
Midspa n de flection (mm)
Fig. 5. Load–midspan deflection diagram for RC1.9 S84 under four different loadingrates.

S.D. Adhikary et al. / Nuclear Engineering and Design 259 (2013) 14– 28 17
0
50
100
150
200
250
300
350
400
450
500
1.0E -05 1.0E -04 1.0E -03 1.0E -02 1.0E -01 1.0E+00
Dy
na
mic
sh
ear
resi
sta
nce
(k
N)
Loa ding rate (m/s)
RC1.9_ S0
RC1.9_ S42
RC1.9_ S84
a
1.0
1.2
1.4
1.6
1.8
2.0
2.2
1.0E -02 1.0E -01 1.0E+00 1.0E+01
ecn
atsiserm
umi
xa
mf
oFI
D
Loa ding rate (m/s)
RC1.9_ S0
RC1.9_ S42
RC1.9_ S84
b
) DIF
lciaim3isR2iodltldmbcr
Fig. 6. (a) Variation of dynamic shear resistance; (b
ow, medium and high rates of loading compared to the static loadarrying capacity. Moreover, the residual strength for all other load-ng rates was more than that under static loading. Under mediumnd high rates, the load vs. midspan deflection curve showed somendentation before reaching the peak load, indicating the develop-
ent of cracking. For RC1.9 S42, the peak load increased by 11%,3% and 53%, respectively, for low, medium and high rates of load-
ng in comparison to the static peak load. However, RC1.9 S42 hadufficient residual strength under all loading rates as compare toC1.9 S0. Similarly, for RC1.9 S84 load resistance increased by 14%,7% and 35%, respectively, for low, medium and high rates of load-
ng compared to the static case. Due to the presence of high amountf transverse reinforcement ratios (0.84%), RC1.9 S84 exhibiteductile nature for all loading rates which is clearly visible from
oad–midspan deformation curves. Fig. 6(a) shows the variation ofhe dynamic shear resistance of each specimen under four differentoading rates. Furthermore, the ultimate shear strength of the RCeep beams increased with the increment of the shear reinforce-
ent ratios. Moreover, it was observed that the slope of post-peakranch (i.e., descending branch) of the load–midspan deformationurve increased for all loading rates due to the increment of sheareinforcement ratio. DIF of maximum resistance under different
0
10
20
30
40
50
60
70
80
90
100
1.0E -05 1.0E -04 1.0E -03 1.0E -02 1.0E -01 1.0E+00 1.0E+01
Sti
ffn
ess
(kN
/ m
m)
Loading rate (m/s)
RC1.9_ S0
RC1.9_ S42
RC1.9_ S84
a b
Fig. 7. (a) Stiffness of RC deep beams under static, low, medium and high loading
of maximum resistance for different loading rates.
loading rates is shown in Fig. 6(b). From the above-mentioned fig-ure, it could be enunciated that the influence of loading rate on theDIF of maximum resistance is more significant for specimens with-out transverse reinforcements as compared to those having shearreinforcements.
3.2. Stiffness
Stiffness is calculated by using the secant of the load vs. midspandeflection curve passing through the points of ultimate shear resis-tance of deep beam under different loading rates. Fig. 7(a) shows thevariation in stiffness for all specimens under static, low, mediumand high loading rates. Stiffness of RC1.9 S0 enhanced by around7.4%, 17.3% and 36.7% when the loading rate was shifted from staticto low, medium and high, respectively. Moreover, for RC1.9 S42the increment in stiffness was observed to be 22.2%, 24.5% and25.1%, respectively, and for RC1.9 S84 the stiffness was augmentedby 35.9%, 39.7% and 40%, respectively. Shear reinforcements had
some beneficial effect to increase the stiffness of deep beam underhigher loading rates as compared to static. However, for specimenshaving shear reinforcements, the stiffness remains almost same forlow, medium and high loading rates.0
500
1000
1500
2000
2500
3000
0 0.005 0.01 0.015 0.02 0.025
RC1.9_S0_M
RC1.9_S0_H
Mic
rost
rain
Time (s)
sys-1855ε
rate; (b) strain histories of RC1.9 S0 under medium and high loading rate.

1 ineeri
3a
rissRtatsrim(plS0os3ttp
3
tarart
8 S.D. Adhikary et al. / Nuclear Eng
.3. Strain at the midspan of longitudinal tensile reinforcementsnd corresponding strain rates
After analyzing the strain history data of longitudinal tensileeinforcements and converting it to stress history by multiplyingt by the elastic modulus of steel, it was recognized that the yieldtress of tensile reinforcing bars was increased as compared to thetatic yield stress (371 MPa) for medium and high loading rates. ForC1.9 S0, 25% and 46% (Fig. 7(b)) enhancement in yield stress inhe tensile reinforcing bars was observed in the case of mediumnd high loading rates, respectively. Similarly, it was calculatedo be 32% and 39% more than the static yield stress of the ten-ile reinforcing bars of RC1.9 S42 for medium and high loadingates, respectively. Again for RC1.9 S84, 40% and 62% incrementn yield stress in the tensile reinforcing bars were observed for
edium and high loading rates, respectively. The peak strain ratesat the midspan of longitudinal tensile reinforcements) were com-uted to be 0.0059 s−1, 0.067 s−1, 0.59 s−1 and 3.5 s−1 for static,
ow, medium and high rates of loading, respectively, for RC1.9 S0.imilarly, the peak strain rates were calculated to be 0.0068 s−1,.041 s−1, 0.48 s−1 and 3.1 s−1 for static, low, medium and high ratesf loading, respectively, for RC1.9 S42. Again for RC1.9 S84, peaktrain rates were computed to be 0.0027 s−1, 0.029 s−1, 0.46 s−1 and.7 s−1 for static, low, medium and high rates of loading, respec-ively. Approximately, one order increment (approximately, 10imes) in the peak strain rate was observed as the loading ratesrogressed from low to high.
.4. Crack profiles
The high-resolution digital photography produced images ofhe side surface of specimens that yielded detailed deflection and
visual record of the crack profiles under four different loading
ates are illustrated in Fig. 8. RC1.9 S0 exhibited diagonal splittingnd/or crushing strut failure under static loading. Moreover, arch-ib cracks were developed from the compressive zone and extendedo the side of the beam. For low rates of loading, shear compressionFig. 8. Cracking patterns of RC deep be
ng and Design 259 (2013) 14– 28
and crushing strut failure were noticed and few arch-rib crackswere formed at the top face of the specimen. Formation of diag-onal strut and crushing of compression concrete was observed inmedium loading rate, moreover bearing failure occurred in one sideand arch-rib cracks were developed in the top face. For high load-ing rates, crushing strut failure including bearing failure at loadingand support region was observed. Massive spalling of concrete intop, bottom and diagonal region and exposure of tensile and com-pressive reinforcements were also perceived for this loading case.For RC1.9 S42, diagonal splitting failure was observed under staticloading, subsequently arch-rib cracks were started to develop fromthe top face of the beam. Under low loading rate, crushing strut anddiagonal splitting failure were noticed. Bearing and crushing strutfailure were perceived for medium loading rate. Crushing strut fail-ure with massive spalling of concrete in strut region was observedin high rates with the exposure of top and bottom reinforcements.For RC1.9 S84, one-sided diagonal cracks and flexural cracks wereformed in the initial stage of static loading. Spalling of concretebelow the loading plate lead to bearing failure and subsequentlycrushing strut failure was observed. Moreover, few arch-rib crackswere also appeared in the top face of the beam. Diagonal splittingand bearing failure under loading point was observed for low rate.For medium loading rate, diagonal splitting failure with crushingof compression concrete was observed. Crushing strut failure andspalling of concrete from compression and diagonal region werenoticed under high loading rate.
4. Analytical truss model approach
Typically, reinforced concrete members are designed to resistthe actions based on the assumption of linear strain distributionat a section referred to as Bernoulli hypothesis or beam theory.The region of structures where the Bernoulli hypothesis is valid
referred to as a B region. Whereas, deep beam must be considereddifferently from a section design because the linear strain distri-bution assumption is no longer valid. ACI 318-08 (ACI Committee,2008) recommends using strut-and-tie models for designing theam under varying loading rates.

S.D. Adhikary et al. / Nuclear Engineering and Design 259 (2013) 14– 28 19
ps of c
demtbomitsbmr
4
(di
f
wε1
f
E
w3
r
f
w
4
sTtmttFtss
tcd = tc
(ε
εs
)0.006[log10(ε/εs)]1.05
(4)
Compression m emb erTensi on memb er
Fig. 9. Constitutive relationshi
iscontinuity regions of RC structures under static loading. How-ver, it does not provide specific guidance on suitable strut-and-tieodels for different structural elements with non-linear strain dis-
ribution at a section. Truss model has been used for analysis of RCeams, columns and their subassemblies subjected to monotonicr cyclic loading (To et al., 2001; Khoo and Li, 2007). However, trussodel to analyze RC members under varying loading rates is scarce
n literature. Therefore, efforts have been devoted herein to analyzehe RC deep beam under varying loading rates by using well-knowntrut-and-tie or truss model approach. In this truss model, the RCeam is idealized by longitudinal, transverse and diagonal truss ele-ents which duly consider the strain rate effects of concrete and
einforcing steel.
.1. Stress–strain relationships of concrete and reinforcing steel
The constitutive relationships of concrete and reinforcing steelFujikake et al., 2009) for the truss model are shown in Fig. 9. Theynamic compressive strength of concrete is defined by the follow-
ng equation as the function of strain rate:
′cd = f ′
s
(ε
εs
)0.006[log10(ε/εs)]1.05
(1)
here f ′cd
is the dynamic compressive strength under strain rate˙ , f ′
s is the compressive strength under static loading (MPa), εs =.2 × 10−5 (s−1).
And the dynamic elastic modulus of concrete is specified as theunction of strain rate by the following equation:
0d = E0
(ε
εs
)0.002[log10(s/εs)]1.12
(2)
here E0 = elastic modulus of concrete under static loading; E0 =320
√f ′c + 6900 (MPa); εs = 1.2 × 10⁻⁵ (s−1).
The relationship between the dynamic yield strength (fsyd) ofeinforcing steel and the strain rate (ε) is given as
syd = fsys(1.202 + 0.040 × log10 ε) ≥ fsys (3)
here fsys is the yield strength under static loading.
.2. Modeling of truss elements
Strut-and-tie models are discrete representations of actualtress fields resulting from applied load and support conditions.hese models represent the load-carrying mechanisms of struc-ural members by approximating the flow of internal forces by
eans of struts representing the flow of compressive stresses andies representing the flow of tensile stresses. A graphical presenta-ion of the overall configuration of the truss model is illustrated in
ig. 10. Compressive members are shown in dotted lines whereasensile members are shown in solid lines. For RC1.9 S0 (withouthear reinforcements), two support points are connected by ten-ion tie which represents the longitudinal reinforcing bars whereasoncrete and reinforcing steel.
the loading point to support point is connected by diagonal com-pression strut that represents the cracked concrete in compression.However, in the case of RC1.9 S42 and RC1.9 S84 (with shear rein-forcements), the shear span is divided into two parts by placingone tension tie in the transverse direction at the mid of shearspan. Although the same model has been used for RC1.9 S42 andRC1.9 S84, the cross sectional area of transverse tie was being var-ied in accordance to the amount of transverse reinforcement ratio.Arch mechanism is duly considered in this truss model by introduc-ing compression strut which directly connects the loading pointswith the supports (Li and Tran, 2008).
Many researchers have opined that the truss model analogytends to overestimate the shear resistance and stiffness of RC beamswhen the failure stress of the concrete strut is assumed to beuniaxial concrete compressive strength. Thus, the stress in eachconcrete element in truss model must be considered carefully. Herethe suggestion from Schlaich et al. (1987) is adopted for the effec-tive compressive stress of concrete. Therefore, 0.85f ′
c is taken for thetop longitudinal concrete element. A compressive strength of 0.68f ′
cis chosen for the diagonal compressive struts which accounts for thedetrimental effects of transverse tensile stresses to the compressivestrength. Moreover, 0.35E0 is specified for the elastic modulus ofdiagonal struts for taking into account of cracked concrete. For thelongitudinal bottom chord elements, the properties of longitudinalbottom reinforcements are defined and successively for transversetension ties, the properties of shear reinforcements are specified.
Although the compression struts are idealized as a uniform crosssectional member, they generally vary in cross section along theirlength by the spreading of compression stress acting on them. Thespreading of compression stress results in transverse tension stressin the compression struts, which may cause cracking. The trans-verse tension stress, therefore, may play a very important roleunder high loading rate, because the strain rate effect on concretestrength is more significant in tension than in compression. Thus,it may appear that the increase in the transverse tension strengthof concrete with increasing the strain rate makes the thickness ofthe concrete compression strut bigger.
The relationship between the thickness of the compression strutand the strain rate is looked into over the experimental data andthe following equation is obtained.
RC1.9_S0 RC1.9_S42 & RC1.9 _S84
Fig. 10. Truss model.

20 S.D. Adhikary et al. / Nuclear Engineering and Design 259 (2013) 14– 28
0
100
200
300
400
1.0E -05 1.0E -04 1.0E -03 1.0E -02 1.0E -01 1.0E+00 1.0E+01
)N
k(ec
natsiser
rae
hsci
ma
ny
D
Exper iment
Truss model
RC1.9_S0
0
100
200
300
400
500
1.0E -05 1.0E -04 1.0E -03 1.0E -02 1.0E -01 1.0E+00 1.0E+01
)N
k (ec
natsiser
rae
hsci
ma
ny
D Exper iment
Truss model
RC1.9_S84
mic sh
wa
4
d
Loa ding rate (m/s)
Fig. 11. Comparison of predicted (truss model) and experimental dyna
here tcd is the thickness of compression strut at any strain rate εnd tc is the thickness of compression strut at εs = 1.2 × 10⁻⁵ (s−1).
.3. Verification of truss model approach
To verify the proposed truss model approach, a comparison ofynamic shear resistance and load–midspan deflection response
0
50
100
150
200
250
300
350
0 1 2 3 4 5 6
Lo
ad
(k
N)
Midspan deflec tion (mm )
EXP._RC1.9_ S42 _S
Truss mod el
Static
0
50
100
150
200
250
300
350
400
0 1 2 3 4 5 6
Lo
ad
(k
N)
Midspan deflec tion (mm )
EXP._RC1.9_ S42 _M
Truss mod el
Medium
Fig. 12. Comparison of predicted (truss model) and experimental load–mi
Loa ding rate (m/s)
ear resistance of RC1.9 S0 and RC1.9 S84 under varying loading rates.
under varying loading rates acquired from test results is demon-strated. Using the methodology as pioneered previously, the trussmodel approach with established member properties was analyzed
by the LS-DYNA solver. Fig. 11 shows that the proposed truss modelpredicts the experimental dynamic shear resistance of RC1.9 S0 andRC1.9 S84 with a reasonable accuracy. Moreover, the truss modelis also validated by plotting the analytical results in terms of load0
50
100
150
200
250
300
350
400
0 1 2 3 4 5 6
Lo
ad
(k
N)
Midspan deflec tion (mm )
EXP._RC1.9_ S42 _L
Truss mod el
Low
0
50
100
150
200
250
300
350
400
450
500
0 1 2 3 4 5 6
Lo
ad
(k
N)
Midspan deflec tion (mm )
EXP._RC1.9_ S42 _H
Truss mod el
High
dpan deflection responses of RC1.9 S42 under varying loading rates.

S.D. Adhikary et al. / Nuclear Engineering and Design 259 (2013) 14– 28 21
vildaemo
5
ei3aoa
5
bt(qCmmuw(bebf4ihiiciTspt
5a
w
Table 1Comparison of dynamic shear resistance of RC deep beam by FE simulation andexperimental results.
Specimen Loading rate(m/s)
Dynamic shearresistance (kN)
LS-DYNA/Test
Test LS-DYNA
RC1 S0
0.0004 170.1 175.6 1.030.04 246.5 239.2 0.970.4 290.5 293.4 1.012 353.6 366 1.04
RC1 S42
0.0004 271.9 300.2 1.100.04 300.6 324 1.080.4 361.3 375.2 1.042 417 421.5 1.01
RC1 S84
0.0004 331.8 338 1.020.04 378.2 381.7 1.010.4 420.75 422.7 1.002 446.7 459.3 1.03
Fig. 13. Finite element model of RC deep beam.
ersus midspan deflection response and comparing it to the exper-mental results of RC1.9 S42 under static, low, medium and highoading rates as shown in Fig. 12. Hence, the proposed truss modelemonstrates good reliability in reasonable matching of test andnalysis curves in terms of ultimate resistance and stiffness. How-ver, to predict the post-peak descending branch of load versusidspan deflection responses, more rigorous model can be devel-
ped.
. Finite element model
In the present study, finite element code LS-DYNA wasmployed because of its proven effectiveness in geometric model-ng and analysis capability under high loading rates. The adoption ofD analysis arose from the need to account for the effects of inertiand the nonlinear behavior of concrete and steel. The descriptionf modeling includes structural geometry, boundary conditions,pplication of loads, and relevant material models.
.1. Structural modeling
Fig. 13 shows the three-dimensional FE model of tested RC deepeams. Eight node solid hexahedron elements with a single integra-ion point were used to represent concrete while beam elements2-node Hughes-Liu beam element formulation with 2 × 2 Gaussuadrature integration) were used to model steel reinforcing bars.omparing the pre-analysis results with the experimental ones, theesh geometry was chosen as follows considering the fact that theesh aspect ratio is smaller than 1.5. A mesh size of 25 mm was
sed to create the solid element in the span direction of RC beamhereas the mesh configuration in sectional directional comprised:
1) in the depth direction of RC beam, 8 elements for concreteetween the top and bottom longitudinal reinforcements and 2lements for concrete cover; (2) in the width direction, 4 elementsetween two adjoining longitudinal reinforcements and 2 elementsor concrete cover. In total, approximately, 6900 nodal points and220 elements were used to model the whole structures. Numer-
cal convergence study showed that further decrease in mesh sizead insignificant effect on the accuracy of results, while increas-
ng the duration of analysis. The mesh discretization was executedn such a way that the reinforcement nodes coincided with theoncrete nodes. The steel reinforcing bars were modeled explic-tly using beam elements connected to the concrete mesh nodes.he nodes that linked the concrete and reinforcement mesh werehared and therefore unable to slip. Due to this assumption of com-lete compatibility of strains between the concrete and steel nodes,hey formed a perfect bond.
.2. Boundary conditions, application of load and contact
lgorithmTo simulate the actual experimental conditions, the beamsere supported on two rigid cylinders made of solid elements.
Mean 1.03COV 0.03
Constraints were defined to the support cylinder, so that it couldrotate about its own longitudinal axis but would not be ableto translate. Displacement was prescribed in the rigid loadingplates located at the midspan of the RC beam. The rigid load-ing plate was allowed to move only in the vertical direction.The prescribed displacement was linear, going from zero dis-placement to 40 mm displacement under certain time duration,depending on the desired rate of loading. The correspondingapplied load due to the prescribed displacement was then deter-mined by monitoring the vertical reaction forces at the concretenodes in contact with the support solid cylinders. The algorithmCONTACT AUTOMATIC SINGLE SURFACE in LS-DYNA was used tomodel the contact between the support cylinder, loading plate andRC beam. This algorithm automatically generates slave and mas-ter surfaces and uses a penalty method where nominal interfacesprings are used to interpenetration between element and sur-faces. The interface stiffness is computed as a function of the bulkmodulus, volume and face area of the elements on the contactsurface.
5.3. Material characteristics
5.3.1. ConcreteMaterial type 072 R3 (MAT CONCRETE DAMAGE REL3), was the
third release of Karagozian and Case (K&C) concrete model andwas utilized in this study. It includes implementation of a third,independent yield failure surface, removal of tension cutoff andextension of the plasticity model in tension; shift of the pres-sure cutoff; implementation of three invariant formulation forthe failure surfaces; determination of triaxial extension to triax-ial compression ratio as a function of pressure; shear moduluscorrection and implementation of a radial path strain rate enhance-ment (Malvar et al., 1997). The model has a default parametergeneration function based on the unconfined compressive strengthof the concrete (Schwer and Malver, 2005). A detailed descrip-tion of the concrete material model was provided by Wu et al.(2011).
5.3.2. SteelThe steel reinforcement bars (longitudinal and shear reinforce-
ments) within the beam were modeled as a strain sensitive uniaxialelastic-plastic material to account for its strain rate sensitivity aswell as stress–strain history dependence. Material model PIECE-WISE LINEAR PLASTICITY (MAT 024) from LS-DYNA was employed

2 ineeri
ipsm
5
limYt
2 S.D. Adhikary et al. / Nuclear Eng
n this study to incorporate the strain rate effect. The expressionsroposed by Malvar (1998) on strain rate effect were utilized in thistudy. Wu et al. vividly depicted the details of the steel materialodeling.
.3.3. Loading plate, support roller and plateMAT RIGID (MAT 020) was used from the LS-DYNA material
ibrary to model the loading plates, support rollers and plates. Real-
stic values of Young’s modulus and Poisson’s ratio of the rigidaterial need to be defined to avoid numerical problems in contact.oung’s modulus and Poisson’s ratio of steel material were used forhe rigid material in the numerical simulation.
Fig. 14. Comparison of cracking pattern of RC deep beams under
ng and Design 259 (2013) 14– 28
6. Verification of finite element model
Numerical simulation results of reinforced concrete beams sub-jected to four different loading rates were calibrated with theexperimental results.
6.1. Load vs. midspan deflection
To simulate the same experimental conditions, the beamswere analyzed in displacement control in LS-DYNA. Table 1presents the comparisons of the numerical simulations resultswith experimental dynamic shear resistance of RC deep beams
: (a) static; (b) low; (c) medium; and (d) high loading rates.

S.D. Adhikary et al. / Nuclear Engineeri
L
2a
d
b
h
utmar
6
tTttosts
7
7
rtvp11aFTm
7
rT(ai1rwfltrca
7
o
tive depth ratio between 1 and 2 show a higher DIF as comparedto specimens having transverse reinforcements for loading rates.However, for specimens of shear span to effective depth ratio
1.0
1.1
1.2
1.3
1.4
1.5
1.6
1.0E-02 1.0E-01 1.0E+00 1.0E+01
ec
nat
sis
erm
umi
xa
mf
oFI
D
Loading rate, δ (m/s)
ρ =0.84 %, a/d=1.9
ρg=2. 4 %
ρg=1. 27 %
1.0
1.1
1.2
1.3
1.4
1.5
1.6
1.7
1.8
1.0E-02 1.0E-01 1.0E+00 1.0E+01
ec
nat
sis
erm
umi
xa
mf
oFI
D
Loading rate, δ (m/s)
ρ =0%, a/d=2.26
ρg=2.4 %
ρg=1.27 %
c
1.0
1.1
1.2
1.3
1.4
1.5
1.6
1.7
1.8
1.0E-02 1.0E-01 1.0E+00 1.0E+01
ec
na t
sis
erm
umi
xa
mf
oFI
D
Loading rate, δ (m/s)
ρ =0.42 %, a/d=2.26
ρg=2.4 %
ρg=1.27 %
1.0
1.1
1.2
1.3
1.4
1.5
1.6
1.7
ec
nat
sis
erm
umi
xa
mf
oFI
D
ρ =0.84%, a/d=2.26
ρg=2. 4 %
ρg=1. 27 %
1.0
1.1
1.2
1.3
1.4
1.5
1.6
1.7
1.8
1.0E-02 1.0E-01 1.0E+00 1.0E+01
ec
nat
sis
erm
umi
xa
mf
oFI
D
Loading rate, δ (m/s)
ρ =0%, a/d=1.4
ρg=2. 4 %
ρg=1. 27 %
a
1.0
1.1
1.2
1.3
1.4
1.5
1.6
1.7
1.8
1.0E-02 1.0E-01 1.0E+00 1.0E+01
ec
nat
sis
e rm
umi
xa
mf
oFI
D
Loading rate, δ (m/s)
ρ =0.42 %, a/d=1.4
ρg=2. 4 %
ρg=1.27 %
1.0
1.1
1.2
1.3
1.4
1.5
1.6
1.7
1.0E-02 1.0E-01 1.0E+00 1.0E+01
ec
nat
sis
e rm
umi
xa
mf
oFI
D
Loading rate, δ (m/s)
ρ =0.84 %, a/d=1.4
ρg=2. 4 %
ρg=1. 27 %
1.0
1.2
1.4
1.6
1.8
2.0
2.2
2.4
1.0E-02 1.0E-01 1.0E+00 1.0E+01
ec
na t
sis
e rm
umi
xa
mf
oFI
D
Loading rate, δ (m/s)
ρ =0%, a/d=1.9
b
1.0
1.1
1.2
1.3
1.4
1.5
1.6
1.0E-02 1.0E-01 1.0E+00 1.0E+01
ec
nat
sis
e rm
umi
xa
mf
oF I
D
Loading rate, δ (m/s)
ρ =0.42 %, a/d=1.9
All side cover 40 mm
Fig. 15. General schematic diagram of RC deep beam.
nder four different rates of loading conditions. It was found thathe mean, and coefficient of variation, of the predicted to experi-
ental shear resistance was 1.04 and 0.04, respectively, showing good correlation between the FE simulation and experimentalesults.
.2. Crack profiles on side surface of RC deep beams
The damage of the beams obtained from numerical simula-ion is shown by plotting the fringes of effective plastic strain.hese effective plastic strain contours reveal the strain localiza-ion where failure propagates. Fig. 14 shows the crack pattern ofhe beams of the present study compared with the damage plotf numerical simulation results. From these comparisons, it can beeen that the damage plot of numerical simulation results can cap-ure the experimental crack profiles under varying loading quiteatisfactorily.
. Parametric study
.1. Numerical simulation case studies
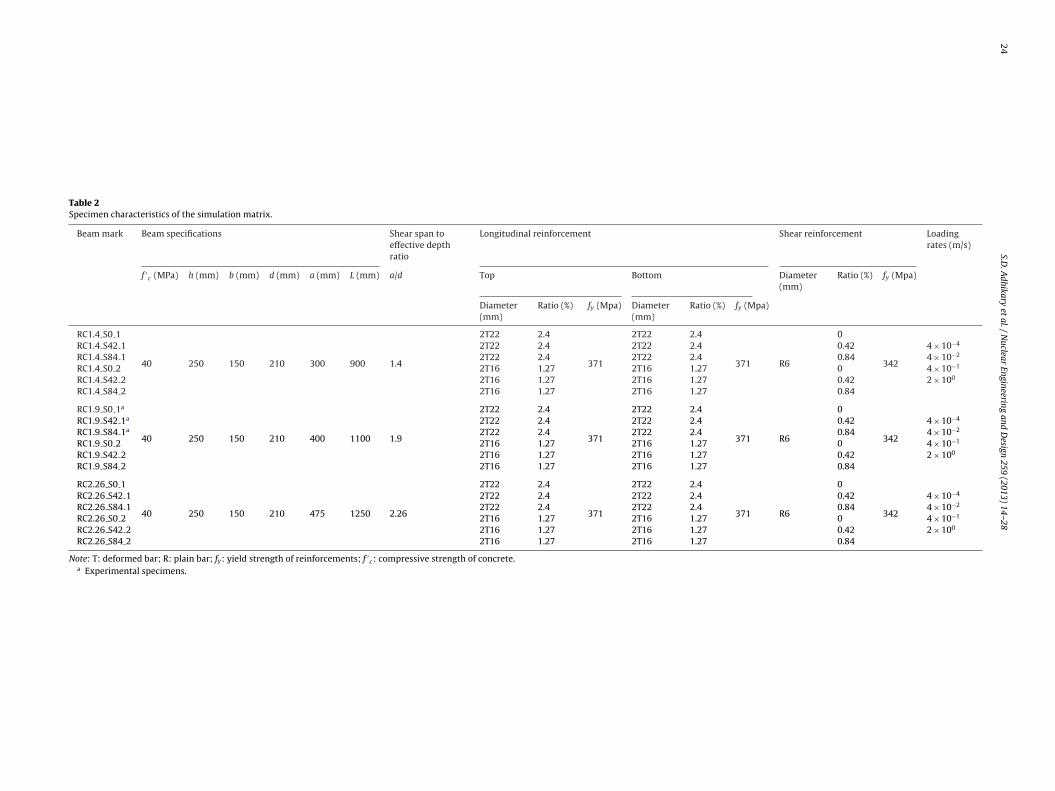
After verification of the FE model against the experimentalesults, this section presents a parametric investigation to cap-ure more information about the behavior of RC deep beams underarying loading rates. The response was studied by varying keyarameters such as shear span to effective depth ratios (a/d: 1.4,.9 and 2.26), longitudinal reinforcement ratios (�g: 2.4% and.27%), transverse reinforcement ratios (�v: 0%, 0.42%, and 0.84%)nd loading rates (ı: 4 × 10⁻⁴, 4 × 10⁻², 4 × 10⁻¹ and 2 × 100 m/s).ig. 15 illustrates the general schematic diagram of the beams andable 2 summarizes the specimen characteristics of the simulationatrix.
.2. Effect of longitudinal reinforcement ratio
Fig. 16 illustrates the effect of the longitudinal reinforcementatio on DIF of maximum resistance under varying loading rates.here were three types of beams in terms of their slenderness ratioa/d: 1.4, 1.9 and 2.26). Fig. 16 shows that for specimens having/d 2.26 and without transverse reinforcements, there is no signif-cant difference in DIF whereas for deep beam having a/d 1.4 and.9, DIF increases with the increment of longitudinal reinforcementatio. However, specimens having transverse reinforcements, DIFas observed to be on the higher side with low longitudinal rein-
orcement ratio (1.27%) of the RC beams at low, medium and highoading rates. This means that although the ultimate shear resis-ance is low in RC deep beams with low longitudinal reinforcementatio for all loading rates, the rate of increment of ultimate loadarrying capacity was higher as compared to beams having highmount of longitudinal reinforcements.
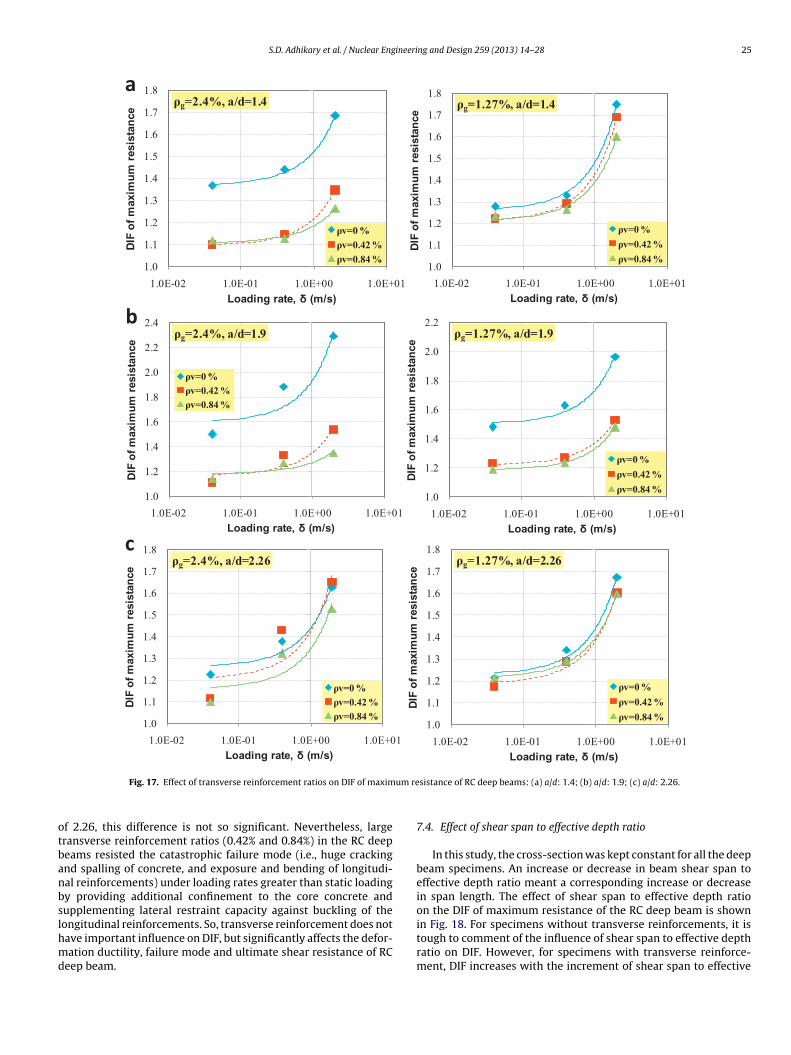
.3. Effect of transverse reinforcement ratio
Fig. 17 shows the influence of transverse reinforcement on DIFf maximum resistance under varying loading rates. Specimens
ng and Design 259 (2013) 14– 28 23
without transverse reinforcements but with a shear span to effec-
1.0E-02 1.0E-01 1.0E+00 1.0E+01
Loading rate, δ (m/s)
Fig. 16. Effect of longitudinal reinforcement ratios on DIF of maximum resistanceof RC deep beams: (a) a/d: 1.4; (b) a/d: 1.9; (c) a/d: 2.26.
24S.D
. A
dhikary et
al. /
Nuclear
Engineering and
Design
259 (2013) 14– 28
Table 2Specimen characteristics of the simulation matrix.
Beam mark Beam specifications Shear span toeffective depthratio
Longitudinal reinforcement Shear reinforcement Loadingrates (m/s)
f ′c (MPa) h (mm) b (mm) d (mm) a (mm) L (mm) a/d Top Bottom Diameter
(mm)Ratio (%) fy (Mpa)
Diameter(mm)
Ratio (%) fy (Mpa) Diameter(mm)
Ratio (%) fy (Mpa)
RC1.4 S0 1
40 250 150 210 300 900 1.4
2T22 2.4
371
2T22 2.4
371 R6
0
342
RC1.4 S42 1 2T22 2.4 2T22 2.4 0.42 4 × 10⁻⁴
RC1.4 S84 1 2T22 2.4 2T22 2.4 0.84 4 × 10⁻²
RC1.4 S0 2 2T16 1.27 2T16 1.27 0 4 × 10⁻¹
RC1.4 S42 2 2T16 1.27 2T16 1.27 0.42 2 × 100
RC1.4 S84 2 2T16 1.27 2T16 1.27 0.84
RC1.9 S0 1a
40 250 150 210 400 1100 1.9
2T22 2.4
371
2T22 2.4
371 R6
0
342
RC1.9 S42 1a 2T22 2.4 2T22 2.4 0.42 4 × 10⁻⁴
RC1.9 S84 1a 2T22 2.4 2T22 2.4 0.84 4 × 10⁻²
RC1.9 S0 2 2T16 1.27 2T16 1.27 0 4 × 10⁻¹
RC1.9 S42 2 2T16 1.27 2T16 1.27 0.42 2 × 100
RC1.9 S84 2 2T16 1.27 2T16 1.27 0.84
RC2.26 S0 1
40 250 150 210 475 1250 2.26
2T22 2.4
371
2T22 2.4
371 R6
0
342
RC2.26 S42 1 2T22 2.4 2T22 2.4 0.42 4 × 10⁻⁴
RC2.26 S84 1 2T22 2.4 2T22 2.4 0.84 4 × 10⁻²
RC2.26 S0 2 2T16 1.27 2T16 1.27 0 4 × 10⁻¹
RC2.26 S42 2 2T16 1.27 2T16 1.27 0.42 2 × 100
RC2.26 S84 2 2T16 1.27 2T16 1.27 0.84
Note: T: deformed bar; R: plain bar; fy: yield strength of reinforcements; f ′c: compressive strength of concrete.
a Experimental specimens.
S.D. Adhikary et al. / Nuclear Engineering and Design 259 (2013) 14– 28 25
1.0
1.1
1.2
1.3
1.4
1.5
1.6
1.7
1.8
1.0E-02 1.0E-01 1.0E+00 1.0E+01
ec
nat
sis
erm
umi
xa
mf
oFI
D
Loading rate, δ (m/s)
ρg=2.4%, a/d=1.4
ρv=0 %
ρv=0. 42 %
ρv=0. 84 %
a
1.0
1.1
1.2
1.3
1.4
1.5
1.6
1.7
1.8
1.0E-02 1.0E-01 1.0E+00 1.0E+01
ec
na t
sis
erm
umi
xa
mf
oFI
D
Loading rate, δ (m/s)
ρg=1.27 %, a/d=1.4
ρv=0 %
ρv=0. 42 %
ρv=0. 84 %
1.0
1.2
1.4
1.6
1.8
2.0
2.2
2.4
1.0E-02 1.0E-01 1.0E+00 1.0E+01
ec
nat
sis
erm
umi
xa
mf
oFI
D
Loading rate, δ (m/s)
ρg=2.4%, a/d=1.9
ρv=0 %
ρv=0. 42 %
ρv=0. 84 %
b
1.0
1.2
1.4
1.6
1.8
2.0
2.2
1.0E-02 1.0E-01 1.0E+00 1.0E+01
ec
na t
sis
e rm
umi
xa
mf
oFI
D
Loading rate, δ (m/s)
ρg=1.27%, a/d=1.9
ρv=0 %
ρv=0. 42 %
ρv=0. 84 %
1.0
1.1
1.2
1.3
1.4
1.5
1.6
1.7
1.8
1.0E-02 1.0E-01 1.0E+00 1.0E+01
ec
nat
sis
erm
umi
xa
mf
oFI
D
Loading rate, δ (m/s)
ρg=2.4%, a/d=2.26
ρv=0 %
ρv=0. 42 %
ρv=0. 84 %
c
1.0
1.1
1.2
1.3
1.4
1.5
1.6
1.7
1.8
1.0E-02 1.0E-01 1.0E+00 1.0E+01
ec
nat
sis
erm
umi
xa
mf
oFI
D
Loading rate, δ (m/s)
ρg=1.27 %, a/d=2.26
ρv=0 %
ρv=0. 42 %
ρv=0. 84 %
um re
otbanbslhmd
Fig. 17. Effect of transverse reinforcement ratios on DIF of maxim
f 2.26, this difference is not so significant. Nevertheless, largeransverse reinforcement ratios (0.42% and 0.84%) in the RC deepeams resisted the catastrophic failure mode (i.e., huge crackingnd spalling of concrete, and exposure and bending of longitudi-al reinforcements) under loading rates greater than static loadingy providing additional confinement to the core concrete andupplementing lateral restraint capacity against buckling of theongitudinal reinforcements. So, transverse reinforcement does not
ave important influence on DIF, but significantly affects the defor-ation ductility, failure mode and ultimate shear resistance of RCeep beam.
sistance of RC deep beams: (a) a/d: 1.4; (b) a/d: 1.9; (c) a/d: 2.26.
7.4. Effect of shear span to effective depth ratio
In this study, the cross-section was kept constant for all the deepbeam specimens. An increase or decrease in beam shear span toeffective depth ratio meant a corresponding increase or decreasein span length. The effect of shear span to effective depth ratioon the DIF of maximum resistance of the RC deep beam is shownin Fig. 18. For specimens without transverse reinforcements, it is
tough to comment of the influence of shear span to effective depthratio on DIF. However, for specimens with transverse reinforce-ment, DIF increases with the increment of shear span to effective
26 S.D. Adhikary et al. / Nuclear Engineering and Design 259 (2013) 14– 28
1.0
1.2
1.4
1.6
1.8
2.0
2.2
2.4
1.0E-02 1.0E-01 1.0E+00 1.0E+01
ec
nat
sis
erm
umi
xa
mf
oFI
D
Loading rate, δ (m/ s)
ρg= 2.4%, ρv= 0%,
a/d=1.4
a/d=1.9
a/d=2. 26
a
1.0
1.1
1.2
1.3
1.4
1.5
1.6
1.7
1.8
1.0E-02 1.0E-01 1.0E+00 1.0E+01
ec
nat
sis
erm
umi
xa
mf
oF I
D
Loading rate, δ (m/ s)
ρg= 2.4%, ρv= 0.42 %,
a/d=1.4
a/d=1.9
a/d=2. 26
1.0
1.1
1.2
1.3
1.4
1.5
1.6
1.0E-02 1.0E-01 1.0E+00 1.0E+01
ec
nat
sis
erm
umi
xa
mf
oFI
D
Loading rate, δ (m/ s)
ρg= 2.4%, ρv= 0.84 %,
a/d=1.4
a/d=1.9
a/d=2. 26
1.0
1.2
1.4
1.6
1.8
2.0
2.2
1.0E-02 1.0E-01 1.0E+00 1.0E+01
ec
na t
sis
erm
umi
xa
mf
oFI
D
Loading rate, δ (m/ s)
ρg= 1.27 %, ρv= 0%,
a/d=1.4
a/d=1.9
a/d=2. 26
b
1.0
1.1
1.2
1.3
1.4
1.5
1.6
1.7
1.8
1.0E-02 1.0E-01 1.0E+00 1.0E+01
ec
nat
sis
erm
umi
xa
mf
oFI
D
Loading rate, δ (m/ s)
ρg= 1.27 %, ρv= 0.42 %,
a/d=1.4
a/d=1.9
a/d=2. 26
1.0
1.1
1.2
1.3
1.4
1.5
1.6
1.7
1.0E-02 1.0E-01 1.0E+00 1.0E+01
ec
nat
sis
erm
umi
xa
mf
oFI
D
Loading rate, δ (m/ s)
ρg= 1.27 %, ρv= 0.84 %,
a/d=1.4
a/d=1.9
a/d=2. 26
Fig. 18. Effect of shear span to effective depth ratios on DIF of maximum resistance of RC deep beams: (a) �g: 2.4%; (b) �g: 1.27%.

S.D. Adhikary et al. / Nuclear Engineering and Design 259 (2013) 14– 28 27
1.0
1.1
1.2
1.3
1.4
1.5
1.6
1.7
1.8
1.0E-02 1.0E-01 1.0E+00 1.0E+01
ec
nat
sis
erm
umi
xa
mf
oFI
D
Loading rate, δ (m/s)
ρv=0%, a/d=1.4
ρg=2.4 % (Analysis)
ρg=1. 27 % ( Analysis)
ρg=2. 4 % ( Equat ion)
ρg=1. 27 % ( Equat ion)
a
1.0
1.2
1.4
1.6
1.8
2.0
2.2
2.4
1.0E-02 1.0E-01 1.0E+00 1.0E+01
ec
nat
sis
erm
um i
xa
mf
oFI
D
Loading rate, δ (m/s)
ρv=0%, a/d=1.9
ρg=2. 4 % (Analysis)
ρg=1.27 % ( Analysis)
ρg=2. 4 % (E quat ion)
ρg=1. 27 % (E quat ion)
1.0
1.1
1.2
1.3
1.4
1.5
1.6
1.7
1.8
1.9
1.0E-02 1.0E-01 1.0E+00 1.0E+01
ec
nat
sis
erm
umi
xa
mf
oFI
D
Loading rate, δ (m/s)
ρv=0.42%, a/d=1.9
ρg=2. 4 % (Analysis)
ρg=1. 27 % (Analysis)
ρg=2. 4 % (E quat ion)
ρg=1. 27 % (E quat ion)
b
1.0
1.1
1.2
1.3
1.4
1.5
1.6
1.0E-02 1.0E-01 1.0E+00 1.0E+01
ec
nat
sis
erm
umi
xa
mf
oF I
D
Loading rate, δ (m/s)
ρv=0.84 %, a/d=1.9
ρg=2. 4 % ( Analysis)
ρg=1. 27 % ( Analysis)
ρg=2. 4 % ( Equat ion)
ρg=1.27 % (Equ ation)
1.0
1.1
1.2
1.3
1.4
1.5
1.6
1.7
1.8
1.0E-02 1.0E-01 1.0E+00 1.0E+01
ec
nat
sis
erm
umi
xa
mf
oFI
D
Loading rate, δ (m/s)
ρv=0.42 %, a/d=1.4
ρg=2.4 % (Analysis)
ρg=1.27 % (Analysis)
ρg=2.4 % (Equation)
ρg=1.27 % (Equat ion)
1.0
1.1
1.2
1.3
1.4
1.5
1.6
1.7
1.8
1.9
2.0
1.0E-02 1.0E-01 1.0E+00 1.0E+01
ec
nat
s is
erm
umi
xa
mf
oFI
D
Loading rate, δ (m/s)
ρv=0.42 %, a/d=2.26
ρg=2.4 % (Analysis)
ρg=1.27 % (Analysis)
ρg=2.4 % (Equation)
ρg=1.27 % (Equation)
a) wit
da
7r
s
Fig. 19. Comparisons of numerical results with proposed equations: (
epth ratio for all loading rates, except for a few cases of lowermount of longitudinal reinforcement ratio.
.5. Proposed equations for estimating DIF of maximum
esistance of RC deep beams at a wide range of loading ratesParametric study through numerical simulation revealed theignificance of parameters that affect the DIF of RC deep beams
hout transverse reinforcements; (b) with transverse reinforcements.
under varying loading rates. Two empirical equations were pro-posed through multivariable regression analysis in terms of variousparameters to predict the DIF. The empirical equation for beamswithout transverse reinforcements is expressed as follows:
DIF =[
0.45 + 0.09�g + 0.48(
a
d
)]e[0.30−0.05�g−0.05(a/d)]ı (5)
2 ineeri
v
D
wstroy
8
c
1
2
3
4
5
8 S.D. Adhikary et al. / Nuclear Eng
The other empirical equation for the case of beams having trans-erse reinforcements is depicted as follows:
IF =[
1.25 − 0.04�g − 0.13�v + 0.05(
a
d
)]
×e[0.22−0.03�g−0.17�v+0.03(a/d)]ı (6)
Examples presenting the comparison of proposed equationsith the numerical analysis results are presented in Fig. 19. The
olid and dotted lines in each plot denote the proposed equa-ions, while the scatter data points represent the numerical analysisesults. After inspecting the plots, it can be addressed that for mostf the cases, the proposed equations matched the numerical anal-sis results within an acceptable accuracy.
. Conclusions
Based on the results presented in this study, the following con-lusions were drawn:
. The dynamic shear resistance of RC deep beams was found toincrease as the loading rates were increased. The ultimate shearresistance also increased with the increment of shear reinforce-ment ratios. Shear reinforcements had some beneficial effectin increasing the stiffness of deep beams under higher load-ing rates as compared to static loading. However, for specimenswith shear reinforcements, the stiffness remains almost samefor loading rates higher than static. Moreover, it was observedthat the slope of the post-peak branch (i.e., descending branch)of the load–midspan deformation curve increased with increas-ing shear reinforcement ratio. The influence of loading rate onthe DIF of maximum resistance is more significant for beamswithout transverse reinforcements as compared to those hav-ing shear reinforcements. Peak strain rate was amplified in oneorder of magnitude (approximately, 10 times) as the loadingrates progressed from low to high.
. Shear compression and/or diagonal splitting type failure wasobserved in all specimens irrespective of applied concentratedloading rates at their midspan, however much ductile behav-ior was perceived due to the increment of shear reinforcementratios under any loading rate.
. The simplified truss model analysis results demonstrated thatit could predict the experimental dynamic shear resistance andthe load–deformation response up to ultimate resistance undervarying loading rates quite satisfactorily.
. Transverse reinforcement does not have important influence onDIF of maximum resistance, but significantly affect the deforma-tion ductility, failure mode and ultimate shear resistance of RCdeep beam. Moreover, high amount of transverse reinforcementratio resisted the catastrophic failure mode under loading rategreater than static loading by providing additional confinementto the core concrete.
. Two empirical equations were proposed in terms of variousparameters by multivariable regression analysis to predict theDIF of maximum resistance of the RC deep beams (with andwithout transverse reinforcements) under varying loading rates.
ng and Design 259 (2013) 14– 28
Comparison of the proposed equations with numerical analysisresults showed that the proposed curves can delineate the incli-nation of the DIF under varying loading rates within a reasonableaccuracy. Therefore, these two equations can be useful in esti-mating the DIF of RC deep beam at a wide range of loading ratesduring preliminary investigation. However, future experimentalinvestigation of RC deep beams under varying loading rates isindeed necessary and should consider other parameters such asvarious grades of concrete and steel reinforcing bars for furtherincorporation in the proposed equations.
References
ACI Committee 318, 1999. Building Code Requirements for Structural Concrete (ACI318-99) and Commentary. American Concrete Institute, Farmington Hills, MI.
ACI Committee 318, 2008. Building Code Requirements for Structural Concrete (ACI318-08) and Commentary. American Concrete Institute, Farmington Hills, MI.
Adhikary, S.D., Li, B., Fujikake, K., 2012. Dynamic behavior of reinforced concretebeams under varying rates of concentrated loading. Int. J. Impact Eng. 47,24–38.
Bhatti, A.Q., Kishi, N., Mikami, H., Ando, T., 2009. Elasto-plastic impact responseanalysis of shear-failure type RC beams with shear rebars. J. Mater. Des. 30,502–510.
CIRIA Guide 2, 1977: The Design of Deep Beams in Reinforced Concrete. Ove Arup654.
Fujikake, K., Li, B., Soeun, S., 2009. Impact response of reinforced concrete beam andits analytical evaluation. ASCE J. Struct. Eng. 135 (August (8)), 938–950.
Khoo, J.H., Li, B., 2007. Modeling of reinforced concrete sub-frame under cyclic loadreversals. J. Earthquake Eng. 11 (2), 215–230.
Kishi, N., Nakano, O., Matsuoka, K.G., Ando, T., 2001. Experimental study on ulti-mate strength of flexural-failure-type RC beams under impact loading. In:Transactions, 16th International Conference on Structural Mechanics in ReactorTechnology (SMiRT), Washington, DC.
Kishi, N., Mikami, H., Matsuoka, K.G., Ando, T., 2002. Impact behavior of shear-failuretype RC beams without shear rebar. Int. J. Impact Eng. 27, 955–968.
Kulkarni, S.M., Shah, S.P., 1998. Response of reinforced concrete beams at high strainrates. ACI Struct. J. 95 (6), 705–715.
Li, B., Tran, C.T.N., 2008. Reinforced concrete beam analysis supplementing concretecontribution in truss model. Eng. Struct. 30 (11), 3285–3294.
LS-DYNA, 2007. Keyword User’s Manual, Version 971. LST Corp., USA.Malvar, L.J., 1998. Review of static and dynamic properties of steel reinforcing bars.
ACI Mater. J. 95 (5), 609–616.Malvar, L.J., Crawford, J.E., Wesevich, J.W., Simons, D., 1997. A plasticity concrete
material model for DYNA3D. Int. J. Impact Eng. 19 (June), 847–873.Mutsuyoshi, H., Machida, A., 1984. Properties and failure of reinforced concrete
members subjected to dynamic loading. Trans. Jpn. Concrete Inst. 6, 521–528.Saatci, S., Vecchio, F., 2009. Nonlinear finite element modeling of reinforced concrete
structures under impact loads. ACI Struct. J. 106 (5), 717–725.Schlaich, J., Schafer, K., Jennewein, M., 1987. Towards a consistent design of struc-
tural concrete. PCI J. 32 (3), 74–150.Schwer, L.E., Malver, L.J., 2005. Simplified concrete modeling with
*Mat Concrete Damage Rel3. JRI LS-DYNA USER WEEK, August.To, N.H.T., Ingham, J.M., Sritharan, S., 2001. Monotonic non-linear strut-and-tie com-
puter models. New Zealand Nat. Soc. Earthquake Eng. Bull. 34 (3), 169–190.Wu, K.-C., Li, B., Tsai, K.-C., 2011. Residual axial compression capacity of localized
blast-damaged RC columns. Int. J. Impact Eng. 38 (January), 29–40.
Satadru Das Adhikary is a PhD candidate in the School of Civil and EnvironmentalEngineering at Nanyang Technological University, Singapore. His research interestsare in reinforced concrete structures, particularly in design for impact resistance.
Bing Li is an Associate Professor in the School of Civil and Environmental Engineer-ing at Nanyang Technological University, Singapore. He received his PhD from theUniversity of Canterbury, New Zealand. His research interests are in reinforced con-crete and precast concrete structures, particularly in design for earthquake and blast
resistance.Kazunori Fujikake is Professor in Department of Civil and Environmental Engi-neering, National Defense Academy, Yokosuka,Japan. His research interests are inreinforced concrete, particularly in design for impact resistance.