nuclear engineering and design - jan leen kloosterman · nuclear engineering and design 239 (2009)...
TRANSCRIPT

Ec
Ma
b
a
ARRA
1
bra1s(lTc
baTto2tvavRa
0d
Nuclear Engineering and Design 239 (2009) 3105–3115
Contents lists available at ScienceDirect
Nuclear Engineering and Design
journa l homepage: www.e lsev ier .com/ locate /nucengdes
valuation of experiments in the AVR with the DALTON–THERMIX coupledode system
. Dinga,∗, B. Boerb, J.L. Kloostermanb, D. Lathouwersb
Institute of Nuclear and New Energy Technology, Tsinghua University, Beijing, 100084, ChinaDelft University of Technology, Mekelweg 15, 2629 JB Delft, The Netherlands
r t i c l e i n f o
rticle history:eceived 9 December 2008eceived in revised form 17 August 2009
a b s t r a c t
The DALTON–THERMIX coupled code system for pebble-bed high temperature reactors was further val-idated by simulation of two dynamic experiments in the AVR. The validation included a rapid mass flow
ccepted 10 September 2009reduction experiment and a depressurized loss of forced cooling (DLOFC) experiment. For the mass flowreduction experiment, the rotational speed of the blowers dropped rapidly from 100% to 50% in 62 s. Inthe DLOFC experiment, the long term behavior (100 h) of the reactor was calculated and compared withexperiments. Besides the transient calculation, each experiment included a coupled steady state calcu-lation to determine the initial condition for the transient. The calculated results of the new code systemagree very well with the experimental ones, from which it is concluded that the code system is very well
optim
suited for the design and. Introduction
The AVR is an experimental high temperature reactor (HTR),uilt as an experiment on industrial scale in Jülich, Germany. Theeactor had 21 years of successful power operation and was used astest bed for various fuels and refueling strategies (Bäumer et al.,990; Ziermann, 1990). Many important experiments to demon-trate the safety features of HTRs were carried out in the AVRKrüger and Ivens, 1985; Gottaut and Krüger, 1990), such as a simu-ation of a depressurized loss of forced cooling (DLOFC) experiment.hese experiments provide valuable data for validation of computerode systems.
In the frame of OECD/NEA PBMR neutronic/thermal–hydraulicenchmark, international cooperations were initiated to developnd validate new code systems to study PBMR (Reitsma et al., 2008;yobeka et al., 2008). A new code system for coupled neutronic andhermal–hydraulic analyses of pebble bed HTRs has been devel-ped and validated at TU-Delft. The code system includes a newD/3D time-dependent diffusion code, DALTON, and an existing 2Dhermal hydraulics code, THERMIX (Struth, 1995). Until now, thealidations mainly focused on 2D neutronics calculations (Boer et
l., 2008, in press). In this paper, the code system has further beenalidated by two experiments of the AVR in the framework of theAPHAEL project (EURATOM, 2004). The two experiments includedrapid mass flow reduction transient and a DLOFC. In the simula-∗ Corresponding author. Tel.: +86 10 6279 5454.E-mail address: [email protected] (M. Ding).
029-5493/$ – see front matter © 2009 Elsevier B.V. All rights reserved.oi:10.1016/j.nucengdes.2009.09.028
ization of future (V)HTR cores.© 2009 Elsevier B.V. All rights reserved.
tion of the mass flow reduction experiment, the rotational speed ofthe blowers dropped rapidly from 100% to 50% and the succeedingpower oscillations were simulated. In the DLOFC simulation, thelong term behavior (100 h) of the reactor without active coolingwas calculated by the code system. To calculate the initial condi-tions of the dynamic simulation, a coupled steady state calculationhas been performed for each experiment.
2. Description of the AVR
The AVR has a compact structural arrangement, as shown inFig. 1. The main technical data are illustrated in Table 1. The steamgenerator, the reactor and the blowers are all in the same reactorpressure vessel. Main features of the AVR are high coolant outlettemperature (950 ◦C), pebble fuel, continuous fuel circulation andhelium coolant.
One difference between the AVR and current HTRs, for examplethe HTR-10 (Gao and Shi, 2002), is the location of the steam gen-erators and the blowers. As shown in Fig. 1, the two blowers of theAVR are located at the bottom of the inner reactor pressure vessel(RPV), and the steam generator is located at the top of the innerreactor pressure vessel, while in the HTR-10 the steam generatorand blower are located outside the reactor pressure vessel. In theAVR the helium flows through the reactor core from the bottom to
the top, and is cooled down in the steam generator. Then, it passesthrough the narrow space between the reactor barrel and the innerreactor pressure vessel, where it cools the reactor barrel and innerreactor pressure vessel. Finally, the helium reaches the blowers andis circulated back into the reactor core again. The steam generator is
3106 M. Ding et al. / Nuclear Engineering and Design 239 (2009) 3105–3115
TT
Fig. 1. Schematic overview of the AVR react
able 1echnical data of the AVR reactor.
Parameters Values Units
Thermal power 46 MWCore
Diameter 3.0 mAverage height 2.8 mAverage power density 2.6 MW/m3
Arrangement Pebble bedNumber of fuel pebbles 110,678Diameter of inner pressure vessel 5.78 mNumber of shut down rods 4Fuel elements
Diameter 6.0 cmComposition LEU, HEU/ThEnrichment 10/16.7, 93 %Mass of U-235 1 gMass of thorium 0, 5/10 g
Coolant blowerNumber 2Speed 400–4000 rpm
or core, adopted from Krüger (1989).
the main and final heat sink during normal operation and for decayheat removal.
The main thermal–hydraulic parameters of the AVR are shown
in Table 2. The reactor can operate in two full load modes: at highoutlet temperature (950 ◦C) and at low outlet temperature (810 ◦C),as shown in the second column of Table 2. The mass flow reduc-tion experiment started from the full load, low outlet temperature(810 ◦C) mode. The DLOFC experiment started from an even lowerTable 2Main thermal–hydraulic parameters of AVR.
Parameters Full power DLOFC experiment Unit
Thermal power 46 4 MWMain coolant (helium)
Pressure 10.8 1.0 barMass flow 16.3/12.7 1.5 kg/sInlet temperature 275/250 183 ◦COutlet temperature 810/950 810 ◦C
Steam generatorMass flow 56 25–20 t/hInlet temperature 110 130–60 ◦COutlet temperature 505 256–67 ◦C

M. Ding et al. / Nuclear Engineering and Design 239 (2009) 3105–3115 3107
ger (1
pp
irtFihcEnrsoF
3
DTMe
(
(2) THERMIX uses the power profile provided by DALTON to cal-culate the 2D temperature profile of the reactor, includingtemperatures of solid structure and helium. It can also providea one-dimensional temperature profile in the fuel pebbles.
Fig. 2. Horizontal A–A section of the AVR core, adopted from reference Krü
ower to be able to depressurize the system. The parameters areresented in the third column in the same table.
Fig. 2 shows the horizontal section of the AVR in the A–A positionn Fig. 1. The line A–A indicates the horizontal cross-section of theeactor core, and will be indicated in the remainder of this article ashe ‘middle of reactor’. An important feature of the AVR is shown inig. 2. That is, the AVR has four so-called ‘reflector noses’ stretchingnto the pebble bed, which are made of graphite. Each reflector noseas a guiding tube for movement of a control rod, which is used toontrol the reactor during normal operation, shutdown and startup.ach guiding tube holds a control rod, which enters the reflectorose from the bottom. Moreover, some thermocouples in the sideeflectors and the reflector noses are also shown in Fig. 2. There areix thermocouples in the side reflectors (2 inner, 2 middle and 2utside), shown in the figure with the letters A, B and C respectively.urthermore, each reflector nose has a thermocouple at the tip (D).
. Coupled neutronic and thermal–hydraulic code system
The dynamic experiments were calculated with theALTON–THERMIX coupled code system presented in Fig. 3.he coupled code system consists of the codes DALTON and THER-
IX, and several other codes and scripts. A simple description ofach component of the code system is given:
1) DALTON is a 2D/3D diffusion code, which is able to performcalculations for steady state and transient modes. It can provide
989) showing the reflector noses and the positions of the thermal couples.
a zone averaged power profile to THERMIX. In the AVR case,DALTON was used in 3D (r, z, �) mode to take the reflector nosesinto account.
Fig. 3. Schematic overview of the coupled code system.

3 ing an
(
(
(
nlrcipcl
TG
In the procedure, the neutronic calculation adopted a 9 energygroups structure. The first 5 groups belong to fast neutrons and theremaining 4 groups are thermal ones. Figs. 4 and 5 show the fastand thermal broad group fluxes in the middle of the reactor core,A–A section as shown in Fig. 1.
108 M. Ding et al. / Nuclear Engineer
3) MIXER calls different scripts, including perl and FORTRANscripts, and several routines of the SCALE5.0 code system(SCALE-5, 2005). MIXER updates the neutron cross-sectionsused in DALTON by linear interpolation of the cross-sections(XS) in the library according to local temperature of the reactorcalculated by THERMIX.
4) A 9 energy groups neutron cross-section (XS) library is createdas a function of the fuel and moderator temperatures by theSCALE5.0 code system. Because AVR is an experimental reac-tor, 9 different types of fuel pebbles are tested and used inits commission. Thus, different type fuel pebbles with differ-ent burn-up classes exist in the reactor core during above twoexperiments. In the calculation of AVR’s XS library, interna-tional cooperators from Germany provided the nuclide dataof the two experiments, which were calculated and dividedinto 9 types, 50 burn-up classes and 141 regions. Based onthe calculated nuclide data, the 9 energy groups neutron XSlibrary was created through TRISO calculation, PEBBLE calcu-lation and REGION calculation. In the TRISO calculation, theresonance shielding calculations were done using BONAMIand NITAWL modules of SCALE5.0 code system after whichone-dimensional discrete ordinates transport calculations weredone using XSDRNPM. As a result, homogenized neutron cross-sections were made for TRISO. The Dancoff factor was usedin the resonance shielding calculation, which took the dou-ble heterogeneity of the fuel design into account (Bende et al.,1999). In the PEBBLE calculation, based on TRISO calculationone-dimensional transport calculations were done in which asphere of TRISO surrounded by a layer of graphite and heliumand resulted in homogenized cross-sections for pebbles. In theREGION calculation, the homogenized pebble cross-sections ofthe different pebble types and different burn-up classes weremixed according to their presence in several core regions, whilethe energy group structure of XS library collapsed from 172groups into 9 groups, as shown in Table 3.
5) MASTER, a perl script, couples the calculations among DAL-TON, THERMIX and MIXER. Its main functions are to controldata exchange among codes, to choose calculation type (steadystate or transient), to determine coupled mode (automatic orfixed time step) during the transient calculation. For example,in the mass flow reduction simulation, a fixed time step waschosen during the transient calculation. However, in the DLOFCsimulation, the transient calculation was uncoupled.
The procedure of the coupled calculation is as follows. First, aeutron XS is generated by linear interpolation in the neutron XS
ibrary according to an assumed temperature distribution of theeactor. The neutron XS library is created in SCALE5.0 before the
oupled calculation. Then, the neutronic calculation is carried outn DALTON on base of the neutron XS. The zone-averaged powerrofile is generated in DALTON and provided to thermal–hydraulicalculation. A new temperature distribution of the reactor is calcu-ated in THERMIX according to the power profile. The neutron XS isable 3roup structure for AVR calculation Massimo, 1976.
Upper (eV) Lower (eV) 9 groups
1.5E107 1.83E105 11.83E105 961 2961 17.6 317.6 3.93 43.93 2.38 52.38 0.414 60.414 0.10 70.10 0.04 80.04 0.0 9
d Design 239 (2009) 3105–3115
updated by linear interpolation according to the new temperatureof the reactor in MIXER. The above calculation is iterated until theconvergent criterion is reached. In the steady coupled calculation,the coupled calculation is finished. In the transient calculation, theabove procedure is only the calculation of a time step.
4. Simulation of mass flow reduction experiment
In March, 1988, a mass flow reduction experiment was per-formed in the AVR. The simulations include a coupled steady stateand a coupled transient calculation.
4.1. Description of the mass flow reduction experiment
In the mass flow reduction experiment, the rotational speed ofthe blowers was linearly reduced from 100% to 50% in 62 s. Andthe mass flow of the primary loop dropped rapidly along with therotational speed of the blowers. During the whole experiment theposition of the control rods was fixed.
Before the start of the experiment, the reactor operated at fullpower, low outlet temperature mode. The second column of Table 2gives the steady state thermal–hydraulic parameters of the AVRbefore the transient. These parameters were used as input data forthe thermal–hydraulics code, THERMIX.
4.2. Coupled steady state calculation of mass flow reductionexperiment
A steady state coupled neutronic and thermal–hydraulic cal-culation was done to obtain the initial conditions of the transientcalculation, since the reactor had operated at full load steady statebefore the mass flow changed in the experiment.
The coupled steady-state calculation was performed accordingto the method described in Section 3. In the calculation, DALTONwas used in 3D mode. Xenon poisoning was not included into thecalculation during the entire dynamic process, because the massflow reduction experiment lasts only 500 s, which is short whencompared to the dynamic effect of Xenon.
Fig. 4. Fast flux (sum of group 1–5) at the start of the mass flow reduction experi-ment.

M. Ding et al. / Nuclear Engineering and Design 239 (2009) 3105–3115 3109
Fe
cTrti
lDtistleiesp
4
ttebtts
TS
decreasing the mass flow and the increasing temperature. The tem-perature continues to increase as a result of heat imbalance afterthe mass flow has stabilized at 50%. Thus, the fission power followsto decrease after the mass flow keeps constant because of the neg-ative reactivity induced by the temperature increase. The average
ig. 5. Thermal flux (sum of group 6–9) at the start of the mass flow reductionxperiment.
The peaks of the thermal flux appear in the graphite noses, inontrast to the fast flux, which is depreciated in the reflector noses.he peaks of the fast flux appear in the zones surrounded by theeflector noses and side reflectors. At the axial position, A–A sec-ion, shown in Figs. 4 and 5, no control rods are present and theirnfluence cannot be observed.
Table 4 gives the measured data (Krüger, 1989) of the full power,ow outlet temperature mode, and the calculated results fromALTON–THERMIX. The measured results can give a good valida-
ion to the calculated results. Because THERMIX is a 2D code system,t is impossible to take into account 3D effects at the top reflectors,uch as helium mixing in the cavity in the top reflectors. Comparinghe top reflectors with the pebble bed, the former is modeled withess degree of accuracy in THERMIX, because THERMIX adopts somempirical formulas from experiments for the flow and heat transfern the pebble bed. As a result, there are larger differences betweenxperimental and calculated data in the top reflectors than in theide reflector whose temperatures are mainly determined by theebble bed.
.3. Transient simulation of mass flow reduction experiment
After the steady state calculation, the succeeding mass flowransient was simulated in the DALTON–THERMIX code system. Inhe calculation, the mass flow of the primary loop dropped lin-arly in 62 s according to the experimental rotational speed of the
lowers. Then, the mass flow was kept constant until the end ofhe calculation period of 500 s. The inlet temperature of the reac-or dropped about 10 ◦ C during the entire experiment because theteam generator maintained its full load operating condition.able 4teady state temperatures of AVR in full power condition.
Locations Exp. (◦C) Cal. (◦C)
Side reflector Middle (Point B in Fig. 2) 635 645Outside (Point C in Fig. 2) 631 629Bottom reflector (Point B in Fig. 1) 287 289Reactor barrel Axial center (Point C in Fig. 1) 335 324Inner RPV Axial center (Point D in Fig. 1) 251 253Helium outlet temperature 810 843 a
a Average helium temperature in cavity above the top reflector.
Fig. 6. Normalized thermal flux during the mass flow reduction experiment.
Fig. 6 illustrates the change of the normalized thermal neutronflux including both the experimental and the calculated data, andthe normalized rotational speed of the blowers that was measuredduring the experiment. The calculated results agree quite well withthe experimental data. The normalized fission power of the reactorshows the same trend as the thermal flux, as shown in Fig. 7.
The change of the fission power is mainly due to the negativetemperature coefficient of the reactor since the control rods arekept at a fixed position during the whole experiment. Fig. 8 showsthe volumetric average temperature of the fuel pebbles in the reac-tor core. The behavior of the fission power can be explained bythe help of Fig. 8. Once the reactor loses part of the coolant flow,the amount of heat generated by fission reaction is more than theamount of the heat carried by the coolant (helium) out of the reac-tor core. The average temperature of the fuel pebbles increasesimmediately because of the heat difference between generationand disappearance in the reactor core. The increasing temperatureinduces negative reactivity, which leads to a decrease of the fis-sion power. The reactor fission power decreases rapidly along with
Fig. 7. Normalized fission power flux during the mass flow reduction experiment.

3110 M. Ding et al. / Nuclear Engineering an
Ft
tsfitttgr8tcc
ttcfarHpobtstqfieMra
tAfio
5(
o
the main part of the experiment was started. In this stage, the blow-ers were shut down and the reactor lost forced cooling. The decayheat curve for full load conditions (46 MW thermal power) wassimulated with the fission power by moving the control rods in thereflector noses. The steam generator operated normally at about
Table 5Steady state temperatures before the DLOFC transient.
Locations Exp. (◦C) Cal. (◦C)
Side reflector Inner (Point A in Fig. 2) 553 560Middle (Point B in Fig. 2) 545 547Outside (Point C in Fig. 2) 535 531
ig. 8. Volumic average temperature of the fuel pebble during the mass flow reduc-ion experiment.
emperature of fuel pebbles stops increasing at the 80th second, ashown in Fig. 8. At this moment, the amount of heat generated byssion reaction is equal to that carried out of the reactor. However,he reactivity of the reactor is not zero because some negative reac-ivity is induced in the last 80 s. Thus, the fission power continueso decrease after the 80th second. As a result, the amount of heatenerated by the fission reaction is less than that carried out of theeactor core. The average temperature begins to decrease after the0th second. The decreasing temperature induces the positive reac-ivity. The negative reactivity induced in the last 80 s is completelyompensated at the 150th second. At this moment, the reactor isritical again and the fission power begins to increase again.
The increasing fission power is still less than the heat carried byhe helium out of the reactor. The average temperature continueso decrease after the 150th second and the decreasing temperatureontinues to induce the positive reactivity. Then, the fission powerollows to increase. At the 250th second, the amount of heat gener-ted by the fission reaction is again equal to that carried out of theeactor. The temperature stops decreasing and begins to increase.owever, the fission power continues to increase because of theositive reactivity induced from the 150th second to the 250th sec-nd. At the 300th second, the positive reactivity is completely offsety the negative reactivity induced by the again increasing tempera-ure after 250 s. After the 300th second, the reactor enters again theubcritical condition and the fission power decreases again. Finally,he fission power and the thermal flux reach a new steady stateuickly after 400 s by feedback of the negative temperature coef-cient. However, the calculated results exists deviation from thexperiment’s, as shown in Fig. 7, because of the defect of 2D THER-IX code system. THERMIX underestimates the heat transfer in the
egion above the core, which does not lead to core under-coolingnd positive reactivity insertion.
The calculations validate the code system reasonably well. Bothhe experiment and the calculations demonstrate the safety of theVR. This reactor has a sufficiently large negative temperature coef-cient to stabilize the reactor power without any interference ofperators.
. Simulation of the depressurized loss of forced coolingDLOFC) experiment
Depressurized loss of forced cooling (DLOFC) is considered asne of the most severe accidents for nuclear power plants. The pri-
d Design 239 (2009) 3105–3115
mary loop of the reactor system loses forced cooling and pressure,which can damage the fuel in most types of nuclear power reac-tors (e.g. PWR). However, the AVR is designed to bear this kind ofaccident without the active intervention of safety systems.
The depressurized loss of forced cooling (DLOFC) was simulatedin the AVR in 1988 (Bäumer et al., 1990) in order to demonstratethe inherent safety and behavior of the AVR. The DLOFC experimenthas been calculated by the DALTON–THERMIX code system and theresults are compared with the experimental data and analyzed inthis section.
5.1. Description of DLOFC experiment
The DLOFC experiment was designed to simulate the AVR losingforced cooling and system pressure at full load condition. But, afast depressurization could not be established for practical reasons.Alternatively, the helium was pumped into the storage vessel by thegas purification system, but that process would have needed aboutthree days. However, after three days, the decay heat level of thereactor would have been substantially lower than in a real loss ofcoolant event, e.g. break of a line of the primary loop. Therefore,the decay heat was simulated by controlling the fission power bymoving the control rods.
The entire experiment was divided into three stages: prepa-ration stage, steady state operation and transient stage. Thepreparation stage included:
(1) The excess reactivity was lowered before the experiment bystopping the feed of new fuel pebbles. This allowed the controlrods to be inserted into the reactor core only partially during thetest, which guaranteed that the power distribution was similarto that in a real full power condition.
(2) The reactor was shut down and the system pressure wasdecreased to 1 bar by pumping out the helium from the primaryloop system into the storage system.
In actual DLOFC accident, the main challenge is to transfer thedecay heat out of the reactor. So, it is feasible and acceptable to sim-ulate the DLOFC accident by above experimental method becausethe whole experiment can meet the object of demonstrating theprocedure of transfer the decay heat out of the reactor.
In the steady state operating stage, the reactor was operatedfor some days at low power level (steam generator power: 4 MW)until the temperature distribution of the full power was obtained.The operating conditions of the AVR are given in Table 2 and thetemperatures of the main components such as the side reflectorsand the reflector noses are shown in the second column of Table 5.
After the temperature distribution of the full power wasachieved, the experiment entered the final transient stage. That is,
Bottom reflector (Point B in Fig. 1) 207 225Reactor barrel Axial center (Point C in Fig. 1) 276 273Inner RPV Axial center (Point D in Fig. 1) 189 193
Top (Point E in Fig. 1) 196 215Discharge tube (Point F in Fig. 1) 198 189

ing and Design 239 (2009) 3105–3115 3111
5twse
5
Dt
(
(
s
ardTms
pdmieotss
tDfiatitcm
ortAitflasp
5
r
Fig. 9. 2D power density profile of the reactor core before DLOFC transient.
M. Ding et al. / Nuclear Engineer
0% of full mass flow in the entire DLOFC experiment accordingo the experimental data in Table 2. The inlet temperature of theater of the steam generator decreased from 130 ◦ C to 60 ◦C. The
team generator kept enough cooling capacity during the entirexperiment and was the main heat sink in the DLOFC experiment.
.2. Coupled steady state calculation of DLOFC experiment
The entire DLOFC experiment has been simulated by theALTON–THERMIX code system, including the steady state and the
ransient. The calculation steps were as follows:
1) The initial steady state of the reactor was calculated by per-forming the coupled neutronics/thermal–hydraulic calculationwith DALTON–THERMIX.
2) The subsequent transient process was simulated using thethermal–hydraulic code system THERMIX from the initial statecalculated in the first step. The simulated decay heat powerobtained in the experiment was directly provided to THERMIXduring the DLOFC transient calculation.
The calculation results of the steady state are presented in thisection, while the transient part is presented in the next section.
In the steady state calculation, the neutronic calculation alsodopted the same 9 energy-groups structure as the mass floweduction experiment. Moreover, the DLOFC experiment has a fluxistribution similar to that of the mass flow reduction experiment.he flux during the DLOFC experiment is lower by one order ofagnitude because the power of the reactor is only 4 MW during
teady state of the DLOFC experiment.DALTON has been used in 3D mode and obtained the 3D flux and
ower profile. The 3D power profile was averaged in the azimuthalirection to generate a 2D profile for THERMIX. The same transfor-ation was adopted in the mass flow reduction experiment. Fig. 9
llustrates the final 2D power density distribution of the DLOFCxperiment used in THERMIX. The power peak appears in the toputer region of the reactor, rather than in the center of the reac-or. The main reason for this is that the zone of the power peak isurrounded by the graphite noses and side reflectors. They provideufficient thermal neutrons.
Fig. 10 shows the 2D temperature distribution of the reac-or before the DLOFC transient, which was calculated by theALTON–THERMIX code system. Fig. 9 only shows the power pro-le in the pebble bed. The 2D temperature distribution includeslmost the whole reactor, the top reflectors, the bottom reflec-ors, side reflectors and the reactor pressure vessels. The reactors cooled by the blowers before the transient, and the position ofhe maximum temperature appears on the top, outer region of theore. It is determined by the corresponding power density and theass flow distribution in the reactor.The third column in Table 5 gives the calculated temperatures
f the reactor by the code system before the DLOFC transient. Theesults calculated by the code system are in good agreement withhe experimental results, shown in the second column in the table.s discussed in Section 4.2, because THERMIX is a 2D code system,
t is impossible to take into account the 3D effects existing at theop and bottom reflectors, such as helium mixing for small massow. As a result, there are larger differences between experimentalnd calculated data in the top and bottom reflectors than in theide reflectors whose temperatures are mainly determined by theebble bed.
.3. Transient simulation of DLOFC experiment
The transient of the DLOFC experiment was started after theeactor reached a full power temperature distribution. The blowers
Fig. 10. Temperature profile of solid structures before DLOFC transient, PB: pebblebed, TC: top cavity, TRG: top reflector graphite, TRC: top reflector carbon, SRC: sidereflector carbon, SRG: side reflector graphite, BSS: bottom support structure, BC:bottom cavity, RB: reactor barrel, GAP: helium gap, BS: biological shield, and IPV:inner pressure vessel.
3 ing and Design 239 (2009) 3105–3115
wz
lrwvastt1dgMcttottl
5
ppitptwct
pserrhaMs
FD
their life. Both are important aspects with regard to reactor
112 M. Ding et al. / Nuclear Engineer
ere shut down and the mass flow of the primary loop reduced toero.
Before the transient, the reactor was cooled by forced circu-ation. The forced convection dominated the heat transfer in theeactor and the steam generator. The conduction and the radiationere of less importance than the convection. After the forced con-
ection stopped, conduction, radiation and local natural convectionll contributed to the heat transfer between the reactor core and theteam generator. Although it is commonly considered as unimpor-ant in a low pressure system, natural convection did contribute tohe heat transfer in the AVR during the DLOFC experiment (Krüger,989; Iyoku et al., 1992). However, because the THERMIX is a 2-imensional code, it cannot take into account the 3-dimensionaleometry of the reactor, especially the ducts in the top reflectors.oreover, THERMIX also underestimates natural convection in the
avity. The deficiency leads to underestimation of the cooling inhe reactor during the transient calculation. In order to simulatehe transient and validate the code system, an artificial mass flowf 0.15 kg/s (Krüger, 1989; Iyoku et al., 1992) was specified in theransient simulation to model the local natural circulation, thoughhe blowers are stopped and the valves are closed in the primaryoop.
.3.1. Maximum surface temperature of fuel pebblesThe temperature of the fuel pebbles is the most important
arameter for the fuel integrity, but a temperature history of theebbles during the experiment is not available. However, the max-
mum surface temperature of the fuel pebbles occurring in theransient was recorded by some monitoring pebbles with a ‘tem-erature wire’. They were put into the reactor core before theransient. The measured maximum temperature of the fuel surfaceas between 1070 ◦ C and 1090 ◦ C in the DLOFC experiment. The
alculated maximum fuel temperature is 1041 ◦C. The maximumemperature is far below the limit temperature of 1600 ◦C.
Fig. 11 illustrates the calculated surface temperature of the fuelebbles at the center of the reactor core (A–A section). The mea-ured maximum surface temperature of the fuel pebbles in thentire transient is also shown as the solid lines in the figure. At theeactor center, the surface temperature of the fuel pebbles increasesapidly and reaches its maximum after 25 h. Because of the large
eat capacity of the reactor, the surface temperature of fuel pebblesfter it loses forced cooling, remains well below the limit of 1600 ◦C.oreover, the calculated temperature difference of the pebble’surface to the pebble’s center during the DLOFC is small (below
ig. 11. Surface temperature of the fuel pebbles at the center of A–A section duringLOFC.
Fig. 12. Calculated temperature of the fuel pebbles at the top of pebble bed duringDLOFC.
2 ◦C) because of the small power of decay heat and good conduc-tivity of the graphite. Then, the temperature decreases slowly untilthe end of the experiment. Because of the poor conductivity of thepebble bed, the temperature at the reactor center increases 500 ◦C,and decreases only slightly later on in the experiment, which is thebasic behavior of the pebble bed, except for the part of the peb-ble bed at the top, as shown in Fig. 12. The top part of the pebblebed can be cooled well by local natural convection, radiation andconduction.
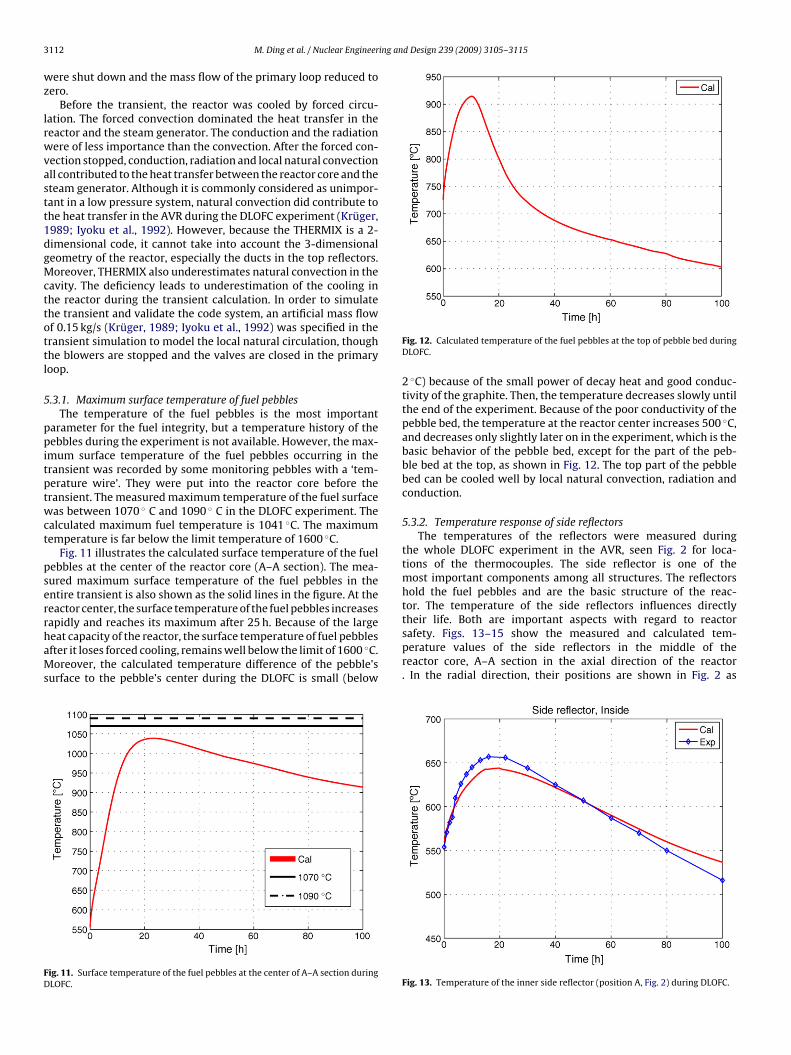
5.3.2. Temperature response of side reflectorsThe temperatures of the reflectors were measured during
the whole DLOFC experiment in the AVR, seen Fig. 2 for loca-tions of the thermocouples. The side reflector is one of themost important components among all structures. The reflectorshold the fuel pebbles and are the basic structure of the reac-tor. The temperature of the side reflectors influences directly
safety. Figs. 13–15 show the measured and calculated tem-perature values of the side reflectors in the middle of thereactor core, A–A section in the axial direction of the reactor. In the radial direction, their positions are shown in Fig. 2 as
Fig. 13. Temperature of the inner side reflector (position A, Fig. 2) during DLOFC.

M. Ding et al. / Nuclear Engineering and Design 239 (2009) 3105–3115 3113
F
PtiT1corStb
5
pctrhFs
F
ig. 14. Temperature of the middle side reflector (position B, Fig. 2) during DLOFC.
oints A, B and C respectively. The temperature of the side reflec-ors increases at the beginning of the transient, because the reactors short of cooling and the decay heat accumulates in the reactor.he side reflectors reach the maximum temperature after about6–22 h according to the experiment. Then, the reactor graduallyools down, discharging the heat to the steam generator and theuter reactor pressure vessel by conduction, radiation and natu-al convection. Compared with the temperature of the center inection 5.3.1, the side reflectors are cooled largely by transferringhe heat to the steam generator and outer reactor pressure vesselecause of its good conductivity.
.3.3. Temperature response of bottom reflectorsFig. 16 shows the temperature of the bottom reflectors. The tem-
erature of the bottom reflectors increases 300 ◦ C after the forcedooling stops. It only decreases slightly after 70 h. Although the bot-om reflectors have a high heat conduction coefficient, the bottom
eflectors are far from the final heat sink in the AVR and the heatas to be removed by other path ways, such as the side reflectors.urthermore, natural circulation in the bottom part of the core ismall compared to that at the top of the reactor core.ig. 15. Temperature of the outside side reflector (position C, Fig. 2) during DLOFC.
Fig. 16. Temperature change of the bottom reflector during DLOFC.
5.3.4. Temperature response of pebble bed near to reflector noseIn the AVR, the reflector noses stretch into the reactor core,
which provide good positions to reflect the behavior of the tem-perature of the pebbles in the AVR core. Some thermal couples arepositioned in the tip of each reflector nose as shown in Fig. 2, posi-tion D. The behavior of the pebble temperature can be estimated bycomparing it with the temperatures of the reflector noses. Fig. 17shows the surface temperature of the pebbles and the tip of thereflector nose in the section A–A. The pebble has the same radialposition as the tip of the reflector nose. They follow the same trend.Because the conductivity of the reflector nose is almost 5–10 timesthat of the pebble bed in the arrange of the temperature from 400 ◦ Cto 900 ◦ C (Iyoku et al., 1992), there exists a large difference betweenthe temperature of the reflector nose and that of the pebble bed,when the pebble bed is cooled by the conduction in the conditionof the DLOFC. Despite of the differences between calculated andexperimental data, the temperatures have a similar trend.
5.3.5. Temperature change pattern of reactor coreFigs. 18–20 illustrate the temperature distributions in the reac-
tor at 5 h, 20 h and 50 h. The final temperature after 100 h of thetransient is shown in Fig. 21. From these figures and Fig. 10, the
Fig. 17. Temperature of pebble bed near to the reflector nose.

3114 M. Ding et al. / Nuclear Engineering and Design 239 (2009) 3105–3115
Fig. 18. Temperature of solid structures after 5 h.
Fig. 19. Temperature of solid structures after 20 h.
Fig. 20. Temperature of solid structures after 50 h.
Fig. 21. Temperature of solid structures after 100 h.

ing an
trtra3cabtbtts
6
sprfhf
dattblslae
mAwtmot
M. Ding et al. / Nuclear Engineer
emperature at the lower part of the reactor core and the bottomeflectors increase quickly at the beginning of the transient becausehe decay heat accumulates and the heat rearranges. Temperatureearrangement dominates the behavior of the reactor at this stagend is more important than the cooling. The process lasts about0 h according to the calculation. Then, the reactor core enters aooling stage, in which the cooling process dominates the temper-ture profile of the reactor. The reactor is gradually cooled downy transferring heat to the steam generator and the outer reac-or pressure vessel. The effect of the two stages is also reflectedy the location and value of the maximum temperature. Its posi-ion moves from outside-top to the center-middle of the core inhe first stage and the value decreases gradually in the secondtage.
. Conclusions
Both experiments and calculations demonstrate the inherentafety characteristics of the AVR, and most probably of other smallebble bed high temperature reactors (HTR) as well. The mass floweduction experiment demonstrates that the AVR can compensateor change of reactivity by temperature change, and that the largeeat capacity of the reactor core can prevent the fuel temperature
rom changing quickly and largely.The AVR can bear the depressurized loss of cooling (DLOFC) acci-
ent by transferring heat out of the reactor by conduction, radiationnd local natural circulation. During a DLOFC, the core undergoeswo different stages. First, the temperature rearrangement ratherhan cooling dominates the process, and a large amount of heat iseing transferred from the top to the bottom in the reactor core. The
arge heat capacity of reactor core can effectively slow down andtop the temperature increase caused by the decay heat. This stageasts about 25–30 h. In the second stage, the reactor transfers theccumulated decay heat to the heat sink, the steam generator andnvironment by conduction, radiation and local natural circulation.
The DALTON–THERMIX code system has been validated by theass flow reduction experiment and the DLOFC experiment in theVR. The results calculated with the new code system agrees very
ell with the experiment values, from which it is concluded thathe code system can effectively be used for the design and opti-ization of new (V)HTR concepts. For a more accurate evaluation
f the two experiments, a 3D code would be needed to calculatehe temperatures in the reflector noses.
d Design 239 (2009) 3105–3115 3115
Acknowledgements
The authors acknowledge the European Union for co-fundingthis project in the framework of the RAPHAEL project (FI6O 516508,WP-CP), and the Forschungszentrum Jülich and the Institut fürKernenergetik und Energiesysteme (IKE) in Stuttgart for providingthe data on the AVR.
References
Bäumer, R., Barnert, H., Baust, E., 1990. AVR: Experimental High Temperature Reac-tor, 21 Years of Successful Operation for a Future Energy Technology. VDI-VerlagGmbH, Düsseldorf.
Bende, E.E., Dam, H., van Hogenbirk, A.H., Kloosterman, J.L., 1999. Analytical cal-culation of the average Dancoff factor for a fuel kernel in a pebble bed hightemperature reactor. Nucl. Sci. Eng. 133 (2), 147–162.
Boer, B., Lathouwers, D., Ding, M., Kloosterman, J.L., 2008. Coupledneutronics/thermal–hydraulics calculations for high temperature reactorswith the DALTON–THERMIX code system. In: International Conference on thePhysics of Reactors (PHYSOR-2008), Interlaken, Switzerland.
Boer, B., Lathouwers, D., Kloosterman, J.L., van der Hagen, T.H.J.J., in press. Validationof the DALTON–THERMIX code system with transient analyses of the HTR-10 andapplication to the PBMR. Nucl. Technol.
EURATOM, 2004. ReActor for Process heat, Hydrogen And Electricity generation(RAPHAEL). Integrated Project of the 6th Framework Programme of the EuratomCommunity.
Gao, Z., Shi, L., 2002. Thermal hydraulic calculation of the HTR-10 for the initial andequilibrium core. Nucl. Eng. Des. 218, 51–64.
Gottaut, H., Krüger, K., 1990. Results of experiments at the AVR reactor. Nucl. Eng.Des. 121, 143–153.
Iyokum, T., Jahn, W., Rehm, W., 1992. Analytical investigation of the AVR loss ofcoolant accident simulation Test-LOCA. Research Center Jülich, KFA-ISR-IB-3.
Krüger, K., 1989. Experimentelle Simulation eines Kühlmittelverlust-Störfalls mitdem AVR-Reaktor. Doctoral Thesis, RWTH-Aachen.
Krüger, K., Ivens, G.P., 1985. Safety related experiences with the AVR reactor. In:Specialists’ Meeting on Safety and Accident Analysis for Gas-cooled Reactors.Oak Ridge, TN, May, pp. 61–70.
Massimo, L., 1976. Physics of High Temperature Reactor. Pergamon, New York, p.93.
Reitsma, F., Han, J., Ivanovb, K., Sartoric, E., 2008. The OECD/NEA/NSC PBMR400MW coupled neutronics thermal hydraulics transient benchmark C steady-stateresults and status. In: Proceedings of the International Conference on the Physicsof Reactors (PHYSOR-2008), Interlaken, Switzerland.
SCALE-5, 2005. Modular Code System for Performing Standardized Computer Anal-ysis for Licensing Evaluations. ORNL, USA.
Struth, S., 1995. Thermix-Direkt: Ein Rechenprogramm zur instationären zweidi-mensionalen simulation thermohydraulischer Transienten. FZ Jülich, Germany.
Tyobeka, B., Pautzc, A., Ivanovb, K., 2008. DORT-TD/THERMIX solutions for theOECD/NEA/NSC PBMR400 MW coupled neutronics thermal hydraulics transientbenchmark. In: Proceedings of the International Conference on the Physics ofReactors (PHYSOR-2008), Interlaken, Switzerland.
Ziermann, E., 1990. Review of 21 years of power operation at the AVR experimentalnuclear power station in Jülich. Nucl. Eng. Des. 121, 135–142.