ntal irfoil - national renewable energy laboratory · ntal irfoil january 1997 ... 78 80 81 84 90...
TRANSCRIPT
Work performed under task number WE71111 0
ntalirfoil
January 1997
NREL technical monitor: James TangIer
National Renewable Energy Laboratory1617 Cole BoulevardGolden, Colorado 80401-3393A national laboratory of the U.S. Department of EnergyManaged by Midwest Research Institutefor the U.s. Department of Energyunder contract No. DE-AC36-83CHlO093
Dan M. SomersAiifoils, IncorporatedState College, Pennsylvania
NREL/SR-440-6918 • UC Category: 1213 • DE97000206
NOTICE
This report was prepared as an account of work sponsored by an agency of the United States government.Neither the United States government nor any agency thereof, nor any of their employees, makes anywarranty, express or implied, or assumes any legal liability or responsibility for the accuracy, completeness,or usefulness of any information, apparatus, product, or process disclosed, or represents that its use wouldnot infringe privately owned rights. Reference herein to any specific commercial product, process, or serviceby trade name, trademark, manufacturer, or otherwise does not necessarily constitute or imply itsendorsement, recommendation, or favoring by the United States government or any agency thereof. The viewsand opinions of authors expressed herein do not necessarily state or reflect those of the United Statesgovernment or any agency thereof.
Available to DOE and DOE contractors from:Office of Scientific and Technical Information (OSTI)P.O. Box 62Oak Ridge, TN 37831
Prices available by calling (423) 576-8401
Available to the public from:National Technicallnforrnation Service (NTIS)U.S. Department of Commerce5285 Port Royal RoadSpringfield, VA 22161(703) 487-4650
#.f.J' Printed on paper containing at least 50% wastepaper. including 20% postconsumer waste
DISCLAIMER
Portions of this document may be illegiblein electronic image products. Images areproduced from the best available originaldocument.
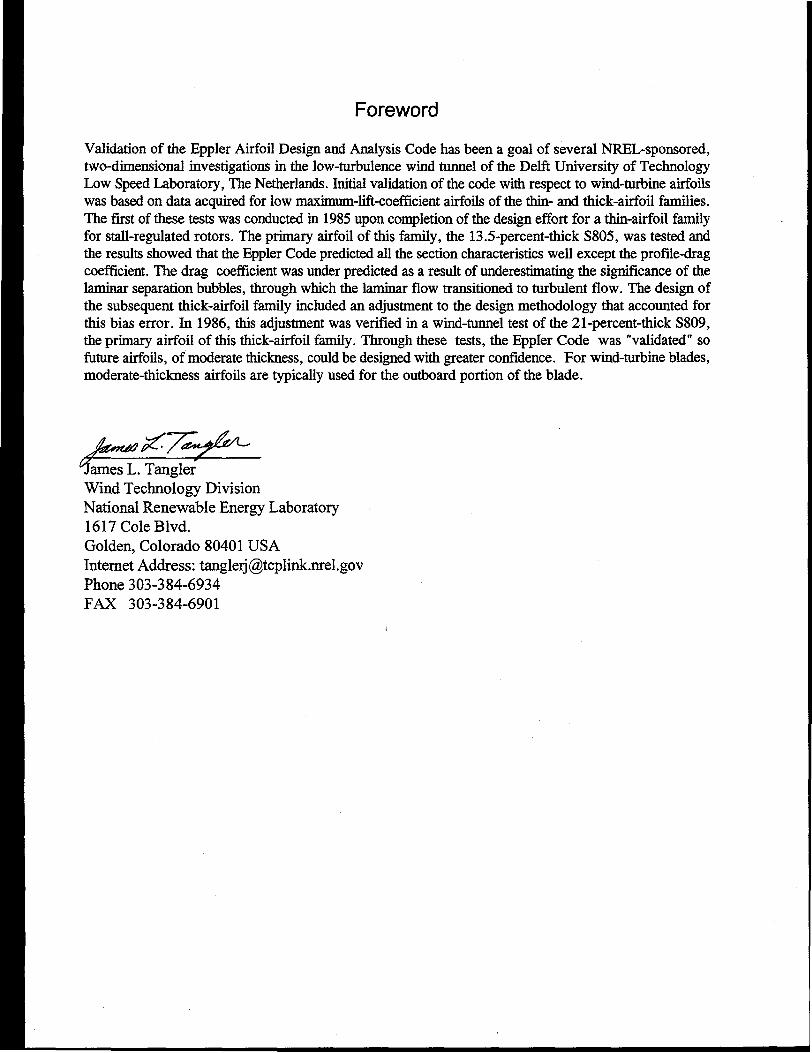
Foreword
Validation of the Eppler Airfoil Design and Analysis Code has been a goal of several NREL-sponsored,two-dimensional investigations in the low-turbulence wind tunnel of the Delft University of TechnologyLow Speed Laboratory, The Netherlands. Initial validation of the code with respect to wind-turbine airfoilswas based on data acquired for low maximum-lift-coefficient airfoils of the thin- and thick-airfoil families.The fIrst of these tests was conducted in 1985 upon completion of the design effort for a thin-airfoil familyfor stall-regulated rotors. The primary airfoil of this family, the 13.5-percent-thick S805, was tested andthe results showed that the Eppler Code predicted all the section characteristics well except the profile-dragcoefficient. The drag coefficient was under predicted as a result of underestimating the signifIcance of thelaminar separation bubbles, through which the laminar flow transitioned to turbulent flow. The design ofthe subsequent thick-airfoil family included an adjustment to the design methodology that accounted forthis bias error. In 1986, this adjustment was verifIed in a wind-tunnel test of the 21-percent-thick 5809,the primary airfoil of this thick-airfoil family. Through these tests, the Eppler Code was "validated" sofuture airfoils, of moderate thickness, could be designed with greater confIdence. For wind-turbine blades,moderate-thickness airfoils are typically used for the outboard portion of the blade.
.~~~tjamesL. TangIerWind Technology DivisionNational Renewable Energy Laboratory1617 Cole Blvd.Golden, Colorado 80401 USAInternet Address: [email protected] 303-384-6934FAX 303-384-6901
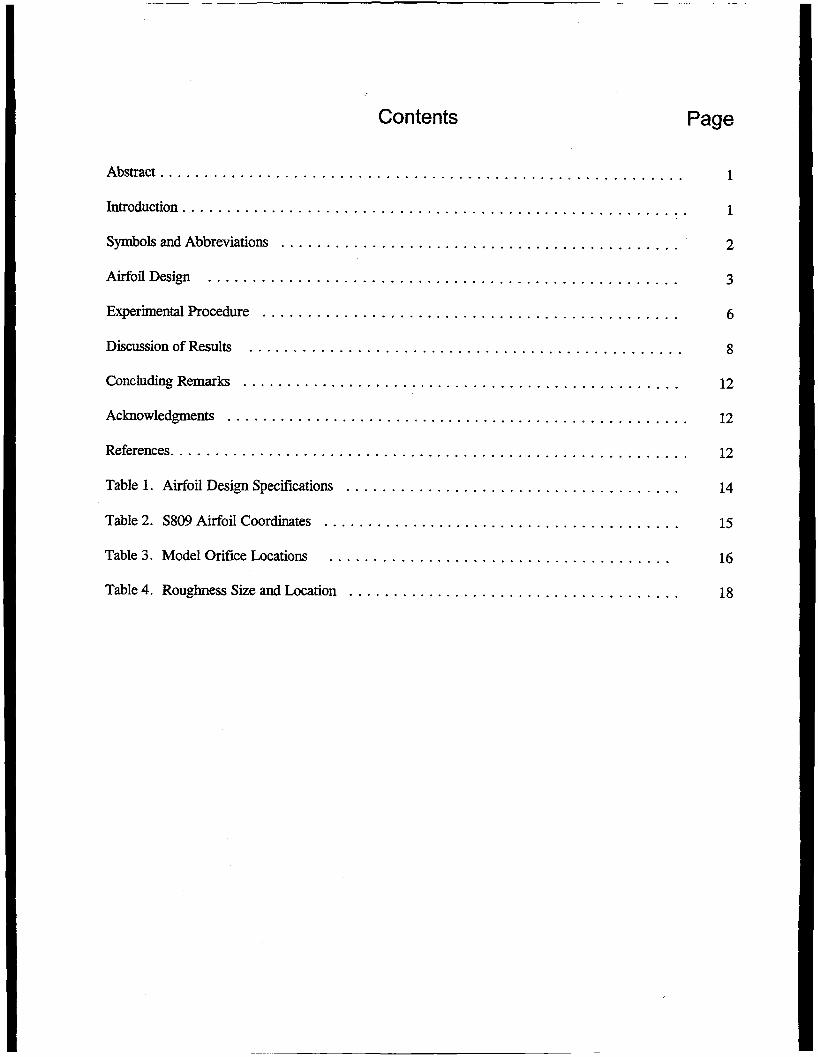
Contents Page
Table 4. Roughness Size and Location .
Table 1. Airfoil Design Specifications .
Table 2. S809 Airfoil Coordinates .
Acknowledgments .
References .
1
1
2
3
6
8
12
12
12
14
15
16
18
............................................................................
................................................................................................
..................................................................................................
Discussion of Results
Concluding Remarks
Abstract .
Introduction . . . . . . . . . . . . . . . . . . . . . . . . . . . . . . . . . . . . . . . . . . . . . . . . . . . . . . . .
Symbols and Abbreviations .
Airfoil Design .
Experimental Procedure .
Table 3. Model Orifice Locations
1.2.3.4.5.6.7.
8.
9.10.11.12.13.14.15.16.17.18.19.20.21.22.
23.
24.
25.
List of Figures
Inviscid pressure distributions .S809 airfoil shape .Delft University of Technology 1.80-x 1.25-m low-speed wind tunnel .Model and wake rakes mounted in test section. All dimensions are in mm . . . . . . . .Photograph of wake rakes mounted on strut . . . . . . . . . . . . . . . . . . . . . . . . . . .Wake rakes ; .Static-pressure, integrating, and total-pressure wake-rake tubes. Alldimensions are in mm .Pressure distributions for R = 2,000,000. Arrows indicate direction ofangle-of-attack change (for determination of hysteresis) .Oil-flow photographs of upper surface for R = 1,000,000 .Oil-flow photographs of upper surface for R = 2,000,000 .Oil-flow photographs of upper surface for R = 3,000,000 .Oil-flow photographs of lower surface for R = 1,000,000 .Oil-flow photographs of lower surface for R = 2,000,000 .Oil-flow photographs of lower surface for R = 3,000,000 .Transition location. Bars extend from beginning to end of transition . . . . . . . . . . .Spanwise drag coefficients for R = 2,000,000 .Section characteristics . . . . . . . . . . . . . . . . . . . . . . . . . . . . . . . . . . . . . . . . . .Effect of roughness on section characteristics .Effect of turbulators on drag coefficients .Effect of turbulators on section characteristics for R = 1,000,000 .Comparison of theoretical and experimental pressure distributions . . . . . . . . . . . . .Comparison of theoretical and experimental section characteristics withtransition free . . . . . . . . . . . . . . . . . . . . . . . . . . . . . . . . . . . . . . . . . . . . . . . . . .Comparison of theoretical and experimental section characteristics withtransition fixed . . . . . . . . . . . . . . . . . . . . . . . . . . . . . . . . . . . . . . . . . . . . . . . . .Comparison of section characteristics of S809 and NACA 4421 airfoilsfor R = 3,000,000 .Comparison of section characteristics of S809 and NACA 23021 airfoilsfor R = 3,000,000 .
Page
192122232425
26
2737414952545658636672788081
84
90
96
97

Design and Experimental Results for the 8809 Airfoil
Dan M. Somers t
March 1989
Abstract
A 21-percent-thick, laminar-flow airfoil, the S809, for horizontal-axis wind-turbine applications, has beendesigned and analyzed theoretically and verified experimentally in the low-turbulence wind tunnel of theDelft University of Technology Low Speed Laboratory, The Netherlands. The two primary objectivesof restrained maximum lift, insensitive to roughness, and low profile drag have been achieved. The airfoilalso exhibits a docile stall. Comparisons of the theoretical and experimental results show good agreement.Comparisons with other airfoils illustrate the restrained maximum lift coefficient as well as the lowerprofile-drag coefficients, thus confinning the achievement of the primary objectives.
Introduction
The majority of the airfoils in use on horizontal-axis wind turbines today were originally developed forairplanes. The design requirements for these airfoils, primarily National Advisory Committee forAeronautics (NACA) and National Aeronautics and Space Administration (NASA) airfoils (refs. 1-6), aresignificantly different from those for wind-turbine airfoils. Accordingly, two sets of thick airfoils weredesigned, using the method of references 7 and 8, specifically for horizontal-axis wind-turbine applications.(See ref. 9.) The major, distinguishing feature between the two sets is the maximum lift coefficients of theairfoils for the outboard portion of the wind-turbine blade. The first set produces relatively low("restrained") maximum lift coefficients outboard whereas the second set produces maximum liftcoefficients outboard that are 0.2 higher than those produced by the first set.
In conjunction with this effort, the primary airfoil (0.75 blade radial station) of the first set was selectedfor experimental verification. In 1986, an investigation was conducted in the low-turbulence wind tunnelof the Delft University of Technology Low Speed Laboratory (ref. 10), The Netherlands, to obtain thebasic, low-speed, two-dimensional aerodynamic characteristics of this airfoil. The results have beencompared with the predictions from the method of references 7 and 8 and also with data from another lowturbulence wind tunnel for other airfoils.
The specific tasks performed under this study are described in Solar Energy Research Institute (SERI)Subcontract Number HK-6-06075-1.
t President, Airfoils, Incorporated, State College, Pennsylvania
1
_.-.-
----------------------------~-- --
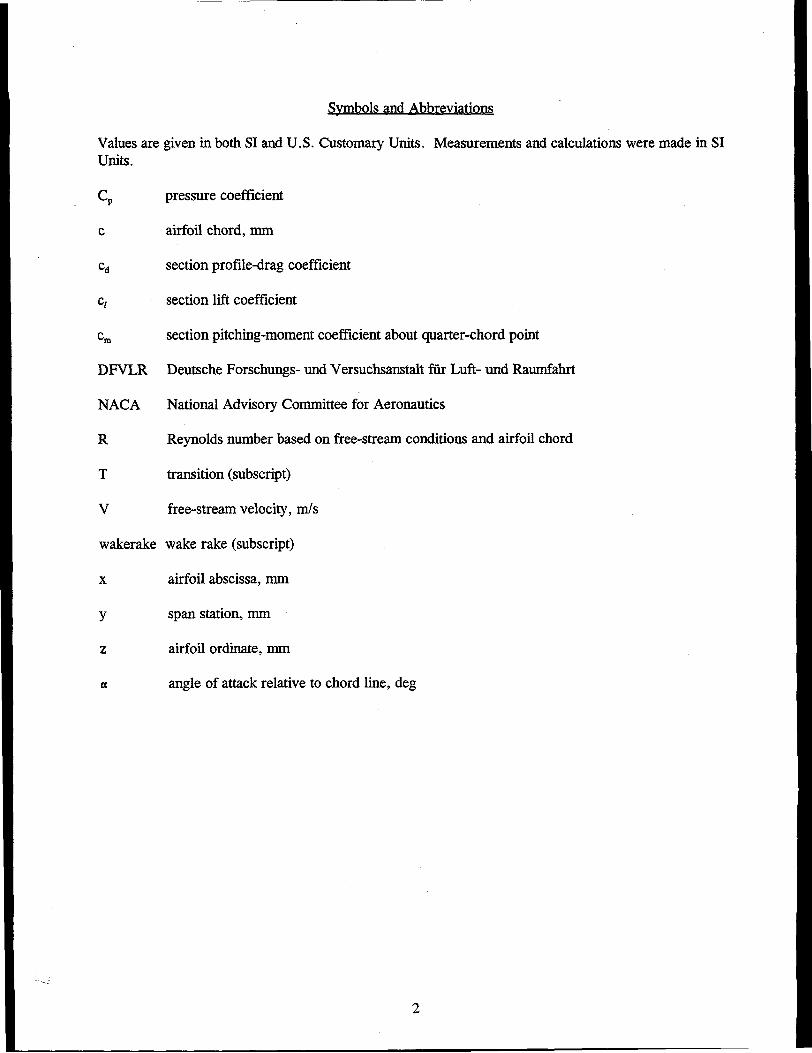
Symbols and Abbreviations
Values are given in both SI and U.S. Customary Units. Measurements and calculations were made in SIUnits.
Cp pressure coefficient
c airfoil chord, mm
Cd section profile-drag coefficient
Ct section lift coefficient
cm section pitching-moment coefficient about quarter-chord point
DFVLR Deutsche Forschungs- und Versuchsanstalt fur Luft- und Raumfahrt
NACA National Advisory Committee for Aeronautics
R Reynolds number based on free-stream conditions and airfoil chord
T transition (subscript)
V free-stream velocity, rnfs
wakerake wake rake (subscript)
x airfoil abscissa, mm
y spansmtion,mm
z airfoil ordinate, mm
IX angle of atmck relative to chord line, deg
2
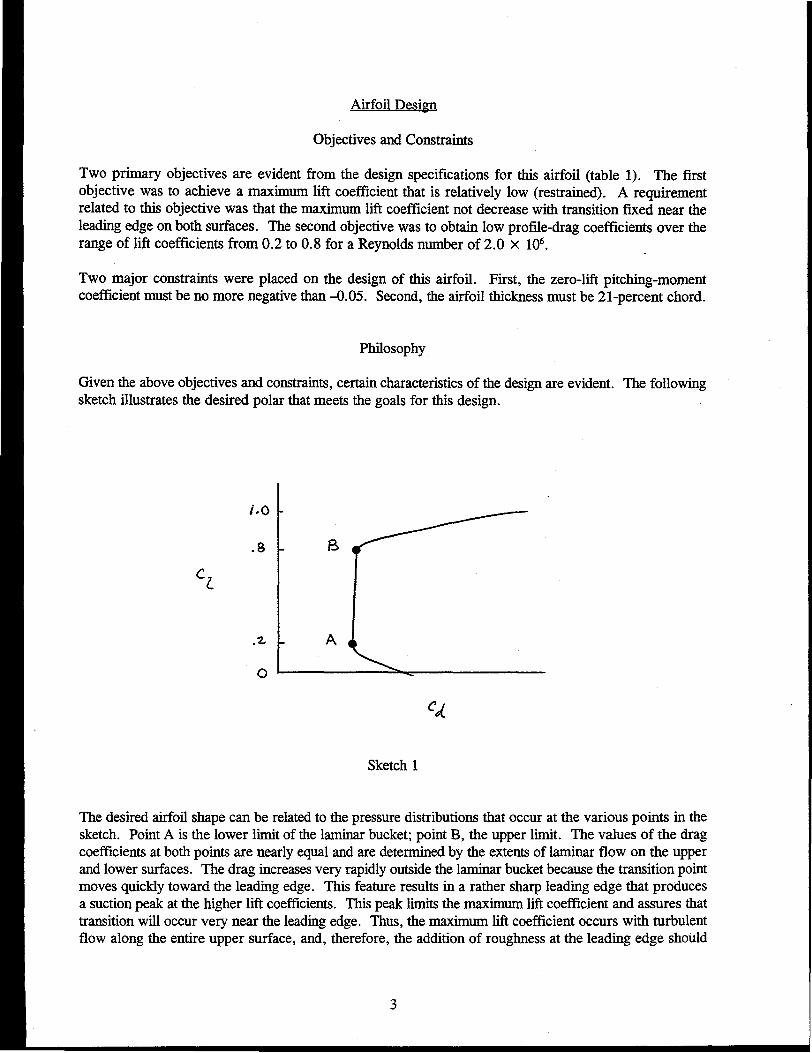
Sketch 1
3
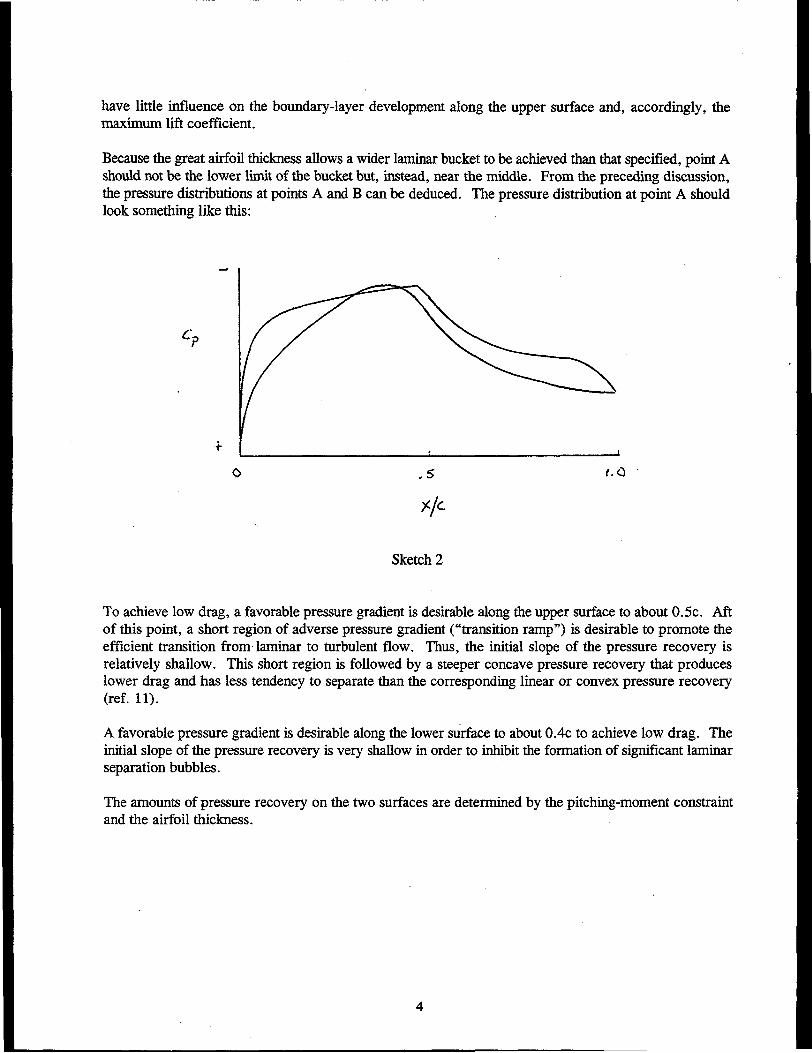
The desired airfoil shape can be related to the pressure distributions that occur at the various points in thesketch. Point A is the lower limit of the laminar bucket; point B, the upper limit. The values of the dragcoefficients at both points are nearly equal and are determined by the extents of laminar flow on the upperand lower surfaces. The drag increases very rapidly outside the laminar bucket because the transition pointmoves quickly toward the leading edge. This feature results in a rather sharp leading edge that producesa suction peak at the higher lift coefficients. This peak limits the maximum lift coefficient and assures thattransition will occur very near the leading edge. Thus, the maximum lift coefficient occurs with turbulentflow along the entire upper surface, and, therefore, the addition of roughness at the leading edge should
o
.2 A
.8 B
1.0
Philosophy
Objectives and Constraints
Airfoil Design
Two major constraints were placed on the design of this airfoil. First, the zero-lift pitching-momentcoefficient must be no more negative than -0.05. Second, the airfoil thickness must be 21-percent chord.
Two primary objectives are evident from the design specifications for this airfoil (table 1). The firstobjective was to achieve a maximum lift coefficient that is relatively low (restrained). A requirementrelated to this objective was that the maximum lift coefficient not decrease with transition fixed near theleading edge on both surfaces. The second objective was to obtain low profile-drag coefficients over therange of lift coefficients from 0.2 to 0.8 for a Reynolds number of 2.0 X 10⁶•
Given the above objectives and constraints, certain characteristics of the design are evident. The followingsketch illustrates the desired polar that meets the goals for this design.
have little influence on the boundary-layer development along the upper surface and, accordingly, themaximum lift coefficient.
Because the great airfoil thickness allows a wider laminar bucket to be achieved than that specified, point Ashould not be the lower limit of the bucket but, instead, near the middle. From the preceding discussion,the pressure distributions at points A and B can be deduced. The pressure distribution at point A shouldlook something like this:
c:?
+
'f./c.
Sketch 2
To achieve low drag, a favorable pressure gradient is desirable along the upper surface to about O.5c. Aftof this point, a short region of adverse pressure gradient ("transition ramp") is desirable to promote theefficient transition from laminar to turbulent flow. Thus, the initial slope of the pressure recovery isrelatively shallow. This short region is followed by a steeper concave pressure recovery that produceslower drag and has less tendency to separate than the corresponding linear or convex pressure recovery(ref. 11).
A favorable pressure gradient is desirable along the lower surface to about OAc to achieve low drag. Theinitial slope of the pressure recovery is very shallow in order to inhibit the formation of significant laminarseparation bubbles.
The amounts of pressure recovery on the two surfaces are determined by the pitching-moment constraintand the airfoil thickness.
4
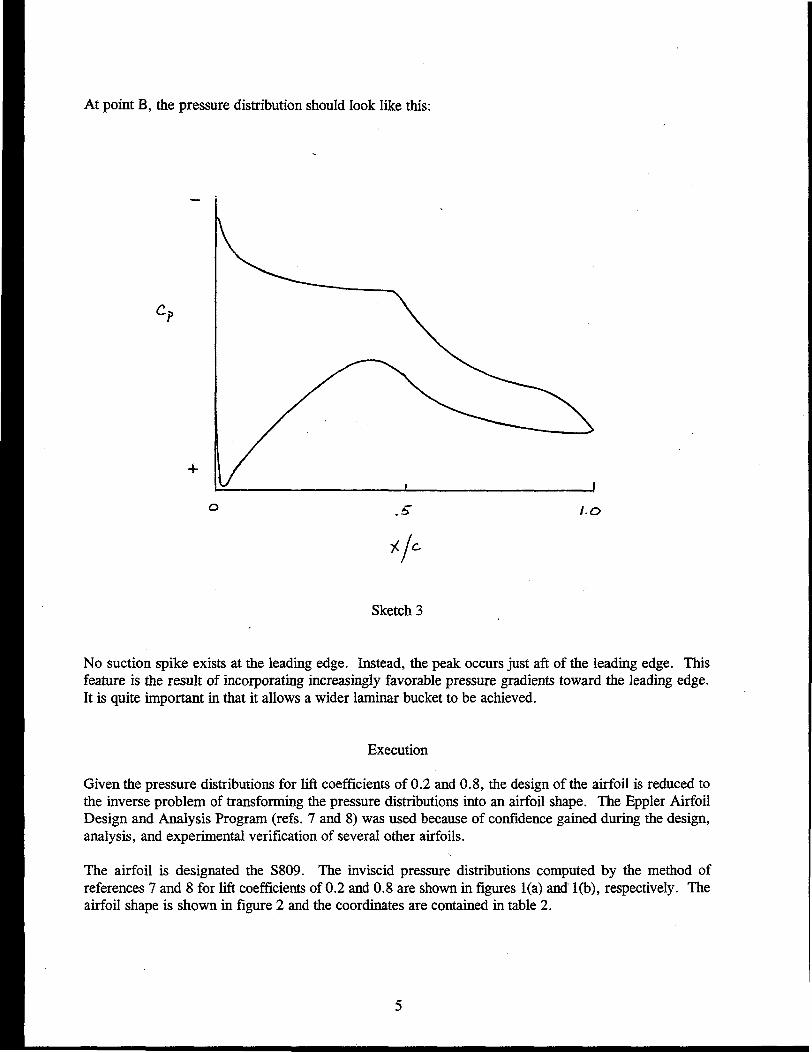
At point B, the pressure distribution should look like this:
+
Sketch 3
No suction spike exists at the leading edge. Instead, the peak occurs just aft of the leading edge. Thisfeature is the result of incorporating increasingly favorable pressure gradients toward the leading edge.It is quite important in that it allows a wider laminar bucket to be achieved.
Execution
Given the pressure distributions for lift coefficients of 0.2 and 0.8, the design of the airfoil is reduced tothe inverse problem of transforming the pressure distributions into an airfoil shape. The Eppler AirfoilDesign and Analysis Program (refs. 7 and 8) was used because of confidence gained during the design,analysis, and experimental verification of several other airfoils.
The airfoil is designated the S809. The inviscid pressure distributions computed by the method ofreferences 7 and 8 for lift coefficients of 0.2 and 0.8 are shown in figures l(a) and"l(b), respectively. Theairfoil shape is shown in figure 2 and the coordinates are contained in table 2.
5
Experimental Procedure
Wind Tunnel
The low-turbulence wind tunnel (ref. 10) of the Delft University of Technology Low Speed Laboratory,The Netherlands, is a closed-throat, single-return, atmospheric tunnel (fig. 3). The turbulence level in thetest section varies from 0.02 percent at 10 mls (33 ft/s) to 0.04 percent at 60 mls (200 ft/s).
The octagonal test section is 180.0 cm (70.87 in.) wide by 125.0 cm (49.21 in.) high. Electrically actuatedturntables provide positioning and attachment for the two-dimensional model. The turntables are flush withthe top and bottom tunnel walls and rotate with the model. The axis of rotation coincided with the quarterchord of the model which was mounted vertically between the turntables. (See fig. 4.) The gaps betweenthe model and the turntables were sealed.
Model
The aluminum, wind-tunnel model was constructed by the Deutsche Forschungs- und Versuchsanstalt fUrLuft- und Raumfahrt e.V. (DFVLR), Braunschweig, Federal Republic of Germany. The model had achord of 600.00 mm (23.622 in.) and a span of 1248 mm (49.13 in.). Chordwise orifices were located inthe upper and lower surfaces to one side of the midspan at the staggered positions listed in table 3.Spanwise orifices were located in the upper surface only in order to monitor the two-dimensionality of theflow at high angles of attack. All the orifices were 0.40 mm (0.016 in.) in diameter with their axesperpendicular to the surface. The measured model contour was generally within 0.1 mm (0.004 in.) of theprescribed shape.
Wake Rake
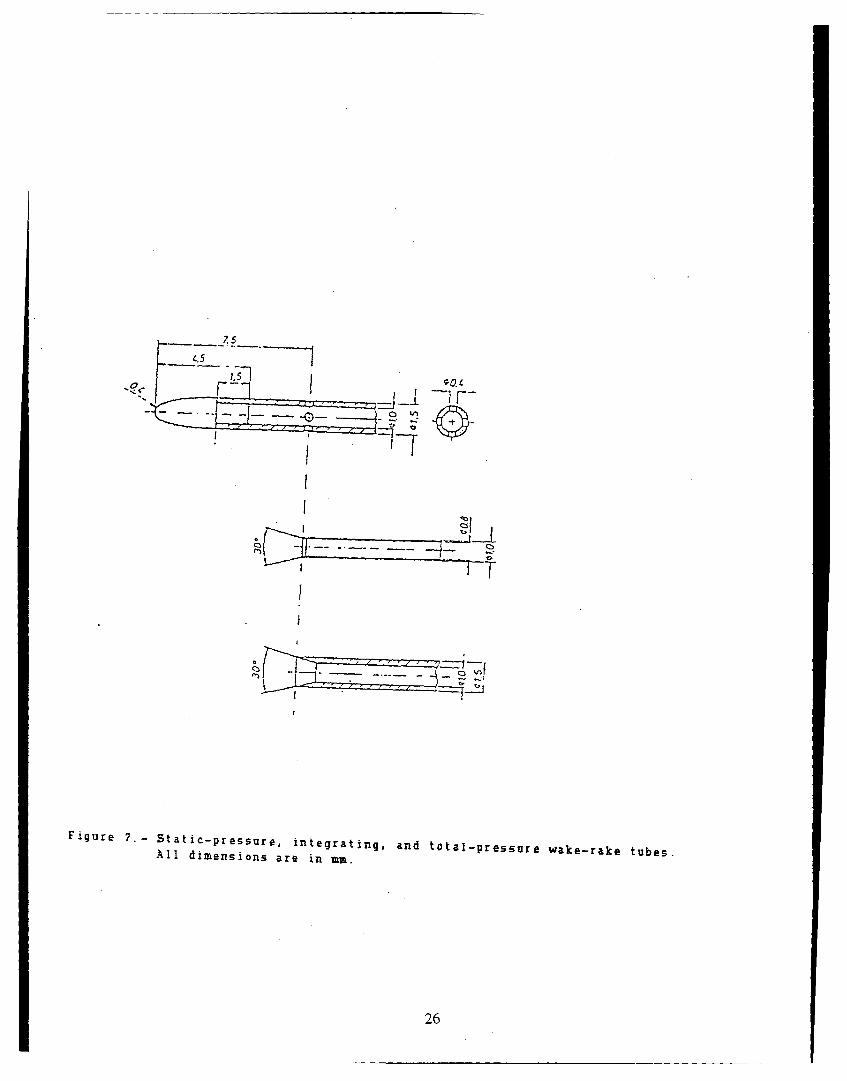
A total-pressure, a static-pressure, and an integrating wake rake were mounted on a strut between thetunnel sidewalls (figs. 4 and 5). The strut could be positioned spanwise and streamwise in the test section.Movement of the strut provided positioning of the wake rakes normal to the sidewalls. The details of thewake rakes are shown in figures 6 and 7. The integrating wake rake was not used in this investigation.
Instrumentation
Measurements of the basic tunnel pressures, the static pressures on the model surfaces, and the wake-rakepressures were made by a multitube manometer which was read automatically using photoelectric cells.Data were obtained and recorded by an electronic data-acquisition system.
Methods
The static-pressure measurements on the model surface were reduced to standard pressure coefficients andnumerically integrated to obtain section normal-force coefficients and section pitching-moment coefficientsabout the quarter-chord point. Section proftle-drag coefficients were computed from the wake-rake totaland static pressures by the method of reference 12. Standard, low-speed, wind-tunnel boundary corrections(ref. 13) have been applied to the data. The following procedure was used. The uncorrected force,moment, and pressure coefficients were referred to the apparent dynamic pressure as measured tunnel
6
empty at the model position. The lift, profile-drag, pitching-moment, and airfoil pressure coefficients andthe angle of attack were then corrected by the method of reference 13. The corrected values were plotted.Finally, as a check, the corrected airfoil pressure distribution was numerically integrated to obtain thecorrected nonnal-force (and pitching-moment) coefficient which, together with the corrected profile-dragcoefficient and angle of attack, yields the corrected lift coefficient (and chord-force coefficient).
At high angles of attack, the wake becomes wider than the wake rake. When this occurs, the drag isobtained from a parabolic extrapolation of the measured wake pressures. At even higher angles of attack,the total-pressure coefficients measured in the wake become negative, making calculation of the dragimpossible. In these cases, an uncorrected profIle-drag coefficient of 0.2 (estimated from ref. 14) isassumed.
Tests
The model wastested at Reynolds numbers based on airfoil chord from 1.0 x 10⁶ to 3.0 X 10⁶• Themodel was tested smooth (transition free) and with transition fIxed by roughness at 0.02c on the uppersurface and O.05c on the lower surface. The grit roughness was sized by the method of reference 15 andsparsely distributed along 3-mm (0. I-in.) wide strips applied to the model with lacqller. (See table 4.)
Starting from 0°, the angle of attack was increased until the entire upper surface was separated and thendecreased to determine hysteresis. The same procedure was followed for the negative angles of attack.For the Reynolds numbers of 2.5 x 10⁶ and 3.0 x 10⁶, the static pressures on the upper surface could notbe measured by the manometer at high angles of attack because the differences between those pressuresand the free-stream static pressure were too great.
For several test runs, the model surfaces were coated with oil to determine the location, as well as thenature, of the boundary-layer transition from laminar to turbulent flow (ref.16). Transition was alsolocated using a probe containing a microphone, which was positioned near the leading edge and thenmoved slowly downstream along the model surface. Two span stations, corresponding to the wake-rakeposition and the chordwise orifIce row, were surveyed. The beginning of the turbulent boundary layer wasdetected as an increase in noise level over that for the laminar boundary layer which was essentially silent.(See ref. 17.)
Two turbulators, zigzag tape (ref. 18), were placed on the model, one between 0.43c and 0.45c on theupper surface and the other between 0.42c and O.44c on the lower surface, to determine their effect onlaminar separation bubbles and section characteristics. The details of the 0.25-mm (O.OID-in.) thick tapeare shown in the following sketch.
J_-.A
1
Sketch 4
7
Discussion of Results
Experimental Results
Pressure Distributions
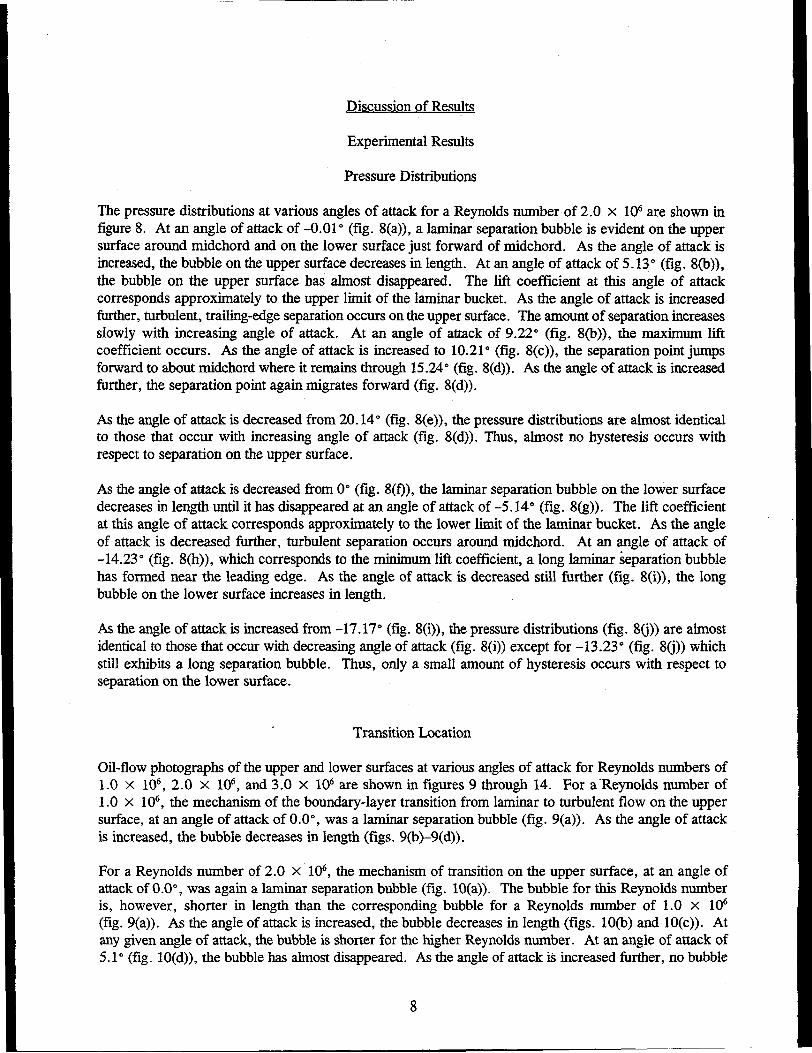
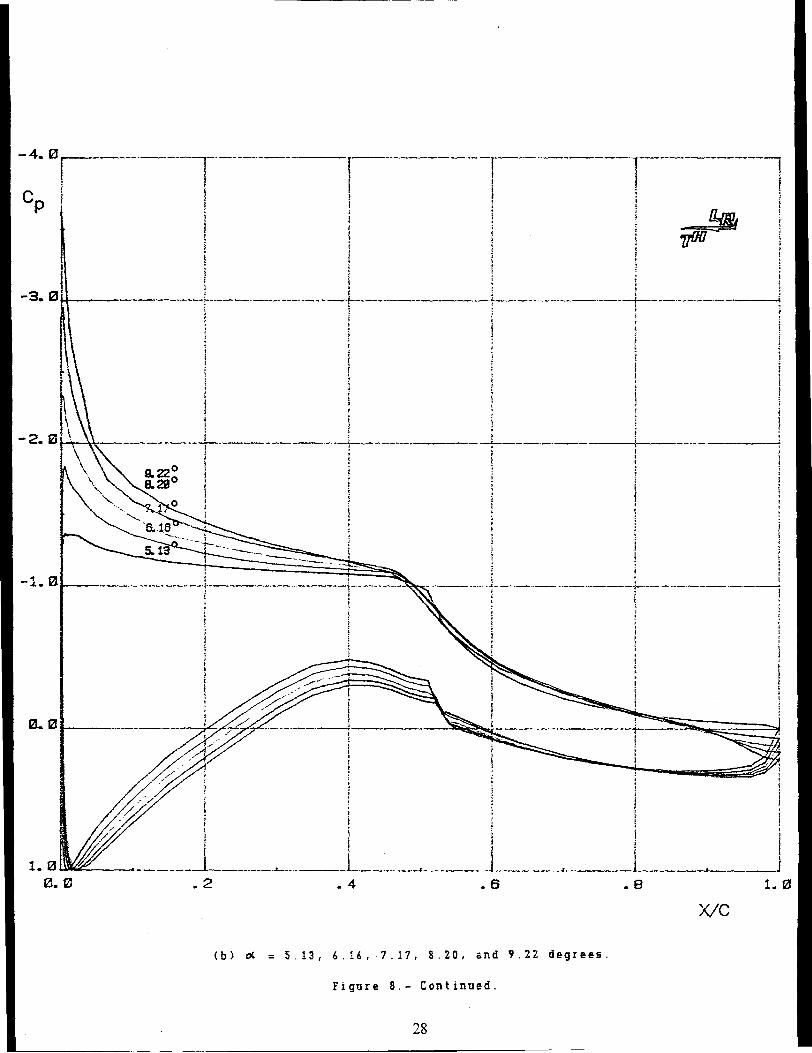
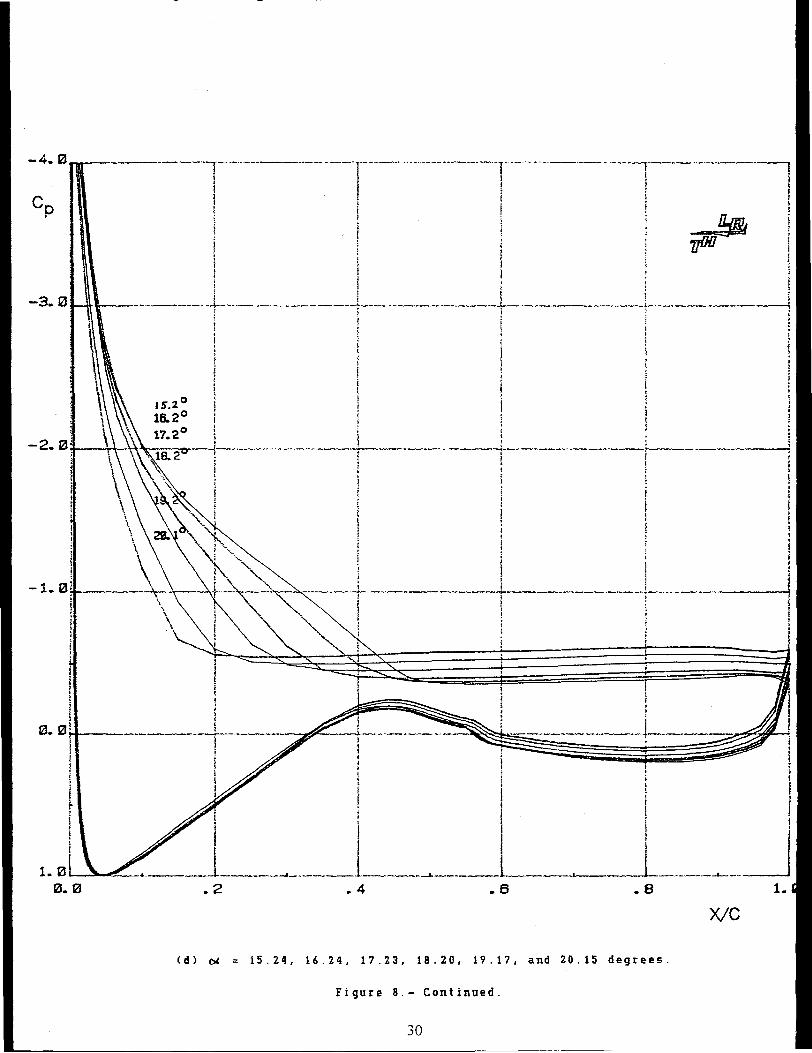
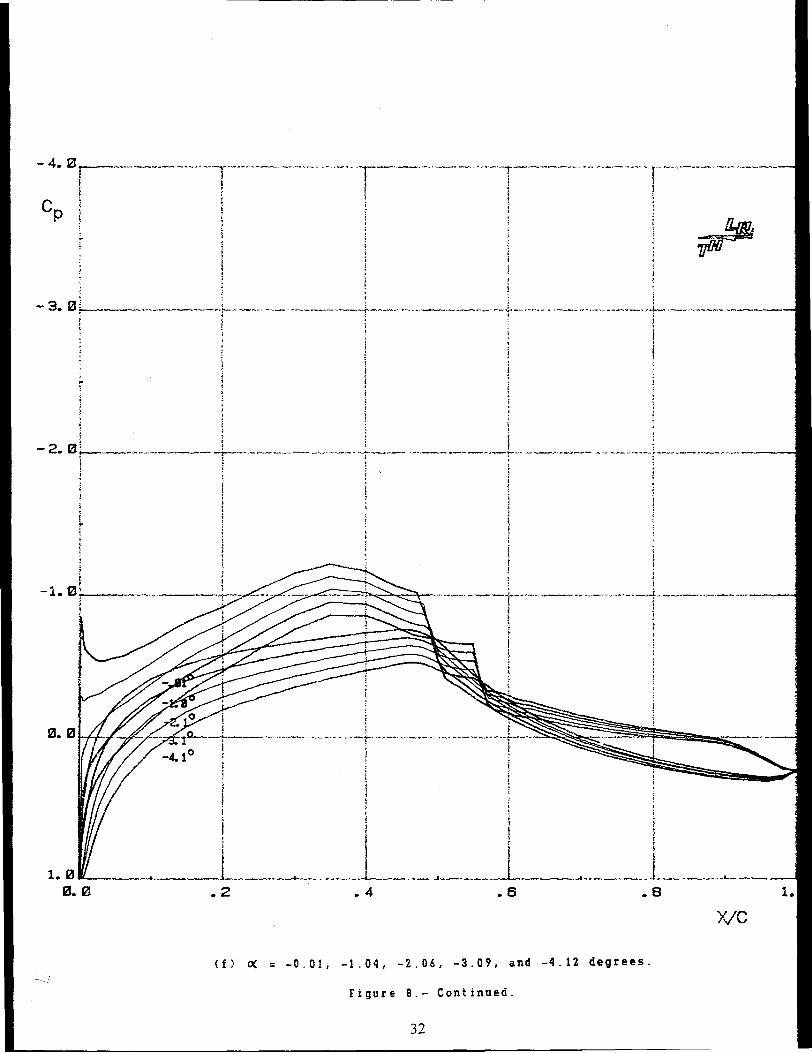
The pressure distributions at various angles of attack for a Reynolds number of 2.0 x 10⁶ are shown infigure 8. At an angle of attack of -0.01 0 (fig. 8(a», a laminar separation bubble is evident on the uppersurface around midchord and on the lower surface just forward of midchord. As the angle of attack isincreased, the bubble on the upper surface decreases in length. At an angle of attack of 5.13 0 (fig. 8(b»,the bubble on the upper surface has almost disappeared. The lift coefficient at this angle of attackcorresponds approximately to the upper limit of the laminar bucket. As the angle of attack is increasedfurther, turbulent, trailing-edge separation occurs on the upper surface. The amount of separation increasesslowly with increasing angle of attack. At an angle of attack of 9.22 0 (fig. 8(b», the maximum liftcoefficient occurs. As the angle of attack is increased to 10.21 0 (fig. 8(c», the separation point jumpsforward to about midchord where it remains through 15.240 (fig. 8(d». As the angle of attack is increasedfurther, the separation point again migrates forward (fig. 8(d».
As the angle of attack is decreased from 20.14 0 (fig. 8(e», the pressure distributions are almost identicalto those that occur with increasing angle of attack (fig. 8(d». Thus, almost no hysteresis occurs withrespect to separation on the upper surface.
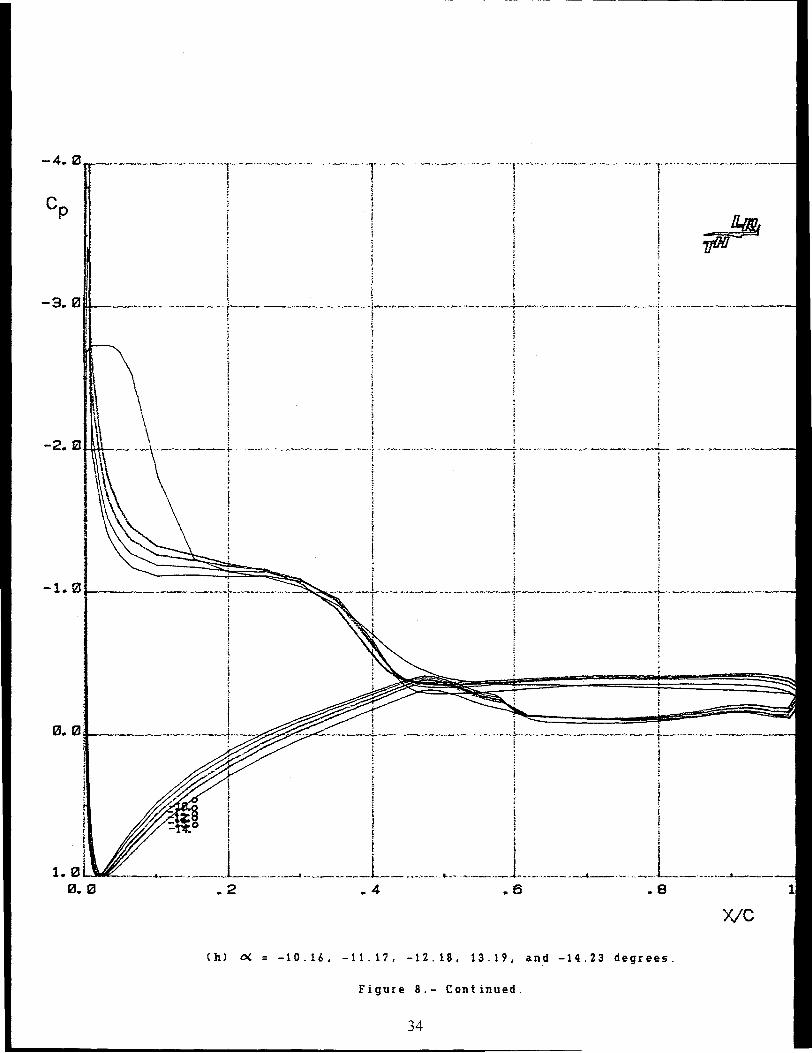
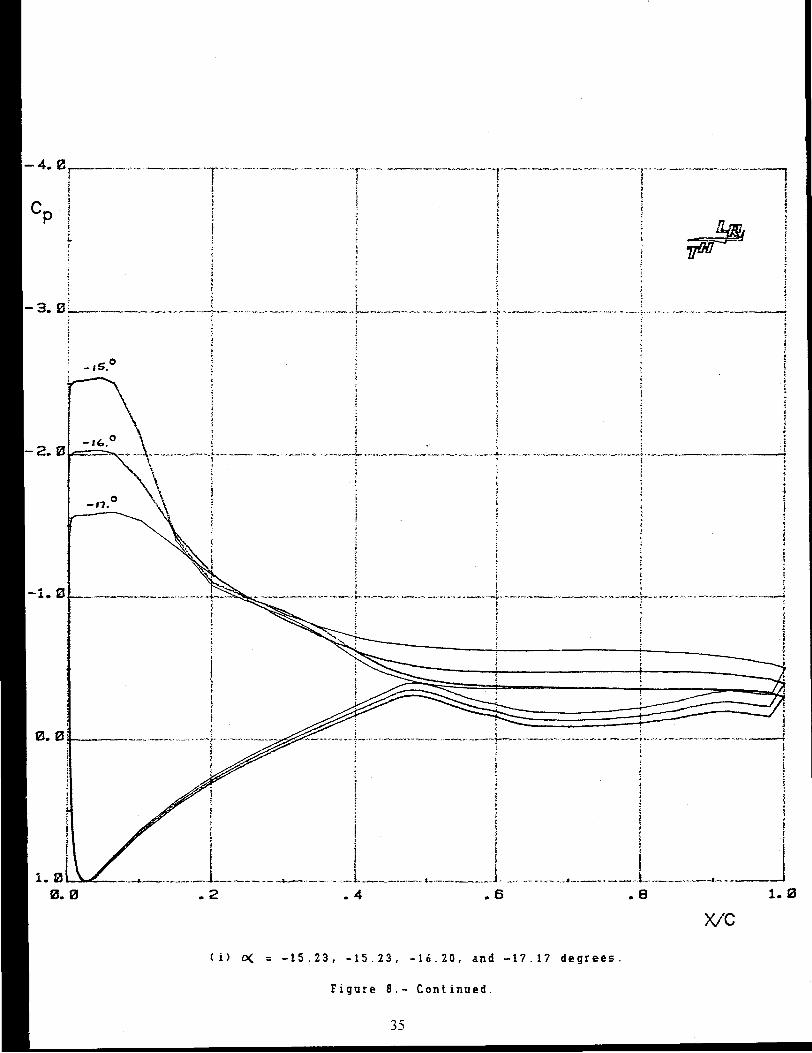
As the angle of attack is decreased from 0 0 (fig. 8(f», the laminar separation bubble on the lower surfacedecreases in length until it has disappeared at an angle of attack of -5.14 0 (fig. 8(g». The lift coefficientat this angle of attack corresponds approximately to the lower limit of the laminar bucket. As the angleof attack is decreased further, turbulent separation occurs around midchord. At an angle of attack of-14.23 0 (fig. 8(h», which corresponds to the minimum lift coefficient, a long laminar separation bubblehas formed near the leading edge. As the angle of attack is decreased still further (fig. 8(i», the longbubble on the lower surface increases in length.
As the angle of attack is increased from -17.17 0 (fig. 8(i», the pressure distributions (fig. 80» are almostidentical to those that occur with decreasing angle of attack (fig. 8(i» except for -13.23 0 (fig. 80» whichstill exhibits a long separation bubble. Thus, only a small amount of hysteresis occurs with respect toseparation on the lower surface.
Transition Location
Oil-flow photographs of the upper and lower surfaces at various angles of attack for Reynolds numbers of1.0 x 106 , 2.0 X 10⁶, and 3.0 X 10⁶ are shown in figures 9 through 14. For a'Reynolds number of1.0 x 106, the mechanism of the boundary-layer transition from laminar to turbulent flow on the uppersurface, at an angle of attack of 0.0 0
, was a laminar separation bubble (fig. 9(a». As the angle of attackis increased, the bubble decreases in length (figs. 9(b)-9(d».
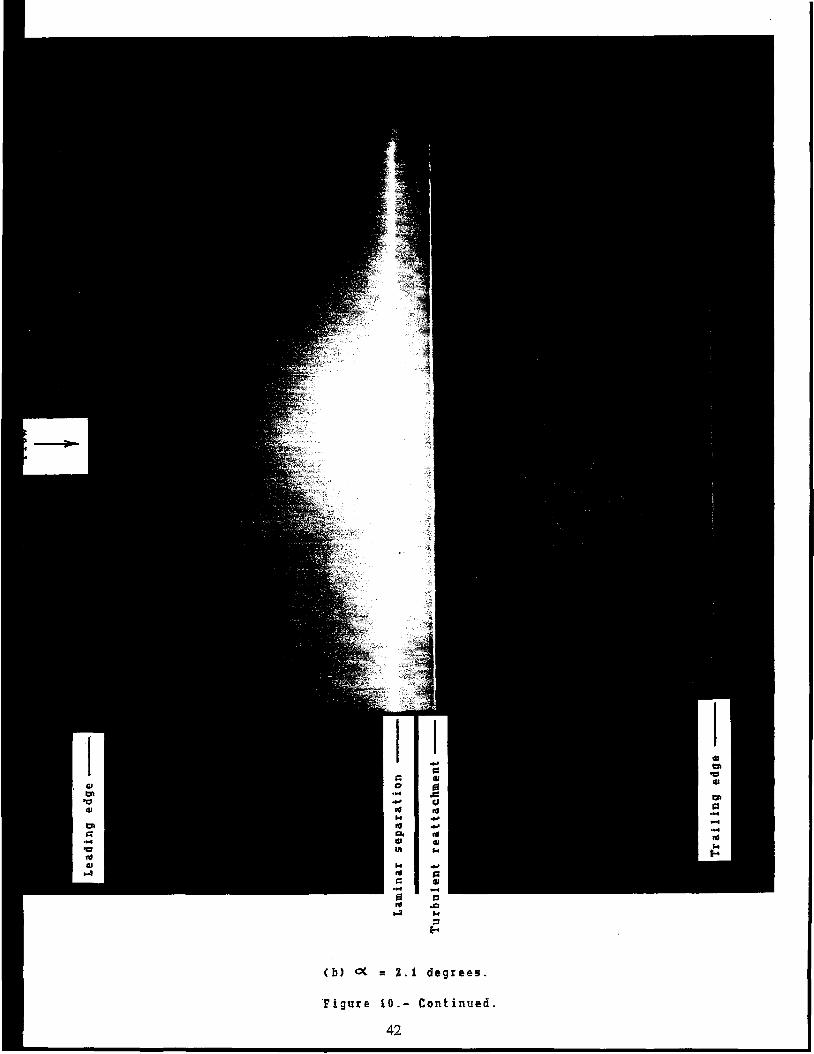
For a Reynolds number of 2.0 x 10⁶, the mechanism of transition on the upper surface, at an angle of
attack of 0.00, was again a laminar separation bubble (fig. 10(a». The bubble for this Reynolds number
is, however, shorter in length than the corresponding bubble for a Reynolds number of 1.0 x 10⁶
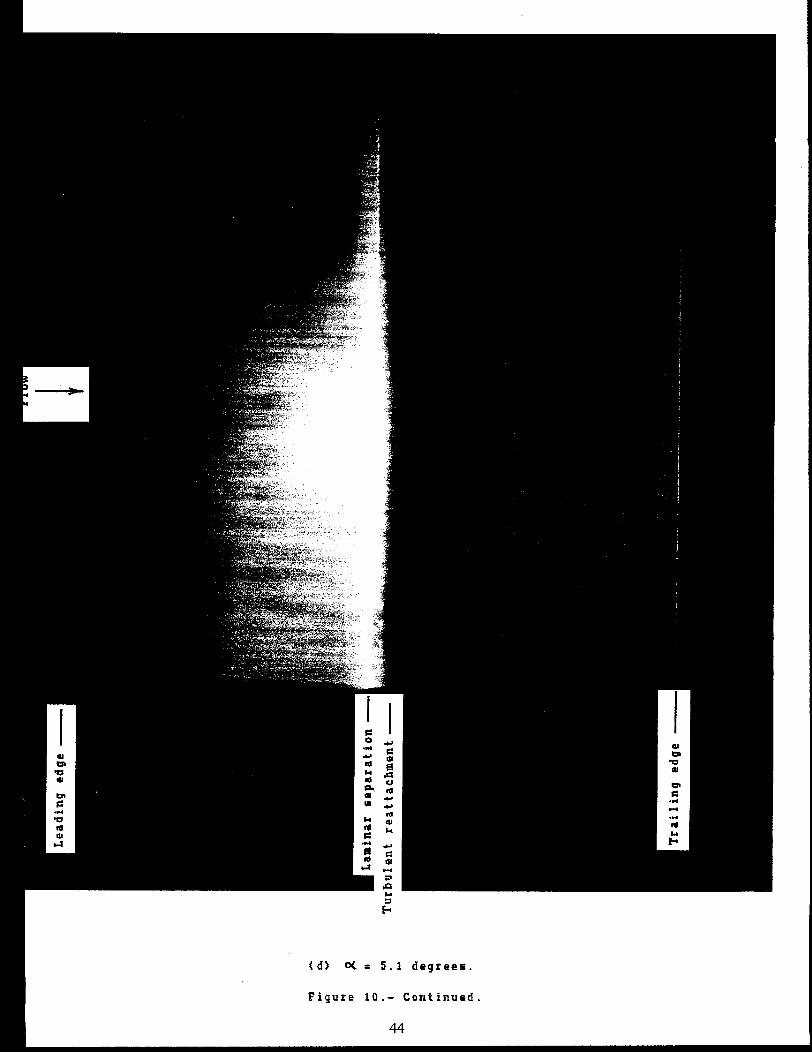
(fig. 9(a». As the angle of attack is increased, the bubble decreases in length (figs. 1O(b) and 1O(c». Atany given angle of attack, the bubble is shorter for the higher Reynolds number. At an angle of attack of5.1 0 (fig. 10(d», the bubble has almost disappeared. As the angle of attack is increased further, no bubble
8
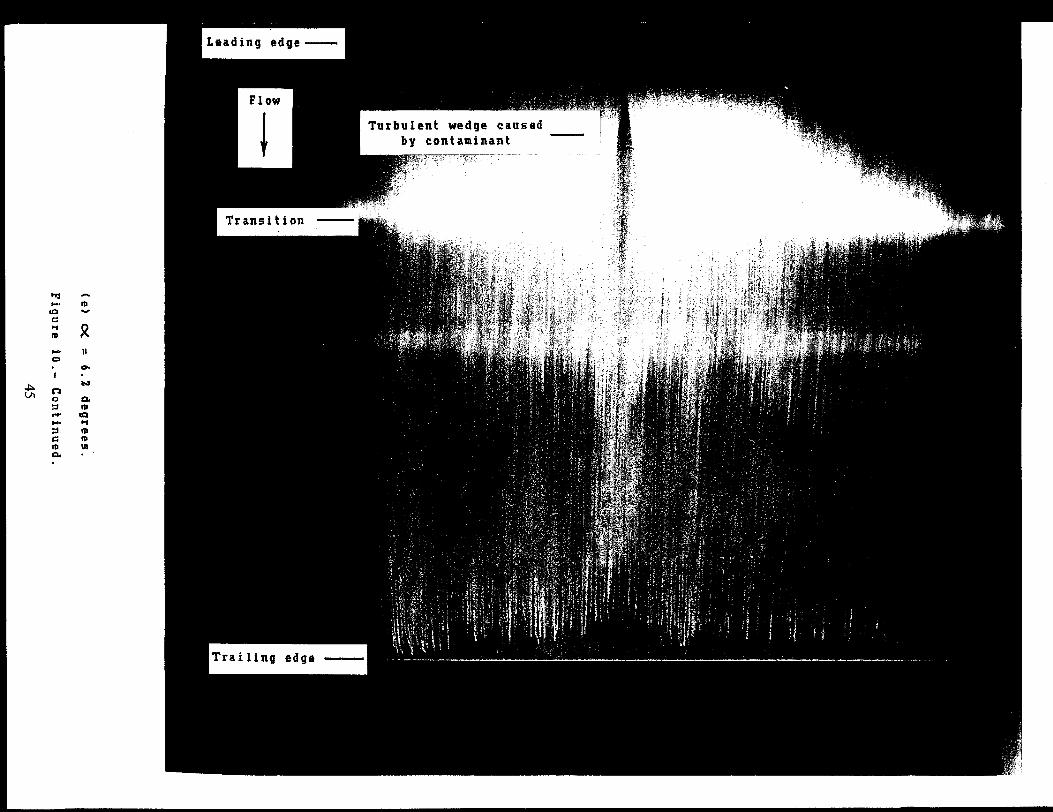
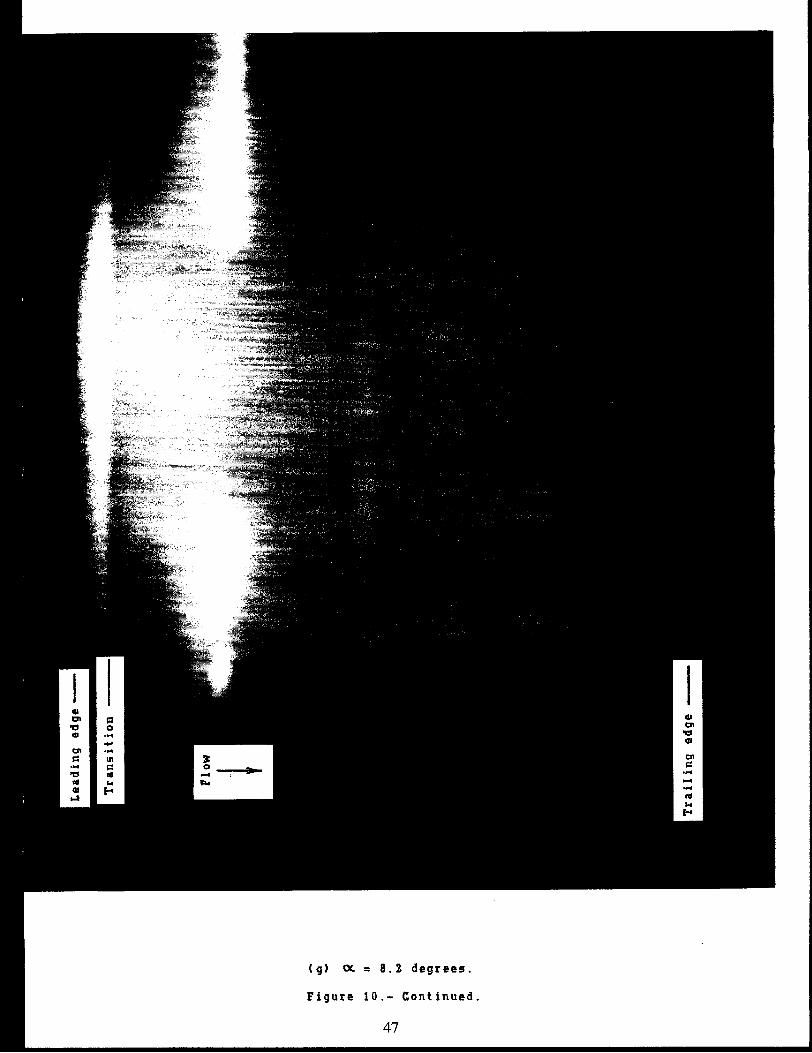
is evident and the transition location moves steadily forward (figs. 10(e)-10(h». (The turbulent wedge infig. lO(e) was caused by a contaminant in the oil.)
For a Reynolds number of 3.0 X 10⁶, the mechanism of transition on the upper surface, at an angle of
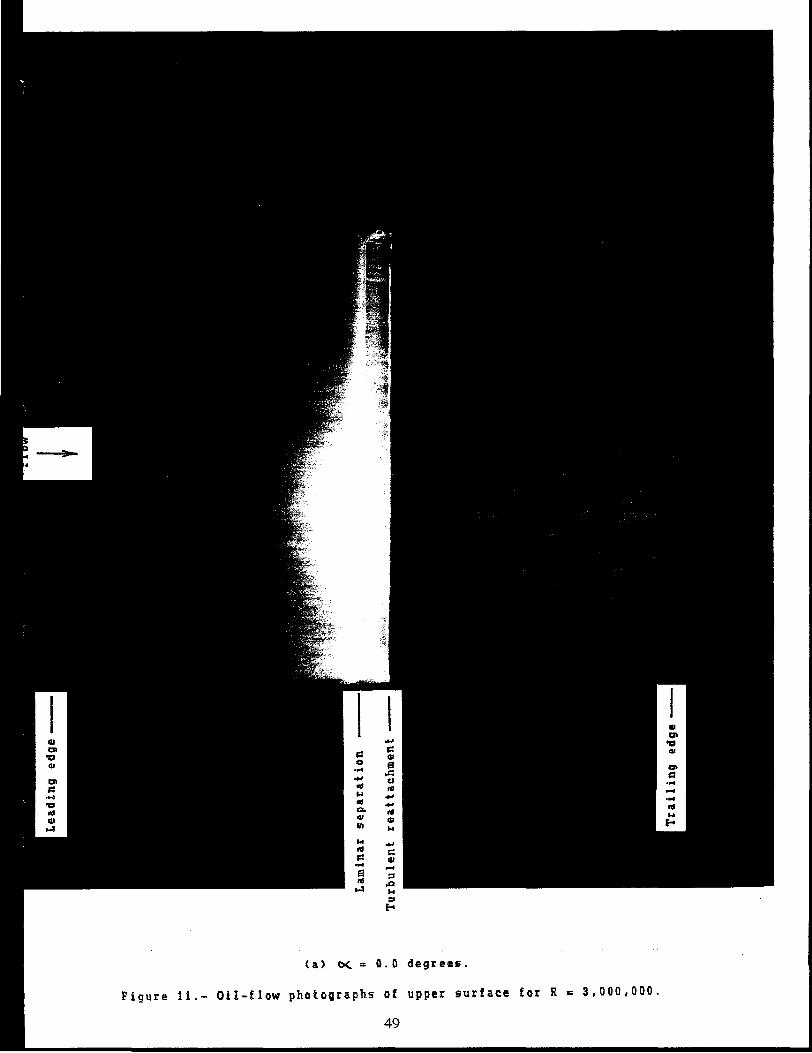
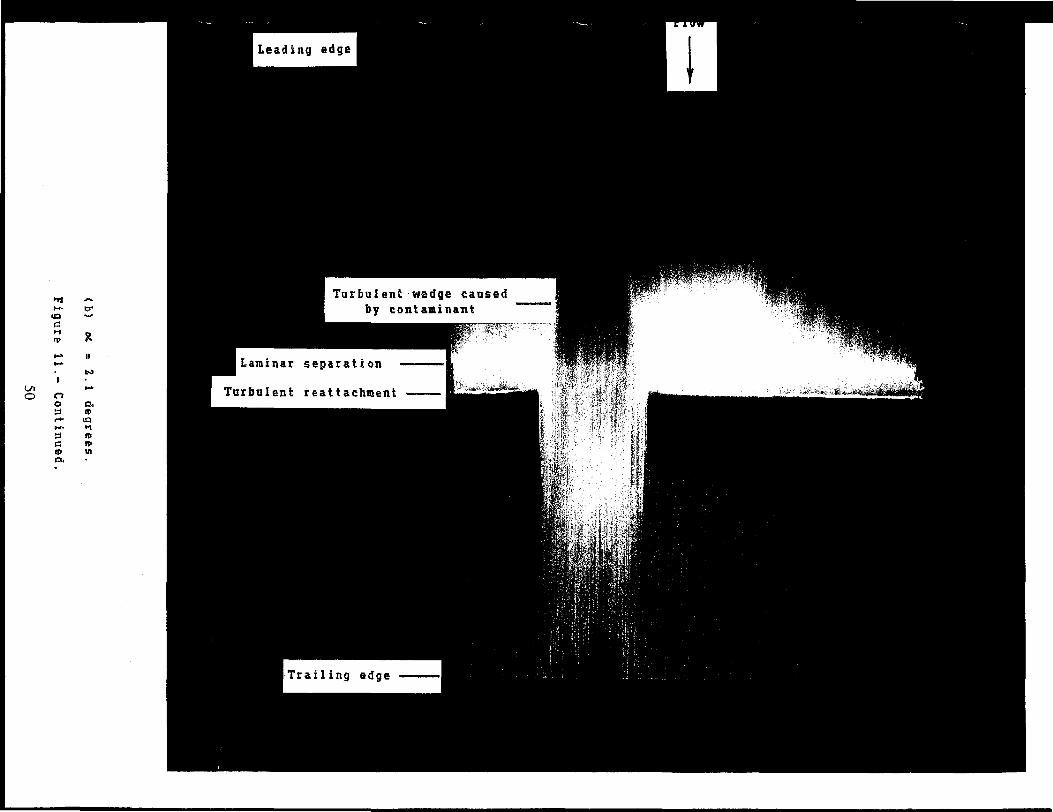
attack of 0.0 0, was again a laminar separation bubble (fig. ll(a». The bubble for this Reynolds number
is shorter than the corresponding bubble for a Reynolds number of 2.0 x 10⁶ (fig. (lOa». As the angleof attack is increased, the bubble decreases in length and has almost disappeared at an angle of attack of4.1 0 (fig. l1(c». (The turbulent wedge in fig. 11(b) was caused by a contaminant in the oil.) At any givenangle of attack, the bubble is shorter for the higher Reynolds number.
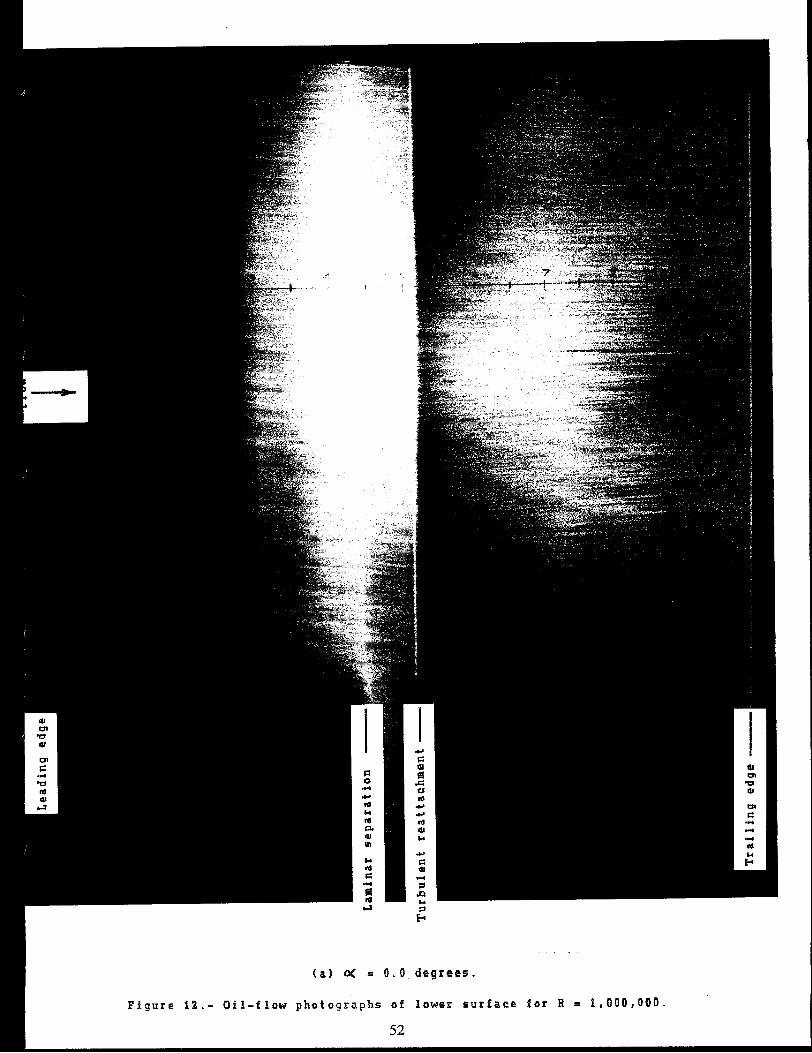
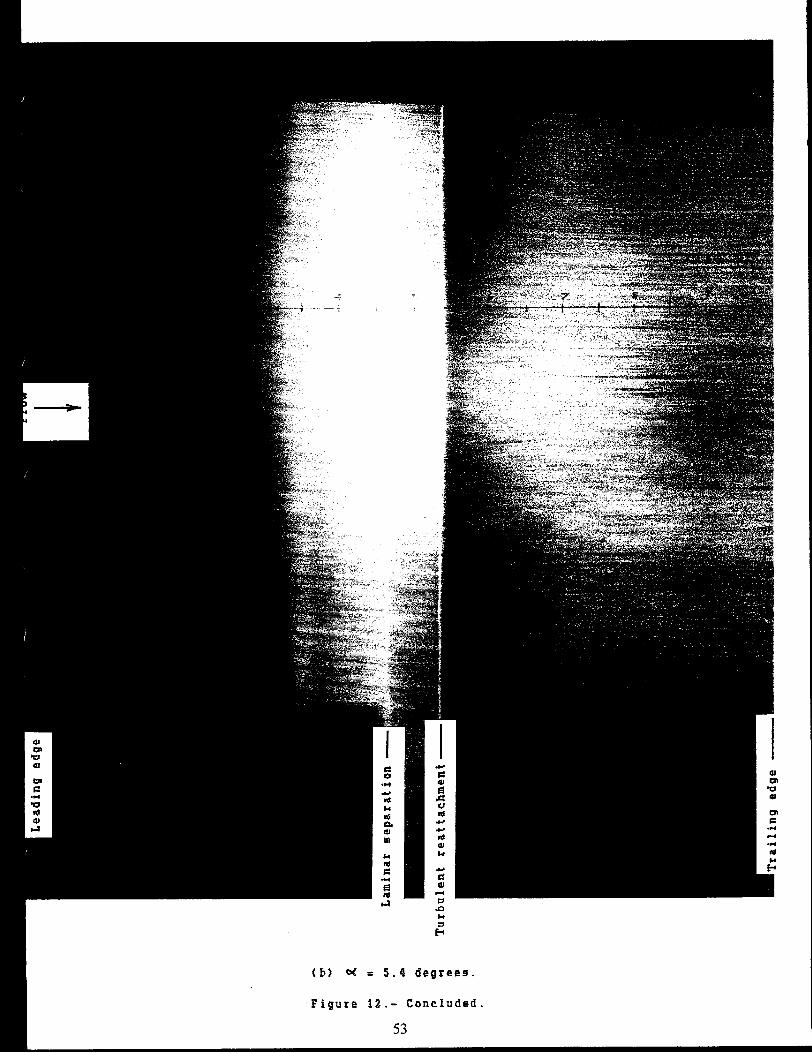
For a Reynolds number of 1.0 x 10⁶, the mechanism of transition on the lower surface, at an angle ofattack of0.00
, was a laminar separation bubble (fig. l2(a». The bubble on the lower surface is comparablein length to the one on the upper surface at this angle of attack. As the angle of attack is increased, thebubble moves downstream while remaining essentially constant in length (fig. 12(b».
For a Reynolds number of 2.0 x 10⁶, the mechanism of transition on the lower surface, at an angle ofattack of 0.0 0
, was again a laminar separation bubble (fig. 13(a». The bubble for this Reynolds numberis, however, shorter in length than the corresponding bubble for a Reynolds number of 1.0 x 10⁶
(fig. 12(a». As the angle of attack is increased, the bubble moves downstream while remaining essentiallyconstant in length (fig. 13(b».
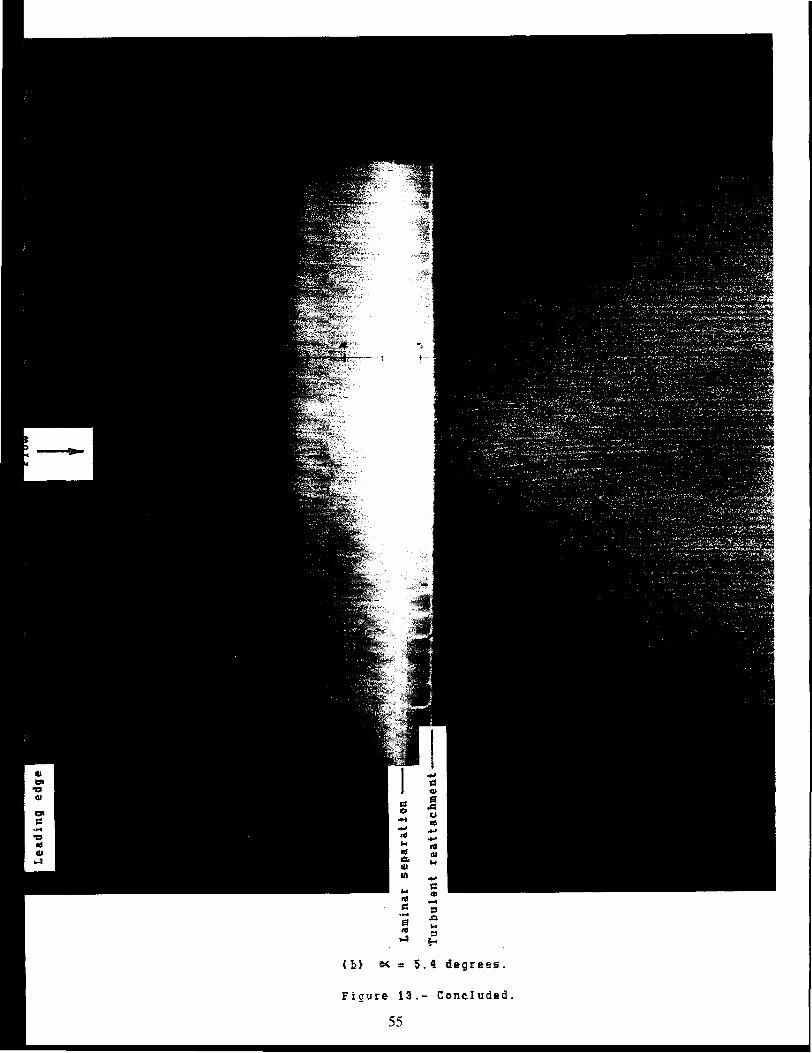
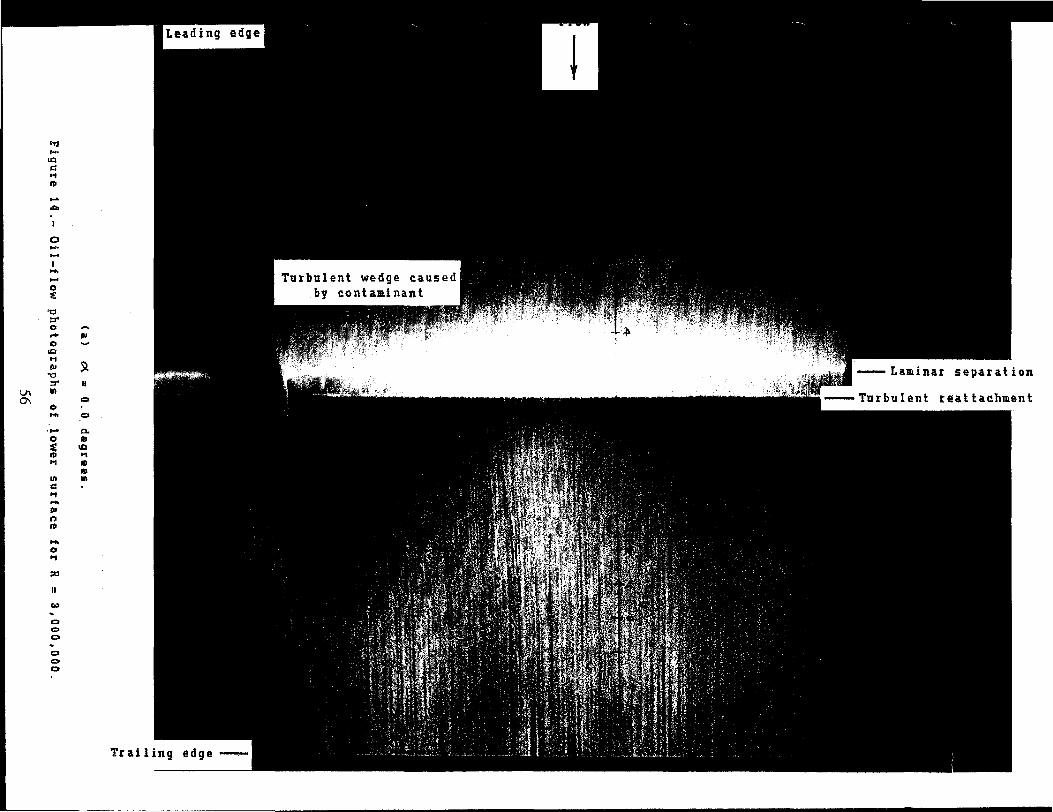
For a Reynolds number of 3.0 x 10⁶, the mechanism of transition on the lower surface, at an angle of
attack of 0.0 0, was again a laminar separation bubble (fig. l4(a». (The turbulent wedge in fig. 14(a) was
caused by a contaminant in the oil.) The bubble for this Reynolds number is shorter than the correspondingbubble for a Reynolds number of 2.0 x 10⁶ (fig. 13(a». As the angle of attack is increased, the bubblemoves downstream while remaining essentially constant in length (fig. l4(b».
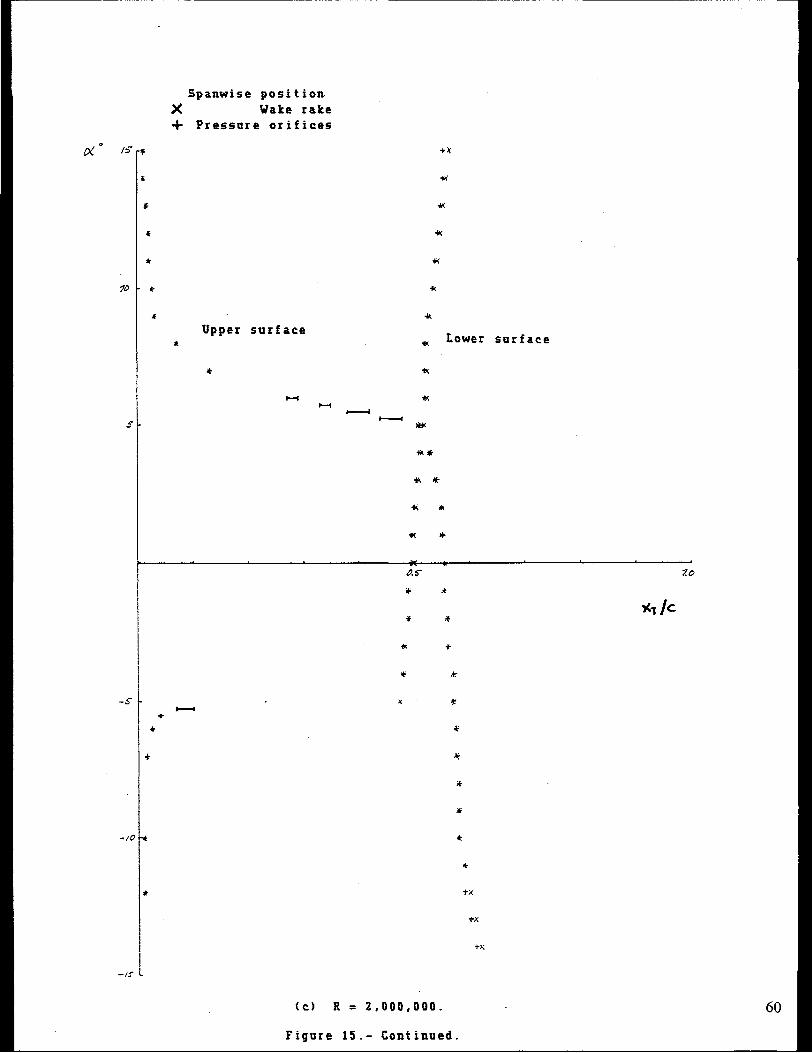
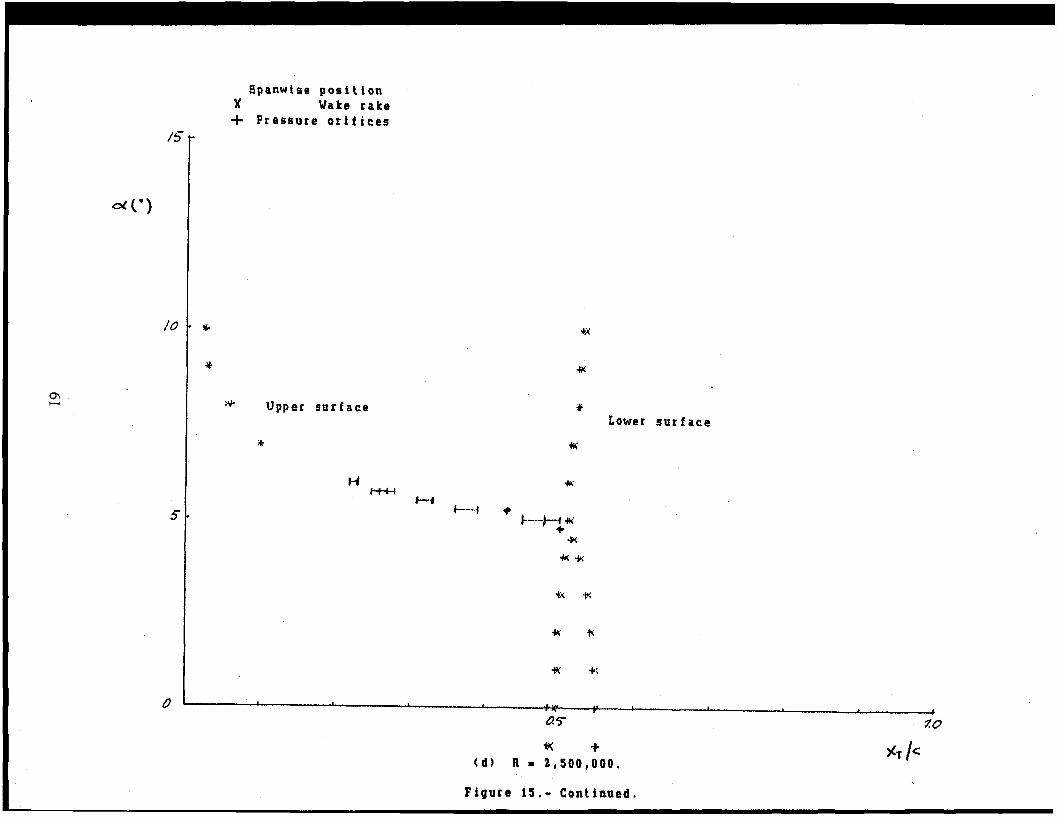
The variation of transition location with angle of attack, as determined by microphone measurements, isshown in figure 15. It should be remembered that only attached turbulent flow can be detected using thistechnique. Thus, for an angle of attack at which a laminar separation bubble is present, the transitionlocation measured corresponds to the turbulent-reattachment point. The symbols represent conditionswhere the onset of turbulence was sudden. These conditions occur at the turbulent-reattachment point orwhere natural transition occurs rapidly. The bars represent conditions where natural transition occurs oversome length. The bars extend from the beginning of transition (defmed here as the point where turbulentbursts are fust detected) to the end of transition (defmed here as the point where individual bursts can nolonger be distinguished). The chordwise orifices generally had little influence on the transition location(forward shift ~ O.Olc) except where natural transition occurred over some length, in which case, theorifices caused transition to occur somewhat further forward. For these cases, the influence decreased withincreasing Reynolds number. It should be noted that wind-tunnel boundary corrections have not beenapplied to the angle of attack shown in figure 15 only.
Section Characteristics
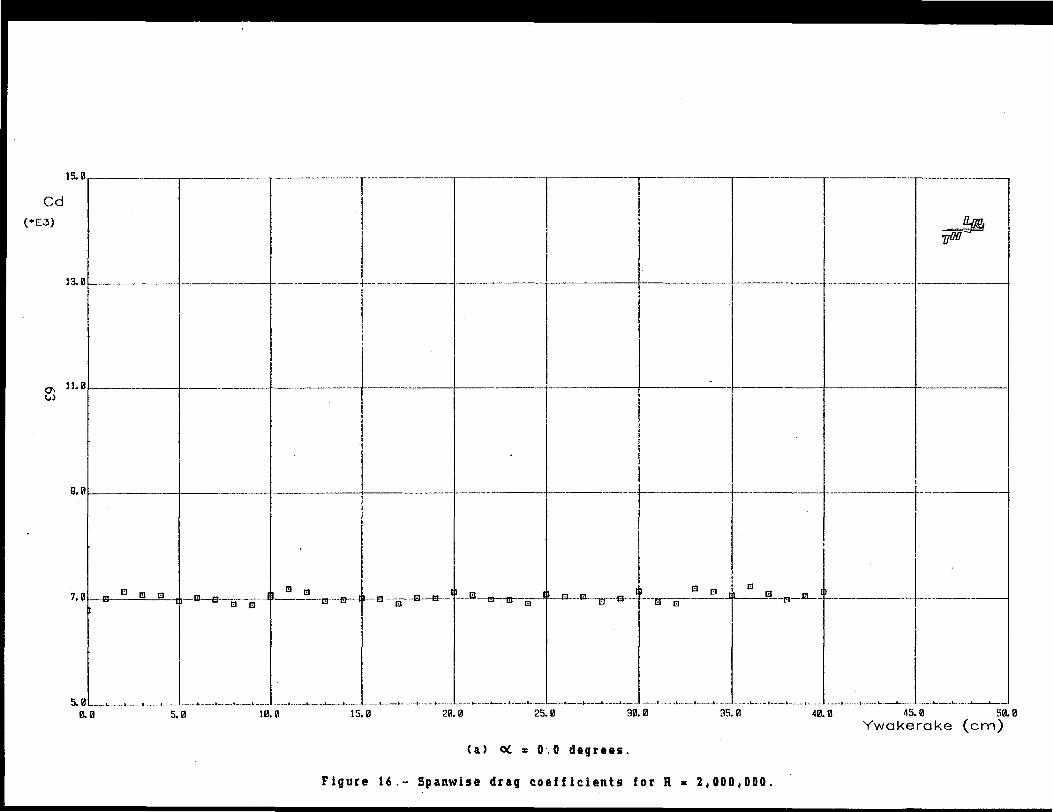
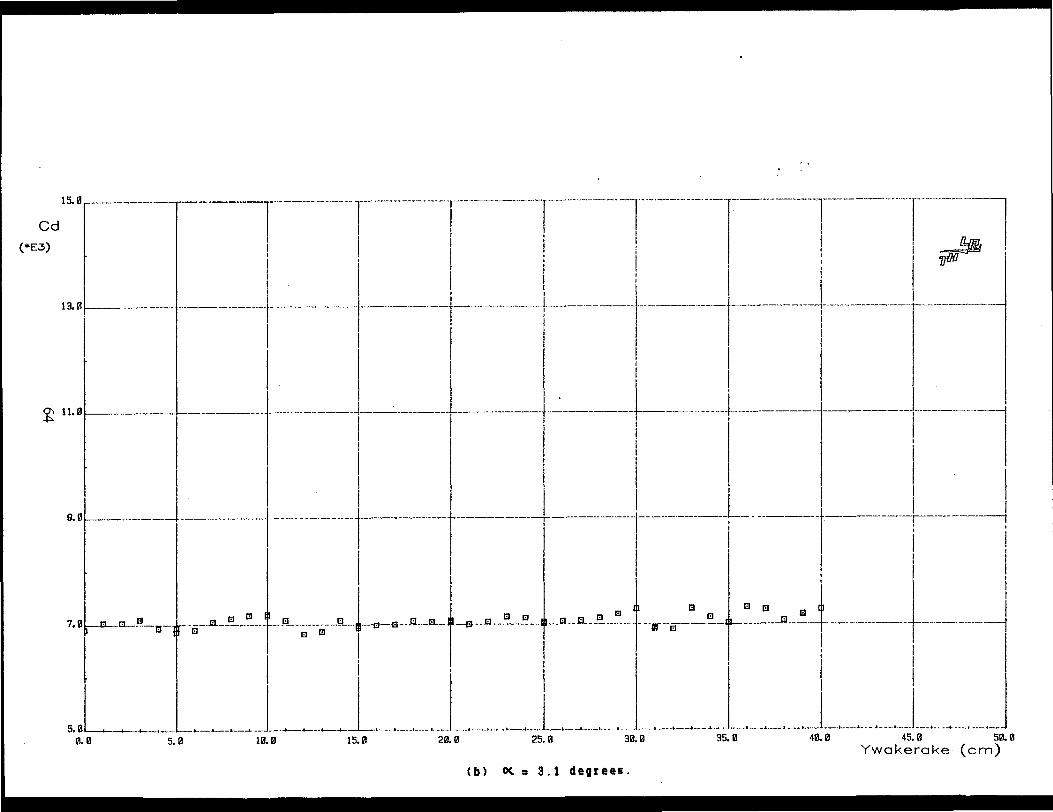
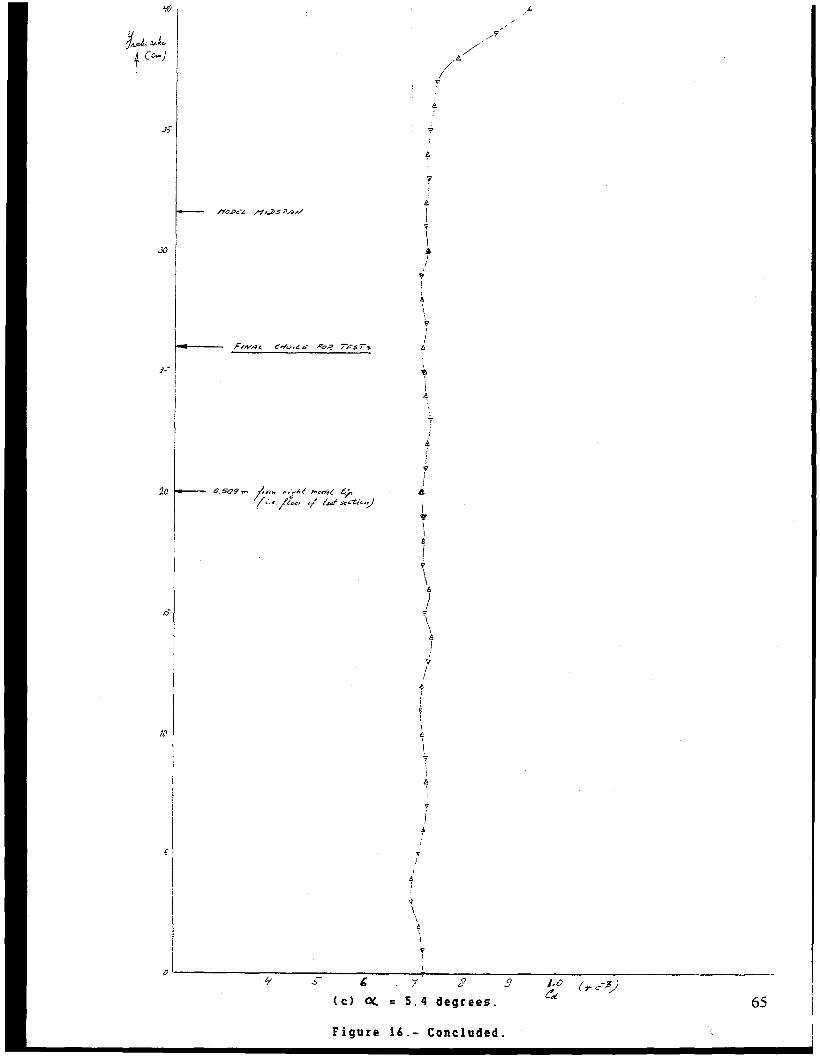
Spanwise drag measurements.- The variation of profile-drag coefficient with span station at three anglesof attack is shown for a Reynolds number of 2.0 x 10⁶ in figure 16. The three angles of attack, 0.0 0
,
3.1 0, and 5.4 0
, correspond approximately to the middle, the upper middle, and the upper limit of thelaminar bucket, respectively, for this Reynolds number. The greatest drag variation occurs in the vicinityof the stations that correspond to the chordwise pressure orifices in the model (44.3 to 51.6 cm). A largedrag variation is only evident at the upper limit of the laminar bucket (fig. 16(c». A total-pressure wake-
9
----------------~ ..._---- ------
rake position of 26.0 em, which is 5.6 cm below the tunnel centerline, was selected for all succeeding dragmeasurements because it resulted in a drag coefficient representative of the mean value at each of the threeangles of attack.
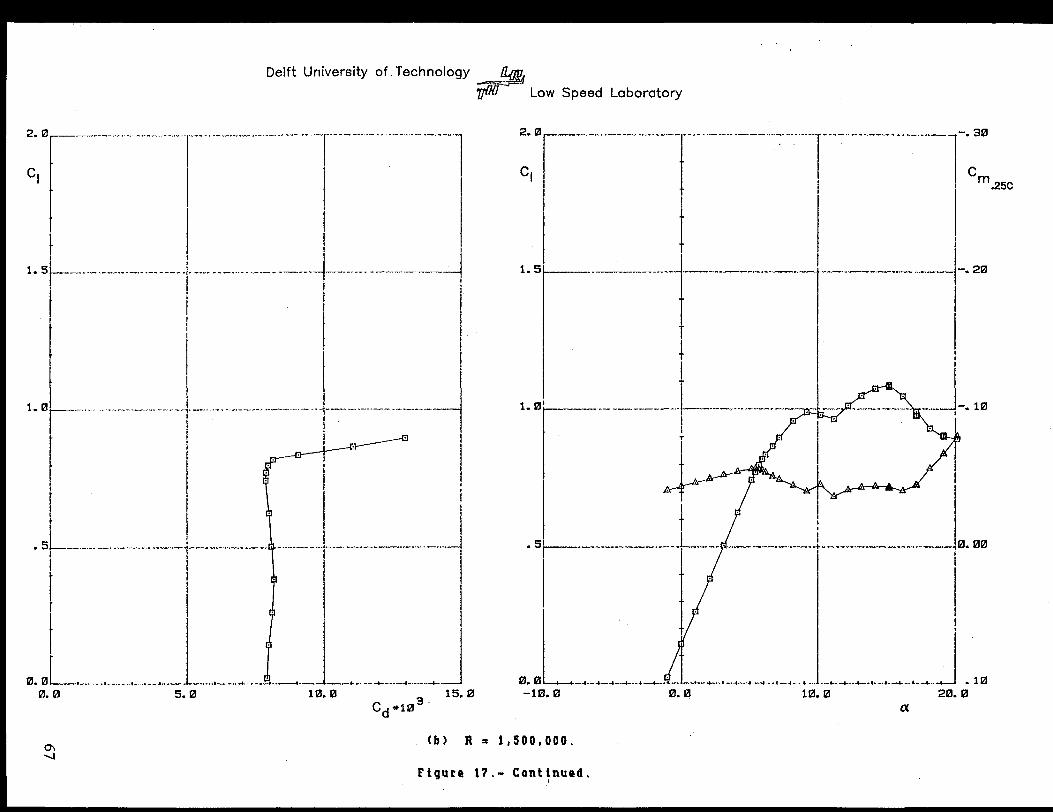
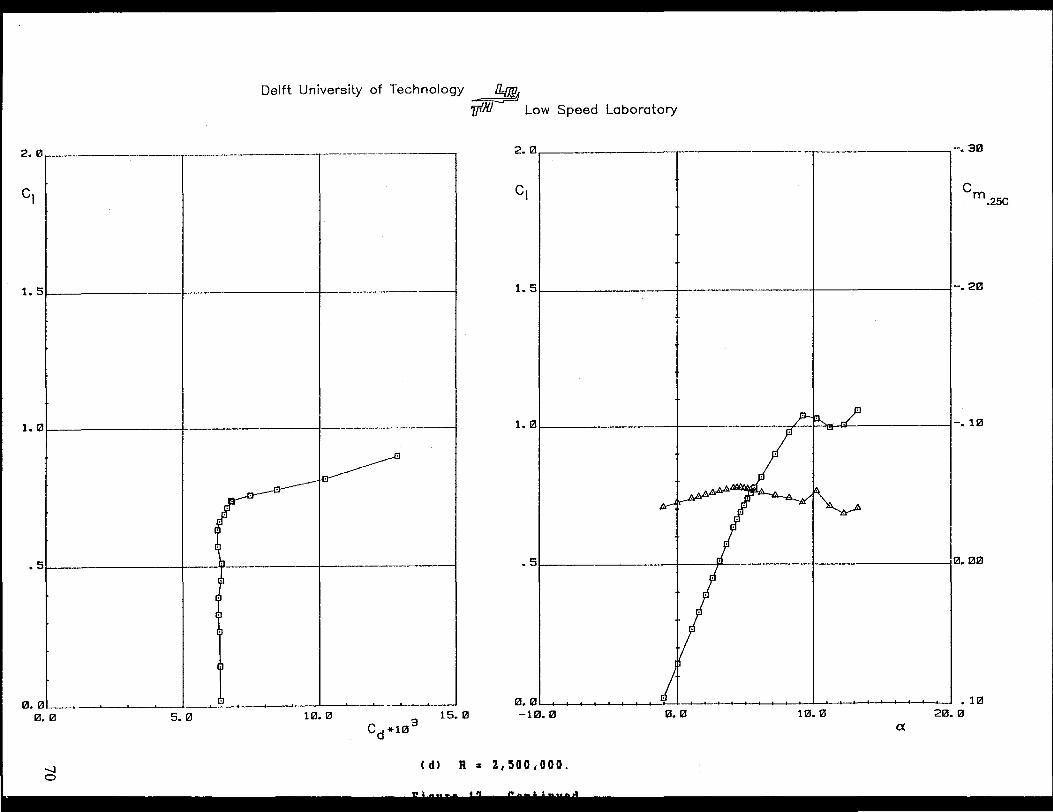
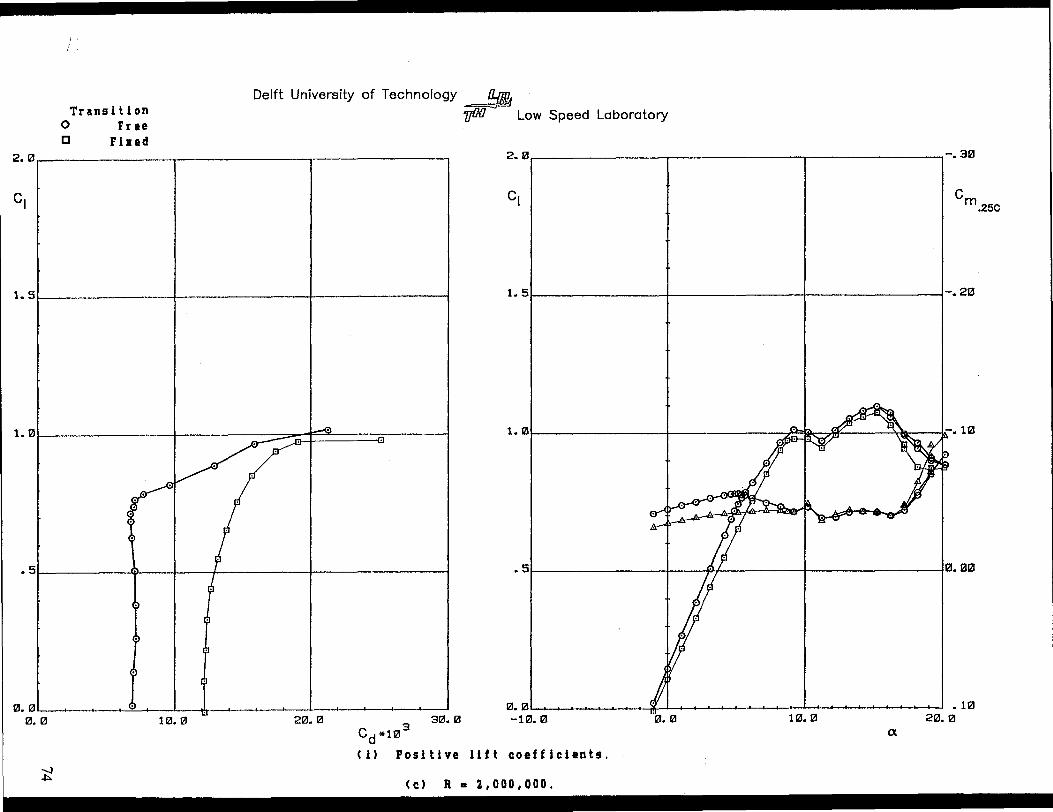
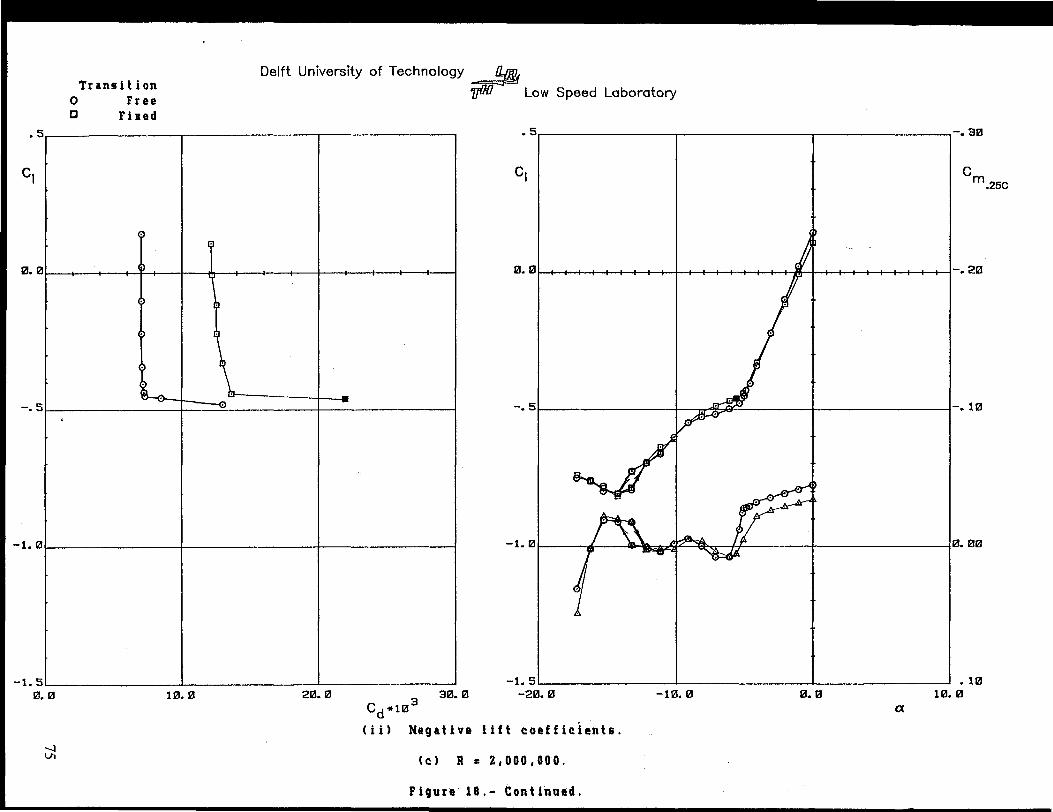
Reynolds number effects.- The section characteristics are shown in figure 17. For the design Reynoldsnumber (R = 2.0 x 10⁶
) (fig. 17(c», the maximum lift coefficient was approximately 1.01, which isessentially equal to the design objective of 1.0. (Note that none of the higher lift coefficients wasinterpreted as the maximum lift coefficient because of the large amount of separation present at all anglesof attack greater than that for the previously-mentioned maximum lift coefficient. See figs. 8(c) and 8(d).Such massive separation suggests that the validity of the data is suspect.) The trailing-edge stall was verydocile. Almost no hysteresis occurred at angles of attack greater than that for maximum lift and less thanthat for minimum lift; a small amount of hysteresis occurred at angles of attack somewhat greater than thatfor minimum lift. Low drag coefficients were obtained over the range of lift coefficients from about -0.45to 0.77. Thus, the lower limit of the laminar bucket is well below that specified (0.2) and the upper limitis just below that specified (0.8). The slightly curved shape of the polar (higher drag between the limitsthan at them) indicates that the laminar separation bubbles, shown in figures 8, 10, and 13, adverselyaffected the drag. The magnitude of this effect decreased with increasing Reynolds number. The zero-liftpitching-moment coefficient was approximately -0.041, which satisfies the design constraint (~ -0.05).
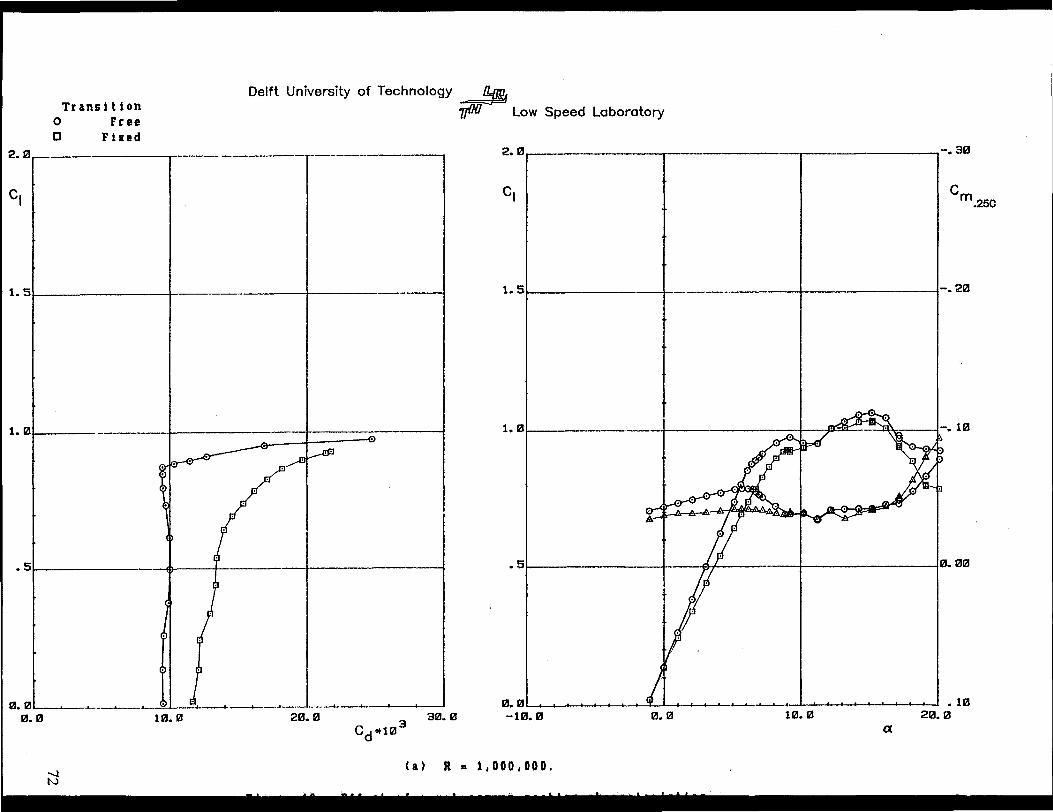
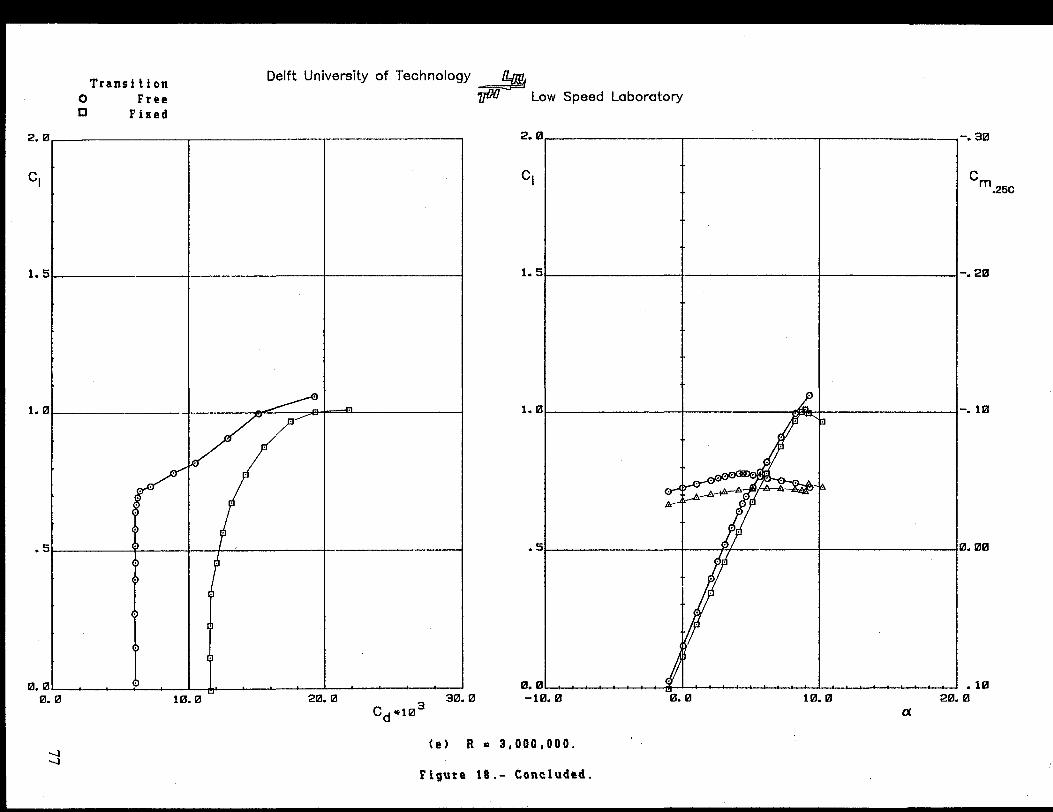
Effect of roughness.- The effect of roughness on the section characteristics is shown in figure 18. Theangle of attack for zero lift coefficient as well as the pitching-moment coefficients generally increased withtransition fixed, whereas the lift-curve slope decreased. All these results are partly a consequence of theboundary-Iayer-displacement effect which decambers the airfoil slightly, the displacement thickness beinggreater for the transition-fixed condition than for the transition-free condition. Increasing Reynolds numberdecreases the displacement thickness and, therefore, the displacement effect. In addition, the lift-curveslopes and magnitude of the pitching-moment coefficients are probably too low with transition fixed. Formany conditions, the Reynolds number, based on local conditions and boundary-layer momentumthickness, at the roughness location is too low to support turbulent flow. Accordingly, in order to forcetransition, the roughness must increase the momentum thickness, which increases the extent of theturbulent, trailing-edge separation on the upper surface and, therefore, reduces the magnitudes of the liftand pitching-moment coefficients.
The angle of attack for zero lift coefficient did not increase with transition fixed for the Reynolds numberof 1.0 x 10⁶ (fig. 18(a». For this Reynolds number, the roughness was too small to force transition on theupper surface at low lift coefficients. Thus, the laminar separation bubble on the upper surface was noteliminated, whereas the one on the lower surface was. The elimination of the lower-surface bubbleresulted in an increase in lift compared to the transition-free condition, which was counterbalanced by thedecambering effect of the increased boundary-layer displacement thickness.
Of more importance, however, is the effect of roughness on the maximum lift coefficient and on the dragcoefficients. The addition of roughness had no major effect on the maximum lift coefficient for any of theReynolds numbers. The minor reductions in maximum lift coefficient with transition fixed are partiallydue to the abnormal roughness effect noted previously. Thus, one of the most important designrequirements has been achieved. The drag coefficients were, of course, adversely affected by theroughness. It should be noted, however, that the drag coefficients with transition fixed are probably toohigh at low and high lift coefficients. This result is obtained because the height of the roughness wassimilar to the boundary-layer thickness on the upper surface at low lift coefficients and on the lower surfaceat high lift coefficients. Therefore, the drag coefficients at these lift coefficients contain an additional(pressure-drag) contribution due to the roughness itself. This effect is larger for higher Reynolds numbers(figs. 18(c)-18(e».
10
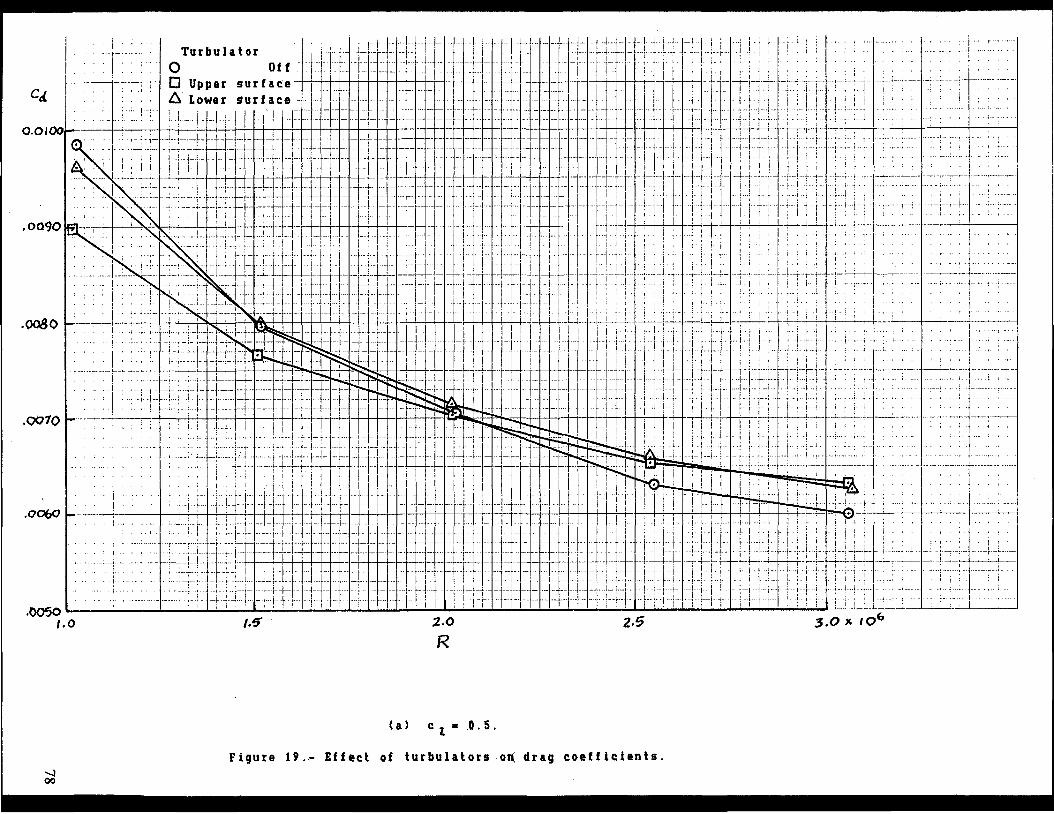
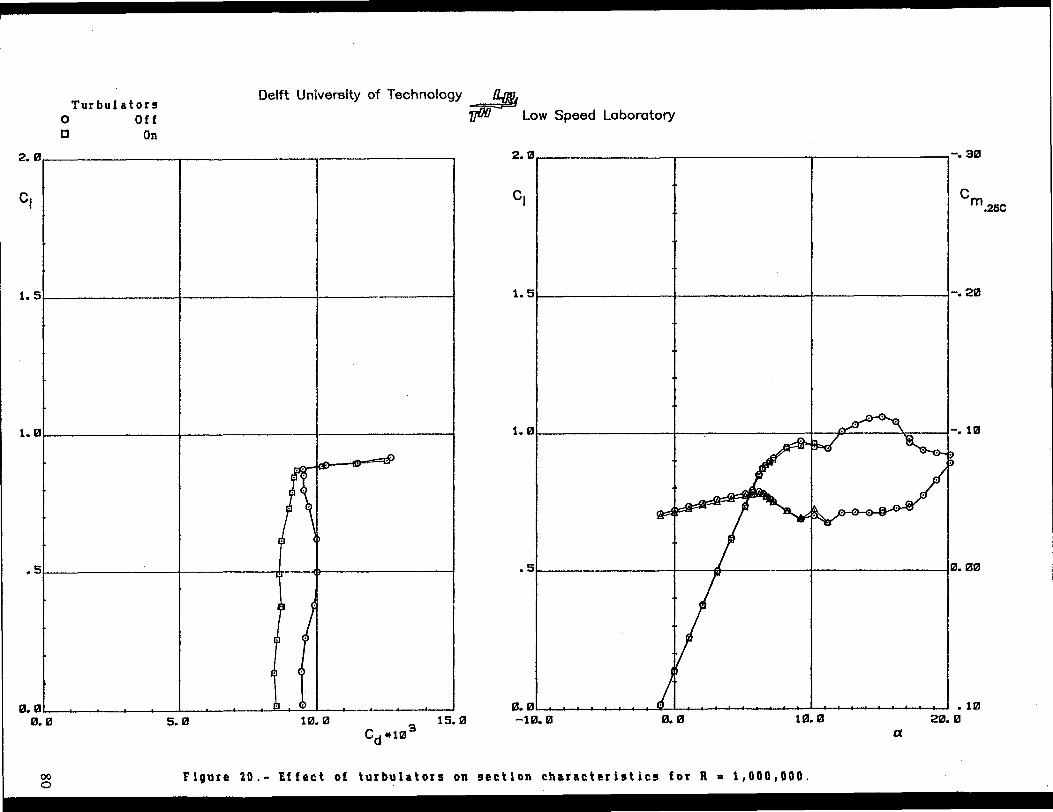
Effect,of turbulators.- The effect of turbulators on the drag coefficients at lift coefficients of 0.5 and 0.7is shown in figure 19. The addition of a turbulator to the upper surface lowered the drag at the lowerReynolds numbers but increased it at the higher Reynolds numbers. The addition of a turbulator to thelower surface produced similar results but of lower magnitude. Because the turbulators lowered the dragat both lift coefficients for a Reynolds number of 1.0 x 10⁶ only, the effect of the turbulators on the sectioncharacteristics for this Reynolds number alone is shown in figure 20. The turbulators, which eliminatedthe laminar separation bubbles on the upper and lower surfaces, had no major effect on any of thecharacteristics except the drag coefficients. The elimination of the upper-surface bubble altered thepressure distribution in such a way that the lift was decreased and the pitching moment, increased. Theelimination of the lower-surface bubble produced similar results but of lower magnitude. Both effectswere, however, small. Thus, the elimination of the bubbles changed the lift and pitching-momentcoefficients little but modified the boundary-layer developments substantially. The influence on the uppersurface drag was larger than on the lower-surface drag. Thus, a significant drag reduction over the entirewidth of the laminar bucket was produced by the upper-surface turbulator, whereas a smaller dragreduction was produced by the lower-surface turbulator.
Comparison of Theoretical and Experimental Results
Pressure Distributions
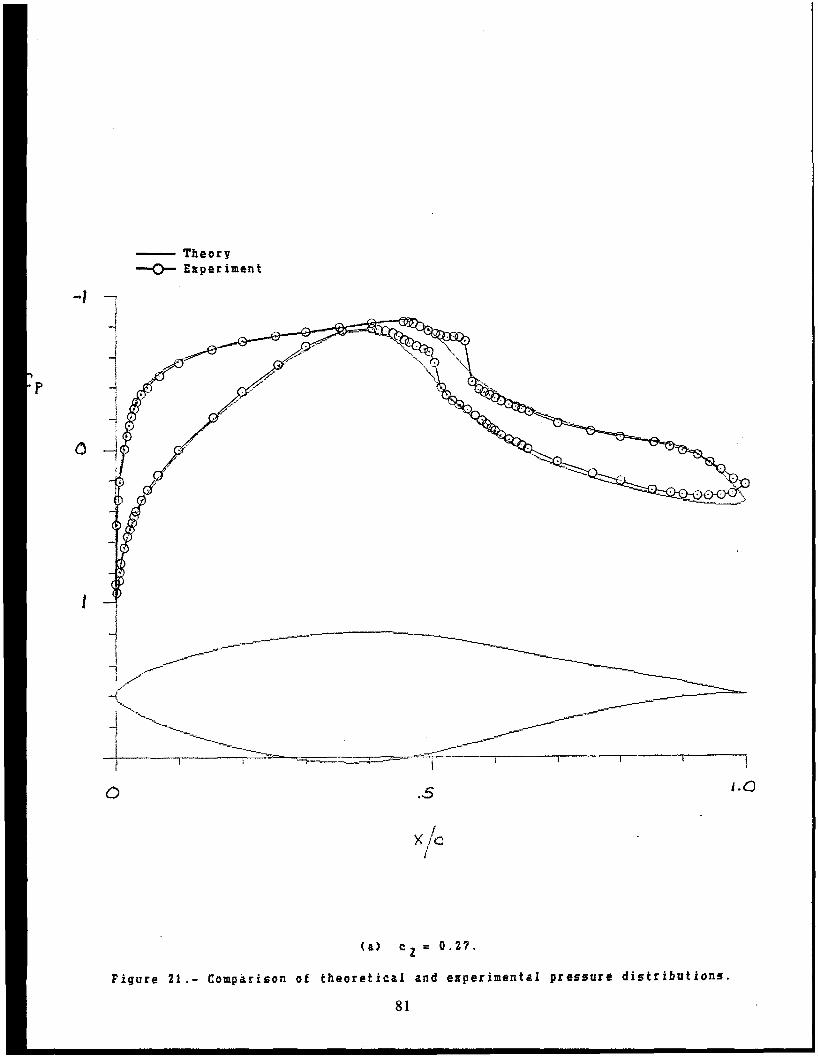
The comparison of theoretical and experimental pressure distributions is shown in figure 21. The pressuredistributions predicted by the method of references 7 and 8 are inviscid and incompressible. Theexperimental pressure distributions were obtained for a Reynolds number of 2.0 x 10⁶• At a lift coefficientof 0.27 (fig. 21(a», the agreement between the theoretical predictions and the experimental data is verygood except in those regions where laminar separation bubbles are present. These bubbles are not modeledin the method of references 7 and 8. At a lift coefficient of 0.77 (fig. 21(b», the decambering viscouseffects have become more apparent and the disparities include differences in the pressure gradients as wellas in the magnitudes of the pressure coefficients. At a lift coefficient of 1.01 (fig. 21(c», whichcorresponds to the experimental maximum lift coefficient, the agreement is relatively poor primarilybecause of the upper-surface, trailing-edge separation which is not modeled in the pressure distributionspredicted by the method of references 7 and 8.
Section Characteristics
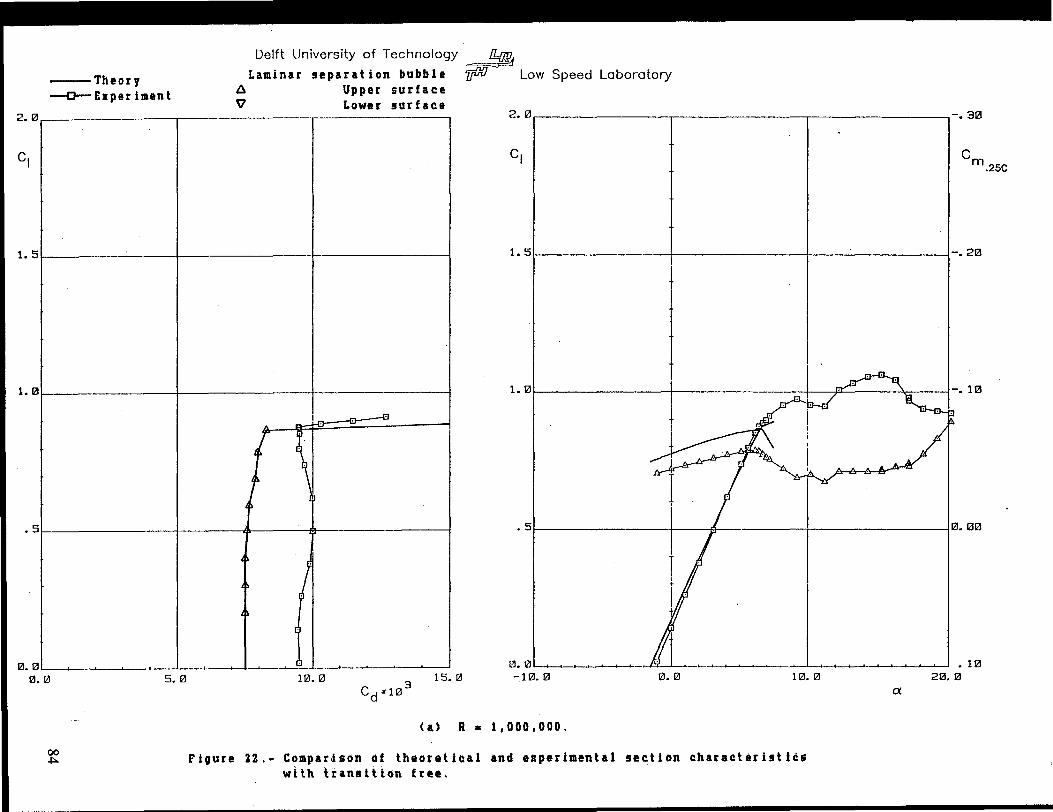
The comparison of theoretical and experimental section characteristics with transition free is shown infigure 22. The drag coefficients are underpredicted by the method of references 7 and 8, especially forthe lower Reynolds numbers. It should be noted, however, that significant, upper-surface laminarseparation bubbles are predicted by the method for a Reynolds number of 1.0 x 10⁶ (fig. 22(a». Theabnormal growth of the boundary layer that occurs within the laminar separation bubble is not accuratelypredicted by the method and, therefore, the drag coefficient is underpredicted. The affected dragcoefficients are indicated in figure 22 by triangles. As the Reynolds number is increased, the laminarseparation bubbles decrease in size and the agreement between the theoretical and experimental dragcoefficients improves significantly. The upper limit of the laminar bucket is generally overpredicted. Themagnitudes of the angle of attack for zero lift coefficient and the pitching-moment coefficients areoverpredicted because the boundary-Iayer-<iisplacement-iteration option of the method was not used. Theagreement between the theoretical and experimental lift-curve slopes and maximum lift coefficients is good.
11
The comparison of theoretical and experimental section characteristics with transition fIxed is shown infIgure 23. The drag coefficients appear to be generally underpredicted at low and high lift coefficientsbecause the experimental drag coefficients are probably too high because of the additional (pressure-drag)contribution due to the roughness itself, as previously discussed. Conversely, the experimental dragcoefficients at lift coefficients below 0.2 for a Reynolds number of 1.0 X 10⁶ (fIg. 23(a)), below 0.1 fora Reynolds number of 1.5 X 10⁶ (fIg. 23(b)), and below -0.2 for a Reynolds number of 2.0 X 10⁶
(fIg. 23(c)) are too low because the roughness was too small to force transition on the upper surface. Themagnitude of the angle of attack for zero lift coefficient is overpredicted because the boundary-layerdisplacement-iteration option of the method was not used. The lift-curve slopes are predicted well in spiteof the fact that the experimental lift coefficients are probably too low because of the abnormal roughnesseffect noted previously. The maximum lift coefficients appear to be generally overpredicted because ofthis effect. The magnitude of the pitching-moment coefficients is also overpredicted because of this effectand because the displacement-iteration option was not used.
Comparisons with Other Airfoils
The comparisons of the section characteristics of the S809 airfoil and the NACA 4421 and 23021 airfoils(ref. 4) with transition free for a Reynolds number of 3.0 X 10⁶ are shown in fIgures 24 and 25,respectively. The S809 airfoil exhibits a lower maximum lift coefficient (restrained) and lower dragcoefficients than do the NACA airfoils. The S809 airfoil produces less negative pitching-momentcoefficients than does the NACA 4421 airfoil and more negative ones than does the NACA 23021 airfoil.These comparisons confirm the achievement of the design objectives.
Concluding Remarks
A 21-percent-thick, laminar-flow airfoil, the S809, for horizontal-axis wind-turbine applications has beendesigned and analyzed theoretically and verified experimentally in the low-turbulence wind tunnel of theDelft University of Technology Low Speed Laboratory, The Netherlands. The two primary objectives ofrestrained maximum lift, insensitive to roughness, and low profile drag have been achieved. In addition,the airfoil exhibits a docile stall. Comparisons of the theoretical and experimental results show goodagreement. Comparisons with other airfoils illustrate the restrained maximum lift coefficient as well asthe lower profile-drag coefficients, thus confirming the achievement of the primary objectives.
Acknowledgments
The assistance of the staff of the Low Speed Laboratory of the Delft University of Technology is gratefullyacknowledged. In particular, the meticulous and persistent efforts ofLoek M. M. Boermans are sincerelyappreciated. Finally, the able assistance of James L. TangIer of the Solar Energy Research Institute isgladly noted.
References
1. Jacobs, Eastman N.; Ward, Kenneth E.; and Pinkerton, Robert M.: The Characteristics of 78Related Airfoil Sections from Tests in the Variable-Density Wind Tunnel. NACA Rep. 460, 1933.
2. Jacobs, Eastman N.; and Pinkerton, Robert M.: Tests in the Variable-Density Wind Tunnel ofRelated Airfoils Having the Maximum Camber Unusually far Forward. NACA Rep. 537, 1935.
12
3. Jacobs, EastmanN.; Pinkerton, RobertM.; and Greenberg, Harry: Tests of Related Forward-CamberAirfoils in the Variable-Density Wind Tunnel. NACA Rep. 610, 1937.
4. Abbott, Ira H.; Von Doenhoff, Albert E.; and Stivers, Louis S., Jr.: Summary of Airfoil Data.NACA Rep. 824, 1945. (Supersedes NACA WR L-560.)
5. Abbott, Ira H.; and Von Doenhoff, Albert E.: Theory of Wing Sections. Dover Publ., Inc., c.1959.
6. McGhee, Robert J.; Beasley, William D.; and Whitcomb, Richard T.: NASA Low- and MediumSpeed Airfoil Development. NASA TM-78709, 1979.
7. Eppler, Richard; and Somers, Dan M. : A Computer Program for the Design and Analysis of LowSpeed Airfoils. NASA TM-8021O, 1980.
8. Eppler, Richard; and Somers, Dan M.: Supplement To: A Computer Program for the Design andAnalysis of Low-Speed Airfoils. NASA TM-81862, 1980.
9. Somers, Dan M.: The S809 through S813 Airfoils. Airfoils, Inc., 1988. [Proprietary to NREL]
10. van Ingen, J. L.; Boermans, L. M. M.; and Blom, J. J. H.: Low-Speed Airfoil Section Research atDelft U~versity of Technology. ICAS-80-10.1, Munich, Oct. 1980.
11. Wortmann, F. X.: Experimental Investigations on New Laminar ProfIles for Gliders and Helicopters.TILlT.4906, British Minist. Aviat., Mar. 1960. (Translated from Z. Flugwissenschaften, Bd. 5,Heft 8, Aug. 1957, S. 228-243.)
12. The.Cambridge University Aeronautics Laboratory: The Measurement of Profile Drag by the PitotTraverse Method. R. & M. No. 1688, British A.R.C., 1937.
13. Allen, H. Julian; and Vincenti, Walter G.: Wall Interference in a Two-Dimensional-Flow WindTunnel, With Consideration of the Effect of Compressibility. NACA Rep. 782, 1944. (SupersedesNACA WR A-63.)
14. Hoerner, Sighard F.: Fluid-Dynamic Drag. Published by the author (Midland Park, New Jersey),1965.
15. Braslow, Albert L; and Knox, Eugene C.: Simplified Method for Determination of Critical Heightof Distributed Roughness Particles for Boundary-Layer Transition at Mach Numbers From 0 to 5.NACA TN 4363, 1958.
16. Loving, Donald L.; and Katzoff, S.: The Fluorescent-Oil Film Method and Other Techniques forBoundary-Layer Flow Visualization. NASA MEMO 3-17-59L, 1959.
17. Pfelminger, Werner: Investigations on Reductions of Friction on Wings, in Particular by Means ofBoundary Layer Suction. NACA TM 1181, 1947.
18. van Ingen, J. L.; and Boermans, L. M. M.: Research on Laminar Separation Bubbles at DelftUniversity of Technology in Relation to Low Reynolds Number Airfoil Aerodynamics. Proceedingsof the Conference on Low Reynolds Number Airfoil Aerodynamics, UNDAS-CP-77B123, Univ. ofNotre Dame, June 1985, pp. 89-124.
13
------------------------------------ ~-
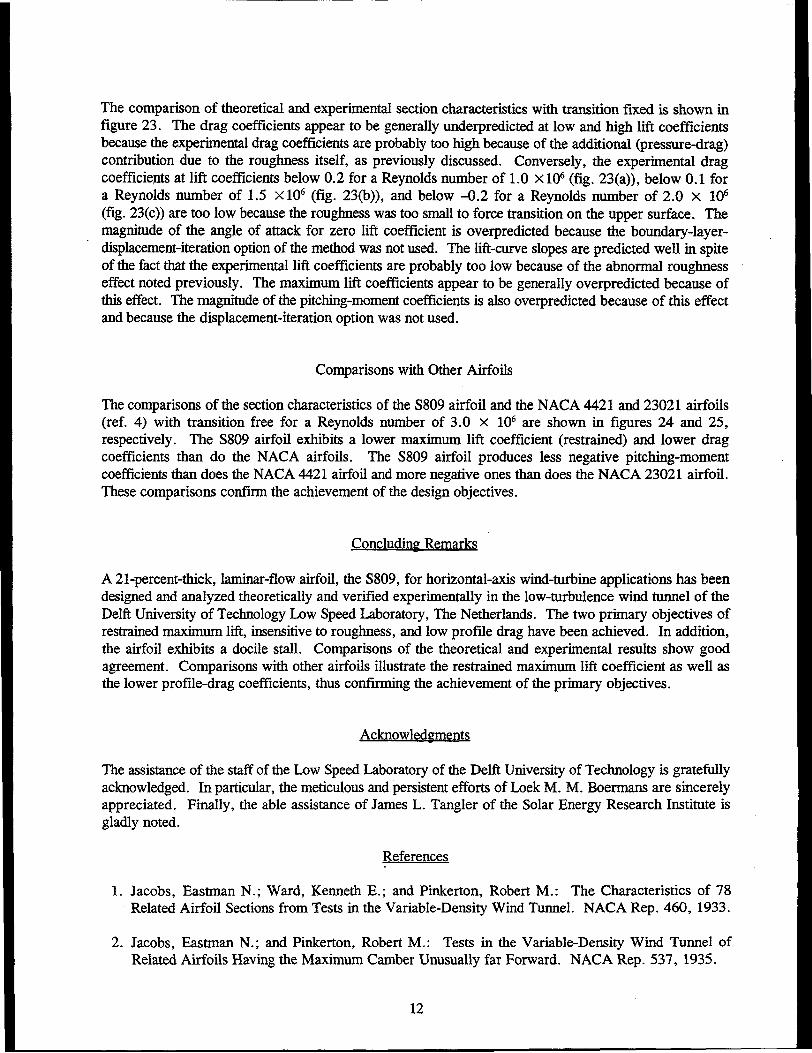
Table 1. Airfoil Design Specifications
Minimum lift coefficient -Maximum lift coefficient 1.0
"Design" lift coefficient 0.5
Lower limit of laminar bucket 0.2
Upper limit of laminar bucket 0.8
Zero-lift pitching-moment coefficient ~ -0.05
Reynolds number 2.0 x 10⁶
Thickness 0.21c
14
I z/c
Lower Surface
x/c
15
z/c
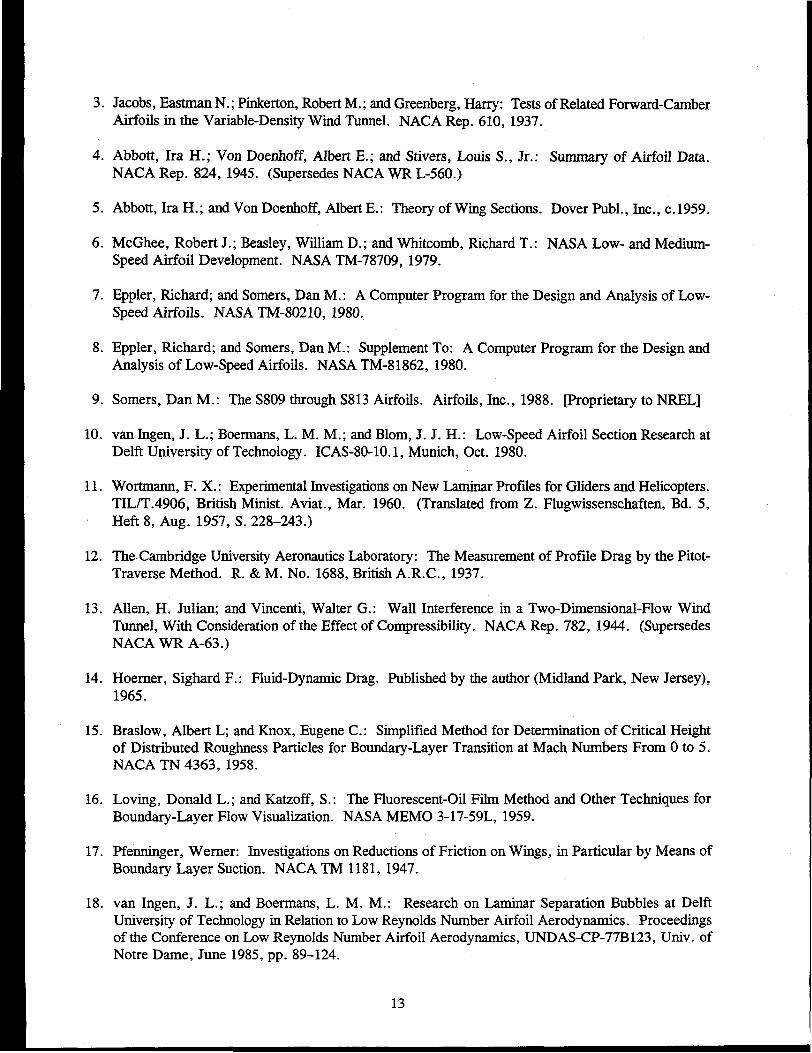
Table 2. S809 Airfoil Coordinates
Upper Surface
x/c
0.00037 0.00275 0.00140 -0.00498
.00575 .01166 .00933 -.01272
.01626 .02133 .02321 -.02162
.03158 .03136 .04223 -.03144
.05147 .04143 .06579 -.04199
.07568 .05132 .09325 -.05301
.10390 .06082 .12397 -.06408
.13580 .06972 .15752 -.07467
.17103 .07786 .19362 -.08447
.20920 .08505 .23175 -.09326
.24987 .09113 .27129 -.10060
.29259 .09594 .31188 -.10589
.33689 .09933 .35328 -.10866
.38223 .10109 .39541 -.10842
.42809 .10101 .43832 -.10484
.47384 .09843 .48234 -.09756
.52005 .09237 .52837 -.08697
.56801 .08356 .57663 -.07442
.61747 .07379 .62649 -.06112
.66718 .06403 .67710 -.04792
.71606 .05462 .72752 -.03558
.76314 .04578 .77668 -.02466
.80756 .03761 .82348 -.01559
.84854 .03017 .86677 -.00859
.88537 .02335 .90545 -.00370
.91763 .01694 .93852 -.00075
.94523 .01101 .96509 .00054
.96799 .00600 .98446 .00065
.98528 .00245 .99612 .00024
.99623 .00054 1.00000 .00000
1.00000 .00000
Table 3. Model Orifice Locations
Upper Surface Lower Surface
x1c x, rom y,mm x/c x, rom y,mm
0.000 0.0 127.0 0.002 1.2 128.0
.002 1.2 200.0 .004 2.4 129.0
.004 2.4 199.0 .006 3.6 130.0
.006 3.6 198.0 .008 4.8 131.0
.008 4.8 197.0 .012 7.2 132.0
.012 7.2 196.0 .016 9.6 133.0
.016 9.6 195.0 .020 12.0 134.0
.020 12.0 194.0 .024 14.4 135.0
.024 14.4 193.0 .028 16.8 136.0
.028 16.8 192.0 .032 19.2 137.0
.032 19.2 191.0 .040 24.0 138.0
.040 24.0 190.0 .048 28.8 139.0
.048 28.8 189.0 .064 38.4 141.0
.064 38.4 187.0 .100 60.0 145.0
.100 60.0 183.0 .150 90.0 150.0
.150 90.0 178.0 .200 120.0 155.0
.200 120.0 173.0 .250 150.0 160.0
.250 150.0 168.0 .300 180.0 165.0
.300 180.0 163.0 .350 210.0 170.0
.350 210.0 158.0 .400 240.0 175.0
.400 240.0 153.0 .410 246.0 176.0
.450 270.0 148.0 .420 252.0 177.0
.460 276.0 147.0 .430 258.0 178.0
.470 282.0 146.0 .440 264.0 179.0
.480 288.0 145.0 .450 270.0 180.0
.490 294.0 144.0 .460 276.0 181.0
.500 300.0 143.0 .470 282.0 182.0
.510 306.0 142.0 .480 288.0 183.0
.520 312.0 141.0 .490 294.0 184.0
.530 318.0 140.0 .500 300.0 185.0
.540 324.0 139.0 .510 306.0 186.0
16
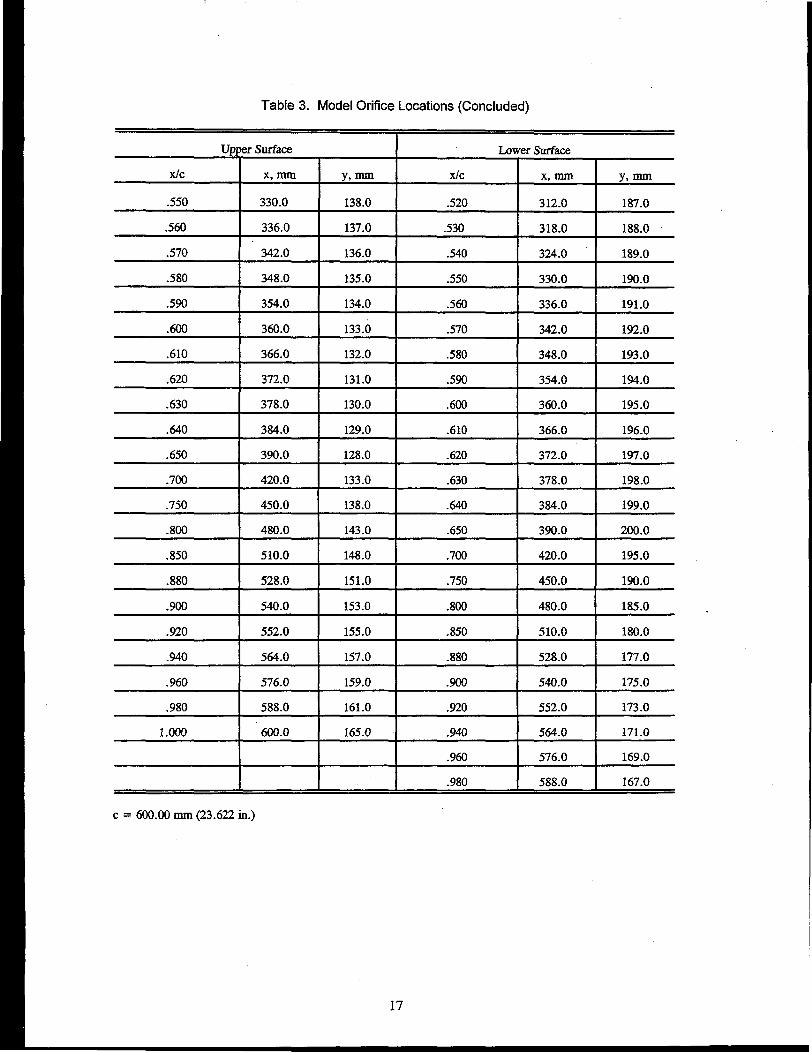
Table 3. Model Orifice Locations (Concluded)
Upper Surface Lower Surface
x1c x,nun .y,nun x1c x,nun y,nun
.550 330.0 138.0 .520 312.0 187.0
.560 336.0 137.0 .530 318.0 188.0
.570 342.0 136.0 .540 324.0 189.0
.580 348.0 135.0 .550 330.0 190.0
.590 354.0 134.0 .560 336.0 191.0
.600 360.0 133.0 .570 342.0 192.0
.610 366.0 132.0 .580 348.0 193.0
.620 372.0 131.0 .590 354.0 194.0
.630 378.0 130.0 .600 360.0 195.0
.640 384.0 129.0 .610 366.0 196.0
.650 390.0 128.0 .620 372.0 197.0
.700 420.0 133.0 .630 378.0 198.0
.750 450.0 138.0 .640 384.0 199.0
.800 480.0 143.0 .650 390.0 200.0
.850 510.0 148.0 .700 420.0 195.0
.880 528.0 151.0 .750 450.0 190.0
.900 540.0 153.0 .800 480.0 185.0
.920 552.0 155.0 .850 510.0 180.0
.940 564.0 157.0 .880 528.0 177.0
.960 576.0 159.0 .900 540.0 175.0
.980 588.0 161.0 .920 552.0 173.0
1.000 600.0 165.0 .940 564.0 171.0
.960 576.0 169.0
.980 588.0 167.0
c = 600.00 nun (23.622 in.)
17
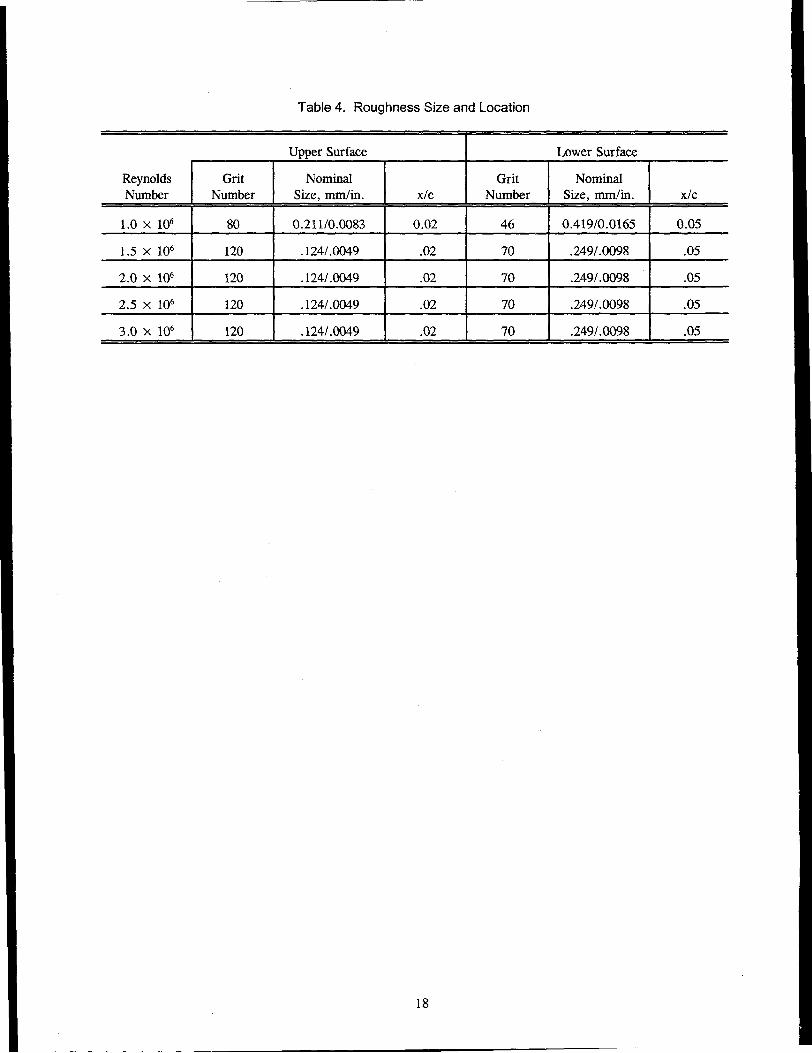
Table 4. Roughness Size and Location
Upper Surface Lower Surface
Reynolds Grit Nominal Grit NominalNumber Number Size, mm/in. x/c Number Size, mm/in. x/c
1.0 x 10⁶ 80 0.211/0.0083 0.02 46 0.419/0.0165 0.05
1.5 x 10⁶ 120 .124/.0049 .02 70 .249/.0098 .05
2.0 x 10⁶ 120 .124/.0049 .02 70 .249/.0098 .05
2.5 x 10⁶ 120 .124/.0049 .02 70 .249/.0098 .05
3.0 x 10⁶ 120 .124/.0049 .02 70 .249/.0098 .05
18
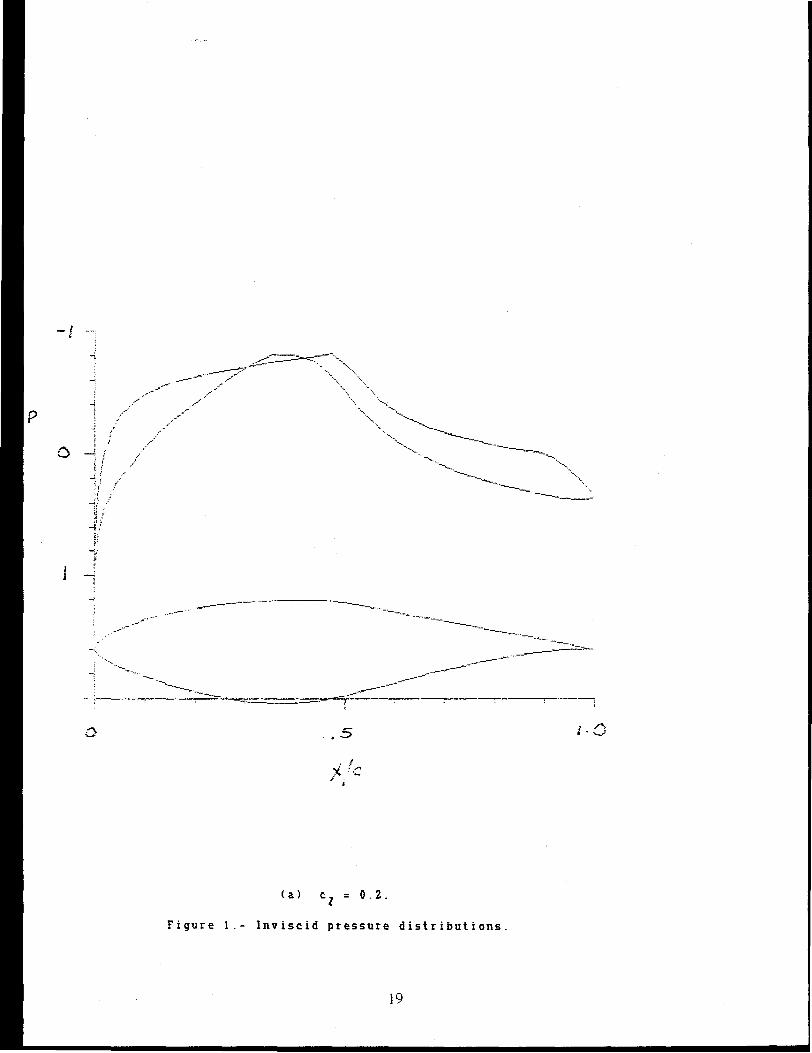
0.2.=
5
19
-- -----~..
. I'X,'C,-
I
( a. )
Inviscid pressure distributions.
------
Figure
-_.-- ."
---
-_....-..------
-----------------------------.......
-~-----
_:":::==-i-..---~~-_ ..~
---------------------~---~------ ---~-
.-.-}--.-.~---. :--.--~- __~·---=---=.:;l:.:.------------·_~----...,.---
-i
-<
....
P ii
,1
0 -l .i,
~ ~lr i
-2f~t"(,
J
\
-'i
-'.
-<
--;l,i,
r' l
P --l'- I;
jti
-j0 I
(,
~....:~
'ih:~
~~iil'-j!t ~i: ..'
-p /n
',-,..-.
-,
..--.-~~-
c
'''~''.-....
.~-~-~--- -------._---,--\•.
~._r
-'/
.---~----...
( b)
Figure
.....
---. ..-------------------------
..------ ---- -----_..
= 0.8.
Concluded.
20
-------------_.--
21
----------_.------_...--:------
--~--
Figure 2.- 5809 airfoil shape.
---
------------_._- ---------- --------._--_.---- -----
..---------- -------Lf.'_'_-_/_- ...:... ---__~_==__~---~.-
~
II~
_ Fan or.d straighteners_ Moler_ C<:rnef vane s_ Selilirg chanoo-_ Oiffussi->g saeco_ Tt..rWence screens_ Screen sIc.- en:x:m_ Cmlroctm_ ~o!je lest seclico_ Diffuser_ S<!o..rity saecn_ SpiCer web_ Screen_ 6 carp. bdanal
1 Sci'roelo;ge<)OOt2 AondijfJm\or3 HockschoepenI. Suskamer
,5 Exponsiegoas6 AnLh.rbJentic()<lleo7 Gazeroer9!iaols8 tns\roomlui\9 VerY<iSsclbare mcclp\:lcts
10 l)lIusor11 \l:ng.goos12 SptY--.ewebo GoesV. Krochlcrvneelsyslecm
o 2 L 6 8 10 ~~.~alt" a ¢uc c:a::l.d!:":;« ~~
--88BEfT
IT
BBBB~:~~(""""'~
CD
~
r~~'~T~':[':.r'..~~~~·;.l'
, I "/,x//.u2d/Z/7/./1/L///?/L'//Z/?//2l?72////77777/ // /// ///~ ~
~~~\
f1 (--,o 'IV: \~9~~\ ,,~ . Q.. .:p \ MI \' It, III ,BIS1 r . -. ." . \.. ! 1:
- !~ y '$ ~ (\Z) II I"'~"':-""'::'''''''\''\'''-''00'''''''''' ...,;S:~ .~ ~ / I::::::iL~v I ~~ . ,"'!=t'. I i 'I==t~ '0 I ~\ . I± - 111 'f ' ~~ 0: I ~I+< if l' .,' ~ J3:St ....~\ I~ r-......'-- "-....: 'rA .1'... ,,' ~.
~ ~I @ 8 I '-- J,"'- . ~ 'I;-~~ --@-'-®c-'-!--@ -------.-€r -!-~~~tj @ I~ .~ V;:: ., i~l
rrrfp; ,h~1J~~I_4_If\ I ~ ,.~\I ~
~ I ~~. ~~ ~ ~ ... ' '" "; , .. I,l\ I ~ ~"'t- ............ ,...... ~~ y ., ~ 'I'" I~ ~'" "" ,'I ~ ' I" ' ~~~ I . I" I
I CD r.; iI .. . 1. " I
Il~~" . / ~ i '2'0-lC- "w,,,,-,,, ~"', I ~~ ? ,I, i 1./
0.., . ~ ~ ! I <-~ '1~ ~ C' I
. ~~ .. _ ~. .. -rt . . '. . l---t-II 11. ~ -JJ f 1)..;>-=-0 .' .4 ., R.m 1:;::m G-l ~ l) ~ rr V"-. ~-2!h, ~ ! I Ji'q,~
~0 i @ - ®lVj 1< i.~~~_\~ i "'\"":~""""'\""'''''''''''''''''''''''''0.......,,,..................,\-,,'0~''''''~~''''''''''''''''''''''''''''''''''~''''''''''0 ~""""""'~~"', ..................~~~~~ ~~~~~~~~""$/ ~~~\ / ~
Figure 3.- Delft University of Technology 1.80- K 1.2S-m low-speed wind tunnel.

wake rake
ol/")N
aa<"'l
1800
wake-rake strut
300
t
OIl( V
axis of rotation at O.25c
J,I
600
II
::-:':=!k r~
C>'-4If)
rcglon of pressure orifices
Figure 4.- Model and wake rakes mounted in test section. All dimensions arein mm.
Figure 5.- Photograph of wake rakes mounted on strut.
24

25
Figure 0.- ~ake rakes.
N
BA
Inter,rating
wakerake
Total-pressure wakerake
21 mIll
Static-pressure wakerake
24 tubes s~acing 3 rom
12 tubes spacinp. 12 mm
36 tubes spac~ng 3 mrnA
6---0---0---<>--0---0--....0---<>---0------0---0----0
79.5 rom
~Not connected
pressure tubes
Spacing 6 rom
Spacing 12 rom
B
51 rom
f'-;:;-.!?_. I
-!l( 1 ~!Ij ) . d_l ..!N---~~ ~'T-' 221:fi ~-
II
{jf-- ---- --I
I
Figure 7.- Static-pressure, integrating, and total-pressure wake-rake tubes.All dimensions are in mm.
26
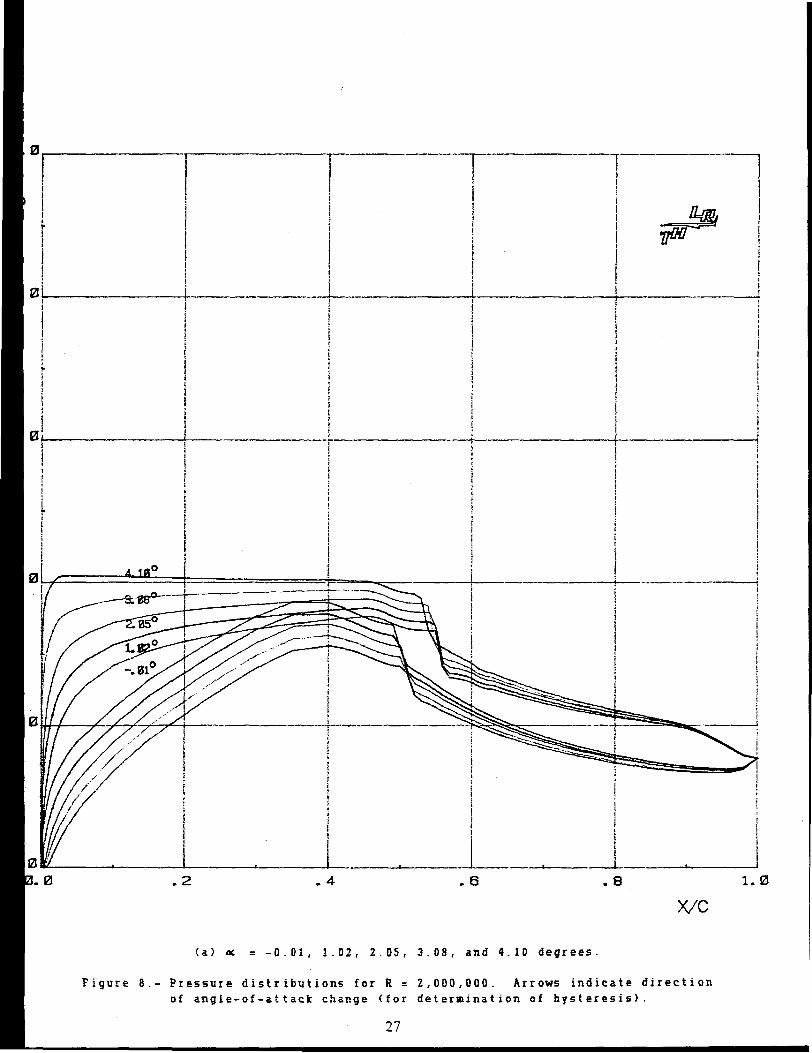
Figure 8.- Pressure distributions for R = 2,000,000. Arrows indieate directionof angle-of-attack change (for determination of hysteresis).
27
1--1\ I
I !I 1JiHllf:/llJ iI II I
! !
i !i It __-----l
I 1i I
',' .I i: IiI it !j 1I i! II i! i
---t--1i
--~--_.._--
,
i
J I--------~----~
.8 1.0
X/C
.6
-TiII!I!!
il;I
.4
!i1i1I
!1
1i1)
---rIiiI
iI!,,lII
i!
(a) « = -0.01, 1.02/ 2.D5, 3.08, and 4.10 degrees.
r-I
!
IIiI
i
.2
o
r
-------------------------------------- .. -
.8
.;
}. [----+r----·-------~
I •
~ !! ~,
----t----------.----;
.6
,._._._-_.~ ...~.~_.----'"'--- -
.4
i!I
! ~,~~~:::=J.----.......--·-------.3Qjis;;:~oic:- ---- .. -.... -.------- .-1-----iI
I
.2
!!.
it: !
I i I j~ ~ ...&- l __. . L -I' '~_
0. 01----.--------.,;.L,/."..~,..c
-1.0~_ i \--"'~---~-....... -.....--4~~l--~··---· ...--·---!--· --_.._-
I !
-4.I?l, 1 _Cp ! !
Ij!ii
I I I-3. 0 ..' 1- . !-----~ .__+_-------------.~.------ ..-.----.-~-~+---.-----.-- ...----4
} ~ t ;t ( ! i
: ! I .~ . .,j\
i,
iI
~ ,I ' I
~'r--\lt,------------i-------------;--·-----------r----·--i !I 1i .,II
X/c
(b) '" = 5_13,6.1.6. 7.17, 8.20, and 9.22 degrees.
Figure S.- Continued.
28

Figure 6.- Continued.
(c) 0( = 10.21, 11.21, 12.22, 13.24, and 14.24 degrees.
X/c
: j------t--------..--------r--------.---~; II ..
29
r!,~
.·--.-----T-----------·l--------T-·---···--····-l-·----···--· -. '-'-1! ; : I I~ ! Ii!t ! : • Il.nn. t
i! i 7JilllZJff!f 1
I ;,iI ;
! ! ' I I-··-----t--------··--r-----------~!-··_······--··--'---·-r--·-------· I
i t il ' •
I' ;
p
1•
X/c. 8
--·····-r-----···-1111
.6.4
30
Figure 8.- Continued.
15.24, 16.24, 17.23, 18.20, 19.17, and 20.15 degrees.
.2
(d) Ol
-4. 0..----------r---.·-.------r--.·.··.-·.--··--..-..T·.·-.,..,·.
i I II , i1 i i~ ! ~
I ,
! \l,II ; .
-3.0~~____ ill i l...-...-----.~ ~t--_·~-~· ... _·_----·----r----------,.-.-..'--....--r·_·----~·_·· ..._..._..--r·-------~·--l~ :
i
. ,~ ) ~ }
- 2. 0 +--+'c- \-'\~-,..,7...",-tr---{i--·---·-·.. • .. ···-···..---+-··_·-_..·----t--------·-------r---·--i . ~. :
1

31
Figure 8.- Continued.
~
l . :·-....r--·--·-·-.-.....------'-···--l·-~·- ..··-· ..---------'-- --,,;.,,~-~, }~ !; ~
ii
.;,I
Il
!!
~ \ i t
_.--- -~ --.... {.--... .---...'--.__.---·--------t··~--..----·---· ~""--'"-.-t---.-.... ..,. ... ------. -~ ..._-~~ ~ ~ :
, 1
~ ~l!
(e) 0( = 20.14L 19.16,., 18.19.., 17.2H, 16.24L and 15.24+ degrees.
15.l0..t6.~o ~
17.2° •j
~ !....,.-.. ..... ...)....__.. ...~~~~ ....._.""'__ .. _.....~--i. .....-..I Ij;jI
.!t t ~ . ~
~---- ,,-., --.- -I ------··-·~·--··-····~--r-----·---------··-·-----r--··· .._...---- -"'-'---r' "-'-"'~"'----"-'-'-----;, .; i
4. fa
3. fl3
121~__,,,,_, ~_. __._.,... r,.~.~_ - - _ ""-- -----.----1------ ~. ~~,~.,._- ---L-., '-"'.._-"-..---------.»L.. "_.,,.,_- .-~ _: i .
~ I
·i !..
1•.8.6
-'~-'-T--""----'-'-"" '" .--..-" ..-. r" '.--.._--.-. '-..-,.-'..--.-• 1.
1:, !
• 4
c::::-:::::::~~:::......;:::y- .....---...... -.-,-+..........~- ..----..---,--, ..... ~- ...~- ...-4-.--..--~ .....~ ..._-_........----! 1! ;i .I
ii
.2
,..~
0L-,' .. ,. -!-... __.__~__",. __ .._,- .~Ii_.-__ I ;•.__._~~ .._~~.• -.........--...... ~-:r, ....-- ..... ,~ .... -.·~ ....-r·--'.. -· ..,---... ,..~------ ........--
I ;! II '
iI
i
Li
!;-1. 0;~: _
-2.
-3.
y../c
(f) 0( = -0,01, -1.04, -2.06, -3.09, and -4.12 degrees.
Figure 8.- Continued.
32
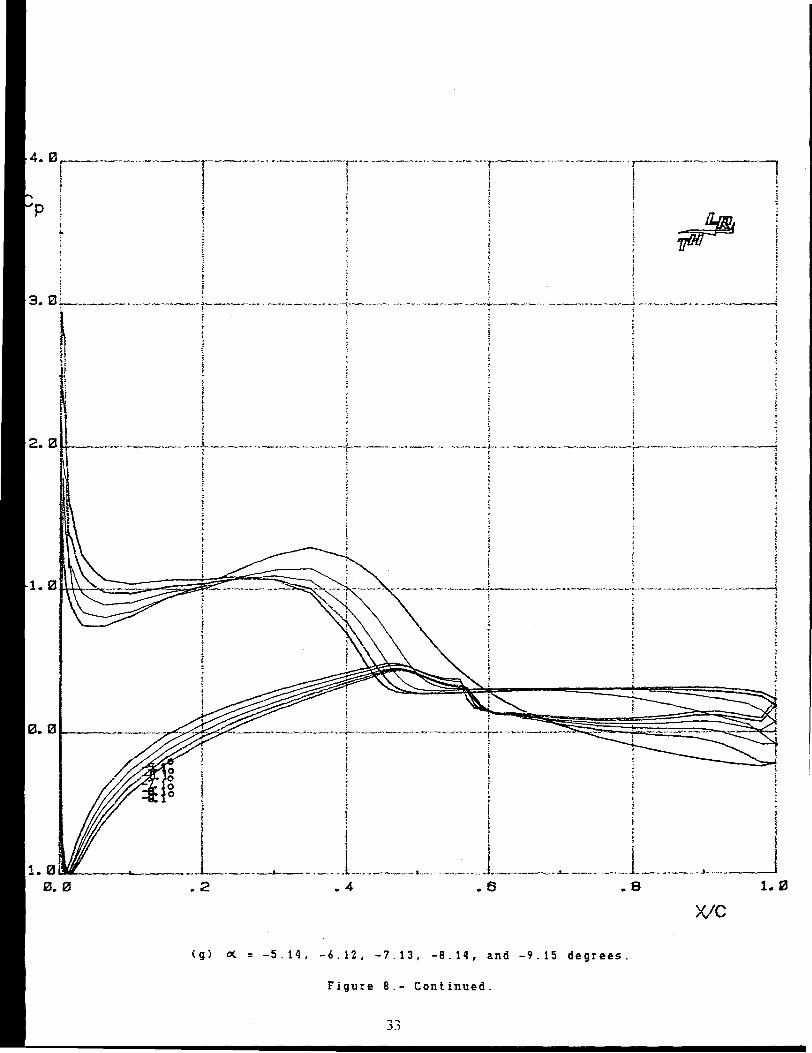
Figure 8.- Continued .
(g) 0{ = -5.14, -6.12, -7.13, -8.14, a.nd -9.15 degrees.
1.. 0
X/c.8
~'-------...-.. -----,.-~ ....,-t ....-....,..'_ ..._-... _.-....... - _.. -'.~"' .......---;
i
.6
j;I
---, __~.• _o -~- ..---------_..---.,.--!-~-.- -----..- - -______1~ ! i, I,
;I II i I
.._1~._.__ 1__ ._._.___J
Ij ;
~. ~ __•. -,,,,,.~ ' _ •••• _ • ..-._~ _ .. ~•• _,.. ~. J _ • .......--_~ •• _._.,_._ _ .."_ ~.., _ __•. ~ _ ••'"_"' ..J._ ____4~ i
.I
I;;
~...>~ ..~._-_._••••••••• t.-..------ .. _h."._...._.... ~_----- ' .•. ----, '.I ,
! '
..,..,
.:U
1,
i,; ;• I
__~._ ..l_...~_._L,. ....2 .4
.3. 0~__,.__. ,," _.~_.._-_.-l-----_ --- -,,'._-- -_.J.~-- .-, .-- -~.,''''-''_.'-' ._ .."_,--,.-
-4.. 0 .-_.~,." ._-'._.., "'1"--_ _-.. ",._--~' ..---- ·..·r..·-_ ..I!i
. _ - _.- .._.1" .., -..-...•-.~.- ..t1
-T >0--' -._- •••__ ..- .......- ..-
I,
-3.. 0I
-2.. 0
0.. 0
1 .. 00 .. 0
;,!
__-""._.~ ...~_........_ - ..........t."-_~ ......... ~ .__ ,_~ ..,_~._. ._."r__ -l.-_~_.... .,.._. __.... ...,... p ~ ......_-. ... ..L .. __..__ a. "' ._...- .............
~ J 1~ 1 \
fi
.. 8
X/c
(h) 0( = -10.16. -11.17. -12.18, 13.19, and -14.23 degrees.
Figure 8.- Continued.
34
._--.. _.-------_ .._._-------,-jI-!
)1Iii
! !
~ ... ._..._._.__.__ .L. .__~ ~.8 1. ~.6
~ ;..-.-.- .. -t'~._----'~-- ....-..-_--...... -- .....-'...... ---~.:,.,' .-.- ... -- ..-- .. -,.... _~ ,..-..-,-"",--~. ,1!
.4
1,,
[ II ,! j
_.J .__ ..._. ._J
.,,.,i' 1
.... - ...-L......... 4 ..... _ ......-.,._ ....._ ._~.......~ ...... "~'" ....._-i'l.. r ~_~ __"." .0 .. , •• .:- ._~ , .......-.--. ...... __~., ..........~ ......__ • __ .. ~__._._~
, ~ ;(
.i i :._... _ .. ~.- ...-.,;: ... -.f-,.. 'v-.-....--..-...........--- ..---....---~~..-- .... - ...'-...- ..- ........-~-.. _----- ~_..._,. .... ··w •• ----...-•.,.- ••--. ,,
ii,
i
l ! ~,. ---- ----. ---~·-..,.,--'·r· ---,..- ~ .._-- _ _, .. _.. --,--~,~,---",~.---, ,'-_._..--_" ,·· ..-------f-- "r~· ""- '''- .--.. .._.-,-- - "",--_._.~
\ -_....-.,.----,'- -_."'----
'\_17. 0
Ii
1i
1. 0~~_.__'O"___ k_._.l ~.0. e .2
Figure 8.- Continued.
35
X/c
(i) 0( = -15.23, -15.23, -16.20, and -17.17 degrees.
iI1.I\
ftI0. £I!t"' . .__... ,. "._.0' . _
I!,
-1. £I
- 3. 0L...-..-. -. -...__ .._L ._._._,... ... ---.-...----J---.~-----.- ...
Figure 8.- Concluded.
36
(j) 0( = -16.20t, -14.23t, -13.231', -12.11t, a.nd -11.17t degrees.
• 8.6.4
1,,:",~.--~~_ _ _._. l...-._. ._ __,..."._._.~<!'.", __ ~-..-.-.,~~-,,,> --. _, ~..--...,...__ __~ :.c:- •.~ __•. _ ..- _
.2
X/c
jII
! ; I il • : 1
1. '"~__... -_J ~ ~.~ .,__.J_~. .~~_-_-.._.__.__J_< ~__...... ..._1. ,_.__.........._ .0.0
-1.0
Cp IIII·i
-8.0 1
(a) ex = 0.0 degrees.
Figure 9.- Oil-flow photographs of upper surface for R = 1,000,000.
37
(b) IX. = 2.1 degrees.
Figure 9.- Continued.
38

(c) 0( = 4.1 degrees.
Figure 9.- Continued.
39
(d) 0( = 6.2 degrees.
Figure 9.- Concluded.
40

~
~$~~
~
~
~
(a) C( = 0.0 degrees.
Figure 10.- Oil-flow photographs of upper surface for R = 2,000,000.
41
<b) 0{ = Z.1 degrees.
Yigure 10.- Continued.
42

(c) oc. = 4.1 degrees.
Figure 10.- Continued.
43
(d) ~ = 5.1 degrees.
Figure 10.- Continued.
44
'T.I.... III&Cl .....c:... R-III
- IIco
0-f .
~N
Ul n0 Co:::I 11II.... \Q.... ...:::I 11IIc: IPIII Ul0.

<f) 0<. = 7.2 degrees.
Figure 10.- Continued.
46
(9) at = 8.2 degrees.
Figure 10.- Continued.
47

(h) O{ .. 9.2 degrees.
Figure 10.- Coneluded.
48
(a) c><.. = O. 0 degr ees .
Figure 11.- Oil-flow photographs of upper surface for R =3,000,000.
49
..,.... t::r'lQ,::...
~rl>
.... II....N
IVl -0 n
0 g.::l III.... I,Q.... ..,::l IIIc: IIIIII IIIPo

(e) ~ = 4.1 degrees.
Figure 11.- Concluded.
51
(a) 0( = 0.0 degrees.
Figure 12.- Oil-flow photographs of lower surface for R = 1.000,000.
52
(b) 0( = 5.4 degrees.
Figure 12.- Concluded.
53

(a) Cl(. = 0.0 degrees.
Figure 13.- Oil-flow photographs of lower surface for R = 2,000,000.
S4
(b) ~ = 5.4 degrees.
Figure 13.- Concluded.
55
.........t.Qdf1III
.-
.c.
I
0.....-I.....-0t
'Cl::r'0.... III0
t.Qf1
~til'Cl::r' II
VI III0\ CO
0.... 0
..- a.0 III~ II:lIII f1f1 III
IIIIII IIIC
'"....til
"III....0f1
::0
II
w.000.00Clt

o<e)
/5
/0 «
Spanwise positionX 'Jake rake+ Pressure orifices
"*'
Vl00
.,. Upper s~rface
~
of(
+:
Lower sur face
s
'II<)--....... ~ L..--.J
~~~·-i ------;.::.'--...-----i Hcoil(
+>tIt
'l/( ...
of/< 'II
of'( ..
It' •
, ., , • " • " ... < iii t t f
.f} I O.S 1.0
(a) R. 1,000,000.
il(. it '1.0':/c
Figure 15.- Transition location. Batl eatend from begittning to end oftr ans it ion.


/S f X Wake rake~ Pressure orifices
0« 0)
VI\0
/0
5'
...
l{'"
+
Upper surface
•
-+X'
...."
iIC
if
+X~'.......al- 1---. I ~r-l+
ofI(f:
if '*ii'l f.
ofK ..
-t'.( .."
Lower surface
o _ I I ..J..- L- . ~..1..1•...J!~. . .....__.~_ ..1. ....1.....-'TI\- ~
D.Sil( :t:
(b) R = 1,500,000.
Figure 15.- Continued.
I l---J_
1.0
~l/c.
*10
$
Spanwise positionX Wake rake+ Pressure orifices
Upper surface
+x
Lower surface
+
-IS l
-
TX
'i'X
+x
(c) R = 2,000,000.
Figure 15.- Continued.
60
Spanwise positionX Wake rake+ Pressure orifices
/5
0( to)
0\......
/0 ~
-ll-
:+
!to
Upper surface
+x
~
*'Ii<
Lower sur face
H ..,.H-H
J-f
S~1--1 .,.
I--·-H iii...~
oj,(-l/(
iX 1'(
"""-fo;
0/1( +;
0 I I I ! ,+~
a'S"'
il( ...( d) R = 2,500,000.
Figure 15.- Continued.
'1-T/c.
1.0

0{ lO)
Spanwise position/51)( Wake rake
~ Pressure orifices
10 r"",
.....
+x
oj,(
Ri
s
*
'!t-
Upper surface
""..+l< .. ...
1-1
+x
Lower surface1;(
+x
of/(.--.....,
*;fl<<fI(if(
i'I( 'It:
ill ~
oil< +
ar to
"'" .,,:}<r/c.
(e) R = 3,000,000.
Figure 15.- Concluded.
45.0 Sill. 0Ywakerake (em)
40. 0
----_._- --- ------1 ~
----J--- ! ---
-----,-~...------r
I--- -------t---
· 1-'-s-J1L- ----- I
I_____ .&-__1- .&---.-.1---
35. III30.025.0
-4- II I
I I
-L----l-----t---III I a
., --ll1-----rr-G-·~---a"""l.il-1!Ia t-I:L-I
20.0
___'- • __ ....L I--_~_ .... •• __&-.__L... ....__....__--I- ... __ l -1- ..__ 1. .. --1 __ ~.j ..... __ • _ • __._ .._~I_.__ l.
·1 •.-.-- ----.------
15. III
IIII S t------.,...--I!t- ~--s-_a__-r----I11---e--~--
'" III B
HU
m-e--s-----s
5. III0.0
5. "L-~ __i--.' _~_._. l __ .I- I __.'_.__ ,, __ ._l .~._~.._- _ ..._ .... 1
7.IIlLm s s s
9. III 1 I
13. III 1--1-----
0'1 11. III 1 I +--w
N~d"'I r---T----r-----T------ir----T------I --rI I
-f---- I
(a) ex • o.° degrees.
Figure 16.- Spanwis8 drag coeffitients for R • 2,000,000.
9.0
('E~dI~'I--~------~---·--r---~---~--- I----~--~-r~~---~-r~-~---!.--._--~---~----~---~~r~---~~-r~~:-l~ • ,. I. nn I
0\ 11 01 r t' I 1 j " ! I j~ .1.__._..... .------ --------J--..------- . 1 II 1"-""--"'-'-'- ------- .J- iI
--I ---------: .---.----- -----------,...------------iI I I I i II! I I"
I i I I I I.-----i------.--.t-..-.....------~t_---- ...-- ..---------. 1---- I l' I,'
I ·---·---1------·------- -- ·------t--: ' -----·--r------------j
I I ' :I
I I I'I i
I I! I II I, i I II
7.9· •. lL.!!!_~_
~" . , , . L._.__~J~_~_1_~ ~.1__,,_J .~,_.L __.-,_L,__.__._~.J-~-'-'- ,~~L .._~ .,_,J0. 0 5.0 10.0 15. 0 20.0 25.0 30.0 35.0 40. 0 45. 0 50. 0
Ywokeroke (em)
(b) ~= 3.1 degrees.
65
..j
4'
i9ii
Il
Iy
\jjI
I,..ia\\V
}
vii
.&
Iw
\aII
V
\eo}
\I!.JI
vI!
"Ii..I\I
a
\i;
14
vi
i
1
Figure 16.- Concluded.
~ , 1 t9 3
(c) 0(, = 5.4 degrees.
r.7
10

Delft University of Technology !ffJJJ7JOO Low Speed Laboratory
Cm.25C
• 1l2l212l.12l1121.121l2l. 121
C1
2.121, , I ,-.3121
1.51 I I 1-. 2121
ex
• 51 I a I 1121• 1313
1. 1211 I I JiT"= \.... I • 112l
121 .. (211 , It. It' I Li' I I t I I I I I ' I I I I • I I I I • J
-1l2l.12115.121
Cd *11213
1121. 1215.121
--,---._------------------
i
I
--B
r -.:.
~
\j
Jt·
~
.5
C,
2.121
1.5
1.121
12l. 121121.13
(a) R = 1,000,000.
0\0\
Figure 17.- Section characteristics.
Delft University of. Technology lfJJ&1JOO Low Speed Laboratory
• 5l---··--········----i--·······--····--·,... ---·---.....·-·-·..--.-~-...- ..I I
r I"
...l .... _._.~_ ..._...._L.~ ....~.j __._.J_... ~_~_.~J
-.2121
__J.,.t
I
--._-.--..._.T··-·-···---~-···r·-· ----_....'-'l-·ca•
~ I ! m.25C
IC1
I1. 51 .-------....--_-...----_.._._.._~ -----.----.--- ...--
2. ta
t
1•• ' •__ ._._._._..1'_r I .--.....----.-I --
~ r.
I ; I ,.
•5~ ··t·_-··----.-.-.1.--.------.--l12l. tal2l
II!
•••L....-.".~"_.•~.~_L" ...._"~.•_"..•_L.~..~.•_.~_~.•.J.,.-1121.121 tao ta 1121.121 2121.121
ex
'-'--l
II
Cd *1121 3 . 15.1211tao 121
······..·-r·-·--······I
5.121tao 121
I I I~ I i ~1.5 _ _ _ _ _ _-.-"1'._.. _._ _ _-- --_..--.. ---.- - -.~ ,
I I I
.....-.- + _ -·····-----1·-~· -----..--.--
C1
1. ta
---- ·1--·····2. tar--- ".
I
0\-...l
(b) R = 1,500,000.
Figure 17.- Cont~nued.

Delft University of Technology ~-!!it&
1JfHJ Low Speed Laboratory
a
.5
fil. fil-1fil.0
2.121
1..-----.-.--...-...
1------.--.----.-.-.
1
.....---..-..__. . -. SIZI
C1
t lI CI r I m.25C
. I1 ... . I
rTIT I .
I! I I1 I I, I ~
1.121 I .'r-.-.------l-------~~.:_- .---1-.1121
I I ro
I ]iJ I / I
Il;a---Ar - - I
_____.. ._+_._... _._.__.... . I: - .. --..- ..----.-.---.----1121. 0121
t . I1 I I
--I- L:l l J J.. _ ...._.4__ ."',_~1~_ .....~ ~~_'--....-....~ __ ...--...-_........._~J,....~ -f..121. 121 .. . -J.-' _........ • 101fil.0 2121.121S 15.0
Cd *1121
(1) Positive lift coefficients.
1121.1115.0
II
_ ......_. .. .....,.------1.:1-.....-.... -_....._._~ .... - ......--.- ... ----- ..-
\
I II I
._ ~ _.__J_ __ __ .._.._._.L_ ~ _.
.5
1.5
121. 121121. 121
...............·-·-..·-....··~-···-·-lI
I \I I
I I
, It-····· ..----.--..-.----------l
. I Ii I II I
. l I It ! I I
1. 0r-----..--..----t·---··-.--·--+--.. ----.....~Ii'
:T----
0\00 (c) R = 2,000,000.

CIlI>
S
I~!~ (I)i S...
*-0-o
j,I!;
!~
I~,I1
S...'S
I~i,! tSIi,!if
IsI •is!1I
!!!IsI, .,IS~ ...
!I
,,II
UI-l:I CIl
I C)
.-J~........CIl
IDS '0N
..:' C)
I -........I
!___~--------_____!S
~ui
;i I iI (
,~GL. IID S IDISS 69. . .I .... ....
I I
S S... S
I ISS-------T---·--·-------,-------! I! ;1 II 1, i, I. ,~I! !I I
! ~-l--~-+---l-Il--~ i
!
I I
,,,T
---------I----·------r-------~----
.l. I t
! I'!, I It .,I !.l. II ii '+ !I ;--1,--------- i-
i
t 1
I I\I!
o
o10"l
S E S(I) 0 N( I
I-'--'-~
i !i !t I,
i...Ir
i--_--+--+-.-e::,.+--+---+--I---l-'I
TiT,
+tI ., I
~'----_._--_.+---------+~i t i
+ f
+ i
t I
L l ~ID S ID
ISS r
~o.....eo
..0
.3-0<0<00.
(/)
;0;o
.....J
.....-Q)o
-o~.~
<0>'c::J
Delft University of Technology ytKJ!Jfl& Low Speed Laboratory
Cm.25C
• H'l213.121
ex113. 13
j Pe r;( 1-. 113
121. 13
• 51 I pl I i13• 1313
1.51 I I 1-. 213
f21. t2J I • I • • I , t , '1 I
-113.13
1. 131 1
c,2.13, I - , ,-.3121
15.121
Cd *11213
1121. 1215.13
i
l
,---~q~
j I,
~
I-
I'
n -
.5
1. 121
2.121
1.5
C1
121.121121.121
-...)o
(d) R = 2,500,000.

•...='GO-J&t
71
D &"'--
ooo
tsl
trl... •....(l)
tsl...*"'0()
tsl....
tsltsl....lSI
tsl....
...
tslC\I
(.)It)C'j
E()
tsl(l)
I'
tsl
C\I
\tsl
trl
If)
u , tsltsl
... ,If)
1, tsl
1 ~.
,i
..
.(.
\ ~~.
tsl
~ lS
. If)
(), lSI
tsl
... ,If)
,
co
-oJ
eo
.Do
..J
"'0lI)lI)Q.
(f)
3=.3
-oJ~lI)o
Trans i ti ono FreeC Filed
Delft University of Technology !f:fJHJ1JiKl Low Speed Laboratory
Cm.25C
.102121.l2J1121.00.0
.51 I fiJI I 1l2J·l2J12I
C1
2.0, , I _ ,-.30
ex
1.01 I I y:rr:: -~ 1-. 1121
t
1.5\ I I \-.20
0.1211 • I I , • fl. If I I· • • , , « , , , I , I , • I • • • ' J
-1121.1213121.l2J
Cd *11213
2l2J.12I1121.121
-
i .-
I-4'
...."
.~".. .~~
~
i
l) ~ --s.---a.-.-.o
.5
l2J. l2J0.121
Cl
2.l2J
1.0
1.5
tj(a) R. 1,000,000.

Transitiono FreeC FiKed
Delft University of Technology lJiJ&rtfHl Low Speed Laboratory
Cm.25C
• 11ZJ21ZJ.1ZJllZJ.0IZJ. lIJ
CI
2.1ZJ, I Ii.31ZJ
ex
.51 I _I I IIZJ.IZJIZJ
1.51 I I I .21ZJ
1·1ZJ1 I ~, :;f.lIa
121.9 1 , , , • , I , I m I I I • I I • I • , I I • I , I , , , • I
-11ZJ. IZJ3l1J.lIJ
Cd *ll1J3
21ZJ.1ZJ1l1J. IZJ
i
I
~~
~
0;
."I
.5
2.0
1.0
CI
1.5
0.lIJ0. IZJ
(b) R = 1,500,000 .......:Iw
Figure 18.- Continued.
!,
Cm.25C
• 1121211l.121
ex10. III13. III
C1
2. 13iii i • 313
1. III1 I ~ ",,-: j
•51 I pi I 113• 130
1.51 I I I .213
121.01 •••••• , • ~ 'tt •• I , 1 • I It, • Iff f ••
-113.121
(c) R. 2,000,000.
3 313.13Cd *10
(i) Positive lift coefficients.
213.13
Delft University of Technology /ffflJ1fKl Low Speed Laboratory
113.13
Trans i t iono FreeC Filed
i
I..-(l\
r/'l.
j.
I·
i
J~
\)
~
.5
Ill. 11113. 13
1. III
C1
1.5
2.13
Trans i t iono FreeC Fixed
Delft University of Technology '!:$J1JiK1 Low Speed Laboratory
Cm.25C
• 11211121. 121
exIa. IZI-1121.121
1
C1
-.51 I r.r~ I I • 1121
121. 1211 I I I I I I I I I I I I , I I I , I Xl I , , I I , , I I , 1-. 2 121
.5, , I I .3121
-1.51 I I I
-2121.121
-1.1211 ti .~<A If I 112J· I2JI2I
3 3121.121Cd *1121
(ii) Negative lift coefficients.
2121.1211121. 121
~
I
:>
~~J.'
i "'<:.~
,
r
.5
C,
-.5
121.121
-1.5121. 121
-1.121
--.]VI
(c) R. 2,000,000.
Figure 18.- Continued.

Transitiono FreeC Ftied
Delft University of Technology /!f/iJ1JlHl Low Speed Laboratory
Cm.25C
• 113213.13113.1313.13
ex
C,
• 51 I PI 1 113• 1313
2.13, , i ,-.313
1. 131 I A:::t'e Jf 1-. 113
1. 51 I I 1-. 213
It'. tal I • I I I I I I mI I I • , t I I I I I , , ' , , , , • • I
-113.13313.13Cd *113
3213.13113.13
5
13 ~
.r~ ..
,'> f
4'>
.1'
.5
1.13
C1
1.5
2.13
13.1313.13
-...:J0\
<d) R = 2,500,000.
Transi tiono Fr@eC Filed
Delft University of Technology If:/llJ1JlH1 Low Speed Laboratory
2.0 2.0, I I I .30
Cm.25C
.1020.010.00.0
• 51 1 PI I 10 • 00
or:
C1
1. 01 I AI 1-. 10
1.51 I I 1-·20
121" 121 1 • I I , , , , , m I , , t I I I I I I I , , , I , I • , t I
-10.030.0Cd *10
320.010.0
,
0 ~
~V
:i
OJ
fh
:l
,-
.5
C1
0.00.0
1.5
1.0
'-l'-l
(e) R = 3,000,000.
Figure 18.- Concluded.
.0050'.0
I· :L:-:-- Turbulator -- -TI'-l·--l-;Jj~·-Ll:-t--II-J.+-'+L j-Jrt Li::l·I~:l!l~-I!--:.. ~ !Ii.'i. ":'''1"::' :.:.:.!
':1:: 0 OfL ~·I'-I···--l:·I· . 1 1- 1-:--/-11 II-j I;-li ;;I-iHI'lt:-t; ::;: , ,. "1" •
CI.. l"---~-:-:;-; ~ Upper sur face -- j - . . -'-- - - . 1- _:. '1' 1_ - I· - - . --rrr 'nl-r ." II. -l+i"T c-.-~ -I;---~-:-:T -:----;-- .; '~-'--''''l-' -: .-:-I
... I' .Lowe~ sur~,ac.e-- -1- _: -- -- -' - .. -- :----- ::: ..... - =--.... :. ·11· i:J-·I.,. t. "1': ... ,.J i-I :.!! j i.:" . I
..----.:. -:L+I-I+II-1+++'-'----'- .. -.--.-- "'--1- ------ -·--··------··11 '111 ! ,I-I!'- ii-Ii .,~ :; ..... ': ..0.0100'"; ., "T-..-:..;--L~-.++LI--HJi ·i.. t-·.. ·---· - ·----·1-- --- --- - -t· -'1-1- -:- II! 1 II.; I !; i I :f- .... '1' .-... :-'-1'·' ;--.
:'1 ;-:~ ..:- .;-i: I-~t: ~l ~=i- j j:-I -I- . --rfj- -.... ': ::: =... :. ==1=:,''''.- - -! :t .- :.= -: '-I I '1 I I l. I 1 i I -;: I \ ::.::: : .: .-::: : -- :.;,~'I :--~ ~~- LL.L~ -t-~'j- -\'j-:'\j- tt .~. -j~IT-'..I.' ~J ~ -.j.:....Lj'Jli- . L! ·1·1. . ~ l--i ..I.· -+-1 i-, ":' !. '. ;.;:: -L~. ::::=. _~'~-:-~-f-:' :-~~-.. 1 . _., LI-rJ·.. ··-ttll 'l-='--t j-j--'+-- ~ t I I [! ! 11 1 't' / , I I'~.' :.- =-::~'.i'-~:~:.' t~T+=l'~·lJ.. m~-- -~:·I::I- ·:".~·I:- ·,,·I,·I-t,·.... t':·II..'···:l·'r:+-···-··::::·1' I ; I' i ;! ;-j' 'I' 'I: j.; 1 ::';!;.::.-/ :~;-:-:. ::: I, .., I I j!. I· Ii! I I I I I , " '" , , . ' ., .... .....
00<]0 kYI... " ,Ii I :LII 1-_ Ii, ," U -'----l-LL .-l--l...:....' ," I ----------+-----. , , i ...~~:.i....~.;. II..· -Tq I -I! '1' I..j I i 1.\ I ! !;. I! .1 1 I-If I I J!' i ;: i I ::!! :'., I " . . ... I . . . .. i .. ,
:. . ,:_i :'''' I,: I ,,; !,., f! I" . i Ii: '1' : /! I I" : I' /! I':' . '.: : ': I :!', . I' •
~,... ,- ~ ,-1- .... I I 1 I --, ! I 1 1-'1 I ,- J' I I .. ·• . r- /...... . . , /' I" I " , .. I' .
. .'.-1:...:.. ~.::_:. ±.tW=-J..LF+c...l.Lt~_ll..lL_.. ~-L.Ll-·H .. -,-UL±'~+. ;-: l..! : LL~1 I .J ...: -I-:-';'-"~'_"_:'_-;'..-~ .._.: -=-:-~:-l.~.:: 'I . : :- I ~;:;.t'~~-·1"t 1'·~I~n."':I" tl··I·l 'j. :'1' [I"--rl--I' I:' --11- i', .. :.-t. i:1- '1' i I Ii! :; ::: I :' .;L :! ~ U' ~: I! : ... "1" : .... : .. : !..
. ! - ~ -I - - -- - r" I 11. I •. - [_I 1 ~ I' t j I ~ I I :! I : j 1 ':! ,I.. " I. ., :00801-...:-J · ';.. j ':', ~-~~•. --1-- ... - .L.j;. '-i-I-! I -' j-I ± ~ : I·'.J-d:.~.-L _LU"':"._:_'''';~ ri-f-;.l..~: :, /:' 'J- : i· . i I
. 1 .. :- :i .. ;+ -~I:'''I'+'~~!' -. -1'+j--".j+-_llj ··1 i If! I II Iii I i.1 1::-: ii.i·! :'ii !' Iii' j' ,1,.: : .;:. I,.",.... " -:.":-:. ..-- "'r"j-·'·'.- _.. -I~::::~m'--I" ... -'r . ---If, .-I ... -- .. '-1'1.1 -j ,+!I !!i!. i '1 ! Iii·' ,.,. ',.1 I. '.' ,.,;. ·" •. 1. '-,' . I.,. :--, .. :.-,-,..\ .. '1'--,"';--1 ~~++'--'-T-rLfl··I'1 , ·1,,/ I r!:TI "1"11'\-1 : I .·'i;:. ":' j....... .. '''',' ..
. I ' . .. ,.,.-; ···-j.. ,-t-·j ~ ·-,,·,1 t I ~I-r- -~ _t_ . ,! '! mi' +:·'1' !! !! i' ! I '.' ,:!' '!: I "', .. , _. , .. I·· .. ···--···-1.......-- ..···_--:--.L.. ," I. ..L --c-L,--,'" -t-- -I .. ---!--"T---i-+-i--.I.. ·;-t"-i-t--t..·.. ····,.. ·l-TT-r···_-.-..· .. ··......· ..·"· ---:--l- ....-....~
. . I " .. "':'i t. --.Li- r-j- _ -;·-+-·~r·-K.- -·f~""t'· __ L_ -I- +r -I .rl·-I·" - -- ,II- -:'i 1-1:1 !+!1 --1. '. +i·i.··· .: ' '.' 1·1 '. :." ;."'·""'·-I-"c-,-,;. :1.: ····,'·T :.,1- '+"I-"-r' _j.-I.-..... --·--I·-I"- ...i--r':--.I'--~ --"'···1"·· "r"- - .. ----·----1 1 1:1 : J'I '·.1. : i-I" :'!~!··!.·!·::rt:: ::;;./. ::"', ,-
.""101--~ .;-:,!: :~;:,:,i,T!'!i{U~":r"i~.ftfLIr,r:i!i~! ill!~*~ IT:! ~4-Lp:_+:-)-
! . ··Irf!.l!:~I:.f+~i=m.··· :j~lr2~1'-~fl~ lMI'++'·~·=~,l'~k i 'j ·1:r·lJi!l:,: ··~{.f.···· ··[·:-4-······; :_.. 1._.1.. :.. i-+... --··1",,1..-;.. ,1,- l··l.·l.. j.., --I'" .... --. - ~ I: I I I I I I' 1.\_1_ 'l-- I -~ :. f ~, ~~ .,1 .. ; .\ t~· .L. 1 : ~. '" : . -.. i. ., .,.i:.. '+.'·!--II--I·· +..1..II·-i· L I+- - .. - . f i i Ii! ,-I -I '. ~:llil·!+!·i ... i"'" T'; i·t-·i-, f·: .:' . ··10060 1-' '. . ' ,I!, ,I , ,It , , ,I . I.. ,'I I , ----l-----i--,.~ .' I' .. I
. --_.~ .. --: ;·.. ··1 ':":.L.';.'--f-I·I+JLtl--/-I-j-···lJ·/t'···/-I···lil/ I Ii :jl: iil'-:i.I.,1 il"[;I"" ..... , .. ,.
i.::,:: -[+~r ~ttttIDfll:'::1.-~:i,:I" ".j£ .•. +1J =11 il· +1 il.Llil .IJJ~ •.·l10t1J .: :·1.4:\l-:r'Tm ' 't~I!==j~!ftfFI::;F==?::fJ!IljjJtI1W.lf!TJjilllfrlR} .. '. rn:,:'IT;~I'! ~
; , .. :. -;T-~'+-!'!rT·+-i'I-I ..!j"lm,-j-lj-i-i-~!·r ·I-I-·I·[·--!--I"·I--·!·'::·+'+· ,r--l·t--iIT!-ii j·:·:rTi;ld·,·, 'I~"_1.1f 2.0 2.5 3.0 x , 0 6
R
(a) c t .0.5.
Figure 19.~ Effect of turbulators on drag coefficients.-..l00

8 02 0
q g 8. ~c. ~
II .
~~~ -~--- ~_._:~------~
i o- 79
Turbulatorso Of fC On
Delft University of Technology ~
1JUU Low Speed Laboratory
Cm.25C
.1020.010.00.0
C1
2.0, I I .-.30
1.51 I I 1-. 20
a
• 51 I tiS - I 10. 00
1.01 I I P= \;:; 1-. 10
fa. ", t • • ' , I , • W I I I • I I , • • I I I I It' , t , I I-10.015.0
Cd *103
10.05.0
)
I
-r;l
~ ~..~~. ,
~
i
~
It· (.
~ :>
.5
0.00.0
1.0
1.5
c,
2.0
00o Figure 20.- Effect of turbulators on section characteristics for R = 1,000,000.
-1
c
I
- Theory--er- Eaperiment
1J
j ,!
x/cI
(a) C z = 0.27.
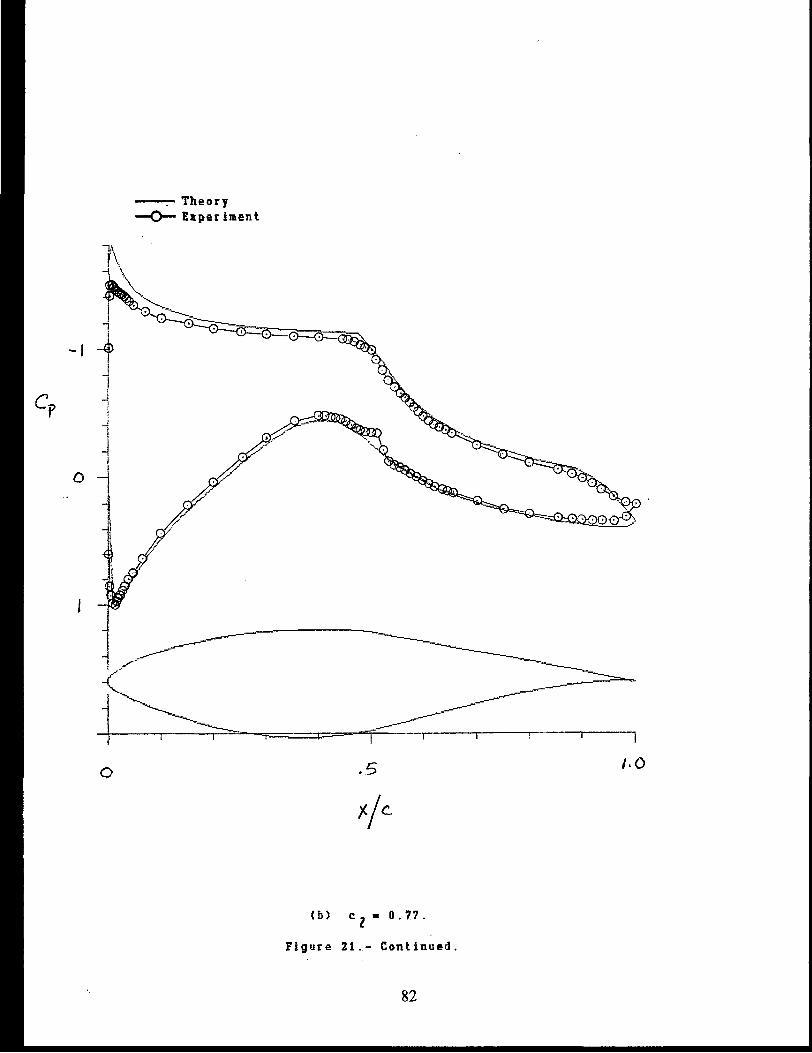
Figure 21.- Comparison of theoretical and experimental pressure distributions.
81
'.0
82
.5
I-
(b) I:Z
= 0.77.
Figure 21L- Continued.
----:- Theory-0- Eaperiment
o
o
... 1
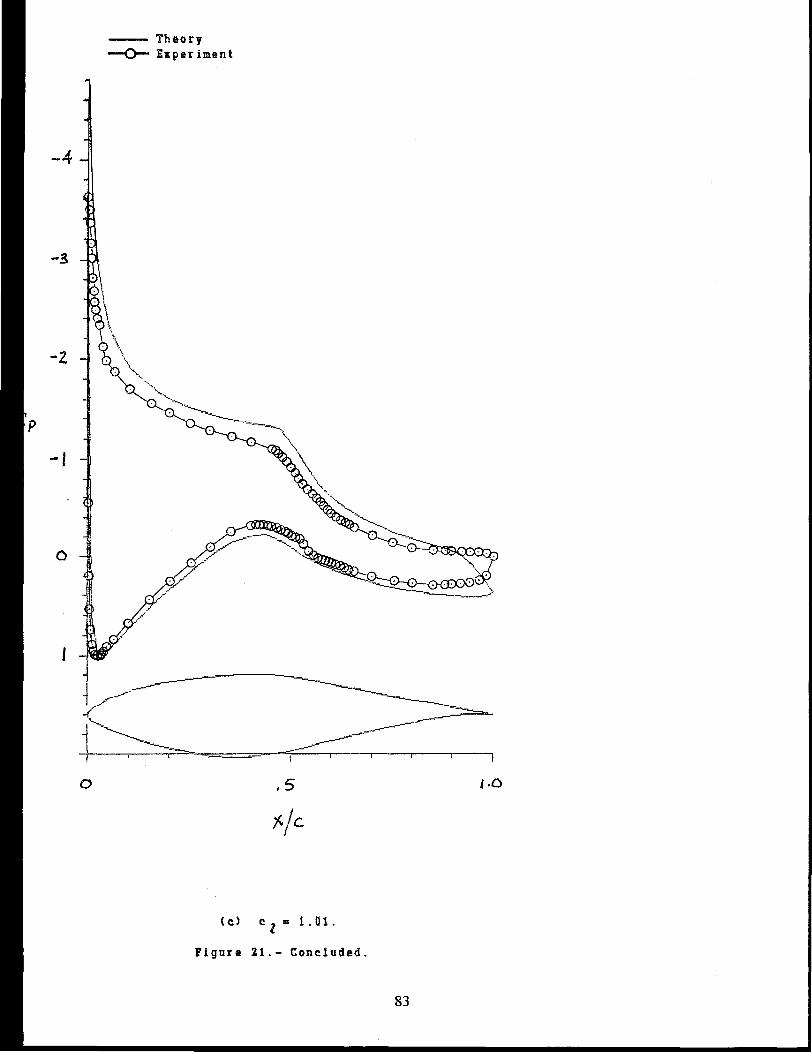
83
Figure Zl.- Concluded.
.5
'f./c.
--- Theory--cr- Experiment
o
o
-3
-4
-I
-2,
p
---Theory--D--Exper iment
Delft University of Technology~
Laminar separation bubble yeo LowA Upper surfaceV Lower surface
Speed Laboratory
Cm.25C
• 113213.13
ex113. 130. 0
+
t!
C1
• 51 I ~ I 1121• 1313
1. 51 I ! 1-.2121
2. 13, I Ii.313
0. IZJI ! , f I ' , I
-10.13
1.131 I I r~ \..- 1-·1121
15. 13Cd *1121
31121. 1215.13
III 1
~j~
-III~ -I. .
t \j
j
i
-rhI,~
C1
.5
1. 13
2.13
1.5
12l.13121. 121
(a) R. 1,000,000.
00.j:::.. Figure J2.- Compar~son of theoretical and experimental section characteristics
with tran&iti~n free.

---Theory--;J--Experiment
Delft University of Technology~r;flO Low Speed Laboratory
2. 13( -- ---- ··----·l~--· --------- ···----T------..· -..-. '--'-lC I II I
. II ·r I I~ . I:
1. 5t---------.----- .;..--.- .._..._....__._. -1"'- .__ .. .._._~___JI I i
tilI II !I I
1. 13r----.--·-·--.----+-····--·---·------i----··------~I : ,t : "
f
i . . . iI ': II I I
l i l' !.5 ... 1... . _..__. - ..._. ..J
I I I
I I I
r I Ii I. It J I...L ._._._ .... h. _. _.~.~_J._.__ ~._ •.__.J
213.13a
113.13
T
0.0-1111.13
IJ.I
.5!------------l.-.-.--. -.-----.-...--..L-.-----------------l13. 1313I I ' I
I t I Ii I I II 1", I II I I. 1 I
I' i13.13L...-o-.............. _ ...... . __..... _ ...... , ...._.•._ ..... _.•....• ", ....~ .........._.,._ .........._.... _.....J .113
15.13
Cd *1133
113.135.1313.13
(bl R = 1,500,000.
00VI Figure 22.- Continued.
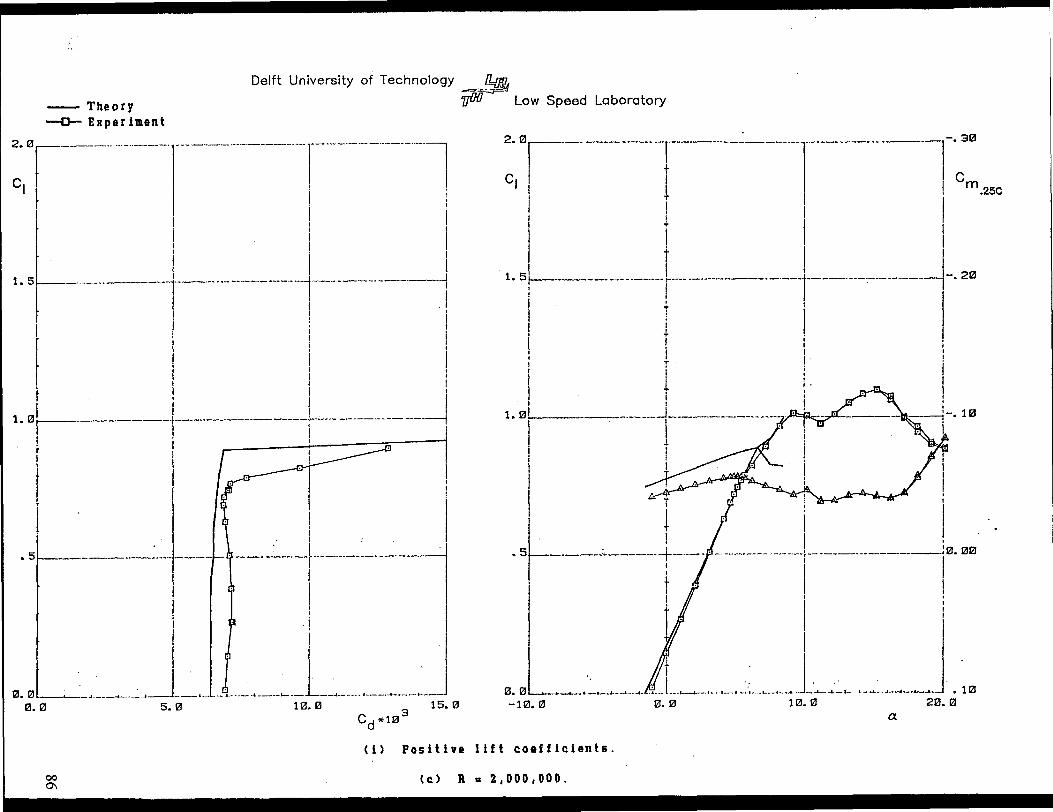
:J------------.-r----.-.-.:-----r-------------l-·::I ! I \ .25C
! ! ! II i I II . I I
·,.51 ---------+--------·-..-t--- -------~-- 2.
I t I I! ~ I I! I I •
\ II I ,I.II T .
I •• I
t .\. I'. 'I I •I I I".1_1 --------l----------'~-,w--
I, l~ .. -. I----r-...~,. II . T ' '! :
.+-----------~- -.-.-------- ----i-------------1·· ... t I I
I I I !: I I
II •
t' I Jir I .
, , j .
fi:l. fi:lL--'--.~'_ .. ~ ..'_.....IL...-..--._.,__ ._:·;_ ....__' .._... .J:....... ;~._ .._...:. ........._....... '. 1121-1 fi:l. fi:l 0. fi:l 1 fi:l. 0 20. fi:l
ex15. fi:l
Cd *103
1 fi:l. 0
Delft University of Technology~
rfHl Low Speed Laboratory
5.0
- Theory-0-- Exper iment
.5t-1--
2. fi:lt·---··· ..·- ..~-·--·I----'--·-·-------···· r---- ---------·----..-·lC1 I I
II :
I 'iI I I I
L I, : II II I
I •
1.5 . -'--' --l!-----------------~-·-----·--·-~~
I II . I
I I '
Ii! I
II : iI I I
II I
til
I I •
I I I1. fi:lr------T-·--~-·----t..-·--------------------j
I I I Ir ! r.
r I fr-1r I r I I
I I
, I·. ,I---''''''r-'- '-·~----f··---------·----·-~
I ,I II I II : III I, i I
•• 01 . •. ~__.c.J__.._~_. ~__L~_. ~.__J0. fi:l
(1) Positive lift coefficients.
000\
(c) R. 2,000,000.
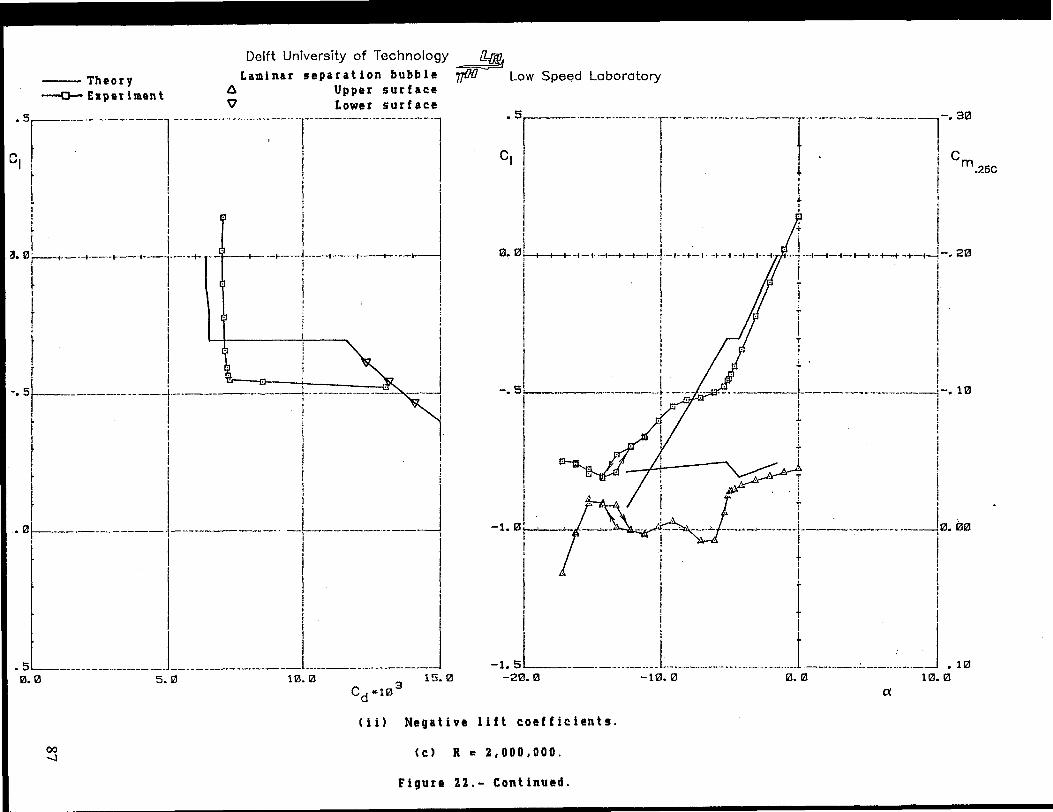
ex0. 0-10.0-20.0
. 5r--'--'-' -'''-. ----"r'--_.-.-.- -_.-..-----1'·· ....---------------,-. 30
C I I ! cI I It' I m.25C
I I I, + II . ,I ~ I
· I I' II I I0.0' I I I -i-I..-I-+ ......-·/-·-!-l--t-·' .. + .... i--I·-l.. -l· ;-·"'-·'--l--f--t-+-+-t--+~-.20
i I II j" II ! II ; I~ T, I
· i I II I • I
Ii !. T :
I . I, 1 . I
t .! ;
-. SL....... ._.... .,J .._. '-' .:.. ..----~------- .._---._.-___l-. 10I I .' i II
' . .• I
0oןס
I 1
I TIII
I-1.0:
III
I I 1 1
I ! ! i! I '
• i I J-1.SL_. .. __L.. ._.... . ...I.__._'..:..__......_.. .10
10.015.0
Cd *103
(ii) Negative lift eoefficients.
10.0S.0
- Theory--0- £llpet imen t
0.0
Delft University of Technology !fJlJYLaminar sepatation bubble rfKl Low Speed Laboratory
6 Upper surfaeeV Lower surfaee
:IS~-··-·--·--·----I-·------··---·--·:-r~---···-----lt I I I
l I I •. I I
I I i II I' I I
~ I ! J..·~--~--~<-l--+ .. ~-.++-+~-- II ' I !
tI : !I : :I ! !
, I : I
tI : !
"
! !I I
~I ",,! I', I'
-.5
1
-----------l---------:-·--------- --I, !I I
I I I
L~ I ! I
. "" ,, .--------0 J-o-----..--J, I I i
I II I i
I I I.sL__o L L_..__ o J00-...l (c) R a 2,000,000.
Figure 22.- Continued.
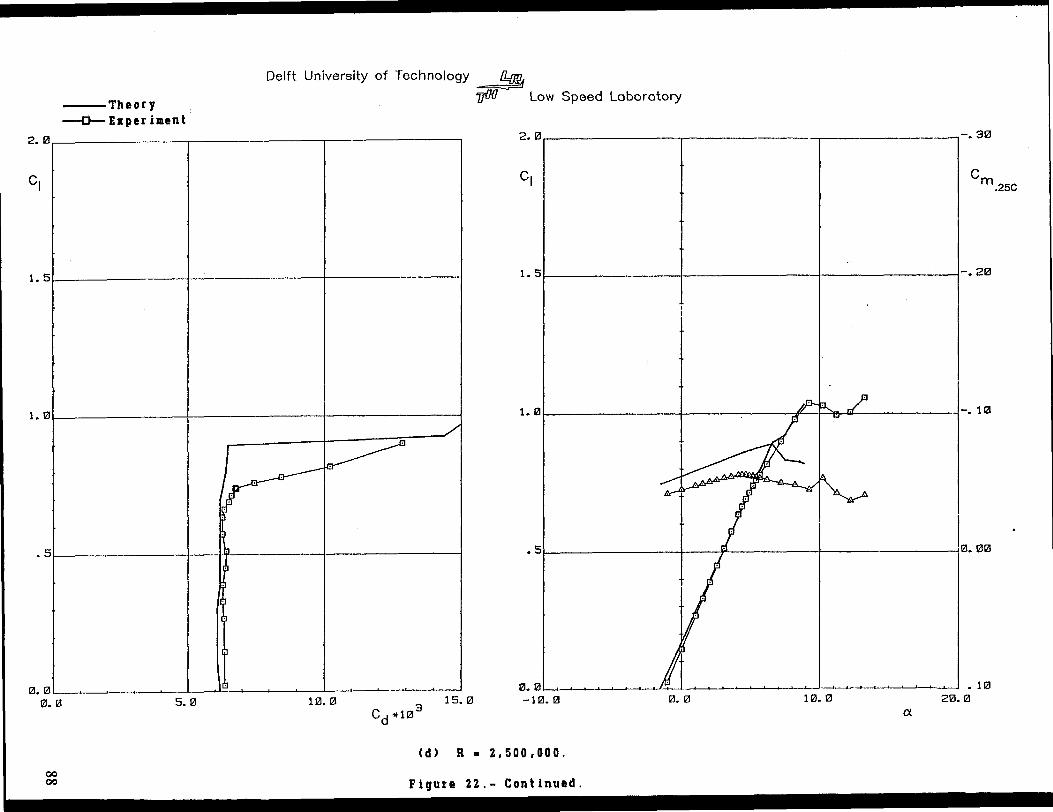
Delft University of Technology 1JIKllJiJ& Low Speed Laboratory
Cm.25C
• 11212121.121111l. 1210.121
I
I
c,
1.51 I I 1-. 2121
2.121, I - , ,-.3121
ex
.51 I P I I•.••
1. 121 1 I :fL P'I!l if 1-. 1121
121 .. 12)1 It. • I ' , I 1'1 I , . ! 't I I I , , ' , " I I !
-1121.12115.121
Cd *11213
1121.1215.121
-----Theory .--0- EKper iment
I
i
I
I/
~~
~
i
It· -
.5
C1
1. 121
1.5
121.12112I.11l
2.
(d) R = 2,500,000.
0000 Figure 22.- Continued.
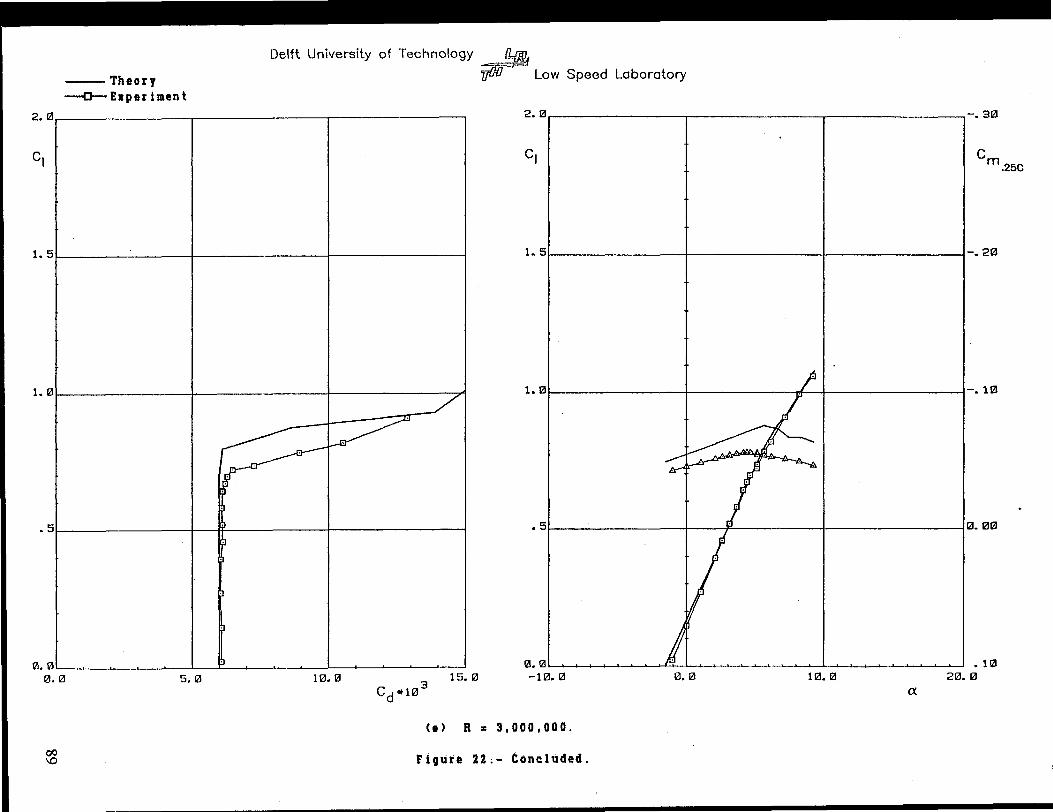
-Theory--c- Eaper imen t
Delft University of Technology '}jJ&'fIJO Low Speed Laboratory
Cm.25C
.102121.121
ex1121. 121121.121
C1
2.121, I I I .30
.51 I P I 1121• 00
1.51 I I I .20
1.01 I , I I .10
QI. (21.1 , •• ',' I " I I , • .
-11.~. 12115.121
Cd *HI3
1121.lil5.121
)
I
/'
~~
i.5
C1
2. liJ
QJ.liJ121.121
1.5
1. liJ
(e) R = 3,000,000.
00\0 Figure 22;- Concluded.

Delft University of Technology tt/lJfJ1JiH1 Low Speed Laboratory
Cm.25C
• ua2121.0
I 1-. 2121
QI. 121 1121. QI
.51 I 1/ - I 113• 12113
C1
2. a. I I ,-.3121
~.1'21 , , I ' , •• _I ~ I , , ' , , • I ' I It· , I ••• , f I
-la.QI
1.51 -+---
a
t
1. 131 I I ~ -'a 1-. 113I ~ '\
3121.13Cd *1Q13
2121.12110. QI
-----
)
,-a'l
I
i
'/J
>-----<--~
-Theory-0- Exper huent:
.5
QI. 00.121
2. QI
C1
1.5
1. QI
(a) R. 1,000,000.
\0oFigure Z3.- Comparison of theoretical and experimental section characteristics
with transition filed.
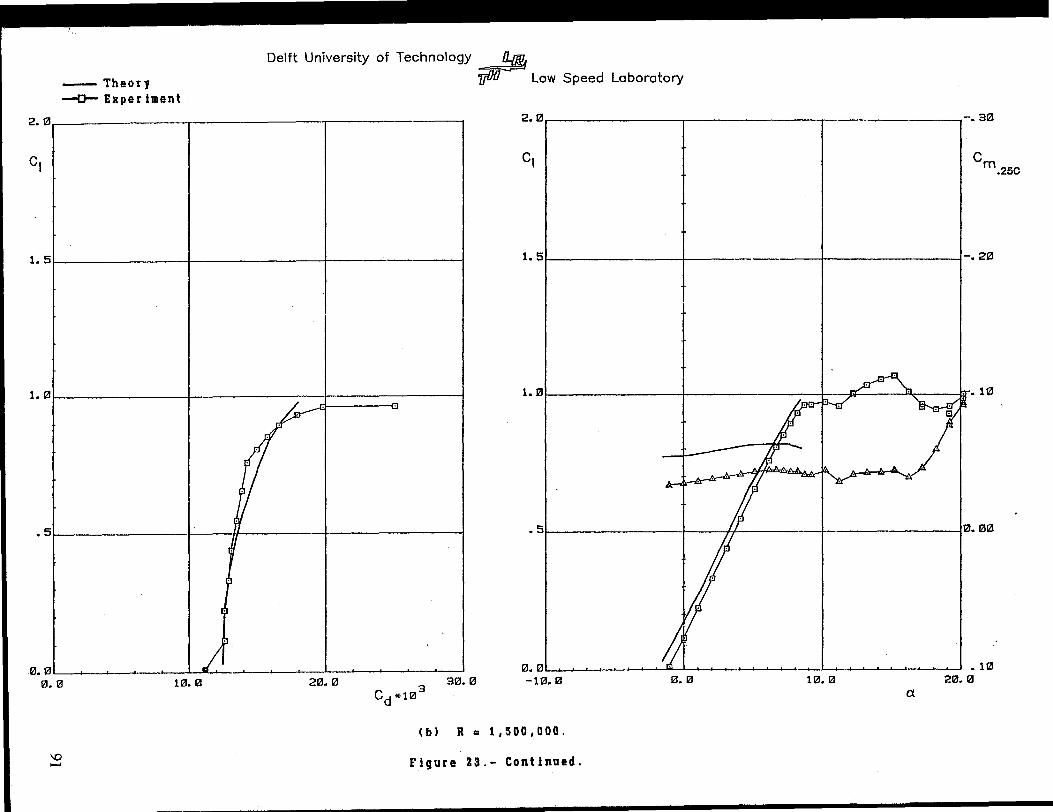
- Theory--0- Exper iment
Delft University of Technology /f;JBJ7JflO Low Speed Laboratory
2.121, I I I 2.121, I I ,-.313
C, C, Cm.25C
• HI20.010. 1210. 121
• 51 I 1/ I 1121• 121121
a
0. ((JI , , • , , , I , ru 1 t' " I , • , J I I I , • , I I ' 1
-1"1.133121.121
Cd *11213
2121.1211121. 121
.51 I· /I I,f I
,.51I I
I ,.51 II I .2121
II I
1. 1211 I ___ I I 1.13
121. 121 [ , , I I I if, , , I , I , I
121. 121
(b) R = 1,500,000.
\0- Figure 23.- Continued.
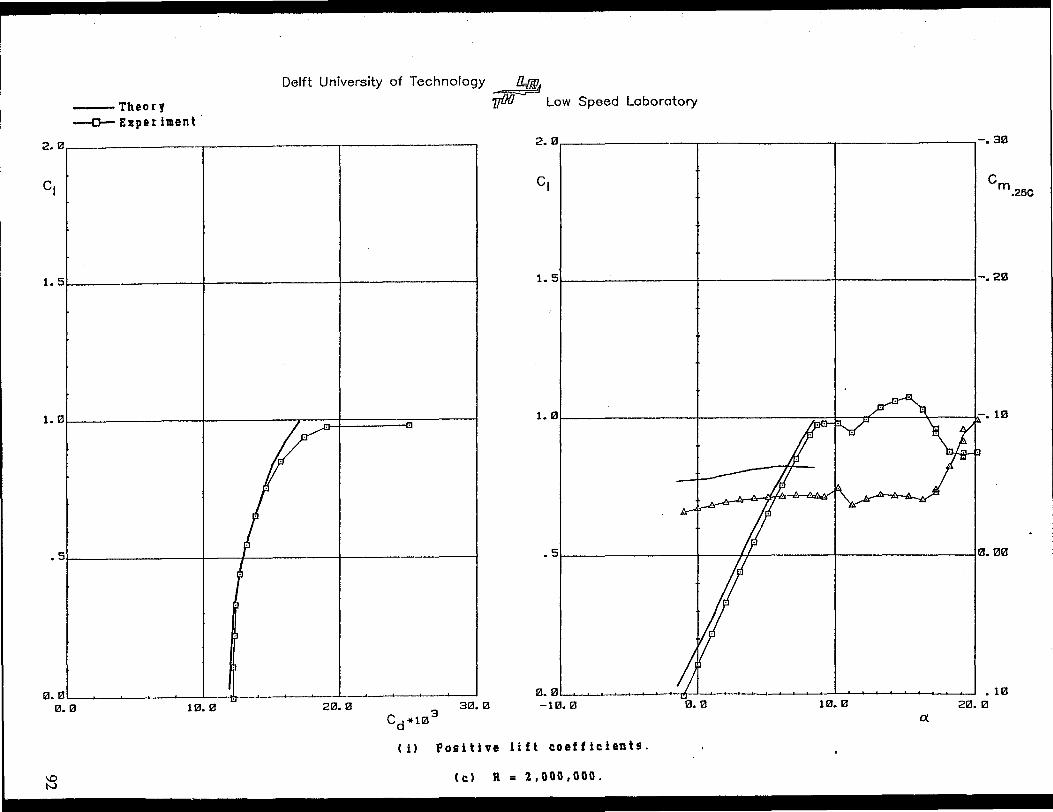
---Theory-0- Exper iment .
Delft University of Technology ~
rrOO Low Speed Laboratory
2.~, I I i2.~, I I 1-·3~
C, C1 Cm.25C
1.51 I I I 1. 51 I I 1-· 23
• 11212~.0
ex10. ~0. ~
• 5\ I /I I Ifa. 30
121.1211 , , , , • ' • , ~ I I I I' 0' I , , f • " ! t
-1121.0
1.31 I L /• J!r "\ !i
3121.0Cd *10
3
(1) Positive lift coefficients.
2121.1211~. ~
.51 I t I I
~.12I1 , , , ! I II , , , I.] I • , I I
121.121
1·~1 1-----7 ~ 8 I
\0to->
(c) R = 2,000,000.
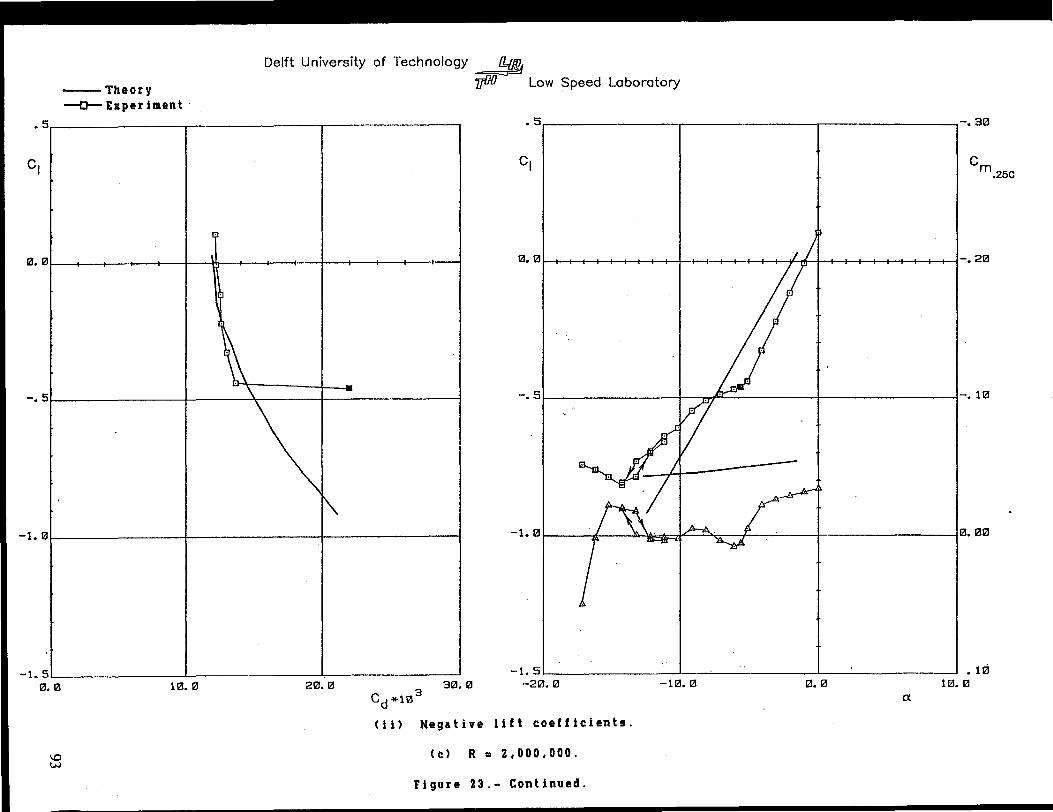
-Theory-0- EKper iment
Delft University of Technology !!1JJg1JfJO Low Speed Laboratory
Cm.25C
• 113111l. Ii'I
ex13.11l-H'I.13
C1
13. 1211 I I I I I I I I I I I I I I I I I I r£ I I I I I I I I I I 1-. 21a
• 5. I I I .31a
-.51 I ar I l·lla
-1.51 I I I
-213.11l
-l. I2IIJ ~~c:!'" p I 1121• 1313. <;K J
311l.0
Cd *1133
(ii) Negative lift coefficients.
211l.11l113.0
I I
.~
j \ --
1'\I
.5
C1
Ia.
-.
-1.51a.13
-1. fa
\0w(e) R = 2.000.000.
Figure 23.- Continued.
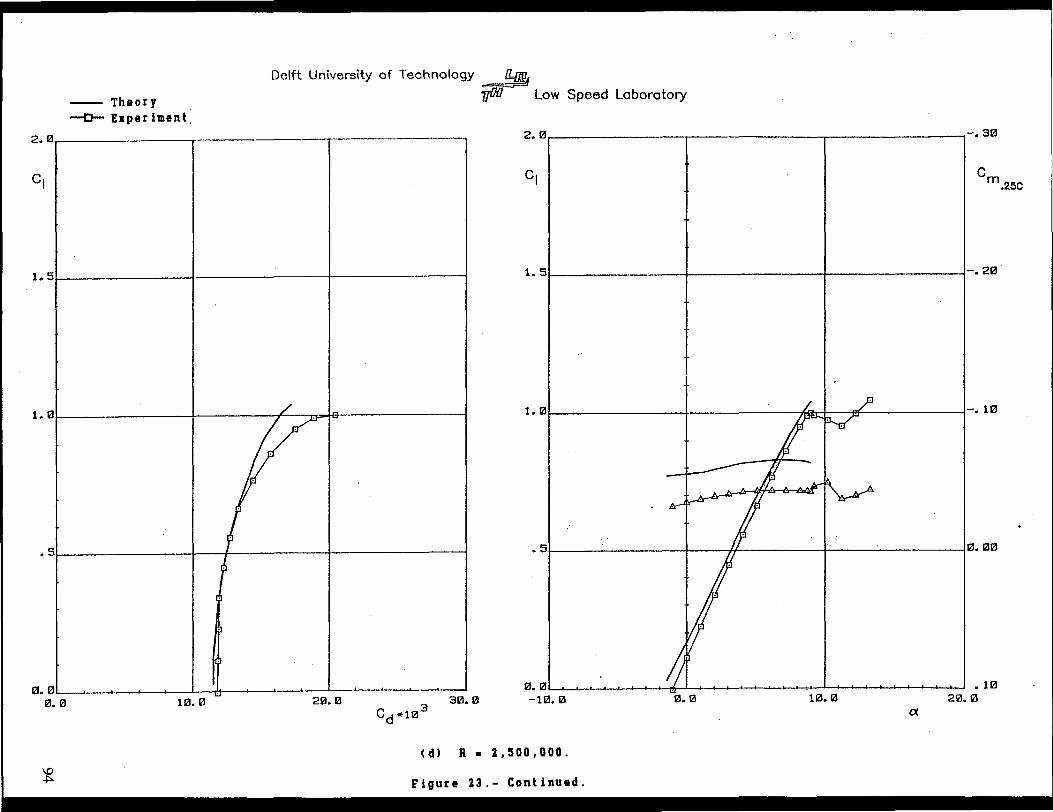
2.121, I I I .3121
Delft University of Technology ~
1JflU Low Speed Laboratory- Theory-0- Experiment,
2.l2Ir------r' ------.------~I I
C1C1 C
m.25C
1.51 I I I 1. 51 I I 1-. 2121 '
1.1211 I / ~ I
.51 ttl I
• 112120.1211Ia. Ii)121. 121
• 51 I 1/ I' 1121• lal2l
a
1. 121 1 I AkL J:f' I • 1121
ItJ. I'a I , , . . , t't r6 I I I I ' , I , I !. I , , , f I I , I , I
-11a.12I3121.121
Cd *11213
2121.1211Ia. Ii)
121. 1211 , , ! , I '" ' , I I ! ! ! !
1a.12I
(d) R. Z,500,OOO.\0~ Figure Z3,- Continued.
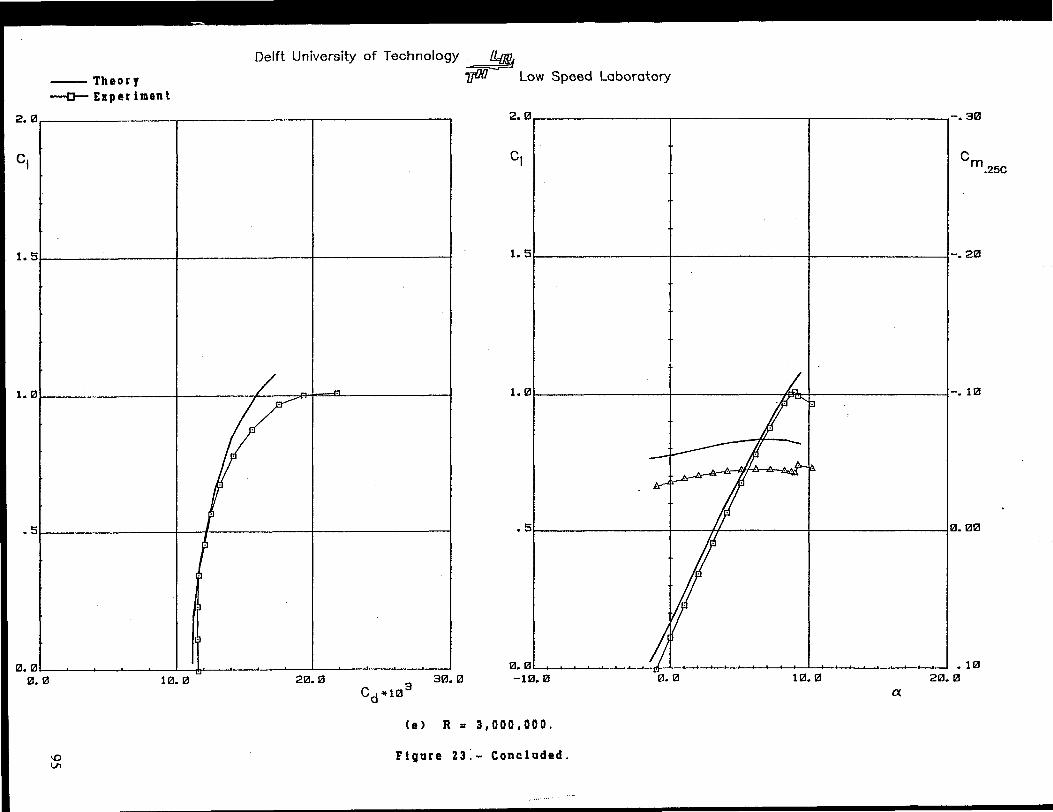
- Theory-0- EKper imen t
Delft University of Technology lfJJiJ1JfHl Low Speed Laboratory
Cm.25C
.102121.010.0121.0
C(
.51 I II I 10 • 00
C1
2.0, I I , .30
1.01 I A!hl 1·10
1.51 I I I .20
0.01 , , , ' , , , ,-,; I , ,-10.0 ' , , ' , ' , 1 • , • , ' , , , , I
30.0
Cd *103
20.010.0
i
I / J:'
i
I.5
2.0
1.5
0.00.0
c,
1.0
(e> R = 3,000,000.
\0VI
Figure Z3:- Concluded.
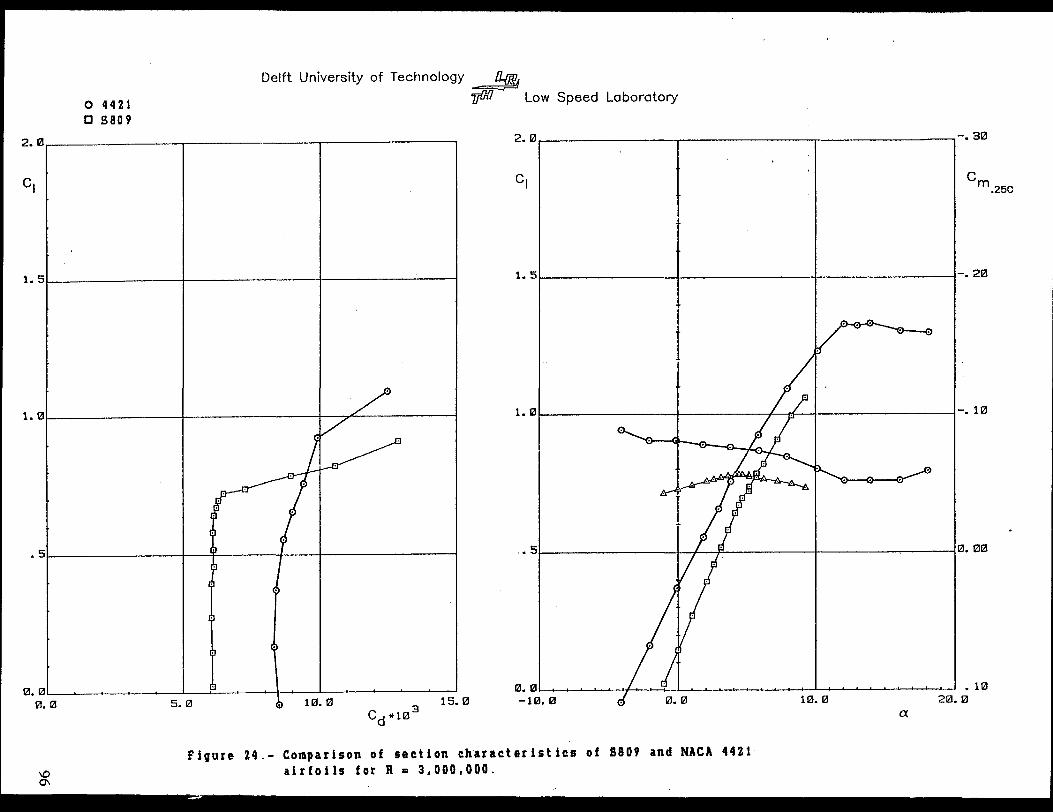
o 4421C 5809
Delft University of Technology '!$J1JCO Low Speed Laboratory
Cm.25C
• 113213.0
C1
•51 I / ? I 113• 13iZl
ex
1. iZll I / , I 1-, 1iZl
2.13. I I 1-. 313
1.51 I I I .2iZl
13. iZll I I ' I ' ,I, I 'T I I' I I I I I I I I I I I I
-113.13Ql
Cd *lQl3
'j
I /
·v)
13 5. Ql 0 113. 1
.5
Ql.QlQl
C1
1.
1. 13
2.13
\00\
Figure 24.- Comparison of section characteristics of S809 and NACA 4421airfoils for R = 3 l 000 l 000.
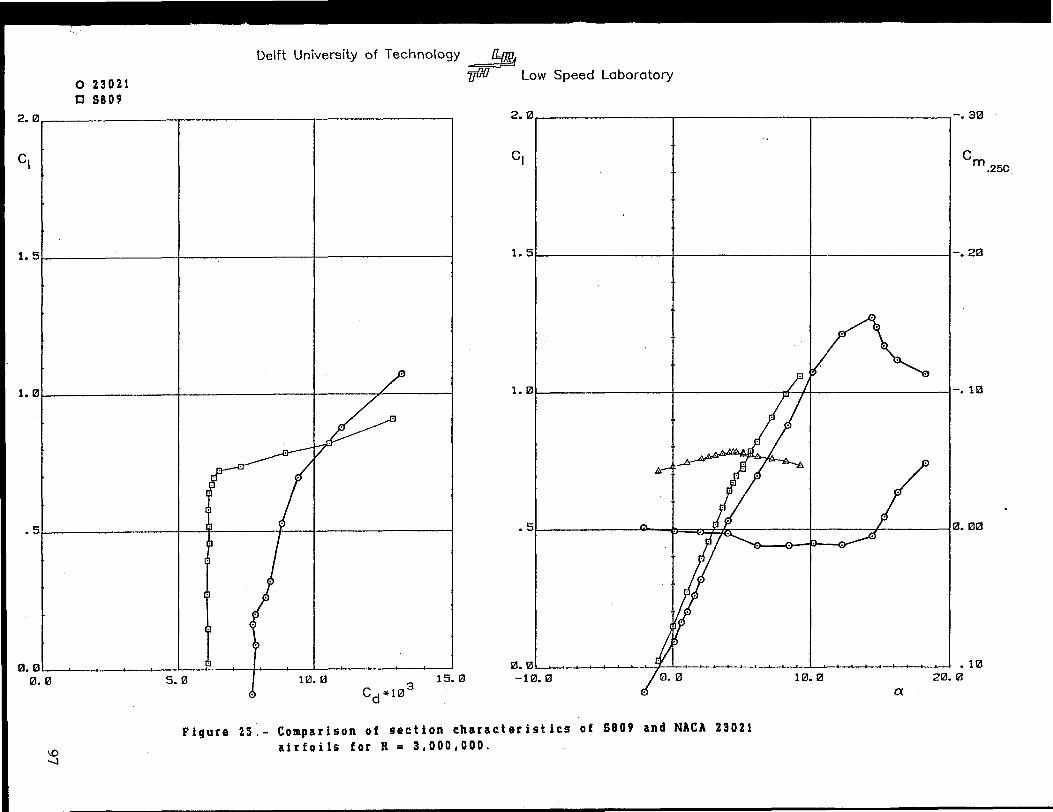
o 23021C 5809
Delft University of Technology ~
1JOO Low Speed Laboratory
Cm.25C
• 11212121.121
C1
2.1211 1 I ,-.3121
1.51 I I 1-· 2121
1. 1211 I rI /1 I . 1121
.51 Q..~ I 1 1121• 121121
0.121\ • ' , I I' • '1 I 'I I I 4. I • J I I I I •• I , , I
-1121.121121
d
i
I/
rj~~
i~
~ ~
~
I,
121 5.121 1121.~
.5
1.121
2.121
C,
1.
121.121121
10.....)
Figure 25.- Comparison of section characteristics of 5809 and NACA 23021airfoils for R = 3,000,000.
Public reporting burden for this collection of information is estimated to average 1 hour per response, including the time for reviewing instructions, searching existing datasources, gathering and maintaining the data needed, and completing and reviewing the collection of information. Send comments regarding this burden estimate or anyother aspect of this collection of information, including suggestions for reducing this burden, to Washington Headquarters Services, Directorate for Information Operationsand Reports, 1215 Jefferson Davis Highway, Suite 1204, Arlington, VA 22202-4302, and to the Office of Management and Budget, Paperwork Reduction Project (07040188), Washington, DC 20503.
11. SUPPLEMENTARY NOTES
6. AUTHOR(S)
Form ApprovedOMB NO. 0704-0188
UC-1213
DE97000106
C: HK-4-04148-01
TA: WE711110
SR-440-691 8
12b. DISTRIBUTION CODE
10. SPONSORING/MONITORINGAGENCY REPORT NUMBER
8. PERFORMING ORGANIZATIONREPORT NUMBER
5. FUNDING NUMBERS
3. REPORT TYPE AND DATES COVERED
Subcontract Report2.
REPORT DATE
January 1997
REPORT DOCUMENTATION PAGE
Design and Experimental Results for the S809 Airfoil
Dan M. Somers
Airfoils, IncorporatedState College, Pennsylvania
National Renewable Energy Laboratory1617 Cole Blvd.Golden, CO 80401-3393
NREL Technical Monitor: James Tangier
12a. DISTRIBUTION/AVAILABILITY STATEMENT
National Technical Information ServiceU.S. Department of Commerce5285 Port Royal RoadSpringfield, VA 22161
9. SPONSORING/MONITORING AGENCY NAME(S) AND ADDRESS(ES)
7. PERFORMING ORGANIZATION NAME(S} AND ADDRESS(ES)
1.
4. TITLE AND SUBTITLE
13. ABSTRACT (Maximum 200 words)
An 21 % thick, laminar-flow airfoil, the S809, for horizontal-axis wind turbine applications, has been designed and analyzedtheoretically and verified experimentally in the low-turbulence wind tunnel of the Delft University of Technology Low SpeedLaboratory, The Netherlands. The two primary objectives of restrained maximum lift, insensitive to roughness, and low profiledrag have been achieved. The airfoil also exhibits a docile stall. Comparisons of the theoretical and experimental results showgood agreement. Comparisons with other airfoils illustrate the restrained maximum lift coefficient as well as the lower profiledrag coefficients, thus confirming the achievement of the primary objectives.
14. SUBJECT TERMS 15. NUMBER OF PAGES
horizontal-axis wind-turbine airfoil16. PRICE CODE
17. SECURITY CLASSIFICATIONOF REPORT
Unclassified
18. SECURITY CLASSIFICATIONOF THIS PAGEUnclassified
19. SECURITY CLASSIFICATIONOF ABSTRACTUnclassified
20. LIMITATION OF ABSTRACT
UL
NSN 7540-01-280-5500 Standard Form 298 (Rev. 2-89)Prescribed by ANSI Std. Z39·1
298·10