nsrp-2015 special issue - israps bulletin- nsrp special... · dr. avinash v. sapre dr. sisir k....
TRANSCRIPT

a
ISrapS Bulletin Vol. 27, Issue Number 1 March 2015
D. K. Palit & P. D. Naik
A Publication of Indian Society for Radiation and Photochemical Sciences
Guest Editor
Dr. A. C. Bhasikuttan
Vol. 27/1MARCH, 2015
NSRP-2015 SPECIAL ISSUE
Advances in RADIATION AND PHOTOCHEMISTRY

viii
ISrapS Bulletin Vol. 27, Issue Number 1 March 2015
Contents
Message from the President and Secretary, ISRAPS iii
Editor’s Desk vii
3,3’-Diselenodipropionic acid (DSePA), a selenocystine derivative: Glutathione peroxidase mimic to preclinical evaluation as radio-protector Amit Kunwar, V.K. Jain, K.I. Priyadarsini 1
Liquid Crystalline Mesophases as Templates for the Synthesis of Noble Metal Nanostructures by Radiolysis and their Catalytic Activity Ajit M. Kalekara, Kirankumar Sharmab and Geeta Sharmaa 11
Radiation Chemistry in Microheterogeneous Media - Revisited Soumyakanti Adhikari 21
Radiolysis: Relevance in Nuclear Reactor Coolant systems Padma, S. Kumar, Debasis Mal, Puspalata Rajesh, S. Rangarajan and S. Velmurugan 28
Plasmonics in Fluorescence: Enhanced Intensities, Directional Emission and Selective Polarization Sharmistha Dutta Choudhury 38
Solid and Hollow Carbon Nanoparticles: Prospects in Molecular Dynamics Somen Mondal and Pradipta Purkayastha 48
Microscopic Investigation of the Polymer-Surfactant and Protein-Surfactant Interactions: Evidence of “Necklace and Bead”-Like Morphology Surajit Chatterjee and Tushar Kanti Mukherjee 56
Adsorption of mixed surfactants at air-water interface: A sum-frequency generation study Ankur Saha, H.P. Upadhyaya, Awadhesh Kumar, P.D. Naik 67
i
ISrapS Bulletin Vol. 27, Issue Number 1 March 2015
INDIAN SOCIETY FOR RADIATION AND PHOTOCHEMICAL SCIENCES (ISRAPS)
EXECUTIVE COUNCIL (2015-2017)president
Dr. Dipak K. Palit
Vice-presidentsDr. Prakash D. Naik
Prof. Sanjay Wategaonkar
SecretaryDr. A. C. Bhasikuttan
Joint SecretaryProf. Anindya Datta
TreasurerDr. Hari P. Upadhyaya
Executive MembersDr. Soumyakanti Adhikari Dr. Tusar Bandyopadhyaya Dr. Atanu BarikProf. Tapas Chakraborty Dr. Aloke Das Dr. Tapan K. GhantyDr. Virendra Kumar Dr. (Mrs) Jyotirmayee Mohanty Dr. Chandra N. PatraProf. B. S. Madhava Rao Dr. (Mrs) Sumana Sen Gupta Prof. Pradeep K. SharmaDr. Rajesh K. Vatsa
Co-opted MembersDr. Niharendu Choudhury Dr. (Mrs) S. Dhanya Dr. Hirendra N. GhoshDr. Manoj Kumbhakar Prof. Jai P. Mittal Dr. Sukhendu NathDr. Avinash V. Sapre Dr. Sisir K. Sarkar Dr. Ajay K. SinghProf. Anil K. Singh
Contact Details:C/o Radiation & Photochemistry Division
Bhabha Atomic Research Centre, Mumbai - 400 085E-mail: [email protected]
Telephone: (022)- 25595091/25593866/25595090

iii
ISrapS Bulletin Vol. 27, Issue Number 1 March 2015
(A. C. Bhasikuttan) Secretary, ISRAPS
(Dipak K. Palit) President, ISRAPS
Greetings from the New Executive Council of ISRAPS.
On behalf of the EC, we thank all the members for entrusting the activities of ISRAPS on us for the coming three years. It is our privilege and honour to serve the society and to contribute to its sustained growth in the area of Radiation and Photochemical Sciences. This special issue, released on the occasion of ISRAPS sponsored 19th National Symposium on Radiation & Photochemistry (NSRP-2015), which is being held in collaboration with Department of Chemistry, IIT Kanpur, during March 9-11, 2015, provides a glimpse of ongoing research activities in different institutes in India. The society actively promotes dissemination of information about the most important and contemporary research not only in the field of radiation and photochemistry, but also in the fields of spectroscopy, nanomaterials, atmospheric chemistry, supramolecular chemistry, radiation biology and medicine, chemical reaction dynamics and many other related fields. ISRAPS’s flagship international conference, the DAE-BRNS biennial Trombay Symposium on Radiation and Photochemistry (TSRP), which has been successfully held for the last 24 years in and around Mumbai, is due in the month of January 2016. This time it also integrates the 6th Asia-Pacific Symposium on Radiation Chemistry (APSRC-2016) as well and we request all the researchers in this field to join hands to make it a grand success.
ISRAPS, with the generous financial support from the beloved family members of the late founder members of ISRAPS, has instituted two awards, namely, P. K. Bhattacharyya Memorial Award, and Hari Mohan Memorial Award, which are awarded to the presenters of the best posters in Photochemistry and Radiation Chemistry, respectively. In addition to this, ISRAPS also sponsors a large number of best poster awards during the TSRPs and NSRPs. We request the scientists and students working in the field of radiation and photochemical sciences and in related areas to become members of ISRAPS and contribute to the growth of its activities across India. On this occasion, on behalf of the EC, we express our sincere thanks to Prof. Pratik Sen (IITK) and Dr. Sukhendu Nath (BARC) in shouldering the responsibility of NSRP-2015 as the Conveners and also thank all the contributors to this special issue for their cooperation in bringing it out to the NSRP-2015 delegates. We wish to express our sincere gratitude to each and every member of ISRAPS for their support and look forward to their continued cooperation in the future endeavor of the society.
Message from the President and the Secretary

v
ISrapS Bulletin Vol. 27, Issue Number 1 March 2015
ISRAPS
INDIAN SOCIETY FOR RADIATION AND PHOTOCHEMICAL SCIENCES(Reg. No. 617/1985, GBBSD, Bombay; Trust No. F-10965)
Radiation & Photochemistry DivisionBhabha Atomic Research Centre, Mumbai - 400 085
Member Enrolment Form
1. Name in Block Letters:
2. Date of Birth:
3. Highest Academic Qualification:
4. Present Position:
5. Addresses:
Photograph
Office Residence
TelephoneE-mail
TelephoneE-mail
6. Address for Correspondence: Office / Residence
7. Category of Membership Applied for: Annual / Life /Corporate member
8. Remittance: DD in favour of ‘ISRAPS’ payable at MUMBAI For Bank Transfer: A/c No.10536133801, SBI, BARC Branch, IFSC SBIN0001268
(e-mail the money transfer details along with the details requested above to [email protected] and CC to [email protected])
Category Fees Admission fee Total AmountAnnual Rs 200/- Rs 100/- Rs 300/-
Life Member Rs 1500/- Rs 100/- Rs 1600/-Corporate Member Rs 20000/- Rs 1000/- Rs 21000/-
9. Brief Resume of activities and research interests:
10. List of memberships of other professional bodies, if any:
11. List of prizes/awards/fellowships received, if any:
12. Number of Publications:
I agree to abide by the constitution and bye-laws, and rules and regulations of the SOCIETY.
Place: SignatureDate:
""
"

vii
ISrapS Bulletin Vol. 27, Issue Number 1 March 2015
ISRAPS BulletinA Publication of
Indian Society for Radiation and Photochemical Sciences
ISRAPSEditor’s Desk...
Dear ISRAPS Members and NSRP-2015 Delegates,
I am extremely happy and honored to present this special issue of ISRAPS Bulletin “Advances in Radiation and Photochemical Sciences” on the auspicious occasion of the National Symposium on Radiation and Photochemistry (NSRP-2015), being organized at IIT Kanpur during March 9-11, 2015. This volume encompasses articles from the complementary subjects of Radiation Chemistry and Photochemistry, which showcase a spectrum of ongoing research activities at different laboratories across India. Over the years this branch of science has grown enormously from understanding the fundamental and early time events to its implications in materials, devices and therapy.
This issue, in the first part, provides a glance of some of the up to date research activities in radiation chemistry and its application in diverse areas. The topics range from the recent research findings on the radio-protective evaluation of DSePA in cells and preclinical model systems, radiolytic synthesis of noble metal nanostructures on liquid crystalline mesophases, radiation chemistry in microheterogeneous media and also to the relevance of radiolysis in nuclear reactor coolant systems. On the other hand, the photochemistry section discusses the promising areas of plasmonics in directional emission of fluorescence, the molecular dynamics of solid and hollow carbon nanoparticles, surfactant interaction with polymers and proteins and also its surface chemistry at the air-water interface studied by sum-frequency generation.
These are not all, but a glimpse of few interesting topics, and I am sure that all these studies do have wealth of potential applications. No doubt, lots of challenging and exciting problems await the young minds. I sincerely acknowledge the active cooperation from all the contributors of this issue and thank the office bearers of ISRAPS for entrusting this job to me.
a.C. Bhasikuttan (Guest Editor) Radiation & Photochemistry Division
Bhabha Atomic Research Centre, Mumbai-85, INDIA
achikanath C. Bhasikuttan obtained his M.Sc. in Chemistry from University of Calicut, Kerala in 1989 and joined Bhabha Atomic Research Centre, Mumbai, India, in 1991 after one year advanced orientation course conducted by the institute. After his Ph.D. from the University of Mumbai in 1998 he joined as a JSPS postdoctoral fellow at Osaka University, Japan, 1999-2001. His research interests include the excited state molecular dynamics and to probe the intricacies of non-covalent interactions in supra-biomolecular systems, mainly by using various time-resolved photochemical techniques. He is an honorary Professor of Chemistry at the Homi Bhabha National Institute (HBNI). He is a recipient of Scientific & Technical Excellence Award -2009 from Department of Atomic Energy (DAE), Bronze medal from Chemical Research Society of India (CRSI) -2014. He is a fellow of the Maharashtra Academy of Sciences (F. M. A. Sc) & the National Academy of Sciences, India (F. N. A. Sc).

viii
ISrapS Bulletin Vol. 27, Issue Number 1 March 2015
Contents
Message from the President and Secretary, ISRAPS v
Editor’s Desk vii
3,3’-Diselenodipropionic acid (DSePA), a selenocystine derivative: Glutathione peroxidase mimic to preclinical evaluation as radio-protector Amit Kunwar, V.K. Jain, K.I. Priyadarsini 1
Liquid Crystalline Mesophases as Templates for the Synthesis of Noble Metal Nanostructures by Radiolysis and their Catalytic Activity Ajit M. Kalekara, Kirankumar Sharmab and Geeta Sharmaa 11
Radiation Chemistry in Microheterogeneous Media - Revisited Soumyakanti Adhikari 21
Radiolysis: Relevance in Nuclear Reactor Coolant systems Padma, S. Kumar, Debasis Mal, Puspalata Rajesh, S. Rangarajan and S. Velmurugan 28
Plasmonics in Fluorescence: Enhanced Intensities, Directional Emission and Selective Polarization Sharmistha Dutta Choudhury 38
Solid and Hollow Carbon Nanoparticles: Prospects in Molecular Dynamics Somen Mondal and Pradipta Purkayastha 48
Microscopic Investigation of the Polymer-Surfactant and Protein-Surfactant Interactions: Evidence of “Necklace and Bead”-Like Morphology Surajit Chatterjee and Tushar Kanti Mukherjee 56
Adsorption of mixed surfactants at air-water interface: A sum-frequency generation study Ankur Saha, H.P. Upadhyaya, Awadhesh Kumar, P.D. Naik 67

1
ISrapS Bulletin Vol. 27, Issue Number 1 March 2015
3,3’-Diselenodipropionic acid (DSePA), a selenocystine derivative: Glutathione peroxidase mimic to preclinical evaluation as radio-
protector
Amit Kunwar1*, V.K. Jain2, K.I. Priyadarsini1
1Radiation & Photochemistry Division, 2Chemistry Division, Bhabha Atomic Research Centre, Trombay, Mumbai-400085, India
Email: [email protected]
Abstract
Radio-protectors are employed to minimize the damaging effects of ionizing radiation to normal cells during radiation accidents and radiotherapy. In this regard organoselenium compounds exhibiting glutathione peroxidase (GPx) like activity are being explored as new class of radio-protectors. Since long, our group has also been evaluating organoselenium compounds for their probable GPx like activity and radio-protective effects. The one lead compound identified so far is 3’-3’ diselenodipropionic (DSePA) acid. It is a water soluble derivative of selenocystine, synthesized in our laboratory. It has been shown to be an effective free radical scavenger and GPx mimic in cell free systems. Further, it was also reported to be nontoxic to normal cells and a potent radio-protector against lethal dose of g-radiation in preclinical model systems. This article provides an account of the recent research findings from our group on the radio-protective evaluation of DSePA in cells and preclinical model systems.
1. Introduction
Since the discovery of X-rays by Roentgen in 1895 and radioactivity by Becquerel in 1896, ionizing radiation both high-energy electromagnetic (X-rays & g-rays) and charged particles (fast electrons, α- particles, protons, deuterons, neutrons, etc) has been used increasingly in medicine, agriculture and food storage [1]. However, their unwanted exposure poses serious health hazards to humans as was evident in the event of radiation accidents such as Three Mile Island (USA; March 1979), Chernobyl (Russia; April 1986) and most recently in Fukushima (Japan; March 2011).
When ionizing radiation interacts with living cell, water being a major (70%) constituent of the cell, undergoes radiolysis producing highly reactive free radical species, viz. hydrogen radicals, hydroxyl radicals, hydroperoxyl radicals and superoxide radicals leading to oxidative stress and cellular damages [2]. Among the various radical species, hydroxyl radicals have
been considered to be primarily responsible for most of the radiation induced cellular damage, which is considered to be the origin of tissue and organ damage leading to acute radiation syndrome and mortality [2,3]. While water radiolysis takes place in time scales of pico to nano seconds, biological events occur within hours to weeks. Sometimes delayed effects are observable even many months after the exposure [4]. The extent of radiation injury and the time to their manifestation depends on the type and dose of radiation exposure. Additionally, sensitivity of different organs equally dictates the severity of radiation injury. For example, organs like brain, bone, muscle, thyroid, pituitary, adrenal and liver are radio-resistant, whereas others like lymphoid organs, reproductive organs, bone marrow and intestinal crypts are radiosensitive [4]. Cellular oxygen enhances the radiation damage and reduced oxygen levels, as observed in certain hypoxic tumors, make them radio resistant [3]. In view of these catastrophic effect of unwanted radiation exposure there has always been urge

2
ISrapS Bulletin Vol. 27, Issue Number 1 March 2015
among the scientific and medical fraternity regarding the development of agents or radio-protectors that can reduce health hazards of radiation exposure.
2. Radio-protectors
Radio-protector is a chemical agent capable of minimizing the damaging effects of ionizing radiation to normal cells [5]. An ideal radio-protector should not only provide survival advantage in the events of radiation emergencies but also protect against the deleterious effect of radiation during therapeutic procedures wherein the normal tissue protection is as important as the destruction of the cancer cells [5]. Additionally, a radio-protector should be inexpensive, have no toxic implications, and can be orally administered, with rapid absorption and a reasonably good dose modifying factor (DMF) [5].
The efficacy of any agent to act as radio-protector is studied in animal models using distinct endpoints like protection against radiation-induced lethality due to hematopoietic or gastrointestinal injury, apoptosis, mutagenesis, and carcinogenesis. The most reliable procedures for evaluating the efficacy of a radio-protector involve determination of DMF. In animal studies, DMFs are typically determined by irradiating mice with and without administered agents at a range of radiation doses and then comparing the endpoint of interest [5]. However, this parameter is the subject of variation depending on radiation dose, dosage of radio-protective chemical, time and schedule of treatment, animal strain and dose rate of irradiation.
The first in vivo study on the radioprotective effects was conducted by Patt & co-workers using the sulphur containing amino acid [6]. They reported that cysteine, a sulfur-containing amino acid, could protect rats from a lethal dose of X-rays. Subsequently Bacq et al. (1951) reported that cysteamine, the decarboxylated form of cysteine, could also protect rats against lethal doses of X-rays [7]. When radio-protective effect of cysteamine was compared with N-acetylcysteine
a water soluble antioxidant, both provided similar protection against the immunosuppressive effect of sub lethal radiation exposure in mice. However, protection against radiation induced lethality was greater after cysteamine treatment compared with the results for N-acetylcysteine treatment, but the lethal toxicity and behavioural toxicity of cysteamine is much greater [8].
Taking clue from above studies, several synthetic sulfhydryl compounds were screened for radio-protective ability in the decades to come [9]. The most effective radio-protective drug identified till date, and the only agent approved by the FDA for the use in clinic is amifostine (S-2-[3-aminopropylamino] ethylphosphorothioic acid) [10]. It exists as pro-drug and gets converted in to active drug once enters inside the cells wherein it exhibits multiple biochemical properties like free radical scavenging activity, DNA repair and induction of hypoxia leading to radioprotection [11]. Although, amifostine is a clinically approved radio-protector for head and neck cancer radiotherapy, it also exhibits considerable behavioural toxicity at radio-protective doses, warranting the search for new effective and non-toxic radio-protectors [10].
3. Selenium a micronutrient and radio-protector
Selenium is an element belonging to the 16th group in the periodic table. Its atomic weight is 78.96 and atomic number is 34. The element selenium was discovery in 1817 by Joens Berzelius and named after the Greek goddess of the moon, Selen. About 140 years later, Schwarz and Foltz, (1957) discovered its role as micronutrient in animals [12]. The entry point of selenium in animals is via plants, which absorb the element in its inorganic form from the soil and convert in to organic forms such as selenomethionine [13]. The selenomethionine obtained from these sources acts as a precursor for the synthesis of selenocysteine. Both selenomethionine and selenocysteine are viewed as the analogs of naturally occurring aminoacids, methionine and cysteine respectively [14]. Selenomethionine is
3
ISrapS Bulletin Vol. 27, Issue Number 1 March 2015
nonspecifically incorporated in to proteins in place of methionine, however, selenocysteine is regarded as the 21st amino acid [15]. The groups of proteins that contain selenocysteine as an integral part of their polypeptide chain are defined as selenoproteins and these proteins are responsible for most of the physiological functions mediated by selenium such as roles in cellular antioxidative protection, redox regulation, male fertility, thyroid function and immune function [15]. In eukaryotes at least 25 selenoproteins have been identified so far and the most important and well studied among them is glutahione peroxidase (GPx). It is an antioxidant enzyme that detoxifies peroxides from the cells and protects against oxidative stress [15].
The recommended nutritional dose of selenium for normal humans is 50-60 µg/day [16]. Sodium selenite, selenomethionine, selenium enriched yeast, broccoli, mushrooms, garlic, fish, cabbage, whole grains, wheat, etc. act as selenium supplements [16]. Compared to its lighter analogue, sulfur, selenium is much less abundant in cells. Although the general properties such as ionic radii, electronegativity of sulfur and selenium are similar, the difference in polarizability (2.9 Aº for sulfur, 3.8 Aº for selenium) and the pKa values (5.2 for SeH and 8.5 for SH) make selenocysteine much stronger nucleophile and better reductant than cysteine at physiological pH [17]. These differences can enhance the redox reaction rates with reactive oxygen species resulting in better radioprotection. Another markedly important difference between the two is that while selenium induces the expression of a variety of selenoproteins like GPx, sulfur has no such activity. All these advantages of selenium over sulfur prompted researchers to speculate that selenium compounds may be explored as new class of antioxidants and radioprotectors.
Sodium selenite (Na2SeO3) was the first selenium compound tested for radioprotection in mice. In this study, selenite (0.8 and 1.6 mg/kg body weight) administered intraperitoneally (i.p.)
before or shortly after irradiation increased the whole body survival [18]. In another study, selenite (0.1 mg /kg body weight) in combination with vitamin E (200 mg/kg body weight) administered through i.p for 10 days in rats before g-irradiation prevented the radiation induced reduction in levels of antioxidant enzymes [19]. Additionally, a recent study showed that selenite exhibited radioprotection in normal fibroblast cells, but not in head and neck carcinoma cells. Based on these studies, selenite was even tested in clinic to reduce the side effects of radiochemotherapy in head and neck cancer patients. In this clinical study, selenite administered at a dosage of 200-400 µg per day increased the activity of serum GPx and also reduced the therapy induced production of free radicals [20]. Although, these studies established selenite as a potential radioprotector in animals and cells, it was also reported to exhibit behavioral toxicity in animal models [20].
A few organoselenium compounds like selenourea, selenocystine, selenoxanthene and selenoxanthone have been examined for radioprotection using in vitro models, however these agents did not show promising activity [21]. Further, selenomethionine was tested for radioprotection in animals and when administered (i.p.) at dosages of 0.8, 1.6 and 4 mg/kg body weight, significantly increased the survival of irradiated mice [18]. It was equally protective when administered at 24 h, 1 h and 15 min prior to γ-irradiation [22]. However, due to its similarity with naturally occurring aminoacid, methionine, it nonspecifically gets incorporated in to cellular proteins resulting in unwanted side effects and this property restricted its further exploration as radioprotector. Recently a synthetic organoselenium compound ebselen, a well studied GPx mimic has been tested for radioprotection in mice and U937 monocytic cells [23]. The results of this study indicated that ebselen administration for 14 days at a daily dosage of 10 mg/kg body weight in mice before whole body irradiation at 8 Gy provided substantial protection (60%) against killing and

4
ISrapS Bulletin Vol. 27, Issue Number 1 March 2015
oxidative damage [23]. It also prevented the radiation induced oxidative stress and apoptosis in U937 cells [23]. Since selenium in organic form exhibits lower toxicity, than the inorganic form, extensive research on modulation of radiation-induced changes by new organoselenium compounds is required.
4. Radio-protection studies from our group
With an aim to develop a radio-protector, our group had also initiated work on design, synthesis and development of GPx active selenium compounds. One of the constraints in the development of selenium compounds is their stability and poor water solubility. Several synthetic groups have been working on development of GPx active selenium compounds and in this regard both aliphatic and aromatic compounds have been examined as GPx mimics. In one such study, Back and Moussa (2003) showed that certain aliphatic seleno-ethers and diselenides depending on the substitution on the aliphatic chain showed higher GPx activity as well as better water solubility than ebselen [24]. Thus a number of organoselenium compounds new as well as previously reported were synthesized in our laboratory [25,26]. To enhance water solubility, functional groups like OH, NH2, COOH were incorporated in these molecules. These compounds were screened for GPx like activity and free radical scavenging capacity in cell free systems, and for radio-protective potential using in vitro and in vivo model systems [27-33]. The one lead compound identified so far exhibiting maximum radio-protective activity is 3’-3’ diselenodipropionic (DSePA) acid [29-33].
4.1. Synthesis of DSePA
3,3’-diselenodipropionic acid (DSePA), a water soluble diselenide, was synthesized in our laboratory according to the literature reported method [27,29]. The compound is structurally related to the diselenide amino acid selenocystine, and it was characterized by NMR, mass and IR spectroscopy. The chemical structure of DSePA is shown in scheme 1. 1H NMR (CD3OD) δ:
2.81 (t, SeCH2); 3.10 (t, CH2CO) (COOH proton exchanged with CD3OD). 13C {1H} NMR (CD3OD) δ: 23.4 (s, SeCH2); 35.4 (s, CH2CO); 174.3 (s, CO). 77Se {1H} NMR (CD3OD) δ: 322 (s). IR spectra: ν(C=O) = 1694 cm-1; Mass spectra: m/z = 306 (molecular ion); 288 (M-H2O). The m/z value given here is based on 78Se isotope with natural abundance of 49.82%.
Se OSeOH
OHO
organoselenium compounds new as well as previously reported were synthesized in our laboratory [25,26]. To enhance water solubility, functional groups like OH, NH2, COOH were incorporated in these molecules. These compounds were screened for GPx like activity and free radical scavenging capacity in cell free systems, and for radio-protective potential using in vitro and in vivo model systems [27-33]. The one lead compound identified so far exhibiting maximum radio-protective activity is 3’-3’ diselenodipropionic (DSePA) acid [29-33].
4.1. Synthesis of DSePA
3,3'-diselenodipropionic acid (DSePA), a water soluble diselenide, was synthesized in our laboratory according to the literature reported method [27,29]. The compound is structurally related to the diselenide amino acid selenocystine, and it was characterized by NMR, mass and IR spectroscopy. The chemical structure of DSePA is shown in scheme 1. 1H NMR (CD3OD) : 2.81 (t, SeCH2); 3.10 (t, CH2CO) (COOH proton exchanged with CD3OD). 13C {1H} NMR (CD3OD) : 23.4 (s, SeCH2); 35.4 (s, CH2CO); 174.3 (s, CO). 77Se {1H} NMR (CD3OD) : 322 (s). IR spectra: (C=O) = 1694 cm-1; Mass spectra: m/z = 306 (molecular ion); 288 (M-H2O). The m/z value given here is based on 78Se isotope with natural abundance of 49.82%.
Scheme 1. Chemical structure of 3,3'-Diselenodipropionic acid (DSePA)
4.2. GPx-mimetic studies of DSePA in cell free system
GPx is a selenoenzyme, which protects biomembranes and other cellular components from oxidative damage by catalyzing the reduction of a variety of hydroperoxides, using glutathione (GSH) as the reducing substrate. Selenium is present in the active site of GPx and plays a very important role in catalysis. Taking clue from this, organoselenium compounds are being developed to mimic GPx like activity. DSePA is also one such organoselenium compound. The GPx activity of DSePA was evaluated by estimating its mass equivalent for one GPx unit and kinetic parameter such as Michaelis-Menten constant (Km) values for peroxide and GSH separately using the Lineweaver-Burk (L-B) plots [26,29]. This study indicated that DSePA has more affinity towards the peroxide than the GSH and 12.84 mM of DSePA is equivalent to one unit of GPx. A diselenide can show its GPx activity through two mechanisms. (1) Reduction pathway in which diselenide is first reduced to a selenol (RSeH) in presence of GSH. The selenol then reacts with hydroperoxides and gests oxidized to selenenic acid (RSeOH). This selenenic acid on two-step reactions with two moles of GSH is converted back to the selenol. (2) Oxidation pathway in which diselenide can directly react with a hydroperoixde to form RSeOH, which can be regenerated back to selenol by the GSH as observed in most selenium GPx mimics. Since DSePA showed higher affinity for peroxide it was inferred that the GPx activity of DSePA might arise through the oxidation pathway [26,29] as shown in scheme 2.
Scheme 1. Chemical structure of 3,3'-Diselenodipropionic acid (DSePA)
4.2. GPx-mimetic studies of DSePA in cell free system
GPx is a selenoenzyme, which protects biomembranes and other cellular components from oxidative damage by catalyzing the reduction of a variety of hydroperoxides, using glutathione (GSH) as the reducing substrate. Selenium is present in the active site of GPx and plays a very important role in catalysis. Taking clue from this, organoselenium compounds are being developed to mimic GPx like activity. DSePA is also one such organoselenium compound. The GPx activity of DSePA was evaluated by estimating its mass equivalent for one GPx unit and kinetic parameter such as Michaelis-Menten constant (Km) values for peroxide and GSH separately using the Lineweaver-Burk (L-B) plots [26,29]. This study indicated that DSePA has more affinity towards the peroxide than the GSH and 12.84 mM of DSePA is equivalent to one unit of GPx. A diselenide can show its GPx activity through two mechanisms. (1) Reduction pathway in which diselenide is first reduced to a selenol (RSeH) in presence of GSH. The selenol then reacts with hydroperoxides and gests oxidized to selenenic acid (RSeOH). This selenenic acid on two-step reactions with two moles of GSH is converted back to the selenol. (2) Oxidation pathway in which diselenide can directly react with a hydroperoixde to form RSeOH, which

5
ISrapS Bulletin Vol. 27, Issue Number 1 March 2015
can be regenerated back to selenol by the GSH as observed in most selenium GPx mimics. Since DSePA showed higher affinity for peroxide it was inferred that the GPx activity of DSePA might arise through the oxidation pathway [26,29] as shown in scheme 2.
The bimolecular rate constant for the reaction of DSePA with CCl3O2
• was determined to be 2.7 x 10⁸ M-1s-1 (Inset c & d of Fig. 1). Generally rate constants for the reaction of CCl3O2
• radicals with chain breaking antioxidants like, vitamin E, curcumin, etc are in the same range.
R Se Se R
R'OOH R'OH
R Se Se RO H2O
2 R-Se-OH
2 R-Se-SG2 R-SeH
2 R'OOH
2 R'OH
2 GSH
2 GSHGSSG
2 H2OGPx cycle
where R= -CH2CH2COOH R= alkyl/aryl group
Scheme 2. Catalytic mechanism of DSePA
4.3. Free radical scavenging and anti-hemolytic activities of DSePA
Since peroxyl radicals are one of the most abundantly generated free radicals in cells during oxidative stress, the ability of DSePA to scavenge such radicals was investigated using the pulse radiolysis technique. Trichloromethyl peroxyl (CCl3O2
•) radicals are model peroxyl radicals, which can be conveniently produced by the radiolysis of aqueous solutions containing 48% 2-propanol and 4% CCl4. Our study showed that reaction of DSePA with CCl3O2
• at physiological pH (~7) produced a transient radical species exhibiting absorption maximum at 560 nm (Fig. 1a) [29]. CCl3O2
• radicals can react with DSePA either by electron transfer or by H-atom abstraction. Another experiment on reaction of DSePA with specific one-electron oxidant, N3
• showed formation of similar transient absorption spectrum (Fig. 1b) suggesting that DSePA reacts with CCl3O2
• preferentially by electron transfer forming a selenium centered radical cation
(DSePA+) [29]. The reactions of DSePA with CCl3O2
• radicals and one-electron oxidant, N3
• are shown in equations 1 and 2. .
3 2 3 2CCl O DSePA DSePA CCl O (1)
3 3N DSePA DSePA N (2)
The bimolecular rate constant for the reaction of DSePA with CCl3O2
• was determined to be 2.7 x 10⁸ M-1s-1 (Inset c & d of Fig. 1). Generally rate constants for the reaction of CCl3O2
• radicals with chain breaking antioxidants like, vitamin E, curcumin, etc are in the same range.
500 600 700 800 900
0.2
0.4
0.6
0.8
0.3 0.6 0.90.7
1.4
2.1
2.8
0 20 400
3
6
9
d
c
b
a
A
bs/1
0-3/G
y
Wavelength, nm
[DSePA], mM
kob
s/105 , s
-1
Time, s
A
bs/1
0-3
Scheme 2. Catalytic mechanism of DSePA
4.3. Free radical scavenging and anti-hemolytic activities of DSePA
Since peroxyl radicals are one of the most abundantly generated free radicals in cells during oxidative stress, the ability of DSePA to scavenge such radicals was investigated using the pulse radiolysis technique. Trichloromethyl peroxyl (CCl3O2
•) radicals are model peroxyl radicals, which can be conveniently produced by the radiolysis of aqueous solutions containing 48% 2-propanol and 4% CCl4. Our study showed that reaction of DSePA with CCl3O2
• at physiological pH (~7) produced a transient radical species exhibiting absorption maximum at 560 nm (Fig. 1a) [29]. CCl3O2
• radicals can react with DSePA either by electron transfer or by H-atom abstraction. Another experiment on reaction of DSePA with specific one-electron oxidant, N3
• showed formation of similar transient absorption spectrum (Fig. 1b) suggesting that DSePA reacts with CCl3O2
• preferentially by electron transfer forming a selenium centered radical cation (DSePA•+) [29]. The reactions of DSePA with CCl3O2
• radicals and one-electron oxidant, N3•
are shown in equations 1 and 2. .
3 2 3 2CCl O DSePA DSePA CCl O• +• −+ → + (1)
3 3N DSePA DSePA N• +• •+ → + (2)
Fig. 1. Differential absorption spectrum of the transient species produced on reaction of DSePA (1 mM) with (a) CCl3O2
• and (b) N•3 radicals at pH 7. Inset (c) shows
absorption-time plot for the formation DSePA radical cation at 560 nm. Inset (d) shows variation in the observed pseudo first order rate constant at 560 nm, as a function of DSePA.
R Se Se R
R'OOH R'OH
R Se Se RO H2O
2 R-Se-OH
2 R-Se-SG2 R-SeH
2 R'OOH
2 R'OH
2 GSH
2 GSHGSSG
2 H2OGPx cycle
where R= -CH2CH2COOH R= alkyl/aryl group
Scheme 2. Catalytic mechanism of DSePA
4.3. Free radical scavenging and anti-hemolytic activities of DSePA
Since peroxyl radicals are one of the most abundantly generated free radicals in cells during oxidative stress, the ability of DSePA to scavenge such radicals was investigated using the pulse radiolysis technique. Trichloromethyl peroxyl (CCl3O2
•) radicals are model peroxyl radicals, which can be conveniently produced by the radiolysis of aqueous solutions containing 48% 2-propanol and 4% CCl4. Our study showed that reaction of DSePA with CCl3O2
• at physiological pH (~7) produced a transient radical species exhibiting absorption maximum at 560 nm (Fig. 1a) [29]. CCl3O2
• radicals can react with DSePA either by electron transfer or by H-atom abstraction. Another experiment on reaction of DSePA with specific one-electron oxidant, N3
• showed formation of similar transient absorption spectrum (Fig. 1b) suggesting that DSePA reacts with CCl3O2
• preferentially by electron transfer forming a selenium centered radical cation
(DSePA+) [29]. The reactions of DSePA with CCl3O2
• radicals and one-electron oxidant, N3
• are shown in equations 1 and 2. .
3 2 3 2CCl O DSePA DSePA CCl O (1)
3 3N DSePA DSePA N (2)
The bimolecular rate constant for the reaction of DSePA with CCl3O2
• was determined to be 2.7 x 10⁸ M-1s-1 (Inset c & d of Fig. 1). Generally rate constants for the reaction of CCl3O2
• radicals with chain breaking antioxidants like, vitamin E, curcumin, etc are in the same range.
500 600 700 800 900
0.2
0.4
0.6
0.8
0.3 0.6 0.90.7
1.4
2.1
2.8
0 20 400
3
6
9
d
c
b
a
A
bs/1
0-3/G
y
Wavelength, nm
[DSePA], mM
kob
s/105 , s
-1
Time, s
A
bs/1
0-3
We further substantiated the peroxyl radical savaging activity of DSePA in cellular model system by monitoring its ability to inhibit 2,2-azobis (2-amidinopropane) hydrochloride (AAPH) induced oxidative hemolysis of human red blood cells (RBCs) [29]. AAPH upon addition to RBCs suspension generates peroxyl radicals causing damage of cell membrane (lipid peroxidation), leakage of haemoglobin (hemolysis) and release of intracellular K+ ions as shown in scheme 3. Our study showed that pretreatment with DSePA protects RBCs from AAPH induced lipid peroxidation, hemolysis and K+ ions leakage [29]. However, their IC50 values were not the same and followed the order as, K+ ion loss > lipid peroxidation > hemolysis (Scheme 3). This is probably because hemoglobin molecule with big size is difficult to be released from the damaged membranes, while K+ ions,

6
ISrapS Bulletin Vol. 27, Issue Number 1 March 2015
being smaller in size can be leaked even with slight disturbance in the membrane structure. Thus at a concentration of DSePA, where it shows little protection to membrane damage (assessed in terms of lipid peroxidation) can have a significant impact on the prevention of hemoglobin loss from RBCs, while to prevent the loss of intracellular K+ ions, a much higher concentration of DSePA is required. Conclusively, the peroxyl radical scavenging ability along with GPx mimicking activity of DSePA suggested it to be a potent antioxidant.
micronuclei frequency in the cell nuclei as per the guidelines of regulatory agencies involved in product safety assessment [30,31].
4.5. Whole body radioprotection by DSePA
The radio-protective efficacy of DSePA was evaluated in mice after administering a non toxic and safe dose of 2 mg/kg body weight (i.p.) for 5 consecutive days prior to whole-body g-irradiation by assessing the protection of hepatic tissue, hematopoietic organ (spleen), gastrointestinal (GI) tract and monitoring the survival advantage against sub (<5 Gy) and supra (> 5 Gy) lethal doses of g-radiation [31,32]. DSePA inhibited radiation induced hepatic lipid peroxidation, protein carbonylation, loss of hepatic function and deformation in hepatic architecture. It also protected against the depletion of endogenous antioxidants viz., glutathione (GSH), GPx, superoxide dismutase (SOD), and catalase in the hepatic tissue of irradiated mice [31]. Protection towards GI tract and hematopoietic system was confirmed by the restoration of radiation-induced reduction in villi height, number of crypt cells and spleen cellularity [31,32]. The Single cell gel electrophoresis of peripheral blood leukocytes showed inhibition of radiation induced DNA damage by DSePA. The mRNA expression analysis revealed that DSePA treatment caused augmentation of GADD45α (involved in post-irradiative repair) and inhibition of p21 (cell cycle arrest) levels in spleen and the hepatic tissue [31]. Additionally, it also reversed the radiation-induced alterations in expression of pro-apoptotic BAX and anti-apoptotic Bcl-2 genes, which may be favoring towards survival. Indeed TUNEL assay performed in spleenocytes and intestinal epithelial cells confirmed that DSePA protects against radiation-induced apoptosis [31,32]. Additionally, DSePA ameliorated the radiation-induced intestinal inflammation and restored the immune balance (Th1/Th2 cytokines) in irradiated mice [32]. In line with these observations, DSePA improved the 30-day survival of the irradiated mice by 35% with a dose reduction factor of about 1.10 [31]. The radio-protective effects of DSePA
Scheme 3. Schematic representation of the AAPH induced oxidative hemolysis in RBCs and its inhibition by DSePA
4.4. Toxicology of DSePA
The most important parameter to be evaluated before performing in vivo studies with a synthetic compound is toxicological parameters. Therefore, cytotoxicity of DSePA was studied using normal cells such as splenic lymphocytes and Chinese Hamster Ovary (CHO) cells and a tumor cell line of T lymphocytes (EL4) [30,31]. The results indicated that DSePA was non-toxic to both normal and tumor cells in the concentration range, where potent antioxidant activity was observed. The acute toxicity study of DSePA in mice revealed its maximum tolerable dose (MTD) as 8 mg/kg body weight for the intraperitoneal mode of administration [31]. Further, DSePA administration at doses below MTD was shown not to cause any DNA damage or
genotoxicity by measuring the induction of -H2AX foci and micronuclei frequency in
the cell nuclei as per the guidelines of regulatory agencies involved in product safety assessment [30,31].
4.5. Whole body radioprotection by DSePA
The radio-protective efficacy of DSePA was evaluated in mice after administering a non toxic and safe dose of 2 mg/kg body weight (i.p.) for 5 consecutive days prior to whole-body -irradiation by assessing the protection of hepatic tissue, hematopoietic organ (spleen), gastrointestinal (GI) tract and monitoring the survival advantage against sub (<5 Gy) and supra (> 5 Gy) lethal doses of -radiation [31,32]. DSePA inhibited radiation induced hepatic lipid peroxidation, protein carbonylation, loss of
Scheme 3. Schematic representation of the AAPH induced oxidative hemolysis in RBCs and its inhibition by DSePA
4.4. Toxicology of DSePA
The most important parameter to be evaluated before performing in vivo studies with a synthetic compound is toxicological parameters. Therefore, cytotoxicity of DSePA was studied using normal cells such as splenic lymphocytes and Chinese Hamster Ovary (CHO) cells and a tumor cell line of T lymphocytes (EL4) [30,31]. The results indicated that DSePA was non-toxic to both normal and tumor cells in the concentration range, where potent antioxidant activity was observed. The acute toxicity study of DSePA in mice revealed its maximum tolerable dose (MTD) as 8 mg/kg body weight for the intraperitoneal mode of administration [31]. Further, DSePA administration at doses below MTD was shown not to cause any DNA damage or genotoxicity by measuring the induction of g-H2AX foci and

7
ISrapS Bulletin Vol. 27, Issue Number 1 March 2015
hepatic function and deformation in hepatic architecture. It also protected against the depletion of endogenous antioxidants viz., glutathione (GSH), GPx, superoxide dismutase (SOD), and catalase in the hepatic tissue of irradiated mice [31]. Protection towards GI tract and hematopoietic system was confirmed by the restoration of radiation-induced reduction in villi height, number of crypt cells and spleen cellularity [31,32]. The Single cell gel electrophoresis of peripheral blood leukocytes showed inhibition of radiation induced DNA damage by DSePA. The mRNA expression analysis revealed that DSePA treatment caused augmentation of GADD45 (involved in post-irradiative repair) and inhibition of p21 (cell cycle arrest) levels in spleen and the hepatic tissue [31]. Additionally, it also reversed the
radiation-induced alterations in expression of pro-apoptotic BAX and anti-apoptotic Bcl-2 genes, which may be favoring towards survival. Indeed TUNEL assay performed in spleenocytes and intestinal epithelial cells confirmed that DSePA protects against radiation-induced apoptosis [31,32]. Additionally, DSePA ameliorated the radiation-induced intestinal inflammation and restored the immune balance (Th1/Th2 cytokines) in irradiated mice [32]. In line with these observations, DSePA improved the 30-day survival of the irradiated mice by 35% with a dose reduction factor of about 1.10 [31]. The radio-protective effects of DSePA against whole body irradiation are depicted in the scheme 4.
.
Scheme 4. Schematic representation of whole body radioprotection offered by DSePA under pre-irradiation mode of administration in mice model
against whole body irradiation are depicted in the scheme 4.
4.6. Lung radioprotection by DSePA
Late lung tissue responses of pneumonitis and fibrosis are the most serious dose-limiting side effects of thoracic radiotherapy for several kinds of malignancies affecting organs in the thorax area [33]. Whereas pneumonitis is an acute inflammatory response, fibrosis is characterized by progressive scarring of the lung, with vascular cell damage and collagen deposition in the interstitial region [33]. With current radiotherapy protocols, the risk of radiation-induced pneumonitis is of the most concern, because it exerts a considerable impact on patient morbidity and mortality. Since DSePA exhibited encouraging whole body radioprotection, the effect of DSePA in reducing the lung tissue response to thorax irradiation was also investigated [33]. A main difference between
the above and previous investigation involved the treatment schedule. Whereas in previous work, DSePA was administered daily for 5 days before radiation exposure, here it was given three times a week, starting from the day of irradiation until the end of the experiment (i.e., until the presentation of lung disease). The change in treatment schedule was made to permit the assessment of the mitigating effects of DSePA on the chronic response of radiation-induced lung pathogenesis. The results from this study indicated that despite the prolonged treatment, DSePA by itself did not cause any toxicity in the mice [33]. Further, DSePA treatment increased the post irradiation survival time of mice by an average of 32 days (p = 0.0002), specifically reduced the levels of lipid peroxidation in the lungs, and increased GPx level, compared with mice receiving irradiation only. The intervention, also, decreased the extent of pneumonitis in mice, and it affected

8
ISrapS Bulletin Vol. 27, Issue Number 1 March 2015
the numbers of mast cells and neutrophils in the lungs of irradiated mice [33]. Finally, this phenotype was associated with reduced levels of granulocyte colony – stimulating factor, intercellular adhesion molecule – 1, and E - selectin in the lungs, suggesting the compound affected the inflammatory cell recruitment that accompanies radiation injury of the lung [33]. The radio-mitigative effects of DSePA against thoracic irradiation are depicted in the scheme 5.
Recently, we also studied the bio-distribution of orally administered DSePA in to different organs systems of tumor bearing mice. The results of this experiment showed the maximum bioavailability of DSePA in the lung followed by other organs such as kidney, liver and intestine. Interestingly, the bioavailability of DSePA in tumor tissue was found to be minimum (unpublished data). These results are thus in line with the lung specific radioprotection exhibited by DSePA in previous study.
5. Conclusions
In conclusion these studies confirm that selenium compounds have great potential to be developed as radioprotectors. The compound DSePA from our group offered significant radioprotection in preclinical mode systems both under pre irradiation and post irradiation mode of administrations. The only 30% increase in survival following whole body irradiation by DSePA may not be appreciating as far as ideal radioprotector for radiation emergencies is concerned. However, the fact that DSePA is differentially absorbed between the normal and tumor tissue and it provides significant protection against the side effects of thoracic irradiation gains a lot of significance as a non-toxic radioprotective agent in planned exposures such as radiotherapy. Therefore in future, we propose to evaluate this compound as radioprotector against thoracic radiotherapy in higher animals followed by clinical trials. Additionally, DSePA may also be considered as a model compound
Scheme 5. Schematic representation of lung radioprotection offered by DSePA under post-irradiation mode of administration in mice model.
Recently, we also studied the bio-distribution of orally administered DSePA in to different organs systems of tumor bearing mice. The results of this experiment showed the maximum bioavailability of DSePA in the lung followed by other organs such as kidney, liver and intestine. Interestingly, the bioavailability of DSePA in tumor tissue was found to be minimum (unpublished data). These results are thus in line with the lung specific radioprotection exhibited by DSePA in previous study.
5. Conclusions
In conclusion these studies confirm that selenium compounds have great potential to be developed as radioprotectors. The compound DSePA from our group offered significant radioprotection in preclinical
mode systems both under pre irradiation and post irradiation mode of administrations. The only 30% increase in survival following whole body irradiation by DSePA may not be appreciating as far as ideal radioprotector for radiation emergencies is concerned. However, the fact that DSePA is differentially absorbed between the normal and tumor tissue and it provides significant protection against the side effects of thoracic irradiation gains a lot of significance as a non-toxic radioprotective agent in planned exposures such as radiotherapy. Therefore in future, we propose to evaluate this compound as radioprotector against thoracic radiotherapy in higher animals followed by clinical trials. Additionally, DSePA may also be considered as a model compound in the design and synthesis of more stable, active
Scheme 5. Schematic representation of lung radioprotection offered by DSePA under post-irradiation mode of administration in mice model.

9
ISrapS Bulletin Vol. 27, Issue Number 1 March 2015
in the design and synthesis of more stable, active and potent selenium antioxidants having high free radical scavenging ability, good GPx activity, low cytotoxicity, water solubility and radioprotective capability.
6. Acknowledgements
We acknowledge all the co-authors and collaborators of our published papers cited in the references. We thank Dr. D. K. Palit, Head, RPCD and Dr. B. N. Jagatap, Director, Chemistry group, BARC, India, for their encouragement and support.
7. References1. Kogelnik, H. D. Int. J. Radiat. Oncol. Biol. Phys. 1996, 35,
219–226.2. Riley, P. A. Int. J. Radiat. Biol. 1994, 65, 27-33.3. Sonntag, C. V. The chemical basis of radiation biology.
Taylor & Francis, London, 1987. 4. Carr, K. E., Hume, S. P., Ettarh, R. R., Carr, E. A.,
McCollough, J. S. Radiation-induced changes to epithelial and non-epithelial tissue. In: Dubois, A., King, G. L., Livengood, D. R. (ed) Radiation and the Gastrointestinal Tract, CRC Press, Boca Raton, 1995.
5. Weiss, J. F., Landauer, M. R. Toxicology 2003, 189, 1-20.6. Patt, H. M.; Tyree, E. B.; Straube, R. L.; Smith, D. E. Science
1949, 110, 213–214.7. Bacq, Z.M.; Herve, A.; Lecomte, J.; Fischer, P.; Blavier, J.;
Dechamps, G.; Le Bihan, H.; Rayet, P. Arch. Int. Physiol. 1951, 59, 442-447.
8. Landauer, M. R.; Davis, H. D.; Dominitz, J. A.; Weiss, J. F. Pharmacol. Ther. 1988, 39, 97-100.
9. Sweeney, T. R. Survey of Compounds from the Antiradiation Drug Development Program of the U.S. Army Medical Research and Development Command. Washington, DC: U.S.Government Printing Office, 1979.
10. Andreassen, C. N.; Grau, C.; Lindegaard, J. C. Seminars in Radiation Oncology 2008, 13, 62-72.
11. Brown, P. E. Nature 1967, 213, 363-364.12. Schwarz, K.; Foltz C. M. J. Am. Chem. Soc. 1957, 79, 3292.13. Whanger, P. D. J. Am. Coll. Nutr. 2002, 21, 223–232.14. Behne, D.; Kyriakopoulos, A. Annu. Rev. Nutr. 2001, 21,
453–473.
15. Papp, L. V.; Lu, J.; Holmgren, A.; Khanna, K. K. Antioxid. Redox. Signal. 2007, 9, 775-806.
16. Zeng, H. Molecules 2009, 14, 1263-1278.17. Wessjohann, L. A., Schneider, A., Abbas M., Brandt, W.
Biol. Chem. 2007, 388, 97–1006. 18. Weiss, J. F.; Srinivasan, V.; Kumar, K. S.; Landauer, M. R.
Adv. Space Res. 1992, 12, 223-231.19. Noaman, E., Zahran, A. M.; Kamal, A. M.; Omran, M. F.
Biol. Trace Elem. Res. 2002, 86, 55-64.20. Buntzel, J.; Micke, O.; Mucke, R.; Glatzel, M.; Schonekaes,
K. G.; Schafer, U.; Kisters, K.; Bruns, F. Trace elements and electrolytes 2005, 22, 211-215.
21. Breccia, A.; Badiello, R.; Trenta A.; Mattii, M. Radiat. Res. 1969, 38, 483.
22. Weiss, J. F.; Srinivasan, V.; Kumar, K. S.; Landauer, M. R.; Patchen, M. L. Trace Elements and Free Radicals in Oxidative Diseases. AOCS Press, Champaign, 1994.
23. Tak, J. K.; Park, J. W. Free Radic. Biol. Med. 2009, 46, 1177-1185.
24. Back, T. G.; Moussa, Z. J. Am. Chem. Soc. 2003, 125, 13455-13460.
25. Jain, V K., Priyadarsini, K.I. Proceed. Nat. Acad. Sciences India 2010, 80, 269-280.
26. Mishra, B., Barik, A., Kunwar, A., Kumbhare, L. B., Priyadarsini, K. I., Jain, V. K. Phosphorus, Sulfur, and Silicon Related Elements 2008, 183, 1018–1025.
27. Mishra, B., Kumbhare, L. B., Jain, V. K., Priyadarsini, K. I. J. Phys. Chem. B 2008, 112, 4441-4446.
28. Santhosh Kumar, B., Kunwar, A., Ahmad, A., Kumbhare, L. B., Jain, V. K., Priyadarsini, K. I. Radiat. Environ. Biophys. 2009, 48, 379–384.
29. Kunwar, A., Mishra, B., Barik, A., Kumbhare, L. B., Pandey, R., Jain, V. K., Priyadarsini, K. I. Chem. Res. Toxicol. 2007, 20, 1482-1487.
30. Chaurasia, R. K., Balakrishnan, S., Kunwar, A., Yadav, U., Bhat, N., Anjaria, K., Nairy, R., Sapra, B. K., Jain, V. K., Priyadarsini, K. I. Mutat. Res. Genet. Toxicol. Environ. Mutagen 2014, 774, 8-16.
31. Kunwar, A., Bansal, P., Jaya Kumar, S., Bag, P. P., Paul, P., Reddy, N. D., Kumbhare, L. B., Jain, V. K., Chaubay, R. C., Unnikrishnan, M. K., Priyadarsini K. I. Free Radic. Biol. Med. 2010, 48, 399-410.
32. Kunwar, A., Bag, P. P., Chatopadhyay, S., Jain, V. K., Priyadarsini K. I. Arch. Toxicol. 2011, 85, 1395-1405.
33. Kunwar, A., Jain, V. K., Priyadarsini, K. I., Haston, C. K. Am. J. Respir. Cell. Mol. Biol. 2013, 49, 654-661.

10
ISrapS Bulletin Vol. 27, Issue Number 1 March 2015
Dr. Amit Kunwar received his M. Sc degree in Biotechnology from Tamil Nadu Agricultural University in 2003 and joined Radiation & Photochemistry Division, BARC in 2005 after graduating from BARC Training School (48th Batch, Bioscience discipline). After his Ph.D. from the Homi Bhabha National Institute in 2010, he carried out his postdoctoral research at Meakins Christie Laboratories, McGill University, Montreal, Canada, 2012-2014. His current research interests focus on the evaluation of synthetic as well as natural molecules for their anti-oxidant and pro-oxidant activity employing spectroscopic and biochemical techniques. He is the recipient of Young Scientist Award -2010 from DAE.
Dr. Vimal K. Jain is currently working at Bhabha Atomic Research Centre, Mumbai as Outstanding Scientist (OS) and Head, Chemistry Division. He is an honorary Senior Professor of Chemistry at Homi Bhabha National Institute (deemed University). He is author/ co-author of more than 300 research papers and review articles published in international peer reviewed Journals. He has received several awards, which include: Bruker NMR Award for the Young Scientist (1989); Homi Bhabha Science and Technology Award (1996)” of Department of Atomic Energy; In 1995, he was elected Fellow of the National Academy of Sciences, India and was the Young Associate of the Indian Academy of Sciences (1988-1991).
Dr. K. Indira Priyadarsini is working in the multidisciplinary research areas of chemistry and biology on development of antioxidants and radioprotectors. Her research interests are on free radical reaction dynamics, radiation chemistry and enzyme kinetics, development of antioxidants and radioprotectors from natural products and organoselenium compounds. Recently, she made a special issue on Selenium antioxidants for the journal, Current Chemical biology, 2013. She has published nearly 200 research papers in peer reviewed journals and contributed review articles and book chapters. She is recipient of Homi Bhabha Science & technology Award, 2003 and is an elected Fellow of National Academy of sciences, India and Royal Society of Chemistry, UK

11
ISrapS Bulletin Vol. 27, Issue Number 1 March 2015
1. Introduction:
Novel nanomaterials are fundamental to advances in the energy conversion and storage and catalysis which are current challenges in the quest for an alternative to the fossil fuels and reduction in global warming. Overwhelming studies of nanostructured materials and their composites are focused on developing durable and efficient nanocatalyst1 which has helped in the exponential developments in the field of nanoscience. Research on the morphology controlled supported metal nanostructures are gaining momentum for various applications in fundamental sciences1-3 as the transition from bulk to nanosized regime leads to an enormous change in the physical and chemical properties of nanostructured materials.1. Among these nanomaterials, metal nanostructures are of great interest mainly because of their high surface to volume ratio and their application in catalysis.1,4-6 Such studies have lead to the term ‘nanocatalysis’.7 The catalytic properties of nanostructured materials have been demonstrated by using gold based nanocages and nanoboxes.8 The noble-metal nanoparticles, in particular,
Liquid Crystalline Mesophases as Templates for the Synthesis of Noble Metal Nanostructures by Radiolysis and their Catalytic Activity
Ajit M. Kalekara, Kirankumar Sharmab and Geeta Sharmaa*
aNational Centre for Free Radical Research, Department of Chemistry, Savitribai Phule Pune University, Pune-411007, Maharashtra, India
bSchool of Nanoscience and Biotechnology, Shivaji University, Kolhapur-416004, Maharashtra, IndiaEmail: [email protected]
AbstractNanocatalysis is an emerging and very active area in the field of nanoscience and nanotechnology. The use of platinum and palladium metals as catalysts in organic reactions challenges the materials chemists to develop nanostructures with tunable morphologies. This article demonstrates the use of liquid crystalline mesophases as soft templates for the synthesis and tuning of platinum and palladium nanostructures to different morphology (nanonets and nanoballs) by radiolysis. These nanostructures showed highest surface area leading to an enhanced catalytic activity. Platinum and palladium nanostructures exhibited different mechanism of catalysis and the mechanism was found to be dependent on the metal and the morphology of the nanostructures.
platinum and palladium, are efficiently used as catalyst in many commercially important organic reactions such as Suzuki-Maurya coupling, Heck reaction, cyclopropanation, cycloisomerization, H-D exchange, Suzuki coupling, hydrosilylation, electron transfer reaction.9-23 Recently, it has been also shown that Pt and Pd nanoparticles can degrade alcohol into water.24,25 The catalytic activity of these platinum nanoparticles have been reported to be highly dependent on the morphology, porosity, size distribution and phase composition.26-30 It has been reported that significant enhancement in the catalytic activity could be achieved when monodispersed platinum nanoparticles are linked into platinum nanowires.31 Further, supported Pd nanostructures employed in the intermolecular C-H amination reaction; the Pd loading is > 5 mol % which is quite higher as the catalytic activity is proportional to the catalyst concentration.32,33 These studies have opened an avenue for the researchers to design and synthesize different metal nanostructures and numerous reports are available for the synthesis of 1D, 2D and 3D platinum nanostructures by using templates.34,35.

12
ISrapS Bulletin Vol. 27, Issue Number 1 March 2015
Hard templates and soft templates based techniques are the two synthetic methodologies which are well known for obtaining novel metal and alloy nanostructured materials. Hard templates, such as silica, anodic aluminum oxide and mesoporous carbon are generally used for the synthesis of semiconductor nanostructures, metal nanoparticles and nanowires with high surface to volume ratio.36 However, the hard template synthesis requires strong chemical treatment like hydrofluoric acid for the retrieval of the metal nanostructures.
The surfactant based swollen liquid crystalline mesophases (SLCs) are powerful supramolecular self assemblies that provide soft template nanoreactors for synthesizing porous nanostructures into a specific phase having a well-defined microscopic orientations and are well characterized by small angle X-ray scattering (SAXS) and polarized optical microscope (POM) as shown in Figure 1. The metal doped SLCs have demonstrated to be a feasible nanoreactor for morphology control synthesis of nanostructures by radiolysis.37-40
Soft template based synthetic method using swollen liquid crystalline mesophases has shown to be more advantageous in terms of post synthetic recovery and has been used to obtain novel and interesting nanostructures of platinum, palladium, platinum-palladium alloys, and even conducting polymers with excellent reproducibility. Some of these nanostructured materials like palladium have shown tunable porosity and high catalytic activity for ethanol oxidation.25 Our group has also reported the synthesis of Pt nanostructures with tunable porosity exceptionally high catalytic activity.38,40,41 These Pt/Pd nanostructures, specially the porous nanoballs shaped structures 38,42 are of increased interest for nanocatalysis applications. In this article, we present our ongoing efforts of determining the catalytic activity of these synthesized Pt/Pd nanostructures using the widely used catalytic reduction reaction of 4-nitro phenol (4-NP) to 4-amino phenol
(4-AP) by sodium borohydride as shown in the Scheme 1.
Scheme 1. The catalytic reduction of 4-NP to by NaBH4 in the presence of Pt/Pd nanostructures
Figure 1: A schematic of the formation of Swollen liquid Crystalline Mesophase
shown that Pt and Pd nanoparticles can degrade alcohol into water.24,25 The catalytic activity of these platinum nanoparticles have been reported to be highly dependent on the morphology, porosity, size distribution and phase composition.26-30 It has been reported that significant enhancement in the catalytic activity could be achieved when monodispersed platinum nanoparticles are linked into platinum nanowires.31 Further, supported Pd nanostructures employed in the intermolecular C-H amination reaction; the Pd loading is > 5 mol % which is quite higher as the catalytic activity is proportional to the catalyst concentration.32,33 These studies have opened an avenue for the researchers to design and synthesize different metal nanostructures and numerous reports are available for the synthesis of 1D, 2D and 3D platinum nanostructures by using templates.34,35.
Hard templates and soft templates based techniques are the two synthetic methodologies which are well known for obtaining novel metal and alloy nanostructured materials. Hard templates, such as silica, anodic aluminum oxide and mesoporous carbon are generally used for the synthesis of semiconductor nanostructures, metal nanoparticles and nanowires with high surface to volume ratio.36 However, the hard template synthesis requires strong chemical treatment like hydrofluoric acid for the retrieval of the metal nanostructures. The surfactant based swollen liquid crystalline mesophases (SLCs) are powerful supramolecular self assemblies that provide soft template nanoreactors for synthesizing porous nanostructures into a specific phase having a well-defined microscopic
orientations and are well characterized by small angle X-ray scattering (SAXS) and polarized optical microscope (POM) as shown in Figure 1. The metal doped SLCs have demonstrated to be a feasible nanoreactor for morphology control synthesis of nanostructures by radiolysis.37-
40
Soft template based synthetic method using swollen liquid crystalline mesophases has shown to be more advantageous in terms of post synthetic recovery and has been used to obtain novel and interesting nanostructures of platinum, palladium, platinum-palladium alloys, and even conducting polymers with excellent reproducibility. Some of these nanostructured materials like palladium have shown tunable porosity and high catalytic activity for ethanol oxidation.25 Our group has also reported the synthesis of Pt nanostructures with tunable porosity exceptionally high catalytic activity.38,40,41 These Pt/Pd nanostructures, specially the porous nanoballs shaped structures 38,42 are of increased interest for nanocatalysis applications. In this article, we present our ongoing efforts of determining the catalytic activity of these synthesized Pt/Pd nanostructures using the widely used catalytic reduction reaction of 4-nitro phenol (4-NP) to 4-amino phenol (4-AP) by sodium borohydride as shown in the Scheme 1.
OHN
O
O
OHH2NNaBH4
PtNB/PtNN
Scheme 1. The catalytic reduction of 4-NP to by NaBH4 in the presence of Pt/Pd nanostructures.
Figure 1: A schematic of the formation of Swollen liquid Crystalline Mesophase 2. Materials and Methods 2.1 Materials
Noble metal precursors, tetraammineplatinum (II) chloride [Pt(NH3)4Cl2], (99% purity) and tetraamminepalladium (II) chloride (98 %) [Pd(NH3)4Cl2], were from Sigma Aldrich. The cationic surfactant, cetyltrimethylammonium bromide (CTAB) (99% purity) was from SD fine. The co-surfactant, 1-pentanol (99.5% purity), the oil, cyclohexane (99% purity), propan-2-ol (99.6% purity) was from Qualigens. Nitrogen (N2) gas with purity 99.995% was purchased from Inox. All the solutions were prepared in de-ionized water from Milli-Q system.
2.2. Synthesis and characterization of Platinum and Palladium Nanostructures
Swollen hexagonal mesophase containing cetyltrimethylammonium bromide (CTAB) as surfactant was prepared by dissolving 1.03 g of surfactant in 2 mL Milli Q water with a concentration of Pt(NH3)4Cl2/ [Pd(NH3)4Cl2], of 0.1 M, to obtain a transparent and viscous micellar solution. The addition of 2.98 mL of oil
(cyclohexane) under stirring into this micellar solution leads to a white unstable emulsion. The co-surfactant, 1-pentanol (250 �L) is then added to the mixture, which is strongly vortexed for a few minutes, and a perfectly transparent and stable gel (a hexagonal mesophase) is obtained. All experiments were performed at room temperature. To eliminate any dissolved O2,
the prepared SLCs were kept under N2 bubbling in glass tubes sealed with siliconized rubber septum for 30 minutes. The stable, perfectly transparent and birefringent SLCs were exposed to radiation using the 60Co γ source facility at Department of Chemistry, Savitribai Phule Pune University Pune. The dose rate determined using Fricke dosimetry was found to be 3.6 kGy h-1). An irradiation dose 80 kGy was used for the synthesis. After irradiation, the SLCs were destabilized by washing with propan-2-ol. The obtained platinum/ palladium nanostructures were centrifuged at 15,000 RPM at ambient temperature for 20 minutes using a REMI research centrifuge. The supernatant was removed by decantation and the residues were washed several times with propan-2-ol and water. The harvested nanostructures
Figure 1: A schematic of the formation of Swollen liquid Crystalline Mesophase
2. Materials and Methods
2.1 Materials
Noble metal precursors, tetraammineplati-num (II) chloride [Pt(NH3)4Cl2], (99% purity) and tetraamminepalladium (II) chloride (98 %) [Pd(NH3)4Cl2], were from Sigma Aldrich. The cationic surfactant, cetyltrimethylammonium bromide (CTAB) (99% purity) was from SD fine. The co-surfactant, 1-pentanol (99.5% purity), the oil, cyclohexane (99% purity), propan-2-ol (99.6% purity) was from Qualigens. Nitrogen (N2) gas with purity 99.995% was purchased from Inox. All the solutions were prepared in de-ionized water from Milli-Q system.
2.2. Synthesis and characterization of Platinum and Palladium Nanostructures
Swollen hexagonal mesophase containing cetyltrimethylammonium bromide (CTAB) as surfactant was prepared by dissolving 1.03 g of surfactant in 2 mL Milli Q water with a concentration of Pt(NH3)4Cl2/ [Pd(NH3)4Cl2], of 0.1 M, to obtain a transparent and viscous micellar solution. The addition of 2.98 mL of oil

13
ISrapS Bulletin Vol. 27, Issue Number 1 March 2015
(cyclohexane) under stirring into this micellar solution leads to a white unstable emulsion. The co-surfactant, 1-pentanol (250 μL) is then added to the mixture, which is strongly vortexed for a few minutes, and a perfectly transparent and stable gel (a hexagonal mesophase) is obtained. All experiments were performed at room temperature. To eliminate any dissolved O2, the prepared SLCs were kept under N2 bubbling in glass tubes sealed with siliconized rubber septum for 30 minutes. The stable, perfectly transparent and birefringent SLCs were exposed to radiation using the 60Co g source facility at Department of Chemistry, Savitribai Phule Pune University Pune. The dose rate determined using Fricke dosimetry was found to be 3.6 kGy h-1). An irradiation dose 80 kGy was used for the synthesis. After irradiation, the SLCs were destabilized by washing with propan-2-ol. The obtained platinum/ palladium nanostructures were centrifuged at 15,000 RPM at ambient temperature for 20 minutes using a REMI research centrifuge. The supernatant was removed by decantation and the residues were washed several times with propan-2-ol and water. The harvested nanostructures were air dried and stored under nitrogen prior to characterization by transmission electron microscopy (TEM), high resolution transmission electron microscopy (HRTEM), X-ray diffraction (XRD), BET surface characterization and UV-Vis spectroscopy.
2.3. Catalytic reduction of 4-nitrophenol (4-NP)
The catalytic reduction of 4-NP by NaBH4 in presence of PtNBs/PdNBs was used as a model reaction for evaluating the catalytic activity of the synthesized nanostructures. The reaction was performed as follows: 1 × 10⁻⁴ M of 4-NP (1.5 mL) and 5 × 10⁻² M NaBH4 (1.0 mL) were mixed and stirred for 1 min in a quartz cuvette. To this mixture, 50 mg/L of PtNBs or 1 mg/L of PdNBs were added and the reaction was monitored by observing the change in absorbance of 4-nitro phenolate anion absorbing at 400 nm. The absorption spectra were recorded within the wavelength range of 200-600 nm. For uncatalyzed reaction, instead of PtNBs/PdNBs, 0.5 mL of
Milli-Q water was added and spectra were recorded at same wavelength.
2.4. Kinetic analysis
The mechanism for the heterogeneous catalysis reactions are studied using the classical Langmuir-Hinshelwood equation which is based on the reaction between the chemisorbed species on the surface of the catalyst and the same mechanism has been accepted for a vast majority of surface catalytic reactions both experimentally and theoritically.43,44 The obtained data, thus were explored utilizing Langmuir-Hinshelwood mechanism on conditions that the reaction proceeds by encounters between the chemisorbed atoms on the surface and the substrate molecules. The rate equation for heterogeneous catalysis according to the Langmuir-Hinshelwood mechanism for a single molecule adsorbed on the surface of catalyst is given by equation (1).
- dCdt
=kreact Kad C1 + Kad C (1)
where, kreact is the reaction rate constant, Kad is the equilibrium constant for the adsorption of the reactant on the platinum nanostructured surface, C is the concentration at any time t. On integrating equation (1), under conditions of pseudo-first order reaction and when Kad
C<<1, equation (1) reduces to:
ln C0C
= kapp t = k S t (2)
where C0 is the initial concentration, kapp = kreact Kad is the pseudo first order rate constant and is assumed to be proportional to the the accessible surface area S of the Pt nanostructures and hence k = kapp/S. The concentrations C0 and C have their equivalent in terms of absorbance are A0 and At respectively, which are monitered at a fixed wavelength (λ) at time t. Therefore, for constant catalyst concentration and uniform acessible surface area by the reactants, a plot of ln (A0/At) as a function of time results in a straight line whose slope is defined by the

14
ISrapS Bulletin Vol. 27, Issue Number 1 March 2015
pseudo-first order rate constant kapp of the catalytic reaction.
The obtained kapp at different temperatures are used in the Arrhenius equation (3) to calculate the activation energy (Ea) of the catalytic reduction by these nanostructures.
RTE
app
a
Aek−
= (3) 3. Results and Discussion
3.1. Morphology and the BET measurement of the synthesized platinum and palladium nanostructures.
The TEM and HRTEM images of the synthesized platinum nanostructures irradiated at different γ-radiation doses (40 kGy and 80 kGy) are shown in the Figures 2a, 2c and 2b, 2d respectively.
Figure 2. TEM images of (a) PtNNs, (dose= 40kGy) and (b) PtNBs, (dose= 80kGy) synthesized in SLCs. The corresponding HRTEM images (c, d). Figure 2a and 2b shows the morphology of platinum nanostructures obtained under these conditions are different. Interconnected platinum nanowires forming net like structures: platinum nanonets (PtNNs) are obtained at 40 kGy of irradiation (Figure 2a). But the sample irradiated at 80 kGy shows interconnected network of platinum nanowires aggregating into ball-shaped structures of 60-100 nm forming porous platinum nanoballs (PtNBs) Figure 2b. The average diameter of the nanowires is about 3-4 nm and this value is consistent with the thickness of water channels between the two cylinders (3 nm) of SLCs.37 The synthesized nanostructures have similar morphology as reported
earlier40,45 suggesting excellent reproducibility and robustness of the synthesis technique.
The HRTEM images were obtained for the PtNNs and PtNBs nanostructures before the catalytic reaction and are shown in Figure 2c and 2d. The continuous lattice fringes over a whole individual nanowire were observed in both PtNNs and PtNBs. The 0.22 nm measured d spacing of the crystal domain corresponds to the d (111) spacing for fcc platinum before the reaction. The results are complemented by the XRD data of the prepared PtNNs and PtNBs shown in the Supporting Information as Figure 3 (a, c). The peaks at 40.11˚, 46.42˚, 67.83˚, 81.52˚ and 40.07˚, 46.50˚, 67.80˚,
(3)
3. Results and Discussion
3.1. Morphology and the BET measurement of the synthesized platinum and palladium nanostructures.
The TEM and HRTEM images of the synthesized platinum nanostructures irradiated at different γ-radiation doses (40 kGy and 80 kGy) are shown in the Figures 2a, 2c and 2b, 2d respectively.
structures of 60-100 nm forming porous platinum nanoballs (PtNBs) Figure 2b. The average diameter of the nanowires is about 3-4 nm and this value is consistent with the thickness of water channels between the two cylinders (3 nm) of SLCs.37 The synthesized nanostructures have similar morphology as reported earlier40,45 suggesting excellent reproducibility and robustness of the synthesis technique.
The HRTEM images were obtained for the PtNNs and PtNBs nanostructures before the catalytic reaction and are shown in Figure 2c and 2d. The continuous lattice fringes over a whole individual nanowire were observed in both PtNNs and PtNBs. The 0.22 nm measured d spacing of the crystal domain corresponds to the d (111) spacing for fcc platinum before the reaction. The results are complemented by the XRD data of the prepared PtNNs and PtNBs shown in the Supporting Information as Figure 3 (a, c). The peaks at 40.11˚, 46.42˚, 67.83˚, 81.52˚ and 40.07˚, 46.50˚, 67.80˚, 81.61˚ respectively, can be attributed to the diffractions from (111), (200), (220) and (311) planes of polycrystalline platinum.
RTE
app
a
Aek−
= (3) 3. Results and Discussion
3.1. Morphology and the BET measurement of the synthesized platinum and palladium nanostructures.
The TEM and HRTEM images of the synthesized platinum nanostructures irradiated at different γ-radiation doses (40 kGy and 80 kGy) are shown in the Figures 2a, 2c and 2b, 2d respectively.
Figure 2. TEM images of (a) PtNNs, (dose= 40kGy) and (b) PtNBs, (dose= 80kGy) synthesized in SLCs. The corresponding HRTEM images (c, d). Figure 2a and 2b shows the morphology of platinum nanostructures obtained under these conditions are different. Interconnected platinum nanowires forming net like structures: platinum nanonets (PtNNs) are obtained at 40 kGy of irradiation (Figure 2a). But the sample irradiated at 80 kGy shows interconnected network of platinum nanowires aggregating into ball-shaped structures of 60-100 nm forming porous platinum nanoballs (PtNBs) Figure 2b. The average diameter of the nanowires is about 3-4 nm and this value is consistent with the thickness of water channels between the two cylinders (3 nm) of SLCs.37 The synthesized nanostructures have similar morphology as reported
earlier40,45 suggesting excellent reproducibility and robustness of the synthesis technique.
The HRTEM images were obtained for the PtNNs and PtNBs nanostructures before the catalytic reaction and are shown in Figure 2c and 2d. The continuous lattice fringes over a whole individual nanowire were observed in both PtNNs and PtNBs. The 0.22 nm measured d spacing of the crystal domain corresponds to the d (111) spacing for fcc platinum before the reaction. The results are complemented by the XRD data of the prepared PtNNs and PtNBs shown in the Supporting Information as Figure 3 (a, c). The peaks at 40.11˚, 46.42˚, 67.83˚, 81.52˚ and 40.07˚, 46.50˚, 67.80˚,
Figure 2. TEM images of (a) PtNNs, (dose= 40kGy) and (b) PtNBs, (dose= 80kGy) synthesized in SLCs. The corresponding HRTEM images (c, d).
Figure 2a and 2b shows the morphology of platinum nanostructures obtained under these conditions are different. Interconnected platinum nanowires forming net like structures: platinum nanonets (PtNNs) are obtained at 40 kGy of irradiation (Figure 2a). But the sample irradiated at 80 kGy shows interconnected network of platinum nanowires aggregating into ball-shaped
81.61˚ respectively, can be attributed to the diffractions from (111), (200), (220) and (311) planes of polycrystalline platinum.
Figure 3: X-ray diffractograms (XRD) recorded, before (a) and after (b) PNP reduction reaction with PtNNs; before (c) and after (d) PNP reduction reaction with PtNBs showing no change in crystalline planes after the reaction. Similarly, the TEM images of the synthesized Pd nanostructures in SLCs are depicted in Figure 4, panel a and b. The images show a three-dimensionally (3D) interconnected Pd nanowires forming hexagonal shaped cells of 13-15 nm diameter which are interlinked into ball shaped nanostructures (PdNBs) of size ranging from 50-90 nm. These 3D nanowires have average diameter of about
3-4 nm, consistent with the water channel thickness between the two cyclohexane cylinders of hexagonal SLCs.38 The HR-TEM image of PdNBs before the catalytic reaction (Figure 4c) shows continuous lattice fringes with 0.238 nm which represents the d spacing. This d spacing of the crystalline domain corresponds to the d (111) plane of fcc Pd.
Figure 3: X-ray diffractograms (XRD) recorded, before (a) and after (b) PNP reduction reaction with PtNNs; before (c) and after (d) PNP reduction reaction with PtNBs showing no change in crystalline planes after the reaction.
Similarly, the TEM images of the synthesized Pd nanostructures in SLCs are depicted in Figure 4, panel a and b. The images show a three-dimensionally (3D) interconnected Pd nanowires forming hexagonal shaped cells of 13-15 nm diameter which are interlinked into ball shaped nanostructures (PdNBs) of size ranging from

15
ISrapS Bulletin Vol. 27, Issue Number 1 March 2015
50-90 nm. These 3D nanowires have average diameter of about 3-4 nm, consistent with the water channel thickness between the two cyclohexane cylinders of hexagonal SLCs.38 The HR-TEM image of PdNBs before the catalytic reaction (Figure 4c) shows continuous lattice fringes with 0.238 nm which represents the d spacing. This d spacing of the crystalline domain corresponds to the d (111) plane of fcc Pd.
patterns were correlated to the diffractions from (111), (200) and (220) planes of crystalline Pd.
BET (Brunauer, Emmett and Teller) measurements (nitrogen adsorption isotherms at 77 K) were performed on the synthesized nanostructures, before and after the 4-NP reactions to determine the total surface area. The isotherms for the PtNNs and PtNBs are shown in Figure 6. As shown in the Figure 6, the PtNNs present a type IV isotherm which is characteristic of mesoporous material while the PtNBs shows a type II isotherm characteristic of macroporous (or non-porous material). The calculated total surface area are larger for PtNBs (110 m2/g) than for the PtNNs (99 m2/g). The surface areas obtained for these Pt nanostructures are the highest of any nanomaterials so far reported in the literature. Compared with silica on a molar ratio basis (SiO2, 60 g, and Pt, 195.1 g), this value would correspond to a specific surface area of 358 m2/g and 322 m2/g respectively. Using the non porous SiO2 materials as reference, it is also possible to give an estimation of the external surface for these PtNNs and PtNBs: 98 m2/g and 82 m2/g, respectively, which finally corresponds to a ratio (external surface over total surface) of 0.88 for the PtNBs and 0.83 for the PtNNs. The surfaces measured here are much higher than those already reported for the Pt nanoballs.46
Figure 4: The TEM image of PdNBs synthesized in SLCs after 80 kGy of γ irradiation (panel a and b); Panel a, inset is the selected area electron diffraction (SAED) pattern. c) HR-TEM image of PdNBs showing a continuous lattice fringes with d spacing 0.238 nm. Dose rate= 3.6 kGyh-1. The XRD pattern of the prepared PdNBs show 2 peaks at 40.13˚, 46.96˚ and 68.13˚ while for Pdurc show 2 peaks at 39.93˚, 46.81˚ and 68.01˚ respectively, Figure 5.
These diffraction patterns were correlated to the diffractions from (111), (200) and (220) planes of crystalline Pd.
Figure 5: X-ray diffractograms (XRD) recorded, before (a) and after (b) 4-NP reduction reaction with PdNBs, showing no change in crystalline planes after the reaction
Figure 4: The TEM image of PdNBs synthesized in SLCs after 80 kGy of γ irradiation (panel a and b); Panel a, inset is the selected area electron diffraction (SAED) pattern. c) HR-TEM image of PdNBs showing a continuous lattice fringes with d spacing 0.238 nm. Dose rate= 3.6 kGyh-1.
Figure 5: X-ray diffractograms (XRD) recorded, before (a) and after (b) 4-NP reduction reaction with PdNBs, showing no change in crystalline planes after the reaction
The XRD pattern of the prepared PdNBs show 2θ peaks at 40.13˚, 46.96˚ and 68.13˚ while for Pdurc show 2θ peaks at 39.93˚, 46.81˚ and 68.01˚ respectively, Figure 5. These diffraction
Figure 6: Nitrogen adsorption isotherms at 77 K for a) PtNNs b) PtNBs before PNP reduction reaction and c) PtNBs after PNP reduction reaction

16
ISrapS Bulletin Vol. 27, Issue Number 1 March 2015
Similarly, the nitrogen adsorption isotherms at 77 K for PdNBs before and after 4-NP reduction reaction were depicted in Figure 7. The PdNBs represents a type II isotherms, characteristic of macroporous (or non-porous) materials. The total surface area for PdNBs was calculated to be 86 m2/g. Comparing this Pd nanostructures with silica on a molar ratio basis (SiO2, Mol. Wt.= 60 g, and Pd, Mol. Wt.= 106.42 g), the value would corresponds to specific surface area of 153 m2/g. The surface area obtained for the PdNBs nanostructures is the highest of any bare Pd nanomaterials
As it can be seen from the Figure 8b, an induction time (t0) is observed for the PtNNs catalyzed reaction and the reaction proceeds at a slower rate up to 25 minutes, while for the PtNBs catalyzed reaction (Figure 8c), no induction time (t0) was observed and the rate of the reaction slows down after 10 minutes and display linear behavior at longer reaction time. The morphology of the nanostructures could be playing an important role in the induction time, because, for PtNBs the porous nanowires are 3D connected into a ball-shaped domain where reactants can easily access the surface and form an equilibrium which is not the case in PtNNs. These kinetic curves are different from those reported so far in the literature and do not seem to follow equation (2). On careful analysis of equation (2), the term related to the accessible surface area, S is an important parameter which will influence the nature of the curve. In order to ascertain the
Figure 7: Nitrogen adsorption isotherms at 77 K for a) PdNBs before PNP reduction reaction, b) PdNBs after PNP reduction reaction.
3.3. Kinetics of the reduction of 4-nitro phenol (4-NP)
The catalytic activity of the platinum nanostructure was investigated in the reduction of PNP to PAP by NaBH4. The UV-Vis spectra for the catalyzed reaction between PNP and NaBH4 in Figure 8a shows a decrease in absorbance at 400 nm which represent the disappearance of the 4-nitro phenolate anion due to reduction of 4-NP to 4-AP. The kinetics at ambient temperature for the PtNNs and PtNBs catalyzed reactions are shown in Figure 8b and 8c respectively. The kinetic data were analyzed by using the Langmuir-Hinshelwood equation (2).
catalyzed reactions are shown in Figure 8b and 8c respectively. The kinetic data were
analyzed by using the Langmuir-Hinshelwood equation (2).
Figure 8: (a) UV-Vis absorption spectra at different time intervals indicate the disappearance of the peak of p-nitrophenolate anion at 400 nm due to reduction of PNP to PAP by NaBH4 in the presence of PtNNs. (b) Linear plots of ln (A0/At) versus time at 303 K in the presence of PtNNs. (c) in the presence of PtNBs, the linearity exists at longer reaction time. Reaction conditions: [PNP] = 1 × 10⁻⁴ M; [NaBH4] = 5x10⁻² M; [PtNNs] = [PtNBs] = 50 mg/L Scan time = 2 minutes for (b) and 1 minute for (c).
As it can be seen from the Figure 8b, an induction time (t0) is observed for the PtNNs catalyzed reaction and the reaction proceeds at a slower rate up to 25 minutes, while for the PtNBs catalyzed reaction (Figure 8c), no induction time (t0) was observed and the rate of the reaction slows down after 10 minutes and display linear behavior at longer reaction time. The morphology of the nanostructures could be playing an important role in the induction time, because, for PtNBs the porous nanowires are 3D connected into a ball-shaped domain where reactants can easily
access the surface and form an equilibrium which is not the case in PtNNs. These kinetic curves are different from those reported so far in the literature and do not seem to follow equation (2). On careful analysis of equation (2), the term related to the accessible surface area, S is an important parameter which will influence the nature of the curve. In order to ascertain the possibility of surface restructuring of platinum nanostructures, TEM and HRTEM images for the platinum nanostructures were recorded after the catalytic reaction and are shown in Figure 9a-d.
Figure 8: (a) UV-Vis absorption spectra at different time intervals indicate the disappearance of the peak of p-nitrophenolate anion at 400 nm due to reduction of PNP to PAP by NaBH4 in the presence of PtNNs. (b) Linear plots of ln (A0/At) versus time at 303 K in the presence of PtNNs. (c) in the presence of PtNBs, the linearity exists at longer reaction time. Reaction conditions: [PNP] = 1 × 10⁻⁴ M; [NaBH4] = 5x10⁻² M; [PtNNs] = [PtNBs] = 50 mg/L Scan time = 2 minutes for (b) and 1 minute for (c).

17
ISrapS Bulletin Vol. 27, Issue Number 1 March 2015
possibility of surface restructuring of platinum nanostructures, TEM and HRTEM images for the platinum nanostructures were recorded after the catalytic reaction and are shown in Figure 9a-d.
The TEM images of PtNBs after the reaction show that the porous nanoballs agglomerate into spindle shaped nanostructures (Figure 9b) and the percentage of agglomeration after the reaction was found to be 14% calculated from the frequency distribution of the nanostructures. This was also corresponding to the rate constant at longer time scale which was lower approximately by 13% than the initial rate constant. The crystallinity of the platinum nanostructures after the catalytic reaction was further confirmed by HRTEM image of the nanostructures and is shown in Figure 9c-d. The XRD of PtNNs and PtNBs after 4-NP reduction reaction are not affected after the reaction (Figure 3b and 3d) although restructuring of the nanostructure occurred leading to the reduction in the accessible surface area S and hence the pseudo-first order rate constant of the reaction. This remarkable evidence of restructuring of platinum nanostructures in a catalytic reaction is first of its kind so far available in the literature.
This observation could be the basis for the explanation of the nature of the plot shown in Figure 8c as the initial fast pseudo-first order rate constant can be attributed to the larger accessible surface area, S = 110 m2/g of the PtNBs. As the reaction proceeds, the restructuring of the PtNBs by agglomeration occurs which leads to the reduction in the accessible surface area (59 m2/g) as determined from the BET isotherm of the PtNBs after the reaction (Figure 6) which is 46% lower than that before the 4-NP reaction. Note that with the same assumptions than previously explained, the ratio of the external surface over the total surface is now of 0.92. Such condition leads to the lowering of the pseudo-first order rate constant in agreement with the equation (2). At ambient temperature, the pseudo-first order rate constant for PtNNs catalyzed reaction was found to be (8.4 ± 0.3) × 10-2 min-1 while for the PtNBs, it was found to be (12.6 ± 2.5) × 10-2 min-1. Since the data points used for fitting the kinetic curves of PtNBs catalyzed reaction of PNP to 4-AP are less, there is a larger error as compared to PtNNs.
Similarly, the catalytic activity of PdNBs was studied in the reduction of 4-NP by sodium borohydride and is shown in Figure 10.
The apparent pseudo-first order rate constants (kapp) were determine by plotting ln(A0/
The TEM images of PtNBs after the reaction show that the porous nanoballs agglomerate into spindle shaped nanostructures (Figure 9b) and the percentage of agglomeration after the reaction was found to be 14% calculated from the frequency distribution of the nanostructures. This was also corresponding to the rate constant at longer time scale which was lower approximately by 13% than the initial rate constant. The crystallinity of the platinum nanostructures after the catalytic reaction was further confirmed by HRTEM image of the
nanostructures and is shown in Figure 9c-d. The XRD of PtNNs and PtNBs after 4-NP reduction reaction are not affected after the reaction (Figure 3b and 3d) although restructuring of the nanostructure occurred leading to the reduction in the accessible surface area S and hence the pseudo-first order rate constant of the reaction. This remarkable evidence of restructuring of platinum nanostructures in a catalytic reaction is first of its kind so far available in the literature.
Figure 9. TEM image of PtNNs (a) and (b) PtNBs after the reaction showing surface restructuring of PtNBs. The corresponding HRTEM images (c, d); inset: the respective SAED patterns.
This observation could be the basis for
the explanation of the nature of the plot shown in Figure 8c as the initial fast pseudo-first order rate constant can be attributed to the larger accessible surface area, S = 110 m2/g of the PtNBs. As the reaction proceeds, the restructuring of the PtNBs by agglomeration occurs which leads
to the reduction in the accessible surface area (59 m2/g) as determined from the BET isotherm of the PtNBs after the reaction (Figure 6) which is 46% lower than that before the 4-NP reaction. Note that with the same assumptions than previously explained, the ratio of the external surface over the total surface is now of 0.92. Such
Figure 9. TEM image of PtNNs (a) and (b) PtNBs after the reaction showing surface restructuring of PtNBs. The corresponding HRTEM images (c, d); inset: the respective SAED patterns.
Figure 10: The plots of absorbance as a function of wavelength at 303 K for regular time intervals indicates the disappearance of the peak of 4-nitrophenolate anion at 400 nm due to reduction of 4-NP to 4-AP by NaBH4 (a) in presence of PdNBs; Inset-linear plots of ln (A0/At) versus time; (b) in absence of PdNBs/Pdurc; Inset- left panel: zoomed around 400 nm, Inset- right panel: linear plots of ln (A0/At) versus time. Reaction conditions: [4-NP] =1×10⁻⁴ M, [NaBH4] = 5 ×10⁻² M, [PdNBs] = 1 mg/L, [Pdurc] = 10 mg/L.
condition leads to the lowering of the pseudo-first order rate constant in agreement with the equation (2). At ambient temperature, the pseudo-first order rate constant for PtNNs catalyzed reaction was found to be (8.4 ± 0.3) × 10-2 min-1 while for the PtNBs, it was found to be (12.6 ± 2.5) × 10-2 min-1. Since the data points used for
fitting the kinetic curves of PtNBs catalyzed reaction of PNP to 4-AP are less, there is a larger error as compared to PtNNs. Similarly, the catalytic activity of PdNBs was studied in the reduction of 4-NP by sodium borohydride and is shown in Figure 10.
Figure 10: The plots of absorbance as a function of wavelength at 303 K for regular time intervals indicates the disappearance of the peak of 4-nitrophenolate anion at 400 nm due to reduction of 4-NP to 4-AP by NaBH4 (a) in presence of PdNBs; Inset-linear plots of ln (A0/At) versus time; (b) in absence of PdNBs/Pdurc; Inset- left panel: zoomed around 400 nm, Inset- right panel: linear plots of ln (A0/At) versus time. Reaction conditions: [4-NP] =1×10⁻⁴ M, [NaBH4] = 5 ×10⁻² M, [PdNBs] = 1 mg/L, [Pdurc] = 10 mg/L. The apparent pseudo-first order rate constants (kapp) were determine by plotting ln(A0/At) as a function of time (Figure 10a; inset). The kapp values was found to be (23.04±0.85) x10-2 min-1 for PdNBs at 303 K is the significantly higher than the PtNNs and PtNBs. Further, the rate is the highest so far reported in the literature for the Pd nanomaterials. Numerous reports are available in the literature for the 4-NP reduction shows t0, owing to the presence of oxygen in the system and a dynamic substrate induced surface restructuring process which slows down the equilibrium between the reactant on the surface of the catalyst. Interestingly, we have observed that t0 is absent even if the reactions are
carried out in air. The absence of t0 is possibly due to the porosity of metal nanostructures which establishes fast equilibrium between the reactant leading to enhanced catalytic activity of PdNBs as compared to PtNNs and PtNBs.41 The 3D interconnected network of nanowires creates a ball shaped morphology where both reactants can easily diffuse on the surface of nanostructures thereby reduces mass transfer process and forms a fast equilibrium to accelerate the reaction. Mei et al. found the surface restructuring in thermosensative microgel-Pd composites occurs at higher temperature and subsequently the catalytic activity decreases.47 In order to investigate such morphological changes at high
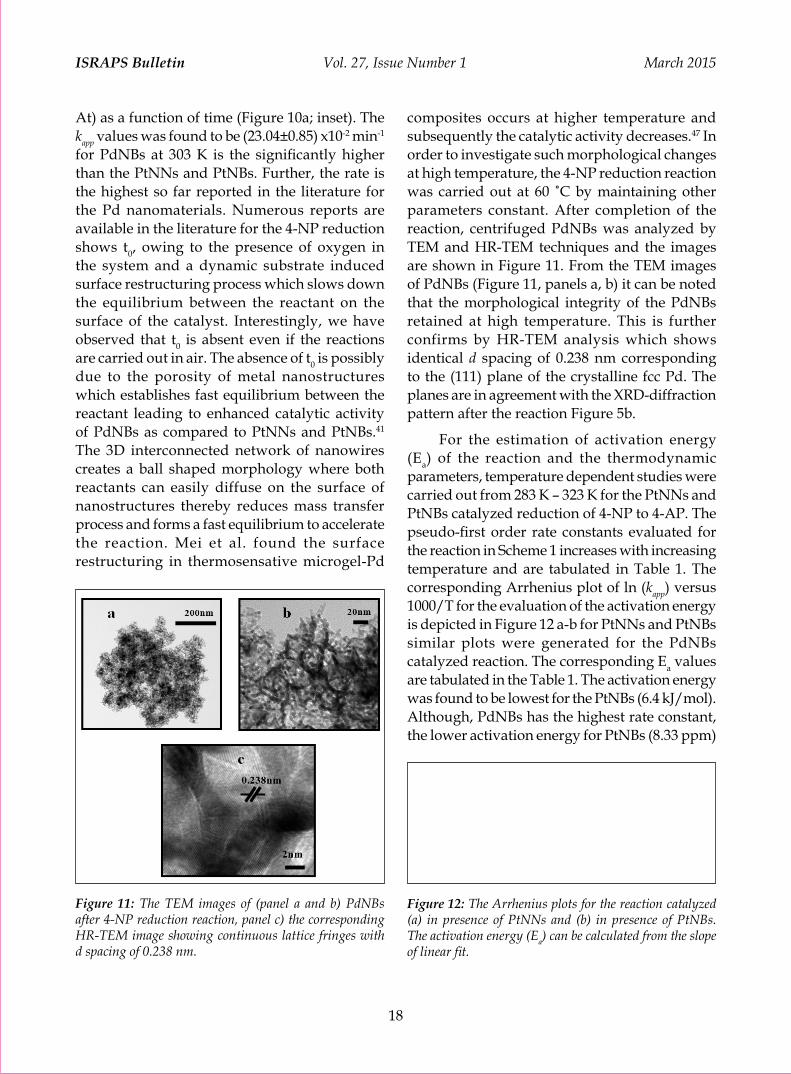
18
ISrapS Bulletin Vol. 27, Issue Number 1 March 2015
At) as a function of time (Figure 10a; inset). The kapp values was found to be (23.04±0.85) x10-2 min-1 for PdNBs at 303 K is the significantly higher than the PtNNs and PtNBs. Further, the rate is the highest so far reported in the literature for the Pd nanomaterials. Numerous reports are available in the literature for the 4-NP reduction shows t0, owing to the presence of oxygen in the system and a dynamic substrate induced surface restructuring process which slows down the equilibrium between the reactant on the surface of the catalyst. Interestingly, we have observed that t0 is absent even if the reactions are carried out in air. The absence of t0 is possibly due to the porosity of metal nanostructures which establishes fast equilibrium between the reactant leading to enhanced catalytic activity of PdNBs as compared to PtNNs and PtNBs.41 The 3D interconnected network of nanowires creates a ball shaped morphology where both reactants can easily diffuse on the surface of nanostructures thereby reduces mass transfer process and forms a fast equilibrium to accelerate the reaction. Mei et al. found the surface restructuring in thermosensative microgel-Pd
composites occurs at higher temperature and subsequently the catalytic activity decreases.47 In order to investigate such morphological changes at high temperature, the 4-NP reduction reaction was carried out at 60 ˚C by maintaining other parameters constant. After completion of the reaction, centrifuged PdNBs was analyzed by TEM and HR-TEM techniques and the images are shown in Figure 11. From the TEM images of PdNBs (Figure 11, panels a, b) it can be noted that the morphological integrity of the PdNBs retained at high temperature. This is further confirms by HR-TEM analysis which shows identical d spacing of 0.238 nm corresponding to the (111) plane of the crystalline fcc Pd. The planes are in agreement with the XRD-diffraction pattern after the reaction Figure 5b.
For the estimation of activation energy (Ea) of the reaction and the thermodynamic parameters, temperature dependent studies were carried out from 283 K – 323 K for the PtNNs and PtNBs catalyzed reduction of 4-NP to 4-AP. The pseudo-first order rate constants evaluated for the reaction in Scheme 1 increases with increasing temperature and are tabulated in Table 1. The corresponding Arrhenius plot of ln (kapp) versus 1000/T for the evaluation of the activation energy is depicted in Figure 12 a-b for PtNNs and PtNBs similar plots were generated for the PdNBs catalyzed reaction. The corresponding Ea values are tabulated in the Table 1. The activation energy was found to be lowest for the PtNBs (6.4 kJ/mol). Although, PdNBs has the highest rate constant, the lower activation energy for PtNBs (8.33 ppm)
Figure 11: The TEM images of (panel a and b) PdNBs after 4-NP reduction reaction, panel c) the corresponding HR-TEM image showing continuous lattice fringes with d spacing of 0.238 nm.
temperature, the 4-NP reduction reaction was carried out at 60 ˚C by maintaining other parameters constant. After completion of the reaction, centrifuged PdNBs was analyzed by TEM and HR-TEM techniques and the images are shown in Figure 11. From the TEM images of PdNBs (Figure 11, panels a, b) it can be noted that the morphological integrity of the PdNBs
retained at high temperature. This is further confirms by HR-TEM analysis which shows identical d spacing of 0.238 nm corresponding to the (111) plane of the crystalline fcc Pd. The planes are in agreement with the XRD-diffraction pattern after the reaction Figure 5b.
Figure 11: The TEM images of (panel a and b) PdNBs after 4-NP reduction reaction, panel c) the corresponding HR-TEM image showing continuous lattice fringes with d spacing of 0.238 nm. For the estimation of activation energy (Ea) of the reaction and the thermodynamic parameters, temperature dependent studies were carried out from 283 K – 323 K for the PtNNs and PtNBs catalyzed reduction of 4-NP to 4-AP. The pseudo-first order rate constants evaluated for the reaction in Scheme 1 increases with increasing temperature and are tabulated in Table 1. The corresponding Arrhenius plot of ln (kapp) versus 1000/T for the evaluation of the activation energy is depicted in Figure
12 a-b for PtNNs and PtNBs similar plots were generated for the PdNBs catalyzed reaction. The corresponding Ea values are tabulated in the Table 1. The activation energy was found to be lowest for the PtNBs (6.4 kJ/mol). Although, PdNBs has the highest rate constant, the lower activation energy for PtNBs (8.33 ppm) is possibly due to the loading amount of PdNBs (0.166 ppm) which is lower by 50 folds.
Figure 12: The Arrhenius plots for the reaction catalyzed (a) in presence of PtNNs and (b) in presence of PtNBs. The activation energy (Ea) can be calculated from the slope of linear fit.
Figure 12: The Arrhenius plots for the reaction catalyzed (a) in presence of PtNNs and (b) in presence of PtNBs. The activation energy (Ea) can be calculated from the slope of linear fit.
Table 2. The pseudo-first order rate constants (kapp) at different temperatures, the activation energy (Ea) for the platinum and palladium nanostructures catalyzed reduction of PNP byNaBH4. The
uncertainties correspond to the standard deviation obtained from the linear regression by least squares method.
4. Conclusions: In conclusion, the article demonstrates the facile synthesis of bare noble metal nanostructures using liquid crystalline mesophases as soft templates by radiolysis. The successful synthesis of porous nanostructures of PtNBs and PdNBs and
other morphologically different PtNNs exhibits the robustness of the technique. The morphologically dependent catalytic activity in combination with the highest surface area achieved in this study will contribute in understanding the catalytic mechanism involved with bare noble metal
Nanostructures Temp. (T/K)
Pseudo first order rate const. (kapp/min-1)
Activation energy; Ea (kJ/mol)
PtNNs 283 (6.5 ± 0.2) x10-2 26
293 (8.4 ± 0.3) x10-2 303 (12.2 ± 0.5) x10-2 313 (20.3 ± 1.4) x10-2 323 (22.8 ± 0.7) x10-2
PtNBs 283 Not determined 6.4
293 (12.6 ± 2.5) x10-2 303 (14.8 ± 2.1) x10-2 313 (15.7 ± 2.3) x10-2 323 (16.2 ± 2.2) x10-2
PdNBs 293 (9.93±0.30) x10-2 45.8 303 (23.04±0.85) x10-2
313 (32.84±1.29) x10-2
19
ISrapS Bulletin Vol. 27, Issue Number 1 March 2015
is possibly due to the loading amount of PdNBs (0.166 ppm) which is lower by 50 folds.
Table 2. The pseudo-first order rate constants (kapp) at different temperatures, the activation energy (Ea) for the platinum and palladium nanostructures catalyzed reduction of PNP byNaBH4. The uncertainties correspond to the standard deviation obtained from the linear regression by least squares method.
Nanostr- uctures
Temp.
(T/K)
Pseudo first order rate const.
(kapp/min-1)
Activation energy; Ea (kJ/mol)
PtNNs 283 (6.5 ± 0.2) x10-2
26
293 (8.4 ± 0.3) x10-2
303 (12.2 ± 0.5) x10-2
313 (20.3 ± 1.4) x10-2
323 (22.8 ± 0.7) x10-2
PtNBs 283 Not determined
6.4
293 (12.6 ± 2.5) x10-2
303 (14.8 ± 2.1) x10-2
313 (15.7 ± 2.3) x10-2
323 (16.2 ± 2.2) x10-2
PdNBs 293 (9.93±0.30) x10-2
45.8303 (23.04±0.85) x10-2
313 (32.84±1.29) x10-2
4. Conclusions:
In conclusion, the article demonstrates the facile synthesis of bare noble metal nanostructures using liquid crystalline mesophases as soft templates by radiolysis. The successful synthesis of porous nanostructures of PtNBs and PdNBs and other morphologically different PtNNs exhibits the robustness of the technique. The morphologically dependent catalytic activity in combination with the highest surface area achieved in this study will contribute in understanding the catalytic mechanism involved with bare noble metal nanocatalyst. The results of this investigation are encouraging to design and synthesize morphologically attractive nanostructured materials and composites including conducting polymers in future.
Acknowledgments
AMK acknowledges UGC for Meritorious Fellowship. GS acknowledges UGC-DAE CSR–Kolkata for financial support. KKKS acknowledges the DST-FTSYS (SR/FT/CS-077/2012) for the financial support.
References:1. Astruc D. Nanoparticles and Catalysis, Wiley-VCH, 2008.
ISBN: 978-3-527-31572-7, p.01-48.2. C R. Ghosh Chaudhuri, S. Paria, Chem. Rev. 112 (2012)
2373–2433.3. L. Zhang, F.X. Gu, J.M. Chan, A.Z. Wang, R.S. Langer, O.C.
Farokhzad, Clin. Pharmacol. Ther. 83 (2008) 761-769.4. Ghosh, S. K.; Pal, T., Chem. Rev., 2007, 107, 4797-4862.5. Hirsch, L. R.; Stafford, R. J.; Bankson, J. A.; Sershen, S. R.;
Rivera, B.; Price, R. E.; Hazle, J.D.; Halas, N. J.; West, J. L., Proc. Natl. Acad. Sci., U.S.A., 2003, 100, 13549–13554.
6. Lee, J. S.; Ulmann, P. A.; Han, M. S.; Mirkin, C. A., Nano Lett., 2008, 8, 529-533.
7. Burda, C.; Chen, X.; Narayanan, R.; El-Sayed, M. A., Chem. Rev., 2005, 105, 1025-1102.
8. Zeng, J.; Zhang, Q.; Chen, J.; Xia, Y. A., Nano Lett., 2010, 10, 30-35.
9. Boverie, S.; Simal, F.; Demonceau, A.; Noels, A. F.; Eremenko, I. L.; Sidorov, A. A.; Nefedov, S. E., Tetra. Lett., 1997, 38, 7543-7546.
10. Mamane, V.; Gress, T.; Krause, H.; Fürstner, A., J. Am. Chem. Soc., 2004, 126, 8654-8655.
11. Yamamoto, M.; Oshima, K.; Matsubura, S., Org Lett., 2004, 6, 5015-5017.
12. Bedford, R. B.; Hazelwood, S. L., Organometallics, 2002, 21, 2599-2600.
13. Lewis, L. N.; Uriartet, R. J., Organometallics, 1990, 9, 621-625.
14. Sharma, R.K.; Sharma, P. Maitra, A., J. Colloid. Interface Sci., 2003, 265, 134–140.
15. Narayanan, R.; El-Sayed, M. A. , J. Phys. Chem. B, 2003, 107, 12416-12424.
16. J.A. Johnson, J.J. Makis, K.A. Marvin, S.E. Rodenbusch, K.J. Stevenson, J. Phys. Chem. C 117 (2013) 22644−22651.
17. S. Harish, J. Mathiyarasu, K.L.N. Phani, V. Yegnaraman, Catal. Lett. 128 (2009) 197-202.
18. S. Arora, P. Kapoor, M.L. Singla, React. Kinet. Mech. Cat. 99 (2010) 157-165.
19. J. Morère, M.J. Tenorio, M.J. Torralvo, C. Pando, J.A.R. Renuncio, A. Cabañas, J. Supercrit. Fluids 56 (2011) 213-222.
20. H. Li, L. Han, J. Cooper-White, I. Kim, Green Chem. 14 (2012) 586–591.
21. X. Lu, X. Bian, G. Nie, C. Zhang, C. Wang, Y. Wei, J. Mater. Chem. 22 (2012) 12723–12730.
22. Y. Lin, Y. Qiao, Y Wang, Y. Yan, J. Huang, J. Mater. Chem. 22 (2012) 18314-18320.
23. C. Deraedt, L. Salmon, J. Ruiz, D. Astruc, Adv. Synth. Catal. 355 (2013) 2992-3001.
24. Dehouche, F.; Archirel, P.; Remita, H.; Brodie-Linder, N.;

20
ISrapS Bulletin Vol. 27, Issue Number 1 March 2015
Traverse, A.. RSC Adv., 2012, 2, 6686–6694.25. A.J. Wang, F.F. Li, J.N. Zheng, H.X. Xi, Z.Y. Menga, J.J.
Feng, RSC Adv. 3 (2013) 10355–10362.26. Narayanan, R.; El-Sayed, M. A. , Nano Lett., 2004, 4, 1343-
1348.27. Sánchez-Sánchez, C. M.; Solla-Gullón, J.; Vidal-Iglesias,
F. J.; Aldaz, A.; Montiel, V.; Herrero, E., J. Am. Chem. Soc., 2010, 132, 5622-5624.
28. Teng, X.; Liang, X.; Maksimuk, S.; Yang, H. Synthesis of Porous Platinum Nanoparticles. Small, 2006, 2, 249–253.
29. Dao, V. D.; Choi, H. S.,. Electrochimica Acta, 2013, 93, 287-292.
30. Wanjala, B. N.; Luo, J.; Loukrakpam, R.; Fang, B.; Mott, D.; Njoki, P. N.; Engelhard, M.; Richard Naslund, H.; Wu, J. K.; Wang, L.; Malis, O.; Zhong, C. J.. Chem. Mater., 2010, 22, 4282–4294.
31. Qin, G. W.; Pei, W.; Ma, X.; Xu, X.; Ren, Y.; Sun, W.; Zuo, L. J. Phys. Chem. C, 2010. 114, 6909-6913.
32. L.L. Chng, J. Yang, Y. Wei, J.Y. Ying, Chem. Commun. 50 (2014) 9049-9052.
33. P. Hervés, M. Pérez-Lorenzo, L.M. Liz-Marzán, J. Dzubiella, Y. Lu, M. Ballauff, Chem. Soc. Rev. 41 (2012) 5577-5587.
34. J. G. Li, C. Y. Tsai and S. W. Kuo, Polymers 2014, 6, 1794-1809.
35. Nogami, M.; Koike, R.; Jalem, R.; Kawamura, G.; Yang, Y.; Sasaki, Y., . J. Phys. Chem. Lett., 2010, 1, 568–571.
36. Fukuoka, A.; Araki, H.; Sakamoto, Y.; Inagaki, S.; Fukushima, Y.; Ichikawa, M., Inorg. Chim. Acta, 2003, 350, 371-378.
37. G. Surendran, M.S. Tokumoto, E.P. Santos, H. Remita, L. Ramos, P.J. Kooyman, C.V. Santilli, C. Bourgaux, P. Dieudonne´, E. Prouzet, Chem. Mater. 17 (2005) 1505-1514.
38. G. Surendran, F. Ksar, L. Ramos, B. Keita, L. Nadjo, E. Prouzet, P. Beaunier, P. Dieudonne´, F. Audonnet, H. Remita, J. Phys. Chem. C 112 (2008) 10740–10744.
39. P.F. Siril, L. Ramos, P. Beaunier, P. Archirel, A. Etcheberry, H. Remita, Chem. Mater. 21 (2009) 5170–5175.
40. F. Ksar, G. Surendran, L. Ramos, B. Keita, L. Nadjo, E. Prouzet, P. Beaunier A. Hagège, F. Audonnet, H. Remita, Chem. Mater. 21 (2009) 1612–1617.
41. Kalekar, A. M.; Sharma,K. K K. Lehoux,A. Audonnet, F. Remita,H. Saha, A. Sharma, G. K. Langmuir, 2013, 29 (36), pp 11431
42. Ksar, F.; Sharma, G. K.; Audonnet, F.; Beaunier, P.; Remita, H. Nanotechnology, 2011, 22, 305609.
43. Vannice, M. A. Kinetics of Catalytic Reactions, Springer, 2005.
44. Baxter, R. J.; Hu, P., J. Chem. Phys. 2002, 116, 4379-4381.45. Lehoux, A., Laurence, R.; Beaunier. P; Uribe, D. B.;
Dieudonné, P.; Audonnet. F.; Etcheberry. A.; José-Yacaman, M.; Remita, H., Adv. Funct. Mater., 2012, 22, 4900–4908.
46. Surendran, G.; Ramos, L.; Pansu, B.; Prouzet, E.; Beaunier, P.; Audonnet, F.; Remita, H., Chem. Mater., 2007, 19, 5045-5048
47. Y. Mei, Y. Lu, F. Polzer, M. Ballauff, Chem. Mater. 19 (2007) 1062-1069.
Ajit M Kalekar was born in Maharashtra, in 1984. After completing his B.Sc. and M.Sc. in Chemistry from the University of Pune, he joined for his doctoral studies in 2010 under the supervision of Dr. Geeta Sharma at the Department of Chemistry, Savitribai Phule Pune University where he is currently pursuing his research work on synthesis, characterisation and catalytic applications of metal nanostructures.
Dr. KiranKumar Sharma received his M. Sc. In Chemistry from Manipur University, Imphal and pursued his doctoral studies under the guidance of Professor B. S. M. Rao . His doctoral research involved the radiation chemical investigation on the redox chemistry of model Azo dyes. After five years of postdoctoral experience at Dept of Biotechnology, University of Pune, Department of Biochemistry and Biophysics, University of Rochester and Institut des Sciences Moléculaires d‘Orsay, Paris, France, he joined the School of Chemical Sciences, North Maharashtra University and served as an Assistant professor until Nov 2014. He is currently Associate Professor at the School of Nanoscience and Biotechnology, Shivaji University, Kolhapur. His research interest are broad based and includes, fast kinetics, nanocatalysis, environmental remediation and free radical chemistry of DNA.
Dr. Geeta Sharma obtained her M.Sc. degree in Chemistry from Pune University in 1998 and joined for her doctoral research in Department of Chemistry, Savitribai Phule Pune University under the supervision of Professor B. S. M. Rao. After completing her PhD she joined as a Marie Curie Incoming International Postdoctoral Fellow (2005-2008) at the Laboratoire de Chimie Physique, Universite de Paris sud, France following which she joined the Department of Chemistry, Savitribai Phule Pune University as an Assistant Professor. Her current research interest include Free radical chemistry of biomolecules, nanocatalysis and investigation of Nanoparticle –biomolecule interactions.

21
ISrapS Bulletin Vol. 27, Issue Number 1 March 2015
Radiation Chemistry in Microheterogeneous Media - Revisited
Soumyakanti AdhikariRadiation & Photochemistry Division, Bhabha Atomic Research Centre, Mumbai 400 085
Email: [email protected]
Abstract
Radiation chemistry, a century old area of research and the basis of radiation biology, is still active in solving important issues in industry, medicine and biology. In this article an attempt has been made to summarize radiation chemical studies in micro-heterogeneous media using pulse radiolysis as a tool. It is exemplified here that radiation chemistry can be used to show that the reaction and self-decay of hydrated electron can lead to achieve useful results relating to the physical properties of micro-droplets. Further, suitable examples have been chosen to show that reactions of free radicals with bio-molecules in these media indeed be extrapolated to living systems in some cases. It is also possible to synthesize nanomaterials of desired shape and size leading to desired optical properties in these media using radiation chemical techniques.
Complex assemblies of lipids and proteins which form the biological membranes allow cellular functions, important for life processes. For instance, in cholesterol, the rigid planar subunit of the rings and a flexible iso-octyl tail allows it to modulate various functions in the biological membrane organization. Several groups of scientists are engaged in understanding the complex phenomena that occur in these living systems. The inherent complexities of these systems pose a challenge to carry out different types of studies in vivo. Essentially, lipids, proteins and carbohydrates coexist to produce the essential unit of all living organisms, the cell, which is a natural example of self-assembly. The compartmentalization of polar and non-polar domains yet in a single unit forms the microheterogeneous media. Thus, a logical thought was to propose intelligent models, where physico-chemical studies can be carried out and results obtained in these systems may be extrapolated to living systems. Among these models the use of amphiphilic synthetic surfactants in water/organic solvent media represents a good experimental approach and can serve as a model for biological structures. Normal micelles, reverse micelles, micro-emulsions all fall under the category of model systems.
Radiation chemistry deals with the chemical reactions induced by ionizing radiations by breaking up of the medium, known as radiolysis. The formation and solvation of primary species from water radiolysis with few MeV electrons is best described elsewhere.1,2 The dry electrons produced in the very early stage get trapped within water molecules in a very short time scale after thermalization process and produces hydrated electron that actually takes part in subsequent chemical reactions. The generally accepted view is that the physicochemical processes are complete within about 10-12 second after the initial ionization event, and the species eaq
-, H., OH., and H3O+ and any radical and molecular product resulting from dissociation of excited molecules are then in thermal equilibrium with the bulk medium. At this time, which may be regarded as the beginning of the chemical stage, these species are localized in the spurs. Subsequently they begin to diffuse, with the result that many of them encounter one another and react to form molecular or secondary products, while the remainder can escape into the bulk solution and become homogeneously distributed throughout the medium. The so called “spurs-expansion” is complete by about 10-7 seconds. At this time the radiolytic change in water is represented by:

22
ISrapS Bulletin Vol. 27, Issue Number 1 March 2015
H2O eaq-, H., OH., HO2
., H2O2 , H3O+.
Numerous measurements have been made of these primary yields, particularly for low LET radiation such as 60CO g-rays and fast electrons. Most of the measurements have been carried out in dilute solutions under steady state conditions, where solutes are employed to scavenge each particular species and form an identifiable product. The primary species are scavenged by using appropriate solutes and gases to generate secondary radicals as per requirement. The radiation chemistry and hence pulse radiolysis technique in microheterogeneous media have been employed to investigate fundamental queries such as, characterization of the aggregate, i.e., size of the water pool, and location of different types of solutes dissolved in this system; to study the biochemical reactions in these membrane mimetic models, and to realize whether these systems can be used as a novel catalytic medium for synthesis of special materials
Hydrated electrons and its reactions:
The micellar effect in aqueous radiation chemistry was first realized in an experiment where an abrupt and significant yield of olefin as a function of solute concentration was observed in irradiated aqueous solution of sodium lenoleate.3 In an effort to establish the micellar effect on rates of radiolytically generated species with a series of substrates have been initiated thereafter. One such report showed that reaction of benzene with hydrated electron in three types of micellar solution e.g., NALS, Igepal CO-370 and CTAB are distinctly different which has been primarily explained on the basis of solubilization sites of the substrates in these micelles.4
The kinetics of radical reactions with pyrene and biphenyl in aqueous surfactant solutions shown to depend markedly on the nature of the micelle formed and the charge on the “probe” or reacting molecule.5 In the case of reaction involving CO2
.- radical with pyrene sulphonic acid, Gratzel et al6 have shown that CO2
.- readily transfers an electron to pyrene sulphonic acid on
the surface of the CTAB micelle catalyzed by the positive electrostatic surface potential. However, no such reaction was observed in homogeneous aqueous medium. These authors had used the Debye-Hückel theory of electrolytes to elucidate the role of charged micellar interface in facilitating the penetration of the electron into the micelle and promoting the electron transfer reaction on the surface. Effect of charge and structure of micelles on radiation induced electron transfer processes had been reviewed earlier.7 Even though, Many such reactions have been reported thereafter including reaction of hydrated electron and other radicals in CTAB micelles8, and still continuing, attention had been diverted more towards the photophysical and photochemical processes in organized media.9,10
However, by this time it was understood that the reverse micelles and nicroemulsions mimic more to the biological situation compared to the normal micellar solutions. Pulse radiolysis technique can be used to determine the size of the water pools and location of the probes in a micro-emulsion. For this purpose the kinetics of hydrated electron itself and its reaction with different solutes were exploited. Radiolytic production of hydrated electrons, and electron processes in micro-heterogeneous system has been studied very well.12-20 Hydroxyl radicals and hydrogen atoms are formed by direct radiolysis and as their reaction rate constant with surfactant and co-surfactant (in general by long chain alkyl alcohol) are very high, they are easily scavenged. In general, this limits the study to eaq
- and only secondary radicals produced from this species in water-in-oil micro-emulsion. Wong et al12 have studied electron processes in AOT, heptane and water system and reported that hydrated electrons could be formed in the aqueous core of the inverted aerosol-OT micelles (AOT/ H2O/heptane). There are two sources of hydrated electrons in water-in-oil micro-emulsion. First one is direct radiolysis of water pools and the second one is scavenging of excess electrons produced in the hydrocarbon phase. The second process has to compete with the annihilation process, i.e.,

23
ISrapS Bulletin Vol. 27, Issue Number 1 March 2015
recombination. The efficiency of recombination decreases with the increase in radius of the water pool. The water molecules that are bound to counter-ion of the surfactant cannot participate in the solvation of electrons. Formation of electron and its attachment to H2O-AOT reverse micelles has been studied by Bakale and coworkers.13 These authors have shown that the properties of the bulk water are approached only when H2O/Na+ ratio exceeds 6. Using competition kinetics and CCl4 as an electron scavenger, they have found that the largest water pools have greater attachment rates. It has been clearly shown that the thermal electrons present in the hydrocarbon phase are captured by water pools. The efficiency of electron capture by water pools increases with increasing water pool size, or availability of free non-bonded water molecules in the water pool. The absorption spectra, yield, lifetime and reaction kinetics of hydrated electrons have been well studied in ternary and quaternary micro-emulsion and have been covered in a review, 11 where the authors presented both the influence of micro-heterogeneous environment on a variety of processes and the information about organized assemblies themselves with the help of radiation chemical studies.
Interesting aspect of pulse radiolysis study on the water in oil microemulsion is that, using the kinetics of hydrated electron itself and its reaction with different solutes, one can determine the size of the water pools and location of the probes in these systems. Decay kinetics of hydrated electrons can be used to find out the water pool radius and location of the probes. The following discussion is with reference to a micro-emulsion consisting of SDS/water/1-pentanol/cyclohexane.21, 22 The decay kinetics of hydrated electron in presence and absence of solutes gives a measure of the water pool concentration, which in turn gives the radius of the water pools assuming these are of spherical shape.
Further, as the scavenging constants (kq) can be evaluated either directly from experiment or by manipulation of decay equation, it is possible
to find out the location of solutes in water in oil microemulsion by plotting log kq versus log W0. There can be two situations; one is the solute located in the water pool and second is that the solute located at the interface.
4
4
presence and absence of solutes gives a measure of the water pool concentration, which in turn gives the radius of the water pools assuming these are of spherical shape. Further, as the scavenging constants (kq) can be evaluated either directly from experiment or by manipulation of decay equation, it is possible to find out the location of solutes in water in oil microemulsion by plotting log kq versus log W0. There can be two situations; one is the solute located in the water pool and second is that the solute located at the interface.
1.2 1.4 1.6 1.8
5.0
5.5
6.0
6.5 b
cd
a
log
k q
log W0 Figure 1. Variation of log kq with log W0 for the solutes (a) BSA, (b) N, N-dimethyl formamide, (c) CuSO4, (d) CCl4 If the solute is located in the water pool, kq is expected to vary with 1/Wo
3 and for the solute located at the interface, kq varies with 1/Wo
2. Hence, the slope of the plot of log kq versus log Wo gives a clue as to the location of the solutes. The slope being close to -2 or -3 means that the solubilization site is at the
interface or within the water pool, respectively. Such a typical plot (figure1), shows that the big protein molecule bovine serum albumin (BSA) stays at the interface up to a certain W0, whereas N, N-dimethyl formamide remains in the aqueous core.
Cetyl trimethyl ammonium bromide (CTAB) has been used as surfactant for the making reverse micelles and microemulsion for several important studies reported earlier. Likewise NALS, CTAB also does not form reverse micelles in alkanes in the absence of a cosurfactant and only in presence of medium chain length primary alcohols, such as 1-butanol, 1-pentanol, or 1-hexanol, the formation of CTAB microemulsion in alkane is possible.23 Hydrated electrons in the microemulsion CTAB / H2O / n-butanol/ cyclohexane, have remarkably short half life (~1µs) and with lower yield as compared to that in pure water system. Electrons are solvated in two regions; one being the water core other is the interface.24
0 2 4 6 8
0.0
0.2
0.4
0.6
0.8
1.0
W0 =10
W0=20
W0=30
W0=40
Time (µµµµs)
∆∆ ∆∆ O
D
A
Figure 1. Variation of log kq with log W0 for the solutes (a) BSA, (b) N, N-dimethyl formamide, (c) CuSO4, (d) CCl4
If the solute is located in the water pool, kq is expected to vary with 1/Wo
3 and for the solute located at the interface, kq varies with 1/Wo
2.
Hence, the slope of the plot of log kq versus log Wo gives a clue as to the location of the solutes. The slope being close to -2 or -3 means that the solubilization site is at the interface or within the water pool, respectively. Such a typical plot (figure1), shows that the big protein molecule bovine serum albumin (BSA) stays at the interface up to a certain W0, whereas N, N-dimethyl formamide remains in the aqueous core.
Cetyl trimethyl ammonium bromide (CTAB) has been used as surfactant for the making of reverse micelles and microemulsion for several important studies reported earlier. Likewise NALS, CTAB also does not form reverse micelles in alkanes in the absence of a cosurfactant and only in presence of medium chain length primary alcohols, such as 1-butanol, 1-pentanol, or 1-hexanol, the formation of CTAB microemulsion in alkane is possible.23 Hydrated electrons in the microemulsion CTAB / H2O
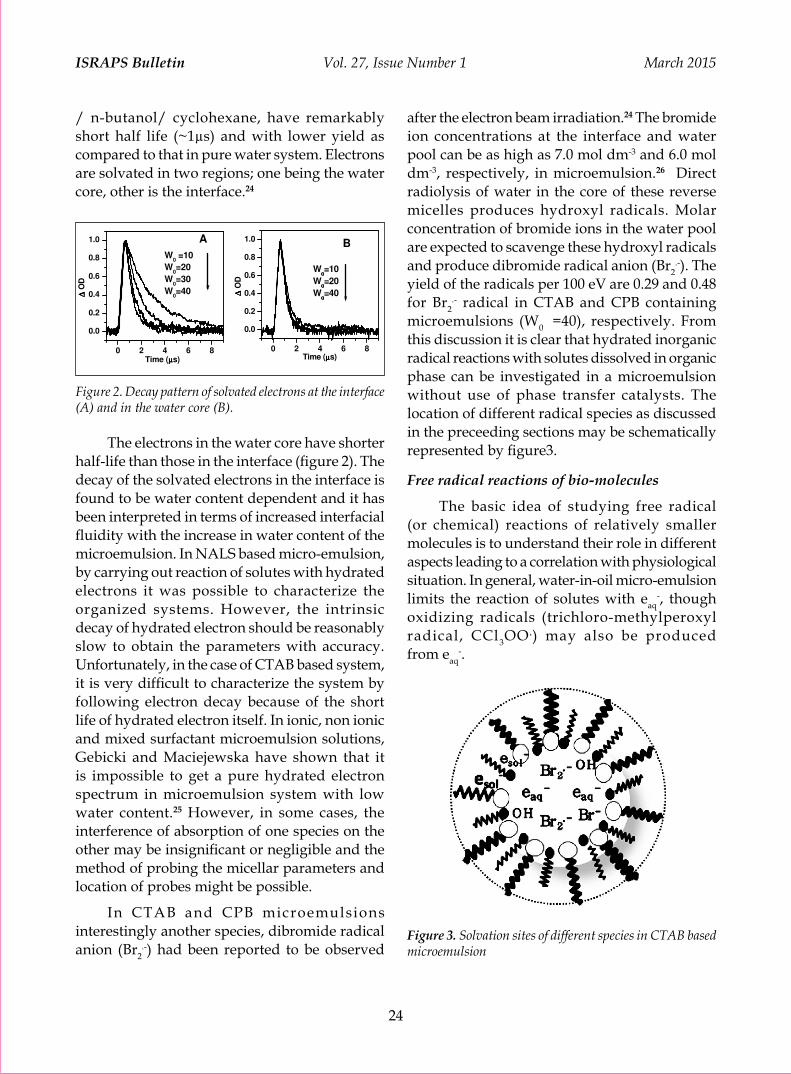
24
ISrapS Bulletin Vol. 27, Issue Number 1 March 2015
/ n-butanol/ cyclohexane, have remarkably short half life (~1µs) and with lower yield as compared to that in pure water system. Electrons are solvated in two regions; one being the water core, other is the interface.24
after the electron beam irradiation.24 The bromide ion concentrations at the interface and water pool can be as high as 7.0 mol dm-3 and 6.0 mol dm-3, respectively, in microemulsion.26 Direct radiolysis of water in the core of these reverse micelles produces hydroxyl radicals. Molar concentration of bromide ions in the water pool are expected to scavenge these hydroxyl radicals and produce dibromide radical anion (Br2
.-). The yield of the radicals per 100 eV are 0.29 and 0.48 for Br2
.- radical in CTAB and CPB containing microemulsions (W0 =40), respectively. From this discussion it is clear that hydrated inorganic radical reactions with solutes dissolved in organic phase can be investigated in a microemulsion without use of phase transfer catalysts. The location of different radical species as discussed in the preceeding sections may be schematically represented by figure3.
Free radical reactions of bio-molecules
The basic idea of studying free radical (or chemical) reactions of relatively smaller molecules is to understand their role in different aspects leading to a correlation with physiological situation. In general, water-in-oil micro-emulsion limits the reaction of solutes with eaq
-, though oxidizing radicals (trichloro-methylperoxyl radical, CCl3OO .) may also be produced from eaq
-.
5
5
0 2 4 6 8
0.0
0.2
0.4
0.6
0.8
1.0 B
Time (µµµµs)
∆∆ ∆∆ O
D
W0000=10
W0000=20
W0000=40
Figure 2. Decay pattern of solvated electrons at the interface (A) and in the water core (B).
The electrons in the water core have shorter half-life than those in the interface (figure 2). The decay of the solvated electrons in the interface is found to be water content dependent and it has been interpreted in terms of increased interfacial fluidity with the increase in water content of the microemulsion. In NALS based micro-emulsion, by carrying out reaction of solutes with hydrated electrons it was possible to characterize the organized systems. However, the intrinsic decay of hydrated electron should be reasonably slow to obtain the parameters with accuracy. Unfortunately, in the case of CTAB based system, it is very difficult to characterize the system by following electron decay because of the short life of hydrated electron itself. In ionic, non ionic and mixed surfactant microemulsion solutions, Gebicki and Maciejewska have shown that it is impossible to get a pure hydrated electron spectrum in microemulsion system with low water
content.25 However, in some cases, the interference of absorption of one species on the other may be insignificant or negligible and the method of probing the micellar parameters and location of probes might be possible.
In CTAB and CPB microemulsions interestingly another species, dibromide radical anion (Br2
.-) had been reported to be observed after the electron beam irradiation.24 The bromide ion concentrations at the interface and water pool can be as high as 7.0 mol dm-3 and 6.0 mol dm-3, respectively, in microemulsion.26 Direct radiolysis of water in the core of these reverse micelles produces hydroxyl radicals. Molar concentration of bromide ions in the water pool are expected to scavenge these hydroxyl radicals and produce dibromide radical anion (Br2
.-). The yield of the radicals per 100 eV are 0.29 and 0.48 for Br2
.- radical in CTAB and CPB containing microemulsions (0 =40), respectively. From this discussion it is clear that hydrated inorganic radical reactions with solutes dissolved in organic phase can be investigated in a microemulsion without use of phase transfer catalysts. The location of different radical species in the as discussed in the preceeding sections may be schematically represented by figure3. Free radical reactions of bio-molecules
The basic idea of studying free radical (or chemical) reactions of relatively smaller molecules is to understand their role in different aspects leading to a correlation with physiological situation. In general, water-in-oil micro-emulsion limits the reaction of solutes with eaq
-, though oxidizing radicals
The electrons in the water core have shorter half-life than those in the interface (figure 2). The decay of the solvated electrons in the interface is found to be water content dependent and it has been interpreted in terms of increased interfacial fluidity with the increase in water content of the microemulsion. In NALS based micro-emulsion, by carrying out reaction of solutes with hydrated electrons it was possible to characterize the organized systems. However, the intrinsic decay of hydrated electron should be reasonably slow to obtain the parameters with accuracy. Unfortunately, in the case of CTAB based system, it is very difficult to characterize the system by following electron decay because of the short life of hydrated electron itself. In ionic, non ionic and mixed surfactant microemulsion solutions, Gebicki and Maciejewska have shown that it is impossible to get a pure hydrated electron spectrum in microemulsion system with low water content.25 However, in some cases, the interference of absorption of one species on the other may be insignificant or negligible and the method of probing the micellar parameters and location of probes might be possible.
In CTAB and CPB microemulsions interestingly another species, dibromide radical anion (Br2
.-) had been reported to be observed Figure 3. Solvation sites of different species in CTAB based microemulsion
4
4
presence and absence of solutes gives a measure of the water pool concentration, which in turn gives the radius of the water pools assuming these are of spherical shape. Further, as the scavenging constants (kq) can be evaluated either directly from experiment or by manipulation of decay equation, it is possible to find out the location of solutes in water in oil microemulsion by plotting log kq versus log W0. There can be two situations; one is the solute located in the water pool and second is that the solute located at the interface.
1.2 1.4 1.6 1.8
5.0
5.5
6.0
6.5 b
cd
a
log
k q
log W0 Figure 1. Variation of log kq with log W0 for the solutes (a) BSA, (b) N, N-dimethyl formamide, (c) CuSO4, (d) CCl4 If the solute is located in the water pool, kq is expected to vary with 1/Wo
3 and for the solute located at the interface, kq varies with 1/Wo
2. Hence, the slope of the plot of log kq versus log Wo gives a clue as to the location of the solutes. The slope being close to -2 or -3 means that the solubilization site is at the
interface or within the water pool, respectively. Such a typical plot (figure1), shows that the big protein molecule bovine serum albumin (BSA) stays at the interface up to a certain W0, whereas N, N-dimethyl formamide remains in the aqueous core.
Cetyl trimethyl ammonium bromide (CTAB) has been used as surfactant for the making reverse micelles and microemulsion for several important studies reported earlier. Likewise NALS, CTAB also does not form reverse micelles in alkanes in the absence of a cosurfactant and only in presence of medium chain length primary alcohols, such as 1-butanol, 1-pentanol, or 1-hexanol, the formation of CTAB microemulsion in alkane is possible.23 Hydrated electrons in the microemulsion CTAB / H2O / n-butanol/ cyclohexane, have remarkably short half life (~1µs) and with lower yield as compared to that in pure water system. Electrons are solvated in two regions; one being the water core other is the interface.24
0 2 4 6 8
0.0
0.2
0.4
0.6
0.8
1.0
W0 =10
W0=20
W0=30
W0=40
Time (µµµµs)
∆∆ ∆∆ O
D
A
Figure 2. Decay pattern of solvated electrons at the interface (A) and in the water core (B).

25
ISrapS Bulletin Vol. 27, Issue Number 1 March 2015
It was reported that in the reaction of eaq-
with cytochrome C and C3 in AOT-H2O- heptane reverse micelle, presence of a protein in the water pool increases the rate of decay of the hydrated electrons which are rapidly quenched by the protein side chain and / or other processes before actual reduction occurs. In the reaction of the molecules like BSA and lysozyme (Lz), the bimolecular rate constants increases steadily as W0 increases in a NaLS/H2O/cyclohexane/1-pentanol system.27
Free radical induced oxidation reactions are important because of its involvement in oxidative stress leading to various diseases. Thus, this type of study in micro-emulsion is expected to yield results similar to cellular environments. A typical study in this regard was carried out in our laboratory might be of interest. β-Carotene is known as ‘provitamin A’ due to its conversion into retinol (vitamin A) by the enzyme dioxygenase via its central28,29 or eccentric cleavage.30 Surprisingly, although the enzyme is present chiefly in the intestine and possibly in the liver, accumulation of vitamin A has been noticed in many tissues in mice.31 This led to the speculation that it is possible conversion of β-carotene to vitamin A occurs via purely chemical protocol. NaLS/water/cyclohexane /1-pentanol system was chosen for studying the reaction of β-carotene with halogenated alkyl peroxyl radical where a stable product formation with the characteristic feature of retinol was reported.32 Essentially, this study confirmed that retinol could be formed during free radical induced oxidation of β-carotene in micro-emulsion. This could explain the presence of retinol in organs other than the intestine and the liver as found with mice.
As it is mentioned that in CTAB and CPB based microemulsion, Br2
.- radical anion are generated, it opens another avenue to study antioxidant efficacy by ABTS (2,2’-Azino bis 3-ethyl benzo thiazoline-6-sulfonic acid) scavenging assay for water insoluble substrates also. In case of water insoluble molecules, the
assay system does not work with confidence. The reaction of Br2
.- radical anion with had been shown to generate ABTS radical in the water core and subsequently this radical was able to react with both water-insoluble molecule vitamin E and water soluble vitamin C. The authors proposed this method as an improved ABTS kinetic assay for antioxidant efficacy, which is applicable for aqueous and organic herbal extracts.24
Synthesis of nanomaterial:
One of the most studied subjects in the media under discussion is synthesis of nanomaterials. I would like to focus on selected recent works from our laboratory in this direction. CdSe nano materials of different shapes and sizes with tuning of optical properties have been reported in CTAB based microemulsions. In one case, these nanoparticles were found to exhibit strong room temperature photoluminescence with two emission peaks at 500 and 580 nm.33 The photo-excitation above exciton absorption gives only the band gap photoluminescence whereas, the photo-excitation below exciton absorption gives only the trap state photoluminescence. However, the photo-excitation closer to the exciton absorption gives rise to both of these emission peaks simultaneously. The intensities of these two emission peaks could be tuned by varying the concentrations of the precursor ions and the W0 values of the microemulsions. It was understood that, shape of the CdSe nanoparticles under different experimental conditions plays a key role in tuning their optical properties. In this particular case, the particles were synthesized without the use of ionizing radiation. In another case, CdSe quantum dots (QDs) were synthesized using electron beam.34 These QDs exhibits broad photoluminescence (PL) in the wavelength region 450 to 750 nm at room temperature. The PL decay curve analysis indicated the presence of predominating trap state. Interestingly, these QDs were found to exhibit CIE (Commission Internationale d’Eclairage) chromaticity x, y co-ordinates close to (0.36, 0.36) and have been proposed to be potential materials as white light emitters.

26
ISrapS Bulletin Vol. 27, Issue Number 1 March 2015
I n s u m m a r y r a d i a t i o n c h e m i s t r y of microheterogeneous media containing surfactants is still a topic of discussion in terms of its application in biology and material science. However, the chemistry of real situation is far from achievable through this path. Indeed, sophisticated experimental techniques in biology have made it much easier to understand physiological situation. On the contrary, ample scope is available to explore the combination of microherogeneous media and radiation chemical techniques in material science.
It would be timely and relevant to discuss about ionic liquids, a new microheterogeneous media, but a single solvent. The notable feature observed in simulation studies of RTILs is called as dynamic heterogeneity.35,36 Hu et al. 37 with their computational calculations on 1-butyl-3-methylimidazolium hexafluorophosphate ([BMIM][PF6]) suggested the presence of ensembles of ions with different diffusion rates. The manifestation of this type of solvent heterogeneity is also apparent in the fluorescence spectroscopy experiments reported by Samanta and coworkers.38 The hydrophilic or hydrophobic character of RTILs depends on the combination of the cation and the anion. The most frequently investigated ILs are based on imidazolium cations. Anions such as halides,
acetate, nitrate and ethylsufate form hydrophilic ILs while anions i.e. hexafluorophosphate, bis(trifluoromethylsulfonyl)imide lead to hydrophobic ILs. Recently, the heterogeneity in 1-Ethyl-3-methyl imidazolium ethyl sulfate ([EMIM][EtSO4]) ionic liquid could be realized while nanomaterial was synthesized by radiation chemical 39 and other method.40 CdSe islands embedded in porous structure of entangled Se nanofibers (figure 4) in the host matrix, was reported.
The formation of such morphology was explained on the basis of inherent structural heterogeneity of the ionic liquids. Detailed and elaborate experimental studies are necessary to establish the inherent heterogeneity in the structure of ionic liquids and radiation chemical techniques might be useful in this endeavor.
Acknowledgements
I gratefully acknowledge all the coauthors of the original, as well as review papers published from this laboratory in this subject. These authors had contributed significantly during the research work and also on the preparation of the manuscripts.
References1. J. K. Thomas in “Radiation Chemistry: Principles and
Applications”, eds. Farhataziz and M. A. J. Rodgers, VCH publishers, N.Y., 1987, p. 377.
2. J. K. Thomas, Radiation Research Vol. 2, eds. W. C. Dewey, M. Edington, R. J. M. Fry, E. J. Hall and Whitmore, Acad. Press, San Diego, 1992, p. 35.
3. J. M. Gebicki and A.O. Allen, J. Phys. Chem. 73 (1969) 2443
4. J.H. fendlar and L.K. Patterson, J. Phys. Chem. 74 (1970) 4608
5. C. S. Wallace and J.K. Thomas, Rad. Res. 54 (1973) 49 6. M. Gratzel, J. ozak, and J.K. Thomas, J. Chem. Phys. 62 (1975)
16327. J. K. Thomas, Acc. Chem. Res. 10 (1977) 1338. S. Adhikari, S. N. Guha and C. Gopinathan, Radiat. Phys.
Chem. 43 (1994) 503; S. Adhikari, S. N. Guha and C. Gopinathan, Int. J. Chem. Kinet. 26 (1994) 903
9. J. K. Thomas, Chem. Rev. 80 (1980) 283; and references therein
10. D. G. Whitten, J. C. Russell, R. H. Schmehl, Tetrahedron 38 (1982) 2455
11. J. L. Gebicki, S. Pietek and L. Gebicka in “Properties and Reaction of Radiation Induced Transients, Selected Topics”,
Figure 4. SEM image of the CdSe and Se anostructures synthesized in ionic liquid ([EMIM][EtSO4]) via electron beam irradiation.
8
8
Figure 4. SEM image of the CdSe and Se anostructures synthesized in ionic liquid ([EMIM][EtSO4]) via electron beam irradiation. The formation of such morphology was explained on the basis of inherent structural heterogeneity of the ionic liquids. Detailed
and elaborate experimental studies are necessary to establish the inherent heterogeneity in the structure of ionic liquids and radiation chemical techniques might be useful in this endeavor. Acknowledgements I gratefully acknowledge all the coauthors of the original, as well as review papers published from this laboratory in this subject. These authors had contributed significantly during the research work and also on the preparation of the manuscripts.
References 1. J. K. Thomas in “Radiation Chemistry:
Principles and Applications”, eds. Farhataziz and M. A. J. Rodgers, VCH publishers, N.Y., 1987, p. 377.
2. J. K. Thomas, Radiation Research Vol. 2, eds. W. C. Dewey, M. Edington, R. J. M. Fry, E. J. Hall and Whitmore, Acad. Press, San Diego, 1992, p. 35.
3. J. M. Gebicki and A.O. Allen, J. Phys. Chem. 73 (1969) 2443
4. J.H. fendlar and L.K. Patterson, J. Phys. Chem. 74 (1970) 4608
5. C. S. Wallace and J.K. Thomas, Rad. Res. 54 (1973) 49
6. M. Gratzel, J. ozak, and J.K. Thomas, J. Chem. Phys. 62 (1975) 1632
7. J. K. Thomas, Acc. Chem. Res. 10 (1977) 133
8. S. Adhikari, S. N. Guha and C. Gopinathan, Radiat. Phys. Chem. 43 (1994) 503; S. Adhikari, S. N. Guha
and C. Gopinathan, Int. J. Chem. Kinet. 26 (1994) 903
9. J. K. Thomas, Chem. Rev. 80 (1980) 283; and references therein
10. D. G. Whitten, J. C. Russell, R. H. Schmehl, Tetrahedron 38 (1982) 2455
11. J. L. Gebicki, S. Pietek and L. Gebicka in “Properties and Reaction of Radiation Induced Transients, Selected Topics”, ed. J. Mayer, Polish Scientific Publishers PWN, Wasszawa, 1999, p. 151 and references therein.
12. M. Wong, M. Gratzel and J. K. Thomas, Chem. Phys. Lett. 30 (1975) 329.
13. G. Bakale, G. Beck and J. K. Thomas, J. Phys. Chem. 85 (1981) 1062.
14. P. Broochette, T. Zemb, P. Mathis and M. P. Pileni, J. Phys. Chem. 91 (1987) 1444.

27
ISrapS Bulletin Vol. 27, Issue Number 1 March 2015
ed. J. Mayer, Polish Scientific Publishers PWN, Wasszawa, 1999, p. 151 and references therein.
12. M. Wong, M. Gratzel and J. K. Thomas, Chem. Phys. Lett. 30 (1975) 329.
13. G. Bakale, G. Beck and J. K. Thomas, J. Phys. Chem. 85 (1981) 1062.
14. P. Broochette, T. Zemb, P. Mathis and M. P. Pileni, J. Phys. Chem. 91 (1987) 1444.
15. G. Bakale, G. Beck and J. K. Thomas, J. Phys. Chem. 96 (1992) 2328.
16. J. L. Gebicki, L. Gebicka and J. Kroh, J. Chem. Soc. Farad. Trans. 90 (1994) 3411 and references therein.
17. M. Wong, M. Gratzel and J.K. Thomas, J. Am. Chem. Soc. 98 (1976) 2391.
18. M. Wong, J. K. Thomas and T. Nowak, J. Am. Chem. Soc. 99 (1977) 4730.
19. M. P. Pileni, B. Hickel, C. Ferradini and J. Pucheault, Chem. Phys. Lett. 92 (1982) 308.
20. G. Bakale and J. M. Warman, J. Phys. Chem. 88 (1984) 2927.
21. S. Adhikari, R. Joshi, C. Gopinathan, J. Coll. Interface. Sci. 191 (1997) 268.
22. S. Adhikari, R. Joshi, C. Gopinathan, Int. J. Chem. Kinetics 30 (1998) 699.
23. E. M. Corbeil, N. E. Levinger, Langmuir 19 (2003) 7264.24. A. Guleria, A.K. Singh, S. K. Sarkar, T. Mukherjee, S.
Adhikari, J. Phys. Chem. B 115 (2011) 10615.25. Gebicki, J. L.; Maciejewska, M. Rad. Phys. Chem. 67 (2003)
257.
26. M. Iolanda, L.G.D. Cuccovia, A.M. Fla´vio, H. Chaimovich, Langmuir 17 (2001) 1060.
27. R. Joshi, S. Adhikari, C.Gopinathan, Res. Chem. Intermed. 25 (1999) 393.
28. T. van Viliet, F. van Schaik, W. H. P. Schreurs and H. van den Berg, Int. J. Vit. Nutr. Res. 66 (1996) 77.
29. A. Nagao, A. During, C. Hoshino, J. Terao and J. A. Olson, Arch. Bichem. Bipphys. 328 (1996)57.
30. X. D. Wang, N. I. Krinsky, G. W. Tang, R. M. Russel, Arch. Biochem. Biophys. 293 (1993) 298.
31. J. A. Olson and O. Hayashi, Proc. Nat. Acad. Sci. 54 (1965) 1364.
32. S. Adhikari, S. Kapoor, S. Chattopadhyay, T. Mukherjee, Biophys. Chem. 88 (2000) 111.
33. A. Guleria, S. Singh, M.C. Rath, A.K.Singh, S.Adhikari, S.K.Sarkar Journal of Luminescence 132 (2012) 652.
34. S. Singh, A. Guleria, A.K. Singh, M.C. Rath, S. Adhikari, S.K. Sarkar, Journal of Colloid and Interface Science 398 (2013) 112.
35. J. Habasaki and K. L. Ngai, J Chem Phys. 129 (2008) 194501.
36. Z. Hu and C. J. Margulis, Proc Natl Acad Sci. 103 (2006) 831.
37. Z. Hu and C. J. Margulis, Acc. Chem. Res. 40 (2007) 1097.38. Anunay Samanta, J. Phys. Chem. B 110 (2006) 13704.39. A. Guleria, A. K Singh, M. C. Rath, S. Adhikari. S. K. Sarkar,
Dalton Trans. 42 (2013) 15159.40. A. Guleria, M. C. Rath, A. K. Singh, S. Adhikari Dalton Tran.
43 (2014) 11843.
Dr. Soumyakanti Adhikari joined the erstwhile Chemistry Division of Bhabha Atomic Research Centre, after graduating from 34th Batch of BARC Training School. He is an honorary Professor of Chemistry at Homi Bhabha National Institute. His recent research interests are; Radiation stability and mechanism of ionic liquids, Synthesis, characterization and application of nanomaterials. He is also involved in the development of picosecond linear electron accelerator in BARC. Dr. Adhikari has received the prestigious IUPAC Prize for Young Chemist (2001). He is also the recipient of Distinguished Service Award from Asia Pacific EPR/ESR Society (2004), and Scientific and Technical Excellence Award, Department of Atomic Energy (2008).

28
ISrapS Bulletin Vol. 27, Issue Number 1 March 2015
Radiolysis: Relevance in Nuclear Reactor Coolant systems
Padma, S. Kumar, Debasis Mal, Puspalata Rajesh,* S. Rangarajan and S. VelmuruganWater and Steam Chemistry Division, BARC Facilities, Kalpakkam
Email: [email protected]
AbstractThe ubiquitous presence of ionizing radiation and water/heavy water in primary coolant circuits of water cooled nuclear reactors makes the study of radiation induced decomposition of water and its subsequent effects with other additives or impurities more relevant for safe and smooth operation of nuclear reactors. In order to assess the corrosion environment of structural materials, estimation of water chemistry parameters and concentrations of oxygen, hydrogen, hydrogen peroxide from radiolysis of coolant is essential. An oxidizing coolant conditions due to radiolysis at high temperature can develop stress corrosion cracking of structural materials in nuclear reactors. Feasibility of using hydrazine to provide reducing condition to the main heat transport system for advanced heavy water reactor was evaluated. Due to high core density of the above tube - type boiling water reactor, a higher concentration of gadolinium nitrate will be required as liquid poison for its secondary emergency safety shutdown system. Effect of this high concentration of soluble neutron poison on molecular product (H2, H2O2) yield is evaluated from the point of view of safety and corrosion of structural material.
1. Introduction
It is well known that the radiolytically produced H2, O2 and H2O2 determine the corrosive environment in nuclear reactor. An oxidizing coolant conditions at high temperature due to radiolysis of water, leads to stress corrosion cracking (SCC) in stainless steel. Electrochemical corrosion potential (ECP) of structural materials is used as an index for the corrosive condition prevalent in the reactors [1-3]. In several boiling water reactors (BWR), hydrogen is added in the presence and absence of noble metals (Pt and Ir) to control the dissolved oxygen so that the required ECP can be achieved by injecting a lower concentration of H2 to mitigate stress corrosion cracking. In BWRs, addition of N2H4 or co-injection of N2H4 and H2 are reported [4]. In proposed Advanced Heavy Water Reactor (AHWR) which has been designed to fulfil the need of development of thorium-based technologies for utilising India’s domestic thorium resource, controlling dissolved oxygen in the downcomer region is an issue. AHWR is a tube type BWR, with channel type
configuration where boiling takes place inside the pressure tubes. The steam of 18% quality exits out of the core and the moisture separation from steam takes place outside the core in a moisture separator. Each channel is connected to the moisture separator by stainless steel tubes which carry the moisture laden steam and is brought back to the core inlet via stainless steel feeders [5]. The downstream coolant outlet pipes are expected to retain the oxidizing condition due to radiolytic H2O2. Cracking defects due to IGSCC were reported in the down-comers of RBMK plants like Ignalina 1 and 2 [6]. Therefore, there is a need to suppress the radiolysis and create adequate reducing environment in the reactor core outlet pipes. Addition of hydrogen i.e. hydrogen water chemistry and hydrogen with noble metal chemical addition may not be effective in controlling the oxidizing species under two phase conditions prevailing in the fuel channels of a proposed tube - type boiling water reactor. Hydrogen will be partitioned out to the steam phase and would not offer any protection to the pipes. Hence, alternative reducing agent
Article 4 - Pushpa

29
ISrapS Bulletin Vol. 27, Issue Number 1 March 2015
like N2H4 is considered, as its distribution in water phase is more than steam. Though several VVER (Water-Water Energy Reactor) of Russian design have reported operating experience with hydrazine in place of ammonia [7], similar data in BWRs are scarce. A clear knowledge of thermal and radiation stability of N2H4 at high temperature under recirculation and partitioning of N2H4 under two phase condition is essential to postulate an exact concentration of N2H4 required for maintaining a reducing condition and lowering the corrosion. Even though the residence time of the coolant is significantly less in the reactor core, sufficient quantity of reductant is essential to provide a reducing atmosphere to mitigate inter-granular stress corrosion. Precise evaluation of corrosion environment at the down-comer region of BWR was also done by simulation [8]. SS 304 LN is the proposed structural material for AHWR. In this paper, radiation stability of N2H4 and its effect on electrochemical potential measurements of SS-304LN were measured in deaerated/ H2 medium.
In context with the moderator system of AHWR, a higher concentration (20-400ppm) of soluble neutron poison Gd(NO3)3 was proposed to be used in the emergency safety shutdown system (ESSS) due to higher core density. Gadolinium is used as a neutron poison in nuclear reactors to control the reactivity because of its high thermal neutron absorption cross section (49,000 b) and good solubility in water. Gadolinium is added with nitric acid to the moderator heavy water and a stringent pH condition is maintained in the range of 5 to 5.5 to prevent gadolinium precipitation. [9] Usually the concentration of gadolinium (Gd3+) used is ~15 ppm during the actuation of secondary shutdown system of 540 MWe PHWRs. Secondary shutdown system operates on the principle of direct injection of the poison from poison tank containing high concentrated Gd(NO3)3 (~8000 ppm) into bulk moderator by means of high pressure helium within few seconds. Subsequently it is removed on ion exchange resin up to a residual concentration of ~2 ppm before subsequent reactor start-up.
With higher concentration of Gd3+, the pH can go down and hence can affect the compatibility of the structural materials. The radiolytic yields are expected to be higher in electrolyte solutions than in pure water and will be dependant on the concentration of the electrolyte since the dissolved substances facilitate the decomposition of water by reaction with the radical products. Hence, it is of interest to see the concentration dependence of Gd3+ ion on the yields of molecular products like H2 and H2O2 during radiolysis and their effect on the integrity of SS 304 LN, the proposed structural material for this reactor, considering ~100 years of operation life.
The redox reactions of N2H4 at elevated temperature and Gd3+ at moderator temperature should be investigated in order to estimate their effect on the radiolysis of the coolant and as a primary step it is meaningful to confirm the radiation chemical reactions of these at room temperature.
3. Materials and methods
All the chemicals used were of high purity grade and used as such without any further purification. Gadolinium nitrate (AR grade) was weighed accurately and added to an acidified nano-pure water sample to get 8000 ppm gadolinium stock solution with pH 2.7. The pH was adjusted with high purity HNO3. The required concentration of Gd3+ (20-400 ppm) was prepared from the above stock solution. Multi-parameter equipment (HACH make) was used for monitoring pH and conductivity of the solutions. Solutions (10 ml solution in ~17 ml sealed sample vials ie. 60% filled) were deaerated by purging argon and irradiated at room temperature using Gamma Chamber 5000, BRIT, India (dose rate = 5.4 kGy hr-1). The Nicolet Evolution 500- UV – Visible spectrophotometer from Thermo Electron Corporation, UK was used for determining hydrazine solution concentration (ppm) from its absorbance at 458 nm using para dimethyl amino benzaldehyde reagent. Hydrazine was found to interfere with NH3 analysis by Nessler’s reagent (absorbance at 410 nm). Hence, the mixture of

30
ISrapS Bulletin Vol. 27, Issue Number 1 March 2015
N2H4 and NH3 formed after radiolysis were analyzed in a cation column (CS16 column, 25 mM methane sulphonic acid as eluant, at a flow rate of 0.5 ml min-1) using Dionex – 2100 ion chromatograph, USA. The concentration of H2O2 was estimated from the absorbance of I–3 at 353 nm. H2 was estimated using gas chromatograph supplied by CIC Dhruva, India.
The corrosion compatibility of SS 304 LN with varying [Gd3+] was monitored using weight loss, electrochemical DC and AC techniques using a potentiostat / galvanostat system (AUTOLAB model PGSTAT 30, The Netherlands). A three electrode configuration was used with platinum foil as counter electrode and a saturated calomel electrode connected through a luggin capillary as the reference electrode. Polarization was carried out in the potential range of -0.25 to 1.0 V with respect to OCP with a scan rate of 0.0005 V/sec and step potential of 0.0003 V. An AC signal of 10 mV amplitude was applied to perturb the system to study the the impedance response in the frequency range of 10 kHz to 5 mHz. The chemical composition of the specimen characterized using direct reading optical emission spectrometry is given in Table 1.
High temperature potential measurements in presence of hydrazine and hydrogen peroxide were carried out in a High Temperature High Pressure Loop made up of SS-316 in WSCD. The HTHP re-circulating system has a volume of 800 litres and is designed to operate at 288oC and 90 Kg.cm-2 pressure. A mixed ion exchange resin bed in the loop was used to remove the chemicals and other impurities after each experiment. The high temperature on-line water chemistry monitoring system TRENDCHEM supplied by CORMET, Finland was used in this study. The system contains probes for the measurement of
temperature and redox potential and specimen potential. An external pressure-balanced reference electrode with Ag/AgCl was used as reference electrode and the measured potentials were converted to the standard hydrogen electrode (SHE) scale.
3. Results and discussions
3.1 Radiolytic stability of N2H4
Even though the residence time of hydrazine in the core is very less, radiolytic decomposition of N2H4 is unavoidable because of the high radiation field prevailing in the core fuel channels. The distribution of the decomposition products in the two phase system has to be accounted for. Radiolysis of aqueous solutions of N2H4 was also carried out both in aerated and N2 purged conditions at room temperature and is given in Figure 1. The rate of reaction of hydrazine was faster in presence of air than in deaerated medium.
Table 1. Chemical composition of SS 304 LN specimens in wt % by direct reading optical emission spectrometer.
C Si Mn P S Mo Co Cu V W Ni Cr Fe0.02 0.3 1.5 0.03 <0.005 0.3 0.12 0.1 0.12 0.06 9.5 19.0 68.9
monitoring system TRENDCHEM supplied by CORMET, Finland was used in this study. The system contains probes for the measurement of temperature and redox potential and specimen potential. An external pressure-balanced reference electrode with Ag/AgCl was used as reference electrode and the measured potentials were converted to the standard hydrogen electrode (SHE) scale.
3. Results and discussions 3.1 Radiolytic stability of N2H4
Even though the residence time of hydrazine in the core is very less, radiolytic decomposition of N2H4 is unavoidable because of the high radiation field prevailing in the core fuel channels. The distribution of the decomposition products in the two phase system has to be accounted for. Radiolysis of aqueous solutions of N2H4 was also carried out both in aerated and N2 purged conditions at room temperature and is given in Fig. 1. The rate of reaction of hydrazine was faster in presence of air than in deaerated medium. No H2O2 was observed in deaerated solution where as in aerated solution the yield of H2O2 was observed to increase with dose and got saturated at ~ 1.6 ppm which shows the high reactivity of radiolytically formed H2O2 with N2H4 (
-139 mol dm104.542 OHHNk [10]).
0 50 100 150 200 250
0
1
2
3
4
5
6
Con
c. (p
pm)
Dose (krad)
Aerated full (N2H4) N2 Purged half filled/N2H4
Figure. 1. Decrease in [N2H4] with dose in aerated and deaerated aqueous solution of N2H4
In deaeated solution complete decomposition was observed after a total dose of 100 krad. The pH and conductivity values were observed to decrease with irradiation and no dose rate effect was observed (0.46 krad min-1) eliminating the possibilities of any chain reaction in the aerated solution. Formation of NH3 was observed in the radiolysis of deaerated N2H4 solution. Fig. 2 shows simultaneous formation of NH3 from the decay of N2H4 during radiolysis. The corresponding overlay chromatogram from ion chromatography was shown in the inset of Fig. 2. The radiolytic yield (G value i.e. number of NH3 molecules formed per 100 eV of absorbed energy) G(NH3) was calculated to be ~ 1.3. Formation of NH3 will again be advantageous in maintaining reducing environment and thereby mitigating SCC. The rate of radiolytic decomposition of hydrazine is quite fast. However, as the residence time of the coolant in the core is in few seconds, sufficient concentration of hydrazine can be maintained in the system by continuous injection of hydrazine.
Figure. 1. Decrease in [N2H4] with dose in aerated and deaerated aqueous solution of N2H4

31
ISrapS Bulletin Vol. 27, Issue Number 1 March 2015
Figure. 2. Yield of NH3 formation (▲) from the radiolytic decomposition of N2H4 (■); inset: chromatogram showing degradation of N2H4 and formation of NH3 with dose.
Figure. 2. Yield of NH3 formation ( ) from the radiolytic decomposition of N2H4 ( ); inset: chromatogram showing degradation of N2H4 and formation of NH3 with dose.
3.2. Online electrochemical and redox potential measurements
The redox and electrochemical potential of stainless steel (SS-304LN and SS-316) at high temperature under varying redox conditions were measured and given in Figure 3. Redox potential values in the presence of N2H4 at both 270 oC and 285 oC are given in Figure 3 (a) and (b) respectively.
-800
-600
-400
-200
0
0 5 10 15Time (Hours)
ECP(
mV
vs S
HE) Redox
SS 304 LNSS 316
-800
-600
-400
-200
0 1 2 3 4 5Time (Hours)
ECP(
mV
vs S
HE)
RedoxSS 304 LNSS 316
0 1 2 3 4 5 6 7 8
-0.4
-0.2
0.0
0.2
0.4
0.6
H 2O 2 solution
N 2H 4 additionE/
V
T im e (Hour)
Irradiation
Figure 3: Response of redox potential and ECP on addition of N2H4 (a) at 270 oC (c) 285 oC and (c) on addition of H2O2 at 285 oC(d) during radiolysis at room temperature. Electrochemical potential was observed to be (~ -700mV and -600 mV respectively), well below the required threshold potential
of -230mV vs. SHE. Thus it was clearly shown that addition of hydrazine could bring down the potential well below -
-1000
-800
-600
-400
-200
0.00 0.20 0.40 0.60 0.80 1.00Time (Hours)
ECP(
mV
vs S
HE)
H2O2 added
0.0 0.5 1.0 1.5 2.00
2
4
6
8
Con
c (p
pm)
Dose (kGy)
0 2 4 6 8 10 12
N 2H 4
Con
duct
ivity
(S
)
N H 3
Tim e (m in)
2 .01.51.00.80.60.40.20.1
U nirradiatedD D w ater
Dos
e (k
Gy)
(b)(a)
(c) (d)
Figure. 2. Yield of NH3 formation ( ) from the radiolytic decomposition of N2H4 ( ); inset: chromatogram showing degradation of N2H4 and formation of NH3 with dose.
3.2. Online electrochemical and redox potential measurements
The redox and electrochemical potential of stainless steel (SS-304LN and SS-316) at high temperature under varying redox conditions were measured and given in Figure 3. Redox potential values in the presence of N2H4 at both 270 oC and 285 oC are given in Figure 3 (a) and (b) respectively.
-800
-600
-400
-200
0
0 5 10 15Time (Hours)
ECP(
mV
vs S
HE) Redox
SS 304 LNSS 316
-800
-600
-400
-200
0 1 2 3 4 5Time (Hours)
ECP(
mV
vs S
HE)
RedoxSS 304 LNSS 316
0 1 2 3 4 5 6 7 8
-0.4
-0.2
0.0
0.2
0.4
0.6
H 2O 2 solution
N 2H 4 addition
E/V
T im e (Hour)
Irradiation
Figure 3: Response of redox potential and ECP on addition of N2H4 (a) at 270 oC (c) 285 oC and (c) on addition of H2O2 at 285 oC(d) during radiolysis at room temperature. Electrochemical potential was observed to be (~ -700mV and -600 mV respectively), well below the required threshold potential
of -230mV vs. SHE. Thus it was clearly shown that addition of hydrazine could bring down the potential well below -
-1000
-800
-600
-400
-200
0.00 0.20 0.40 0.60 0.80 1.00Time (Hours)
ECP(
mV
vs S
HE)
H2O2 added
0.0 0.5 1.0 1.5 2.00
2
4
6
8
Con
c (p
pm)
Dose (kGy)
0 2 4 6 8 10 12
N 2H 4C
ondu
ctiv
ity (S
)
N H 3
Tim e (m in)
2 .01.51.00.80.60.40.20.1
U nirradiatedD D w ater
Dos
e (k
Gy)
(b)(a)
(c) (d)
Figure. 2. Yield of NH3 formation ( ) from the radiolytic decomposition of N2H4 ( ); inset: chromatogram showing degradation of N2H4 and formation of NH3 with dose.
3.2. Online electrochemical and redox potential measurements
The redox and electrochemical potential of stainless steel (SS-304LN and SS-316) at high temperature under varying redox conditions were measured and given in Figure 3. Redox potential values in the presence of N2H4 at both 270 oC and 285 oC are given in Figure 3 (a) and (b) respectively.
-800
-600
-400
-200
0
0 5 10 15Time (Hours)
ECP(
mV
vs S
HE) Redox
SS 304 LNSS 316
-800
-600
-400
-200
0 1 2 3 4 5Time (Hours)
ECP(
mV
vs S
HE)
RedoxSS 304 LNSS 316
0 1 2 3 4 5 6 7 8
-0.4
-0.2
0.0
0.2
0.4
0.6
H 2O 2 solution
N 2H 4 addition
E/V
T im e (Hour)
Irradiation
Figure 3: Response of redox potential and ECP on addition of N2H4 (a) at 270 oC (c) 285 oC and (c) on addition of H2O2 at 285 oC(d) during radiolysis at room temperature. Electrochemical potential was observed to be (~ -700mV and -600 mV respectively), well below the required threshold potential
of -230mV vs. SHE. Thus it was clearly shown that addition of hydrazine could bring down the potential well below -
-1000
-800
-600
-400
-200
0.00 0.20 0.40 0.60 0.80 1.00Time (Hours)
ECP(
mV
vs S
HE)
H2O2 added
0.0 0.5 1.0 1.5 2.00
2
4
6
8
Con
c (p
pm)
Dose (kGy)
0 2 4 6 8 10 12
N 2H 4
Con
duct
ivity
(S
)
N H 3
Tim e (m in)
2 .01.51.00.80.60.40.20.1
U nirradiatedD D w ater
Dos
e (k
Gy)
(b)(a)
(c) (d)
Figure. 2. Yield of NH3 formation ( ) from the radiolytic decomposition of N2H4 ( ); inset: chromatogram showing degradation of N2H4 and formation of NH3 with dose.
3.2. Online electrochemical and redox potential measurements
The redox and electrochemical potential of stainless steel (SS-304LN and SS-316) at high temperature under varying redox conditions were measured and given in Figure 3. Redox potential values in the presence of N2H4 at both 270 oC and 285 oC are given in Figure 3 (a) and (b) respectively.
-800
-600
-400
-200
0
0 5 10 15Time (Hours)
ECP(
mV
vs S
HE) Redox
SS 304 LNSS 316
-800
-600
-400
-200
0 1 2 3 4 5Time (Hours)
ECP(
mV
vs S
HE)
RedoxSS 304 LNSS 316
0 1 2 3 4 5 6 7 8
-0.4
-0.2
0.0
0.2
0.4
0.6
H 2O 2 solution
N 2H 4 addition
E/V
T im e (Hour)
Irradiation
Figure 3: Response of redox potential and ECP on addition of N2H4 (a) at 270 oC (c) 285 oC and (c) on addition of H2O2 at 285 oC(d) during radiolysis at room temperature. Electrochemical potential was observed to be (~ -700mV and -600 mV respectively), well below the required threshold potential
of -230mV vs. SHE. Thus it was clearly shown that addition of hydrazine could bring down the potential well below -
-1000
-800
-600
-400
-200
0.00 0.20 0.40 0.60 0.80 1.00Time (Hours)
ECP(
mV
vs S
HE)
H2O2 added
0.0 0.5 1.0 1.5 2.00
2
4
6
8
Con
c (p
pm)
Dose (kGy)
0 2 4 6 8 10 12
N 2H 4
Con
duct
ivity
(S
)
N H 3
Tim e (m in)
2 .01.51.00.80.60.40.20.1
U nirradiatedD D w ater
Dos
e (k
Gy)
(b)(a)
(c) (d)
No H2O2 was observed in deaerated solution where as in aerated solution the yield of H2O2 was observed to increase with dose and got saturated at ~ 1.6 ppm which shows the high reactivity of radiolytically formed H2O2 with N2H4 (
monitoring system TRENDCHEM supplied by CORMET, Finland was used in this study. The system contains probes for the measurement of temperature and redox potential and specimen potential. An external pressure-balanced reference electrode with Ag/AgCl was used as reference electrode and the measured potentials were converted to the standard hydrogen electrode (SHE) scale.
3. Results and discussions 3.1 Radiolytic stability of N2H4
Even though the residence time of hydrazine in the core is very less, radiolytic decomposition of N2H4 is unavoidable because of the high radiation field prevailing in the core fuel channels. The distribution of the decomposition products in the two phase system has to be accounted for. Radiolysis of aqueous solutions of N2H4 was also carried out both in aerated and N2 purged conditions at room temperature and is given in Fig. 1. The rate of reaction of hydrazine was faster in presence of air than in deaerated medium. No H2O2 was observed in deaerated solution where as in aerated solution the yield of H2O2 was observed to increase with dose and got saturated at ~ 1.6 ppm which shows the high reactivity of radiolytically formed H2O2 with N2H4 (
-139 mol dm104.542 OHHNk [10]).
0 50 100 150 200 250
0
1
2
3
4
5
6
Con
c. (p
pm)
Dose (krad)
Aerated full (N2H4) N2 Purged half filled/N2H4
Figure. 1. Decrease in [N2H4] with dose in aerated and deaerated aqueous solution of N2H4
In deaeated solution complete decomposition was observed after a total dose of 100 krad. The pH and conductivity values were observed to decrease with irradiation and no dose rate effect was observed (0.46 krad min-1) eliminating the possibilities of any chain reaction in the aerated solution. Formation of NH3 was observed in the radiolysis of deaerated N2H4 solution. Fig. 2 shows simultaneous formation of NH3 from the decay of N2H4 during radiolysis. The corresponding overlay chromatogram from ion chromatography was shown in the inset of Fig. 2. The radiolytic yield (G value i.e. number of NH3 molecules formed per 100 eV of absorbed energy) G(NH3) was calculated to be ~ 1.3. Formation of NH3 will again be advantageous in maintaining reducing environment and thereby mitigating SCC. The rate of radiolytic decomposition of hydrazine is quite fast. However, as the residence time of the coolant in the core is in few seconds, sufficient concentration of hydrazine can be maintained in the system by continuous injection of hydrazine.
[10]).
In deaeated solution complete decomposition was observed after a total dose of 100 krad. The pH and conductivity values were observed to decrease with irradiation and no dose rate effect was observed (0.46 krad min-1) eliminating the possibilities of any chain reaction in the aerated solution. Formation of NH3 was observed in the radiolysis of deaerated N2H4 solution. Figure 2 shows simultaneous formation of NH3 from the decay of N2H4 during radiolysis in deaerated solutions. The corresponding overlay chromatogram from ion chromatography was shown in the inset of Figure 2. The radiolytic
yield (G value i.e. number of NH3 molecules formed per 100 eV of absorbed energy) G(NH3) was calculated to be ~ 1.3. Formation of NH3 will
Figure 3. Response of redox potential and ECP on addition of N2H4 (a) at 270 oC (b) 285 oC and (c) on addition of H2O2 at 285 oC(d) during radiolysis at room temperature.

32
ISrapS Bulletin Vol. 27, Issue Number 1 March 2015
again be advantageous in maintaining reducing environment and thereby mitigating SCC.
The rate of radiolytic decomposition of hydrazine is quite fast. However, as the residence time of the coolant in the core is in few seconds, sufficient concentration of hydrazine can be maintained in the system by continuous injection of hydrazine.
3.2. Online electrochemical and redox potential measurements
The redox and electrochemical potential of stainless steel (SS-304LN and SS-316) at high temperature under varying redox conditions were measured. Redox potential values in the presence of N2H4 at 270 oC and 285 oC are given in Figure 3 (a) and (b) respectively which is the core inlet and outlet temperature. Electrochemical potential was observed to be (~ -700mV and -600 mV respectively), well below the required threshold potential of -230mV vs. SHE. Thus it was clearly shown that addition of hydrazine could bring down the potential well below -230mV vs. SHE, above which stainless steel is prone to stress corrosion [11]. Redox potential and the ECP of SS were not significantly affected by variation in hydrazine concentration at this high temperature. Hydrogen peroxide corresponding to 0.5 ppm dissolved oxygen was added at 270 oC to maintain oxidizing conditions at high temperature and the corresponding change in potential is shown in Figure 3 c. The redox potential increased from -650mV vs. SHE towards positive potential. A rapid shift of ECP to the noble direction was reported at 285 oC, in presence of H2O2 as compared to potential values measured at the same concentration of dissolved oxygen [12]. Figure 3 d showed the changes in ECP during radiolysis of N2H4 and H2O2 solution at room temperature in recirculation mode. The ECP was ~ + 400 mV in H2O2 solution. The electrochemical potential of SS-304LN in H2O2 solution was more anodic as compared to N2H4 solution and water. It decreased on exposure to gamma irradiation due to decrease in H2O2 concentration. In aerated water the potential was ~100 mV. Addition
of N2H4 to the aqueous medium was reflected with a decrease in ECP from + 100 mV to -160 mV. A shift towards noble direction in ECP was observed on irradiation (dose 1 kGy) due to the radiolytic decomposition of N2H4 and formation of H2O2 from aerated water.
3.3 . Electrochemical potentiodynamic anodic polarization measurements at room temperature
During electrochemical reaction of SS, iron is oxidized at the anode and released into the water. The electrons from oxidation are then released and absorbed by oxygen at the cathode in aerated solution. The reactions are given as follows:
Anode: Fe → Fe++ + 2e- (1)
Cathode: ½ O2 + H2O + 2e- → 2OH- (2)
Electrochemical Reaction:Fe + ½ O2 + H2O → Fe(OH)2 (3)
When an oxygen scavenger is used in the system to eliminate free oxygen, the ferrous hydroxide [Fe(OH2)] is converted to a dense magnetite (Fe3O4) film, protecting SS metal from further attack from water and oxygen.
Fe(OH2) → Fe3O4 +H2 + 2H2O (4)
Once this film is formed, the scavenging of oxygen is important, because free oxygen can convert the magnetite into hematite which is porous and can eventually lead to localized corrosion.
2Fe3O4 + ½ O2 → Fe2O3 + H2O (5)
Hence, it is very important to scavenge the oxygen in the system at all times. Oxygen scavenging by hydrazine is very slow below 150 oC, whereas above 400 oC, hydrazine begins to break down into ammonia. Inhibitive action of hydrazine at ambient temperatures is caused by oxidation of hydrazine to N2 given by equation (6), replacing the aggressive anodic reaction (1) [13].
N2H4 + 4OH- → N2 + 4H2O+4e- (6)
Below -1000 mV, the water decomposition

33
ISrapS Bulletin Vol. 27, Issue Number 1 March 2015
Figure 4: Potentiodynamic anodic polarization plots for SS-304LN in (a) N2H4, NH3, H2O2 separately and as a mixture in deaerated condition (b) in H2 purged N2H4 solution at ambient temperature.
reaction is the major contributor to the net cathodic current whereas above -1000 mV the rate of reaction for water decomposition falls to insignificant proportions and the net cathodic current is dominated either by the hydrogen or oxygen reduction reaction depending on the saturating gas.
2H2O + 2e- → H2↑ + 2OH- (7)
2H+ +2e- →H2 ↑ (8)
O2+ 2H2O + 4e- →4OH- (9)
Figure 4 showed that the potentio-dynamic anodic polarization curve obtained for SS (a) in N2H4 and other possible radiolytic products like NH3 from radiolysis of deaerated N2H4 solution and H2O2 from radiolysis of aerated water. OCP observed for N2H4 in case of SS-304LN was the most active one compared to the OCP values of NH3, H2O2 and the mixture. The corrosion rate was in the following order N2H4 > NH3 ≅ H2O2 > (N2H4+NH3+H2O2). A passive film formation with almost constant current was observed from a potential range of +220 mV to -560mV vs. SCE, which can be due to absorption of N2H4 or due to formation of metal hydroxide on SS surface in 5 ppm N2H4 medium. The corrosion potential shifted to more positive side with addition of NH3 and H2O2 with lower anodic current as SS 304 – LN goes to passivation potential on exposure to the medium. In the mixture,
though it did not show any clear active to passive transition in anodic polarization, yet the corrosion current was quite low and corrosion potential was nobler than that observed in both NH3 and N2H4 mediums. The film formed with N2H4 was found to have a longer passivating region at lower potentials than NH3. The Tafel slopes indicated that the redox reaction was under mixed control. OCP shifted to nobler region with H2O2 due to additional cathodic reaction as mentioned above. When both NH3 and H2O2 are present similar film is formed. Hydrogen peroxide acts as a redox couple and can be oxidized and reduced as follows.
H2O2 ↔ O2 + 2H+ + 2 e-- (10)
H2O2 + 2H++ 2 e-→ 2 H2O (11)
O2 + 4H++ 4 e-→ 2 H2O (12)
In case of aerated solutions or in presence of H2O2, the OCP value was observed to be nobler. No significant effect on PDAP curves and corrosion rates were observed in case of aerated and deaerated condition for 5 ppm peroxide indicating that effect of oxygen over peroxide is insignificant. The difference in Ecorr values between aerated and deaerated conditions was also observed to be decreased with increasing N2H4 concentration due to increase in alkalinity and complexing ability of the medium at higher N2H4 concentration. The passive film formed was not quite stable and the dissolution rate of the
film was observed to be comparatively higher than the film formation. Since usage of H2 with hydrazine is reported in BWRs, polarization studies were carried out with H2 purged N2H4 solution and compared before and after gamma irradiation. The results were given in Figure 4 (b). H2 purged N2H4 solution showed a more
1
Figure 4:
Figure 8:
-10 -9 -8 -7 -6 -5 -4 -3-1.5
-1.0
-0.5
0.0
0.5
1.0
1.5
2.0
Log Current Density (A/cm2)
Pote
ntia
l (V)
N2H4 NH3 H2O2 NH3+N2H4+H2O2
-8 -7 -6 -5 -4-1.5
-1.0
-0.5
0.0
0.5
1.0
1.5
Pote
ntia
l (V)
Log Current Density (A/cm2)
N2H4+Ar N2H4+H2 N2H4+H2-Irradiated
(a) (b)
2
3
4
1
3
12
4
23 1
23
(1)(2)(3)
(1)(2)
(3)
1

34
ISrapS Bulletin Vol. 27, Issue Number 1 March 2015
Figure 5. Change in pH and conductivity with gadolinium nitrate concentration
curves and corrosion rates were observed in case of aerated and deaerated condition for 5 ppm peroxide which shows that effect of oxygen over peroxide is insignificant. A small passive region was observed with oxygen evolution in case of aerated condition due to the presence of dissolved oxygen. The difference in Ecorr values between aerated and deaerated conditions was observed to be decreased with increasing N2H4 concentration. At higher N2H4 concentration, due to increase in alkalinity and complexing ability of the medium, the passive film formed was not quite stable and the dissolution rate of the film was observed to be comparatively higher than the film formation. Since usage of H2 with hydrazine is reported in BWRs, polarization studies were carried out with H2 purged N2H4 solution and compared before and after gamma irradiation. The results were given in Fig. 4 (b). H2 purged N2H4
solution showed a more cathodic shift in the electrochemical potential (- 820 mV) as compared to argon purged solution (- 420 mV) due to additional reduction reaction. There was no significant difference observed in the OCP values in non-irradiated and irradiated H2 saturated N2H4. Two active to passive transitions were observed in case of non-irradiated H2 purged N2H4 and a single broad passive region were observed in case of irradiated H2 purged N2H4. Hydrogen was observed to protect N2H4 from decomposition by radiation. This could be due to scavenging OH radicals by H2. Hence, oxidation of N2H4 by OH radical is lowered. The % of decrease in N2H4 was only 33% after irradiation up to 50 kGy. Though not much change in ECP was observed between irradiated and non-irradiated solutions, a broader stable passivation range was
observed in irradiated solution due to formation of NH3. 3.4. Effect of Gd(NO3)3 concentration in moderator system radiolysis at room temperature 3.4.1 Yield of H2 and H2O2 on radiolysis
A mixture of radiations like gamma, neutron and heavy ions from fission products will be present in the reactor core the actual molecular product yield in moderator will be dependant (summation) on effective dose from both high and low LET radiations. Radiolysis yield from low LET gamma radiation though not give an actual picture can still give a basic idea of H2 and H2O2 and used for basic understanding and approximation.
The changes in pH and conductivity values of the gadolinium nitrate solutions with increasing concentration from 20-400 ppm range are given in Figure. 5. With the increase in [Gd], the pH decreased from 5.33-3.77 and the conductivity increased from 50-869.5 S/cm.
Figure 5. Change in pH and conductivity with gadolinium nitrate concentration Such a large increase in conductivity is expected to increase the radiolytic H2 generation in the moderator cover gas. The extent of H2 generated in a 60 % filled
cathodic shift in the electrochemical potential (- 820 mV) as compared to argon purged solution (- 420 mV) due to additional reduction reaction. There was no significant difference observed in the OCP values in non-irradiated and irradiated H2 saturated N2H4. Two active to passive transitions were observed in case of non-irradiated H2 purged N2H4 and a single broad passive region were observed in case of irradiated H2 purged N2H4. Hydrogen was observed to protect N2H4 from decomposition by radiation. This could be due to scavenging OH radicals by H2. Hence, oxidation of N2H4 by OH radical is lowered. The % of decrease in N2H4 was only 33% after irradiation up to 50 kGy. Though not much change in ECP was observed between irradiated and non-irradiated solutions, a broader stable passivation range was observed in irradiated solution due to formation of NH3.
3.4. Effect of Gd(NO3)3 concentration in moderator system radiolysis at room temperature
3.4.1 Yield of H2 and H2O2 on radiolysis
A mixture of radiations like gamma, neutron and heavy ions from fission products will be present in the reactor core. The actual molecular product yield in moderator will be dependant (summation) on effective dose from both high and low LET radiations. Radiolysis yield from low LET gamma radiation though not give an actual picture can still give a basic idea of H2 and H2O2 and used for basic understanding and approximation.
The changes in pH and conductivity values of the gadolinium nitrate solutions with increasing concentration from 20-400 ppm range are given in Figure 5. With the increase in [Gd], the pH decreased from 5.33-3.77 and the conductivity increased from 50-869.5 µS/cm. Such a large increase in conductivity is expected to increase the radiolytic H2 generation in the moderator cover gas. The extent of H2 generated in a 60 % filled sample tubes with varying dose and concentration of gadolinium is given in Figure 6.
The volume of hydrogen was found to increase linearly with dose in the experimental dose range.
The yield of H2 increased to 10 times by the addition of 20 ppm Gd3+ as compared to
Figure 6. Variation of volume % of H2 in the head space of 60% filled sample vials with absorbed dose.
sample tubes with varying dose and concentration of gadolinium is given in Figure 6. The volume of hydrogen was found to increase linearly with dose in the experimental dose range.
Figure 6. Variation of volume % of H2 in the head space of 60% filled sample vials with absorbed dose.
The yield of H2 increased to 10 times by the addition of 20 ppm Gd3+ as compared to deaerated ultra pure water. But the rate of H2 generation was observed to get saturated at higher gadolinium concentration. The G(H2) values as calculated from the slopes of these curves are given in Table 2. Table 2. G(H2) values with varying gadolinium nitrate concentration on gamma radiolysis.
Similar behaviour was observed in H2O2 formation from gamma radiolysis of gadolinium nitrate solution. The corresponding yield in oxidizing H2O2, are given in Figure 7.
Figure 7. Variation of H2O2 in the irradiated Gd(NO3)3 solutions with absorbed dose. As can be seen from Figure 7, H2O2 yield increased with dose at lower doses but saturated at higher doses due to secondary reactions and steady state equilibrium between formation and simultaneous decomposition of H2O2. The production of the above species (H2 and H2O2) was found to be influenced by the reactivity of the scavengers of their precursors e-
aq and OH respectively [14]. NO3
- can scavenge e-aq
and thereby protect H2O2 from decomposition. About 250 - 1100 ppb NO2
- was observed only at higher doses from 20 -100 ppm Gd(NO3)3. Gd3+ analysis by ICPAAS showed no Gd3+ precipitation in the irradiated solution. 3.4.2 Corrosion of SS – 304 LN Corrosion compatibility studies on SS - 304 LN with varying concentration of deaerated Gd(NO3)3 solutions at 65 oC was carried out by both DC and AC techniques. From the electrochemical studies it was observed that the electrochemical potential increased to more positive values with increase in gadolinium concentration. The polarization graphs and impedance (Nyquist) plots are shown in Figure 8. The PDAP curves
Gd(NO3)3 (ppm) G(H2)0 0.014
20 0.131 100 0.188 200 0.233 400 0.242
Table 2. G(H2) values with varying gadolinium nitrate concentration on gamma radiolysis.
Gd(NO3)3 (ppm) G(H2)0 0.01420 0.131100 0.188200 0.233400 0.242

35
ISrapS Bulletin Vol. 27, Issue Number 1 March 2015
Figure 7. Variation of H2O2 in the irradiated Gd(NO3)3 solutions with absorbed dose.
sample tubes with varying dose and concentration of gadolinium is given in Figure 6. The volume of hydrogen was found to increase linearly with dose in the experimental dose range.
Figure 6. Variation of volume % of H2 in the head space of 60% filled sample vials with absorbed dose.
The yield of H2 increased to 10 times by the addition of 20 ppm Gd3+ as compared to deaerated ultra pure water. But the rate of H2 generation was observed to get saturated at higher gadolinium concentration. The G(H2) values as calculated from the slopes of these curves are given in Table 2. Table 2. G(H2) values with varying gadolinium nitrate concentration on gamma radiolysis.
Similar behaviour was observed in H2O2 formation from gamma radiolysis of gadolinium nitrate solution. The corresponding yield in oxidizing H2O2, are given in Figure 7.
Figure 7. Variation of H2O2 in the irradiated Gd(NO3)3 solutions with absorbed dose. As can be seen from Figure 7, H2O2 yield increased with dose at lower doses but saturated at higher doses due to secondary reactions and steady state equilibrium between formation and simultaneous decomposition of H2O2. The production of the above species (H2 and H2O2) was found to be influenced by the reactivity of the scavengers of their precursors e-
aq and OH respectively [14]. NO3
- can scavenge e-aq
and thereby protect H2O2 from decomposition. About 250 - 1100 ppb NO2
- was observed only at higher doses from 20 -100 ppm Gd(NO3)3. Gd3+ analysis by ICPAAS showed no Gd3+ precipitation in the irradiated solution. 3.4.2 Corrosion of SS – 304 LN Corrosion compatibility studies on SS - 304 LN with varying concentration of deaerated Gd(NO3)3 solutions at 65 oC was carried out by both DC and AC techniques. From the electrochemical studies it was observed that the electrochemical potential increased to more positive values with increase in gadolinium concentration. The polarization graphs and impedance (Nyquist) plots are shown in Figure 8. The PDAP curves
Gd(NO3)3 (ppm) G(H2)0 0.014
20 0.131 100 0.188 200 0.233 400 0.242
deaerated ultra pure water. But the rate of H2 generation was observed to get saturated at higher gadolinium concentration. The G(H2) values as calculated from the slopes of these curves are given in Table 2.
Similar behaviour was observed in H2O2 formation from gamma radiolysis of gadolinium nitrate solution. The corresponding yield in oxidizing H2O2, are given in Figure 7.
As can be seen from Figure 7, H2O2 yield increased with dose at lower doses but saturated at higher doses due to secondary reactions and steady state equilibrium between formation and simultaneous decomposition of H2O2. The production of the above species (H2 and H2O2)
was found to be influenced by the reactivity of the scavengers of their precursors, e-
aq and OH● respectively [14]. NO3
- can scavenge e-aq and
thereby protect H2O2 from decomposition. About 250 - 1100 ppb NO2
- was observed only at higher doses from 20 -100 ppm Gd(NO3)3. Gd3+ analysis by ICPAAS showed no Gd3+ precipitation in the irradiated solution.
3.4.2 Corrosion of SS – 304 LN
Corrosion compatibility studies on SS - 304 LN with varying concentration of deaerated Gd(NO3)3 solutions at 65 oC was carried out by both DC and AC techniques. From the electrochemical studies it was observed that the electrochemical potential increased to more positive values with increase in gadolinium concentration. The polarization graphs and impedance (Nyquist) plots are shown in Figure 8. The PDAP curves showed a wide limiting current region due to a steady state of formation and dissolution of oxide film in the anodic side. The corrosion rates as calculated from Tafel slopes (Table 3) were found to be decreased with increase in gadolinium concentration. Impedance spectra showed that the corrosion reaction is controlled by diffusion kinetics. The surface of the specimen was observed to retain the original luster from polishing even after the exposure.
The corrosion rate was also monitored by weight loss method by exposing 10 coupons of
Figure 8. PDAP and Impedance (Nyquist) curves for SS – 304 LN in varying Gd(NO3)3 medium.
(1) (2) (3)
(2) (1)
(3)
(a) (b)

36
ISrapS Bulletin Vol. 27, Issue Number 1 March 2015
SS – 304 LN (area 33.8 cm2) in aerated 200 ppm Gd(NO3)3 solution at 65 oC. Very negligible quantity of Cr and Ni was found to be released and was found to be constant and the corrosion rate was measured to be 4.35 X 10⁻⁵ µm h-1.
4. Conclusions
The following conclusions could be made from radiolysis and material compatibility related studies related to AHWR. Hydrazine could be an effective reducing agent and would stay in the liquid phase to control oxidants and thereby prevent SCC problems in AHWR main heat transport system. Potential measurements indicated that using hydrazine the redox and stainless steel potential can be maintained well below the – 230 mV required for preventing the IGSCC in stainless steel. A passive film formation with almost constant current was observed due to formation of metal hydroxide and absorption of N2H4 on SS surface. In hydrogen saturated N2H4 solution which can be simulated as hydrazine and hydrogen co-injection, H2 was observed to protect N2H4 from radiation decomposition. The study showed that a sufficient concentration of hydrazine in the system can be maintained by continuous injection. In the moderator system with increase in Gd concentration, there was an increase in both H2 and H2O2 yield due to radiolysis but the extent of increase was not linear with concentration. The structural material SS - 304 LN gets passivated at higher gadolinium concentration.
5. References1. R.J. Row, M.E. Indig, C.C. Lin et al, Supression of radiolytic
oxygen produced in a BWR by feed water hydrogen addition, Water Chemistry of Nuclear reactor systems, BNES 1984, 3, 23-28.
2. R. L. Cowan, M. E. Indig, J. N. Kass, R.J. Law, L.L Sundberg, Experience with hydrogen water chemistry in Boiling water reactors. Water Chemistry of Nuclear reactor systems, BNES 1986, 4, 29 -36.
3. F. P. Ford, D. F. Taylor, P. L. Andresen, Corrosion assisted cracking of stainless and low alloy steels in LWR environment, EPRI NP - 5064M Project 2006-6, Final report, 1987.
4. K. Ishida, Y. Wada, M. Tachibana, M. Alzawa, .M. Fuse, E. Kadoi, Hydrogen and hydrazine co-injection to mitigate stress corrosion cracking of structural materials in boiling water reactors (1) Temperature dependence of hydrazine reactions. J. Nucl. Sci. Technol., 2006, 43, 65-76.
5. R.K. Sinha, A. Kakodkar, Design and development of the AHWR—the Indian thorium fuelled innovative nuclear reactor, Nucl. Eng. Des. 2006, 236, 683–700
6. A publication of the extra budgetary programme on mitigation of Intergranular stress corrosion cracking in RBMK reactors, IAEA-EBP-IGSCC, IAEA, Vienna, September 2002, pp. 19 – 20.
7. J. Kysela, VVER primary coolant chemistry experience and perspectives, Water Chemistry for nuclear Reactor systems 6. BNES, 1992, 1, 1 - 8.
8. N. Ichikawa and J. Takagi, Precise evaluation of corrosion environments of structural materials under complex water flow condition, (II) Water chemistry at down comer region of a BWR, J. Nucl. Sci. Technol., 2003, 40 (), 941-950.
9. T. Moeller, N. Foger, Observations on the rare earths. LXI. Precipitation of hydrous oxides or hydroxides from perchlorate solutions, J. Am. Chem. Soc. 1951, 73, 4481-4481.
10. G.V. Buxton, C.R. Stuart, Radiation chemistry of aqueous solutions of hydrazine at elevated temperatures. Part 1 – oxygen free solutions. J. Chem. Soc., Faraday Trans., 1996, 92, 1519- 1525.
11. K. Makela and P. Altonen, Online monitoring for further corrosion reduction and better understanding of the activity build-up in LWR primary coolant systems, Int. J. Pres. Ves. Pip. 1993, 55, 163-177.
12. Y.J. Kim, Analysis of oxide film formed on type 304 stainless steel in 288oC water containing oxygen, hydrogen and hydrogen peroxide, Corrosion, 1999, 55, 81 – 88.
13. Evans, U. R., The Corrosion and Oxidation of Metals, 1960, p. 173.
14. Z.D.Draganic, I.G. Draganic, Formation of primary yields of hydrogen peroxide and molecular hydrogen in the gamma. radiolysis of neutral aqueous solutions, J. Phys. Chem. 1971, 75, 3950-3957.
Table 3. Corrosion rates of SS – 304 LN in varying Gd(NO3)3 concentration
Gd(NO3)3 (ppm) Corrosion rate (µm/h)20 4.43 x 10⁻⁴
100 3.94 x 10⁻⁴
400 1.83 x 10⁻⁴

37
ISrapS Bulletin Vol. 27, Issue Number 1 March 2015
Mrs Padma S. Kumar joined WSCD on 1989 after graduating from, University of Calicut, Kerala. She did her post graduation from Annamalai University during 1993 and currently perusing PhD in Madras university. Her area of interest includes Control of activity build up in nuclear reactors, chemical decontamination, Noble metal chemical addition, Corrosion and corrosion inhibitors, Chemical decontamination, radiolysis and role of reductants and R & D on process aspects related to AHWR water chemistry.
After obtaining his MSc from IIT Kanpur, Shri Debasis Mal joined WSCD, BARCF, Kalpakkam, in 2013, through 56th batch of BARC Training school. His research interest is in electrochemical corrosion compatibility of structural materials and gamma radiolysis studies related to AHWR and other nuclear reactor coolant chemistry.
Puspalata Rajesh completed her MSc from Ravenshaw College, Orissa in 1992 and joined BARC Training school in 1993 in 37th batch. She obtained PhD degree from university of Mumbai in 2004 and post doctoral research in University of Notre Dame, US during 2005-2007. She initially joined Applied Chemistry Division, BARC, Mumbai in 1994 and later joined WSCD, Kalpakkam in 1999. Her main area of research includes gamma and pulse radiolysis studies related to nuclear reactors, electrochemical corrosion, crevice corrosion in SG circuits and electro-chemical ion exchange for minimizing active waste from decontamination.
Dr S Rangarajan completed his postgraduation in analytical chemistry from Madras University, Tamilnadu, with gold medal in 1983. He joined Water & Steam Chemistry Division in 1984 after completing 27th batch of BARC training school. He obtained PhD from Madras University and did his post doctoral research during 2001-2002 in Fracture Research Institute, Sendai and Dept. of Applied Chemistry & Biochemistry, Kumamoto, Japan. He is presently heading Surface characterisation and mass transport studies section of WSCD. Dr Rangarajan’s contributions in the area of Reactor Water Chemistry, Material compatibility studies of Structural materials in various decontamination & SG cleaning formulations, Electro-chemical ion exchange for minimizing active waste from decontamination, Electrochemical speciation Electrochemical corrosion, Flow Accelerated Corrosion, Modelling of Crevice corrosion in SG circuits and radiolysis, Impedance studies on high temperature oxide films and Scanning Electrochemical Microscopy (SECM) has given an insight into the processes occurring at the Metal /Metal oxide/Water Interfacial systems.
Dr S Velmurugan is currently heading Water & Steam Chemistry Division of Chemistry group in Kalpakkam. He is from 28th batch of Training School and joined the department in 1985. During 1981-1984 he served as lecturer at American college, Madurai before joining BARC. He is actively involved in Dilute Chemical Decontamination (DCD) process for the full system decontamination which was applied 8 times to PHT systems of Indian PHWRs. His main area of research revolves around controlling Radiation field build-up for MAN-REM saving measures, development of process for the chemical cleaning of steam generators, removal of Hotspots in the PHWR moderator system, behaviour of antimony activity, development of decontamination process for the decommissioning, new ion exchange resins and electrochemical ion exchange, Flow accelerated corrosion behaviour of feeders and radiolysis modelling for AHWR coolant system. He is the chairman of COSWAC. Dr. Velmurugan is recipient of prestigious DAE Technical Excellance Award for Developing a process for the full PHT system decontamination of PHWRs in 2001.
38
ISrapS Bulletin Vol. 27, Issue Number 1 March 2015
Plasmonics in Fluorescence: Enhanced Intensities, Directional Emission and Selective Polarization
Sharmistha Dutta ChoudhuryRadiation & Photochemistry Division, Bhabha Atomic Research Center, Mumbai 400085, India.
Email: [email protected]
AbstractThe recent spectacular advances in plasmonics and the opportunity it offers for manipulating light at the nanoscale has led to the conception of plasmon-controlled fluorescence. This article summarizes some of our recent contributions in modifying fluorescence properties through fluorophore-plasmon interactions. These interactions modify the emission in ways not seen in classical fluorescence experiments. Apart from enhancing the fluorescence intensities, coupling with surface plasmon oscillations also provides directional emission and control over emission polarization. The immense potential of plasmon-controlled fluorescence in designing new detection formats, multicolour sensing, bioassays and novel emissive structures are discussed.
1. Introduction
Fluorescence detection is one of the most widely used tools in chemical and biological sciences, with applications in sensing, cell imaging, sequencing and diagnostics. It provides information on a wide range of molecular processes, including the interactions of solvent molecules with fluorophores, rotational diffusion of biomolecules, conformational changes and binding interactions [1]. Today fluorescence spectroscopy and microscopy require minimal sample volumes, often in the range of femtoliters, and extremely low concentrations of fluorophores. Although the growing applications of fluorescence have been accompanied by significant improvements in probe chemistry, light sources, optics and detectors, we have probably reached the practical sensitivity limit of classical fluorescence. A variety of fluorophores are already available with high quantum yields; and detectors have been developed with good quantum efficiencies. It is apparent that there are only limited opportunities for further improvements in fluorescence intensities, based on classical far-field free space emission. Moreover, classical fluorescence is isotropic in nature and independent of the observation angle. Because of the omnidirectional nature
of fluorescence, it is possible to capture only a small fraction of the total emitted light. Higher fluorescence collection efficiencies need complex and expensive optics. To improve fluorescence detection capabilities it is desirable to control the direction of emission in a cost-effective manner and preferably to obtain the entire emission as a narrow beam normal to the sample surface. Increased brightness and good photostability of fluorophores are also extremely important for single molecule fluorescence studies. This has led researchers to look for alternative methodologies that can boost fluorescence technology. The recent advances in plasmonics and the unprecedented opportunity for the manipulation of light at the nanoscale, has led to the emergence of plasmon-controlled fluorescence [2-4].
During the past decade, there has been increasing interest in the modification of f luorescence properties using metal nanostructures. These effects depend on the collective oscillation of electrons in metals, called surface plasmons. The optical fields near fluorophores can couple to the surface plasmon oscillations of metallic substrates as localized excitations for metal nanoparticles or as propagating surface waves for thin metal films. The coupling of fluorescence with plasmons
Article 5- Sharmistha

39
ISrapS Bulletin Vol. 27, Issue Number 1 March 2015
offers exciting new avenues for controlling and directing the flow of optical energy using near-field effects rather than classical far-field optical components [5-8]. This article is an account of some of our recent contributions in the area of plasmon-controlled fluorescence. We describe the coupling of fluorophores with metal nanostructures as well as with thin metal films. Although the basic interactions are similar, the effects are quite different and depend on the geometry of the nanometallic substrate [4].
Our studies show that fluorophore-plasmon coupling with silver-gold nanocomposite substrates leads to increased fluorescence intensities and reduced excited-state lifetimes. This phenomenon is referred as metal-enhanced fluorescence (MEF) and has the potential to overcome several limitations of single-molecule fluorescence spectroscopy such as low photostability, low signal intensities, and on-off blinking [9]. We have demonstrated that silver nanostructures can increase the upper detection limit in fluorescence correlation spectroscopy (FCS) measurements, by reducing the detection volume and increasing the signal intensities [10]. Silver nanostructure substrates can thus extend the applicability of FCS to
higher concentrations, which is useful for many biologically relevant reactions. In an interesting study we have shown that the coupling of fluorescence with the electromagnetic modes that are present in metal-dielectric layered structures can convert the isotropic emission from randomly oriented fluorophores, into directional emission perpendicular to the sample surface [11]. The observation of beaming emission from such simple structures can have applications in microarrays and microscope based studies. Importantly, the fluorescence emission from various probes can be tuned by varying the optical properties of the metal and the thickness of the dielectric layer [12]. An interesting outcome of metal-fluorophore coupling is that, although the emission arises from the fluorophores, the dispersion and polarization properties of the emission are that of the optical mode to which the emission couples. This fact can be advantageously utilized to confer desired properties to the coupled emission. Our investigations reveal that the intrinsically unpolarized emission from luminescent lanthanide ions can be transformed to wavelength-resolved and sharply directional polarized emission by coupling with plasmonic and photonic modes present in
Scheme 1: Schematic representation of (A) free space emission from fluorophores on a glass slide, (B) coupling of fluorescence to metal nanoparticles, (C) fluorescence coupling to optical modes in metal-dielectric (MD) and metal-dielectric-metal (MDM) substrates.
2. Fluorescence Enhancement with Silver-Gold Nanocomposite Substrates
Metal-enhanced fluorescence (MEF) is the phenomenon in which the near-field interactions of fluorophores with surface plasmons in metallic nanostructures can lead to substantial fluorescence enhancements. This interesting feature arises due to two effects. First, metallic nanoparticles can increase the local electromagnetic fields in their vicinity and this enhanced local field results in increased rates of excitation of nearby fluorophores. Secondly and more importantly, the proximity of fluorophores to metal particles increases the radiative decay rates of the fluorophores. The coupled plasmon-fluorophore system, or “plasmophore”, subsequently radiates into the far-field with increased emission intensity [4]. Metal-enhanced fluorescence (MEF) is largely dependent on the nature of the metallic nanoparticles. For example, Ag, one of the most widely studied plasmonic substrates, can enhance the fluorescence of probes
emitting in the wavelength range of 380-800 nm, while Au provides enhancement beyond 500 nm and Al nanostructures are effective for MEF in the UV region [14]. A large number of methods have been investigated for the preparation of MEF substrates, starting from simple vapor deposition to more exotic nanofabrication techniques [5, 15, 16]. We have shown that the galvanic replacement reaction is a facile and powerful approach to prepare large area silver-gold nanocomposite (Ag-Au-NC) substrates that are suitable for MEF [9].
The galvanic replacement reaction of silver with gold is driven by the difference between the reduction potential of AuCl4-
/Au (0.99 V vs standard hydrogen electrode, SHE) and Ag+/Ag (0.8 V vs. SHE) [17]. The Ag-Au-NC substrates were fabricated by first coating glass slides with a layer of Ag (~600 nm) using thermal vapor deposition, followed by immersing the slide in a solution of HAuCl4. The immersion of the Ag coated slides into the HAuCl4 solution leads to the spontaneous oxidation of elemental Ag and the uniform deposition of
Scheme 1: Schematic representation of (A) free space emission from fluorophores on a glass slide, (B) coupling of fluorescence to metal nanoparticles, (C) fluorescence coupling to optical modes in metal-dielectric (MD) and metal-dielectric-metal (MDM) substrates.
metal-dielectric layered substrates [13]. This nanoscale control over lanthanide luminescence can facilitate the design of novel emissive structures with many technological applications.
2. Fluorescence enhancement with silver-gold nanocomposite substrates
Metal-enhanced fluorescence (MEF) i s the phenomenon i n w h i c h t h e n e a r - f i e l d interactions of fluorophores wi th sur face p lasmons in metallic nanostructures can lead to substantial fluorescence enhancements. This interesting

40
ISrapS Bulletin Vol. 27, Issue Number 1 March 2015
feature arises due to two effects. First, metallic nanoparticles can increase the local electromagnetic fields in their vicinity and this enhanced local field results in increased rates of excitation of nearby fluorophores. Secondly and more importantly, the proximity of fluorophores to metal particles increases the radiative decay rates of the fluorophores. The coupled plasmon-fluorophore system, or “plasmophore”, subsequently radiates into the far-field with increased emission intensity [4]. Metal-enhanced fluorescence (MEF) is largely dependent on the nature of the metallic nanoparticles. For example, Ag, one of the most widely studied plasmonic substrates, can enhance the fluorescence of probes emitting in the wavelength range of 380-800 nm, while Au provides enhancement beyond 500 nm and Al nanostructures are effective for MEF in the UV region [14]. A large number of methods have been investigated for the preparation of MEF substrates, starting from simple vapor deposition to more exotic nanofabrication techniques [5, 15, 16]. We have shown that the galvanic replacement reaction is a facile and powerful approach to prepare large area silver-gold nanocomposite (Ag-Au-NC) substrates that are suitable for MEF [9].
The galvanic replacement reaction of silver with gold is driven by the difference between the reduction potential of AuCl4
-/Au (0.99 V vs standard hydrogen electrode, SHE) and Ag+/Ag (0.8 V vs. SHE) [17]. The Ag-Au-NC substrates were fabricated by first coating glass slides with a layer of Ag (~600 nm) using thermal vapor deposition, followed by immersing the slide in a solution of HAuCl4. The immersion of the Ag coated slides into the HAuCl4 solution leads to the spontaneous oxidation of elemental Ag and the uniform deposition of nanoscale Au particles on the surface of the sacrificial Ag substrate. Figure 1A shows the SEM image of the Ag-Au-NC substrate formed after the galvanic reaction. The EDS analysis (Figure 1B) yields an elemental composition of Au (26%), Ag (64%) and Cl (10% by weight). The presence of residual metallic silver on the fabricated substrates
is advantageous because silver has suitable plasmonic properties for MEF. However, silver surfaces are unstable and prone to oxidation. Gold surfaces, on the other hand, are resistant to oxidation, have favorable surface chemistry and biocompatibility. So it is expected that the fabricated substrates with surface deposited gold nanoparticles will provide a more robust surface, while at the same time the residual silver will provide favorable metal-fluorophore interactions for better fluorescence enhancement.
nanoscale Au particles on the surface of the sacrificial Ag substrate. Figure 1A shows the SEM image of the Ag-Au-NC substrate formed after the galvanic reaction. The EDS analysis (Figure 1B) yields an elemental composition of Au (26%), Ag (64%) and Cl (10% by weight). The presence of residual metallic silver on the fabricated substrates is advantageous because silver has suitable plasmonic properties for MEF. However, silver surfaces are unstable and prone to oxidation. Gold surfaces, on the other hand, are resistant to oxidation, have favorable surface chemistry and biocompatibility. So it is expected that the fabricated substrates with surface deposited gold nanoparticles will provide a more robust surface, while at the same time the residual silver will provide favorable metal-fluorophore interactions for better fluorescence enhancement.
Figure 1: (A) SEM image of Ag-Au-NC substrate and (B) the EDS spectra before and after the galvanic reaction.
For fluorescence studies, the dye molecules (ATTO655) were immobilized on the substrate using biotin-streptavidin chemistry (Figure 2A). Figure 2B shows the fluorescence spectra of ATTO655 on the fabricated Ag-Au-NC substrates, the starting Ag-film before the galvanic reaction and on bare glass slides, used as the control. About 15-fold enhancement in the fluorescence intensity of ATTO655-SA is observed on the Ag-Au-NC substrate in comparison to that from the probe on bare
glass. The corresponding enhancement from the starting Ag substrate is about 5-fold. This result shows the superior performance of the Ag-Au-NC substrate for MEF as compared to the Ag-film. Most interestingly, the intensity enhancement is accompanied by decrease in the fluorescence lifetime of ATTO655 (Figure 3B). This is a characteristic feature of the fluorophore-plasmon coupling effect and suggests a plasmon induced increase in the radiative decay rate of the fluorophores [4].
Figure 2: (A) Immobilization of dyes on Ag-Au-NC substrates using the biotin (Bt)-streptavidin (SA) assembly, (B) steady-state fluorescence spectra and (C) fluorescence decay traces of ATTO655 on Ag-Au-NC.
The ensemble fluorescence results are also corroborated by single molecule fluorescence studies. The single molecule technique is a valuable tool to study the intricacies of metal-fluorophore interactions without any averaging effect [18]. In the Ag-Au-NC substrate, the fluorophore can reside in a variety of locations such as on the tip of a nanoparticle, in the valley between two particles or on the flat surface of a particle. Since the fluorophore-metal coupling depends on the position and orientation of the fluorophore on the metallic surface, there is considerable heterogeneity in the mode of interaction of individual fluorophores with the metal nanostructures. This can be easily
Figure 1: (A) SEM image of Ag-Au-NC substrate and (B) the EDS spectra before and after the galvanic reaction.
For fluorescence studies, the dye molecules (ATTO655) were immobilized on the substrate using biotin-streptavidin chemistry (Figure 2A). Figure 2B shows the fluorescence spectra of ATTO655 on the fabricated Ag-Au-NC substrates, the starting Ag-film before the galvanic reaction and on bare glass slides, used as the control. About 15-fold enhancement in the fluorescence intensity of ATTO655-SA is observed on the Ag-Au-NC substrate in comparison to that from the probe on bare glass. The corresponding enhancement from the starting Ag substrate is about 5-fold. This result shows the superior performance of the Ag-Au-NC substrate for MEF as compared to the Ag-film. Most interestingly, the intensity enhancement is accompanied by decrease in the fluorescence lifetime of ATTO655 (Figure 2C). This is a characteristic feature of the fluorophore-plasmon coupling effect and suggests a plasmon induced increase in the radiative decay rate of the fluorophores [4].
The ensemble fluorescence results are also corroborated by single molecule fluorescence studies. The single molecule technique is a valuable tool to study the intricacies of metal-fluorophore interactions without any averaging

41
ISrapS Bulletin Vol. 27, Issue Number 1 March 2015
3. Silver nanostructures for fluorescence correlation spectroscopy
Fluorescence correlation spectroscopy (FCS) is a widely used technique to investigate the interactions and dynamics of molecules based on the fluorescence intensity fluctuations in a small detection volume [19]. With typical diffraction-limited observation volumes of about 1 fl obtained with conventional confocal microscopy systems, FCS measurements can only be performed at low fluorophore concentrations (pico- to nanomolar). This restricts the ability of FCS to study biological interactions that take place at high concentrations (micro- to millimolar range) or to investigate processes in cellular environments. Such systems can be investigated only with ultralow observation volumes. A number of methods are being explored to reduce the detection volumes and hence increase the upper detection limit in FCS measurements, one approach being the use of metallic nanoapertures. Since the pioneering
nanoscale Au particles on the surface of the sacrificial Ag substrate. Figure 1A shows the SEM image of the Ag-Au-NC substrate formed after the galvanic reaction. The EDS analysis (Figure 1B) yields an elemental composition of Au (26%), Ag (64%) and Cl (10% by weight). The presence of residual metallic silver on the fabricated substrates is advantageous because silver has suitable plasmonic properties for MEF. However, silver surfaces are unstable and prone to oxidation. Gold surfaces, on the other hand, are resistant to oxidation, have favorable surface chemistry and biocompatibility. So it is expected that the fabricated substrates with surface deposited gold nanoparticles will provide a more robust surface, while at the same time the residual silver will provide favorable metal-fluorophore interactions for better fluorescence enhancement.
Figure 1: (A) SEM image of Ag-Au-NC substrate and (B) the EDS spectra before and after the galvanic reaction.
For fluorescence studies, the dye molecules (ATTO655) were immobilized on the substrate using biotin-streptavidin chemistry (Figure 2A). Figure 2B shows the fluorescence spectra of ATTO655 on the fabricated Ag-Au-NC substrates, the starting Ag-film before the galvanic reaction and on bare glass slides, used as the control. About 15-fold enhancement in the fluorescence intensity of ATTO655-SA is observed on the Ag-Au-NC substrate in comparison to that from the probe on bare
glass. The corresponding enhancement from the starting Ag substrate is about 5-fold. This result shows the superior performance of the Ag-Au-NC substrate for MEF as compared to the Ag-film. Most interestingly, the intensity enhancement is accompanied by decrease in the fluorescence lifetime of ATTO655 (Figure 3B). This is a characteristic feature of the fluorophore-plasmon coupling effect and suggests a plasmon induced increase in the radiative decay rate of the fluorophores [4].
Figure 2: (A) Immobilization of dyes on Ag-Au-NC substrates using the biotin (Bt)-streptavidin (SA) assembly, (B) steady-state fluorescence spectra and (C) fluorescence decay traces of ATTO655 on Ag-Au-NC.
The ensemble fluorescence results are also corroborated by single molecule fluorescence studies. The single molecule technique is a valuable tool to study the intricacies of metal-fluorophore interactions without any averaging effect [18]. In the Ag-Au-NC substrate, the fluorophore can reside in a variety of locations such as on the tip of a nanoparticle, in the valley between two particles or on the flat surface of a particle. Since the fluorophore-metal coupling depends on the position and orientation of the fluorophore on the metallic surface, there is considerable heterogeneity in the mode of interaction of individual fluorophores with the metal nanostructures. This can be easily
Figure 2: (A) Immobilization of dyes on Ag-Au-NC substrates using the biotin (Bt)-streptavidin (SA) assembly, (B) steady-state fluorescence spectra and (C) fluorescence decay traces of ATTO655 on Ag-Au-NC.
effect [18]. In the Ag-Au-NC substrate, the fluorophore can reside in a variety of locations such as on the tip of a nanoparticle, in the valley between two particles or on the flat surface of a particle. Since the fluorophore-metal coupling depends on the position and orientation of the fluorophore on the metallic surface, there is considerable heterogeneity in the mode of interaction of individual fluorophores with the metal nanostructures. This can be easily determined from single molecule studies. The scanning confocal images (Figure 3A) clearly show the increased brightness of individual ATTO655 molecules on the Ag-Au-NC substrates compared to the bare glass slide. Statistical analysis reveals the large variation in the fluorescence enhancements of single dye molecules located at various sites in the Ag-Au-NC substrates (Figure 3B). Nearly 50 fold enhancement can be observed for dyes that are favourably located in the plasmonic “hotspots”. Other than fluorescence enhancement, a considerable increase is observed in the photostability of the dyes on the nanocomposite surface. These results suggest that Ag-Au-NC substrates are well- suited for biophysical and bioimaging studies based on MEF and can also be used to design novel experiments for selective biomolecular binding and recognition.
Figure 3: (A) Scanning confocal images of ATTO655 on glass and Ag-Au-NC substrates and (B) the histograms showing fluorescence enhancement factors for several single molecules.
determined from single molecule studies. The scanning confocal images (Figure 3A) clearly show the increased brightness of individual ATTO655 molecules on the Ag-Au-NC substrates compared to the bare glass slide. Statistical analysis reveals the large variation in the fluorescence enhancements of single dye molecules located at various sites in the Ag-Au-NC substrates (Figure 3B). Nearly 50 fold enhancement can be observed for dyes that are favourably located in the plasmonic “hotspots”. Other than fluorescence enhancement, a considerable increase is observed in the photostability of the dyes on the nanocomposite surface. These results suggest that Ag-Au-NC substrates are well suited for biophysical and bioimaging studies based on MEF and can also be used to design novel experiments for selective biomolecular binding and recognition.
Figure 3: (A) Scanning confocal images of ATTO655 on glass and Ag-Au-NC substrates and (B) the histograms showing fluorescence enhancement factors for several single molecules.
3. Silver nanostructures for fluorescence correlation spectroscopy Fluorescence correlation spectroscopy (FCS) is a widely used technique to investigate the interactions and dynamics of molecules based on the fluorescence intensity fluctuations in a small detection volume [19]. With typical diffraction-limited observation volumes of about 1 fl obtained with conventional confocal microscopy systems, FCS measurements can only be performed at low fluorophore concentrations (pico- to nanomolar). This restricts the ability of FCS to study biological interactions that take place at high concentrations (micro- to millimolar range) or to investigate processes in cellular environments. Such systems can be investigated only with ultralow observation volumes. A number of methods are being explored to reduce the detection volumes and hence increase the upper detection limit in FCS measurements, one approach being the use of metallic nanoapertures. Since the pioneering study of FCS within subwavelength metallic apertures by Levene et al., quite a few notable investigations have been carried out in specially prepared nanoapertures of various shapes and sizes [20-22]. These substrates have mainly been fabricated by electron lithographic techniques or focused ion beam milling on aluminum or gold films. We have demonstrated that even silver nanostructures prepared by simple wet chemical synthesis or thermal vapor deposition (AgNS_VD) can be used as efficient substrates for FCS measurements at high concentrations [10]. In addition to reduced detection volumes, the plasmonic properties of metal nanostructures also allow for the tuning of the fluorescence behavior of molecules. Moreover, the introduction of plasmonic.

42
ISrapS Bulletin Vol. 27, Issue Number 1 March 2015
study of FCS within subwavelength metallic apertures by Levene et al., quite a few notable investigations have been carried out in specially prepared nanoapertures of various shapes and sizes [20-22]. These substrates have mainly been fabricated by electron lithographic techniques or focused ion beam milling on aluminum or gold films. We have demonstrated that even silver nanostructures prepared by simple wet chemical synthesis or thermal vapor deposition (AgNS_VD) can be used as efficient substrates for FCS measurements at high concentrations [10]. In addition to reduced detection volumes, the plasmonic properties of metal nanostructures also allow for the tuning of the fluorescence behavior of molecules. Moreover, the introduction of
Figure 4: (A) Schematic of FCS set-up, (B) SEM image of AgNS_VD, (C) intensity time trajectories of ATTO655 on the substrates and (D) autocorrelation plots for 9 µM ATTO655 in open volume and AgNS_VD. nanostructures has the distinct advantage of making FCS studies feasible at high concentrations without any modification of the conventional optical setup
Figures 4A and B show the schematic of the FCS set-up on silver nanostructured substrates and the SEM image of AgNS_VD, respectively. The intensity-time traces observed due to the diffusion of ATTO655 (50 nM) in the open volume and within the nanospaces on the AgNS_VD substrates are shown in Figure 4C. Compared to the open volume, fluorescence bursts with very high signal intensities can be observed on AgNS_VD. This occurs because diffusion of the individual ATTO655 molecules in the proximity of silver nanoparticles leads to large fluorescence enhancements due to the fluorophore-plasmon coupling effect. The autocorrelation functions, obtained for the fluorescence intensity fluctuations due to diffusion of the fluorescent probe molecule,
ATTO655, show several notable features, particularly an increase in the amplitude and a decrease in the correlation time, on AgNS_VD compared to the open volume. Most interestingly, at 9 µM fluorophore concentration, no time correlation can be observed in the open volume whereas a distinct correlation is observed on AgNS_VD (Figure 4C). These results suggest that there is a reduction in the effective fluorescence detection volume on the AgNS_VD substrates. From a statistical analysis of several independent measurements at different positions on the AgNS_VD, the effective detection volume is estimated to be reduced by about a factor of 18±10 on the AgNS_VD substrate in comparison to open volume.
We propose that two effects are responsible for the reduction in the detection volumes in the present substrates. First, is the physical confinement of the molecules within the nanospaces between the silver nanoparticles and second is the modification
Figure 4: (A) Schematic of FCS set-up, (B) SEM image of AgNS_VD, (C) intensity time trajectories of ATTO655 on the substrates and (D) autocorrelation plots for 9 µM ATTO655 in open volume and AgNS_VD.
plasmonic. nanostructures has the distinct advantage of making FCS studies feasible at high concentrations without any modification of the conventional optical setup
Figures 4A and B show the schematic of the FCS set-up on silver nanostructured substrates and the SEM image of AgNS_VD, respectively. The intensity-time traces observed due to the diffusion of ATTO655 (50 nM) in the open volume and within the nanospaces on the AgNS_VD
substrates are shown in Figure 4C. Compared to the open volume, fluorescence bursts with very high signal intensities can be observed on AgNS_VD. This occurs because diffusion of the individual ATTO655 molecules in the proximity of silver nanoparticles leads to large fluorescence enhancements due to the fluorophore-plasmon coupling effect. The autocorrelation functions, obtained for the fluorescence intensity fluctuations due to diffusion of the fluorescent probe molecule, ATTO655, show several notable features, particularly an increase in the amplitude and a decrease in the correlation time, on AgNS_VD compared to the open volume. Most interestingly, at 9 µM fluorophore concentration, no time correlation can be observed in the open volume
whereas a distinct correlation is observed on AgNS_VD (Figure 4D). These results suggest that there is a reduction in the effective fluorescence detection volume on the AgNS_VD substrates. From a statistical analysis of several independent measurements at different positions on the AgNS_VD, the effective detection volume is estimated to be reduced by about a factor of 18±10 on the AgNS_VD substrate in comparison to open volume.
We propose that two effects are responsible for the reduction in the detection volumes in the present substrates. First, is the physical confinement of the molecules within the nanospaces between the silver
nanoparticles and second is the modification of the near-fields in the vicinity of the plasmonic nanoparticles. Since the plasmon coupled near-field effect exists within a small region (upto ~200 nm) around the metal nanoparticles, a very small and bright fluorescence volume is created in the immediate vicinity of these particles [4]. This effect also increases the fluorescence count rates and improves the detectability of single diffusing molecules. Despite the fact that the

43
ISrapS Bulletin Vol. 27, Issue Number 1 March 2015
AgNS_VD substrates do not have well-defined and isolated compartments, as obtained by nanofabrication, they provide effective reduction of the fluorescence detection volumes by more than an order of magnitude below the diffraction limit. Moreover, the fluorescence enhancement with the present substrates (∼11-fold) is quite comparable with that of the structures prepared by nanofabrication. This study highlights the simplicity with which plasmonic nanostructures can be incorporated on a standard confocal microscopy set-up to augment its measurement capabilities. Thus, plasmonic AgNS substrates could be a good platform for performing FCS studies and addressing many biological problems that demand observation volumes below the classical diffraction limit.
4. Directional emission with metal-dielectric layered substrates
When a thin metal film is illuminated by light through a medium of high refractive index, such as glass, it is completely reflected except at a specific angle where the light can excite propagating surface plasmon oscillations on the metal/air interface. This angle of minimum reflectivity depends on the wavelength of the incident light and is observed specifically for P-polarized light (i.e. electric field in the plane of incidence) [4]. Light incident on the metal film from the air side is always reflected because it cannot satisfy the wavevector matching conditions required for exciting surface plasmons. Interestingly, however, fluorophores that are present in the vicinity of thin metal films can excite the surface plasmons by near-field interaction. The activated surface-plasmons then radiate into the substrate with their own characteristic properties, determined by the surface-plasmon resonance conditions, which depend on the emission wavelength. Thus, if the minimum reflectivity for light having a certain wavelength, λ, appears at a specific angle (θsp,λ), the coupled emission from a fluorophore having an emission wavelength of λ also appears at the specific angle, θsp,λ. This remarkable phenomenon is called surface-plasmon coupled
emission (SPCE) [4]. SPCE can convert the usual isotropic emission from a fluorophore into directional emission, so that a cone of emission can be observed on the glass side as depicted in Scheme 1C, for metal-dielectric or MD substrates in which fluorophores are present on a dielectric medium on top of a metal film. However, SPCE occurs at angles larger than the critical angle of the glass/air interface, which makes it difficult to collect the coupled emission and is unsuitable for high throughput or array-based applications. It would certainly be more advantageous if we could obtain the fluorescence emission as a single, highly collimated beam normal to the substrate surface. Recently, we have demonstrated that the emission from randomly oriented fluorophores can be converted into narrow emission beaming normal to the surface, with planar meta-dielectric-metal (MDM) substrates [11, 12]. The experimental geometry and polarization directions are depicted in Scheme 2.
Scheme 2: Schematic representation of the experimental set-up, the S- and P-polarization of emitted light and the angular notations for observation of emission with MDM substrates. The MDM substrates can be prepared with simple thermal vapor deposition techniques without the need for top down nanofabrication. The fluorophore is embedded in a dielectric medium sandwiched between two thin metal films. The MDM structures can support both photonic as well as plasmonic modes that can act together under suitable conditions [23]. Depending on the thickness of the dielectric layer, the fluorophore can couple to the various optical modes present in the MDM substrate. The angular emission patterns for the dye, Fluorscein (Fl) in MDM substrates composed of silver with different dielectric (polyvinyl alcohol film, PVA) thickness are shown in Figure 5. The beaming emission for a particular fluorophore is observed at a characteristic dielectric thickness where the emission can couple to the Fabry-Pérot-like modes [24]. Further, depending on the dispersion properties of the optical modes, different emission wavelengths are observed at different angles.
Figure 5: Angular radiation patterns observed for Fluorescein embedded in MDM substrates composed of silver with different thicknesses of the dielectric medium (PVA). We have shown that it is possible to tailor the light matter interactions in a simple and flexible manner by changing the design parameters of the MDM structure. The nature and thicknesses of the metallic or dielectric layer could be varied to suit our requirements and according to the emission range of the fluorophore. The different wavelength dependent optical properties of Au, Ag, and Al, can be used to tune the fluorescence properties of various fluorophores emitting in the NIR, visible, or UV/blue region, respectively [12]. The observation of beaming emission from such simple structures is an interesting result and can have many important applications. For example, the MDM structures can be readily adapted for use in microarray formats. The high spatial control and beaming emission will permit focusing onto an imaging detector with simple and inexpensive optics and will reduce crosstalk between adjacent spots, thus improving data quality (Figure
The MDM substrates can be prepared with simple thermal vapor deposition techniques without the need for top down nanofabrication. The fluorophore is embedded in a dielectric medium sandwiched between two thin metal films. The MDM structures can support both photonic as well as plasmonic modes that can act together under suitable conditions [23]. Depending on the thickness of the dielectric layer, the fluorophore can couple to the various optical modes present in the MDM substrate. The angular emission patterns for the dye,
Scheme 2: Schematic representation of the experimental set-up, the S- and P-polarization of emitted light and the angular notations for observation of emission with MDM substrates.

44
ISrapS Bulletin Vol. 27, Issue Number 1 March 2015
Fluorscein (Fl) in MDM substrates composed of silver with different dielectric (polyvinyl alcohol film, PVA) thickness are shown in Figure 5. The beaming emission for a particular fluorophore is observed at a characteristic dielectric thickness where the emission can couple to the Fabry-Pérot-like modes [24]. Further, depending on the dispersion properties of the optical modes, different emission wavelengths are observed at different angles.
adapted for use in microarray formats. The high spatial control and beaming emission will permit focusing onto an imaging detector with simple and inexpensive optics and will reduce crosstalk between adjacent spots, thus improving data quality (Figure 6A). Furthermore, since the emission from different dyes is observed at different angles, MDM substrates can be used for multicolor directional fluorescence sensing of multiple probes [11].
Scheme 2: Schematic representation of the experimental set-up, the S- and P-polarization of emitted light and the angular notations for observation of emission with MDM substrates. The MDM substrates can be prepared with simple thermal vapor deposition techniques without the need for top down nanofabrication. The fluorophore is embedded in a dielectric medium sandwiched between two thin metal films. The MDM structures can support both photonic as well as plasmonic modes that can act together under suitable conditions [23]. Depending on the thickness of the dielectric layer, the fluorophore can couple to the various optical modes present in the MDM substrate. The angular emission patterns for the dye, Fluorscein (Fl) in MDM substrates composed of silver with different dielectric (polyvinyl alcohol film, PVA) thickness are shown in Figure 5. The beaming emission for a particular fluorophore is observed at a characteristic dielectric thickness where the emission can couple to the Fabry-Pérot-like modes [24]. Further, depending on the dispersion properties of the optical modes, different emission wavelengths are observed at different angles.
Figure 5: Angular radiation patterns observed for Fluorescein embedded in MDM substrates composed of silver with different thicknesses of the dielectric medium (PVA). We have shown that it is possible to tailor the light matter interactions in a simple and flexible manner by changing the design parameters of the MDM structure. The nature and thicknesses of the metallic or dielectric layer could be varied to suit our requirements and according to the emission range of the fluorophore. The different wavelength dependent optical properties of Au, Ag, and Al, can be used to tune the fluorescence properties of various fluorophores emitting in the NIR, visible, or UV/blue region, respectively [12]. The observation of beaming emission from such simple structures is an interesting result and can have many important applications. For example, the MDM structures can be readily adapted for use in microarray formats. The high spatial control and beaming emission will permit focusing onto an imaging detector with simple and inexpensive optics and will reduce crosstalk between adjacent spots, thus improving data quality (Figure
Figure 5: Angular radiation patterns observed for Fluorescein embedded in MDM substrates composed of silver with different thicknesses of the dielectric medium (PVA).
We have shown that it is possible to tailor the light matter interactions in a simple and flexible manner by changing the design parameters of the MDM structure. The nature and thicknesses of the metallic or dielectric layer could be varied to suit our requirements and according to the emission range of the fluorophore. The different wavelength dependent optical properties of Au, Ag, and Al, can be used to tune the fluorescence properties of various fluorophores emitting in the NIR, visible, or UV/blue region, respectively [12]. The observation of beaming emission from such simple structures is an interesting result and can have many important applications. For example, the MDM structures can be readily
6A). Furthermore, since the emission from different dyes is observed at different angles, MDM substrates can be used for multicolor directional fluorescence sensing of multiple probes [11].
Figure 6: Representation of the use of MDM substrates for (A) microarrays and (B) biosensing applications. One limitation of the MDM substrates is that the fluorophores are embedded within the dielectric between the metal layers and are not amenable for dynamic studies or binding interactions. For bioanalytical applications it is important to be able to access the analyte surface so that chemistry can be performed. Recently, there have been studies of energy transfer across a metal film mediated by surface Plasmon polaritons (SPPs) in which the coupling of donor emission to the surface plasmon modes of the first metal dielectric interface is followed by cross coupling of the SPPs on opposite sides of the metal film and energy transfer to the acceptor molecules on the second metal-dielectric interface [25]. These concepts can be utilized in the present MDM substrates for bioassays or bioanalytical applications (Figure 6B). The top metal layer can be decorated with biomarkers capable of attaching to specific fluorescence donor labeled biomolecules. The dielectric layer between the metals can contain the fluorescence acceptor. Under suitable binding conditions, SPP-ET will
lead to the observation of directional emission from the embedded acceptor molecules. This configuration will thus allow molecule-specific bio-sensing, with the advantage of a high degree of spatial control over the fluorescence emission. We have demonstrated the feasibility of this concept using a standard fluorescence donor-acceptor pair in MDM substrates of silver [12]. 5. Obtaining polarized emission from lanthanide ions with metal-dielectric substrates Lanthanide ions possess unique optical properties that have led to development of novel luminescent probes, tags and smart photonic materials. Unlike organic fluorophores, the emission from lanthanide ions results from high-spin to high-spin transitions involving multiple transition dipole moments. The combination of the many energetically degenerate transitions, often leads to unpolarized emission from the lanthanides [26]. The intrinsically unpolarized luminescence of lanthanides is useful in resonance energy transfer studies to measure conformations of biomolecules without concern for the orientation dependence. However, polarized emission from lanthanides could be valuable for many other applications such as, measuring rotational motions in the millisecond time scale or improving the performance of optical displays and polarized LEDs. Controllable, polarized emission is important for future emissive devices, and lanthanide based materials are expected to be especially significant because of their unique optical characteristics. Most of the earlier efforts to obtain polarized emission from lanthanides are based on specially synthesised, oriented molecular systems [27,
Figure 6: Representation of the use of MDM substrates for (A) microarrays and (B) biosensing applications.
One limitation of the MDM substrates is that the fluorophores are embedded within the dielectric between the metal layers and are not amenable for dynamic studies or binding interactions. For bioanalytical applications it is important to be able to access the analyte surface so that chemistry can be performed. Recently, there have been studies of energy transfer across a metal film mediated by surface plasmon polaritons (SPPs) in which the coupling of donor emission to the surface plasmon modes of the first metal−dielectric interface is followed by cross coupling of the SPPs on opposite sides of the metal film and energy transfer to the acceptor molecules on the second metal-dielectric interface [25]. These concepts can be utilized in the present MDM substrates for bioassays or bioanalytical applications (Figure 6B). The top metal layer can be decorated with biomarkers capable of attaching to specific fluorescence donor labeled biomolecules. The dielectric layer between the metals can contain the fluorescence acceptor. Under suitable binding conditions, SPP-ET will lead to the observation of directional emission from the embedded acceptor molecules. This
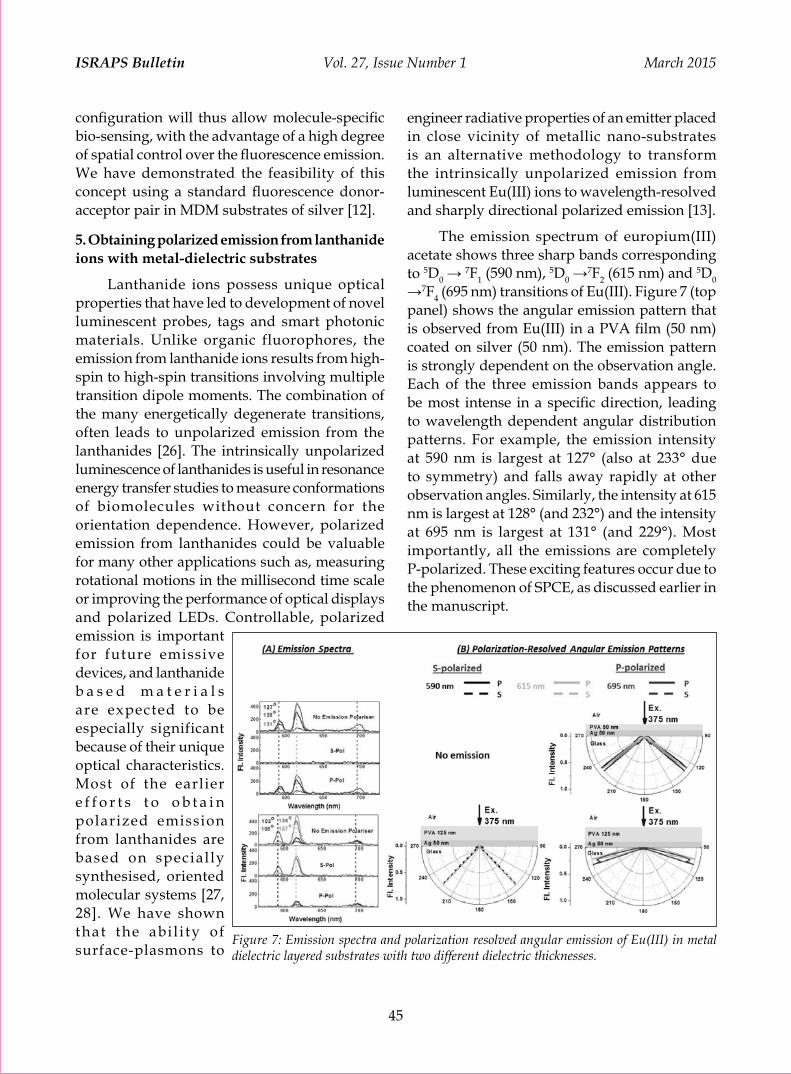
45
ISrapS Bulletin Vol. 27, Issue Number 1 March 2015
configuration will thus allow molecule-specific bio-sensing, with the advantage of a high degree of spatial control over the fluorescence emission. We have demonstrated the feasibility of this concept using a standard fluorescence donor-acceptor pair in MDM substrates of silver [12].
5. Obtaining polarized emission from lanthanide ions with metal-dielectric substrates
Lanthanide ions possess unique optical properties that have led to development of novel luminescent probes, tags and smart photonic materials. Unlike organic fluorophores, the emission from lanthanide ions results from high-spin to high-spin transitions involving multiple transition dipole moments. The combination of the many energetically degenerate transitions, often leads to unpolarized emission from the lanthanides [26]. The intrinsically unpolarized luminescence of lanthanides is useful in resonance energy transfer studies to measure conformations of biomolecules without concern for the orientation dependence. However, polarized emission from lanthanides could be valuable for many other applications such as, measuring rotational motions in the millisecond time scale or improving the performance of optical displays and polarized LEDs. Controllable, polarized emission is important for future emissive devices, and lanthanide b a s e d m a t e r i a l s are expected to be especially significant because of their unique optical characteristics. Most of the earlier e f f o r t s t o o b t a i n polarized emission from lanthanides are based on special ly synthesised, oriented molecular systems [27, 28]. We have shown that the abi l i ty of surface-plasmons to
engineer radiative properties of an emitter placed in close vicinity of metallic nano-substrates is an alternative methodology to transform the intrinsically unpolarized emission from luminescent Eu(III) ions to wavelength-resolved and sharply directional polarized emission [13].
The emission spectrum of europium(III) acetate shows three sharp bands corresponding to 5D0 → 7F1 (590 nm), 5D0 →7F2 (615 nm) and 5D0 →7F4 (695 nm) transitions of Eu(III). Figure 7 (top panel) shows the angular emission pattern that is observed from Eu(III) in a PVA film (50 nm) coated on silver (50 nm). The emission pattern is strongly dependent on the observation angle. Each of the three emission bands appears to be most intense in a specific direction, leading to wavelength dependent angular distribution patterns. For example, the emission intensity at 590 nm is largest at 127° (also at 233° due to symmetry) and falls away rapidly at other observation angles. Similarly, the intensity at 615 nm is largest at 128° (and 232°) and the intensity at 695 nm is largest at 131° (and 229°). Most importantly, all the emissions are completely P-polarized. These exciting features occur due to the phenomenon of SPCE, as discussed earlier in the manuscript.
28]. We have shown that the ability of surface-plasmons to engineer radiative properties of an emitter placed in close vicinity of metallic nano-substrates is an alternative methodology to transform the intrinsically unpolarized emission from luminescent Eu(III) ions to wavelength-resolved and sharply directional polarized emission [13]. The emission spectrum of europium(III) acetate shows three sharp bands corresponding to 5D0 7F1 (590 nm), 5D0
7F2 (615 nm) and 5D0 7F4 (695 nm) transitions of Eu(III). Figure 7 (top panel) shows the angular emission pattern that is observed from Eu(III) in a PVA film (50 nm) coated on silver (50 nm). The emission pattern is strongly dependent on the
observation angle. Each of the three emission bands appears to be most intense in a specific direction, leading to wavelength dependent angular distribution patterns. For example, the emission intensity at 590 nm is largest at 127° (also at 233° due to symmetry) and falls away rapidly at other observation angles. Similarly, the intensity at 615 nm is largest at 128° (and 232°) and the intensity at 695 nm is largest at 131° (and 229°). Most importantly, all the emissions are completely P-polarized. These exciting features occur due to the phenomenon of SPCE, as discussed earlier in the manuscript.
Figure 7: Emission spectra and polarization resolved angular emission of Eu(III) in metal dielectric layered substrates with two different dielectric thicknesses. When the thickness of the dielectric layer above the metal film increases, the metal-dielectric substrates can support multiple photonic modes in the dielectric layer, in addition to the existing surface-plasmon mode [29]. Considering that the unpolarized lanthanide luminescence can be converted to completely P-polarized luminescence by
the surface-plasmons in a simple metal-dielectric substrate, we investigated the possibility of selective and independent polarization tuning of the three bands of Eu(III) by coupling with multiple modes present in Ag-PVA substrates with thicker PVA layers. It is seen that when the PVA thickness is increased from 50 nm to ~95
Figure 7: Emission spectra and polarization resolved angular emission of Eu(III) in metal dielectric layered substrates with two different dielectric thicknesses.

46
ISrapS Bulletin Vol. 27, Issue Number 1 March 2015
When the thickness of the dielectric layer above the metal film increases, the metal-dielectric substrates can support multiple photonic modes in the dielectric layer, in addition to the existing surface-plasmon mode [29]. Considering that the unpolarized lanthanide luminescence can be converted to completely P-polarized luminescence by the surface-plasmons in a simple metal-dielectric substrate, we investigated the possibility of selective and independent polarization tuning of the three bands of Eu(III) by coupling with multiple modes present in Ag-PVA substrates with thicker PVA layers. It is seen that when the PVA thickness is increased from 50 nm to ~95 nm, the emissions at all three wavelengths are completely P-polarized, as in the case of the Ag-PVA substrate with 50 nm PVA layer. With further increase in the PVA thickness (~125 nm), the polarization property of Eu(III) emission turns out to be quite intriguing (Figure 7, lower panel). Each of the emission bands carries distinctive polarization characteristics, depending on the wavelength. More specifically, the 590 nm emission band is completely S-polarized and is observed to have the largest intensity at an angle of 136° (and 224°). The emission band at 695 nm is completely P-polarized and has the largest intensity at an angle of 108° (and 252°). On the other hand, the emission band at 615 nm has both S- and P-polarized components that appear at different observation angles. At higher PVA thickness (~300 nm), all three emission bands of Eu(III) exhibit polarized emission, having both S- and P-polarized components, that appear in different directions. Essentially, the emission from Eu(III) senses the electromagnetic modes present in the respective metal-dielectric substrate, and gets modified by the characteristics of these modes. The ultimate outcome of the near-field coupling with various electromagnetic modes present in Ag-PVA substrates, is the creation of selective, polarized and directional emission for each band of Eu(III). This approach of plasmonic polarization tailoring has several advantages: it is very general and will be applicable for any luminescent lanthanide and the substrates can
be fabricated easily. Moreover, these substrates can be adapted for use in device formats and the substrate dimensions can be readily tuned to obtain desired emissive structures.
6. Conclusions
The use of plasmonic nanostructures adds a new dimension to fluorescence spectroscopy. Instead of considering only the propagating radiation, it is possible to utilize the near-fields created by metals and excited fluorophores. While there are many complexities to fluorophore–metal interactions there are also many opportunities. Plasmonics allows us to control the processes of excitation and emission to a significant extent. In our recent studies, we have demonstrated that Ag-Au-NC substrates provide increased emission intensities and better photostabilities for improved fluorescence detection. Simple silver nanostructures can increase the upper concentration limit of FCS measurements. Additionally, we are able to control the spatial distribution of fluorescence, not with macroscopic optics, but with nearby metallic nanostructures. We have obtained beaming emission at directions normal to the surface using MDM substrates. We have also shown that coupling with plasmonic and photonic modes can lead to wavelength-resolved and sharply directional polarized emission from lanthanide ions in metal-dielectric layered substrates. Overall, our studies suggest that plasmonics has the potential for advancement of fluorescence technology and can result in new classes of experimental procedures, novel probes, bioassays and devices.
Acknowledgements
I thank Professor J. R. Lakowicz for introducing me to the interesting field of plasmon-controlled fluorescence, and also acknowledge all the co-authors of our published papers cited in the references. I am thankful to Dr. D. K. Palit, Head, RPCD, Dr. B. N. Jagatap, Director, Chemistry Group, BARC, and members of RPCD, BARC, for their encouragement and support. Financial support from Indo-US Science

47
ISrapS Bulletin Vol. 27, Issue Number 1 March 2015
and Technology Forum and SERB Women Excellence Award Grant, SB/WEA-010/2013, is gratefully acknowledged.
6. References1. J. R. Lakowicz, Principles of Fluorescence Spectroscopy,
Springer, New York, 3rd edn, 2006.2. Schuller, J. A.; Barnard, E. S.; Cai, W.; Jun, Y. C.; White, J.
S.; Brongersma, M. L. Nat. Mater. 2010, 9, 193.3. Jun, Y. C.; Huang, K. C. Y.; Brongersma, M. L. Nat. Commun.
2011, 283, 1.4. Lakowicz, J. R.; Ray, K.; Chowdhury, M.; Szmacinski, H.;
Fu, Y.; Zhang, J.; Nowaczyk, K. Analyst 2008, 133, 1308.5. Shiv Shankar, S.; Rizzello, L.; Cingolani, R.; Rinaldi, R.;
Pompa, P. P. ACS Nano 2009, 3, 893.6. Curto, A. G.; Volpe, G.; Taminiau, T. H.; Kreuzer, M. P.;
Quidant, R.; Hulst, N. F. v. Science 2010, 329, 930.7. Aouani, H.; Mahboub, O.; Devaux, E.; Rigneault, H.;
Ebbesen, T. W.; Wenger, J. Nano Lett. 2011, 11, 2400.8. Xie, T.-T.; Liu, Q.; Cai, W.-P.; Chen, Z.; Li, Y.-Q. Chem.
Commun. 2009, 3190.9. Dutta Choudhury, S., Badugu, R.; Ray, K.; Lakowicz, J. R.
J. Phys. Chem. C 2012, 116, 5042.10. Dutta Choudhury, S., Ray, K.; Lakowicz, J. R. J. Phys. Chem.
Lett. 2012, 3, 2915.11. Dutta Choudhury, S.; Badugu, R.; Nowaczyk, K.; Ray, K.;
Lakowicz, J. R. J. Phys. Chem. Lett. 2013, 4, 227.12. Dutta Choudhury, S.; Badugu, R.; Ray, K.; Lakowicz, J. R. J.
Phys. Chem. C 2013, 117, 15798.13. Dutta Choudhury, S.; Badugu, R.; Ray, K.; Lakowicz, J. R.
Chem. Comm. 2014, 50, 9010.14. Lakowicz, J. R.,;Shena, Y.; D’Auria, S.; Malicka, J.; Fang,
J.; Gryczynski, Z.; Gryczynski, I. Anal. Biochem. 2002, 261, 301.
15. Szmacinski, H;, Badugu, R.; Lakowicz, J. R., J. Phys. Chem. C 2010, 114, 21142.
16. Fu, C.; Ossato, G.; Long, M.; Digman, M. A.; Gopinathan, A.; Lee, L. P.; Gratton, E.; Khine, M. Appl. Phys. Lett. 2010, 97, 20310.
17. Sun, Y.; Xia, Y. J. Am. Chem. Soc. 2004, 126, 3892.18. Ray, K.; Badugu, R.; Lakowicz, J. R. J. Am. Chem. Soc. 2006,
128, 8998.19. Hess, S. T.; Huang, S.; Heikal, A. A.; Webb, W. W.
Biochemistry 2002, 41, 697.20. Levene, M. J.; Korlach, J.; Turner, S. W.; Foquet, M.;
Craighead, H. G.; Webb, W. W. Science 2003, 299, 682.21. Kastrup, L.; Blom, H.; Eggeling, C.; Hell, S. W. Phys. Rev.
Lett. 2005, 94, 178101.22. Lu, G.; Li, W.; Zhang, T.; Yue, S.; Liu, J.; Hou, L.; Li, Z.;
Gong, Q. ACS Nano 2012, 6, 1438.23. Villa, F.; Lopez-Rios, T.; Regalado, L. E. Phys. Rev. B 2001,
63, 165103.24. Becker, H.; Burns, S. E.; Tessler, N.; Friend, R. H. J. Appl.
Phys. 1997, 81, 2825.25. Andrew, P.; Barnes, W. L. Science 2004, 306, 1002.26. Reifenberger, J. G.; Snyder, G. E.; Baym, G.; Selvin, P. R. J.
Phys. Chem. B 2003, 107, 12862.27. Galyametdinov, Y. G.; Knyazev, A. A.; Dzhabarov, V. I.;
Cardinaels, T.; Driesen, K.; Görller-Walrand, C.; Binnemans, K. Adv. Mater. 2008, 20, 252.
28. Driesen, K.; Vaes, C.; Cardinaels, T.; Goossens, K.; Görller-Walrand, C.; Binnemans, K. J. Phys. Chem. B 2009, 113, 10575.
29. Gryczynski, I.; Malicka, J.; Nowaczyk, K.; Gryczynski, Z.; Lakowicz, J. R. J. Phys. Chem. B 2004, 108, 12073.
Dr. Sharmistha Dutta Choudhury obtained her M. Sc. degree in Chemistry, with gold medal from Jadavpur University, Kolkata in 2000. After her Ph. D. at Saha Institute of Nuclear Physics, Kolkata, she joined BARC in 2006. She carried out her postdoctoral research at the University of Maryland, Baltimore, US, under the Indo-US Science and Technology Fellowship scheme. Her current research interests include the study of photophysical processes in supramolecular systems and interactions of fluorophores with plasmonic/photonic structures. She is the recipient of the NASI Young Scientist Award in Chemical Sciences, the DAE Young Scientist Award and the INSA Medal for Young Scientist.

48
ISrapS Bulletin Vol. 27, Issue Number 1 March 2015
Solid and Hollow Carbon Nanoparticles: Prospects in Molecular Dynamics
Somen Mondal and Pradipta Purkayastha*Department of Chemical Sciences, Indian Institute of Science
Education and Research (IISER) Kolkata, Mohanpur 741246, INDIAE-mail: [email protected]
1. Introduction
Surface passivation by suitable organic or biomolecules imparts strong non-blinking fluorescence in carbon nanoparticles (CNPs) [1-5]. CNPs are essentially non-toxic and thus can be extensively used as high performance fluorescence markers in biological systems [6–8]. Non-cytotoxicity of the CNPs has proven them to be excellent alternatives to the considerably
AbstractThe article is aimed to provide an overview on the influence of solid and hollow carbon nanoparticles (CNPs) on molecular dynamics. The CNPs have inherent fluorescence that helps to use them in charge and electron transfer to and from a suitable molecule. CNPs can be synthesized very easily from different sources that yields evenly sized nanoparticles with different fluorescence quantum yields. Properties of CNPs also depend on the nature of protecting group used for its stabilization. Hence, the source and coating agents can be varied to impose different ways to use the CNPs. In this article, we would provide a few applications where surfactant bilayer protected core–shell type CNPs control photoinduced electron transfer (PET), dopamine functionalized CNPs act as efficient photoinduced electron donor–acceptor systems depending on the pH of the medium and hollow fluorescent CNPs (HFCNs) as molecular hosts.
more toxic semiconductor quantum dots (QDs) [9,10]. Many different methods of synthesis of fluorescent CNPs are reported [11–14]. The CNPs obtained generally have uniform size distribution (Fig. 1).
2. Surfactant protected CNPs
Surfactants are frequently used to disperse carbon nanotubes and keep them separated [16]. Likewise, core–shell type nanoparticles with a surfactant assembly forming the shell are also known [17,18]. Surfactants accumulate around the CNPs in the form of a bilayer [19]. Formation of the surfactant bilayer around CNPs can provide stability to the system so as to keep the entities homogeneously distributed in the medium. Moreover, the width of the surfactant bilayer can be spectroscopically measured using Förster resonance energy transfer (FRET) [15].
Formation of surfactant bilayer around CNPs can provide stability to the system so as to keep the entities homogeneously distributed in the medium. The negatively charged CNPs can be protected by cationic surfactants. It is observed that upon formation of the core–shell entity, the Figure 1. High resolution TEM micrograph of CNPs [15].
Solid and Hollow Carbon Nanoparticles: Prospects in Molecular Dynamics
Somen Mondal and Pradipta Purkayastha*
Department of Chemical Sciences, Indian Institute of Science Education and Research
(IISER) Kolkata, Mohanpur 741246, INDIA
E-mail: [email protected]
Abstract
The article is aimed to provide an overview on the influence of solid and hollow carbon
nanoparticles (CNPs) on molecular dynamics. The CNPs have inherent fluorescence that
helps to use them in charge and electron transfer to and from a suitable molecule. CNPs can
be synthesized very easily from different sources that yields evenly sized nanoparticles with
different fluorescence quantum yields. Properties of CNPs also depend on the nature of
protecting group used for its stabilization. Hence, the source and coating agents can be varied
to impose different ways to use the CNPs. In this article, we would provide a few applications
where surfactant bilayer protected core–shell type CNPs control photoinduced electron
transfer (PET), dopamine functionalized CNPs act as efficient photoinduced electron donor–
acceptor systems depending on the pH of the medium and hollow fluorescent CNPs (HFCNs)
as molecular hosts.
1. Introduction
Surface passivation by suitable organic or biomolecules imparts strong non-blinking fluorescence in carbon nanoparticles (CNPs) [1-5]. CNPs are essentially non-toxic and thus can be extensively used as high performance fluorescence markers in biological systems [6–8]. Non-cytotoxicity of the CNPs has proven them to be excellent alternatives to the considerably more toxic semiconductor quantum dots (QDs) [9,10]. Many different methods of synthesis of fluorescent CNPs are reported [11–14]. The CNPs obtained generally have uniform size distribution (Fig. 1).
Figure 1. High resolution TEM micrograph of CNPs [15].
2. Surfactant protected CNPs
Article 6- Purkayastha

49
ISrapS Bulletin Vol. 27, Issue Number 1 March 2015
fluorescence quantum yield of the CNPs increases to ~22% (15). The formation of surfactant bilayer around the CNPs can be confirmed by monitoring the change in zeta potential of the CNPs with increase in surfactant concentration. The final positive value of zeta potential indicates that the surface of the composite has the cationic head groups of the surfactant facing towards the bulk. Mondal et al. chose phenosafranine (PSF), a cationic dye, and fluorescein (FL), an anionic dye, (Scheme 1) as model markers for characterising the surfactant bilayer.
PSF readily interacts with the negative surface of CNPs due to electrostatic interaction, whereas the anionic dye, FL, cannot approach the CNPs due to repulsion. The surfactant bilayer coated species become positively charged and thus allow FL to readily interact with it. The negatively charged dye is supposed to stay on the surface of the coated CNPs due to repulsion from the CNP core and attraction of the surfactant bilayer. Since the surface of bare CNP gets partially coated with the cationic head groups of the surfactant during the shell formation, interaction of CNP with cationic PSF will get reduced. The PSF molecules would be pushed back and the strategic location of the dye may be somewhere at the central domain of the surfactant double layer (since the surface of the coated CNP is also positively charged). Both the dyes form excellent FRET pairs with the fluorescent CNPs. CNPs have excellent energy donating and accepting properties [20]. A strong green fluorescence is observed from the CNPs in aqueous solution at pH 7 with a
Surfactants are frequently used to disperse carbon nanotubes and keep them separated [16]. Likewise, core–shell type nanoparticles with a surfactant assembly forming the shell are also known [17,18]. Surfactants accumulate around the CNPs in the form of a bilayer [19]. Formation of the surfactant bilayer around CNPs can provide stability to the system so as to keep the entities homogeneously distributed in the medium. Moreover, the width of the surfactant bilayer can be spectroscopically measured using Förster resonance energy transfer (FRET) [15].
Formation of surfactant bilayer around CNPs can provide stability to the system so as to keep the entities homogeneously distributed in the medium. The negatively charged CNPs can be protected by cationic surfactants. It is observed that upon formation of the core–shell entity, the fluorescence quantum yield of the CNPs increases to ~22% (15). The formation of surfactant bilayer around the CNPs can be confirmed by monitoring the change in zeta potential of the CNPs with increase in surfactant concentration. The final positive value of zeta potential indicates that the surface of the composite has the cationic head groups of the surfactant facing towards the bulk. Mondal et al. chose phenosafranine (PSF), a cationic dye, and fluorescein (FL), an anionic dye, (Scheme 1) as model markers for characterising the surfactant bilayer.
Scheme 1. Structures of (A) phenosafranine (PSF) and (B) sodium salt of fluorescein (FL).
PSF readily interacts with the negative surface of CNPs due to electrostatic interaction, whereas the anionic dye, FL, cannot approach the CNPs due to repulsion. The surfactant bilayer coated species become positively charged and thus allow FL to readily interact with it. The negatively charged dye is supposed to stay on the surface of the coated CNPs due to repulsion from the CNP core and attraction of the surfactant bilayer. Since the surface of bare CNP gets partially coated with the cationic head groups of the surfactant during the shell formation, interaction of CNP with cationic PSF will get reduced. The PSF molecules would be pushed back and the strategic location of the dye may be somewhere at the central domain of the surfactant double layer (since the surface of the coated CNP is also positively charged). Both the dyes form excellent FRET pairs with the fluorescent CNPs. CNPs have excellent energy donating and accepting properties [20]. A strong green fluorescence is observed from the CNPs in aqueous solution at pH 7 with a maximum at 506 nm independent of the excitation wavelength between 350 and 430 nm. The invariance in the emission peak position with varying excitation wavelengths reflects relatively uniform size distribution of the synthesised CNPs. The absorption spectrum of CNP exhibits a broad shoulder at 255 nm without noticeable structural features and a weak band at 400 nm. Upon formation of the surfactant bilayer around the CNPs the emission maximum shifts to 496 nm due to the development of a relatively less polar surrounding environment.
Scheme 1. Structures of (A) phenosafranine (PSF) and (B) sodium salt of fluorescein (FL).
Figure 2. Fluorescence spectra of different donor–acceptor conjugates: (A) bare CNP and PSF, (B) CTAB–CNP and PSF, (C) bare CNP and FL and (D) CTAB–CNP and FL. The acceptor concentration has been gradually increased at a fixed donor concentration. The CNPs have been excited at 400 nm. The final concentration of CNP was maintained at 0.45 mg mL-1, while the concentration of PSF was varied from 0 to 19 M and that for FL from 0 to 3.4 mM.
Considering the emission from the CNPs when excited at 400 nm, three FRET pairs can be designed with the CNPs as donors and PSF and FL as acceptors. Fig. 2 shows the changes in the emission spectra of the different FRET pairs. Decrease in emission from the CNPs and enhancement in acceptor emissions indicate the occurrence of FRET in the conjugates. It was mentioned previously that the CNPs have negative surface charge. Thus, PSF finds ready access to the bare CNPs to show efficient FRET (Fig. 2A). However, upon formation of the CTAB bilayer surrounding the CNPs, the extent of FRET between CNPs and PSF decreases (Fig. 2B). FL does not show any sign of FRET with bare negatively charged CNPs (Fig. 2C), whereas it participates in the process when CNP is coated with CTAB bilayer (Fig. 2D) that imparts positive charge on the surface of the
CNPs. Time-resolved fluorescence decay profiles confirm the occurrence of FRET. Two-component exponential decay profile for the CNPs without addition of the acceptor molecules is obtained monitoring the emission maxima of the acceptors. Upon addition of the acceptors, an ultrafast growth component is observed under all the circumstances. Fig. 3 shows the generation of the growth component for FL in CNP–CTAB solution as a representative for the other cases.
Figure 2. Fluorescence spectra of different donor–acceptor conjugates: (A) bare CNP and PSF, (B) CTAB–CNP and PSF, (C) bare CNP and FL and (D) CTAB–CNP and FL. The acceptor concentration has been gradually increased at a fixed donor concentration. The CNPs have been excited at 400 nm. The final concentration of CNP was maintained at 0.45 mg mL-1, while the concentration of PSF was varied from 0 to 19 µM and that for FL from 0 to 3.4 mM
maximum at 506 nm independent of the excitation wavelength between 350 and 430 nm. The invariance in the emission peak position with varying excitation wavelengths reflects relatively uniform size distribution of the synthesised CNPs. The absorption spectrum of CNP exhibits a broad shoulder at 255 nm without noticeable structural features and a weak band at 400 nm. Upon formation of the surfactant bilayer around the CNPs the emission maximum shifts to 496 nm due to the development of a relatively less polar surrounding environment.
Considering the emission from the CNPs when excited at 400 nm, three FRET pairs can be designed with the CNPs as donors and PSF and FL as acceptors. Fig. 2 shows the changes in the emission spectra of the different FRET pairs. Decrease in emission from the CNPs and enhancement

50
ISrapS Bulletin Vol. 27, Issue Number 1 March 2015
in acceptor emissions indicate the occurrence of FRET in the conjugates. It was mentioned previously that the CNPs have negative surface charge. Thus, PSF finds ready access to the bare CNPs to show efficient FRET (Fig. 2A). However, upon formation of the CTAB bilayer surrounding the CNPs, the extent of FRET between CNPs and PSF decreases (Fig. 2B). FL does not show any sign of FRET with bare negatively charged CNPs (Fig. 2C), whereas it participates in the process when CNP is coated with CTAB bilayer (Fig. 2D) that imparts positive charge on the surface of the CNPs. Time-resolved fluorescence decay profiles confirm the occurrence of FRET. Two-component exponential decay profile for the CNPs without addition of the acceptor molecules is obtained monitoring the emission maxima of the acceptors. Upon addition of the acceptors, an ultrafast growth component is observed under all the circumstances. Fig. 3 shows the generation of the growth component for FL in CNP–CTAB solution as a representative for the other cases.
the CNP–CTAB–PSF and CNP–CTAB–FL pairs are 8.9 and 10.5 nm, respectively. Due to the formation of the CTAB double layer around the CNPs, the PSF molecules would prefer to occupy the middle zone of the bilayer. The positively charged heads of CTAB would prevent the positively charged PSF from approaching the CNP surface as well as the interface with the bulk environment. Since the negative charge density on the CNPs is supposed to be greater than the positive surface charge developed by the CTAB heads toward the bulk, PSF molecules would prefer to approach the CNP surface during development of the bilayer. In the process the dye molecules get trapped in the central region of the bilayer as per the mechanism discussed above. Hence, the calculated distance of PSF from the CNP surface was found to be ~1.6 nm. On the other hand, the negatively charged FL molecules would be attracted by the positively charged surface of the CTAB bilayer coated CNPs and undergo FRET with the core–shell CNPs. The calculated distance of the FL molecules at the surface of the composite provides information about the thickness of the surfactant bilayer. Calculations show that the bilayer is ~3.2 nm thick (Scheme 2).
Figure 3. Time-resolved fluorescence data for CNP–CTAB and CNP–CTAB conjugate and FL. The donor was excited at 405 nm and the emission was monitored at 515 nm.
Figure 3. Time-resolved fluorescence data for CNP–CTAB and CNP–CTAB conjugate and FL. The donor was excited at 405 nm and the emission was monitored at 515 nm.
The distance between bare CNP and PSF is calculated to be about 7.3 nm, which apparently provides the radius of the bare CNPs. The diameter of the CNPs (~12–13 nm) agrees well with the TEM measurements (Fig. 1). The corresponding donor–acceptor distances (r) for the CNP–CTAB–PSF and CNP–CTAB–FL pairs are 8.9 and 10.5 nm, respectively. Due to the formation of the CTAB double layer around the CNPs, the PSF molecules would prefer to occupy the middle zone of the bilayer. The positively charged heads of CTAB would prevent the positively charged PSF from approaching the CNP surface as well as the interface with the bulk environment. Since the negative charge density on the CNPs is supposed to be greater than the positive surface charge developed by the CTAB heads toward the bulk, PSF molecules would prefer to approach the CNP surface during development of the bilayer. In the process the dye molecules get trapped in the central region of the bilayer as per the mechanism discussed above. Hence, the calculated distance of PSF from the CNP surface was found to be ~1.6 nm.
On the other hand, the negatively charged FL molecules would be attracted by the positively charged surface of the CTAB bilayer coated CNPs and undergo FRET with the core–shell CNPs. The calculated distance of the FL molecules at the surface of the composite provides information about the thickness of the surfactant bilayer. Calculations show that the bilayer is ~3.2 nm thick (Scheme 2).
Scheme 2. The calculated distances between the donor (CNP) and the acceptors (PSF and FL). The yellow and cyan zones indicate the central and the total thickness of the surfactant bilayer, respectively.
CNPs coated with bilayers of cationic surfactants, namely, cetyltrimethyl ammoniumbromide (CTAB), tetradecyl trimethylammoniumbromide (TTAB) and dodecyltrimethylammoniumbromide (DTAB), can be used in controlling photoinduced electron transfer (PET) between an electron donor and the core of the CNP aggregate. PET is an important phenomenon in many chemical and biological processes [21–23]. Occurrence of PET from a typical electron donor, dimethylaniline (DMA), to and from carbon dots has been studied in homogeneous and heterogeneous media. Absorbance of CNPs increases with addition of surfactants.
The distance between bare CNP and PSF is calculated to be about 7.3 nm, which apparently provides the radius of the bare CNPs. The diameter of the CNPs (~12–13 nm) agrees well with the TEM measurements (Fig. 1). The corresponding donor–acceptor distances (r) for
Scheme 2. The calculated distances between the donor (CNP) and the acceptors (PSF and FL). The yellow and cyan zones indicate the central and the total thickness of the surfactant bilayer, respectively.

51
ISrapS Bulletin Vol. 27, Issue Number 1 March 2015
CNPs coated with bilayers of cationic sur-factants, namely, cetyltrimethyl ammoniumbro-mide (CTAB), tetradecyl trimethylammonium-bromide (TTAB) and dodecyltrimethylammoni-umbromide (DTAB), can be used in controlling photoinduced electron transfer (PET) between an electron donor and the core of the CNP ag-gregate. PET is an important phenomenon in many chemical and biological processes [21–23]. Occurrence of PET from a typical electron donor, dimethylaniline (DMA), to and from carbon dots has been studied in homogeneous and hetero-geneous media. Absorbance of CNPs increases with addition of surfactants. Fluorescence from CNPs intensifies with increase in concentration of the surfactants along with a hypsochromic shift. DMA quenches fluorescence of the surfactant coated CNPs to different degrees depending on the nature of the coating. DMA is known to be a good electron donor and preferably resides at the micelle–water interface [21]. The extent of fluorescence quenching is determined by plotting the relative change in fluorescence intensity (I0/I, where I0 and I denote the fluorescence intensities, respectively, of CNP in absence and presence of quencher) against quencher concentrations (Fig. 4).
DMA resides on the outer surface of the core–shell CNP assembly. The non-linearity of the
fluorescence quenching plots indicates presence of some DMA molecules around the CNPs that are inaccessible to the electron acceptor. Fluorescence quenching is maximum in case of CTAB bilayer and minimum for DTAB. It is also known that solvent reorganization energy increases with decrease in surfactant chain length that affects PET between the donor and the acceptor [24]. Hence, CNP–surfactant system can not only control PET from a donor residing at the surface of the surfactant shell but also can tune the process by changing the hydrophobic chain length.
3. Dopamine functionalized carbon nanoparticles
In a recent report, Medintz et al. showed that fluorescent quantum dots (QD)–dopamine bioconjugates can function as redox coupled assemblies for in vitro and intracellular pH sensing [25]. Researchers have used peptides to aid in the self-assembly of dopamine–hydroquinone onto QDs and demonstrated that quenching of fluorescence takes place due to pH-dependent electron-transfer from QDs to oxidized dopamine–quinone. Keeping these views in mind and also considering the cytotoxicity of QDs, environmentally benign CNPs can be used to replace QDs in controlling electron transfer processes. It is well-known that CNPs can act as electron donors as well as acceptors, as the case may be in the excited state through a photoinduced electron transfer (PET) mechanism [6]. Water-soluble CNPs with -COOH functionalities can readily combine with dopamine in the presence of N-(3-Dimethylaminopropyl)-N′-ethyl carbodiimide hydrochloride (EDC.HCl) and Sulfo-NHS. The CNP–dopamine (CNP–DOP) conjugate undergoes an enhanced pH dependent photoluminescence (PL) quenching compared to the original CNPs. Fig. 5C and D show changes in the PL spectra of the CNPs over the pH range 3.4–10.4. The pH-dependent PL quenching takes place due to electron transfer (ET) from CNPs to the oxidized dopamine where dopamine–quinone functions as an electron acceptor [26,27].
Figure 4. Relative quenching of CNP fluorescence by DMA in the presence of different surfactant coatings around the CNPs in aqueous medium.
Fluorescence from CNPs intensifies with increase in concentration of the surfactants along with a hypsochromic shift. DMA quenches fluorescence of the surfactant coated CNPs to different degrees depending on the nature of the coating. DMA is known to be a good electron donor and preferably resides at the micelle–water interface [21]. The extent of fluorescence quenching is determined by plotting the relative change in fluorescence intensity (I0/I, where I0 and I denote the fluorescence intensities, respectively, of CNP in absence and presence of quencher) against quencher concentrations (Fig. 4).
Figure 4. Relative quenching of CNP fluorescence by DMA in the presence of different surfactant coatings around the CNPs in aqueous medium.
DMA resides on the outer surface of the core–shell CNP assembly. The non-linearity of the fluorescence quenching plots indicates presence of some DMA molecules around the CNPs that are inaccessible to the electron acceptor. Fluorescence quenching is maximum in case of CTAB bilayer and minimum for DTAB. It is also known that solvent reorganization energy increases with decrease in surfactant chain length that affects PET between the donor and the acceptor [24]. Hence, CNP–surfactant
system can not only control PET from a donor residing at the surface of the surfactant shell but also can tune the process by changing the hydrophobic chain length.
3. Dopamine functionalized carbon nanoparticles
In a recent report, Medintz et al. showed that fluorescent quantum dots (QD)–dopamine bioconjugates can function as redox coupled assemblies for in vitro and intracellular pH sensing [25]. Researchers have used peptides to aid in the self-assembly of dopamine–hydroquinone onto QDs and demonstrated that quenching of fluorescence takes place due to pH-dependent electron-transfer from QDs to oxidized dopamine–quinone. Keeping these views in mind and also considering the cytotoxicity of QDs, environmentally benign CNPs can be used to replace QDs in controlling electron transfer processes. It is well-known that CNPs can act as electron donors as well as acceptors, as the case may be in the excited state through a photoinduced electron transfer (PET) mechanism [6]. Water-soluble CNPs with -COOH functionalities can readily combine with dopamine in the presence of N-(3-Dimethylaminopropyl)-N -ethyl carbodiimide hydrochloride (EDC.HCl) and Sulfo-NHS. The CNP–dopamine (CNP–DOP) conjugate undergoes an enhanced pH dependent photoluminescence (PL) quenching compared to the original CNPs. Fig. 5C and D show changes in the PL spectra of the CNPs over the pH range 3.4–10.4. The pH-dependent PL quenching takes place due to electron transfer (ET) from CNPs to the oxidized dopamine where dopamine–quinone functions as an electron acceptor [26,27]. The pH-dependent concentration of oxidized dopamine in the

52
ISrapS Bulletin Vol. 27, Issue Number 1 March 2015
The pH-dependent concentration of oxidized dopamine in the CNP conjugate at any point determines the magnitude of ET associated with PL quenching. At low pH, the concentration of oxidized dopamine is small producing only marginal PL quenching. Enhancement in the pH results in an increase in the rate of oxidation of dopamine to dopamine–quinone by using ambient oxygen. As a result more PL quenching is observed. A closer look a Fig. 5B and D shows the development of a new absorption band at 415 nm and a corresponding emission peak at 470 nm with ncrease in the solution pH. These bands are due to the formation of dopamine–quinone from dopamine [28]. CNPs without dopamine do not show such properties under similar conditions.
Fig. 6 shows the redox curves of CNP–DOP solution. A well-defined oxidation peak undergoes a progressive shift toward a lower voltage as the pH increases. This behaviour can be attributed to a two-electron two-proton transformation of dopamine into dopamine–quinine [28]. As the pH increases, dopamine
undergoes oxidation to dopamine–quinone and consequently acts as an electron acceptor. Hence, two simultaneous processes become apparent under these circumstances: (i) electron transfer between dopamine–hydroquinone to oxidized dopamine–quinone, and (ii) electron transfer from CNPs to dopamine–quinone. As a result, CNP fluorescence quenches with an increase in pH. The potential shift toward lower voltage with increasing solution pH indicates a lower barrier for oxidation, and hence a shift of the equilibrium toward the oxidized form of dopamine.
It is clear from the above discussions that dopamine–hydroquinone is predominant at low pH values and acts as an
Figure 5. Steady-state absorption and fluorescence spectral signals obtained from solutions of (A, C) CNPs and (B, D) CNP–DOP conjugates with increasing pH from 3.4 to 10.4. The excitation wavelength for obtaining the fluorescence spectra was 350 nm.
CNP conjugate at any point determines the magnitude of ET associated with PL quenching. At low pH, the concentration of oxidized dopamine is small producing only marginal PL quenching. Enhancement in the pH results in an increase in the rate of oxidation of dopamine to dopamine–quinone by using ambient oxygen. As a result more PL quenching is observed. A
closer look a Fig. 5B and D shows the development of a new absorption band at 415 nm and a corresponding emission peak at 470 nm with ncrease in the solution pH. These bands are due to the formation of dopamine–quinone from dopamine [28]. CNPs without dopamine do not show such properties under similar conditions.
Figure 5. Steady-state absorption and fluorescence spectral signals obtained from solutions of (A, C) CNPs and (B, D) CNP–DOP conjugates with increasing pH from 3.4 to 10.4. The excitation wavelength for obtaining the fluorescence spectra was 350 nm.
Fig. 6 shows the redox curves of CNP–DOP solution. A well-defined oxidation peak undergoes a progressive shift toward a lower voltage as the pH increases. This behaviour can be attributed to a two-electron two-proton transformation of dopamine into dopamine–quinine [28]. As the pH increases, dopamine undergoes
oxidation to dopamine–quinone and consequently acts as an electron acceptor. Hence, two simultaneous processes become apparent under these circumstances: (i) electron transfer between dopamine–hydroquinone to oxidized dopamine–quinone, and (ii) electron transfer from CNPs to dopamine–quinone. As a result,
electron donor to the CNP acceptor, whereas, at higher pH values dopamine–quinone is formed and acts as an electron acceptor where the CNP core acts as the donor. At neutral pH an equiproportion of dopamine–hydroquinone and dopamine–quinone results in a plateau in fluorescence quenching. Addition of NADH to the CNP donor dopamine–quinine acceptor
Figure 6. Cyclic voltammograms collected from CNP–DOP dispersed in solutions of varying pH.
CNP fluorescence quenches with an increase in pH. The potential shift toward lower voltage with increasing solution pH indicates a lower barrier for oxidation, and hence a shift of the equilibrium toward the oxidized form of dopamine.
Figure 6. Cyclic voltammograms collected from CNP–DOP dispersed in solutions of varying pH.
It is clear from the above discussions that dopamine–hydroquinone is predominant at low pH values and acts as an
electron donor to the CNP acceptor, whereas, at higher pH values dopamine–quinone is formed and acts as an electron acceptor where the CNP core acts as the donor. At neutral pH an equiproportion of dopamine–hydroquinone and dopamine–quinone results in a plateau in fluorescence quenching. Addition of NADH to the CNP donor dopamine–quinine acceptor system results in the reduction of the quinone form to its hydroquinone counterpart (Fig. 7A). Thus, the role of the CNPs reverses from donor to electron acceptor. Initially, there is a small enhancement in the fluorescence intensity of CNP–DOP upon addition of NADH due to the formation of a NADH–dopamine–quinone complex (Fig. 7B). The result indicates that the reduction of dopamine–quinone to dopamine–hydroquinone occurs in a two-electron two-photon transfer process in the presence of NADH and the complex at the CNP surface.
Figure 7. (A) Absorption spectral changes of CNP–DOP at pH 10.4 and (B) changes in the fluorescence spectrum of the CNP–DOP–quinone composite. In both cases, the black colour indicates the corresponding spectrum for the CNP–DOP–quinone form and the red to cyan spectra show the changes due to the addition of 0.5–2 mM of NADH.

53
ISrapS Bulletin Vol. 27, Issue Number 1 March 2015
system results in the reduction of the quinone form to its hydroquinone counterpart (Fig. 7A). Thus, the role of the CNPs reverses from donor to electron acceptor. Initially, there is a small enhancement in the fluorescence intensity of CNP–DOP upon addition of NADH due to the formation of a NADH–dopamine–quinone complex (Fig. 7B). The result indicates that the reduction of dopamine–quinone to dopamine–hydroquinone occurs in a two-electron two-photon transfer process in the presence of NADH and the complex at the CNP surface.
4. Hollow fluorescent carbon nanoparticles
Depending on a specific application area, various methods have been applied for synthesis of CNPs with different structures and morphologies. Silica template has been used to prepare CNPs with ordered pore structure for the application to catalysis and electrochemistry [29-31]. Polymer as porogen to prepare porous carbon is another efficient method. Reaction induced phase separation of miscible polymer blends have been applied in recent past to prepare nanostructure carbonaceous material with continuous pores [32,33]. Preparation of hollow fluorescent carbon nanoparticles (HFCNs) with
green emission has been reported very recently [34]. Simple mixing of acetic acid, water, and diphosphorus pentoxide produced the desired HFCNs. In comparison to traditional dyes and quantum dots, HFCNs are claimed to be superior fluorescent bioimaging agents because of their low toxicity, stability, and resistance to photobleaching. The void space in hollow particles has been used to modulate optical properties, increase active area for catalysis, etc. To make use of the full significance of HFCNs since they are practically non-toxic to biological systems, in addition to the methods of synthesis one needs to know about the characteristics of their interior.
AFM images of the HFCNs are shown in Fig. 8A,B. The hollow core and the vessel nature of the HFCNs are clearly visible. The thickness of the carbon shell is about 5 nm.31 DLS experiment shows that the average particle size of the HFCNs is in the range 60−70 nm (Fig. 8C) and also that they are monodispersed. Monodispersity is optimal for biomedical applications. The absorption spectrum of HFCNs shows two bands at 245 and 297 nm (Fig. 9A). The band at 245 nm is likely to originate due to the formation of multiple polyaromatic chromophores, while
Figure 7. (A) Absorption spectral changes of CNP–DOP at pH 10.4 and (B) changes in the fluorescence spectrum of the CNP–DOP–quinone composite. In both cases, the black colour indicates the corresponding spectrum for the CNP–DOP–quinone form and the red to cyan spectra show the changes due to the addition of 0.5–2 mM of NADH.
CNP fluorescence quenches with an increase in pH. The potential shift toward lower voltage with increasing solution pH indicates a lower barrier for oxidation, and hence a shift of the equilibrium toward the oxidized form of dopamine.
Figure 6. Cyclic voltammograms collected from CNP–DOP dispersed in solutions of varying pH.
It is clear from the above discussions that dopamine–hydroquinone is predominant at low pH values and acts as an
electron donor to the CNP acceptor, whereas, at higher pH values dopamine–quinone is formed and acts as an electron acceptor where the CNP core acts as the donor. At neutral pH an equiproportion of dopamine–hydroquinone and dopamine–quinone results in a plateau in fluorescence quenching. Addition of NADH to the CNP donor dopamine–quinine acceptor system results in the reduction of the quinone form to its hydroquinone counterpart (Fig. 7A). Thus, the role of the CNPs reverses from donor to electron acceptor. Initially, there is a small enhancement in the fluorescence intensity of CNP–DOP upon addition of NADH due to the formation of a NADH–dopamine–quinone complex (Fig. 7B). The result indicates that the reduction of dopamine–quinone to dopamine–hydroquinone occurs in a two-electron two-photon transfer process in the presence of NADH and the complex at the CNP surface.
Figure 7. (A) Absorption spectral changes of CNP–DOP at pH 10.4 and (B) changes in the fluorescence spectrum of the CNP–DOP–quinone composite. In both cases, the black colour indicates the corresponding spectrum for the CNP–DOP–quinone form and the red to cyan spectra show the changes due to the addition of 0.5–2 mM of NADH.

54
ISrapS Bulletin Vol. 27, Issue Number 1 March 2015
4. Hollow fluorescent carbon nanoparticles
Depending on a specific application area, various methods have been applied for synthesis of CNPs with different structures and morphologies. Silica template has been used to prepare CNPs with ordered pore structure for the application to catalysis and electrochemistry [29-31]. Polymer as porogen to prepare porous carbon is another efficient method. Reaction induced phase separation of miscible polymer blends have been applied in recent past to prepare nanostructure carbonaceous material with continuous pores [32,33]. Preparation of hollow fluorescent carbon nanoparticles (HFCNs) with green emission has been
reported very recently [34]. Simple mixing of acetic acid, water, and diphosphorus pentoxide produced the desired HFCNs. In comparison to traditional dyes and quantum dots, HFCNs are claimed to be superior fluorescent bioimaging agents because of their low toxicity, stability, and resistance to photobleaching. The void space in hollow particles has been used to modulate optical properties, increase active area for catalysis, etc. To make use of the full significance of HFCNs since they are practically non-toxic to biological systems, in addition to the methods of synthesis one needs to know about the characteristics of their interior.
Figure 8. 2D and 3D AFM images of HFCNs (A, B). Figure 8. 2D and 3D AFM images of HFCNs (A, B).
the broad peak at 297 nm may be attributed to the n−π* transitions in C=O on the HFCNs. The carbon source with carboxylic group introduces oxygenous defects in the CNs that impose the fluorescence property. Furthermore, the polyaromatic structure may serve as fluorescent chromophore that makes HFCN a fluorophore. Fig. 9B shows emission spectra of HFCN on
excitations from 340 to 420 nm. No noticeable shift in emission maximum as the excitation wavelength is varied indicates that there is a uniform distribution of size for the HFCNs. The characteristic luminescence decay for the HFCNs is found to be biexponential (Fig. 9C) with decay times 2.42 ns (81%) and 360 ps (18%).
Conclusions
Solid and hollow CNPs with different coating agents can be easily synthesised and characterised. It has been shown that the negatively charged CNPs can be coated with cationic surfactants that form bilayer around them. Thickness of the bilayer can be measured using FRET. Moreover, change in thickness of the surfactant bilayer may be applied to control processes like photoinduced electron transfer (PET). CNPs can be functionalized with dopamine that modulates to and fro PET using CNPs with variation in environment pH. HFCNs are modified CNPs that has relatively hydrophobic interior and their fluorescent nature allows them to be used as drug carriers and markers.
Acknowledgement
The work was supported by Department of Science and Technology, Government of India, through Project SR/S1/PC-35/2011. S. M. acknowledges University Grants Commission, Government of India, for his fellowship.
References1. Y. P. Sun, B. Zhou, Y. Lin, W. Wang, K. A. S. Fernando, P.
Pathak, M. J. Meziani, B. Harruff, X. Wang, H. Wang, P. G. Luo, H. Yang, M. E. Kose, B. Chen, L. M. Veca and S. Y. Xie, J. Am. Chem. Soc., 2006, 128, 7756-7757.
2. J. Zhou, C. Booker, R. Li, X. Zhou, T. K. Sham, X. Sun and Z. Ding, J. Am. Chem. Soc., 2007, 129, 744-745.
3. A. B. Bourlinos, A. Stassinopoulos, D. Anglos, R. Zboril, M. Karakassides and E. P. Giannelis, Small, 2008, 4, 455-458.
4. V. N. Mochalin and Y. Gogotsi, J. Am. Chem. Soc., 2009, 131, 4594-4595.
5. R. Liu, D. Wu, S. Liu, K. Koynov, W. Knoll and Q. Li, Angew. Chem., Int. Ed., 2009, 48, 4598-4601.
6. S. T. Yang, X. Wang, H. Wang, F. Lu, P. G. Luo, L. Cao, M. J. Meziani, J. H. Liu, Y. Liu, M. Chen, Y. Huang and Y. P. Sun, J. Phys. Chem. C, 2009, 113, 18110-18114.
7. Y. Song, W. Shi, W. Chen, X. Li and H. Ma, J. Mater. Chem., 2012, 22, 12568-12573.
AFM images of the HFCNs are shown in Fig. 8A,B. The hollow core and the vessel nature of the HFCNs are clearly visible. The thickness of the carbon shell is about 5 nm.31 DLS experiment shows that the average particle size of the HFCNs is in the range 60 70 nm (Fig. 8C) and also that they are monodispersed. Monodispersity is optimal for biomedical applications. The absorption spectrum of HFCNs shows two bands at 245 and 297 nm (Fig. 9A). The band at 245 nm is likely to originate due to the formation of multiple polyaromatic chromophores, while the broad peak at 297 nm may be attributed to the n * transitions in C=O on the HFCNs. The carbon source
with carboxylic group introduces oxygenous defects in the CNs that impose the fluorescence property. Furthermore, the polyaromatic structure may serve as fluorescent chromophore that makes HFCN a fluorophore. Fig. 9B shows emission spectra of HFCN on excitations from 340 to 420 nm. No noticeable shift in emission maximum as the excitation wavelength is varied indicates that there is a uniform distribution of size for the HFCNs. The characteristic luminescence decay for the HFCNs is found to be biexponential (Fig. 9C) with decay times 2.42 ns (81%) and 360 ps (18%).
Figure 9. (A) Absorption spectrum, (B) steady-state fluorescent spectra, and (C) time-resolved fluorescence decay of HFCN ( ex = 377 nm, em = 490 nm).
Conclusions
Solid and hollow CNPs with different coating agents can be easily synthesised and characterised. It has been shown that the negatively charged CNPs can be coated with cationic surfactants that form bilayer around
them. Thickness of the bilayer can be measured using FRET. Moreover, change in thickness of the surfactant bilayer may be applied to control processes like photoinduced electron transfer (PET). CNPs can be functionalized with dopamine that modulates to and fro PET using CNPs with
Figure 9. (A) Absorption spectrum, (B) steady-state fluorescent spectra, and (C) time-resolved fluorescence decay of HFCN (λex = 377 nm, λem = 490 nm).

55
ISrapS Bulletin Vol. 27, Issue Number 1 March 2015
8. H. Li, Z. Kang, Y. Liu and S. T. Lee, J. Mater. Chem., 2012, 22, 24230-24253.
9. M. Derfus, W. C. W. Chan and S. N. Bhatia, Nano Lett., 2004, 4, 11-18.
10. C. Kirchner, T. Liedl, S. Kudera, T. Pellegrino, A. M. Javier, H. E. Gaub, S. Stolzle, N. Fertig and W. J. Parak, Nano Lett., 2005, 5, 331-338.
11. Q. L. Zhao, Z. L. Zhang, B. H. Huang, J. Peng, M. Zhang and D. W. Pang, Chem. Commun., 2008, 5116–5118.
12. H. P. Liu, T. Ye and C. D. Mao, Angew. Chem., Int. Ed., 2007, 46, 6473-6475.
13. J. Zong, Y. H. Zhu, X. L. Yang, J. H. Shen and C. Z. Li, Chem. Commun., 2011, 47, 764-766.
14. L. B. Tang, R. B. Ji, X. K. Cao, J. Y. Lin, H. X. Jiang, X. M. Li, K. S. Teng, C. M. Luk, S. J. Zeng, J. H. Hao and S. P. Lau, ACS Nano, 2012, 6, 5102-5110.
15. S. Mondal, T. Das, P. Ghosh, A. Maity, A. Mallick and P. Purkayastha, Chem. Commun., 2013, 49, 7638-7640.
16. M. J. O’Connell, S. M. Bachilo, C. B. Huffman, V. C. Moore, M. S. Strano, E. H. Haroz, K. L. Rialon, P. J. Boul, W. H. Noon, C. Kittrell, J. Ma, R. H. Hauge, R. B. Weisman and R. E. Smalley, Science, 2002, 297, 593-596.
17. Z. M. Sui, X. Chen, L. Wang, Y. Chai, C. Yang and J. Zhao, Chem. Lett., 2005, 100.
18. X. H. Liu, X. H. Luo, S. X. Lu, J. C. Zhang and W. L. Cao, J. Colloid Interface Sci., 2007, 307, 94-100.
19. M. Chakraborty, F. W. Hsiao, B. Naskar, C. H. Chang and A. K. Panda, Langmuir, 2012, 28, 7282-7290.
20. Y. Wang, L. Bao, Z. Liu and D. W. Pang, Anal. Chem., 2011, 83, 8130-8137.
21. S. K. Pal, D. Mandal, D. Sukul and K. Bhattacharyya, Chem. Phys., 1999, 249, 63–71.
22. F. Lin, D. Pei, W. He, Z. Huang, Y. Huang and X. Guo, J. Mater. Chem., 2012, 22, 11801–11807.
23. X. Wang, L. Cao, F. Lu, M. J. Meziani, H. Li, G. Qi, B. Zhou, B. A. Harruff, F. Kermarrec and Y.-P. Sun, Chem. Commun., 2009, 3774–3776.
24. S. Mondal, T. Das, P. Ghosh, A. Maity, A. Mallick and P. Purkayastha, Mater. Lett., 2015, 141, 252–254.
25. I. L. Medintz, M. H. Stewart, S. A. Trammell, K. Susumu, J. B. Delehanty, B. C. Mei, J. S. Melinger, J. B. Blanco-Canosa, P. E. Dawson and H. Mattoussi, Nat. Mater., 2010, 9, 676-684.
26. S. Patai and Z. Rappoport, The chemistry of the quinonoid compounds, Part I & II, John Wiley, 1988.
27. X. Gao, Y. Cui, R. M. Levenson, L. W. K. Chung and S. Nie, Nat. Biotechnol., 2004, 22, 969-976.
28. E. Belluzzi, M. Bisaglia, E. Lazzarini, L. C. Tabares, M. Beltramini and L. Bubacco, PLoS One, 2012, 7, e38026.
29. S. H. Joo, S. J. Choi, I. Oh, J. Kwak, Z. Liu, O. Terasaki and R. Ryoo, Nature, 2001, 412, 169−172.
30. P. Kim, J. B. Joo, W. Kim, S. K. Kang, I. K. Song and J. A. Yi, Carbon, 2006, 44, 389−392.
31. J. B. Joo, P. Kim, W. Kim, J. Kim, N. D. Kim and J. Yi, Curr. Appl. Phys. 2008, 8, 814−817.
32. M. Yamazaki, M. Teduka, K. Ikeda and S. Ichihara, J. Mater. Chem., 2003, 13, 975−977.
33. M. Yamazaki, M. Kayama, K. Ikeda, T. Alii and S. Ichihara, Carbon, 2004, 42, 1641−1649.
34. Y. Fang, S. Guo, D. Li, C. Zhu, W. Ren, S. Dong and E. Wang, ACS Nano, 2012, 6, 400−409.
Somen Mondal did his B.Sc. with Chemistry honours from Guskara Mahavidyalaya, Burdwan University in 2009 and M.Sc. from NIT Durgapur in 2011. After finishing his undergraduate program he joined the group of Dr. Pradipta Purkayastha at IISER Kolkata on 1st August, 2011. His area of research is to explore electron and charge transfer dynamics to and from carbon nanoparticles.
Dr. Pradipta Purkayastha did his B.Sc. and M.Sc. from the University of Calcutta and Ph.D. from Jadavpur University. After his Ph.D. he joined the group of Professor Feng Gai at University of Pennsylvania in 2002. He returned to India in 2004 to join BITS Pilani and later moved to IISER Kolkata in 2009. He is presently an Associate Professor in the Department of Chemical Sciences at IISER Kolkata. His area of research encompasses studies of molecular dynamics in microheterogeneous environments and nanoparticulate systems.

56
ISrapS Bulletin Vol. 27, Issue Number 1 March 2015
1. Introduction
1.1. Polymer-surfactant interactions.
Extensive studies have been performed over the past few decades to understand the mechanistic and thermodynamic aspects of the polymer-surfactant interaction because of its importance in paints and coatings, cosmetic products, detergents, and oil recovery processes [1-3]. The polymer-surfactant interaction serves as a simplified model for protein-surfactant and protein-lipid binding processes in biological systems [4].
A wide variety of techniques, such as nuclear magnetic resonance (NMR) [5-8], light scattering
[9, 10], conductometry [11, 12], calorimetry [13, 14], tensiometry [15, 16], and fluorescence spectroscopy [17-21], have contributed
Microscopic Investigation of the Polymer-Surfactant and Protein-Surfactant Interactions: Evidence of “Necklace and
Bead”-Like Morphology
Surajit Chatterjee and Tushar Kanti Mukherjee*
Discipline of Chemistry, Indian Institute of Technology Indore, M-Block, IET-DAVV Campus, Khandwa Road, Indore-452017, M.P., India. Email: [email protected];
Abstract
In this article we present our recent studies on the complexes of surfactants with polymers and proteins. Over the past few decades, various studies have been performed to understand the mechanisms and thermodynamic aspects of such complexes. The “necklace and bead” model has long been the most widely accepted model for the supramolecular structure of polymer–surfactant complexes. However, the lack of microscopic evidence of the initial complexation between surfactant and polymer has resulted in many contradictory reports in the literature. Here, we visualized these initial complexes formed between negatively charged surfactant sodium dodecyl sulfate (SDS) with neutral poly(vinylpyrrolidone) (PVP) and cationic poly-(diallyldimethylammonium chloride) (PDADMAC) polymer through photoluminescence (PL) microscopy and atomic force microscopy (AFM) using silicon quantum dot (Si QD) as an external PL marker. It is observed that, for the PVP−SDS system, SDS molecules bind at the hydrophobic sites on the random-coiled PVP chain through their hydrocarbon tails, while for the PDADMAC−SDS system, SDS head groups are associated with the positively charged nitrogen centers of the polymer, where the polymer chain wraps around the surfactant head groups. Similarly, we have investigated the protein-surfactant interactions with bovine serum albumin (BSA) and SDS system and shown that they form typical ring-shaped doughnut-like structures due to “necklace and bead”-like complex formation.
significantly to a deeper understanding of the mechanistic aspects of various polymer-surfactant complexes. Surfactant aggregates bind with the polymer chain in a “necklace and bead”-like morphology below their normal critical micellar concentration (cmc) and are mainly governed by either hydrophobic, dipolar, or electrostatic forces. Earlier, two distinct “necklace and bead”-like structures have been proposed for polymer−surfactant complexes: one having the surfactant aggregates nucleate on the hydrophobic sites of the polymer chain, where surfactant head groups are exposed to surrounding water, and the other with the polymer chain wrapped around the surfactant aggregates, where the surfactant head groups are associated with the polymeric chain (Figure 1).
Article 7- Tusar

57
ISrapS Bulletin Vol. 27, Issue Number 1 March 2015
For example, several groups have proposed that, for the PVP−SDS system, SDS binds to positive nitrogen centers on the pyrrolidone rings of PVP, resulting in the formation of type I “necklace and bead”-like structures [18-20, 22, 23]. In contrast, Wang et al. and Shen et al. have claimed that, for the PVP−SDS system, SDS binds at the hydrophobic sites of the PVP chain, which leads to type II “necklace and bead”-like structures [24-26]. Similarly, Roscigno et al. have reported association of the alkyl moiety of SDS with the ring carbons of PVP through hydrophobic interaction [27]. Similar contradictory results have been reported for the PVP−lithium perfluorononanoate (LiPFN) system. Earlier, Segre et al. have proposed that, for the PVP−LiPFN system, the PVP chain wraps the surfactant aggregates to form type I “necklace and bead”-like structures because of electrostatic interactions. However, recently, Hou et al. have proposed type II structures for the PVP−LiPFN system, where the PVP chain penetrates into the hydrophobic core of the surfactant aggregates because of hydrophobic interactions [28]. To resolve these discrepancies, it is utmost important to have a technique that can directly visualize the initial polymer-surfactant complexes at the microscopic level.
1.2. Protein-surfactant interactions.
Similarly, protein-surfactant mixed systems have been widely studied and developed in the past few decades [29-35]. It has been proposed that the initial interaction between very low concentrations of surfactants and proteins is
predominantly ionic in nature with the surfactant head groups bound to oppositely charged groups on the protein. These initial electrostatic interactions lead to partially unfolded proteins, which subsequently bind with more surfactants in a cooperative fashion. The most well studied example of protein-surfactant interaction is between bovine serum albumin (BSA) and sodium dodecyl sulfate (SDS). Both intrinsic and extrinsic fluorescent probes have been used to illustrate the underlying mechanism and dynamics of BSA-SDS interactions [31, 36-39]. Earlier, Oakes has studied the binding isotherm between BSA and SDS by means of nuclear magnetic resonance signal of surfactant molecules and proposed that both the surfactant head groups and alkyl chains interact with the proteins at low surfactant concentrations [40]. At higher surfactant concentrations, micelle-like complexes (“necklace and bead” model) are formed on proteins in which the surfactant alkyl chains are associated with protein apolar groups.
Single-particle fluorescence microscopy is a very powerful and direct technique to probe complex chemical and biological phenomena [41-45]. In the present study, we have directly visualized the initial polymer−surfactant complexes far below (1 mM) the normal cmc of SDS (8 mM) using a home-built epi-fluorescence microscope. The main objective of the present study is to address the fundamental question of the polymer-surfactant interaction as to how individual surfactant molecules bind with the polymer chain and the driving force behind it. To address this problem, we have used two different polymers: the first polymer is a neutral polymer PVP, and the second polymer is a cationic polymer poly(diallyldimethylammonium chloride) (PDADMAC). Similarly we have explored the dynamics of BSA−SDS interactions. Amine-functionalized silicon quantum dots (Si QDs) were used as an external photoluminescent (PL) marker to probe the polymer-surfactant as well as protein-surfactant complexes. Our system is based on a unique binary complex between
various polymer-surfactant complexes. Surfactant aggregates bind with the polymer chain in a “necklace and bead”-like morphology below their normal critical micellar concentration (cmc) and are mainly governed by either hydrophobic, dipolar, or electrostatic forces. Earlier, two distinct “necklace and bead”-like structures have been proposed for polymer−surfactant complexes: one having the surfactant aggregates nucleate on the hydrophobic sites of the polymer chain, where surfactant head groups are exposed to surrounding water, and the other with the polymer chain wrapped around the surfactant aggregates, where the surfactant head groups are associated with the polymeric chain (Figure 1).
Figure 1. Two possible structures of the “necklace and bead” model. For example, several groups have proposed that, for the PVP−SDS system, SDS binds to positive nitrogen centers on the pyrrolidone rings of PVP, resulting in the formation of type I “necklace and bead”-like structures [18-20, 22, 23]. In contrast, Wang et al. and Shen et al. have claimed that, for the PVP−SDS system, SDS binds at the hydrophobic sites of the PVP chain, which leads to type II “necklace and bead”-like structures [24-26]. Similarly, Roscigno et al. have reported association of the alkyl moiety of SDS with the ring carbons of PVP through
hydrophobic interaction [27]. Similar contradictory results have been reported for the PVP−lithium perfluorononanoate (LiPFN) system. Earlier, Segre et al. have proposed that, for the PVP−LiPFN system, the PVP chain wraps the surfactant aggregates to form type I “necklace and bead”-like structures because of electrostatic interactions. However, recently, Hou et al. have proposed type II structures for the PVP−LiPFN system, where the PVP chain penetrates into the hydrophobic core of the surfactant aggregates because of hydrophobic interactions [28]. To resolve these discrepancies, it is utmost important to have a technique that can directly visualize the initial polymer-surfactant complexes at the microscopic level. 1.2. Protein-surfactant interactions. Similarly, protein-surfactant mixed systems have been widely studied and developed in the past few decades [29-35]. It has been proposed that the initial interaction between very low concentrations of surfactants and proteins is predominantly ionic in nature with the surfactant head groups bound to oppositely charged groups on the protein. These initial electrostatic interactions lead to partially unfolded proteins, which subsequently bind with more surfactants in a cooperative fashion. The most well studied example of protein-surfactant interaction is between bovine serum albumin (BSA) and sodium dodecyl sulfate (SDS). Both intrinsic and extrinsic fluorescent probes have been used to illustrate the underlying mechanism and dynamics of BSA-SDS interactions [31, 36-39]. Earlier, Oakes has studied the binding isotherm between BSA and SDS by means of nuclear magnetic resonance signal of
Figure 1. Two possible structures of the “necklace and bead” model.

58
ISrapS Bulletin Vol. 27, Issue Number 1 March 2015
SDS and Si QDs, where sulfate head groups of SDS are engaged in hydrogen-bond-induced Si QD aggregate formation, while its hydrocarbon tails remain free in solution [46].
2. Experimental section.
2.1 Materials. Neutral polymer PVP (MW = 40 000), cationic polymer PDADMAC (MW = 100 000−200 000), Bovine serum albumin (BSA, ≥99%, essentially fatty acid free and globulin free), SDS (98.5%), tetraoctylammonium bromide (TOAB, 98%), chloroplatinic acid hexahydrate, and isopropyl alcohol (99%) were purchased from Sigma-Aldrich. Silicon tetrachloride (99%) and tetrahydrofuran (THF, 99.5%) were purchased from Merck (Germany). Lithium aluminum hydride (LAH, 97%) and toluene (99%) were purchased from SD Fine Chemicals (India). Allylamine (99%) was purchased from Spectrochem (India). Milli-Q water was obtained from a Millipore water purifier system (Milli-Q integral).
2.2. Synthesis of Amine-capped Si QDs. Allylamine capped Si QDs were synthesized by a wet-chemical method according to the literature [47]. Briefly, hydrogen-terminated hydrophobic Si QDs were synthesized by reduction of SiCl4 by LAH under an argon atmosphere. Hydrophilic amine-functionalized Si QDs were then formed by modifying the surface with allylamine in the presence of H2PtCl6 catalyst. Then, the solvents were evaporated, and amine functionalized Si QDs were redispersed in Milli-Q water by sonication. Finally, all of the reactants were removed by successive filtration through a 0.22 μm membrane filter. The concentration of synthesized Si QD solution was estimated spectrophotometrically using the molar extinction coefficient at 260 nm (ε260) of 2.6 × 10⁵ M−1 cm−1 [48]. The final concentration of Si QDs was kept constant at 300 nM, so that the optical density (OD) should not exceed the value of 0.5 to avoid unnecessary self-aggregation and inner filter effect.
2.3. Instrumentation. Absorption spectra were recorded in a quartz cuvette (10 × 10 mm)
using a Varian ultraviolet−visible (UV-vis) spectrophotometer (Carry 100 Bio) and were corrected using solvent absorption as the baseline. Photoluminiscence spectra were recorded using a Fluoromax-4 spectrofluorimeter (HORIBA Jobin Yvon, model FM-100) with excitation and emission slit width at 4 nm. All measurements were performed at room temperature. Fourier transform infrared (FTIR) measurements were carried out in a Bruker spectrometer (Tensor-27) on a thin KBr pellet. Atomic force microscopy (AFM) measurements were performed on a cleaned glass coverslip using an AIST-NT microscope (model SmartSPM-1000). PL imaging of an individual Si QD was carried out using a custom-made microscope setup based on an inverted fluorescence microscope (Nikon, Eclipse Ti-U) coupled with a back-illuminated electron-multiplying charge-coupled device (EM-CCD) camera (Andor, iXon X3 897). An air-cooled argon ion laser (Melles Griot, 400-A03) was used as a source of excitation light. A collimated laser beam of 457 nm wavelength was passed through a beam expander (Holmarc, India) and a neutral density filter (Sigma Koki, Japan). The beam was then directed toward the center of the back aperture of an oil immersion objective (Apo TIRF, Nikon, 100X, NA = 1.49) parallel to the objective axis and subsequently focused on its back focal plane. The PL signal was filtered by a 505 nm dichroic mirror and a 520 nm long-pass filter. Finally, the images were captured by the back illuminated EM-CCD camera at a frame rate of 200 ms with no binning. The images were analyzed with ImageJ (version 1.47v) by the National Institutes of Health (NIH).
3. Results and discussion.3.1. Polymer-surfactant interactions.
3.1.1 PL Spectroscopy of Si QDs in the Presence of SDS and PVP. The synthesized Si QDs were characterized by FTIR spectroscopy [46]. The characteristic peak at 1641 cm−1 indicates the attachment of an allylamine moiety at the surface of Si QDs, which is very close to the reported value [46]. The size distribution and

59
ISrapS Bulletin Vol. 27, Issue Number 1 March 2015
mean size of these Si QDs were determined from AFM. The QDs are spherical in nature, and the estimated mean diameter is 3.34 ± 0.16 nm. These Si QDs show a broad continuous absorption between 200 and 500 nm with two distinct shoulders at 265 and 310 nm [46]. An intense PL band centered at 455 nm appears upon excitation at 375 nm, while the excitation at 460 nm results in a PL maximum at 490 nm [46].
The PL spectra of Si QDs remain unaltered in the presence of 0.05 wt % PVP, suggesting no specific interactions between the polymer and QDs (Figure 2). However, at pH 7.4, the addition of 1 mM SDS into Si QD solution results in PL quenching at 455 nm with a concomitant appearance of a large Stokes-shifted broad PL at 610 nm because of the formation of ordered surfactant-induced Si QD aggregates via a specific hydrogen-bonding interaction between amine moieties of Si QDs and negatively charged sulfate head groups of SDS (Figure 2).
not alter its PL characteristics. To obtain a clear picture, we visualized this ternary system in our home-built epi-fluorescence microscope.
3.1.2. PL Microscopy and AFM of Si QDs in the Presence of SDS and PVP. PL imaging has been performed with an excitation wavelength of 457 nm from an argon ion laser. Figure 3a shows a PL image of the ternary system consisting of 300 nM Si QDs, 1 mM SDS, and 0.05 wt % PVP. Interestingly, the image reveals ring-shaped arrangements of distinct luminescent spots throughout the slide. The diameter of these ring-shaped structures varies from 4 to 14 μm. Moreover, it has been observed that these structural patterns disappear when we imaged Si QDs with PVP in the absence of SDS.
Figure 2. PL spectra (λex= 375 nm) of Si QDs, Si QDs with PVP, Si QDs with 1 mM SDS, and Si QDs with 1 mM SDS and 0.05 wt % PVP.
The PL spectrum of Si QDs in the presence of 1 mM SDS remains unaltered upon the addition of 0.05 wt % PVP at pH 7.4 (Figure 2). This indicates that either the surfactant-induced Si QD aggregates do not interact with the polymer chain or binding with the polymer chain does
Figure 3. (a) PL images of Si QDs in the presence of 1 mM SDS and 0.05 wt % PVP (b) Histogram of the distance between adjacent luminescent spots.
Thus, the observed ring shaped structural patterns of luminescent spots appear only because of binding of SDS-induced Si QD aggregates with the PVP matrix. In addition, it is clear from the steady-state PL experiment that the extent of SDS-induced Si QD aggregation remains same in the absence and presence of 0.05 wt % PVP. The best way to explain these observations is by considering binding of SDS-induced Si QD aggregates with the polymer chain through their free hydrocarbon tails because of hydrophobic interactions. As the sulfate head groups of SDS molecules are not involved in this binding process, the extent of SDS-induced Si QD aggregation remains unaltered.
The present observation of discrete luminescent spots of SDS-induced Si QD

60
ISrapS Bulletin Vol. 27, Issue Number 1 March 2015
aggregates indicates that the binding is not uniform throughout the polymer chain; instead, they bind at some specific hydrophobic sites on the polymer chain. We believe that this kind of non-uniform binding of SDS at specific hydrophobic sites on the PVP backbone arises because of the random-coiled structure of PVP in aqueous solution. The presence of several pyrrolidone rings in these coils provides high-affinity binding sites for SDS molecules compared to pyrrolidone rings in the uncoiled segment of the PVP chain. This argument gains support from earlier reported random coiled conformation of PVP in water [49, 50]. Hence, on the basis of our present results and aforesaid discussion, we propose that SDS-induced Si QD aggregates specifically bind at the methylene carbon centers of pyrrolidone rings of random-coiled PVP through hydrophobic interactions.
To know the nature of these luminescent spots, we analyzed their PL time traces and full width at half maximum (fwhm) values. Figure 4a shows the distribution of fwhm values of 123 luminescent spots determined from their respective intensity line profiles. A broad distribution is observed similar to that previously reported for SDS-induced Si QD aggregates alone. However, Si QDs alone show diffraction-limited luminescent spots with fwhm of ∼1−3 pixels (0.23−0.69 μm). Hence, these wider luminescent spots in the presence of PVP might be due to SDS-induced Si-QD aggregates on the polymer chain.
It is well-known that a single molecule or single QD shows PL intermittency or blinking (fluorescence on-off). This unique phenomenon distinguishes between multi-dot spots against single-dot spots. Hence, to distinguish single-QD spots from aggregated QDs, we have carefully analyzed time traces of 123 individual localized luminescent spots. Figure 4b shows the PL time traces of three individual luminescent spots. These spots show gradual intensity decay with no clear photobleaching steps. This kind of characteristic PL time trace clearly indicates that the observed luminescent spots are due to SDS-induced Si QD aggregates.
The morphological insight of these ternary complexes was determined from AFM. Figure 5a shows an AFM image of the ternary system. The spherical spots visible in the image represent Si QD aggregates. The size of these spots varies from 20 to 60 nm determined from the height profile (Figure 5b).
The presence of several pyrrolidone rings in these coils provides high-affinity binding sites for SDS molecules compared to pyrrolidone rings in the uncoiled segment of the PVP chain. This argument gains support from earlier reported random coiled conformation of PVP in water [49, 50]. Hence, on the basis of our present results and aforesaid discussion, we propose that SDS-induced Si QD aggregates specifically bind at the methylene carbon centers of pyrrolidone rings of random-coiled PVP through hydrophobic interactions.
To know the nature of these luminescent spots, we analyzed their PL time traces and full width at half maximum (fwhm) values. Figure 4a shows the distribution of fwhm values of 123 luminescent spots determined from their respective intensity line profiles. A broad distribution is observed similar to that previously reported for SDS-induced Si QD aggregates alone. However, Si QDs alone show diffraction-limited luminescent spots with fwhm of 1−3 pixels (0.23−0.69 m). Hence, these wider luminescent spots in the presence of PVP might be due to SDS-induced Si-QD aggregates on the polymer chain.
Figure 4. (a) Distribution of fwhm of individual luminescent spots of Si QDs in the presence of 1 mM SDS and 0.05 wt % PVP. (b) PL time traces of three representative luminescent spots.
It is well-known that a single molecule or single QD shows PL intermittency or blinking (fluorescence on-off). This unique phenomenon distinguishes between multi-dot spots against single-dot spots. Hence, to distinguish single-QD spots from aggregated QDs, we have carefully analyzed time traces of 123 individual localized luminescent spots. Figure 4b shows the PL time traces of three individual luminescent spots. These spots show gradual intensity decay with no clear photobleaching steps. This kind of characteristic PL time trace clearly indicates that the observed luminescent spots are due to SDS-induced Si QD aggregates.
The morphological insight of these ternary complexes was determined from AFM. Figure 5a shows an AFM image of the ternary system. The spherical spots visible in the image represent Si QD aggregates. The size of these spots varies from 20 to 60 nm determined from the height profile (Figure 5b).
Figure 5. (a) AFM image and (b) size distribution histogram of SDS induced Si-QD aggregates in the presence of PVP. As expected, these values are significantly higher than that of the earlier reports for SDS-induced Si QD aggregates alone. This discrepancy can be explained by considering the attachment of SDS-induced Si QD aggregates with the polymeric network through their free hydrocarbon tails. To
Figure 4. (a) Distribution of fwhm of individual luminescent spots of Si QDs in the presence of 1 mM SDS and 0.05 wt % PVP. (b) PL time traces of three representative luminescent spots.
The presence of several pyrrolidone rings in these coils provides high-affinity binding sites for SDS molecules compared to pyrrolidone rings in the uncoiled segment of the PVP chain. This argument gains support from earlier reported random coiled conformation of PVP in water [49, 50]. Hence, on the basis of our present results and aforesaid discussion, we propose that SDS-induced Si QD aggregates specifically bind at the methylene carbon centers of pyrrolidone rings of random-coiled PVP through hydrophobic interactions.
To know the nature of these luminescent spots, we analyzed their PL time traces and full width at half maximum (fwhm) values. Figure 4a shows the distribution of fwhm values of 123 luminescent spots determined from their respective intensity line profiles. A broad distribution is observed similar to that previously reported for SDS-induced Si QD aggregates alone. However, Si QDs alone show diffraction-limited luminescent spots with fwhm of 1−3 pixels (0.23−0.69 m). Hence, these wider luminescent spots in the presence of PVP might be due to SDS-induced Si-QD aggregates on the polymer chain.
Figure 4. (a) Distribution of fwhm of individual luminescent spots of Si QDs in the presence of 1 mM SDS and 0.05 wt % PVP. (b) PL time traces of three representative luminescent spots.
It is well-known that a single molecule or single QD shows PL intermittency or blinking (fluorescence on-off). This unique phenomenon distinguishes between multi-dot spots against single-dot spots. Hence, to distinguish single-QD spots from aggregated QDs, we have carefully analyzed time traces of 123 individual localized luminescent spots. Figure 4b shows the PL time traces of three individual luminescent spots. These spots show gradual intensity decay with no clear photobleaching steps. This kind of characteristic PL time trace clearly indicates that the observed luminescent spots are due to SDS-induced Si QD aggregates.
The morphological insight of these ternary complexes was determined from AFM. Figure 5a shows an AFM image of the ternary system. The spherical spots visible in the image represent Si QD aggregates. The size of these spots varies from 20 to 60 nm determined from the height profile (Figure 5b).
Figure 5. (a) AFM image and (b) size distribution histogram of SDS induced Si-QD aggregates in the presence of PVP. As expected, these values are significantly higher than that of the earlier reports for SDS-induced Si QD aggregates alone. This discrepancy can be explained by considering the attachment of SDS-induced Si QD aggregates with the polymeric network through their free hydrocarbon tails. To
Figure 5. (a) AFM image and (b) size distribution histogram of SDS induced Si-QD aggregates in the presence of PVP.
As expected, these values are significantly higher than that of the earlier reports for SDS-induced Si QD aggregates alone. This discrepancy can be explained by considering the attachment of SDS-induced Si QD aggregates with the polymeric network through their free hydrocarbon tails. To further extend the study and investigate the role of specific electrostatic interactions between negatively charged SDS and a cationic polymer on the morphology of the polymer-surfactant complex, we studied the interactions between SDS and a cationic polymer PDADMAC.

61
ISrapS Bulletin Vol. 27, Issue Number 1 March 2015
3.1.3. PL Characteristics of Si QDs in the Presence of SDS and PDADMAC. Figure 6a shows the effect of 0.1 wt % PDADMAC on the PL spectrum of SDS-induced Si QD aggregates. As mentioned above, the PL band ∼610 nm signifies the presence of SDS-induced Si QD aggregates. It has been observed that the band at 610 nm completely disappears in the presence of PDADMAC with a concomitant increase in the PL intensity at 455 nm.
individual intensity line profile. It is evident from the histogram that most of them are diffraction-limited spots with fwhm ∼1−3 pixels (0.23−0.69 μm). Most of these diffraction-limited spots show PL blinking behavior characteristics of a single particle.
Figure 6. (a) PL spectra of Si QDs, Si QDs with 1 mM SDS, and Si QDs with 1 mM SDS and 0.1 wt % PDADMAC. (b) PL image of Si QDs in the presence of SDS and PDADMAC.
These changes in the PL characteristics of Si QDs clearly indicate that the presence of a cationic polymer disrupts the SDS-induced Si QD aggregates. Moreover, it also indicates that, in the ternary system, Si QDs remain in bulk-water-like environments. These results can only be explained if we assume that SDS molecules dissociate from SDS-induced Si QD aggregates to specifically bind with the positively charged sites on the polymer chain, leaving free Si QDs in the solution. To validate this assumption, we visualized this ternary system in our epi-fluorescence microscope.
Figure 6b shows a PL image of the above-mentioned ternary system. In contrast to the PVP−SDS system, no ring-shaped structural arrangements of luminescent spots have been observed in the presence of the cationic PDADMAC polymer. It can be clearly noticed from the image that localized luminescent spots are scattered throughout the slide. Figure 7a shows the fwhm distribution generated from an
further extend the study and investigate the role of specific electrostatic interactions between negatively charged SDS and a cationic polymer on the morphology of the polymer-surfactant complex, we studied the interactions between SDS and a cationic polymer PDADMAC. 3.1.3. PL Characteristics of Si QDs in the Presence of SDS and PDADMAC. Figure 6a shows the effect of 0.1 wt % PDADMAC on the PL spectrum of SDS-induced Si QD aggregates. As mentioned above, the PL band 610 nm signifies the presence of SDS-induced Si QD aggregates. It has been observed that the band at 610 nm completely disappears in the presence of PDADMAC with a concomitant increase in the PL intensity at 455 nm.
Figure 6. (a) PL spectra of Si QDs, Si QDs with 1 mM SDS, and Si QDs with 1 mM SDS and 0.1 wt % PDADMAC. (b) PL image of Si QDs in the presence of SDS and PDADMAC. These changes in the PL characteristics of Si QDs clearly indicate that the presence of a cationic polymer disrupts the SDS-induced Si QD aggregates. Moreover, it also indicates that, in the ternary system, Si QDs remain in bulk-water-like environments. These results can only be explained if we assume that SDS molecules dissociate from SDS-induced Si QD aggregates to specifically bind with the
positively charged sites on the polymer chain, leaving free Si QDs in the solution. To validate this assumption, we visualized this ternary system in our epi-fluorescence microscope.
Figure 6b shows a PL image of the above-mentioned ternary system. In contrast to the PVP−SDS system, no ring-shaped structural arrangements of luminescent spots have been observed in the presence of the cationic PDADMAC polymer. It can be clearly noticed from the image that localized luminescent spots are scattered throughout the slide. Figure 7a shows the fwhm distribution generated from an individual intensity line profile. It is evident from the histogram that most of them are diffraction-limited spots with fwhm 1−3 pixels (0.23−0.69 m). Most of these diffraction-limited spots show PL blinking behavior characteristics of a single particle.
Figure 7. (a) Distribution of fwhm of individual Si QDs in the presence SDS and PDADMAC. PL time traces (b) single-dot and (c) multi-dot luminescent spots. As observed earlier for Si QDs, two distinct kinds of time traces have been observed: one having a clear two-state blinking characteristic with single-step photobleaching (Figure 7b) and the other with gradual intensity decay with no clear photobleaching
Figure 7. (a) Distribution of fwhm of individual Si QDs in the presence SDS and PDADMAC. PL time traces (b) single-dot and (c) multi-dot luminescent spots.
As observed earlier for Si QDs, two distinct kinds of time traces have been observed: one having a clear two-state blinking characteristic with single-step photobleaching (Figure 7b) and the other with gradual intensity decay with no clear photobleaching step (Figure 7c).
Hence, on the basis of our obtained results, we propose a model where negatively charged SDS molecules bind with the neutral PVP through their hydrocarbon tails via hydrophobic interactions with the methylene carbon centers of
step (Figure 7c). Hence, on the basis of our obtained results, we propose a model where negatively charged SDS molecules bind with the neutral PVP through their hydrocarbon tails via hydrophobic interactions with the methylene carbon centers of the pyrrolidone rings of PVP (Scheme 1). On the other hand, binding with cationic PDADMAC occurs through electrostatic interactions between negatively charged sulfate head groups of SDS and positively charged nitrogen centers of PDADMAC. We propose for the PVP−SDS system a type II “necklace and bead”-like structure, while we propose for the PDADMAC−SDS system a type I “necklace and bead”-like structure.
Scheme 1. Proposed Model of the Interaction of SDS-Induced Si-QD Aggregates with PVP and PDADMAC. 3.2. Protein-surfactant interactions. 3.2.1. PL Characteristics of Si-QDs Aggregates in the Presence of BSA. Figure 8a shows the changes in PL spectra of allylamine-capped Si QDs in the presence of 1 mM SDS with varying concentration of BSA from 2 to 8 M range. A marginal increase in the PL intensity at 455 nm with no
noticeable change in the 610 nm band indicates that the surfactant induced aggregates remain unperturbed in the presence of BSA. Earlier, it has been shown that BSA contains a high affinity binding site for very low concentrations of SDS. Addition of very low concentrations of SDS (0.0-0.2 mM) results in specific binding that follows a noncooperative binding region. The cooperative binding of SDS to BSA starts at or near 0.6 mM SDS concentration.
Hence, the unchanged PL behaviors of these surfactant induced aggregates of Si QDs signify that SDS has more affinity to bind at the QDs surface than with the proteins. Even though the surfactant-induced aggregates of Si QDs remain stable in the presence of BSA, we cannot rule out interaction of BSA with these aggregates as a whole due to the presence of free hydrocarbon chains on SDS.
However, significant spectral changes for the aggregated Si QDs have been observed beyond the 10 M BSA concentration. Figure 8b shows the effect of high concentration of BSA on the PL spectra of surfactant-induced aggregates of allylamine-capped Si QDs. With gradual addition of BSA, the PL intensity at 455 nm increases whereas that at 610 nm decreases with an isoemissive point at 542 nm. The aggregated emission at 610 nm totally disappears at 150 M BSA. The complete disappearance of the aggregated PL at 610 nm with increased PL from normal emission at 150 M BSA suggests that SDS molecules specifically bind with the protein rather than allylamine-capped Si QDs. These results strongly signify the concentration-dependent conformational change of BSA with altered hydrophobicity and hydrophilicity. To know the origin of this
Scheme 1. Proposed Model of the Interaction of SDS-Induced Si-QD Aggregates with PVP and PDADMAC.

62
ISrapS Bulletin Vol. 27, Issue Number 1 March 2015
the pyrrolidone rings of PVP (Scheme 1). On the other hand, binding with cationic PDADMAC occurs through electrostatic interactions between negatively charged sulfate head groups of SDS and positively charged nitrogen centers of PDADMAC. We propose for the PVP−SDS system a type II “necklace and bead”-like structure, while we propose for the PDADMAC−SDS system a type I “necklace and bead”-like structure.
3.2. Protein-surfactant interactions.
3.2.1. PL Characteristics of Si-QDs Aggregates in the Presence of BSA. Figure 8a shows the changes in PL spectra of allylamine-capped Si QDs in the presence of 1 mM SDS with varying concentration of BSA from 2 to 8 μM range. A marginal increase in the PL intensity at 455 nm with no noticeable change in the 610 nm band indicates that the surfactant induced aggregates remain unperturbed in the presence of BSA. Earlier, it has been shown that BSA contains a high affinity binding site for very low concentrations of SDS. Addition of very low concentrations of SDS (0.0-0.2 mM) results in specific binding that follows a noncooperative binding region. The cooperative binding of SDS to BSA starts at or near 0.6 mM SDS concentration.
Hence, the unchanged PL behaviors of these surfactant induced aggregates of Si QDs signify that SDS has more affinity to bind at the QDs surface than with the proteins. Even though the surfactant-induced aggregates of Si QDs remain stable in the presence of BSA, we cannot rule out interaction of BSA with these aggregates as a whole due to the presence of free hydrocarbon chains on SDS.
However, significant spectral changes for the aggregated Si QDs have been observed beyond the 10 μM BSA concentration. Figure 8b shows the effect of high concentration of BSA on the PL spectra of surfactant-induced aggregates of allylamine-capped Si QDs. With gradual addition of BSA, the PL intensity at 455 nm increases whereas that at 610 nm decreases with
an isoemissive point at 542 nm. The aggregated emission at 610 nm totally disappears at 150 μM BSA. The complete disappearance of the aggregated PL at 610 nm with increased PL from normal emission at 150 μM BSA suggests that SDS molecules specifically bind with the protein rather than allylamine-capped Si QDs. These results strongly signify the concentration-dependent conformational change of BSA with altered hydrophobicity and hydrophilicity. To know the origin of this concentration-dependent
Figure 8. PL spectra of allylamine-capped Si QDs at λex = 375 nm in the presence SDS and (a) 2-8 µM BSA and (b) 20-150 µM BSA.
conformational dynamics of BSA, we performed DLS measurement.
3.2.2. Evidence of self-oligomerization of BSA. Direct evidence of self-association of
concentration-dependent conformational dynamics of BSA, we performed DLS measurement.
400 450 500 550 600 650 7000
20000
40000
60000
80000
400 450 500 550 600 650 7000
20000
40000
60000
80000 (b)
Wavelength (nm)
PL.
I. (a
.u.)
only QD QD_SDS 1 mM QD_SDS_BSA 2 µµµµM QD_SDS_BSA 4 µµµµM QD_SDS_BSA 6 µµµµM QD_SDS_BSA 8 µµµµM
(a)
PL.
I. (a
.u.)
Wavelength (nm)
only QD QD_SDS 1 mM QD_SDS_BSA 20 µµµµM QD_SDS_BSA 50 µµµµM QD_SDS_BSA 100 µµµµM QD_SDS_BSA 150 µµµµM
Figure 8. PL spectra of allylamine-capped Si QDs at ex = 375 nm in the presence SDS and (a) 2-8 µM BSA and (b) 20-150 µM BSA. 3.2.2. Evidence of self-oligomerization of BSA. Direct evidence of self-association of BSA at high concentration comes from DLS measurement.
4 5 6 7 80
50
100
Inte
nsity
(a) 2 µµµµM
4.260 ± ± ± ± 0.001 nm
1 10 1000
50
100
Inte
nsity
Diameter (nm)
(b)150 uM
4.21 ± ± ± ± 0.15 nm
104.66 ±±±± 1.26 nm
Figure 9. Size distribution histogram from DLS measurement for (a) 2 M and (b) 150 M BSA. Figure 9 shows the changes in the intensity histogram as a function of BSA concentration.
BSA at a concentration of 2 M shows a narrow monodispersed peak with a mean diameter of 4.260 ± 0.001 nm (Figure 9a). However, BSA at a concentration of 150 M shows a bimodal distribution with one peak at 4.04 ± 0.03 nm and the second one at 104.66 ± 1.26 nm (Figure 9b). The first peak with a mean diameter of 4.260 ± 0.001 nm observed for 2 M BSA is in good agreement with the hydrodynamic diameter reported in the literature for monomeric BSA at pH 7.4 [52-54]. The second larger diameter peak that appears at higher BSA concentration can be assigned due to the self-associated BSA as the value of RH increases with an increase in BSA concentration. 3.2.3. Dougnut-shaped PL rings of Protein-Surfactant complexes. To investigate the luminescent behavior of individual Si QDs aggregates in the absence and presence of BSA, we performed PL imaging. Figure 10 shows the PL images of surfactant-induced aggregates of Si QDs in the absence and presence of BSA at pH 7.4. Surfactant-induced aggregates of Si QDs shows bright luminescent spots with broad fwhm ranging from 2 to 7 pixels (Figure 10a). However, when these QDs aggregates spin-cast in the presence of 150 M BSA (Figure 10b), we observed diffraction limited spots (fwfm 2−3 pixels) with characteristic fluorescence blinking and single step photobleaching. This is in accordance with our steady state results where SDS specifically binds with the self-associated BSA, leaving monomeric QDs in solution. Interestingly, in the presence of 2 M BSA these aggregates exhibit uniform ring-shaped doughnut emission patterns (Figure 10c,d).
Figure 9. Size distribution histogram from DLS measurement for (a) 2 μM and (b) 150 μM BSA.

63
ISrapS Bulletin Vol. 27, Issue Number 1 March 2015
BSA at high concentration comes from DLS measurement.
Figure 9 shows the changes in the intensity histogram as a function of BSA concentration.
BSA at a concentration of 2 μM shows a narrow monodispersed peak with a mean diameter of 4.260 ± 0.001 nm (Figure 9a). However, BSA at a concentration of 150 μM shows a bimodal distribution with one peak at 4.04 ± 0.03 nm and the second one at 104.66 ± 1.26 nm (Figure 9b). The first peak with a mean diameter of 4.260 ± 0.001 nm observed for 2 μM BSA is in good agreement with the hydrodynamic diameter reported in the literature for monomeric BSA at pH 7.4 [52-54]. The second larger diameter peak that appears at higher BSA concentration can be assigned due to the self-associated BSA as the value of RH increases with an increase in BSA concentration.
3.2.3. Dougnut-shaped PL rings of Protein-Surfactant complexes. To investigate the luminescent behavior of individual Si QDs aggregates in the absence and presence of BSA, we performed PL imaging. Figure 10 shows the PL images of surfactant-induced aggregates of Si QDs in the absence and presence of BSA at
pH 7.4. Surfactant-induced aggregates of Si QDs shows bright luminescent spots with broad fwhm ranging from 2 to 7 pixels (Figure 10a). However, when these QDs aggregates spin-cast in the presence of 150 μM BSA (Figure 10b), we observed diffraction limited spots (fwfm ∼ 2−3 pixels) with characteristic fluorescence blinking and single step photobleaching. This is in accordance with our steady state results where SDS specifically binds with the self-associated BSA, leaving monomeric QDs in solution. Interestingly, in the presence of 2 μM BSA these aggregates exhibit uniform ring-shaped doughnut emission patterns (Figure 10c,d).
Here, it is important to remember that SDS forms “necklace and bead”-like structure in the presence of BSA in the concentration range of 1−7 μM. Hence, the observed ring-shaped emission patterns of Si QDs aggregates in the presence of BSA is due to the formation of “necklace and bead” structures where the micelle-like aggregates of SDS are associated with the unfolded protein through their free hydrocarbon chain. To the best of our knowledge, this is the first direct microscopic evidence of “necklace and bead”-like structures between BSA−SDS.
3.2.4. Atomic Force Microscopy (AFM) of Protein-Surfactant Complexes. To determine the morphology and size of these fluorescent ring structures, we performed AFM (Figure 11). Clear ring-shaped doughnut structures have
Figure 10. PL images of Si QDs with (a) 1 mM SDS, (b) 1 mM SDS and 150 M BSA, and (c) 1
mM SDS and 2 M BSA. (d) Intensity line profile of the selected doughnut-shaped ring.
Here, it is important to remember that SDS forms “necklace and bead”-like structure in the presence of BSA in the concentration range of 1−7 M. Hence, the observed ring-shaped emission patterns of Si QDs aggregates in the presence of BSA is due to the formation of “necklace and bead” structures where the micelle-like aggregates of SDS are associated with the unfolded protein through their free hydrocarbon chain. To the best of our knowledge, this is the first direct microscopic evidence of “necklace and bead”-like structures between BSA−SDS. 3.2.4. Atomic Force Microscopy (AFM) of Protein-Surfactant Complexes. To determine the morphology and size of these fluorescent ring structures, we performed AFM (Figure 11). Clear ring-shaped doughnut structures have been observed in the presence of 2 M BSA concentrations (Figure 11a,b). Figure 11b shows a close up look of one of the selected ring with its line scan analysis.
Figure 11. (a) AFM image of SDS-induced aggregates of allylamine capped Si QDs in the presence of 2 M BSA. (b) AFM image of the selected ring with its line scan analysis. This type of characteristic line profile in AFM image with no appreciable amount of QDs in the center of the ring clearly signify that surfactant-induced aggregates of Si-QDs warp around the protein to form “necklace and bead”-like structures.
On the basis of our experimental results, we propose a model where BSA in its monomeric native state undergoes unfolding in the presence of SDS-induced Si QDs aggregates and form “necklace and bead”-like structures mainly due to hydrophobic interactions with the free hydrocarbon chain of SDS (Scheme 2). However, BSA at high concentration undergoes self association and adopts a unique conformation where its positively charged residues expose to surrounding environment. We believe that these exposed positively charged residues on BSA specifically interact with negatively charged sulfate head groups of SDS and results in deaggregation of Si QDs (Scheme 2).
Figure 10. PL images of Si QDs with (a) 1 mM SDS, (b) 1 mM SDS and 150 μM BSA, and (c) 1 mM SDS and 2 μM BSA. (d) Intensity line profile of the selected doughnut-shaped ring.
Figure 10. PL images of Si QDs with (a) 1 mM SDS, (b) 1 mM SDS and 150 M BSA, and (c) 1
mM SDS and 2 M BSA. (d) Intensity line profile of the selected doughnut-shaped ring.
Here, it is important to remember that SDS forms “necklace and bead”-like structure in the presence of BSA in the concentration range of 1−7 M. Hence, the observed ring-shaped emission patterns of Si QDs aggregates in the presence of BSA is due to the formation of “necklace and bead” structures where the micelle-like aggregates of SDS are associated with the unfolded protein through their free hydrocarbon chain. To the best of our knowledge, this is the first direct microscopic evidence of “necklace and bead”-like structures between BSA−SDS. 3.2.4. Atomic Force Microscopy (AFM) of Protein-Surfactant Complexes. To determine the morphology and size of these fluorescent ring structures, we performed AFM (Figure 11). Clear ring-shaped doughnut structures have been observed in the presence of 2 M BSA concentrations (Figure 11a,b). Figure 11b shows a close up look of one of the selected ring with its line scan analysis.
Figure 11. (a) AFM image of SDS-induced aggregates of allylamine capped Si QDs in the presence of 2 M BSA. (b) AFM image of the selected ring with its line scan analysis. This type of characteristic line profile in AFM image with no appreciable amount of QDs in the center of the ring clearly signify that surfactant-induced aggregates of Si-QDs warp around the protein to form “necklace and bead”-like structures.
On the basis of our experimental results, we propose a model where BSA in its monomeric native state undergoes unfolding in the presence of SDS-induced Si QDs aggregates and form “necklace and bead”-like structures mainly due to hydrophobic interactions with the free hydrocarbon chain of SDS (Scheme 2). However, BSA at high concentration undergoes self association and adopts a unique conformation where its positively charged residues expose to surrounding environment. We believe that these exposed positively charged residues on BSA specifically interact with negatively charged sulfate head groups of SDS and results in deaggregation of Si QDs (Scheme 2).
Figure 11. (a) AFM image of SDS-induced aggregates of allylamine capped Si QDs in the presence of 2 μM BSA. (b) AFM image of the selected ring with its line scan analysis.

64
ISrapS Bulletin Vol. 27, Issue Number 1 March 2015
been observed in the presence of 2 μM BSA concentrations (Figure 11a,b). Figure 11b shows a close up look of one of the selected ring with its line scan analysis.
This type of characteristic line profile in AFM image with no appreciable amount of QDs in the center of the ring clearly signify that surfactant-induced aggregates of Si-QDs warp around the protein to form “necklace and bead”-like structures.
On the basis of our experimental results, we propose a model where BSA in its monomeric native state undergoes unfolding in the presence of SDS-induced Si QDs aggregates and form “necklace and bead”-like structures mainly due to hydrophobic interactions with the free hydrocarbon chain of SDS (Scheme 2). However, BSA at high concentration undergoes self association and adopts a unique conformation where its positively charged residues expose to surrounding environment. We believe that
BSA that may also contribute to the overall deaggregation process.
Here, it is important to note the discrepancy in the structural morphology of the protein-surfactant and polymer-surfactant complexes. The present protein-surfactant rings are composed with contimuous arrangements of SDS-induced Si QDs aggregates throughout the denatured protein backbone, while the rings of polymer-surfactant complexes were composed with discrete Si QDs aggregates on the random coiled polymer backbone. This is expected because of the fact that BSA contains a greater amount of hydrophobic and hydrophilic residues compared to the neutral PVP polymer.
4. Conclusions
In summary, by using PL spectroscopy and single particle imaging techniques, we have demonstrated the mechanism behind the differential interaction of polymer-surfactant and protein surfactant complex. The unique binary system composed of SDS-induced Si QD aggregates allowed us to clearly distinguish the two well-known ‘necklace and bead”-like morphologies of the polymer-surfactant and protein-surfactant complexes.
Acknowledgements
The authors thank IIT Indore for providing the infrastructure, experimental facilities, and financial support. These works are supported by Council of Scientific and Industrial Research grant no. 01(2695)/12/EMR-II. We thank all our co-workers whose names appear in the references for their contribution. The authors sincerely thank Professor Anindya Datta and Mr. Tuhin Khan from the Indian Institute of Technology Bombay for their help during dynamic light scattering experiment.
References1. Nagarajan, R. J. Chem. Phys. 1989, 90, 1980–1994.2. Langevin, D. Adv. Colloid Interface Sci. 2009, 147-148,
170–177.3. Brackman, J. C.; Engberts, J. B. F. N. Chem. Soc. Rev. 1993,
22, 85–92.
Scheme 2. Proposed Model for Concentration-Dependent Differential Interaction of BSA with SDS-Induced Si-QDs Aggregates: (A) Low and (B) High Concentration of BSA However, we cannot rule out alteration of surface hydrophobicity of self-associated BSA that may also contribute to the overall deaggregation process.
Here, it is important to note the discrepancy in the structural morphology of the protein-surfactant and polymer-surfactant complexes. The present protein-surfactant rings are composed with contimuous arrangements of SDS-induced Si QDs aggregates throughout the denatured protein backbone, while the rings of polymer-surfactant complexes were composed with discrete Si QDs aggregates on the random coiled polymer backbone. This is expected because of the fact that BSA contains a greater amount of hydrophobic and hydrophilic residues compared to the neutral PVP polymer. 4. Conclusions. In summary, by using PL spectroscopy and single particle imaging techniques, we have demonstrated the mechanism behind the differential interaction of polymer-surfactant and protein surfactant complex. The unique
binary system composed of SDS-induced Si QD aggregates allowed us to clearly distinguish the two well-known ‘necklace and bead”-like morphologies of the polymer-surfactant and protein-surfactant complexes. Acknowledgements The authors thank IIT Indore for providing the infrastructure, experimental facilities, and financial support. These works are supported by Council of Scientific and Industrial Research grant no. 01(2695)/12/EMR-II. We thank all our co-workers whose names appear in the references for their contribution. The authors sincerely thank Professor Anindya Datta and Mr. Tuhin Khan from the Indian Institute of Technology Bombay for their help during dynamic light scattering experiment. References. (1) Nagarajan, R. J. Chem. Phys. 1989, 90, 1980–1994. (2) Langevin, D. Adv. Colloid Interface Sci. 2009, 147-148, 170–177. (3) Brackman, J. C.; Engberts, J. B. F. N. Chem. Soc. Rev. 1993, 22, 85–92. (4) Klotz, L. M. Academic Press: New York, 1953; Vol. 1, p 727. (5) Sagre, A. L.; Proietti, N.; Sesta, B.; D’Aprano, A.; Amato, M. E. J. Phys. Chem. B 1998, 102, 10248–10254. (6) Cabane, B. J. Phys. Chem. 1977, 81, 1639–1645. (7) Gao, Z.; Wasylishen, R. E.; Kwak, J. C. J. Phys. Chem. 1991, 95, 462–467. (8) Effing, J. J.; McLennan, I. J.; Os, N. M. V.; Kwak, J. C. T. J. Phys. Chem. 1994, 98, 12397.
Scheme 2. Proposed Model for Concentration-Dependent Differential Interaction of BSA with SDS-Induced Si-QDs Aggregates: (A) Low and (B) High Concentration of BSA
these exposed positively charged residues on BSA specifically interact with negatively charged sulfate head groups of SDS and results in deaggregation of Si QDs (Scheme 2).
However, we cannot rule out alteration of surface hydrophobicity of self-associated

65
ISrapS Bulletin Vol. 27, Issue Number 1 March 2015
4. Klotz, L. M. Academic Press: New York, 1953; Vol. 1, p 727.
5. Sagre, A. L.; Proietti, N.; Sesta, B.; D’Aprano, A.; Amato, M. E. J. Phys. Chem. B 1998, 102, 10248–10254.
6. Cabane, B. J. Phys. Chem. 1977, 81, 1639–1645.7. Gao, Z.; Wasylishen, R. E.; Kwak, J. C. J. Phys. Chem. 1991,
95, 462–467.8. Effing, J. J.; McLennan, I. J.; Os, N. M. V.; Kwak, J. C. T. J.
Phys. Chem. 1994, 98, 12397.9. Xia, J.; Dubin, P. L.; Kim, Y. J. Phys. Chem. 1992, 96, 6805–
6811.10. Nizri, G.; Schmidt, M. J.; Cohen, Y.; Talmon, Y. Langmuir
2004, 20, 4380–4385.11. Fadnavis, N.; Engberts, J. B. F. N. J. Am. Chem. Soc. 1984,
106, 2636–2640.12. Witte, F. M.; Engberts, J. B. F. N. J. Org. Chem. 1987, 52,
4767–4772.13. Lisi, R. D.; Simone, D. D.; Milioto, S. J. Phys. Chem. B 2000,
104, 12130–12136.14. Kevelam, J.; Breemen, J. F. L. V.; Blokzijl, W.; Engberts, J.
B. F. N. Langmuir 1996, 12, 4709–4717.15. Folmer, B. M.; Kronberg, B. Langmuir 2000, 16, 5987–5992.16. Mukherjee, S.; Dan, A.; Bhattacharya, S. C.; Panda, A. K.;
Moulik, S. P. Langmuir 2011, 27, 5222–5233.17. Chandar, P.; Somasundaran, P.; Turro, N. J. Macromolecules
1988, 21, 950–953.18. Sen, S.; Sukul, D.; Dutta, P.; Bhattacharyya, K. J. Phys. Chem.
B 2002, 106, 3763–3769.19. Sen, S.; Sukul, D.; Dutta, P.; Bhattacharyya, K. J. Phys. Chem.
A 2001, 105, 7495–7500.20. Chakraborty, A.;Seth, D.; Setua, P.; Sarkar, N. J. Chem. Phys.
2008, 128, 204510.21. Panmai, S.; Prud’homme, R. K.; Peiffer, D. G.; Jockusch, S.;
Turro, N. J. Langmuir 2002, 18, 3860–3864.22. Dan, A.; Ghosh, S.; Moulik, S. P. J. Phys. Chem B 2008, 112,
3617–3624.23. Prasad, M.; Palepu, R.; Moulik, S. P. Colloid Polym. Sci. 2006,
284, 871–878.24. Wang, G.; Olofsson, G. J. Phys. Chem. B 1998, 102, 9276–
9283.25. Shen, Q.; Wei, H.; Wang, L.; Zhou, Y.; Zhao, Y.; Zhang,
Z.; Wang, D.; Xu, G.; Xu, D. J. Phys. Chem. B 2005, 109, 18342–18347.
26. Majhi, P. R.; Moulik, S. P.; Burke, S. E.; Rodgers, M.; Palepu, R. J. Colloid Interface Sci. 2001, 235, 227–234.
27. Roscigno, P.; Asaro, F.; Pellizer, G.; Ortona, O.; Paduano, L. Langmuir 2003, 19, 9638–9644.
28. Hou, S. S.; Tzeng, J. K.; Chuang, M. H. Soft Matter 2010, 6, 409–415.
29. Turro, N. J.; Lei, X.-G.; Ananthapadmanabhan, K. P.; Aronson, M. Langmuir 1995, 11, 2525−2533.
30. Gelamo, E. L.; Silva, C. H. T. P.; Imasato, H.; Tabak, M. Biochim. Biophys. Acta 2002, 1594, 84−99.
31. Mesa, C. L. J. Colloid Interface Sci. 2005, 286, 148−157.32. Chakraborty, T.; Chakraborty, I.; Moulik, S. P.; Ghosh, S.
Langmuir 2009, 25, 3062−3074.33. Naidu, K. T.; Prabhu, N. P. J. Phys. Chem. B 2011, 115,
14760−14767.34. Otzen, D. Biochim. Biophys. Acta 2011, 1814, 562−591.35. Anand, U.; Jash, C.; Mukherjee, S. J. Phys. Chem. B 2010,
114, 15839−15845.36. Chakraborty, A.; Seth, D.; Setua, P.; Sarkar, N. J. Phys. Chem.
B 2006, 110, 16607−16617.37. Sahu, K.; Roy, D.; Mondal, S. K.; Karmakar, R.; Bhattacharyya,
K. Chem. Phys. Lett. 2005, 404, 341−345.38. Paul, B. K.; Samanta, A.; Guchhait, N. J. Phys. Chem. B 2010,
114, 6183−6196.39. De, D.; Santra, K.; Datta, A. J. Phys. Chem. B 2012, 116,
11466−11472.40. Oakes, J. J. Chem. Soc. Faraday Trans. 1 1974, 70,
2200−2209.41. Esfandiari, N. M.; Blum, S. A. J. Am. Chem. Soc. 2011, 133,
18145–18147.42. Hensle, E. M.; Blum, S. A. J. Am. Chem. Soc. 2013, 135,
12324–12328.43. Lee, J. E.; Stepanenko, V.; Yang, J.; Yoo, H.; Schlosser, F.;
Bellinger, D.; Engels, B.; Scheblykin, I. G.; Würthner, F.; Kim, D. ACS Nano 2013, 7, 5064−5076.
44. Zhuang, X.; Bartley, L.; Babcock, H.; Russell, R.; Ha, T.; Herschlag, D.; Chu, S. A Science 2000, 288, 2048−2051.
45. Gahlmann, A.; Ptacin, J. L.; Grover, G.; Quirin, S.; von Diezmann, A. R.; Lee, M. K.; Backlund, M. P.; Shapiro, L.; Piestun, R.; Moerner, W. E. Nano Lett. 2013, 13, 987−993.
46. Chatterjee, S.; Mukherjee, T. K. J. Phys. Chem. C 2013, 117, 10799−10808.
47. Warner, J. H.; Hoshino, A.; Yamamoto, K.; Tilley, R. D. Angew. Chem., Int. Ed. 2005, 44, 4550−4554.
48. Vasic, M. R.; Cola, L. D.; Zuilhof, H. J. Phys. Chem. C 2009, 113, 2235−2240.
49. Tanaka, N.; Takemura, M.; Konno, T.; Kunugi, S. Macromolecules 1998, 31, 8840−8844.
50. Tsvetkov, V. B.; Solov’eva, A. B.; Nubarov, N. S. M. Phys. Chem. Chem. Phys. 2014, 16, 10903−10913.
51. Lakowicz, J. R. Principles of Fluorescence Spectroscopy, 2nd ed.; Academic Press: New York, 1999.
52. Valstar, A.; Almgren, M.; Brown, W.; Vasilescu, M. Langmuir 2000, 16, 922−927.
53. Castelletto, V.; Krysmann, M.; Kelarakis, A.; Jauregi, P. Biomacromolecules 2007, 8, 2244−2249.
54. Zhao, Y.; Li, F.; Carvajal, M. T.; Harris, M. T. J. Colloid Interface Sci. 2009, 332, 345−353.

66
ISrapS Bulletin Vol. 27, Issue Number 1 March 2015
Mr. Surajit Chatterjee is a Ph.D scholar in the Department of Chemistry at Indian Institute of Technology Indore. He obtained his Master degree in Chemistry from NIT Durgapur in 2011. He is currently pursuing his Ph.D. research work on photoluminescence spectroscopy and microscopy of water soluble biocompatible quantum dots.
Dr. Tushar Kanti Mukherjee is an Assistant Professor in the Department of Chemistry at Indian Institute of Technology Indore. He received his Master degree from Banaras Hindu University in 2003 and Ph.D. from Indian Institute of Technology Bombay in 2007. After a postdoctoral stay in Columbia university, he joined as a faculty at Indian Institute of Technology Indore. His current research interest includes Spectroscopy and single particle luminescence microscopy of metal and semiconductor nanoparticles.

67
ISrapS Bulletin Vol. 27, Issue Number 1 March 2015
Adsorption of mixed surfactants at air-water interface: A sum-frequency generation study
Ankur Saha, H.P. Upadhyaya, Awadhesh Kumar*, P.D. NaikRadiation & Photochemistry Division,Bhabha Atomic Research Centre, Trombay, Mumbai – 400 085.
Email: [email protected]
AbstractThe effects of various compositions in mixed surfactant solutions of SDS (sodium dodecyl sulfate), an anionic surfactant, and CTAB (cetyltrimethylammonium bromide), a cationic surfactant, at air-water interface have been investigated using sum-frequency generation vibrational nonlinear optical spectroscopy. The work is focused on understanding the temporal evolution of ordering of interfacial water molecules at the charged air-water interface, and aggregation behaviour of the catanionic system of CTAB and SDS.
1. INTRODUCTION
Studies at surfaces and interfaces are very important, since an interfacial region between bulk phases consists of only a small fraction of the material, but frequently these are the sites of reactions, and hence dominate the macroscopic properties. The study of surfaces under ultra-high vacuum (UHV) conditions is carried out by several experimental techniques to obtain chemical and structural information. Many electron-based techniques, such as low-energy electron diffraction (LEED), reflection high-energy electron diffraction (RHEED), auger electron spectroscopy (AES), x-ray photoemission spectroscopy (XPS) and high resolution electron energy-loss spectroscopy (HREELS), give an access to various aspects of surface properties. Since these techniques are electron-based and electrons have limited mean free path, these techniques are not suitable to probe an interface between dense media. Although optical techniques can be used as probes for interfacial studies, linear optical techniques suffer from a significant contribution from the bulk phases in contact at the interface. The interfacial contribution is obscured by the bulk signal, since the latter is many orders of magnitude greater than the former.
Thus, probing a small interfacial region is quite challenging, because of interferences from the bulk media. One requires a surface selective technique to probe an interface, and avoid any contribution from the bulk phases. Second-order nonlinear optical processes, such as second harmonic generation (SHG) and sum-frequency generation (SFG), are interface specific and are ideal to probe any buried interface accessible by light.1,2 These processes are forbidden under the electric-dipole approximation in the bulk of media having an inversion symmetry. At the interface between centrosymmetric media, the symmetry is broken and these SHG and SFG processes are allowed. These techniques can be applied to a broad range of surfaces and interfaces.
The SFG technique is surface-sensitive and quite selective to probe vibrational spectra of molecules present solely at the interfaces.2,3 The SFG process is primarily a three-wave mixing with two input beams and the third signal beam. The two input beams interact temporally and spatially in a medium at the interface, and the coherent SFG signal is generated due to second-order nonlinear susceptibility, χ(2). One of these two input beams is in the visible frequency region (generally fixed at 532 nm) and the other is in IR frequency region with tunability. The SFG signal is generated at the frequency, ωSFG, which

68
ISrapS Bulletin Vol. 27, Issue Number 1 March 2015
is the sum of the visible (ωVIS) and IR (ωIR) input frequencies, i.e.
ωSFG = ωVIS + ωIR. (1)
The signal beam direction is given by the phase-matching condition,
kSFG = kVIS + kIR, (2)
where ki is the wave vector of the beam i. Since these input visible and IR beams interact at the interface at angles θVIS and θIR with the normal to the interface (Figure 1), the general phase-matching condition (eq. 2) can be written as follows (eq. 3),
kSFG sinθSFG = kVIS sinθVIS + kIR sinθIR. (3)
A three-wave-mixing experiment is performed employing short (ns or ps) or ultrashort (fs) laser pulses, since the signal is proportional to the reciprocal of the laser pulse width. Depending on the pulse duration, two main schemes are commonly employed to detect the vibrational SFG (VSFG) signal. For the short laser pulses, the IR wavelength is scanned across the vibrational band, and the signal is recorded for each wavelength after three stages of spatial, spectral and polarization filtration to remove the reflected input visible light. The spectral resolution is determined by the width of the IR laser, which is typically less than 1 cm-1 for ns systems, 1-20 cm-1 for ps systems. For fs lasers, the IR frequency is not required to be scanned to obtain a vibrational spectrum. Since the bandwidth of such lasers is of the order of ~100 cm-1 (for ~100 fs), a spectrum can be measured over this interval without scanning the IR frequency. This scheme is known as broadband SFG spectroscopy, which offers the advantage of a shorter acquisition time.
These VSFG spectra, measured under different polarization geometries, can provide valuable information on polar orientation, molecular conformation, tilt angle of the adsorbate to the surface, etc. However, heterodyne-detected VSFG studies provide direct information on these structural parameters at an interface.4
Polar ordering of adsorbed molecules at the interfaces is important for surface modifications and chemical reactions. The SFG technique is capable of probing various interfaces, such as liquid-vapour, liquid-liquid, solid-vapour, etc.
In addition to the structural information at an interface, time-domain studies of the dynamical aspects of molecular vibration at surfaces can also be performed, using SFG spectroscopy.3 This technique helps in understanding energy transfer at surfaces, which is of a fundamental interest for investigating bond-selective photochemistry through selective vibrational excitation. Fundamental studies on the surface/interface dynamics, such as vibrational relaxation, dephasing, lateral coupling (direct or indirect through the substrate), and charge transfer, of simple adsorbate systems are amenable to this technique. VSFG spectroscopy allows time-domain investigations of relaxation at surfaces, because of its inherent time resolution based on the laser system employed. Thus, the vibrational relaxation at the surface can be directly measured using a SFG pump-probe scheme.
Surfactants are widely used for several industrial applications. Hence, the adsorption of these molecules at interfaces, particularly air-water interface, is an important area of research in surface science. Recently, aqueous mixtures of cationic and anionic surfactants have received immense attention, particularly because of their higher surface activity than the individual components. Among several techniques employed to investigate the microscopic structure and morphological properties, the VSFG is ideally suited because of its surface sensitivity and high selectivity.
We have investigated effects of various compositions in mixed surfactant solutions of SDS and CTAB at an air-water interface using VSFG nonlinear optical spectroscopy. The main objective of this study was to investigate ordering of interfacial water molecules at the charged air-water interface, and aggregation behaviour of the catanionic system of CTAB and SDS with

69
ISrapS Bulletin Vol. 27, Issue Number 1 March 2015
varying compositions in aqueous solutions. Recently, some studies have been reported on aggregation behaviour of mixed charged surfactants, employing IR external reflection spectroscopy5 and Langmuir-Blodgett technique6 at the air-water interface.
2. EXPERIMENTAL
Vibrational SFG spectroscopy is based on a coherent second order non-linear process, which involves two input beams of fixed visible (ωvis) and tunable infrared frequencies (ωIR). The laser at ωvis is fixed at 532 nm, and that at ωIR is tuned in the 2.3-10.0 µm spectral range to measure the vibrational spectra at an interface. The experimental details are described in our earlier publication.7 Briefly, the visible beam is generated by frequency doubling of the fundamental output of a Nd:YAG laser (PL2241B, Ekspla, Lithuania). The tunable IR beam is generated in a difference frequency generator (DFG) by mixing the output (420-680 nm) of an optical parametric generator (OPG) with the fundamental output (1064 nm) of the Nd:YAG laser in a silver thiogallate (AgGaS2) crystal. The OPG (PG401, Ekspla) was pumped by the third harmonic (355 nm) beam of the Nd:YAG laser, using lithium triborate (LiB3O5) as a non-linear crystal. These two input beams are passed through apertures, energy attenuators and polarizers, and finally loosely focused at the interface. The angles of incidence θIR and θVIS were kept at 55° and 60° for the IR and visible laser beams, respectively. The visible beam is also passed through a delay line for proper temporal overlap of both the beams at the interface. The reflected IR and visible beams were blocked, and the SFG signal beam was separated, and detected with a photomultiplier tube (PMT) after spatial, polarization and spectral filtering. Four different polarization schemes (ssp, sps, pss and ppp) are possible for SFG experiments, and these are denoted based on the polarization states of the SFG, visible and IR beams in the sequence. For example, the polarization ssp implies that the SFG and visible beams are s-polarized, whereas the IR beam is p-polarized.
In all our experiments, the ssp polarization has been used.
Two different types of SFG experiments have been performed. For measuring the vibrational spectra at an interface, the IR wavelength was scanned in the appropriate range. The CH and OH vibrational stretching regions were scanned in the range of 2750-3000 cm-1 and 3000-3600 cm-1, respectively. Each scan was obtained with a spectral resolution of 2 and 4 cm-1 for the CH and OH spectral regions, respectively, and an average of 100 laser shots per experimental data. In another type of experiment, the temporal evolution of a vibrational band was measured. In this experiment, the frequency of the tunable IR laser beam was also fixed, at the maximum of a vibrational band, and the SFG signal was measured at different time by scanning the time delay.
For the VSFG studies on mixed surfactants at the air-water interface, aqueous solutions of SDS (~1 mM) and CTAB (~1 mM) were mixed in different volume ratios of 1:9, 3:7, 1:1, 7:3 and 9:1. Surfactant concentration of each solution was kept much lower than its critical micelle concentration (CMC), 8.1 mM for SDS and 0.924 mM for CTAB. A known volume of this mixture was spread at the air-water interface. Then the interfacial region was probed in the CH and OH vibrational regions. All the experiments were conducted in a circular glass trough (~40 mm in diameter), which was mounted on a six-axes
Figure 1: Schematic experimental set up for measurement of VSFG spectra at the air-water interface.
4
the IR beam is p-polarized. In all our experiments, the ssp polarization has been used.
Two different types of SFG experiments have been performed. For measuring the vibrational spectra at an interface, the IR wavelength was scanned in the appropriate range. The CH and OH vibrational stretching regions were scanned in the range of 2750-3000 cm-1 and 3000-3600 cm-1,respectively. Each scan was obtained with a spectral resolution of 2 and 4 cm-1 for the CH and OH spectral regions, respectively, and an average of 100 laser shots per experimental data. In another type of experiment, the temporal evolution of a vibrational band was measured. In this experiment, the frequency of the tunable IR laser beam was also fixed, at the maximum of a vibrational band, and the SFG signal
was measured at different time by scanning the time delay.
For the VSFG studies on mixed surfactants at the air-water interface, aqueous solutions of SDS (~1 mM) and CTAB (~1 mM) were mixed in different volume ratios of 1:9, 3:7, 1:1, 7:3 and 9:1. Surfactant concentration of each solution was kept much lower than its critical micelle concentration (CMC), 8.1 mM for SDS and 0.924 mM for CTAB. A known volume of this mixture was spread at the air-water interface. Then the interfacial region was probed in the CH and OH vibrational regions. All the experiments were conducted in a circular glass trough (~40 mm in diameter), which was mounted on a six-axes mount for spatial overlapping of the laser beams at the interface (shown in Figure 1).
Figure 1: Schematic experimental set up for measurement of VSFG spectra at the air-water interface.

70
ISrapS Bulletin Vol. 27, Issue Number 1 March 2015
mount for spatial overlapping of the laser beams at the interface (shown in Figure 1).
In order to support the VSFG results on time dependent adsorption behaviour of catanionic surfactant, surface pressure-time (π-t) adsorption kinetics was measured. In addition, a Brewster angle microscope was employed for microscopic observation of the surface morphology.
3. RESULTS & DISCUSSION
3.1 SDS OR CTAB SOLUTION AT THE INTERFACE
Vibrational SFG spectra of water show broad, but weak, peaks at ~3200 cm-1 and ~3400 cm-1, due to the OH symmetric vibrational stretching frequencies of hydrogen-bonded water molecules. In addition, a sharp peak is observed at 3750 cm-1 due to the OH vibrational frequency of free water molecules. In the presence of either SDS or CTAB aqueous solution, we observed a significant enhancement in the intensities of the OH stretching modes of hydrogen-bonded interfacial water molecules (shown in Figure 2). The observed enhancement is attributed to ordering of interfacial water molecules induced by the large electrostatic field due to the charged surfactants.8 This explanation is supported by VSFG spectra of mixed surfactants of SDS and CTAB (vide infra), which are oppositely charged.
With a 1:1 composition of solution, opposite charges on these surfactant molecules are cancelled resulting in the disappearance of the OH peaks. Similarly, the vibrational region of the CH stretching frequencies at the air-water interface was probed to investigate the conformational order of the alkyl chain of surfactant molecules. With increasing bulk concentration of SDS (up to 1.6 mM) and CTAB (up to 0.2 mM), intensities of vibrational bands increased due to an increase in their surface concentrations. However, a decrease in vibrational frequencies of vs(CH2) was observed with increasing bulk concentration of SDS, indicating an increase in the conformational order of the alkyl chain, such as a decrease in the gauche and increase in trans conformers. Similarly, with only CTAB solution, vibrational peaks have been observed at 2848 cm-1, 2876 cm-1
and ~2917 cm-1, and intensities of all these peaks increased with the bulk concentration of CTAB.
3.2 MIXED SURFACTANTS AT THE INTERFACE
A significant change was observed in the CH spectral region of the mixed surfactants. The spectra of the CTAB-rich 9:1 ratio and the SDS-rich 1:9 ratio are almost similar to CTAB and SDS spectra, respectively. Due to low concentration of SDS, no peaks could be observed for the 9:1 ratio. With CTAB-rich ratios of 9:1 and 7:3, the absorption at ~2946 cm-1 is not observed, because of a destructive interference between the OH and the CH3 Fermi-resonance modes in CTAB. However with the 1:1 ratio, a strong new peak at ~2940 cm-1, close to v(CH3-FR) peak at 2946 cm-1 of SDS, is observed. The spectral features of the 1:1 composition are very much different from other compositions. For the 1:1 composition, the intensity of the vs(CH2) band at ~2850 cm-1 is reduced and that for the va(CH2) band at ~2917 cm-1 (due to CTAB) is negligibly small. But the intensities of the CH3 modes are very much enhanced, and are the maximum among all compositions. In addition, the vs(CH2) band at ~2850 cm-1 has shifted to a lower wavenumber
Figure 2: VSFG spectra of neat water and aqueous solution of SDS and CTAB at the air-water interface.
5
In order to support the VSFG results on time dependent adsorption behaviour of catanionic surfactant, surface pressure-time (-t) adsorption kinetics was measured. In addition, a Brewster angle microscope was employed for microscopic observation of the surface morphology.
3. RESULTS & DISCUSSION
3.1 SDS OR CTAB SOLUTION AT THE INTERFACE
Vibrational SFG spectra of water show broad, but weak, peaks at ~3200 cm-1 and ~3400 cm-1, due to the OH symmetric vibrational stretching frequencies of hydrogen-bonded water molecules. In addition, a sharp peak is observed at 3750 cm-1 due to the OH vibrational frequency of free water molecules. In the presence of either SDS or CTAB aqueous solution, we observed a significant enhancement in the intensities of the OH stretching modes of hydrogen-bonded interfacial water molecules (shown in Figure 2). The observed enhancement is attributed to ordering of interfacial water molecules induced by the large electrostatic field due to the charged surfactants.8 This explanation is supported by VSFG spectra of mixed surfactants of SDS and CTAB (vide infra),which are oppositely charged. With a 1:1 composition of solution, opposite charges on these surfactant molecules are cancelled resulting in the disappearance of the OH peaks.
2800 2900 3000 3100 3200 3300 3400 3500 3600
0
50
100
150
200
(A) H2O(B) H2O x 10(C) CTAB (0.35 mM)(D) SDS (0.90 mM)
(D)
(C)
(B)
(A)
SFG
inte
nsity
Wavenumbers
Figure 2: VSFG spectra of neat water and aqueous solution of SDS and CTAB at the air-water interface.
Similarly, the vibrational region of the CH stretching frequencies at the air-water interface was probed to investigate the conformational order of the alkyl chain of surfactant molecules. With increasing bulk concentration of SDS (up to 1.6 mM) and CTAB (up to 0.2 mM), intensities of vibrational bands increased due to an increase in their surface concentrations. However, a decrease in vibrational frequencies of vs(CH2) was observed with increasing bulk concentration of SDS, indicating an increase in the conformational order of the alkyl chain, such as a decrease in the gauche and increase in trans conformers. Similarly, with only CTAB solution, vibrational peaks have been observed at 2848 cm-1, 2876 cm-1 and ~2917 cm-1, and intensities of all these peaks increased with the bulk concentration of CTAB.
3.2 MIXED SURFACTANTS AT THE INTERFACE
A significant change was observed in the CH spectral region of the mixed surfactants. The spectra of the CTAB-rich 9:1 ratio and the SDS-rich 1:9 ratio are

71
ISrapS Bulletin Vol. 27, Issue Number 1 March 2015
of 2846 cm-1. Even the new peak at ~2940 cm-1
has shifted to lower wavenumber by about 3 cm-1, and this peak can be assigned to the ν(CH3-FR) band of a complex between CTAB and SDS surfactant molecules. VSFG spectra for different compositions of mixed surfactants are shown in Figure 3. The vibrational frequencies in VSFG spectra of surfactants with their assignment are given in Table I. Thus, the observed VSFG spectra from the mixed surfactant system are dominated by the vs(CH3) and CH3 Fermi-resonance bands positions, suggesting highly ordered conformation and low gauche conformation with respect to individual surfactant component.
Table I.: Assignment of vibrational frequencies in VSFG spectra with ssp polarization of surfactants at air-water interface.
Assignment of vibrational frequencies
Observed vibrational frequencies/cm-1
SDS CTAB 1:1-Complex
CH2 symmetric stretch, νs(CH2)
2850-2857
2848 2846
CH3 symmetric stretch, νs(CH3)
2879-2881
2876 2877
CH2 antisymmetric stretch, νa(CH2)
~2924 2914-2920
--
CH3 Fermi-resonance, ν(CH3-FR)
2944-2947
-- 2940
Similar to the CH spectral region, a significant change was observed in the OH spectral region of the mixed surfactants. However unlike the CH stretch intensities, which increase, the OH intensities decrease as we move towards the 1:1 composition of SDS and CTAB surfactants. The observed enhancement in the intensities of the OH stretching modes in the presence of either SDS or CTAB, attributed to ordering of interfacial water molecules induced by the large electrostatic field due to the charged surfactants, gets reduced in the mixed surfactants due to the neutralization of opposite charges on these surfactants. With a 1:1 composition, opposite charges on these
Figure 3: VSFG spectra of the CH region of mixed SDS and CTAB solutions with different compositions at the air-water interface.
7
2850 2900 2950 3000
0
100
200
300
400
500
600
D
B
A
D
C
C
ED
CBA
SDS : CTAB1 : 9 (A)3 : 7 (B)1 : 1 (C)7 : 3 (D)9 : 1 (E)
SFG
inte
nsity
Wavenumber
Figure 3: VSFG spectra of the CH region of mixed SDS and CTAB solutions with different compositions at the air-water interface.
Similar to the CH spectral region, a significant change was observed in the OH spectral region of the mixed surfactants. However unlike the CH stretch intensities, which increase, the OH intensities decrease as we move towards the 1:1 composition of SDS and CTAB surfactants. The observed enhancement in the intensities of the OH stretching modes in the presence of either SDS or CTAB, attributed to ordering of interfacial water molecules induced by the large electrostatic field due to the charged surfactants, gets reduced in the mixed surfactants due to the neutralization of opposite charges on these surfactants. With a 1:1 composition, opposite charges on these surfactant molecules are cancelled resulting in the disappearance of the OH peaks (shown in Figure 4). One can assume that for this composition approximately half of the interfacial water molecules are oriented with oxygen atoms towards the bulk water phase, and the other half are oriented with oxygen atoms towards the air. This results into null orientation of interfacial water molecules, leading to disappearance of the OH peaks. For other compositions, the OH peak intensity is less
than that observed for the individual component. Thus, SFG results on both the OH and CH spectral regions suggest formation of an insoluble 1:1 complex between CTAB and SDS molecules, and thus these molecules are retained at the surface. These complex molecules are formed to the greater extent for the 1:1 ratio of the surfactants.
3000 3300 3600
0
100
200
300
400
Mixture (1:1)
SDS
CTAB
SFG
inte
nsity
Wavenumber
Figure 4: VSFG spectra of aqueous solution of individual and mixed (1:1) surfactants of SDS and CTAB at the air-water interface.
3.3 TIME-DEPENDENT MEASUREMENTS
Time-dependent VSFG spectra were measured to understand the dynamics of the 1:1 complex formation between SDS and CTAB mixed components. Different bulk concentrations (1-35 each) of the 1:1 composition were probed. A procedure for the measurement was adopted to take the equilibrated aqueous solution of one surfactant in a trough, and subsequently the required volume of another surfactant solution was added to it, and then the time delay scan was immediately started fixing the wavelength either at 2877 cm-1 or 2940 cm-1 in the CH-region, and ~3140 cm-1 in the OH spectral region. A typical temporal profile of the mixed surfactant in the CH-
surfactant molecules are cancelled resulting in the disappearance of the OH peaks (shown in Figure 4). One can assume that for this composition approximately half of the interfacial water molecules are oriented with oxygen atoms towards the bulk water phase, and the other half are oriented with oxygen atoms towards the air. This results into null orientation of interfacial water molecules, leading to disappearance of the OH peaks. For other compositions, the OH
Figure 4: VSFG spectra of aqueous solution of individual and mixed (1:1) surfactants of SDS and CTAB at the air-water interface.

72
ISrapS Bulletin Vol. 27, Issue Number 1 March 2015
peak intensity is less than that observed for the individual component. Thus, SFG results on both the OH and CH spectral regions suggest formation of an insoluble 1:1 complex between CTAB and SDS molecules, and thus these molecules are retained at the surface. These complex molecules are formed to the greater extent for the 1:1 ratio of the surfactants.
3.3 TIME-DEPENDENT MEASUREMENTS
Time-dependent VSFG spectra were measured to understand the dynamics of the 1:1 complex formation between SDS and CTAB mixed components. Different bulk concentrations (1-35 µΜ each) of the 1:1 composition were probed. A procedure for the measurement was adopted to take the equilibrated aqueous solution of one surfactant in a trough, and subsequently the required volume of another surfactant solution was added to it, and then the time delay scan was immediately started fixing the wavelength either at 2877 cm-1 or 2940 cm-1 in the CH-region, and ~3140 cm-1 in the OH spectral region. A typical temporal profile of the mixed surfactant in the CH-region shows an induction time (up to 600 s) after which a fast growth is observed, followed by a slow growth for hours. These profiles strongly depend on the total bulk concentration of surfactants (shown in Figure 5). The induction time decreases and the growth kinetics become faster at increased total bulk concentration. The induction time and the growth kinetics also depend on the relative ratios of the surfactants. The 1:1 composition has the shortest induction time, and the fastest growth kinetics. Thus, the induction time gets longer and the growth kinetics slower as the composition shifts away from the 1:1 composition. The induction time for formation of the fast component is related to the frequency of encounters between two surfactant molecules of opposite charges, SDS and CTAB, leading to the adsorption of sufficient number density of complex molecules at the interface for the SFG detection. This frequency is the highest for the 1:1 ratio, implying the shortest induction time. The initial growth intensity is greater for
a CTAB-rich composition, because of greater surface activity of CTAB than SDS. Thus, the CTAB molecules have a greater probability of residing at the interface than the SDS molecules, and these interfacial CTAB molecules can attract the SDS molecules and pull them from the bulk to form the complex at the interface.
The intensities of the CH stretching bands of the complex for the 1:1 ratio keep on growing for a longer time, signifying an increase in the conformational order of the alkyl chain as the complex stabilizes during formation, and adsorption at the interface. However, the time evolution observed for the OH stretching frequency of interfacial water molecules at ~3140 cm-1 is significantly different. Under similar experimental conditions, the intensity of the OH stretching band is reduced to zero much early (shown in Figure 6). We should keep in mind that the VSFG intensity depends on both the number density and the orientation of adsorbed species at the interface. Moreover, the intensity of the OH band is due to the presence of the charges on the head groups of the surfactant molecules. Thus, the results suggest that the complex formation starts with an interaction between the head groups of the charged surfactants present at the interface and sub-surface. In the process, the alkyl chains of both the surfactant molecules in the complex are
Figure 5: Temporal evolution at 2877 cm-1 of 1:1 complex of SDS and CTAB at different bulk concentrations.
8
region shows an induction time (up to 600 s) after which a fast growth is observed, followed by a slow growth for hours. These profiles strongly depend on the total bulk concentration of surfactants (shown in Figure 5). The induction time decreases and the growth kinetics become faster at increased total bulk concentration The induction time and the growth kinetics also depend on the relative ratios of the surfactants. The 1:1 composition has the shortest induction time, and the fastest growth kinetics. Thus, the induction time gets longer and the growth kinetics slower as the composition shifts away from the 1:1 composition. The induction time for formation of the fast component is related to the frequency of encounters between two surfactant molecules of opposite charges, SDS and CTAB, leading to the adsorption of sufficient number density of complex molecules at the interface for the SFG detection. This frequency is the highest for the 1:1 ratio, implying the shortest induction time. The initial growth intensity is greater for a CTAB-rich composition, because of greater surface activity of CTAB than SDS. Thus, the CTAB molecules have a greater probability of residing at the interface than the SDS molecules, and these interfacial CTAB molecules can attract the SDS molecules and pull them from the bulk to form the complex at the interface.
0 20 40 60 80 100 120
0
100
200
300
400 15 M
7 M4 M
2 M
SFG
inte
nsity
Time / min.
Figure 5: Temporal evolution at 2877 cm-1 of 1:1 complex of SDS and CTAB at different bulk concentrations.
The intensities of the CH stretching bands of the complex for the 1:1 ratio keep on growing for a longer time, signifying an increase in the conformational order of the alkyl chain as the complex stabilizes during formation, and adsorption at the interface. However, the time evolution observed for the OH stretching frequency of interfacial water molecules at ~3140 cm-1 is significantly different. Under similar experimental conditions, the intensity of the OH stretching band is reduced to zero much early (shown in Figure 6). We should keep in mind that the VSFG intensity depends on both the number density and the orientation of adsorbed species at the interface.Moreover, the intensity of the OH band is due to the presence of the charges on the head groups of the surfactant molecules. Thus, the results suggest that the complex formation starts with an interaction between the head groups of the charged surfactants present at the interface and sub-surface. In the process, the alkyl chains of both the surfactant molecules in the complex are brought closer to each other. Subsequently, the alkyl chains re-arrange and further come closer increasing their conformational order, which leads to an increase in the CH intensity. The formation of monolayer because of adsorption from the bulk at the

73
ISrapS Bulletin Vol. 27, Issue Number 1 March 2015
brought closer to each other. Subsequently, the alkyl chains re-arrange and further come closer increasing their conformational order, which leads to an increase in the CH intensity. The formation of monolayer because of adsorption from the bulk at the interface continues till saturation. In the bulk solution, both free surfactant molecules and their neutral catanionic complex exist. Since the OH VSFG intensity is decreased much earlier with the CH intensity still increasing, the adsorption of CTAB and SDS is simultaneous at the interface, or the catanionic complex from the bulk phase is getting directly adsorbed gradually at the interface to form the monolayer. The mechanism of the simultaneous adsorption of both the cationic and anionic surfactants at the air-water interface can explain the decrease in the intensity of the OH band and the initial increase in that of the CH band till the time when the former is completely vanished. However, this mechanism cannot explain further increase in the VSFG intensity of the CH bands at 2876 and 2940 cm-1 till saturation. These results suggest that the initial adsorption (till the OH intensity vanishes) can be due to both the mechanisms. But, the later temporal increase in the SFG intensity of the CH bands is predominantly due to the direct adsorption of the complex from the sub-surface and ordering of alkyl chains of the adsorbed surfactants with time.
The π-t adsorption kinetics of the mixed surfactants CTAB and SDS were measured to support the results on time-dependant SFG studies. These π-t adsorption curves are qualitatively similar to the temporal profiles of SFG, except for the absence of the fast growth component in the former. Like SFG temporal profiles, the π-t adsorption curves also show induction time, which corresponds to the minimum surface concentration, required to change the surface pressure, and slow adsorption kinetics, but not the fast growth component. A significant increase in the surface pressure caused by the catanionic mixture is mainly due to the enhanced surface coverage through the strong attractive electrostatic interaction. The growth kinetics is the fastest for the 1:1 ratio. With increasing bulk concentration the induction time decreases, the growth kinetics become faster and the value of saturation pressure increases. The initial fast growth observed in SFG measurement, but not in surface pressure measurements, can be rationalized, if we assume formation of surface aggregate domains due to the adsorption of catanionic surfactant molecules. These domains have larger surface density than the continuous phase due to free surfactant molecules. Since the SFG intensity scales with the number of surfactant molecules per unit surface area, the domains dominate the SFG intensity. Therefore, the SFG signal is observed when these domains are formed; and the domain formation is expected to depend on the relative composition of CTAB and SDS and the total surfactant concentration. The domain formation was ascertained by measuring the Brewster angle microscopy (BAM) images. These bright domains due to formation of aggregates are observed only after the induction period. With time the surface density of these bright domains increases. Appearance of these bright domains is responsible for observation of the fast component of the VSFG signal.
4. CONCLUSIONS
We have investigated the effects of various compositions in mixed surfactant solutions
Figure 6: Temporal evolution of the OH (3140 cm-1) and CH (2877 and 2942 cm-1) vibrational bands of the 1:1 complex of SDS and CTAB.
9
interface continues till saturation. In the bulk solution, both free surfactant molecules and their neutral catanionic complex exist. Since the OH VSFG intensity is decreased much earlier with the CH intensity still increasing, the adsorption of CTAB and SDS is simultaneous at the interface, or the catanionic complex from the bulk phase is getting directly adsorbed gradually at the interface to form the monolayer. The mechanism of the simultaneous adsorption of both the cationic and anionic surfactants at the air-water interface can explain the decrease in the intensity of the OH band and the initial increase in that of the CH band till the time when the former is completely vanished. However, this mechanism cannot explain further increase in the VSFG intensity of the CH bands at 2876 and 2940 cm-1 till saturation. These results suggest that the initial adsorption (till the OH intensity vanishes) can be due to both the mechanisms. But, the later temporal increase in the SFG intensity of the CH bands is predominantly due to the direct adsorption of the complex from the sub-surface and ordering of alkyl chains of the adsorbed surfactants with time.
0 20 40 60 80 100 1200
100
200
300
3140 cm-1
2942 cm-1
2877 cm-1
x10
SDS:CTAB=1:1(2 M)
SFG
inte
nsity
Time / min
Figure 6: Temporal evolution of the OH (3140 cm-1) and CH (2877 and 2942 cm-1)vibrational bands of the 1:1 complex of SDS and CTAB.
The -t adsorption kinetics of the mixed surfactants CTAB and SDS were measured to support the results on time-dependant SFG studies. These -t adsorption curves are qualitatively similar to the temporal profiles of SFG, except for the absence of the fast growth component in the former. Like SFG temporal profiles, the -tadsorption curves also show induction time, which corresponds to the minimum surface concentration, required to change the surface pressure, and slow adsorption kinetics, but not the fast growth component. A significant increase in the surface pressure caused by the catanionic mixture is mainly due to the enhanced surface coverage through the strong attractive electrostatic interaction. The growth kinetics is the fastest for the 1:1 ratio. With increasing bulk concentration the induction time decreases, the growth kinetics become faster and the value of saturation pressure increases. The initial fast growth observed in SFG measurement, but not in surface pressure measurements, can be rationalized, if we assume formation of surface aggregate domains due to the adsorption of catanionic surfactant molecules. These domains have larger surface density than the continuous phase due to free surfactant molecules. Since the SFG intensity scales with the number of surfactant molecules per unit surface area, the domains dominate the SFG intensity. Therefore, the SFG signal is observed when these domains are formed; and the domain formation is expected to depend on the relative composition of CTAB and SDS and the total surfactant concentration. The domain formation was ascertained by measuring the Brewster angle microscopy (BAM) images. These bright domains due to formation of aggregates are observed only after the

74
ISrapS Bulletin Vol. 27, Issue Number 1 March 2015
of SDS (sodium dodecyl sulfate) and CTAB (cetyltrimethylammonium bromide), at air-water interface using vibrational sum-frequency generation (VSFG) nonlinear optical spectroscopy. In the presence of either SDS or CTAB aqueous solution, we observed a significant enhancement in the intensities of the OH stretching modes (broad peaks at ~3200 cm-1 and ~3400 cm-1) of interfacial water molecules in the vibrational sum frequency generation (VSFG) spectra, due to ordering of these molecules induced by the large electrostatic field of the charged surfactants. However, with a mixed surfactant solution of SDS and CTAB in 1:1 ratio, opposite charges on these surfactant molecules get cancelled and consequently the OH peaks disappear. For other compositions, the VSFG intensity of OH stretch is less than that of an individual component. The experimental results suggest formation of an insoluble complex between two surfactants, which has nearly 1:1 composition.
Vibrational region of the CH stretching frequencies at the air-water interface was also probed to investigate the time evolution of the alkyl chain of the surfactant molecules in the insoluble 1:1 complex. The complex is characterized by two vibrational peaks at 2876 and 2940 cm-1. The temporal profiles show an induction time before the appearance of these two peaks of the complex. Subsequently, there is a fast growth (within ~30s) followed by a slow growth up to more than 3 hrs. The induction time and the growth kinetics strongly depend on the total bulk
concentration and the relative compositions. The 1:1 ratio of CTAB and SDS exhibits the smallest induction time and the fastest adsorption kinetics. Under similar conditions, the OH peak decays much faster, whereas the CH peaks keep on growing for a longer time. The slow growth can be due to re-arrangement, and adsorption of the complex forming a monolayer at the interface. The π-t adsorption kinetics qualitatively supports the VSFG temporal profile with respect to the induction time, slow growth, and dependence on the bulk concentration. However, the fast growth could not be observed in the π-t curves. The presence of the fast growth in VSFG profile is explained based on the formation of surface aggregate domains due to the adsorption of catanionic surfactant molecules. The BAM images clearly show the presence of the bright domains in the catanionic mixture after the induction time.
REFERENCES1. Y. R. Shen, Nature, 1989, 337, 519.2. A. G. Lambert, P. B. Davies, and D. J. Neivandt, Appl.
Spectros. Rev., 2005, 40, 103.3. V. Vogel, and Y. R. Shen, Ann. Rev. Mater. Sci., 1991, 21,
515.4. S. Nihonyanagi, S. Yamaguchi, and T. Tahara, J. Chem. Phys.,
2009, 130, 204704.5. T. Kawai, Y. Yamada, and T. Kondo, J. Phys. Chem. C, 2008,
112, 2040.6. B. Tah, P. Pal, M. Mahato, and G. B. Talapatra, J. Phys. Chem.
B, 2011, 115, 8493.7. Ankur Saha, H.P. Upadhyaya, S. Choudhury, Awadhesh
Kumar, and P.D. Naik. J. Phys. Chem. C, 2014, 118, 3145.8. D. E. Gragson, B. M. McCarty, and G. L. Richmond, J. Am.
Chem. Soc., 1997, 119, 6144.

75
ISrapS Bulletin Vol. 27, Issue Number 1 March 2015
Ankur Saha was born in 1982 in West Bengal, India. He received his B.Sc. in Chemistry in 2005 from Burdwan Raj College, The University of Burdwan, India and M.Sc. in Chemistry in 2007 from The University of Burdwan, West Bengal, India. He is currently working as a Scientific Officer in Radiation & Photochemistry Division of Bhabha Atomic Research Centre, Mumbai. His research interests focus on laser induced photodissociation dynamics of gas phase polyatomic molecules using laser-induced fluorescence and resonance-enhanced multiphoton ionization techniques. Since last two years, he has widened his domain of research to investigate the structure, orientation and dynamics at interfaces employing a vibration-sum-frequency generation technique.
Hari P. Upadhyaya was born in 1965 in Guwahati, India. He received his B.Sc. in Chemistry in 1987 from North Eastern Hill University, Shillong, India and M.Sc. in Chemistry in 1990 from University of Delhi, India. He is currently working as a Scientific Officer in Radiation & Photochemistry Division of Bhabha Atomic Research Centre, Mumbai, India. He worked for a period of 1 year at Institute of Physical Chemistry, University of Heidelberg, Germany in the area of photodissociation and reaction dynamics with Prof. J. Wolfrum during 1997–1998. Subsequently, he received his Ph.D. degree in Chemistry from University of Mumbai in 2001. In his post-doctoral studies, he worked with Prof. Tim K. Minton, Montana State University, USA for a period of 2 years, in the area of reaction dynamics using cross beam technique during 2004-2006. His current research interests focus on photodissociation and reaction dynamics involving small polyatomic molecules as well kinetics of atmospherically important reactions in gas phase. He is also interested in studies on interfacial structure and dynamics, using sum-frequency generation technique.
Awadhesh Kumar was born in 1964 in Bihar, India. He received his B.Sc. in Chemistry in 1985 from University of Delhi, India and M.Sc. in Chemistry in 1987 from Indian Institute of Technology, Kanpur, India. He is currently working as a Scientific Officer in Radiation & Photochemistry Division of Bhabha Atomic Research Centre, Mumbai. He received his Ph.D. degree in Chemistry from University of Mumbai in 1995. He worked for a period of 2 years at National Tsing Hua University, Hsinchu, Taiwan with Prof. Yuan Pern Lee. His research interests focus on dynamics of gas phase reactions induced by lasers using resonant four-wave mixing, laser-induced fluorescence and resonance-enhanced multiphoton dissociation with special reference to atmospherically important free radical species. Recently, he has extended his work to understanding the structure and dynamics at interfaces employing a nonlinear sum-frequency generation technique.
Prakash D. Naik was born in 1959 in Karwar, India. He received his B.Sc. in Chemistry in 1980 from Karnataka University, Dharwar, India and M.Sc. in Chemistry in 1983 from University of Mumbai, India. He is currently working as a Scientific Officer in Radiation & Photochemistry Division of Bhabha Atomic Research Centre, Mumbai, India. He received his Ph.D. degree in Chemistry from University of Mumbai in 1992. He worked for a period of 1.5 years at Institute of Physical Chemistry, University of Heidelberg, Germany in the area of photodissociation and reaction dynamics with Prof. J. Wolfrum during 1992–1993. His research interests focus on laser-induced dissociation dynamics involving small polyatomic molecules and kinetics of atmospherically important reactions in gas phase. His current research activity is extended to include interfacial structure and dynamics studies, using vibrational sum-frequency generation technique.

78
ISrapS Bulletin Vol. 27, Issue Number 1 March 2015
Message from the President and Secretary, ISRAPS iii
Editor’s Desk iv
Surface Enhanced Raman Spectrosocpic Studies of Analytes Using Various Approaches Deepak Ranjan Nayak, Sanchita Sil, Rekha Gautam, Navakanta Bhatt and Siva Umapathy 1
Laser-matter interaction studies with a 10 TW (45 fs) Ti:sapphire laser P. A. Naik, B.S. Rao, V. Arora, M. Tayyab, H. Singhal, S. Bagchi, B. Ramakrishna, M. Kumar, T. Mandal, A. Moorti, J. A. Chakera, and P.D. Gupta 8
High Laser Efficiency of Pyrromethene Dyes in spite of Low Fluorescence Yield: Perspectives from Photophysics, Photochemistry, Laser Experiments and Theory Alok Kumar Ray 18
Multistep Delayed Photoionization Spectroscopy: An excellent tool for measuring atomic parameters Vas Dev 28
Femtosecond Laser Induced Breakdown Spectroscopy: Emerging technique for Analysis of Complex Materials P. Mathi, Vinu V. Namboodiri, Ajay K. Singh, and Sisir K. Sarkar 37
Coherent anti-Stokes Raman Scattering Spectroscopy Using Shaped Ultrashort Laser Pulses Vinu V. Namboodiri, Apurav Guleria, Ajay K. Singh and Sisir K. Sarkar 45
ContentsMessage from the President and Secretary, ISRAPS iii
Editor’s Desk vii
3,3’-Diselenodipropionic acid (DSePA), a selenocystine derivative: Glutathione peroxidase mimic to preclinical evaluation as radio-protector Amit Kunwar, V.K. Jain, K.I. Priyadarsini 1
Liquid Crystalline Mesophases as Templates for the Synthesis of Noble Metal Nanostructures by Radiolysis and their Catalytic Activity Ajit M. Kalekara, Kirankumar Sharmab and Geeta Sharmaa 11
Radiation Chemistry in Microheterogeneous Media - Revisited Soumyakanti Adhikari 21
Radiolysis: Relevance in Nuclear Reactor Coolant systems Padma, S. Kumar, Debasis Mal, Puspalata Rajesh, S. Rangarajan and S. Velmurugan 28
Plasmonics in Fluorescence: Enhanced Intensities, Directional Emission and Selective Polarization Sharmistha Dutta Choudhury 38
Solid and Hollow Carbon Nanoparticles: Prospects in Molecular Dynamics Somen Mondal and Pradipta Purkayastha 48
Microscopic Investigation of the Polymer-Surfactant and Protein-Surfactant Interactions: Evidence of “Necklace and Bead”-Like Morphology Surajit Chatterjee and Tushar Kanti Mukherjee 56
Adsorption of mixed surfactants at air-water interface: A sum-frequency generation study Ankur Saha, H.P. Upadhyaya, Awadhesh Kumar, P.D. Naik 67
Published by ISRAPS, C/o RPCD, BARC, Mumbai 400 085
Designed & Printed by Ebenezer Printing House Tel.: 2446 2632 / 3872, E-mail: [email protected]
For Limited Circulation Only