npp mission brochure - nasa · npp is a satellite that carries five very different instruments to...
TRANSCRIPT
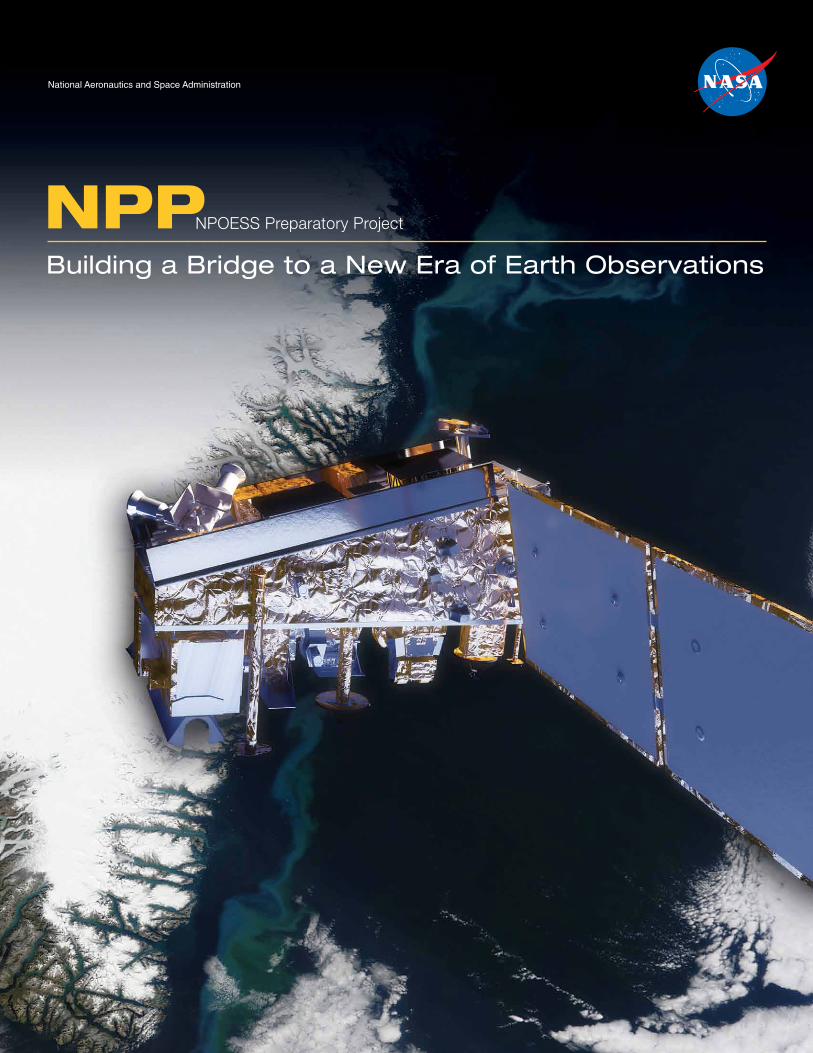
NPPNPOESS Preparatory Project
National Aeronautics and Space Administration
Building a Bridge to a New Era of Earth Observations

Acknowledgements
NPP Websiteshttp://npp.gsfc.nasa.govhttp://www.nasa.gov/NPP
Special thanks to the NPP Science Team for making this publication possible.
Writer: Aries KeckEditors: Ellen Gray, Patrick Lynch, Cynthia O’Carroll, Adam VoilandDesigner: Debbi McLean, Kevin MillerFront cover satellite illustration: Ryan Zuber
Published: October 2011
Table of Contents
NPP: Building a Bridge to a New Era of Earth Observations .................. 1
Change and the Earth’s Climate System .................................................. 3
A Sentinel When Disaster Strikes ............................................................ 5
NPP’s Eyes and Ears: The Instruments .................................................... 7
Watching the Weather ............................................................................ 9
A Vigilant Eye on Ozone ......................................................................... 11
Tracking Climate Changes ...................................................................... 13
Glossary/Resources .................................................................................. 15

NPP I Building a Bridge to a New Era of Earth Observations1
NPP: Building a Bridge to a New Era of Earth Observations
NPP is in a polar
orbit—circling the Earth
from the North Pole to
the South Pole and back
about 14 times a day.
Pho
to C
redi
t: B
all A
eros
pace
Understanding, monitoring and predicting the course of long-term climate change and short-term weather fluctuations remain tasks of profound importance. Economic competitiveness, human health and welfare, and global security all depend in part on our ability to understand and adapt to environmental changes.
NPP I Building a Bridge to a New Era of Earth Observations 2
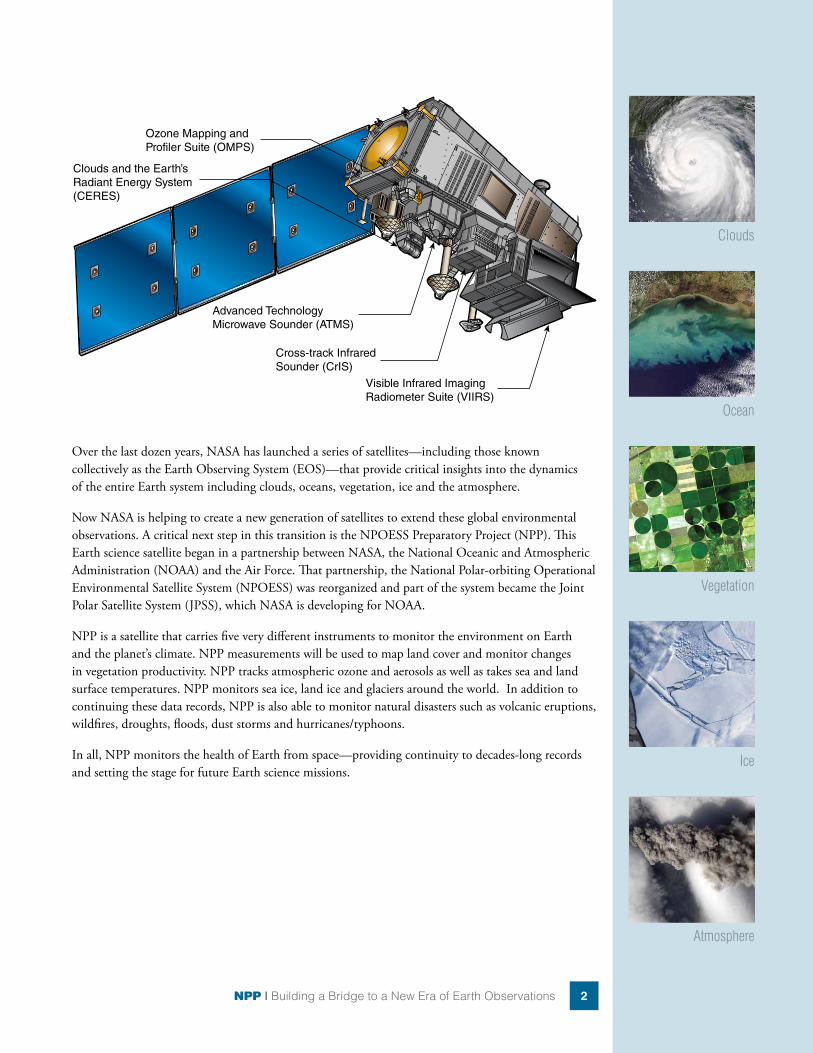
Over the last dozen years, NASA has launched a series of satellites—including those known collectively as the Earth Observing System (EOS)—that provide critical insights into the dynamics of the entire Earth system including clouds, oceans, vegetation, ice and the atmosphere.
Now NASA is helping to create a new generation of satellites to extend these global environmental observations. A critical next step in this transition is the NPOESS Preparatory Project (NPP). This Earth science satellite began in a partnership between NASA, the National Oceanic and Atmospheric Administration (NOAA) and the Air Force. That partnership, the National Polar-orbiting Operational Environmental Satellite System (NPOESS) was reorganized and part of the system became the Joint Polar Satellite System (JPSS), which NASA is developing for NOAA.
NPP is a satellite that carries five very different instruments to monitor the environment on Earth and the planet’s climate. NPP measurements will be used to map land cover and monitor changes in vegetation productivity. NPP tracks atmospheric ozone and aerosols as well as takes sea and land surface temperatures. NPP monitors sea ice, land ice and glaciers around the world. In addition to continuing these data records, NPP is also able to monitor natural disasters such as volcanic eruptions, wildfires, droughts, floods, dust storms and hurricanes/typhoons.
In all, NPP monitors the health of Earth from space—providing continuity to decades-long records and setting the stage for future Earth science missions.
Ozone Mapping and Profiler Suite (OMPS)
Advanced Technology Microwave Sounder (ATMS)
Cross-track Infrared Sounder (CrIS)
Visible Infrared Imaging Radiometer Suite (VIIRS)
Clouds and the Earth’s Radiant Energy System (CERES)
Clouds
Ocean
Vegetation
Ice
Atmosphere
NPP I Building a Bridge to a New Era of Earth Observations3
Change and the Earth’s Climate System
Over the last 100 years, the average global temperature has increased more than one degree Fahrenheit, nearly one degree Celsius. The timing of this increase coincides with human activities that release unprecedented amounts of carbon dioxide, methane, and nitrous oxide – gases referred to as greenhouse gases because they are known to trap heat. Climate models show that over the next 100 years, it is likely worldwide temperatures will increase at least two degrees Fahrenheit.
This change in average temperature over such a short time period is very unusual. Long-term records found in tree rings and ice cores show that the global average temperature is usually stable over periods of time that can be thousands of years long. A change of a degree or two may seem small, but incremental increases in the overall temperature of the Earth’s surface can have profound effects. For example, long-frozen sea ice in the Arctic is melting and glaciers are getting smaller all over the world. Another result of warmer temperatures may be that, because warmer air holds more moisture, storms could become fiercer and may also become more frequent. That being noted, it’s important to keep in mind that climate and weather are how the entire Earth system behaves over both short time scales (weather) and long time scales (climate). The difference between weather and climate is time. Climate is defined by consistent patterns over long periods of time, while weather consists of daily fluctuations and extremes. Beyond daily weather changes, there can be multi-year events that affect our climate, for example El Niño and La Niña oscillations, and so that’s why studying change in our climate requires consistent and reliable monitoring over decades-long timescales.
NPP extends decades-long records of climate data. NPP’s Visible Infrared Imaging Radiometer Suite (VIIRS) continues critical data records of vegetation, clouds, aerosols, sea and land surface temperature, the productivity of the biosphere and changes in land cover. Scientists want to observe these major climate drivers and responses to understand how these interconnected Earth system components affect one another and how climate change may be affecting them both individually and in combination.
NASA satellites have been making key cloud measurements for three decades. Since the composition of clouds can vary greatly, they can have a strong positive or a strong negative impact on climate. For example, some clouds reflect sunlight, keeping solar radiation from heating the Earth, yet others acts
Pho
to C
redi
t: D
ean
Ayr
es
Just a few degrees can
make a big difference.
For example, at the end
of the last ice age, when
the northeastern portion
of the United States
was covered by more
than 3,000 feet of ice,
average temperatures
were only 5 to 9 degrees
Fahrenheit cooler
than today.
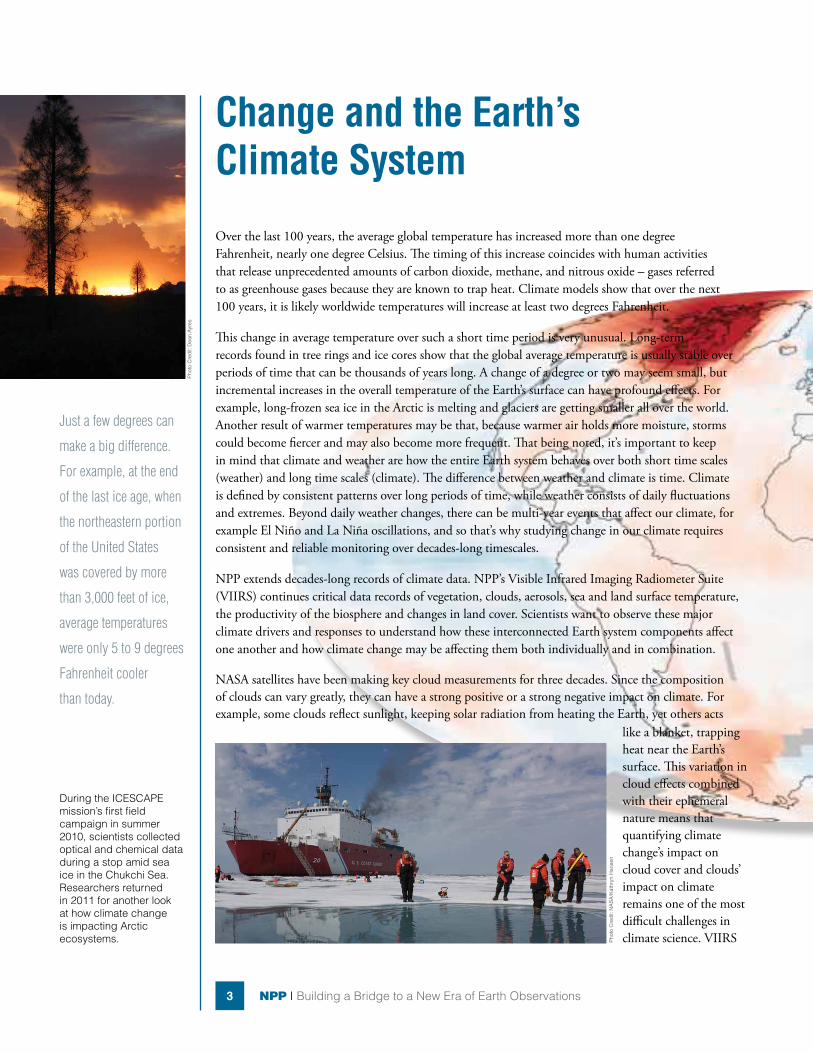
During the ICESCAPE mission’s first field campaign in summer 2010, scientists collected optical and chemical data during a stop amid sea ice in the Chukchi Sea. Researchers returned in 2011 for another look at how climate change is impacting Arctic ecosystems. P
hoto
Cre
dit:
NA
SA
/Kat
hryn
Han
sen
like a blanket, trapping heat near the Earth’s surface. This variation in cloud effects combined with their ephemeral nature means that quantifying climate change’s impact on cloud cover and clouds’ impact on climate remains one of the most difficult challenges in climate science. VIIRS
NPP I Building a Bridge to a New Era of Earth Observations 4
This image from the Coastal Zone Color Scanner depicts ocean temperatures in the Atlantic Ocean off North America. Reds are the warmest, and blues and violets are the coolest. Swirls indicate eddies in the Gulf Stream.
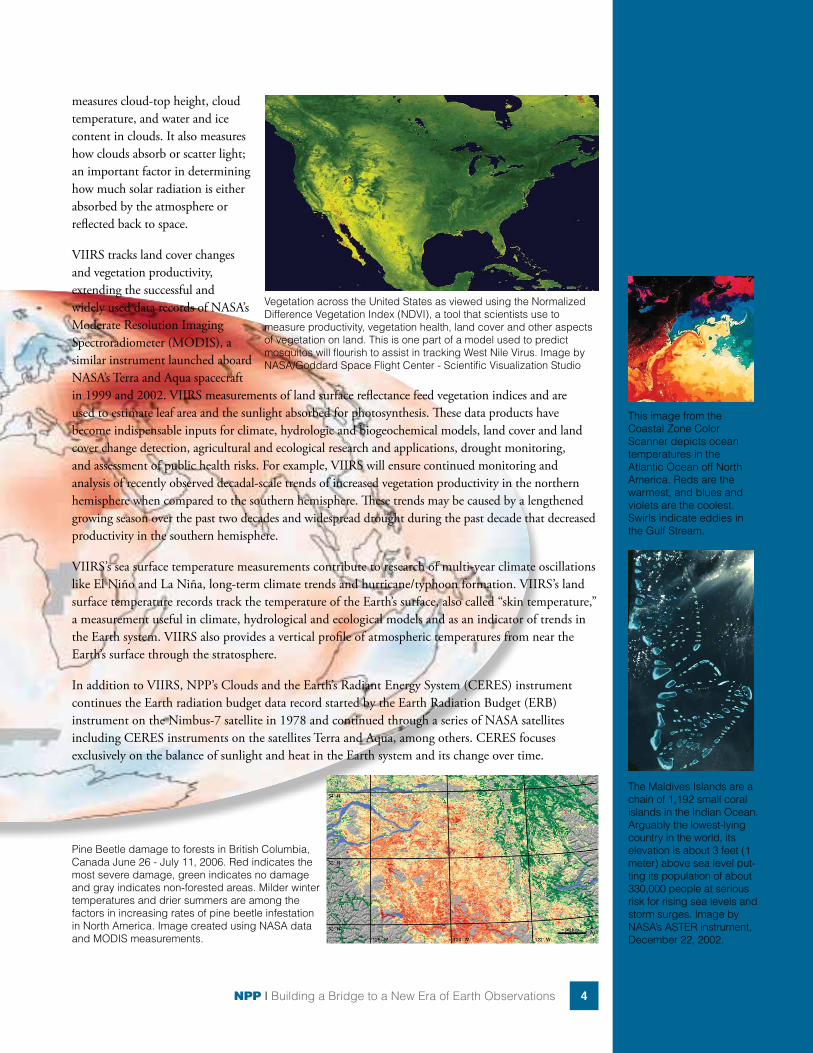
Vegetation across the United States as viewed using the Normalized Difference Vegetation Index (NDVI), a tool that scientists use to measure productivity, vegetation health, land cover and other aspects of vegetation on land. This is one part of a model used to predict mosquitos will flourish to assist in tracking West Nile Virus. Image by NASA/Goddard Space Flight Center - Scientific Visualization Studio
The Maldives Islands are a chain of 1,192 small coral islands in the Indian Ocean. Arguably the lowest-lying country in the world, its elevation is about 3 feet (1 meter) above sea level put-ting its population of about 330,000 people at serious risk for rising sea levels and storm surges. Image by NASA’s ASTER instrument, December 22, 2002.
measures cloud-top height, cloud temperature, and water and ice content in clouds. It also measures how clouds absorb or scatter light; an important factor in determining how much solar radiation is either absorbed by the atmosphere or reflected back to space.
VIIRS tracks land cover changes and vegetation productivity, extending the successful and widely used data records of NASA’s Moderate Resolution Imaging Spectroradiometer (MODIS), a similar instrument launched aboard NASA’s Terra and Aqua spacecraft in 1999 and 2002. VIIRS measurements of land surface reflectance feed vegetation indices and are used to estimate leaf area and the sunlight absorbed for photosynthesis. These data products have become indispensable inputs for climate, hydrologic and biogeochemical models, land cover and land cover change detection, agricultural and ecological research and applications, drought monitoring, and assessment of public health risks. For example, VIIRS will ensure continued monitoring and analysis of recently observed decadal-scale trends of increased vegetation productivity in the northern hemisphere when compared to the southern hemisphere. These trends may be caused by a lengthened growing season over the past two decades and widespread drought during the past decade that decreased productivity in the southern hemisphere.
VIIRS’s sea surface temperature measurements contribute to research of multi-year climate oscillations like El Niño and La Niña, long-term climate trends and hurricane/typhoon formation. VIIRS’s land surface temperature records track the temperature of the Earth’s surface, also called “skin temperature,” a measurement useful in climate, hydrological and ecological models and as an indicator of trends in the Earth system. VIIRS also provides a vertical profile of atmospheric temperatures from near the Earth’s surface through the stratosphere.
In addition to VIIRS, NPP’s Clouds and the Earth’s Radiant Energy System (CERES) instrument continues the Earth radiation budget data record started by the Earth Radiation Budget (ERB) instrument on the Nimbus-7 satellite in 1978 and continued through a series of NASA satellites including CERES instruments on the satellites Terra and Aqua, among others. CERES focuses exclusively on the balance of sunlight and heat in the Earth system and its change over time.
Pine Beetle damage to forests in British Columbia, Canada June 26 - July 11, 2006. Red indicates the most severe damage, green indicates no damage and gray indicates non-forested areas. Milder winter temperatures and drier summers are among the factors in increasing rates of pine beetle infestation in North America. Image created using NASA data and MODIS measurements.

NPP I Building a Bridge to a New Era of Earth Observations5
A Sentinel When Disaster StrikesWhen the Icelandic volcano Eyjafjallajökull erupted in 2010 it released a massive plume of ash and sulfur dioxide. NASA satellites tracked the ash cloud as it swept across the Atlantic Ocean toward Europe, providing crucial data to airlines on when it was safe to fly. In 2011 record rainfall led to the largest and most damaging flooding along the Mississippi River in over a century. NASA satellites provided detailed records of when and where the river flooded thousands of acres of farmland. The Wallow Fire, also in 2011, was the largest fire in Arizona history, burning over half-a-million acres in the American Southwest. NASA satellites measured drought conditions, tracked smoke clouds and recorded the burned areas it left behind.
For these events and many, many more, Earth system satellites, like Landsat and the three NASA Earth Observing System (EOS) flagship satellites - Terra, Aqua and Aura - contribute a wealth of data for monitoring disasters, providing crucial information to both first responders and research scientists.
One striking example of how data from satellites assisted with disaster recovery was in the response to the 2010 BP Deepwater Horizon oil spill in the Gulf of Mexico. The spill was the largest accidental marine oil spill in the history of the petroleum industry. NASA’s Moderate-Resolution Imaging Spectroradiometer (MODIS) made daily quantitative measurements of the region impacted by the spill. Using MODIS instruments aboard NASA’s Terra and Aqua satellites, scientists tracked the slick as it changed due to the amount of oil spilled, the use of oil dispersing chemicals and changes in weather, water currents and other events.
Charred land and smoke plumes from the Wallow fire are visible in this image acquired by MODIS aboard the Aqua satellite on June 8, 2011
First responders and
air quality experts used
satellite data to track
the record-setting 2011
Wallow Fire in the
American Southwest
that burned more than
700 square miles
(about 1,800 square
kilometers) and resulted
in the evacuation of
6,000 people.
Pho
to C
redi
t: K
ari G
reer
/US
For
est S
ervi
ce
Arizona New Mexico
NPP I Building a Bridge to a New Era of Earth Observations 6
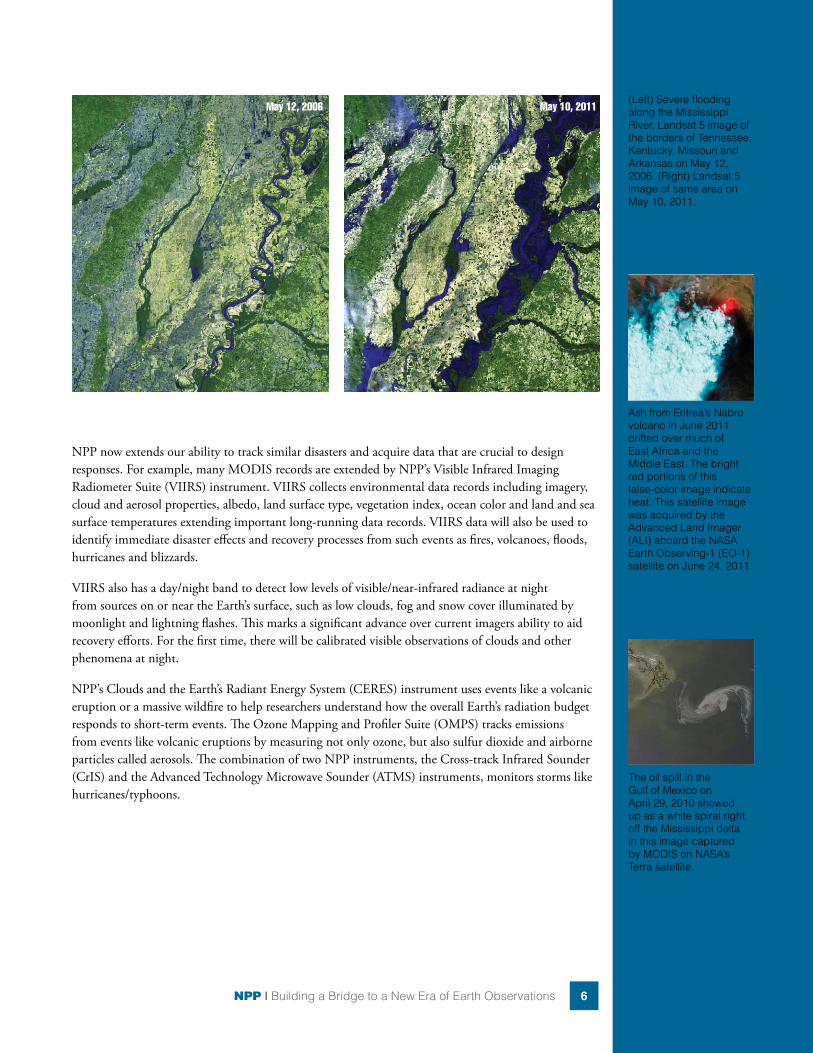
(Left) Severe flooding along the Mississippi River. Landsat 5 image of the borders of Tennessee, Kentucky, Missouri and Arkansas on May 12, 2006. (Right) Landsat 5 image of same area on May 10, 2011.
May 12, 2006 May 10, 2011
Ash from Eritrea’s Nabro volcano in June 2011 drifted over much of East Africa and the Middle East. The bright red portions of this false-color image indicate heat. This satellite image was acquired by the Advanced Land Imager (ALI) aboard the NASA Earth Observing-1 (EO-1) satellite on June 24, 2011.
The oil spill in the Gulf of Mexico on April 29, 2010 showed up as a white spiral right off the Mississippi delta in this image captured by MODIS on NASA’s Terra satellite.
NPP now extends our ability to track similar disasters and acquire data that are crucial to design responses. For example, many MODIS records are extended by NPP’s Visible Infrared Imaging Radiometer Suite (VIIRS) instrument. VIIRS collects environmental data records including imagery, cloud and aerosol properties, albedo, land surface type, vegetation index, ocean color and land and sea surface temperatures extending important long-running data records. VIIRS data will also be used to identify immediate disaster effects and recovery processes from such events as fires, volcanoes, floods, hurricanes and blizzards.
VIIRS also has a day/night band to detect low levels of visible/near-infrared radiance at night from sources on or near the Earth’s surface, such as low clouds, fog and snow cover illuminated by moonlight and lightning flashes. This marks a significant advance over current imagers ability to aid recovery efforts. For the first time, there will be calibrated visible observations of clouds and other phenomena at night.
NPP’s Clouds and the Earth’s Radiant Energy System (CERES) instrument uses events like a volcanic eruption or a massive wildfire to help researchers understand how the overall Earth’s radiation budget responds to short-term events. The Ozone Mapping and Profiler Suite (OMPS) tracks emissions from events like volcanic eruptions by measuring not only ozone, but also sulfur dioxide and airborne particles called aerosols. The combination of two NPP instruments, the Cross-track Infrared Sounder (CrIS) and the Advanced Technology Microwave Sounder (ATMS) instruments, monitors storms like hurricanes/typhoons.

NPP I Building a Bridge to a New Era of Earth Observations7
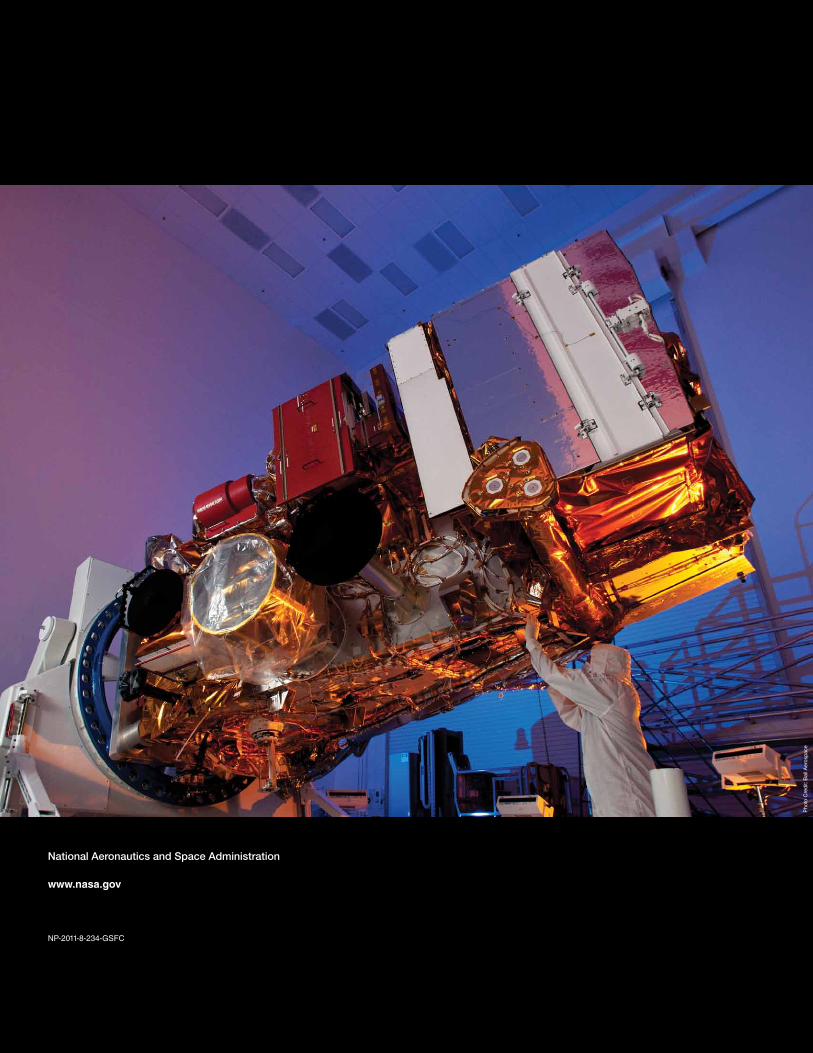
NPP’s Eyes and Ears: The InstrumentsNPP’s five instruments retrieve data about land surfaces, ocean and atmosphere and, as a result, NPP serves as an important link between the current generation of Earth-observing satellites and the next generation of climate and weather satellites.
NPP observes the Earth’s surface twice every 24-hour day, once in daylight and once at night. In its orbit NPP flies 512 miles (824 kilometers) above the surface in a polar orbit, circling the planet about 14 times a day. NPP sends its data once an orbit to the ground station in Svalbard, Norway and continuously to local direct broadcast users.
VIIRS – Visible Infrared Imaging Radiometer Suite
The largest instrument aboard NPP is the Visible Infrared Imaging Radiometer Suite (VIIRS). It collects radiometric imagery in visible and infrared wavelengths of the land, atmosphere, ice and ocean. Data from VIIRS, collected from 22 channels across the electromagnetic spectrum, are used to observe active fires, vegetation, ocean color, sea surface temperature and other surface features. A variety of scientists study VIIRS data, much of which is used in monitoring the pace and impacts of climate change. Atmospheric scientists use some of these channels to observe clouds and small airborne particles called aerosols. Oceanographers use VIIRS to monitor phytoplankton and sediment in the seas. Terrestrial ecologists use it to monitor forest cover and productivity and ice experts use it to track changes in polar sea ice. VIIRS has similarities to the Moderate Resolution Imaging Spectroradiometers (MODIS) currently operating on two NASA satellites, Terra and Aqua.
CERES – Clouds and the Earth’s Radiant Energy System
The Clouds and the Earth’s Radiant Energy System (CERES) measures both solar energy reflected by the Earth and heat emitted by our planet. This solar and thermal energy are key parts of what’s called the Earth’s radiation budget. When sunlight hits Earth and its atmosphere, they warm up. Clouds and other light-colored surfaces like snow and ice reflect some of the sun’s heat and light, cooling Earth, while additional cooling comes from heat that the Earth radiates to space. It’s crucial
VIIRS
CrIS
ATMS
OMPS
CERES
Pho
to C
redi
t: B
all A
eros
pace
Pho
to C
redi
t: B
all A
eros
pace
Roughly the size of
a minibus, the NPP
spacecraft is a modified
BCP 2000 bus built
by the Ball Aerospace
and Technologies
Corporation in
Colorado.
VIIRS is a multi-spectral scanning radiometer that scans a 1,889-mile wide swath of the Earth (3,040 kilometers). Built by Raytheon Space and Airborne Systems in El Segundo, California.
CERES is a 3-channel radiometer measuring reflected solar radiation, emitted terrestrial radiation and total radiation. Built by Northrop Grumman Aerospace Systems of Redondo Beach, California.

NPP I Building a Bridge to a New Era of Earth Observations 8
VIIRS
CrIS
ATMS
OMPS
CERES
Pho
to C
redi
t: N
AS
AP
hoto
Cre
dit:
Bal
l Aer
ospa
ceP
hoto
Cre
dit:
Bal
l Aer
ospa
ce
for scientists to understand this complex Earth radiation budget system. The changing role of clouds in this system is one of the biggest unknowns in climate science. So scientists need long-term, stable data sets to make accurate projections of global climate change. NPP’s CERES instrument continues a multi-year record of the amount of energy entering and exiting from the top of Earth’s atmosphere. A total of four other CERES instruments fly on the EOS satellites Terra and Aqua.
CrIS – Cross-track Infrared Sounder
The Cross-track Infrared Sounder (CrIS) and the Advanced Technology Microwave Sounder (ATMS) work together, providing global high-resolution profiles of temperature and moisture. These advanced atmospheric sensors create cross-sections of storms and other weather conditions, helping with both short-term ‘nowcasting’ and long-term forecasting. CrIS measures continuous channels in the infrared region
and has the ability to measure temperature profiles with improved accuracy over its predecessor instruments on operational satellites, and comparable accuracy to the
Atmospheric Infrared Sounder (AIRS) on Aqua. NOAA will be using CrIS for numerical weather prediction and, because it is a brand new instrument, its use on NPP provides a real-world test of
the equipment before NOAA’s upcoming Joint Polar Satellite System (JPSS) missions.
ATMS – Advanced Technology Microwave Sounder
The Advanced Technology Microwave Sounder (ATMS) works in both clear and cloudy conditions, providing high-spatial-resolution microwave measurements of temperature
and moisture. ATMS has better sampling and and two more channels than previous instruments like the Advanced Microwave Sounding Units (AMSU), and it combines
all of their abilities into one instrument. Working in concert, CrIS and ATMS together comprise the Cross-track Infrared Microwave Sounding Suite (CrIMSS).
OMPS – Ozone Mapping and Profiler Suite
The Ozone Mapping and Profiler Suite measures the ozone layer in our upper atmosphere—tracking the status of global ozone distributions, including the
‘ozone hole.’ It also monitors ozone levels in the troposphere, the lowest layer of our atmosphere. OMPS extends out 40-year long record ozone layer measurements while also providing improved vertical resolution compared to previous operational
instruments. Closer to the ground, OMPS’s measurements of harmful ozone improve air quality monitoring and when combined with cloud predictions; help to create the Ultraviolet Index, a guide to safe levels of sunlight exposure. OMPS has two sensors, both new designs, composed of three advanced hyperspectral-
imaging spectrometers.
CrIS is a Michelson interferometer that scans about 1,367 miles (2200 kilometers) of the Earth’s atmosphere. Built by ITT Corporation in Fort Wayne, Indiana.
ATMS is a 22-channel passive microwave radiometer with a swath width of 1,429 miles (2300 kilometers). Built by Northrop Grumman in Azusa, California.
OMPS is an advanced suite of three hyperspec-tral instruments that mea-sure ozone. Built by Ball Aerospace in Boulder, Colorado.
NPP I Building a Bridge to a New Era of Earth Observations9
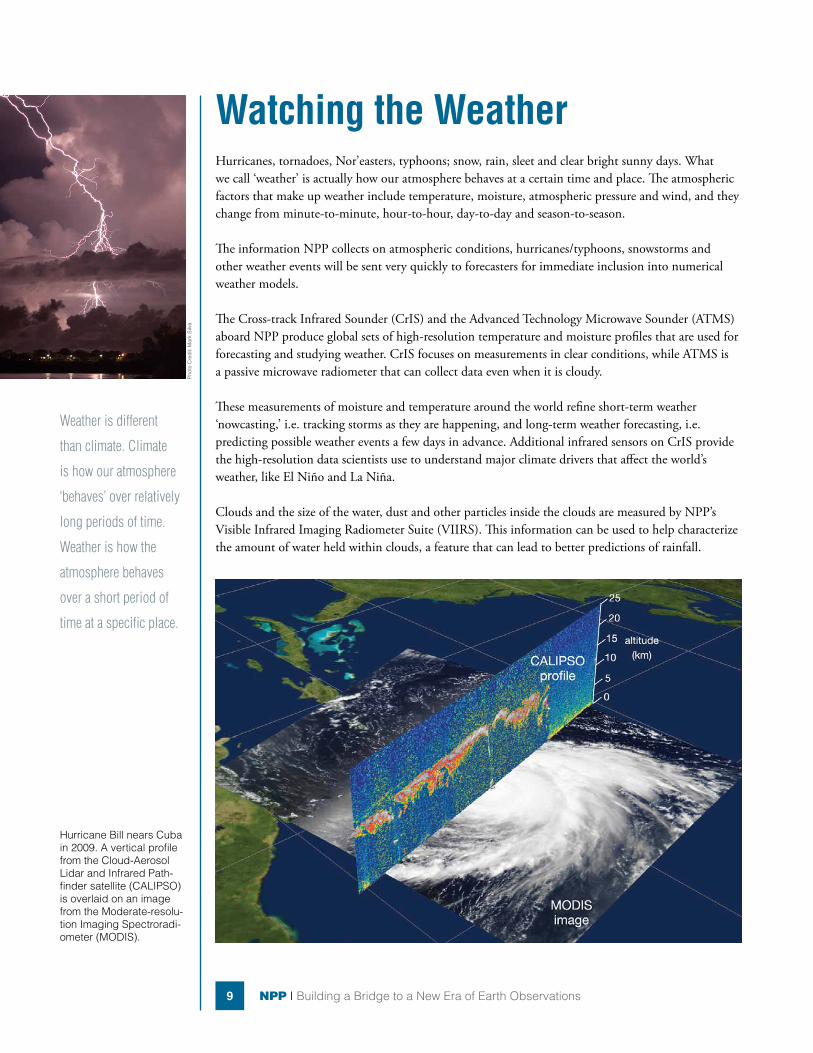
Hurricane Bill nears Cuba in 2009. A vertical profile from the Cloud-Aerosol Lidar and Infrared Path-finder satellite (CALIPSO) is overlaid on an image from the Moderate-resolu-tion Imaging Spectroradi-ometer (MODIS).
Pho
to C
redi
t: M
ark
Silv
a
Watching the Weather Hurricanes, tornadoes, Nor’easters, typhoons; snow, rain, sleet and clear bright sunny days. What we call ‘weather’ is actually how our atmosphere behaves at a certain time and place. The atmospheric factors that make up weather include temperature, moisture, atmospheric pressure and wind, and they change from minute-to-minute, hour-to-hour, day-to-day and season-to-season.
The information NPP collects on atmospheric conditions, hurricanes/typhoons, snowstorms and other weather events will be sent very quickly to forecasters for immediate inclusion into numerical weather models.
The Cross-track Infrared Sounder (CrIS) and the Advanced Technology Microwave Sounder (ATMS) aboard NPP produce global sets of high-resolution temperature and moisture profiles that are used for forecasting and studying weather. CrIS focuses on measurements in clear conditions, while ATMS is a passive microwave radiometer that can collect data even when it is cloudy.
These measurements of moisture and temperature around the world refine short-term weather ‘nowcasting,’ i.e. tracking storms as they are happening, and long-term weather forecasting, i.e. predicting possible weather events a few days in advance. Additional infrared sensors on CrIS provide the high-resolution data scientists use to understand major climate drivers that affect the world’s weather, like El Niño and La Niña.
Clouds and the size of the water, dust and other particles inside the clouds are measured by NPP’s Visible Infrared Imaging Radiometer Suite (VIIRS). This information can be used to help characterize the amount of water held within clouds, a feature that can lead to better predictions of rainfall.
Weather is different
than climate. Climate
is how our atmosphere
‘behaves’ over relatively
long periods of time.
Weather is how the
atmosphere behaves
over a short period of
time at a specific place.
NPP I Building a Bridge to a New Era of Earth Observations 10
High temperatures led to record drought across Texas in 2011. Image uses MODIS image and data from April 7-14.
This MODIS image (above), centered over the Great Lakes region in North America, shows a variety of cloud types. The clouds at the top of the image, colored pink, are cold, high-level snow and ice clouds, while the neon green clouds are lower-level water clouds. Different cloud types reflect and emit radiant energy differently so sci-entists use MODIS data to distinguish them. This red, green, blue composite is from Feb. 24, 2000.
Ocean
Land
ColderWaterClouds
WarmWaterClouds
ThinCirrus
OpaqueCirrus
Smoke
MODIS Red-Green-Blue Characterization MODIS True Color
(Left) Cloud cover in the Pacific Ocean off the coast of Central America.
In addition, NPP data help us plan responses to weather events. For example, NPP’s VIIRS instrument tracks flooding and drought events as they happen while also collecting long-term data of land vegetation. Combining these data records can help scientists predict and plan for famine relief efforts, disease outbreaks or track changes in which crops are planted when. Another example is that VIIRS data on hurricanes, combined with CERES, ATMS and CrIS data, give scientists better weather prediction ability, as well as great insight into how these storms affect the overall Earth system.
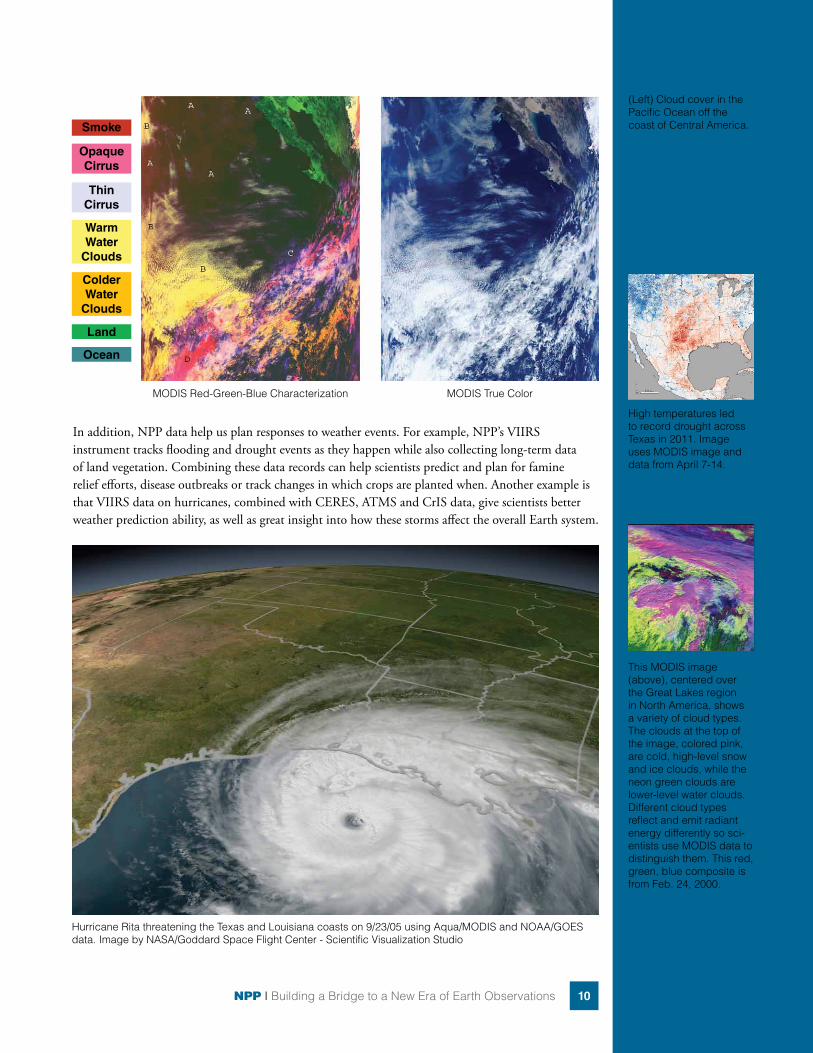
Hurricane Rita threatening the Texas and Louisiana coasts on 9/23/05 using Aqua/MODIS and NOAA/GOES data. Image by NASA/Goddard Space Flight Center - Scientific Visualization Studio

NPP I Building a Bridge to a New Era of Earth Observations11
A Vigilant Eye on OzoneOzone is an atmospheric gas that plays two very different roles on Earth. In our upper atmosphere, ozone forms a shield that blocks dangerous ultraviolet radiation coming from the sun. In our lower atmosphere, ozone is a harmful air pollutant.
Ozone is an almost
colorless, gaseous
form of oxygen. It
contains three atoms
of oxygen, but is
relatively unstable
and reacts easily with
some other gases.
Ozone only represents
a tiny fraction of our
atmosphere – at its
greatest no more than
10 parts per million in
the stratosphere – but
it is crucial for life
on Earth.
Pho
to C
redi
t: C
hris
Rie
bsch
lage
r
A 3-D image of the hole in the ozone layer over Antarctica rendered by NASA’s Goddard Space Flight Center.
When will the Antarctic ozone hole recover? Scientists think the ozone layer over Antarctica could return to 1980 levels by about 2070. Significant improvement isn’t expected until about 2025, but the ozone hole isn’t getting larger.
Ozone (Dobson Units)
0 136 273 409 545
A visualization showing the vertical distribution of ozone including the ‘ozone hole.’ Data from the Earth Probe Total Ozone Mapping Spectrometer (TOMS) and the NIMBUS-7 Solar Backscatter Ultraviolet instrument. Image by NASA/Goddard Space Flight Center – Scientific Visualization Studio.

NPP I Building a Bridge to a New Era of Earth Observations 12
NPP’s Ozone Mapping and Profiler Suite (OMPS) continues decades-long ozone records and consists of two separate instruments. The first is a downward, or nadir-viewing, instrument that looks beneath the satellite and maps the total amount of ozone between the ground and the top of the atmosphere. The second is a newer and more experimental instrument called a limb profiler. It views the edge of the atmosphere from an angle thus giving scientists more detail about the vertical distribution of ozone.
September 17, 1979
October 7, 1989
October 9, 2006
October 1, 2010
Ozone (Dobson Units)
110 220 330 440 550
Pho
to C
redi
t: M
alin
gerin
g
(Right) A layer of ground-level air pollution above traffic on the 105 freeway in California.
Troposphere
Stratosphere OzoneLayer
Scientists in the 1970s recognized that the human-produced chemicals called chlorofluorocarbons (CFCs) had the potential to deplete the protective ozone layer. CFCs are chemical compounds of chlorine, fluorine and carbon and were common in refrigerants and certain spray cans.
This destruction of the ozone layer is most extreme over the South Pole where there’s an actual ‘ozone hole’ in springtime. In the late-1980s, a worldwide agreement restricted production of CFCs and other chemicals and thus led to the protection of the ozone layer.
OMPS’s ability to take accurate, long-term measurements of ozone allows it to play a key role in tracking the evolution of the ozone layer, as it builds on the legacy of decades of ozone observations pioneered by NASA in the 1970s and continued by NASA and other agencies, most recently the Ozone Monitoring Instrument (OMI) launched aboard NASA’s Aura spacecraft in 2004.

NPP I Building a Bridge to a New Era of Earth Observations13
Tracking Climate ChangesEarth science can be seen as studying a system of systems—all overlapping and interconnected. Because NPP includes a range of observations, it helps us get a sense of the bigger picture. For example, the study of sea surface temperatures not only provides details about the ocean itself, it also helps us understand the amount of moisture in the atmosphere, which then can change the amount of rain, which then can change land use and vegetation productivity, which then can change the amount of fires or dust in our atmosphere – and so on.
NPP’s instruments observe the entire globe twice every 24-hour day and record many different environmental systems. CERES tracks the Earth’s overall radiation budget. OMPS tracks ozone. VIIRS collects visible and infrared radiometric imagery of the land, atmosphere, ice and ocean. VIIRS also characterizes the properties of clouds and aerosols – including changes in cloud shape and reflectivity, the particles that make up clouds and the concentration of those particles. Clouds and aerosols remain two of the most difficult climate influences to characterize and model.
ATMS and the CrIS work together to provide high-resolution profiles of atmospheric temperature and moisture during both cloudy and clear conditions. Continuing the data record of the Atmospheric Infrared Sounder (AIRS) on Aqua, CrIS will also add to its ability to collect high-resolution data that are used to understand major climate features like El Niño and La Niña.
These two climate features are called Southern Oscillations and are characterized by changes in the temperature of the surface of the tropical eastern Pacific Ocean, combined with changes in the surface air pressure in the western Pacific. El Niño corresponds with warmer oceans and high pressure; La Niña with cooler waters and low pressure. Both occur roughly every five years and often cause extreme weather events like floods and droughts in other parts of the world. El Niño’s warmer waters feed thunderstorms and increase rainfall, while they also suppress the upwelling of the cold, nutrient-rich waters that sustain large fish populations. Generally, La Niña has the opposite effect, resulting in drier conditions in some areas, but La Niña has also been behind increased snowfalls in the Northern United States and Canada. In the winter of 2007-2008 La Niña caused a ‘never-ending winter’ in Eastern Canada in which snow fell nearly every single day, setting many seasonal snowfall records.
Deviations from normal sea surface tempera-tures (left) and sea surface heights (right) at the peak of the 2009-2010 central Pacific El Niños, as measured by NOAA polar orbiting satellites and NASA’s Jason-1 spacecraft, respectively. The warm-est temperatures and highest sea levels were located in the central equatorial Pacific.
Weather is different
than climate. Climate
is how our atmosphere
‘behaves’ over relatively
long periods of time.
Weather is how the at-
mosphere behaves over
a short period of time at
a specific place.
Pho
to C
redi
t: A
nush
Kris
hnas
wam
i

NPP I Building a Bridge to a New Era of Earth Observations 14
An exceptionally severe winter storm (left) dropped several feet of snow around the Washington, D.C., area in early February 2010. A true-color image by MODIS on NASA’s Terra satellite.
Once per orbit, NPP beams data from its instruments to a ground station in Svalbard, Norway. From there, fiber optic cables transmit the information to data processing centers in the United States, making much of the data avail-able within 3 hours.
The Pacific Ocean sea surface heights on June 11, 2010 showing that the tropical Pacific has switched from warm (red) to cold (blue) foreshadow-ing a transition from El Niño, to La Niña condi-tions. Image from the NASA/European Ocean Surface Topography Mission/Jason-2.
Understanding the connections between weather, climate drivers and the worldwide climate requires a vast amount of continuous and reliable scientific data. NPP contributes to these long-term records while also providing the type of immediate data that meteorologists use to create weather forecasts. The information it collects on hurricanes/typhoons, snowstorms and other weather events also is used by researchers to create long-term records of extreme weather events.
These long-term records of the strength and frequency of extreme weather events provides crucial information to scientists looking to establish a connection between them and climate change. One use of that data is evaluating the performance of computer models of weather and climate. For example, a model created after the fact by scientists at Goddard Space Flight Center – the Goddard Earth Observing System Model, Version 5 (GEOS-5) – closely reproduced the actual satellite imagery of a massive snowstorm that dumped about two feet of snow on Washington, D.C. in 2010. This ‘hindcast’ shows how satellite observations can help us better understand what weather conditions create a storm and shows how NASA computer modeling efforts can use detailed satellite information to improve weather and climate prediction. In addition, NASA scientists work with colleagues at NOAA through the Joint Center for Satellite Data Assimilation to accelerate the use of NPP data in weather forecasting.
In all, NPP is a powerful tool that will assist us to enhance the data that underlies our nation’s weather forecasting system as well as help us to comprehend, track and forecast the course of long-term climate change and improving our knowledge of how the entire Earth system works.
NPP I Building a Bridge to a New Era of Earth Observations15
Glossary/Resourcesaerosols – Aerosols are tiny solid or liquid particles that are suspended in the air. They include dust, smoke, salt and sea spray, and air pollution.
Air Quality Index (AQI) – The Air Quality Index is a daily report on local air conditions. In the U.S. it’s produced by the Environmental Protection Agency. It calculates air quality based on five air pollutants: carbon monoxide, sulfur dioxide, nitrogen dioxide, particle pollutants (aerosols) and ground-based ozone. The AQI is measured on a scale of 0-500 where higher numbers mean a higher health risk.
Aqua – A NASA Earth Observing System (EOS) satellite that collects information on the Earth’s water cycle, including evaporation from oceans, water vapor in the atmosphere, clouds, precipitation, soil moisture, sea ice, land ice and snow cover. Aqua also takes measurements relating to radiative energy fluxes, aerosols, vegetation, land cover, phytoplankton and dissolved organic matter in the oceans, and temperatures of the land, air and ocean. It launched on May 4, 2002.
ATMS - The Advanced Technology Microwave Sounder (ATMS) instrument aboard NPP provides high-spatial-resolution microwave data to take measurements of temperature and humidity in both clear and cloudy conditions.
Aura – Aura is an NASA Earth Orbiting satellite that studies ozone, air quality and climate and is designed exclusively to conduct research on the composition, chemistry and dynamics of the Earth’s atmosphere. It launched on July 15, 2004.
CALIPSO – The Cloud-Aerosol Lidar and Infrared Pathfinder Satellite Observation (CALIPSO) satellite that studies clouds and atmospheric aerosols and the role they play in regulating the Earth’s weather, climate and air quality and weather monitoring. Launched on April 28, 2006, CALIPSO is a joint NASA and French mission.
CERES – The Clouds and the Earth’s Radiant Energy System (CERES) is an instrument aboard NPP that measures solar energy reflected by the Earth and heat emitted by our planet.
CloudSat – A satellite that uses radar to observe clouds and precipitation from space. It launched with CALIPSO on April 28, 2006.
chlorofluorocarbons (CFCs) – Chlorofluorocarbons are chemical compounds of chlorine, fluorine and carbon previously used in spray cans, fire-fighting tools and refrigerants. Partially as a reaction to the discovery of the ‘ozone hole’ in 1987, 197 nations signed an international treaty called the Montreal Protocol to phase out their use.
CrIS – The Cross-track Infrared Sounder (CrIS) is an instrument aboard NPP that produces high-resolution, three-dimensional temperature, pressure and moisture profiles.
Earth Observing System (EOS) – The Earth Observing System is a major part of NASA’s Earth Science Program. It’s composed of multiple satellites designed to make long-term global observations of the Earth’s land surface, oceans, biosphere and atmosphere.
El Niño – A climate pattern that occurs across the Pacific Ocean roughly every five years in which often ocean temperature are warmer than usual.
energy budget – Earth’s ‘energy budget’ is an accounting of all the heat, light and other energy as it moves into and out of our planet. This includes the heat and light from the sun that hits the Earth’s atmosphere, oceans and land, as well as the energy reflected back out into space from the Earth’s atmosphere, snow and ice.
geostationary orbit – An orbit around a body, in this case Earth, that is directly above its equator and one that goes the same speed as the body’s rotation so that the position of the satellite relative to the Earth’s surface remains constant.
ground stations – A series of facilities around the world that will provide command, control, communications, data processing and operations for satellites. NPP uses the world’s largest commercial ground station, the Svalbard Satellite Station (SvalSat) in Norway.
infrared – Light that has a wavelength longer than visible light and shorter than microwave radiation. This form of electromagnetic radiation is between 0.74 micrometers and 300 micrometers and includes most thermal or heat radiation, thus measuring infrared light can measure heat.
Joint Polar Satellite System (JPSS) —The next generation of U.S. polar-orbiting environmental satellites. NPP is the forerunner to this satellite system. JPSS will do both climate and weather monitoring.
La Niña – A climate pattern that occurs across the Pacific Ocean roughly every five years in which often ocean temperatures are cooler than usual.
microwave – A type of electromagnetic wave whose wavelength is as long as one meter or as short as one millimeter. On NPP the ATMS instrument uses and measures microwaves.
NPP I Building a Bridge to a New Era of Earth Observations 16
Moderate-Resolution Imaging Spectroradiometer (MODIS) – A key instrument aboard the Terra and Aqua satellites. Each MODIS instrument images the entire Earth every one to two days in visible and infrared wavelengths, one in a morning orbit and the other in an afternoon orbit.
OMPS - The Ozone Mapping and Profiler Suite (OMPS) is a suite of instruments aboard NPP that measures the ozone in the Earth’s atmosphere.
ozone – A chemical compound made up of three oxygen molecules, O3. It forms in the upper atmosphere where it’s protective against the sun’s rays and in the lower atmosphere where it’s an environmental and health hazard.
ozone hole – An opening in the protective ozone layer that occurs above Antarctica from September to December. The cause of the hole and other losses of ozone in the upper atmosphere, the stratosphere, are due to man-made compounds like CFCs (chlorofluorocarbons) whose byproducts can lead to very efficient destruction of ozone under the unique conditions of the Antarctic stratosphere in the springtime.
polar orbit – The curved path around a body that moves from pole to pole. For the Earth, this means an orbit that travels from the North Pole to the South Pole and back. Satellites in polar orbits, when combined with the Earth’s rotation, result in viewing the entire planet’s surface.
Radiation Budget – Also known as the Earth’s ‘energy budget’ this is a physical system that includes all the incoming energy from the sun, mostly in the form of light and heat, and the outgoing heat and light that’s emitted and reflected back from the Earth.
radiometer – A device that detects the amount of energy given off by an object in the form of electromagnetic radiation. Satellites monitor specific wavelengths of light depending on what they want to measure, from microwave to infrared to visible light to ultraviolet radiation.
sounding – A way of investigating an environment by measuring a stimulus, often an electromagnetic wave or a sound wave, emitted by a source, whether naturally-occurring or intentionally created, and then measuring what is reflected or scattered.
stratosphere – The stratosphere is a layer of the atmosphere above the troposphere. Its lower boundary lies between 10 to 15 kilometers (6 to 9 miles) above the Earth’s surface and its upper boundary lies around 50 kilometers (30 miles) above the Earth’s surface.
Sulfur dioxide (SO2) – A chemical compound that’s released by industrial processes and by volcanoes. It’s a major air pollutant in the Earth’s lower atmosphere, the troposphere.
swath – A long but narrow strip, usually of the surface of something. Because NPP travels around the Earth from pole to pole as the planet rotates, it measures large swaths of the Earth beneath it.
Terra – the oldest of the three Earth Orbiting System satellites, a group that also includes Aqua and Aura. Terra launched in 1999 with a 6-year mission life, but it continues to operate. Instruments aboard Terra include MODIS and CERES.
troposphere – The troposphere is the layer of atmosphere that runs from the ground to about 10 to 15 kilometers (about 6 to 9 miles) above the Earth’s surface.
Ultraviolet Index (UI) – A standard measurement of the strength of ultraviolet radiation that’s coming from the sun. It’s a part of daily weather forecasts to help people protect themselves from excessive exposure.
ultraviolet – Ultraviolet radiation is light that is just beyond the short wavelength side of the visible spectrum and has high energy. It’s the radiation that drives atmospheric chemistry and causes sunburns, among other biological effects.
VIIRS – The Visible Infrared Imaging Radiometer Suite is the largest instrument aboard NPP and it collects visible and infrared images of Earth in 22 different spectral bands.
visible light – Light that humans can see. Human eyes perceive light that’s in the portion of the electromagnetic spectrum from about 380 to 780 nanometers.
volatile organic compounds – Volatile organic compounds are chemicals made up of hydrogen, oxygen, and carbon that evaporate from liquid to gas very quickly. They include paints and solvents, and are associated with health problems when breathed in unventilated areas. VOCs react with nitrogen oxides (NOx) in the presence of sunlight to produce ozone, an air pollutant at ground level.
National Aeronautics and Space Administration
www.nasa.gov
NP-2011-8-234-GSFC
Pho
to C
redi
t: B
all A
eros
pace