npl report depc mpe 015 - national physical · pdf filehampton road, teddington, ......
TRANSCRIPT

NPL REPORT DEPC MPE 015 “TENSTAND” WP2 Final Report: Digital Tensile Software Evaluation J Lord, M Loveday, M Rides, I McEnteggart NOT RESTRICTED January 2005

NPL Report DEPC MPE 015
‘ Computer Controlled Tensile Testing Machines: Validation of European Standard EN 10002-1’
“TENSTAND”
WP2 Final Report: Digital Tensile Software Evaluation
by
Jerry Lord * Malcolm Loveday
Martin Rides * Ian McEnteggart
*NPL Materials Centre
National Physical Laboratory Queens Road
Teddington TW11 0LW, UK
Instron Ltd
Coronation Road Cressex Business Park
High Wycombe HP12 3SY, UK
NPL Consultant, Beta Technology
January 2005
CONTRACT No: G6RD-CT-2000-00412
NPL Report DEPC MPE 015
Crown copyright 2005 Reproduced with the permission of the Controller of HMSO
and Queen’s Printer for Scotland
ISSN 1744-0262
National Physical Laboratory Hampton Road, Teddington, Middlesex, TW11 0LW
Extracts from this report may be reproduced provided the source is acknowledged and the extract is not taken out of context.
We gratefully acknowledge the financial support of the UK Department of Trade and Industry (National Measurement System Policy Unit)
Approved on behalf of the Managing Director, NPL, by Dr M G Gee, Knowledge Leader, Materials Performance Team authorised by Director, Engineering and Process Control Division
NPL Report DEPC MPE 015
“TENSTAND” WP2 Final Report
Digital Tensile Software Evaluation
Jerry Lord, Malcolm Loveday, Martin Rides, Ian McEnteggart
Executive Summary This is the final report of Work Package 2 concerned with the validation of Tensile Testing software as part of the EU Project ‘TENSTAND’. The majority of tensile testing machines are now computer controlled, and the results of the tensile test are usually automatically processed by dedicated software with little or no interaction from the test machine operator. The informative annex A ‘Recommendations concerning the use of computer controlled tensile testing machines’ in the current issue of EN 10002-1 gives guidance on various aspects of testing associated with computer controlled tensile testing. Until now there has been no co-ordinated systematic evaluation or activity aimed at providing reference data for validating the analysis software used in these tests. Within TENSTAND WP2, work has been carried out to validate tensile test software using a set of ASCII datafiles with agreed values, so that the operators may have confidence in the results produced during testing. Considerable time and effort was devoted to agreeing the format of the ASCII datafiles and their associated header data, so that commercial tensile software could recognise the data and derive the required tensile parameters. A series of ASCII datafiles were then prepared representing the typical tensile characteristics of a range of industrially important materials – including ferritic and austenitic steels having upper and lower yield strength characteristics and monotonic yielding, and non-ferrous alloys including a number of aluminium alloys and the nickel based alloy, Nimonic 75 (the Room Temperature Tensile Reference Material, CRM 661). Some synthetic datafiles, with different levels of noise, have also been included in the analysis. The datafiles were analysed by a number of different organisations, both industrial and academic, together with testing machine manufacturers using a range of software. Agreed values for the tensile properties of each datafile were decided by a WP2 working group. Even after careful and detailed inspection of the data and the individual stress-strain curves, some files continued to give problems. It is clear from the results presented that in some cases there is considerable variation and uncertainties in the reported values, which is probably larger than might be expected for the software alone. The main causes of the large uncertainty appear to be related to different interpretations of the definitions in the Standard, and anomalies in the stress-strain curves, often caused by a premature change in the test conditions (speed or control mode). Some of the problems were specific to a particular material behaviour (for instance there were significant problems with some of the files that showed upper and lower yield behaviour), whilst others (such as the large variation in the calculated values for modulus) were a factor in all the datafiles. Many of these issues are discussed in this report and have formed the basis of recommendations to be put forward to the Standards committee, for inclusion in future revisions of EN 10002-1. A further decision was taken by the WP2 working group to exclude any datafiles where there were issues and anomalies, including all the 5Hz files. This has resulted in a “Premium Quality ASCII Dataset” of 15 files consisting of at least one file from each of the material types examined. The definitive agreed values for this dataset are given in Section 8. These “Premium Quality ASCII Datafiles“ are now available, along with the agreed values, for instrument manufacturers and operators to validate their tensile testing software.

NPL Report DEPC MPE 015
CONTENTS FOREWORD ........................................................................................................................ i 1 Introduction to the TENSTAND project ................................................................1 2 Objectives and Activities of Work Package 2 (WP2) ............................................2 3 Agreed TENSTAND ASCII file format ..................................................................4 4 Generation of representative stress-strain curves .................................................5 5 Distribution of files and list of participants ..........................................................12 6 Results .......................................................................................................................14
6.2 Strategy for analysing the data .......................................................................14 6.3 Initial analysis of the full dataset....................................................................14 6.3 Identification of outliers and agreed values ...................................................19
7 Issues, difficulties and rejected files.......................................................................24 7.1 Example 1 – Ambiguities in defining Fm and Rm (File 26)............................25 7.2 Example 2 – Problems caused by a premature change of speed (Files 26, 34,
13)...................................................................................................................26 7.3 Example 3 – Identifying a transient effect (Files 13, 53, 34).........................30 7.4 Example 4 – Regarding the definition of Ae (File 13) ...................................32 7.5 Example 5 – Effect of modulus variation on other parameters (Files 22, 1, 6)
........................................................................................................................33 7.6 Example 6 – Correcting for preloads and offsets (File 42) ............................36 7.7 Example 7 – The use of synthetic datafiles (File 57) .....................................37 7.8 Example 8 – Scatter in identifying fracture point, At (File 30)......................38 7.9 Example 9 – Smoothing and noise (Files 46, 61) ..........................................39 7.10 Example 10 – Relevance of files at 5Hz sampling rate (Files 44, 15) ...........41
8 Premium Quality ASCII Datasets and Agreed Values .......................................43 9 Validation of software using the TENSTAND ASCII Datafiles ........................45 10 Contribution of the software to the measurement uncertainty..........................47 11 Summary and Recommendations to Standards Committee ..............................48 12 Acknowledgements ..................................................................................................50 13 References .................................................................................................................50 APPENDIX A Glossary of relevant definitions in EN 10002-1 .................................51 APPENDIX B Spreadsheet of All Datafiles..................................................................56


NPL Report DEPC MPE 015
FOREWORD This Report has been compiled by Jerry Lord & Malcolm Loveday with help from Martin Rides & Ian McEnteggart as part of Work Package 2 of the EU Funded Project ‘TENSTAND’, Contract Number G6RD-2000-00412. The following partners also made significant contributions, either by undertaking tests, supplying advise and comments, or by participation in the WP2 meetings which were held at Instron, High Wycombe (Dec 2001 and Nov 2002), BSI, Chiswick, London (July 2002), and NPL, Teddington (July 2003):
NAME ORGANISATION COUNTRY J. Aegerter Hydro Aluminium Germany H. Bloching Zwick Germany J.-L. Geoffroy Sollac / USINOR France H. Klingelhoffer BAM Germany R.D. Lohr Instron UK J. D. Lord NPL UK M. S. Loveday Beta Technology, NPL UK I. McEnteggart Instron UK M. Nicholson ASTM / Instron USA M. Pietrzyk AGH Poland
M. Rides NPL UK S. Sotheran Corus UK
The original work package leader was Prof. Ray Lohr, from Instron, who left the company to take up a new appointment during the course of the project. The leadership was subsequently taken on jointly by Ian McEnteggart (Instron) and Jerry Lord (NPL).
i

NPL Report DEPC MPE 015

NPL Report DEPC MPE 015
1 INTRODUCTION TO THE TENSTAND PROJECT The current Standard for the Tensile Testing of Metallic Materials, EN 10002-1, now recognises the dominance of computer controlled testing machines but the systematic technological evidence on which such a Standard should be based has not been readily available. The TENSTAND project (2001-2004), which was funded by the EU under their programme "Promoting Competitive & Sustainable Growth", has sought to address this deficiency by detailed examination of various aspects of the test procedure in the current Standard. The project acronym ‘TENSTAND’ was chosen to reflect the focus of the work, dealing with the Tensile Standard. The uniaxial tensile test is the primary method used for quality control and certification of virtually all metallic materials. This represents over 80 million tons per annum of various ferrous and non-ferrous alloys sold throughout the European Community with a value in excess of 50,000 million euro. Rapid turnaround of testing is essential to prevent production line delays and automatic testing is now becoming commonplace with robots feeding computer controlled testing machines. Reliable tensile data is also crucial in the design of many safety critical components in power plant, nuclear and aerospace applications where inaccurate data can result in catastrophe. The importance of achieving reliable and reproducible tensile data from different laboratories and test houses throughout the Community is also vital if fair trade on an equitable basis is to be maintained, otherwise inadequacies in the Standard could be exploited to give unfair commercial advantage to companies interpreting the document in a manner that was not intended by the Standards writing body. Activities in the TENSTAND project have sought to examine these issues via a detailed intercomparison exercise evaluating the effect of different test parameters, a study on modulus, and the generation of reference ASCII datafiles for the validation and calibration of tensile testing analysis software. The project consisted of a series of targeted research activities carried out within a framework of five Workpackages (WPs), namely:
WP 1: Literature Review A review of relevant literature on tensile test machine control characteristics, modulus determination and inter-comparison exercises, compiling data suitable for the assessment of uncertainty.
WP 2: Evaluation of Digital Tensile Software Specification of software including evaluation of mathematical and graphical methods and preparation of ASCII format tensile data sets of typical engineering alloys. The data sets were used to compare results from the determination of designated material properties including proof stress or upper and lower yield stress, tensile strength, and elongation at fracture using commercial software from the testing machine manufacturers, and in-house university and industrial software.
WP 3: Modulus Measurement Methods Evaluation of algorithms used for determining tensile modulus by software validation using ASCII tensile data sets and by mechanical testing. Findings were also compared with modulus determined using alternative techniques.
WP 4: Evaluation of Machine Control Characteristics This part of the project validated options of test machine control criteria, i.e. new speed changes during the test proposed for inclusion in the Standard. This was achieved by a test programme using a
Page 1 of 68

NPL Report DEPC MPE 015
selection of materials, including the Nimonic 75 Tensile Certified Reference Material CRM661, and a range of other industrial relevant materials.
WP 5: Dissemination, Exploitation and Project management Included reviewing interpretations of the existing Standards, EN 10002-1 & EN 10002-5, dissemination of the Project’s findings and the preparation of recommendations for a Normative Annex for the Tensile Testing Standard. This WP also included the co-ordination and management of the Project.
The work described in this report deals with the activity in WP2 – the generation and analysis of reference ASCII data sets for the validation of tensile testing analysis software. Reports from the other work packages are available separately or can be downloaded as pdf files from the TENSTAND website, at www.npl.co.uk/npl/cmmt/projects/tenstand To avoid repetition throughout the document, EN 10002-1 is sometimes referred to as the “Standard”. As the focus of the work is to provide validation of EN 10002-1, it is hoped that the reader accepts that this terminology does in fact refer to EN 10002-1. 2 OBJECTIVES AND ACTIVITIES OF WORK PACKAGE 2 (WP2) The majority of tensile testing machines are now computer controlled, and in many cases the results of the tensile test are automatically processed by dedicated software with little or no interaction from the test machine operator. The informative Annex A ‘Recommendations concerning the use of computer controlled tensile testing machines’ in the current issue of EN 10002-1 gives guidance on various aspects of testing associated with computer controlled tensile testing, but until now there has been no co-ordinated systematic evaluation or activity aimed at providing reference data for validating the analysis software used in these tests. Within TENSTAND WP2, work has been carried out to validate tensile test software using a set of ASCII datafiles with agreed values, so that the operators may have confidence in the results produced during testing. In future, such validation procedures will probably need to become an integral part of the calibration of the testing machine and will also be needed for accreditation purposes. In principle this is a generic problem that will need to be addressed by the majority of testing machines used to determine materials properties, whether it is an impact testing machine, a fracture toughness testing machine, a fatigue machine or a tensile testing machine, as they become increasingly dependent on computers, both for control and processing of results.
In America the ASTM Standards committee E08.03.04 - Data Acquisition Task Group is currently working on producing a draft standard entitled ‘Standard Guide for Evaluating Software used to Calculate Mechanical Properties of Materials’ which requires the various sub-committees responsible for individual testing standards to produce ASCII datafiles representing particular tests with agreed values for the designated material properties. A similar concept has already been used within another European funded project where an agreed ASCII datafile was used to compare and hence validate the results associated with the development of the standard concerning Instrumented Charpy Impact Testing (Varma & Loveday, 2002). The same approach has also been adopted in this project, where a series of ASCII datafiles have been prepared representing the typical tensile characteristics of a range
Page 2 of 68

NPL Report DEPC MPE 015
of industrially relevant materials. Datafiles were analysed by a number of different organisations, both industrial and academic, together with testing machine manufacturers using a range of software. Results are presented and discussed in the following sections of the report. It should be appreciated that the use of ASCII datafiles in this manner is not primarily concerned with conventional validation of software in absolute terms via the rigorous analysis of lines of code, but in the pragmatic sense of demonstrating that the underlying algorithms used by the testing machine manufacturers to interpolate or calculate the material properties give comparable answers to those determined by manual analysis of the analogue graphs. The latter activity was carried out by detailed inspection of the files by the WP2 working group. It is anticipated that a spin-off from this project will be the realisation by the test machine manufacturers of the benefits of incorporating into their new machines the ability to input data in the agreed ASCII format so that in future, it will be a routine process to validate the software either as part of an annual accreditation audit, or more regularly for machines used for product release testing. The concept behind this approach is shown schematically in Figure 1, which was prepared by Prof. Lohr as part of the TENSTAND project.
Crosshead (moving)
Tensile Testing Machine (generic)
Loadcell Extensometer Grips
Crosshead (fixed)
Base
Columns Screws + ve displacement
Demand
Load Strain
Displacement
Feedback
Controller CD + ASCII raw data files (format not critical)
Reference System:Independent computer+ software analysis,e.g. Excel Spreadsheet
Computer
User system No1software analysis
COMPARE
CD + ASCII raw data files (formally agreed input format)
Reference Systemsoftware analysis
User system 1software analysis
User system “n” software analysis
R. D. Lohr Sept ember 2001
Crosshead (moving)
Tensile Testing Machine (generic)
Loadcell Extensometer Grips
Crosshead (fixed)
Base
Columns Screws + ve displacement
Demand
Load Strain
Displacement
Feedback
Controller CD + ASCII raw data files (format not critical)
Reference System:Independent computer+ software analysis,e.g. Excel Spreadsheet
Computer
User system No1software analysis
Computer
User system No1software analysis
COMPARE
CD + ASCII raw data files (formally agreed input format)
Reference Systemsoftware analysis
User system 1software analysis
User system “n” software analysis
R. D.
Fig 1 Schematic of machine and software validation and calibration process using the ASCII datafiles and format developed in TENSTAND WP2
Page 3 of 68

NPL Report DEPC MPE 015
It should be noted that considerable time and effort was devoted to agreeing the format of the ASCII datafiles and their associated header data, so that commercial tensile software could recognise the files and derive the required tensile parameters. Datafiles representing typical tensile curves of ferritic and austenitic steels having upper and lower yield strength characteristics and monotonic yielding, and non-ferrous alloys including a number of aluminium alloys and the nickel-based alloy, Nimonic 75 (the room temperature tensile reference material, CRM 661) have been prepared. Some synthetic datafiles, with different levels of noise, have also been included in the intercomparison. Following a software intercomparison exercise involving 13 organisations, the correct values for the various ASCII files were agreed by manual inspection of the raw datafiles by a working group, rather than accepting a statistical average value determined in the round robin exercise. This is unlike the procedure normally undertaken when determining agreed certified values for reference materials, and can be considered equivalent to identifying and removing “outliers” based on logical, reasoned argument. For some parameters, such as modulus and proof stress, it was not possible to specify a single value for the parameter, and a range of values is given. Uncertainties for each parameter have been calculated and should be included as a “software factor” in any uncertainty budget developed. The ASCII datafiles and the agreed tensile parameters developed in the TENSTAND project are now available for software validation purposes, on the TENSTAND web site. 3 AGREED TENSTAND ASCII FILE FORMAT A major task within WP2 was the agreement of the ASCII datafile format for the intercomparison exercise and for the future validation of commercial software packages by direct input into the tensile testing machine software. A number of meetings were held to agree the details of the ASCII data format and the rate for data capture. Following a meeting of the main WP2 partners in November 2002 at Instron, High Wycombe, the following format was agreed (Fig 2). Dr Murray Nicholson had also attended the meeting in his capacity of Chairman of two ASTM committees that are considering a similar approach to that adopted in TENSTAND, to ensure that wherever possible, the recommendations from the European project will be identical to the American approach.
Page 4 of 68

NPL Report DEPC MPE 015
Header Test Parameters
Data
"Reference";"EN10002-1" "Identification";"Tenstand" "Material";"Nimonic" "Extensometer to crosshead transition";0.00;"mm" "Specimen geometry";"Circular" "Cross-sectional area = So" "Extensometer gauge length = Le" "Extensometer output in mm" "Parallel length = Lc" "Data acquisition rate 50Hz" "Data row for start force reduction (Hysteresis) = Hs" "Data row for end force reduction (Hysteresis) = He" "Data row for switch to crosshead = Cs" "File length N data rows" "File width M data columns" "So";78.46129;"mm2" "Le";50.00000;"mm" "Lc";60.00000;"mm" "N";3127 "M";4 "Hs";0 "He";0 "Cs";0 "time";"crosshead";"extensometer";"force" "s";"mm";"mm";"kN" 0.00000;0.0515983300;0.0000579191;0.1913788000521364400000000000000000;0.0000637003000000000000000;0.191544500000000000
Fig 2: Agreed format of TENSTAND ASCII datafiles The agreed format of the datafile contains a header, details of the test parameters and the data. The header includes basic details on the material and definitions of the various parameters; the section on test parameters includes actual values for the specimen geometry and extensometer gauge length and, where appropriate, information on the machine control and crossover conditions, followed by the data from the test in the format of time (s), crosshead displacement (mm), extensometer extension (mm) and force (kN). The datafiles generated in this project were then used in the software intercomparison exercise described later in the report to evaluate and compare results from different software packages for determining material properties such as modulus, proof stress or upper and lower yield stress values, tensile strength, and elongation at fracture. 4 GENERATION OF REPRESENTATIVE STRESS-STRAIN CURVES The generation of the datafiles for the intercomparison exercise was carried out by Instron, Zwick and TKS, using materials and specimens supplied by the project partners. In total over 30 tensile tests were performed on 11 batches of material, chosen to represent a range of commercial alloys with different characteristics. A further set of synthetically generated data was later supplied by NPL for inclusion in the exercise. This was an important set of data as it
Page 5 of 68
NPL Report DEPC MPE 015
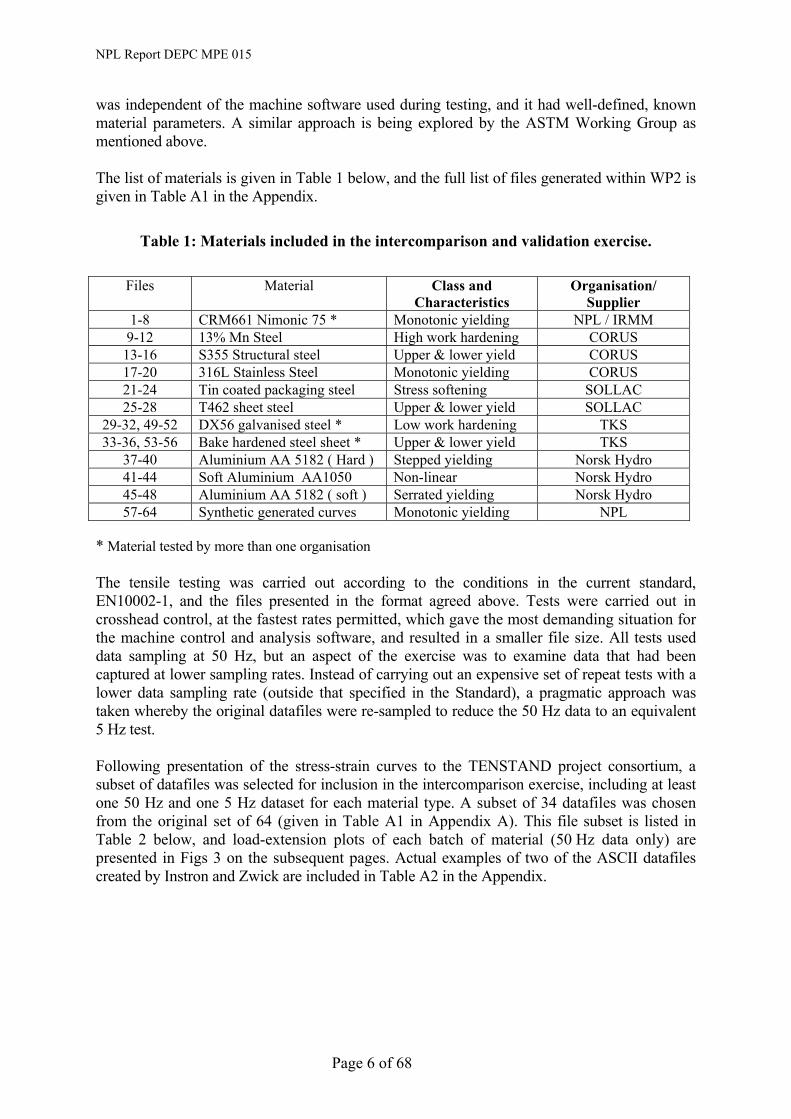
was independent of the machine software used during testing, and it had well-defined, known material parameters. A similar approach is being explored by the ASTM Working Group as mentioned above. The list of materials is given in Table 1 below, and the full list of files generated within WP2 is given in Table A1 in the Appendix.
Table 1: Materials included in the intercomparison and validation exercise.
Files Material Class and Characteristics
Organisation/ Supplier
1-8 CRM661 Nimonic 75 * Monotonic yielding NPL / IRMM 9-12 13% Mn Steel High work hardening CORUS
13-16 S355 Structural steel Upper & lower yield CORUS 17-20 316L Stainless Steel Monotonic yielding CORUS 21-24 Tin coated packaging steel Stress softening SOLLAC 25-28 T462 sheet steel Upper & lower yield SOLLAC
29-32, 49-52 DX56 galvanised steel * Low work hardening TKS 33-36, 53-56 Bake hardened steel sheet * Upper & lower yield TKS
37-40 Aluminium AA 5182 ( Hard ) Stepped yielding Norsk Hydro 41-44 Soft Aluminium AA1050 Non-linear Norsk Hydro 45-48 Aluminium AA 5182 ( soft ) Serrated yielding Norsk Hydro 57-64 Synthetic generated curves Monotonic yielding NPL
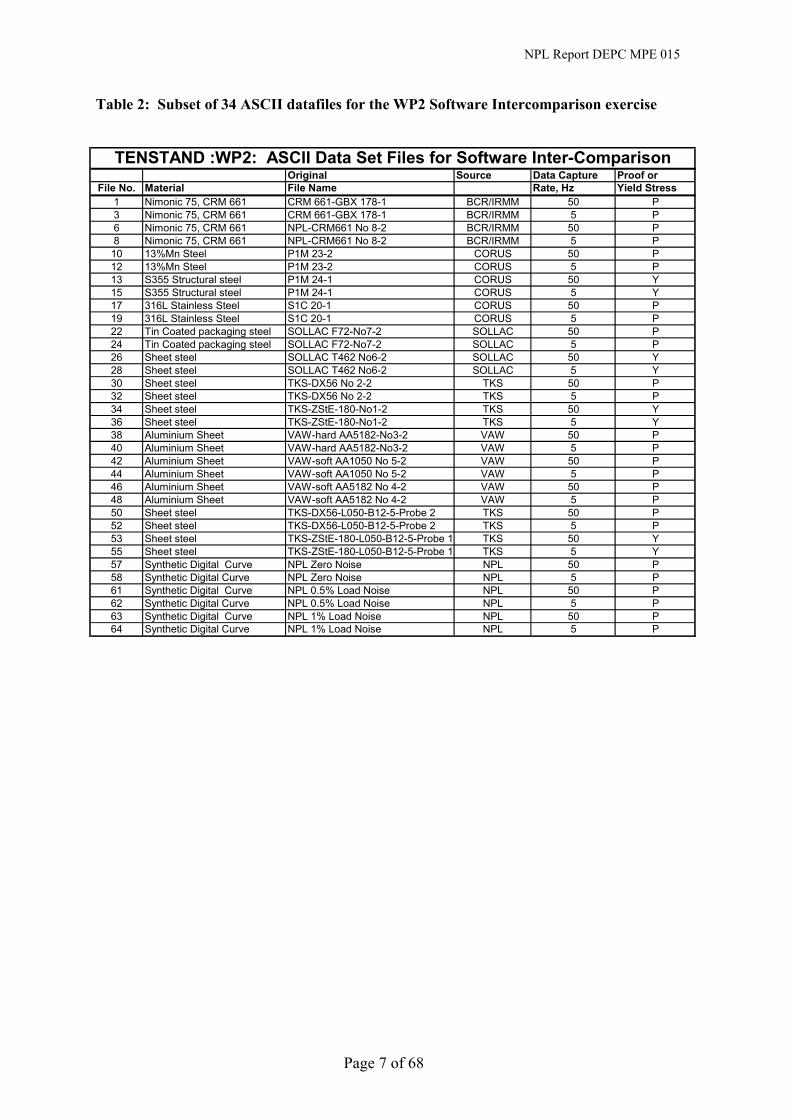
* Material tested by more than one organisation The tensile testing was carried out according to the conditions in the current standard, EN10002-1, and the files presented in the format agreed above. Tests were carried out in crosshead control, at the fastest rates permitted, which gave the most demanding situation for the machine control and analysis software, and resulted in a smaller file size. All tests used data sampling at 50 Hz, but an aspect of the exercise was to examine data that had been captured at lower sampling rates. Instead of carrying out an expensive set of repeat tests with a lower data sampling rate (outside that specified in the Standard), a pragmatic approach was taken whereby the original datafiles were re-sampled to reduce the 50 Hz data to an equivalent 5 Hz test. Following presentation of the stress-strain curves to the TENSTAND project consortium, a subset of datafiles was selected for inclusion in the intercomparison exercise, including at least one 50 Hz and one 5 Hz dataset for each material type. A subset of 34 datafiles was chosen from the original set of 64 (given in Table A1 in Appendix A). This file subset is listed in Table 2 below, and load-extension plots of each batch of material (50 Hz data only) are presented in Figs 3 on the subsequent pages. Actual examples of two of the ASCII datafiles created by Instron and Zwick are included in Table A2 in the Appendix.
Page 6 of 68
NPL Report DEPC MPE 015
Table 2: Subset of 34 ASCII datafiles for the WP2 Software Intercomparison exercise
Original Source Data Capture Pr orFile No. Material File Name Rate, Hz Yield Stress
1 Nimonic 75, CRM 661 CRM 661-GBX 178-1 BCR/IRMM 50 P3 Nimonic 75, CRM 661 CRM 661-GBX 178-1 BCR/IRMM 5 P6 Nimonic 75, CRM 661 NPL-CRM661 No 8-2 BCR/IRMM 50 P8 Nimonic 75, CRM 661 NPL-CRM661 No 8-2 BCR/IRMM 5 P10 13%Mn Steel P1M 23-2 CORUS 50 P12 13%Mn Steel P1M 23-2 CORUS 5 P13 S355 Structural steel P1M 24-1 CORUS 50 Y15 S355 Structural steel P1M 24-1 CORUS 5 Y17 316L Stainless Steel S1C 20-1 CORUS 50 P19 316L Stainless Steel S1C 20-1 CORUS 5 P22 Tin Coated packaging steel SOLLAC F72-No7-2 SOLLAC 50 P24 Tin Coated packaging steel SOLLAC F72-No7-2 SOLLAC 5 P26 Sheet steel SOLLAC T462 No6-2 SOLLAC 50 Y28 Sheet steel SOLLAC T462 No6-2 SOLLAC 5 Y30 Sheet steel TKS-DX56 No 2-2 TKS 50 P32 Sheet steel TKS-DX56 No 2-2 TKS 5 P34 Sheet steel TKS-ZStE-180-No1-2 TKS 50 Y36 Sheet steel TKS-ZStE-180-No1-2 TKS 5 Y38 Aluminium Sheet VAW-hard AA5182-No3-2 VAW 50 P40 Aluminium Sheet VAW-hard AA5182-No3-2 VAW 5 P42 Aluminium Sheet VAW-soft AA1050 No 5-2 VAW 50 P44 Aluminium Sheet VAW-soft AA1050 No 5-2 VAW 5 P46 Aluminium Sheet VAW-soft AA5182 No 4-2 VAW 50 P48 Aluminium Sheet VAW-soft AA5182 No 4-2 VAW 5 P50 Sheet steel TKS-DX56-L050-B12-5-Probe 2 TKS 50 P52 Sheet steel TKS-DX56-L050-B12-5-Probe 2 TKS 5 P53 Sheet steel TKS-ZStE-180-L050-B12-5-Probe 1 TKS 50 Y55 Sheet steel TKS-ZStE-180-L050-B12-5-Probe 1 TKS 5 Y57 Synthetic Digital Curve NPL Zero Noise NPL 50 P58 Synthetic Digital Curve NPL Zero Noise NPL 5 P61 Synthetic Digital Curve NPL 0.5% Load Noise NPL 50 P62 Synthetic Digital Curve NPL 0.5% Load Noise NPL 5 P63 Synthetic Digital Curve NPL 1% Load Noise NPL 50 P64 Synthetic Digital Curve NPL 1% Load Noise NPL 5 P
TENSTAND :WP2: ASCII Data Set Files for Software Inter-Comparisonoof
Page 7 of 68

NPL Report DEPC MPE 015
File 1: Nimonic 75
0
10
20
30
40
50
60
70
0 5 10 15 20 25
Extension (mm)
Load
(kN
)
File 13: S355 Structural Steel
0
5
10
15
20
25
30
35
40
45
50
0 2 4 6 8 10 12 14 16 18 20
Extension (mm)
Load
(kN
)
File 17: 316 Stainless Steel
0
5
10
15
20
25
30
35
40
45
50
0 5 10 15 20 25 30
Extension (mm)
Load
(kN
)
File 10: 13%Mn Steel
0
10
20
30
40
50
60
70
80
0 5 10 15 20 25 30
Extension (mm)
Load
(kN
)
Fig 3: Load-extension curves for each material type
Page 8 of 68

NPL Report DEPC MPE 015
Page 9 of 68
File 22: Tin Coated Packaging Steel
0
0.5
1
1.5
2
2.5
0.00 0.10 0.20 0.30 0.40 0.50 0.60 0.70 0.80 0.90 1.00
Extension (mm)
Load
(kN
)
File 26: Sheet Steel
0
0.5
1
1.5
2
2.5
3
0.00 0.50 1.00 1.50 2.00 2.50 3.00
Extension (mm)
Load
(kN
)
File 30: Sheet Steel
0
0.5
1
1.5
2
2.5
3
3.5
4
4.5
0.00 5.00 10.00 15.00 20.00 25.00 30.00 35.00
Extension (mm)
Load
(kN
)
File 34: Sheet Steel
0
1
2
3
4
5
6
7
0.00 5.00 10.00 15.00 20.00 25.00 30.00 35.00
Extension (mm)
Load
(kN
)
Fig 3 (contd): Load-extension curves for each material type

NPL Report DEPC MPE 015
Page 10 of 68
File 38: Aluminium Sheet
0
0.5
1
1.5
2
2.5
0.00 0.50 1.00 1.50 2.00 2.50 3.00 3.50 4.00 4.50 5.00
Extension (mm)
Load
(kN
)
File 42: Aluminium Sheet
0
0.2
0.4
0.6
0.8
1
1.2
1.4
0.00 5.00 10.00 15.00 20.00 25.00 30.00 35.00 40.00
Extension (mm)
Load
(kN
)
File 46: Aluminium Sheet
0
1
2
3
4
5
6
7
8
9
0.00 2.00 4.00 6.00 8.00 10.00 12.00 14.00 16.00 18.00 20.00
Extension (mm)
Load
(kN
)
File 50: Sheet Steel
0
0.5
1
1.5
2
2.5
3
0.00 5.00 10.00 15.00 20.00 25.00
Extension (mm)
Load
(kN
)
Fig 3 (contd) Load-extension curves for each material type

File 53: Sheet Steel
0
0.5
1
1.5
2
2.5
3
3.5
4
0.00 5.00 10.00 15.00 20.00 25.00
Extension (mm)
Load
(kN
)
NPL Report DEPC MPE 015 File 61: NPL Synthetic data
0
10
20
30
40
50
60
70
0.00 5.00 10.00 15.00 20.00 25.00 30.00
Extension (mm)
Load
(kN
)
he File 63: NPL Synthetic data
0
10
20
30
40
50
60
70
0.00 5.00 10.00 15.00 20.00 25.00 30.00
Extension (mm)Lo
ad (k
N)
File 57: NPL Synt tic data
0
10
20
30
40
50
60
70
0.00 5.00 10.00 15.00 20.00 25.00 30.00
Extension (mm)
Load
(kN
)
Fig 3 (contd): Load-extension curves for each material type
Page 11 of 68

NPL Report DEPC MPE 015
5 DISTRIBUTION OF FILES AND LIST OF PARTICIPANTS Following agreement of the TENSTAND partners at the project meeting in Dublin held in February 2003, the datafiles were distributed on CD for analysis. The list of organisations invited to participate in the exercise is given in Table 3.
Table 3: List of participants in WP2 ASCII datafiles analysis
Organisation Contact Country BAM * Dr Hellmuth Klingelhoffer Germany BAOSTEEL LI Heping China CORUS * Stuart Sotheran UK Dirlik Controls Dr Turan Dirlik UK DMG (Dennison-Mayes) * Dr Darren Burke UK EMIC José Gonçalves Brazil ESH Testing Ltd Trevor Allen, Martin Button UK Hounsfield Test Equipment Edmund Hall UK IBMB Dr.-Ing. Martin Laube Germany Instron (Schenk)* Ian McEnteggart UK/USA Lloyd Instruments Ltd Toby Rogers , Sarah Brien UK MTS Gary Dahlberg USA NPL * Dr Jerry Lord UK Norsk Hydro * Johannes Aegerter Germany PLANSEE Dr Wolfrom Knabl Austria Servotest Nick Richardson UK Tinius Olsen Testing Machine Co. Earl Ruth/ J.A.Millane USA Sollac/USINOR * Jean Luc Geoffroy France Zwick (Dartec) * Herman Bloching Germany
* TENSTAND Consortium partners
In total 13 organisations completed the analysis, using a variety of commercial test machine software, other proprietary software and in-house software. Details of the software packages used are included in Table A3 in the Appendix. Some participants returned more than one set of results for cases where different software or analysis parameters had been used, resulting in 14 sets of data. As is common practice with such intercomparison exercises, the results have been presented in a form that preserves the anonymity of the organisation, and are labelled 1-14 corresponding to the order in which the results were returned. Of course, the laboratory that undertook the measurements will be able to recognize their own results.
Page 12 of 68

NPL Report DEPC MPE 015
Participants were given detailed instructions and asked to analyze each data set to provide results for the following parameters, calculated in accordance with the definitions in EN 10002-1:
• 0.1% Proof Stress, Rp0.1, (MPa) • 0.2% Proof Stress, Rp 0.2, (MPa) • Upper Yield Stress ReH, (MPa) • Lower Yield Stress, ReL, (MPa) • Tensile Strength, Rm, (MPa) • Maximum Force, Fm, (N) • Percentage Elongation after Fracture, A, (%) • Percentage Total Elongation at Fracture, At (%) • Percentage non-proportional elongation at maximum force, Ag, (%) • Percentage total elongation at maximum force, Agt, (%) • Yield Point Extension, Ae (%)
If possible, participants were also asked to report the values for:
• Young’s Modulus (from the slope of the load-extension or stress-strain curves) and the specific stress range over which this was calculated (if appropriate)
• Strain values at which point the proof or yield stresses were determined, (e.g. A0.1, A0.2, AeH, & AeL).
and note whether any smoothing or filtering of the data had been undertaken Although these latter values and information are not a requirement of the Standard, it was deemed important as they might assist in explaining any inter-laboratory discrepancies. The default spreadsheet for return of the results is shown in Table A4 in the Appendix. Cells marked with an ‘x’ indicate that no values were expected for that particular material and parameter in the Table. An initial assessment of the returns can be summarised thus:
• Not all organisations completed the analysis on the full dataset • Different levels of precision were quoted • Some organisations applied rounding to the results • Some organisations used default values for E for the calculation of Rp0.1 & Rp0.2 • Only 2 organisations applied smoothing, where appropriate • Some organisations returned values for parameters that were not appropriate for
the particular material behaviour Organisations were also encouraged to comment on their data, particularly if there were problems or difficulties with a test or in measuring a particular parameter, or whether an approach different to that recommended in the Standard was used. A summary of the results, observations and conclusions from the exercise, together with some recommendations for inclusion in future revisions of EN 10002-1 are given in the following sections.
Page 13 of 68

NPL Report DEPC MPE 015
6 RESULTS 6.2 STRATEGY FOR ANALYSING THE DATA All the results were sent to NPL for collation and analysis. Throughout the duration of the project, updates were reported to the main project consortium at the 6-monthly project meetings, and a separate WP2 ASCII subgroup was formed to discuss the values and issues in more detail. The strategy adopted for the analysis of the data involved the following approach …
1. Collate and analyse all the data, including uncertainties, without removing outliers 2. Agree the outliers with WP2 working group for each datafile 3. Agree definitive values for ReH, ReL, Rm and Fm 4. Agree a range of values for E, Rp0.1, Rp0.2 and A 5. Calculate the uncertainties on the “refined” dataset (without outliers) for comparison
with Step 1Discard any datafiles that had ambiguities or problems with the analysis 7. Highlight issues and recommendations for input into the Standards committee 8. Agree a final subset of Premium Quality datafiles 9. Prepare the dataset for distribution on CD and via the project website
6.3 INITIAL ANALYSIS OF THE FULL DATASET Table 4 shows the results returned for 3 representative datafiles, without removing any outliers. The uncertainty values for each parameter (but not including A0.1, A0.2, AeH, & AeL, which were provided for information only) are summarized in Table 5, and were calculated from twice the standard deviation for a given data set, representing the uncertainty at the 95% confidence limit. The uncertainty values are expressed as a percentage of the mean value of the relevant parameter. The cells have been colour coded for presentation purposes, highlighting uncertainties in the range 1-2% (yellow), 2-5% (orange) and over 5% (red). Uncertainty values below 1% are not highlighted. Figure 4 shows the uncertainty values for the parameters of interest, grouped according to file number and material type. The data are presented in pairs, such that the first is the 50Hz datafile and the second are the results from the corresponding 5Hz file. Note that the figures are not plotted to the same scale and from this initial assessment it is clear that there are issues with measuring some of the parameters (e.g. modulus and elongation show large uncertainties and scatter), and that particular datafiles are giving problems. It is important to remember at this stage that the data is from a single test and the results do not include any factors due to material variability or different test conditions. All the participants are analyzing the same data, which they are converting into stress-strain data, and the uncertainty in the values is associated solely with the software and the analysis methods used. As we will see later however, following a more rigorous assessment of the data and inspection of the individual load-extension and stress-strain curves, in many cases a significant contribution to the uncertainty has arisen because of problems encountered during testing (eg premature speed change), poor quality data, and different interpretations of the Standard.
Page 14 of 68

NPL Report DEPC MPE 015
Table 4: Examples of the analysis returns for 3 ASCII datafiles
Lab ID Data set ID Rp0.1 Rp0.2 ReH ReL Rm Fm A At Ag Agt Ae E A0.1 A0.21 1 303.99 309.87 764.36 59972.7 41.22 41.5 30.81 31.18 208 0.25 0.352 1 303.84 309.88 764.36 59971.6856 34 30.55 31.18 210.156 0.24 0.353 1 304.57 310.1 764.36 59971.6856 34 30.52 31.18 200 0.25 0.354 1 303.8 309.8 764.4 59972.73 41.2 41.5 30.8 31.2 211 0.2 0.35 1 303.8 309.768 764.4 59973 41.229 41.495 30.8 31.2 211.862 0.243 0.3466 1 303.8689 309.8033 764.3495 59971.9 41.2031 41.4726 30.9854 31.3489 210.3043 0.24516 0.347997 1 304.2 309.9 764.4 59973 41.2 41.5 31.1 31.5 205.5 0.249 0.3498 1 304.927 309.706 764.708 764.708 60000 41.4 30.7 200.848 0.252 0.3549 1 303.9 309.8 764.4 59973 41.24 41.496 30.814 31.178 210.05 0.245 0.348
10 1 303.86 309.8 764.36 59972.7 41.23 41.5 30.81 31.18 210.7 0.25 0.3511 1 304.2 310 764.3 59970.99 41.15 41.43 30.91 31.28 202.85 0.25 0.3512 1 303.9 309.8 764.4 59970 41.2 41.5 30.8 31.2 210.1 0.245 0.34813 1 303 310 764 59900 41 41.5 31 31.5 216.5 0.2 0.314 1 303.94 309.84 764.36 59972.73 41.22 41.50 30.81 31.18 208.82
VAW-hard AA5182-No3-2Lab ID Data set ID Rp0.1 Rp0.2 ReH ReL Rm Fm A At Ag Agt Ae E A0.1 A0.2
1 38 385.51 396.53 434.31 2006.5 4.73 5.35 4.32 4.95 69 0.66 0.772 38 384.59 396.14 434.31 2006.5122 5.48 4.94 68.826 0.65 0.763 38 382.78 395.44 395.44 1826.9328 5.48 4.94 70 0.63 0.754 38 385.3 396.4 434.3 2006.532959 4.7 5.3 4.3 4.9 69 0.7 0.85 38 385.219 396.397 434.3 2006.5 4.732 5.354 4.3 4.9 69.32 0.656 0.7726 38 385.6295 396.5263 434.3145 2006.5 4.7184 5.3727 4.3091 4.9386 68.9826 0.65209 0.767887 38 386.3 396.8 434.3 2007 5.5 5.5 4.3 4.9 68.1 0.657 0.7738 38 385.822 396.645 433.441 433.441 2002.5 5.343 5.3437 68.903 0.654 0.779 38 385.6 396.5 434.3 2007 4.7375 5.475 4.309 4.939 68.98 0.6538 0.7688
10 38 385.59 396.52 434.31 2006.53 4.628 5.251 4.309 4.939 69.03 0.66 0.7811 38 386.2 396.8 404.11 398.2 428 1977.21 4.69 5.31 4.31 4.93 4.03 68.26 0.66 0.7712 38 385.4 396.5 404.1 398.3 434.3 2007 4.7 5.4 4.3 4.9 69.2 0.651 0.76713 38 385 397 435 2000 5 5 4 5 69 0.6 0.714 38 386.29 396.84 404.11 398.03 434.31 2006.53 4.72 5.36 0.27 0.86 68.16
TKS-ZStE-180-L050-B12-5-Probe 1Lab ID Data set ID Rp0.1 Rp0.2 ReH ReL Rm Fm A At Ag Agt Ae E A0.1 A0.2
1 53 246.82 230.1 270.06 231.94 318.86 3781.6 40.37 40.39 18.93 19.09 1.74 204 0.22 0.312 53 270.06 228.66 318.86 3781.6796 40.82 18.86 19.08 1.93 198.6533 53 270.06 228.66 318.86 3781.6796 40.82 18.86 19.08 1.93 2004 53 270.1 228.7 318.9 3781.637451 40.8 40.8 18.9 19.1 1.8 2045 53 270.064 233.633 318.9 3781.6 38.164 38.261 18.9 19.1 1.781 206.2016 53 270.0642 231.9365 318.713 3779.9 37.9818 38.0947 18.6555 18.8118 1.65386 203.97927 53 247.4 230.2 270.1 228.7 318.9 3782 40.8 40.8 18.9 19.1 1.801 203.8 0.214 0.3098 53 245.53 230.016 265.767 318.718 3780 38.1 16.65 203.73 0.218 0.319 53 270.6 228.2 318.9 3782 40.86 40.821 18.925 19.083 1.842 200.75
10 53 245.02 230.34 270.06 228.66 318.86 3781.64 38.07 38.17 18.93 19.08 1.739 204.2 0.22 0.3111 53 246.9 230 270.06 231.9 318.6 3779.01 40.71 40.71 18.65 18.8 2.97 208.94 0.22 0.3112 53 270.1 231.9 318.9 3782 40.8 40.8 18.9 19.1 20413 53 270 232 319 3782 40.5 40.5 19 19 1.76 20414 53 270.06 228.66 318.86 3781.64 18.93 19.09 204.04
Sheet steel, 50 Hz
Aluminium Sheet, 50 Hz
CRM 661-GBX 178-1Nimonic 75, CRM 661, 50 Hz
Page 15 of 68

NPL Report DEPC MPE 015
Table 5: Summary of uncertainty values (± 2 standard deviations, ie 95% confidence level expressed as a percentage) for complete ASCII dataset (including outliers)
Dataset Material File Name Rp0.1 Rp0.2 ReH ReL Rm Fm A At Ag Agt E1 Nimonic 75, CRM 661 CRM 661-GBX 178-1 0.3 0.1 0.0 0.1 0.3 13.4 1.0 1.2 4.43 Nimonic 75, CRM 661 CRM 661-GBX 178-1 0.6 0.5 0.0 0.0 0.1 2.8 1.1 1.6 4.46 Nimonic 75, CRM 661 NPL-CRM661 No 8-2 0.3 0.2 0.0 0.0 0.6 0.4 0.7 2.2 6.28 Nimonic 75, CRM 661 NPL-CRM661 No 8-2 0.5 0.1 0.0 0.0 0.1 2.7 1.2 2.1 6.3
10 13%Mn Steel P1M 23-2 0.3 0.1 0.4 0.4 1.0 1.2 6.8 6.8 5.212 13%Mn Steel P1M 23-2 0.3 0.1 1.0 1.0 0.6 0.5 3.0 2.8 5.7
13 S355 Structural steel P1M 24-1 0.1 0.7 0.0 0.0 0.6 14.3 1.0 4.4 9.115 S355 Structural steel P1M 24-1 0.0 0.7 0.0 0.0 13.8 19.6 1.5 4.3 6.9
17 316L Stainless Steel S1C 20-1 1.5 0.8 0.0 0.0 0.4 6.4 0.7 0.8 12.319 316L Stainless Steel S1C 20-1 1.6 0.9 0.0 0.0 0.2 2.2 0.6 0.6 13.5
22 Tin Coated packaging steel SOLLAC F72-No7-2 1.9 0.7 0.1 0.1 10.7 295.2 12.5 289.5 8.524 Tin Coated packaging steel SOLLAC F72-No7-2 2.4 0.9 0.0 0.0 23.7 28.8 70.6 5.7 11.9
26 Sheet steel SOLLAC T462 No6-2 0.4 0.6 8.6 8.4 5.1 294.2 236.2 223.0 2.028 Sheet steel SOLLAC T462 No6-2 0.5 0.0 8.5 9.9 0.9 57.1 221.3 125.6 1.430 Sheet steel TKS-DX56 No 2-2 0.5 0.2 0.1 0.0 1.4 1.6 0.9 3.6 11.732 Sheet steel TKS-DX56 No 2-2 0.6 0.1 0.0 0.0 2.0 2.8 2.2 4.0 11.434 Sheet steel TKS-ZStE-180-No1-2 1.3 1.9 0.0 0.0 15.9 1.6 1.1 4.4 2.336 Sheet steel TKS-ZStE-180-No1-2 1.4 1.7 0.0 0.0 1.9 2.9 2.8 8.2 2.0
38 Aluminium Sheet VAW-hard AA5182-No3-2 0.5 0.2 4.8 4.8 10.3 4.8 61.9 47.2 1.440 Aluminium Sheet VAW-hard AA5182-No3-2 0.4 0.2 4.2 4.2 0.2 4.1 44.4 68.8 1.542 Aluminium Sheet VAW-soft AA1050 No 5-2 9.4 2.4 0.3 0.0 2.0 1.7 2.4 4.6 10.244 Aluminium Sheet VAW-soft AA1050 No 5-2 10.0 2.4 0.1 0.0 2.8 2.8 3.1 5.0 11.646 Aluminium Sheet VAW-soft AA5182 No 4-2 0.3 0.2 0.9 0.9 2.2 1.2 59.4 56.3 1.548 Aluminium Sheet VAW-soft AA5182 No 4-2 0.1 0.1 1.0 1.0 2.7 2.9 39.7 37.4 1.4
50 Sheet steel TKS-DX56-L050-B12-5-Probe 2 1.1 0.3 0.1 0.7 1.4 1.3 0.4 5.4 16.052 Sheet steel TKS-DX56-L050-B12-5-Probe 2 0.9 0.4 0.1 0.0 1.9 62.4 1.8 5.5 17.953 Sheet steel TKS-ZStE-180-L050-B12-5-Probe 1 0.9 1.7 0.1 0.1 6.4 6.2 1.1 6.9 2.555 Sheet steel TKS-ZStE-180-L050-B12-5-Probe 1 0.1 1.6 0.0 0.0 7.6 8.3 2.2 6.9 2.4
57 Synthetic Digital Curve NPL Zero Noise 0.1 0.1 0.0 0.0 0.1 0.1 0.7 3.6 2.058 Synthetic Digital Curve NPL Zero Noise 0.3 0.5 0.0 0.0 0.5 0.4 0.8 3.7 2.261 Synthetic Digital Curve NPL 0.5% Load Noise 1.0 1.4 0.9 0.9 0.3 1.2 0.8 4.8 3.162 Synthetic Digital Curve NPL 0.5% Load Noise 1.3 0.8 0.5 0.5 0.6 1.1 3.3 2.7 7.763 Synthetic Digital Curve NPL 1% Load Noise 0.6 2.7 55.5 55.5 0.3 0.2 1.4 1.0 6.264 Synthetic Digital Curve NPL 1% Load Noise 0.5 1.2 1.4 1.4 0.6 0.6 65.5 61.8 8.2
Uncertainty 1-2% 2-5% Above 5%
Page 16 of 68
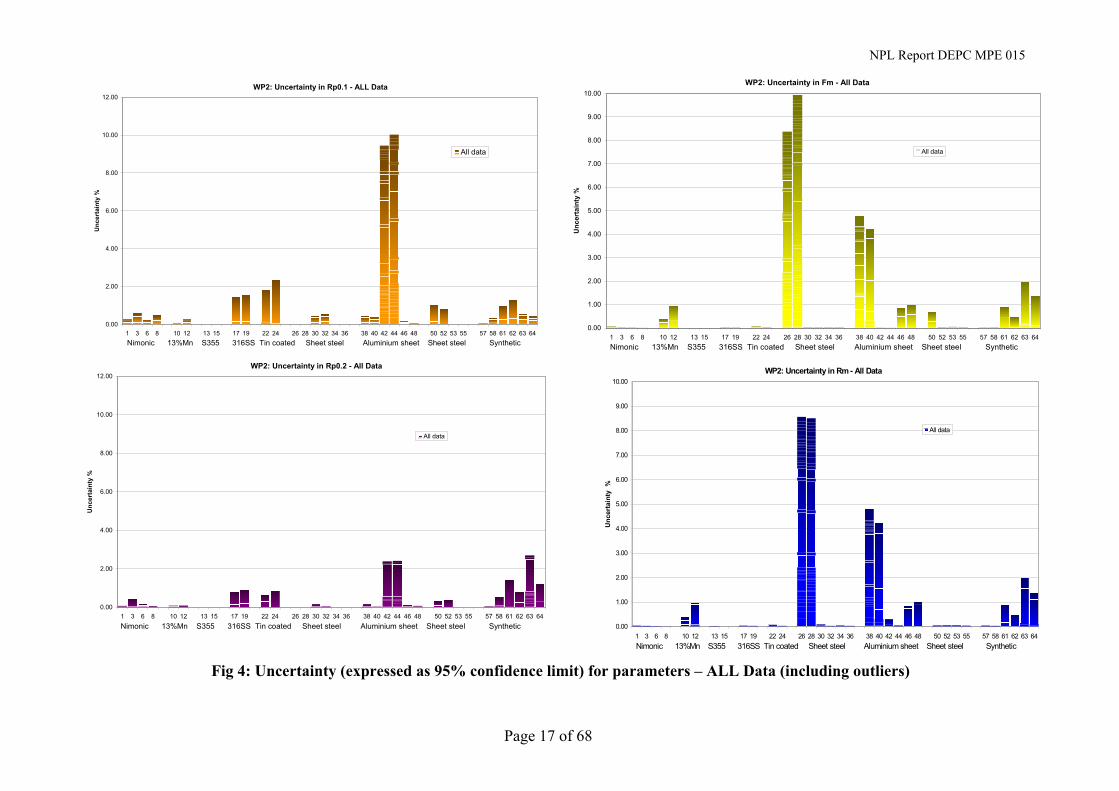
NPL Report DEPC MPE 015
Page 17 of 68
WP2: Uncertainty in Rp0.1 - ALL Data
0.00
2.00
4.00
6.00
8.00
10.00
12.00
1 3 6 8 10 12 13 15 17 19 22 24 26 28 30 32 34 36 38 40 42 44 46 48 50 52 53 55 57 58 61 62 63 64
Unc
erta
inty
%
All data
Nimonic 13%Mn S355 316SS Tin coated Sheet steel Aluminium sheet Sheet steel Synthetic
WP2: Uncertainty in Fm - All Data
0.00
1.00
2.00
3.00
4.00
5.00
6.00
7.00
8.00
9.00
10.00
1 3 6 8 10 12 13 15 17 19 22 24 26 28 30 32 34 36 38 40 42 44 46 48 50 52 53 55 57 58 61 62 63 64
Unc
erta
inty
%
All data
Nimonic 13%Mn S355 316SS Tin coated Sheet steel Aluminium sheet Sheet steel Synthetic
WP2: Uncertainty in Rp0.2 - All Data
0.00
2.00
4.00
6.00
8.00
10.00
12.00
1 3 6 8 10 12 13 15 17 19 22 24 26 28 30 32 34 36 38 40 42 44 46 48 50 52 53 55 57 58 61 62 63 64
Unc
erta
inty
%
All data
Nimonic 13%Mn S355 316SS Tin coated Sheet steel Aluminium sheet Sheet steel Synthetic
WP2: Uncertainty in Rm - All Data
0.00
1.00
2.00
3.00
4.00
5.00
6.00
7.00
8.00
9.00
10.00
1 3 6 8 10 12 13 15 17 19 22 24 26 28 30 32 34 36 38 40 42 44 46 48 50 52 53 55 57 58 61 62 63 64
Unc
erta
inty
%
All data
Nimonic 13%Mn S355 316SS Tin coated Sheet steel Aluminium sheet Sheet steel Synthetic
Fig 4: Uncertainty (expressed as 95% confidence limit) for parameters – ALL Data (including outliers)
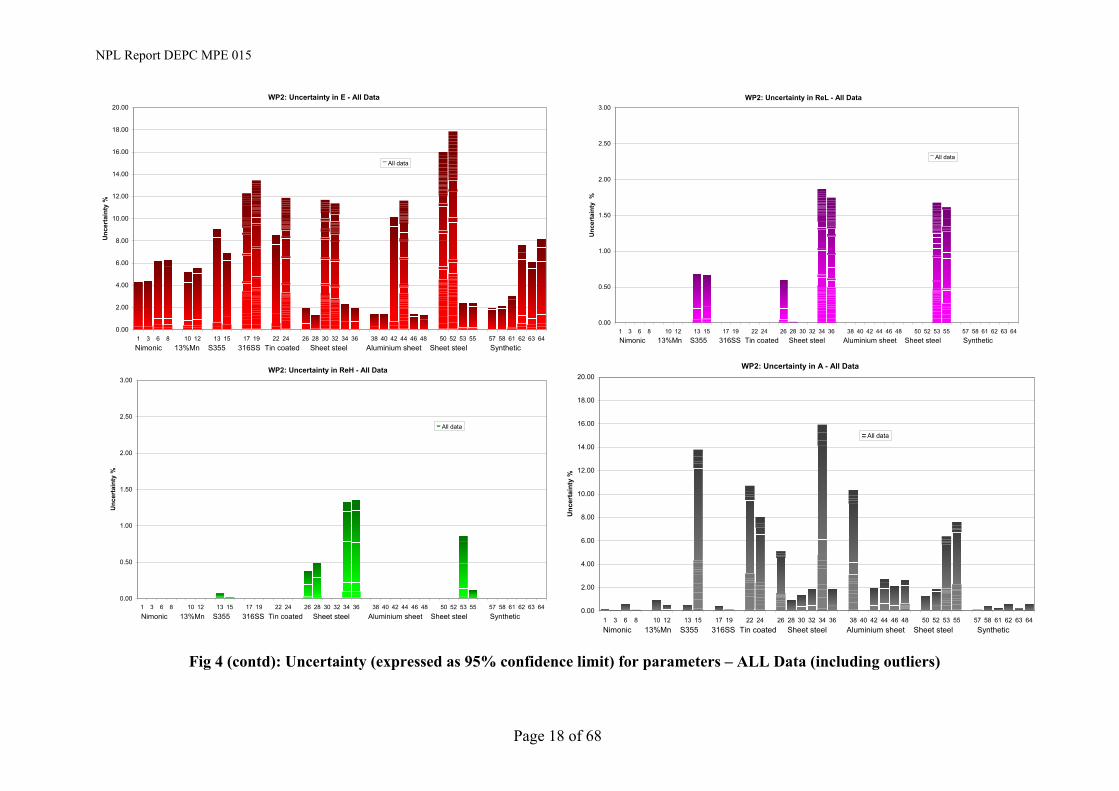
NPL Report DEPC MPE 015
Page 18 of 68
WP2: Uncertainty in E - All Data
0.00
2.00
4.00
6.00
8.00
10.00
12.00
14.00
16.00
18.00
20.00
1 3 6 8 10 12 13 15 17 19 22 24 26 28 30 32 34 36 38 40 42 44 46 48 50 52 53 55 57 58 61 62 63 64
Unc
erta
inty
%
All data
Nimonic 13%Mn S355 316SS Tin coated Sheet steel Aluminium sheet Sheet steel Synthetic
WP2: Uncertainty in ReL - All Data
0.00
0.50
1.00
1.50
2.00
2.50
3.00
1 3 6 8 10 12 13 15 17 19 22 24 26 28 30 32 34 36 38 40 42 44 46 48 50 52 53 55 57 58 61 62 63 64
Unc
erta
inty
%
All data
Nimonic 13%Mn S355 316SS Tin coated Sheet steel Aluminium sheet Sheet steel Synthetic
WP2: Uncertainty in A - All Data
0.00
2.00
4.00
6.00
8.00
10.00
12.00
14.00
16.00
18.00
20.00
1 3 6 8 10 12 13 15 17 19 22 24 26 28 30 32 34 36 38 40 42 44 46 48 50 52 53 55 57 58 61 62 63 64
Unc
erta
inty
%
All data
Nimonic 13%Mn S355 316SS Tin coated Sheet steel Aluminium sheet Sheet steel Synthetic
WP2: Uncertainty in ReH - All Data
0.00
0.50
1.00
1.50
2.00
2.50
3.00
1 3 6 8 10 12 13 15 17 19 22 24 26 28 30 32 34 36 38 40 42 44 46 48 50 52 53 55 57 58 61 62 63 64
Unc
erta
inty
%
All data
Nimonic 13%Mn S355 316SS Tin coated Sheet steel Aluminium sheet Sheet steel Synthetic
Fig 4 (contd): Uncertainty (expressed as 95% confidence limit) for parameters – ALL Data (including outliers)

NPL Report DEPC MPE 015
6.3 IDENTIFICATION OF OUTLIERS AND AGREED VALUES The identification of outliers and the agreed values was a two-stage process. Initially the results were inspected for obvious errors and mistakes, and these values were removed or corrected. A rigorous assessment for outliers, such as that proposed by the Cochran test, was not carried out, but the agreed values and outliers for each datafile were chosen by careful examination of the data and inspection of the individual stress-strain curves. This was not a trivial task, and a separate WP2 meeting was held at NPL in July 2003 to discuss the data and agree values for all the files – even then less than half were covered. Further iterations and lengthy communications with the project partners followed to reach agreement. For some parameters - such as the maximum force and tensile strength - an absolute value (in most cases) could be agreed, but for others such as the modulus (with the exception of the synthetic data with zero noise presented in Files 57 and 58) a range of values were quoted. It is important to note that there is some interdependency of parameters such that modulus (slope) values also have an impact on the Rp0.1 and Rp0.2 values, and the associated values of A0.1, A0.2, AeH, & AeL. Where appropriate these are also presented as a range of values. Despite detailed instructions regarding the precision and rounding, several participants did not adhere to the request and the returned values show considerable variations in this respect. Agreed values for the ASCII dataset are presented here to one level of precision higher than that specified in Section 17 of EN 10002-1 – for example stress values are reported to the nearest 0.1 MPa, force to the nearest 1 N and strains to the nearest 0.1%. Table 6 below shows the database page for File 38, the AA5182 Aluminium sheet. All the data are included as before, but in this table the grey cells identify the outliers and these values have not been included in the subsequent uncertainty or statistical analyses. The full set of results from all the files is given in the spreadsheet in Appendix B. The pink cells show the upper and lower modulus (slope) values selected for each file. These values were selected by analyzing each curve using the NPL modulus software developed in WP3 and selecting a range of representative values that gave a reasonable visual fit to the early part of the curve. Typically the variation in modulus expressed by the range is 4-5%. Based on these modulus values, a corresponding range of values for Rp0.1 and Rp0.2 was calculated. Cells coloured in orange represent proof stresses that fall outside the range calculated using these modulus values - these are also excluded from the uncertainty and statistical analyses. The yellow coloured rows give the agreed values for the parameters for each material, either as a single value or a range (as appropriate). The rows beneath show the statistics - mean values, standard deviation and uncertainty (expressed as twice the standard deviation, representing the 95% confidence limit) for each parameter. The latter values are plotted in Fig 5 and summarized in Table 7, as before.
Page 19 of 68

NPL Report DEPC MPE 015
Table 6: ASCII datafile analysis
VAW-hard AA5182-No3-2Lab ID Data set ID Rp0.1 Rp0.2 ReH ReL Rm Fm A At Ag Agt Ae E
1 38 385.51 396.53 434.31 2006.5 4.73 5.35 4.32 4.95 692 38 384.59 396.14 434.31 2006.5122 5.48 4.94 68.8263 38 382.78 395.44 395.44 1826.9328 5.48 4.94 705 38 385.3 396.4 434.3 2006.532959 4.7 5.3 4.3 4.9 696 38 385.219 396.397 434.3 2006.5 4.732 5.354 4.3 4.9 69.327 38 385.6295 396.5263 434.3145 2006.5 4.7184 5.3727 4.3091 4.9386 68.98268 38 386.3 396.8 434.3 2007 5.5 5.5 4.3 4.9 68.19 38 385.822 396.645 433.441 433.441 2002.5 5.343 5.3437 68.903
10 38 385.6 396.5 434.3 2007 4.7375 5.475 4.309 4.939 68.9811 38 385.59 396.52 434.31 2006.53 4.628 5.251 4.309 4.939 69.0312 38 386.2 396.8 404.11 398.2 428 1977.21 4.69 5.31 4.31 4.93 4.03 68.2613 38 385.4 396.5 404.1 398.3 434.3 2007 4.7 5.4 4.3 4.9 69.214 38 385 397 435 2000 5 5 4 5 6915 38 386.29 396.84 404.11 398.03 434.31 2006.53 4.72 5.36 0.27 0.86 68.16
Agreed 385.2-386.8 396.4-397.1 434.3 2007 4.7 5.4 4.3 4.9 68.1-69.3Mean 385.4 396.5 431.1 1990.9 4.8 5.4 3.9 4.7 68.9
2SDev 1.8 0.8 20.8 95.7 0.5 0.3 2.4 2.2 1.0Uncertainty (%) 0.5 0.2 4.8 4.8 10.3 4.8 61.9 47.2 1.4
Aluminium Sheet, 50 Hz
Outliers
Range of Modulus values
Outliers, based on permitted range of
modulus values
Statistics, calculated excluding outliers
Agreed Values
Page 20 of 68

NPL Report DEPC MPE 015
Table 7: Summary of uncertainty values (± 2 standard deviations, ie 95% confidence level expressed as a percentage) for the ASCII dataset (mean values exclude Files 26,28) – Outliers excluded
Dataset Material File Name Rp0.1 Rp0.2 ReH ReL Rm Fm A At Ag Agt E1 Nimonic 75, CRM 661 CRM 661-GBX 178-1 0.1 0.1 0.0 0.0 0.3 0.2 0.4 0.2 3.93 Nimonic 75, CRM 661 CRM 661-GBX 178-1 0.2 0.0 0.0 0.0 0.1 0.0 0.7 0.3 4.46 Nimonic 75, CRM 661 NPL-CRM661 No 8-2 0.2 0.1 0.0 0.0 0.6 0.4 0.7 2.2 4.08 Nimonic 75, CRM 661 NPL-CRM661 No 8-2 0.2 0.1 0.0 0.0 0.1 2.7 0.8 0.4 3.9
10 13%Mn Steel P1M 23-2 0.1 0.0 0.0 0.0 0.3 0.8 0.7 0.2 1.112 13%Mn Steel P1M 23-2 0.0 0.0 0.0 0.0 0.6 0.5 0.7 0.0 1.6
13 S355 Structural steel P1M 24-1 0.0 0.0 0.0 0.0 0.6 0.4 1.0 4.4 2.415 S355 Structural steel P1M 24-1 0.0 0.0 0.0 0.0 0.8 0.6 0.8 4.4 3.6
17 316L Stainless Steel S1C 20-1 0.2 0.2 0.0 0.0 0.4 0.5 0.3 0.2 4.319 316L Stainless Steel S1C 20-1 0.3 0.3 0.0 0.0 0.2 2.2 0.6 0.6 4.8
22 Tin Coated packaging steel SOLLAC F72-No7-2 0.6 0.3 0.0 0.0 2.5 2.8 1.4 1.1 2.924 Tin Coated packaging steel SOLLAC F72-No7-2 1.0 0.4 0.0 0.0 1.5 0.7 1.1 4.4 4.0
26 Sheet steel SOLLAC T462 No6-2 0.0 0.0 6.6 8.4 5.1 1.3 193.9 223.0 1.828 Sheet steel SOLLAC T462 No6-2 0.0 0.0 8.5 9.9 0.9 57.1 179.1 125.6 1.130 Sheet steel TKS-DX56 No 2-2 0.4 0.2 0.0 0.0 0.9 0.9 0.5 0.3 4.032 Sheet steel TKS-DX56 No 2-2 0.4 0.1 0.0 0.0 2.0 2.8 2.2 4.0 5.934 Sheet steel TKS-ZStE-180-No1-2 0.0 0.1 0.0 0.0 0.8 1.3 1.1 1.2 2.336 Sheet steel TKS-ZStE-180-No1-2 0.0 0.1 0.0 0.0 1.9 2.9 0.3 0.1 2.0
38 Aluminium Sheet VAW -hard AA5182-No3-2 0.2 0.1 0.0 0.0 1.4 4.8 0.3 0.8 1.440 Aluminium Sheet VAW -hard AA5182-No3-2 0.2 0.1 0.0 0.0 0.2 4.1 1.1 0.8 1.542 Aluminium Sheet VAW -soft AA1050 No 5-2 0.1 0.1 0.1 0.0 0.3 0.7 0.4 0.1 5.844 Aluminium Sheet VAW -soft AA1050 No 5-2 0.4 0.3 0.0 0.0 2.8 2.8 0.4 0.1 6.946 Aluminium Sheet VAW -soft AA5182 No 4-2 0.3 0.2 0.1 0.0 0.2 1.2 0.9 0.2 1.548 Aluminium Sheet VAW -soft AA5182 No 4-2 0.1 0.1 0.0 0.0 0.1 0.2 0.9 0.1 1.4
50 Sheet steel TKS-DX56-L050-B12-5-Pr 2 0.5 0.1 0.0 0.0 1.4 1.3 0.4 0.2 3.552 Sheet steel TKS-DX56-L050-B12-5-Pr 2 0.1 0.1 0.0 0.0 0.8 0.1 0.4 1.5 6.453 Sheet steel TKS-ZStE-180-L050-B12-5-Pr 1 0.0 0.0 0.0 0.0 0.9 0.8 0.9 0.3 2.555 Sheet steel TKS-ZStE-180-L050-B12-5-Pr 1 0.0 0.0 0.0 0.0 7.6 8.3 0.3 6.9 2.4
57 Synthetic Digital Curve NPL Zero Noise 0.1 0.0 0.0 0.0 0.1 0.1 0.5 0.1 0.358 Synthetic Digital Curve NPL Zero Noise 0.0 0.0 0.0 0.0 0.5 0.4 0.8 0.1 0.461 Synthetic Digital Curve NPL 0.5% Load Noise 0.2 0.2 0.0 0.0 0.3 1.2 0.8 4.8 2.462 Synthetic Digital Curve NPL 0.5% Load Noise 0.0 0.0 0.0 0.0 0.6 1.1 3.3 2.7 2.163 Synthetic Digital Curve NPL 1% Load Noise 0.4 0.2 0.0 0.0 0.3 0.2 1.4 1.0 2.864 Synthetic Digital Curve NPL 1% Load Noise 0.2 0.2 0.0 0.0 0.6 0.6 0.8 0.1 4.0
Mean 0.2 0.1 0.0 0.0 0.0 0.0 0.8 1.3 0.8 1.4 3.1
Uncertainty 1-2% 2-5% Above 5%
Page 21 of 68
NPL Report DEPC MPE 015
Page 22 of 68
WP2: Uncertainty in Fm - excluding outliers
0.00
0.10
0.20
0.30
0.40
0.50
0.60
0.70
0.80
0.90
1.00
1 3 6 8 10 12 13 15 17 19 22 24 26 28 30 32 34 36 38 40 42 44 46 48 50 52 53 55 57 58 61 62 63 64
Unc
erta
inty
%
excluding outliers
Nimonic 13%Mn S355 316SS Tin coated Sheet steel Aluminium sheet Sheet steel Synthetic
WP2: Uncertainty in Rp0.1 - excluding outliers
0.00
0.10
0.20
0.30
0.40
0.50
0.60
0.70
0.80
0.90
1.00
1 3 6 8 10 12 13 15 17 19 22 24 26 28 30 32 34 36 38 40 42 44 46 48 50 52 53 55 57 58 61 62 63 64
Unc
erta
inty
%
excluding outliers
Nimonic 13%Mn S355 316SS Tin coated Sheet steel Aluminium sheet Sheet steel Synthetic
WP2: Uncertainty in Rp0.2 - excluding outliers
0.00
0.10
0.20
0.30
0.40
0.50
0.60
0.70
0.80
0.90
1.00
1 3 6 8 10 12 13 15 17 19 22 24 26 28 30 32 34 36 38 40 42 44 46 48 50 52 53 55 57 58 61 62 63 64
Unc
erta
inty
%
excluding outliers
Nimonic 13%Mn S355 316SS Tin coated Sheet steel Aluminium sheet Sheet steel Synthetic
WP2: Uncertainty in Rm - excluding outliers
0.00
0.10
0.20
0.30
0.40
0.50
0.60
0.70
0.80
0.90
1.00
1 3 6 8 10 12 13 15 17 19 22 24 26 28 30 32 34 36 38 40 42 44 46 48 50 52 53 55 57 58 61 62 63 64
Unc
erta
inty
%
excluding outliers
Nimonic 13%Mn S355 316SS Tin coated Sheet steel Aluminium sheet Sheet steel Synthetic
Fig 5: Uncertainty (expressed as 95% confidence limit) for parameters – Data excluding outliers

NPL Report DEPC MPE 015
Page 23 of 68
WP2: Uncertainty in E - excluding outliers
0.00
1.00
2.00
3.00
4.00
5.00
6.00
7.00
8.00
9.00
10.00
1 3 6 8 10 12 13 15 17 19 22 24 26 28 30 32 34 36 38 40 42 44 46 48 50 52 53 55 57 58 61 62 63 64
Unc
erta
inty
% excluding outliers
Nimonic 13%Mn S355 316SS Tin coated Sheet steel Aluminium sheet Sheet steel Synthetic
WP2: Uncertainty in ReL - excluding outliers
0.00
0.05
0.10
0.15
0.20
0.25
0.30
0.35
0.40
0.45
0.50
1 3 6 8 10 12 13 15 17 19 22 24 26 28 30 32 34 36 38 40 42 44 46 48 50 52 53 55 57 58 61 62 63 64
Unc
erta
inty
%
excluding outliers
Nimonic 13%Mn S355 316SS Tin coated Sheet steel Aluminium sheet Sheet steel Synthetic
WP2: Uncertainty in A - excluding outliers
0.00
1.00
2.00
3.00
4.00
5.00
6.00
7.00
8.00
9.00
10.00
1 3 6 8 10 12 13 15 17 19 22 24 26 28 30 32 34 36 38 40 42 44 46 48 50 52 53 55 57 58 61 62 63 64
Unc
erta
inty
%
excluding outliers
Nimonic 13%Mn S355 316SS Tin coated Sheet steel Aluminium sheet Sheet steel Synthetic
WP2: Uncertainty in ReH - excluding outliers
0.00
0.05
0.10
0.15
0.20
0.25
0.30
0.35
0.40
0.45
0.50
1 3 6 8 10 12 13 15 17 19 22 24 26 28 30 32 34 36 38 40 42 44 46 48 50 52 53 55 57 58 61 62 63 64
Unc
erta
inty
%
excluding outliers
Nimonic 13%Mn S355 316SS Tin coated Sheet steel Aluminium sheet Sheet steel Synthetic
Fig 5 (contd): Uncertainty (expressed as 95% confidence limit) for parameters – Data excluding outliers

NPL Report DEPC MPE 015
As might be expected, this data shows a significant reduction in uncertainty compared with the full data set. Data from Files 26 and 28 are not included in the mean uncertainty values due to anomalies during testing (see later). Files 34 and 36 are affected in the same manner, but in this case the difficulties associated with the test did not affect the values to the same extent, and these results are included in the statistics. Generally the uncertainty values are low, with the notable exception of the modulus, elongation and extension results. The proof stress values show some variability and in most cases the uncertainty in Rp0.1 values are greater than the Rp0.2. This is to be expected as the stress-strain curve at this point is generally steeper and any variation in modulus will have a greater impact on the calculated value for Rp0.1. The Rp0.1 values are also smaller than Rp0.2, so an equivalent error in modulus will have a larger effect in terms of the percentage uncertainty. Surprisingly, the uncertainties associated with the total elongations at At and Agt are generally a little lower than those calculated for the non-proportional equivalents (A and Ag respectively), which also rely to some extent on the slope of the initial part of the stress-strain curve. Perhaps not surprisingly, the uncertainty values for the 5Hz data tend to be higher than the corresponding 50 Hz data. 7 ISSUES, DIFFICULTIES AND REJECTED FILES Even after careful and detailed inspection of the data and the individual load-extension and stress-strain curves, some files continued to give problems. It is clear from the results presented so far that in some cases there is considerable variation and uncertainties in the reported values, which is probably larger than might be expected for the software alone. The main causes of the large uncertainty appear to be related to different interpretations of the definitions in the Standard, and to anomalies in the stress-strain curves sometimes caused by a premature change in the test conditions (speed or control mode). Some of the problems were specific to a particular material behaviour (for instance there were significant problems with two sets of files that showed upper and lower yield behaviour), whilst others (such as the large variation in the calculated values for modulus) were factors in all the datafiles. Some of these issues are presented as examples in this section. They highlight some of the difficulties encountered by participants in the exercise and provide background to why some of the values and files were rejected. Where appropriate the relevant issues identified will be taken forward as part of the recommendations from WP2 for consideration by the Standards committee for inclusion in future revisions of EN 10002-1. The specific examples are: Example 1 - Ambiguities in defining Fm and Rm (File 26) Example 2 – Problems caused by a premature change of speed (Files 26, 34, 13) Example 3 – Identifying a transient effect (Files 13, 53, 34) Example 4 – Regarding the definition of Ae (File 13) Example 5 – Effect of modulus variation on other parameters (Files 22, 1, 6) Example 6 – Correcting for preloads and offsets (File 42) Example 7 – The use of synthetic datafiles (File 57) Example 8 – Scatter in identifying fracture point, At (File 30)
Page 24 of 68

NPL Report DEPC MPE 015
Example 9 – Smoothing and noise (Files 46, 61) Example 10 – Relevance of 5Hz data sampling rate (Files 44, 15) Examples 1-5 deal with specific issues, mainly associated with materials exhibiting upper and lower yield, and reflect the difficulties in correctly measuring some of the parameters. Examples 6-10 cover more general issues relevant to all material behaviour. The File numbers in brackets refer to specific examples chosen to illustrate the point. In many cases other datafiles show similar behaviour and attributes, and the issues are appropriate to a wide range of situations and cases. Where appropriate, issues and recommendations are highlighted in bold and summarised in Section 10. For information, a glossary of definitions for the various parameters, taken from the Standard, is given in Appendix A.
7.1 EXAMPLE 1 – AMBIGUITIES IN DEFINING FM AND RM (FILE 26) Figure 6 below shows part of the stress-strain curve for File 26 for the T462 sheet steel, which exhibits upper and lower yield. The behaviour of this material is very different from the other materials that show this yield phenomena (Files 13, 34 & 53) as the stress-strain curve is very flat. Consequently there was some ambiguity with respect to the definition of the maximum force, Fm, leading to two very different values being selected – as indicated on the curve. The values returned from the software intercomparison are given in the spreadsheet in Appendix B.
File 26: Sheet Steel
300
350
400
450
500
550
600
0.0 0.5 1.0 1.5 2.0 2.5 3.0 3.5
Strain (%)
Stre
ss (M
Pa)
Fm = 2528 N ?
Fm = 2318 N ?
Fig 6: Example illustrating the ambiguities in defining Fm and Rm
Page 25 of 68

NPL Report DEPC MPE 015
According to the definition in section 4.8 of EN 10002-1, the Maximum Force (Fm) is the greatest force that the testpiece withstands during the test once the yield point has been passed. For materials without yield point, it is the maximum value during the test. Taken literally, and using modern computer-controlled test machines with closed loop feedback and high data sampling rates, the value of 2528 N could correspond to the first data point immediately following the detection of upper yield (via a drop in the force) but the issue is whether this is the intention or is it a misinterpretation of the Standard. For this datafile the majority of participants chose the value of 2528 N for Fm, four selected 2318 N, and three other different values were selected. There are further ambiguities when considering the Tensile Strength (Rm), which is defined in Section 4.9.1 of EN 10002-1 as the stress corresponding to the maximum force (Fm). According to this definition, Rm = 556.7 MPa, but this is the same as the ReH value. In fact, for this datafile, five different values for Rm were quoted including 556.7 MPa, 554.2 MPa, 549.3 MPa, 512.1 MPa and 510.5 MPa. As will be explained in Example 2 below, the ambiguity of choosing between 512.1 MPa and 510.5 MPa has arisen because of a premature change in speed during the test, but the focus in this example is whether the value of 556.7 MPa or 510.5 MPa (or 512.1 MPa) is correct. The value of 556.7 MPa corresponds to the upper yield strength (ReH), which all but two organisations identified correctly. It is interesting to note that whilst the value of Rm of 512.1 MPa is probably correct according to the definition currently given in the Standard, the supplier of the material in this case asserts that they would use the value of 510.5 MPa. Thus there clearly appears to be ambiguity in the interpretation of the Standard concerning the measurement of Fm and Rm, and the definition of yield point. Consideration should be given to amending the Standard, to clarify the definition of Fm and Rm, particularly for materials that exhibit upper and lower yield phenomena where ambiguities may arise.
7.2 EXAMPLE 2 – PROBLEMS CAUSED BY A PREMATURE CHANGE OF SPEED (FILES 26, 34, 13)
Figure 7 below shows an expanded portion of the stress-strain curve for File 26 - the file that gave the WP2 working group the greatest difficulties. As mentioned above, the values reported for Rm and Fm showed considerable variation, and this is also true for ReL. The ambiguity in the interpretation of ReL is almost certainly associated with the premature change of speed, as indicated by the arrow on the graph, which led to a sharp jump in the stress-strain curve. Figure 8 shows the corresponding plot of stress and crosshead vs time, also showing the point of speed change.
Page 26 of 68

NPL Report DEPC MPE 015
File 26: Sheet Steel
500
502
504
506
508
510
512
514
516
518
520
0.00 0.20 0.40 0.60 0.80 1.00 1.20 1.40 1.60 1.80 2.00
Strain (%)
Stre
ss (M
Pa)
Rm ?
Rm ?
ReL 2 ?
ReL ?
Speed change
ReH
Fig 7: Example illustrating the different interpretation of values of ReL and Rm
The identification of the upper yield point (ReH) was not a problem, although as noted in Example 1, some organisations quoted the same value for ReH and Rm. The Upper yield strength (ReH) is defined in A.4.2 and 4.9.2.1 as the stress corresponding to the highest value of force prior to a reduction of at least 0.5% of the force and followed by a region in which the force should not exceed the previous maximum over a strain range not less than 0.05%.
File 26: Sheet Steel
500
502
504
506
508
510
512
514
516
518
520
20 22 24 26 28 30 32 34 36 38 40
Time (secs)
Stre
ss (M
Pa)
0.5
1
1.5
2
2.5
3
3.5
4
Cro
sshe
ad (m
m)
StressCrosshead
Rm ?Rm ?
ReL ?
Speed change
ReH
ReL 2 ?
Fig 8: Corresponding plot of stress and crosshead vs time, showing the
point of speed change
Page 27 of 68

NPL Report DEPC MPE 015
The Lower yield strength (ReL) is defined in 4.9.2.2 and A.4.3 as the lowest value of stress during plastic yielding, ignoring any transient effects. In this example most of the participants chose 504.9 MPa as the value for ReL, and this is strictly correct according to the definition above. However, the premature speed change that occurred during plastic yielding has caused a jump in the stress-strain curve, without which the event marked by ReL2 would probably give the correct value. A similar problem occurred with File 34 shown in Fig 9 below. In this case values for ReL of 236.7 MPa and 240.4 MPa were reported, but the point identified at 236.7 MPa occurs before the speed change. Section 10.2 of EN 10002-1 specifies the rate conditions for the test. Specific guidance is given for the rate to be used within the elastic range and up to ReH (10.2.2.1) and for tests where only ReL is being measured (10.2.2.2). For the determination of ReH, the test conditions are presented in terms of a stress rate, depending on the elastic modulus of the material being tested. For the determination of ReL however the Standard states that the strain rate during yield of the parallel length of the test piece shall be between 0.00025 s-1 and 0.0025 s-1 … and that the strain rate shall be kept as constant as possible, the controls of the machine not being further adjusted until the completion of yield. Furthermore, Section 10.2.2.3 specifies that if the two yield strengths are determined during the same test, the conditions for determining ReL shall be complied with. Only after the determination of the required yield or proof strength properties may the test rate be increased.
File 34: Sheet Steel
234
236
238
240
242
244
246
248
250
0.0 0.2 0.4 0.6 0.8 1.0 1.2 1.4 1.6 1.8 2.0 2.2 2.4
Strain (%)
Stre
ss (M
Pa)
ReL 2 ?
ReL ? Speed change
Fig 9: Curve showing alternative interpretations of the values of ReL Clearly these test rate conditions have not been followed in these cases (Files 26 & 34). Possible causes could be an incorrect manual selection of the point for speed change, or the over-sensitivity of the control software to noise and fluctuations in the load signal during yielding, which has triggered the premature change.
Page 28 of 68
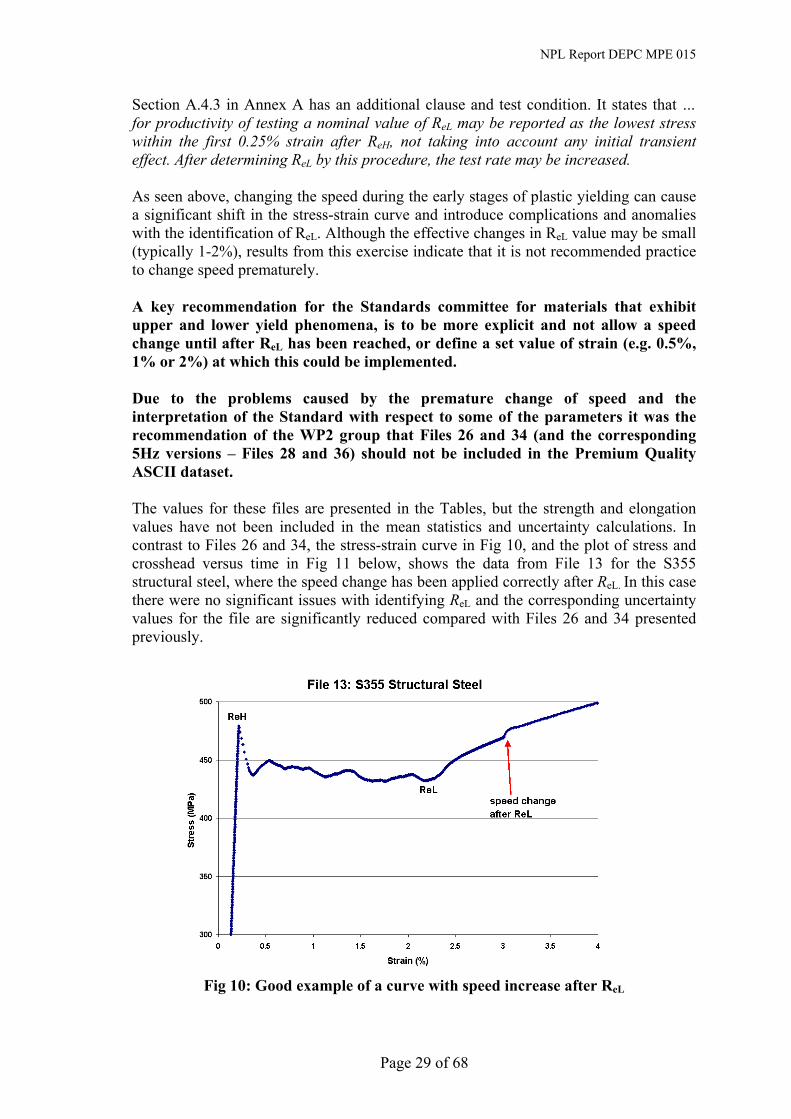
NPL Report DEPC MPE 015
Section A.4.3 in Annex A has an additional clause and test condition. It states that … for productivity of testing a nominal value of ReL may be reported as the lowest stress within the first 0.25% strain after ReH, not taking into account any initial transient effect. After determining ReL by this procedure, the test rate may be increased. As seen above, changing the speed during the early stages of plastic yielding can cause a significant shift in the stress-strain curve and introduce complications and anomalies with the identification of ReL. Although the effective changes in ReL value may be small (typically 1-2%), results from this exercise indicate that it is not recommended practice to change speed prematurely. A key recommendation for the Standards committee for materials that exhibit upper and lower yield phenomena, is to be more explicit and not allow a speed change until after ReL has been reached, or define a set value of strain (e.g. 0.5%, 1% or 2%) at which this could be implemented. Due to the problems caused by the premature change of speed and the interpretation of the Standard with respect to some of the parameters it was the recommendation of the WP2 group that Files 26 and 34 (and the corresponding 5Hz versions – Files 28 and 36) should not be included in the Premium Quality ASCII dataset. The values for these files are presented in the Tables, but the strength and elongation values have not been included in the mean statistics and uncertainty calculations. In contrast to Files 26 and 34, the stress-strain curve in Fig 10, and the plot of stress and crosshead versus time in Fig 11 below, shows the data from File 13 for the S355 structural steel, where the speed change has been applied correctly after ReL. In this case there were no significant issues with identifying ReL and the corresponding uncertainty values for the file are significantly reduced compared with Files 26 and 34 presented previously.
Fig 10: Good example of a curve with speed increase after ReL
Page 29 of 68
NPL Report DEPC MPE 015
File 13: S355 Structural Steel
200
250
300
350
400
450
500
550
600
0 5 10 15 20 25 30 35 40 45 50
time (secs)
Stre
ss (M
Pa)
0
2
4
6
8
10
12
14
16
18
Cro
sshe
ad (m
m)
StressCrosshead
ReL
Speed change after ReL
ReH
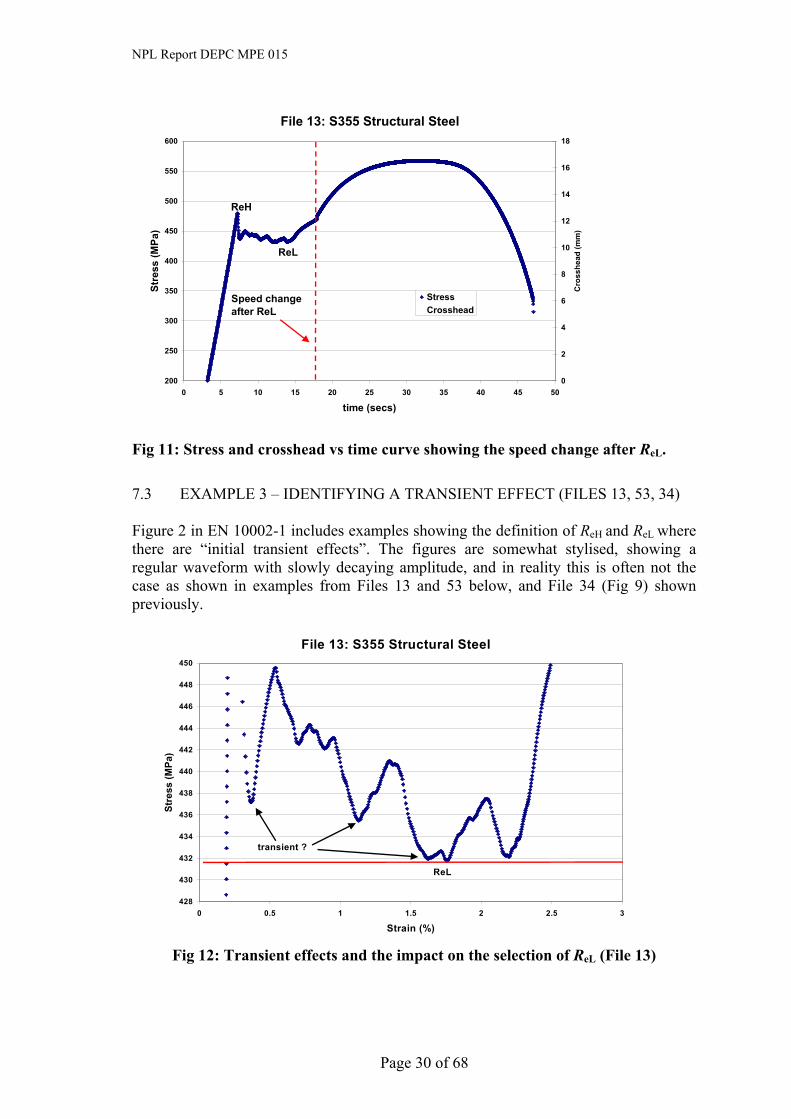
Fig 11: Stress and crosshead vs time curve showing the speed change after ReL.
7.3 EXAMPLE 3 – IDENTIFYING A TRANSIENT EFFECT (FILES 13, 53, 34) Figure 2 in EN 10002-1 includes examples showing the definition of ReH and ReL where there are “initial transient effects”. The figures are somewhat stylised, showing a regular waveform with slowly decaying amplitude, and in reality this is often not the case as shown in examples from Files 13 and 53 below, and File 34 (Fig 9) shown previously.
File 13: S355 Structural Steel
428
430
432
434
436
438
440
442
444
446
448
450
0 0.5 1 1.5 2 2.5
Strain (%)
Stre
ss (M
Pa)
transient ?
ReL
3
Fig 12: Transient effects and the impact on the selection of ReL (File 13)
Page 30 of 68

NPL Report DEPC MPE 015
File 53: Sheet Steel
220
225
230
235
240
245
250
0.0 0.2 0.4 0.6 0.8 1.0 1.2 1.4 1.6 1.8 2.0 2.2 2.4
Strain (%)
Stre
ss (M
Pa)
transient ?
ReL ?
ReL ?
Fig 13: Transient effects and the impact on the selection of ReL (File 53) The WP2 group had some difficulty in agreeing what was meant by the definition of the “initial transient effect” in the Standard, and indeed its cause, although it is probably triggered by the onset of yielding in the testpiece, and is affected by a combination of the system compliance, the location of yielding in the testpiece, the material properties and test machine response. It is unclear whether the definition refers only to the first drop in load (as seems to be implied from Fig. 2 in the Standard) and whether subsequent variations should be ignored and assumed to be real material behaviour. This is an issue with File 13 (Fig. 12), although all but one laboratory selected the value of 431.8 MPa for ReL. For File 53 (Fig. 13) there was less agreement, with about half of the participants identifying ReL as 228.7 MPa, and the rest selecting 231.9 MPa. Assuming that the first load drop is the transient effect, then the value of ReL = 231.9 MPa has been selected as the correct value in this case. For this file, different interpretations of the definition for ReL have led to an uncertainty of over 1%. It is also interesting to compare the stress-strain curves presented for File 34 (Fig 9) and File 53 (Fig 13) above as these are tests on the same material – the bake hardened steel sheet - carried out by different laboratories. Although File 34 is affected by the premature speed change, the tests have been carried out under nominally the same conditions, and the difference in detail and form of this part of the curve is almost certainly related to the differences in machine compliance, response and control. There is also a significant difference in ReL values from the two tests – a factor that would be important in determining the uncertainty and repeatability of the material batch, but is not considered further in this study as the emphasis is on the generation and analysis of representative stress-strain curves. To avoid ambiguities in the interpretation of the “initial transient effect”, it is recommended that the Standards committee consider expanding and clarifying the definition, including more realistic examples where appropriate.
Page 31 of 68

NPL Report DEPC MPE 015
7.4 EXAMPLE 4 – REGARDING THE DEFINITION OF AE (FILE 13) File 13 is also useful for examining the issues regarding the definition and identification of the percentage yield point extension (Ae), as indicated in Fig 14 below. According to Section A.4.7 of EN 10002-1, the percentage yield point extension (Ae) requires assessment of the 2 points that define the beginning and end of the yield point extension. The beginning is at that point where the slope becomes zero and is represented by a horizontal line. The end point can be determined by constructing 2 lines, the first being horizontal from the last point of zero slope and the second as a tangent to the strain hardening section of the curve, as close as possible to the point of inflection. The intersection between these 2 lines represents the end of yield point extension. As illustrated in Fig 14, the tangent to the strain hardening part of the curve is not well defined and a range of points and values can be chosen depending on the point at which strain hardening is deemed to start, and the algorithms used in the particular software to define this point. This difficulty is reflected in the values reported for Ae for this datafile, which range from 1.98% to 2.1%. Similar variability in Ae values was obtained for Files 15, 34, 36, 53 and 54.
File 13: S355 Structural Steel
400
420
440
460
480
500
0 0.5 1 1.5 2 2.5
Strain (%)
Stre
ss (M
Pa)
3
ReH
Uncertainty in end of yield point extension
Fig 14: Example illustrating the difficulty in determining the yield
point extension, Ae The main difficulty in this case is how to define the start and end of plastic yielding. To reduce this uncertainty one approach would be to adopt the definition in Section 4.6.2 (and Fig 7) of ISO 6892 [3], which states that the percentage yield point extension (Ae) in discontinuous yielding materials, is the extension between the start of yielding and the start of uniform work hardening. Perhaps a more pragmatic approach could be
Page 32 of 68

NPL Report DEPC MPE 015
to define Ae as the percentage extension between the points on the curve that define ReH and ReL. It is recommended therefore that the Standards committee consider simplifying the definition and method for calculating Ae to reduce the large uncertainty in reported values.
7.5 EXAMPLE 5 – EFFECT OF MODULUS VARIATION ON OTHER PARAMETERS (FILES 22, 1, 6)
The uncertainty in modulus was the highest of all the parameters examined, and yet inspection of the ASCII datafiles and stress-strain curves do not show any files with significant non-linearity. Such large uncertainty should not be unexpected, as EN 10002-1 does not specifically cover the measurement or calculation of Young’s modulus. However, the slope of the initial part of the curve is necessary for the calculation of proof strength values and the percentage non-proportional elongations at maximum force, Ag and percentage elongation after fracture, A (see Fig 1 in EN 10002-1 for schematic). More specific guidance on the measurement of the slope of the curve in the elastic range is given in Section A.4.9 in Annex A in the Standard. A detailed assessment of the test methodology and analysis procedures for obtaining reliable modulus data from the tensile test has been carried out within TENSTAND WP3 [6], and is not reported in detail here. The main summary and recommendation from WP3 is that the test procedure currently described in EN 10002-1 is inadequate for accurate measurements of modulus, and that there is a real need for better guidance on modulus measurement and the techniques and algorithms used for calculating the slope of the curve, either via a separate Standard or as a new Annex to the current document. It is possible to get good quality modulus data from a tensile test, but this requires a separate test using high quality averaging strain measurement, focusing only on the early part of the stress-strain curve. Within the tensile test itself, there are many practical difficulties associated with achieving a good straight portion of the curve, which corresponds to the modulus. For this reason some organisations select pre-determined or handbook values for the initial slope and modulus, which they then use to calculate the proof stress values. In this exercise, only one laboratory used default values for modulus (200 GPa for steel and 70 GPa for aluminium) in a complete set of analysis returns. Where these values are significantly different from the rest of the returns they have not been included in the statistics for the exercise. The modulus of some materials is notoriously difficult to measure, but an accurate value is important for design purposes and for subsequent calculation of proof stress values and non-proportional elongation values in the full tensile test. The stress-strain curve below shows the typical effect different values for the slope can have on these parameters.
Page 33 of 68

NPL Report DEPC MPE 015
File 22: Tin Coated Packaging Steel
0
100
200
300
400
500
600
700
0.00 0.20 0.40 0.60 0.80 1.00 1.20 1.40
Strain (%)
Stre
ss (M
Pa)
Uncertainty in slope/modulus
Uncertaintyin Rp0.2
Uncertainty in A
Fig 15: The influence of the variation in modulus on other parameters.
According to Sections 4.9.3 and 14.1 of EN 10002-1 the Proof Strength (Rp0.1 and Rp0.2) is the stress at which a non-proportional extension is equal to a specified percentage of the extensometer gauge length. It is determined on the force-extension diagram by drawing a line parallel to the ordinate axis (force axis) and at a distance from this equivalent to the prescribed total percentage extension. The point at which this line intersects the curve gives the force corresponding to the desired proof strength, which is calculated by dividing this force by the original cross-sectional area of the testpiece. In Fig 15 above, two lines for the slope are shown, with values of 205 GPa and 199 GPa, both of which are within the range of values returned for the analysis of this datafile. It can be seen that the variation in modulus has an impact on the calculated values for Rp and A, with the agreed range of values for Rp0.2 being 560.5-563.0 MPa in this case. Although the differences in proof stress values are small (~ 0.5%) they might be expected to be greater for materials with significant work hardening since small variations in the modulus may result in large differences in the values of Rp. The corresponding values for Rp0.1 were 519.3-526.1 MPa, showing larger uncertainty as expected. Section 13.1 of EN 10002-1 to some extent recognises the problems of measuring the slope at the beginning of the stress–strain curve, and offers the use of hysteresis loops and preloading as means of alleviating the problem. Although many tests showed small levels of preload, no hysteresis tests were carried out in generating the datafiles for this exercise. Figures 16 and 17 show the stress-strain curves for Files 1 and 6 – the Nimonic 75 tensile reference material, which was the only material tested by both Zwick and Instron.
Page 34 of 68

NPL Report DEPC MPE 015
File 1 & 6: Nimonic 75
0
100
200
300
400
500
600
700
800
0 5 10 15 20 25 30 35 40 45
Strain (%)
Stre
ss (M
Pa)
Fig 16: Comparison of stress-strain data for the Nimonic 75 reference material The full stress-strain curves in Fig 16 show excellent agreement, and it would be expected that there would be generally only small differences in the modulus and proof stress values between the two datafiles. However, the expanded part of the stress-strain curves in Fig 17 show very different modulus values (mean values for E were 209.0 GPa and 188.3 GPa respectively for Files 1 and 6) and this has an effect on the calculated proof stress values. In this case, because the curve is relatively flat the variations are relatively small, but for other materials such differences could be significant.
File 1 & 6: Nimonic 75
0
50
100
150
200
250
300
350
0 0.1 0.2 0.3 0.4 0.5
Strain (%)
Stre
ss (M
Pa)
Fig 17: Expanded part of Fig 16 (above) showing the variation in modulus
Page 35 of 68
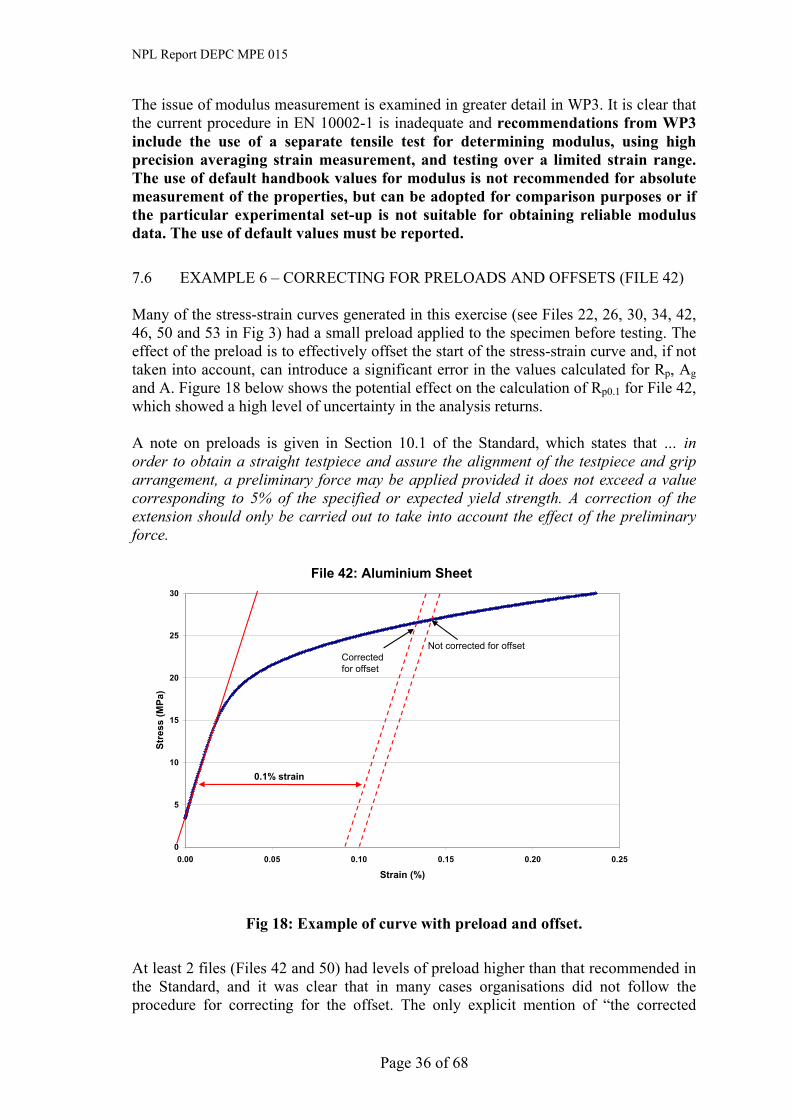
NPL Report DEPC MPE 015
The issue of modulus measurement is examined in greater detail in WP3. It is clear that the current procedure in EN 10002-1 is inadequate and recommendations from WP3 include the use of a separate tensile test for determining modulus, using high precision averaging strain measurement, and testing over a limited strain range. The use of default handbook values for modulus is not recommended for absolute measurement of the properties, but can be adopted for comparison purposes or if the particular experimental set-up is not suitable for obtaining reliable modulus data. The use of default values must be reported.
7.6 EXAMPLE 6 – CORRECTING FOR PRELOADS AND OFFSETS (FILE 42) Many of the stress-strain curves generated in this exercise (see Files 22, 26, 30, 34, 42, 46, 50 and 53 in Fig 3) had a small preload applied to the specimen before testing. The effect of the preload is to effectively offset the start of the stress-strain curve and, if not taken into account, can introduce a significant error in the values calculated for Rp, Ag and A. Figure 18 below shows the potential effect on the calculation of Rp0.1 for File 42, which showed a high level of uncertainty in the analysis returns. A note on preloads is given in Section 10.1 of the Standard, which states that … in order to obtain a straight testpiece and assure the alignment of the testpiece and grip arrangement, a preliminary force may be applied provided it does not exceed a value corresponding to 5% of the specified or expected yield strength. A correction of the extension should only be carried out to take into account the effect of the preliminary force.
File 42: Aluminium Sheet
0
5
10
15
20
25
30
0.00 0.05 0.10 0.15 0.20 0.25
Strain (%)
Stre
ss (M
Pa)
Not corrected for offsetCorrected for offset
0.1% strain
Fig 18: Example of curve with preload and offset. At least 2 files (Files 42 and 50) had levels of preload higher than that recommended in the Standard, and it was clear that in many cases organisations did not follow the procedure for correcting for the offset. The only explicit mention of “the corrected
Page 36 of 68

NPL Report DEPC MPE 015
origin to the curve” occurs in Section 13.1 of the Standard, which deals with the use of hysteresis testing to determine Rp. Note 2 states that … several methods can be used to define the origin of the force-extension curve. A method which may be used is to construct a line parallel to that determined by the hysteresis loop so that it is a tangent to the force-extension curve. The point where this line crosses the abscissa is the effective origin of the force-extension curve. The implication of not correcting for an offset at the origin can introduce significant errors in the calculation of material parameters, particularly for low strength and low elongation materials. The stress-strain curve for File 22, the tin coated packaging steel (Fig 15, shown previously) illustrates the problem. Due to a combination of factors, including the large variation in modulus reported for this datafile and several organisations not correcting for the offset, the range of values for “A” ranged from 0.83-0.89%. Although the procedure for correcting for preloads and offsets is covered in the Standard, it is the recommendation that more explicit instructions are developed, including a Figure and example to illustrate the effect. Note 2 in Section 17 of EN 10002-1 also states that elongation values should be rounded off to 0.5%, but it is questionable whether such rounding is sensible for low ductility materials (as seen in Files 22 (Fig15 above), Files 26 and 38), where small differences in elongation are significant and a higher level of precision is required, to reduce the errors and uncertainty in the values that would be introduced by rounding to the nearest 0.5%. Annex F of the Standard currently includes advice and information on measuring the percentage elongation after failure, but there is no comment on the precision of reporting the strain values. In such cases, for example where ‘A’ is less than ~ 5%, it is recommended that the Standards committee consider changing the accuracy and rounding of strain readings reported to the nearest 0.1%.
7.7 EXAMPLE 7 – THE USE OF SYNTHETIC DATAFILES (FILE 57) Figure 19 below shows the early part of a stress-strain curve from one of the synthetically generated files. A clear advantage of using mathematically generated data is that the stress-strain curve is free from the influence of test set-up and test machine software. It is also possible to tailor the curve with specific properties and more readily examine the sensitivity of software analyses to the effects of parameters such as noise. For the synthetic datafiles generated in this study (Files 57, 58, 61-64), in all cases the initial slope of the curve was selected to give a modulus value of 207.5 GPa. This was a perfect straight line between the stress values of 0-350 MPa, so it is a little disconcerting that two organisations returned values of 207.46 GPa and 206.69 GPa. Despite the request for strength and modulus values to be reported to one decimal place, some organisations applied rounding (both up and down!) so the uncertainty in modulus for this file (Table 7 and Fig 5) includes a contribution from this.
Page 37 of 68

NPL Report DEPC MPE 015
File 57: NPL Synthetic data
0
100
200
300
400
500
0.0 0.2 0.4 0.6 0.8 1.0
Strain (%)
Stre
ss (M
Pa)
Fig 19. Synthetically generated curve with zero noise.
The effect of noise on the calculation of various parameters was examined using the set of synthetically generated stress-strain curves, which used the same force-extension data, with different levels of random noise applied to the force channel. For Files 61 and 62, 0.5% random noise was introduced on the force signal, and 1% noise for File 63 and 64. As can be clearly seen from Table 8 and Fig.5, the uncertainties generally increase with increasing levels of noise as might be expected.
7.8 EXAMPLE 8 – SCATTER IN IDENTIFYING FRACTURE POINT, AT (FILE 30)
Several files showed a high degree of scatter in the value for At, caused by different interpretations of when the testpiece had broken. The definition for the percentage elongation at fracture (At) is given in A.4.6 and states that … the fracture is considered effective when the force between 2 measuring points decreases by more than 5 times the value of the previous 2 points followed by a decrease to lower than 3% of the maximum. An example is given in Fig 20 below, for the DX56 steel sheet (File 30). Even at a sampling rate of 50 Hz there were variations in the values reported, and in this example at least seven different points were identified with ‘At’. Most organisations identified the point ‘x6’ as the fracture point where there was the specified decrease in force between the datapoints, and this was chosen as the agreed value, but there is considerable variation and uncertainty. The reduction to 3% of the maximum force was not realised in this test (as was the case in many of the tests) as automatic data collection stopped as soon as specimen break was detected, or the data at the end of the test had been discarded. The situation is worse with lower sampling rates and fewer datapoints.
Page 38 of 68
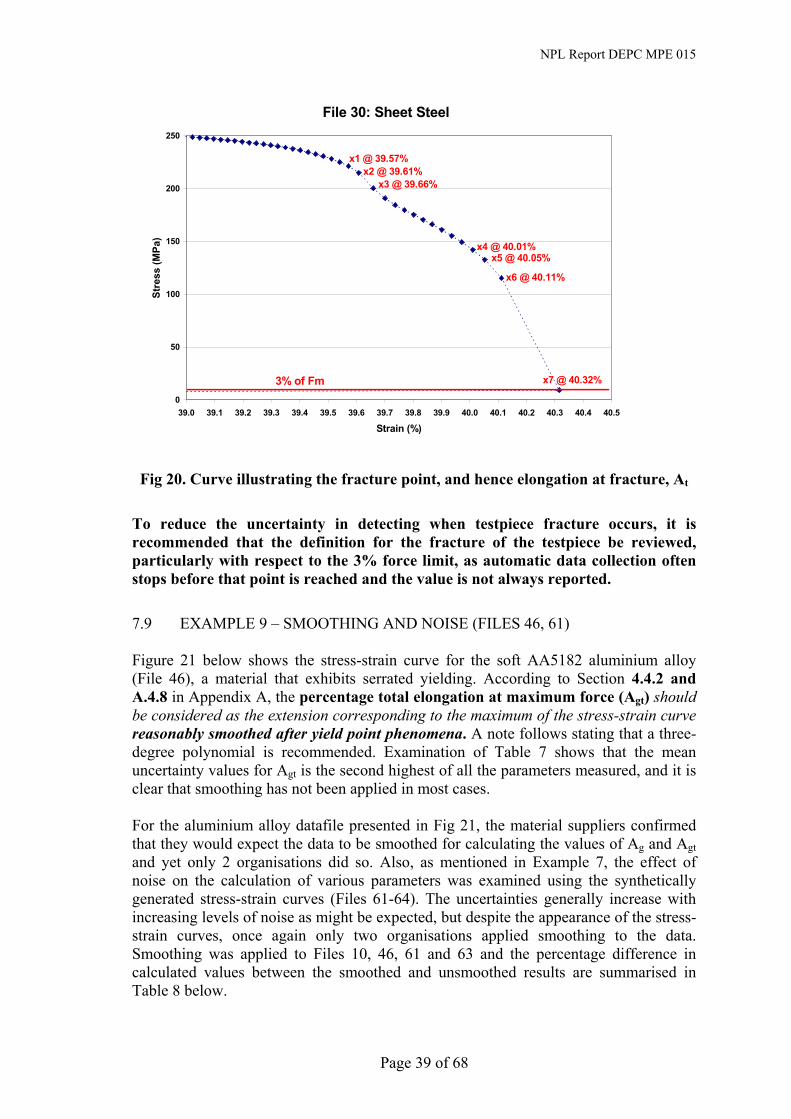
NPL Report DEPC MPE 015
File 30: Sheet Steel
0
50
100
150
200
250
39.0 39.1 39.2 39.3 39.4 39.5 39.6 39.7 39.8 39.9 40.0 40.1 40.2 40.3 40.4 40.5
Strain (%)
Stre
ss (M
Pa)
x1 @ 39.57%
x4 @ 40.01%
x3 @ 39.66%x2 @ 39.61%
x7 @ 40.32%
x6 @ 40.11%
x5 @ 40.05%
3% of Fm
Fig 20. Curve illustrating the fracture point, and hence elongation at fracture, At
To reduce the uncertainty in detecting when testpiece fracture occurs, it is recommended that the definition for the fracture of the testpiece be reviewed, particularly with respect to the 3% force limit, as automatic data collection often stops before that point is reached and the value is not always reported.
7.9 EXAMPLE 9 – SMOOTHING AND NOISE (FILES 46, 61) Figure 21 below shows the stress-strain curve for the soft AA5182 aluminium alloy (File 46), a material that exhibits serrated yielding. According to Section 4.4.2 and A.4.8 in Appendix A, the percentage total elongation at maximum force (Agt) should be considered as the extension corresponding to the maximum of the stress-strain curve reasonably smoothed after yield point phenomena. A note follows stating that a three-degree polynomial is recommended. Examination of Table 7 shows that the mean uncertainty values for Agt is the second highest of all the parameters measured, and it is clear that smoothing has not been applied in most cases. For the aluminium alloy datafile presented in Fig 21, the material suppliers confirmed that they would expect the data to be smoothed for calculating the values of Ag and Agt and yet only 2 organisations did so. Also, as mentioned in Example 7, the effect of noise on the calculation of various parameters was examined using the synthetically generated stress-strain curves (Files 61-64). The uncertainties generally increase with increasing levels of noise as might be expected, but despite the appearance of the stress-strain curves, once again only two organisations applied smoothing to the data. Smoothing was applied to Files 10, 46, 61 and 63 and the percentage difference in calculated values between the smoothed and unsmoothed results are summarised in Table 8 below.
Page 39 of 68

NPL Report DEPC MPE 015
Table 8: Typical effect of smoothing on the results
Percentage difference between smoothed and unsmoothed data
Rm Ag Agt File 10 – 13%Mn Steel 0.7 1.3 1.3 File 46 – Soft Al sheet 1.6 5.3 5.2 File 61 – Synthetic + 0.5% noise 1.3 3.9 3.9 File 63 – Synthetic + 1% noise 2.7 1.5 1.5
Comparison of the values calculated with and without smoothing typically show differences of between 1-5%. It is interesting to note that the two organisations that used smoothing calculated different values for the parameters above. Also, it is not clear why the differences reported for Ag and Agt should be lower for the synthetic file with 1% noise compared to the same data with 0.5% noise. The issue of noise and smoothing has not been applied by participants in this study, and it is recommended therefore that the issue of smoothing the data be given further consideration and more visibility in future revisions of the Standard, with examples. Because a definitive approach to smoothing the data cannot be given the agreed values for the ASCII datafiles have been selected prior to any further data processing and smoothing.
File 46: Aluminium Sheet
0
50
100
150
200
250
300
0.0 5.0 10.0 15.0 20.0 25.0
Strain (%)
Stre
ss (M
Pa)
Fig 21: Stress-strain curve showing serrated yielding.
Page 40 of 68

NPL Report DEPC MPE 015
File 61: NPL Synthetic data
360
380
400
420
440
460
480
0.0 0.2 0.4 0.6 0.8 1.0 1.2 1.4 1.6 1.8 2.0
Strain (%)
Stre
ss (M
Pa)
Fig 22: Synthetically generated curve with 0.5% noise.
7.10 EXAMPLE 10 – RELEVANCE OF FILES AT 5HZ SAMPLING RATE (FILES 44, 15)
As mentioned previously, all the tests for generating the ASCII datafiles used a data-sampling rate of 50Hz, but an important aspect of the exercise was to examine data that had been captured at lower sampling rates. Instead of carrying out an expensive set of repeat tests with a lower data sampling rate, a pragmatic approach was taken whereby the original datafiles were sampled to reduce the 50Hz data to an equivalent 5Hz test. Section A.3.2 of the Standard gives recommendations on the minimum data sampling frequencies, which depend on the stress rate and value of ReH or Rp0.2. There is a general requirement that the data sampling frequency should be sufficiently high to be able to record the material characteristics and parameters to be measured. It is clear from inspection of the 5Hz datafiles that this is not the case, and two examples are given in Figs 23 and 24 below. Figure 23 shows the stress-strain curve for the soft AA1050 aluminium sheet. In this case the main issues are the limited number of datapoints at the beginning of the curve (less than 10 datapoints cover the range over which the slope is calculated) and the reduced number of points available for defining the fracture point. (Consider also removing 9 out of 10 datapoints in File 30 (Fig 20) in example 8 above to see the effect). The part of the stress-strain curve presented in Figure 24 shows that the reduced number of datapoints leads to the loss of definition and resolution in the stress-strain curve, and there are problems detecting parameters such as ReH, where there is a sharp change. Comparing values for ReH for Files 13 (50Hz) and File 15 (5Hz) shows a reduction of 5 MPa (~1%) in the values reported, from data generated in the same test.
Page 41 of 68

NPL Report DEPC MPE 015
File 44: Aluminium Sheet
0
10
20
30
40
50
60
70
80
90
0 5 10 15 20 25 30 35 40 45 50
Strain (%)
Stre
ss (M
Pa)
Fig 23: 5Hz datafile (File 44)
It is interesting to note also that the uncertainty values for the 5Hz data tend to be higher than the corresponding 50 Hz data. This is to be expected unless sophisticated data fitting and interpolation is used in the analysis software, because of the reduced number of datapoints and resolution of the actual material response.
File 15: S355 Structural Steel
380
400
420
440
460
480
0 0.5 1 1.5 2 2.5 3
Strain (%)
Stre
ss (M
Pa)
Fig 24: Example of the limited resolution in a 5Hz datafile (File 15)
Page 42 of 68

NPL Report DEPC MPE 015
Following detailed examination of all the 5Hz analysis returns and the stress-strain curves themselves, the recommendation of the WP2 working group was that the 5Hz datafiles would not be included in the Premium Quality datasets. Further recommendations are that high data sampling rates are used, commensurate with the duration and test conditions. Consideration should be given to the practical aspects of handling the potentially large datafiles generated with the high sampling rates, and range of test rates and conditions being proposed in the Standard. 8 PREMIUM QUALITY ASCII DATASETS AND AGREED VALUES Following detailed examination of the individual stress-strain curves and spreadsheet returns the WP2 working group reached agreement on a final set of datafiles, giving a range of material behaviour that could be used to validate the tensile test analysis software. Table 9 overleaf details the files and agreed values. For the reasons described in the preceding section some datafiles have not been included, but the final Premium Quality Dataset of 15 datafiles includes at least one datafile from each material examined. The TENSTAND WP2 Premium Quality Dataset is available for instrument manufacturers and operators to validate their tensile testing software both on CD and by downloading from the TENSTAND website at www.npl.co.uk/npl/cmmt/projects/tenstand No 5Hz datafiles are included, but the full set of 64 datafiles generated as part of this study is available on request.
Page 43 of 68

NPL Report DEPC MPE 015
Table 9: Agreed values for the Premium Quality ASCII dataset (no smoothing applied)
Rp0.1 Rp0.2 ReH ReL Rm Fm A At Ag Agt Ae E(MPa) (MPa) (MPa) (MPa) (MPa) (N) (%) (%) (%) (%) (%) (GPa)
1 Nimonic 75, CRM 661 303.4 - 304.5 309.6 - 310.1 764.4 59973 41.2 41.5 30.8 31.2 200.8 -216.56 Nimonic 75, CRM 661 300.5 - 301.8 308.0 - 308.6 761.1 59780 41.4 41.7 31.4 31.8 182.7 - 195.810 13%Mn Steel 334.5 - 334.9 337.1 - 337.2 937.0 72667 51.4 51.9 49.8 50.4 180.6 - 184.013 S355 Structural steel 479.4 431.8 567.2 44503 29.4 29.5 14.5 14.7 1.98 - 2.10 228.8 - 221.017 316L Stainless Steel 244.7 - 245.2 261.0 - 261.2 575.7 45278 51.1 51.3 38.3 38.6 189.8 - 202.322 Tin Coated packaging steel 525.6 - 530.6 562.5 - 564.6 596.7 2369 0.9 1.2 0.6 0.9 198.7 - 207.330 Sheet steel - DX56 157.2 - 157.6 162.7 - 162.9 301.5 4272 39.9 - 40.1 40.1 22.5 22.6 195.0 - 207.438 Aluminium Sheet - hard AA5182 385.2 - 386.8 396.4 - 397.1 434.3 2007 4.7 5.4 4.3 4.9 68.1 - 69.342 Aluminium Sheet - soft AA1050 26.48 - 26.55 30.01 - 30.05 83.6 1210 44.5 44.6 28.6 28.7 68.7 - 72.046 Aluminium Sheet -soft AA5182 133.4 - 133.9 134.5 - 134.8 284.6 8420 22.6 - 22.7 23.2 20.5 20.9 68.7 - 70.050 Sheet steel - DX56 158.6 - 158.7 163.9 - 164.0 303.9 2665 43.4 - 43.9 44.2 23.9 24.1 162.2 - 165.353 Sheet steel - ZStE 270.1 228.7 318.9 3782 40.3 - 40.8 40.8 18.9 19.1 1.74 - 1.80 198.7 - 208.957 Synthetic Digital Curve - zero noise 432.4 434.3 738.5 58000 50.0 50.2 39.6 40.0 207.5 - 208.061 Synthetic Digital Curve - 0.5% noise 431.8 - 434.1 438.1 - 441.6 748.1 58754 50.0 50.2 39.2 39.6 201.6 - 211.563 Synthetic Digital Curve - 1% noise 429.6 - 432.7 446.5 - 448.2 759.3 59632 50.0 50.2 37.3 37.7 203.0 - 211.6
Dataset Material
Page 44 of 68

NPL Report DEPC MPE 015 9 VALIDATION OF SOFTWARE USING THE TENSTAND ASCII DATAFILES Section A.5 of Appendix A in the Standard details a method for validating the software of the test machine. A procedure for comparing values calculated by the computer and those determined by examination of the stress-strain data is given, based on measuring and calculating the average value of the parameter of interest from tests on five testpieces. This procedure only confirms the characteristics for the particular testpiece under specific test conditions, and inevitably will also include a contribution associated with the variation in the batch and the repeatability of the test itself. Table A.1 in Section A.5 gives the conditions for “proof of confidence” for Rp0.2, Rp1, ReH, ReL, Rm and A, based on the relative or absolute differences between the manual and computer-based measurements. Part of the table is reproduced below:
Table 9: Conditions for the proof of confidence (from Appendix A.5 of the Standard)
D, Mean difference between manual and computer evaluation
Parameter
Relative Absolute Rp0.2 ≤ 0.5% 2 MPa Rp1 ≤ 0.5% 2 MPa ReH ≤ 1% 4 MPa ReL ≤ 0.5% 2 MPa Rm ≤ 0.5% 2 MPa A ≤ 2%
If the differences measured from the validation exercise are smaller than the values given in Table 9 the software is deemed to be valid and appropriate for the test. The method above is somewhat unsatisfactory as the stress-strain curves generated as part of the five tests will invariably include some variation, but it does provide some validation of the data recording aspects of the test machine software. The approach is very conservative and it would be expected that modern test machine software should be able to measure a point such as the tensile strength, Rm to better than 2 MPa. The use of default data files, such as the TENSTAND Premium Quality ASCII dataset generated within the WP2 activity in this project, should provide a more robust assessment of the software performance because the stress-strain curves have been thoroughly examined, and there is no factor due to material variability or test repeatability. Note 2 of Section A.5 confirms that pre-determined data from a known material with a recognized level of quality assurance can be used, but does not give further details. Table 10 below shows some of the results of the software validation exercise carried out in the current project, for all Laboratories and all the files in the TENSTAND Premium Quality ASCII dataset. The data presented is the difference between the values returned and the agreed mean values for Rm and Rp0.2. The colour coding of cells is the same as that used in the spreadsheet views, and helps to identify which Laboratories and datafiles had problems. In general the results show considerably lower variation than the values given in Table 9 above. Although a manual procedure for validating the test machine software is prescribed in Annex A of the Standard, it is recommended that the Standards Committee consider introducing mandatory software validation using the TENSTAND Premium Quality ASCII datafiles.
Page 45 of 68

NPL Report DEPC MPE 015
Table 10: Difference between agreed & calculated values for Rm (top) and Rp0.2 (bottom) for the ASCII Premium Quality Dataset
Tensile Strength, Rm TENSTAND ASCII
1 6 10 13 17 22 30 38 42 46 50 53 57 61 631 0.0 0.0 0.0 0.0 0.0 0.0 0.0 0.0 0.0 0.0 0.0 0.0 0.0 0.0 0.02 0.0 0.0 0.0 0.0 0.0 0.0 0.0 0.0 0.0 0.0 0.0 0.0 0.0 0.0 0.03 0.0 0.0 0.0 0.0 0.0 0.0 0.0 -38.9 0.0 0.0 0.0 0.0 0.0 0.0 0.04 0.0 0.0 0.0 0.0 0.0 0.0 0.0 0.0 0.0 0.0 0.0 0.0 0.0 0.0 0.05 0.0 0.0 0.0 0.0 0.0 0.0 0.0 0.0 0.0 0.0 0.0 0.0 0.0 0.0 0.06 -0.1 -0.2 -7.0 0.0 0.0 -0.1 -0.2 0.0 -0.1 -2.9 -0.2 -0.2 0.0 -9.7 -18.97 0.0 0.0 0.0 0.0 0.0 0.0 0.0 0.0 0.0 0.0 0.0 0.0 0.0 0.0 0.08 0.3 0.0 0.1 0.0 0.3 0.3 -0.2 -0.9 0.0 -0.1 -0.1 -0.2 -0.3 -3.3 -4.99 0.0 0.0 0.0 0.0 0.0 0.0 0.0 0.0 0.3 0.0 0.0 0.0 0.0 0.0 0.0
10 0.0 0.0 0.0 0.0 0.0 0.0 0.0 0.0 0.0 0.0 0.0 0.0 0.0 0.0 0.011 -0.1 -0.1 -0.7 0.0 0.0 -0.5 -0.3 -6.3 -0.1 -3.8 -0.2 -0.312 0.0 0.0 0.0 0.0 0.0 0.0 0.0 0.0 0.0 0.0 0.0 0.0 0.0 -8.3 -18.813 -0.4 -0.1 0.0 -0.2 0.3 -0.7 -0.5 0.7 0.4 0.4 0.1 0.1 -0.5 -2.114 0.0 0.0 0.0 0.0 0.0 0.0 0.0 0.0 0.0 0.0 0.0 0.0 0.0 0.0 -675.5
Premium Datafile No.Lab No.
0.2% Proof strength, Rp0.2
1 6 10 13 17 22 30 38 42 46 50 53 57 61 631 0.0 0.5 0.0 -0.1 0.6 -0.3 -0.1 0.0 0.0 -0.1 0.0 1.7 -17.62 0.0 0.0 0.0 1.1 0.0 0.0 -0.5 -0.1 0.0 0.1 2.6 -6.03 0.2 -0.6 -0.3 -1.9 -0.3 -0.1 -1.2 -0.2 -0.9 0.1 -7.5 0.54 -0.1 0.0 0.0 0.0 0.0 0.0 -0.2 0.0 0.0 0.0 0.0 0.8 0.35 -0.1 0.0 0.0 0.0 -1.0 -0.1 -0.2 0.1 0.0 -0.4 0.0 -2.6 0.46 -0.1 0.0 0.0 0.2 -0.6 0.0 -0.1 0.1 0.0 -0.2 0.0 1.0 -0.87 0.0 0.4 0.0 2.0 6.4 0.3 0.2 0.2 0.1 0.2 0.1 2.6 0.58 -0.2 0.0 0.3 2.3 0.7 0.2 0.0 1.3 -0.2 0.2 0.2 -0.3 0.09 -0.1 0.0 -0.2 0.1 0.7 0.1 -0.1 0.2 -0.1 0.0 -0.2 -3.210 -0.1 0.1 0.0 0.0 0.4 0.0 -0.1 0.0 0.1 0.0 0.0 0.6 0.211 0.1 0.3 0.0 -0.8 -1.5 -0.1 0.2 0.0 -0.1 0.012 -0.1 -0.1 0.0 0.0 0.0 0.0 -0.1 0.0 0.1 0.0 0.0 -6.0 -12.713 0.1 -0.4 -0.2 0.1 -0.3 0.2 0.4 0.0 0.3 0.0 -0.3 0.514 -0.1 0.1 0.0 0.1 0.9 0.0 0.2 0.1 -0.1 -0.1 0.0 1.1 0.1
TENSTAND ASCII Premium Datafile No.Lab No.
Page 46 of 68

NPL Report DEPC MPE 015 10 CONTRIBUTION OF THE SOFTWARE TO THE MEASUREMENT
UNCERTAINTY Annex J in EN 10002-1 provides guidance on how to estimate the uncertainty in the measurements from the tensile tests, based on the approach in the ISO TAG4 document [7]. It is recognised that the precision of the test depends on a large number of factors including:
• Measurements of testpiece dimensions • Measurement of force and extension • Test temperature and loading rates • Gripping system and the test machine characteristics and response • Human and software errors • Material inhomogeneity
Software errors are mentioned, but are not included in subsequent examples or calculations. Table J.1 in the Standard provides an estimate of the measurement uncertainty based on material independent parameters, and can be amended as proposed below, to include a contribution due to the software. Table 11: Measurement Uncertainty based on material independent parameters, including
the contribution due to software (Proposed modification of Table J.1 in the Standard)
Tensile properties, % error Parameter ReH ReL Rm Rp A z E **
Force 1 1 1 1 1 Strain 1 1 1 Lo 1 1 1 So 1 1 1 1 1 1 Su 2 Software * 1 0.5 0.5 0.5 1 3 * Taken from the values in Table A.1 in EN 10002-1 ** Modulus, E, is not included in Table J.1 in EN 10002-1, but is an important parameter that has been examined in this study and within the separate activity in TENSTAND WP3 With the exception of the modulus ‘E’, the default values for the software contribution are taken from the maximum uncertainties given in Table 9 above (Table A.1 in the Standard). For the modulus contribution, a value has been selected based on the typical variation seen in the calculated modulus values for the WP2 exercise and from more detailed studies in TENSTAND WP3. As mentioned above, it is recommended that mandatory software validation should be incorporated into the Standard, and carried out using the TENSTAND ASCII datafiles. A contribution due to the uncertainty associated with the software calculation should also be included in the uncertainty budget for the test and parameter being measured. Until the TENSTAND ASCII datafiles have been used to validate the software or the user can demonstrate otherwise, the default values for uncertainty currently proposed in Section A.5 in the Annex to the Standard should be used. It is recognized that these are probably somewhat over-conservative. Organizations are encouraged and recommended to use the Premium
Page 47 of 68

NPL Report DEPC MPE 015 Quality ASCII dataset to qualify the performance of their own software, following which the appropriate values for the uncertainty for the individual parameters can be substituted. 11 SUMMARY AND RECOMMENDATIONS TO STANDARDS COMMITTEE The study carried out within WP2 of the TENSTAND project has produced a set of 15 reference ASCII datafiles for the verification of tensile test analysis software. To ensure further take up of this data and a common approach by the standards and material testing community it is recommended that …
• A procedure for the mandatory validation of tensile testing software should be included in the next revision of EN 10002-1, carried out using the TENSTAND Premium Quality ASCII datafiles.
• A common ASCII file format, in line with that developed within the TENSTAND
project be adopted in the Standard
• A contribution due to the uncertainty associated with the software calculation should be included in the uncertainty budget for the test and parameter being measured.
• Until the TENSTAND ASCII datafiles have been used to validate the software, the
default values for uncertainty currently proposed in Section A.5 in the Annex to the Standard be used. The default uncertainty values could be substituted by calculated values, based on the performance of the user’s software and analysis of the ASCII Premium Dataset.
• The issue of modulus measurement should be examined further. Recommendations
from WP3 include the use of a separate tensile test for determining modulus, using high precision averaging strain measurement, and testing over a limited strain range. The use of default handbook values for modulus is not recommended for absolute measurement of the properties, but can be adopted for comparison purposes or if the particular experimental set-up is not suitable for obtaining reliable modulus data. In all cases, the use of default values must be reported.
The software intercomparison exercise has shown that further clarification is required to remove uncertainty and ambiguity in the definition and calculations of some material parameters. From the examples presented in Section 7 of this report, it is recommended that the Standards committee consider and address the following changes:
• For materials that exhibit upper and lower yield phenomena, it is recommended that the test conditions be revised, either by not allowing a speed change until after ReL has been reached, or by agreeing a set value of strain (e.g. 0.5%, 1% or 2%) at which this could be implemented.
• To reduce the uncertainty in detecting when testpiece fracture occurs, it is
recommended that the definition for the fracture of the testpiece is reviewed, particularly with respect to the 3% force limit, as automatic data collection often stops before that point is reached and the value is not always reported.
Page 48 of 68

NPL Report DEPC MPE 015 For low elongation materials (e.g A < 5%), consideration should be given to changing the accuracy and rounding of strain readings reported to the nearest 0.1%.
• To avoid ambiguities in the interpretation of the “initial transient effect”, consideration should be given to expanding and clarifying the definition, with more realistic examples where appropriate.
• It is recommended also that the Standards committee consider simplifying the
definition and method for calculating the percentage yield point extension ‘Ae ’ to reduce the large uncertainty in reported values.
And, to clarify the following areas, providing more instructive information where applicable to remove ambiguity in the interpretation, in particular …
• Clarifying the definition of Fm and Rm, particularly for materials that exhibit upper and lower yield phenomena where ambiguities may arise.
• That the issue of smoothing the data be given further consideration and more visibility
in future revisions of the Standard, with examples.
• Although the procedure for correcting for preloads and offsets is covered in the Standard, it is recommended that more explicit instructions are developed, including a Figure and example to illustrate the effect.
• Further recommendations are that high data sampling rates are used, commensurate
with the duration and test conditions. Consideration should be given to the practical aspects of handling the potentially large datafiles generated with the high sampling rates, and range of test rates and conditions being proposed in the Standard.
Until the issues have been resolved regarding the use of completely automated testing and analysis software for calculating tensile properties it is recommended that there should still be a manual check of the stress-strain data to ensure the correct values and parameters have been selected. This is probably not so much an issue in an industrial quality control laboratory, because they will be familiar with the particular material behaviour and should have set up the software accordingly. It is probably of greatest concern to those laboratories and organisations that test a variety of materials with different stress-strain behaviour. At the time of writing this report, a number of the issues outlined above were raised with the Working Group, ISO TC164 SC1 WG4, charged with revising part of ISO 6892 relevant to Room Temperature Tensile Testing. The recommendations of the Working Group will be considered at the ISO meeting being held in Beijing, China in October 2004. It is the intention that a revised ISO 6892 will supersede EN10002-1 in due course, under the dual voting procedure of the Vienna Agreement.
Page 49 of 68

NPL Report DEPC MPE 015 12 ACKNOWLEDGEMENTS The work reported in this study has been the cumulative effort of a number of partners in the TENSTAND project. The authors would like to offer special thanks to Mr Hermann Bloching (Zwick), Mr Johannes Aegeter (Hydro Aluminium), Dr Hellmuth Klingelhoffer (BAM), Mr Stuart Sotheran (Corus) and Mr Jean-Luc Geoffrey (Sollac) for their invaluable contributions in determining the agreed values and to the other TENSTAND partners for their input and feedback. Thanks are also due to Mr Tony Fry (NPL) who helped with the database and data analysis. The European Commission is acknowledged for financial support, and the UK Department of Trade & Industry is acknowledged for additional support for the NPL members of staff. 13 REFERENCES [1] EN 10002-1: Metallic Materials - Tensile Testing – Part 1: Method of Test at Ambient
temperature (2001)
[2] EN 10002-Pt5: Metallic Materials - Tensile Testing – Part 1: Method of Testing at elevated temperature
[3] ISO 6892: International Standard for Metallic materials – tensile testing at ambient temperature (1998)
[4] ASTM E8: Standard Test Methods for Tension Testing of Metallic Materials [5] G Dean, M S Loveday, P M Cooper, B E Read and B Roebuck. "Aspects of Modulus
Measurement". Chapt 8, pp 150-209, Materials Metrology and Standards for Structural Performance. Ed. B F Dyson, M S Loveday and M G Gee. Pub. Chapman and Hall, London, 1995.
[6] J Lord, M S Loveday and M Rides, TENSTAND “WP3 Final Report: Modulus
Measurement Methods.” August 2004 [7] ISO TAG4 – BIPM, IEC, IFCC, ISO, IUPAC, IUPAP, OIML. Guide to the
Expression of Uncertainty in Measurement, ISO, Geneva, Switzerland. ISBN 92-67-10188-9.
Page 50 of 68

NPL Report DEPC MPE 015 APPENDIX A GLOSSARY OF RELEVANT DEFINITIONS IN EN 10002-1 4.8 Maximum Force (Fm) …. is the greatest force which the testpiece withstands during the test once the yield point has been passed. For materials without yield point, it is the maximum value during the test 4.9.1 Tensile Strength (Rm) …. is the stress corresponding to the maximum force (Fm). 4.9.2.1 and A.4.2 Upper yield strength (ReH) .. is defined as the stress corresponding to the highest value of force prior to a reduction of at least 0.5% of the force and followed by a region in which the force should not exceed the previous maximum over a strain range not less than 0.05% 4.9.2.2 Lower yield strength (ReL) …. is the lowest value of stress during plastic yielding, ignoring any transient effects. However in A.4.3 it states that for productivity of testing a nominal value of ReL may be reported as the lowest stress within the first 0.25% strain after ReH, not taking into account any initial transient effect. When this procedure is used, it must be recorded in the test report. After determining ReL by this procedure, the test rate may be increased as per 10.1.3. (This only applies to materials having yield phenomena and when Ae is not required). 4.9.3 and 14.1 Proof strength, non-proportional extension (Rp0.1 and Rp0.2) is the stress at which a non-proportional extension is equal to a specified percentage of the extensometer gauge length. It is determined on the force-extension diagram by drawing a line parallel to the ordinate axis (force axis) and at a distance from this equivalent to the prescribed total percentage extension. The point at which this line intersects the curve gives the force corresponding to the desired proof strength, which is calculated by dividing this force by the original cross-sectional area of the testpiece. A.4.4 states that the values can be determined by interpolation between two points of the smoothed curve. 4.4.2 Percentage elongation after fracture (A) …permanent elongation of the gauge length after fracture, expressed as a percentage of the original gauge length 4.4.3 Percentage total elongation at fracture (At ) .. is the total elongation (elastic plus plastic) of the gauge length at the moment of fracture. From A.4.6 … the fracture is considered effective when the force between 2 measuring points decreases by more than 5 times the value of the previous 2 points followed by a decrease to lower than 3% of the maximum Ag is the percentage non-proportional elongation at maximum force. 4.4.2 and A.4.8 Percentage total elongation at maximum force (Agt ) should be considered as the extension corresponding to the maximum of the stress-strain curve, reasonably smoothed after yield point phenomena. 4.6.2 Percentage yield point extension (Ae) …. In discontinuous yielding materials, is the extension between the start of yielding and the start of uniform work hardening. A more detailed description is given in A.4.7 whereby the method for determining Ae involves assessment of the two particular points in the force-extension curve which define the beginning and end of yield point extension. The beginning is that point where the slope becomes zero and is represented by a horizontal line. The end point can be determined by constructing two lines, the first being horizontal from the last point of zero slope and the second as a tangent to the strain hardening section of the curve as close as possible to the point of inflection. The intersection between these two lines represents the end of yield point extension.
Page 51 of 68

NPL Report DEPC MPE 015
Table A1: Full List of ASCII datafiles generated in WP2 (by Instron and Zwick) (Files highlighted in green were selected for the intercomparison exercise)
Original Source Data Capture Proof or File No. Material File Name Rate, Hz Yield Stress
1 Nimonic 75, CRM 661 CRM 661-GBX 178-1 BCR/IRMM 50 P2 Nimonic 75, CRM 661 CRM 661-GBX 178-2 BCR/IRMM 50 P3 Nimonic 75, CRM 661 CRM 661-GBX 178-1 BCR/IRMM 5 P4 Nimonic 75, CRM 661 CRM 661-GBX 178-2 BCR/IRMM 5 P5 Nimonic 75, CRM 661 NPL-CRM661 No 8-1 BCR/IRMM 50 P6 Nimonic 75, CRM 661 NPL-CRM661 No 8-2 BCR/IRMM 50 P7 Nimonic 75, CRM 661 NPL-CRM661 No 8-1 BCR/IRMM 5 P8 Nimonic 75, CRM 661 NPL-CRM661 No 8-2 BCR/IRMM 5 P9 13%Mn Steel P1M 23-1 CORUS 50 P10 13%Mn Steel P1M 23-2 CORUS 50 P11 13%Mn Steel P1M 23-1 CORUS 5 P12 13%Mn Steel P1M 23-2 CORUS 5 P13 S355 Structural steel P1M 24-1 CORUS 50 Y14 S355 Structural steel P1M 24-2 CORUS 50 Y15 S355 Structural steel P1M 24-1 CORUS 5 Y16 S355 Structural steel P1M 24-2 CORUS 5 Y17 316L Stainless Steel S1C 20-1 CORUS 50 P18 316L Stainless Steel S1C 20-2 CORUS 50 P19 316L Stainless Steel S1C 20-1 CORUS 5 P20 316L Stainless Steel S1C 20-2 CORUS 5 P21 Tin Coated packaging steel SOLLAC F72-No7-1 SOLLAC 50 P22 Tin Coated packaging steel SOLLAC F72-No7-2 SOLLAC 50 P23 Tin Coated packaging steel SOLLAC F72-No7-1 SOLLAC 5 P24 Tin Coated packaging steel SOLLAC F72-No7-2 SOLLAC 5 P25 Sheet steel SOLLAC T462 No6-1 SOLLAC 50 Y26 Sheet steel SOLLAC T462 No6-2 SOLLAC 50 Y27 Sheet steel SOLLAC T462 No6-1 SOLLAC 5 Y28 Sheet steel SOLLAC T462 No6-2 SOLLAC 5 Y29 Sheet steel TKS-DX56 No 2-1 TKS 50 P30 Sheet steel TKS-DX56 No 2-2 TKS 50 P31 Sheet steel TKS-DX56 No 2-1 TKS 5 P32 Sheet steel TKS-DX56 No 2-2 TKS 5 P33 Sheet steel TKS-ZStE-180-No1-1 TKS 50 Y34 Sheet steel TKS-ZStE-180-No1-2 TKS 50 Y35 Sheet steel TKS-ZStE-180-No1-1 TKS 5 Y36 Sheet steel TKS-ZStE-180-No1-2 TKS 5 Y37 Aluminium Sheet VAW-hard AA5182-No3-1 VAW 50 P38 Aluminium Sheet VAW-hard AA5182-No3-2 VAW 50 P39 Aluminium Sheet VAW-hard AA5182-No3-1 VAW 5 P40 Aluminium Sheet VAW-hard AA5182-No3-2 VAW 5 P41 Aluminium Sheet VAW-soft AA1050 No 5-1 VAW 50 P42 Aluminium Sheet VAW-soft AA1050 No 5-2 VAW 50 P43 Aluminium Sheet VAW-soft AA1050 No 5-1 VAW 5 P44 Aluminium Sheet VAW-soft AA1050 No 5-2 VAW 5 P45 Aluminium Sheet VAW-soft AA5182 No 4-1 VAW 50 P46 Aluminium Sheet VAW-soft AA5182 No 4-2 VAW 50 P47 Aluminium Sheet VAW-soft AA5182 No 4-1 VAW 5 P48 Aluminium Sheet VAW-soft AA5182 No 4-2 VAW 5 P49 Sheet steel TKS-DX56-L050-B12-5-Probe 1 TKS 50 P50 Sheet steel TKS-DX56-L050-B12-5-Probe 2 TKS 50 P51 Sheet steel TKS-DX56-L050-B12-5-Probe 1 TKS 5 P52 Sheet steel TKS-DX56-L050-B12-5-Probe 2 TKS 5 P53 Sheet steel TKS-ZStE-180-L050-B12-5-Probe 1 TKS 50 Y54 Sheet steel TKS-ZStE-180-L050-B12-5-Probe 2 TKS 50 Y55 Sheet steel TKS-ZStE-180-L050-B12-5-Probe 1 TKS 5 Y56 Sheet steel TKS-ZStE-180-L050-B12-5-Probe 2 TKS 5 Y57 Synthetic Digital Curve NPL Zero Noise NPL 50 P58 Synthetic Digital Curve NPL Zero Noise NPL 5 P61 Synthetic Digital Curve NPL 0.5% Load Noise NPL 50 P62 Synthetic Digital Curve NPL 0.5% Load Noise NPL 5 P63 Synthetic Digital Curve NPL 1% Load Noise NPL 50 P64 Synthetic Digital Curve NPL 1% Load Noise NPL 5 P
TENSTAND :WP2: ASCII Data Set Files for Software Inter-Comparison
Page 52 of 68

NPL Report DEPC MPE 015 Table A2: Examples of ASCII datafiles generated by Instron (top) and Zwick (bottom)
"Reference";"EN10002-1" "Identification";"Tenstand" "Material";"Nimonic" "Extensometer to crosshead transition";0.00;"mm" "Specimen geometry";"Circular" "Cross-sectional area = So" "Extensometer gauge length = Le" "Extensometer output in mm" "Parallel length = Lc" "Data acquisition rate 50Hz" "Data row for start force reduction (Hysteresis) = Hs" "Data row for end force reduction (Hysteresis) = He" "Data row for switch to crosshead = Cs" "File length N data rows" "File width M data columns" "So";78.46129;"mm2" "Le";50.00000;"mm" "Lc";60.00000;"mm" "N";3127 "M";4 "Hs";0 "He";0 "Cs";0 "time";"crosshead";"extensometer";"force" "s";"mm";"mm";"kN" 0.00000;0.0515983300;0.0000579191;0.1913788000
"Reference";"DIN EN 10002-1" "Identification";"Tenstand" "Material";"CRM661 Nimonic 75" "Extensometer to crosshead transition";0.00;"%" "Specimen geometry";"round" "Cross-sectional area = So" "Extensometer gauge length = Le" "Extensometer output in mm" "Parallel length = Lc" "Data acquisition rate 50Hz" "Data row for start force reduction (Hysteresis) = Hs" "Data row for end force reduction (Hysteresis) = He" "Data row for switch to crosshead = Cs" "File length N data rows" "File width M data columns" "So";78.54;"mm2" "Le";50.00;"mm" "Lc";60.00;"mm" "N";3168 "M";4 "Hs";0 "He";0 "Cs";0 "time";"crosshead";"extensometer";"force" "s";"mm";"mm";"kN" 0.01999;0.0000004712;0.0001500793;0.4039989013
Page 53 of 68

NPL Report DEPC MPE 015
Table A3: Details of analysis software used
Organisation Software used Zwick TestXpert ver 10 NPL In-house software (modification of modulus analysis software) Instron Merlin ver 5.41.00 Usinor/Sollac In-house tensile analysis Hydro Al In-house EXCEL MTS MTS' TestWorks 4 monotonic application SW BAM In house software (using Excel; TechPlot) Corus Regraph ver 2 Dirlik DC-Tensile EMIC Tesc ver 3.00
Page 54 of 68

NPL Report DEPC MPE 015
Table A4: Default sheet for analysis returns
T E N S T A N D : T e n s i le T e s t in g S o f tw a r e V a l id a t io nC o n t a c t D e t a i ls o f R e s p o n d e n t :N a m e :e - m a il: O r g a n is a t io n : A d d r e s s : D e t a i ls o f S o f t w a r e :T it le / N a m e :V e r s io n :Y e a r o f is s u e : P le a s e in s e r t y o u r r e s u l t s in t h e a p p r o p r ia t e c o lu m n sM a t e r ia l D a t a R p 0 .1 R p 0 .2 R e H R e L R m F m A A t A g A g t A e E A 0 .1 A 0 .2 A e H
C a p t u r e 0 .1 0 % 0 .2 0 % U p p e r L o w e r T e n s i l e M a x . P e r c e n ta g e E lo n g a t io n % N o n - p r o p % T o ta l Y ie ld Y o u n g 's s t r a in a t s t r a in a t s t r a in a tR a t e P r o o f P r o o f Y ie ld Y ie ld S tr e n g th F o r c e E lo n g a t io n a t E lo n g E lo n g a t io n p o in t M o d u lu s R p 0 .1 R p 0 .2 R e H
S tr e s s S tr e s s S t r e s s S t r e s s a t f r a c t . F r a c tu r e a t F r a c t . a t f r a c t . e x te n s io nH z ( M P a ) ( M P a ) ( M P a ) ( M P a ) ( M P a ) ( N ) ( % ) ( % ) ( % ) ( % ) ( % ) ( G P a ) ( % ) ( % ) ( % )
1 N im o n ic 7 5 , C R M 6 6 1 5 0 X X X X3 N im o n ic 7 5 , C R M 6 6 1 5 X X X X6 N im o n ic 7 5 , C R M 6 6 1 5 0 X X X X8 N im o n ic 7 5 , C R M 6 6 1 5 X X X X
1 0 1 3 % M n S te e l 5 0 X X X X1 2 1 3 % M n S te e l 5 X X X X
1 3 S 3 5 5 S t r u c tu r a l S te e l 5 0 X X X X1 5 S 3 5 5 S t r u c tu r a l S te e l 5 X X X X
1 7 3 1 6 L s ta in le s s S te e l 5 0 X X X1 9 3 1 6 L s ta in le s s S te e l 5 X X X
2 2 T in c o a te d s te e l, F 7 2 1 B 5 0 X X X2 4 T in c o a te d s te e l, F 7 2 1 B 5 X X X
2 6 T 4 6 2 S h e e t s te e l 5 0 X X2 8 T 4 6 2 S h e e t s te e l 5 X X
3 0 S te e l D X 5 6 5 0 X X X3 2 S te e l D X 5 6 5 X X X
3 4 S te e l Z s te 1 8 0 5 0 X X3 6 S te e l Z s te 1 8 0 5 X X
3 8 H a r d A lu m in iu m S h e e t A A 5 1 8 2 5 04 0 H a r d A lu m in iu m S h e e t A A 5 1 8 3 5
4 2 A lu m in iu m A A 1 0 5 0 5 0 X X X4 4 A lu m in iu m A A 1 0 5 0 5 X X X
4 6 S o f t A lu m in iu m S h e e t ,A A 5 1 8 2 5 0 X X X4 8 S o f t A lu m in iu m S h e e t ,A A 5 1 8 2 5 X X X
5 0 S h e e t S te e l T K S D X 5 6 5 0 X X X5 2 S h e e t S te e l T K S D X 5 7 5 X X X
5 3 S h e e t S te e l T K S Z S tE 5 0 X X5 5 S h e e t S te e l T K S Z S tE 5 X X
5 7 S y n e th ic C u r v e Z e r o N o is e 5 0 X X X5 8 S y n e th ic C u r v e Z e r o N o is e 5 X X X
6 1 S y n e th ic C u r v e 0 .5 % N o is e 5 0 X X X6 2 S y n e th ic C u r v e 0 .5 % N o is e 5 X X X
6 3 S y n e th ic C u r v e 1 % N o is e 5 0 X X X6 4 S y n e th ic C u r v e 1 % N o is e 5 X X X
Page 55 of 68

NPL Report DEPC MPE 015
APPENDIX B SPREADSHEET OF ALL DATAFILES
Table B1: Key to spreadsheet view
VAW-hard AA5182-No3-2Lab ID Data set ID Rp0.1 Rp0.2 ReH ReL Rm Fm A At Ag Agt Ae E
1 38 385.51 396.53 434.31 2006.5 4.73 5.35 4.32 4.95 692 38 384.59 396.14 434.31 2006.5122 5.48 4.94 68.8263 38 382.78 395.44 395.44 1826.9328 5.48 4.94 705 38 385.3 396.4 434.3 2006.532959 4.7 5.3 4.3 4.9 696 38 385.219 396.397 434.3 2006.5 4.732 5.354 4.3 4.9 69.327 38 385.6295 396.5263 434.3145 2006.5 4.7184 5.3727 4.3091 4.9386 68.98268 38 386.3 396.8 434.3 2007 5.5 5.5 4.3 4.9 68.19 38 385.822 396.645 433.441 433.441 2002.5 5.343 5.3437 68.903
10 38 385.6 396.5 434.3 2007 4.7375 5.475 4.309 4.939 68.9811 38 385.59 396.52 434.31 2006.53 4.628 5.251 4.309 4.939 69.0312 38 386.2 396.8 404.11 398.2 428 1977.21 4.69 5.31 4.31 4.93 4.03 68.2613 38 385.4 396.5 404.1 398.3 434.3 2007 4.7 5.4 4.3 4.9 69.214 38 385 397 435 2000 5 5 4 5 6915 38 386.29 396.84 404.11 398.03 434.31 2006.53 4.72 5.36 0.27 0.86 68.16
Agreed 385.2-386.8 396.4-397.1 434.3 2007 4.7 5.4 4.3 4.9 68.1-69.3Mean 385.4 396.5 431.1 1990.9 4.8 5.4 3.9 4.7 68.9
2SDev 1.8 0.8 20.8 95.7 0.5 0.3 2.4 2.2 1.0Uncertainty 0.5 0.2 4.8 4.8 10.3 4.8 61.9 47.2 1.4
Aluminium Sheet, 50 Hz
Range of Modulus valuesOutliers, based on permitted range of
modulus values
OutliersStatistics, calculated excluding outliers
Agreed Values
Page 56 of 68

NPL Report DEPC MPE 015
Table B2: Summary of analysis returns
Lab ID Data set ID Rp0.1 Rp0.2 ReH ReL Rm Fm A At Ag Agt Ae E A0.1 A0.2 AeH AeL1 1 303.99 309.87 764.36 59972.7 41.22 41.5 30.81 31.18 208 0.25 0.352 1 303.84 309.88 764.36 59971.686 34 30.55 31.18 210.156 0.24 0.353 1 304.57 310.1 764.36 59971.686 34 30.52 31.18 200 0.25 0.354 1 303.8 309.8 764.4 59972.73 41.2 41.5 30.8 31.2 211 0.2 0.35 1 303.8 309.768 764.4 59973 41.229 41.495 30.8 31.2 211.862 0.243 0.3466 1 303.8689 309.8033 764.3495 59971.9 41.2031 41.4726 30.9854 31.3489 210.3043 0.24516 0.347997 1 304.2 309.9 764.4 59973 41.2 41.5 31.1 31.5 205.5 0.249 0.3498 1 304.927 309.706 764.708 764.708 60000 41.4 30.7 200.848 0.252 0.354 3.079 1 303.9 309.8 764.4 59973 41.24 41.496 30.814 31.178 210.05 0.245 0.348
10 1 303.86 309.8 764.36 59972.7 41.23 41.5 30.81 31.18 210.7 0.25 0.3511 1 304.2 310 764.3 59970.99 41.15 41.43 30.91 31.28 202.85 0.25 0.3512 1 303.9 309.8 764.4 59970 41.2 41.5 30.8 31.2 210.1 0.245 0.34813 1 303 310 764 59900 41 41.5 31 31.5 216.5 0.2 0.314 1 303.94 309.84 764.36 59972.73 41.22 41.50 30.81 31.18 208.82
Agreed 303.5-304.6 309.6-310.2 764.4 59973 41.2 41.5 30.8 31.2 200.8-216.5 0.25 0.35M ean 304.0 309.9 764.3 59972.2 41.2 41.5 30.8 31.2 209.0
2SDev 0.5 0.2 0.2 1.9 0.1 0.1 0.1 0.1 8.0Uncertainty 0.1 0.1 0.0 0.0 0.3 0.2 0.4 0.2 3.9
Lab ID Data set ID Rp0.1 Rp0.2 ReH ReL Rm Fm A At Ag Agt Ae E A0.1 A0.2 AeH AeL1 3 303.9 309.88 764.35 59971.9 41.13 41.4 31.11 31.48 207 0.25 0.352 3 304.22 311.37 764.35 59971.891 41.4 30.85 31.48 210.662 0.25 0.383 3 307.1 311.37 764.35 59971.891 41.4 30.82 31.48 200 0.29 0.384 3 303.7 309.8 764.4 59971.95 41.1 41.4 31.1 31.5 211 0.2 0.35 3 303.649 309.797 764.4 59972 41.131 41.402 31.1 31.5 211.182 0.244 0.3476 3 303.7328 309.8254 764.3549 59972.3 41.1307 41.4028 30.9958 31.3599 209.8837 0.2453 0.34827 3 304.2 309.2 764.4 59972 41.1 41.4 31.1 31.5 201.6 0.249 0.3368 3 303.971 310.662 764.708 764.708 60000 39.4 30.7 201.138 0.252 0.356 3.079 3 303.7 311.3 764.4 59972 41.12 41.403 31.113 31.475 210.72 0.246 0.348
10 3 303.55 309.76 764.35 59971.9 41.13 41.4 31.12 31.48 212.8 0.24 0.3511 3 304.2 310 764.3 59967.82 41.12 41.4 30.58 30.95 202.78 0.25 0.3512 3 303.8 309.8 764.4 59970 41.1 41.4 31.1 31.5 209.1 0.246 0.34813 314 3 303.64 309.79 764.35 59971.95 31.09 31.48 211.24
Agreed 303.5-304.5 309.8-310.2 764.4 59972 41.1 41.4 31.1 31.5 201.1-212.8 0.25 0.35M ean 303.9 309.8 764.4 59971.6 41.1 41.4 31.0 31.5 208.3
2SDev 0.5 0.2 0.1 2.5 0.0 0.0 0.2 0.1 8.3Uncertainty 0.2 0.0 0.0 0.0 0.1 0.0 0.7 0.3 4.0
NPL-CRM661 Lab ID Data set ID Rp0.1 Rp0.2 ReH ReL Rm Fm A At Ag Agt Ae E A0.1 A0.2 AeH AeL
1 6 302.3 308.89 761.14 59779.8 41.41 41.73 31.37 31.81 176 0.27 0.382 6 301.25 308.36 761.14 59779.936 41.85 31.11 31.8 190.711 0.26 0.363 6 300.31 307.84 761.14 59779.936 41.85 31.15 31.8 200 0.25 0.364 6 301.3 308.4 761.1 59779.75 41.4 41.7 31.4 31.8 191 0.3 0.45 6 301.414 308.403 761.1 59780 41.405 41.703 31.4 31.8 190.193 0.258 0.3626 6 301.4341 308.4104 760.9492 59764.9 41.4082 41.7066 31.2758 31.6766 189.8583 0.26195 0.365627 6 301.9 308.8 761.1 59780 41.8 41.9 31.4 31.8 182.7 0.265 0.378 6 301.757 308.441 761.077 761.077 59775 41.7 30.5 185.169 0.266 0.37 3.059 6 301.5 308.4 761.1 59780 41.46 41.851 31.402 31.805 188.76 0.263 0.366
10 6 301.65 308.48 761.14 59779.8 41.43 41.73 31.4 31.8 186.1 0.26 0.3711 6 301.9 308.7 761 59770.24 41.33 41.64 31.21 31.63 182.83 0.27 0.3712 6 301.1 308.3 761.1 59780 41.4 41.7 31.4 31.8 195.8 0.258 0.36213 6 301 308 761 59778 41.4 41.7 31.5 31.9 189 0.26 0.3614 6 301.57 308.46 761.14 59779.75 31.40 31.80 187.06
Agreed 300.7-302.0 308.2-308.8 761.1 59780 41.4 41.7 31.4 31.8 182.7-195.8 0.26 0.37M ean 301.5 308.4 761.1 59778.6 41.4 41.8 31.3 31.7 188.3
2SDev 0.6 0.4 0.1 5.8 0.3 0.2 0.2 0.7 7.5Uncertainty 0.2 0.1 0.0 0.0 0.6 0.4 0.7 2.2 4.0
CRM 661-G BX 178-1
CRM 661-G BX 178-1
N im onic 75, CRM 661, 50 Hz
Nim onic 75, CRM 661, 50 Hz
Nim onic 75, CRM 661, 5 Hz
Page 57 of 68

NPL Report DEPC MPE 015
Table B2 (contd): Summary of analysis returns (contd) NPL-CRM661 No 8-2
Lab ID Data set ID Rp0.1 Rp0.2 ReH ReL Rm Fm A At Ag Agt Ae E A0.1 A0.2 AeH AeL1 8 302.26 308.82 761.08 59775 41.27 41.6 31.34 31.77 176 0.27 0.382 8 302.94 308.36 761.08 59775.223 41.6 31.07 31.77 189.143 0.28 0.363 8 302.94 308.36 761.08 59775.223 41.6 31.11 31.77 200 0.28 0.364 8 301.2 308.4 761.1 59774.996 41.3 41.6 31.4 31.8 191 0.3 0.45 8 301.328 308.428 761.1 59775 41.29 41.592 31.4 31.8 189.729 0.259 0.3636 8 301.3351 308.4312 760.9772 59767.2 41.2929 41.5956 31.171 31.5724 189.5922 0.26199 0.365737 8 302.9 308.4 761.1 59775 41.3 41.6 31.4 31.8 182.3 0.276 0.3648 8 301.757 308.441 761.077 761.077 59775 39.65 30.65 184.992 0.268 0.37 3.0659 8 303 309 761 59775 41.24 41.596 31.366 31.769 188.76 0.262 0.366
10 8 301.61 308.55 761.08 59775 41.28 41.6 31.36 31.77 184.7 0.26 0.3711 8 301.7 308.6 761 59767.87 41.28 41.6 30.83 31.24 183.59 0.27 0.3712 8 301 308.3 761.1 59770 41.3 41.6 31.4 31.8 194.5 0.259 0.36313 814 8 301.33 308.43 761.08 59775.00 31.36 31.77 189.73
Agreed 300.6-301.9 308.1-308.7 761.1 59775 41.3 41.6 31.4 31.8 182.3-194.5 0.27 0.37M ean 301.4 308.4 761.1 59775.0 41.3 41.4 31.3 31.8 188.0
2SDev 0.5 0.2 0.1 0.2 0.0 1.1 0.3 0.1 7.3Uncertainty 0.2 0.1 0.0 0.0 0.1 2.7 0.8 0.4 3.9
Lab ID Data set ID Rp0.1 Rp0.2 ReH ReL Rm Fm A At Ag Agt Ae E A0.1 A0.2 AeH AeL1 10 334.78 337.2 936.99 72666.5 51.42 51.92 49.84 50.36 181 0.28 0.392 10 334.78 337.18 936.99 72666.676 52.53 49.19 50.36 180.574 0.28 0.393 10 333.18 336.88 936.99 72666.676 52.53 49.3 50.36 200 0.26 0.374 10 334.6 337.2 937 72666.5 51.4 51.9 49.8 50.4 184 0.3 0.45 10 334.708 337.18 937 72666 51.427 51.915 49.8 51.915 182.642 0.283 0.3856 10 334.7537 337.1891 929.9645 72121.8 51.4114 51.9132 49.9423 50.4537 181.8515 0.2841 0.385437 10 334.8 337.2 937 72667 52.2 52.5 49.8 50.4 181.5 0.284 0.3858 10 334.608 337.509 913.887 937.097 72675 51.76 50.32 182.514 0.286 0.388 4.6329 10 335 337 937 72667 51.48 52.527 49.848 50.358 183.88 0.282 0.384
10 10 334.7 337.18 936.99 72666.5 51.2 51.71 49.84 50.36 183 0.28 0.3911 10 334.8 337.2 936.3 72616.65 51.39 51.9 49.82 50.34 181.65 0.28 0.3912 10 334.7 337.2 937 72670 51.4 51.9 49.8 50.4 183.1 0.283 0.38513 10 335 337 937 72667 51.5 52 50 50.5 183 0.28 0.3814 10 334.72 337.18 936.99 72666.50 51.42 51.92 43.79 44.28 182.53
Agreed 334.6-334.9 337.2 937.0 72667 51.4 51.9 49.8 50.4 180.6-184.0 0.28 0.39M ean 334.8 337.2 937.0 72666.9 51.4 51.9 49.8 50.4 182.4
2SDev 0.2 0.1 0.1 2.1 0.2 0.4 0.4 0.1 2.1Uncertainty 0.1 0.0 0.0 0.0 0.3 0.8 0.7 0.2 1.1
Lab ID Data set ID Rp0.1 Rp0.2 ReH ReL Rm Fm A At Ag Agt Ae E A0.1 A0.2 AeH AeL1 12 334.64 337.26 935.22 72529.5 51.42 51.92 49.81 50.32 181 0.29 0.392 12 335.65 337.65 935.22 72529.426 51.92 49.15 50.32 179.316 3 0.413 12 335.65 337.65 935.22 72529.426 51.92 49.27 50.32 200 0.3 0.414 12 334.5 337.2 935.2 72529.47 51.4 51.9 49.8 50.3 185 0.3 0.45 12 334.579 337.242 935.2 72529 51.103 51.614 49.8 50.3 182.157 0.284 0.3856 12 334.6144 337.2516 932.803 72342 51.4238 51.9154 50.1342 50.6486 181.3524 0.28428 0.385737 12 335.7 337.6 935.2 72529 51.4 51.9 49.8 50.3 181.6 0.299 0.4068 12 334.608 337.509 935.162 935.162 72525 51.6 50.32 183.63 0.286 0.388 5.0329 12 335.3 337.6 935.3 72529 51.48 51.915 49.814 50.324 183.49 0.284 0.384
10 12 334.63 337.26 935.22 72529.5 51.1 51.61 49.81 50.32 181 0.28 0.3911 12 334.6 337.3 918.9 71263.21 51.42 51.92 47.3 47.8 181.59 0.28 0.3912 12 334.6 337.2 935.2 72530 51.3 51.8 49.8 50.3 182.5 0.284 0.38513 1214 12 334.60 337.25 935.22 72529.47 49.81 50.32 181.74
Agreed 334.3-334.8 337.2-337.3 935.2 72530 51.4 51.9 49.8 50.3 179.3-185.0 0.29 0.39M ean 334.6 337.2 935.2 72529.0 51.3 51.8 49.7 50.3 182.0
2SDev 0.1 0.1 0.1 2.7 0.3 0.3 0.4 0.0 3.0Uncertainty 0.0 0.0 0.0 0.0 0.6 0.5 0.7 0.0 1.6
N im onic 75, CRM 661, 5 Hz
P1M 23-2
P1M 23-2
13% M n Steel, 50 Hz
13% M n Steel, 5 Hz
Page 58 of 68

NPL Report DEPC MPE 015
Table B2 (contd): Summary of analysis returns (contd)
Lab ID Data set ID Rp0.1 Rp0.2 ReH ReL Rm Fm A At Ag Agt Ae E A0.1 A0.2 AeH AeL1 13 448.42 439.13 479.36 431.79 567.19 44502.7 29.4 29.54 14.48 14.74 1.98 223 0.3 0.4 0.22 1.762 13 479.36 431.79 567.19 44502.462 35.27 14.41 14.74 2.04 228.8493 13 479.36 431.79 567.19 44502.462 35.27 14.36 14.74 2.04 2004 13 479.4 431.8 567.2 44502.68 29.4 29.5 14.5 14.7 2.1 223 0.2 1.85 13 479.356 431.791 567.2 44503 29.285 29.429 14.5 14.7 2.097 228.532 0.215 1.7586 13 479.356 431.791 567.1718 44501 29.2863 29.4306 14.3143 14.5637 1.92112 227.41 0.21651 1.75987 13 446.4 439.4 479.4 431.8 567.2 44503 29.4 29.5 14.5 14.7 1.979 250.4 0.306 0.398 0.217 1.768 13 448.628 439.707 479.217 567.158 44500 29.4 13.52 224.182 0.3 0.396 0.29 13 478.7 437.1 567.2 44503 29.42 29.535 14.483 14.737 2.13 223.11 0.214 0.368
10 13 447.86 439.36 479.36 431.79 567.19 44502.7 29.39 29.53 14.48 14.74 1.979 222.7 0.3 0.4 0.22 1.7611 13 479.36 432.1 567.2 44501.44 29.2 29.35 14.34 14.59 2.88 220.97 0.22 2.212 13 479.4 431.8 567.2 44500 29.4 29.5 14.5 14.7 222.2 0.217 1.7613 13 479 431 567 44500 29.5 29.5 14.5 14.5 2 226.8 0.2 2.214 13 479.36 431.79 567.19 44502.68 14.48 14.74 221.99
Agreed 479.36 431.79 567.2 44503 29.4 29.5 14.5 14.7 1.98-2.1 221.0-228.8 0.2 1.8M ean 479.3 431.8 567.2 44501.9 29.4 29.5 14.5 14.6 224.4
2SDev 0.2 0.0 0.1 2.4 0.2 0.1 0.1 0.6 5.5Uncertainty 0.0 0.0 0.0 0.0 0.6 0.4 1.0 4.4 2.4
Lab ID Data set ID Rp0.1 Rp0.2 ReH ReL Rm Fm A At Ag Agt Ae E A0.1 A0.2 AeH AeL1 15 449.29 439.48 474.27 432.09 567.19 44502.7 29.09 29.24 14.48 14.74 1.98 223 0.3 0.4 0.21 1.782 15 474.27 432.09 567.19 44502.462 35.27 14.42 14.74 1.9 233.793 15 474.27 432.09 567.19 44502.462 35.27 14.36 14.74 1.9 2004 15 474.3 432.1 567.2 44502.68 29.1 29.2 14.5 14.7 2.2 223 0.2 1.85 15 474.273 432.091 567.2 44503 28.868 29.023 14.5 14.7 1.999 228.359 0.214 1.7786 15 474.273 432.091 567.1783 44501.5 28.8667 29.0215 14.3603 14.6094 1.90917 227.7199 0.21232 1.777037 15 450.8 437.2 474.3 432.1 567.2 44503 29.1 29.2 14.5 14.7 1.975 221 0.291 0.366 0.212 1.7778 15 448.628 439.707 474.119 567.158 44500 26.52 13.6 224.278 0.302 0.396 0.29 15 474.2 437.1 567.2 44503 29.18 29.24 14.482 14.737 2.038 223.11 0.212 0.37
10 15 448.97 439.64 474.27 432.09 567.19 44502.7 29.09 29.24 14.48 14.74 1.975 222.9 0.3 0.4 0.21 1.7811 15 474.27 432.1 567.2 44500.43 35.19 35.27 14.12 14.38 3.41 220.84 0.21 1.7812 15 474.3 432.1 567.2 44500 29.1 29.2 14.5 14.7 219.2 0.212 1.77713 1514 15 474.27 432.09 567.19 44502.68 14.48 14.74 221.59
Agreed 474.3 432.1 537.2 44503 29.1 29.2 14.5 14.7 2.0 219.2-228.3 0.2 1.8M ean 474.3 432.1 567.2 44502.0 29.0 29.2 14.5 14.6 224.1
2SDev 0.0 0.0 0.0 2.3 0.2 0.2 0.1 0.6 8.1Uncertainty 0.0 0.0 0.0 0.0 0.8 0.6 0.8 4.4 3.6
Lab ID Data set ID Rp0.1 Rp0.2 ReH ReL Rm Fm A At Ag Agt Ae E A0.1 A0.2 AeH AeL1 17 244.41 260.83 575.72 45279.9 51.1 51.32 38.29 38.59 193 0.23 0.342 17 246.44 261.98 575.72 45280.268 47.1 37.95 38.59 173.141 0.23 0.343 17 240.34 259.04 575.72 45280.268 47.1 38.04 38.59 200 0.21 0.324 17 244.5 260.9 575.7 45279.88 51.3 51.5 38.3 38.6 192 0.2 0.35 17 244.475 260.865 575.7 45280 51.1 51.324 38.3 38.6 192.184 0.227 0.3366 17 244.8312 261.0695 575.6719 45276.5 51.0961 51.3223 38.2194 38.5227 189.7859 0.22743 0.335997 17 247.1 262.9 575.7 45280 51.2 51.5 38.2 38.6 164.3 0.239 0.3518 17 247.298 263.191 575.97 575.97 45300 51.28 38.08 165.985 0.242 0.352 3.8089 17 244.7 261 575.7 45280 51.2 51.47 38.288 38.59 190.12 0.226 0.334
10 17 244.47 260.86 575.72 45279.9 51.1 51.32 38.29 38.59 192.1 0.23 0.3311 17 247.7 260.1 575.7 45275.65 50.98 51.25 38.11 38.46 202.32 0.25 0.3312 17 244.5 260.9 575.7 45280 51.3 51.5 38.3 38.6 192 0.226 0.33413 17 245 261 576 45278 51.3 51.6 38.4 38.7 191.8 0.23 0.3314 17 244.79 261.05 575.72 45279.88 38.29 38.59 189.87
Agreed 242.7-244.9 259.9-261.1 575.7 452780 51.1 51.3 38.3 38.6 189.8-202.3 0.23 0.34M ean 244.6 260.9 575.7 45279.2 51.2 51.4 38.3 38.6 193.2
2SDev 0.4 0.6 0.2 3.1 0.2 0.2 0.1 0.1 8.2Uncertainty 0.2 0.2 0.0 0.0 0.4 0.5 0.3 0.2 4.3
S355 Structural steel, 50 Hz P1M 24-1
P1M 24-1S355 Structural steel, 5 Hz
S1C 20-1316L Stainless Steel, 50 Hz
Page 59 of 68

NPL Report DEPC MPE 015
Table B2 (contd): Summary of analysis returns (contd)
Lab ID Data set ID Rp0.1 Rp0.2 ReH ReL Rm Fm A At Ag Agt Ae E A0.1 A0.2 AeH AeL1 19 243.51 260.73 575.67 45276.4 50.97 51.2 38.2 38.5 191 0.23 0.342 19 247.9 263.37 575.67 45276.336 51.2 37.88 38.5 176.885 0.25 0.363 19 247.9 263.37 575.67 45276.336 51.2 37.95 38.5 200 0.25 0.364 19 243.6 260.8 575.7 45276.45 51 51.2 38.2 38.5 191 0.2 0.35 19 243.514 260.736 575.7 45276 50.974 51.203 38.2 38.5 191.121 0.227 0.3366 19 243.7511 260.8933 575.6683 45276.2 50.9699 51.2015 38.2206 38.5248 189.2167 0.22716 0.336227 19 247.9 263.4 575.7 45276 50.9 51.2 38.1 38.5 158.1 0.248 0.3568 19 246.663 262.556 575.97 575.97 45300 49.28 38.08 166.932 0.242 0.352 3.8089 19 245.8 262.2 575.7 45276 51.04 51.201 38.197 38.5 190.12 0.226 0.335
10 19 243.3 260.59 575.67 45276.5 50.97 51.2 38.19 38.5 193.2 0.22 0.3311 19 247.3 260.1 575.7 45275.56 50.94 51.2 37.97 38.32 202.14 0.25 0.3312 19 243.5 260.7 575.7 45280 51 51.2 38.2 38.5 191.4 0.226 0.33513 1914 19 244.59 261.46 575.67 45276.45 38.19 38.50 181.37
Agreed 242.1-243.8 259.8-260.9 575.7 45276 51.0 51.2 38.2 38.5 190.12-202.1 0.24 0.34M ean 243.7 260.8 575.7 45276.5 51.0 51.0 38.1 38.5 193.2
2SDev 0.8 0.7 0.0 2.3 0.1 1.1 0.2 0.2 9.2Uncertainty 0.3 0.3 0.0 0.0 0.2 2.2 0.6 0.6 4.8
Lab ID Data set ID Rp0.1 Rp0.2 ReH ReL Rm Fm A At Ag Agt Ae E A0.1 A0.2 AeH AeL1 22 525.9 562.94 596.71 2368.9 0.88 1.17 0.61 0.91 199 0.36 0.482 22 524.51 562.32 596.71 2368.9387 1.16 0.59 0.9 198.997 0.35 0.473 22 523.55 561.99 596.71 2368.9387 1.16 0.59 0.9 200 0.35 0.474 22 524.5 562.3 596.7 2368.9487 0.9 1.2 0.6 0.9 201 0.4 0.55 22 521.584 561.288 596.7 2368.9 0.887 1.17 0.6 0.9 205.245 0.354 0.4736 22 522.6205 561.736 596.5859 2368.4 0.8673 1.1552 0.6201 0.9128 203.8441 0.34892 0.468117 22 523.9 568.7 596.7 2369 0.83 1.16 0.55 0.9 171.2 0.351 0.5088 22 525.818 562.972 596.977 596.977 2370 1.155 8.9 200.558 0.355 0.474 0.899 22 526.1 563 596.7 2369 0.8813 1.163 0.597 0.898 198.68 0.3563 0.475
10 22 525.53 562.66 596.71 2368.95 0.8738 1.163 0.5984 0.8974 199.6 0.35 0.4711 22 541.8 560.8 596.2 2367.04 0.83 1.15 0.52 0.84 207.26 0.39 0.4612 22 524.5 562.3 596.7 2369 0.9 1.2 0.6 0.9 200.9 0.353 0.47213 22 522 562 596 2366 1 1 0.5 1 204 0.36 0.4614 22 526.59 563.16 596.71 2368.95 0.60 0.91 197.90
Agreed 519.3-526.1 560.5-563.0 596.7 2369 0.9 1.2 0.6 0.9 198.7-207.3 0.36 0.47M ean 524.4 562.3 596.7 2369.0 0.9 1.2 0.6 0.9 201.3
2SDev 3.2 1.4 0.0 0.7 0.0 0.0 0.0 0.0 5.8Uncertainty 0.6 0.3 0.0 0.0 2.5 2.8 1.4 1.1 2.9
SO LLAC F72-No7-2Lab ID Data set ID Rp0.1 Rp0.2 ReH ReL Rm Fm A At Ag Agt Ae E A0.1 A0.2 AeH AeL
1 24 531.78 565.11 596.63 2368.6 0.87 1.17 0.64 0.95 190 0.38 0.52 24 526.26 563.32 596.63 2368.6211 1.16 0.64 0.94 199.085 0.36 0.483 24 526.26 563.32 596.63 2368.6211 1.16 0.64 0.94 200 0.36 0.484 24 524.5 562.4 596.6 2368.6292 0.9 1.2 0.7 0.9 201 0.4 0.55 24 521.779 561.393 596.6 2368.6 0.886 1.17 0.7 0.9 204.917 0.355 0.4746 24 522.4589 561.6346 596.632 2368.6 0.8778 1.1629 0.6482 0.9406 204.0549 0.34862 0.467827 24 540.1 568.7 596.6 2369 0.82 1.16 0.59 0.94 170.5 0.389 0.5088 24 526.448 562.972 596.347 596.347 2367.5 0.94 0.873 200.449 0.3563 0.474 0.87259 24 525.4 562.7 596.6 2369 0.8788 1.163 0.642 0.941 199.59 0.355 0.4738
10 24 524.29 562.31 596.63 2368.63 1.163 0.644 0.9406 201.2 0.36 0.4811 24 541.5 569 0.85 1.16 0.02 170.3 0.39 0.5112 24 524.9 562.5 596.6 2369 0.8 1.1 0.7 0.9 200.4 0.354 0.47213 2414 24 527.92 563.68 596.63 2368.63 195.82
Agreed 521.3-533.2 561.2-565.6 596.6 2369 0.9 1.2 0.6 0.9 190.0-204.9 0.36 0.47M ean 525.6 562.8 596.6 2368.7 0.9 1.2 0.6 0.9 199.7
2SDev 5.4 2.0 0.0 0.4 0.0 0.0 0.0 0.0 8.0Uncertainty 1.0 0.4 0.0 0.0 1.5 0.7 1.0 4.4 4.0
T in Coated packaging steel, 5Hz
S1C 20-1316L Stainless Steel, 5Hz
Tin coated packaging steel, 50Hz SO LLAC F72-No7-2
Page 60 of 68

NPL Report DEPC MPE 015
Table B2 (contd): Summary of analysis returns (contd) SO LLAC T462 No6-2
Lab ID Data set ID Rp0.1 Rp0.2 ReH ReL Rm Fm A At Ag Agt Ae E A0.1 A0.2 AeH AeL1 26 511.78 511.82 556.73 504.91 512.11 2527.6 2.84 3.06 0.17 0.27 0.06 203 0.35 0.45 0.27 0.332 26 556.73 504.91 510.49 2317.6246 3.04 0.76 1.02 0.42 202.4313 26 553.73 504.91 510.49 2317.6246 3.04 0.76 1.02 0.42 2004 26 556.7 504.9 510.6 2318.1238 2.8 3.1 0.7 0.9 0.5 203 0.3 0.35 26 556.732 504.908 556.7 2527.6 2.84 3.059 0.269 0.084 206.29 0.269 0.3296 26 556.5259 2526.6 2.8159 3.0493 -0.008 0.2656 203.41817 26 511.8 511.8 556.7 504.9 512.1 2325 3.05 3.05 0.16 0.41 0.06 203.3 0.345 0.445 0.266 0.3258 26 511.894 511.894 554.185 554.185 2516 30.47 3.047 201.458 0.3475 0.4475 0.26259 26 556.6 504.4 556.7 2528 2.8375 3.055 -0.008 0.265 0.085 203.54 0.265 0.3225
10 26 511.79 511.7 556.59 504.91 512.11 2324.97 2.832 3.055 0.1596 0.4119 0.1257 203 0.35 0.45 0.27 0.32511 26 556.73 505.7 549.3 2493.91 2.82 3.05 0 0.26 208.44 0.27 0.3112 26 556.7 504.9 556.7 2528 2.8 3.1 0 0.3 203.1 0.266 0.32513 2614 26 556.73 499.94 556.73 2527.56 2.84 3.06 0.25 0.50 204.12
Agreed 556.7 504.9 510.5 2325.0 or 2.8 3.1 201.5-208.4 0.27 0.33M ean 556.7 504.9 517.8 2444.5 2.8 3.1 0.3 0.7 203.8
2SDev 0.1 0.0 34.4 204.7 0.1 0.0 0.6 1.5 3.7Uncertainty 0.0 0.0 6.6 8.4 5.1 1.3 193.9 223.0 1.8
SO LLAC T462 No6-2Lab ID Data set ID Rp0.1 Rp0.2 ReH ReL Rm Fm A At Ag Agt Ae E A0.1 A0.2 AeH AeL
1 28 511.44 511.83 556.2 505.01 511.94 2324.2 2.82 3.05 0.18 0.43 0.06 204 0.35 0.45 0.27 0.332 28 556.2 505.01 510.36 2317.0344 3.05 0.81 1.07 0.39 203.0913 28 556.2 505.01 510.36 2317.0344 3.05 0.81 1.07 0.39 2004 28 556.2 505 510.4 2317.3157 2.8 3 0.6 0.9 0.6 202 0.3 0.35 28 556.828 505.009 556.2 2155.2 2.817 3.05 0.27 0.084 205.637 0.27 0.3296 28 550.6837 2500.1 2.8098 3.0457 -0.0061 0.2646 203.44357 28 511.8 511.8 556.2 505 511.9 2324 2.81 3.05 0.17 0.42 0.059 203.3 0.345 0.445 0.265 0.3258 28 511.894 511.894 551.541 551.541 2504 0.2625 0.2625 201.177 0.34875 0.44875 0.26259 28 555.8 504.9 556.2 2525 2.825 3.046 -0.009 0.265 0.08625 203.04 0.265 0.3225
10 28 511.75 511.84 556.2 505.01 511.94 2324.2 2.783 3.023 0.1677 0.4195 0.0591 203.3 0.35 0.45 0.27 0.32511 28 556.2 505 510.8 2319.04 2.82 3.05 0 0.24 202.54 0.27 0.3212 28 556.2 505 556.2 2525 2.8 3 0 0.3 203.1 0.265 0.32513 2814 28 556.2 505.01 556.20 2525.16 0.63 0.88 204.32
Agreed 556.2 505.0 2.8 3.1 201.2-205.6 0.27 0.33M ean 556.2 505.0 531.1 2382.9 2.8 2.8 0.4 0.5 203.2
2SDev 0.0 0.1 45.2 236.8 0.0 1.6 0.7 0.7 2.2Uncertainty 0.0 0.0 8.5 9.9 0.9 57.1 179.1 125.6 1.1
TKS-DX56 No 2-2Lab ID Data set ID Rp0.1 Rp0.2 ReH ReL Rm Fm A At Ag Agt Ae E A0.1 A0.2 AeH AeL
1 30 156.88 162.46 301.46 4271.7 39.95 40.01 22.46 22.6 224 0.17 0.272 30 157.3 162.78 301.46 4271.6882 40.32 22.36 22.6 195.042 0.17 0.283 30 157.12 162.66 301.46 4271.6882 40.32 22.37 22.6 200 0.17 0.274 30 157.3 162.8 301.5 4271.6875 40.1 40.1 22.5 22.6 202 0.2 0.35 30 157.295 162.748 301.5 4271.7 39.992 40.057 22.5 22.6 204.715 0.177 0.2796 30 157.3509 162.7984 301.3309 4269.9 39.4301 39.5411 22.5778 22.7265 202.6761 0.17292 0.275617 30 158 163.1 301.5 4272 40.3 40.3 22.4 22.6 172.6 0.181 0.2858 30 158.08 163.02 301.34 301.34 4270 39.35 21.15 183.196 0.18 0.2825 21.159 30 157.5 162.9 301.5 4272 40.125 40.316 22.442 22.596 195.75 0.175 0.2775
10 30 157.35 162.8 301.46 4271.69 40.05 40.11 22.44 22.6 203.2 0.17 0.2811 30 158 162.7 301.2 4268.65 39.86 39.94 22.77 22.94 207.41 0.18 0.2712 30 157.4 162.8 301.5 4272 40.1 40.1 22.5 22.6 201 0.173 0.27613 30 157 163 301 4272 40.5 40.5 22.5 22.5 195 0.17 0.2714 30 157.40 162.84 301.46 4271.69 22.45 22.60 199.76
Agreed 157.2-157.6 162.7-162.9 301.5 4272 39.9-40.1 40.1 22.5 22.6 195-207.4 0.17 0.28M ean 157.5 162.8 301.5 4271.8 40.1 40.2 22.4 22.6 200.6
2SDev 0.6 0.3 0.0 0.3 0.4 0.3 0.1 0.1 8.1Uncertainty 0.4 0.2 0.0 0.0 0.9 0.9 0.5 0.3 4.0
Sheet steel, 50 Hz
Sheet steel, 5Hz
Sheet steel, 50 Hz
Page 61 of 68
NPL Report DEPC MPE 015
Table B2 (contd): Summary of analysis returns (contd)
TKS-DX56 No 2-2Lab ID Data set ID Rp0.1 Rp0.2 ReH ReL Rm Fm A At Ag Agt Ae E A0.1 A0.2 AeH AeL
1 32 157.09 162.61 301.39 4270.7 39.29 39.41 22.15 22.29 210 0.17 0.282 32 158.34 162.85 301.39 4270.6963 40.11 22.06 22.29 193.603 0.19 0.283 32 157.12 162.85 301.39 4270.6963 40.11 22.06 22.29 200 0.17 0.284 32 157.3 162.7 301.4 4270.688 40.1 40.1 22.1 22.3 201 0.2 0.35 32 157.252 162.676 301.4 4270.7 39.291 39.407 22.1 22.3 204.109 0.177 0.286 32 157.0911 162.6092 301.3267 4269.8 39.2898 39.4024 22.7824 22.9261 209.784 0.17052 0.273157 32 158.3 162.8 301.4 4271 40 40.1 22.1 22.3 168.6 0.186 0.288 32 157.727 163.02 301.34 301.34 4270 38.15 21 184.486 0.18 0.2825 219 32 157.5 162.8 301.4 4271 40.125 40.112 22.133 22.29 191.23 0.1763 0.2788
10 32 157.38 162.73 301.39 4270.69 39.64 39.74 22.13 22.29 198.4 0.18 0.2811 32 158 162.6 301.3 4269.13 40.05 40.11 22.66 22.83 205.85 0.18 0.2712 32 157.3 162.7 301.4 4271 39.3 39.4 22.1 22.3 200.9 0.173 0.27613 3214 32 157.35 162.72 301.39 4270.69 39.29 39.41 22.14 22.29 199.55
Agreed 157.3-157.6 162.6-162.8 301.4 4271 39.2-40.1 39.4 22.1 22.3 191.2-210.0 0.17 0.28M ean 157.4 162.7 301.4 4270.7 39.6 39.7 22.2 22.3 201.3
2SDev 0.6 0.2 0.1 0.6 0.8 1.1 0.5 0.9 11.8Uncertainty 0.4 0.1 0.0 0.0 2.0 2.8 2.2 4.0 5.9
TKS-ZStE-180-No1-2 Com m entLab ID Data set ID Rp0.1 Rp0.2 ReH ReL Rm Fm A At Ag Agt Ae E A0.1 A0.2 AeH AeL
1 34 243.26 244.19 270.18 236.69 318.23 6161 38.26 38.33 17.98 18.13 1.87 206 0.22 0.32 0.14 0.142 34 270.18 236.69 318.23 6160.9328 38.65 17.91 18.13 1.96 205.5063 34 270.18 236.69 318.23 6160.9328 38.65 17.91 18.13 1.96 2004 34 270.2 236.7 318.2 6160.9912 38.4 38.4 18 18.1 2.1 206 0.1 0.15 34 270.18 242.942 318.2 6161 38.377 38.436 18 18.1 2.045 209.936 0.136 0.6796 34 270.18 240.38 318.1121 6158.6 37.6446 37.7596 18.1445 18.2984 2.01176 206.7021 0.13295 2.0067 34 243.3 244.2 270.2 236.7 318.2 6161 38.6 38.7 18 18.1 1.985 206.8 0.213 0.313 0.133 0.1378 34 243.285 244.059 263.429 318.052 6157.5 37.75 16.7 206.218 0.215 0.316 19 34 270.1 237 318.2 6161 38.6625 38.651 17.976 18.129 0.08375 207.91 0.1325 0.13875
10 34 243.38 244.35 270.18 236.69 318.23 6160.99 28.49 38.53 17.98 18.13 1.873 206.7 0.22 0.32 0.13 0.13711 34 270.18 236.7 318.2 6160.58 38.22 38.29 18.29 18.44 3.09 210.58 18.13 0.1412 34 270.2 240.4 318.2 6161 38.4 38.4 18 18.1 206.5 0.133 2.00613 34 270 241 318 6161 38.5 38.5 18 18 2.02 206.5 0.13 2.0314 34 270.18 236.69 318.23 6160.99 38.38 38.44 17.98 18.13 205.94
Agreed 270.2 236.7 318.2 6161 38.2-38.5 38.65 18 18.1 1.87 205.5-210.6 0.13 0.14M ean 270.2 236.7 318.2 6161.0 38.4 38.4 18.0 18.1 206.5
2SDev 0.1 0.2 0.1 0.2 0.3 0.5 0.2 0.2 4.8Uncertainty 0.0 0.1 0.0 0.0 0.8 1.3 1.1 1.2 2.3
TKS-ZStE-180-No1-2 Com m entLab ID Data set ID Rp0.1 Rp0.2 ReH ReL Rm Fm A At Ag Agt Ae E A0.1 A0.2 AeH AeL
1 36 243.18 244.32 270 236.85 318.19 6160.1 37.56 37.68 18.93 19.08 1.87 206 0.22 0.32 0.14 0.142 36 270 236.85 318.19 6160.1584 38.37 18.86 19.08 1.87 206.5733 36 270 236.85 318.19 6160.1584 38.37 18.85 19.08 1.87 2004 36 270 236.8 318.2 6160.1309 37.6 37.7 18.9 19.1 2.1 206 0.1 0.15 36 270.003 242.919 318.2 6160 37.563 37.679 18.9 19.1 2.067 209.24 0.135 1.4326 36 270.003 240.38 318.1119 6158.6 37.5588 37.6763 18.2742 18.4281 2.01401 206.7711 0.13205 2.0067 36 243.2 244.7 270 236.8 318.2 6160 38.3 38.4 18.9 19.1 1.874 206.7 0.211 0.327 0.132 0.1398 36 243.285 244.447 263.429 318.052 6157.5 36.4 16.35 206.246 0.2162 0.316 19 36 270.1 237 318.2 6160 38.3625 38.369 18.924 19.078 0.08375 206.93 0.13125 0.13875
10 36 243.22 244.44 270 236.85 318.19 6160.13 37.92 38.01 18.92 19.08 1.874 206.5 0.22 0.32 0.13 0.13911 36 270 236.8 318.2 6159.52 38.31 38.37 18.2 18.35 2.52 206.4 0.13 0.1412 36 270 240.4 318.2 6160 37.6 37.7 18.9 19.1 207 0.132 2.00613 3614 36 270 236.85 318.19 6160.13 37.56 37.68 18.93 19.08 206.96
Agreed 270.0 318.2 6160 37.6 38.4 18.9 19.1 1.87 206.0-209.2M ean 270.0 236.9 318.2 6160.0 37.8 37.9 18.9 19.1 206.3
2SDev 0.1 0.1 0.0 0.4 0.7 1.1 0.1 0.0 4.1Uncertainty 0.0 0.1 0.0 0.0 1.9 2.9 0.3 0.1 2.0
Sheet steel, 50 Hz
Sheet steel, 5Hz
Sheet steel, 5Hz
Page 62 of 68

NPL Report DEPC MPE 015
Table B2 (contd): Summary of analysis returns (contd)VAW -hard AA5182-No3-2
Lab ID Data set ID Rp0.1 Rp0.2 ReH ReL Rm Fm A At Ag Agt Ae E A0.1 A0.2 AeH AeL1 38 385.51 396.53 434.31 2006.5 4.73 5.35 4.32 4.95 69 0.66 0.772 38 384.59 396.14 434.31 2006.5122 5.48 4.94 68.826 0.65 0.763 38 382.78 395.44 395.44 1826.9328 5.48 4.94 70 0.63 0.754 38 385.3 396.4 434.3 2006.533 4.7 5.3 4.3 4.9 69 0.7 0.85 38 385.219 396.397 434.3 2006.5 4.732 5.354 4.3 4.9 69.32 0.656 0.7726 38 385.6295 396.5263 434.3145 2006.5 4.7184 5.3727 4.3091 4.9386 68.9826 0.65209 0.767887 38 386.3 396.8 434.3 2007 5.5 5.5 4.3 4.9 68.1 0.657 0.7738 38 385.822 396.645 433.441 433.441 2002.5 5.343 5.3437 68.903 0.654 0.77 4.92379 38 385.6 396.5 434.3 2007 4.7375 5.475 4.309 4.939 68.98 0.6538 0.7688
10 38 385.59 396.52 434.31 2006.53 4.628 5.251 4.309 4.939 69.03 0.66 0.7811 38 386.2 396.8 404.11 398.2 428 1977.21 4.69 5.31 4.31 4.93 4.03 68.26 0.66 0.77 0.85 0.8612 38 385.4 396.5 404.1 398.3 434.3 2007 4.7 5.4 4.3 4.9 69.2 0.651 0.767 0.854 1.62913 38 385 397 435 2000 5 5 4 5 69 0.6 0.714 38 386.29 396.84 404.11 398.03 434.31 2006.53 4.72 5.36 0.27 0.86 68.16
Agreed 385.2-386.8 396.4-397.1 434.3 2007 4.7 5.4 4.3 4.9 68.1-69.3 0.66 0.77M ean 385.7 396.6 434.3 2006.7 4.7 5.4 4.3 4.9 68.9
2SDev 0.8 0.4 0.0 0.5 0.1 0.3 0.0 0.0 1.0Uncertainty 0.2 0.1 0.0 0.0 1.4 4.8 0.3 0.8 1.4
VAW -hard AA5182-No3-2Lab ID Data set ID Rp0.1 Rp0.2 ReH ReL Rm Fm A At Ag Agt Ae E A0.1 A0.2 AeH AeL
1 40 385.52 396.48 432.13 1996.4 4.7 5.32 4.32 4.94 69 0.66 0.772 40 384.59 396.34 432.13 1996.4406 5.31 4.25 4.94 68.804 0.65 0.773 40 382.98 395.57 432.13 1996.4406 5.31 4.26 4.94 70 0.63 0.754 40 385.2 396.4 432.1 1996.4277 4.7 5.3 4.3 4.9 69 0.7 0.85 40 385.217 396.38 432.1 1996.4 4.698 5.321 4.3 4.9 69.313 0.656 0.7726 40 385.6349 396.5204 432.1272 1996.4 4.6887 5.3141 4.3098 4.9362 68.9801 0.65211 0.767897 40 386.2 396.7 432.1 1996 4.7 5.3 4.3 4.9 68.1 0.656 0.778 40 385.281 396.536 432 432.034 1996 4.94 0.494 69.333 0.651 0.7675 4.93759 40 385.7 396.5 432.1 1996 4.7 5.314 4.309 4.936 68.9 0.6525 0.7688
10 40 385.49 396.47 432.13 1996.4 4.69 5.314 4.311 4.936 69.12 0.65 0.7711 40 386.3 396.8 399.2 1844.26 4.69 5.31 1.33 1.91 68.26 0.66 0.7712 40 385.6 396.5 400.7 432.1 1996 4.7 5.3 4.3 4.9 69 0.652 0.768 0.836 1.67413 40 385 397 69 0.65 0.7514 40 386.42 396.85 400.66 398.03 432.13 1996.43 68.04
Agreed 385.2-386.8 396.4-397.1 432.1 1996 4.7 5.3 4.3 4.9 68.1-69.3 0.66 0.77M ean 385.7 396.6 432.1 1996.3 4.7 5.3 4.3 4.9 68.9
2SDev 0.9 0.4 0.1 0.4 0.0 0.2 0.0 0.0 1.0Uncertainty 0.2 0.1 0.0 0.0 0.2 4.1 1.1 0.8 1.5
VAW -soft AA1050 No 5-2Lab ID Data set ID Rp0.1 Rp0.2 ReH ReL Rm Fm A At Ag Agt Ae E A0.1 A0.2 AeH AeL
1 42 26.48 30.01 83.56 1210 43.83 43.91 28.56 28.68 72 0.14 0.242 42 26.32 29.94 83.56 1209.9488 44.55 28.45 28.67 63.244 0.13 0.233 42 26.17 29.82 83.56 1209.9488 44.55 28.48 28.67 70 0.12 0.234 42 26.5 30 83.6 1209.9811 44.5 44.5 28.6 28.7 70 0.1 0.25 42 26.607 30.107 83.6 1210 44.472 44.499 28.6 28.7 66.197 0.14 0.2456 42 26.627 30.1215 83.5474 1209.8 43.2319 43.3485 28.1008 28.2282 65.5887 0.1352 0.240537 42 26.7 30.2 83.6 1210 44.5 44.5 28.5 28.7 61.1 0.138 0.2438 42 28.14 31.33 83.563 83.56 1210 44.05 26.45 0.17625 0.289 26.459 42 26.68 30.19 83.91 1210 44.6 44.546 28.55 28.673 68.67 0.1338 0.2388
10 42 26.51 30.04 83.562 1209.98 43.86 43.94 28.55 28.67 70.17 0.14 0.2411 42 31 30 83.5 1209.6 44.4 44.44 27.49 28.25 71.92 0.28 0.2412 42 26.5 30 83.6 1210 44.5 44.6 28.6 28.7 69.8 0.133 0.23813 42 26 30 84 1210 44.5 44.5 29 29.5 71 0.13 0.2314 42 26.63 30.12 83.56 1209.98 43.87 43.94 28.56 28.68 65.22
Agreed 26.48-26.55 30.01-30.05 83.6 1210 44.5 44.6 28.6 28.7 68.7-72.0 0.14 0.24M ean 26.5 30.0 83.6 1209.9 44.5 44.5 28.5 28.7 69.9
2SDev 0.0 0.0 0.1 0.2 0.1 0.3 0.1 0.0 4.1Uncertainty 0.1 0.1 0.1 0.0 0.3 0.7 0.4 0.1 5.8
Alum inium Sheet, 50 Hz
Alum inium Sheet, 5 Hz
Alum inium Sheet, 50 Hz
Page 63 of 68

NPL Report DEPC MPE 015
Table B2 (contd): Summary of analysis returns (contd)VAW -soft AA1050 No 5-2
Lab ID Data set ID Rp0.1 Rp0.2 ReH ReL Rm Fm A At Ag Agt Ae E A0.1 A0.2 AeH AeL1 44 26.5 30.01 83.56 1210 43.28 43.38 28.77 28.89 72 0.14 0.242 44 26.44 30.08 83.56 1209.9488 44.55 28.65 28.88 60.15 0.13 0.243 44 26.44 29.86 83.56 1209.9488 44.55 28.69 28.88 70 0.13 0.234 44 26.5 30 83.6 1209.9622 44.5 44.5 28.8 28.9 70 0.1 0.25 44 26.553 30.055 83.6 1210 43.274 43.383 28.8 28.9 68.953 0.139 0.2446 44 26.601 30.094 83.5472 1209.8 43.0089 43.1269 27.9198 28.0453 66.554 0.13468 0.239937 44 26.8 30.3 83.6 1210 44.5 44.5 28.7 28.9 60.1 0.138 0.2478 44 28.14 31.33 83.563 83.56 1210 42.9 26.4 0.175 0.2875 26.49 44 26.5 30.01 83.56 1210 44.6 44.546 28.768 28.885 71.82 0.1325 0.2375
10 44 26.56 30.08 83.561 1209.96 43.86 43.94 28.76 28.88 67.07 0.14 0.2511 44 31.3 30.1 83.6 1210 44.53 44.55 27.38 28.18 66.97 0.29 0.2412 44 26.6 30.1 83.6 1210 43.9 43.9 28.8 28.9 66.2 0.135 0.2413 4414 44 26.62 30.11 83.56 1209.96 43.56 43.65 28.77 28.89 65.51
Agreed 26.49-26.61 30.00-30.10 83.6 1210 43.38 28.8 28.9 66.2-72.0 0.14 0.24M ean 26.6 30.1 83.6 1210.0 43.9 44.0 28.8 28.9 68.5
2SDev 0.1 0.1 0.0 0.1 1.2 1.2 0.1 0.0 4.7Uncertainty 0.4 0.3 0.0 0.0 2.8 2.8 0.4 0.1 6.9
VAW -soft AA5182 No 4-2 Com m ent Need to apply sm oothing for Ag and Agt onlyLab ID Data set ID Rp0.1 Rp0.2 ReH ReL Rm Fm A At Ag Agt Ae E A0.1 A0.2 AeH AeL
1 46 133.56 134.66 134.4 133.8 284.56 8420.3 22.65 22.97 20.49 20.9 0.55 69 0.29 0.39 0.27 0.442 46 142.16 142.16 284.56 8420.1304 23.16 20.29 20.9 68.1523 46 142.16 142.16 284.56 8420.1304 23.16 20.3 20.9 704 46 133.5 134.7 284.6 8420.2715 22.7 23 20.5 20.9 69 0.3 0.45 46 133.507 134.7 284.6 8420.3 22.436 22.788 20.5 20.9 69.614 0.292 0.3936 46 133.545 134.6632 281.6558 8334.2 22.6445 22.9604 20.8264 21.2336 69.1678 0.28751 0.389127 46 133.7 134.8 284.6 8420 23.2 23.2 20.5 20.9 68.9 0.289 0.3888 46 133.82 134.5 220.682 284.55 8420 22.95 20.9 69.085 0.289 0.39 5.259 46 134.5 133.4 284.6 8420 22.6625 22.964 20.484 20.897 0.63 68.91 0.26875 0.285
10 46 133.45 134.76 284.56 8420.27 22.65 22.96 20.49 20.9 69.5 0.29 0.3911 46 133.6 134.6 280.8 8308.21 22.45 22.8 20.59 20.99 70.02 0.29 0.3912 46 133.4 134.8 284.6 8420 22.7 23 20.5 20.9 69.5 0.286 0.38813 46 134 135 285 8420 23.1 23.2 20.5 20.9 68.7 0.29 0.3914 46 133.58 134.65 284.56 8420.27 0.23 0.42 69.04
Agreed 133.4-133.9 134.5-134.8 284.6 8420 22.6-22.7 23.16 20.5 20.9 68.7-70.0 0.29 0.39M ean 133.6 134.7 284.6 8420.1 22.7 23.0 20.5 20.9 69.3
2SDev 0.3 0.3 0.2 0.3 0.1 0.3 0.2 0.1 0.8Uncertainty 0.3 0.2 0.1 0.0 0.2 1.2 0.9 0.2 1.2
VAW -soft AA5182 No 4-2 Need to apply sm oothing for Ag and Agt onlyLab ID Data set ID Rp0.1 Rp0.2 ReH ReL Rm Fm A At Ag Agt Ae E A0.1 A0.2 AeH AeL
1 48 134.4 134.73 135.41 134.12 282.87 8370.2 22.12 22.51 20.57 20.98 69 0.29 0.39 0.42 0.462 48 143.23 143.23 282.87 8370.1233 22.86 20.37 20.97 68.0433 48 143.23 143.23 282.87 8370.1233 22.86 20.38 20.97 704 48 134.4 134.7 282.9 8370.1768 22.5 22.9 20.6 21 69 0.3 0.45 48 134.375 134.761 282.9 8370.177 21.831 22.229 20.6 21 69.538 0.293 0.3946 48 134.4019 134.7324 282.8718 8370.2 22.5092 22.8555 20.563 20.9718 69.1811 0.28874 0.389217 48 134.5 134.8 282.9 8370 22.5 22.9 20.6 21 68.9 0.293 0.3888 48 134.504 134.842 257.857 282.86 8370 21.975 20.975 68.772 0.29125 0.39125 9.5259 48 134.6 133.6 282.9 8370 22.5125 22.854 20.561 20.97 0.6225 69.03 0.265 0.2775
10 48 134.4 134.73 282.87 8370.18 22.12 22.5 20.56 20.97 69.06 0.29 0.3911 48 134.4 134.8 277.7 8218.34 22.51 22.86 16.86 17.26 69.57 0.29 0.3912 48 134.4 134.7 282.9 8370 21.8 22.2 20.6 21 69.6 0.288 0.38813 4814 48 134.41 134.73 282.87 8370.18 7.56 7.91 69.01
Agreed 134.4-134.5 134.6-134.8 282.9 8370 22.5 22.9 20.6 21.0 68.0-69.6 0.29 0.39M ean 134.4 134.7 282.9 8370.1 22.5 22.9 20.5 21.0 69.1
2SDev 0.1 0.1 0.0 0.2 0.0 0.0 0.2 0.0 1.0Uncertainty 0.1 0.1 0.0 0.0 0.1 0.2 0.9 0.1 1.4
Alum inium Sheet, 5 Hz
Alum inium Sheet, 5 Hz
Alum inium Sheet, 50 Hz
Page 64 of 68

NPL Report DEPC MPE 015
Table B2 (contd): Summary of analysis returns (contd) TKS-DX56-L050-B12-5-Probe 2
Lab ID Data set ID Rp0.1 Rp0.2 ReH ReL Rm Fm A At Ag Agt Ae E A0.1 A0.2 AeH AeL1 50 159.04 163.87 303.88 2665 43.47 43.59 23.94 24.14 155 0.2 0.312 50 158.56 163.98 303.88 2665.0276 44.17 23.84 24.13 163.634 0.19 0.293 50 156.92 163.07 303.88 2665.0276 44.17 23.89 24.13 200 0.17 0.274 50 158.6 164 303.9 2664.9885 43.9 43.9 23.95 24.1 165 0.2 0.35 50 156.513 163.618 303.9 2665 44.121 44.125 24 24.1 177.772 0.189 0.2926 50 158.5616 163.8241 303.7227 2663.6 43.325 43.4462 23.9559 24.1305 174.016 0.1836 0.286627 50 158.5 164.2 303.9 2665 44.2 44.2 23.9 24.1 144.8 0.182 0.2988 50 159.635 164.196 303.762 303.76 2664 43.4 21.7 149.231 0.196 0.3 21.79 50 158.7 163.9 303.9 2665 44.2 44.171 23.938 24.125 162.23 0.188 0.292
10 50 158.61 163.96 303.88 2664.99 43.87 43.92 23.94 24.13 165.5 0.2 0.311 50 159.4 164 303.7 2663.36 43.72 43.8 23.98 24.18 166.46 0.2 0.2912 50 158.6 164 303.9 2665 43.9 43.9 24 24.1 170 0.184 0.28813 50 159 164 304 2700 44 44.1 24 24.1 164 0.19 0.2914 50 158.77 163.88 303.88 2664.99 43.53 43.66 23.91 24.15 160.39
Agreed 158.6-158.7 163.9-164.0 303.9 2665 43.4-43.9 44.17 23.9 24.1 162.2-165.3 0.19 0.3M ean 158.7 164.0 303.9 2665.0 43.8 43.9 23.9 24.1 164.7
2SDev 0.7 0.1 0.1 0.0 0.6 0.6 0.1 0.0 5.8Uncertainty 0.5 0.1 0.0 0.0 1.4 1.3 0.4 0.2 3.5
TKS-DX56-L050-B12-5-Probe 2Lab ID Data set ID Rp0.1 Rp0.2 ReH ReL Rm Fm A At Ag Agt Ae E A0.1 A0.2 AeH AeL
1 52 158.87 163.87 303.86 2664.9 43.06 43.2 24.45 24.64 163 0.2 0.32 52 159.39 164.28 303.86 2664.8522 44.14 24.34 24.63 162.69 0.2 0.33 52 156.92 163.07 303.86 2664.8522 44.14 24.39 24.63 200 0.17 0.274 52 158.8 163.8 303.9 2664.8525 43.4 43.5 24.5 24.6 166 0.2 0.35 52 158.608 163.688 303.9 2664.9 43.064 43.197 24.5 24.6 174.067 0.191 0.2946 52 158.0251 163.4442 303.7284 2663.7 43.0665 43.1897 23.8621 24.0232 188.5495 0.17728 0.280167 52 159.4 164.3 303.9 2665 44.1 44.1 24.4 24.6 145.2 0.195 0.38 52 159.179 164.196 303.762 303.76 2664 0.422 22.25 148.621 0.196 0.3 22.259 52 158.9 163.9 303.9 2665 43.36 44.144 24.438 24.627 161.25 0.188 0.292
10 52 158.8 163.82 303.86 2664.85 43.35 43.48 24.44 24.63 165.1 0.2 0.311 52 159.4 163.8 303.6 2662.94 44.15 44.14 23.89 24.09 165.28 0.2 0.2912 52 158.8 163.8 303.9 2665 43.4 43.5 24.5 24.6 167 0.186 0.28913 5214 52 159.12 164.04 303.86 2664.85 24.41 24.65 154.36
Agreed 158.5-158.9 163.6-163.9 303.9 2665 43.0-43.4 44.14 24.5 24.6 161.3-174.1 0.2 0.3M ean 158.8 163.8 303.9 2664.7 43.2 44.1 24.4 24.6 164.3
2SDev 0.2 0.1 0.0 0.8 0.3 0.0 0.1 0.4 10.5Uncertainty 0.1 0.1 0.0 0.0 0.8 0.1 0.4 1.5 6.4
TKS-ZStE-180-L050-B12-5-Probe 1 Com m entLab ID Data set ID Rp0.1 Rp0.2 ReH ReL Rm Fm A At Ag Agt Ae E A0.1 A0.2 AeH AeL
1 53 246.82 230.1 270.06 231.94 318.86 3781.6 40.37 40.39 18.93 19.09 1.74 204 0.22 0.31 0.16 1.892 53 270.06 228.66 318.86 3781.6796 40.82 18.86 19.08 1.93 198.6533 53 270.06 228.66 318.86 3781.6796 40.82 18.86 19.08 1.93 2004 53 270.1 228.7 318.9 3781.6375 40.8 40.8 18.9 19.1 1.8 204 0.2 0.35 53 270.064 233.633 318.9 3781.6 38.164 38.261 18.9 19.1 1.781 206.201 0.155 1.4976 53 270.064 231.937 318.713 3779.9 37.9818 38.0947 18.6555 18.8118 1.65386 203.9792 0.15 1.88887 53 247.4 230.2 270.1 228.7 318.9 3782 40.8 40.8 18.9 19.1 1.801 203.8 0.214 0.309 0.15 0.2778 53 245.53 230.016 265.767 318.718 3780 38.1 16.65 203.73 0.218 0.31 0.159 53 270.6 228.2 318.9 3782 40.86 40.821 18.925 19.083 1.842 200.75 0.15 0.276
10 53 245.02 230.34 270.06 228.66 318.86 3781.64 38.07 38.17 18.93 19.08 1.739 204.2 0.22 0.31 0.15 0.27711 53 246.9 230 270.06 231.9 318.6 3779.01 40.71 40.71 18.65 18.8 2.97 208.94 0.22 0.31 0.15 1.8912 53 270.1 231.9 318.9 3782 40.8 40.8 18.9 19.1 204 0.15 1.88913 53 270 232 319 3782 40.5 40.5 19 19 1.76 204 0.15 1.9114 53 270.06 228.66 318.86 3781.64 18.93 19.09 204.04
Agreed 270.1 231.9 318.9 3782 40.3-40.8 40.82 18.9 19.1 1.74-1.8 198.7-208.9M ean 270.1 231.9 318.9 3781.8 40.7 40.7 18.9 19.1 203.6
2SDev 0.1 0.1 0.1 0.4 0.4 0.3 0.2 0.1 5.0Uncertainty 0.0 0.0 0.0 0.0 0.9 0.8 0.9 0.3 2.5
Sheet steel, 5 Hz
Sheet steel, 50 Hz
Sheet steel, 50 Hz
Page 65 of 68

NPL Report DEPC MPE 015
Table B2 (contd): Summary of analysis returns (contd) TKS-ZStE-180-L050-B12-5-Probe 1
Lab ID Data set ID Rp0.1 Rp0.2 ReH ReL Rm Fm A At Ag Agt Ae E A0.1 A0.2 AeH AeL1 55 246.97 229.93 270.05 232.02 318.79 3780.9 37.68 37.8 19.09 19.25 1.74 204 0.22 0.31 0.15 1.92 55 270.05 228.85 318.79 3780.8494 40.74 19.02 19.24 1.68 201.6333 55 270.05 228.85 318.79 3780.8494 40.74 19.02 19.24 1.68 2004 55 270 228.8 318.8 3780.8816 40.7 40.7 19.1 19.3 1.8 203 0.2 0.35 55 270.046 233.779 318.8 3780.9 37.958 38.071 19.1 19.2 1.783 205.399 0.153 1.4566 55 270.046 232.017 318.7166 3780 37.678 37.7986 18.5419 18.6983 1.63965 203.8014 0.14784 1.890727 55 247.4 231.2 270 228.8 318.8 3781 40.7 40.7 19.1 19.2 1.743 203.8 0.214 0.336 0.148 0.2828 55 246.543 230.016 270.151 318.718 3780 36.3 16.9 206.633 0.218 0.31 0.159 55 270.6 229.3 318.8 3781 40.78 40.738 19.087 19.244 1.844 203.66 0.15 0.282
10 55 245.88 230.13 270.05 228.85 318.79 3780.88 37.95 38.07 19.09 19.24 1.743 205 0.22 0.31 0.15 0.28211 55 247 229.8 270.05 232.1 318.6 3778.47 40.74 40.74 18.56 18.71 1.72 210.51 0.22 0.31 0.15 1.8712 55 270 232 318.8 3781 40.4 40.5 19.1 19.2 204 0.148 1.89113 5514 55 270.05 228.85 318.79 3780.88 37.96 38.07 19.09 19.25 203.27
Agreed 270.1 228.85 318.8 3781 40.74 19.1 19.25 1.74 201.6-210.5M ean 270.0 232.0 318.8 3780.8 39.3 39.3 19.1 19.0 204.2
2SDev 0.1 0.1 0.1 0.7 3.0 3.2 0.1 1.3 5.0Uncertainty 0.0 0.0 0.0 0.0 7.6 8.3 0.3 6.9 2.4
NPL Zero NoiseLab ID Data set ID Rp0.1 Rp0.2 ReH ReL Rm Fm A At Ag Agt Ae E A0.1 A0.2 AeH AeL
1 57 432.42 434.27 738.48 58000 49.97 50.24 39.64 40 207 0.31 0.412 57 432.43 434.39 738.48 58000.219 50.24 39.3 40 207.5 0.31 0.423 57 432.71 434.39 738.48 58000.219 50.24 39.27 40 200 0.32 0.424 57 432.4 434.3 738.5 58000 50 50.2 39.6 40 208 0.3 0.45 57 432.418 434.273 738.5 58000 49.937 50.211 39.6 40 207.5 0.308 0.4096 57 432.4175 434.2726 738.4789 58000.1 49.9681 50.2413 39.6308 39.9867 207.5 0.30839 0.409297 57 432.4 434.4 738.5 58000 50 50.2 39.6 40 207.5 0.309 0.4168 57 432.58 434.49 738.158 738.158 57975 50.16 37.44 207.461 0.31 0.412 37.449 57 432.4 434.3 738.5 58000 50.02 50.241 39.638 39.996 206.69 0.308 0.41
10 57 432.42 434.27 738.48 58000 49.97 50.24 39.64 40 207.5 0.31 0.4111 5712 57 432.4 434.3 738.5 58000 50 50.2 39.6 40 207.5 0.308 0.40913 57 432 434 738 58000 49.9 50.2 39.6 39.9 207.5 0.31 0.4114 57 432.42 434.27 738.48 58000.00 39.64 40.00 207.50
Agreed 432.4 434.3 738.5 58000 50 50.2 39.6 40 207.5-208.0 0.31 0.41M ean 432.4 434.3 738.4 58000.0 50.0 50.2 39.6 40.0 207.4
2SDev 0.2 0.2 0.3 0.2 0.1 0.0 0.2 0.1 0.6Uncertainty 0.1 0.0 0.0 0.0 0.1 0.1 0.5 0.1 0.3
NPL Zero NoiseLab ID Data set ID Rp0.1 Rp0.2 ReH ReL Rm Fm A At Ag Agt Ae E A0.1 A0.2 AeH AeL
1 58 440.16 442.01 738.48 57999.9 49.83 50.1 39.56 39.92 208 0.31 0.412 58 441.78 444.56 738.48 58000.219 50.1 39.23 39.92 207.5 0.4 0.553 58 441.78 444.56 738.48 58000.219 50.1 39.2 39.92 200 0.4 0.554 58 440.2 442 738.5 57999.948 49.8 50.1 39.6 39.9 208 0.3 0.45 58 440.156 442.012 738.5 58000 49.522 49.801 39.6 39.9 207.5 0.312 0.4136 58 440.1561 442.012 738.5572 58006.3 49.8296 50.1045 39.3725 39.7284 207.5001 0.31212 0.413027 58 441.8 444.6 738.5 58000 49.8 50.1 39.6 39.9 207.5 0.401 0.5538 58 440.22 442.13 738.158 738.15 57975 49.92 37.36 207.443 0.314 0.416 37.369 58 738.5 58000 49.94 50.097 39.559 39.913 208.73 0.312 0.412
10 58 440.16 442.01 738.48 57999.9 49.83 50.1 39.56 39.92 207.5 0.31 0.4111 5812 58 440.2 442 738.5 58000 49.8 50.1 39.6 39.9 207.5 0.312 0.41313 5814 58 440.16 442.01 738.48 57999.95 39.56 39.92 207.50
Agreed 440.1-440.2 442.0 738.5 58000 49.8 50.1 39.6 39.9 207.4-208.7 0.31 0.41M ean 440.2 442.0 738.5 58000.6 49.8 50.1 39.5 39.9 207.7
2SDev 0.1 0.0 0.0 3.8 0.2 0.2 0.3 0.0 0.8Uncertainty 0.0 0.0 0.0 0.0 0.5 0.4 0.8 0.1 0.4
Sheet steel, 5 Hz
Synthetic D igital Curve, 50 Hz
Synthetic D igital Curve, 5 Hz
Page 66 of 68

NPL Report DEPC MPE 015
Table B2 (contd): Summary of analysis returns (contd)NPL 0.5% Load Noise
Lab ID Data set ID Rp0.1 Rp0.2 ReH ReL Rm Fm A At Ag Agt Ae E A0.1 A0.2 AeH AeL1 61 433.62 443.21 437.97 424.69 748.08 58754.5 49.96 50.24 39.21 39.57 0.21 207 0.31 0.41 0.24 0.342 61 428.12 444.11 748.08 58754.203 50.24 38.85 39.57 201.604 0.32 0.423 61 428.12 433.96 748.08 58754.203 50.24 38.84 39.57 200 0.32 0.434 61 433.8 442.3 748.1 58754.505 50 50.2 39.2 39.6 208 0.3 0.45 61 434.033 438.888 748.1 58754.5 49.939 50.21 39.2 39.6 211.335 0.305 0.4086 61 433.8222 442.4663 738.4371 57996.9 49.9651 50.2413 39.0673 39.4229 207.6547 0.30932 0.413487 61 433.8 444.1 748.1 58755 50 50.2 39.2 39.6 206.7 0.309 0.4168 61 433.53 441.17 482.238 744.843 58500 49.2 36.32 211.479 0.308 0.412 2.889 61 433.9 441.3 748.1 58755 50.04 50.241 39.213 39.571 208.84 0.308 0.414
10 61 433.85 442.09 748.08 58754.5 49.95 50.23 39.21 39.57 207.9 0.31 0.4111 6112 61 432.4 435.5 739.8 58100 49.8 50.1 39.3 39.7 206.7 0.309 0.4113 61 434 442 746 58630 50 50 39 39.5 208 0.31 0.4114 61 433.80 442.55 748.08 58754.51 207.12
Agreed 431.8-434.1 438.1-441.6 748.1 58754 50.0 50.2 39.2 39.6 201.6-211.5 0.31 0.41M ean 433.7 441.5 748.1 58754.5 50.0 50.1 39.1 39.3 207.7
2SDev 0.9 0.9 0.0 0.6 0.1 0.6 0.3 1.9 5.0Uncertainty 0.2 0.2 0.0 0.0 0.3 1.2 0.8 4.8 2.4
NPL 0.5% Load Noise Lab ID Data set ID Rp0.1 Rp0.2 ReH ReL Rm Fm A At Ag Agt Ae E A0.1 A0.2 AeH AeL
1 62 438.72 438.72 437.09 432.8 745.08 58518.5 49.82 50.11 36.52 36.88 203 0.32 0.42 0.23 0.242 62 444.56 443.9 745.08 58518.583 50.1 36.11 36.88 180.198 0.4 0.553 62 444.56 443.9 745.08 58518.583 50.1 36.18 36.88 200 0.4 0.554 62 438.6 444.5 745.1 58518.515 49.8 50.1 36.5 36.9 206 0.3 0.45 62 438.413 444.509 745.1 58518.5 49.526 49.798 36.5 36.9 211.206 0.308 0.416 62 438.5994 444.4968 740.1131 58128.5 49.8238 50.1045 37.6638 38.0239 205.5293 0.31268 0.415557 62 444.6 443.9 745.1 58519 49.8 50.1 36.5 36.9 204.6 0.401 0.5538 62 439.26 444.99 587.28 744.84 58500 49.2 36.88 206.605 0.314 0.418 9.369 62 745.1 58519 49.94 50.097 36.512 36.873 206.87 0.312 0.414
10 62 438.53 444.5 745.08 58518.5 49.68 49.95 36.52 36.88 207.8 0.31 0.4111 6212 62 437.5 441.5 741 58200 49.5 49.8 37.9 38.2 206.3 0.312 0.41413 6214 62 438.58 444.50 745.08 58518.52 205.53
Agreed 438.3-438.9 444.1 745.1 58519 49.8 50.1 36.5 36.9 203.0-211.2 0.31 0.42M ean 438.6 444.5 745.1 58518.6 49.7 50.0 36.7 37.1 206.3
2SDev 0.2 0.0 0.0 0.4 0.3 0.6 1.2 1.0 4.3Uncertainty 0.0 0.0 0.0 0.0 0.6 1.1 3.3 2.7 2.1
NPL 1% Load Noise Lab ID Data set ID Rp0.1 Rp0.2 ReH ReL Rm Fm A At Ag Agt Ae E A0.1 A0.2 AeH AeL
1 63 430.35 430.35 428.9 403.3 759.26 59632.4 49.96 50.24 37.29 37.66 206 0.31 0.42 0.21 0.212 63 427.48 441.89 759.26 59632.28 50.24 36.89 37.66 186.298 0.32 0.433 63 430.04 448.42 759.26 59632.28 50.24 36.94 37.66 200 0.31 0.424 63 430.9 448.2 759.3 59632.385 50 50.2 37.3 37.7 207 0.3 0.45 63 432.338 448.268 759.3 59632.4 49.941 50.21 37.3 37.7 211.631 0.304 0.4126 63 429.8727 447.1028 740.3684 58148.5 49.9565 50.2413 37.8715 38.2363 202.9707 0.31029 0.418787 63 430 448.4 759.3 59632 50 50.2 37.3 37.7 205.3 0.309 0.4168 63 429.71 447.86 446.906 754.39 59250 50.08 38 205.901 0.31 0.418 0.569 63 430.9 444.7 759.3 59632 50.04 50.241 37.288 37.655 206.87 0.308 0.416
10 63 430.74 448.12 759.26 59632.4 49.96 50.23 37.29 37.66 207.2 0.31 0.4211 6312 63 432.3 435.2 740.5 58160 49.8 50.1 37.4 37.7 207.3 0.309 0.4113 6314 63 430.68 448.05 83.78 6579.94 206.36
Agreed 429.6-432.7 446.5-448.2 759.3 59632 50.0 50.2 37.3 37.7 203.0-211.6 0.31 0.42M ean 430.7 447.9 759.3 59632.3 50.0 50.2 37.3 37.8 206.0
2SDev 1.8 0.9 0.0 0.3 0.1 0.1 0.5 0.4 5.7Uncertainty 0.4 0.2 0.0 0.0 0.3 0.2 1.4 1.0 2.8
Synthetic D igital Curve, 50 Hz
Synthetic D igital Curve, 5 Hz
Synthetic D igital Curve, 50 Hz
Page 67 of 68

NPL Report DEPC MPE 015
Page 68 of 68
NPL 1% Load Noise Lab ID Data set ID Rp0.1 Rp0.2 ReH ReL Rm Fm A At Ag Agt Ae E A0.1 A0.2 AeH AeL
1 64 439.02 439.02 447.72 445.13 754.95 59293.6 49.66 49.95 39.25 39.62 0.46 203 0.32 0.42 0.25 0.862 64 441.08 447.69 754.95 59293.773 50.1 38.91 39.62 208.102 0.4 0.553 64 441.08 447.69 754.95 59293.773 50.1 38.88 39.62 200 0.4 0.554 64 439 441.8 754.9 59293.578 49.8 50.1 39.2 39.6 204 0.3 0.45 64 438.652 441.116 754.9 59293.6 49.533 49.792 39.3 39.6 228.983 0.292 0.3936 64 438.9144 441.5952 739.3952 58072.1 49.8401 50.1045 38.0993 38.4517 209.8182 0.31101 0.412297 64 437.4 441.1 754.9 59294 49.8 50.1 39.3 39.6 206.9 0.249 0.4018 64 439.26 441.17 455.5 755.34 59325 49.76 39.6 217.896 0.308 0.41 0.729 64 754.9 59294 49.94 50.097 39.241 39.609 205.57 0.312 0.412
10 64 439 441.76 754.95 59293.6 49.66 49.95 39.24 39.62 202.4 0.32 0.4211 6412 64 439.9 444 744.6 58480 49.5 49.8 39.3 39.6 209.2 0.312 0.41413 6414 64 439.08 441.91 754.95 59293.58 0.48 0.71 197.15
Agreed 438.8-439.0 441.4-441.8 755.0 59294 49.7 50.0 39.3 39.6 202.4-209.8 0.3 0.4M ean 439.2 441.5 754.9 59293.7 49.7 50.0 39.2 39.6 204.6
2SDev 0.8 0.7 0.1 0.4 0.3 0.3 0.3 0.0 8.2Uncertainty 0.2 0.2 0.0 0.0 0.6 0.6 0.8 0.1 4.0
Synthetic D igital Curve, 5 Hz
Table B2 (contd): Summary of analysis returns (contd)