november 2016 redondo beach real estate market trends update
TRANSCRIPT


Table of
Contents
Key Statistics for November
Sales 2016 Residential Sales Stats Year-to-Year Total Sales by Map Area Median 2016 Median Sales Stats Year-to-Year Median Sales by Map Area Listings 2016 Active Listings by Map Area 2016 Total Active Listings vs. Total Sales Year-to-Year Active Listings by Map Area Inventory 2016 Months of Inventory by Map Area Year-to-Year Months of Inventory
Summary
About Hady Chahine Contact Information

Key Statistics for November
Back to Table of Contents
= trending positive = trending positive
= trending negative = trending negative
Monthly Comparison Year-to-Year Nov 2015 Nov 2016 Delta Delta Increase Decrease
Total Sales 43 67 24 55.8%
Median Sales Price 850,000 899,000 49,000 5.8%
Median Days to Sell 32 46 14 43.8%
Listings 144 142 -2 -1.4%
Months of Inventory 3.0 2.0 -1 -33.3%
Month-to-Month Comparison Oct 2015 Nov 2015 Delta (qty) Delta (%) Increase Decrease
Total Sales 66 67 1 1.5%
Median Sales Price 891,000 899,000 8,000 0.9%
Median Days to Sell 21 46 25 119.0%
Listings 169 142 -27 -16.0%
Sales/Listing Ratio 39.1% 47.2% 8.1% 20.7%
Months of Inventory 3.0 2.0 -1.0 -33.3%

Back to Table of Contents
Total Sales Month-to-Month by Map Area Sep Oct Nov
N Redondo Beach/Villas North 16 22 18
S Redondo Beach W of PCH 11 8 13
N Redondo Beach/Villas South 10 12 15
S Redondo Beach S of Torrance Blvd 9 9 5
S Redondo Beach N of Torrance Blvd 5 5 8
N Redondo Beach/Golden Hills 6 8 6
N Redondo Beach/El Nido 6 2 2
Total Sales 63 66 67
-
10
20
30
40
50
60
70
Sep Oct Nov
2016 Total Sales Month-to-Month by Map Area
N Redondo Beach/Villas North
S Redondo Beach W of PCH
N Redondo Beach/Villas South
S Redondo Beach S of Torrance Blvd
S Redondo Beach N of Torrance Blvd
N Redondo Beach/Golden Hills
N Redondo Beach/El Nido
Total Sales
Back to Table of Contents
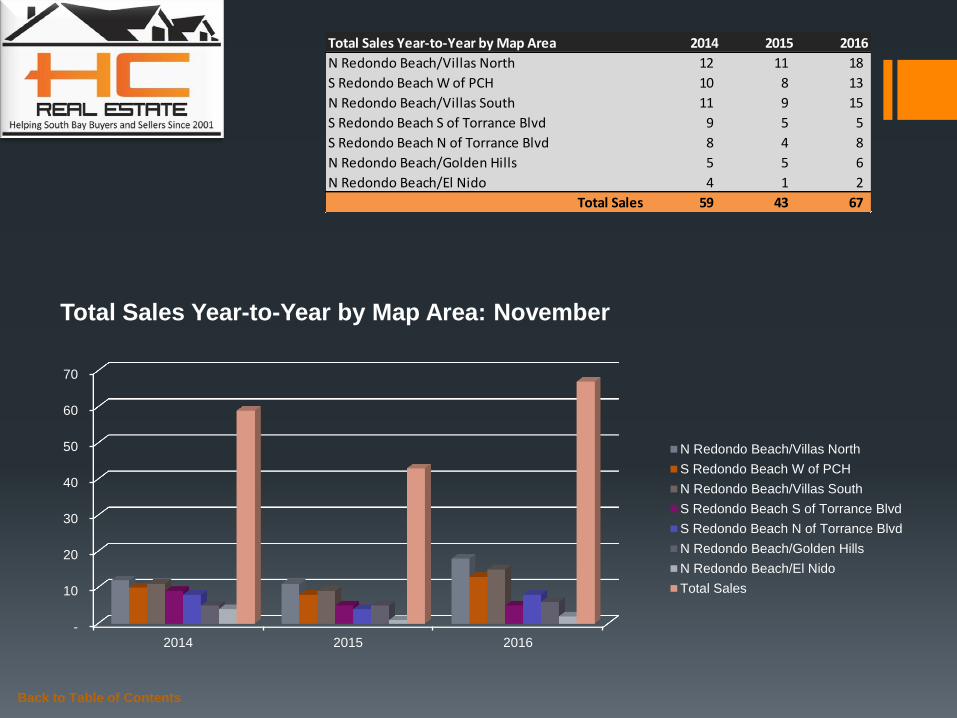
Total Sales Year-to-Year by Map Area 2014 2015 2016
N Redondo Beach/Villas North 12 11 18
S Redondo Beach W of PCH 10 8 13
N Redondo Beach/Villas South 11 9 15
S Redondo Beach S of Torrance Blvd 9 5 5
S Redondo Beach N of Torrance Blvd 8 4 8
N Redondo Beach/Golden Hills 5 5 6
N Redondo Beach/El Nido 4 1 2
Total Sales 59 43 67
-
10
20
30
40
50
60
70
2014 2015 2016
Total Sales Year-to-Year by Map Area: November
N Redondo Beach/Villas North
S Redondo Beach W of PCH
N Redondo Beach/Villas South
S Redondo Beach S of Torrance Blvd
S Redondo Beach N of Torrance Blvd
N Redondo Beach/Golden Hills
N Redondo Beach/El Nido
Total Sales

Back to Table of Contents
Median Sales Price Month-to-Month by Map Area Sep Oct Nov
N Redondo Beach/Villas North 807,500 857,000 837,000
S Redondo Beach W of PCH 671,000 872,500 1,050,000
N Redondo Beach/Villas South 792,500 875,950 870,000
S Redondo Beach S of Torrance Blvd 1,080,000 1,085,000 1,880,000
S Redondo Beach N of Torrance Blvd 1,040,000 860,000 880,500
N Redondo Beach/Golden Hills 993,500 898,500 928,500
N Redondo Beach/El Nido 871,000 1,180,000 1,165,000
Market Median Sales Price 899,000 891,000 899,000
-
200,000
400,000
600,000
800,000
1,000,000
1,200,000
1,400,000
1,600,000
1,800,000
2,000,000
Sep Oct Nov
2016 Median Sales Price Month-to-Month by Map Area
N Redondo Beach/Villas North
S Redondo Beach W of PCH
N Redondo Beach/Villas South
S Redondo Beach S of Torrance Blvd
S Redondo Beach N of Torrance Blvd
N Redondo Beach/Golden Hills
N Redondo Beach/El Nido
Market Median Sales Price

Back to Table of Contents
Median Sales Price Year-to-Year by Map Area 2014 2015 2016
N Redondo Beach/Villas North 775,000 850,000 837,000
S Redondo Beach W of PCH 857,500 682,000 1,050,000
N Redondo Beach/Villas South 759,000 930,000 870,000
S Redondo Beach S of Torrance Blvd 1,000,000 1,095,000 1,880,000
S Redondo Beach N of Torrance Blvd 732,500 1,215,000 880,500
N Redondo Beach/Golden Hills 850,000 811,000 928,500
N Redondo Beach/El Nido 712,500 621,000 1,165,000
Market Median Sales Price 785,000 850,000 899,000
-
200,000
400,000
600,000
800,000
1,000,000
1,200,000
1,400,000
1,600,000
1,800,000
2,000,000
2014 2015 2016
Median Sales Price Year-to-Year by Map Area: November
N Redondo Beach/Villas North
S Redondo Beach W of PCH
N Redondo Beach/Villas South
S Redondo Beach S of Torrance Blvd
S Redondo Beach N of Torrance Blvd
N Redondo Beach/Golden Hills
N Redondo Beach/El Nido
Market Median Sales Price
Back to Table of Contents
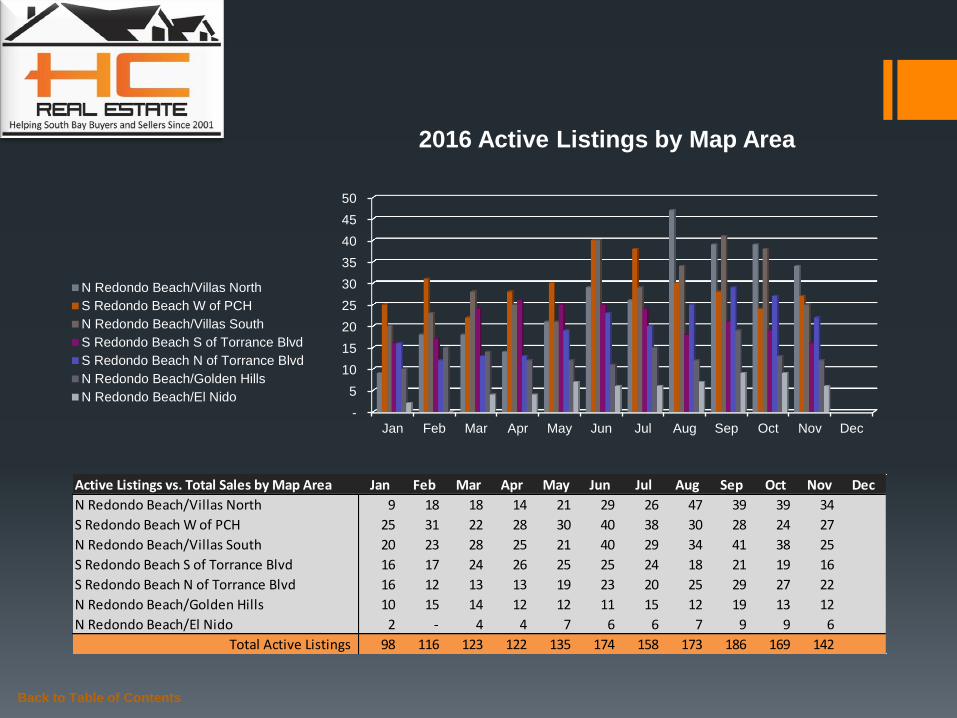
Active Listings vs. Total Sales by Map Area Jan Feb Mar Apr May Jun Jul Aug Sep Oct Nov Dec
N Redondo Beach/Villas North 9 18 18 14 21 29 26 47 39 39 34
S Redondo Beach W of PCH 25 31 22 28 30 40 38 30 28 24 27
N Redondo Beach/Villas South 20 23 28 25 21 40 29 34 41 38 25
S Redondo Beach S of Torrance Blvd 16 17 24 26 25 25 24 18 21 19 16
S Redondo Beach N of Torrance Blvd 16 12 13 13 19 23 20 25 29 27 22
N Redondo Beach/Golden Hills 10 15 14 12 12 11 15 12 19 13 12
N Redondo Beach/El Nido 2 - 4 4 7 6 6 7 9 9 6
Total Active Listings 98 116 123 122 135 174 158 173 186 169 142
-
5
10
15
20
25
30
35
40
45
50
Jan Feb Mar Apr May Jun Jul Aug Sep Oct Nov Dec
2016 Active Listings by Map Area
N Redondo Beach/Villas North
S Redondo Beach W of PCH
N Redondo Beach/Villas South
S Redondo Beach S of Torrance Blvd
S Redondo Beach N of Torrance Blvd
N Redondo Beach/Golden Hills
N Redondo Beach/El Nido

Back to Table of Contents
Active Listings vs. Total Sales by Map Area Jan Feb Mar Apr May Jun Jul Aug Sep Oct Nov Dec
N Redondo Beach/Villas North 9 18 18 14 21 29 26 47 39 39 34
S Redondo Beach W of PCH 25 31 22 28 30 40 38 30 28 24 27
N Redondo Beach/Villas South 20 23 28 25 21 40 29 34 41 38 25
S Redondo Beach S of Torrance Blvd 16 17 24 26 25 25 24 18 21 19 16
S Redondo Beach N of Torrance Blvd 16 12 13 13 19 23 20 25 29 27 22
N Redondo Beach/Golden Hills 10 15 14 12 12 11 15 12 19 13 12
N Redondo Beach/El Nido 2 - 4 4 7 6 6 7 9 9 6
Total Active Listings 98 116 123 122 135 174 158 173 186 169 142
Total Sales 54 34 73 87 83 89 83 82 63 66 67
Sales/Listings Ratio 55.1% 29.3% 59.3% 71.3% 61.5% 51.1% 52.5% 47.4% 33.9% 39.1% 47.2%
-
20
40
60
80
100
120
140
160
180
200
Jan Feb Mar Apr May Jun Jul Aug Sep Oct Nov Dec
2016 Total Active Listings vs. Total Sales
Total Active Listings
Total Sales

Back to Table of Contents
Active Listings Year-to-Year by Map Area 2014 2015 2016
N Redondo Beach/Villas North 33 18 34
S Redondo Beach W of PCH 15 37 27
N Redondo Beach/Villas South 36 24 25
S Redondo Beach S of Torrance Blvd 24 24 16
S Redondo Beach N of Torrance Blvd 28 22 22
N Redondo Beach/Golden Hills 7 11 12
N Redondo Beach/El Nido 8 8 6
Total Active Listings 151 144 142
-
20
40
60
80
100
120
140
160
2014 2015 2016
Active Listings Year-to-Year by Map Area: November
N Redondo Beach/Villas North
S Redondo Beach W of PCH
N Redondo Beach/Villas South
S Redondo Beach S of Torrance Blvd
S Redondo Beach N of Torrance Blvd
N Redondo Beach/Golden Hills
N Redondo Beach/El Nido
Total Active Listings

Back to Table of Contents
Months of Inventory by Map Area Jan Feb Mar Apr May Jun Jul Aug Sep Oct Nov Dec
N Redondo Beach/Villas North 1.0 4.0 2.0 1.0 1.0 3.0 2.0 3.0 2.0 2.0 2.0
S Redondo Beach W of PCH 4.0 16.0 2.0 2.0 2.0 2.0 3.0 2.0 3.0 3.0 2.0
N Redondo Beach/Villas South 1.0 2.0 2.0 2.0 1.0 2.0 1.0 2.0 4.0 3.0 2.0
S Redondo Beach S of Torrance Blvd 2.0 2.0 2.0 2.0 2.0 1.0 2.0 2.0 2.0 2.0 3.0
S Redondo Beach N of Torrance Blvd 2.0 2.0 2.0 2.0 3.0 2.0 2.0 2.0 6.0 5.0 3.0
N Redondo Beach/Golden Hills 3.0 15.0 1.0 1.0 1.0 2.0 2.0 1.0 3.0 2.0 2.0
N Redondo Beach/El Nido 1.0 - 1.0 1.0 1.0 1.0 3.0 7.0 2.0 5.0 3.0
-
2.0
4.0
6.0
8.0
10.0
12.0
14.0
16.0
Jan Feb Mar Apr May Jun Jul Aug Sep Oct Nov Dec
2016 Months of Inventory by Map Area
N Redondo Beach/Villas North
S Redondo Beach W of PCH
N Redondo Beach/Villas South
S Redondo Beach S of Torrance Blvd
S Redondo Beach N of Torrance Blvd
N Redondo Beach/Golden Hills
N Redondo Beach/El Nido

Back to Table of Contents
Months of Inventory Year-to-Year Jan Feb Mar Apr May Jun Jul Aug Sep Oct Nov Dec
2014 3.0 4.0 2.0 2.0 3.0 3.0 2.0 3.0 3.0 2.0 2.0 1.0
2015 2.0 3.0 2.0 2.0 2.0 2.0 2.0 2.0 2.0 2.0 3.0 1.0
2016 2.0 3.0 2.0 1.0 2.0 2.0 2.0 2.0 3.0 3.0 2.0
-
0.5
1.0
1.5
2.0
2.5
3.0
3.5
4.0
Jan Feb Mar Apr May Jun Jul Aug Sep Oct Nov Dec
2016 Months of Inventory Year-to-Year
2014
2015
2016
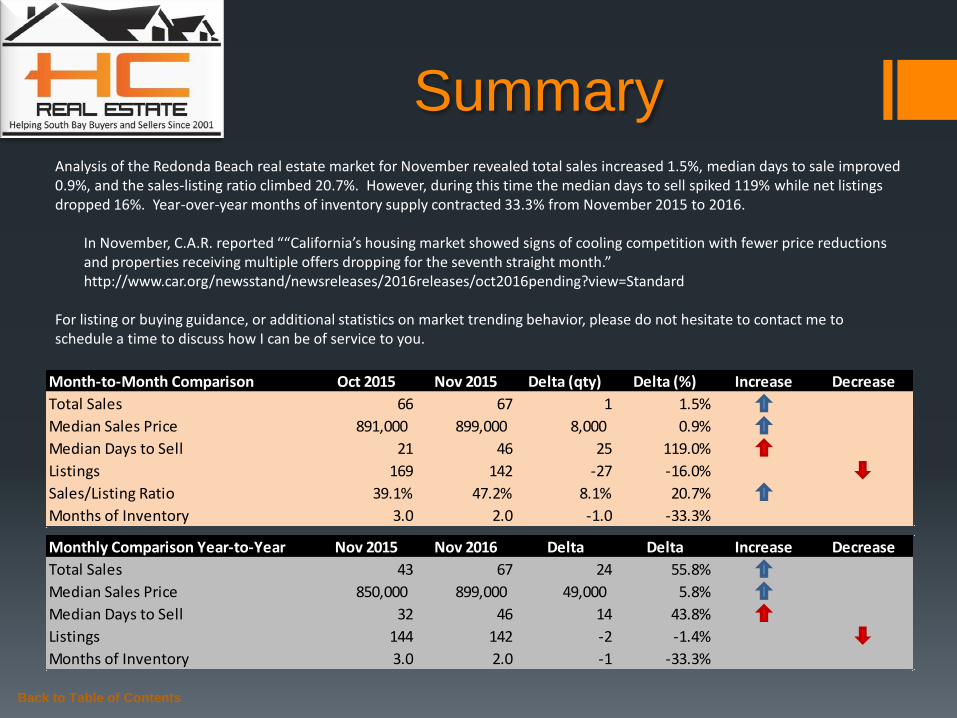
Summary Analysis of the Redonda Beach real estate market for November revealed total sales increased 1.5%, median days to sale improved 0.9%, and the sales-listing ratio climbed 20.7%. However, during this time the median days to sell spiked 119% while net listings dropped 16%. Year-over-year months of inventory supply contracted 33.3% from November 2015 to 2016.
In November, C.A.R. reported ““California’s housing market showed signs of cooling competition with fewer price reductions and properties receiving multiple offers dropping for the seventh straight month.” http://www.car.org/newsstand/newsreleases/2016releases/oct2016pending?view=Standard
For listing or buying guidance, or additional statistics on market trending behavior, please do not hesitate to contact me to schedule a time to discuss how I can be of service to you.
Back to Table of Contents
Month-to-Month Comparison Oct 2015 Nov 2015 Delta (qty) Delta (%) Increase Decrease
Total Sales 66 67 1 1.5%
Median Sales Price 891,000 899,000 8,000 0.9%
Median Days to Sell 21 46 25 119.0%
Listings 169 142 -27 -16.0%
Sales/Listing Ratio 39.1% 47.2% 8.1% 20.7%
Months of Inventory 3.0 2.0 -1.0 -33.3%
Monthly Comparison Year-to-Year Nov 2015 Nov 2016 Delta Delta Increase Decrease
Total Sales 43 67 24 55.8%
Median Sales Price 850,000 899,000 49,000 5.8%
Median Days to Sell 32 46 14 43.8%
Listings 144 142 -2 -1.4%
Months of Inventory 3.0 2.0 -1 -33.3%

Serving South Bay Home Buyers and Sellers Since 2001
RE/MAX Top 4 Team in California – 2012
RE/MAX 100% Club - 2011
Shorewood Realtors Top 5% in Overall Sales 2001-2006, 2008-2010
Back to Table of Contents
About
Hady Chahine…

The information being provided by CARETS (CLAW, CRISNet MLS, DAMLS, CRMLS, i-Tech MLS, and/or VCRDS) is for the visitor’s personal, non-commercial use and may not be used for
any purpose other than to identify prospective properties visitor may be interested in purchasing. Any information relating to a property referenced on this web site comes from the Internet
Data Exchange (IDX) program of CARETS. This web site may reference real estate listing(s) held by a brokerage firm other than the broker and/or agent who owns this web site. The accuracy
of all information, regardless of source, including but not limited to square footages and lot sizes, is deemed reliable but not guaranteed and should be personally verified through personal
inspection by and/or with the appropriate professionals.
Back to Table of Contents
Listings MLS BLOG Website
Hady Chahine
• 310-404-5361