november 2012 investor...
TRANSCRIPT

November 2012 Investor Presentation

2
FORWARD-LOOKING STATEMENTS
This presentation and our accompanying comments include “forward-looking statements.”
These statements relate to future events or our future financial performance and are subject to known
and unknown risks, uncertainties and other factors that may cause our actual results, levels of activity,
performance or achievements to differ materially from those expressed or implied by these forward-
looking statements. This presentation and our accompanying comments do not purport to identify the
risks inherent in an investment in Domino’s Pizza and factors that could cause actual results to differ
materially from those expressed or implied in the forward-looking statements. These risks include but
are not limited to those risk factors identified in Domino’s Pizza, Inc.’s Annual Report on Form 10-K for
the fiscal year ended January 1, 2012, as well as other SEC reports filed by Domino’s Pizza, Inc. from
time to time. Although we believe that the expectations reflected in the forward-looking statements are
based upon reasonable estimates and assumptions, we cannot guarantee future results, levels of
activity, performance or achievements. We caution you not to place undue reliance on forward-looking
statements, which reflect our estimates and assumptions and speak only as of the date of this
presentation. We undertake no obligation to update the forward-looking statements to reflect
subsequent events or circumstances. In light of the above, you are urged to review the disclosures
contained in the Domino’s Pizza, Inc. SEC reports, including the risk factors contained therein.
This presentation contains trade names, trademarks and service marks of other companies. We do not
intend our use or display of other parties’ trade names, trademarks and service marks to imply a
relationship with, or endorsement or sponsorship of, these other parties.

3
INVESTMENT THESIS
Domestic Business
• Popular brand
• Primarily franchised
• Value-adding Supply Chain
International Business
• Entirely franchised
• Highly profitable master franchise business model
• Consistently strong sales and store growth
Leveraging Technology
• Online and mobile ordering
• Digital marketing
Balance Sheet
• Franchise business run efficiently, with leverage
• Cash deployed to benefit shareholders

4
OVER 10,000 UNITS WORLDWIDE
52% of Global Retail Sales 48% of Global Retail Sales
• 4,509 Franchised Stores
• 387 Company-Owned Stores
• 19 Company-Owned Supply
Chain Facilities
Domestic International
• 5,144 Franchised Stores
• Currently No Company-Owned Stores
• 6 Company-Owned Supply Chain
Facilities
As of Q3 2012

5 ¹As of FY 2011
DOMESTIC PIZZA UNIT ECONOMICS
Franchise model generates sustainable returns
• Focused and efficient operating model
— Delivery and carryout
• Low cost to open / operate
— $150,000 - $300,000 average cost range for new store
— Minimal square footage
— Makeline + oven + POS system
• Strong cash-on-cash returns
• Average reported annual EBITDA per domestic franchise store is
between $50,000 and $75,0001

6 Source: The NPD Group/CREST® - year-ending February 2012
DOMESTIC MARKET SHARE
Pizza Delivery Market Share
22%
29%
49%
11%
26% 63%
Total QSR Pizza Market Share
Domino’s Pizza Small Chains & Independents Major Pizza Chains

7
Supporting Strong Domestic Business
DOMESTIC SUPPLY CHAIN
• Sells and delivers food & equipment to U.S. franchisees
• Provides consistency
– Produces fresh dough
– System-wide ingredients & equipment
• Franchise partnership
– Profit-sharing agreement
8
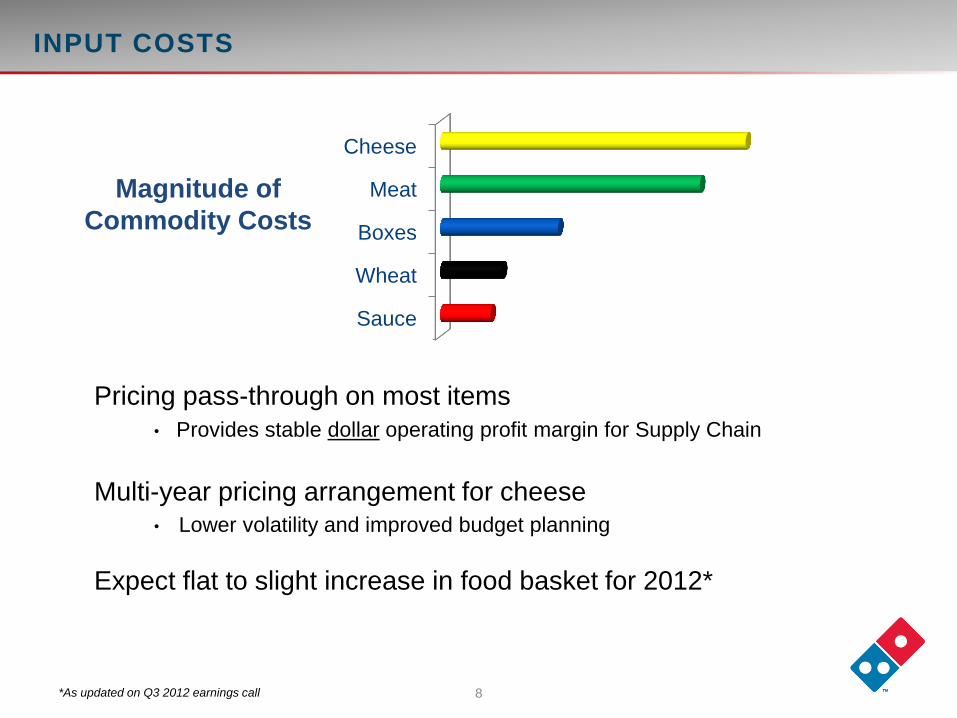
INPUT COSTS
Pricing pass-through on most items
• Provides stable dollar operating profit margin for Supply Chain
Multi-year pricing arrangement for cheese • Lower volatility and improved budget planning
Expect flat to slight increase in food basket for 2012*
Magnitude of
Commodity Costs
Cheese
Meat
Boxes
Wheat
Sauce
*As updated on Q3 2012 earnings call

9
Q3 2012 DOMESTIC RECAP
• SSS +3.3%
• About 40% delivery orders coming from digital channels
• New logo and store design
– Allows franchisees flexibility on timing and scale
Recent News
• Introduced Pan Pizza
– Made from fresh dough

10
3,223 3,469
3,726
4,072
4,422
4,835
2006 2007 2008 2009 2010 2011
Excludes the impact of foreign currency exchange rates
INTERNATIONAL PERFORMANCE
• International profits driven by franchise royalties – 91% of 2011 International operating income
• Limited Domino’s Pizza investment through master franchise model
• Five-year International retail sales CAGR of 13%*
• International is ranked among top five publicly-traded restaurant
companies in terms of store count
*FY 2006 – 2011
International Store Growth International Same Store Sales Growth
4.0%
6.7%
6.2%
4.3%
6.9% 6.8%
2006 2007 2008 2009 2010 2011

INTERNATIONAL OPPORTUNITY
Top 10 Markets Q3 2012
Store Count
Delivery Market
Position
Potential
Store Count
United Kingdom 693 1 1,100
Mexico 584 1 700
India 508 1 1,000
Australia 456 1 650
South Korea 367 1 450
Canada 366 2 450
Turkey 253 1 600
Japan 228 3 700
France 208 1 850
Taiwan 140 2 150
TOTAL 3,803 6,650
Delivery market position and potential store count based on Domino’s Pizza International estimates.
• Potential for nearly 3,000 additional restaurants in Domino’s top 10 international markets alone
• Next five target markets are as diversified as the top ten (store counts as of Q3 2012):
Netherlands (120), Spain (117), Malaysia (94), New Zealand (85), Saudi Arabia (80)
12
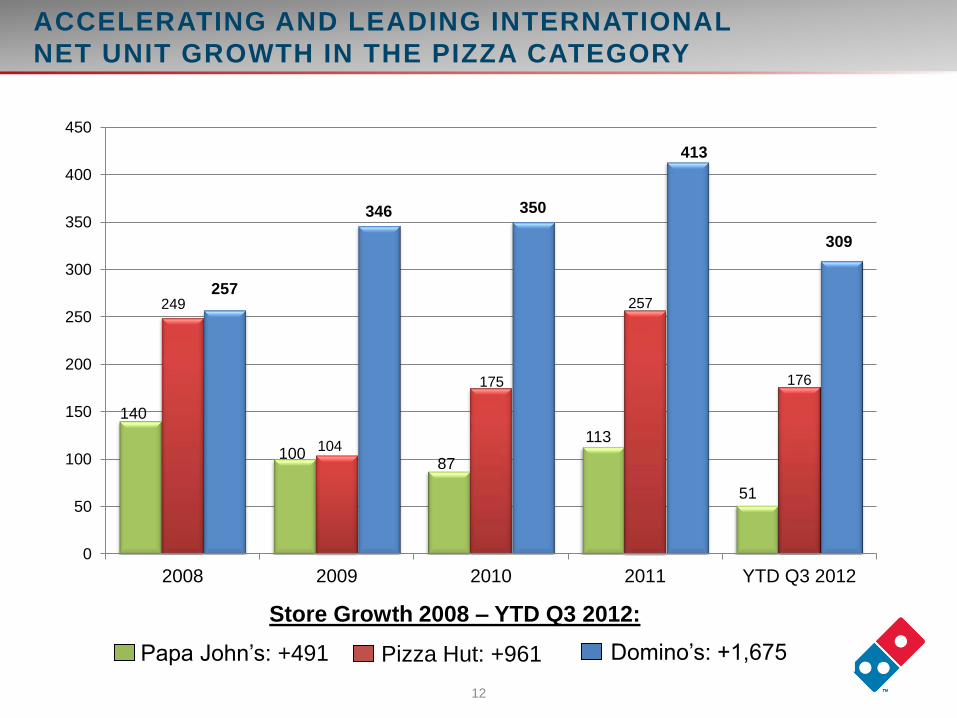
Store Growth 2008 – YTD Q3 2012:
Pizza Hut: +961 Domino’s: +1,675 Papa John’s: +491
ACCELERATING AND LEADING INTERNATIONAL
NET UNIT GROWTH IN THE PIZZA CATEGORY
140
100 87
113
51
249
104
175
257
176
257
346 350
413
309
0
50
100
150
200
250
300
350
400
450
2008 2009 2010 2011 YTD Q3 2012
13
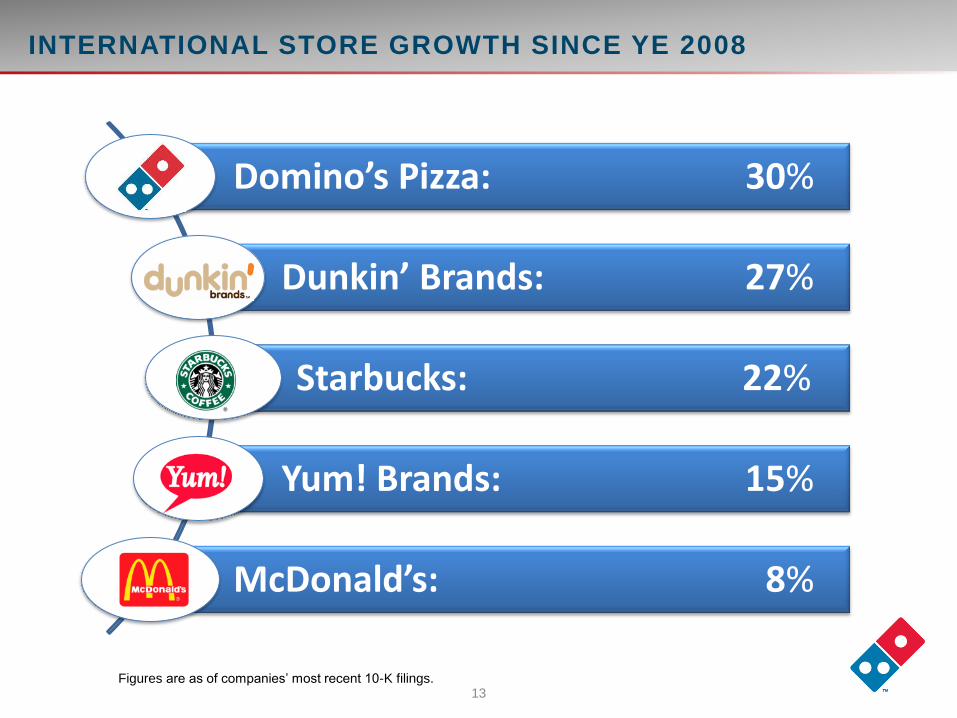
Domino’s Pizza: 30%
Dunkin’ Brands: 27%
Starbucks: 22%
Yum! Brands: 15%
McDonald’s: 8%
Figures are as of companies’ most recent 10-K filings.
INTERNATIONAL STORE GROWTH SINCE YE 2008

14
STRONG INTERNATIONAL FRANCHISE BASE
890
752
511
611
2,380
JUBI
DOM
• India
• Sri Lanka
DMP
• Australia
• New Zealand
• Netherlands
• France
• Belgium
Alsea
• Mexico
• Colombia
Four publicly-traded Domino’s Pizza master franchisees
make up more than half of total international store count
Rest of
International • United Kingdom
• Ireland
• Germany
International master franchisee store count pie chart as of Q3 2012. Master franchisee market capitalization as of 9/7/2012.
Market Cap
$685.7M
Market Cap
$1,396.1M
Market Cap
$1,454.8M
Market Cap
$903.5M

15
Q3 2012 INTERNATIONAL RECAP
• SSS +5.0%
• 75 consecutive quarters of positive same store sales growth
• Store count grew by net 121 units
• New market openings: Macedonia and Nigeria

16
TECHNOLOGY
• Surpassed $1 billion in digital sales
in one year in the U.S.
1
• Both mobile apps, iPhone and
Android, are in the top 10 free app
lifestyle, and food and drink
rankings in the iTunes store and
on Google Play.
• Mobile ordering apps
have been downloaded
almost 3.5 million times.
1 – First achieved in the twelve months ending April 2012
FEBRUARY 2012
JUNE 2011
JUNE 2012

17
5.5
4.7
4.1
3.2
4.8
3.7
3.1 3.0
7.2
7.7
6.7
5.5
4.9 5.0
1999 2000 2001 2002 2003 2004 2005 2006 2007 2008 2009 2010 2011 Q3 2012
SUCCESSFUL HISTORY OF OPERATING WITH LEVERAGE
Total Debt to EBITDA

18
CAPITAL STRUCTURE
• $1.563 billion debt of Senior Notes outstanding as of Q3 2012
─ 5.216% interest rate
─ 7-year term to Anticipated Repayment Date
─ Required principal payments equal to 1.5% - 2.5% of debt annually until leverage is 4.5x or less
• $100 million VFN facility
─ $39.7 million letters of credit issued as of Q3 2012
─ No borrowings outstanding as of Q3 2012
“Whole-business securitization” secured with most cash flows of the company

19
GROWING EPS
Q3 2012 Adjusted EPS Up Almost 23% Over Q3 2011
(1) EPS amounts are adjusted for items affecting comparability. Items adjusting reported EPS are detailed in the respective Earnings Release or Form 8-K.
0.35 0.33
0.27
0.40 0.42
0.40
0.35
0.52
0.47 0.47
0.43
1.35
1.69
0.70
0.90
1.10
1.30
1.50
1.70
1.90
0.00
0.10
0.20
0.30
0.40
0.50
0.60
0.70
1st Quarter 2nd Quarter 3rd Quarter 4th Quarter Full Year2010 2011 2012

20
CONSISTENT GLOBAL PERFORMANCE
Avg: +2.5%
Avg: +5.6%
3.6%
2.2%
6.7% 6.8%
4.5%
2.8%
0.0%
4.0%
2.6% 1.3% 1.8%
4.9%
-4.1%
-1.7%
-4.9%
0.5%
9.9%
3.5% 2.3%
-6.0%
-4.0%
-2.0%
0.0%
2.0%
4.0%
6.0%
8.0%
10.0%
12.0%
1994 1995 1996 1997 1998 1999 2000 2001 2002 2003 2004 2005 2006 2007 2008 2009 2010 2011 YTDQ3
2012
U.S. Same Store Sales 1994 - YTD 2012
8.9%
3.8%
5.2%
11.1%
3.4% 3.6% 3.7%
6.4%
4.1% 4.0%
5.9% 6.1%
4.0%
6.7% 6.2%
4.3%
6.9% 6.8%
5.1%
0.0%
2.0%
4.0%
6.0%
8.0%
10.0%
12.0%
1994 1995 1996 1997 1998 1999 2000 2001 2002 2003 2004 2005 2006 2007 2008 2009 2010 2011 YTDQ3
2012
International Same Store Sales 1994 - YTD 2012

21
Domestic Same Store
Sales
+1% to +3%
International Same Store
Sales
+3% to +6%
Global Net Units
+350 to +450
Global Retail Sales
+5% to +8%
Outlook does not constitute specific earnings guidance. Domino’s does not provide quarterly or annual earnings estimates.
LONG RANGE OUTLOOK

22
DEPLOY CAPITAL TO BUILD SHAREHOLDER VALUE
Invest in growing the business, and
1Subsequent to Q3 2012, the Company repurchased 106,573 shares at an average price of $34.98, as stated in the Q3 2012 Form 8-K, with further
details provided in the Form 10-Q.
Deleverage
• Moderate amortization
requirements under
current debt structure.
Repurchase Shares
• Through the first three
quarters of 2012,
repurchased 1.3 million
shares at an average
price of $31.971.
• In July 2012, Board
authorized replenishment
of Open Market
Repurchase Program to
$200 million, the third
time the Board authorized
repurchases since DPZ
went public in 2004.
Pay Dividends
• Paid $3.00 per share
special dividend as part
of recapitalization in
March 2012.
23
PROVEN BUSINESS MODEL
Powerful global brand with more than 50 years of:
Strong product demand
Strong unit economics
Consistent cash flow based upon franchise model

THANK YOU!
Contact Information
Lynn Liddle: [email protected]
Jenny Fouracre: [email protected]
Stacy Haas: [email protected]
Or call us at:734-930-3008