novel vaccination strategies for cd4+ t cell immunotherapy
TRANSCRIPT

Novel vaccination strategies
for CD4+ T cell immunotherapy of melanoma
Dissertation
zur
Erlangung des Doktorgrades (Dr. rer. nat.)
in
Molekulare Biomedizin
der
Mathematisch-Naturwissenschaftlichen Fakultät
der
Rheinischen Friedrich-Wilhelms-Universität Bonn
vorgelegt von
Naveen Shridhar
aus Honavar, Indien
Bonn
März 2019

2
Angefertigt mit Genehmigung der Mathematisch-Naturwissenschaftlichen Fakultät der
Rheinischen Friedrich-Wilhelms-Universität Bonn
1. Gutachter: Prof. Dr. med. Thomas Tüting
2. Gutachter: Prof. Dr. rer. nat. Sven Burgdorf
Tag der Promotion: 26.08.2019
Erscheinungsjahr: 2019

3
Table of Contents 1. Introduction .............................................................................................................. 5
1.1 Melanoma: the most dangerous form of Skin Cancer. ......................................... 5 1.1.1 History of melanoma..................................................................................... 5 1.1.2 Incidence and mortality of melanoma ........................................................... 6 1.1.3 Clinical classification of melanoma ............................................................... 6 1.1.4 Melanoma pathogenesis .............................................................................. 7 1.1.5 Role of the immune system .......................................................................... 9 1.1.6 Melanoma therapy ........................................................................................ 9 1.1.7 Novel Immunotherapeutic approaches ........................................................10
1.2 Experimental mouse models and the role of anti-tumor CD4+ T cells ................11 1.2.1 Early developments .....................................................................................11 1.2.2 Anti-tumoral functions of CD4+ T cells .........................................................12 1.2.3 Immunosuppressive functions of CD4+ T cells ............................................12 1.2.4 Tumor immune escape mechanisms ...........................................................13
1.3 Virus vectors for melanoma immunotherapy: Adenovirus and Modified Vaccinia Ankara Vectors ........................................................................................................13
1.3.1 Structure of Adenovirus ...............................................................................13 1.3.2 Adenovirus infection pathway ......................................................................14 1.3.3 Adenovirus vectors for gene therapy ...........................................................16 1.3.4 Adenovirus vectors as cancer vaccines .......................................................16 1.3.5 Modified Vaccinia Ankara ............................................................................16 1.3.6 Vaccinia Virus structure ...............................................................................17 1.3.7 Vaccinia virus replication .............................................................................18 1.3.8 Heterologous prime-boost vaccination .........................................................20
2. Hypotheses and aims of the thesis work .................................................................21 3. Material and methods ..............................................................................................22
3.1 Materials ............................................................................................................22 3.1.1 Reagents and Chemicals. ...........................................................................22 3.1.2 PCR primer for next-generation sequencing (NGS) .....................................24 3.1.3 NGS barcode primers ..................................................................................25 3.1.4 Flow cytometry antibodies ...........................................................................26 3.1.5 Western Blot and Immunofluorescence antibodies ......................................26 3.1.6 ELISA ..........................................................................................................26 3.1.7 Histology antibodies ....................................................................................26
3.2 Methods .............................................................................................................27 3.2.1 Mice ............................................................................................................27 3.2.2 Molecular cloning ........................................................................................27 3.2.3 Generation of Trp1 and Ciita sgRNA CRISPR-Cas9 plasmids .....................28 3.2.4 Generation of HCmel12 Trp1 and Ciita-knockout cells ................................29 3.2.5 Next generation sequencing ........................................................................30 3.2.6 Insertion or deletion (indel) detection ...........................................................30 3.2.7 Cell Culture .................................................................................................30 3.2.8 Tumor transplantation experiments .............................................................31 3.2.9 Viral vectors ................................................................................................31 3.2.10 Adoptive T-cell immunotherapy .................................................................32 3.2.11 Vitiligo scoring ...........................................................................................32 3.2.12 Histology and immunohistology .................................................................32 3.2.13 Enzyme-linked immunosorbent assay .......................................................32 3.2.14 Flow cytometry ..........................................................................................33 3.2.15 Recognition of HCmel12 and variants by Trp1 CD4+ T cells in vitro ..........33 3.2.16 Cell culture immunofluorescence analysis .................................................34 3.2.17 Western blot analysis ................................................................................34 3.2.18 Amplification of adenovirus stocks .............................................................35 3.2.19 Amplification of MVA stocks ......................................................................35

4
3.2.20 Titering of Adenovirus and MVA ................................................................35 3.2.21 Generation of fluorescent HCmel12 melanoma cells .................................36 3.2.22 Selection of statistical tests ........................................................................36
4. Results ....................................................................................................................37 4.1 Establishment of an ACT regimen with CD4+ T cells .............................................37
4.1.1 Generation of an adenoviral vector expressing both a Trp1 CD4+ T cell epitope and a gp100 CD8+ T cell epitope ............................................................37 4.1.2 Adenoviral vaccination expands adoptively transferred Trp1 CD4+ T cells less efficiently than Pmel-1 CD8+ T cells in vivo ..................................................40 4.1.3 Trp1 CD4+ T cell ACT controls melanoma growth and causes extensive vitiligo in mice with regressing melanomas ...........................................................42
4.2 Heterologous prime-boost strategies to enhance T cell ACT .................................45 4.2.1 Generation of a Modified vaccina virus vector expressing both a Trp1 CD4+ T cell epitope and a gp100 CD8+ T cell epitope ...................................................45 4.2.2 Ad5-GTY priming and MVA-PMTP boosting works for Pmel-1 CD8+ T cells but not for Trp1 CD4+ T cells in vivo ....................................................................51 4.2.3 MVA booster vaccination does not improve the therapeutic efficacy of the adoptive T cell therapy .........................................................................................53 4.2.4 Co-transfer of tumor antigen specific CD8+ and CD4+ T cells controls melanomas only marginally better than CD8+ or CD4+ T cells alone ...................55 4.2.5 HCmel12 melanomas that relapse after T cell immunotherapy show down-regulated expression of the melanocytic target antigens ......................................57
4.3 Mechanisms of CD4+ T cell anti-tumor effector functions ......................................59 4.3.1 Genetic ablation of the Trp1 gene in melanoma cells using CRISPR-Cas9 genome editing .....................................................................................................59 4.3.2 Trp1 CD4+ T cells do not recognize Trp1-/- HCmel12 melanoma cells in vitro .............................................................................................................................63 4.3.3 Trp1 CD4+ T cell ACT is ineffective against HCmel12 Trp1-/- melanomas ...65 4.3.4 Genetic ablation of the Ciita gene in melanoma cells using CRISPR-Cas9 genome editing .....................................................................................................70 4.3.5 Trp1 CD4+ T cell ACT can control the growth of HCmel12 Ciita-/- melanomas .............................................................................................................................75
5. Discussion ...............................................................................................................77 5.1 Adoptive transfer of Trp1 CD4+ T cells and adenoviral vaccination....................77 5.2 Boost vaccination with recombinant MVA for CD4+ T cells ................................77 5.3 Therapeutic efficacy of Trp1 CD4+ T cells against skin melanomas...................78 5.4 Immune escape through dedifferentiation ..........................................................79 5.5 Antigen-specific effector functions and bystander killing ....................................79 5.6 The role of MHC class II restricted antigen presentation ....................................80 5.7 Consequences for the mechanisms of CD4+ T cell anti-tumor immunity ............82 5.8 The connection between anti-tumor immunity and autoimmune vitiligo ..............83
6. Summary .................................................................................................................85 7. References ..............................................................................................................87 8. List of Figures ........................................................................................................ 100 9. List of Abbreviation ................................................................................................ 103 10. Acknowledgement ............................................................................................... 105 11. Contributions to scientific meetings ..................................................................... 106 12. Publication list ..................................................................................................... 107
5
1. Introduction
1.1 Melanoma: the most dangerous form of Skin Cancer.
1.1.1 History of melanoma
“As to the remote and exciting causes of melanosis, we are quite in the dark, nor
can more be said of the methodus medendi. We are hence forced to confess the
incompetency of our knowledge of the disease under consideration, and to leave
to future investigators the merit of revealing the laws which govern its origin and
progress.... and pointing out the means by which its ravages may be prevented
or repressed“ – Thomas Fawdington, The Manchester Royal Infirmary, 1826.
With these words, Thomas Fawdington described a condition he called
“melanosis”.
The earliest evidence for melanomas comes from metastases found in the
skeletons of Pre-Colombian mummies from Chancay and Chingas in Peru, which
according to radiocarbon based analyses are approximately 2400 years old
(Rebecca et al., 2012; Shain and Bastian, 2016; Urteaga B. and Pack, 1966). In
the 5th century BC, melanoma was described in the writings of Hippocrates of
Cos. In 1787, the Scottish surgeon John Hunter performed the first recorded
surgical excision of melanoma from the jaw of a 35-year-old patient. Hunter
described melanoma as a cancerous fungus excrescence. This case was
described again by Everard Home in 1805 in his book Observations on Cancer.
He described that melanoma was black in appearance and soft in consistency.
The general practitioner Dr. William Norris gave first detailed reports on etiology
and progression of melanosis. He followed a 59-year old patient with melanoma
for over 3 years and performed an autopsy on the patient. He observed that
melanoma was heterogeneous with reddish and whitish brown throughout and
also described melanoma metastases. It was Dr. Norris who observed familial
hereditary inheritance of melanoma as he reported that his patient’s father had
succumbed to a similar disease (Norris, 1820). In 1806 Rene Laennec, a medical
student who later invented the stethoscope, was the first to lecture on melanoma.
He coined the term “melanoses” to describe the black lesions commonly found in
the lungs while performing autopsies (Roguin, 2006). In 1838, Sir Robert
Carswell, a pathologist, coined the word “melanoma”.

6
1.1.2 Incidence and mortality of melanoma
Skin cancer is common among fair-skinned individuals. It can be divided into
melanoma and non-melanoma skin cancers (Breitbart et al., 2006). Non-
melanoma skin cancer includes basal cell carcinoma and squamous cell
carcinoma. Although non-melanoma skin cancer is more common, it is not as
aggressive as melanoma. Annually around 132,000 new cases of melanoma are
reported worldwide (WHO Skin Cancer). The incidence of melanoma is 16 times
higher in Caucasians compared to Africans (Gloster and Neal, 2006). Although
melanoma is not the most frequent form of skin cancer, it accounts for the highest
number of skin cancer related deaths. For instance, in the USA melanoma
represents only 3% of skin cancers but contributes to 75% of skin cancer-related
deaths (American Academy of Dermatology).
Based on a pilot study in the state Schleswig-Holstein, it was estimated that
between the year 2003 and 2007 the incidence of malignant melanoma in
Germany amounted to around 15 per 100.000 people. However, since nationwide
screening for skin cancer was started in 2008 the incidence rate of melanoma
increased by 28 percent (~18 cases per 100.000 people) (Katalinic et al., 2015).
1.1.3 Clinical classification of melanoma
Melanomas are classified by the WHO into 4 subtypes based on the clinical
characteristics as superficial spreading melanoma, lentigo meligna melanoma,
nodular melanoma and acral lentiginous melanoma (Schadendorf et al., 2013).
The American Joint Committee on Cancer (AJCC) groups melanoma into four
stages. Stage I and II cutaneous melanomas are restricted to the skin with no
regional or distant metastasis. In stage I the vertical tumor thickness is less than
2 mm, in stage II, the vertical tumor thickness is more than 2 mm. Stage III
melanomas show evidence of locoregional disease including satellite, in-transit
and regional lymph node metastasis. Stage IV melanomas show distant
metastasis in skin, lymph nodes, lungs, liver and other visceral sites, the skeleton
and the brain (Mohr et al., 2009).

7
1.1.4 Melanoma pathogenesis
Melanomas originate from pigment-producing cells called melanocytes, which
are derived from neural crest precursor cells during development. They are a
minor, slowly proliferating cell population located in the basal epidermis, hair
follicles, uveal tract of the eye and to a lesser extent in meninges and the
anogenital tract (Costin and Hearing, 2007). Epidermal melanocytes are part of
the skin defense system because the melanin pigment produced by them is
passed to keratinocytes and protects against UV induced DNA damage (Kaidbey
et al., 1979; Plonka et al., 2009).
The benign precursors of melanomas are known as nevi. Acquired common nevi
commonly effect the trunk and extremities exposed to sun, indicating that
ultraviolet (UV) radiation is the most important cause for the formation of nevi.
Based on histology, nevi are classified as junctional, dermal, and compound nevi.
Junctional nevi are restricted to the epidermis, dermal nevi to dermis and
compound nevi have both epidermal and dermal components (Bastian, 2014).
Melanocytic nevi can already be present at birth, They are called congenital nevi
and have an increased risk for malignant transformation. While acquired nevi are
associated with BRAF mutations (Pollock et al., 2003), congenital nevi are
associated with NRAS mutations (Carr and Mackie, 1994). It is thought that the
proliferative activity of melanocytes during the development of a nevus is
counteracted by oncogene-induced senescence (Collado et al., 2007;
Michaloglou et al., 2005), a process involving upregulation of the p16INK4a tumor
suppressor protein (Takata et al., 2010). Acquired melanocytic nevi arise during
the second decade of life and tend to regress spontaneously after the sixth
decade of life (Purdue et al., 2005).
Progression of a nevus to a melanoma can be due to inactivation of p16INK4a
(Shain and Bastian, 2016). In addition, the human telomerase reverse
transcriptase (hTERT) is frequently activated. Subsequent invasive growth
involves β-catenin activation, E-Cadherin loss and N-Cadherin overexpression
resulting in invasive and migratory melanoma cells (Bennett, 2003; Miller and
Mihm, 2006). This progression of nevi to melanoma is considered as a multistep
process characterized by accumulating genomic alterations (Hussein, 2004).

8
UV radiation typically causes the mutations in melanoma through DNA damage
and the formation of pyrimidine dimers resulting in C to T transition mutations
(Narayanan et al., 2010). The number of UV-induced mutations correlates with
the cumulative extent of skin sun damage. Accordingly, melanomas have been
divided in those arising on chronically sun damaged (CSD) and those arising on
non-chronically sun damaged melanomas (non-CSD) (Shain and Bastian, 2016).
CSD melanomas are associated with inactivating NF1 mutations (Krauthammer
et al., 2012), increased copy numbers of CCND1 (Curtin et al., 2005), activating
mutations of KIT (Curtin et al., 2006) and increased p53 mutation frequencies
(Krauthammer et al., 2012). Non-CSD melanomas are more common in younger
patients and are associated with BRAFV600E mutations (Curtin et al., 2005;
Maldonado et al., 2003). The distribution of CSD and non-CSD melanomas on
the body is shown in figure 1.1.4.1
Fig.1.1.4.1 Schematic representation of the distribution of CSD and non-CSD melanomas. The left panel depicts common mutation and age of incidence observed in these broad subtypes of melanoma and right panel depicts the distribution of CSD (violet color coded) and non-CSD
(orange color coded) melanomas on the body (Shain and Bastian, 2016).

9
1.1.5 Role of the immune system
Primary cutaneous melanomas are frequently infiltrated with immune cells. These
include cytotoxic CD8 T cells (CTLs), natural killer cells (NK cells) as well as
dendritic cells and macrophages, which are thought to control tumor growth
(Chen and Mellman, 2017). However, they also include T regulatory cells (Tregs)
and immunosuppressive myeloid cells that antagonize cytotoxic immunity and
promote progressive tumor growth. For example, a recent study by the Tüting
laboratory showed that repetitive UV exposure of mice bearing spontaneous
cutaneous melanomas promoted the recruitment of neutrophils as a result of UV
induced damage of epidermal keratinocytes which enhanced metastatic spread
(Bald et al., 2014a). The balance between anti-tumor immunity and pro-
tumorigenic inflammation co-determines the clinical outcome (Grivennikov et al.,
2010).
1.1.6 Melanoma therapy
William Norris, who described the first case of melanoma in 1820, suggested wide
excision of skin and subcutaneous tissue as surgical management for melanoma
(Lee et al., 2013; Norris, 1857). Another surgeon, Herbert Lumley Snow, provided
a detailed rationale for regional lymphadenectomy in melanoma patients (Snow,
1892). Surgery was the only option for management of melanoma between 1800
and 1950 and continues to be first line of treatment of early stage melanomas
with no metastasis even to the present day. A recent study involving multivariate
analysis of melanoma patients with stage I to III disease showed that early
surgical resection of stage I melanomas was associated with improved clinical
outcome (Conic et al., 2018)
Surgery is not an option for advanced melanomas with distant metastases. In the
1970s large-scale clinical trials proved the efficacy of chemotherapeutic drugs
like dacarbazine and nitrosoureas. Indeed, dacarbazine was approved by the
United States Food and Drugs Administration (FDA) for the treatment of
metastatic melanoma (Lee et al., 2013). Although nitrosoureas showed effect on
melanoma progression it was not approved by FDA due to the aggressive side
effects such as bone marrow suppression and thrombocytopenia.
Chemotherapeutic drugs belonging to the group of vinca alkaloids, paclitaxel and

10
platinums such as cisplatin and carboplatin have also been used in the treatment
of malignant melanoma with moderate efficacy (Luke and Schwartz, 2013).
1.1.7 Novel Immunotherapeutic approaches
The discovery of interferons (IFN) and their role in anti-viral and anti-tumoral
immunity between 1950-1970 marked the dawn of tumor immunotherapy (Isaacs
and Lindermann, 1957; Isaacs et al., 1957; Lee et al., 2013). In the 1980s,
immunostimulatory cytokines became available as recombinant proteins and
IFN-alpha became the first approved treatment. This was followed by the cytokine
IL-2 in the 1990s, a growth factor for IL-2 (Morgan et al., 1976; Smith, 1988).
Patients with advanced metastatic melanoma receiving high dose IL-2 showed
tumor responses in about 16% of patients, with complete and durable regression
in about 6% (Atkins et al., 2000). However, this treatment was associated with
severe side effects frequently requiring monitoring in the hospital (Atkins et al.,
2000; Bhatia et al., 2009; Rosenberg, 2014).
IL-2 was also able to expand tumor-infiltrating lymphocytes (TILs) in vitro. These
lymphocytes contained T and NK cells and were used for adoptive cell transfer
(ACT) therapies, an approach that was first shown to be effective by Rosenberg
and colleagues (Rosenberg et al., 1988). ACT with tumor-specific T cells has
subsequently provided proof of concept for the ability of the adaptive immune
system to control cancer cell growth (Baruch et al., 2017; Yee et al., 2002). More
recently, both CD8+ and CD4+ T cells have been used successfully in ACT
therapies (Li et al., 2017; Muranski et al., 2008; Rosenberg et al., 2008).
2011 and 2014 marked important milestones in cancer immunotherapy with the
FDA approval of antibodies blocking the immune-checkpoint molecules CTLA-4
or PD-1, which are upregulated on T cells upon prolonged T cell activation. T
cells are generated in the thymus where they acquire specificity for large variety
of non-self-antigens by rearrangement of T cell receptor (TCR) genes (Lucas et
al., 2016; Takahama, 2006). T cells recognize antigens in the form of short
peptides presented by major histocompatibility complex (MHC) on the cell
surface. CD8+ T cells require the antigen to be presented on MHC-I and CD4+ T
cells on MHC-II (Janeway et al., 2001). T cells having high affinity for self-
antigens undergo apoptosis in a process called negative selection (Klein et al.,

11
2014). T cell activation in the periphery requires three signals. Signal 1 is provided
by binding of T cell receptor (TCR) with cognate antigen bound to MHC molecules
on professional antigen presenting cells (APCs) such as dendritic cells or
macrophages. Interaction of co-receptor CD28 on T cells with CD80 and CD86
ligands on APCs provide signal 2 followed by cytokines which constitute signal
3, and determine the effector phenotype of the T cells (Sckisel et al., 2015).
CTLA-4 is upregulated on T cells following activation. It then binds to CD80 (B7.1)
and CD86 (B7.2) on antigen presenting cells and prevents the interaction of the
T cell co-receptor CD28 with CD80 and CD86. This terminates T cell activation.
Upregulation of CTLA-4 is also observed on Tregs, which plays an important role
in the prevention of effector T cell activation (Peggs et al., 2009; Redman et al.,
2016; Yao et al., 2013). PD-1 is also a member of the CD28 superfamily and is
upregulated on activated T cells (Dong et al., 2002; Redman et al., 2016). It binds
to its ligands PD-L1 and PD-L2 which are widely expressed in tissues and
upregulated by IFNs during inflammatory responses. Together, CTLA-4 and PD-
1 likely protect against autoimmune responses during infections but inhibit
cytotoxic immunity against cancer cells (Hanahan and Coussens, 2012; Pitt et
al., 2016). Immune checkpoint therapies blocking CTLA-4 and PD1 act by
unleashing the power of anti-tumor T cells. In 2018, the Nobel Prize was awarded
to James P Allison and Tasuku Honjo for identifying CTLA-4 and PD-1,
respectively.
1.2 Experimental mouse models and the role of anti-tumor CD4+ T cells
1.2.1 Early developments
Mouse models have been crucial in the development of immunotherapeutic
approaches to enhance T cell immunity against solid tumors. Already in the mid-
1960s it was reported that the transfer of immune cells from mice or rats bearing
transplanted tumors can cause regression of the same tumors established in a
second mouse or rat (Delforme and Alexander, 1964; Rosenberg et al., 2008;
Urba, 2014). Combining chemotherapy (cyclophosphamide) with immune cell
transfer enhanced their anti-tumor efficacy (Fefer, 1969; van der Most et al.,
2009; North, 1982). Transient lymphodepletion via radiotherapy also enhanced
the efficacy of ACT (Cheever et al., 1977; North, 1982; Urba, 2014). In 1986, it
was first shown that tumor infiltrating lymphocytes (TILs) can be isolated from

12
mice bearing sarcomas or melanomas, expanded ex vivo with the help of IL-2
and re-infused into mice to treat lung and liver tumors (Rosenberg et al., 1986,
2008). Transfer of TILs in conjunction with cyclophosphamide and IL-2 was
extremely efficient in causing melanoma regression (Rosenberg et al., 1986;
Urba, 2014).
1.2.2 Anti-tumoral functions of CD4+ T cells
Traditionally, CD4+ T cells have been considered to provide help for cytotoxic
CD8+ T cells which then carry out antitumor immunity (Borst et al., 2018). In
general, CD4+ T cells help by licensing of dendritic cells through CD40-CD40
ligand interactions (Bennett et al., 1998). However, in addition to supporting the
activation of CD8+ T cells several studies have shown that CD4+ T cells can also
have additional roles in the tumor microenvironment. Recent studies demonstrate
that CD4+ T cells can recognize cancer specific neoantigens which are patient
specific (Linnemann et al., 2014; Ott et al., 2017). CD4+ T cells isolated from
tumors or draining lymph nodes could produce effector IFN-γ, TNF-α as well as
granzyme-B indicating cytotoxic potential (Malandro et al., 2016; Quezada et al.,
2010; Xie et al., 2010). Cytotoxic CD4+ T cells capable of direct killing of tumor
cells in vivo can be induced by engaging the exclusive costimulatory molecule
OX40 (Hirschhorn-Cymerman et al., 2012).
CD4+ T cells can also lead to indirect anti-tumor effects. For example, Th1-biased
CD4+ T cells could induce senescence in tumor cells through secretion of IFN-γ
and TNF-α and thereby indirectly control tumor growth (Braumüller et al., 2013).
Another study demonstrated that CD4+ T cells can induce indirect bystander
killing due to IFN-γ dependent antigen presentation by host cells (Mumberg et al.,
1999; Perez-Diez et al., 2007). The IFN-γ mediated anti-tumor effects of CD4+ T
cells can also involve inhibition of angiogenesis (Qin and Blankenstein, 2000a).
CD4+ T cells can also activate NK cells through IL-2 secretion and thereby
enhance innate anti-tumor effects (Fehniger et al., 2003).
1.2.3 Immunosuppressive functions of CD4+ T cells
CD4+ T cells with a Th-2 phenotype secrete IL-4, IL-13 and IL-10 can render the
tumor microenvironment immunosuppressive and induce M2, tumor promoting
macrophages (DeNardo et al., 2009). CD4+ regulatory T cells (Tregs) show high

13
expression of CD25 and transcription factor FOXP3, secrete TGF-β and are
responsible for protection against auto-immunity (Peck and Mellins, 2010). A
hypoxic tumor microenvironment can shift CD4+ T cells towards the regulatory
phenotype (Facciabene et al., 2011; Westendorf et al., 2017). Regulatory CD4+
T cells infiltrating melanomas, breast and lung carcinomas are associated with
poor prognosis (Ward-Hartstonge and Kemp, 2017).
1.2.4 Tumor immune escape mechanisms
Tumor cells can become resistant to immunotherapeutic intervention (Beatty and
Gladney, 2015; Sharma et al., 2017). They can down-regulate the expression of
antigens and of MHC molecules, upregulate immunoregulatory ligands such as
PD-L1 and PD-L2 and lose IFN-γ responsiveness. For example, reversible
dedifferentiation in an inflammatory microenvironment is associated with down-
regulation of melanocytic differentiation antigens (Landsberg et al., 2012).
Expression of PD-L1 on tumor cells is observed predominantly in areas with high
T cell infiltration, a process termed adaptive resistance. Other immunoregulatory
molecules such as TIM-3 and LAG-3 which are expressed on tumor infiltrating T
cells and immunosuppressive cytokines such as IL-10 and TGF-β which are
present in the microenvironment can further inhibit T cell effector functions
(Beatty and Gladney, 2015; Inozume et al., 2010; Reinhard et al., 2012; Puccetti
and Grohmann, 2007; Wiguna and Walden, 2015).
1.3 Virus vectors for melanoma immunotherapy: Adenovirus and Modified
Vaccinia Ankara Vectors
1.3.1 Structure of Adenovirus
Rowe and colleagues isolated a novel virus in 1953 from adenoid cell cultures
and named it as “adenovirus” (Rowe et al., 1953). Human adenovirus belongs to
the family of adenoviridae and can be divided into seven subgroups or species A
to G and 57 distinct serotypes based on their agglutination properties (Hoeben
and Uil, 2013; Majhen et al., 2014; Yamamoto et al.). Adenoviruses are non-
enveloped double-stranded DNA viruses with icosahedral capsid of 90 nm
diameter (Nemerow et al., 2012). They have a genome of 36 kb with inverted
terminal repeats of approximately 100 bp in size. The 5’ end of the DNA is
attached to a terminal protein. Adenoviral replication is a robust and efficient
process. Once the cell is infected with an adenovirus, the infected cell will

14
produce about one million copies of viral DNA within 40 hours (Hoeben and Uil,
2013). The adenoviral genome in combination with proteins V, VII and X is called
the core of the adenovirus (Majhen et al., 2014). The core proteins, or DNA
associated proteins play an important role in the interaction of the adenovirus with
the host nucleus (Matthews, 2001), assembly of viral particles (Ugai et al., 2012),
DNA binding, initiation of DNA replication, and protection of viral genome from
damage response (Majhen et al., 2014; Xue et al., 2005)
The icosahedral capsid is composed of the protein hexon, the most abundant
structural protein. Penton bases are located at each of twelve vertices of the
capsid and from these penton bases protrude twelve fiber homo-trimers. These
fibers make knob-like structures protruding on the capsid. The interaction
between the Cocksackievirus-and-adenovirus receptor (CAR) and the fiber knob
results in internalization of adenovirus. Penton bases facilitated this process by
binding integrins with RGD motif which is a peptide sequence that mediates cell
attachment (Kanerva and Hemminki, 2004; Majhen et al., 2014; Rux and Burnett,
2004).
Apart from the hexon and penton base, the capsid is composed of proteins IIIa,
VI, VII and IX (Russell, 2009). Phosphorylation of protein IIIa occurs early during
infection at multiple sites of the protein (Tsuzuki and Luftig, 1983) and its
considered to be important for initial stages of viral disassembly (Russell, 2009).
Protein VI has a lytic function, which facilitates the virus to penetrate the
membrane. Additionally, it also plays important role in transporting virus towards
the nucleus (Burckhardt et al., 2011; Fejer et al., 2011; Wiethoff et al., 2005).
Proteins VIII and IX are involved in capsid stability (Liu et al., 2010; Majhen et al.,
2014; de Vrij et al., 2011).
1.3.2 Adenovirus infection pathway
Adenoviral entry into non-immune cells is well characterized (Figure 1.3.2.1). First,
the virus attaches to the cells. For human adenoviruses serotypes 2 and 5, it has
been shown that the high-affinity receptor Coxsackie Adenovirus receptor (CAR)
is crucial for this attachment (Bergelson et al., 1997; Fejer et al., 2011; Waye and
Sing, 2010). Next, the virus enters the cell, a process that is initiated by the
interaction of the penton base arginine-glycine-aspartic acid (RGD) motif and

15
cellular αvβ integrins resulting in endocytosis of the virus. Then, viral disassembly
occurs in the endosome and protein VI acidifies the endosomal membrane
thereby facilitating the disruption and release of viral DNA into the cytosol. Viral
DNA is then transported to the nucleus, a process which is mediated by protein
VI and microtubules. Transcription of early viral genes occurs in the nucleus
resulting in the production of regulatory proteins to prepare the host cell for viral
DNA replication and to prevent anti-viral responses. The adenoviral genome can
be divided into immediately early (E1A), early (E1B, E2, E3 and E4), intermediate
(IX, Iva2) and late genes (a variety of structural proteins). Once the host cell is
acclimatized and suitable for the viral gene replication the major late promoter
(MLP) mediates transcription of the viral genome and late viral genes, encoding
the viral structural proteins and proteins for maturation of viral particles. The
assembly of the virus occurs in the nucleus and new viral particles are released
by cell lysis (Kanerva and Hemminki, 2004; Waye and Sing, 2010).
Figure 1.3.2.1 Adenovirus infection and replication pathway. Adenovirus is internalized by endocytosis once it binds to the receptor which is followed by the release of viral genome in cytoplasm. The genome is transported to nucleus where transcription of early viral genes and late viral genes occurs which is followed by replication of viral DNA. This is then packaged and released by cell lysis (Waye and Sing, 2010).

16
1.3.3 Adenovirus vectors for gene therapy
Adenovirus can be an effective tool to express foreign DNA in target cells.
Adenoviral vectors are well studied, can be produced in high titers, are stable,
and can transduce both dividing and non-dividing cells. These properties make
them ideal for gene therapy. About 400 therapy trials have been or are being
conducted with human adenoviral vectors (Lee et al., 2017; Majhen et al., 2014;
Wold and Toth, 2013). In replication-deficient adenovirus vectors, E1A and E1B
(early transcribed region 1) are deleted and replaced with a transgene under a
strong promoter like the CMV promoter, which drives the expression of the
transgene. These vectors are propagated in cell lines that complement E1
function such as human embryonic kidney (HEK 293) cells and human embryonal
retinoblasts 911 cells.
1.3.4 Adenovirus vectors as cancer vaccines
Recombinant adenoviruses expressing tumor-associated antigens have been
tested in melanoma and prostate cancer in pre-clinical models where they could
augment antitumor immunity. Immunization of mice with adenovirus expressing
prostate-specific antigen and prostate stem cell antigen induced a very strong
anti-tumor CD8+ T cell response (Karan, 2017). Furthermore, vaccination with a
replication-deficient Ad40 based adenovirus expressing mesothelin was shown
to have prophylactic efficacy against metastatic lesions of pancreatic cancer
(Yamasaki et al., 2013). Adenoviral transduced DC-based vaccines have been
studied in pre-clinical models to treat melanoma, but have not so far shown
promises in clinical trials (Steitz et al., 2001; Tuettenberg et al., 2003).
1.3.5 Modified Vaccinia Ankara
Vaccinia virus is a complex double-stranded, encapsulated DNA virus, which
belongs to poxviridae family. The double-stranded DNA codes approximately for
250 genes. Vaccinia viral vaccination for smallpox disease has resulted in
eradication of smallpox in 1980 (Henderson et al., 1988; Sutter and Moss, 1992).
Initially, smallpox infections were treated with variolation involving inoculation of
live smallpox virus in the patients. Despite the inherent safety risks variolation
was a widespread practice in Asian countries and it gathered some popularity in
the UK (Brimnes, 2004). A major breakthrough in treatment of smallpox came,
17
when Edward Jenner first time used cowpox virus as a prophylaxis against
smallpox in a protocol he called “vaccination” (Riedel, 2005).
Vaccinia virus is directly related to the Jenner’s cowpox virus and several features
such as its large packaging capacity of recombinant DNA, absence of genomic
integration risk, strong recombinant DNA expression mediated through the
poxviral promoter, ease of production and high immunogenicity as vaccine makes
it a useful tool for gene therapy and vaccination (Verheust et al., 2012). However,
Vaccinia virus is a biosafety level 2 virus and it is known to infect individuals with
a weak immune system, and dermatological abnormalities (Isaacs, 2004).
Modified Vaccinia Ankara (MVA) is a highly attenuated strain of vaccinia virus
with decreased health risks associated with the wild-type vaccinia virus. MVA is
a biosafety level I virus which is derived from vaccinia virus strain Ankara,
attenuated through more than 570 serial passages in chicken embryo fibroblasts
(Mayr et al., 1975). This virus is replication deficient in mammalian cells but
maintains the advantage of the vaccinia virus capacity to express high levels of
transgene (Staib et al., 2004). MVA has been used as an alternative and safer
vaccine for smallpox and proven to have an excellent safety profile.
1.3.6 Vaccinia Virus structure
Vaccinia virus exists in four different forms, the intracellular mature virus (IMV) or
mature virus (MV), intracellular enveloped virus (IEV), cell-associated enveloped
virus (CEV) and extracellular enveloped virus (EEV or EV). IMV is the most
abundant form and is responsible for transmitting infection between hosts. IEV is
intermediate form between IMV and CEV/EEV, which is responsible for
dissemination of virus to cell surface. CEV is important for cell-to-cell spread and
EEV is important for long-range dissemination of virus in vitro or in vivo (Smith et
al., 2002). Vaccinia virus has dumbbell-shaped core that contains double-
stranded viral DNA genome, enzymes including DNA dependent RNA
polymerase and RNA processing enzymes (Harrison et al., 2004).
The genome of the Copenhagen vaccinia virus strain has been sequenced
completely. It has a 191-kbp of double-stranded DNA genome, from which the
ends are connected by 101 nucleotides long single-stranded hairpin loops. The
genome sequence reveals 185 putative protein-coding sequences. Similar to

18
other poxviruses, the genes encoding structural proteins and essential enzymes
are clustered in the central 120 kb of the genome and genes encoding virulence
proteins are at the ends (Harrison et al., 2004).
1.3.7 Vaccinia virus replication
Replication of pox-virus occurs in the cytoplasm and does not involve the host
nucleus. These viruses form unique cytoplasmic mini-nuclei surrounded by
membranes derived from host endoplasmic reticulum which support viral
replication (Schramm and Locker, 2005; Tolonen et al., 2001). Replication of virus
is summarized in figure 1.3.7.1.
Figure 1.3.7.1 Vaccinia virus replication cycle. Vaccinia virus replication occurs in cytoplasm of the host cell. The virus is attaches to the cell surface and releases its core in to the cell by a not clearly known mechanism, which is followed by transcription of early viral mRNA followed by replication of viral genome and protein synthesis. Next the intermediate and late genes are expressed which facilitates packaging of virus particles are released by host cell lysis. Figure is adapted from (Volz and Sutter, 2017)
The precise mechanism of entry of vaccinia virus into the host cell is unknown.
While MV is the infective form of the vaccinia and responsible for the spread
between the hosts, the EEV form of vaccinia virus is responsible for cell-to-cell
spread within the host (Blasco and Moss, 1992; Moss, 2012; Roper et al., 1998).
Entry of vaccinia virus into the host cell requires fusion of the viral membrane with
the plasma membrane or the endosomal membrane of the host cell (White et al.,
2008). Electron microscopic studies revealed that the fusion occurs via the
interaction of the virus with glycosaminoglycans at the cell surface at neutral pH
(Law et al., 2006). Another study by Townsley and colleagues show that viral

19
entry is accelerated by a low pH resulting enhanced interactions of viral
membrane with endosomes of host cells (Townsley et al., 2006). Once the virus
is attached to the cell, the core is released into the cytoplasm, which is followed
by synthesis of early mRNA and protein synthesis regulated by the early
promoter. Next, DNA synthesis is started and can be detected within two hours
post infection (Moss, 2013). The replicated DNA provides a template for synthesis
of intermediate and late mRNA, which are responsible for virus assembly and
maturation. Enzymes involved in DNA synthesis and packaging of vaccinia virus
are summarized in Table 1.3.7.1.
Table 1.3.7.1 Proteins and viral DNA synthesized during replication cycle of vaccinia virus
Protein Expression Essential
Precursor metabolism
Thymidine Kinase Early No
Thymidylate kinase Early No Ribonucleotide
reductase
Early No
dUTPase Early No
Replication
DNA Polymerase Early Yes
Helicase primase Early Yes
Uracil DNA glycosylase Early Yes
Processivity factor Early Yes
MVA does not replicate in mammalian cells like vaccinia virus but can efficiently
enter the cell and synthesis early, intermediate and late viral genes abundantly.
Therefore, they are efficient in expressing foreign DNA but the assembly of viral
DNA to form the virus particles does not occur thereby inhibiting its replication in
mammalian cells (Volz and Sutter, 2017). MVA has been tested in clinical trials
involving patients with various malignancies like colorectal cancer, prostate
cancer and renal cancer (Amato et al., 2008; Harrop et al., 2011; Scurr et al.,
2017). The clinical trials have shown that it is safe and well tolerated in humans
making an attractive tool as a cancer vaccine.

20
1.3.8 Heterologous prime-boost vaccination
An effective vaccination requires administration of immunization more than once
in the form of prime-boost. The same viral vaccine given more than once,
homologous prime-boost can induce anti-virus antibodies which results in
clearing the virus off the system leading to reduced efficacy of therapy. Prime-
boost with different vaccine vectors encoding the same antigen is known as
heterologous prime-boost and can be more immunogenic when compared to
homologous prime-boost (Lu, 2009). Vaccinia virus is one of the most used
recombinant vectors used in heterologous prime-boost therapy (Cottingham and
Carroll, 2013).
Prime-boost strategies were tested against malaria, HIV and cancer. A recent
study by Chapman and colleagues showed that heterologous prime-boost
vaccination with DNA and MVA vaccines expressing HIV-1 subtype C
immunogen Gag induced strong CD8 and CD4 T cell responses in mice.
furthermore the T cells had effector memory phenotype (Chapman et al., 2017).
A study by Shukarev and colleagues in 2017 showed that prime boost vaccination
with adenovirus and MVA expressing ebola virus glycoprotein induced a strong
antibody and T cell responses against the antigen in healthy 18 to 50 year old
volunteers (Shukarev et al., 2017). Ability of prime-boost vaccine strategies to
induce strong T cell and humoral responses is being studied in malignancies like
prostate cancer, colon cancer and melanomas (Amato et al., 2008; Ilett et al.,
2017; Schweizer and Drake, 2014; Xiang et al., 2017)

21
2. Hypotheses and aims of the thesis work
Tumor cells closely interact with the host’s immune system and immunotherapy
is emerging as a part of standard cancer care. Cytotoxic CD8+ T cells have been
in the main focus of cancer immunologists for many years. More recently, CD4+
T cells have gained increasing attention. Traditionally, CD4+ T cells have been
thought to primarily provide help to cytotoxic CD8+ T cells. In addition, CD4+ T
cells can also have direct anti-tumoral effector functions. The mechanisms how
CD4+ T cells recognize their cognate antigen in tumor tissues and how they exert
their effector functions against tumor cells are incompletely understood.
General hypothesis:
In the current work it was hypothesized that melanocyte antigen-specific CD4+ T
cells can control the growth of melanomas as efficiently as corresponding CD8+
T cells but differ in the way they recognize antigen and exert their effector
functions against tumor cells in the tissue microenvironment.
Specific aims:
1) Develop an adoptive cell therapy (ACT) protocol with CD4+ T cells targeting
the melanocyte differentiation antigen Trp1 and compare its efficacy to the
established ACT protocol with CD8+ T cells targeting the melanocytic antigen
gp100 for the treatment of mice bearing progressively growing transplanted
melanomas.
2) Evaluate the ability of MVA-based virus vaccine vectors to boost CD4+ and
CD8+ T cell responses.
3) Confirm the antigen-specificity of CD4+ T cell ACT using melanoma cell
variants that have lost antigen following CRISPR-Cas9 based genetic ablation
of the Trp1 gene.
4) Investigate the importance of direct antigen recognition on tumor cells for the
anti-tumoral efficacy of CD4+ T cell ACT using melanoma cell variants that
are deficient in direct MHC class II antigen presentation following CRISPR-
Cas9 based genetic ablation of the Class II transactivator (Ciita) gene.

22
3. Material and methods
3.1 Materials
3.1.1 Reagents and Chemicals.
Reagent Manufacturer Order number
β-Mercaptoethanol Sigma-Aldrich M7522
4',6-Diamidino-2-phenylindol
Dihydrochloride (DAPI)
Roth 6335.1
Acetone Merck 100299
Agarose NEEO Roth 2267.4
Ammonium chloride Roth 5470.1
Antibody Diluent (Immune
histology)
DAKO S0809
APS Roth 959,2
FastDigest Bpil Thermo-scientific FD1014
FastDigest BamHI Thermo-scientific FD0054
FastDigest Sall Thermo-scientific FD0644
FastDigest NotI Thermo-scientific FD0593
FastDigest MfeI Thermo-scientific FD0753
FastDigest BglII Thermo-scientific FD0083
FastDigest XhoI Thermo-scientific FD0694
Brefeldin Biolegend 420601
Bovine serum albumin (BSA) Sigma-Aldrich A7030
Butanol Roth 7171.2
Calcium chloride dihydrate Roth 5239.1
Collagenase D Roche 11088866001
DNase Roche 10104159001
dNTPs Fermentas 00030191
Ethanol Merck 1.009.831.011
Ethylenediaminetetraacetic acid
(EDTA)
Roth 8043.2
E. coli: DH10β Prepared in lab ----------
Fast Digest Green buffer Thermo Scientific 00200201
Flouromount-G Southern Biotech 0100-01
Fugene HD transfection reagent Promega E2311
Gene Ruler 100bp Plus DNA
Ladder
Fermentas SM0322
Glycerin Roth 3783.1
Glycin Roth 3790.3
GoTaq G2 DNA Polymerase Promega M7848
HD green DNA stain Intas
Hydrogen peroxide (H2O2) 3% Merck 1.072.091.000
Isopropanol (Propan-2-ol) Fluka 59304-1l-F
KOH Roth P747.2
Laemmli Buffer (2x) Sigma-Aldrich 38733
L-Lysine Sigma 5626-500G
M-Per Mammalian Protein
reagent
Fermentas K0301
Methanol Roth 4627.20
Paraffin Labomedic 52709
Paraformaldehyde (PFA) Roth 0335.1
PBS Life Technologies 14190-094
Phusion HF buffer Biolabs B0518S

23
Phusion HD polymerase New England
Biolabs
M0530S
polyinosinic:polycytidylic acid
(Poly(I:C))
Invivogen PC-32-19
Protease inhibitors Thermo 78438
Proteinase K Macherey&Nagel P14104S
Puromycin PanReac Applichem A2856.0010
Saponin Sigma 47036-50G
Sodium chloride Roth 9265.1
Sodium Dodecyl Sulfate(SDS) VWR 444464T
Streptavidin-HRP R&D 312275
Tetramethylethyldiamin(TEMED) Sigma T9281
Tris Roth 5429.2
Tris-buffered Saline (TBS) DAKO S3001
Tris-HCl Roth 5429.2
Tween 20 Sigma-Aldrich P-1379
T4 DNA Ligase Sigma-Aldrich 000000010481220001 Zinc fixative (10x) BD 12296
Buffer Ingredients
Annealing buffer 100nM NaCL, 50mM Hepes; pH 7.4
Blocking solution
(ELISA)
1% BSA in PBS
Blocking solution
(Histology)
5% BSA in TBS
Collagenase Solution 5mg Collagenase in 500ml PBS, 25ml FCS, 1ml
DNAse (10mg/ml)
Erythrocyte lysis buffer 0.1mM Disodium-EDTA pH 7.3, 155mM NH4Cl;
10mM KHCO3
FACS buffer 2 ml 50mM EDTA, 1% FCS in 500 ml of PBS
Fast digest green buffer Thermo-scientific
Reagent Diluent (ELISA) 1% BSA in PBS
Saponin buffer 0.5% Saponin in FACS buffer
Stripping buffer 200nM glycin; 0.1% SDS; 1% Tween, pH 2,2
10x Transfer buffer 144.2 g Glycine, 30.3 g Tris base in 1000ml
water
1x Transfer buffer 100ml 10x transfer buffer, 200ml methanol and
700ml water

24
Trypan blue solution Trypan blue basis solution (0.4%)
Washing buffer (ELISA) 0.05 % Tween 20 in PBS
Washing buffer
(Histology)
0.1% Tween 20 in PBS
10x Western blot
running buffer
144.12 g Glycine, 10 g SDS, 30.28 g Tris base
in 1000ml water.
Western blot stacking
gel
4.52 ml water, 600 μl 30% acrylamide, 380 μl 2X
stacking gel buffer, 30 μl 10% ammonium
persulfate (APS) and 6 μl TEMED Western blot separating
gel (10%)
5.42 ml water, 6.67 ml 30% acrylamide, 2.5 ml
2X separating gel buffer, 200 μl 10% ammonium
persulfate (APS) and 16 μl TEMED 2X Stacking gel buffer 0.5 M Tris, pH 6.8
2X Separating gel buffer 1.5 M Tris, pH 8.8
Cell culture media and
reagents
Ingredients
PBS Dulbecco's Phosphate-Buffered Saline, Gibco,
14190136
RPMI 1640 RPMI 1640, Gibco, 118350630,1mM HEPES,
Gibco, 15630
50 µM 2-mercaptoethanol, Sigma-Aldrich, M-
3148
50,000units of Penicillin/Streptomycin, Gibco,
15070063
1mM Sodium-Pyruvate, Gibco, 11360039
0,1mM non-essential amino acids,
Gibco, 11140-050
10% (v/v) fetal calf serum (FCS),
Biochrom AG, 0987S
Trypsin-EDTA 0,25% Trypsin-EDTA Phenol Red, Gibco,
25200056
DMEM, high glucose DMEM, Gibco, 41965-0390,1mM HEPES, Gibco,
15630
50 µM 2-mercaptoethanol, Sigma-Aldrich, M-
3148
50,000units of Penicillin/Streptomycin, Gibco,
15070063
1mM Sodium-Pyruvate, Gibco, 11360039
0,1mM non-essential amino acids,
Gibco, 11140-050
10% (v/v) fetal calf serum (FCS),
Biochrom AG, 0987S
3.1.2 PCR primer for next-generation sequencing (NGS)
Gene Sequence: forward Sequence: reverse
Trp1
sgRNA 1
ACACTCTTTCCCTACACGACG
CTCTTCCGATCTCACGAGAGT
GTGCCAATATTG
TGACTGGAGTTCAGACGTGTGCT
CTTCCGATCTCACCTGTGAGAAT
TTTCTGGT
Trp1
sgRNA 2
ACACTCTTTCCCTACACGACG
CTCTTCCGATCTGACCTGTGTT
CTGAACTCTTGCT
TGACTGGAGTTCAGACGTGTGCT
CTTCCGATCTACCTCAGAGGCCA
GGCTTCTC

25
Trp1
sgRNA 3
and 4
ACACTCTTTCCCTACACGACG
CTCTTCCGATCT
GTGGCTGTGATTGCAGACTC
TGACTGGAGTTCAGACGTGTGCT
CTTCCGATCT
AGGATTTAAGGTGACTCCTGA
CIITA
sgRNA 1
and 2
ACACTCTTTCCCTACACGACG
CTCTTCCGATCT
CAGACACTGCTCTCCAGCCA
TGACTGGAGTTCAGACGTGTGCT
CTTCCGATCT
GATGCCAGCTTACCTCCATGGT
CIITA
SgRNA
3 and 4
ACACTCTTTCCCTACACGACG
CTCTTCCGATCT
TAATCCGATGACATATCTGAG
TGACTGGAGTTCAGACGTGTGCT
CTTCCGATCT
GAGACCGGCTCCAAATGAG
CIITA
sgRNA 5
ACACTCTTTCCCTACACGACG
CTCTTCCGATCT
AAGGTGTAGACAGAAAGTGAA
AG
TGACTGGAGTTCAGACGTGTGCT
CTTCCGATCT
CCTCTCAACCTCCTGCACAC
Underlined base pairs in the table above is the region, which anneals with the
region of interest. The sequences highlighted in red and blue are the adapter
sequences in forward primer and reverse primer, which binds the barcoding
primers.
3.1.3 NGS barcode primers
Forward primer with barcode sequence underlined
Name Sequence
D501_long AATGATACGGCGACCACCGAGATCTACACTATAGCCTACACTCTTTCCCTACACGACGCT
D502_long AATGATACGGCGACCACCGAGATCTACACATAGAGGCACACTCTTTCCCTACACGACGCT
D503_long AATGATACGGCGACCACCGAGATCTACACCCTATCCTACACTCTTTCCCTACACGACGCT
D504_long AATGATACGGCGACCACCGAGATCTACACGGCTCTGAACACTCTTTCCCTACACGACGCT
D505_long AATGATACGGCGACCACCGAGATCTACACAGGCGAAGACACTCTTTCCCTACACGACGCT
D506_long AATGATACGGCGACCACCGAGATCTACACTAATCTTAACACTCTTTCCCTACACGACGCT
D507_long AATGATACGGCGACCACCGAGATCTACACCAGGACGTACACTCTTTCCCTACACGACGCT
D508_long AATGATACGGCGACCACCGAGATCTACACGTACTGACACACTCTTTCCCTACACGACGCT
Reverse primer with barcode sequence underlined
Name Sequence
DS701_long CAAGCAGAAGACGGCATACGAGATCGAGTAATGTGACTGGAGTTCAGACGTGTGCT
DS702_long CAAGCAGAAGACGGCATACGAGATTCTCCGGAGTGACTGGAGTTCAGACGTGTGCT
DS703_long CAAGCAGAAGACGGCATACGAGATAATGAGCGGTGACTGGAGTTCAGACGTGTGCT
DS704_long CAAGCAGAAGACGGCATACGAGATGGAATCTCGTGACTGGAGTTCAGACGTGTGCT

26
DS705_long CAAGCAGAAGACGGCATACGAGATTTCTGAATGTGACTGGAGTTCAGACGTGTGCT
DS706_long CAAGCAGAAGACGGCATACGAGATACGAATTCGTGACTGGAGTTCAGACGTGTGCT
DS707_long CAAGCAGAAGACGGCATACGAGATAGCTTCAGGTGACTGGAGTTCAGACGTGTGCT
DS708_long CAAGCAGAAGACGGCATACGAGATGCGCATTAGTGACTGGAGTTCAGACGTGTGCT
DS709_long CAAGCAGAAGACGGCATACGAGATCATAGCCGGTGACTGGAGTTCAGACGTGTGCT
DS710_long CAAGCAGAAGACGGCATACGAGATTTCGCGGAGTGACTGGAGTTCAGACGTGTGCT
DS711_long CAAGCAGAAGACGGCATACGAGATGCGCGAGAGTGACTGGAGTTCAGACGTGTGCT
DS712_long CAAGCAGAAGACGGCATACGAGATCTATCGCTGTGACTGGAGTTCAGACGTGTGCT
3.1.4 Flow cytometry antibodies
Antigen Isotype Clone Company
anti-mouse CD16/32 rat IgG2a,λ 93 BioLegend
anti-mouse CD8 rat IgG2a,ϰ 53-6.7 BD
anti-mouse CD90.1 mouse IgG1,
kappa
OX-7 Biolegend
anti-mouse CD4 rat IgG2a,ϰ RM4-5 Biolegend
anti-mouse CD3 Armenian
hamster IgG
145-
2C11
Biolegend
anti-mouse CD45.2 Mouse (SJL)
IgG2a,ϰ
104 Biolegend
anti-mouse CD45.1 Mouse
(A.SW),
IgG2a,ϰ
A20 Biolegend
anti-mouse CD25 Rat IgG1,λ PC61 Biolegend
anti-mouse CD69 Armenian
hamster
IgG1,λ3
H1.2F3 BD
biosciences
3.1.5 Western Blot and Immunofluorescence antibodies
Antigen Origin species Company
Mouse Trp1 Rabbit
polyclonal
NBP-1 88370; Novus
Mouse Trp1 (M-19) Goat polyclonal sc-10448, Santa Cruz
Biotechnology ß-Actin (C4) mouse sc-47778; Santa Cruz
Biotechnology Alexa488 anti-
rabbit IgG
Donkey 705-545-003, Jackson
ImmunoResearch
3.1.6 ELISA
Reagent Manufacturer Order number Mouse IFN-gamma
Duo-Set
R&D Systems DY008
3.1.7 Histology antibodies
Antigen Origin
species
Company
anti-mouse gp100 Rabbit
polyclonal
NBP1-69571,
Novus
Biologicals

27
biotinylated anti-mouse NGFR Goat
polyclonal
BAF1157, R&D
systems
Biotin goat anti-rabbit goat 111-067-
003Dianova
3.2 Methods
3.2.1 Mice
Mice on the C57BL/6 background were used in all experiments. Congenic
CD45.1 C57BL/6 mice were bred in house. Trp1-specific CD4+ T cell TCR
transgenic mice established by Muranski and colleagues were obtained from
Jackson Laboratories. These CD4+ T cells recognize the MHC class II (H-2-IAB)
binding peptide SGHNCGTCRPGWRGAACNQKILTVR. The mice were bred on
the RAG1−/− background and lack expression of Trp1 (due to the “white based
brown” radiation-induced mutation Tyrp1B-w). This allows for efficient
development of Trp1-specific CD4+ TCR transgenic T cells (Muranski et al.,
2008). Splenocytes of RAG1- BW TRP-1 TCR mice (Trp1 mice) were used for
CD4+ T cell transfer experiments. Mice were screened by staining lymphocytes
for Vβ14, CD4 and CD45.2. In addition, Pmel-1 CD8+ TCR transgenic T cells
established by Overwijk and colleagues were obtained from the Jackson
Laboratories. These CD8+ T cells recognize the MHC class I (H-2Db) binding
human gp100 (amino acids 25-33) peptide KVPRNQDWL. They cross react with
mouse gp100 (amino acids 25-33) EGSRNQDWL. Pmel-1 mice were Thy1.1
(CD90.1), which was used as marker to track the cells in vivo. For CD8+ T cell
transfer experiments, splenocytes were harvested from Pmel-1 TCR-transgenic
mice for adoptive cell therapy. These mice were screened by staining
lymphocytes with CD8, Vβ13 and CD90.1.
All animal experiments were conducted according to the institutional and national
guidelines for the care and use of laboratory animals with approval by the local
government authorities (LANUV, NRW and SA, Germany and SA).
3.2.2 Molecular cloning
Amino-terminal of human PMEL transgene with MHC-I restricted CD8 epitope
was amplified by PCR using the primers with SalI and BamHI overhangs and
cloned into the plasmid pmCherry-N1. pADLOX-gp100 plasmid was used as a
28
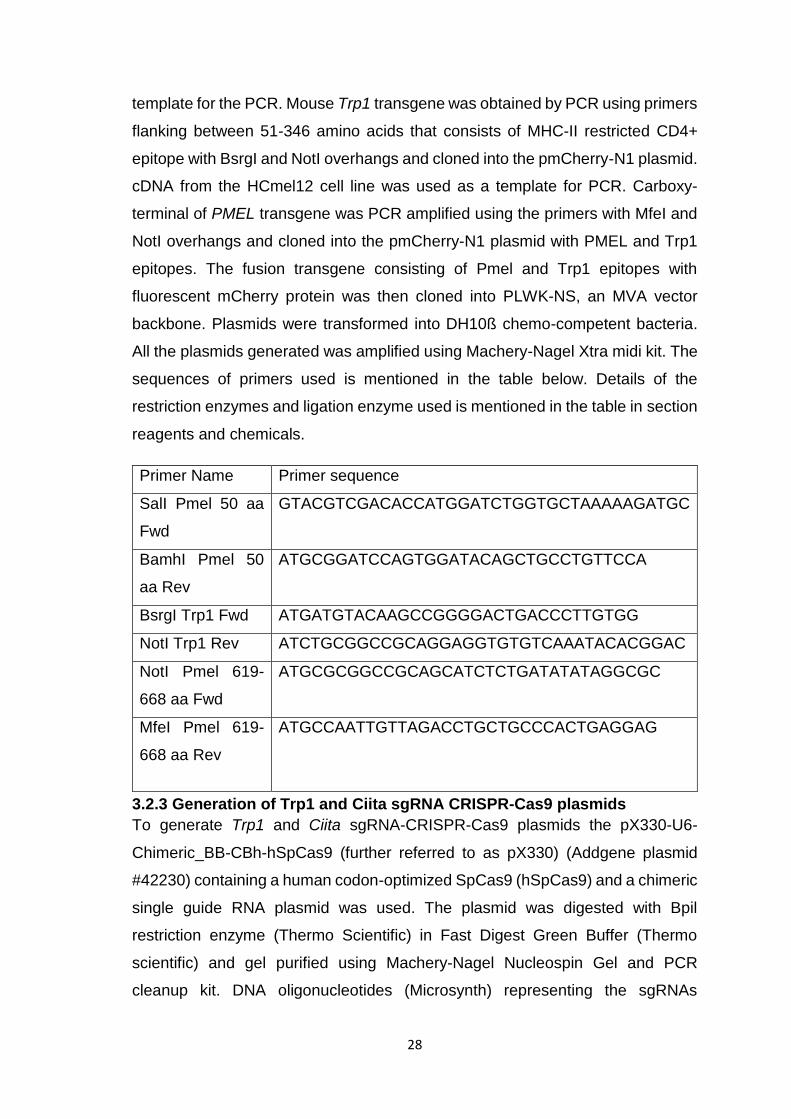
template for the PCR. Mouse Trp1 transgene was obtained by PCR using primers
flanking between 51-346 amino acids that consists of MHC-II restricted CD4+
epitope with BsrgI and NotI overhangs and cloned into the pmCherry-N1 plasmid.
cDNA from the HCmel12 cell line was used as a template for PCR. Carboxy-
terminal of PMEL transgene was PCR amplified using the primers with MfeI and
NotI overhangs and cloned into the pmCherry-N1 plasmid with PMEL and Trp1
epitopes. The fusion transgene consisting of Pmel and Trp1 epitopes with
fluorescent mCherry protein was then cloned into PLWK-NS, an MVA vector
backbone. Plasmids were transformed into DH10ß chemo-competent bacteria.
All the plasmids generated was amplified using Machery-Nagel Xtra midi kit. The
sequences of primers used is mentioned in the table below. Details of the
restriction enzymes and ligation enzyme used is mentioned in the table in section
reagents and chemicals.
Primer Name Primer sequence
SalI Pmel 50 aa
Fwd
GTACGTCGACACCATGGATCTGGTGCTAAAAAGATGC
BamhI Pmel 50
aa Rev
ATGCGGATCCAGTGGATACAGCTGCCTGTTCCA
BsrgI Trp1 Fwd ATGATGTACAAGCCGGGGACTGACCCTTGTGG
NotI Trp1 Rev ATCTGCGGCCGCAGGAGGTGTGTCAAATACACGGAC
NotI Pmel 619-
668 aa Fwd
ATGCGCGGCCGCAGCATCTCTGATATATAGGCGC
MfeI Pmel 619-
668 aa Rev
ATGCCAATTGTTAGACCTGCTGCCCACTGAGGAG
3.2.3 Generation of Trp1 and Ciita sgRNA CRISPR-Cas9 plasmids
To generate Trp1 and Ciita sgRNA-CRISPR-Cas9 plasmids the pX330-U6-
Chimeric_BB-CBh-hSpCas9 (further referred to as pX330) (Addgene plasmid
#42230) containing a human codon-optimized SpCas9 (hSpCas9) and a chimeric
single guide RNA plasmid was used. The plasmid was digested with Bpil
restriction enzyme (Thermo Scientific) in Fast Digest Green Buffer (Thermo
scientific) and gel purified using Machery-Nagel Nucleospin Gel and PCR
cleanup kit. DNA oligonucleotides (Microsynth) representing the sgRNAs
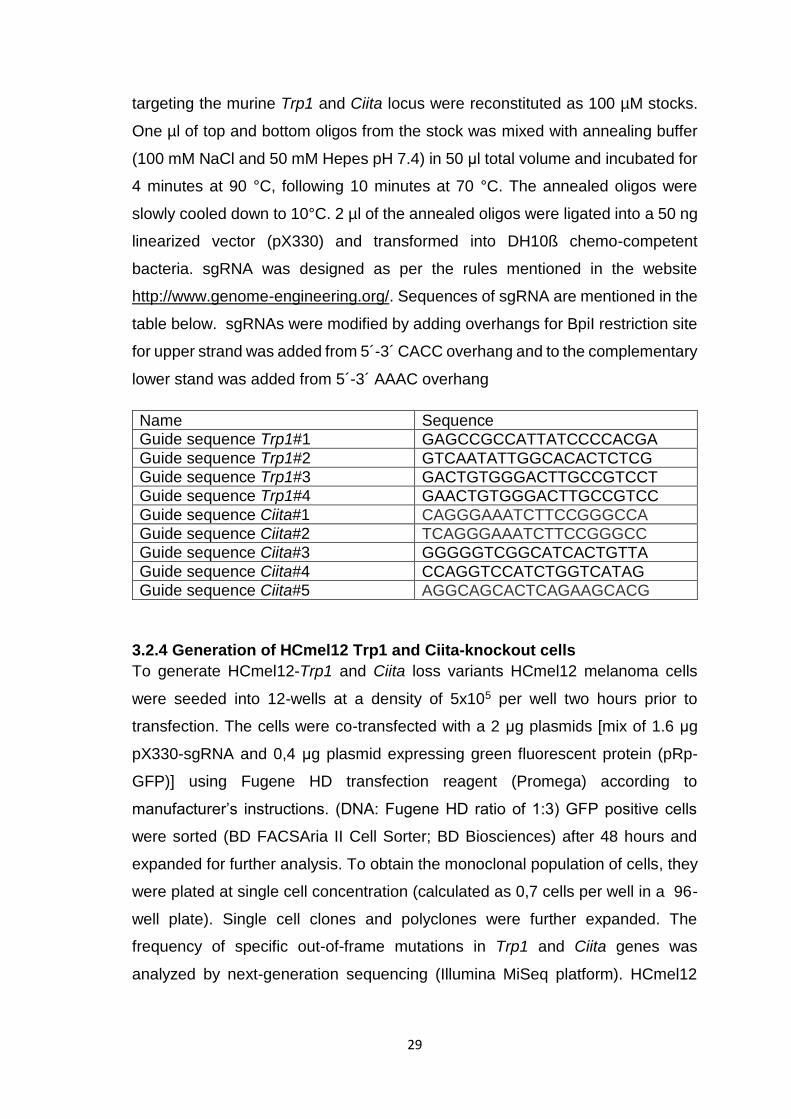
29
targeting the murine Trp1 and Ciita locus were reconstituted as 100 µM stocks.
One µl of top and bottom oligos from the stock was mixed with annealing buffer
(100 mM NaCl and 50 mM Hepes pH 7.4) in 50 μl total volume and incubated for
4 minutes at 90 °C, following 10 minutes at 70 °C. The annealed oligos were
slowly cooled down to 10°C. 2 µl of the annealed oligos were ligated into a 50 ng
linearized vector (pX330) and transformed into DH10ß chemo-competent
bacteria. sgRNA was designed as per the rules mentioned in the website
http://www.genome-engineering.org/. Sequences of sgRNA are mentioned in the
table below. sgRNAs were modified by adding overhangs for BpiI restriction site
for upper strand was added from 5´-3´ CACC overhang and to the complementary
lower stand was added from 5´-3´ AAAC overhang
Name Sequence Guide sequence Trp1#1 GAGCCGCCATTATCCCCACGA
Guide sequence Trp1#2 GTCAATATTGGCACACTCTCG Guide sequence Trp1#3 GACTGTGGGACTTGCCGTCCT Guide sequence Trp1#4 GAACTGTGGGACTTGCCGTCC
Guide sequence Ciita#1 CAGGGAAATCTTCCGGGCCA Guide sequence Ciita#2 TCAGGGAAATCTTCCGGGCC Guide sequence Ciita#3 GGGGGTCGGCATCACTGTTA
Guide sequence Ciita#4 CCAGGTCCATCTGGTCATAG Guide sequence Ciita#5 AGGCAGCACTCAGAAGCACG
3.2.4 Generation of HCmel12 Trp1 and Ciita-knockout cells
To generate HCmel12-Trp1 and Ciita loss variants HCmel12 melanoma cells
were seeded into 12-wells at a density of 5x10⁵ per well two hours prior to
transfection. The cells were co-transfected with a 2 μg plasmids [mix of 1.6 μg
pX330-sgRNA and 0,4 μg plasmid expressing green fluorescent protein (pRp-
GFP)] using Fugene HD transfection reagent (Promega) according to
manufacturer’s instructions. (DNA: Fugene HD ratio of 1:3) GFP positive cells
were sorted (BD FACSAria II Cell Sorter; BD Biosciences) after 48 hours and
expanded for further analysis. To obtain the monoclonal population of cells, they
were plated at single cell concentration (calculated as 0,7 cells per well in a 96-
well plate). Single cell clones and polyclones were further expanded. The
frequency of specific out-of-frame mutations in Trp1 and Ciita genes was
analyzed by next-generation sequencing (Illumina MiSeq platform). HCmel12

30
cells were mock transfected with pX330 plasmid without sgRNA and the
polyclonal cell line was used as a CRISPR control in all performed experiments.
3.2.5 Next generation sequencing
Genomic DNA (gDNA) from cultured cells was extracted using the NucleoSpin
Tissue kit (Macherey-Nagel) according to the manufacturer's recommendations.
A two-step PCR protocol was performed to generate targeted PCR amplicons for
next-generation sequencing (NGS). In the first PCR gene-specific primers for
Trp1 or Ciita with additional adapter sequences complementary to the barcoding
primers was used. The sequencing primers used for the NGS is mentioned in the
table in section reagents and chemicals. The genomic region of interest was
amplified with 18 cycles, using approximately 20-50 ng of gDNA as template and
Phusion HD polymerase (New England Biolabs) in a 12.5 μl mixture according to
manufacturer’s protocol. For the second PCR adapter-specific universal primers
containing barcode sequences and the Illumina adapter sequences P5 and P7 were
used (Illumina barcodes: D501-508 & D701-D712). Therefore, 2 µl of the first PCR
product was amplified with 18 cycles in a 25 μl reaction mix with Phusion HD
polymerase. Next-generation sequencing was performed with MiSeq Gene & Small
Genome Sequencer (Illumina) according to manufacturer's standard protocols with
a single-end read and 300 cycles (MiSeq Reagent Kit v2 300 cycle).
3.2.6 Insertion or deletion (indel) detection
For basic indel detection, the web-based program outknocker
(http://www.outknocker.org/) was used as previously described (Schmid-Burgk et
al., 2014). FASTQ files were imported and the sequence of the Trp1 and Ciita
PCR amplicons was used as reference sequence for alignment.
3.2.7 Cell Culture
The melanoma cell line HCmel12 was established from a primary DMBA-induced
melanoma in Hgf-Cdk4(R24C) mice as described previously (Bald et al., 2014a).
All HCmel12 melanoma cells and the variants were routinely cultured in
“complete RPMI medium”, i.e. RPMI 1640 medium (Life Technologies)
supplemented with 10% FCS (Biochrome), 2mM L-glutamine, 10 mM non-
essential amino acids, 1 mM Hepes (all from Life Technologies), 20 µM 2-
mercaptoethanol (Sigma), 100 IU/ml penicillin and 100µg/ml streptomycin
(Invitrogen). Chicken embryo fibroblasts (DF1), HEK 293T cells, and human

31
embryonal retinoblasts (911 cells) were cultured in DMEM medium supplemented
with 10% FCS, 2 mM L-glutamine, 10 mM non-essential amino acids and 1mM
Hepes. All cell lines used in this study were routinely tested for mycoplasma by
PCR.
3.2.8 Tumor transplantation experiments
For tumor transplantation experiments cohorts of male CD45.1 mice were
injected intracutaneously (i.c.) with 2x10⁵ parental HCmel12 melanoma cells or
HCmel12 Ciita knockout (HCmel12 Ciita-/-) or Trp1 knockout cells (HCmel12
Trp1-/-) resuspended in 100 μl PBS into the right flank. Tumor growth was
monitored by inspection and palpation and archived by digital photography.
Tumor size was measured twice weekly with a vernier caliper and recorded as
the mean diameter of two perpendicular measurements. Mice were sacrificed
when tumors exceeded 20 mm diameter or when signs of illness were observed.
All experiments were performed in groups of at least six mice.
3.2.9 Viral vectors
Adenovirus expressing gp100 and Trp1 epitopes (Ad5-GTY) was generated with
the help of Dr. Di Yu and Prof. Magnus Essand, in the department of Immunology,
Genetics and Pathology, University of Uppsala, Sweden.
Modified vaccinia Ankara virus expressing human gp100 and Trp1 epitopes
(MVA-PMTP) was generated in our laboratory. PLWK-NS plasmid expressing
both the epitopes fused to the mCherry fluorescent protein (PLWK-NS with PMTP
transgene) was used. MVA expressing yellow fluorescent protein was used as a
wild type virus in order to generate the recombinant MVA expressing gp100 and
Trp1 epitopes. Chicken embryo fibroblasts (DF1 cells) were first infected with
wild-type MVA virus expressing eYFP fluorescence protein at MOI of 0.05 to 0.08.
After incubating the cells for 2 hours at 37°C the cells were then transfected with
a PLWK-NS plasmid with PMTP transgene using lipofectamine. The cells were
incubated further at 37°C to allow the spontaneous recombination of the
transfected plasmid with WT MVA genome. After three days the cells were
monitored for the expression of the mCherry fluorescent protein. mCherry
expressing cells were isolated by FACS sorting and used further to generate pure
recombinant MVA expressing epitopes of interest.

32
MVA-OVA virus expressing full length of OVA protein was kindly provided by Prof.
Wolfgang Kastenmüller, Institute for Systems Immunology, University of
Würzburg. Adenovirus expressing full length of OVA protein (Ad5-OVA) was
generated previously in our laboratory.
3.2.10 Adoptive T-cell immunotherapy
When transplanted melanomas reached a size of 2 mm in diameter mice were
preconditioned for the ACT by a single i.p. injection of 2 mg Cyclophosphamide
(Endoxan, Baxter). 24 hours later adoptive cell transfer of Pmel-1 CD8+ T cells
or Trp1 CD4+ T cells or both were performed. 2x10⁶ naïve gp100-specific TCR
transgenic CD90.1+ CD8+ Pmel T-cells and/or 5x10⁵ Trp1 CD4 T cells in 200 µl
PBS were injected by intra-venous route and activated in vivo by a single injection
of 5x10⁷ plaque forming units (PFU) of recombinant adenoviral vector encoding
human GP100 and mouse Trp1 (Ad5-GTY) epitopes. Mice received 50 µg of
Cytosine-phosphatidyl-Guanosine (CpG) 1826 DNA (MWG Biotech) and 50 µg
of polyinosinic:polycytidylic acid (poly I:C); Invivogen diluted in 100 µl water on
days 3, 6 and 9 after adoptive transfer of T cells. 14 days post adoptive transfer
and Ad5-GTY immunization, MVA-PMTP boost vaccine of 107 PFU was given.
3.2.11 Vitiligo scoring
The area of vitiligo-like fur depigmentation on the back of mice was scored on a
scale of 0-100% by three independent investigators in a blinded fashion.
3.2.12 Histology and immunohistology
Tumor tissue samples were immersed in a zinc-based fixative (BD Pharmingen)
overnight, dehydrated in increasing ethanol in water solution concentrations and
xylol and embedded in paraffin. Tissue samples were cut into 4 µm slices using
a microtome and rehydrated in decreasing ethanol in water solution
concentrations. Hematoxylin and Eosin, gp100 and ngfr stainings were
performed on the sections by the histology department of experimental
dermatology, Magdeburg. Slides shown were scanned with Hamamatzu
nanozoomer slide scanner.
3.2.13 Enzyme-linked immunosorbent assay
2x10⁶ wild-type splenocytes were plated in 96-well plates and were transduced
with MVA-PMTP MOI 1. WT splenocytes without virus and WT splenocytes with
MVA-OVA (a non-specific virus) were used as negative controls. Splenocytes

33
pulsed with Trp1 or Pmel peptide were used as positive control. After overnight
incubation with virus, the splenocytes were then co-cultured with 5x10⁵ Pmel-1
splenocytes or 1x10⁵ Trp1 splenocytes for 24 hours. IFN-γ production by Pmel-1
T-cells and Trp1 CD4+ T cells was determined in culture supernatants using an
IFN-γ ELISA kit (R&D) according to the manufacturer's protocol. In brief, 96 well
plates were coated overnight at 4°C with 50 µl capture antibody diluted in PBS
and blocked with PBS containing 1% BSA (assay buffer) for 2 hours. samples
were then added and incubated for 2 hours at room temperature. After washing,
50µl of biotinylated detection antibody diluted in assay buffer was applied for 2
hours at room temperature. Plates were washed again and 100µl streptavidin-
HRP was added to each well and incubated at room temperature for 20 minutes.
The OptEIA system (BD, 555214) was used to visualize bound cytokines. The
colorimetric reaction was stopped with 1M sulfuric acid and optical density was
measured in a microplate reader set to 450nm (BIOTek).
3.2.14 Flow cytometry
To measure Pmel-1 CD8+ T cell and Trp1 CD4+ T cell expansion in vivo, blood
samples were collected from the right facial vein of mice. Erythrocytes were lysed
by RBC lysis buffer for 10 min at room temperature. After washing in FACS buffer
cells were stained with fluorochrome-conjugated mAb specific for mouse CD8,
CD90.1, CD4 and CD45.2 according to standard protocols. The details of
antibodies are mentioned in the table in reagents and chemicals section. To
measure fluorescently labelled melanoma cells, the melanoma tissue was
incubated in collagenase for 15 min at 37°C. Tissues were then processed
through the cell strainer and washed with FACS buffer. IgG Fc receptors II and
III of the cells were blocked using anti-CD16/32 and stained with CD45 in order
to separate immune cells and tumor cells according to standard protocols.
3.2.15 Recognition of HCmel12 and variants by Trp1 CD4+ T cells in vitro
HCmel12 CRISPR ctrl (HCmel12 cells transfected with mock pX330 plasmid),
HCmel12 Trp1-/-, and HCmel12 Ciita-/- were seeded in 96 well plates. After
adherence, they were incubated with Trp1 transgenic CD4+ T cells. After 5 hours
of co-cultures, CD4+ T cells were stained with fluorochrome-conjugated
CD4,CD3,CD25 and CD69 (BD Biosciences, clone H1.2F3). Data were acquired

34
with an acoustic focusing Flowcytometer (Thermofischer Scientific) and analyzed
with the FlowJo software (TreeStar, V10 for Windows).
3.2.16 Cell culture immunofluorescence analysis
Immunofluorescence analysis was performed to validate the HCmel12 Trp1-/-
cells at protein level. HCmel12 CRISPR ctrl and Trp1-/- melanoma cells were
seeded on cover slides in 6 well plates at a density of 1x10⁵ per well. Cells were
washed with PBS and fixed in 4% PFA solution for 10 minutes at 4°C. After
washing cells were stained with a goat polyclonal Trp1 antibody in the dilution
1:100 (sc-10448, Santa Cruz Biotechnology) for 1 hour at room temperature. Anti-
goat Alexa 488 antibodies (Jackson, Imunoresearch) were used as a secondary
antibody at dilution 1:200 and were incubated for 1 hour at room temperature.
Nuclei were counterstained with DAPI. Stained sections were examined with a
Zeiss Axio Observer Z1 fluorescence microscope. Images were acquired with the
Axiocam 506 digital camera and processed with Adobe Photoshop.
3.2.17 Western blot analysis
Melanoma cells were washed in PBS and lysed using the M-PER mammalian
protein reagent (Fermentas) with protease inhibitors (Thermoscientific). The
protein concentration was spectrophotometrically measured by a Bradford-based
assay using Pierce BCA protein assay kit (Thermo Scientific) according to
manufacturer’s protocol. Laemmli buffer was added and lysates were boiled at
95°C for 5 minutes. 10 µg protein was loaded and separated according to size by
SDS–PAGE gel electrophoresis on a 3% stacking and 10% polyacrylamide gel.
Proteins were transferred to PVDF membranes with a 0,2 μm pore size (GE
Healthcare) via wet blotting for 1 hour. Running buffer and blotting buffers used
in immunoblots are mentioned in reagents and chemicals section. Unspecific
binding was blocked with 5% skimmed milk in TBST for 1 hour. Blots were stained
with a goat polyclonal Trp1 antibody (NBP1-88370, Novus biologicals) overnight
at 4°C. Next, the blots were incubated with anti-goat IgG HRP (Santa Cruz) for 1
hour at room temperature. Horseradish peroxidase conjugated β-actin was used
as loading control. Bound antibody was detected by SignalFire ECL reagent (Cell
Signaling technology) and chemiluminescence was visualized using an Octoplus
QPLEX imager (NH DyeAgnostics).

35
3.2.18 Amplification of adenovirus stocks
Ad5-GTY virus was propagated utilizing human embryonal retinoblasts (911) cell
lines. A confluent monolayer of the cells in T175 cell culture flasks was infected
with Ad5-GTY at MOI 1. The cytopathic effects were observed at around 36 hours
of incubation at 37°C. Then cells were scraped using a cell scraper and collected
in PBS. Ten T175 flasks were used to make a batch of adenovirus. The cells
were the freeze-thawed three times and the lysates were cleared by centrifuging
at the speed of 7000 x g. The crude virus was then titered by TCID50 method as
described in Hierholzer and Killington , Virology Methods Manual (Hierholzer and
Killington, 1996).
3.2.19 Amplification of MVA stocks
The MVA was propagated utilizing chicken embryo fibroblasts (DF1) cell lines.
Ten confluent T175 flasks of DF1 cells were infected with MVA at MOI 1 and
incubated for 36 hours at 37°C. Next, the cells were scraped and pelleted by
spinning down at 500 x g for ten minutes in 10 mM Tris. Cells were then freeze-
thawed four times and dounced to homogenise the material. The crude virus was
then centrifuged at 1800 x g for ten minutes remove the cellular debris. The
supernatant was then purified by sucrose cushion ultracentrifugation at
30,000rpm for one hour at 4°C after which the purified virus was titered by TCID50
method.
3.2.20 Titering of Adenovirus and MVA
1x10⁴ 911 cells or DF1 cells were plated in each well in a 96 well plate in 200 μl
DMEM medium. Tenfold serial dilutions of the adenovirus or MVA was prepared
and the dilutions ranging from 10-3 to 10-14 was added to the cells. Virus was
added in 100 μl DMEM medium. The cells were incubated at 37 °C and
expression of fluorescent proteins eYFP in Adenovirus infected 911 cells or
mCherry in MVA infected DF1 cells was monitered every week for up to three
weeks. TCID50 was calculated based on number of infected wells in each dilution.
For example, if all eight wells are counted positive in dilution 10-7 then x=7. If, five
wells were found positive in 10-8 and number of infected wells in highest dilution
10-9 was 2, then TCID 50 is 7-1/2+(8/8+5/8+2/8)= 8.375. Therefore end point
dilution which infects 50% of the wells would be 10-8.375 the reciprocal of which
gives the titer of virus. since the virus is added in 100 μl of DMEM medium per

36
well then the titer would be 108.375 TCID 50/0.1ml or 109.275 TCID 50/ml (Staib et al.,
2004).
3.2.21 Generation of fluorescent HCmel12 melanoma cells
All melanoma cells in this study were transduced with retroviral vectors that were
generated in HEK293T cells following standard protocols using the two retroviral
packaging constructs pCMV-Gag-Pol and pMD.2G (expressing VSVg, vescicular
stomatitis virus envelope) and the retroviral plasmids pRp-mCherry and pRp-
TagBFP (derived from pCLNX derivate, kindly provided by E. Latz, Bonn).
Antibiotic selection with Puromycin (10 µg/ml) was started 48 hours after
infection, for another 48-72 hours. These cells were maintained in culture with
one µg/ml puromycin containing complete RPMI medium.
3.2.22 Selection of statistical tests
For statistical analysis, GraphPad Prism was used. Statistical tests are specified
in corresponding legends of the figures. P-Value less than 0.05 was considered
significant.
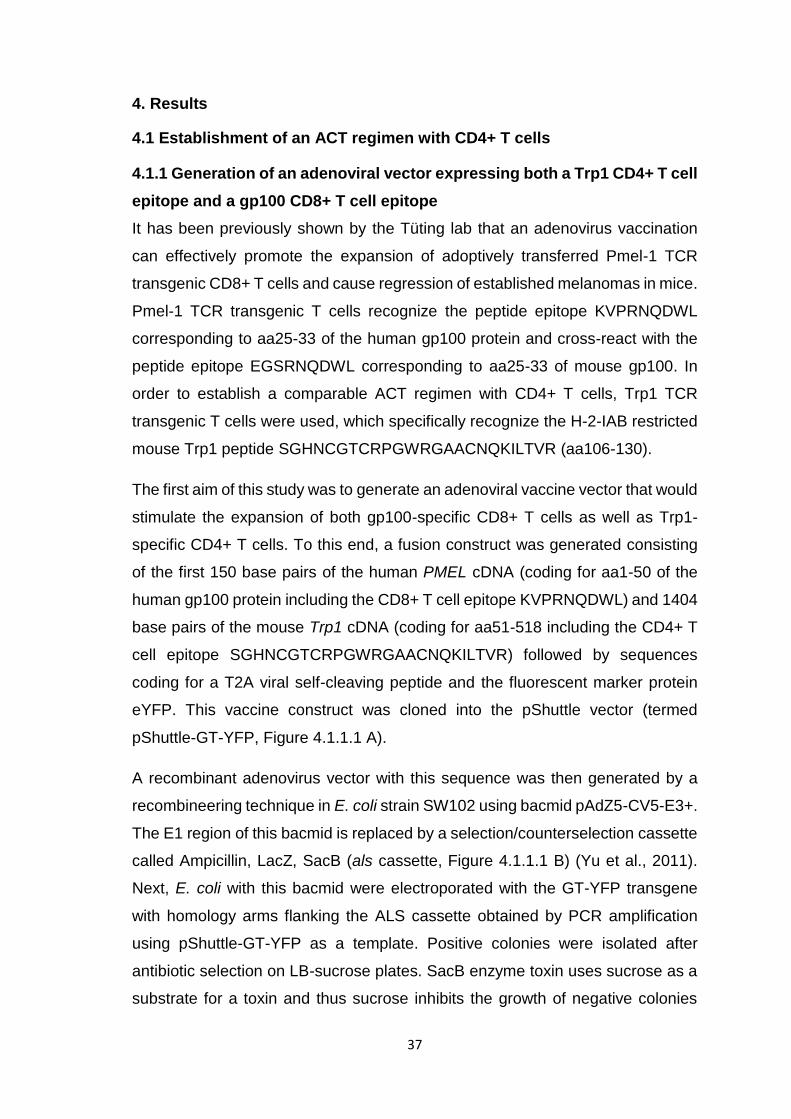
37
4. Results
4.1 Establishment of an ACT regimen with CD4+ T cells
4.1.1 Generation of an adenoviral vector expressing both a Trp1 CD4+ T cell
epitope and a gp100 CD8+ T cell epitope
It has been previously shown by the Tüting lab that an adenovirus vaccination
can effectively promote the expansion of adoptively transferred Pmel-1 TCR
transgenic CD8+ T cells and cause regression of established melanomas in mice.
Pmel-1 TCR transgenic T cells recognize the peptide epitope KVPRNQDWL
corresponding to aa25-33 of the human gp100 protein and cross-react with the
peptide epitope EGSRNQDWL corresponding to aa25-33 of mouse gp100. In
order to establish a comparable ACT regimen with CD4+ T cells, Trp1 TCR
transgenic T cells were used, which specifically recognize the H-2-IAB restricted
mouse Trp1 peptide SGHNCGTCRPGWRGAACNQKILTVR (aa106-130).
The first aim of this study was to generate an adenoviral vaccine vector that would
stimulate the expansion of both gp100-specific CD8+ T cells as well as Trp1-
specific CD4+ T cells. To this end, a fusion construct was generated consisting
of the first 150 base pairs of the human PMEL cDNA (coding for aa1-50 of the
human gp100 protein including the CD8+ T cell epitope KVPRNQDWL) and 1404
base pairs of the mouse Trp1 cDNA (coding for aa51-518 including the CD4+ T
cell epitope SGHNCGTCRPGWRGAACNQKILTVR) followed by sequences
coding for a T2A viral self-cleaving peptide and the fluorescent marker protein
eYFP. This vaccine construct was cloned into the pShuttle vector (termed
pShuttle-GT-YFP, Figure 4.1.1.1 A).
A recombinant adenovirus vector with this sequence was then generated by a
recombineering technique in E. coli strain SW102 using bacmid pAdZ5-CV5-E3+.
The E1 region of this bacmid is replaced by a selection/counterselection cassette
called Ampicillin, LacZ, SacB (als cassette, Figure 4.1.1.1 B) (Yu et al., 2011).
Next, E. coli with this bacmid were electroporated with the GT-YFP transgene
with homology arms flanking the ALS cassette obtained by PCR amplification
using pShuttle-GT-YFP as a template. Positive colonies were isolated after
antibiotic selection on LB-sucrose plates. SacB enzyme toxin uses sucrose as a
substrate for a toxin and thus sucrose inhibits the growth of negative colonies
38
with the intact ALS cassette. The recombinant adenovirus vector generated in
this way was named Ad5-GTY for Gp100-Trp1-YFP. When the human embryonic
retinoblast producer cell line 911 was infected with Ad5-GTY, a strong cytopathic
effect in conjunction with eYFP fluorescence was observed (Figure 4.1.1.1 C)
Figure 4.1.1.1 Adenovirus vector expressing PMEL and Trp1 epitopes (Ad5-GTY) display strong cytopathic effect upon 911-cell line infection. A Map of the plasmid used to generate the adenovirus vector expressing PMEL and Trp1 epitopes fused to yellow fluorescent protein (eYFP) with T2A peptide in-between. B Principle behind recombineering method used to generate new adenovirus vector showing recombination replacing ALS casette with PMEL-Trp1-eYFP transgene (Amp= ampicillin, LacZ=lac operon Z, SacB= levansucrase). C Human 911 cell line infected with the generated adenovirus expressing eYFP and showing strong cytopathic effect.

39
Next, it was tested if the newly generated Ad5-GTY could activate Pmel-1 CD8+
and Trp1 CD4+ T cells in vitro. To this end, the splenocytes from C57BL6 mice
were transduced with Ad5-GTY and then co-cultured with splenocytes of Pmel-1
TCR transgenic or Trp1 TCR transgenic mice (Figure 4.1.1.2 A). It was observed
that only the Ad5-GTY virus induced IFN-γ production by both Pmel-1 CD8+ and
Trp1 CD4+ T cells as measured by ELISA (Figure 4.1.1.2 B and C).
Figure 4.1.1.2 Ad5-GTY activate both gp100 specific Pmel-1 CD8+ and Trp1 specific CD4+ T cells in vitro. A Experimental protocol for ELISA to measure IFN- γ secreted by activated Pmel-1 and Trp1 splenocytes B Bar graph showing induction of IFN-γ cytokine synthesis upon co culturing pmel-1 splenocytes with WT splenocytes transduced with Ad5-GTY. Negative control= WT spenocytes co-cultured with pmel-1 splenocytes in absence of Ad5-GTY. Positive control= Pmel-1 splenocytes pulsed with pmel peptide. C Bar graph showing induction of IFN-γ cytokine synthesis upon co culturing Trp1 splenocytes with WT splenocytes transduced with Ad5-GTY but not with Ad5-GP100 expressing only gp100 epitope. Negative control= WT splenocytes co-cultured with Trp1 splenocytes only. Positive control= Trp1 splenocytes pulsed with Trp1 peptide. Data were pooled from two biological replicates of a single experiment. Statistics calculated by one-way ANOVA by comparing the level of IFN-γ production from the Pmel-1 CD8+ or Trp1 CD4+ T cells cultured with the virus transduced splenocytes against the non-transduced splenocytes, p-Value <0.001=***, p-Value 0.0001=****, error bar represents mean ± SEM.

40
4.1.2 Adenoviral vaccination expands adoptively transferred Trp1 CD4+ T
cells less efficiently than Pmel-1 CD8+ T cells in vivo
After generating the Ad5-GTY adenovirus expressing MHC-I restricted
Pmel/Gp100 and MHC-II restricted Trp1 epitopes, it was tested if an adenoviral
vaccination would be able to promote the expansion of adoptively transferred
Trp1 CD4+ TCR-transgenic T cells and Pmel-1 CD8+ T cells in vivo. A therapy
protocol similar to the Pmel CD8+ T cell ACT protocol previously optimized in the
Tüting lab was used (Kohlmeyer et al., 2009) (Figure 4.1.2.1 A). On day 0, a
lymphodepleting injection of cyclophosphamide was performed in wild-type naïve
mice expressing the congenic markers CD45.1 and CD90.2. The next day,
recipient congenic CD45.1+/CD90.2+ mice received intravenous injections of 5 x
105 CD45.2+/CD90.2 Trp1 CD4+ T cells or of 2 x 10⁶ CD45.2+/CD90.1+ Pmel
CD8+ T cells and a vaccine consisting of 5 x 10⁷ PFU Ad5-GTY virus. On day 3
and 6 mice were treated with subcutaneous injections of poly I:C and CpG. On
day 7 mice were bled and PBMC probed for Trp1 CD4+ T cells or Pmel-1 CD8+
T cells by flow cytometry where the adoptively transferred T cells could be
separated from endogenous T cells on the basis of their congenic markers CD45
and CD90. Only mice receiving the Ad5-GTY vaccine showed expansion of Pmel
CD8+ and Trp1 CD4+ T cells. However, Trp1 CD4+ T cells expanded less
efficiently when compared to Pmel-1 CD8 + T cells (Figure 4.1.2.1 B-C).

41
Figure 4.1.2.1 Trp1 CD4+ T cells expand less efficiently than Pmel-1 CD8+ T cells. A Experimental protocol for adoptive cell transfer (ACT) is shown, C= cyclophosphamide, L= ACT, V=Adenovirus vaccine and I=Poly I:C+CpG. B Representative FACS plots showing no expansion of CD90.1+ Pmel -1 CD8+ T cells and CD45.2+ Trp1 CD4+ T cells in the absence (left panel) and expansion in the presence of the adenoviral (Ad5-GTY) vaccine right panel. C Bar graph showing significantly higher percentage adoptively transferred Pmel-1 CD8+ T cells (blue bar, n=10) when compared to Trp1 CD4+ T cells (red bar, n=10) in blood post priming Ad5 GTY vaccination (Statistics calculated by T test, p-Value= 0.0001, error bar represents mean ± SEM).
Further experiments using adoptively transferred MHC class I restricted OVA 257-
264 specific OT-1 CD8+ T cells and MHC class II restricted OVA 323-339 specific
OT-II CD4+ T cells also showed less efficient stimulation of CD4+ T cells by an
adenoviral vaccine (Figure 4.1.2.2).

42
Figure 4.1.2.2 OT-II CD4 T cells expand less efficiently in blood when compared to OT-I CD8 T cells. A Experimental protocol for adoptive cell transfer (ACT) is shown, C= cyclophosphamide, L= ACT, V=Adenovirus vaccine and I=Poly I:C+CpG. B Representative FACS plots showing expansion of venus+ OT-I CD8+ T cells (left) and CD45.2+ OT-II CD4+ T cells (right) in blood. C Bar graph showing significantly higher percentage adoptively transferred OT-I venus CD8+ T cells (blue bar, n=8) when compared to OT-II CD4+ T cells (red bar, n=8) in blood post priming Ad5 OVA vaccination (Statistics calculated by T test, p-Value= 0.0008, error bar represents mean ± SEM).
4.1.3 Trp1 CD4+ T cell ACT controls melanoma growth and causes
extensive vitiligo in mice with regressing melanomas
Having shown that the Ad5-GTY vaccine could effectively expand both Trp1
CD4+ and Pmel-1 CD8+ T cells in vivo, it was tested if the CD4+ T cell ACT
protocol was able to effectively treat established melanomas. This was of
particular interest because the expansion of CD4+ T cells following Ad5-GTY
vaccination was rather poor when compared to Pmel-1 CD8+ T cells. Groups of
CD45.1 congenic C57BL/6 mice were injected with HCmel12 melanoma cells
intracutaneously into the flanks. When tumors reached a size of 2 to 3 mm, a

43
single dose of lymphodepleting cyclophosphamide was given intraperitoneally
one day before adoptive transfer of Trp1 CD4+ T cells and vaccination with Ad5-
GTY as described above. Mice received 3 doses of poly I:C and CpG
peritumorally on days 3, 6 and 9 post ACT (Figure 4.1.3.1 A). CD4+ T cell ACT
was able to delay the growth of HCmel12 melanomas when compared to
untreated cohorts leading to increased survival of mice (Figure 4.1.3.1 B, C).
Furthermore, responder mice with regressing melanomas showed substantial
vitiligo-like fur depigmentation suggesting an autoimmune effect resulting from
targeting the melanocytic antigen Trp1 (Figure 4.1.3.1 D).

44
Figure 4.1.3.1 Trp1 CD4+ T cell ACT controls the growth of established melanomas and induces vitiligo-like fur depigmentation in responder mice with regressing melanomas. A Experimental protocol for the treatment of HCmel12 melanoma bearing mice with Trp1 CD4+ cell ACT as depicted. C= cyclophosphamide, L= ACT, V=Adenovirus vaccine and I=Poly I:C+CpG B Tumor growth kinetics in 2 different groups of mice,untreated (left, n=6) and Trp1 CD4+ T cell immunotherapy treated (right, n=10). C Kaplan-Meier graph showing the survival of mice (statistics calculated by Log-rank test, p-Value = 0.0001). D Vitiligo development observed in the treatment group in mice responding to therapy and regressing melanoma.

45
4.2 Heterologous prime-boost strategies to enhance T cell ACT
4.2.1 Generation of a Modified vaccina virus vector expressing both a Trp1
CD4+ T cell epitope and a gp100 CD8+ T cell epitope
The experiments so far demonstrated that CD4+ T cells expanded less efficiently
when compared to CD8+ T cells. Therefore, a heterologous prime boost vaccine
strategy was considered in order to increase the efficacy of CD4+ T cell ACT.
Based on the literature, prime-boost vaccination strategies using adenovirus and
MVA-virus have been shown to induce sustained antigen specific CD8+T cell
responses in experimental models for prostate cancer and for malaria infection
(Cappuccini et al., 2016; Fonseca et al., 2017). Therefore, an MVA virus vector
expressing a fusion protein containing the gp100 and Trp1 T cell epitopes
described above was generated (Figure 4.2.1.1).
Figure 4.2.1.1 Schematic representation of the generation of plasmids expressing PMEL (hGP100) epitope and Trp1 epitope fused to mCherry fluorescent protein. A Cloning of the N-terminal end (first 50 amino acids) of the human PMEL gene containing the signal sequence into the multiple cloning site of plasmid pmCherry-N1 between SalI and BamHI restriction sites. B Cloning the central domain (aa51-346) of mouse Trp1 containing the MHC-II restricted epitope recognized by TRP1 TCRtg T cells between BsrgI and NotI restriction sites. C Cloning of the C-terminal end (aa619-688) of PMEL between NotI and MfeI restriction sites (MCS= multiple cloning site).

46
This time mCherry was used as a fluorescent marker protein. The fusion
construct contained only 888bp corresponding to aa51-346 of TRP1 in order to
avoid transcription stop codons of MVA. The fusion construct was subcloned into
the MVA recombination plasmid PLWK-NS containing the MH5 promoter (Figure
4.2.1.2 A). In the resulting plasmid the vaccine construct was flanked by
homologous recombination sites which are directed to the Del III area of the MVA
genome (Figure 4.2.1.2 B). The final plasmid was checked by Sanger
sequencing. It was then transfected into chicken embryo fibroblasts (DF1 cells)
which were co-infected with WT-MVA expressing eYFP. The DF1 cells were daily
monitored and checked for the appearance of mCherry expression resulting from
the spontaneous recombination between the transfected plasmid and parental or
WT-MVA. The protocol is shown in Figure 4.2.1.2 C. Expression of mCherry
indicates the generation of virus with the Pmel and Trp1 epitopes fused to the
fluorescent protein mCherry. The produced virus vector was named Modified
Vaccinia Ankara MVA Pmel-mCherry-Trp1-Pmel (MVA-PMTP).
Next, mCherry expressing DF1 cells were harvested utilizing a sorting flow
cytometer. Only the cells with high mCherry expression were selected (Figure
4.2.1.3 A). Sorted cells were subjected to three freeze-thaw cycles and the lysate
was subsequently used to infect a fresh monolayer of DF1 cells. As shown in
Figure 4.2.1.3 B both the recombinant MVA with the Pmel-mCherry-Trp1 (MVA-
PMTP) fusion transgene as well as the parental MVA (MVA-eYFP) were detected
in the first round of infection. Upon successive purification rounds by picking
mCherry expressing MVA-PMTP plaques, the concentration of the MVA-eYFP
decreased and finally 100% pure recombinant MVA-PMTP was obtained.

47
Figure 4.2.1.2 PLWK-NS plasmid facilitates the recombination of the inserted transgene with parental or wild type Modified vaccinia Ankara. A cloning of PMEL mCherry Trp1 fusion construct into PLWK-NS vector backbone between BglII and SalI restriction sites to generate a plasmid for MVA production. B Schematic representation showing the site in MVA viral genome where the recombination occurs to incorporate the fusion construct into recombinant MVA. C Experimental protocol depicting generation of recombinant MVA by spontaneous recombination between wild-type viral genome with the transgene of interest. (MVA= Modified vaccinia Ankara)

48
Figure 4.2.1.3 Recombinant MVA-PMTP was generated and and plaque purified. A Sorting of mCherry high expressing DF1 cells to generate recombinant MVA. B Microscopic images of DF1 producer cells infected with the freeze-thaw lysates from sorted cells. In the upper panel wild type virus expressing eYFP can be observed and few mCherry expressing cells indicating presence of recombinant MVA. Subsequent plaque purification of the virus resulting in decrease of eYFP expressing virus and increase of mCherry expressing virus plaques (middle panel). In the lower panel we can see the presence of only the recombinant MVA expressing mCherry.

49
Next, it was tested if the MVA-PMTP generated could activate Pmel-1 CD8+ and
Trp1 CD4+ T cells in vitro. To this end, the splenocytes from C57BL6 mice were
transduced with MVA-PMTP or with MVA-OVA as a control. Transduced
splenocytes were then co-cultured with Pmel-1 CD8+ T cells (Figure 4.2.1.4 A).
Only the MVA-PMTP virus induced IFN-γ production by Pmel-1 CD8+ T cells as
measured by ELISA (Figure 4.2.1.4 B).
Figure 4.2.1.4 MVA-PMTP activates gp100 specific Pmel-1 CD8+ T cells in vitro. A Experimental protocol for ELISA to measure IFN- γ secreted by activated Pmel-1 splenocytes B Bar graph showing induction of IFN-γ cytokine synthesis upon co culturing pmel-1 splenocytes with WT splenocytes transduced with MVA-PMTP. MVA-OVA was used as non specific virus. Negative control= WT spenocytes co-cultured with pmel-1 splenocytes in absence of MVA. Positive control= Pmel-1 splenoctes pulsed with pmel peptide. Data is pooled from two biological replicates from single experiment. Statistics calculated by one-way ANOVA by comparing the level of IFN-γ production from the Pmel-1 CD8+ T cells cultured with the virus transduced splenocytes against the non-transduced splenocytes, p-Value 0.0309 =*, p-Value 0.0001=****, error bar represents mean ± SEM.

50
To test if the MVA-PMTP could also activate Trp1 specific CD4+ T cell in vitro,
splenocytes transduced with MVA-PMTP or MVA-OVA were co-cultured with
MACS purified Trp1 CD4+ T cells (Figure 4.2.1.5 A). FACS analysis for
intracellular IL-2 was performed. It was observed that only MVA-PMTP
transduced splenocytes induced IL-2 synthesis in Trp1 specific CD4+ T cells
(Figure 4.2.1.5 B).
Figure 4.2.1.5 MVA PMTP expressing Pmel and Trp1 epitopes activate Trp1 CD4+ T cells in vitro. A Experimental protocol for FACS analysis to measure intracellular IL-2 in activated Trp1 CD4+ T cells B FACS dot plots showing induction of IL 2 cytokine synthesis in activated Trp1 CD4+ T cells co cultured with WT splenocytes transduced with MVA-PMTP. MVA OVA was used as non specific virus vector control. Negative control= WT spenocytes co-cultured with Trp1 CD4 T cells in absence of MVA. Positive control= Trp1 CD4 T cells activated with T cell activation cocktail containing PMA+ionomysin.

51
4.2.2 Ad5-GTY priming and MVA-PMTP boosting works for Pmel-1 CD8+ T
cells but not for Trp1 CD4+ T cells in vivo
Next, the ability of an MVA vaccine to boost Trp1 CD4+ T cell and Pmel-1 CD8+
responses was tested. On day 0, a lymphodepleting injection of
cyclophosphamide was provided to wild-type C57BL/6 mice expressing the
congenic markers CD45.1 and CD90.2. The next day, mice received 2 x 10⁶
CD90.1+ Pmel-1 CD8+ T cells and 5 x 10⁵ CD45.2+ Trp1 CD4+ T cells and 5 x
107 PFU Ad5-GTY virus. Subsequently, mice received three intradermal
injections of poly I:C/CpG on days 3,6 and 9 days post ACT. On day 14 mice
MVA-PMTP or MVA-OVA control vaccines were administered subcutaneously
(Figure 4.2.2.1A). Blood was obtained 7 and 19 days post ACT and Pmel-1 CD8+
T cells and Trp1 CD4+ T cells expansion characterized by flow cytometry using
the congenic marker CD90.1 in for CD8+ T cells and CD45.2 for CD4+ T cells,
respectively (Figure 4.2.2.1 A).
As shown above, a Pmel-1 CD8+ cells expanded much more effectively when
compared Trp1 CD4+ T cells upon priming with Ad5-GTY (Figure 4.2.2.1 B-C).
Following the MVA boost vaccine, a secondary expansion of Pmel-1 CD8+ T cells
was observed in the mice receiving MVA-PMTP but not MVA OVA (Figure 4.4.1
B top panel). However, MVA-PMTP vaccination failed to boost the Trp1 CD4+ T
cells (Figure 4.2.2.1 B bottom panel). After Ad-MVA prime boost vaccination the
mice that received MVA-PMTP virus had a higher percentage of Pmel-1 CD8+ T
cells in the blood when compared to mice that received MVA-OVA (Figure 4.2.2.1
C). Although MVA-PMTP failed to boost Trp1 CD4+ T cells, the cohorts showed
better persistence of Trp1 CD4+ T cells when compared to the cohorts that
received MVA-OVA (Figure 4.2.2.1.C). These results confirmed the specificity of
the recombinant viruses generated here and demonstrated that CD8+ T cells
show better expansion and boosting than CD4+ T cells following adenovirus and
MVA vaccinations, respectively.

52
Figure 4.2.2.1 Heterologous prime-boost immunization with Ad5-GTY and MVA-PMTP vectors expand and boost Pmel-1 CD8+ T cells but not Trp1 CD4+ T cells. A Experimental protocol for adoptive cell transfer and heterologous prime-boost vaccination with Ad5-GTY and MVA-PMTP virus vectors, C= cyclophosphamide, L= ACT, V=Adenovirus vaccine and I=Poly I:C+CpG. B Representative FACS dot plots showing expansion after Ad5-GTY priming and secondary expansion after MVA-PMTP boosting for Pmel-1 CD8+ T cells (top) and Trp1 CD4+ T cells (bottom). C Bar graphs showing the percentage of Pmel-1 CD8+ T cells and Trp1 CD4+ T cells in the blood of cohorts receiving Ad5-GTY prime and MVA-PMTP boost vaccination (left panel) or Ad5-GTY prime and MVA-OVA boost vaccination (right panel) n=10 mice in each cohort. Student T test was used to compare the CD8+ and CD4+ T cell abundancy. P-Value <0.01 **, <0.001***, <0.0001 ****, error bar represents mean ± SEM.

53
4.2.3 MVA booster vaccination does not improve the therapeutic efficacy of
the adoptive T cell therapy
The next experiments were aimed to test if the MVA-PMTP boost vaccine was
able to specifically improve the therapeutic efficacy of CD8 and CD4 T cell
combination ACT. Treated groups of tumor bearing mice were either boosted with
MVA-PMTP or MVA-Ova locally in the tumor microenvironment (Figure 4.2.3.1
A). Both treatment cohorts showed comparable tumor growth control without
significant survival differences between mice receiving MVA-PMTP or MVA-OVA
as a boost vaccine (Figure 4.2.3.1 B,C). Thus, MVA boost vaccination could not
improve antigen-specific T cell immunity in this experimental setting.
Longterm surviving mice in the MVA-PMTP treated groups showed a tendency
to develop more vitiligo when compared to the MVA-OVA group but this did not
reach significance (Figure 4.2.3.2).

54
Figure 4.2.3.1 MVA boost vaccination does not significantly increase the survival of T cell ACT treated mice. A Schematic representation of adoptive cell transfer in HCmel12 tumor-bearing mice using heterologous prime-boost with Ad5 and MVA respectively. C= cyclophosphamide, L= ACT, V=Adenovirus vaccine and I=Poly I:C+CpG B Tumor growth kinetics of untreated control group (n=5), MVA-PMTP boosted (n=10) and MVA-OVA boosted (n=8) cohorts C Kaplan meier graph showing survival of treated cohorts compared to untreated control (Log rank test, p-Value= < 0.0001,**** and 0.0050, **)

55
Figure 4.2.3.2 Mice with regressing HCmel12 melanomas show vitiligo-like fur depigmentation. A Skin depigmentation observed in mice that regressed melanoma following immunotherapy. B Dot plot showing vitiligo score of the mice receiving MVA-PMTP and MVA-OVA. Error bars represents mean ± SEM.
4.2.4 Co-transfer of tumor antigen specific CD8+ and CD4+ T cells controls
melanomas only marginally better than CD8+ or CD4+ T cells alone
Next, it was investigated whether the combination of CD4+ and CD8+ T cell ACT
would result in increased anti-tumor efficacy when compared to ACT involving
either CD4+ or CD8+ T cells only. To this end, mice were intracutanously injected
with HCmel12 melanoma cells. When the tumors reached a diameter of 2-3 mm,
mice were randomly assigned to three groups and treatment was started. Mice
received Trp1 CD4+ T cell ACT, Pmel-1 CD8+ T cell ACT or combined Trp1
CD4+ T and Pmel-1 CD8+ T cell ACT (Figure 4.2.4.1 A). All three treatment
groups showed transient control of melanoma growth with some mice
experiencing complete regression and some mice eventually escaping therapy
(Figure 4.2.4.1 B). The Kaplan-Meier survival graph showed that there was no
significant difference between the treatment groups (Figure 4.2.4.1 C) with the
cohorts receiving combination therapy showing marginally better survival when
compared to the cohorts receiving Pmel-1 CD8+ or Trp1 CD4+ T cell
monotherapy (Figure 4.2.4.1 C). Taken together these results nevertheless
demonstrated that CD4+ T cell ACT could be as effective as CD8+ T cell ACT.

56
Figure 4.2.4.1 Pmel-1 CD8+ T cell and Trp1 CD4+ T cell combination therapy was only marginally more effective in controlling the growth of melanoma when compared to Trp1 CD4+ T cell or Pmel-1 CD8+ T cell monotherapy. A Experimental protocol for therapy of HCmel12 tumor bearing mice using heterologous prime-boost vaccination with Ad5-GTY and MVA-PMTP, respectively and different T cell transfers as depicted. C= cyclophosphamide, L= ACT, V=Adenovirus vaccine and I=Poly I:C+CPG. B. Tumor growth kinetics in 3 different groups of mice always treated with double antigen heterologous prime-boost vaccination and either Trp1 CD4+ T cells (CD45.2+) alone (n=15), Pmel-1 CD8+ T cells (CD90.1+) alone (n=13) or the combination of PMEL CD8+ and Trp1 CD4+ T cells (n=15 ). C Kaplan-Meier graph showing the survival of mice (Gehan-Breslow-Wilcoxon test, p-Value= 0.0062).

57
4.2.5 HCmel12 melanomas that relapse after T cell immunotherapy show
down-regulated expression of the melanocytic target antigens
HCmel12 melanomas that relapsed in mice after heterologous prime-boost
vaccination with Trp1 CD4+ T cell ACT or with CD4+ and CD8+ T cell ACT
macroscopically showed increased hypomelanotic areas when compared to
untreated tumors, suggesting down-regulation of antigen expression as a
mechanism of therapy resistance. It was hypothesized that melanoma cells
acquired a dedifferentiated phenotype which is characterized by upregulation of
markers such as Ngfr which are expressed in neural crest precursors as was
previously shown by the Tüting laboratory upon Pmel-1 CD8+ T cell ACT
(Landsberg et al., 2012). qPCR analysis indeed demonstrated that relapse
melanomas down-regulated mRNA for the melanocytic target genes Trp1 and
gp100. In addition, the master transcription factor of the melanocytic lineage, Mitf,
was down-regulated and the neural crest marker Ngfr was up-regulated (Figure
4.2.5.1) suggesting coordinate dedifferentiation.
Figure 4.2.5.1 Tumors escape melanocyte lineage antigen targeted T cell therapy by de-differentiation. A Graphical representation of the treatment groups and melanoma samples with the genes studied in qPCR. B Bar Graphs showing fold change in the melanoma differentiation genes (left panel) in Trp1 CD4+ACT (red bar) and treated Trp1CD4+ and Pmel-1 CD8+ combination ACT treated (green bar) groups and dedifferentiation genes (right panel) of the same treatment cohorts. Error bar represents mean ± SEM. Two-way ANOVA analysis was done and mean fold change of each gene was compared to the fold change of corresponding gene in untreated group p-Value <0.0001=****, <0.001=***, <0.01=**.

58
The results of the mRNA analyses were confirmed on the protein level by
immunohistochemical analyses showing down-regulation of gp100 as well as
upregulation of Ngfr in relapse tumor tissues (Figure 4.2.5.2).
Figure 4.2.5.2 Immunohistochemical analyses of HCmel12 relapse melanomas. A Gross appearance of untreated HCmel12 melanoma showing pigmentation and immunohistochemical analyses for gp100 and ngfr expression. B Gross appearance of a Trp1 CD4+ T cell treated HCmel12 melanomas showing depigmentation, loss of gp100 expression and increased ngfr expression. C. Similar appearance of a HCmel12 melanoma after pmel-1 CD8+ and Trp1 CD4+ T cell combination ACT.
59
4.3 Mechanisms of CD4+ T cell anti-tumor effector functions
4.3.1 Genetic ablation of the Trp1 gene in melanoma cells using CRISPR-
Cas9 genome editing
The experiments with Trp1 CD4+ T cell ACT so far demonstrated less efficient
expansion following adenoviral vaccination when compared to Pmel-1 CD8+ T
cell ACT. However, despite their lower numbers, CD4+ T cells were able to
control the growth of established melanoma equally well. Importantly, immune
escape by downregulation of melanocytic antigen expression was observed in
TRP1 CD4+ T cell ACT treated mice. Together with reports in the literature this
suggested direct anti-tumor effector functions of the adoptively transferred CD4+
T cells.
Subsequent experiments were designed to address the mechanisms of CD4+ T
cell effector functions. To investigate the role of principally reversible (phenotypic)
vs. irreversible (genetic) antigen loss, HCmel12 melanoma cells lacking Trp1
expression were generated by targeting the Trp1 gene using the CRISPR-Cas9
gene editing technology. The mouse Trp1 gene consists of seven coding exons.
Exon 2 contains the start codon of the gene as well as the MHC-II restricted
epitope CRPGWRGAACNQKIL (Muranski et al., 2008). Therefore, four single
guide RNAs (sgRNAs) were designed to target this exon. A schematic
representation of the Trp1 gene target region as well as the guide sequences
used are shown in figure 4.3.1.1.

60
Figure 4.3.1.1 Design of sgRNAs targeting the mouse Trp1 gene locus. Schematic outline of the generation of sgRNAs targeting a 20 bp site in the mouse Trp1 locus. Exon 1 of Trp1 gene is shown which was targeted by sgRNAs. Four sgRNAs complementary to the target region of Trp1 upstream and on the region encoding for the Class II-restricted epitope was designed. sgRNA sequences are shown along with the adjacent PAM sequence in blue color.
HCmel12 cells were co-transfected with a GFP expression plasmid along with the
px330-derived plasmid containing the U6 promoter driving transcription of the
different sgRNAs and as well as the chicken beta-actin promotor driving
transcription of the Cas9 enzyme (Cong et al., 2013). 72 hours later, GFP
expressing cells were sorted and expanded to obtain a putative polyclonal
population of Trp1 knockout HCmel12 cells. The polyclonal population was
seeded as single cells in 96 well plates and pure monoclones raised. The
overview of the procedure is shown in figure 4.3.1.2 A. The Trp1 gene of different
monoclones was then analyzed using next generation sequencing technology
(figure 4.3.1.2 B). Data analysis revealed that the monoclones 1-4 had an
insertion of 1 nucleotide or a deletion of 65, 1 or 5 nucleotides at the CRISPR
target site of the Trp1 gene, each causing a frame shift resulting in a genetic
knockout (HCmel12 Trp1-/-). Figure 4.3.1.2 B shows pie charts representing the
four different pure monoclones. Sequencing of the wild-type cell line transfected
with pX330 plasmid without sgRNA revealed that this cell line retained an intact
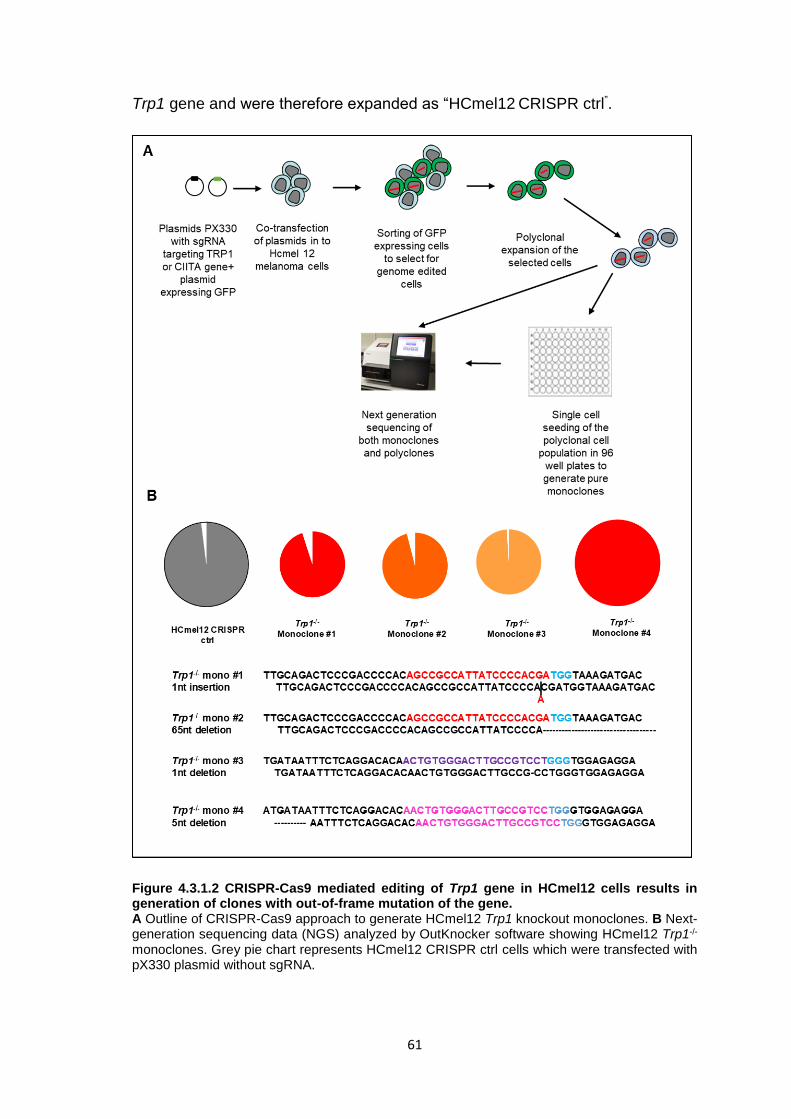
61
Trp1 gene and were therefore expanded as “HCmel12 CRISPR ctrl”.
Figure 4.3.1.2 CRISPR-Cas9 mediated editing of Trp1 gene in HCmel12 cells results in generation of clones with out-of-frame mutation of the gene. A Outline of CRISPR-Cas9 approach to generate HCmel12 Trp1 knockout monoclones. B Next-generation sequencing data (NGS) analyzed by OutKnocker software showing HCmel12 Trp1-/- monoclones. Grey pie chart represents HCmel12 CRISPR ctrl cells which were transfected with pX330 plasmid without sgRNA.

62
Immunofluorescence staining as well as western blot analysis confirmed the loss
of the Trp1 protein expression in the four HCmel12 Trp1-/- monoclones (figure
4.3.1.3 A and B). HCmel12 CRISPR ctrl cells had intact Trp1 expression.
Figure 4.3.1.3 Frame shift mutations caused by CRISPR-Cas9 mediated editing of Trp1 gene result in loss of protein expression. A. Immunofluorescence staining showing Trp1 protein expression (green) and nucleus (blue) in HCmel12 CRISPR ctrl cells (left) and absence of proteins in knockout monoclones (right upper and lower panel). Nuclei is counterstained with DAPI (blue) B. Western blots showing loss of expression of the Trp1 protein in HCmel12 Trp1-/- monoclones.

63
4.3.2 Trp1 CD4+ T cells do not recognize Trp1-/- HCmel12 melanoma cells in
vitro
Next, the consequence of loss of Trp1 expression by tumor cells on recognition
by Trp1 CD4+ T cells was studied in vitro. First, the HCmel12 CRISPR ctrl cells
were treated with IFN-γ. This upregulated the expression of class II molecules on
their cell surface (figure 4.3.2.1).
Figure 4.3.2.1 HCmel12 CRISPR ctrl melanoma cell line upregulates MHC-II upon treatment with IFN-γ. A Experimental plan for the analysis of MHC-II expression on HCmel12 CRISPR ctrl cells. B. FACS histograms showing no upregulation of MHC-II on HCmel12 CRISPR ctrl cells without IFN-γ and gradual upregulation with IFN-γ treatment.
Next, melanoma cells were co-cultured for 5 hours with Trp1 CD4+ T cells after
which the T cell activation status was analyzed by flow cytometry (Figure
4.3.2.2A). The Trp1 CD4+ T cells recognized HCmel12 CRISPR ctrl cells (figure
4.3.2.2 B upper panel) and upregulated the activation marker CD69. In contrast,
Trp1-/- monoclones were not able to upregulate CD69 on T cells (figure 4.3.2.2 B.
lower panel respectively).

64
Figure 4.3.2.2 HCmel12 Trp1-/- cells do not activate antigen specific Trp1 CD4+ T cells in vitro. A. Experimental plan for co-culturing HCmel12 Trp1-/- and CRISPR ctrl cells with Trp1 CD4+ T cells. B. Representative FACS plots showing CD69 on CD4+CD45.2+ cells upon co-culture with HCmel12 CRISPR ctrl (top panel) and HCmel12 Trp1-/- cells (bottom panel). Negative ctrl is Trp1 CD4+ cells without tumor cell coculture and positive control is Trp1 CD4+ T cells stimulated with T cell activation cocktail (PMA+ionomysin).

65
4.3.3 Trp1 CD4+ T cell ACT is ineffective against HCmel12 Trp1-/-
melanomas
Having shown that Trp1 CD4+ T cells cannot recognize Trp1-/- HCmel12 cells in
vitro, the ability of Trp1-/- HCmel12 cells to evade TRP1 CD4+ T cell responses
in vivo was studied. To address this question HCmel12 CRISPR ctrl cells and
mixtures of three Trp1-/- HCmel12 monoclones were transplanted
intracutaneously into syngeneic WT mice. When the tumors reached a size of 2
to 3 mm, they were randomly assigned for the TRP1 CD4+ T cell ACT regimen
described above or for untreated control groups (figure 4.3.3.1 A).
HCmel12 CRISPR ctrl and the mixture of Trp1-/- HCmel12 monoclones grew
progressively in the untreated control groups with a similar growth rate. However,
while HCmel12 CRISPR ctrl melanomas responded to TRP1 CD4+ T cell ACT
(with 5/7 complete regressions), Trp1-/- HCmel12 melanomas largely did not (with
only 1 responding mouse), as shown in figure 4.3.3.1 B. As a consequence,
survival of treated mice bearing HCmel12 CRISPR ctrl melanomas was
significantly prolonged when compared to mice bearing Trp1-/- HCmel12
melanomas (figure 4.3.3.1 C).

66
Figure 4.3.3.1 HCmel12 Trp1-/- melanomas fail to respond to Trp1 CD4+ T cell ACT. A Schematic representation of adoptive cell transfer in mice bearing HCmel12 CRISPR ctrl (Group 1 and 2) and HCmel12 Trp1-/- (Group 3 and 4). C= cyclophosphamide, L= ACT, V=Adenovirus vaccine and I=Poly I:C+CPG. B Tumor growth in mice bearing HCmel12 CRISPR ctrl (upper panel, untreated n=7 and treated n=10) or HCmel12 Trp1-/- (lower panel, untreated n=4 and treated n=6). C Kaplan-Meier graph showing survival of mice in 4 different experimental groups (statistics calculated by log rank test, p-Value <0.0001 ****, 0.004 to 0.009 **).

67
In subsequent experiments, the Trp1-/- melanoma cells were admixed with
HCmel12 CRISPR ctrl cells, inoculated in the skin of mice and a potential
selection advantage under treatment with Trp1 CD4+ T cell ACT was
investigated. To discriminate between HCmel12 Trp1-/- and CRISPR ctrl
melanoma cells we performed stable retroviral transductions with TagBFP and
mCherry as fluorescent marker genes. The three Trp1-/- mCherry or TagBFP
labelled monoclones (1:1:1) were admixed with HCmel12 CRISPR ctrl cells
labelled with mCherry or TagBFP, respectively, to achieve an overall Trp1-/-
frequency of 25% as shown in the figure 4.3.3.2.
Figure 4.3.3.2 Mixtures of fluorescently tagged Trp1-/- and wild-type HCmel12 melanoma cells in vitro. FACS plots showing the percentages of mCherry expressing HCmel12 Trp1-/- and TagBFP expressing HCmel12 CRISPR ctrl (left) and of mCherry expressing HCmel12 CRISPR ctrl and TagBFP expressing HCmel12 Trp1-/- (right) at the time of transplantation in two independent experiments.
The melanoma cell mixtures were then inoculated into the skin of syngeneic
wildtype mice. Once tumors reached a size of 2 to 3 mm they were randomly
assigned to four groups and the treatment was started (Figure 4.3.3.3 A). Trp1
CD4+ T cell ACT was performed as described above (with cyclophosphamide
conditioning, Ad5-GTY vaccination and three peritumoral doses of poly I:C and
CpG on days 3, 6 and 9 after T cell transfer). Tumor growth was monitored twice
weekly. Seven out of fourteen mice bearing mixture of HCmel12 CRISPR ctrl and
Trp1-/- melanoma escaped the therapy (figure 4.3.3.3 B). The survival of the

68
treatment cohort was significantly prolonged when compared to the untreated
controls (figure 4.3.3.3 C).
Figure 4.3.3.3 Trp1 CD4+ T cell ACT can cause regression of tumors containing 25% HCmel12 Trp1-/- melanoma cells suggesting effective bystander killing. A Schematic representation of adoptive cell therapy protocol. Groups of mice received mixtures of HCmel12 CRISPR ctrl and Trp1-/- cells transduced with with mCherry or TagBFP. C= cyclophosphamide, L= ACT, V=Adenovirus vaccine and I=Poly I:C + CpG. B Tumor growth kinetics of untreated (n=12) and treated (n=14) groups of HCmel12 CRISPR ctrl and Trp1-/- tumor bearing mice. C Kaplan-Meier graph showing survival of mice (Log rank test used to calculate significance, p-Value < 0.0001 ****).

69
Flowcytometric analysis of untreated tumors showed a growth disadvantage of
fluorescently labelled HCmel12 Trp1-/- melanoma cells (Figure 4.3.3.4 left
panels). This was observed with both TagBFP and mCherry labelled cells.
Nevertheless, in tumors escaping Trp1 CD4+ T cell ACT only HCmel12 Trp1-/-
melanoma cells were found, indicating strong genetic selection for genetically
engineered antigen loss variants (Figure 4.3.3.4 right panels).
Figure 4.3.3.4 Melanomas escaping CD4+ T cell ACT show strong selection for genetic Trp1 antigen loss variants A Representative FACS plots showing percentage of HCmel12 CRISPR ctrl TagBFP and HCmel12 Trp1-/- mCherry in untreated (Left) and Trp1 CD4+ T cell ACT treated samples (right). B Dot plots showing percentages of HCmel12 CRISPR ctrl TagBFP and HCmel12 Trp1-/- mCherry in untreated (Left, n=6) and Trp1 CD4+ T cell ACT treated samples (right, n=2). C. Representative FACS plots showing percentage of HCmel12 CRISPR ctrl mCherry and HCmel12 Trp1-/- TagBFP in untreated (Left) and Trp1 CD4+ T cell ACT treated samples (right). D Dot plots showing percentages of HCmel12 CRISPR ctrl mCherry and HCmel12 Trp1-/- TagBFP in untreated (Left, n=5) and Trp1 CD4+ T cell ACT treated samples (right, n=4). Statistics calculated by student T test, p-Value <0.0001 ****, 0.001 to 0.0001 ***, error bar represents mean ± SEM.

70
4.3.4 Genetic ablation of the Ciita gene in melanoma cells using CRISPR-
Cas9 genome editing
The experiments so far showed that adoptively transferred TRP1 CD4+ T cells
control melanoma growth in an antigen specific manner but can also eradicate
an admixed population of genetically engineered antigen loss variants through
bystander killing. This raises the question whether direct MHC class II restricted
antigen presentation by melanoma cells is required for the therapeutic efficacy of
TRp1 CD4+ T cells. To address this question, the Ciita gene was disrupted in
HCmel12 cells using the CRISPR-Cas9 genome editing technique. As Ciita is
absolutely required to chaperone MHC class II molecules to the cell surface, this
results in functional loss of MHC class II expression. The Ciita gene is located on
chromosome 16 and has 17 coding exons as shown in figure 4.3.4.1. The exon
1 (common to the isoforms 1, 3 and 4) and the exon 2 (common for all isoforms)
were targeted using appropriate guide RNAs.
Figure 4.3.4.1 Design of sgRNAs targeting the mouse Ciita gene locus. Schematic outline of the generation of sgRNAs targeting a 20 bp site in the mouse Ciita locus. Exon 1 and 2 of Ciita gene is shown which is targeted by sgRNAs. Exon 2 shown is common for all the isoforms but exon 1 is common between isoforms 1 and 4 but different for isoform 3. Five sgRNAs complementary to the target region of Ciita and the sgRNA sequences are shown in the lower panel along with the adjacent PAM sequence in blue color.

71
CRISPR-Cas9 edited cells were generated and monoclones derived as
described above. Sequencing analyses confirmed three different pure
monoclones (HCmel12 Ciita-/-) with deletion of 2 nucleotides, 65 nucleotides and
7 nucleotides respectively at the Ciita gene target site causing frameshift
mutations (Figure 4.3.4.2). HCmel12 CRISPR ctrl cells transfected with pX330
plasmid without sgRNA were used as controls.
Figure 4.3.4.2 CRISPR-Cas9 mediated editing of the Ciita gene in HCmel12 cells results in generation of clones with frameshift mutations. Next-generation sequencing data (NGS) analyzed by Outknocker software showing HCmel12 Ciita-/- monoclones with 2nt, 65nt and 7nt deletions, respectively. The grey pie chart represents the HCmel12 CRISPR ctrl cell line transfected with the empty pX330 plasmid.
Next, the loss of MHC-II expression on HCmel12 melanoma cells was validated
by flow cytometry (Figure 4.3.4.3). HCmel12 CRISPR ctrl and Ciita-/- monoclones
were treated with recombinant mouse IFN-γ and expression of MHC-I and MHC-
II was analyzed 24h, 48h and 72h later. In the absence of IFN-γ, HCmel12
CRISPR ctrl and Ciita-/- cells showed no expression of MHC-I and -II (Figure
4.3.4.3 B). Upon treatment with IFN-γ, HCmel12 CRISPR ctrl cells upregulated
MHC-II gradually and the levels of expression reached maximum levels by 72
hours. In contrast, Ciita-/- HCmel12 cells failed to upregulate MHC-II as shown in
figure 4.3.4.3 C, upper panel. Both the HCmel12 CRISPR ctrl and the Ciita-/- cells
upregulated MHC-I by 24 hours of incubation with IFN-γ as shown in the figure
4.3.4.3 C, lower panel.

72
Figure 4.3.4.3 Targeting Ciita by CRISPR-Cas9 technique results in loss of expression of MHC-II on the melanoma cells. A Experimental plan for the analysis of HCmel12 Ciita-/- cells generated. B. Histograms showing no expression of MHC-I or MHC-II by HCmel12 CRISPR ctrl and Ciita-/- cells in absence of IFN-γ. C Gradual expression of MHC-II by HCmel12 CRISPR ctrl cells but no expression of MHC-II by Ciita-/- cells upon incubation with IFN-γ (upper panel), and upregulation of MHC-I by both HCmel12 CRISPR ctrl and Ciita-/- cells upon incubation with IFN-γ (lower panel).

73
Next, the consequence of MHC-II loss by tumor cells for the recognition by Trp1
CD4+ T cells was studied in vitro. HCmel12 CRISPR ctrl and HCmel12 Ciita-/-
were treated with IFN-γ, then co-cultured for 5 hours with Trp1 CD4+ T cells and
T cell activation analyzed by flow cytometry (Figure 4.3.4.4). Upregulation of the
activation marker CD69 was observed with HCmel12 CRISPR ctrl cells but not
with Ciita-/- monoclones.
Figure 4.3.4.4 HCmel12 Ciita-/- cells do not activate antigen specific Trp1 CD4+ T cells in vitro. A. Experimental plan for the co-culture of HCmel12 Ciita-/- and CRISPR ctrl cells with Trp1 CD4+ T cells. B. Representative FACS plots showing CD69 on CD4+CD45.2+ cells upon co-culture of HCmel12 CRISPR ctrl (top panel) and HCmel12 Ciita-/- cells (Lower panel). Negative ctrl is Trp1 CD4+ cells without tumor cell coculture and positive control is Trp1 CD4+ T cells stimulated with T cell activation cocktail (PMA+ionomysin).

74
Next, it was tested if these HCmel12 Ciita-/- cells could still be indirectly
recognized by Trp1 CD4+ T cells in vitro. To this end, Trp1 splenocytes were
pulsed with cell lysates prepared from freeze-thawed HCmel12 CRISPR ctrl,
Trp1-/- and Ciita-/- cells and T cell activation assessed after 24 hours incubation
(Figure 4.3.4.5). Trp1 CD4+ T cells upregulated the activation markers CD69 and
CD25 in response to HCmel12 CRISPR ctrl and Ciita-/- tumor cell lysates but not
to HCmel12 Trp1-/- tumor cell lysates, indicating intact cross-presentation of
antigen by professional APC.
Figure 4.3.4.5 Antigen specific activation of Trp1 CD4+ T cells following incubation with tumor cell lysates. A Experimental plan for culturing Trp1 splenocytes with HCmel12 CRISPR ctrl, Ciita-/- and Trp1-/- cell lysates. B, C Representative FACS contour plots showing upregulation of CD69 and CD25 on CD4+CD3+ T cells following co-culture with the indicated tumor cell lysates. Controls included splenocytes without tumor cell lysate and stimulation with PMA+ionomysin.

75
4.3.5 Trp1 CD4+ T cell ACT can control the growth of HCmel12 Ciita-/-
melanomas
Having shown that Trp1 CD4+ T cells can only recognize HCmel12 Ciita-/- cells
indirectly but not directly in vitro, it was investigated whether this was sufficient
for the therapeutic efficacy of Trp1 CD4+ T cell ACT in vivo. To this end,
syngeneic wildtype mice were intracutaneously injected with HCmel12 CRISPR
ctrl and mixtures of HCmel12 Ciita-/- monoclones. When the tumors reached a
size of 2 to 3mm they were randomly assigned to untreated control and Trp1
CD4+ T cell ACT treatment groups. Additionally, in two treatment cohorts with
HCmel12 CRISPR ctrl and HCmel12 ciita-/- melanomas endogenous CD8+ T
cells were depleted to investigate their potential contribution to the anti-tumor
efficacy of Trp1 CD4+ T cell ACT. CD8+ T cell depletion was monitored once
weekly by flowcytometry (Figure 4.3.5.1 A).
HCmel12 CRISPR ctrl cells and the mixtures of Ciita-/- monoclones grew
progressively when left untreated. Both HCmel12 CRISPR ctrl melanomas with
intact MHC-II and Trp1 antigen expression and HCmel12 Ciita-/- melanomas
regressed when treated with Trp1 CD4+ T cell ACT. This resulted in significantly
prolonged survival of mice. The depletion of endogenous CD8+ T cells did not
significantly impair the treatment efficacy (Figure 4.3.5.1).
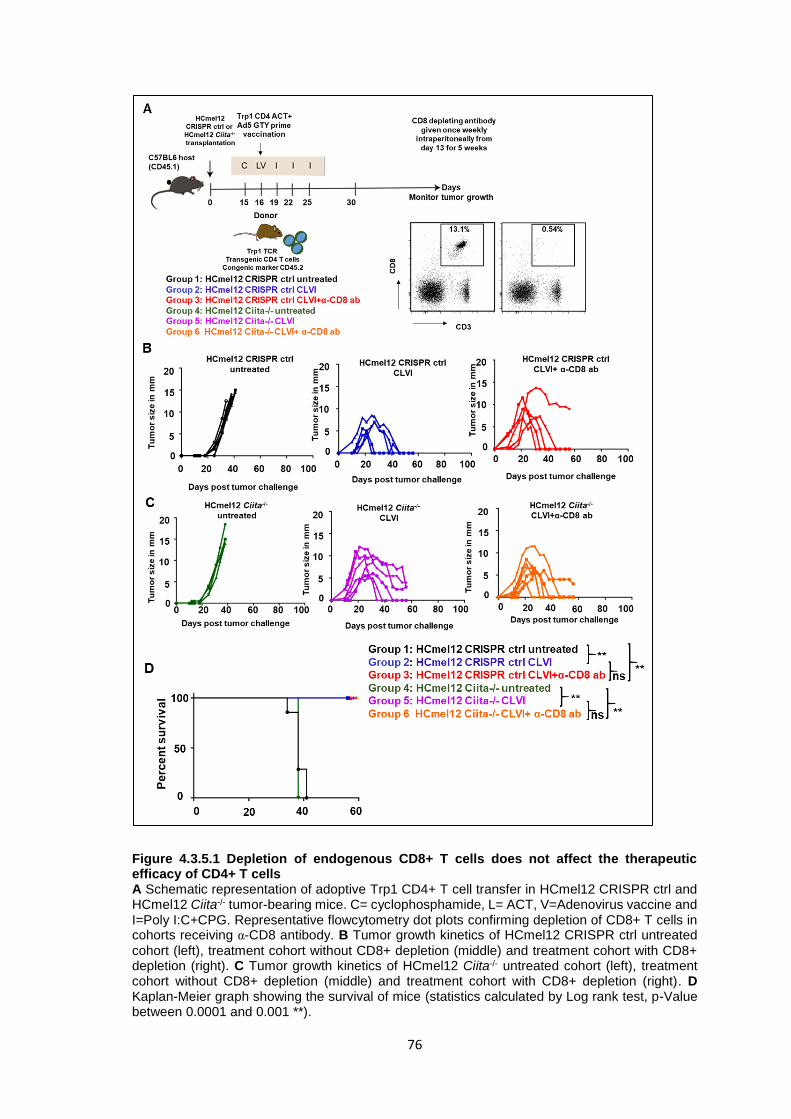
76
Figure 4.3.5.1 Depletion of endogenous CD8+ T cells does not affect the therapeutic efficacy of CD4+ T cells A Schematic representation of adoptive Trp1 CD4+ T cell transfer in HCmel12 CRISPR ctrl and HCmel12 Ciita-/- tumor-bearing mice. C= cyclophosphamide, L= ACT, V=Adenovirus vaccine and I=Poly I:C+CPG. Representative flowcytometry dot plots confirming depletion of CD8+ T cells in cohorts receiving α-CD8 antibody. B Tumor growth kinetics of HCmel12 CRISPR ctrl untreated
cohort (left), treatment cohort without CD8+ depletion (middle) and treatment cohort with CD8+ depletion (right). C Tumor growth kinetics of HCmel12 Ciita-/- untreated cohort (left), treatment cohort without CD8+ depletion (middle) and treatment cohort with CD8+ depletion (right). D Kaplan-Meier graph showing the survival of mice (statistics calculated by Log rank test, p-Value between 0.0001 and 0.001 **).

77
5. Discussion
5.1 Adoptive transfer of Trp1 CD4+ T cells and adenoviral vaccination
The first aim of this work was to develop an adoptive cell therapy (ACT) protocol
with CD4+ T cells targeting the melanocyte differentiation antigen Trp1 for the
treatment of mice bearing progressively growing transplanted melanomas. The
efficacy of Trp1 CD4+ T cell ACT was to be compared with that of the established
ACT protocol with CD8+ T cells targeting the melanocytic antigen gp100. To this
end, the replication deficient adenoviral vector Ad5-GTY was generated in initial
work, Ad5-GTY contains an artificially generated fusion protein between the
melanocytic antigens gp100 and Trp1 and expresses the two peptide epitopes
recognized by Pmel-1 CD8+ T cells and the Trp1 CD4+ T cells, respectively
(Figure 4.1.1.1). The ability of this virus to activate TCRtg T cells was then
confirmed using adenovirus infected splenocytes in vitro (Figure 4.1.1.2). This
demonstrated that both peptides were effectively presented for MHC-I restricted
Pmel-1 and MHC-II restricted Trp1 T cells. This multi-epitope adenoviral vector
then allowed for a direct side by side comparison of the expansion of adoptively
transferred T cells in vivo. Interestingly, it was observed that melanocyte-specific
CD4+ T cells expanded much less efficiently when compared to CD8+ T cells
(Figure 4.1.2.1). This was not dependent on the number of T cells transferred
since the transfer of higher number of OT-II CD4+ T cells (500,000 cells) and
lower number of OT-I CD8+ T cells (100,000 cells ) also resulted in more efficient
expansion of the CD8+ T cells (Figure 4.1.2.2).
5.2 Boost vaccination with recombinant MVA for CD4+ T cells
In subsequent work, a recombinant MVA vaccine vector was generated that also
contains both peptide epitopes. This vector was then tested both in vitro and in
vivo. Adoptively transferred Pmel-1 CD8+ T cells could successfully be re-
expanded following administration of MVA. However, re-expansion of CD4+ T
cells failed (Figure 4.2.2.1). Thus, the MVA vaccine was not effective in boosting
Trp1 CD4+ T cells. These results are in keeping with a previous study, where
effector and memory CD4+ T cells were shown to proliferate less efficiently than
CD8+ T cells (Homann et al., 2001). This was found to be due to lower expression
of Bcl-2 in CD4+ T cells and thus increased apoptosis. Furthermore, the memory

78
CD4+ T cells that were restimulated with a booster vaccine secreted more IFN-γ
and less IL-2 than CD8+ T cells that could explain reduced proliferation (MacLeod
et al., 2010; Malandro et al., 2016; Ravkov and Williams, 2009). CD8+ T cells are
also known to divide and differentiate efficiently even after a single exposure to
the antigen and interestingly daughter cells do not need the antigen presence for
their continued differentiation and proliferation, whereas CD4+ T cells require
repeated exposure to the antigen for efficient expansion (Bajenoff et al., 2002;
Kaech and Ahmed, 2001). Unlike CD8+ T cells, CD4+ T cells can arrest in
various stages of proliferation and differentiation forming a heterogeneous
population, which could also explain their limited expansion in the current study
(Foulds and Shen, 2006).
5.3 Therapeutic efficacy of Trp1 CD4+ T cells against skin melanomas
Interestingly, although CD4+ T cells expanded less efficiently than Pmel-1
specific CD8+ T cells they could still control the growth of HCmel12 melanomas
and significantly prolong the survival of tumor bearing mice (Figure 4.1.3.1 B, C).
Furthermore, the mice which showed complete regression of their melanomas
also developed strong vitiligo-like depigmentation of their fur indicating an
effective autoimmune response against the melanocytic differentiation antigen
Trp1 (Figure 4.1.3.1 D).
In several experiments, the therapeutic anti-tumor efficacy of adoptively
transferred CD4+ T cells and of Pmel-1 CD8+ T cells each alone were compared
with the combination of both CD4+ and CD8+ T cells. It was envisioned that CD4+
T cells could provide linked help to CD8+ T cells because the two epitopes were
expressed by one protein which results in antigen presentation by the same
dendritic cell as a prerequisite for an optimal immune response (Borst et al., 2018;
Mitchison and O’Malley, 1987). Furthermore, CD4+ T cell help is considered to
be critically important for the generation of functionally efficient memory CD8+ T
cells (Khanolkar et al., 2004; Laidlaw et al., 2016; Shedlock and Shen, 2003).
However, the combination therapy was not significantly more effective than either
monotherapy alone (Figure 4.2.4.1).

79
5.4 Immune escape through dedifferentiation
A major reason for the inability of the adoptive cell therapy approach to mediate
complete and durable tumor regression was the escape of melanomas from T
cell control through inflammation-induced dedifferentiation. This is associated
with down-regulation of the melanocytic target antigens and upregulation of the
neural crest precursor cell markers ngfr and CD73 (Figure 4.2.5.1 and 4.2.5.2)
(Landsberg et al., 2012; Le Poole et al., 2002; Reinhardt et al., 2017; Restivo et
al., 2017; Verfaillie et al., 2015). In this way, the adoptively transferred CD4+ and
CD8+ T cells loose their target on tumor cells. Melanoma escape by
dedifferentiation has already previously been described by the Tüting laboratory
for CD8+ T cell therapy (Landsberg et al., 2012). While the exact spatio-temporal
dynamics of the dedifferentiation response remain to be shown, a rapid and
powerful T cell attack could presumably outrun the epigenetic rewiring required
for melanoma cell dedifferentiation.
In addition to the inflammation-induced dedifferentiation, other factors may have
contributed to therapy resistance. While speculative, it is possible that T cell
exhaustion played a role in the resistance. Indeed, induction of type I or type II
interferon signaling in human and mouse melanoma cells is known to upregulate
the expression of PDL-1 and PDL-2 (Bald et al., 2014b; Robert et al., 2014).
Therefore, the treatment protocol used in this study consisting of both peritumoral
injections of nucleotide analogs and MVA viral vectors might have caused
upregulation of these checkpoint molecules. Finally, the Tüting and Hölzel
laboratory has recently shown that CD8+ T cell ACT can induce reactive
neutrophil infiltration to tumor and other T cell inflamed tissues, which contributes
to an immunosuppressive tumor microenvironment (Glodde et al., 2017). While
less is known about the regulation of CD4+ T cells, it seems plausible that
immunosuppressive neutrophils also limit their function.
5.5 Antigen-specific effector functions and bystander killing
In order to confirm the antigen-specific anti-tumor effects of CD4+ T cells and to
dissect effector mechanisms, HCmel12 Trp1-/- cell lines that lack the target
antigen were created with CRISPR-Cas9 technology (Figures 4.3.1.1). The
knockout success was validated both at the genomic level (Figures 4.3.1.2) as

80
well as at the protein level (Figures 4.3.1.3). The Trp1-/- cells were not recognized
by CD4+ T cells in vitro (Figure 4.3.2.2) confirming the knockout success at the
functional level. As expected, HCmel12 Trp1-/- melanomas did not respond to
CD4+ T cell ACT, indicating that they act in an antigen specific manner (Figure
4.3.3.1).
Further in vivo experiments with mixtures of HCmel12 CRISPR ctrl and Trp1-/-
melanoma cells revealed that the anti-tumoral CD4+ T cells had strong bystander
killing capacity. Half of the melanomas composed of HCmel12 CRISPR ctrl and
significant numbers of HCmel12 Trp1-/- cells regressed completely following the
Trp1 CD4+ T cell ACT (Figure 4.3.3.3). This is in contrast to our experiments
involving MHC class I restricted CD8+ T cells (unpublished observations). The
mice where melanomas generated with HCmel12 CRISPR ctrl and Trp1-/- cells
escaped CD4+ T cell immunotherapy showed complete genetic selection for
Trp1-/- cells (Figure 4.3.3.4). These results indicated that genetic and irreversible
antigen loss is dominant over phenotypic and principally reversible antigen loss
as a mechanism of melanoma immune escape. The data also suggest that local
activation of adoptively transferred CD4+ T cells caused bystander killing of
HCmel12 Trp1-/- cells.
5.6 The role of MHC class II restricted antigen presentation
MHC class I molecules are expressed ubiquitously on most cells. In contrast,
MHC-II molecule are expressed in a more restriction fashion, predominantly by
professional antigen presenting cells such as dendritic cells, B cells and
macrophages. Epithelial cells and melanocytes can also upregulate MHC class
II in response to IFN-γ. Some human cancers like breast cancer, colon cancer
and melanoma have been shown to express MHC class II (Johnson et al., 2016;
Park et al., 2017; Sconocchia et al., 2014). A recent bioinformatical analysis by
Johnson and colleagues showed that all the 60 human melanoma cell lines listed
in cancer cell line encyclopedia ubiquitously expressed high levels of MHC-I
(HLA-A prototype) whereas MHC-II (HLA-DRA) was absent in around 50 percent
of cell lines and remaining cells had intermediate to high expression.
The HCmel12 mouse melanoma cells used in this work were also shown to
upregulate MHC class II in response to IFN-γ and could then be recognized in

81
vitro by CD4+ T cells as evidenced by upregulation of CD69. In order to
investigate whether Trp1 CD4+ T cells require direct antigen presentation by
melanoma cells, HCmel12 Ciita-/- cell lines were created with CRISPR-Cas9
technology (Figure 4.3.4.1). The knockout success was again first validated at
the genomic level (Figure 4.3.4.2). The Ciita-/- monoclones failed to upregulate
MHC-II in the presence of IFN-γ confirming the knockout success at the protein
level (Figure 4.3.4.3). As a consequence Ciita-/- monoclones were also not
recognized by Trp1 CD4+ T cells directly (Figure 4.3.4.4), confirming the
functional consequence of Ciita loss. However, lysates prepared from HCmel12
Ciita-/- cells and pulsed onto splenocytes containing professional APCs could
activate Trp1 CD4+ T cells in vitro indicating that the CD4+ T cells can indirectly
recognize the HCmel12 derived Trp1 antigen (Figure 4.3.4.5). Taken together,
these findings suggest that Trp1 CD4+ T cells can principally recognize
melanoma cells directly in an MHC class II restricted manner as well as indirectly
through MHC class II expressing cells in the microenvironment.
Subsequent experiments showed that Trp1 CD4+ T cell ACT could nevertheless
efficiently control the growth of HCmel12 Ciita-/- cells in vivo (Figure 4.3.5.1).
Additional experiments with depleting anti-CD8 monoclonal antibodies indicated
that the therapeutic efficacy of CD4+ T cell ACT was independent of the presence
of potentially tumor-reactive endogenous CD8+ T cells. Together with the
experimental results involving HCmel12 Trp1-/- cells, this indicated that Trp1
CD4+ T cells do not necessarily need direct MHC class II restricted antigen
recognition on melanoma cells for their anti-tumoral effector functions. These
results do not support the observations reported by Quezada and colleagues who
claimed that MHC class II expression was required on melanoma cells for efficient
tumor rejection by Trp1 CD4+ T cells (Quezada et al., 2010). Alternatively, CD4+
T cells could be activated by professional APC in the tumor microenvironment
that have taken up antigen from dead tumor cells for processing and presentation.
This was shown by Shklovskaya and colleagues who used Hen Egg Lysozyme-
moth Cytochrome C (HELMCC) as a model antigen for specific CD4+ T cells
recognizing antigen-transduced B16 F10 melanomas. They reported that MHC-
IIhigh CD11clow migrators dendritic cells in tumor draining lymph nodes caused

82
activation of transgenic CD4+ T cells by presenting tumor derived antigen
(Shklovskaya et al., 2016).
5.7 Consequences for the mechanisms of CD4+ T cell anti-tumor immunity
The findings raise the question how Trp1 CD4+ T cells exert their anti-tumoral
effects. Muranski and colleagues reported antigen dependent direct recognition
and killing of melanoma cells by CD4+ T cells. The authors showed that adoptive
transfer of the Trp1 CD4+ T cells could regress large established B16 melanomas
even in RAG-/- mice confirming that the CD4+ T cells can induce direct anti-tumor
effects in the absence of CD8+ T cells. Furthermore, they showed that the Trp1
CD4+ T cells in RAG-/- mice express perforin, granzyme B and LAMP-1 (a
degranulation marker CD107a) suggesting that the anti-tumor effect observed in
this model are due to the direct effect of CD4+ T cells (Xie et al., 2010).
A recent study showed that Th-1 CD4+ T cells such as IL-2, IFN-γ, TNF-α,
perforin and granzyme-B strongly delayed the growth of tumor cells both in vitro
and in vivo while simultaneously activating tumor specifc cytotoxic CD8+ effector
T cells (Matsuzaki et al., 2015). It is worth speculating, whether the TLR3 agonist
poly I:C skewed endogenous CD8+ T cells towards effector phenotypes as
shown previously (Ngoi et al., 2008). Moreover, induction of type 1 IFNs by poly
I:C can enhance clonal expansion of antigen specific CD8+ T cells (Kolumam et
al., 2005) and boost innate immune responses (Alexopoulou et al., 2001).
Similarly, the TLR9 agonist CpG was shown to activated T cells by inducing IL-2
dependent proliferation (Bendigs et al., 1999). However, CD8+ T cell depletion
did not diminish the CD4+ T cell ACT anti-tumoral efficacy in the melanoma model
used here suggesting that CD4+ ACT did not work predominantly by providing
help to endogenous CD8+ T cells.
The anti-tumor effects of CD4+ T cells could be due to the activity of the effector
cytokines IFN-γ and TNF-α. Two different studies demonstrated that Trp1 CD4+
T cells can differentiate into Th1 phenotypes in vivo (Hirschhorn-Cymerman et
al., 2012; Quezada et al., 2010). Quezada and colleagues also showed that
transfer of small numbers of naive Trp1 CD4+ T cells (5x10⁵ cells) in combination
with the anti-CTLA4 antibody lead to complete regression of large established
B16 melanomas and this effect was mediated by IFN-γ and granzyme-B but not

83
Fas-ligand. While it remains to be shown in the future, it is possible that direct
and indirect bystander anti-tumor effects could have been mediated by the Th1
effector cytokine IFN-γ that has been shown to inhibit angiogenesis in the Mc51.9
model. This cell line is derived from methylcholanthrene-induced sarcoma cells
in IFN-γ receptor knockout mice (Qin and Blankenstein, 2000b). IFN-γ and TNF-
α have also been shown to promote senescence and growth arrest of tumor cells
in a mouse model where the Simian virus 40 large T antigen (Tag) is expressed
as an oncogene under the control of the rat insulin promoter. These mice develop
insulinomas due to lack of p53, and Rb mediated cell cycle control in pancreatic
islets (Braumüller et al., 2013). T cell derived TNF-α and the chemotherapeutic
drug cyclophosphamide used in the treatment protocol could also potentially
synergistically induce oxidative stress in tumor cells through NADPH oxidases
resulting in death of the cells due to accumulation of reactive oxygen species
(Habtetsion et al., 2018).
Finally, a contribution of direct MHC class II restricted antigen presentation by
tumor cells for the anti-tumor efficacy cannot be ruled out in the present work. A
study by Kitano and colleagues showed that NY-ESO-1 cancer testis antigen
specific CD4+ T cells isolated from melanoma patients receiving ipilimumab
treatment showed IFN-γ, perforin and granzyme B expression. They further
showed that these CD4+ T cells recognized and lysed the human melanoma cell
line SK-MEL-381 expressing NY-ESO-1 and the same MHC class II molecule in
vitro. Furthermore, it was shown that MHC class II blocking antibodies abrogated
this cytotoxic effect of CD4+ T cells (Kitano et al., 2013).
5.8 The connection between anti-tumor immunity and autoimmune vitiligo
Vitiligo is a common cutaneous toxicity observed in melanoma patients
undergoing immunotherapy and it has been considered an indicator for therapy
response (Byrne and Turk, 2011; Hua et al., 2016). Indeed, HCmel12 tumor
eradication after CD4+ T cell transfer was often accompanied by vitiligo-like fur
depigmentation. To study CD4+ T cell mediated vitiligo, Lambe and colleagues
generated mice expressing hen egg lysozyme as a melanocyte specific antigen.
These mice were then crossed with CD4+ TCR transgenic mice recognizing hen
egg lysozyme (HEL1 and HEL2 antigens). The resulting mice developed patchy

84
vitiligo during their lifespan which depended on Fas-ligand mediated destruction
of melanocytes (Lambe et al., 2006). It is unclear whether Fas-Fas-ligand
interactions played a role in the destruction of melanocytic cells in the
experiments presented here and whether tumor immunity and autoimmunity
share effector mechanisms.

85
6. Summary
Immunotherapy has emerged as a standard treatment modality in melanoma and
many other cancers. While a lot is known about the anti-tumoral effector functions
of CD8+ T cells, CD4+ T cells remain less well understood in cancer
immunotherapy. In the current work it was hypothesized that melanocyte antigen-
specific CD4+ T cells can control the growth of melanomas as efficiently as
corresponding CD8+ T cells but differ in the way they recognize antigen and exert
their effector functions against tumor cells in the tissue microenvironment. It has
been previously shown by the Tüting lab that a single administration of an
adenovirus vector expressing the melanocytic antigen gp100 can promote
effective expansion of adoptively transferred gp100-specific Pmel-1 TCR
transgenic CD8+ T cells and cause regression of established melanomas in
syngeneic mice. Here, a similar therapy protocol was established for Trp1-
specific TCR transgenic CD4+ T cells. For this the adenoviral vaccine vector Ad-
GTY expressing both gp100 and Trp1 epitopes was first generated. Ad-GTY
could expand adoptively transferred Trp1 CD4+ T cells in vivo, albeit less
efficiently when compared to Pmel-1 CD8+ T cells. Nevertheless, a Trp1 CD4+ T
cell ACT protocol with Ad-GTY showed significant anti-tumor efficacy and could
control the growth of HCmel12 melanomas. The recombinant MVA virus vector
MVA-PMTP that also expressed both the gp100 and Trp1 epitopes was
generated to evaluate prime-boost vaccine strategies. However, MVA-PMTP was
only able to re-expand CD8+ T cells but not CD4+ T cells. Moreover, the Ad-MVA
prime boost vaccination strategy did not significantly increase the therapeutic
efficacy of the ACT protocols. Following Trp1 CD4+ ACT escaping melanoma
cells frequently down-regulated melanocytic antigen expression and acquired a
dedifferentiated phenotype presumably due to therapy-induced inflammation. As
shown previously with CD8+ T cells, this also represented a major limitation of
targeting melanocytic antigens with antigen-specific CD4+ T cells.
Experiments using HCmel12 Trp1 antigen loss variants generated with CRISPR-
Cas9 genome editing techniques revealed that the control of tumor growth by
Trp1 CD4+ T cells is antigen-specific. Experiments with mixtures of HCmel12
control and Trp1 knockout cells demonstrated that Trp1 CD4+ cells can exert
significant bystander killing and that immunoselection for irreversible genetic

86
antigen loss is dominant over reversible phenotypic antigen loss for immune
escape of melanoma cells. HCmel12 Ciita loss variants were also generated with
CRISPR-Cas9 genome editing techniques. Unlike unmodified HCmel12 cells
they fail to upregulate MHC class II and therefore cannot be directly recognized
by Trp1 CD4+ T cells. Experiments revealed that direct MHC class II restricted
recognition of melanoma cells by Trp1 CD4+ T cells was not required for tumor
growth control in vivo. This suggested an important role for indirect stimulation of
Trp1 CD4+ T cells by APC in the tumor microenvironment. Likely, Trp1 CD4+ T
cells indirectly control melanoma growth in the tumor microenvironment through
Th1 associated cytokines such as IFN-γ and TNF-α.
Future studies will have to address the spatial location of Trp1 CD4+ T cells in
the tumor microenvironment, their interaction with other immune cells and the
role of Th1-associated cytokines for their anti-tumor efficacy. Combining T cell
therapies with signal transduction inhibitors or checkpoint inhibitors to counteract
mechanisms of therapy resistance and immune escape in mouse models will help
to delineate strategies for more effective treatment of melanoma patients that
should be tested in the clinic.

87
7. References
Alexopoulou, L., Holt, A.C., Medzhitov, R., and Flavell, R.A. (2001). Recognition of double-stranded RNA and activation of NF-kappaB by Toll-like receptor 3. Nature 413, 732–738.
Amato, R.J., Drury, N., Naylor, S., Jac, J., Saxena, S., Cao, A., Hernandez-McClain, J., and Harrop, R. (2008). Vaccination of prostate cancer patients with modified vaccinia ankara delivering the tumor antigen 5T4 (TroVax): a phase 2 trial. J. Immunother. 31, 577–585.
Atkins, M.B., Kunkel, L., Sznol, M., and Rosenberg, S.A. (2000). High-dose recombinant interleukin-2 therapy in patients with metastatic melanoma: long-term survival update. Cancer J. Sci. Am. 6 Suppl 1, S11-4.
Bajenoff, M., Wurtz, O., and Guerder, S. (2002). Repeated antigen exposure is necessary for the differentiation, but not the initial proliferation, of naive CD4(+) T cells. J. Immunol. 168, 1723–1729.
Bald, T., Quast, T., Landsberg, J., Rogava, M., Glodde, N., Lopez-Ramos, D., Kohlmeyer, J., Riesenberg, S., van den Boorn-Konijnenberg, D., Hömig-Hölzel, C., et al. (2014a). Ultraviolet-radiation-induced inflammation promotes angiotropism and metastasis in melanoma. Nature 507, 109–113.
Bald, T., Landsberg, J., Lopez-Ramos, D., Renn, M., Glodde, N., Jansen, P., Gaffal, E., Steitz, J., Tolba, R., Kalinke, U., et al. (2014b). Immune cell-poor melanomas benefit from PD-1 blockade after targeted type I IFN activation. Cancer Discov. 4, 674–687.
Baruch, E.N., Berg, A.L., Besser, M.J., Schachter, J., and Markel, G. (2017). Adoptive T cell therapy: An overview of obstacles and opportunities. Cancer 123, 2154–2162.
Bastian, B.C. (2014). The molecular pathology of melanoma: an integrated taxonomy of melanocytic neoplasia. Annu Rev Pathol 9, 239–271.
Beatty, G.L., and Gladney, W.L. (2015). Immune escape mechanisms as a guide for cancer immunotherapy. Clin. Cancer Res. 21, 687–692.
Bendigs, S., Salzer, U., Lipford, G.B., Wagner, H., and Heeg, K. (1999). CpG-oligodeoxynucleotides co-stimulate primary T cells in the absence of antigen-presenting cells. Eur. J. Immunol. 29, 1209–1218.
Bennett, D.C. (2003). Human melanocyte senescence and melanoma susceptibility genes. Oncogene 22, 3063–3069.
Bennett, S.R., Carbone, F.R., Karamalis, F., Flavell, R.A., Miller, J.F., and Heath, W.R. (1998). Help for cytotoxic-T-cell responses is mediated by CD40 signalling. Nature 393, 478–480.
Bergelson, J.M., Cunningham, J.A., Droguett, G., Kurt-Jones, E.A., Krithivas, A., Hong, J.S., Horwitz, M.S., Crowell, R.L., and Finberg, R.W. (1997). Isolation of a common receptor for Coxsackie B viruses and adenoviruses 2 and 5. Science 275, 1320–1323.
Bhatia, S., Tykodi, S.S., and Thompson, J.A. (2009). Treatment of Metastatic Melanoma: An Overview. Oncology (Williston Park). 23, 488–496.
Blasco, R., and Moss, B. (1992). Role of cell-associated enveloped vaccinia virus in cell-to-cell spread. J. Virol. 66, 4170–4179.
88
Borst, J., Ahrends, T., Babala, N., Melief, C.J.M., and Kastenmuller, W. (2018). CD4(+) T cell help in cancer immunology and immunotherapy. Nat. Rev. Immunol.
Braumüller, H., Wieder, T., Brenner, E., Aßmann, S., Hahn, M., Alkhaled, M., Schilbach, K., Essmann, F., Kneilling, M., Griessinger, C., et al. (2013). T-helper-1-cell cytokines drive cancer into senescence. Nature 494, 361–365.
Breitbart, E.W., Greinert, R., and Volkmer, B. (2006). Effectiveness of information campaigns. Prog. Biophys. Mol. Biol. 92, 167–172.
Brimnes, N. (2004). Variolation, Vaccination and Popular Resistance in Early Colonial South India. Med. Hist. 48, 199–228.
Burckhardt, C.J., Suomalainen, M., Schoenenberger, P., Boucke, K., Hemmi, S., and Greber, U.F. (2011). Drifting motions of the adenovirus receptor CAR and immobile integrins initiate virus uncoating and membrane lytic protein exposure. Cell Host Microbe 10, 105–117.
Byrne, K.T., and Turk, M.J. (2011). New Perspectives on the Role of Vitiligo in Immune Responses to Melanoma. Oncotarget 2, 684–694.
Campoli, M., and Ferrone, S. (2008). HLA antigen changes in malignant cells: Epigenetic mechanisms and biologic significance. Oncogene 27, 5869–5885.
Cappuccini, F., Stribbling, S., Pollock, E., Hill, A.V.S., and Redchenko, I. (2016). Immunogenicity and efficacy of the novel cancer vaccine based on simian adenovirus and MVA vectors alone and in combination with PD-1 mAb in a mouse model of prostate cancer. Cancer Immunol. Immunother. 65, 701–713.
Carr, J., and Mackie, R.M. (1994). Point mutations in the NRAS oncogene in malignant melanoma and congenital naevi. Br. J. Dermatol. 131, 72–77.
Chapman, R., Jongwe, T.I., Douglass, N., Chege, G., and Williamson, A.-L. (2017). Heterologous prime-boost vaccination with DNA and MVA vaccines, expressing HIV-1 subtype C mosaic Gag virus-like particles, is highly immunogenic in mice. PLoS One 12, e0173352.
Cheever, M.A., Kempf, R.A., and Fefer, A. (1977). Tumor Neutralization, Immunotherapy, and Chemoimmunotherapy of a Friend Leukemia with Cells Secondarily Sensitized in vitro; J. Immunol. 119, 714 LP-718.
Chen, D.S., and Mellman, I. (2017). Elements of cancer immunity and the cancer-immune set point. Nature 541, 321–330.
Collado, M., Blasco, M.A., and Serrano, M. (2007). Cellular Senescence in Cancer and Aging. Cell 130, 223–233.
Conic, R.Z., Cabrera, C.I., Khorana, A.A., and Gastman, B.R. (2018). Determination of the impact of melanoma surgical timing on survival using the National Cancer Database. J. Am. Acad. Dermatol. 78, 40–46.e7.
Costin, G.-E., and Hearing, V.J. (2007). Human skin pigmentation: melanocytes modulate skin color in response to stress. FASEB J. 21, 976–994.
Cottingham, M.G., and Carroll, M.W. (2013). Recombinant MVA vaccines: dispelling the myths. Vaccine 31, 4247–4251.
Curtin, J.A., Busam, K., Pinkel, D., and Bastian, B.C. (2006). Somatic activation of KIT

89
in distinct subtypes of melanoma. J. Clin. Oncol. 24, 4340–4346.
Curtin, J. a, Fridlyand, J., Kageshita, T., Patel, H.N., Busam, K.J., Kutzner, H., Cho, K.-H., Aiba, S., Bröcker, E.-B., LeBoit, P.E., et al. (2005). Distinct sets of genetic alterations in melanoma. N. Engl. J. Med. 353, 2135–2147.
Delforme, E.J., and Alexander, P. (1964). Treatment of primary fibrosarcoma in the rat with immune lymphocytes. Lancet (London, England) 2, 117–120.
DeNardo, D.G., Barreto, J.B., Andreu, P., Vasquez, L., Tawfik, D., Kolhatkar, N., and Coussens, L.M. (2009). CD4+T Cells Regulate Pulmonary Metastasis of Mammary Carcinomas by Enhancing Protumor Properties of Macrophages. Cancer Cell 16, 91–102.
Dong, H., Strome, S.E., Salomao, D.R., Tamura, H., Hirano, F., Flies, D.B., Roche, P.C., Lu, J., Zhu, G., Tamada, K., et al. (2002). Tumor-associated B7-H1 promotes T-cell apoptosis: a potential mechanism of immune evasion. Nat. Med. 8, 793–800.
Facciabene, A., Peng, X., Hagemann, I.S., Balint, K., Barchetti, A., Wang, L.P., Gimotty, P.A., Gilks, C.B., Lal, P., Zhang, L., et al. (2011). Tumour hypoxia promotes tolerance and angiogenesis via CCL28 and Tregcells. Nature 475, 226–230.
Fefer, A. (1969). Immunotherapy and Chemotherapy of Moloney Sarcoma Virus-induced Tumors in Mice. Cancer Res. 29, 2177–2183.
Fehniger, T.A., Cooper, M.A., Nuovo, G.J., Cella, M., Facchetti, F., Colonna, M., and Caligiuri, M.A. (2003). CD56bright natural killer cells are present in human lymph nodes and are activated by T cell-derived IL-2: a potential new link between adaptive and innate immunity. Blood 101, 3052–3057.
Fejer, G., Freudenberg, M., Greber, U.F., and Gyory, I. (2011). Adenovirus-triggered innate signalling pathways. Eur. J. Microbiol. Immunol. (Bp). 1, 279–288.
Glodde, N., Bald, T., van den Boorn-Konijnenberg, D., Nakamura, K., O’Donnell, J.S., Szczepanski, S., Brandes, M., Eickhoff, S., Das, I., Shridhar, N., et al. (2017). Reactive Neutrophil Responses Dependent on the Receptor Tyrosine Kinase c-MET Limit Cancer Immunotherapy. Immunity 47, 789–802.e9.
Gloster, H.M., and Neal, K. (2006). Skin cancer in skin of color. J. Am. Acad. Dermatol. 55, 741–760.
Grivennikov, S.I., Greten, F.R., and Karin, M. (2010). Immunity, Inflammation, and Cancer. Cell 140, 883–899.
Habtetsion, T., Ding, Z.-C., Pi, W., Li, T., Lu, C., Chen, T., Xi, C., Spartz, H., Liu, K., Hao, Z., et al. (2018). Alteration of Tumor Metabolism by CD4+ T Cells Leads to TNF-alpha-Dependent Intensification of Oxidative Stress and Tumor Cell Death. Cell Metab. 28, 228–242.e6.
Hanahan, D., and Coussens, L.M. (2012). Accessories to the Crime: Functions of Cells Recruited to the Tumor Microenvironment. Cancer Cell 21, 309–322.
Harrison, S.C., Alberts, B., Ehrenfeld, E., Enquist, L., Fineberg, H., McKnight, S.L., Moss, B., O’Donnell, M., Ploegh, H., Schmid, S.L., et al. (2004). Discovery of antivirals against smallpox. Proc. Natl. Acad. Sci. U. S. A. 101, 11178–11192.
Harrop, R., Shingler, W.H., McDonald, M., Treasure, P., Amato, R.J., Hawkins, R.E., Kaufman, H.L., de Belin, J., Kelleher, M., Goonewardena, M., et al. (2011). MVA-5T4-
90
induced immune responses are an early marker of efficacy in renal cancer patients. Cancer Immunol. Immunother. 60, 829–837.
Henderson, D.A., Arita, I., Jezek, Z., and Ladnyi, I.D. (1988). Smallpox and its Eradication (WHO, Geneva).
Hierholzer, J.C., and Killington, R.A. (1996). 2 - Virus isolation and quantitation. B.W.J. Mahy, and H.O.B.T.-V.M.M. Kangro, eds. (London: Academic Press), pp. 25–46.
Hirschhorn-Cymerman, D., Budhu, S., Kitano, S., Liu, C., Zhao, F., Zhong, H., Lesokhin, A.M., Avogadri-Connors, F., Yuan, J., Li, Y., et al. (2012). Induction of tumoricidal function in CD4 + T cells is associated with concomitant memory and terminally differentiated phenotype. J. Exp. Med. 209, 2113–2126.
Hoeben, R.C., and Uil, T.G. (2013). Adenovirus DNA replication. Cold Spring Harb. Perspect. Biol. 5.
Homann, D., Teyton, L., and Oldstone, M.B.A. (2001). Differential regulation of antiviral T-cell immunity results in stable CD8+ but declining CD4+ T-cell memory. Nat. Med. 7, 913.
Hua, C., Boussemart, L., Mateus, C., Routier, E., Boutros, C., Cazenave, H., Viollet, R., Thomas, M., Roy, S., Benannoune, N., et al. (2016). Association of Vitiligo With Tumor Response in Patients With Metastatic Melanoma Treated With Pembrolizumab. JAMA Dermatology 152, 45–51.
Hussein, M.R. (2004). Genetic pathways to melanoma tumorigenesis. J. Clin. Pathol. 57, 797–801.
Ilett, E., Kottke, T., Thompson, J., Rajani, K., Zaidi, S., Evgin, L., Coffey, M., Ralph, C., Diaz, R., Pandha, H., et al. (2017). Prime-boost using Separate Oncolytic Viruses in Combination with Checkpoint Blockade Improves Anti-tumor Therapy. Gene Ther. 24, 21–30.
Inozume, T., Hanada, K.I., Wang, Q.J., Ahmadzadeh, M., Wunderlich, J.R., Rosenberg, S.A., and Yang, J.C. (2010). Selection of CD8++PD-1+ lymphocytes in fresh human melanomas enriches for tumor-reactive T cells. J. Immunother. 33, 956–964.
Isaacs, S.N. (2004). Working Safely with Vaccinia Virus. In Vaccinia Virus and Poxvirology: Methods and Protocols, S.N. Isaacs, ed. (Totowa, NJ: Humana Press), pp. 1–13.
Isaacs, A., and Lindermann, J. (1957). Virus Interference I: the Interferon. Proc. R. Soc. London Ser. B 157, 258–267.
Isaacs, A., Lindermann, J., and Valentine, R.C. (1957). Virus Interference. II . Some properties of Interferon. Proc. R. Soc. London Ser. B 147, 268–273.
Janeway, C.J., Travers, P., and Walport, M. (2001). Immunobiology.
Johnson, D.B., Estrada, M. V, Salgado, R., Sanchez, V., Doxie, D.B., Opalenik, S.R., Vilgelm, A.E., Feld, E., Johnson, A.S., Greenplate, A.R., et al. (2016). Melanoma-specific MHC-II expression represents a tumour-autonomous phenotype and predicts response to anti-PD-1/PD-L1 therapy. Nat. Commun. 7, 10582.
Kaech, S.M., and Ahmed, R. (2001). Memory CD8+ T cell differentiation: initial antigen encounter triggers a developmental program in naïve cells. Nat. Immunol. 2, 415–422.

91
Kaidbey, K.H., Agin, P.P., Sayre, R.M., and Kligman, A.M. (1979). Photoprotection by melanin--a comparison of black and Caucasian skin. J. Am. Acad. Dermatol. 1, 249–260.
Kanerva, A., and Hemminki, A. (2004). Replication competent viruses for Cancer therapy. Drugs Future.
Karan, D. (2017). Formulation of the bivalent prostate cancer vaccine with surgifoam elicits antigen-specific effector T cells in PSA-transgenic mice. Vaccine 35, 5794–5798.
Katalinic, A., Eisemann, N., and Waldmann, A. (2015). Skin Cancer Screening in Germany. Documenting Melanoma Incidence and Mortality From 2008 to 2013. Dtsch. Arzteblatt Int. 112, 629–634.
Khanolkar, A., Fuller, M.J., and Zajac, A.J. (2004). CD4 T Cell-Dependent CD8 T Cell Maturation. J Immunol 172, 2834–2844.
Kitano, S., Tsuji, T., Liu, C., Hirschhorn-Cymerman, D., Kyi, C., Mu, Z., Allison, J.P., Gnjatic, S., Yuan, J.D., and Wolchok, J.D. (2013). Enhancement of tumor-reactive cytotoxic CD4+ T cell responses after ipilimumab treatment in four advanced melanoma patients. Cancer Immunol. Res. 1, 235–244.
Klein, L., Kyewski, B., Allen, P.M., and Hogquist, K.A. (2014). Positive and negative selection of the T cell repertoire: what thymocytes see and don’t see. Nat. Rev. Immunol. 14, 377–391.
Kohlmeyer, J., Cron, M., Landsberg, J., Bald, T., Renn, M., Mikus, S., Bondong, S., Wikasari, D., Gaffal, E., Hartmann, G., et al. (2009). Complete regression of advanced primary and metastatic mouse melanomas following combination chemoimmunotherapy. Cancer Res. 69, 6265–6274.
Kolumam, G.A., Thomas, S., Thompson, L.J., Sprent, J., and Murali-Krishna, K. (2005). Type I interferons act directly on CD8 T cells to allow clonal expansion and memory formation in response to viral infection. J. Exp. Med. 202, 637–650.
Krauthammer, M., Kong, Y., Ha, B.H., Evans, P., Bacchiocchi, A., McCusker, J.P., Cheng, E., Davis, M.J., Goh, G., Choi, M., et al. (2012). Exome sequencing identifies recurrent somatic RAC1 mutations in melanoma. Nat. Genet. 44, 1006–1014.
Laidlaw, B.J., Craft, J.E., and Kaech, S.M. (2016). The multifaceted role of CD4+ T cells in CD8+ T cell memory. Nat. Rev. Immunol. 16, 102.
Lambe, T., Leung, J.C.H., Bouriez-Jones, T., Silver, K., Makinen, K., Crockford, T.L., Ferry, H., Forrester, J. V, and Cornall, R.J. (2006). CD4 T Cell-Dependent Autoimmunity against a Melanocyte Neoantigen Induces Spontaneous Vitiligo and Depends upon Fas-Fas Ligand Interactions. J. Immunol. 177, 3055 LP-3062.
Landsberg, J., Kohlmeyer, J., Renn, M., Bald, T., Rogava, M., Cron, M., Fatho, M., Lennerz, V., Wölfel, T., Hölzel, M., et al. (2012). Melanomas resist T-cell therapy through inflammation-induced reversible dedifferentiation. Nature 490, 412–416.
Law, M., Carter, G.C., Roberts, K.L., Hollinshead, M., and Smith, G.L. (2006). Ligand-induced and nonfusogenic dissolution of a viral membrane. Proc. Natl. Acad. Sci. U. S. A. 103, 5989–5994.
Lee, C., Collichio, F., Ollila, D., and Moschos, S. (2013). Historical review of melanoma treatment and outcomes. Clin. Dermatol. 31, 141–147.

92
Li, K., Donaldson, B., Young, V., Ward, V., Jackson, C., Baird, M., and Young, S. (2017). Adoptive cell therapy with CD4+ T helper 1 cells and CD8+ cytotoxic T cells enhances complete rejection of an established tumour, leading to generation of endogenous memory responses to non-targeted tumour epitopes. Clin Trans Immunol 6, e160.
Linnemann, C., van Buuren, M.M., Bies, L., Verdegaal, E.M.E., Schotte, R., Calis, J.J.A., Behjati, S., Velds, A., Hilkmann, H., Atmioui, D. el, et al. (2014). High-throughput epitope discovery reveals frequent recognition of neo-antigens by CD4+ T cells in human melanoma. Nat. Med. 21, 81.
Liu, H., Jin, L., Koh, S.B.S., Atanasov, I., Schein, S., Wu, L., and Zhou, Z.H. (2010). Atomic structure of human adenovirus by cryo-EM reveals interactions among protein networks. Science 329, 1038–1043.
Lu, S. (2009). Heterologous Prime-Boost Vaccination. Curr. Opin. Immunol. 21, 346–351.
Lucas, B., McCarthy, N.I., Baik, S., Cosway, E., James, K.D., Parnell, S.M., White, A.J., Jenkinson, W.E., and Anderson, G. (2016). Control of the thymic medulla and its
influence on αβT‐cell development. Immunol. Rev. 271, 23–37.
MacLeod, M.K.L., Kappler, J.W., and Marrack, P. (2010). Memory CD4 T cells: generation, reactivation and re-assignment. Immunology 130, 10–15.
Majhen, D., Calderon, H., Chandra, N., Fajardo, C.A., Rajan, A., Alemany, R., and Custers, J. (2014). Adenovirus-Based Vaccines for Fighting Infectious Diseases and Cancer: Progress in the Field. Hum. Gene Ther. 25, 301–317.
Malandro, N., Budhu, S., Kuhn, N.F., Liu, C., Murphy, J.T., Cortez, C., Zhong, H., Yang, X., Rizzuto, G., Altan-Bonnet, G., et al. (2016). Clonal Abundance of Tumor-Specific CD4+ T Cells Potentiates Efficacy and Alters Susceptibility to Exhaustion. Immunity 44, 179–193.
Maldonado, J.L., Fridlyand, J., Patel, H., Jain, A.N., Busam, K., Kageshita, T., Ono, T., Albertson, D.G., Pinkel, D., and Bastian, B.C. (2003). Determinants of BRAF mutations in primary melanomas. J. Natl. Cancer Inst. 95, 1878–1890.
Matsuzaki, J., Tsuji, T., Luescher, I.F., Shiku, H., Mineno, J., Okamoto, S., Old, L.J., Shrikant, P., Gnjatic, S., and Odunsi, K. (2015). Direct tumor recognition by a human CD4+T-cell subset potently mediates tumor growth inhibition and orchestrates anti-tumor immune responses. Sci. Rep. 5.
Matthews, D.A. (2001). Adenovirus Protein V Induces Redistribution of Nucleolin and B23 from Nucleolus to Cytoplasm. J. Virol. 75, 1031–1038.
Mayr, A., Hochstein-Mintzel, V., and Stickl, H. (1975). Abstammung, Eigenschaften und Verwendung des attenuierten Vaccinia-Stammes MVA. Infection 3, 6–14.
Michaloglou, C., Vredeveld, L.C.W., Soengas, M.S., Denoyelle, C., Kuilman, T., van der Horst, C.M. a M., Majoor, D.M., Shay, J.W., Mooi, W.J., and Peeper, D.S. (2005). BRAFE600-associated senescence-like cell cycle arrest of human naevi. Nature 436, 720–724.
Miller, A.J., and Mihm, M.C. (2006). Melanoma. N. Engl. J. Med. 355, 51–65.
Mitchison, N.A., and O’Malley, C. (1987). Three-cell-type clusters of T cells with antigen-presenting cells best explain the epitope linkage and noncognate requirements

93
of the in vivo cytolytic response. Eur. J. Immunol. 17, 1579–1583.
Mohr, P., Eggermont, A.M.M., Hauschild, A., and Buzaid, A. (2009). Staging of cutaneous melanoma. Ann. Oncol. 20, vi14-vi21.
Morgan, D.A., Ruscetti, F.W., and Gallo, R. (1976). Selective in vitro growth of T lymphocytes from normal human bone marrows. Science 193, 1007–1008.
Moss, B. (2012). Poxvirus Cell Entry: How Many Proteins Does it Take? Viruses 4, 688–707.
Moss, B. (2013). Poxvirus DNA replication. Cold Spring Harb. Perspect. Biol. 5.
van der Most, R.G., Currie, A.J., Mahendran, S., Prosser, A., Darabi, A., Robinson, B.W.S., Nowak, A.K., and Lake, R.A. (2009). Tumor eradication after cyclophosphamide depends on concurrent depletion of regulatory T cells: a role for cycling TNFR2-expressing effector-suppressor T cells in limiting effective chemotherapy. Cancer Immunol. Immunother. 58, 1219–1228.
Mumberg, D., Monach, P.A., Wanderling, S., Philip, M., Toledano, A.Y., Schreiber, R.D., and Schreiber, H. (1999). CD4(+) T cells eliminate MHC class II-negative cancer cells in vivo by indirect effects of IFN-gamma. Proc. Natl. Acad. Sci. U. S. A. 96, 8633–8638.
Muranski, P., Boni, A., Antony, P.A., Cassard, L., Irvine, K.R., Kaiser, A., Paulos, C.M., Palmer, D.C., Touloukian, C.E., Ptak, K., et al. (2008). Tumor-specific Th17-polarized cells eradicate large established melanoma. Blood 112, 362–373.
Narayanan, D.L., Saladi, R.N., and Fox, J.L. (2010). Ultraviolet radiation and skin cancer. Int. J. Dermatol. 49, 978–986.
Nemerow, G.R., Stewart, P.L., and Reddy, V.S. (2012). Structure of Human Adenovirus. Curr. Opin. Virol. 2, 115–121.
Ngoi, S.M., Tovey, M.G., and Vella, A.T. (2008). Targeting Poly I:C to the TLR3-independent pathway boosts effector CD8 T cell differentiation through IFNα/β. J. Immunol. 181, 7670–7680.
Norris, W. (1820). Case of fungoid disease. Edinburgh Med Surg J 16, 562–565.
Norris, W. (1857). Eight cases of Melanosis with pathological and therapeutical remarks on that disease (Longman, Brown, Green, Longmans, and Roberts.).
North, R.J. (1982). Cyclophosphamide-facilitated adoptive immunotherapy of an established tumor depends on elimination of tumor-induced suppressor T cells. J. Exp. Med. 155, 1063–1074.
Ott, P.A., Hu, Z., Keskin, D.B., Shukla, S.A., Sun, J., Bozym, D.J., Zhang, W., Luoma, A., Giobbie-Hurder, A., Peter, L., et al. (2017). An immunogenic personal neoantigen vaccine for patients with melanoma. Nature 547, 217–221.
Overwijk, W.W., Theoret, M.R., Finkelstein, S.E., Surman, D.R., de Jong, L.A., Vyth-Dreese, F.A., Dellemijn, T.A., Antony, P.A., Spiess, P.J., Palmer, D.C., et al. (2003). Tumor regression and autoimmunity after reversal of a functionally tolerant state of self-reactive CD8+ T cells. J. Exp. Med. 198, 569–580.
Oxenius, A., Bachmann, M.F., Zinkernagel, R.M., and Hengartner, H. (1998). Virus-specific MHC-class II-restricted TCR-transgenic mice: effects on humoral and cellular

94
immune responses after viral infection. Eur. J. Immunol. 28, 390–400.
Park, I.A., Hwang, S.-H., Song, I.H., Heo, S.-H., Kim, Y.-A., Bang, W.S., Park, H.S., Lee, M., Gong, G., and Lee, H.J. (2017). Expression of the MHC class II in triple-negative breast cancer is associated with tumor-infiltrating lymphocytes and interferon signaling. PLoS One 12, e0182786.
Peck, A., and Mellins, E.D. (2010). Plasticity of T-cell phenotype and function: the T helper type 17 example. Immunology 129, 147–153.
Peggs, K.S., Quezada, S.A., Chambers, C.A., Korman, A.J., and Allison, J.P. (2009). Blockade of CTLA-4 on both effector and regulatory T cell compartments contributes to the antitumor activity of anti-CTLA-4 antibodies. J. Exp. Med. 206, 1717–1725.
Perez-Diez, A., Joncker, N.T., Choi, K., Chan, W.F.N., Anderson, C.C., Lantz, O., Matzinger, P., Lee, K., Wang, E., Nielsen, M., et al. (2007). CD4 cells can be more efficient at tumor rejection than CD8 cells. Blood 109, 5346–5354.
Pitt, J.M., Vetizou, M., Daillere, R., Roberti, M.P., Yamazaki, T., Routy, B., Lepage, P., Boneca, I.G., Chamaillard, M., Kroemer, G., et al. (2016). Resistance Mechanisms to Immune-Checkpoint Blockade in Cancer: Tumor-Intrinsic and -Extrinsic Factors. Immunity 44, 1255–1269.
Plonka, P.M., Passeron, T., Brenner, M., Tobin, D.J., Shibahara, S., Thomas, A., Slominski, A., Kadekaro, A.L., Hershkovitz, D., Peters, E., et al. (2009). What are melanocytes really doing all day long...? Exp. Dermatol. 18, 799–819.
Pollock, P.M., Harper, U.L., Hansen, K.S., Yudt, L.M., Stark, M., Robbins, C.M., Moses, T.Y., Hostetter, G., Wagner, U., Kakareka, J., et al. (2003). High frequency of BRAF mutations in nevi. Nat. Genet. 33, 19–20.
Le Poole, I.C., Riker, A.I., Quevedo, M.E., Stennett, L.S., Wang, E., Marincola, F.M., Kast, W.M., Robinson, J.K., and Nickoloff, B.J. (2002). Interferon-gamma reduces melanosomal antigen expression and recognition of melanoma cells by cytotoxic T cells. Am. J. Pathol. 160, 521–528.
Puccetti, P., and Grohmann, U. (2007). IDO and regulatory T cells: a role for reverse signalling and non-canonical NF-κB activation. Nat. Rev. Immunol. 7, 817.
Purdue, M.P., From, L., Armstrong, B.K., Kricker, A., Gallagher, R.P., McLaughlin, J.R., Klar, N.S., and Marrett, L.D. (2005). Etiologic and other factors predicting nevus-associated cutaneous malignant melanoma. Cancer Epidemiol. Biomarkers Prev. 14, 2015–2022.
Qian, X., Wang, X., and Jin, H. (2014). Cell Transfer Therapy for Cancer: Past, Present, and Future. J. Immunol. Res. 2014, 525913.
Qin, Z., and Blankenstein, T. (2000a). CD4+T cell-mediated tumor rejection involves inhibition of angiogenesis that is dependent on IFNγ receptor expression by nonhematopoietic cells. Immunity 12, 677–686.
Qin, Z., and Blankenstein, T. (2000b). CD4+ T cell--mediated tumor rejection involves inhibition of angiogenesis that is dependent on IFN gamma receptor expression by nonhematopoietic cells. Immunity 12, 677–686.
Quezada, S.A., Simpson, T.R., Peggs, K.S., Merghoub, T., Vider, J., Fan, X., Blasberg, R., Yagita, H., Muranski, P., Antony, P.A., et al. (2010). Tumor-reactive CD4(+) T cells develop cytotoxic activity and eradicate large established melanoma after transfer into

95
lymphopenic hosts. J. Exp. Med. 207, 637–650.
Van Raamsdonk, C.D., Bezrookove, V., Green, G., Bauer, J., Gaugler, L., O’Brien, J.M., Simpson, E.M., Barsh, G.S., and Bastian, B.C. (2009). Frequent somatic mutations of GNAQ in uveal melanoma and blue naevi. Nature 457, 599–602.
Ravkov, E. V, and Williams, M.A. (2009). The magnitude of CD4(+) T cell recall responses is controlled by the duration of the secondary stimulus. J. Immunol. 183, 2382.
Rebecca, V.W., Sondak, V.K., and Smalley, K.S.M. (2012). A brief history of melanoma: From mummies to mutations. Melanoma Res. 22, 114–122.
Redman, J.M., Gibney, G.T., and Atkins, M.B. (2016). Advances in immunotherapy for melanoma. BMC Med. 14, 20.
Reinhard, C.T., Planavsky, N.J., Hemp, J., Parks, D.H., Fischer, W.W., Hugenholtz, P., Randall, M., Kamen, M., Hyde, J.L., Zhaxybayeva, O., et al. (2012). The blockade of immune checkpoints in cancer immunotherapy. Cell 161, 252–264.
Reinhardt, J., Landsberg, J., Schmid-Burgk, J.L., Ramis, B.B., Bald, T., Glodde, N., Lopez-Ramos, D., Young, A., Ngiow, S.F., Nettersheim, D., et al. (2017). MAPK Signaling and Inflammation Link Melanoma Phenotype Switching to Induction of CD73 during Immunotherapy. Cancer Res. 77, 4697 LP-4709.
Restivo, G., Diener, J., Cheng, P.F., Kiowski, G., Bonalli, M., Biedermann, T., Reichmann, E., Levesque, M.P., Dummer, R., and Sommer, L. (2017). The low affinity neurotrophin receptor CD271 regulates phenotype switching in melanoma . Nat. Commun. 8, 1988.
Riedel, S. (2005). Edward Jenner and the history of smallpox and vaccination. Proc. (Bayl. Univ. Med. Cent). 18, 21–25.
Robert, C., Ribas, A., Wolchok, J.D., Hodi, F.S., Hamid, O., Kefford, R., Weber, J.S., Joshua, A.M., Hwu, W.J., Gangadhar, T.C., et al. (2014). Anti-programmed-death-receptor-1 treatment with pembrolizumab in ipilimumab-refractory advanced melanoma: A randomised dose-comparison cohort of a phase 1 trial. Lancet 384, 1109–1117.
Roguin, A. (2006). Rene theophile hyacinthe la??nnec (1781-1826): The man behind the stethoscope. Clin. Med. Res. 4, 230–235.
Roper, R.L., Wolffe, E.J., Weisberg, a, and Moss, B. (1998). The envelope protein encoded by the A33R gene is required for formation of actin-containing microvilli and efficient cell-to-cell spread of vaccinia virus. J. Virol. 72, 4192–4204.
Rosenberg, S.A. (2014). IL-2: The First Effective Immunotherapy for Human Cancer. J. Immunol. 192, 5451 LP-5458.
Rosenberg, S.A., Spiess, P., and Lafreniere, R. (1986). A new approach to the adoptive immunotherapy of cancer with tumor-infiltrating lymphocytes. Science 233, 1318–1321.
Rosenberg, S.A., Packard, B.S., Aebersold, P.M., Solomon, D., Topalian, S.L., Toy, S.T., Simon, P., Lotze, M.T., Yang, J.C., and Seipp, C.A. (1988). Use of tumor-infiltrating lymphocytes and interleukin-2 in the immunotherapy of patients with metastatic melanoma. A preliminary report. N. Engl. J. Med. 319, 1676–1680.

96
Rosenberg, S.A., Restifo, N.P., Yang, J.C., Morgan, R.A., and Dudley, M.E. (2008). Adoptive cell transfer: a clinical path to effective cancer immunotherapy. Nat. Rev. Cancer 8, 299–308.
Rowe, W.P., Huebner, R.J., Gilmore, L.K., Parrot, R.H., and Ward, T.G. (1953). Isolation of a cytopathogenic agent from human adenoids undergoing spontaneous degeneration in tissue culture. Proc. Soc. Exp. Biol. Med. 84, 570–573.
Russell, W.C. (2009). Adenoviruses: update on structure and function. J. Gen. Virol. 90, 1–20.
Rux, J.J., and Burnett, R.M. (2004). Adenovirus structure. Hum. Gene Ther. 15, 1167–1176.
Schadendorf, D., Kochs, C., and Livingstone, E. (2013). Clinical Features and Classification. In Handbook of Cutaneous Melanoma: A Guide to Diagnosis and Treatment, (Tarporley: Springer Healthcare Ltd.), pp. 13–27.
Schmid-Burgk, J.L., Schmidt, T., Gaidt, M.M., Pelka, K., Latz, E., Ebert, T.S., and Hornung, V. (2014). OutKnocker: a web tool for rapid and simple genotyping of designer nuclease edited cell lines. Genome Res. 24, 1719–1723.
Schramm, B., and Locker, J.K. (2005). Cytoplasmic organization of POXvirus DNA replication. Traffic 6, 839–846.
Schweizer, M.T., and Drake, C.G. (2014). Immunotherapy for Prostate Cancer – Recent Developments and Future Challenges. Cancer Metastasis Rev. 33, 641–655.
Sckisel, G.D., Bouchlaka, M.N., Monjazeb, A.M., Crittenden, M., Curti, B.D., Wilkins, D.E.C., Alderson, K.A., Sungur, C.M., Ames, E., Mirsoian, A., et al. (2015). Out-of-sequence Signal 3 paralyzes primary CD4(+) T cell dependent immunity. Immunity 43, 240–250.
Sconocchia, G., Eppenberger-Castori, S., Zlobec, I., Karamitopoulou, E., Arriga, R., Coppola, A., Caratelli, S., Spagnoli, G.C., Lauro, D., Lugli, A., et al. (2014). HLA class II antigen expression in colorectal carcinoma tumors as a favorable prognostic marker. Neoplasia 16, 31–42.
Scurr, M., Pembroke, T., Bloom, A., Roberts, D., Thomson, A., Smart, K., Bridgeman, H., Adams, R., Brewster, A., Jones, R., et al. (2017). Effect of Modified Vaccinia Ankara-5T4 and Low-Dose Cyclophosphamide on Antitumor Immunity in Metastatic Colorectal Cancer: A Randomized Clinical Trial. JAMA Oncol. 3, e172579.
Shain, a H., and Bastian, B.C. (2016). From melanocytes to melanomas. Nat. Rev. Cancer.
Sharma, P., Hu-Lieskovan, S., Wargo, J.A., and Ribas, A. (2017). Primary, Adaptive, and Acquired Resistance to Cancer Immunotherapy. Cell 168, 707–723.
Shedlock, D.J., and Shen, H. (2003). Requirement for CD4 T cell help in generating functional CD8 T cell memory. Science 300, 337–339.
Shklovskaya, E., Terry, A.M., Guy, T. V, Buckley, A., Bolton, H.A., Zhu, E., Holst, J., and Fazekas de St Groth, B. (2016). Tumour-specific CD4 T cells eradicate melanoma via indirect recognition of tumour-derived antigen. Immunol. Cell Biol. 94, 593–603.

97
Shukarev, G., Callendret, B., Luhn, K., Douoguih, M., and consortium, the E. (2017). A two-dose heterologous prime-boost vaccine regimen eliciting sustained immune responses to Ebola Zaire could support a preventive strategy for future outbreaks. Hum. Vaccin. Immunother. 13, 266–270.
Smith, K.A. (1988). Interleukin-2: inception, impact, and implications. Science 240, 1169–1176.
Smith, G.L., Vanderplasschen, A., and Law, M. (2002). The formation and function of extracellular enveloped vaccinia virus. J. Gen. Virol. 83, 2915–2931.
Snow, H. (1892). Melanocytic cancerous disease. Lancet 2, 872.
Staib, C., Drexler, I., and Sutter, G. (2004). Construction and isolation of recombinant MVA. Methods Mol. Biol. 269, 77–100.
Steitz, J., Bruck, J., Knop, J., and Tuting, T. (2001). Adenovirus-transduced dendritic cells stimulate cellular immunity to melanoma via a CD4(+) T cell-dependent mechanism. Gene Ther. 8, 1255–1263.
Sutter, G., and Moss, B. (1992). Nonreplicating vaccinia vector efficiently expresses recombinant genes. Proc. Natl. Acad. Sci. U. S. A. 89, 10847–10851.
Takahama, Y. (2006). Journey through the thymus: stromal guides for T-cell development and selection. Nat. Rev. Immunol. 6, 127–135.
Takata, M., Murata, H., and Saida, T. (2010). Molecular pathogenesis of malignant melanoma: A different perspective from the studies of melanocytic nevus and acral melanoma. Pigment Cell Melanoma Res. 23, 64–71.
Tolonen, N., Doglio, L., Schleich, S., and Locker, J.K. (2001). Vaccinia Virus DNA Replication Occurs in Endoplasmic Reticulum-enclosed Cytoplasmic Mini-Nuclei. Mol. Biol. Cell 12, 2031–2046.
Townsley, A.C., Weisberg, A.S., Wagenaar, T.R., and Moss, B. (2006). Vaccinia Virus Entry into Cells via a Low-pH-Dependent Endosomal Pathway. J. Virol. 80, 8899–8908.
Tsuzuki, J., and Luftig, R.B. (1983). The adenovirus type 5 capsid protein IIIa is phosphorylated during an early stage of infection of HeLa cells. Virology 129, 529–533.
Tuettenberg, A., Jonuleit, H., Tuting, T., Bruck, J., Knop, J., and Enk, A.H. (2003). Priming of T cells with Ad-transduced DC followed by expansion with peptide-pulsed DC significantly enhances the induction of tumor-specific CD8+ T cells: implications for an efficient vaccination strategy. Gene Ther. 10, 243–250.
Ugai, H., Dobbins, G.C., Wang, M., Le, L.P., Matthews, D.A., and Curiel, D.T. (2012). Adenoviral protein V promotes a process of viral assembly through nucleophosmin 1. Virology 432, 283–295.
Urba, W.J. (2014). At the bench: adoptive cell therapy for melanoma. J. Leukoc. Biol. 95, 867–874.
Urteaga B., O., and Pack, G.T. (1966). On the antiquity of melanoma. Cancer 19, 607–610.
Verfaillie, A., Imrichova, H., Atak, Z.K., Dewaele, M., Rambow, F., Hulselmans, G., Christiaens, V., Svetlichnyy, D., Luciani, F., Van den Mooter, L., et al. (2015). Decoding the regulatory landscape of melanoma reveals TEADS as regulators of the invasive
98
cell state. Nat. Commun. 6, 6683.
Verheust, C., Goossens, M., Pauwels, K., and Breyer, D. (2012). Biosafety aspects of modified vaccinia virus Ankara (MVA)-based vectors used for gene therapy or vaccination. Vaccine 30, 2623–2632.
Volz, A., and Sutter, G. (2017). Chapter Five - Modified Vaccinia Virus Ankara: History, Value in Basic Research, and Current Perspectives for Vaccine Development. M. Kielian, T.C. Mettenleiter, and M.J.B.T.-A. in V.R. Roossinck, eds. (Academic Press), pp. 187–243.
de Vrij, J., van den Hengel, S.K., Uil, T.G., Koppers-Lalic, D., Dautzenberg, I.J.C., Stassen, O.M.J.A., Bárcena, M., Yamamoto, M., de Ridder, C.M.A., Kraaij, R., et al. (2011). Enhanced transduction of CAR-negative cells by protein IX-gene deleted adenovirus 5 vectors. Virology 410, 192–200.
Ward-Hartstonge, K.A., and Kemp, R.A. (2017). Regulatory T-cell heterogeneity and the cancer immune response. Clin. Transl. Immunol. 6, e154.
Waye, M.M.Y., and Sing, C.W. (2010). Anti-Viral Drugs for Human Adenoviruses. Pharmaceuticals 3, 3343–3354.
Westendorf, A.M., Skibbe, K., Adamczyk, A., Buer, J., Geffers, R., Hansen, W., Pastille, E., and Jendrossek, V. (2017). Hypoxia Enhances Immunosuppression by Inhibiting CD4+ Effector T Cell Function and Promoting Treg Activity. Cell. Physiol. Biochem. 41, 1271–1284.
White, J.M., Delos, S.E., Brecher, M., and Schornberg, K. (2008). Structures and mechanisms of viral membrane fusion proteins: multiple variations on a common theme. Crit. Rev. Biochem. Mol. Biol. 43, 189–219.
Wiethoff, C.M., Wodrich, H., Gerace, L., and Nemerow, G.R. (2005). Adenovirus protein VI mediates membrane disruption following capsid disassembly. J. Virol. 79, 1992–2000.
Wiguna, A.P., and Walden, P. (2015). Role of IL-10 and TGF-beta in melanoma. Exp. Dermatol. 24, 209–214.
Wold, W.S.M., and Toth, K. (2013). Adenovirus Vectors for Gene Therapy, Vaccination and Cancer Gene Therapy. Curr. Gene Ther. 13, 421–433.
Xiang, B., Baybutt, T.R., Berman-Booty, L., Magee, M.S., Waldman, S.A., Alexeev, V.Y., and Snook, A.E. (2017). Prime-Boost Immunization Eliminates Metastatic Colorectal Cancer by Producing High-Avidity Effector CD8(+) T Cells. J. Immunol. 198, 3507–3514.
Xie, Y., Akpinarli, A., Maris, C., Hipkiss, E.L., Lane, M., Kwon, E.-K.M., Muranski, P., Restifo, N.P., and Antony, P.A. (2010). Naive tumor-specific CD4(+) T cells differentiated in vivo eradicate established melanoma. J. Exp. Med. 207, 651–667.
Xue, Y., Johnson, J.S., Ornelles, D.A., Lieberman, J., and Engel, D.A. (2005). Adenovirus Protein VII Functions throughout Early Phase and Interacts with Cellular Proteins SET and pp32. J. Virol. 79, 2474–2483.
Yamamoto, Y., Nagasato, M., Yoshida, T., and Aoki, K. Recent advances in genetic modification of adenovirus vectors for cancer treatment. Cancer Sci. n/a-n/a.
Yamasaki, S., Miura, Y., Davydova, J., Vickers, S.M., and Yamamoto, M. (2013).

99
Intravenous genetic mesothelin vaccine based on human adenovirus 40 inhibits growth and metastasis of pancreatic cancer. Int. J. Cancer 133, 10.1002/ijc.27983.
Yao, S., Zhu, Y., and Chen, L. (2013). Advances in targeting cell surface signalling molecules for immune modulation. Nat. Rev. Drug Discov. 12, 130–146.
Yee, C., Thompson, J.A., Byrd, D., Riddell, S.R., Roche, P., Celis, E., and Greenberg, P.D. (2002). Adoptive T cell therapy using antigen-specific CD8+ T cell clones for the treatment of patients with metastatic melanoma: in vivo persistence, migration, and antitumor effect of transferred T cells. Proc. Natl. Acad. Sci. U. S. A. 99, 16168–16173.
Yu, D., Jin, C., Leja, J., Majdalani, N., Nilsson, B., Eriksson, F., and Essand, M. (2011). Adenovirus with Hexon Tat-Protein Transduction Domain Modification Exhibits Increased Therapeutic Effect in Experimental Neuroblastoma and Neuroendocrine Tumors . J. Virol. 85, 13114–13123.

100
8. List of Figures
Figure 1.1.4.1 Schematic representation of the distribution of CSD and non-
CSD melanomas.
Figure 1.3.2.1 Adenovirus infection and replication pathway.
Figure 1.3.7.1 Vaccinia virus replication cycle.
Figure 4.1.1.1 Adenovirus vector expressing PMEL and Trp1 epitopes
(Ad5-GTY) display strong cytopathic effect upon 911-cell line
infection
Figure 4.1.1.2 Ad5-GTY activate both gp100 specific Pmel-1 CD8+ and
Trp1 specific CD4+ T cells in vitro.
Figure 4.1.2.1 Trp1 CD4+ T cells expand less efficiently than Pmel-1 CD8+
T cells.
Figure 4.1.2.2 OT-II CD4 T cells expand less efficiently in blood when
compared to OT-I CD8 T cells.
Figure 4.1.3.1 Trp1 CD4+ T cell ACT controls the growth of established
melanomas and induces vitiligo-like fur depigmentation in
responder mice with regressing melanomas.
Figure 4.2.1.1 Schematic representation of the generation of plasmids
expressing PMEL (hGP100) epitope and Trp1 epitope fused
to mCherry fluorescent protein.
Figure 4.2.1.2 PLWK-NS plasmid facilitates the recombination of the inserted
transgene with parental or wild type Modified vaccinia Ankara.
Figure 4.2.1.3 Recombinant MVA-PMTP was generated and plaque
purified.
Figure 4.2.1.4 MVA-PMTP activate gp100 specific Pmel-1 CD8+ T cells in
vitro.
Figure 4.2.1.5 MVA PMTP expressing Pmel and Trp1 epitopes activate
Trp1 CD4+ T cells in vitro.
Figure 4.2.2.1 Heterologous prime-boost immunization with Ad5-GTY and
MVA-PMTP vectors expand and boost Pmel-1 CD8+ T cells
but not Trp1 CD4+ T cells.

101
Figure 4.2.3.1 MVA boost vaccination does not significantly increase the
survival of T cell ACT treated mice.
Figure 4.2.3.2 Mice with regressing HCmel12 melanomas show vitiligo-like
fur depigmentation.
Figure 4.2.4.1 Pmel-1 CD8+ T cell and Trp1 CD4+ T cell combination
therapy was only marginally more effective in controlling the
growth of melanoma when compared to Trp1 CD4+ T cell or
Pmel-1 CD8+ T cell monotherapy.
Figure 4.2.5.1 Tumors escape melanocyte lineage antigen targeted T cell
therapy by de-differentiation.
Figure 4.2.5.2 Immunohistochemical analyses of HCmel12 relapse
melanomas.
Figure 4.3.1.1 Design of sgRNAs targeting the mouse Trp1 gene locus.
Figure 4.3.1.2 CRISPR-Cas9 mediated editing of Trp1 gene in HCmel12
cells results in generation of clones with out-of-frame
mutation of the gene.
Figure 4.3.1.3 Frameshift mutations caused by CRISPR-Cas9 mediated
editing of Trp1 gene, results in loss of protein expression.
Figure 4.3.2.1 HCmel12 CRISPR ctrl melanoma cell line upregulate MHC-
II upon treatment with IFN-γ.
Figure 4.3.2.2 HCmel12 Trp1-/- cells do not activate antigen specific Trp1
CD4+ T cells in vitro.
Figure 4.3.3.1 HCmel12 Trp1-/- melanomas fail to respond to Trp1 CD4+ T
cell ACT.
Figure 4.3.3.2 Mixtures of fluorescently tagged Trp1-/- and wild-type
HCmel12 melanoma cells in vitro.
Figure 4.3.3.3 Trp1 CD4+ T cell ACT can cause regression of tumors
containing 25% HCmel12 Trp1-/- melanoma cells suggesting
effective bystander killing.
Figure 4.3.3.4 Melanomas escaping CD4+ T cell ACT show strong selection
for genetic Trp1 antigen loss variants.
Figure 4.3.4.1 Design of sgRNAs targeting the mouse Ciita gene locus.
Figure 4.3.4.2 CRISPR-Cas9 mediated editing of Ciita gene in HCmel12

102
cells results in generation of clones with frameshift
mutations.
Figure 4.3.4.3 Targeting Ciita by CRISPR-Cas9 technique results in loss of
expression of MHC-II on the melanoma cells.
Figure 4.3.4.4 HCmel12 Ciita-/- cells do not activate antigen specific Trp1
CD4+ T cells in vitro.
Figure 4.3.4.5 Antigen specific activation of Trp1 CD4+ T cells following
incubation with tumor cell lysates.
Figure 4.3.5.1 Depletion of endogenous CD8+ T cells does not affect the
therapeutic efficacy of CD4+ T cells.

103
9. List of Abbreviation
Abbreviation Explanation
ACT Adoptive cell therapy
Ad5-GTY Adenovirus serotype 5 - Gp100 Trp1 YFP
β-ME β-Mercaptoethanol
BCA Bicinchonininc acid
BCG Bacillus Calmette-Guerin
BFP Blue fluorescent protein
bp Base pair
BRAF v-Raf murine sarcoma viral oncogene homolog B1
BSA Bovine serum albumin
CIITA Class II transactivator
CAR Cocksackievirus-and-adenovirus receptor
CD Cluster of differentiation
CEA Carcinaembryonic antigen
Cdk4 Cyclin-dependent kinase 4
CDKN2A Cyclin dependent kinase inhibitor 2A
cDNA complementary DNA
CSD Chronically sun damaged
CTL Cytotoxic T lymphocytes
CTLA-4 Cytotoxic T lymphocyte associated protein 4
dNTP Deoxyribonucleotide
DMBA 7,12-Dimethylbenzanthracene
DMSO Dimethyl sulfoxide
DNA Deoxyribonucleic acid
EDTA Ethylenediaminetetraacetic acid
EEV Extracellular encapsulated virion
ELISA Enzyme-linked immunosorbent assay
EMT Epithelial–mesenchymal transition
FACS Fluorescence-activated cell sorting
FDA The food and drug administration
Gp100 Glycoprotein 100
HE Hematoxylin and eosin stain
HEPES 4-(2-hydroxyethyl)-1-piperazineethanesulfonic acid
Hgf Hepatocyte growth factor
HIV Human immunodeficiency virus
HRP Horseradish peroxidase
HSV Herpes simplex virus
IDO Indoleamine 2,3 deoxygenase
IMV Intracellular mature virion
IFN Interferon
IL Interleukin
ITR Inverted terminal repeat

104
Indels Insertion or deletion of bases
kb Kilo-base pair
KO Knock-out
KIT Proto-oncogene receptor tyrosine kinase
LAG-3 Lymphocyte activated gene 3
MAPK Mitogen-activated protein kinases
MHC Major histocompatibility complex
Mitf Microphthalmia-associated transcription factor
mRNA Messenger RNA
MOI Multiplicity of infection
MSV Moloney murine sarcoma virus
MV Mature virion
MVA Modified vaccinia ankara
NK cells Natural killer cells
NTP Nucleoside triphosphate
NRAS Neuroblastoma RAS viral oncogene homolog
PBS Phosphate-buffered saline
PCR Polymerase chain reaction
PD-1 Programmed cell death protein-1
PDL-1 Programmed death ligand-1
q-PCR quantitative real time polymerase chain reaction
RNA Ribonucleic acid
RGP Radial growth phase
s.e.m. Standard Error of the Mean
SSM Superficial spreading melanoma
TAA Tumor associated antigen
TCR T cell receptor
TCID Tissue culture infective dose
TGF-β Transforming growth factor
Th T helper
TILs Tumor infiltrating lymphocytes
TIM-3 T cell immunoglobulin and mucin domain containing-3
TLR4 Toll-like receptor 4
TNF-α Tumor necrosis factor alpha
Treg Regulatory T cells
Trp-1 Tyrosinase related protein -1
UV Ultraviolet
VGP Vertical growth phase

105
10. Acknowledgement
I would like to thank Professor. Dr.Thomas Tüting for providing me the opportunity
to pursue my Ph.D. in his working group. I thank for his supervision, patience
and his help to shape my thesis to its present form. I would like to thank Dr.
Evelyn Gaffal for her support and supervision.
I thank Prof. Sven Burgdorf for agreeing to be my second supervisor. I thank Prof.
Michael Hölzel and Prof. Anton Bovier who were part of my Ph.D supervisor
committee. I thank Prof. Wolfgang Kastenmüller and Prof. Magnus Essand for
their expert advice on virology. I would like to thank Dr. Di Yu from University of
Uppsala for his help in generating the adenovirus. I thank all our lab members
especially Dr. Janne Ruotsalainen and Dr. Tetje van der Sluis for their support,
supervision and providing feedback for my dissertation. I would like to thank Dr.
Miriam Mengoni and Bastian Kruse who proof read my thesis before submission.
I thank Susanne Bonifatius, Meri Rogava Judith Leipold and Jeannine Herz for
her technical support. I would like to thank other members of our working group
Steffi, Johannes, Rieke, Katka and Carina. It was great fun to work with all of you.
I would like to thank all my friends in Bonn who were like a family. Thank you
Anchal, Ralf and Dhruv. I thank Bharadwaj Vijayasarathy and Vishwas
Kaveeshwar for the philosophical discussions and sheeshas. Janne and Dorys,
thank you guys for great support and friendship
Most importantly, I thank my wife Sowmya who looked after our kid alone in Bonn
while I was working in Magdeburg and my son Adhyanth for bearing my absence.
Without you both it would not be possible to achieve my dream, I thank my
parents, my sister for supporting me through this journey.

106
11. Contributions to scientific meetings
2019
Development of antigen specific immunotherapy against melanoma with TRP1 targeted CD4+ T cell transfer.
Shridhar N , Van Der Sluis T C, Ruotsalainen J, Kruse B, Bonifatius S, Rogava M, Braun A D, Yu D, Essand M, Kastenmüller W, Gaffal E, Tüting T.
Poster at ADF conference, Munich.
2018
Modifying melanoma immune microenvironment by heterpöpgous prime boost with a
recombinant adenovirus and a recombinant modified vaccinia ankara virus.
Shridhar N, Ruotsalainen J, Van der Sluis T C, Rogava M, Yu D, Essand M,
Kastenmüller W, Gaffal E, Tüting T.
Poster at CIMT conference Mainz and ADF conference, Zurich.
Effect of selective Gq/11 inhibition on malignant melanoma
Shridhar N, v.Ehrlich-Treuenstätt G, Bonifatius S, Tüting T, Gaffal E.
Talk and poster at ADF conference, Zurich and poster at TIMO conference Halle.
2017
Development of antigen specific immunotherapy against melanoma conisting of Ad5-
GTY and MVA-PMTP heterologous prime-boost vaccination in combination with Trp1
targeted CD4+ T cell transfer.
Shridhar N, Ruotsalainen J, Van der Sluis T C, Rogava M, Bonifatius S, Yu D, Essand
M, Kastenmüller W, Hölzel M, Gaffal E, Tüting T.
Poster at Skin Cancer meeting 2017, Heidelberg.
Modifying melanoma immune microenvironment by heterpöpgous prime boost with a
recombinant adenovirus and a recombinant modified vaccinia ankara virus.
Shridhar N, Rogava M, Ruotsalainen J, Van der Sluis T C, Yu D, Essand M,
Kastenmüller W, Gaffal E, Tüting T.
Poster at ADF winter school , and at ADF conference in Göttingen
2015
Dickkopf 3 (DKK3) deficiency delays the onset and progression of primary melanomas.
Shridhar N, Bald T, Landsberg J, Hüttner C, Mayer M, Tüting T.
Poster at Science day, Immunosensation cluster of excellence, Bonn.
107
2014
Dickkopf 3 (DKK3) deficiency delays the onset and progression of primary melanomas.
Shridhar N, Bald T, Landsberg J, Hüttner C, Mayer M, Tüting T.
Poster at Science day, Immunosensation cluster of excellence, Bonn.
12. Publication list
Multicomponent analysis of tumour microenvironment reveals low CD8 T cell number,
low stromal caveolin-1 and high tenascin-C and their combination as significant
prognostic markers in non-small cell lung cancer.
Onion D, Isherwood M, Shridhar N, Xenophontos M, Craze ML, Day LJ, Garcia-Marquez
MA, Pineda RG, Reece-Smith AM, Saunders JH, Duffy JP, Argent RH, Grabowska AM.
Oncotarget.2017 Jun 29;(2):1760-1771
Reactive neutrophil responses dependent on the receptor tyrosine kinase c-MET limit
cancer immunotherapy.
Glodde N, Bald T, van den Boorn-Konijnenberg D, Nakamura K, O’Donnell JS,
Szczepanski S, Brandes M, Eickhoff S, Das I, Shridhar N, van der Sluis TC,
Ruotsalainen JJ, Gaffal E, Landsberg J, Ludwig KU, Wilhelm C, Riek-Buchardt M, Müller
AJ, Gebhardt C, Scolyer RA, Long GV, Janzen V, Teng MWL, Kastenmüller W, Mazzone
M, Smyth MJ, Tüting T, Hölzel M.
Immunity. 2017 Oct 17;47(4):789-802.e9
Dickkopf-3 contributes to the regulation of anti-tumor immune responses by
mesenchymal stem cells.
Lu KH, Tounsi A, Shridhar N, Küblbeck G, Klevenz A, Prokosch S, Bald T, Tüting T,
Arnold B
Front Immunol. 2015 Dec 24;6:645
The experimental power of FR900359 to study Gq-regulated biological processes.
Schrage R, Schmitz AL, Gaffal E, Annala S, Kehraus S, Wenzel D, Büllesbach KM, Bald
T, Inoue A, Shinjo Y, Galandrin S, Shridhar N, Hesse M, Grundmann M, Merten N,

108
Charpentier TH, Martz M, Butcher AJ, Slodczyk T, Armando S, Effern M, Namkung Y,
Jenkins L, Horn V, Stößel A, Dargatz H, Tietze D, Imhof D, Gales C, Drewke C, Müller
CE, Hölzel M, Milligan G, Tobin AB, Gomeza J, Dohlman HG, Sondek J, Harden TK,
Bouvier M, Laporte SA, Aoki J, Fleischmann BK, Mohr K, König GM, Tüting T, Kostenis
E.
Nat Commun.2015 Dec 14;6:10156
Direct targeting of Gαq and Gα11 oncoproteins in cancer cells.
Annala S, Feng X, Shridhar N, Eryilmaz F, Patt J, Yang J, Pfeil EM, Cervantes-
Villagrana RD, Inoue Am Häberlein F, Slodczyk T, Reher R, Kehraus S, Monteleone S,
Schrage R, Heycke N, Rick U, Engel S, Pfeifer A, Kolb P, König G, Bünemann M, Tüting
T, Vázquez-Prado J, Gutkind S, Gaffal E, Kostenis E.
Science Signaling 2019, accepted.