nova paradigma dimenzioniranja na potresna …
TRANSCRIPT

Perić, Lj. 42
Number 16, december, 2018.
Performance based seismic engineering applied to the light frame ...
NOVA PARADIGMA DIMENZIONIRANJA NA POTRESNA DJELOVANJA (PERFORMANCE BASED SEISMIC ENGINEERING - PBSE) NA PRIMJERU NELINEARNOGA ODZIVA ZIDOVA TIPIČNIH DRVENIH KONSTRUKCIJA
Izvorni znanstveni rad/Scientific paper
Primljen/Received: 24. 10. 2018. Prihvaćen/Accepted: 30. 11. 2018.
Ljupko Perić Institut für Baustatik und Konstruktionen Eidgenoschische Technische Hochschule Zürich (c.o. MWV Bauingenieure AG,CH-5400 Baden) Sažetak: Za proračun kompleksnih potresnih djelovanja na konstrukciju danas se koriste standardne metode temeljene na silama ili na pomacima. U praksi najčešće korištena metoda spektra odziva ima značajne nedostatke kojih projektanti najčešće nisu svjesni. Rezultat su objekti s nepoznatim i nepouzdanim stupnjevima zaštite od potresa. U radu je prikazana primjena metode temeljene na pomacima i stupnjevima oštećenja na primjeru tradicionalno korištenih, višestruko nelinearnih zidova od drveta popločanih OSB panelima ili pločama na bazi gipsa. Izvedeni su parametri potrebni za određivanje stupnja oštećenja i predložene granične vrijednosti relativnih katnih pomaka i stupnjeva oštećenja za različite razine potresnoga rizika. U radu su prikazani primjeri provedene parametarske studije za takozvane računske potrese s povratnom periodom od 475 g i vjerojatnoćom prekoračenja od 10% u 50 godina. Ključne riječi: okvirnizidovi od drveta, OSB i GB paneli, performance based engineering, stupanj oštećenja, Stewart-ova histereza, MCASHEW PERFORMANCE BASED SEISMIC ENGINEERING APPLIED TO THE LIGHT FRAME TIMBER WALLS (LFTWS) SHEATHED WITH OSB AND GB Abstract: The most commonly used force based seismic design in the engineering practice has major drawbacks, the practicians are usually not aware of. Thus, the structures have an unknown and unreliable safety coefficient in terms of both human lives and properties. In this paper the application of the performance based seismic engineering to the LFTWs has been presented. The parameter needed for the estimation of the damage index as well as the performance limits for different performance objectives have been proposedfor life safety limit state, characterized by the probability of exceedence of 10% in 50 years and return period RP 475 years. Key words: Light Frame Timber Walls, LFTWs, OSB and GB sheathing panels, performance based seismic engineering, damage index, Stewart hysteresis, MCASHEW

Perić, Lj. 43
Number 16, december, 2018.
Performance based seismic engineering applied to the light frame ...
1. HISTORICAL OVERVIEW Although the first earthquakes were recorded and described in detail as early as 780 BC in China and 79 in Italy [1], evidence of first systematic scientific research of seismological phenomena only dates back in the late 19th century in the works of Dr. Oldham [2] which describe the earthquake in the Himalayan Mountains region (Cachar) of 1869. When designing engineering structures, seismic actions were generally not taken into account until 1930s. It is not until after the devastating earthquakes of 1930s with magnitudes between 6.3 and 7.9 on the Richter scale that first proposals for estimating earthquake actions on structures were made. The closest and most "natural" way of describing earthquake action relies on engineering intuition which at that time prescribed that earthquake action, like the action of dead weight or wind, be described by force. Thus, earthquake action was included in the so-called equivalent replacement horizontal force whose intensity was expressed presumptively as a percentage of the total weight of the structure ranging:
퐸 = (0.05 − 0.15) ∙ 푚 ∙ 푔 Figure 1 shows a schematic timeline view of the development of essentially different philosophies of design for earthquake resistance.
Force based procedure Performance based design
Setting the basis for dynamic analysis (Newmark)
Influence of ductility
Transition to carrying capacity based design Development of PBD
Development of PBD in PBE
Rocking
Earthquake action not taken into account
Force replacement method
Spectrum response method
Nonelastic response spectra Pushover NLTHA
Damage estimate based method
Low damage design
1930 1950 1970 1990 2008 2018
Figure 1. Historical overview of the development of seismic design methods
As shown in Figure 1, it is possible to distinguish several substantially different approaches to structural design for seismic resistance: - From 1930 to about 1950, seismic actions were expressed empirically by a horizontal
statically acting force. Dynamic properties of the structure did not affect the value of the replacement force.
- From 1950 to 1970, based on the pioneering achievements of Professor Newmark, the magnitude of the force caused by earthquake effects depends on the dynamic properties of the structure. This resulted in development of elastic response spectra that quantify the maximum value of earthquake action on single-mass elastic systems depending on the natural oscillation period or stiffness. Actions on multi-mass systems are obtained by combining higher modes of equivalent single-mass systems using a particular procedure.
- Since the 1970s, a force-based approach which, in addition to dynamic properties of the structure, also takes into account the ductility and energy dissipation during the earthquake, was developed. The dependency of parameters 푅 − 휇푖푇 is established, which for different spectral ranges results in different degrees of seismic action reduction
-

Perić, Lj. 44
Number 16, december, 2018.
Performance based seismic engineering applied to the light frame ...
expressed by the reduction factor R or the behavior factor q. When using the behavior factor, the procedure is generally based on the equal displacement rule.
- In the 1980s, based on nonelastic response spectra, a carrying-capacity-based design method that predefines areas where plastic energy dissipation will occur, while the response of other parts of the structure is elastic, was developed by the work of Professor Thomas Paulay at Canterbury University, New Zealand. Design is reduced to constructing plastic hinges with high requirements in terms of providing local flexural ductility, while simultaneously protecting hinges against shear with targeted increase in shear capacity.
- In parallel with development of the methods that take into account the ductility of the structure while using nonelastic response spectra with high reduction factors, the displacement based methods known as "performance based design" are also being developed. These methods are applicable to systems whose response is dominantly in the first mode and have a distinct elastic-plastic behavior. The method uses the view of effects (response spectrum) and bearing capacity (pushover curve) on a single graph in the Acceleration Displacement Response Spectra format and makes it possible to directly compare the required and actual bearing capacity, and the required ductility, required and actual deformation capacity of the structure. One of the displacement based methods is the N2 method, whose authors are Fajfar, Fišinger and Vidić. The method is an integral part of Eurocode 8. Since it is not forces, but displacement resulting in forces, that are transferred to the structure during an earthquake, this method is more appropriate for structural design for earthquake resistance than force-based methods.
- An upgrade of the displacement-based methods is the method of the so-called performance-based engineering, which is based on the degree of acceptable damage to the structure after an earthquake. The degree (index) of damage is expressed as a linear combination of deformations caused by the earthquake and energy dissipated in the structure during the earthquake. The method takes into account the behavior of the structure subjected to cyclic action (hysteretic relationship between force and displacement) and degradation of stiffness and bearing capacity in several successive cycles. Application of this method requires direct dynamic integration on the nonlinear model (NLTHA) of real seismic records scaled to different seismic risk levels (earthquake zones) defined by regulations. This method correlates the degree of damage caused by the earthquake and cost of reconstruction after the earthquake. In addition to the design engineer, the selection of target values of damage and possible reconstruction costs is considerably influenced by the client, insurance company or the society as a whole.
- The "rocking" method, which is one of the methods ensuring low damage, is developed by the work of Professor Priestley in the 1990s. The method is based on the introduction of energy into the system by prestressing the elements expected to take earthquake forces. The degree of prestressing is determined according to the magnitude of seismic action so as to allow opening of the joint (rocking) connecting the wall (post) and the foundation, but to prevent uncontrolled overturning of the structure. There is no major damage after an earthquake, because the structure re-centers itself after the earthquake action. The method is independent of the material, and intensive research in the framework of timber structures (LVL and CLT walls) is currently in progress.

Perić, Lj. 45
Number 16, december, 2018.
Performance based seismic engineering applied to the light frame ...
2. EARTHQUAKE RESISTANCE DESIGN METHODS IN PRACTICE 2.1 Force-based method The force-based method is not in the focus of this paper, however, as it is the most commonly used method among the design practitioners, a brief overview of the drawbacks of this method will be made here in order to deepen the understanding of the main limitations as well as risks of the design for earthquake resistance using the force-based method.
Figure 2. Design for earthquake resistance: constant period/stiffness versus constant displacement at the plasticity limit [3]
In Figure 2, the authors in [3] have clearly schematically shown the differences between force-based and displacement-based methods. Figure 2d) clearly shows a valid force-based procedure. Before any calculation is made, the designer is forced to assume stiffness of the structure, from which the structure oscillation period directly follows, because of the relation
흎 = ;푻 = 2휋 ; 풇 = ∙
. A more or less arbitrary value of the "supreme" behavior
factor q or (related to the US nomenclature) reduction factor R, is adopted in order to somehow cover the effects of energy dissipation during the earthquake. After introducing these two basic approximations (constant stiffness and assumed ductility), the design process progresses in an automated manner without iterations and interruption. Sometimes deliberately and sometimes unknowingly, by designing, the designer influences a change in the ductility factor 휇 or behavior factor q, actually the reduction factor R. Since the underlying principle of the procedure is that stiffness (period) does not change even in the case of a

Perić, Lj. 46
Number 16, december, 2018.
Performance based seismic engineering applied to the light frame ...
change in bearing capacity, any change in bearing capacity results in a change in displacement at the plasticity limit ∆ . In the process, the structure is assumed to have almost unchanged deformability capacity ∆ . The reality is different in many aspects: a change in bearing capacity results in a change in stiffness (period), the deformability capacity ∆ significantly changes, while displacements consistent with plasticity stresses in the structure ∆ are almost constant. If we analyze the behavior factor q, which actually accounts for the quantity of energy spent during an earthquake in the structure (the work of internal forces on plastic deformations), we see that the same factor covers entire families (types) of structures, independent of their actual architecture. Besides, although on clear physical grounds, the behavior factor q is, to a certain extent, presumptively quantified. This is best illustrated by examples of q factor values in national standards around the world. Thus, for example, the behavior factor for reinforced concrete frames is 1.8-3.3 in Japan, 4.4 in Europe, 5 in the US and 7.5 in New Zealand (see [5]). Professor M.J.N. Priestley gave in [5] a critical assessment of the force-based method, concluding that stiffness and bearing capacity are not independent of each other, the equal displacement rule is not valid and it is not possible to define a single ductility factor for the same type of structures. The author of this paper is somewhat more critical, joining the evaluation of Prof. Bachmann, see [4] and [6]: structures designed using the force-based method have uncontrolled behavior, plastic mechanisms are random and possible more or less everywhere, safety factor and thereby the degree of protection of people and properties is unknown, the weakest element in the structure is unknown, the method makes a wrong impression of acting on the "safety side" while actually resulting in an uncontrolled failure mechanism. Figure 3 schematically shows application of the force-based method of design for earthquake resistance in engineering practice. Significantly more favorable and more controlled results are obtained if, in addition to the "classical method" of earthquake resistant design, using the design method based on carrying capacity, which is also the first step towards the methods known as "performance based design".
Figure 3. The procedure of force-based design for seismic resistance [4]

Perić, Lj. 47
Number 16, december, 2018.
Performance based seismic engineering applied to the light frame ...
2.2 Displacement based method
(performance based design) Figure 4 shows a schematic view of the displacement-based design procedure. It is characteristic of this procedure that the nonlinear dependency of forces/moments and displacements/deformations is determined based on the designed structure (frame or wall) with actual percentages of reinforcement and real, rather than reduced, stresses in the associated working charts of materials (characteristic 5% fractile values). This curve is called the pushover curve. The pushover curve divided (normalized) by the mass that participates in the first tone is the curve with the ordinate representing the seismic coefficient (pseudo acceleration) and the abscissa representing displacement and is called the bearing capacity curve. Due to the same ADRS format, the curve can be input into the response spectrum as a bilinear approximation and compared with seismic effects. In addition, if Yield Point Spectra is selected to represent the effects, then the required displacements and required ductility, based on the equal displacement rule, are determined easily at the intersection of the fundamental period and the elastic response spectrum. By directly comparing the required and actual ductility and required displacements with the displacement capacity, it can be concluded whether the design meets the set requirements, and also what is necessary to do (increase/decrease stiffness, bearing capacity or ductility) to meet the design objectives. The displacement based design method is also called performance based design. Its advantage is that it better describes the real behavior of the structure, there are no artificial interventions in terms of stiffness and ductility, and the carrying capacity curve is derived based on real mechanical properties of materials. The method does not take into account (at least not directly) higher vibration tones, and is unable to include the hysteretic effects of cyclic earthquake activity. Likewise, it is not possible to estimate the level of damage to the structure in accordance with expected structural displacements in case of an earthquake. In order to analytically determine the level of expected damage after effects of the earthquake, the analysis must be based on NLTHA and nonlinear hysteretic model of material. An example of such material is given in the following section.
Figure 4. The procedure of design for earthquake resistance based on displacements [4], performance based design

Perić, Lj. 48
Number 16, december, 2018.
Performance based seismic engineering applied to the light frame ...
2.3 Performance based engineering (the method based on the damage index) In reinforced-concrete structures we work with inhomogeneous materials and sections that, after the occurrence of first cracks, behave predictably, and on cyclic action develop closed and stable hystereses. In metal structures hystereses are even more uniform, fuller and more stable. In this way it is easy to determine the amount of energy spent on deforming the structure. In timber structures (we are talking about typical frame walls sheathed with OSB or gypsum based panels), the panels are attached to the timber frame using nails or staples. The response of the timber structure to cyclic loading is hysteresis which is normally closed and stable, but with a manifested pinching effect at the point of passing through the initial, unloaded state. The difference in response of timber walls with OSB boards and gypsum-based panels is in incomparably (up to 3 and more times) greater deformability of the system with OSB panels. Figure 5 is a schematic view of the procedure with steps typical of performance-based engineering.
Figure 5. Schematic view of the performance based engineering procedure [4]
The figure shows a kind of diagram with steps within the PBE method, which we will follow in further text of this paper. At the very beginning of the process is the requirement to determine the nonlinear response to monotonic loading (gradual pushing) and cyclic loading. At the center of the method, the procedure for determining the damage index, which is dependent on relative story drift, is presented below. It is typically irrelevant which construction material is used. The procedure of design for seismic resistance presented below in independent of the type of material. The calculation is based on a mechanical model that covers the nonlinearity of the relationship between forces

Perić, Lj. 49
Number 16, december, 2018.
Performance based seismic engineering applied to the light frame ...
and displacements and reliably describes the hysteretic response of the structure to cyclic loading. For steel and reinforced concrete structures, it is possible to generate nonlinear pushover curves using appropriate software (for example Response-2000), and there are a whole range of proposals describing the hysteretic dependency between force and displacement for the case of cyclic loading. For masonry and timber structures, such curves should be determined by a combination of experiments and numerical procedures. 3. Mechanical model of a light frame timber wall
3.1 Configuration of a traditional LFTW
Figure 6 shows a configuration of a traditional frame wall as a structural element of typical timber structures. We will not lose space on describing the wall geometry which is evident by itself. We will focus on its mechanical properties.
Figure 6. Configuration of a traditional frame wall with OSB or GB sheathing panels
3.2 Mechanical model as a hysteresis defined with ten independent parameters
Response of the wall shown in Figure 6 is obtained in laboratory conditions as a result of monotonic and cyclic loading. However, for its numerical analysis it is necessary first to determine the response of a single fastener to cyclic loading (see Figure 7). After the hysteresis recorded during the test is input into the MCASHEW software, a numerical approximation of the model is generated, trying to make the values of energy spent on deformation of the wall during the test and energy of the numerical model as close to each other as possible.

Perić, Lj. 50
Number 16, december, 2018.
Performance based seismic engineering applied to the light frame ...
In the next step, within the same MCASHEW program, the wall is modeled in a way that each nail is modeled in its real position on the wall element with a 10-parameter hysteresis, after which the model is subjected to monotonic and at will created cyclic loading (loading protocol). The numerical response of the wall is compared and, as necessary, calibrated with results of actual tests. The hysteretic responses of walls with lengths 2.4, 3.0, 3.6, 4.2 and 4.8 m are determined in this way for both types of panels (OSB and GB) attached with nails or staples to the timber frame. Experimentally determined hysteresis of a d=2.87 mm diameter nail as a response to the Mergos-Beyer loading protocol is shown in Figure 7, while the hysteresis of the entire 3.6 m long wall with 15 mm thick OSB panels and d=2.87 mm diameter nails spaced at 30 mm is shown in Figure 8, and the table view of hysteretic responses to monotonic and cyclic loading is shown in Figure 9.
Test of timber connections subjected to cyclic loading
Loading protocol
Figure 7. The procedure of determining the hysteretic response of an individual fastener (nail or staple) [4]
Hystereses of all walls can be determined in the same way independently of the type of applied panels. A set of all parameters is essentially a constitutive model of a wall of a particular length. Mergos-Beyer loading protocol was used because it was developed for the areas of low and medium seismicity. From this view it is clear that it is essential for the tests to determine the response of a single fastener, which is then used to generate the numerical ten-parametric model of the wall.
Consolidated results of 10-parametric hysteresis of the connection element in N and mm

Perić, Lj. 51
Number 16, december, 2018.
Performance based seismic engineering applied to the light frame ...
Figure 8. Hysteretic response of the 3.6 m long wall to Mergos-Beyer loading protocol
Figure 9. Wall hysteresis parameters determined by different loading protocols [4]

Perić, Lj. 52
Number 16, december, 2018.
Performance based seismic engineering applied to the light frame ...
3.2.1 Determining the damage index
Figure 10 presents the expression used to analytically define the damage index according to Park-Ang's proposal [7], as a linear combination of the maximum displacement and hysteretic energy spent to deform the element during the earthquake. From numerical analysis (NLTHA) it is easy for each degree of freedom (for example floor) to read maximum displacements ∆ (independent of time) and accelerations 푥 ̈ and displacements 푥 in each time increment ∆ , and then by simple integration (see Figure 11), to determine the cumulative energy spent on structural deformation. The ultimate displacement capacity ∆ , , and yield force 퐹 are determined from the static pushover curve of bearing capacity, shown in Figure 10.
Figure 10. Numerical procedure for determining the damage index [4]
Figure 11. Procedure for determining the cumulative energy during the earthquake
From bilinear approximation of pushover curve
Determine experimentally
From (scaled) earthquake record

Perić, Lj. 53
Number 16, december, 2018.
Performance based seismic engineering applied to the light frame ...
The damage index, and consequently all parameters involved in its calculation, are normally processed at the place of the maximum shear forces 푚 ∙ 푥̈ with associated relative displacements 푥 located on the first or the lowest floor of the structure. To complete the expression for damage index, we still have to determine the coefficient β which accounts for the stiffness degradation during the increment of displacement relative to the increment of the energy spent in the observed step of cyclic loading. Since this is a parameter that is dependent on the type of material and connections in the wall composite, it can also be determined by numerical analysis of the wall, provided that the wall is brought to failure in the numerical analysis. In this case, we assume the value DI=1.0 for damage index and reformulate the expression so as to obtain the β expression as follows:
훽 = (∆ , ∆ )∙∫
then from the numerical models of walls in MCASHEW for different
types of protocols under which the wall element is loaded to failure,we find all values of the necessary parameters and determine the coefficient β according to the above expression. Defining of the mechanical model within the PBE method would be completed by this. It is still left to determine the values of damage indices for calculation earthquake situations. 4. Defining the limit values of structural response
4.1 Defining the limit values for gypsum based board elements
In European areas of small and medium seismic intensity, wooden structures have been in use for centuries and their application has been intensifying recently. The application of gypsum based boards is traditionally widespread because the material has a dual application, namely it is used both as fire protection and as a stiffener in load-bearing elements that take horizontal loads. Since gypsum board is a relatively brittle material, and connections with these materials fail under tension and shear without any substantial warning signs of yield, their application in elements that are subjected to horizontal cycling loads is rarely recommended. In this respect, there are no references, and particularly indications of the use of this material in timber structures in the framework of the PBE method presented here. On the other hand, for walls with OSB panels there are some papers in Japan and the US that can serve as a landmark. Although it is a brittle material in connection with staples, experiments on walls have shown surprisingly stable hystereses, although deformability of the elements with gypsum-based boards is relatively small. Namely, after a connection at the outermost staple fails (breaks), the force from this fastener is redistributed to the adjacent fastener with a slight increase in displacement. Thus, the degradation process is continuous and accompanied by an increase in displacement. The process of failure of individual fasteners is brittle but the mechanism is ductile, which can be clearly seen in Figure 12. Figure 13 shows a wall that failed brittly under monotonic loading by the occurrence of cracks due to tension. We do not have space here to deal with the causes of various damage mechanisms, but it is important to note that for walls with a relative inter-story drift up to approx. IDR=0.5, there are no signs of damage. For the value IDR=0.8, the damage is in a moderate range and can be repaired, while the damage at levels IDR=1.1 is of such a character that it cannot be repaired and the structure ultimately fails. It is interesting that, after a whole range of steps has been performed within numerical analysis without a single need for the so-called calibration, the numerically determined damage index is identical to the values established experimentally.

Perić, Lj. 54
Number 16, december, 2018.
Performance based seismic engineering applied to the light frame ...
Picture 12. Deformations and degrees of damage to the wall as a result of cyclic loading
Figure 13. Deformations and degrees of damage to the wall subjected to gradual pushing
Perić, Lj. 55
Number 16, december, 2018.
Performance based seismic engineering applied to the light frame ...
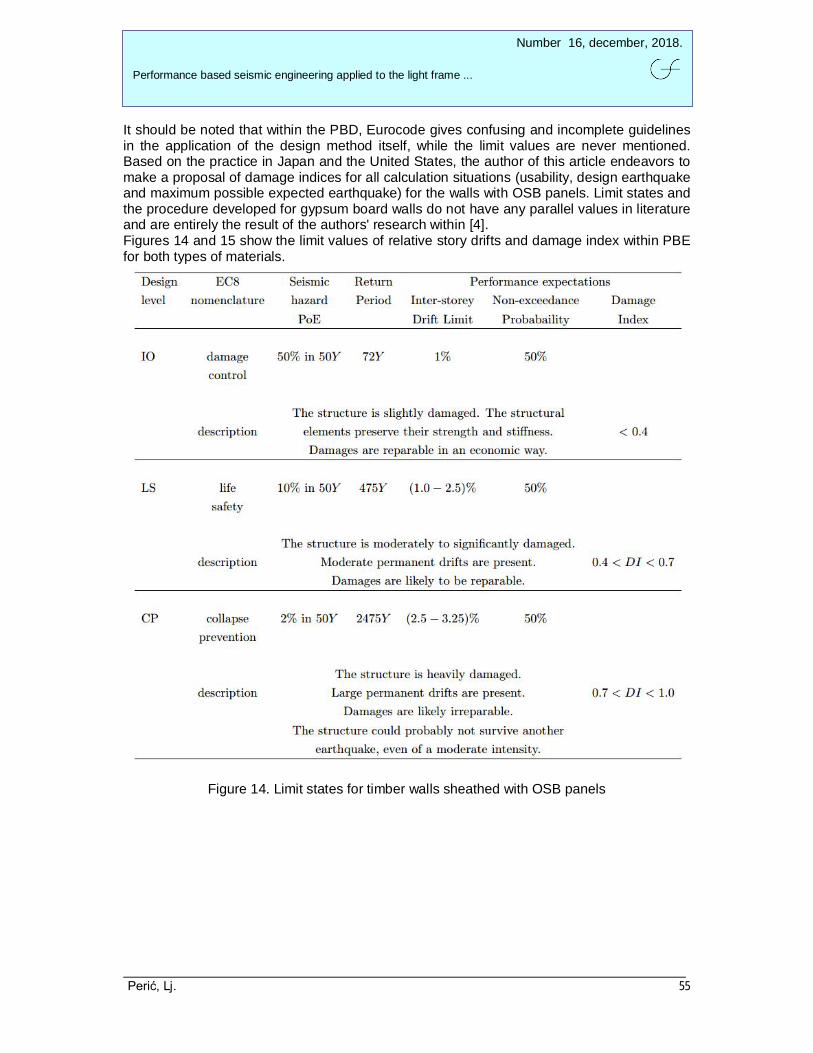
It should be noted that within the PBD, Eurocode gives confusing and incomplete guidelines in the application of the design method itself, while the limit values are never mentioned. Based on the practice in Japan and the United States, the author of this article endeavors to make a proposal of damage indices for all calculation situations (usability, design earthquake and maximum possible expected earthquake) for the walls with OSB panels. Limit states and the procedure developed for gypsum board walls do not have any parallel values in literature and are entirely the result of the authors' research within [4]. Figures 14 and 15 show the limit values of relative story drifts and damage index within PBE for both types of materials.
Figure 14. Limit states for timber walls sheathed with OSB panels

Perić, Lj. 56
Number 16, december, 2018.
Performance based seismic engineering applied to the light frame ...
Figure 15. Limit states for timber walls sheathed with gypsum based panels
The procedure within the PBE method is schematically presented in Figure 5. The function of incremental dynamic analysis is shown at the end as a tool used by the author to verify the results obtained by parametric analysis. Unfortunately, we do not have space here to deal with IDA as a probabilistic tool for determining the so-called "fragility functions", so this topic will be omitted hereafter. 5. Modeling
Modeling can be carried out after setting up a mechanical model of the wall and determining limit values of relative story drifts and damage indices. It only remains to switch from single-mass to multi-mass system (from SDOF to MDOF) and determine loads by selecting and scaling seismic records. Available to everyone, the OPENSEES platform for nonlinear analysis of structures subjected to earthquake loads is selected for modeling. Within the platform, a material that describes the behavior of a timber wall subjected to cyclic action called SAWS is in all equal to the model defined by the ten parameters of the so-called Stewart hysteresis, described earlier.

Perić, Lj. 57
Number 16, december, 2018.
Performance based seismic engineering applied to the light frame ...
Figure 16. Transition from single-degree to multi-degree static system
The wall is modeled by placing in the middle of each element a nonlinear shear spring with described properties (the so-called SAWS material), thus simulating the behavior of the wall. All other elements in the relation are infinitely stiff. Since the structural response also contains yielding of the ground connections (anchors), this same model can be repetitively placed on top of one another and thus generate a multi-story model without limitations, because the effects of inter-story connections over the anchor modeled in MCASHEW is also included in the model response. Figure 17 shows an illustration of the data input for execution of parametric analysis, consisting of the selection of wall geometry, seismically active mass per story, number of stories, seismic zones, parameters defining the damage index and finally the wall model itself. Walls with five different lengths, in four seismic zones with ground accelerations of 0.6, 1.0, 1.3 and 1.6 m/s2 for three different soil types and two types of surface elements (OSB and GB) all together were analyzed in [4]. All 780 computations were individually collected and shown in tables and in graphs (see Figure 19). Figure 18 gives a view of earthquake examples selected from a database of 3510 real seismic records and scaled to the required risk level. The earthquakes had to meet certain conditions which are graphically summarized in Figure 18. 6. Results
The analysis results are presented in tables and graphs. An example of tabulation of results in the format of allowable mass and floors of the building can be seen in Figure 19, while the graphical representation is shown in Figure 20. The results for each zone and floor mass were controlled by an independent IDA method, and they are divided into the results of modal, pushover and NLTH analysis. Considering that floor slabs as a composite of concrete and wood have a seismically active mass of approximately 450 kg/m2 and assuming that the relevant surface attributable to each timber wall with sides 10 x 10 m is practically about 100 m2, then for all elements the mass relevant for practice can be roughly estimated to be of the order of magnitude 100 x 0.45 =45

Perić, Lj. 58
Number 16, december, 2018.
Performance based seismic engineering applied to the light frame ...
t/floor. Thus, it can be concluded that a 3.6 m long wall sheathed with GB panels can be used economically for buildings up to 5 floors in height in seismic zone 1, three floors in seismic zone 2, and for single-story buildings in seismic zones 3a and 3b. Likewise, 3.6 m long walls sheathed with OSB panels can be used for buildings up to 5 floors in height regardless of the seismic zone. At this point it should be noted that one of the limiting criteria of the conducted parametric analysis is the set maximum nonelastic vibration period T* ≤1.7 s, which is in this case the determining criterion reached for all walls sheathed with OSB panels in buildings with 4 and more floors.
Figure 17. Input in Matlab and linking with OPENSEES
Figure 18. An example of the group of ten earthquakes used in the parametric model analysis for the required earthquake risk level of 0.6 m/s2.

Perić, Lj. 59
Number 16, december, 2018.
Performance based seismic engineering applied to the light frame ...
Figure 19. Tabulation of results for the 3.6 m long wall sheathed with gypsum based panels

Perić, Lj. 60
Number 16, december, 2018.
Performance based seismic engineering applied to the light frame ...
Figure 20. Results on the example of the 3.6 m long wall sheathed with GB (left) and OSB (right) panels
7. Example
7.1 Prototype four-story timber building
7.2.1 Results of the analysis based on response spectra
We will use a prototype building shown in Figure 21 as an example of application of PBE in practice. The example is elaborated in detail in [8], which currently has the value of instructions in Switzerland on how to analyze multi-story timber buildings for seismic loads using the spectrum response method.
Figure 21. Prototype four-story building

Perić, Lj. 61
Number 16, december, 2018.
Performance based seismic engineering applied to the light frame ...
Figure 22. Timber wall functioning as a stiffener of the prototype building1
As evident in the plan view in Figure 21, the structure is symmetric along Y-axis and is asymmetric along X-axis. Floor masses are 150 t, while the mass at the level of the last slab is 75 t. The walls are 3 and 4 [m] in length, and extensions at floor slab levels are conceived as multi-shear screw extensions with steel plates, as presented in Figure 22. The walls are sheathed with 15 mm thick OSB panels, and attached to wooden frame with d=1.53 mm diameter staples spaced at 24 mm in two rows. The building is located in a seismic zone with design ground acceleration of 1.6 m/s2. The calculation was begun with the assumption that the wall could develop the ductility of 휇 = 3.0. The vibration period for the first form was determined on the so-called equivalent elastic member, using several methods, and finally the period T1=1.51 s was adopted. The carrying capacity is based on the design capacity of a d=1.53 mm staple and amounts to 푟 = 476 푁 per staple. This results in the calculation bearing capacity of a three-meter long wall of 푅 = 238 푘푁. All results of the calculation performed in [8] can be compressed and shown on a single graph, as is done in Figure 23. The figure shows that the required bearing capacity of the wall is consistent with the assumed required ductility factor 푅 , = 132.5 푘푁, while the wall is actually designed for a bearing capacity of 238 kN, which is an increase of 80%. The figure clearly shows that this does not influence a change in stiffness since the period remains the same. The required ductility has changed from the calculation assumption 휇 = 3.0 to the actual 휇 = 1.67.
Figure 23. Initial assumptions for the calculation of a three-meter long wall of the prototype
building
The fact that the structure is actually designed for 238 kN is completely ignored in further calculation. Instead, the originally assumed seismic force of 132.5 kN is increased for

Perić, Lj. 62
Number 16, december, 2018.
Performance based seismic engineering applied to the light frame ...
Figure 24. Distribution of different values of earthquake forces over the height of the building, affinely to the first vibration form
torsional effects and geometric nonlinearity to a value of 198 kN. This force is distributed over the height of the building, as shown in Figure 24, resulting in forces on foundation fasteners of 526.5 kN. However, the actual force causes the forces in fasteners of 632.7 kN. The remaining values of forces distributed over the height of the building in Figure 24 will be referred to in the second part of the example.
7.2.2 Results of the analysis based on the PBE method
It should be noted first that the methodology used in this paper is based on nonlinear 2D member. In order to carry out the analysis and compare the results of the two methods, all effects need to be reduced to the same two-dimensional space. In this respect, it is necessary first to determine the effect of torsion in order to be able to confidently say what mass is taken by the 3 m long wall in combination with 4 m long walls. As already indicated in the introduction, the total floor mass is 150 t. The problem of determining torsional effects can easily by solved, even by using simple software, therefore only results will be shown here. Interested readers can find a detailed description of all calculation steps in [4]. It is known from elementary statics that total effects can be represented by a linear combination of force work on translational (first part of the equation) and torsional (second part of the equation) displacements.
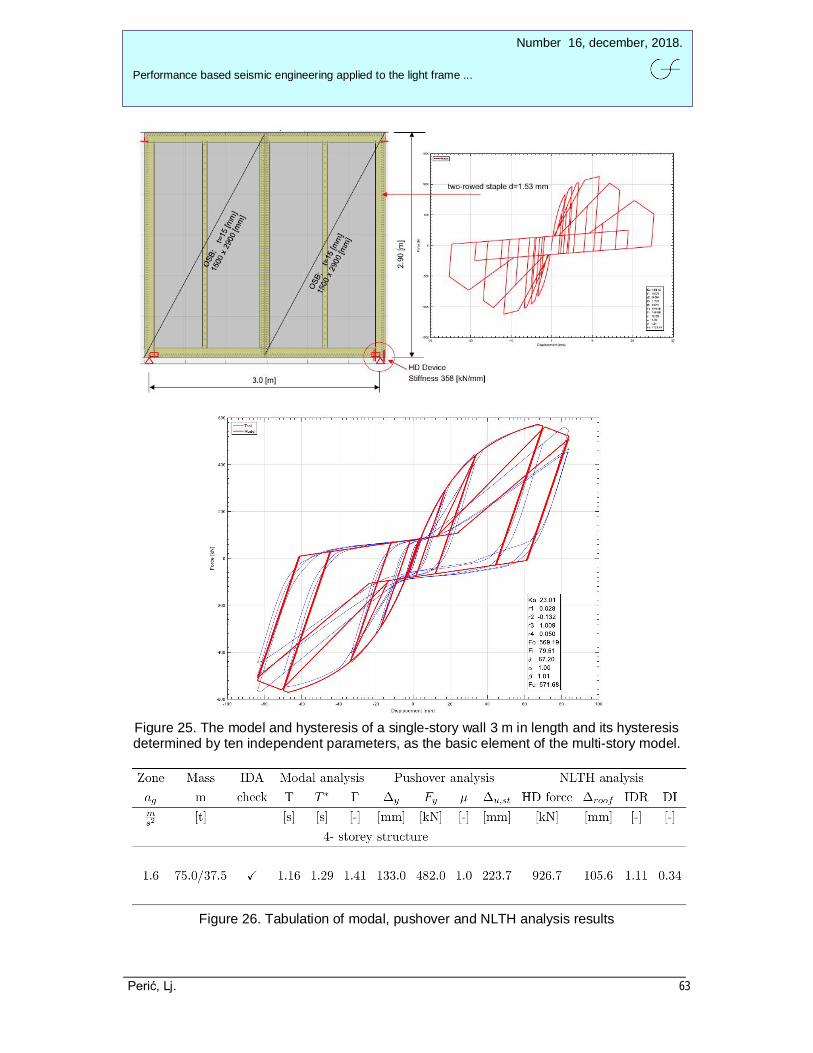
In any case, the 3 m long wall takes 48.6 ≈ 50% of the total seismic force at the level of the first/ground floor, so the corresponding mass is distributed over the walls in a 50:50% ratio, which means that the 3.0 m long wall should be analyzed for a mass of 75 t/floor. The model of a single-story wall is shown in Figure 25 and the results of modal, pushover and NLTH analysis in Figures 26, 27 and 28.
Perić, Lj. 63
Number 16, december, 2018.
Performance based seismic engineering applied to the light frame ...
Figure 25. The model and hysteresis of a single-story wall 3 m in length and its hysteresis determined by ten independent parameters, as the basic element of the multi-story model.
Figure 26. Tabulation of modal, pushover and NLTH analysis results

Perić, Lj. 64
Number 16, december, 2018.
Performance based seismic engineering applied to the light frame ...
Figure 28. Pushover curve (up left), damage index (up right) and selected NLTHA results (down)
Figure 27. Results of modal analysis for first three modes of the four-story wall
floor displacements
floor accelerations
relative floor displacements shear
forces
floor accelerations

Perić, Lj. 65
Number 16, december, 2018.
Performance based seismic engineering applied to the light frame ...
Comparison of the results obtained in [8] with PBE analysis results is shown in Figure 29.
Figure 29. Comparison of results in YPS- ADRS- format
Figure 29 plots the actual results represented by the green line in comparison with the results of the calculation conducted by the response spectrum method, which are represented by the red line. Already at first glance, it is clear that the structure response is linear-elastic, with real bearing capacity (Cy = 2,23). The required bearing capacity, in order for the structure response to be elastic, is Cy = 2.14 m/s2. The real bearing capacity even exceeded this value. The ratio of the design bearing capacity specified by the standard to the actual bearing capacity engaged during an earthquake is expressed by the overstrength ratio, which is 203.5% in this case. With respect to the assumed bearing capacity of the wall, the ratio is almost 370%. The value of damage index DI = 0.34 (see also Figure 14) also shows that the structure is overdesigned, so it can be said that the design earthquake would probably cause minor damage to the structure designed as shown in [8]. Based on the above comparison, a superficial observer would conclude that the structure is overdesigned and consequently probably uneconomical, but the designing method fulfills the function of protecting human lives and properties. Is that so? The statement of Professor Paulay, that earthquakes do not read standards, is well-known. It is precisely on the presented example that this comment is fully manifested. Actually, what is this about? A load-bearing structure will respond to seismic activity completely elastically. This will induce disproportionately larger earthquake forces for which it is designed, at least when speaking of the number of staples d=1.53 mm in diameter and distributed in two rows at a distance of 24 mm. However, the actual earthquake force will also cause disproportionately larger bending moments in the fastener to foundations, causing moments and tensile forces for which the wall is not designed. In Figure 24, in addition to the values determined in [8], the real earthquake force of 464 kN, which causes a fixity moment of 3706 kNm, or forces in anchor elements of 1235 kN, is also distributed over the height of the building. In Figure 24, the base shear force obtained by the NLTH analysis of 379.4 kN, which causes forces in anchors of about 1000 kN, is also distributed over the height of the building according to the first mode. Unlike the triangular distribution of force over the height of the structure, NLTHA gives a slightly lower value of force in anchors of 927 kN, see Figure 26. Whichever of these forces we take, it is not possible to design a reasonable HD connection that can

Perić, Lj. 66
Number 16, december, 2018.
Performance based seismic engineering applied to the light frame ...
Figure 30. Results of the four-story wall of a length of 3.0 m with calculation bearing capacity 219 kN
transfer this force to the ground. The maximum (reasonable) value is approximately 750 kN and is realized with three steel plates slotted in a timber post and four posts with steel dowels d=16 mm in four rows (96ple shear connection), which require a minimum post size of 300 x 300 mm in order to be installed. However, guided by the wrong conclusion that the system responds nonlinearly, the connection of the wall to the ground is significantly underdesigned. In case of an earthquake it would fail, while the entire package above the foundation fastener would behave as a block, elastically. For comparison, let's see the behavior of a wall of the same length and of real bearing capacity at the level of the expected bearing capacity of about 238 kN. Namely, it is a 3.0 m long wall, fastened with a single row of d=2.87 mm diameter nails spaced at 30 mm. Everything else is the same as in the example analyzed above. The calculation result is tabulated for the first four floors in Figure 30.
It is interesting that, despite almost half the value of the bearing capacity, the wall "transfers" a greater mass of 92> 75 t/floor, and meets all criteria as well. Bearing capacity for earthquake resistance would be even greater if we selected longer limit periods. Thus, the limit period of 1.7 [s] is reached, while the required ductility is 2.23, forces in anchors 578 kN, relative displacement 1.62% and damage index DI=0.56. From this it follows not only that it is possible to optimize the load-bearing structure, but also that it is possible to achieve almost complete control of its real behavior, regarding all constitutive elements. It is also clearly shown that more resistant and stiffer elements subjected to earthquake do not necessarily have a better behavior than "weaker", ductile elements, in fact, their behavior

Perić, Lj. 67
Number 16, december, 2018.
Performance based seismic engineering applied to the light frame ...
is uncontrolled, and the actual degree of protection of people and goods is unknown and largely entirely unreliable. 8. Conclusion
The paper presents the methodology for calculation of structures for earthquake resistance using the PBE method. For this purpose, the development of a mechanical model and the method of determining the parameters defining the degree of structural damage are shown. Application of the method is an extension of the displacement-based N2 method. Application of the method in the design of multi-story structures is presented on the example of traditionally used timber walls. By its nature, the method is independent of the type of material and can also be applied to reinforced concrete, masonry or metal structures.
REFERENCES 1. Steven L. Kramer: Geotechnical Earthquake Engineering, Pearson Education, Inc. 1996 2. S. K. Jain, A.N.C. Nigam, Historical development and current status of earthquake
engineering in India, 12WCEE, 2000 3. Tjen. N. Tjhin, M.A.Aschheim, J.W.Wallace: Yield displacement-based seismic design of
RC wall buildings, Engineer structures, 2007 4. Lj.Peric: Feasibility range for LFTW in regions of low to moderate seismicity, PhD Thesis,
ETH Zürich, 2018. 5. M.J.N. Priestley, G.M. Calvi, M.J. Kowalsky: Displacement-based seismic design of
structures, IUSS Press, Italy, 2007 6. H.Bachmann: Erdbebensicherung von Bauwerken, Birkhäuser Verlag, Basel-Boston-
Berlin, 2002 7.Young-Ji Paark, Alfredo Ang: Seismic damage analysis of reinforced concrete buildings.
Journal of Structural Engineering, 111:740-757, 1985 8. R. Brunner, P.Jung, R. Steiger, T. Wenk, Erdbebengerechte mehrgeschossige Holzbau,
Lignum, Schweiz (2010)