nov-24-2007 chapter 4: assessment of terrestrial...
TRANSCRIPT

1
Nov-24-2007
Chapter 4: Assessment of Terrestrial Ecosystems A. How have Ecosystems Changed? A.1. Ecosystem Structure We consider the following categories of systems on land: forest, cultivated, dry-land, urban and polar. Forest systems: Forest systems are lands dominated by trees - they are often used for timber, fuel-wood, and non-wood forest products. Figure 1 shows areas with a canopy cover of at least 40% by woody plants taller than 5 meters. Forests include temporarily cut-over forests and plantations but exclude orchards and agro-forests where the main products are food crops.
• The global area of forest systems has been reduced by one half over the past three centuries.
• Forests have effectively disappeared in 25 countries, and another 29 have lost more than 90% of their forest cover.
• Forest systems are associated with the regulation of 57% of total water runoff. About 4.6 billion people depend for all or some of their water on supplies from forest systems.
• From 1990 to 2000, the global area of temperate forest increased by almost 3 million hectares per year, while deforestation in the tropics occurred at an average rate exceeding 12 million hectares per year over the past two decades.
Figure 1. Global distribution of forest systems.
2
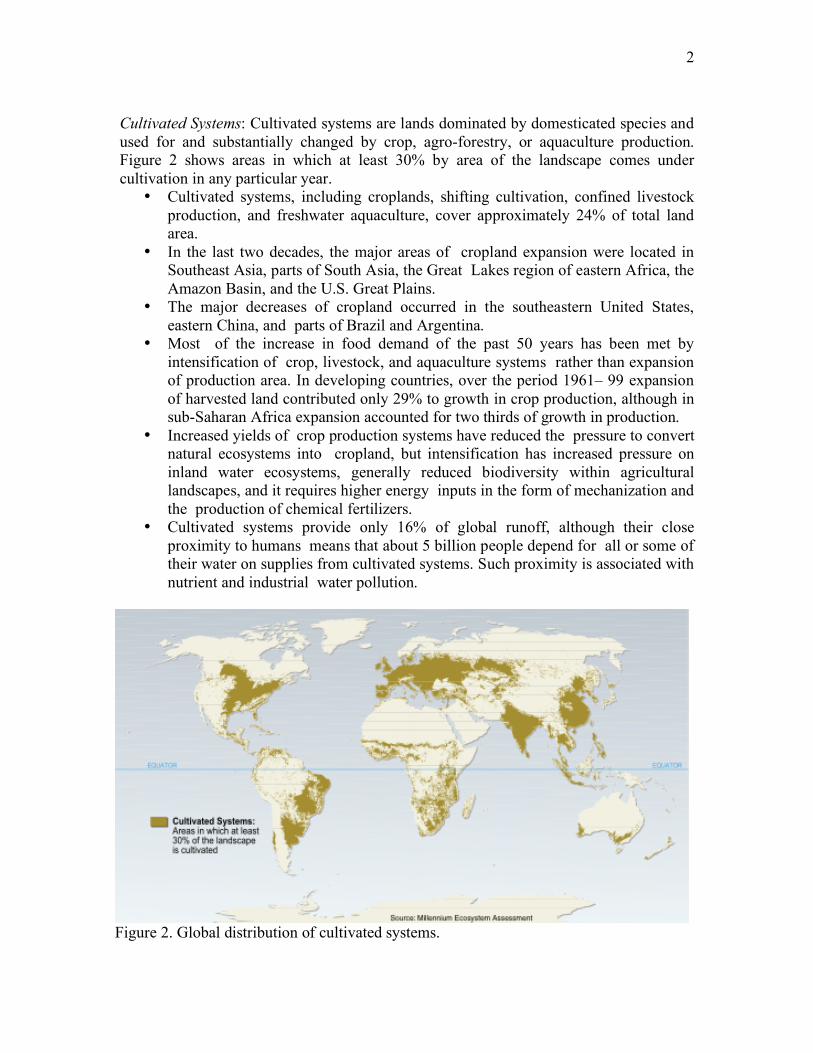
Cultivated Systems: Cultivated systems are lands dominated by domesticated species and used for and substantially changed by crop, agro-forestry, or aquaculture production. Figure 2 shows areas in which at least 30% by area of the landscape comes under cultivation in any particular year.
• Cultivated systems, including croplands, shifting cultivation, confined livestock production, and freshwater aquaculture, cover approximately 24% of total land area.
• In the last two decades, the major areas of cropland expansion were located in Southeast Asia, parts of South Asia, the Great Lakes region of eastern Africa, the Amazon Basin, and the U.S. Great Plains.
• The major decreases of cropland occurred in the southeastern United States, eastern China, and parts of Brazil and Argentina.
• Most of the increase in food demand of the past 50 years has been met by intensification of crop, livestock, and aquaculture systems rather than expansion of production area. In developing countries, over the period 1961– 99 expansion of harvested land contributed only 29% to growth in crop production, although in sub-Saharan Africa expansion accounted for two thirds of growth in production.
• Increased yields of crop production systems have reduced the pressure to convert natural ecosystems into cropland, but intensification has increased pressure on inland water ecosystems, generally reduced biodiversity within agricultural landscapes, and it requires higher energy inputs in the form of mechanization and the production of chemical fertilizers.
• Cultivated systems provide only 16% of global runoff, although their close proximity to humans means that about 5 billion people depend for all or some of their water on supplies from cultivated systems. Such proximity is associated with nutrient and industrial water pollution.
Figure 2. Global distribution of cultivated systems.

3
Urban Systems: These are built environments with a high human density. For mapping purposes (Figure 3), known human settlements with a population of 5,000 or more are considered, with boundaries delineated by observing persistent night-time lights or by inferring areal extent in the cases where such observations are absent.
• The world’s urban population increased from about 200 million in 1900 to 2.9 billion in 2000, and the number of cities with populations in excess of 1 million increased from 17 in 1900 to 388 in 2000.
Dry-land Systems: These are lands where plant production is limited by water availability. The dominant human uses are large mammal herbivory, including livestock grazing, and cultivation. Figure 3 shows dry-lands as defined by the U.N. Convention to Combat Desertification, namely lands where annual precipitation is less than two thirds of potential evapo-transpiration - from dry sub-humid areas (ratio ranges 0.50–0.65) through semi-arid, arid, and hyper-arid (ratio <0.05), but excluding polar areas.
• Dry-lands include cultivated lands, scrublands, shrublands, grasslands, savannas, semi-deserts, and true deserts.
• Dry-land systems cover about 41% of Earth’s land surface and are inhabited by more than 2 billion people.
• Croplands cover approximately 25% of dry-lands, and dry-land rangelands support approximately 50% of the world’s livestock.
• The current socio-economic condition of people in dry-land systems, of which about 90% are in developing countries, is worse than in other areas. Fresh water availability in dry-lands is projected to be further reduced from the current average of 1,300 cubic meters per person per year in 2000, which is already below the threshold of 2,000 cubic meters required for minimum human well-being and sustainable development.
• Approximately 10–20% of the world’s dry-lands are degraded. Polar Systems: These are high-latitude systems frozen for most of the year, including ice caps, areas underlain by permafrost, tundra, polar deserts, and polar coastal areas (Figure 3). Polar systems do not include high-altitude cold systems in low latitudes.
• Temperature in polar systems is on average warmer now than at any time in the last 400 years, resulting in widespread thaw of permafrost and reduction of sea ice.
• Most changes in feedback processes that occur in polar regions magnify trace gas–induced global warming trends and reduce the capacity of polar regions to act as a cooling system for Earth.
• Tundra constitutes the largest natural wetland in the world.

4
Figure 3. Global distribution of urban, dry-land and polar systems. Conclusion 1: The structure of the world’s ecosystems changed more rapidly in the second half of the twentieth century than at any time in recorded human history, and virtually all of Earth’s ecosystems have now been significantly transformed through human actions.
• The most significant change in the structure of ecosystems has been the transformation of approximately one quarter (24%) of Earth’s terrestrial surface to cultivated systems. More land was converted to cropland in the 30 years after 1950 than in the 150 years between 1700 and 1850.
Conclusion 2: Although the most rapid changes in ecosystems are now taking place in developing countries, industrial countries historically experienced comparable rates of change.
• Croplands expanded rapidly in Europe after 1700 and in North America and the former Soviet Union particularly after 1850. Roughly 70% of the original temperate forests and grasslands and Mediterranean forests had been lost by 1950, largely through conversion to agriculture.
• Historically, deforestation has been much more intensive in temperate regions than in the tropics, and Europe is the continent with the smallest fraction of its original forests remaining. However, changes prior to the industrial era seemed to occur at much slower rates than current transformations.
Conclusion 3: The ecosystems and biomes that have been most significantly altered globally by human activity include marine and freshwater ecosystems, temperate broadleaf forests, temperate grasslands, Mediterranean forests, and tropical dry forests.
• More than two thirds of the area of 2 of the world’s 14 major terrestrial biomes (temperate grasslands and Mediterranean forests) and more than half of the area

5
of 4 other biomes (tropical dry forests, temperate broadleaf forests, tropical grassland, and flooded grasslands) had been converted (primarily to agriculture) by 1990.
• Among the major biomes, only tundra and boreal forests show negligible levels of loss and conversion, although they have begun to be affected by climate change.
Conclusion 4: Globally, the rate of conversion of ecosystems has begun to slow largely due to reductions in the rate of expansion of cultivated land, and in some regions (particularly in temperate zones) ecosystems are returning to conditions and species compositions similar to their pre-conversion states. Yet rates of ecosystem conversion remain high or are increasing for specific ecosystems and regions.
• The pattern of deforestation, afforestation, and dry-land degradation between 1980 and 2000 is shown in Figure 4.
Figure 4. Global distribution of deforestation, afforestation and dry-land degradation.
• Opportunities for further expansion of cultivation are diminishing in many regions of the world as most of the land well-suited for intensive agriculture has been converted to cultivation.
• Increased agricultural productivity is also diminishing the need for agricultural expansion.
• As a result of these two factors, a greater fraction of land in cultivated systems (areas with at least 30% of land cultivated) is actually being cultivated, the intensity of cultivation of land is increasing, fallow lengths are decreasing, and management practices are shifting from monocultures to polycultures.

6
• Since 1950, cropland areas have stabilized in North America and decreased in Europe and China. Cropland areas in the Former Soviet Union have decreased since 1960.
• Within temperate and boreal zones, forest cover increased by approximately 2.9 million hectares per year in the 1990s, of which approximately 40% was forest plantations.
• In some cases, rates of conversion of ecosystems have apparently slowed because most of the ecosystem has now been converted, as is the case with temperate broadleaf forests and Mediterranean forests.
2. Ecosystem Processes Ecosystem processes, including water, nitrogen, carbon, and phosphorus cycling, changed more rapidly in the second half of the twentieth century than at any time in recorded human history. Human modifications of ecosystems have changed not only the structure of the systems (such as what habitats or species are present in a particular location), but their processes and functioning as well. The capacity of ecosystems to provide services derives directly from the operation of natural biogeochemical cycles that in some cases have been significantly modified. Water Cycle:
• Water withdrawals from rivers and lakes for irrigation or for urban or industrial use doubled between 1960 and 2000 (Worldwide, 70% of water use is for agriculture).
• Large reservoir construction has doubled or tripled the residence time of river water - the average time, that is, that a drop of water takes to reach the sea.
• Globally, humans use slightly more than 10% of the available renewable freshwater supply through household, agricultural, and industrial activities, although in some regions such as the Middle East and North Africa, humans use 120% of renewable supplies (the excess is obtained through the use of groundwater supplies at rates greater than their rate of recharge).
Carbon Cycle:
• Since 1750, the atmospheric concentration of carbon dioxide has increased by about 34% (from about 280 parts per million to 376 parts per million in 2003). Approximately 60% of that increase (60 parts per million) has taken place since 1959.
• The effect of changes in terrestrial ecosystems on the carbon cycle reversed during the last 50 years. Those ecosystems were on average a net source of CO2 during the nineteenth and early twentieth centuries (primarily due to deforestation, but with contributions from degradation of agricultural, pasture, and forestlands) and became a net sink sometime around the middle of the last century (although carbon losses from land use change continue at high levels).

7
• Factors contributing to the growth of the role of ecosystems in carbon sequestration include afforestation, reforestation, and forest management in North America, Europe, China, and other regions; changed agriculture practices; and the fertilizing effects of nitrogen deposition and increasing atmospheric CO2.
Nitrogen Cycle:
• The total amount of reactive, or biologically available, nitrogen created by human activities increased nine-fold between 1890 and 1990, with most of that increase taking place in the second half of the century in association with increased use of fertilizers (Figure 5).
• A recent study of global human contributions to reactive nitrogen flows projected that flows will increase from approximately 165 teragrams of reactive nitrogen in 1999 to 270 teragrams in 2050, an increase of 64%.
• More than half of all the synthetic nitrogen fertilizer (which was first produced in 1913) ever used on the planet has been used since 1985.
• Human activities have now roughly doubled the rate of creation of reactive nitrogen on the land surfaces of Earth.
• The flux of reactive nitrogen to the oceans increased by nearly 80% from 1860 to 1990, from roughly 27 teragrams of nitrogen per year to 48 teragrams in 1990.
Figure 5. Most of the reactive nitrogen produced by humans comes from manufacturing nitrogen for synthetic fertilizer and industrial use. Reactive nitrogen is also created as a by-product of fossil fuel combustion and by some (nitrogen-fixing) crops and trees in agro-ecosystems. The range of the natural rate of bacterial nitrogen fixation in natural terrestrial ecosystems (excluding fixation in agro-ecosystems) is shown for comparison. Human activity now produces approximately as much reactive nitrogen as natural processes do on the continents.

8
B. Drivers of Ecosystem Changes Natural or human-induced factors that directly or indirectly cause a change in an ecosystem are referred to as “drivers.”
• A direct driver unequivocally influences ecosystem processes. • An indirect driver operates more diffusely, by altering one or more direct
drivers. Drivers affect ecosystem services and human well-being at different spatial and temporal scales, which makes both their assessment and their management complex.
• Climate change may operate on a global or a large regional spatial scale. • Political change may operate at the scale of a nation or a municipal district. • Socio-cultural change typically occurs slowly, on a time scale of decades
(although abrupt changes can sometimes occur, as in the case of wars or political regime changes), while economic changes tend to occur more rapidly.
As a result of this spatial and temporal dependence of drivers, the forces that appear to be most significant at a particular location and time may not be the most significant over larger (or smaller) regions or time scales. B.1. Indirect Drivers In the aggregate and at a global scale, there are five indirect drivers of changes in ecosystems and their services: population change, change in economic activity, sociopolitical factors, cultural factors, and technological change. Collectively these factors influence the level of production and consumption of ecosystem services and the sustainability of production. Demographic Drivers:
• Global population doubled in the past 40 years and increased by 2 billion people in the last 25 years, reaching 6 billion in 2000.
• Developing countries have accounted for most recent population growth in the past quarter century, but there is now an unprecedented diversity of demographic patterns across regions and countries.
• Some high-income countries such as the United States are still experiencing high rates of population growth, while some developing countries such as China, Thailand, and North and South Korea have very low rates. In the United States, high population growth is due primarily to high levels of immigration.
• About half the people in the world now live in urban areas (although urban areas cover less than 3% of the terrestrial surface), up from less than 15% at the start of the twentieth century. High-income countries typically have populations that are 70–80% urban. Some developing-country regions, such as parts of Asia, are

9
still largely rural, while Latin America, at 75% urban, is indistinguishable from high-income countries in this regard.
Economic Drivers:
• Global economic activity increased nearly sevenfold between 1950 and 2000. • With rising per capita income, the demand for many ecosystem services grows. At
the same time, the structure of consumption changes. In the case of food, for example, as income grows the share of additional income spent on food declines, the importance of starchy staples (such as rice, wheat, and potatoes) declines, diets include more fat, meat and fish, and fruits and vegetables, and the proportionate consumption of industrial goods and services rises.
• In the late twentieth century, income was distributed unevenly, both within countries and around the world. The level of per capita income was highest in North America, Western Europe, Australasia, and Northeast Asia, but both GDP growth rates and per capita GDP growth rates were highest in South Asia, China, and parts of South America (Figure 6).
Figure 6. Average annual percentage growth rate of GDP at market prices based on constant local currency. Dollar figures for GDP are converted from domestic currencies using 1995 official exchange rates. GDP is the sum of gross value added by all resident producers in the economy plus any product taxes and minus any subsidies not included in the value of the products. It is calculated without making deductions for depreciation of fabricated assets or for depletion and degradation of natural resources.

10
• Growth in international trade flows has exceeded growth in global production for many years, and the differential may be growing. In 2001, international trade in goods was equal to 40% of gross world product.
• Taxes and subsidies are important indirect drivers of ecosystem change. Fertilizer taxes or taxes on excess nutrients, for example, provide an incentive to increase the efficiency of the use of fertilizer applied to crops and thereby reduce negative externalities. Currently, many subsidies substantially increase rates of resource consumption and increase negative externalities.
• Annual subsidies to conventional energy, which encourage greater use of fossil fuels and consequently emissions of greenhouse gases, are estimated to have been $250–300 billion in the mid-1990s.
• The 2001–03 average subsidies paid to the agricultural sectors of OECD countries were over $324 billion annually, encouraging greater food production and associated water consumption and nutrient and pesticide release. At the same time, many developing countries also have significant agricultural production subsidies.
Sociopolitical Drivers:
• Sociopolitical drivers encompass the forces influencing decision-making and include the quantity of public participation in decision-making, the groups participating in public decision-making, the mechanisms of dispute resolution, the role of the state relative to the private sector, and levels of education and knowledge.
• These factors in turn influence the institutional arrangements for ecosystem management, as well as property rights over ecosystem services.
• Over the past 50 years there have been significant changes in sociopolitical drivers.
• There is a declining trend in centralized authoritarian governments and a rise in elected democracies. The role of women is changing in many countries, average levels of formal education are increasing, and there has been a rise in civil society (such as increased involvement of NGOs and grassroots organizations in decision-making processes).
• The trend toward democratic institutions has helped give power to local communities, especially women and resource-poor households. There has been an increase in multilateral environmental agreements.
• The importance of the state relative to the private sector - as a supplier of goods and services, as a source of employment, and as a source of innovation - is declining.
Cultural and Religious Drivers:
• To understand culture as a driver of ecosystem change, it is most useful to think of it as the values, beliefs, and norms that a group of people share.

11
• In this sense, culture conditions individuals’ perceptions of the world, influences what they consider important, and suggests what courses of action are appropriate and inappropriate.
• Broad comparisons of whole cultures have not proved useful because they ignore vast variations in values, beliefs, and norms within cultures. Nevertheless, cultural differences clearly have important impacts on direct drivers. Cultural factors, for example, can influence consumption behavior (what and how much people consume) and values related to environmental stewardship, and they may be particularly important drivers of environmental change.
Science and Technology:
• The development and diffusion of scientific knowledge and technologies that exploit that knowledge has profound implications for ecological systems and human wellbeing. The twentieth century saw tremendous advances in understanding how the world works physically, chemically, biologically, and socially and in the applications of that knowledge to human endeavors.
• Science and technology are estimated to have accounted for more than one third of total GDP growth in the United States from 1929 to the early 1980s, and for 16–47% of GDP growth in selected OECD countries in 1960–95.
• The impact of science and technology on ecosystem services is most evident in the case of food production. Much of the increase in agricultural output over the past 40 years has come from an increase in yields per hectare rather than an expansion of area under cultivation. For instance, wheat yields rose 208%, rice yields rose 109%, and maize yields rose 157% in the past 40 years in developing countries.
• At the same time, technological advances can also lead to the degradation of ecosystem services. Advances in fishing technologies, for example, have contributed significantly to the depletion of marine fish stocks.
Summary: Consumption of ecosystem services is slowly being decoupled from economic growth. Growth in the use of ecosystem services over the past five decades was generally much less than the growth in GDP. This change reflects structural changes in economies, but it also results from new technologies and new management practices and policies that have increased the efficiency with which ecosystem services are used and provided substitutes for some services. Even with this progress, though, the absolute level of consumption of ecosystem services continues to grow, which is consistent with the pattern for the consumption of energy and materials such as metals: in the 200 years for which reliable data are available, growth of consumption of energy and materials has outpaced increases in materials and energy efficiency, leading to absolute increases of materials and energy use. Global trade magnifies the effect of governance, regulations, and management practices on ecosystems and their services, enhancing good practices but worsening the damage caused by poor practices. Increased trade can accelerate degradation of ecosystem

12
services in exporting countries if their policy, regulatory, and management systems are inadequate. At the same time, international trade enables comparative advantages to be exploited and accelerates the diffusion of more-efficient technologies and practices. For example, the increased demand for forest products in many countries stimulated by growth in forest products trade can lead to more rapid degradation of forests in countries with poor systems of regulation and management, but can also stimulate a “virtuous cycle” if the regulatory framework is sufficiently robust to prevent resource degradation while trade, and profits, increase. While historically most trade related to ecosystems has involved provisioning services such as food, timber, fiber, genetic resources, and biochemicals, one regulating service - climate regulation, or more specifically carbon sequestration - is now also traded internationally. Urban demographic and economic growth has been increasing pressures on ecosystems globally, but affluent rural and suburban living often places even more pressure on ecosystems. Dense urban settlement is considered to be less environmentally burdensome than urban and suburban sprawl. And the movement of people into urban areas has significantly lessened pressure on some ecosystems and, for example, has led to the reforestation of some parts of industrial countries that had been deforested in previous centuries. At the same time, urban centers facilitate human access to and management of ecosystem services through, for example, economies of scale related to the construction of piped water systems in areas of high population density. B.2. Direct Drivers Most of the direct drivers of change in ecosystems and biodiversity currently remain constant or are growing in intensity in most ecosystems (Figure 7).
• The most important direct drivers of change in ecosystems are habitat change (land use change and physical modification of rivers or water withdrawal from rivers), pollution, and climate change.
Land cover Change: For terrestrial ecosystems, the most important direct drivers of change in ecosystem services in the past 50 years, in the aggregate, have been land cover change (in particular, conversion to cropland) and the application of new technologies (which have contributed significantly to the increased supply of services such as food, timber, and fiber).
• In 9 of the 14 terrestrial biomes, between one half and one fifth of the area has been transformed, largely to croplands. Only biomes relatively unsuited to crop plants, such as deserts, boreal forests, and tundra, have remained largely untransformed by human action.
• New technologies have resulted in significant increases in the supply of some ecosystem services, such as through increases in agricultural yield. In the case of cereals, for example, from the mid-1980s to the late 1990s the global area under cereals fell by around 0.3% a year, while yields increased by about 1.2% a year.

13
Figure 7. Main direct drivers of change in terrestrial ecosystems. Nutrient Overloading: Over the past four decades, excessive nutrient loading has emerged as one of the most important direct drivers of ecosystem change in terrestrial, freshwater, and marine ecosystems (Table 1).

14
Table 1. Increase in Nitrogen fluxes in rivers to coastal oceans due to human activities related to fluxes prior to the industrial and agricultureal revolutions.
• While the introduction of nutrients into ecosystems can have both beneficial effects (such as increased crop productivity) and adverse effects (such as eutrophication of inland and coastal waters), the beneficial effects will eventually reach a plateau as more nutrients are added (that is, additional inputs will not lead to further increases in crop yield), while the harmful effects will continue to grow.
• Synthetic production of nitrogen fertilizer has been an important driver for the remarkable increase in food production that has occurred during the past 50 years. World consumption of nitrogenous fertilizers grew nearly eightfold between 1960 and 2003, from 10.8 million tons to 85.1 million tons.
• As much as 50% of the nitrogen fertilizer applied may be lost to the environment, depending on how well the application is managed. Excessive flows of nitrogen contribute to eutrophication of freshwater and coastal marine ecosystems and acidification of freshwater and terrestrial ecosystems (with implications for biodiversity in these ecosystems).
• Phosphorus application has increased threefold since 1960, with a steady increase until 1990 followed by a leveling off at a level approximately equal to applications in the 1980s. While phosphorus use has increasingly concentrated on phosphorus deficient soils, the growing phosphorus accumulation in soils contributes to high levels of phosphorus runoff.
• As with nitrogen loading, the potential consequences include eutrophication of coastal and freshwater ecosystems, which can lead to degraded habitat for fish and decreased quality of water for consumption by humans and livestock.
• Many ecosystem services are reduced when inland waters and coastal ecosystems become eutrophic. Water from lakes that experience algal blooms is more expensive to purify for drinking or other industrial uses. Eutrophication can reduce or eliminate fish populations. Possibly the most apparent loss in services is the loss of many of the cultural services provided by lakes. Foul odors of rotting algae, slime-covered lakes, and toxic chemicals produced by some blue-green algae during blooms keep people from swimming, boating, and otherwise enjoying the aesthetic value of lakes.
Climate change: In the past century, climate change has already had a measurable impact on ecosystems. Earth’s climate system has changed since the preindustrial era, in part due to human activities, and it is projected to continue to change throughout the twenty-first century.

15
• During the last 100 years, the global mean surface temperature has increased by about 0.6 Celsius, precipitation patterns have changed spatially and temporally, and global average sea level rose by 0.1–0.2 meters.
• Observed changes in climate, especially warmer regional temperatures, have already affected biological systems in many parts of the world. There have been changes in species distributions, population sizes, and the timing of reproduction or migration events, as well as an increase in the frequency of pest and disease outbreaks, especially in forested systems. The growing season in Europe has lengthened over the last 30 years.

16
References General: Millennium Ecosystem Assessment: Ecosystems and Human Well-being. Ecosystems of Europe: Schroeter et al., Ecosystem Service Supply and Vulnerability to Global Change in Europe. / www.sciencexpress.org / 27 October 2005 / Page 1/ 10.1126/science.1115233 Land Use: Foley et al., Global Consequences of Land Use, Science, Vol. 309, 570-574 (2005). Global Water Use: Vorosmarty et al., Global Water Resources: Vulnerability from Climate Change and Population Growth, Science, Vol. 289, 284-288 (2000). Deforestation: Nepstad et al., Large-scale impoverishment of Amazonian forests by logging and fire. Nature, Vol. 398, 505-508 (1999). Asner et al., Selective logging in the Brazilian Amazon, Science, Vol. 310, 480-482 (2005).