notice of meeting - squarespace · notice of meeting policy committee date: april 19, ......
TRANSCRIPT

NOTICE OF MEETING
POLICY COMMITTEE
DATE: April 19, 2017 TIME: 9:30 am PLACE: Washtenaw County Learning Resource Center
4135 Washtenaw Ave, Ann Arbor, MI 48108 Superior Room
AGENDA:
1. Call to Order/Introductions
2. Approval of the Agenda
3. Approval of Minutes – March 15, 2017 Policy Committee Meeting (attached) – Action
4. Public Participation
5. Communications and Announcements
6. Bills over $500
7. Old Business
A. FY 2017-2020 CMAQ Prioritization (attached) - Action 8. New Business
A. 2040 Long Range Plan Update (attached) - Action B. Travel Demand Model Contract Authorization (attached) - Action
1

9. Agency Reports Ann Arbor DDA City of Ann Arbor Ann Arbor Township City of Chelsea Pittsfield Township City of Ypsilanti The Ride City of Milan Ypsilanti Township Scio Township Superior Township MDOT Planning MDOT Region/TSC Northfield Township Washtenaw County BOC City of Dexter City of Saline Dexter TownshipSEMCOG SWWCOG EMU U of M FHWA WCRC
10. Adjournment
The Washtenaw Area Transportation Study (WATS) financed the preparation of this document through grants from the U.S. Department of Transportation in cooperation with the Michigan Department of Transportation and contributions from local government, public transit, and educational unit members of the Washtenaw Area Transportation Study. The views and opinions expressed herein do not necessarily state or reflect those of the U. S. Department of Transportation.
2

Minutes of Meeting
POLICY COMMITTEE DATE: April 19, 2017 TIME: 9:30 a.m.
PLACE: Washtenaw County Learning Resource Center Members Present: City of Dexter – Jim Carson, Chair
Pittsfield Township – Mandy Grewal
City of Ypsilanti – Peter Murdock
MDOT Region - Kari Martin (for Pam Boyd) City of Chelsea – Melissa Johnson Ypsilanti Township – Monica Ross-Williams
Scio Township – Nancy Hedberg, Vice-Chair
City of Ann Arbor – Chuck Warpehoski Ann Arbor Township – Mike Moran WCRC – Sheryl Siddall (for Doug Fuller) TheRide – Larry Krieg Northfield Township - Marlene Chockley City of Saline – Linda TerHaar (for Brian Marl) WCBOC – Conan Smith
Members Absent: Superior Township – Ken Schwartz City of Ann Arbor DDA – Keith Orr EMU - City of Milan – Michael Armitage
Dexter Township - Harley Rider University of Michigan – Hank Baier SWWCOG – Gene DeRossett
Others Present: WATS – Ryan Buck, Mark Ferrall, Suzann Flowers, Nick Sapkiewicz SEMCOG - Tom Bruff FHWA - Andy Pickard MDOT Region - Chris Gulock RTA - Liz Gerber and Alma Wheeler Smith
3

Policy Minutes
March 15, 2017
Page 2 of 5
1. Call to Order Chair Carson called the meeting to order at 9:35am. 2. Approval of Agenda Mr. Warpehoski made a motion to approve the agenda as presented. Ms. Grewal supported the motion and it passed. 3. Approval of Minutes Ms. Hedberg made a motion to approve the February 15, 2017 Policy Committee meeting minutes. Ms. Chockley supported the motion and it passed. 4. Public Participation Ms. Gerber from the Regional Transit Authority discussed the recent vote on the RTA millage and how the agency would be moving forward. She noted that the board can consider returning to the voters in 2018 or 2020 for another ballot millage. She also addressed recent news coverage regarding spending irregularities, adding that the board will be taking action at the next meeting. Ms. Johnson stated that she was disappointed that the RTA didn’t provide more services in Western Washtenaw County, and that she thought more people would have supported the millage had those areas been considered. Ms. Gerber responded that time constraints on staff lead to them overlooking portions of the region. Ms. Wheeler Smith stated that the plan considered needs of seniors and people with disabilities, but agreed that it should consider services beyond door-to-door transit in outlying communities in future iterations. Ms. Chockley asked if there was any connection with the North-South Rail plan. Ms. Gerber stated that there is no current formal connection. Mr. Carson stated that the WAVE and People’s Express had a productive conversation with the RTA, and would like to continue those conversations in the future. 5. Communications and Announcements Mr. Buck summarized the contents of the March 2017 Staff report. Mr. Pickard asked staff to elaborate on planned model improvements. Mr. Ferrall stated that the improvements are largely incremental, but will continue to improve the ability to model high capacity transit and improve reporting tools. 6. Bills over $500 Mr. Buck presented three bills for consideration
● $750 x 2 - Yeo and Yeo - Accounting services ● $4,000 - Michigan Municipal Risk Management Association - Authorization amount for
annual coverage
4

Policy Minutes
March 15, 2017
Page 3 of 5
Mr. Krieg made a motion to approve the bills over $500. Ms. TerHaar supported the motion and it passed. 7. Old Business There were no items of old business. 8. New Business A. FY 2017-2020 Transportation Improvement Program Amendments Mr. Sapkiewicz summarized the proposed amendments to the Transportation Improvement Program. Mr. Warpehoski asked why TheRide is removing improvements that coordinate signals with bus vehicles from the program. Mr. Krieg responded that TheRide planned on those projects being funded as part of the planned BRT service on Washtenaw Avenue through the RTA. Mr. Pickard commented on the use of the Safe Routes to School Code in the TIP, which has been discontinued. Ms. Chockley asked why the East Shore Drive project is being removed from the TIP. Ms. Siddall clarified that the project is now being funded with local dollars. Ms. Grewal asked why the US-12 project is being deleted from the TIP. Ms. Martin responded that the project is still planned, but outside the years of the current TIP (2017-2020). She said that future amendments are planned and that it will be included in the Long Range Plan.. Mr. Warpehoski made a motion to approve the FY 2017-2020 Transportation Improvement Program Amendments. Mr. Moran supported the motion and it passed. B. FY 2017-2020 Transportation Improvement Program Modifications Mr. Sapkiewicz summarized modifications of the FY 2017-2020 Transportation Improvement Program. C. FY 2017-2020 CMAQ Prioritization Ms. Flowers summarized the prioritization of the FY2017-2018 CMAQ program proposed by the Technical Committee. Mr. Smith asked staff to explain how the scoring works. Ms. Flowers explained that WATS uses a SEMCOG spreadsheet, which scores projects based on emissions reductions and cost effectiveness. Mr. Krieg asked why the Technical Committee didn’t propose prioritizing the top scoring project. Ms. Flowers responded that SEMCOG has respected the WATS prioritization process in the past, which takes into account local priorities and funding needs. Ms. Ross-Williams asked for more detail on the signal optimization project and why the Baker Road project was prioritized instead. Ms. Siddall described the project and its scope. Staff further described the prioritization process, and discussed the Technical Committee’s priority
5

Policy Minutes
March 15, 2017
Page 4 of 5
of maximizing federal investment. Ms. Johnson asked if there would be value in evaluating CMAQ in the context of Urban and Rural funding, similarly to how STP funds have a urban and rural allocation. Ms. Grewal stated that she would like to see more detail in future discussions regarding the benefits of projects, and the Technical Committee's reasoning for reprioritization. Ms. Ross-Williams made a motion to table discussion on the CMAQ Prioritization until April, when the committee will vote on it. Mr. Krieg supported the motion and it passed. D. 2040 Long Range Plan Update Mr. Sapkiewicz summarized the scope and content of the 2040 Long Range Plan Update. Mr. Ferrall discussed the contents of the Performance Measure Target Summary Sheets and process behind setting the targets. E. Agency Reports TheRide Mr. Krieg reported that the board will select a proposal for improving the Ypsilanti Transit Center in the coming months, and that Chris White will be retiring. MDOT University Region Ms. Martin reported that work on the US-23 Flex Route is underway and that bids will open later today on the US-12 ACM project. Dexter Mr. Carson had nothing to report. SEMCOG Mr. Bruff stated that SEMCOG will host an April 25th workshop on connected vehicles and that they are currently accepting responses to the Pulse of the Region Survey. Ann Arbor Mr. Warpehoski had nothing to report. Northfield Township Ms. Chockley reported that the township is preparing for impacts that the closing of the 6 Mile Bridge over US-23 will have on local traffic. FHWA Mr. Pickard reported that the Performance Measures rules are being finalized, and encouraged the Policy Committee to discuss issues with Technical Committee representatives prior to meetings. Ypsilanti Township Ms. Ross-Williams reported that the US-12 project is moving forward. She also discussed new hotels developing south of the Huron/I-94 bridge, which will put additional strain on traffic and increase the number of pedestrians on the bridge.
6

Policy Minutes
March 15, 2017
Page 5 of 5
WCBOC Mr. Smith reported on the following
● The Regional Prosperity Initiative Region 9 Study on how local governments should prepare for connected vehicles will be released soon
● There have been concerns raised regarding Right of Way as part of the Loop Trail between Dexter and Chelsea
● The county is moving forward on the Platt Road Development WCRC Ms. Siddall reported on the following
● The 2017 millage projects are out to bid ● The Harris road project has started ● The Road Commission is continuing to evaluate and improve culverts throughout the county
Mr. Carson adjourned the meeting at 11:27 am
7
MEMORANDUM
To: Policy Committee
From: Suzann Flowers
Date: April 10, 2017
Re: 2018-2020 CMAQ Prioritization
Background The Congestion Mitigation and Air Quality (CMAQ) program provides funding for projects that reduce traffic congestion or improve air quality for areas that do not meet or are in maintenance for national ambient air quality standards. WATS issued a call for CMAQ projects for fiscal years 2018-2020 on December 6, 2016 and received requests from the Washtenaw County Road Commission, City of Ann Arbor, and Ann Arbor Area Transportation Authority. SEMCOG will continue to issue awards annually leading up to the start of each fiscal year. Staff scored the projects according to SEMCOG’s Regional Ranking process. The three years of requests for the Traffic Operations Centers (TOC) from the City of Ann Arbor and the Washtenaw County Road Commission will be funded by an MDOT set aside of CMAQ funds and therefore were not part of the prioritization recommendation from the Technical Committee. The Technical Committee made a recommendation at their March 2017 meeting to prioritize the submitted CMAQ projects as follows: 2018
WCRC - Baker - Top Priority Project for the County WCRC - Jackson Rd. Signal Interconnect - 630 points
8

WCRC - Ypsilanti Township Signal Optimization - 680 points WCRC - ATMS Backhaul upgrade - 680 points
2019 WCRC - North Territorial at Pontiac Trail Roundabout - Top Priority Project for County WCRC - Signal Interconnect at Ann Arbor-Saline Rd - 580 points WCRC - Signal Interconnect at North Territorial - 530 points City of Ann Arbor - Traffic Adaptive Signal Control - 480 points
2020 City of Ann Arbor - Fuller Maiden Lane Roundabout - Top Priority Project for County WCRC - Signal Optimization at Huron St - 630 points WCRC - Signal Optimization at Plymouth Rd - 580 points City of Ann Arbor - Traffic Adaptive Signal Control - 530 points WCRC - Dixboro Rd. at Plymouth - 130 points
At the time of the WATS Policy Committee’s March 2017 discussion of 2018-2020 CMAQ prioritization, SEMCOG’s intent was to award WATS’ prioritization of projects regardless of regional score. SEMCOG has since stated that only regional scoring will determine projects that get awarded. To maximize the possibility of securing funding for the top priority project, it should be the only project submitted for consideration for 2018 (in the event the top priority is not the top scoring project). Other candidate projects will become illustrative. Beyond the Technical Committee’s recommendation to select Baker as the top 2018 priority, the WCRC (the only other agency submitting projects for 2018) maintain the Baker Rd. roundabout as their top priority and agree to submitting it as WATS’ top priority for 2018 and that all other candidates be considered illustrative for the 2018 SEMCOG call for CMAQ projects. FY 2018 Project List WCRC - Baker - Top Priority Project for the County - 130 points Justification for Baker Road roundabouts as 2018 top Project - The Baker Road project directly advances the goals of the Long Range Plan:
● Linking Transportation and Land Use - The project is within walking distance of two schools and a daycare center. Additionally, Baker Road provides access for commuters accessing I-94 for commuter and truck traffic, and provides the only access to the city’s industrial park. The project will improve the experience of drivers, truckers, pedestrians, and cyclists who are accessing these facilities.
● Provide Access and Mobility - These intersections are congested in the morning and the afternoon with commuter and school traffic, as turning movements from Shield and Dan Hoey are difficult during peak travel. Additionally, the project will improve pedestrian access to the school system, potentially reducing the number
9

of car dropoffs ● Protect and Enhance the Environment - The project will reduce the amount of
idling of cars and trucks waiting to turn on to Baker Road. Also, by improving pedestrian access, automotive trips may be replaced by pedestrian trips from nearby neighborhoods.
● Invest Strategically - The project prioritizes the total dollars invested in Washtenaw County. Maximizing the dollars invested today frees up the greatest amount of resources to address other priorities in the future.
● Engage the Public - The Road Commission and City of Dexter have conducted extensive public involvement identifying the needs at the intersections.
● Promote Safety and Security - Roundabouts, where appropriate, are inherently safer than traditional signalized intersections, reducing the total number of conflict points between vehicles. This project enhances safety for both drivers and pedestrians.
2018 Illustrative Project List WCRC - Ypsilanti Township Signal Optimization - 680 points WCRC - ATMS Backhaul upgrade - 680 points WCRC - Jackson Rd. Signal Interconnect - 630 points WCRC - Signal Optimization at Huron St - 630 points WCRC - Signal Optimization at Plymouth Rd - 580 points WCRC - Signal Interconnect at Ann Arbor-Saline Rd - 580 points City of Ann Arbor - Traffic Adaptive Signal Control - 530 points WCRC - Signal Interconnect at North Territorial - 530 points City of Ann Arbor - Traffic Adaptive Signal Control - 480 points City of Ann Arbor - Fuller Maiden Lane Roundabout - 280 points WCRC - North Territorial at Pontiac Trail Roundabout - 130 points WCRC - Dixboro Rd. at Plymouth - 130 points Action The Technical Committee recommend the Policy Committee approve the Baker Road Project in 2018, as the top priority for CMAQ Funding. In light of SEMCOG’s program changes, staff recommend all other CMAQ candidates be considered illustrative for 2018 funding.
10

11

MEMORANDUM
To: Policy Committee
From: Nick Sapkiewicz
Date: April 11, 2017
Re: 2040 Long Range Transportation Plan Update
Background Over the past several months, staff have developed updates to the 2040 Long Range Transportation Plan (LRTP). The updates were introduced at the March 2017 Technical and Policy Committee meetings and via public participation opportunities. The updates focus on:
● Washtenaw County’s increased focus on equity, including WATS Technical Committee guidance to include an equity representative seat
● Advancements in automated/connected vehicle technology and vehicle ownership models
● Progress on regionally significant projects, including US-23 Flex Route and the Ann Arbor Connector high capacity transit
● Development of WATS data dashboard and LRTP performance measure targets ● Refined Environmental Justice area, better defining the most isolated minority
and low-income populations ● Transit Asset Management State of Good Repair information
The updated Plan is available on the WATS website for review at http://www.miwats.org/2040lrp/home/
Action The Technical Committee recommend the Policy Committee approve the 2040 Long Range Transportation Plan update.
12

MEMORANDUM
To: Technical Committee
From: Ryan Buck
Date: April 12, 2017
Re: WATS Travel Model Contract
Background The travel demand model is a tool that analyzes anticipated multi-model (drive, walk, bike, transit) demand by calibrating it to travel patterns and choices observed today. As a federally defined Transportation Management Area (TMA), WATS is required to have a calibrated model. The model helps identify future congestion issues for the Long Range Plan and allows WATS to test alternative investment and demographic scenarios. It is necessary to create a newly calibrated travel demand model to help develop the 2045 Long Range Plan. The last complete overhaul of the travel demand model took place in 2007, an interim model update took place in 2011. WATS formed a model steering committee, comprised of representatives of MDOT, SEMCOG, WATS, The University of Michigan, City of Ann Arbor and The Ride. WATS released a Request for Proposals for a new travel demand model in early 2017 and received four proposals. The model steering committee reviewed the proposals and chose to interview two firms. Interviews took place on March 24 and RSG was selected as the preferred consultant. The two finalists both provided solid proposals that the committee felt would serve WATS well. However, the Committee and WATS staff felt that the RSG proposal provided a more robust, cutting edge approach particularly in its approach towards university travel, performance measures and reporting, and newly established modeling techniques. RSG’s proposal is attached for your reference. The contract will not exceed $250,000 and is planned to be paid over FY 2017, 2018 and 2019. Approximately 80% of the cost will be paid using federal dollars with the remaining 20% coming from local funds. Action The WATS Director requests the Policy Committee authorize him to sign a contract with RSG in an amount not to exceed $250,000.
13

PROPOSAL
MODEL UPDATE AND IMPROVEMENTS 2.10.2017
RSG 2709 Washington Avenue, Suite 9, Evansville, Indiana 47714
www.rsginc.com
PREPARED FOR: WASHTENAW AREA TRANSPORTATION STUDY
SUBMITTED BY: RSG
IN COOPERATION WITH: CONVERGENCE PLANNING LOCHMUELLER GROUP
14

RSG 2709 Washington Avenue, Suite 9, Evansville, Indiana 47714 www.rsginc.com
February 10, 2017
Mark Ferrall Transportation Planner WATS 200 N Main St., Garden Level Ann Arbor, MI 48104
RE: Request for Proposal for Model Update and Improvements
Dear Mr.Ferrall
Resource Systems Group, Inc. (RSG), together with our teammates, Convergence Planning, LLC, and Lochmueller Group, Inc., are pleased to offer this proposal for the WATS Model Update and Improvements Request for Proposal.
The results of the new MI Travel Counts III travel survey show that that the Ann Arbor area has the highest non-auto mode shares anywhere in the state of Michigan. The area is also leading the way in the state with MDOT’s first Flex Route managed lanes on US 23. WATS needs a model that is tailored to these special characteristics of their area and able to adapt to address further evolution of travel in the region including the advent of autonomous vehicles. The RSG team has the experience and expertise to deliver an advanced trip-based model leveraging big data to do precisely that.
Not only do our many MPO clients from across the county--literally from Concord, New Hampshire to San Diego, California, and from Jacksonville, Florida to Anchorage, Alaska—turn to RSG when they are looking to design and develop new travel forecasting models, but FHWA and FTA turn to RSG as well. RSG developed FTA’s new STOPS transit forecasting tool, FHWA’s new National Long-Distance Passenger Travel Demand Model, and is now designing the first ever National Freight Model for FHWA. RSG staff include the original developers of activity-based models and innovators, including me, who have developed advanced trip-based modeling approaches including advanced destination choice models designed to link home-based and non-home-based trips.
While many firms can claim to have calibrated a mode choice model, and maybe three or four can even point to real experience estimating destination choice models, RSG is routinely called upon by MPOs to help bring their mode choice models up to FTA standards, and I have personally published multiple peer-reviewed scholarly papers on destination choice models and implemented them in half a dozen states. Moreover, they have been one of the focuses of my work precisely because I believe that they can produce meaningfully better forecasts and I am committed to achieving that result for your model.
Perhaps because we develop many of them and few others can, sometimes RSG may be caricatured as peddling activity-based models as a one-size-fits-all solution, but quite to the contrary, RSG’s
15

RSG 55 Railroad Row, White River Junction, Vermont 05001 www.rsginc.com
growing success across the country and around the globe is founded on our commitment to crafting innovative solutions tailored to an individual client’s needs.
We want to sincerely thank you for considering us and hope to be able to assist you soon.
Sincerely,
RSG
VINCE BERNARDIN, JR., PHD Director
16

MODEL UPDATE AND IMPROVEMENTS
PREPARED FOR: WASHTENAW AREA TRANSPORTATION STUDY
i
CONTENTS
1.0 BUSINESS ORGANIZATION ........................................................................................................... 3
2.0 STATEMENT OF THE PROBLEM ................................................................................................... 4
The Local Context ............................................................................................................................ 4
New Modes and Sketch Planning .................................................................................................... 5
Harnessing the Power of Big Data ................................................................................................... 6
3.0 MANAGEMENT SUMMARY ............................................................................................................ 7
4.0 CONSULTANT QUALIFICATIONS AND PRIOR EXPERIENCE .................................................... 9
5.0 WORK PLAN .................................................................................................................................. 18
TASK 1: 2015 Model Network Development ................................................................................. 19
TASK 2: Transit Network Development ......................................................................................... 20
TASK 3: TAZ Development ............................................................................................................ 20
TASK 4: External Trips................................................................................................................... 21
TASK 5: Trip Generation ................................................................................................................ 21
TASK 6: Trip Distribution................................................................................................................ 23
TASK 7: Mode Choice.................................................................................................................... 25
TASK 8: Vehicle and Transit Assignment ...................................................................................... 26
TASK 9: Model Calibration and Validation ..................................................................................... 27
TASK 10: Model Interface Development ........................................................................................ 28
TASK 11: Required Documentation ............................................................................................... 29
TASK 12: Training .......................................................................................................................... 29
TASK 13: Performance Measures ................................................................................................. 30
17
ii February 10, 2017
6.0 KEY PERSONNEL ......................................................................................................................... 31
7.0 PROJECT MANAGEMENT ............................................................................................................ 33
8.0 PROJECT SCHEDULE AND STAFF ALLOCATION .................................................................... 34
9.0 AUTHORIZED NEGOTIATORS ..................................................................................................... 34
10.0 SUBCONSULTANTS ..................................................................................................................... 35
APPENDIX A. RESUMES ....................................................................................................................... 36
List of Figures
FIGURE 1. MICHIGAN MODE SHARES BY AREA (SOURCE: MI TRAVEL COUNTS III, FINAL REPORT) ................................... 4 FIGURE 2. SHIFT FROM TRADITIONAL FOUR-STEP TO ALTERNATIVE TRIP-BASED FRAMEWORK .................................... 22 FIGURE 3. ELIMINATION OF UNREASONABLE NHB TRIPS IN SALT LAKE CITY MODEL ....................................................... 23 FIGURE 4: EXAMPLE SCATTERPLOT COMPARING MODELED VOLUMES WITH COUNTS .................................................... 28 FIGURE 5: SAMPLE EXCEL OUTPUT, TENNESSEE STATEWIDE MODEL ................................................................................ 29
List of Tables
TABLE 1: COST PROPOSAL WITH MILESTONES ......................................................................................................................... 8 TABLE 2: PARTIAL LIST OF RSG PUBLIC AGENCY CLIENTS ..................................................................................................... 9 TABLE 3: MID-SIZED MPO MODELING EXPERIENCE ................................................................................................................. 10 TABLE 4: COST PROPOSAL WITH HOURS BY STAFF ............................................................................................................... 18 TABLE 5: TASK 1 MILESTONES / DELIVERABLES .....................................................................................................................19
TABLE 6: TASK 1 MILESTONES / DELIVERABLES ..................................................................................................................... 20 TABLE 6: TASK 2 MILESTONES / DELIVERABLES ..................................................................................................................... 20 TABLE 7: TASK 3 MILESTONES / DELIVERABLES ..................................................................................................................... 21 TABLE 8: TASK 4 MILESTONES / DELIVERABLES ..................................................................................................................... 21 TABLE 9: TASK 5 MILESTONES / DELIVERABLES ..................................................................................................................... 23 TABLE 10: FACTORS IN GRAVITY MODELS VERSUS DESTINATION CHOICE MODELS ........................................................ 24 TABLE 11: TASK 6 MILESTONES / DELIVERABLES ................................................................................................................... 25 TABLE 12: TASK 7 MILESTONES / DELIVERABLES ................................................................................................................... 26 TABLE 13: TASK 8 MILESTONES / DELIVERABLES ................................................................................................................... 27 TABLE 14: TASK 9 MILESTONES / DELIVERABLES ................................................................................................................... 28 TABLE 15: TASK 10 MILESTONES / DELIVERABLES ................................................................................................................. 29 TABLE 16: TASK 11 MILESTONES / DELIVERABLES ................................................................................................................. 29 TABLE 17: TASK 12 MILESTONE / DELIVERABLE ...................................................................................................................... 30 TABLE 18: TASK 13 MILESTONES / DELIVERABLES ................................................................................................................. 30
18

3
1.0 BUSINESS ORGANIZATION
Resource Systems Group, Inc. (dba RSG) creatively applies state-of-the-art modeling and analytics to transportation planning, market strategy, environmental management, and custom software development, helping organizations make critical decisions with confidence. Since its incorporation by Dartmouth professors in New Hampshire in 1986, RSG has provided actionable insights through the skilled application of advanced, creative, and customized techniques and tools to serve a broad portfolio of public- and private-sector clients locally, regionally, nationally, and internationally. RSG is a 100% employee-owned (ESOP) company and has been honored with several national workplace excellence awards. RSG is headquartered in Vermont at 55 Railroad Row, White River Junction, VT 05001, and has additional offices in Burlington, Vermont; Arlington, Virginia; Evansville, Indiana; Chicago, Illinois; Portland, Oregon; Salt Lake City, Utah; and San Diego, California. The firm is registered to do business in the State of Michigan. We do not have a DBE on our team. We have documented our Good Faith Efforts and have received a waiver for the DBE goal for this contract.
Convergence Planning LLC, opened for business in December of 2015 as a firm that provides transportation planning consulting services to state, metropolitan, county, and private-sector clients around the U.S. The firm is based in Indiana and has been pre-qualified for systems planning consulting by the Indiana Department of Transportation.
Convergence Planning LLC services include:
• Model Development • Transportation Planning • Transportation Performance Measurement • Economic Effectiveness and Impact Analysis • Asset Management Planning • Land Use Forecasting
For more than 30 years, Lochmueller Group has helped communities and clients reinvent their future through thoughtful, actionable planning— planning based on your aspirations and supported by applicable data and the most accurate forecasting tools available. Over time, the firm expanded to offer a wide range of services in road, structural, and environmental design, so that today we can walk beside you each step of the way from planning through execution. This allows us to approach projects with a view to your overall goals, rather than as a series of unrelated assignments. By taking the larger view, we can often suggest alternative approaches that save time and money. These include environmentally sensible solutions, such as green infrastructure, that support long-term sustainability, while respecting limited budgets.
19

Washtenaw Area Transportation Study PROPOSAL Model Update and Improvements
4 February 10, 2017
2.0 STATEMENT OF THE PROBLEM
The existing WATS model is a good traditional trip-based model that the RFP states has generally performed well and been largely adequate for the traditional uses it was put. However, the world of transportation is changing rapidly and the new WATS model needs to be designed both with an eye to new uses and new questions it may be called upon to answer as well as taking advantage of new data resources that were previously unavailable.
THE LOCAL CONTEXT
The RFP notes the importance of forecasting high capacity transit and managed lanes impacts on congestion and VMT, particularly in major corridors. Producing reasonable forecasts for these new modes will be a key focus of our efforts in developing the new WATs model. This begins with correctly understanding and representing the existing mode shares in region – which are the most diverse in Michigan. The results of the latest household travel survey show that the Ann Arbor area has the highest non-auto mode shares anywhere in Michigan (See Figure 1).
The first key to success in developing the new WATS model will be ensuring the model understands and correctly reproduces existing mode choices in the region. Critical to this will be the realistic representation of university students and their travel patterns. Both RSG and Lochmueller Group bring special experience with university student travel having conducted special travel surveys of university students across the country at institutions including Indiana University, the University of Notre Dame, the
FIGURE 1. MICHIGAN MODE SHARES BY AREA (SOURCE: MI TRAVEL COUNTS III, FINAL REPORT)
20

5
University of Utah, Utah State, and Arizona State universities. RSG’s project manager, Vince Bernardin, has developed special university student travel models for MPOs with both smaller commuter schools and major universities including the University of Notre Dame, the University of Kentucky, the University of Arkansas, the University of Tennessee, and James Madison University. Further, both RSG and Convergence Planning bring high levels of expertise in mode choice modeling with experience from across the country. RSG is the developer of the Federal Transit Administration’s (FTA) STOPS transit forecasting tool and both RSG and Convergence Planning staff have experience developing mode choice models and using them for major transit forecasting projects.
Properly capturing the benefit and attractiveness of actively managed lanes, such as the US 23 Flex Route relies on the model understanding travel time reliability and the way travelers perceive delay and unpredictability. RSG has developed methods for incorporating travel time reliability effects in traffic assignment through the SHRP2 C04 and other studies that can be applied to improve the realism of the new WATS model.
NEW MODES AND SKETCH PLANNING
Beyond existing modes, WATS is right to emphasize sketch planning in the RFP, since mode choice models simply cannot be calibrated for new modes that do not yet exist in a region (we will not promise the impossible and then disappoint you when it can’t be done). However, a well-designed and calibrated mode choice model, drawing on data from other parts of the country where these modes do exist should be able to produce good, reasonable forecasts for sketch planning. Drawing on our national experience, we will produce such a model that will produce reasonable forecasts for new transit modes.
Moreover, we will not stop there, but will also design the model - and calibrate it insofar as available data will allow - to include or allow the exploration of other new and emerging modes. Uber has recently begun providing data to the public on request on a case-by-case basis. If adequate data can be acquired from Uber for the WATS area, we will calibrate a taxi/ridesharing mode. If not, we will include ridesharing as a placeholder or ‘dummy’ mode along with modes for private and shared autonomous vehicles. While the model cannot yet be calibrated for these new modes, the inclusion of these modes in the model together with functionality to allow the user to specify ‘override’ mode share assumptions will allow WATS to do exploratory modeling in support of scenario sketch planning efforts with regard to these new modes. The functionality will be basic, and all forecasts will rely directly on the model user’s assumptions for a particular scenario, but even so, we believe that this functionality could be of great value to WATS in coming years as well as allow more straightforward model updates in the future as data on these emerging modes does become available.
21

Washtenaw Area Transportation Study PROPOSAL Model Update and Improvements
6 February 10, 2017
HARNESSING THE POWER OF BIG DATA
Finally, the RFP is right to acknowledge ‘big data’ as an important new resource to support model development. While the RFP emphasizes travel time data, in our experience this data requires substantial effort to process only to result in minor changes to speeds in most models. In contrast, passively collected big data on origin-destination (OD) patterns stands to revolutionize travel forecasting. While household travel surveys provide much important and needed information on many aspects of travel behavior, they actually provide very little data on OD travel patterns. Typically, household surveys provide observations on 2% or less of the cells in a zonal OD matrix. In contrast, big data sources can provide more than ten times this level of information with observations typically on at least 25% and sometimes more than 33% of the cells in a zonal OD matrix. While traditional surveys provide information on average trip lengths, big data can now provide real information on where people go to and from.
For this reason, we have included the use of large-scale passive OD data as part of our proposal. RSG has worked with every major provider of big data for transportation with applications in almost twenty states and is using such a data-driven approach in the development of MDOT’s new statewide model. RSG has also lead the way in understanding the representativeness of big data and developing expansion methods to correct for sample biases. We can harness the power of big data – and control for its limitations – to produce a more accurate and data-driven next generation of the WATS model.
22

7
3.0 MANAGEMENT SUMMARY
We have attempted to tailor our work plan to the framework requested in the RFP, since it is generally well thought through.
For all tasks involving implementation of complex technical methods, the first deliverable is a technical specification document detailing the approach to be taken including the data to be used, the statistical model or analysis method, and the validation or reasonableness checking criteria. No further work will proceed beyond the development of this specification until the WATS project manager accepts the specification. This process will ensure agreement on technical methods and avoid miscommunication and costly rework.
Also, in addition to the final project documentation provided in Tasks 10 and 11, documentation is provided as a milestone / deliverable for each task.
Following the RFP, the work begins with data development in Tasks 1-4, followed by the development of model components in Tasks 5-8. The model will be completed in Tasks 9 and 10, while Tasks 11 and 12 provide final documentation and training. Task 13 provides additional assistance related to computing performance measures. Our cost proposal with detailed milestones and completion dates (in months from the notice to proceed) is presented on the following page.
We believe that our proposal provides superior value through the following innovations:
• Big data on origin-destination patterns which we propose to use provides unprecedentedinformation on travel patterns and supports more data-driven methodologies capable ofproducing significantly more accurate forecasts.
• Including placeholders and allowing user overrides for emerging modes such asautonomous vehicles will allow the WATS model to answer important questions in comingyears starting with sketch planning or “exploratory modeling analysis.”
• Developing FTA compliant mode choice models drawing the RSG team’s deep expertise andutilizing data resources such as GTFS-based networks and SEMCOG’s on-board survey as bestpractices will support transit planning.
• Linking non-home-based (NHB) trips to home-based (HB) trips by simply modeling NHBtrips in series with HB trips instead of in parallel has been proven to eliminate many importantproblems in trip-based models and helps ensure basic consistency with real touring behavior.
• A Campus-based rather than residence-based approach to university trips, together withthe RSG team’s deep experience with university travel, will lead to better representation of theUniversity of Michigan and Eastern Michigan University.
• Replacing gravity models with destination choice models will further improve the accuracyof the model and its ability to produce robust forecasts.
• Incorporating travel time reliability and other traffic dynamics will allow the model to betterunderstand the value of actively managed lanes such as the US 23 Flex Route.
Our proposal may not be the least expensive, but we feel confident that we offer the best value to WATS.
23

Washtenaw Area Transportation Study PROPOSAL Model Update and Improvements
8 February 10, 2017
1. Roadway Network Developmenta Base Year Roadway Network Bernardin, Molakatalla, Bindra/Trevino 1 3 $14,853.70b Future Year Roadway Network Bernardin, Molakatalla 4 5 $5,620.97c Task Documentation Bernardin, Molakatalla, Bindra/Trevino 5 6 $2,945.42
2. Transit Network Developmenta Base Year Transit Network Bernardin, Woodford, Munn, Sadrsadat/Chen 1 3 $12,080.88b Future Year Transit Network Bernardin, Woodford, Munn 4 4 $4,379.87c Task Documentation Bernardin, Woodford, Munn, Sadrsadat/Chen 4 5 $2,521.39
3. TAZ Developmenta Base Year Zones with Data Bernardin, Molakatalla, Bindra/Trevino 1 3 $11,104.17b Future Year Zones with Data Bernardin, Molakatalla 4 6 $10,641.94c Task Documentation Bernardin, Molakatalla 6 7 $3,220.97
4. External Tripsa Base Year EE Trip Matrix Bernardin, Sadrsadat/Chen, Bindra/Trevino 3 6 $35,148.30b Base Year EI/IE Trips Bernardin, Sadrsadat/Chen 3 6 $7,177.16c Future Year External Trips Bernardin, Sadrsadat/Chen 8 9 $4,409.55d Task Documentation Bernardin, Sadrsadat/Chen 9 10 $2,481.54
5. Trip Generationa Trip Generation Specification Bernardin, Bindra/Trevino 2 2 $1,283.20b Validated Trip Generation Model Bernardin, Bindra/Trevino 3 5 $15,867.43c Task Documentation Bernardin, Bindra/Trevino 5 6 $1,283.20
6. Trip Distributiona Trip Distribution Specification Bernardin, Sadrsadat/Chen 3 3 $3,016.44b Validated Trip Distribution Model Bernardin, Sadrsadat/Chen 4 6 $15,996.27c Task Documentation Bernardin, Sadrsadat/Chen 6 7 $3,025.75
7. Mode Choicea Mode Choice Specification Bernardin, Woodford, Munn 4 4 $2,319.26b Validated Mode Choice Model Bernardin, Woodford, Munn 6 10 $23,834.74c Guidance on New Transit Modes Bernardin, Woodford, Munn 11 12 $2,319.26d Task Documentation Bernardin, Woodford, Munn 10 11 $2,319.26
8. Vehicle and Transit Assignmenta Assignment Model Specification Bernardin, Sadrsadat/Chen, Bindra/Trevino 2 2 $4,299.64b Validated Base Year Assignment Bernardin, Sadrsadat/Chen, Bindra/Trevino 10 12 $12,127.36c Reasonable Future Year Assignment Bernardin, Sadrsadat/Chen 12 13 $5,497.98d Task Documentation Bernardin, Sadrsadat/Chen 13 14 $1,928.02
9. Model Calibration and Validationa Validated Model Set Bernardin, Sadrsadat/Chen, Bindra/Trevino 13 14 $6,720.68b Final System Calibration Report Bernardin, Sadrsadat/Chen, Bindra/Trevino 14 14 $1,836.72
10. Model Interface Developmenta GISDK Code and GUI Bernardin, Bindra/Trevino 11 13 $3,594.32b Reporting Tool and Reports Bernardin, Bindra/Trevino 12 14 $3,594.32c Users Guide Bernardin, Bindra/Trevino 13 14 $2,669.87
11. Required Documentationa Monthly Progress Reports Bernardin 1 14 $2,873.40b Compiled Documentation w/ Recommendations Bernardin 14 14 $1,641.94
12. Traininga On-site Training Session Bernardin, Munn, Sadrsadat/Chen 14 14 $9,909.98
13. Performance Measuresa Recommendations / Tool Specification Bernardin, Munn 10 10 $1,423.97b Working Performance Measures Tool Bernardin, Bindra/Trevino 11 12 $3,132.10c Performance Measures Tool Documentation Bernardin, Bindra/Trevino 12 13 $872.71
$249,973.68
Total CostEnd
MonthStaffTaskStart
MonthMilestone
TABLE 1: COST PROPOSAL WITH MILESTONES
24

9
4.0 CONSULTANT QUALIFICATIONS AND PRIOR EXPERIENCE
For 30 years, RSG has influenced innovations in transportation through state-of-the-art modeling, analytics, and planning. We have built a national reputation as a thought leader in developing and applying modeling and analytical techniques to help our clients understand and predict complex human behavior and systems dynamics. RSG strives to bridge the gap between the state-of-the-art and state-of-the-practice solutions, never losing sight of the need for innovation to be practical and serve the needs of each client to ultimately facilitate wise investments.
RSG delivers high-quality analysis and information for a diverse portfolio of clients in both the public and private sectors of the transportation industry. RSG routinely serves national, state, regional, and local public agencies across the United States. Error! Reference source not found. provides a partial list of past and current state and regional public agency clients:
TABLE 2: PARTIAL LIST OF RSG PUBLIC AGENCY CLIENTS
RSG also performs substantial work for the federal government. For the Federal Highway Administration (FHWA), RSG administers the Travel Model Improvement Program (TMIP), developed a new national long-distance travel model, and is designing a new national freight model slated to replace FAF. For the Federal Transit Administration (FTA), RSG has developed a transit forecasting tool, Simplified Trips-on-Project Software (STOPS), as an alternative to traditional forecasting for major capital investments. Moreover, key staff proposed for this project have been involved in these projects, with Vince Bernardin managing the TMIP Toolbox project and serving as an advisor on both the FHWA national modeling projects and Bill Woodford leading the development of STOPS.
RSG’s experience is broad-based geographically and deep technically, touching all aspects inherent to excellent transportation analyses.
MAJOR METROPOLITAN PLANNING ORGANIZATIONS STATE DEPARTMENTS OF TRANSPORTATION
Charlotte Regional Transportation Planning Organization(CRTPO)
Philadelphia: Delaware Valley Regional Planning Commission(DVRPC)
San Francisco: Metropolitan Transportation Commission (MTC) San Diego: San Diego Association of Governments (SANDAG)
Seattle: Puget Sound Regional Council (PSRC)
Michigan Department of Transportation (MDOT) Virginia Department of Transportation (VDOT) Florida Department of Transportation (FDOT) Ohio Department of Transportation (ODOT)
Utah Department of Transportation (UDOT)
Oregon Department of Transportation (ODOT)
TOLL AUTHORITIES MAJOR TRANSIT AGENCIES
Port Authority of New York and New Jersey (PANYNJ) Florida’s Turnpike Enterprise (FTE)
Texas Tollways
Chicago: Chicago Transit Authority (CTA), RegionalTransportation Authority (RTA), Pace Suburban BusService, Metra Commuter Rail
New York: Metropolitan Transportation Authority(MTA)
New Jersey: New Jersey Transit (NJT)
25

Washtenaw Area Transportation Study PROPOSAL Model Update and Improvements
10 February 10, 2017
RSG has developed and updated both trip-based and activity-based travel models for many MPOs across the country. RSG has developed models for MPOs as small as Harrisonburg, Virginia, and as large as Philadelphia, Pennsylvania (beyond the U.S., we are now developing a model for the Beijing metro area with a population over 25 million). Among mid-sized metro areas (between roughly 250,000 and 1,250,000 population), recent MPO model examples include Toledo, Ohio; South Bend and Evansville, Indiana; Syracuse, Poughkeepsie, and Rochester, New York; Burlington, Vermont; Nashville and Chattanooga, Tennessee; Jacksonville, Florida; Richmond, Virginia; Charleston, South Carolina; Salt Lake City, Utah; and Anchorage, Alaska. Most of these models were implemented entirely in TransCAD in its GISDK scripting language with the exceptions of Jacksonville, Richmond, Toledo, and Salt Lake City. Most of these efforts involved the development of wholly or largely new model systems, but some such as Anchorage, Richmond, Rochester, Salt Lake City, and Burlington, involved updates of existing models. Many of these projects required the final models to meet strict calibration standards in states such as Florida, Ohio, Virginia, and Tennessee.
Table 3 provides a select sample of our team’s experience with mid-sized MPO models.
RSG also offers extensive experience with the application of travel models for travel forecasting. RSG has provided forecasts for major highway and transit investment studies across the country such as I-81 in New York and I-15 in Utah, and St. Louis’ MetroLink and Orlando’s Lynx expansions as well as Grand Rapid’s Laker Line in Michigan.
Across North America from Tampa, Florida, to Anchorage, Alaska, and from San Diego, California, to Concord, New Hampshire, RSG develops traditional trip-based models, advanced activity-based models and everything in between.
TABLE 3: MID-SIZED MPO MODELING EXPERIENCE
Anchorag
e, AK
Salt L
ake City
, UT
Grand Rap
ids, MI
Flint, M
I
Lansi
ng, MI
Toled
o, OH
South Bend
, IN
Columbus, IN
Bloomington, IN
Syrac
use, N
Y
Burlingto
n, VT
Knoxville
, TN
Chattan
ooga, T
N
Richmond,
VA
Charlest
on, SC
Jackso
nville,
FL
ArchitectureActivity-based X X XTrip-based X X X X X X X X X X X X X X
Project TypeModel Development X X X X X X X X X X X X X X XModel Application X X X X X X X X X X X X
SoftwareTransCAD X X X X X X X X X X X X
Key StaffVince Bernardin X X X X X X X X X X XBill Woodford X X X XDean Munn X X X XUdit Molakatalla X X X
Support StaffHadi Sadrsadat X X X X XJason Chen X X X X X XSteven Trevino X X X X X XSumit Bindra X X X X X X
26

11
RSG has worked with both Convergence Planning and Lochmueller Group on mid-sized MPO modeling projects in Indiana and Tennessee. Convergence Planning’s Dean Munn also brings significant experience with MPO modeling in Michigan to complement RSG’s current work on MDOT’s statewide model. Dean’s Michigan project experience includes:
• Technical and Planning Assistance to the Lansing Tri-County MPO, 2015, PM • Freight Forecast Report for the I-69 Thumb Region, 2014, PM • Lansing MPO Tri-County Travel Demand Model Update, 2014, QA/QC • Freight Forecast Report for Genesee County, 2012, PM • SEMCOG Freight Economics Study (SEAT tool), 2012, Task Leader • Genesee County Freight and Connectivity Study, 2010, Task Leader • MDOT Estimating VMT on Local Road Systems, 2009, PM • Urban Travel Demand Model Improvements for Genesee County MPO, 2008, PM • MDOT State Long-Range Transportation Plan, 2005, Task Leader
Below are a sample of projects with descriptions and references:
Michigan Statewide Passenger and Freight Travel Demand Model
Client: Michigan Department of Transportation
Dates: 2016 - 2019
RSG was selected by the Michigan Department of Transportation (MDOT) to design and develop a new statewide model that can model passenger and freight travel. RSG will develop a data-driven approach based on big origin-destination data with aggregate or trip-based methods, which will help MDOT meet its most important planning needs. The project includes a data assessment to understand existing data sources and an assessment of current MDOT needs. RSG has proposed to develop an advanced trip-based model of both resident and non-resident passenger travel across the state. This advanced trip-based model will replace the state’s existing traditional passenger model and will include long-distance, visitor, and short-distance daily travel components. RSG will also be updating MDOT’s freight model. The new freight model will fully leverage available freight data to produce more accurate and current results. Once the update process is complete, the models will be calibrated (to base year) and validated. RSG will also develop future-year forecasts using the updated models and provide documentation to MDOT on model updates and use. After the updates are completed, RSG will also provide training on model use to MDOT staff.
Proposed staff: Vince Bernardin, Hadi Sadrsadat, and Steven Trevino
Reference: Jesse Frankovich, [email protected], (517) 373-9356
27

Washtenaw Area Transportation Study PROPOSAL Model Update and Improvements
12 February 10, 2017
Laker Line Study
Client: The Rapid Transit Authority Dates: 2014
RSG was part of a consultant team that conducted a study to forecast potential ridership for each Laker Line alternative for The Rapid Transit Authority. These alternatives included variations in alignment and line extensions on both the east and west ends of the project. Given the unique nature of the corridor—with a concentration of university students using transit to travel between campuses—RSG used two techniques to estimate ridership for the project. The largest market comprised university students, so RSG used a data-driven technique to estimate ridership. The data supporting this analysis were stop-level count data on the existing Rapid services that connect the two campuses. RSG then developed procedures to add or subtract ridership depending on BRT stops, which would replace the existing shuttle routes. RSG estimated the market for trips made by the public using FTA’s Simplified Trips-on-Project Software (STOPS). RSG calibrated STOPS using current Rapid schedules in GTFS format and ride check count data for all routes in the system (except the campus shuttles). The Laker Line is projected to be among the Rapid’s most successful services when it is implemented, serving an existing and robust campus market and improving mobility for the public.
Proposed staff included on this project: Bill Woodford, Sumit Bindra Reference: Nick Monoyios, [email protected], (616) 774-1153
South Bend Household Travel Survey and Model Development
Client: Michiana Area Council of Government
Dates: 2013 – 2014
In this project RSG developed a new, integrated transportation and land use model of the South Bend-Elkhart metro area to support the Michiana Area Council of Governments’ (MACOG) transportation plan update. The travel model was of an advanced trip-based design with destination and mode choice models and linkage between home-based and non-home-based trips. RSG also conducted both household and university travel surveys of the area. These travel surveys were used in concert with MACOG’s traffic count database to statistically estimate the travel model parameters. This groundbreaking process used a genetic algorithm to solve for composite maximum likelihood parameters for the whole travel model, minimizing errors using both the survey data and the traffic counts. This novel approach harnessed modern computing power to eliminate redundancy and potential for inconsistency and errors between the standard two-step, ad hoc process of calibration and validation.
Proposed staff: Vince Bernardin, Jason Chen, and Steven Trevino
Reference: James Turnwald, [email protected], (574) 287-1829
28

13
Lansing TCRPC Model Update
Client: Tri-County Regional Planning Commission Dates: 2014 – 2015
The Tri-County Regional Planning Commission (TCRPC) conducted a major update of its TransCAD travel demand model under this contract. The consultant team used the Michigan Travel Counts (MITC) household travel survey to develop mode trip generation rates and other model parameters including auto occupancy factors, time of data factors, and mode shares. Household stratification curves were developed to utilize TAZ-level averages to disaggregate zonal households for trip production estimation. Michigan State University (MSU) is a major trip generator in the region. MSU was considered a special generator and the MSU trips were generated based on proximity of households to campus, dorm population, and classroom seats. A truck/freight submodel was included in the Tri-County travel demand model to evaluate the truck traffic in the region and to better assess truck and commercial vehicle freight issues.
The updated model used a nested logit model structure for the model choice component of the travel demand model, which was implemented using the TransCAD’s nested logit model GISDK function. The mode choice step included two modes of transit; regular bus and Bus Rapid Transit (BRT). A separate set of guideway links were coded to model BRT routes. The CATA On-Board survey was used to calibrate and the validated the mode choice component of the travel demand model. This model was used in the analysis of the forthcoming Lansing area’s BRT project.
In addition to regular trip assignment, the model also incorporated a “Park-Walk” assignment to understand the parking related behavior in the high employment density CBD district. The “park-walk” assignment estimated the number of trips parking in the destination zone versus the number of trips parking in a different zone and walking to the destination zone. The model was validation against the 2010 traffic counts and verified to satisfy the Michigan Department of Transportation (MDOT) and Federal Highway Administration (FHWA) validation checks.
Proposed staff included on this project: Udit Molakatalla, Dean Munn while at previous firm
Reference: Paul Dionne, 517-393-0342
Flint / Genesee County Travel Demand Model Improvements
Client: Genesee County Metropolitan Planning Commission Dates: 2007 - 2008
The project involved the development of an entirely new travel demand model and add-on analysis tools for the region using TransCAD software. The model improvements were specifically designed to meet the major highway, transit, and freight planning needs of the region. The study area encompasses all of Genesee County Michigan.
Work elements included:
29

Washtenaw Area Transportation Study PROPOSAL Model Update and Improvements
14 February 10, 2017
• Analysis of the MI Travel Counts Household Survey and used for re-design of trip purposes, trip generation, trip distribution, and mode choice model calibration.
• The time-of-day aspect of the model was enhanced to include AM, Midday, PM peak, and off-peak periods. Model validation was also conducted for each time period.
• A nested logit mode choice model was developed and calibrated specifically for Genesee County. As part of this model, a time-of-day transit network was designed and built.
• A multi-vehicle class truck model was incorporated and calibrated to local truck data.
• The traffic analysis zone system and roadway network were reviewed and updated using the Michigan Geographic Framework. Most noteworthy was the development of a master-network system which was created to simplify management of model scenarios.
• The model network tools incorporate a Highway Capacity Manual methodology for computing link capacities and accounts for delays at controlled intersections. The model’s network speed assumptions have been updated to incorporate results from a local GPS speed survey.
• A graphical user interface was developed to allow users with a wide range of technical abilities to use the model. As part of the graphical user interface, additional interface tools were developed in Caliper’s GISDK language to assess model calibration and to generate summary level and link specific traffic flow statistics (VMT, VHT, LOS, etc.).
• A final report, user’s guide, as well as training were provided for the GCMPC staff, MDOT, and other agencies in the use of the model.
Proposed staff included on this project: Dean Munn while at Lochmueller Group
Reference: Christine Pobocik, 810-766-6572
Chattanooga Activity-Based Travel Demand Model Development
Client: Chattanooga-Hamilton County Regional Planning Agency Dates: 2015 - 2016
RSG developed a new activity-based (AB) model for the Chattanooga-Hamilton County-North Georgia Transportation Planning Organization. The model made extensive use of big data, including travel time data from HERE, AirSage cellphone-based origin-destination (OD) data, and truck GPS-based OD data from ATRI. This is likely the first project in the world in which big, passive OD data has been incorporated into an AB model. After removing from the AirSage data truck trips developed from ATRI data, the AirSage data were then processed and expanded to a subset of the traffic count data using a number of screenlines to create a target passenger O-D trip table. The AirSage-based trip
30

15
table was then used to develop a robust set of district-level interaction constants in DaySim’s destination choice models using shadow-pricing techniques. The result was a model that produced a high level of validation to multiple data sources, including several not used in the calibration. The Chattanooga model is implemented in TransCAD.
Proposed staff included on this project: Vince Bernardin, Sumit Bindra, Steven Trevino, and Hadi Sadrsadat Reference: Yuen Lee, [email protected], (423) 643-5946
Travel Demand Model Update for Anchorage Metropolitan Area Transportation Solutions
Client: Anchorage, Alaska MPO Dates: 2014-2015
RSG was selected by the Municipality of Anchorage (AMATS) to develop and implement model improvements to the AMATS 4-step regional travel demand model in TransCAD. RSG has been performing model updates using data collected as part of AMATS’ household travel study, which RSG also conducted. The AMATS region faces unique planning challenges. The Matanuska‐Susitna Borough (MSB) is growing at an astounding rate with only one roadway connecting it to Anchorage, and the region expects freight movements to double by 2020. Moreover, like all agencies, AMATS is working to achieve its goals at a time when federal and state transportation funds are at historic lows. RSG is helping AMATS navigate these challenges as part of the model update process. RSG’s team also includes several local firms who are providing the effort with invaluable regional insights. RSG will bring several technical innovations to the updated model, including greater mode choice sensitivity to the presence of bicycle and pedestrian facilities, explicit treatment of control delay at intersections, and improved freight forecasting using truck GPS data.
Proposed staff included on this project: Vince Bernardin, Sumit Bindra, Steve Trevino Reference: Teresa Brewer, [email protected], (907) 343-7994
Virginia DOT (VDOT) Modeling On-Call: Fredericksburg Area MPO Model Update, Phase 1 and Phase 2
Client: Virginia Department of Transportation Dates: 2015-2016
31

Washtenaw Area Transportation Study PROPOSAL Model Update and Improvements
16 February 10, 2017
Under this on-call modeling contract, RSG has (to date) assisted VDOT in updating models for Richmond-Tri-Cities, Fredericksburg, and Harrisonburg MPOs. The Fredericksburg Area MPO (FAMPO) is situated immediately outside of the Washington, D.C., metropolitan area, between Washington and Richmond, Virginia, which is also nearby. There are significant commuting patterns between all three areas, particularly between Fredericksburg and Washington which are connected by commuter rail and express lanes. The FAMPO model breaks out internal-external trips between non-resident, resident work, and resident non-work trips. RSG’s improvements to the model include enhancements to toll choice for internal-external trips to better model the I-95 express lane use and to the mode choice model for internal-external trips to explicit representation of the “slugging” mode in which SOVs gather in park-and-ride lots and riders combine into HOV3+ vehicles so they can utilize the I-95 express lanes without paying the toll.
Proposed staff included on this project: Vince Bernardin, Hadi Sadrsadat, Bill Woodford Reference: Peng Xiao, [email protected], (804) 786-0998
Ohio Medium & Small Standard Model System
Client: Ohio Department of Transportation Dates: 2013 to 2015
The Ohio Medium/Small MPO Model System (OMS) was developed 10 years ago to provide a standard enhanced four-step modeling framework for eight of Ohio’s smaller MPO areas. As part of the 2010 model update, several improvements were made to the system. ODOT’s goal was to move their small/medium-sized models toward more advanced practice where it makes sense in small, manageable steps that could be applied to any area. The tasks included assignment improvements (more stringent convergence criteria, faster algorithms for user equilibrium, additional user classes including truck breakouts and travelers by income groups, more realistic vehicle operating costs, driver biases, and other components of generalized cost), new validation statistics (MAPE and GEH, travel time statistics for comparison with INRIX data), and Feedback/Warm Start testing (tests to compare free-flow, warm start and feedback to find best method). A new auto ownership model component was developed and integrated with the existing synthetic household model. The project concluded with assistance to ODOT in the re-validation of the eight MPO models to a new 2010 base year.
Proposed staff included on this project: Vince Bernardin, Jason Chen, Hadi Sadrsadat Reference: Greg Giaimo, [email protected], (614) 752-5738
32

17
Columbus Travel Demand Model
Client: Columbus Area MPO
Lochgroup partnered with RSG to develop the first travel demand model for CAMPO in south central Indiana. The advanced trip-based model leveraged Lochgroup and RSG work for the South Bend and Evansville MPOs and included an automobile ownership model as well as destination and mode choice models with linkage between home-based and non-home-based trips.
33

Washtenaw Area Transportation Study PROPOSAL Model Update and Improvements
18 February 10, 2017
5.0 WORK PLAN
The work plan presented below is based on the Project Tasks described in the RFP and the proposed Milestones / Subtasks are generally taken directly from the deliverables requested in the RFP, although in a few cases we have combined two or more small or similar deliverables in a single milestone. Table 4 summarizes the cost by each task and subtask with effort broken out by hours allocated to individual team members.
TABLE 4: COST PROPOSAL WITH HOURS BY STAFF
Project Manager
Senior Advisor Task Lead Task Lead
Senior Support
Staff
Junior Support
Staff
Bernardin Woodford Munn Molakatalla Sadrsadat / Chen
Bindra / Trevino
1. Roadway Network Developmenta Base Year Roadway Network 6 60 40 106 $14,853.70 $14,853.70b Future Year Roadway Network 4 32 36 $5,620.97 $5,620.97c Task Documentation 4 8 8 20 $2,945.42 $2,945.42
2. Transit Network Developmenta Base Year Transit Network 4 2 48 24 78 $12,080.88 $12,080.88b Future Year Transit Network 2 1 24 27 $4,379.87 $4,379.87c Task Documentation 2 1 8 4 15 $2,521.39 $2,521.39
3. TAZ Developmenta Base Year Zones with Data 8 60 4 72 $11,104.17 $11,104.17b Future Year Zones with Data 8 60 68 $10,641.94 $10,641.94c Task Documentation 4 16 20 $3,220.97 $3,220.97
4. External Tripsa Base Year EE Trip Matrix 24 40 40 104 $15,083.30 $20,065.00 $35,148.30b Base Year EI/IE Trips 8 40 48 $7,177.16 $7,177.16c Future Year External Trips 8 20 28 $4,409.55 $4,409.55d Task Documentation 4 12 16 $2,481.54 $2,481.54
5. Trip Generationa Trip Generation Specification 4 4 8 $1,283.20 $1,283.20b Validated Trip Generation Model 12 116 128 $15,867.43 $15,867.43c Task Documentation 4 4 8 $1,283.20 $1,283.20
6. Trip Distributiona Trip Distribution Specification 12 4 16 $3,016.44 $3,016.44b Validated Trip Distribution Model 24 80 104 $15,996.27 $15,996.27c Task Documentation 8 10 18 $3,025.75 $3,025.75
7. Mode Choicea Mode Choice Specification 2 2 8 12 $2,319.26 $2,319.26b Validated Mode Choice Model 4 2 148 154 $23,834.74 $23,834.74c Guidance on New Transit Modes 2 2 8 12 $2,319.26 $2,319.26d Task Documentation 2 2 8 12 $2,319.26 $2,319.26
8. Vehicle and Transit Assignmenta Assignment Model Specification 16 4 4 24 $4,299.64 $4,299.64b Validated Base Year Assignment 24 32 24 80 $12,127.36 $12,127.36c Reasonable Future Year Assignment 16 16 32 $5,497.98 $5,497.98d Task Documentation 4 8 12 $1,928.02 $1,928.02
9. Model Calibration and Validationa Validated Model Set 8 20 20 48 $6,720.68 $6,720.68b Final System Calibration Report 4 4 4 12 $1,836.72 $1,836.72
10. Model Interface Developmenta GISDK Code and GUI 4 24 28 $3,594.32 $3,594.32b Reporting Tool and Reports 4 24 28 $3,594.32 $3,594.32c Users Guide 4 16 20 $2,669.87 $2,669.87
11. Required Documentationa Monthly Progress Reports 14 14 $2,873.40 $2,873.40b Compiled Documentation w/ Recommendations 8 8 $1,641.94 $1,641.94
12. Traininga On-site Training Session 16 16 16 48 $7,909.98 $2,000.00 $9,909.98
13. Performance Measuresa Recommendations / Tool Specification 4 4 8 $1,423.97 $1,423.97b Working Performance Measures Tool 4 20 24 $3,132.10 $3,132.10c Performance Measures Tool Documentation 2 4 6 $872.71 $872.71
Project Totals 292 12 272 236 334 356 1502 $227,908.68 $249,973.68
Total Hours Labor Cost
Direct Expenses Total CostMilestoneTask
34

19
The beginning and ending times of each subtask are documented together with the assigned staff and cost at the end of each task description below, and a graphical illustration of the timeline is presented in Section 8.
We have attempted to present our best recommendations below for the project approach, but at the same time, we remain open to your feedback and are willing to adapt our approach or schedule to meet WATS’ needs as best as possible within the constraints of the project budget, etc. Whether it is your idea or ours, we want to do what will ultimately serve you best.
TASK 1: 2015 Model Network Development
The base year model network will be updated to include roadway improvements implemented since the previous network update. The RSG team has experience working with the Michigan Geographic Framework (MGF) from various projects in state and will use it as the geographic basis for the updated network. In addition to freeways, arterials, and collectors (major and minor), regionally significant local roadways will be added, as needed, to the model network to better represent travel patterns in the region and to accurately load traffic from TAZs. The model network will also include all routes that support transit services as well as walk and drive access links.
The network geometry as well as the link and node attributes (e.g. lanes, median type, posted speed, on-street parking, traffic control locations, etc.) will be reviewed and updated. As a visual validation, the network attributes will be color-plotted and checked for accuracy. Additional network and node attributes will be added as needed to facilitate model enhancements (e.g., signal locations, HOV lanes, calculated signal delay, screen line/cutline attributes). The model network will be updated to accommodate HOV/managed lane modeling (e.g. US 23 freeway corridor).
The network will be populated with recent traffic counts from the regional count database for assignment validation purposes. Availability of hourly and classification counts by direction will help better validate the time-of-day and truck sub-models. Seasonal and daily adjustment factors will be calculated as needed to estimate the Annual Average Weekday Traffic (AAWTs). Historical count data will be reviewed to ensure suitability of traffic counts for validation; for example, counts collected during nearby construction may not be reasonable to use for validation purpose.
The link capacity calculation methodology for segments and intersections will be updated to conform to HCM 2010 procedures. The capacities will be further adjusted on a link by link basis for on-street parking and subpar lane width. Additionally, traffic signal location information will be collected and coded in the network to derive a more realistic link impedance by considering signal delays. A methodology will be developed to estimate link speed by facility type and calibrated based on available speed and travel time data.
Once the base year model network has been established, the E+C and future-year model networks will be developed based on regional TIP and long ranger transportation plan projects.
35

Washtenaw Area Transportation Study PROPOSAL Model Update and Improvements
20 February 10, 2017
TASK 2: Transit Network Development
RSG helped introduce the use the General Transit Feed Specification (GTFS) in travel modeling when we designed FTA’s STOPS tool to use the format. Since then we have also used TransCAD’s functionality to import GTFS data and use it as the basis of TransCAD transit route systems. This process still requires processing to connect stops with zone centroids, and address occasional errors in the import process, but does offer a substantial improvement over error-prone manual coding of transit networks. The connection of zone centroids to transit stops is an important and non-trivial aspect of transit network development since these represent access times where are an important component of transit impedances. Parking restrictions and parking costs at U-M will also be of particular importance. Under this task, the RSG team will combine and import GTFS data for the fixed route transit service provided by the Ann Arbor Area Transportation Authority (AAATA), the Western Washtenaw Area Value Express (WAVE), and the University of Michigan. RSG will also review planned transit expansions in Washtenaw County and code a 2045 transit network. Also, as part of this task, the model’s fare structure will be updated to represent current and proposed transit fare policies, which will account for the U-M M-RIDE program. Network values for link-level transit travel times, headways, and dwell times will be based on AAATA data.
The TransCAD network will be validated using an on-board survey-derived origin-destination trip matrix which will be assigned to the TransCAD transit network to ensure that modeled paths, boarding locations, and transfer locations reflect the movements of real-world transit riders. Adjustments to path building parameters (weights on wait times, transfers, access and egress times, etc.) will be made to the TransCAD network such that modeled paths replicate observed paths.
TASK 3: TAZ Development
The TAZ structure will be reviewed and updated as required to reflect development patterns and land use changes since the previous model update. The TAZ delineation and positioning of centroid connectors will be verified and adjusted as needed. The TAZ structure will be modified, to be consistent with the SEMCOG TAZ layer to facilitate the interoperability of the two models and to capitalize on SEMCOG’s modeling resources. Suggested revisions to the TAZ structure will be presented for review and approval
TABLE 6: TASK 2 MILESTONES / DELIVERABLES
1. Roadway Network Developmenta Base Year Roadway Network Bernardin, Molakatalla, Bindra/Trevino 1 3 $14,853.70b Future Year Roadway Network Bernardin, Molakatalla 4 5 $5,620.97c Task Documentation Bernardin, Molakatalla, Bindra/Trevino 5 6 $2,945.42
Total CostEnd
MonthStaffTaskStart
MonthMilestone
2. Transit Network Developmenta Base Year Transit Network Bernardin, Woodford, Munn, Sadrsadat/Chen 1 3 $12,080.88b Future Year Transit Network Bernardin, Woodford, Munn 4 4 $4,379.87c Task Documentation Bernardin, Woodford, Munn, Sadrsadat/Chen 4 5 $2,521.39
Total CostEnd
MonthStaffTaskStart
MonthMilestone
TABLE 5: TASK 1 MILESTONES / DELIVERABLES
36

21
by WATS staff. A detailed procedure describing TAZ delineation and positioning of centroids & centroid connectors will be provided to WATS staff before implementation.
The base year land use information will be developed based on the U.S. Census data related sources, including 5-year American Community Survey (ACS) estimates, Public Use Microdata Sample (PUMS) data, Longitudinal Employer-Household Dynamics (LEHD) data, proprietary Woods & Poole data, and any available local information. The employment information will be separated by sector (e.g. retail, industrial, manufacturing, etc.) based on NAICS codes to increase the sensitivity of the trip attraction sub-models. Additional information needed for model development, such as employment data for major employers or school locations and enrollment, will be collected during the data collection effort.
TASK 4: External Trips
Given the proximity of the Detroit area and the significance of the interaction between the Detroit and Ann Arbor areas, no WATS model will be capable of functioning properly without a robust representation of external trips.
For this reason and its general benefits for the accuracy of the WATS model, RSG is including in this proposal the use of passive OD data. SEMCOG has purchased data from Streetlight which does cover Washtenaw County, and may be able to provide it to WATS free of charge. However, since SEMCOG was not able to verify this for RSG, we have obtained quotes for an alternative / additional dataset from AirSage and the American Transportation Research Institute (ATRIO) and included this in our budget for the project. AirSage and ATRI are providing the passive OD data that RSG is using the Michigan statewide model. If SEMCOG is able to share its data free of charge, then this money could be invested in other parts of the project or saved by WATS. Although the cost of this data is shown under this task, it will also greatly benefit other tasks including Task 6 and Task 9 in particular.
RSG will expand observed external trips by auto and truck from the Streetlight data using traffic counts at the external stations to develop highly accurate base year external trip matrices. Future-year external trips will be developed using growth factoring based on forecast socioeconomic growth.
TASK 5: Trip Generation
TABLE 7: TASK 3 MILESTONES / DELIVERABLES
TABLE 8: TASK 4 MILESTONES / DELIVERABLES
3. TAZ Developmenta Base Year Zones with Data Bernardin, Molakatalla, Bindra/Trevino 1 3 $11,104.17b Future Year Zones with Data Bernardin, Molakatalla 4 6 $10,641.94c Task Documentation Bernardin, Molakatalla 6 7 $3,220.97
Total CostEnd
MonthStaffTaskStart
MonthMilestone
4. External Tripsa Base Year EE Trip Matrix Bernardin, Sadrsadat/Chen, Bindra/Trevino 3 6 $35,148.30b Base Year EI/IE Trips Bernardin, Sadrsadat/Chen 3 6 $7,177.16c Future Year External Trips Bernardin, Sadrsadat/Chen 8 9 $4,409.55d Task Documentation Bernardin, Sadrsadat/Chen 9 10 $2,481.54
Total CostEnd
MonthStaffTaskStart
MonthMilestone
37

Washtenaw Area Transportation Study PROPOSAL Model Update and Improvements
22 February 10, 2017
Many trip-based models attempt to improve trip generation by adding segmentation, carving trips up into more and more detailed purposes and multi-level, sometimes even three-dimensional cross-classification schemes. However, this general approach is ill-conceived and often counter-productive because the more finely the trips are sliced the trip rates / models are based on less and less survey observations. Moreover, even after much slicing, these models almost always remain insensitive to important factors in trip generation such as the walkability of neighborhoods, the presence of seniors in a household, and other factors.
Instead, we propose to estimate new disaggregate discrete generalized linear models for trip generation. Generalized linear models have distinct advantages for trip generation. They allow the incorporation of multiple factors affecting trip generation including life cycle variables (e.g., number of seniors, children, workers, etc.) as well as other factors such as neighborhood characteristics or urban form (i.e., compared to suburbanites, residents of dense, walkable neighborhoods generate more trips which are more likely to be short and non-motorized). They provide maximum statistical efficiency with parameters supported by the fullest possible range of survey observations, minimizing the issues in cross-classification with too few observations for some rates. They do not require the response variable to have a normal error distribution, but rather can reflect the discrete nature of trip generation by using Poisson or Negative-Binomial distributions, and they can take advantage of robust estimation techniques such as k-fold cross-validation and minimum iteratively reweighted least squares (IRLS) error. RSG’s Vince Bernardin and Sumit Bindra have pioneered these techniques and with applications in statewide and MPO models in Indiana, Tennessee, and South Carolina.
Using this approach, the new WATS model might use a slightly simplified set of trip purposes might be used but with sensitivity to several additional input variables. It will, however, of course be important to maintain distinct trip purposes for university travel. We may, however, recommend re-casting them in terms of campus-based trips rather than home-based university trips, etc. The reason for this is two-fold. First, the number of students enrolled at each campus is generally available and can be forecast with comparative ease, while the location of student residences off-campus are usually difficult to identify. Using the college-age population from Census data to identify student housing can often pose problems as many college students use their parents’ residence for the Census. Second, in addition to trips to campus made by students who reside off-campus, students who reside on campus also generate trips to (non-home) off-campus locations and this travel can sometimes be significant.
FIGURE 2. SHIFT FROM TRADITIONAL FOUR-STEP TO ALTERNATIVE TRIP-BASED FRAMEWORK
38

23
Finally, non-home-based (NHB) trips represent one of the greatest challenges of trip-based models. Their significance is not to be underestimated as they comprise roughly a third of all trips, but in the traditional four-step framework, NHB trips generally act simply as noise in the model, cranked up to the right level to produce the right overall volume, but capable of illogical responses in different scenarios, inconsistent with the responses of home-based (HB) trips. RSG has developed a simple method for linking NHB trips to HB trips by modeling NHB trips after and conditional on HB trips rather than simultaneously, in parallel with them. This method is being highlighted by FHWA’s Travel Model Improvement Program (TMIP) in a forthcoming How-to Guide and has been implemented by RSG in both the Iowa and Tennessee statewide models and MPO models in Alaska, Utah, Indiana, and Virginia and presented by RSG at the 2016 Annual Meeting of the Transportation Research Board (TRB). Part of TMIP’s study of the method demonstrated that it produced improved results in several regards. Perhaps most notably, it eliminated physically impossible travel patterns such as illustrated in the Salt Lake region in
Figure 3. Using this innovative approach, RSG will develop new NHB models designed to use the outputs of mode choice for the HB trips to ensure a more realistic representation of NHB trips in the new model.
TASK 6: Trip Distribution
While RSG can provide a review of industry practices in trip distribution modeling for mid-sized regions as a part of the specification deliverable for this task if desired, we believe that this may be unnecessary as there is ample evidence of the benefits of destination choice models and their cost-effectiveness, which we hope is demonstrated by our cost proposal, which assume them.
Both common experience as well as academic research (Zhao & Kockelman, 2002) have found that spatial distribution models are the largest source of error in travel forecasting. Destination choice models and pivot-point methods provide potentially complementary opportunities for improving on traditional gravity
FIGURE 3. ELIMINATION OF UNREASONABLE NHB TRIPS IN SALT LAKE CITY MODEL
TABLE 9: TASK 5 MILESTONES / DELIVERABLES
5. Trip Generationa Trip Generation Specification Bernardin, Bindra/Trevino 2 2 $1,283.20b Validated Trip Generation Model Bernardin, Bindra/Trevino 3 5 $15,867.43c Task Documentation Bernardin, Bindra/Trevino 5 6 $1,283.20
Total CostEnd
MonthStaffTaskStart
MonthMilestone
39

Washtenaw Area Transportation Study PROPOSAL Model Update and Improvements
24 February 10, 2017
models. Destination choice models have consistently demonstrated the ability to better reproduce observed travel patterns than gravity models, both through the incorporation of additional variables, as well as by reflecting more complex statistical assumptions, such as capturing spatial autocorrelation. (See Bernardin et al., 2009, for a review.) For this reason, destination choice models have become an increasingly common replacement for gravity models, including in mid-sized (even smaller) regions such as South Bend, Evansville, and Columbus, Indiana; Burlington, Vermont; Knoxville and Chattanooga, Tennessee; Charlottesville, Virginia; Charleston, South Carolina; and Jacksonville, Florida.
TABLE 100: FACTORS IN GRAVITY MODELS VERSUS DESTINATION CHOICE MODELS
GRAVITY MODELS DESTINATION CHOICE MODELS
NOT IN MODELS
OBSERVED VARIABLES Number of households
Number of employees by industry
Travel time and/or distance
Number of households
Number of employees by industry
Travel time and/or distance
River/Water crossings, highway crossings & other known psychological barriers
Where the traveler lives
Traveler’s income, etc.
Proximity of similar, competing destinations
Convenience of destinations to other attractive places
Walkability, density, mix of uses at destinations
Parking Prices and Availability (sometimes)
UNOBSERVED VARIABLES Simple Random Variation
Other Traveler Attitudes / Preferences (toward price and quality of goods/services, etc.)
Spatial Autocorrelation / Unobserved homogeneity of destinations
Simple Random Variation
Price of goods/services provided at the destination
Quality of goods / services provided at the destination
Occupation of workers in residences
Social relationships (friendships, familial relations)
History/habit (this used to be the best pizza place and I have good memories here)
Aesthetics
It is important to recognize several key advantages that destination choice models offer over gravity models through their ability to consider additional factors (Table 10). At the same time, it is also important to recognize that current destination choice models can still struggle to explain the spatial distribution of travel largely due to lack of data and the importance of unobserved factors. In many cases, a destination choice model may be able to double the goodness-of-fit, or explain twice as much of observed travel patterns than a gravity model and still explain less than half the variation in the observed patterns.
40
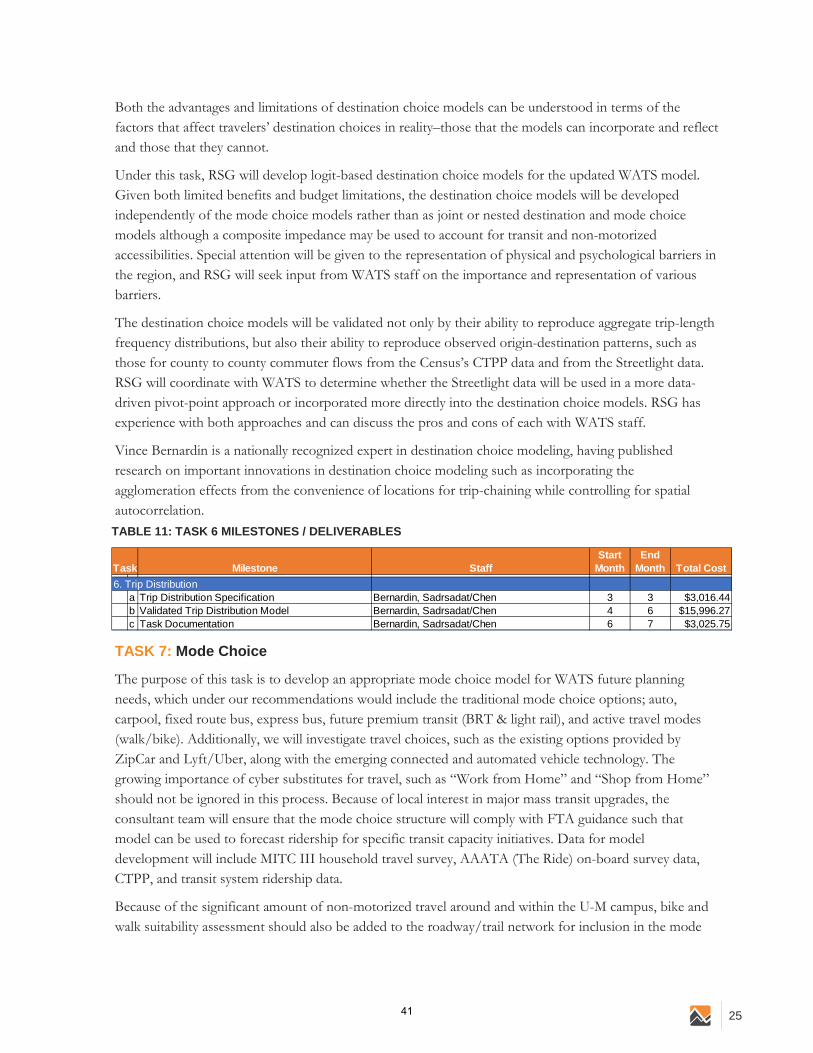
25
Both the advantages and limitations of destination choice models can be understood in terms of the factors that affect travelers’ destination choices in reality–those that the models can incorporate and reflect and those that they cannot.
Under this task, RSG will develop logit-based destination choice models for the updated WATS model. Given both limited benefits and budget limitations, the destination choice models will be developed independently of the mode choice models rather than as joint or nested destination and mode choice models although a composite impedance may be used to account for transit and non-motorized accessibilities. Special attention will be given to the representation of physical and psychological barriers in the region, and RSG will seek input from WATS staff on the importance and representation of various barriers.
The destination choice models will be validated not only by their ability to reproduce aggregate trip-length frequency distributions, but also their ability to reproduce observed origin-destination patterns, such as those for county to county commuter flows from the Census’s CTPP data and from the Streetlight data. RSG will coordinate with WATS to determine whether the Streetlight data will be used in a more data-driven pivot-point approach or incorporated more directly into the destination choice models. RSG has experience with both approaches and can discuss the pros and cons of each with WATS staff.
Vince Bernardin is a nationally recognized expert in destination choice modeling, having published research on important innovations in destination choice modeling such as incorporating the agglomeration effects from the convenience of locations for trip-chaining while controlling for spatial autocorrelation.
TASK 7: Mode Choice
The purpose of this task is to develop an appropriate mode choice model for WATS future planning needs, which under our recommendations would include the traditional mode choice options; auto, carpool, fixed route bus, express bus, future premium transit (BRT & light rail), and active travel modes (walk/bike). Additionally, we will investigate travel choices, such as the existing options provided by ZipCar and Lyft/Uber, along with the emerging connected and automated vehicle technology. The growing importance of cyber substitutes for travel, such as “Work from Home” and “Shop from Home” should not be ignored in this process. Because of local interest in major mass transit upgrades, the consultant team will ensure that the mode choice structure will comply with FTA guidance such that model can be used to forecast ridership for specific transit capacity initiatives. Data for model development will include MITC III household travel survey, AAATA (The Ride) on-board survey data, CTPP, and transit system ridership data.
Because of the significant amount of non-motorized travel around and within the U-M campus, bike and walk suitability assessment should also be added to the roadway/trail network for inclusion in the mode
TABLE 11: TASK 6 MILESTONES / DELIVERABLES
6. Trip Distributiona Trip Distribution Specification Bernardin, Sadrsadat/Chen 3 3 $3,016.44b Validated Trip Distribution Model Bernardin, Sadrsadat/Chen 4 6 $15,996.27c Task Documentation Bernardin, Sadrsadat/Chen 6 7 $3,025.75
Total CostEnd
MonthStaffTaskStart
MonthMilestone
41

Washtenaw Area Transportation Study PROPOSAL Model Update and Improvements
26 February 10, 2017
choice modeling. A potential bike/walk network would consider suitability as a major component of the skimming and path building. The suitability is based on:
• Traffic volume – how many vehicles will pass a rider/walker while traversing a link, with more weight placed on the impact of truck traffic.
• The speed of vehicles. • The space available for the non-motorized traveler is considered, and will be based on shoulder
width, or presence of bike lanes, sidewalks, side-paths, etc.
The active travel network model will use the combination of these factors to determine a suitability index. The composite impedance of time + suitability will be used for pathfinding during skims and potentially for non-motorized assignments. The skims are used in the mode choice step, so adding bike/walk suitability to the model allows increased sensitivity to the benefits of providing active travel infrastructure. Because improving system suitability can result in an increase in non-motorized travel and a reduction in auto travel. Suitability can also be used as one of the inputs to an auto ownership model via an urban design or walk score.
The consultant team’s recommendation for the mode choice model structure is to use a standard nested logit model format which is consistent with FTA guidance regarding New Starts/Small Starts applications. We will recommend all the components of impedance appropriate for each of the modes. Examples include: walk and wait times, in-vehicle time, highway time, fares, time for walk access, drive time and parking cost; composite impedance (time and suitability index) for bike/ped modes; etc. Following approval by WATS, the consultant team will implement the approved mode choice procedure. Mode choice model parameters will be estimated using household and on-board survey datasets, and will comply with FTA guidance/constraints regarding acceptable parameter ranges and ratios of parameters to each other (e.g. in-vehicle time/out-of-vehicle time). For final model calibration, the model will be applied and then heuristic adjustments will be made to mode choice constants until the model replicates observed mode share targets (derived from the household and on-board transit surveys).
Using “disaggregate validation” methods described in Section 5.2 of MVRCM, we will compare model results with observed district-district trips and market shares (e.g., zero-car households) produced by the model with available data. The model will also undergo sensitivity testing by adjusting key variables (fares, value of time, new transit services, headways, etc.) to ascertain the associated elasticity in the mode share for each mode.
TASK 8: Vehicle and Transit Assignment
The RSG team will review the existing WATS and SEMCOG models and their representation of peak periods and assignment methods in particular. Based on this review, we will provide recommendations for improvements both as part of this model update and potentially beyond it. While Dynamic Traffic
TABLE 12: TASK 7 MILESTONES / DELIVERABLES
7. Mode Choicea Mode Choice Specification Bernardin, Woodford, Munn 4 4 $2,319.26b Validated Mode Choice Model Bernardin, Woodford, Munn 6 10 $23,834.74c Guidance on New Transit Modes Bernardin, Woodford, Munn 11 12 $2,319.26d Task Documentation Bernardin, Woodford, Munn 10 11 $2,319.26
Total CostEnd
MonthStaffTaskStart
MonthMilestone
42

27
Assignment (DTA) holds great promise, it is still very uncommon and computationally challenging at for regional modeling. So, while RSG offers experience with DTA and we will examine its feasibility for the WATS area, it is more likely that it may be best considered as a future enhancement. That said, there may be other important ways to improve highway assignment in the WATS model, including but not limited to advanced assignment algorithms, more realistic representation of traffic control delays, and generalized cost functions that can account for drivers’ preference for reliability and biases in route choice, such those due to limited knowledge of lower class facilities (especially for truck drivers). RSG has developed and
implemented two different methods for incorporating travel time reliability in highway assignment primarily through the SHRP2 C04 project and will discuss the benefits of these approaches and their requirements. Upon WATS agreement on recommended specifications for the enhanced assignment model, including calibration targets, the RSG team will implement the document the new methodologies.
TASK 9: Model Calibration and Validation
RSG offers wide-ranging experience in travel model system calibration and validation. We have calibrated and validated travel models for MPOs as small as Harrisonburg, VA, and as large as Philadelphia, PA. RSG is now developing a model for Beijing, China, with a population of 25 million. RSG has extensive experience with medium-sized MPOs across the country from Jacksonville, Florida, to Anchorage, Alaska.
RSG routinely performs modeling work in states with formalized calibration standards including Ohio, Florida, Tennessee, and Virginia, and would be happy to adopt any of their standards for the validation of the WATS model or is equally comfortable developing custom criteria in coordination with WATS staff, tailored to the anticipated uses of the model and potentially drawing on criteria from various states.
Calibration efforts will include route level validation of the transit assignment as well as dynamic validation in the form of sensitivity tests and reasonableness checks of a 2045 future-year run.
TABLE 13: TASK 8 MILESTONES / DELIVERABLES
8. Vehicle and Transit Assignmenta Assignment Model Specification Bernardin, Sadrsadat/Chen, Bindra/Trevino 2 2 $4,299.64b Validated Base Year Assignment Bernardin, Sadrsadat/Chen, Bindra/Trevino 10 12 $12,127.36c Reasonable Future Year Assignment Bernardin, Sadrsadat/Chen 12 13 $5,497.98d Task Documentation Bernardin, Sadrsadat/Chen 13 14 $1,928.02
Total CostEnd
MonthStaffTaskStart
MonthMilestone
43

Washtenaw Area Transportation Study PROPOSAL Model Update and Improvements
28 February 10, 2017
FIGURE 4: EXAMPLE SCATTERPLOT COMPARING MODELED VOLUMES WITH COUNTS
Whatever assignment validation criteria are adopted, RSG will encode in a customizable automated report using TransCAD’s GISDK scripting language to facilitate both current validation efforts and potential future checks or tests by WATS staff in the course of maintaining the model and performing minor updates. RSG has used this validation reporting script in numerous models around the country.
TASK 10: Model Interface Development
The RSG team has used TransCAD’s standard model interface as well as developed custom user interfaces. We will review the existing model interface, consult with WATS staff, and make a recommendation for potential improvements. In addition to the interface itself, we may recommend improvements to the presentation of model statistics and reports including the possible development of a “dashboard” spreadsheet in Excel. Excel supports easy formatting and basic visualization of charts and graphs with maximum flexibility and ease of use for further analysis. These reports can be tailored so that they are “print ready” for use in reports. RSG has developed this sort of Excel solution for the Tennessee Department of Transportation with positive feedback.
TABLE 14: TASK 9 MILESTONES / DELIVERABLES
9. Model Calibration and Validationa Validated Model Set Bernardin, Sadrsadat/Chen, Bindra/Trevino 13 14 $6,720.68b Final System Calibration Report Bernardin, Sadrsadat/Chen, Bindra/Trevino 14 14 $1,836.72
Total CostEnd
MonthStaffTaskStart
MonthMilestone
44

29
TASK 11: Required Documentation
The RSG team will provide thorough documentation of the updated WATS model including a flow chart illustrated the updated model processes, the specifications of enhanced model components, a report on the calibration of each model component, and a holistic review of the model with acknowledgements of its limitations and recommendations for additional short and long-term improvements. This documentation will be delivered together with a complete set of all data files and scripts to run the model. RSG will also prepare and submit monthly progress reports as part of this task. In the interests of both environmental stewardship and cost containment, RSG is proposing that all documentation be delivered in electronic format rather than hard copy.
TASK 12: Training
FIGURE 5: SAMPLE EXCEL OUTPUT, TENNESSEE STATEWIDE MODEL
TABLE 15: TASK 10 MILESTONES / DELIVERABLES
TABLE 16: TASK 11 MILESTONES / DELIVERABLES
10. Model Interface Developmenta GISDK Code and GUI Bernardin, Bindra/Trevino 11 13 $3,594.32b Reporting Tool and Reports Bernardin, Bindra/Trevino 12 14 $3,594.32c Users Guide Bernardin, Bindra/Trevino 13 14 $2,669.87
Total CostEnd
MonthStaffTaskStart
MonthMilestone
11. Required Documentationa Monthly Progress Reports Bernardin 1 14 $2,873.40b Compiled Documentation w/ Recommendations Bernardin 14 14 $1,641.94
Total CostEnd
MonthStaffTaskStart
MonthMilestone
45

Washtenaw Area Transportation Study PROPOSAL Model Update and Improvements
30 February 10, 2017
The RSG team will develop training materials and conduct a full-day, on-site training session for WATS staff. The training materials will include step-by-step instructions for running the model with screenshots illustrating the process, including reporting functionality. We will also verify that WATS can replicate assignment validation results on their own machines and supply written answers to WATS staff questions.
TASK 13: Performance Measures
Under this task, the RSG team will review FHWA’s performance measures for System Performance/Freight Movement once they are finalized and make recommendations for partially or fully automating the process of producing these measures from available data. Upon the approval of WATS, the team will then implement these recommendations and provide documentation of these tools.
TABLE 17: TASK 12 MILESTONE / DELIVERABLE
TABLE 18: TASK 13 MILESTONES / DELIVERABLES
12. Traininga On-site Training Session Bernardin, Munn, Sadrsadat/Chen 14 14 $9,909.98
Total CostEnd
MonthStaffTaskStart
MonthMilestone
13. Performance Measuresa Recommendations / Tool Specification Bernardin, Munn 10 10 $1,423.97b Working Performance Measures Tool Bernardin, Bindra/Trevino 11 12 $3,132.10c Performance Measures Tool Documentation Bernardin, Bindra/Trevino 12 13 $872.71
Total CostEnd
MonthStaffTaskStart
MonthMilestone
46

31
6.0 KEY PERSONNEL
Below are the key individuals assigned to the project:
VINCE BERNARDIN, JR., PHD (RSG) will serve as Project Manager for this project. Vince has worked in twenty states and abroad developing and applying statewide, urban, and corridor-level travel forecasting models for both plan development and major project studies. He is perhaps best known for his advanced trip-based approaches, which combine elements of activity-based and trip-based models. He is also recognized as an expert in destination choice
modeling and a pioneer in the use of big data in travel models being the first to use big data in statewide models, the first to combine GPS and cell-phone datasets, and the first to incorporate big data in an activity-based model.
BILL WOODFORD (RSG) will serve as a senior advisor for this project with responsibility for quality assurance of mode choice and transit validation. Bill has extensive consulting experience in the areas of travel demand forecasting, ridership forecasting, and transportation planning. He has focused his career on the planning and development of fixed guideway transit New Starts projects with a particular emphasis on transit ridership forecasting, alternatives
analysis, and system analysis. He has consulted with many of the largest transit agencies in the United States, including those in New York, Washington, Chicago, San Jose, Denver, and Los Angeles. He worked with the FTA and FHWA and state DOTs in several states.
DEAN MUNN (CP) will help lead mode choice model development and provide quality assurance for the highway assignment for this project. Dean is co-founder and principal of Convergence Planning (CP). Dean’s 23 years of transportation planning experience include both public service at INDOT and the Association of Monterey Bay Area Governments (AMBAG) MPO in California as well as consulting work for clients around the U.S. Dean has
extensive technical experience, including statewide and metropolitan freight model development. Dean is able to understand MPO planning needs and model applications from his own experience. He has developed several economic analysis and performance measure toolkits designed to maximize the value of plan development projects. He brings extensive experience with developing models for small and medium-sized MPOs.
UDIT MOLAKATALLA, PE, PTOE (LG) will help lead the highway network and TAZ development tasks for the project. Udit is Lochmueller Group’s (LG) lead modeler with eleven years of progressively responsible experience travel demand modeling, traffic operations, and transportation planning. Prior to his current position at Lochmueller Group, Udit had experience in the public sector as modeler for the Champaign-Urbana MPO which is home to
the University of Illinois, as well as previous consulting experience at the Corradino Group and Kimley-Horn Associates.
The following support staff will aid in various tasks throughout the project:
HADI SADRSADAT, PHD (RSG) is experienced with the development, calibration, and validation of travel demand models in TransCAD and Cube. He specializes in urban travel demand modeling, forecasting, analyzing collected data, and preparing traffic simulation models. He has developed and applied travel demand models in several states and abroad to
47

Washtenaw Area Transportation Study PROPOSAL Model Update and Improvements
32 February 10, 2017
forecast travel demand for major transit projects, freight plans, and highway improvement strategies such as managed lanes and ramp metering. Hadi also has significant experience with data validation and analysis, including research validating INRIX speed data along the I-95 corridor using Bluetooth sensor data and validating AirSage data against traffic counts.
JASON CHEN, PHD (RSG) will also be available if additional assistance is needed in the development of the WATS model. Jason has worked closely with Vince on enhancements to MPO models for Ohio DOT and to ODOT’s economic analysis tools, as well as with Vince and Hadi on MPO models in Virginia and with Vince and Steven Trevino on the South Bend and Chattanooga models. Jason brings is experienced in both activity-based and four-step trip-
based travel demand model development with expertise and research experience with destination choice models as well as practical model application experience.
SUMIT BINDRA (RSG) develops and implements travel demand forecasting models and travel surveys. Sumit has improved, expanded, and updated the TransCAD models for Syracuse and Rochester in New York State. His work on these projects has included expanding the model area and network, updating model validation, and preparing and
analyzing future land use and transportation network scenarios. Sumit also reports directly to Vince and has worked closely with him on projects in several states including the development of advanced trip generation models.
STEVEN TREVINO (RSG) will assist with GISDK scripting for this project. Steven has experience in the development and validation of both TDMs and land use models at both the regional and statewide level. He has implemented complex spatial and temporal logit models as part of advanced trip-based models and is a lead contributor to model development,
calibration, and validation efforts. He has supported Vince the development of destination choice models in several states.
CHRISTOPHER L. JOANNES, AICP is an expert user of both Cube and TransCAD and is adept at GISDK scripting. He is skilled in HTML, JavaScript, CSS, Python, and PHP programming languages. He previously oversaw GIS for a planning firm in Scottsdale, Arizona. He is the firm’s GIS specialist and has experience in multiple areas of the GIS field.
Detailed resumes of all proposed staff are included in Appendix A.
48

33
7.0 PROJECT MANAGEMENT
RSG is a nimble firm, and our project managers thrive on close and regular cooperation with clients. RSG delivers timely and accurate project deliverables for clients. Each RSG project is led by a project manager (PM) with direct operational control of project work and client communications. Our PMs’ focus is to review client deliverables for accuracy throughout the project lifecycle, reducing the likelihood of omissions or the need for revisions after the fact, all of which can impact the project’s cost. While final responsibility for quality control rests with the PM, senior advisors also play a critical function, providing a fresh set of eyes and independent review of key deliverables. The RSG team not only boasts an eminently qualified PM in Vince Bernardin, but Bill Woodford as a senior advisor who also brings extensive experience to the team, and Dean Munn and Udit Molakatalla will also provide additional and more independent quality assurance, outside of any internal RSG budget pressure, and well-informed and experienced in travel model development in Michigan.
RSG takes its clients’ deadlines seriously and communicates frequently and clearly. When TDOT’s director accelerated the timeline for their statewide long-range plan—requiring the completion of their new statewide model several months earlier than originally scheduled—RSG’s Project Manager, Vince Bernardin, worked with TDOT to develop a strategy to complete an interim version of the model that could be in place in time for use in the accelerated plan schedule and defer more complex components and functionality to a subsequent phase. RSG delivered the interim model on time to support the plan update before ultimately continuing to develop the final model. Whether as major as this example or much more minor or mundane, Vince will document significant events and project decisions. He will also inform the WATS project manager of any new information that has the potential to impact the scope, schedule, or cost of the project.
RSG believes that consistent Quality Assurance/Quality Control (QA/QC) is a prerequisite. RSG automates quality control at all possible levels of technical implementation so that error checking occurs throughout the project lifecycle. RSG uses Deltek Vision accounting software for financial, business, and project management. This software accounts for costs, revenues, and profits by project. Vision makes all transactions, audit trails, and processes available to any PM. In addition to the software capabilities, RSG has implemented internal controls for the job-cost accounting system for the recording and accumulation of costs incurred under its contracts that are reviewed monthly. Potential cost overruns will be identified through careful financial management on the part of RSG accounting staff, task order managers, and the RSG PM. This oversight will be enabled by the Vision software, which provides monitoring of expenses at task levels coupled with monitoring of progress on project tasks. Monitoring both expenditures and progress enables RSG managers to direct next steps on the project, communicate cost and progress reports to the client, and anticipate and avoid cost overruns.
49

Washtenaw Area Transportation Study PROPOSAL Model Update and Improvements
34 February 10, 2017
8.0 PROJECT SCHEDULE AND STAFF ALLOCATION
The table below presents our proposed project schedule and staff allocations.
9.0 AUTHORIZED NEGOTIATORS
As a Director of the firm, Vince Bernardin is authorized to negotiate on behalf of RSG and to enter into binding contracts. Vince’s direct phone line is 812-200-2351.
Project Manager
Senior Advisor
Task Lead Task Lead
Senior Support
Staff
Junior Support
Staff
1 2 3 4 5 6 7 8 9 10 11 12 13 14 Bernardin
Woodford Munn Molakatall
aSadrsadat
/ Chen
Bindra /
Trevino
a Base Year Roadway Network 6 0 0 60 0 40b Future Year Roadway Network 4 0 0 32 0 0c Task Documentation 4 0 0 8 0 8
a Base Year Transit Network 4 2 48 0 24 0b Future Year Transit Network 2 1 24 0 0 0c Task Documentation 2 1 8 0 4 0
a Base Year Zones with Data 8 0 0 60 0 4b Future Year Zones with Data 8 0 0 60 0 0c Task Documentation 4 0 0 16 0 0
a Base Year EE Trip Matrix 24 0 0 0 40 40b Base Year EI/IE Trips 8 0 0 0 40 0c Future Year External Trips 8 0 0 0 20 0d Task Documentation 4 0 0 0 12 0
a Trip Generation Specification 4 0 0 0 0 4b Validated Trip Generation Model 12 0 0 0 0 116c Task Documentation 4 0 0 0 0 4
a Trip Distribution Specification 12 0 0 0 4 0b Validated Trip Distribution Model 24 0 0 0 80 0c Task Documentation 8 0 0 0 10 0
a Mode Choice Specification 2 2 8 0 0 0b Validated Mode Choice Model 4 2 148 0 0 0c Guidance on New Transit Modes 2 2 8 0 0 0d Task Documentation 2 2 8 0 0 0
a Assignment Model Specification 16 0 0 0 4 4b Validated Base Year Assignment 24 0 0 0 32 24c Reasonable Future Year Assignment 16 0 0 0 16 0d Task Documentation 4 0 0 0 8 0
a Validated Model Set 8 0 0 0 20 20b Final System Calibration Report 4 0 0 0 4 4
a GISDK Code and GUI 4 0 0 0 0 24b Reporting Tool and Reports 4 0 0 0 0 24c Users Guide 4 0 0 0 0 16
a Monthly Progress Reports 14 0 0 0 0 0b Compiled Documentation w/ Recommendations 8 0 0 0 0 0
a On-site Training Session 16 0 16 0 16 0
a Recommendations / Tool Specification 4 0 4 0 0 0b Working Performance Measures Tool 4 0 0 0 0 20c Performance Measures Tool Documentation 2 0 0 0 0 4
12. Training
13. Performance Measures
7. Mode Choice
8. Vehicle and Transit Assignment
9. Model Calibration and Validation
10. Model Interface Development
11. Required Documentation
2. Transit Network Development
3. TAZ Development
4. External Trips
5. Trip Generation
6. Trip Distribution
Hours by Staff
Month from Notice to Proceed
MilestoneTask1. Roadway Network Development
50

35
10.0 SUBCONSULTANTS
RSG has proposed to supplement its staff to ensure its ability to deliver the project on schedule. RSG has proposed as subconsultants Convergence Planning, LLC, and Lochmueller Group, Inc. Their qualifications and experience are detailed in Sections 1.0 and 4.0.
51

Washtenaw Area Transportation Study PROPOSAL Model Update and Improvements
36 February 10, 2017
APPENDIX A. RESUMES
52

VINCE BERNARDIN, JR., PHD Director
Vince has project experience in twenty states and abroad developing and applying statewide, urban, and corridor-level travel forecasting models for both plan development and major project studies. He is best known for his innovative work with passively collected big data and for development of “hybrid” modeling approaches, which combine elements of activity-based and trip-based models. He also offers considerable experience with emissions and economic analyses. With his broad experience, Vince brings both technical expertise and creativity in crafting the right tool or analysis for an individual client’s needs. He has published on a wide variety of topics, from destination and mode choice modeling to carbon accounting methods for freight projects.
PROJECT EXPERIENCE
Michigan Statewide Passenger and Freight Travel Demand Model for Michigan Department of Transportation. Project Manager for the development of a new statewide travel model for the state of Michigan. The new model makes use of big data, particularly for understanding long distance, visitor, and truck travel patterns, and includes a special summer travel model in addition to a typical weekday model.
MACOG Regional Travel Surveys, Demand Model Improvement and Land Use Model Development. As Project Manager, designed and oversaw a feasible plan for accomplishing this ambitious project including collection of household and college travel surveys, development of a hybrid tour-based travel model and development of a land use modeling system for the Michiana Area Council of Governments (MACOG).
Chattanooga Daysim Model Development for the Chattanooga-Hamilton County-North Georgia Transportation Planning Organization. Project manager for the development of a new activity-based model using the Daysim platform. The new model incorporates speed data from HERE and AirSage data in addition to traditional household travel survey data and traffic counts in model calibration.
Update of Ohio’s Standard Model for Small- & Medium-Sized MPOs for the Ohio Department of Transportation (ODOT). Project Manager for ODOT’s update of its standard travel model for eight small-/medium-size MPOs in Ohio. The update is addresses assignment convergence and feedback, school trips and auto ownership modeling; the update will also provide assistance to ODOT modeling staff in validating the models volumes and travel times to a new 2010 base year.
Virginia DOT Statewide and Metropolitan Travel Demand Modeling On-Call
EXPERIENCE
12 years
EDUCATION Doctor of Philosophy, Transportation Engineering, Northwestern University (2008)
MS, Transportation Engineering, Northwestern University (2006)
BA, Honors Philosophy with a concentration in Physics, University of Notre Dame (2001)
53

VINCE BERNARDIN, JR., PHD Director
2
(Virginia DOT). Task Leader for updates to the Richmond-Tri-Cities, Fredericksburg, and Harrisonburg MPOs including analysis of AirSage and Streetlight data to update external travel flows and improvements to non-home-based trips, mode choice, time-of-day, and toll modeling components.
Nashville Daysim Transfer and Web Interface for the Nashville MPO. Project Manager for the transfer and implementation of Daysim, an activity-based model platform, for the Nashville region and the development of a web-interface for accessing and visualizing model results.
TMIP Planning Analysis Toolbox for the Federal Highway Administration (FHWA). Project Manager for FHWA - Travel Model Improvement Program (TMIP)’s development of a reference resource for the selection and application of analytical tools and methods to support data driven, performance-based transportation planning. Initial tools developed as part of the Toolbox include a road pricing feasibility screening tool and a TAZ data consistency checking tool.
NCHRP 08-94: Guidelines for Selecting Travel Forecasting Methods and Techniques. Senior Advisor responsible for reviewing method selection software tool and evaluating advantages and disadvantages of various travel modeling methodologies.
Big Data Analytics (Charlotte Regional Transportation Planning Organization) Senior Advisor to the TPO for the acquisition and processing of big data to support regional travel modeling and transportation planning.
I-69 Evansville-Indianapolis Tier 1 EIS for INDOT. For more than a year, served as chief modeler responsible for the I-69 Evansville-Indianapolis Tier I Environmental Impact Statement (EIS) examining 142 miles of the I-69 corridor intended to connect Mexico with Canada. Responsibilities included the traffic forecasts for the final corridor alternatives and the associated user benefit/cost, proximity, accessibility, and traffic impact analyses, as well as several sensitivity analyses of the travel demand model.
US 31 Plymouth-South Bend EIS for INDOT. Analyst responsible for re-validation of the Indiana Statewide Travel Demand Model to incorporate new network and zonal detail in and around the study area, producing regional socioeconomic forecasts and developing post-processors to generate traffic performance measures and user economic benefits for the alternatives.
Tennessee Statewide Planning On-Call Support (Tennessee DOT). Project Manager for the development of a new statewide model for Tennessee to support the development of a new statewide transportation plan. The new model triples the number of zones and road miles of network. The passenger models are being updated using an add-on to the 2009 NHTS, and the truck models using ATRI’s GPS truck data.
Hybrid Travel Model Development for the Evansville, Indiana MPO. Project Manager for development of a hybrid tour-based travel model for the metropolitan area to incorporate new sensitivity and realism. The entire advanced hybrid modeling system is implemented in TransCAD using GISDK.
Update of the Knoxville Regional Travel Model for the Knoxville Regional Transportation Planning Organization. Project Manager for the latest update of Knoxville’s hybrid tour-based travel
54

3
model. The 2011 update included the incorporation of the Morristown, TN, area and revalidation to a 2010 base year.
Hybrid Regional Travel Demand Model for the Knoxville, Tennessee Regional Transportation Planning Organization. Project Manager responsible for a new hybrid model design and development of the component activity generation, external travel, mode, departure time and destination choice models and validation of the complete model system. The choice model estimation required the combination of two household surveys and an on-board survey. The entire modeling system was implemented in TransCAD. He presented a paper on the project in a Best Papers Session at TRB’s 89th Annual Meeting in Washington, DC, January 2010.
Anchorage Travel Model Update (Municipality of Anchorage). Senior Advisor for an update of the Anchorage travel model including the processing and incorporation of truck GPS data from ATRI.
Travel Demand Model Improvements, Phoenix, Arizona for the Maricopa Association of Governments (MAG). Senior Advisor responsible for recommendations for future supply-side modeling improvements. The project involved estimating capacities and free-flow speeds to reflect uncongested average speeds and then updating and re-calibrating sets of volume-delay functions used in the model.
Northwest Arkansas Regional Travel Demand Model Development, for the Arkansas Highway & Transportation Department. Modeler with primary responsibility for this project that included network and zone development, model calibration to household and external travel surveys, a custom user interface, and advanced modeling components including a population synthesizer, mode choice model, destination choice models, flow averaging trip distribution-traffic assignment feedback loop, and a high level of model validation. The project involved extensive programming in TransCAD’s GISDK script.
Lexington Metro Area TransCAD Travel Demand Model Conversion & Update for the Kentucky Transportation Cabinet (KYTC). Modeler responsible various model components as well as two post-processors which were calibrated to the observed average peak period speeds on arterial corridors.
RECENT PUBLICATIONS
Simultaneous Travel Model Estimation from Survey Data and Traffic Counts. Bernardin, V., S. Trevino, G. Slater & J. Gliebe. Transportation Research Record: Journal of the Transportation Research Board, No. 2496, TRB, Washington, DC, 2015, pp. 69-76.
Income Effects and Other New Findings on the Complexity of Transit Tours. Bernardin, V., A. Swenson, Z. Jiang & M. Grovak. Transportation Research Record: Journal of the Transportation Research Board, No. 2217, TRB, Washington, DC, 2011, pp. 38-45.
Hierarchical Ordering of Nests in a Joint Mode & Destination Choice Model. Newman, J. & V. Bernardin. Transportation, Vol. 37, No. 4, 2010, pp. 677-688.
Enhanced Destination Choice Models Incorporating Agglomeration Related to Trip Chaining While Controlling for Spatial Competition. Bernardin, V., F. Koppelman & D. Boyce. Transportation Research
Record: Journal of the Transportation Research Board, No. 2132, TRB, Washington, DC, 2009, pp. 143-151.
55

WILLIAM WOODFORD Principal
William Woodford has extensive consulting experience in the areas of travel demand forecasting, ridership forecasting, and transportation planning. He has focused his career on the planning and development of fixed guideway transit New Starts projects with a particular emphasis on transit ridership forecasting, alternatives analysis, and system analysis. He has consulted with many of the largest transit agencies in the United States, including those in Chicago, New York, Newark, Washington, Denver, Los Angeles, and San Jose. He worked with the Federal Transit Administration and Federal Highway Administration and state DOTs in New York, Virginia, and Maine.
PROJECT EXPERIENCE
Development of Simplified Ridership Forecasting Model, Federal Transit Administration (FTA), Nationwide: Directed this project to develop FTA’s simplified ridership forecasting model known as the Simplified Trips on Projects Software (STOPS) model. This new process builds on the Aggregate Rail Ridership Forecasting (ARRF) model and is designed to provide a quick and reliable method for estimating ridership for New Starts projects and enable local agencies and FTA staff to evaluate the merits of new fixed guideway transit systems without the difficult process of calibrating and validating local modeling systems. STOPS is based on Census Transportation Planning Package information coupled to level of service measures derived from schedule information maintained in GTFS format. The first version of STOPS is currently available from FTA and is being used to developed forecasts.
Strategic Plan, Northern Indiana Commuter Transportation District (NICTD), Chesterton, IN. Developing long-range ridership forecasts in support of the strategic planning program for NICTD. Forecasts are being prepared using STOPS and demographic information obtained from three MPOs for the areas served by NICTD. Forecasts are examining the relative impacts on ridership of implementing service improvements to the existing South Shore Line, constructing a new West Lake branch, and a combination of the two options.
US-192 Alternatives Analysis, Osceola County, FL, LYNX: Led the effort to develop the transit ridership forecasts for potential improvements to the US-192 Corridor between St. Cloud, Kissimmee, and the Disney World Resort in Osceola and Orange Counties, FL. This work involved developing an Off-Line Ridership Forecasting Model based on FTA data-driven forecasting process. This work made extensive use of the
EXPERIENCE
32 years
EDUCATION MS, University of California, Berkeley (Transportation), 1980
BS, University of Virginia (Civil Engineering), 1979
56
WILLIAM WOODFORD Principal
2
2010 on-board transit survey coupled with socioeconomic growth forecasts and transportation network information obtained from the Metroplan regional travel forecasting model (OUATS). The resulting model was calibrated to match route and stop-level ridership counts used to support the analysis of a range of low cost bus service improvements and potential Bus Rapid Transit investments.
Preservation of New Starts Forecasts, Federal Transit Administration (FTA), Nationwide: Directed AECOM's assistance to FTA in preserving and improving New Starts forecasts. Bill’s role in this project has included leading the effort to diagnose issues related to the travel forecasting models used to estimate ridership on the Woodward Avenue LRT in Detroit, MI and developing model enhancements intended to bring the model into conformity with FTA guidance. Mr. Woodford also led other tasks related to testing the techniques used to preserve forecasts made by others related to the LRT program in Houston, TX. (project work while at AECOM)
Improving New Starts, Federal Transit Administration (FTA), Nationwide: Directed AECOM's assistance to FTA related to transit ridership, travel modeling, and forecasting for potential New Starts projects. This work has included a major update to the Aggregate Rail Ridership Forecasting Model. This tool was developed to serve as a quality control step for assessing the reasonableness of forecasts developed using conventional forecasting procedures. AECOM has also studied improved survey data collection and survey weighting procedures with a view to determining the appropriate level of detail for conducting survey expansion. (project work while at AECOM)
Travel Demand Forecasting, Federal Transit Administration (FTA): Assisted FTA in conducting research and preparing guidance for improving the state of travel demand forecasting for New Starts transit projects. This work included consideration of transit congestion, development of external aggregate forecasting tools, and refinement of trip distribution techniques. (project work while at AECOM)
Planning Methods, Federal Transit Administration: Assisted FTA with research designed to improve New Starts planning methods. These methods are an increasingly important element of the process used by FTA to determine the justification for potential fixed guideway transit projects. This project provided the basis for addressing some of the most challenging issues facing the development of fixed guideway transit systems in the United States - forecasting ridership and estimating the related benefits of those transit projects. (project work while at AECOM)
New Starts Forecasts, Multiple Sponsors, Nationwide: Mr. Woodford has led the development of New Starts ridership forecasts and project justification measures for some of the largest and most complex projects in the United States. Many have obtained funding and are either in operation or under construction. (project work while at AECOM)
LICENSES, CERTIFICATIONS, MEMBERSHIPS, AND AFFILIATIONS
• American Society of Civil Engineers (ASCE), National Capital Section • Institute of Traffic Engineers (ITE), Washington DC Chapter
57

Dean Lawrence Munn Principal
[email protected] 317.295.1566
Education
University of Wisconsin, Whitewater, Wis., B.S. (Geography, Urban Area Development) (1994) Indiana University, Bloomington, Ind., Graduate Studies (Geography) (1994-1996)
Professional Experience
Dean Munn, is co-founder and principal of Convergence Planning. Prior to starting the firm, Dean spent 12 years with other consulting firms. During this time, Dean worked on a variety of planning and technical analysis projects for clients around the United States, including many in Michigan. Dean has extensive technical experience, including statewide and metropolitan model development. Earlier in his career, Dean worked in the public sector; first, as Team Leader of Long Range Planning at the Indiana Department of Transportation; and later at the Association of Monterey Bay Area Governments in his home state of California. Mr. Munn was also a researcher at the Indiana University Transportation Research Center. In total, Mr. Munn has 23 years of transportation planning experience, and offers a uniquely creative and responsive approach to serve each client's needs.
Selected Project Experience
• St. Charles County Missouri Travel Demand Model – Mr. Munn is task leader for development of trip generation and distribution models from the East-West Gateway MPO household survey. Mr. Munn also led the traffic analysis zone development and growth forecasts for socioeconomic and employment data. Mr. Munn is also providing QA/QC guidance on all other aspects of the model development. Convergence Planning is a sub to Lochgroup 2016-2017
• Madison County, Indiana MPO On-Call Modeling, Forecasting, and Data Analytics - The project provides support to staff in development of a new travel model for the MCCOG MPO. As part of the RSG/Convergence team, Mr. Munn has been active in making data-driven recommendations for model coverage area, TAZ splits, and external travel methodologies. The work has included the combination of the MCCOG HIM household survey data with the NHTS and CITS surveys. 2016-2017
• Technical and Planning Assistance to the Lansing Tri-County MPO – Project Manager. Provided assistance to the Lansing MPO in development of a revised Long Range Transportation Plan, with an emphasis on expanded performance based planning and MAP-21 compliance. Other tasks involved development of economic and urban design oriented performance based planning add-ons to the regional travel demand model. 2015
• Freight Forecast Report for the I-69 Thumb Region – Project Manager. A freight forecast report was prepared on behalf of the partners of the I-69 Thumb Region. This 7-county region includes Genesee, Huron, Lapeer, St. Clair, Sanilac, Shiawassee, and Tuscola Counties which have potential sites for development as major truck-rail intermodal, production, and distribution/logistics facilities. Data from the IHS Global Insight Transearch dataset was used as the primary information source to analyze current (2009) and future (2030) freight flows in the I-69 Thumb Region. 2014
• Genesee County Freight and Connectivity Study, Genesee County, Mich. – Task Leader of modeling and economic analysis activities. The project is analyzing the feasibility of various new freeway connections. 2010
• Estimating VMT on Local Road Systems, Michigan Department of Transportation – Principal investigator on a research project to evaluate national and international practices used for
58

estimating vehicle miles of travel on local road systems to identify alternative methods and options that are available to meet the current and future needs of MDOT and FHWA. 2009
• 2005-2030 State Long-Range Transportation Plan for the Michigan Department of Transportation – Task Leader for the Borders & Corridors Task, involved identification of major activity centers, linkages between centers, and prioritization of corridors based on an economic valuing exercise. 2006
• SEMCOG Freight Economics Study – Task Manager. Conducted analysis of current and forecasted freight movement in and through the greater Detroit economic region and developed an economic impact tool based on the MDOT version of the REMI model. 2012
• West Central Indiana Economic Development District Travel Demand Model Update –The project involved a major expansion of the modeled area to include more coverage of Vigo County and added a portion of Clay County (Brazil). All zonal input data was updated to include 2010 Census data, 2010 InfoUSA employment data, 2040 growth forecasts. Similar updates and expansion of the roadway network were made, and traffic data was updated to year 2010. The entire model interface and GISDK script was updated to run in TransCAD 6.0, and the model was validated to match the new traffic count data. 2014
• Lansing MPO Tri-County Travel Demand Model Update – Provided QA/QC and technical assistance to the consultant modeling staff in the update for the Tri-County Regional Planning Commission travel demand model. The model update involved updating to 2010 Census data, 2040 growth forecasts and zonal data, coding future year multimodal alternatives, and testing the alternatives for the long range plan. 2014
• Bloomington Model Update – Project Manager. a complete update of the Bloomington/Monroe County model components using an on-line household travel survey combined with household survey data from NHTS. Updated components include trip purposes, production rates, destination choice model, stratification curves, friction factors, mode choice calibration, external auto trip patterns, and auto occupancy statistics. The project also developed sensitivity to 4D/5D urban environment variables and inclusion of active travel (bike & pedestrian) through every step of the model stream. 2015
• Fort Wayne MPO Model Update – Project manager. A complete travel demand model update for the Fort Wayne metro area. The project included a new household travel survey, on-board transit survey, re-design and calibration of the trip generation, trip distribution, and mode choice components. The project also adds a graphical user interface and a MOVES emission rate post-processor for air quality conformity applications. 2013
• Knoxville TPO Transit Alternatives Analysis – Task Manager. Added transit mode choice components to the Knoxville model to support ridership and feasibility forecasting for various premium transit corridors and concepts. 2012
• AMBAG Transit Model Enhancements and 4D Postprocessor – Project manager for a complete re-calibration of the AMBAG model’s mode choice model and transit assignment capabilities suitable for future New Starts transit forecasting. The project also includes the addition of a 4D Postprocessor tool to enhance the region’s ability to assess the transportation effects of smart growth initiatives. 2012
• Indianapolis MPO Travel Demand Model 2010 Update – Project manager and lead modeler for a complete re-calibration of the Indianapolis MPO model to a 2010 base year. The model was calibrated to the 2009 Central Indiana Household Survey, the 2009 NHTS, and a comprehensive transit on-board survey. The model was used for New Starts ridership forecasting. 2010-2013
• Urban Travel Demand Model Improvements for the Genesee County MPC, Mich. – Project Manager of a complete update and calibration using a new household survey and on-board transit survey which included estimation of a nested logit mode choice model and transit assignment component for the travel demand model covering Genesee County. 2009
59

Udit Molakatalla, PE, PTOE Senior Transportation Engineer
Udit has more than 10 years of public and private sector experience managing broad range of projects in travel demand modeling, traffic engineering, transportation planning, and traffic safety. He has worked on multiple regional travel demand models to assist clients make decisions based on independent, unbiased analysis. He understands that regional transportation systems, in addition to serving mobility, play an important role in shaping surrounding communities. His multimodal experience ranges from corridor studies to regional multimodal plans conducive for all modes of transportation. Udit’s attention to detail and quality of work extends to his interaction with clients, government agency staff, elected officials, and the public to communicate details of transportation studies, long-range plans, and MPO programs.
REPRESENTATIVE PROJECT EXPERIENCE Travel Demand Model, Columbus, Indiana for the Columbus Area Metropolitan Planning Organization (CAMPO) – Travel Demand Modeler responsible to develop CAMPO’s hybrid travel demand model. The travel demand model will be used to evaluate future year scenarios in CAMPO’s long-range transportation plan and to identify regional travel patterns and traffic forecasts for various transportation projects.
Travel Demand Model, Lansing, Michigan for the Tri-County Regional Planning Commission (TCRPC) – Lead Modeler and Project Manager on development of travel demand model for this Commission, which overseas planning for the greater Lansing urbanized area. The project developed zonal socio-economic data for horizon years; coded GISDK scripts; derived model parameters from regional household survey; performed model calibration; developed alternatives; and prepared documentation, staff training, and presentation to the TCRPC policy board. The model analyzed potential Bus Rapid Transit (BRT) routes as part of the future transit alternatives.
Illinois Model Users Group (ILMUG) – Helped create Illinois Modeling Users Group (IL-MUG) to support, set standards, and guide the development, implementation, and maintenance of travel demand models in small- and medium-sized MPOs in Illinois. The IL-MUG has been acting as a forum for the exchange of ideas, tips/techniques, and issues involving the development, applications, and improvements of travel demand models utilized by the small- and medium-sized MPOs in Illinois.
Travel Demand Model for Champaign County, Illinois – Lead Modeler and Project Manager responsible for developing a four-step travel demand model for Champaign County, using Cube Voyager. Developed model parameters using household travel survey and prepared custom Cube scripts. Validated and calibrated the model against base-year conditions. Extensively used the model for various planning and engineering projects.
Travel Demand Model for Small- & Medium-Size MPOs, Illinois – Project Engineer responsible to establish the framework necessary for the development, maintenance, and application of small- and medium-sized MPOs’ TDMs. This study addresses the statewide modeling current practices in the US and highlights issues and benefits of statewide modeling and the integration of state and regional (MPO-level) travel demand models. The major outcome of the study included enhancements to the traffic forecasting capabilities of small and medium MPOs in Illinois and development of an effective transportation planning tool for the Illinois Department of Transportation (IDOT).
PUBLICATIONS Travel Demand Modeling for the Small & Medium Sized MPOs in Illinois, Udit Molakatalla, Mohammad S. Ullah, Rita Morocoima-
Black, and Ahmed Z. Mohideen, Research Report ICT-11-091, September 2011.
WITH THE FIRM Since 2015
YEARS OF EXPERIENCE 11
EDUCATION MS, Civil Engineering (Transportation), North Dakota State University, 2006
BS, Civil Engineering, Osmania University, India, 2003
REGISTRATION Professional Engineer: Michigan
Professional Traffic Operations Engineer
60

HADI SADRSADAT, PhD Consultant
Hadi Sadrsadat, PhD is experienced with the development, calibration, and validation of travel demand models in Cube, TransCAD, and STOPS. He specializes in urban travel demand modeling, forecasting, analyzing collected data, and preparing traffic simulation models. He has developed and applied travel demand models in several states and abroad to forecast travel demand for major transit projects, freight plans, and highway improvement strategies such as managed lanes, ramp metering, and hard shoulder. Hadi also has significant experience with data validation and analysis, including research validating speed data along the I-95 corridor provided by INRIX by using Bluetooth Sensors data as the ground truth.
PROJECT EXPERIENCE
Northeast Regional Planning Model (NERPM), Jacksonville, FL. Enhanced the model and improved the model run time by updating the model structure and adding new features to the model. Assisted in developing a new application to the model to generate new parcel or edit parcel data. He also cleaned up the CUBE Catalog Interface of the model. The project needs lots of CUBE scripting. (2015)
Richmond/Tri-Cities Model Update, VA. Reviewed different components of the Richmond/Tri-Cities (RTC) model including Mode Choice, Highway Assignment, and Transit Assignment. The purpose of this project is to improve the performance of the RTC model for use in the RTC Long Range Transportation Plan (LRTP). He recalibrated the time-of-day part of the RTC model. He also improved the value-of-time part of the RTC model. The project needs calibration of several parameters and CUBE scripting. (2015)
Tennessee Statewide Travel Demand Model – Phase 3, TN. The purpose of this project is developing enhanced passenger and freight modeling features as part of statewide travel demand model for Tennessee. Mr. Sadrsadat calibrated the volume delay function (VDF) parameters and free flow speed class parameters according to observed speeds and counts, enhanced freight modeling by developing commodity flow freight models for 43 commodity types, and calibrated vehicle occupancy models to scale AirSage data according to count data. (Ongoing)
I-26 Regional Fixed Guidway Transit Alternatives Analysis, Charleston, SC. Reviewed the Berkeley-Charleston-Dorchester Council of Governments (BCDCOG) travel demand forecasting model in TransCAD and investigated its readiness for transit ridership. He also assisted in transit network coding and preparing the travel
EXPERIENCE
11 years
EDUCATION Doctor of Philosophy, Transportation Engineering, University of Maryland (2012)
MS, Transportation Planning, Sharif University of Technology (2003)
BS, Civil Engineering, Sharif University of Technology (2001)
61

HADI SADRSADAT, PHD Consultant
2
demand model in Simplified Transit Trips-on-Project Software (STOPS) to forecast transit ridership for 12 alternatives suggested to improve transit service and enhance regional mobility along I-26 corridor. (2015)
Statewide Active Traffic and Demand Management, OH. Assisted in calibration and validation of Ohio-Kentucky-Indiana Regional Council of Government (OKI) travel demand model in CUBE. Re-estimated trips based on current traffic volumes and processed INRIX speeds to evaluate the model speeds along the main corridors. Evaluated the use of Active Traffic and Demand Management (ATDM) strategies in Ohio, such as managed lanes and ramp metering to improve the traffic condition in future. (2013-2015)*
TransForM Version 1.5 Travel Demand Model Calibration and Documentation, Prince George’s County, MD. Assisted in calibration and validation of TransForM travel demand model in TransCAD. Provided land use data for the new zonal structure. (2014-2015)*
WMATA Regional Transit System Plan (RTSP) Enhancement, Washington, DC. Assisted in transit network coding and preparing the travel demand model in CUBE to analyze future transit scenarios. Provided performance measures for alternatives to evaluate scenarios. (2013-2014)*
Evaluation and Rating of Significant Transportation Projects, VA. Modeled highway and transit networks in TRANSIMS based on MWCOG model and converted MWCOG trip files into TRANSIMS format. Calibrated the TRANSIMS model for the base year to capture the observation. (2014)*
Farragut North-Farragut West Station Capacity Improvements, Washington, DC. Analyzed 2012 Metrorail survey, 2012 and 2013 official station counts, and Metrorail station boarding based on MWCOG and RTSP models to calibrate Metrorail station parameters used in the RTSP model. Modeled alternatives in CUBE for the future focusing on Farragut North, Farragut West, and Metro Center stations and ran the model in LineLoad application and analyzed the outputs. (2013-2014)*
East Colfax Model Assessment, City and County of Denver, Denver, CO. Assisted in calibration and validation of travel demand model in TransCAD for the city of Denver considering the East Colfax alternatives. Processed Front Range Travel Count (FRTC) and the latest on-board transit survey and compared them with model trip tables. (2013)*
Cordova Hills Environmental Impact Study, Sacramento, CA. Modified the Sacramento Regional Travel Demand Model (SACMET) in Cube to insert projects designed for Cordova Hills area. The modification included changes in parts of scripts, highway network structure, and zonal land use. Developed post-process scripts to provide desired performance measures from the outputs of the software. (2013)*
Traffic Engineering and Transportation Planning
*Work completed prior to joining RSG.
62
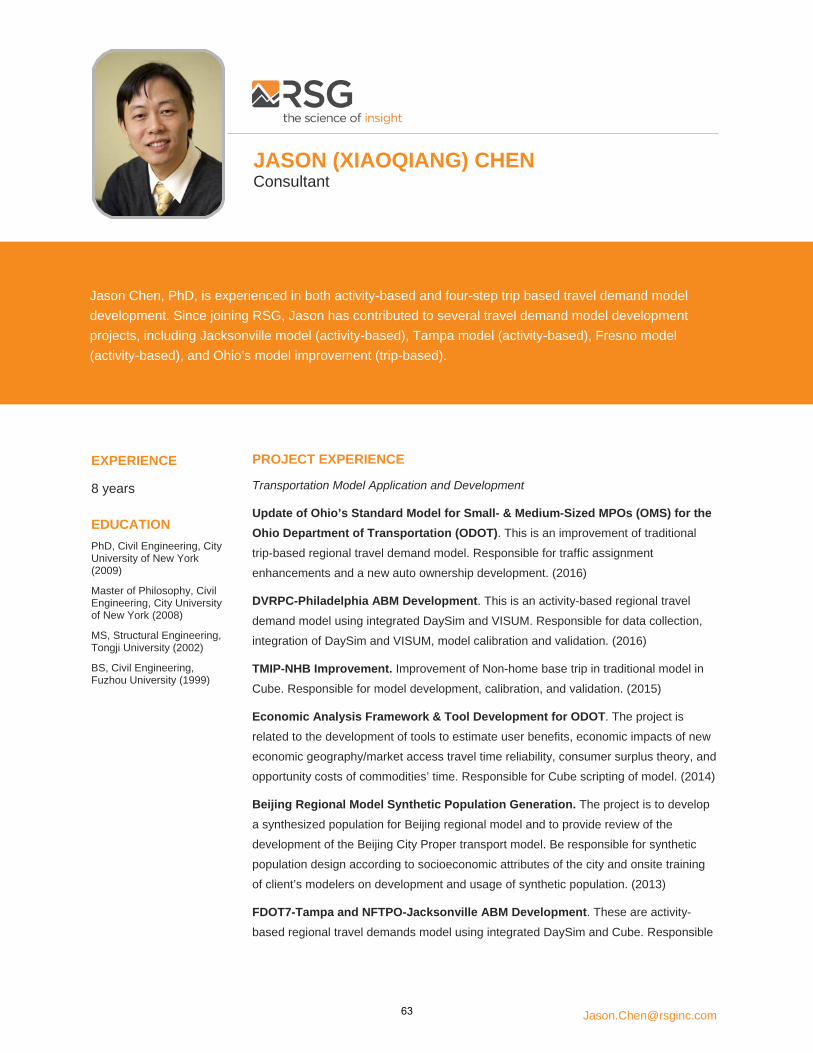
JASON (XIAOQIANG) CHEN Consultant
Jason Chen, PhD, is experienced in both activity-based and four-step trip based travel demand model development. Since joining RSG, Jason has contributed to several travel demand model development projects, including Jacksonville model (activity-based), Tampa model (activity-based), Fresno model (activity-based), and Ohio’s model improvement (trip-based).
PROJECT EXPERIENCE
Transportation Model Application and Development
Update of Ohio’s Standard Model for Small- & Medium-Sized MPOs (OMS) for the Ohio Department of Transportation (ODOT). This is an improvement of traditional trip-based regional travel demand model. Responsible for traffic assignment enhancements and a new auto ownership development. (2016)
DVRPC-Philadelphia ABM Development. This is an activity-based regional travel demand model using integrated DaySim and VISUM. Responsible for data collection, integration of DaySim and VISUM, model calibration and validation. (2016)
TMIP-NHB Improvement. Improvement of Non-home base trip in traditional model in Cube. Responsible for model development, calibration, and validation. (2015)
Economic Analysis Framework & Tool Development for ODOT. The project is related to the development of tools to estimate user benefits, economic impacts of new economic geography/market access travel time reliability, consumer surplus theory, and opportunity costs of commodities’ time. Responsible for Cube scripting of model. (2014)
Beijing Regional Model Synthetic Population Generation. The project is to develop a synthesized population for Beijing regional model and to provide review of the development of the Beijing City Proper transport model. Be responsible for synthetic population design according to socioeconomic attributes of the city and onsite training of client’s modelers on development and usage of synthetic population. (2013)
FDOT7-Tampa and NFTPO-Jacksonville ABM Development. These are activity-based regional travel demands model using integrated DaySim and Cube. Responsible
EXPERIENCE
8 years
EDUCATION PhD, Civil Engineering, City University of New York (2009)
Master of Philosophy, Civil Engineering, City University of New York (2008)
MS, Structural Engineering, Tongji University (2002)
BS, Civil Engineering, Fuzhou University (1999)
63

JASON (XIAOQIANG) CHEN Consultant
2
for data preparation, DaySim and Cube integration, and system-level calibration, highway validation and long range planning. The efforts involved advanced model development to make operational an integrated, advanced travel-demand model with a fine-grained, time-dependent network, and to demonstrate the model’s performance through validation tests and policy analyses. (2013)
San Joaquin Valley Model Improvement. These are activity-based regional travel demand models using integrated DaySim and Cube. Primarily responsible for development of model calibration target from Census and ACS data, calibration of parcel-level ABM for Fresno County, and a TAZ-level ABM for the three-county area of San Joaquin, Stanislaus and Merced Counties, and integration of model into Cube platform. (2012)
Tour and Supply Chain Freight Models in Chicago. Investigated how new planning tools and programs—such as freight analytical techniques, freight modeling improvements, methods of innovative freight data collection, and data sharing—can be used, and developed logistics supply chain models and tour-based micro-simulation models for freight movement. (2012)
West of Hudson Regional Transit Access Alternatives Analysis, Orange County, New York. Participated the alternatives analysis phase of the study, provided input to the planning process, ran and analyzed the travel demand model, integrated the air passenger model with the travel demand model, and recalibrated the BPM to better represent travel in relevant project markets. (AECOM, 2009–2011)
EIS Tappan Zee Bridge / I-287 Corridor, Rockland and Westchester Counties, New York. Ran and analyzed the BPM for several alternatives. Elements tested include HOT lanes, BRT, light rail, and commuter rail. (AECOM, 2009–2011)
Sensitivity Analysis of BPM (Best Practice model of NYMTC), New York. Participated in a study to test how the ABM responds to socioeconomic and demographic changes in the New York Metropolitan Region and to test the sensitivity of the model to spatial location of population and employment changes. (City College of New York, 2007–2008)
Travel Behavior Studies
Residential Relocation Behavior, Puget Sound Region, Washington. Participated in an investigation of how human adaptive nature would affect residential location choice using Puget Sound Panel data. Determined that residential preference is significantly influenced by past experience. (City College of New York, 2006–2008)
Time Use Change and Response Lag in Travel and Activity Patterns. Participated in a study using the 10-wave Puget Sound Panel Dataset to investigate the response lag of a significant change in discretionary time use. The results suggested that family and temporal constraints play a more important role than the built environment. (City College of New York, 2005–2006)
Probit and Mixed Logit Models Accounting for Future Expectation. Participated in a study of how future expectation could be incorporated into discrete choice models. Future anticipation often occurs in medium-term choice scenarios, such as vehicle holding and transaction decisions, or long-term choice scenarios, such as residential and job location choices. Most of the discrete choice models developed
64

3
so far in the area of travel behavior are incapable of accounting for expectation of future utility. (City College of New York, 2004–2005)
Transit Operation and Ridership
New York City Subway Ridership Time-of-Day Pattern Study, New York. Participated in a study of the relationship between time of day transit ridership patterns and the built environment in New York City. Identified five main types of time-of-day ridership patterns that differed by the total volume, morning and afternoon ridership, duration of the peak periods, and their starting times. Demonstrated that time of day ridership pattern is closely related to the built environment. A forecasting methodology to predict ridership time of day pattern is proposed in the final report. (City College of New York, 2006–2007)
PUBLICATIONS
Colin Smith, Jason Chen, Bhargava Sana, and Maren Outwater 92013) “A Disaggregate Tour-Based
Truck Model with Simulation of Shipment Allocation to Trucks”, Transportation Research Board Annual Meeting, Washington, DC, January 2013.
Colin Smith, Maren Outwater, Bhargava Sana, and Jason Chen (2012) “Tour-based and Supply Chain Modeling for Freight: An Integrated Model for Metropolitan Areas Demonstrated in Chicago”, 13th International Conference on Travel Behavior Research, Toronto, Canada, July 2012.
Cynthia Chen, Don Varley, and Jason Chen (2010). “What Affects Transit Ridership? A Dynamic Analysis involving Multiple Factors, Lags and Asymmetric Behaviour”, Urban Studies, November 17, 2010.
Cynthia Chen, Jason Chen, Harry Timmermans (2009). "Historical deposition influence in residential location decisions: a distance-based GEV model for spatial correlation" Environment and Planning A, 41(11) 2760 – 2777.
PRESENTATIONS
Jason Chen, "Historical Deposition Effect and its Interaction with Life Cycle in Residential Location Choice," 2008, Northwestern University, Chicago, Illinois.
Jason Chen, Cynthia Chen, and James Barry, "Diurnal Pattern of Transit Ridership," Association of American Geographers 2008 Annual Meeting, Boston, Massachusetts.
Jason Chen, Cynthia Chen, and Harry Timmermans, "Accessibility Tradeoffs in Households' Residential Relocation Decisions," 14th International Conference on Retailing and Consumer Services Science, San Francisco, California, June, 2007.
LICENSES, CERTIFICATIONS, MEMBERSHIPS, AND AFFILIATIONS
American Planning Association
65

SUMIT BINDRA Senior Analyst
Sumit Bindra develops and implements travel demand forecasting models and travel surveys. He has eight years of experience analyzing large- and small-scale transportation networks, pedestrian safety studies, and demand forecasting. His day-to-day activities include working as a senior analyst and deputy project manager on various Travel Demand Modeling and Forecasting projects. In the past, he has also worked on several Environmental Impact Statements (EIS) and Bus Rapid Transit (BRT) studies in New York City. Sumit has also supervised and participated in various data collection efforts and traffic surveys for the Port Authority of NY & NJ and the Metropolitan Transit Authority of NY.
PROJECT EXPERIENCE
Syracuse Metropolitan Transportation Council (SMTC), New York. Ongoing contract to provide travel demand modeling retainer services to SMTC in Syracuse, NY. Past assignments include incorporating cellphone O-D data from AirSage for the study region in model calibration and validation, model refinement with sub-area calibration focused on the I-81 corridor in downtown Syracuse and expanding the zonal and network coverage of the model region to include neighboring counties. (2013 –Ongoing)
Genesee Transportation Council (GTC), New York. Ongoing contract to provide travel demand modeling services to GTC in Rochester, NY. Current assignments include migrating the travel demand model from TransCAD 5.0 to TransCAD 7.0 (latest build), including adding support for importing transit data from Rochester’s GTFS files and incorporating corridor level speed comparison and validation using INRIX data. Past assignments include expanding the zonal and network coverage of the model region to include neighboring counties. (2013 –Ongoing)
Bow-Concord Regional Model, New Hampshire. Sumit was responsible for developing the four-step regional travel demand model in TransCAD for the region. This model was developed in partnership with a microsimulation model of the I-93 corridor and parallel primary street network. The two models were developed in conjunction and allow for seamless integration. The regional model was developed in TransCAD version 5 and is calibrated to a 2015 base year. The model was calibrated using Bluetooth data to inform origin-destination pairs. (2014–2016)
Tennessee Statewide Model (TDOT), Tennessee. Working on behalf of TDOT to help develop a new statewide travel model in TransCAD 6.0. The new travel model will
EXPERIENCE
9 years
EDUCATION MS, Transportation and Urban Engineering, University of Connecticut (2007)
BTech, Civil Engineering, Indian Institute of Technology (2005)
66

SUMIT BINDRA Senior Analyst
2
be used in the state’s 25-year Long-Range Transportation Policy Plan. Sumit has been involved in developing detailed traffic analysis zone system representing travel-sheds, detailed representation of the highway network, developing count-model based trip generation equations and processing of ATRI truck data to support a new freight model. (2013–Ongoing)
I-81 Corridor Study (SMTC), NY. Providing travel demand forecasting services to the Syracuse MPO in support of the I-81 corridor study. This work involves careful model refinement and validation to ensure that the model is ready for this extremely important study, along with forecasting transportation impacts for over 20 alternatives, including replacing I-81 with an at-grade arterial. (2014)
Accessing New England’s Airport via Intermodal Connectors. Involved in a project studying accessibility for six airports in the New England region. The project assigns trips onto the National Highway Planning Network (NHPN) in TransCAD to identify important (and most used) Intermodal Connectors drivers use to access these airports in the region. The project also involves processing the air passenger survey conducted at these airports to geo-locate land access trip origins and counts. (2013)
Seacoast Regional Model, New Hampshire. Sumit was responsible for maintaining and refining the existing four-step Seacoast regional transportation model to support the Rockingham Planning Commission and the Strafford Regional Planning Commission staff. The model is built in TransCad and calibrated to 2010 conditions. He used the model to perform scenario testing in the model area on projects such as the Bunker Creek bridge closure analysis. (2012-2014)
Florida Express Lanes Time-of-Day (ELToD) Model Development. Involved in supporting a custom strategic model specifically designed to estimate managed lanes traffic diversion for HOT lanes under congestion pricing policies. Provide guidance and QA/QC on the implementation of ELToD for studies in Tampa, along I-4 (Orlando) and I-75 (Miami) for Florida’s Turnpike Enterprise. (2013)
Utah Statewide Household Diary Study. Involved in analyzing the household diary survey data collected for the entire state of Utah. The goal of the project was to collect and analyze data to help update various existing travel demand models in the state of Utah. Responsibilities include preparation of datasets for travel demand modeling using ArcGIS and SPSS. (2012)
NYC Bus Rapid Transit. Traffic analyst as part of a consultant team retained by NYCDOT and New York City Transit to plan and implement the first-ever bus rapid transit system in New York City. Involved in traffic data collection efforts, development of ArcGIS volume maps, and traffic analysis for implementing Select Bus Service along the Fifth/Madison Avenue corridors in Manhattan and Hylan Boulevard in Staten Island, New York. (2011)
Khalifa Port and Industrial Zone (Abu Dhabi, United Arab Emirates). As part of the traffic impact study, preliminary interchange designs were proposed for several interchanges along the new Khalifa Industrial Road in Abu Dhabi. He evaluated the proposed alternatives for these interchanges using Synchro/SimTraffic software to ensure that all approaches operate at acceptable levels of service and coordinated with the highway design department to ensure that. (2010)
Hunter's Point South EIS. The project is the largest municipal affordable housing development with mixed-use and middle-income housing (approximately 5,000 units) in New York City and is located in
67

3
Long Island City, Queens. As the primary traffic analyst, he assessed the existing traffic conditions, future traffic flow patterns with and without the proposed development, and analyzed the future No Build and Build conditions for traffic impacts using HCS, SYNCHRO and CORSIM. Also responsible for providing assignments to other junior engineers working on the project and compiling the relevant sections of the EIS for review by NYCDOT's CEQR, Traffic Signals, Highways, and Bike and Pedestrian divisions. (2007)
PUBLICATIONS
Using Cellphone O-D data for Regional Travel Model Validation. Annual Meeting of the Transportation Research Board in Washington, D.C. (2016).
Predicting Segment-Intersection Crashes with Land Development Data. Transportation Research Record: Journal of the Transportation Research Board (2009). Co-Authors: J. N. Ivan and Thomas Jonsson.
Explaining Road Speeds with Spatial Lag and Spatial Error Regression Models. 86th Annual Meeting, TRB (2007). Co-Authors: J.K. Hackney, M. Bernard, and K. W. Axhausen.
Bessel's Graphical Solution of Three-Point Problem in Plane-Table Surveying - Limitation and
Alternative Solutions. American Society of Civil Engineers (2007). Co-Authors: A. C. Borsaikia and Mohammad Jawed.
68
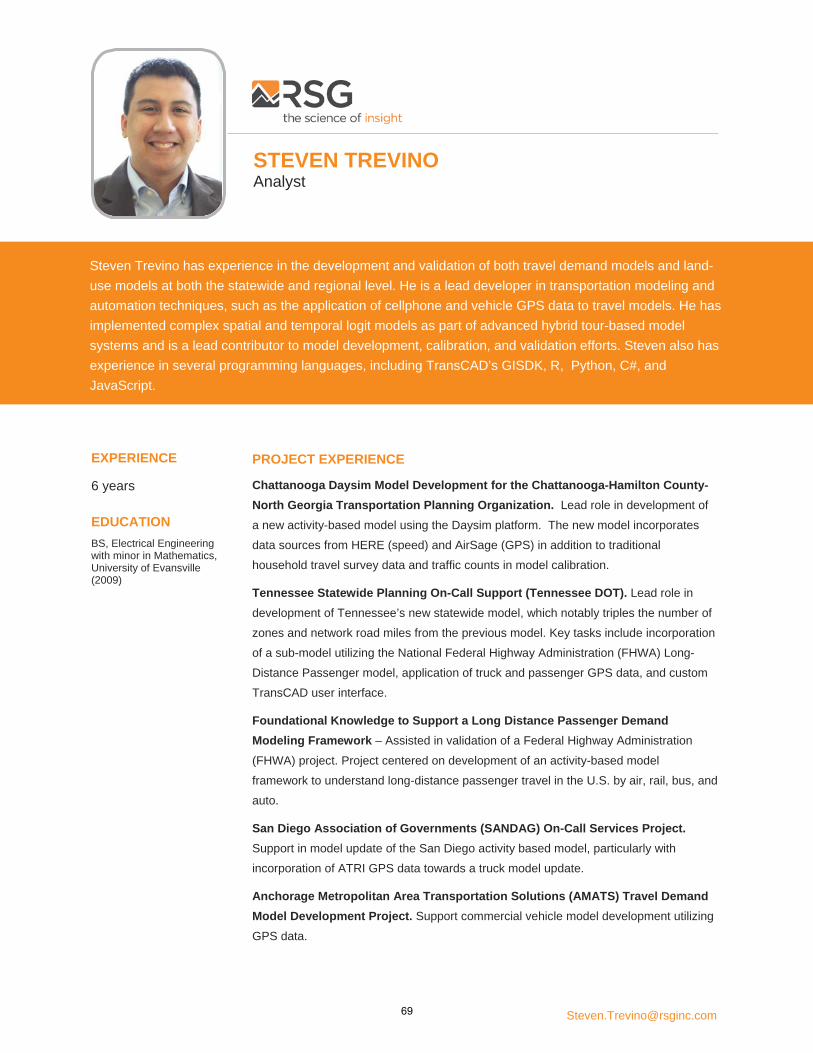
STEVEN TREVINO Analyst
Steven Trevino has experience in the development and validation of both travel demand models and land-use models at both the statewide and regional level. He is a lead developer in transportation modeling and automation techniques, such as the application of cellphone and vehicle GPS data to travel models. He has implemented complex spatial and temporal logit models as part of advanced hybrid tour-based model systems and is a lead contributor to model development, calibration, and validation efforts. Steven also has experience in several programming languages, including TransCAD’s GISDK, R, Python, C#, and JavaScript.
PROJECT EXPERIENCE
Chattanooga Daysim Model Development for the Chattanooga-Hamilton County-North Georgia Transportation Planning Organization. Lead role in development of a new activity-based model using the Daysim platform. The new model incorporates data sources from HERE (speed) and AirSage (GPS) in addition to traditional household travel survey data and traffic counts in model calibration.
Tennessee Statewide Planning On-Call Support (Tennessee DOT). Lead role in development of Tennessee’s new statewide model, which notably triples the number of zones and network road miles from the previous model. Key tasks include incorporation of a sub-model utilizing the National Federal Highway Administration (FHWA) Long-Distance Passenger model, application of truck and passenger GPS data, and custom TransCAD user interface.
Foundational Knowledge to Support a Long Distance Passenger Demand Modeling Framework – Assisted in validation of a Federal Highway Administration (FHWA) project. Project centered on development of an activity-based model framework to understand long-distance passenger travel in the U.S. by air, rail, bus, and auto.
San Diego Association of Governments (SANDAG) On-Call Services Project. Support in model update of the San Diego activity based model, particularly with incorporation of ATRI GPS data towards a truck model update.
Anchorage Metropolitan Area Transportation Solutions (AMATS) Travel Demand Model Development Project. Support commercial vehicle model development utilizing GPS data.
EXPERIENCE
6 years
EDUCATION BS, Electrical Engineering with minor in Mathematics, University of Evansville (2009)
69

STEVEN TREVINO Analyst
2
Enhancements to the Iowa Statewide Model for Iowa Department of Transportation. Support in developing freight and passenger demand data, destination choice models, and processing of ATRI GPS data for the Iowa’s statewide model update.
Hybrid Travel Model & Land Use Model for Michiana Area Council of Governments (MACOG). Leading development and validation of a two-county hybrid travel and land use model. Responsible for refining, updating, and improving the accuracy of model network. Incorporation of multiple model and user enhancements, including on-the-fly model inputs, advanced network handling, time-of-day and directional analysis, algorithmic parameter estimation, air quality post-processing, traffic post-processing, and multiuser outputs.
Travel and Land Use Modeling to Support a Regional Plan for Sustainable Development (Evansville MPO). Developed a land use model to highlight multiple development strategies and policies for the Evansville MPO three-county region. Utilized a two-tiered approach that integrates GIS visualization with econometric forecasting techniques, city planners can collaborate to create full scenarios or blend with predictive spatial discrete choice models. Features also included compatibility and functionality with existing travel model. Led data efforts, programming, and model analysis, including statistical parameter estimation using a genetic algorithm. Utilizes CommunityViz for visualization.
Hybrid Travel Model for the Evansville, Indiana MPO (EMPO). Responsible for updating, maintaining, and recalibrating model components, including Tour Generation, Mode Choice, Activity Allocation, Departure Time and Assignment in the development of a new hybrid travel model that contains the Evansville, IN and Henderson, KY regions. Applied a genetic algorithm for estimating parameters to improve model performance while developing tools and methods for data extraction, management, and model efficiency. Involved with analyzing and developing a multiple scenario network for future interchange improvement, and constructing graphical user interfaces and post processing tools while maintaining traffic, economic, and air quality databases.
Regional Travel Model for the Knoxville Regional Transportation Planning Organization. Responsible for improving, debugging, and upgrading hybrid tour-based travel model components and leading various calibration tasks, with special focus on destination choice model calibration. Developed a special sub-area model for the Morristown, TN, Lakeway MPO and created a tool for MOVES database calculation and extraction.
I-69, Section 5 Corridor Model for the Indiana Department of Transportation (INDOT) – Programmed and developed a hybrid travel model while constructing, maintaining, and analyzing traffic, economic, and air quality databases for the Indiana Statewide Model and the I-69 Corridor sub-model between Indianapolis and Evansville. Also performed tool development in extraction and analysis of employment, population, and income information for all regions.
Sustainable Evansville Area Coalition Regional Plan for Sustainable Development. Performed vehicle emissions modeling, including integrating INDOT’s air quality post-processor with hybrid travel model. Realized improvements to vehicle availability ordinal choice logit model while responsible for the
70

3
management and processing of several large GIS and other datasets for future land use model. Achieved large efficiency gains by automating an optical character recognition process.
Indiana DOT On-Call Planning Services. Responsible for enhancements to INDOT’s air quality post-processor to incorporate new emissions rates and analysis years. Developed pre-processing scripts to automate the preparation of input files from travel demand model outputs; processed and analyzed a variety of data sources, including statewide traffic & employment datasets. Administered databases for socioeconomic development within traffic analysis zones.
71

Christopher L. Joannes, AICP Transportation Planner/GIS Specialist
Chris is a Transportation Modeler and GIS expert involved in the development and application of travel demand models on projects ranging from major corridor analyses to regional planning. Chris specializes in transit with experience in transit path building and mode choice modeling. He currently serves as a lead transportation modeler on many travel demand modeling projects.
Chris is an expert user of both Cube and TransCAD and is adept at GISDK scripting. He is skilled in HTML, JavaScript, CSS, Python, and PHP programming languages. He previously oversaw GIS for a planning firm in Scottsdale, Arizona. He is the firm’s GIS specialist and has experience in multiple areas of the GIS field.
REPRESENTATIVE PROJECT EXPERIENCE I-69 Section 6 Tier 2 EIS for the Indiana Department of Transportation – Transportation Modeler responsible for updating, expanding, validating and calibrating the corridor travel demand model developed for the I-69 Section 5 Tier 2 EIS. A number of levels of corridor alternatives were also evaluated ranging from conceptual alternatives all the way through the final alternative that proceeded into the DEIS and FEIS. Substantial post-processing was also performed to quantify the full benefits of the project that support the purpose and need of the EIS, including using the TREDIS economic model to obtain statistics on economic growth and job creation as a result of the project. Additionally, a new post-processing method was developed to modify peak-hour modeling results to be used for microsimulation modeling according to tactics outlined in NCHRP 765.
Hybrid Travel Demand Model, Columbus, Indiana for the Columbus Area MPO (CAMPO) – Transportation Modeler for the development of the MPO’s first travel demand model. The travel demand model will provide a tool that is both practical and easy to use but also advanced in terms of its ability to address complex policy questions involving multi-modal transportation, land use and development patterns, and overall quality of life and livability issues. The model will also be consistent with the Indiana statewide model and it would interface with that tool to capture long-distance trips (both auto and truck) passing through the CAMPO region as well as trips either beginning or ending outside the CAMPO region.
Travel Demand Modeling for Ohio Statewide Network, Columbus, for the Ohio Department of Transportation – Travel Demand Modeler responsible for developing enhanced functionalities to test project alternatives in Citilabs Cube to accomplish the following:
• Introduce the effects of asset deterioration and different maintenance strategies (reconstruction, repavement, status-quo maintenance and deferred maintenance) into agency costs, speed calculations and user costs;
• Update the existing user benefits tool to include travel time reliability costs, work zone delay costs and consumer surplus; • Incorporate a custom freestanding version of TREDIS, a nationally-recognized economic impact model, into Cube to be run with
the user benefits tool to provide increased accessibility, job creation, increased income and value added for project alternatives; • Update the user benefits and economic impact tools to be compatible with both the statewide travel demand model and the
various Metropolitan Planning Organization (MPO) travel demand models throughout Ohio.
The tools require very little user input to determine a multitude of useful outputs for ODOT to be able to extensively test project alternatives.
WITH THE FIRM 2012
YEARS OF EXPERIENCE 5
EDUCATION MAS, GIS, Arizona State University, Tempe, Arizona, 2012
BS, Urban Planning, Arizona State University, Tempe, Arizona, 2011
CERTIFICATION American Institute of Certified Planners
INDUSTRY ASSOCIATIONS American Planning Association
72