notes to the consolidated financial statements - cgi.com · notes to the consolidated financial...
TRANSCRIPT

48 2010 ANNUAL REPORT CGI GROUP INC
Notes to the Consolidated Financial Statements
Years ended September 30, 2010, 2009 and 2008 (tabular amounts only are in thousands of Canadian dollars, except share data)
Note 1 Description of businessCGI Group Inc. (the “Company”), directly or through its subsidiaries, manages information technology services (“IT services”), including outsourcing, systems integration and consulting, software licenses and maintenance, as well as business process services (“BPS”) to help clients cost effectively realize their strategies and create added value.
Note 2 Summary of significant accounting policiesThe consolidated financial statements are prepared in accordance with Canadian generally accepted accounting principles (“GAAP”), which differ in certain material respects from U.S. GAAP. A reconciliation between Canadian and U.S. GAAP can be found in Note 28. Certain comparative figures have been reclassified in order to conform to the presentation adopted in 2010.
CHANGES IN ACCOUNTING POLICIESOn October 1, 2009, the Company elected to adopt the following Handbook Sections issued by the Canadian Institute of Chartered Accountants (“CICA”) during the year as they primarily converge with the International Financial Reporting Standards (“IFRS”) and U.S. GAAP:
a) Section 1582, “Business Combinations”, which replaces Section 1581, “Business Combinations”. The Section establishes standards for the accounting for a business combination. It is similar to the corresponding provisions of IFRS 3 (Revised), “Business Combinations” and of U.S. GAAP standard, Accounting Standards Codification (“ASC”) Topic 805, “Business Combinations”. The new Section requires the acquiring entity in a business combination to recognize most of the assets acquired and liabilities assumed in the transaction at their acquisition-date fair values including non-controlling interest and contingent consideration. Subsequent changes in fair value of contingent consideration classified as a liability are recognized in earnings. Acquisition-related and integration costs are also to be expensed as incurred rather than considered as part of the purchase price allocation. In addition, changes in estimates associated with future income tax assets after the measurement period are recognized as income tax expense rather than as a reduction of goodwill, with prospective application to all business combinations regardless of the date of acquisition.
Section 1601, “Consolidated Financial Statements” and Section 1602, “Non-Controlling Interests”, together replace Section 1600, “Consolidated Financial Statements”. Section 1601 establishes standards for the preparation of consolidated financial statements. Section 1602 establishes standards for accounting for a non-controlling interest in a subsidiary in consolidated financial statements subsequent to a business combination. These sections are similar to the corresponding provisions of IFRS standard, International Accounting Standards 27 (Revised), “Consolidated and Separate Financial Statements” and of U.S. GAAP standard, ASC Topic 810, “Consolidation”. Section 1602 requires the Company to report non-controlling interests as a separate component of shareholders equity rather than as a liability on the consolidated balance sheets. Transactions between an entity and non-controlling interests are considered as equity transactions. In addition, the attribution of net earnings and comprehensive income between the Company’s shareholders and non-controlling interests is presented separately in the consolidated statements of earnings and comprehensive income rather than reflecting non-controlling interests as a deduction of net earnings and total comprehensive income.
In accordance with the transitional provisions, these sections have been applied prospectively, with the exception of the presentation requirements for non-controlling interest, which must be applied retrospectively. The adoption of these sections change the accounting of the business combination realized in fiscal year 2010 for which acquisition-related and integration costs of $20,883,000 with associated income tax expense of $3,688,000 were recorded directly in the consolidated statement of earnings (refer to Note 18a). The previously unrecognized future tax assets related to losses carried forward of past acquisitions of $7,378,000 were also recognized as a reduction of income tax expense (refer to Note 18b). In addition, the above-mentioned reclassifications of non-controlling interest have been reflected in the consolidated financial statements and had no significant impact. The effects on future periods will depend on the nature and significance of the business combinations subject to these standards.
b) In June 2009, the CICA amended Section 3862 “Financial Instruments — Disclosures” to adopt the amendments proposed by the International Accounting Standards Board (“IASB”) to IFRS 7 “Financial Instruments: Disclosures”. The amendments were made to enhance disclosure requirements about the liquidity risk and fair value measurement of financial instruments. The amendments are effective for annual financial statements relating to fiscal years ending after September 30, 2009, and comparative information is not required in the first year of adoption. The Company adopted these amendments in fiscal 2010. The adoption of these amendments had no impact on the consolidated financial statements. The new disclosures are included in Note 26.

CGI GROUP INC 2010 ANNUAL REPORT 49
USE OF ESTIMATESThe preparation of the consolidated financial statements in conformity with Canadian GAAP requires management to make estimates and assumptions that affect the reported amounts of assets, liabilities and shareholders’ equity and disclosure of contingent assets and liabilities at the date of the consolidated financial statements and the reported amounts of revenue and expenses during the reporting period. Because of the use of estimates inherent in the financial reporting process, actual results could differ from those estimates. Significant estimates include, but are not limited to, purchase accounting and goodwill, income taxes, contingencies and other liabilities, revenue recognition, stock based compensation, investment tax credits and government programs and the impairment of long-lived assets and goodwill.
BASIS OF CONSOLIDATIONThe consolidated financial statements include the accounts of the Company and its subsidiaries. All intercompany transactions and balances have been eliminated. The Company accounts for its jointly-controlled investment using the proportionate consolidation method.
REVENUE RECOGNITION, WORK IN PROGRESS AND DEFERRED REVENUEThe Company generates revenue principally through the provision of IT services and BPS.
The IT services include a full range of information technology services, namely: i) outsourcing ii) systems integration and consulting iii) software licenses and iv) provision of maintenance. BPS provides business processing for the financial services sector, as well as other services such as payroll, insurance processing and document management services.
The Company provides services and products under arrangements that contain various pricing mechanisms. The Company recognizes revenue when persuasive evidence of an arrangement exists, services or products have been provided to the client, the fee is fixed or determinable, and collectability is reasonably assured.
The Company’s arrangements often include a mix of the services listed below. If an arrangement involves the provision of multiple elements, the total arrangement value is allocated to each element as a separate unit of accounting if: 1) the delivered item has value to the client on a stand-alone basis; 2) there is objective and reliable evidence of the fair value of the undelivered item; and 3) in an arrangement that includes a general right of return relative to the delivered item, the delivery or performance of the undelivered item is considered probable and substantially in the control of the Company. If these criteria are met, then the total consideration of the arrangement is allocated among the separate units of accounting based on their relative fair values. Fair value is established based on the internal or external evidence of the amount charged for each revenue element. However, some software license arrangements are subject to specific policies as described below in “Software license arrangements”.
In situations where there is fair value for all undelivered elements, but not for the delivered elements, the residual method is used to allocate the arrangement consideration. Under the residual method, the amount of revenue allocated to the delivered elements equals the total arrangement consideration less the aggregate fair value of any undelivered elements.
For all types of arrangements, the appropriate revenue recognition method is applied for each unit of accounting, as described below, based on the nature of the arrangement and the services included in each unit of accounting. All deliverables that do not meet the separation criteria are combined into one unit of accounting and the most appropriate revenue recognition method is applied.
Some of the Company’s arrangements may include client acceptance clauses. Each clause is analyzed to determine whether the earnings process is complete when the service is performed. If uncertainty exists about client acceptance, revenue is not recognized until acceptance occurs. Formal client sign-off is not always necessary to recognize revenue, provided that the Company objectively demonstrates that the criteria specified in the acceptance provisions are satisfied. Some of the criteria reviewed include the historical experience with similar types of arrangements, whether the acceptance provisions are specific to the client or are included in all arrangements, the length of the acceptance term and the historical experience with the specific client.
Provisions for estimated contract losses, if any, are recognized in the period in which the loss is determined. Contract losses are measured at the amount by which the estimated total costs exceed the estimated total revenue from the contract.
Outsourcing and BPS arrangementsRevenue from outsourcing and BPS arrangements under time and materials and unit-priced arrangements are recognized as the services are provided at the contractually stated price. If the contractual per-unit prices within a unit-priced contract change during the term of the arrangement, the Company evaluates whether it is more appropriate to record revenue based on the average per-unit price during the term of the contract or based on the actual amounts billed.
Revenue from outsourcing and BPS arrangements under fixed-fee arrangements is recognized on a straight-line basis over the term of the arrangement, regardless of the amounts billed, unless there is a better measure of performance or delivery.

50 2010 ANNUAL REPORT CGI GROUP INC
Note 2 Summary of significant accounting policies (continued)
Systems integration and consulting servicesRevenue from systems integration and consulting services under time and material arrangements is recognized as the services are rendered, and revenue under cost-based arrangements is recognized as reimbursable costs are incurred.
Revenue from systems integration and consulting services under fixed-fee arrangements and software licenses arrangements where the implementation services are essential to the functionality of the software or where the software requires significant customization are recognized using the percentage-of-completion method over the implementation period. The Company uses the labour costs or labour hours incurred to date to measure the progress towards completion. This method relies on estimates of total expected labour costs or total expected labour hours to complete the service, which are compared to labour costs or labour hours incurred to date, to arrive at an estimate of the percentage of revenue earned to date. Management regularly reviews underlying estimates of total expected labour costs or hours. Revisions to estimates are reflected in the statement of earnings in the period in which the facts that gave rise to the revision become known.
Revenue from systems integration and consulting services under benefits-funded arrangements is recognized only to the extent it can be predicted, with reasonable certainty, that the benefit stream will generate amounts sufficient to fund the value on which revenue recognition is based.
Software license arrangementsMost of the Company’s software license arrangements are accounted for as described above in “Systems integration and consulting services”. In addition, the Company has software license arrangements that do not include implementation services that are essential to the functionality of the software or software that requires significant customization, but that may involve the provision of multiple elements such as integration and post-contract customer support. For these types of arrangements, revenue from software licenses is recognized upon delivery of software if persuasive evidence of an arrangement exists, collection is probable, the fee is fixed or determinable and vendor-specific objective evidence (“VSOE”) of fair value of an arrangement exists to allocate the total fee to the different elements of an arrangement based on their relative VSOE of fair value. The residual method, as defined above, using VSOE of fair value can be used to allocate the arrangement consideration. VSOE of fair value is established through internal evidence of prices charged for each revenue element when that element is sold separately. Revenue from maintenance services for licenses sold and implemented is recognized ratably over the term of the contract.
Work in progress and deferred revenueAmounts recognized as revenue in excess of billings are classified as work in progress. Amounts received in advance of the delivery of products or performances of services are classified as deferred revenue.
REIMBURSEMENTSReimbursements, including those relating to travel and other out-of-pocket expenses, and other similar third party costs, such as the cost of hardware and software re-sales, are included in revenue, and the corresponding expense is included in costs of services when the Company has assessed that the costs meet the criteria for gross revenue recognition.
CASH AND CASH EQUIVALENTSCash and cash equivalents consist of unrestricted cash and short-term investments having an initial maturity of three months or less.
SHORT-TERM INVESTMENTSShort-term investments, comprised of term deposits, have remaining maturities over three months, but not more than one year, at the date of purchase. Short-term investments are designated as held-for-trading and are carried at fair value.
FUNDS HELD FOR CLIENTS AND CLIENTS’ FUNDS OBLIGATIONSIn connection with the Company’s payroll, tax filing and claims services, the Company collects funds for payment of payroll, taxes and claims, temporarily holds such funds until payment is due, remits the funds to the clients’ employees, appropriate tax authorities or claim holders, files federal and local tax returns, and handles related regulatory correspondence and amendments. The Company presents the funds held for clients and related obligations separately.
CGI GROUP INC 2010 ANNUAL REPORT 51
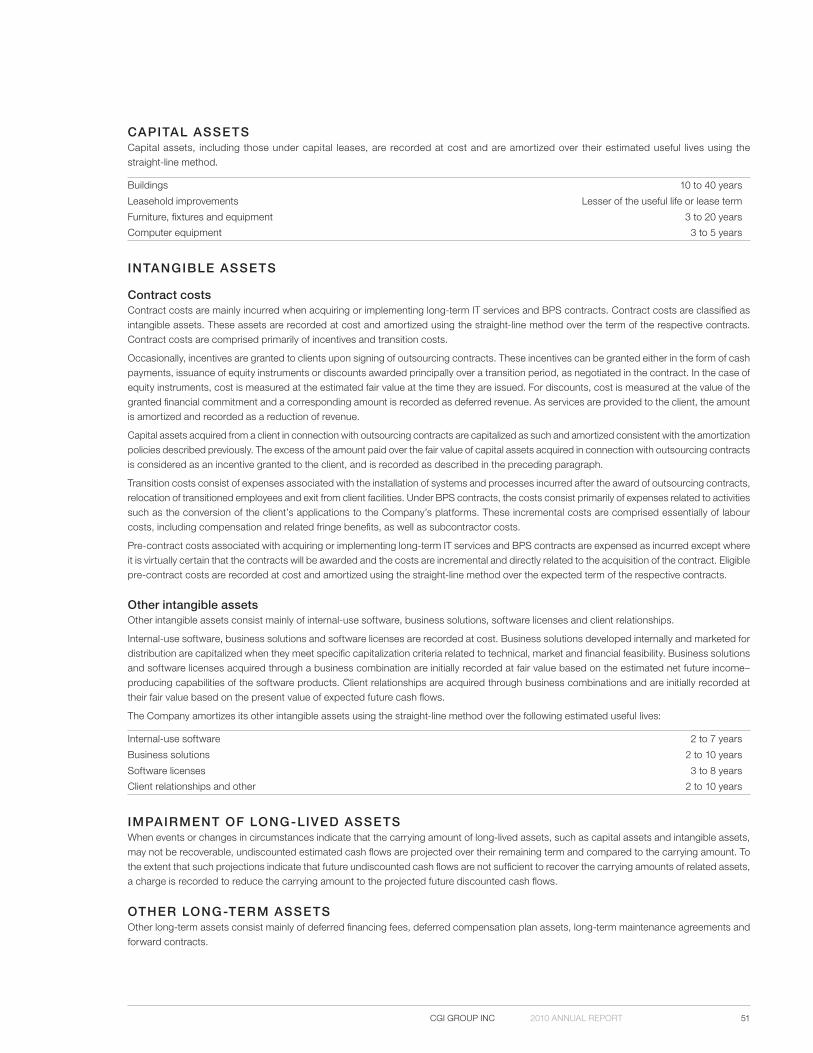
CAPITAL ASSETSCapital assets, including those under capital leases, are recorded at cost and are amortized over their estimated useful lives using the straight-line method.
Buildings 10 to 40 years
Leasehold improvements Lesser of the useful life or lease term
Furniture, fixtures and equipment 3 to 20 years
Computer equipment 3 to 5 years
INTANGIBLE ASSETS
Contract costsContract costs are mainly incurred when acquiring or implementing long-term IT services and BPS contracts. Contract costs are classified as intangible assets. These assets are recorded at cost and amortized using the straight-line method over the term of the respective contracts. Contract costs are comprised primarily of incentives and transition costs.
Occasionally, incentives are granted to clients upon signing of outsourcing contracts. These incentives can be granted either in the form of cash payments, issuance of equity instruments or discounts awarded principally over a transition period, as negotiated in the contract. In the case of equity instruments, cost is measured at the estimated fair value at the time they are issued. For discounts, cost is measured at the value of the granted financial commitment and a corresponding amount is recorded as deferred revenue. As services are provided to the client, the amount is amortized and recorded as a reduction of revenue.
Capital assets acquired from a client in connection with outsourcing contracts are capitalized as such and amortized consistent with the amortization policies described previously. The excess of the amount paid over the fair value of capital assets acquired in connection with outsourcing contracts is considered as an incentive granted to the client, and is recorded as described in the preceding paragraph.
Transition costs consist of expenses associated with the installation of systems and processes incurred after the award of outsourcing contracts, relocation of transitioned employees and exit from client facilities. Under BPS contracts, the costs consist primarily of expenses related to activities such as the conversion of the client’s applications to the Company’s platforms. These incremental costs are comprised essentially of labour costs, including compensation and related fringe benefits, as well as subcontractor costs.
Pre-contract costs associated with acquiring or implementing long-term IT services and BPS contracts are expensed as incurred except where it is virtually certain that the contracts will be awarded and the costs are incremental and directly related to the acquisition of the contract. Eligible pre-contract costs are recorded at cost and amortized using the straight-line method over the expected term of the respective contracts.
Other intangible assetsOther intangible assets consist mainly of internal-use software, business solutions, software licenses and client relationships.
Internal-use software, business solutions and software licenses are recorded at cost. Business solutions developed internally and marketed for distribution are capitalized when they meet specific capitalization criteria related to technical, market and financial feasibility. Business solutions and software licenses acquired through a business combination are initially recorded at fair value based on the estimated net future income–producing capabilities of the software products. Client relationships are acquired through business combinations and are initially recorded at their fair value based on the present value of expected future cash flows.
The Company amortizes its other intangible assets using the straight-line method over the following estimated useful lives:
Internal-use software 2 to 7 years
Business solutions 2 to 10 years
Software licenses 3 to 8 years
Client relationships and other 2 to 10 years
IMPAIRMENT OF LONG-LIVED ASSETSWhen events or changes in circumstances indicate that the carrying amount of long-lived assets, such as capital assets and intangible assets, may not be recoverable, undiscounted estimated cash flows are projected over their remaining term and compared to the carrying amount. To the extent that such projections indicate that future undiscounted cash flows are not sufficient to recover the carrying amounts of related assets, a charge is recorded to reduce the carrying amount to the projected future discounted cash flows.
OTHER LONG-TERM ASSETSOther long-term assets consist mainly of deferred financing fees, deferred compensation plan assets, long-term maintenance agreements and forward contracts.

52 2010 ANNUAL REPORT CGI GROUP INC
Note 2 Summary of significant accounting policies (continued)
BUSINESS COMBINATIONS AND GOODWILLOn October 1, 2009, the Company elected to early adopt prospectively Section 1582 which revised the accounting guidance that the Company was required to apply for past acquisitions done in prior fiscal years. The underlying principles are similar to the previous guidance but introduce certain accounting changes which were described earlier in changes in accounting policies in this note.
The Company accounts for its business combinations using the purchase method of accounting. Under this method, the Company allocates the purchase price to tangible and intangible assets acquired and liabilities assumed based on estimated fair values at the date of acquisition, with the excess of the purchase price amount being allocated to goodwill.
Acquisition-related and integration costs associated to the business combination are expensed as incurred. Changes in estimates associated with future income tax assets after measurement period are recognized as income tax expense with prospective application to all business combinations regardless of the date of acquisition.
Goodwill for each reporting unit is assessed for impairment at least annually, or when an event or circumstance occurs that more likely than not reduces the fair value of a reporting unit below its carrying amount. The Company has designated September 30 as the date for the annual impairment test. An impairment charge is recorded when the carrying amount of the reporting unit exceeds its fair value and is determined as the difference between the goodwill’s carrying amount and its implied fair value.
EARNINGS PER SHAREBasic earnings per share are based on the weighted average number of shares outstanding during the period. Diluted earnings per share is determined using the treasury stock method to evaluate the dilutive effect of stock options.
RESEARCH AND SOFT WARE DEVELOPMENT COSTSResearch costs are charged to earnings in the period in which they are incurred, net of related tax credits. Software development costs are charged to earnings in the year they are incurred, net of related tax credits, unless they meet specific capitalization criteria related to technical, market and financial feasibility.
TA X CREDITSThe Company follows the cost reduction method to account for tax credits. Under this method, tax credits related to operating expenditures are recognized in the period in which the related expenditures are charged to operations, provided there is reasonable assurance of realization. Tax credits related to capital expenditures are recorded as a reduction of the cost of the related asset, provided there is reasonable assurance of realization. The tax credits recorded are based on management’s best estimates of amounts expected to be recovered and are subject to audit by the taxation authorities.
INCOME TA XESIncome taxes are accounted for using the asset and liability method of accounting for income taxes. Future income tax assets and liabilities are determined based on deductible or taxable temporary differences between the amounts reported for financial statement purposes and tax values of assets and liabilities using substantively enacted income tax rates expected to be in effect for the year in which the differences are expected to reverse. A valuation allowance is recorded for the portion of the future income tax assets when its realization is not considered more likely than not.
TRANSL ATION OF FOREIGN CURRENCIESRevenue and expenses denominated in foreign currencies are recorded at the rate of exchange prevailing at the transaction date. Monetary assets and liabilities denominated in foreign currencies are translated at exchange rates prevailing at the balance sheet date. Realized and unrealized translation gains and losses are reflected in net earnings.
Self-sustaining subsidiaries, with economic activities largely independent of the Company, are accounted for using the current rate method. Under this method, assets and liabilities of subsidiaries denominated in a foreign currency are translated into Canadian dollars at exchange rates in effect at the balance sheet date. Revenue and expenses are translated at average exchange rates prevailing during the period. Resulting unrealized gains or losses are reported as net unrealized gains (losses) on translating financial statements of self-sustaining foreign operations in the consolidated statements of comprehensive income.
The accounts of foreign subsidiaries, which are financially or operationally dependent on the Company, are accounted for using the temporal method. Under this method, monetary assets and liabilities are translated at the exchange rates in effect at the balance sheet date, and non-monetary assets and liabilities are translated at historical exchange rates. Revenue and expenses are translated at average rates for the period. Translation exchange gains or losses of such subsidiaries are reflected in net earnings.

CGI GROUP INC 2010 ANNUAL REPORT 53
STOCK-BASED COMPENSATIONThe Company uses the fair value based method to account for stock options awarded under its stock option plan. The fair value of stock options is recognized as compensation costs in earnings with a corresponding credit to contributed surplus on a straight line basis over the vesting period of the entire award. The number of stock options expected to vest are estimated on the grant date and subsequently revised on a periodic basis. When stock options are exercised, any consideration paid by employees is credited to capital stock and the recorded fair value of the option is removed from contributed surplus and credited to capital stock.
HEDGING TRANSACTIONSThe Company uses various financial instruments to manage its exposure to fluctuations in foreign currency exchange rates. The Company does not hold or use any derivative instruments for trading purposes.
Cash flow hedges on Senior U.S. unsecured notesEffective December 21, 2007, the Company entered into forward contracts to hedge the contractual principal repayments of the Senior U.S. unsecured notes. The purpose of the hedging transactions is to hedge the risk of variability in functional currency equivalent cash flows associated with the foreign currency debt principal repayments.
The hedges were documented as cash flow hedges and no component of the derivative’s fair value are excluded from the assessment and measurement of hedge effectiveness. The hedge is considered to be highly effective as the terms of the forward contracts coincide with the intended repayment of the two remaining tranches of the debt. The first tranche was repaid in fiscal 2009.
The forward contracts are derivative instruments and, therefore, are recorded at fair value on the balance sheet under other current assets and other long-term assets and the effective portion of the change in fair value of the derivatives is recognized in other comprehensive income (loss). An amount that will offset the related translation gain or loss arising from the remeasurement of the portion of the debt that is designated is reclassified each period from other comprehensive income (loss) to earnings. The forward premiums or discounts on the forward contracts used to hedge foreign currency long-term debt are amortized as an adjustment of interest expense over the term of the forward contracts. Valuation models, such as discounted cash flow analysis using observable market inputs, are utilized to determine the fair values of the forward contracts. Realized and unrealized foreign exchange gains and losses in relation to forward contracts for the year ended September 30, 2010, were not significant. The cash flows of the hedging transaction are classified in the same manner as the cash flows of the position being hedged.
Hedge on net investments in self-sustaining foreign subsidiariesThe Company has designated certain long-term debt as a hedging instrument for a portion of the Company’s net investment in self-sustaining U.S. and European subsidiaries. Foreign exchange translation gains or losses on the net investments and the effective portions of gains or losses on instruments hedging the net investments are recorded in other comprehensive income (loss).
Cash flow hedges on future revenueDuring the year ended September 30, 2010, the Company entered into various foreign currency forward contracts to hedge the variability in the foreign currency exchange rate between the U.S. dollar and the Indian rupee on future U.S. revenue. During the year ended September 30, 2009, the Company entered into various foreign currency forward contracts to hedge the variability in the foreign currency exchange rate between the U.S. dollar and the Indian rupee on future U.S. revenue, and to hedge the variability in the foreign currency exchange rate between the U.S. dollar and the Canadian dollar on future U.S. revenue. The cash flow hedges mature at various dates until 2014.
These hedges were documented as cash flow hedges and no component of the derivative instruments’ fair value is excluded from the assessment and measurement of hedge effectiveness. The forward contracts are derivative instruments, and, therefore, are recorded at fair value on the balance sheet under other current assets, other long-term assets, accrued liabilities or other long-term liabilities. Valuation models, such as discounted cash flow analysis using observable market inputs, are utilized to determine the fair values of the forward contracts.
The effective portion of the change in fair value of the derivative instruments is recognized in other comprehensive income (loss) and the ineffective portion, if any, in the consolidated statement of earnings. The effective portion of the change in fair value of the derivatives is reclassified out of other comprehensive income (loss) into earnings as an adjustment to revenue when the hedged revenue is recognized. The assessment of effectiveness is based on forward rates utilizing the hypothetical derivative method. During fiscal 2010, the Company’s hedging relationships were effective. The cash flows of the hedging transactions are classified in the same manner as the cash flows of the position being hedged.

54 2010 ANNUAL REPORT CGI GROUP INC
Note 2 Summary of significant accounting policies (continued)
FUTURE ACCOUNTING CHANGESIn December 2009, the CICA issued Emerging Issue Committee Abstract (“EIC”) 175, “Revenue Arrangements with Multiple Deliverables”, an amendment to EIC 142, “Revenue Arrangements with Multiple Deliverables”. EIC 175 provides guidance on certain aspects of the accounting for arrangements under which the Company will perform multiple revenue-generating activities. Under the new guidance, when VSOE or third party evidence for deliverables in an arrangement cannot be determined, a best estimate of the selling price is required to separate deliverables and allocate arrangement consideration using the relative selling price method. EIC 175 also includes new disclosure requirements on how the application of the relative selling price method affects the timing and amount of revenue recognition. EIC 175 is effective prospectively, with retrospective adoption permitted, for revenue arrangements entered into or materially modified in fiscal years beginning on or after January 1, 2011. Early adoption is also permitted. Effective October 1, 2010, the Company will early adopt this new EIC, on a prospective basis. The effects on future periods will depend on the nature and significance of the future customer contracts subject to this EIC.
Note 3Cash and cash equivalents
2010 2009
$ $
Cash 27,162 203,160
Cash equivalents 100,662 140,267
127,824 343,427
Note 4Accounts receivable
2010 2009
$ $
Trade 349,349 317,647
Other1 74,577 143,644
423,926 461,291
1 Other accounts receivable include refundable tax credits on salaries related to the Québec Development of E-Business program, Research and Development tax credits in North America and Europe, and other Job and Economic Growth Creation programs available. The tax credits represent approximately $55,758,000 and $124,803,000 of other accounts receivable in 2010 and 2009, respectively.
Effective April 1, 2008, the Company became eligible for the new Development of E-Business refundable tax credit, which replaces prior existing Québec tax credit programs. The fiscal measure enables corporations with an establishment in the province of Québec that carry out eligible activities in the technology sector to obtain a refundable tax credit equal to 30% of eligible salaries, up to a maximum of $20,000 per year per eligible employee until December 31, 2015.
Prior to April 1, 2008, in order to be eligible for the E-Commerce Place, Cité du Multimédia de Montréal, New Economy Centres tax credits, the Company relocated some of its eligible employees to designated locations. Real estate costs for these designated locations are significantly higher than they were at the previous facilities. As at September 30, 2010, the balance outstanding for financial commitments for these real estate locations was $352,362,000 ranging between three months and 13 years. The refundable tax credits for these programs were calculated at rates varying between 35% to 40% on salaries paid in Québec to a maximum range of $12,500 to $15,000 per year per eligible employee.
Note 5Capital assets
2010 2009
CostAccumulated amortization
Net bookvalue Cost
Accumulatedamortization
Net bookvalue
$ $ $ $ $ $
Land and buildings 17,309 4,461 12,848 17,757 3,427 14,330
Leasehold improvements 142,297 76,381 65,916 139,542 68,879 70,663
Furniture, fixtures and equipment 75,990 30,605 45,385 55,953 24,569 31,384
Computer equipment 256,985 143,110 113,875 190,850 94,809 96,041
492,581 254,557 238,024 404,102 191,684 212,418
Capital assets include assets acquired under capital leases totalling $57,101,000 ($37,680,000 in 2009), net of accumulated amortization of $35,533,000 ($17,880,000 in 2009). Amortization expense of capital assets acquired under capital leases was $18,467,000 and $13,213,000 in 2010 and 2009, respectively.

CGI GROUP INC 2010 ANNUAL REPORT 55
Note 6Intangible assets
2010
CostAccumulatedamortization
Net book value
$ $ $
Intangible assets
Contract costs
Incentives 236,750 190,294 46,456
Transition costs 200,154 102,734 97,420
436,904 293,028 143,876
Other intangible assets
Internal-use software 90,704 66,841 23,863
Business solutions 283,799 178,491 105,308
Software licenses 174,412 123,977 50,435
Client relationships and other 426,546 233,274 193,272
975,461 602,583 372,878
1,412,365 895,611 516,754
2009
CostAccumulatedamortization
Net book value
$ $ $
Intangible assets
Contract costs
Incentives 247,146 185,296 61,850
Transition costs 169,087 77,138 91,949
416,233 262,434 153,799
Other intangible assets
Internal-use software 88,128 59,033 29,095
Business solutions 284,341 160,423 123,918
Software licenses 144,861 108,127 36,734
Client relationships and other 341,188 228,959 112,229
858,518 556,542 301,976
1,274,751 818,976 455,775
All intangible assets are subject to amortization. The following table presents the aggregate amount of intangible assets that were acquired or internally developed during the period:
2010 2009 2008
$ $ $
Acquired 166,468 22,965 30,665
Internally developed 49,193 44,181 40,257
215,661 67,146 70,922
Amortization expense of other intangible assets included in the consolidated statements of earnings is as follows:
2010 2009 2008
$ $ $
Internal-use software 11,121 12,963 12,307
Business solutions 26,322 33,444 34,367
Software licenses 18,726 16,674 17,997
Client relationships and other 36,676 37,748 37,121
Amortization of other intangible assets (Note 14) 92,845 100,829 101,792
Amortization expense of contract costs is presented in Note 14.
56 2010 ANNUAL REPORT CGI GROUP INC
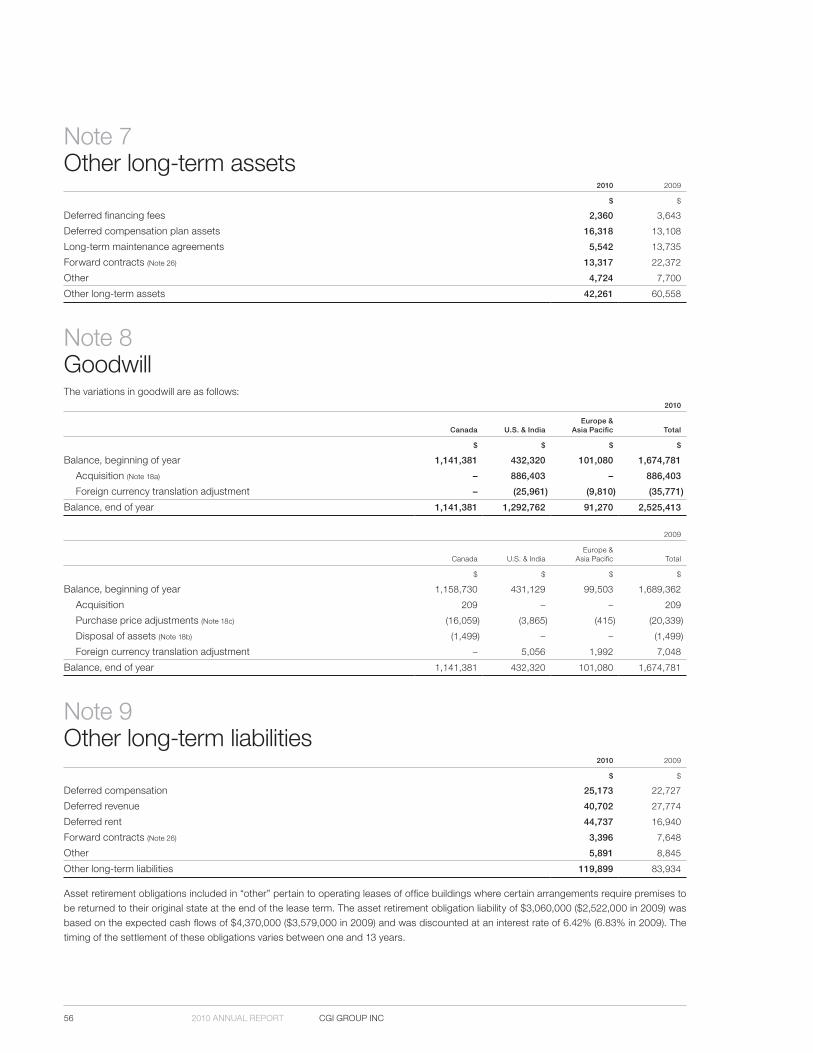
Note 7Other long-term assets
2010 2009
$ $
Deferred financing fees 2,360 3,643
Deferred compensation plan assets 16,318 13,108
Long-term maintenance agreements 5,542 13,735
Forward contracts (Note 26) 13,317 22,372
Other 4,724 7,700
Other long-term assets 42,261 60,558
Note 8GoodwillThe variations in goodwill are as follows:
2010
Canada U.S. & IndiaEurope &
Asia Pacific Total
$ $ $ $
Balance, beginning of year 1,141,381 432,320 101,080 1,674,781
Acquisition (Note 18a) – 886,403 – 886,403
Foreign currency translation adjustment – (25,961) (9,810) (35,771)
Balance, end of year 1,141,381 1,292,762 91,270 2,525,413
2009
Canada U.S. & IndiaEurope &
Asia Pacific Total
$ $ $ $
Balance, beginning of year 1,158,730 431,129 99,503 1,689,362
Acquisition 209 – – 209
Purchase price adjustments (Note 18c) (16,059) (3,865) (415) (20,339)
Disposal of assets (Note 18b) (1,499) – – (1,499)
Foreign currency translation adjustment – 5,056 1,992 7,048
Balance, end of year 1,141,381 432,320 101,080 1,674,781
Note 9Other long-term liabilities
2010 2009
$ $
Deferred compensation 25,173 22,727
Deferred revenue 40,702 27,774
Deferred rent 44,737 16,940
Forward contracts (Note 26) 3,396 7,648
Other 5,891 8,845
Other long-term liabilities 119,899 83,934
Asset retirement obligations included in “other” pertain to operating leases of office buildings where certain arrangements require premises to be returned to their original state at the end of the lease term. The asset retirement obligation liability of $3,060,000 ($2,522,000 in 2009) was based on the expected cash flows of $4,370,000 ($3,579,000 in 2009) and was discounted at an interest rate of 6.42% (6.83% in 2009). The timing of the settlement of these obligations varies between one and 13 years.

CGI GROUP INC 2010 ANNUAL REPORT 57
Note 10Long-term debt
2010 2009
$ $
Senior U.S. unsecured notes, bearing a weighted average interest rate of 5.27% and repayable by payments of $89,593 (US$87,000) in 2011 and $20,596 (US$20,000) in 2014, less imputed interest of $2901 109,899 114,061
Unsecured committed revolving term facility bearing interest at LIBOR rate plus 0.63% or bankers’ acceptance rate plus 0.63%, maturing in 20122 964,223 126,043
Obligations bearing a weighted average interest rate of 4.00% and repayable in blended monthly instalments maturing at various dates until 2018 22,049 5,879
Obligations under capital leases, bearing a weighted average interest rate of 4.89% and repayable in blended monthly instalments maturing at various dates until 2018 57,705 37,147
1,153,876 283,130
Current portion 114,577 17,702
1,039,299 265,428
1 As at September 30, 2010, the private placement financing with U.S. institutional investors is comprised of two remaining tranches of Senior U.S. unsecured notes maturing in January 2011 and 2014 for a total amount of US$107,000,000. On January 29, 2009, the Company repaid the first tranche in the amount of US$85,000,000 and settled the related forward contracts taken to manage the Company’s exposure to fluctuations in the foreign exchange rate resulting in a cash inflow of $18,318,000. The Senior U.S. unsecured notes contain covenants that require the Company to maintain certain financial ratios (Note 27). At September 30, 2010, the Company is in compliance with these covenants.
2 The Company has a five-year unsecured revolving credit facility available for an amount of $1,500,000,000 that expires in August 2012 bearing interest at LIBOR plus a variable margin that is determined based on leverage ratios. As at September 30, 2010, an amount of $964,223,000 has been drawn upon this facility (Note 26). Also an amount of $15,846,000 has been committed against this facility to cover various letters of credit issued for clients and other parties. In addition to the revolving credit facility, the Company has available demand lines of credit in the amount of $25,000,000. At September 30, 2010, no amount had been drawn upon these facilities. The revolving credit facility contains covenants that require the Company to maintain certain financial ratios (Note 27). At September 30, 2010, the Company is in compliance with these covenants. The Company also has a proportionate share of a revolving demand credit facility related to the joint venture for an amount of $2,500,000 bearing interest at the Canadian prime rate. As at September 30, 2010, no amount has been drawn upon this facility.
Principal repayments on long-term debt over the forthcoming years are as follows:
$
2011 95,169
2012 968,636
2013 4,750
2014 24,308
2015 1,917
Thereafter 1,391
Total principal payments on long-term debt 1,096,171
Minimum capital lease payments are as follows:Principal Interest Payment
$ $ $
2011 19,408 2,441 21,849
2012 17,308 1,440 18,748
2013 10,456 578 11,034
2014 5,850 276 6,126
2015 3,188 68 3,256
Thereafter 1,495 – 1,495
Total minimum capital lease payments 57,705 4,803 62,508

58 2010 ANNUAL REPORT CGI GROUP INC
Note 11Capital stockAuthorized, an unlimited number without par value:
First preferred shares, carrying one vote per share, ranking prior to second preferred shares, Class A subordinate shares and Class B shares with respect to the payment of dividends;
Second preferred shares, non-voting, ranking prior to Class A subordinate shares and Class B shares with respect to the payment of dividends;
Class A subordinate shares, carrying one vote per share, participating equally with Class B shares with respect to the payment of dividends and convertible into Class B shares under certain conditions in the event of certain takeover bids on Class B shares;
Class B shares, carrying ten votes per share, participating equally with Class A subordinate shares with respect to the payment of dividends, convertible at any time at the option of the holder into Class A subordinate shares.
For 2010, 2009 and 2008, the Class A subordinate and the Class B shares varied as follows:
Class A subordinate shares Class B shares Total
NumberCarrying
value NumberCarrying
value NumberCarrying
value
$ $ $
Balance, September 30, 2007 290,545,715 1,321,305 34,208,159 47,724 324,753,874 1,369,029
Repurchased and cancelled1 (20,488,168) (90,748) – – (20,488,168) (90,748)
Repurchased and not cancelled1 – (847) – – – (847)
Issued upon exercise of options2 4,107,823 42,238 – – 4,107,823 42,238
Balance, September 30, 2008 274,165,370 1,271,948 34,208,159 47,724 308,373,529 1,319,672
Repurchased and cancelled1 (9,708,292) (44,272) – – (9,708,292) (44,272)
Issued upon exercise of options2 2,221,032 22,870 – – 2,221,032 22,870
Conversion of shares3 600,000 837 (600,000) (837) – –
Balance, September 30, 2009 267,278,110 1,251,383 33,608,159 46,887 300,886,269 1,298,270
Repurchased and cancelled1 (35,602,085) (168,759) – – (35,602,085) (168,759)
Issued upon exercise of options2 6,008,766 65,558 – – 6,008,766 65,558
Balance, September 30, 2010 237,684,791 1,148,182 33,608,159 46,887 271,292,950 1,195,069
1 On January 27, 2010, the Company’s Board of Directors authorized the renewal of a Normal Course Issuer Bid (“NCIB”) to purchase up to 10% of the public float of the Company’s Class A subordinate shares during the next year. The Toronto Stock Exchange (“TSX”) subsequently approved the Company’s request for approval. The Issuer Bid enables the Company to purchase up to 25,151,058 Class A subordinate shares (26,970,437 in 2009 and 28,502,941 in 2008) for cancellation on the open market through the TSX. The Class A subordinate shares were available for purchase under the Issuer Bid commencing February 9, 2010, until no later than February 8, 2011, or on such earlier date when the Company completes its purchases or elects to terminate the bid. During 2010, the Company repurchased, under the previous and current NCIB, 35,602,085 Class A subordinate shares (9,525,892 in 2009 and 19,910,068 in 2008) for cash consideration of $516,699,000 ($99,881,000 in 2009 and $213,485,000 in 2008). The excess of the purchase price over the carrying value of Class A subordinate shares repurchased, in the amount of $347,940,000 ($55,609,000 in 2009 and $121,890,000 in 2008), was charged to retained earnings.
As at September 30, 2008, 182,400 of the repurchased Class A subordinate shares with a carrying value of $847,000 and a purchase value of $1,817,000 were held by the Company and had been cancelled and paid subsequent to year-end.
2 The carrying value of Class A subordinate shares includes $13,332,000 ($5,253,000 in 2009 and $10,223,000 in 2008) which corresponds to a reduction in contributed surplus representing the value of accumulated compensation cost associated with the options exercised during the year.
3 During the twelve months ended September 30, 2009, a shareholder converted 600,000 Class B shares into 600,000 Class A subordinate shares.

CGI GROUP INC 2010 ANNUAL REPORT 59
Note 12Stock-based compensation plans and contributed surplusA) STOCK OPTIONSUnder the Company’s stock option plan, the Board of Directors may grant, at its discretion, options to purchase Class A subordinate shares to certain employees, officers, directors and consultants of the Company and its subsidiaries. The exercise price is established by the Board of Directors and is equal to the closing price of the Class A subordinate shares on the TSX on the day preceding the date of the grant. Options generally vest one to three years from the date of grant conditionally upon the achievement of objectives and must be exercised within a ten-year period, except in the event of retirement, termination of employment or death. As at September 30, 2010, 52,002,178 Class A subordinate shares have been reserved for issuance under the stock option plan.
The following table presents information concerning all outstanding stock options granted by the Company for the years ended September 30:
2010 2009 2008
Number ofoptions
Weighted average exercise price
per shareNumber of
options
Weighted average exercise price
per shareNumber of
options
Weighted average exercise price
per share
$ $ $
Outstanding, beginning of year 28,883,835 9.16 26,757,738 9.34 24,499,886 8.52
Granted 8,413,586 12.58 8,448,453 9.32 7,798,388 11.39
Exercised (6,008,766) 8.69 (2,221,032) 7.93 (4,107,823) 7.79
Forfeited (3,734,542) 9.65 (3,863,746) 11.16 (1,094,052) 10.65
Expired (998,630) 15.91 (237,578) 14.11 (338,661) 12.20
Outstanding, end of year 26,555,483 10.03 28,883,835 9.16 26,757,738 9.34
Exercisable, end of year 14,116,392 8.60 18,087,166 8.75 19,398,753 8.56
The following table summarizes information about outstanding stock options granted by the Company as at September 30, 2010:
Options outstanding Options exercisable
Range of exercise price
Number of options
Weightedaverage
remaining contractual
life (years)
Weighted average exercise
priceNumber of
options
Weighted average exercise
price
$ $ $
2.06 to 5.20 10,729 0.51 2.57 10,729 2.57
6.05 to 6.98 2,255,941 4.48 6.48 2,255,941 6.48
7.00 to 7.87 3,408,828 4.57 7.74 3,408,828 7.74
8.00 to 8.99 4,417,145 3.43 8.62 4,417,145 8.62
9.05 to 9.90 4,832,132 7.50 9.34 1,692,713 9.40
10.05 to 11.80 3,566,872 6.99 11.37 2,284,340 11.35
12.54 to 13.26 7,964,939 9.01 12.55 10,799 13.26
14.48 to 15.58 98,897 9.54 14.98 35,897 9.55
26,555,483 6.58 10.03 14,116,392 8.60
The following table presents the weighted average assumptions used to determine the stock-based compensation cost recorded in cost of services, selling and administrative expenses using the Black-Scholes option pricing model for the years ended September 30:
2010 2009 2008
Stock-based compensation costs ($) 15,517 8,617 5,131
Dividend yield (%) 0.00 0.00 0.00
Expected volatility (%) 27.32 24.42 23.70
Risk-free interest rate (%) 2.48 3.05 4.09
Expected life (years) 5.00 5.00 5.00
Weighted average grant date fair value ($) 3.63 2.59 3.37

60 2010 ANNUAL REPORT CGI GROUP INC
Note 12 Stock-based compensation plans and contributed surplus (continued)
B) PERFORMANCE SHARE UNITS (PSUs)On September 28, 2010, the Company adopted a PSU plan for senior executives and other key employees (“participants”). Under that plan, the Board of Directors may grant PSUs to participants which entitles them to receive one Class A subordinate share for each PSU. The vesting and performance conditions are determined by the Board of Directors at the time of each grant. PSUs must be exercised within three years following the end of the Company’s fiscal year during which the award is made, except in the event of retirement, termination of employment or death.
There was no grant under this plan in fiscal year 2010.
C) CONTRIBUTED SURPLUSThe following table summarizes the contributed surplus activity since September 30, 2007:
$
Balance, September 30, 2007 82,465
Compensation cost associated with exercised options (Note 11) (10,223)
Stock-based compensation costs 5,131
Balance, September 30, 2008 77,373
Compensation cost associated with exercised options (Note 11) (5,253)
Stock-based compensation costs 8,617
Balance, September 30, 2009 80,737
Compensation cost associated with exercised options (Note 11) (13,332)
Stock-based compensation costs 15,517
Balance, September 30, 2010 82,922
Note 13Earnings per shareThe following table sets forth the computation of basic and diluted earnings per share from continuing operations attributable to shareholders of the Company for the years ended September 30:
2010 2009 2008
Earnings from
continuingoperations
Weighted average
number ofshares
outstanding1
Earnings per share
fromcontinuingoperations
Earnings from
continuingoperations
Weighted average
number ofshares
outstanding1
Earnings per share
fromcontinuingoperations
Earnings from
continuingoperations
Weighted average
number ofshares
outstanding1
Earnings per share
fromcontinuingoperations
$ $ $ $ $ $
362,386 284,826,257 1.27 315,158 306,853,077 1.03 298,266 317,604,899 0.94
Dilutive options2 8,093,693 3,492,164 5,199,388
362,386 292,919,950 1.24 315,158 310,345,241 1.02 298,266 322,804,287 0.92
1 The 35,602,085 Class A subordinate shares repurchased during the year (9,525,892 in 2009 and 19,910,068 in 2008), were excluded from the calculation of weighted average number of shares outstanding as of the date of repurchase.
2 The calculation of the diluted earnings per share excluded 8,029,590, 13,384,651 and 8,764,136 options for the years ended September 30, 2010, 2009 and 2008, respectively, as they were anti-dilutive.

CGI GROUP INC 2010 ANNUAL REPORT 61
Note 14Amortization
2010 2009 2008
$ $ $
Amortization of capital assets 72,067 61,412 43,455
Amortization of intangible assets
Contract costs related to transition costs 30,396 22,377 17,925
Other intangible assets (Note 6) 92,845 100,829 101,792
Impairment of other intangible assets1 – 11,143 –
195,308 195,761 163,172
Amortization of contract costs related to incentives (presented as reduction of revenue) 23,149 21,043 21,682
Amortization of deferred financing fees (presented in interest on long-term debt) 1,283 1,283 1,266
219,740 218,087 186,120
1 The impairment of other intangible assets relates to certain assets that were no longer expected to provide future value.
Note 15Accumulated other comprehensive loss
Balance, as atOctober 1,
2009
Net changesduring
the year
Balance, as atSeptember 30,
2010
$ $ $
Net unrealized losses on translating financial statements of self-sustaining foreign operations (net of accumulated income tax recovery of $12,686) (359,423) (53,598) (413,021)
Net unrealized gains on translating long-term debt designated as a hedge of net investments in self-sustaining foreign operations (net of accumulated income tax expense of $14,347) 61,000 15,806 76,806
Net unrealized gains on cash flow hedges (net of accumulated income tax expense of $5,336) 12,433 2,036 14,469
(285,990) (35,756) (321,746)
Balance, as atOctober 1,
2008
Net changesduring
the year
Balance, as atseptember 30,
2009
$ $ $
Net unrealized losses on translating financial statements of self-sustaining foreign operations (net of accumulated income tax recovery of $10,464) (365,672) 6,249 (359,423)
Net unrealized gains on translating long-term debt designated as a hedge of net investments in self-sustaining foreign operations (net of accumulated income tax expense of $11,623) 45,261 15,739 61,000
Net unrealized gains on cash flow hedges (net of accumulated income tax expense of $4,422) (1,013) 13,446 12,433
(321,424) 35,434 (285,990)

62 2010 ANNUAL REPORT CGI GROUP INC
Note 15 Accumulated other comprehensive loss (continued)
Balance, as atOctober 1,
2007
Net changesduring
the year
Balance, as atseptember 30,
2008
$ $ $
Net unrealized losses on translating financial statements of self-sustaining foreign operations (net of accumulated income tax recovery of $7,029) (431,872) 66,200 (365,672)
Net unrealized gains on translating long-term debt designated as a hedge of net investment in self-sustaining foreign operations (net of accumulated income tax expense of $8,748) 45,799 (538) 45,261
Net unrealized losses on cash flow hedges (net of accumulated income tax recovery of $187) – (1,013) (1,013)
(386,073) 64,649 (321,424)
For the year ended September 30, 2010, $8,359,000 of the net unrealized gains previously recognized in other comprehensive income (net of income taxes of $3,746,000) were reclassified to net earnings for derivatives designated as cash flow hedges ($928,000 net of income taxes of $478,000 for the year ended September 30, 2009, and nil for the year ended September 30, 2008).
Note 16Income taxesFuture income taxes are classified as follows:
2010 2009
$ $
Current future income tax assets 16,509 15,110
Long-term future income tax assets 11,592 10,173
Current future income tax liabilities (26,423) (50,250)
Long-term future income tax liabilities (170,683) (171,697)
Future income taxes, net (169,005) (196,664)
The income tax expense is as follows:
2010 2009 2008
$ $ $
Current 136,387 95,923 128,972
Future (21,417) 29,300 (22,675)
114,970 125,223 106,297
The Company’s effective income tax rate on income from continuing operations differs from the combined Federal and Provincial Canadian statutory tax rate as follows:
2010 2009 2008
% % %
Company’s statutory tax rate 30.2 30.9 31.2
Effect of foreign tax rate differences 0.3 – (0.6)
Final determination from agreements with tax authorities and expirations of statutes of limitations (7.9) (3.9) (3.7)
Non-deductible and tax exempt items 1.7 1.3 0.8
Impact on future tax assets and liabilities resulting from tax rate changes (0.3) – (1.7)
Tax benefits on losses 0.1 0.1 0.2
Effective income tax rate 24.1 28.4 26.2

CGI GROUP INC 2010 ANNUAL REPORT 63
Future income tax assets and liabilities are as follows at September 30:2010 2009
$ $
Future income tax assets:
Accounts payable and accrued liabilities 14,074 11,316
Tax benefits on losses carried forward 14,667 10,171
Capital assets, intangible assets and other long-term liabilities 20,482 17,197
Accrued compensation 28,397 23,414
Unrealized losses on cash flow hedges 1,585 3,395
Allowance for doubtful accounts 1,793 3,107
Other 1,612 2,433
82,610 71,033
Valuation allowance (4,346) (6,818)
78,264 64,215
Future income tax liabilities:
Capital assets, intangible assets and other long-term assets 161,988 161,008
Work in progress 25,165 22,395
Goodwill 27,774 25,276
Refundable tax credits on salaries 20,985 40,233
Unrealized gain on cash flow hedges 6,908 7,478
Other 4,449 4,489
247,269 260,879
Future income taxes, net (169,005) (196,664)
At September 30, 2010, the Company had $46,419,000 in non-capital losses carried forward, of which $13,053,000 expire at various dates up to 2030 and $33,366,000 have no expiry dates. The Company recognized a future tax asset of $14,667,000 on the losses carried forward and recognized a valuation allowance of $4,346,000. The decrease in the valuation allowance mainly results from the expiry of non capital losses. The resulting net future income tax asset of $10,321,000 is the amount that is more likely than not to be realized.
Foreign earnings of certain of the Company’s subsidiaries would be taxed only upon their repatriation to Canada. The Company has not recognized a future income tax liability for these retained earnings as management does not expect them to be repatriated. A future income tax liability will be recognized when the Company expects that it will recover those undistributed earnings in a taxable matter, such as the sale of the investment or through the receipt of dividends. On remittance, certain countries impose withholding taxes that, subject to certain limitations, are then available for use as tax credits against a federal or provincial income tax liability, if any.
Note 17Costs of services, selling and administrativeTax credits netted against costs of services, selling and administrative expenses are as follows:
2010 2009 2008
$ $ $
Costs of services, selling and administrative 3,116,425 3,268,995 3,193,270
Tax credits (90,602) (98,589) (82,510)
3,025,823 3,170,406 3,110,760

64 2010 ANNUAL REPORT CGI GROUP INC
Note 18Investments in subsidiariesFor all business acquisitions, the Company records the results of operations of the acquired entities as of their respective effective acquisition dates.
2010 TRANSACTIONS
a) AcquisitionThe Company made the following acquisition:
– Stanley, Inc. (“Stanley”) — On August 17, 2010, the Company acquired all outstanding shares of Stanley, a provider of information technology services and solutions to U.S. defence, intelligence and federal civilian government agencies, for a total cash consideration of $923,150,000. The acquisition was financed through a withdrawal from the Company’s existing unsecured revolving credit facility and cash on hand of $832,160,000 and $90,990,000, respectively. Stanley’s operations will increase the scale and capabilities of the Company to serve the U.S. Federal Government expanding the offering into the defence and intelligence space.
The acquisition was accounted for using the purchase method. The purchase price allocation shown below is preliminary and based on the Company’s management’s best estimates. The final purchase price allocations are expected to be completed as soon as Company’s management has gathered all of the significant information available and considered necessary in order to finalize this allocation.
Stanley
$
Current assets1 163,648
Capital assets 9,005
Intangible assets 123,897
Goodwill2 886,403
Other long-term assets 3,167
Future income taxes 3,564
Current liabilities (176,110)
Debt, classified as current (102,262)
Other long-term liabilities (11,748)
899,564
Cash acquired 23,586
Net assets acquired 923,150
Cash consideration 923,150
1 The current assets include accounts receivable with a fair value of $97,967,000 which approximates the gross amount due under the contracts.2 The goodwill arising from the acquisition mainly represents the future economic value associated to acquired work force and synergies with the Company’s operations. All of the
goodwill is included in the U.S. and India segment and $26,323,000 is deductible for tax purposes.

CGI GROUP INC 2010 ANNUAL REPORT 65
In connection with the acquisition of Stanley, the Company expensed $20,883,000 during the year ended September 30, 2010. Included in that amount are acquisition-related costs of $11,573,000 and integration costs of $9,310,000. The acquisition-related costs consist mainly of professional fees incurred for the acquisition. The integration costs mainly include provisions related to leases for premises occupied by the acquired business, which the Company vacated, as well as costs related to the termination of certain employees of the acquired business performing functions already available through its existing structure. The acquisition-related and integration costs are separately disclosed in the Company’s consolidated statement of earnings.
Stanley’s revenue in the year ended September 30, 2010 represents approximately 3% of the total consolidated revenue of the Company. Stanley’s net earnings in the year ended September 30, 2010 is not significant. On a pro-forma basis, the revenue and net earnings of the combined Company for the year ended September 30, 2010 would have been approximately $4,556,000,000 and $411,000,000 respectively, had the Stanley acquisition occurred as of October 1, 2009. The pro forma financial information was constructed using the Company’s 2010 annual results and Stanley’s results from July 1, 2009 to June 30, 2010 due to the differences in reporting periods and includes business combination adjustments such as amortization of acquired intangible assets, interest expense on borrowings, elimination of acquisition-related and integration costs and related tax effects. The pro-forma financial information does not reflect synergies or changes to historical transactions and is not necessarily indicative of the results of operations of the Company that would have resulted had the acquisition actually occurred on October 1, 2009, or the results that may be obtained in the future.
b) Business combination adjustmentsCertain unrecorded future income tax assets acquired from past acquisitions were recognized during the year ended September 30, 2010, resulting in a corresponding decrease in income tax expense of $7,378,000. The transitional rules of the new Section 1582 require that a change in recognized acquired future income tax assets arising from past business combinations be recorded through the income tax expense. Prior to the adoption of Section 1582, the corresponding decrease would have been applied to the goodwill.
2009 TRANSACTIONS
a) AcquisitionThere were no significant acquisitions during fiscal 2009.
b) DisposalOn February 20, 2009, the Company disposed of its actuarial services business for purchase consideration of $3,780,000 less an estimated working capital adjustment. The Company received $3,565,000 on February 27, 2009. The business was previously included in the Canada segment. As a result of the final agreement, net assets disposed of included goodwill of $1,499,000. The transaction resulted in a gain of $1,494,000.
c) Modifications to purchase price allocationsDuring the year ended September 30, 2009, the Company modified the purchase price allocation and made adjustments relating to certain business acquisitions, resulting in a net decrease of accounts payable and accrued liabilities of $969,000 and a net increase of future income tax liabilities of $338,000, whereas goodwill decreased by $631,000.
Additionally, certain unrecorded future income tax assets acquired from past acquisitions were recognized during the year ended September 30, 2009, resulting in a corresponding decrease in goodwill of $19,708,000.
d) Consideration of purchase priceDuring fiscal 2009, the Company paid a balance of purchase price of $997,000 relating to a business acquisition.

66 2010 ANNUAL REPORT CGI GROUP INC
Note 18 Investments in subsidiaries (continued)
2008 TRANSACTIONS
a) AcquisitionThere were no acquisitions during fiscal 2008.
b) DisposalOn July 19, 2008, the Company disposed of its Canadian claims adjusting and risk management services business for purchase consideration of $38,050,000 which was subject to subsequent adjustments. This business was included in the former BPS segment in prior years. The Company received $31,671,000 in August 2008. Of the remaining balance, $879,000 was received in fiscal year 2009 and $4,100,000 was received in fiscal year 2010 as a final payment. The net assets disposed of included goodwill of $7,732,000, which is net of an impairment of $4,051,000. The transaction resulted in a loss of $2,365,000.
c) Modifications to purchase price allocationsThe Company modified the purchase price allocation and made adjustments relating to certain business acquisitions resulting in a net decrease of accounts payable and accrued liabilities, current portion of long-term debt, long-term debt, future income tax assets and other long-term liabilities of $5,801,000, $3,287,000, $2,685,000, $2,145,000 and $320,000, respectively, and a net increase of cash and non-controlling interest of $43,000 and $75,000, respectively, whereas goodwill decreased by $9,916,000.
d) Consideration of purchase priceDuring fiscal 2008, the Company paid balances of purchase price relating to certain business acquisition resulting in a net decrease of long-term debt by $3,954,000.
Note 19Discontinued operationsIn fiscal 2008, the Company classified its Canadian claims adjusting and risk management services and actuarial services businesses as discontinued operations. The Canadian claims adjusting and risk management services business was divested in July 2008 and the actuarial services business was divested in February 2009 (Note 18b of 2009 Transactions and 2008 Transactions).
The following table presents summarized financial information related to discontinued operations:2010 2009 2008
$ $ $
Revenue – 2,511 64,851
Operating expenses1 – 1,046 68,747
Amortization – 14 1,624
Earnings (loss) before income taxes – 1,451 (5,520)
Income tax expense (recovery)2 – 143 (386)
Earnings (loss) from discontinued operations – 1,308 (5,134)
1 For the year ended September 30, 2009, operating expenses from discontinued operations include a gain on disposition of $1,494,000. For the year ended September 30, 2008, it includes an impairment of goodwill of $4,051,000 and a loss on disposition of $965,000.
2 Income tax expense (recovery) does not bear a normal relation to earnings (loss) before income taxes since the sale includes goodwill of $1,499,000 for the year ended September 30, 2009 ($7,732,000 for the year ended September 30, 2008), which has no tax basis.
The related cash flow information of discontinued operations is as follows:2010 2009 2008
$ $ $
Cash provided by (used in) operating activities – 164 (818)
Cash used in investing activities – (3) (250)
Total cash provided by (used in) discontinued operations – 161 (1,068)

CGI GROUP INC 2010 ANNUAL REPORT 67
Note 20Joint venture: supplementary informationThe Company’s proportionate share of its joint venture investee’s operations included in the consolidated financial statements is as follows:
2010 2009
$ $
Balance sheets
Current assets 38,148 37,608
Non-current assets 2,992 2,998
Current liabilities 15,609 14,721
Non-current liabilities 933 445
2010 2009 2008
$ $ $
Statements of earnings
Revenue 91,015 101,964 87,887
Expenses 79,597 88,552 77,381
Net earnings 11,418 13,412 10,506
2010 2009 2008
$ $ $
Statements of cash flows
Cash provided by (used in):
Operating activities 13,763 25,542 4,879
Investing activities (733) (570) (412)
Financing activities (12,740) (12,250) (13,720)

68 2010 ANNUAL REPORT CGI GROUP INC
Note 21Supplementary cash flow informationa) Net change in non-cash working capital items is as follows for the years ended September 30:
2010 2009 2008
$ $ $
Accounts receivable 125,928 31,749 (13,164)
Work in progress (59,579) (22,450) (43,785)
Prepaid expenses and other current assets 17,933 8,399 (12,692)
Accounts payable and accrued liabilities (46,810) (39,255) 5,762
Accrued compensation (74,443) 38,009 (5,327)
Deferred revenue 22,415 15,194 (13,323)
Income taxes (8,386) 25,974 (31,357)
(22,942) 57,620 (113,886)
b) Non-cash operating, investing and financing activities related to continuing operations are as follows for the years ended September 30:
2010 2009 2008
$ $ $
Operating activities
Accounts receivable (693) (1,476) 408
Work in progress 2,707 – –
Accounts payable and accrued liabilities – (1,817) (2,723)
Deferred revenue 3,750 4,779 –
5,764 1,486 (2,315)
Investing activities
Purchase of capital assets (42,982) (27,040) (17,559)
Purchase of intangible assets (23,708) (4,779) (13,185)
(66,690) (31,819) (30,744)
Financing activities
Increase in obligations under capital leases 38,200 27,040 17,559
Increase in obligations 22,033 – 13,185
Issuance of shares 693 1,476 (408)
Repurchase of Class A subordinate shares – 1,817 2,723
60,926 30,333 33,059
c) Interest paid and income taxes paid are as follows for the years ended September 30:2010 2009 2008
$ $ $
Interest paid 13,254 16,558 26,847
Income taxes paid 104,724 63,125 139,803

CGI GROUP INC 2010 ANNUAL REPORT 69
Note 22Segmented informationThe Company is managed through three operating segments, in addition to Corporate services, namely: Canada, U.S. & India and Europe & Asia Pacific (Note 8). The segments are based on a delivery view and the results incorporate domestic activities as well as impacts from our delivery model utilizing our centers of excellence.
The following presents information on the Company’s operations based on its management structure.2010
CanadaU.S. &
IndiaEurope &
Asia Pacific Corporate Total
$ $ $ $ $
Segment revenue 2,170,082 1,483,593 242,152 – 3,895,827
Intersegment revenue elimination (57,670) (83,194) (22,846) – (163,710)
Revenue 2,112,412 1,400,399 219,306 – 3,732,117
Earnings (loss) from continuing operations before acquisition-related and integration costs, interest on long-term debt, interest income, other (income) expense, gain on sale of capital assets and income tax expense1 375,998 192,305 89 (56,490) 511,902
Total assets 2,083,675 2,166,397 180,780 176,339 4,607,191
1 Amortization included in Canada, U.S. & India, Europe & Asia Pacific and Corporate is $132,073,000, $69,010,000, $5,790,000 and $11,584,000, respectively, for the year ended September 30, 2010.
2009
CanadaU.S. &
IndiaEurope &
Asia Pacific Corporate Total
$ $ $ $ $
Segment revenue 2,216,042 1,421,366 305,417 – 3,942,825
Intersegment revenue elimination (36,383) (59,579) (21,702) – (117,664)
Revenue 2,179,659 1,361,787 283,715 – 3,825,161
Earnings (loss) from continuing operations before acquisition-related and integration costs, interest on long-term debt, interest income, other (income) expense, gain on sale of capital assets and income tax expense1 320,702 171,965 18,639 (50,565) 460,741
Total assets 2,341,074 985,289 197,619 375,928 3,899,910
1 Amortization included in Canada, U.S. & India, Europe & Asia Pacific and Corporate is $116,243,000, $78,819,000, $7,247,000 and $14,495,000, respectively, for the year ended September 30, 2009. Amortization includes an impairment of $11,143,000 mainly related to other intangible assets in the U.S. & India segment.
2008
CanadaU.S. &
IndiaEurope &
Asia Pacific Corporate Total
$ $ $ $ $
Segment revenue 2,356,629 1,137,457 296,745 – 3,790,831
Intersegment revenue elimination (21,063) (50,944) (12,961) – (84,968)
Revenue 2,335,566 1,086,513 283,784 – 3,705,863
Earnings (loss) from continuing operations before acquisition-related and integration costs, interest on long-term debt, interest income, other (income) expense, gain on sale of capital assets and income tax expense1 332,827 129,401 24,692 (56,434) 430,486
Total assets 2,274,589 1,113,303 197,900 94,766 3,680,558
1 Amortization included in Canada, U.S. & India, Europe & Asia Pacific and Corporate is $111,903,000, $54,358,000, $5,069,000 and $13,524,000, respectively, for the year ended September 30, 2008.
The accounting policies of each operating segment are the same as those described in the summary of significant accounting policies (Note 2). Intersegment revenue is priced as if the revenue was from third parties.

70 2010 ANNUAL REPORT CGI GROUP INC
Note 22 Segmented information (continued)
GEOGRAPHIC INFORMATIONThe following table provides information for capital assets based on their location:
2010 2009
$ $
Capital assets
Canada 161,993 155,072
U.S. 59,306 40,528
Other 16,725 16,818
238,024 212,418
The geographic revenue information based on client’s location approximates the revenue presented under the operating segments.
INFORMATION ABOUT SERVICESThe following table provides revenue information based on services provided by the Company:
2010 2009 2008
$ $ $
Outsourcing IT Services 1,870,804 1,817,943 1,523,562
BPS 412,341 405,516 485,454
Systems integration and consulting 1,448,972 1,601,702 1,696,847
3,732,117 3,825,161 3,705,863
MAJOR CUSTOMER INFORMATIONContracts with the U.S. federal government and its various agencies accounted for $510,786,000 of revenues included within the U.S. & India segment for the year ending September 30, 2010 ($394,436,000 and $360,926,000 for the years ending September 30, 2009 and 2008, respectively).
Note 23Related party transactionsIn the normal course of business, the Company is party to contracts with Innovapost, a joint venture, pursuant to which the Company is its preferred IT supplier. The Company exercises joint control over Innovapost’s operating, financing and investing activities through its 49% ownership interest.
Transactions and resulting balances, which were measured at commercial rates (exchange amount), are presented below.
Revenue was $81,760,000, $108,139,000 and $124,461,000 for the years ending September 30, 2010, 2009 and 2008, respectively.
2010 2009
$ $
Accounts receivable 681 10,542
Work in progress 1,076 5,937
Contract costs 6,210 8,706
Deferred revenue 1,012 3,351

CGI GROUP INC 2010 ANNUAL REPORT 71
Note 24Employee future benefitsGenerally, the Company does not offer pension plan or post-retirement benefits to its employees with the exception of the following:
– The Company has defined contribution pension plans mainly covering certain European employees. For the years ended September 30, 2010, 2009 and 2008, the plan expense was $5,343,000, $5,053,000 and $5,303,000, respectively.
– The Company maintains a 401(k) defined contribution plan covering substantially all U.S. employees. Since January 1, 2008, the Company matches employees’ contributions to a maximum of US$2,500 per year. Prior to that date, the maximum was US$1,000 per year. For the years ended September 30, 2010, 2009 and 2008, the amounts of the Company’s contributions were $8,212,000, $7,557,000 and $5,069,000, respectively.
– The Company maintains two non-qualified deferred compensation plans covering some of its U.S. management. One of these plans is an unfunded plan and the non-qualified deferred compensation liability totaled $2,376,000 as at September 30, 2010 ($3,211,000 at September 30, 2009). The other plan is a funded plan for which a trust was established so that the plan assets could be segregated; however, the assets are subject to the Company’s general creditors in the case of bankruptcy. The assets, included in other long-term assets, composed of investments, vary with employees’ contributions and changes in the value of the investments. The change in liability associated with the plan is equal to the change of the assets. The assets in the trust and the associated liabilities totalled $16,318,000 as at September 30, 2010 ($13,108,000 as at September 30, 2009).
– The Company maintains a post-employment benefits plan to cover certain former retired employees associated with the divested Canadian claims adjusting and risk management services business. The post-employment benefits liability totalled $7,008,000 as at September 30, 2010 ($7,201,000 at September 30, 2009). The Company measures its benefits liability as at September 30 of each year. An actuarial valuation was performed at September 30, 2008, and the next actuarial valuation will be as at September 30, 2011.
Note 25Commitments, contingencies and guaranteesA) COMMITMENTSAt September 30, 2010, the Company is committed under the terms of operating leases with various expiration dates up to 2030, primarily for the rental of premises and computer equipment used in outsourcing contracts, in the aggregate amount of approximately $917,834,000. Minimum lease payments due in the next five years and thereafter are as follows:
$
2011 135,003
2012 118,971
2013 104,238
2014 88,739
2015 84,135
Thereafter 386,748
The Company entered into long-term service and other agreements representing a total commitment of $107,721,000. Minimum payments under these agreements due in each of the next five years and thereafter are as follows:
$
2011 54,237
2012 28,730
2013 17,644
2014 5,073
2015 1,409
Thereafter 628
As of April 19, 2007, the Company became committed under the agreement between shareholders of Conseillers en informatique d’affaires (“CIA”) to purchase the remaining shares of CIA by October 1, 2011. As at September 30, 2010, 32.44% of shares of CIA remains to be purchased. The purchase price of the remaining shares will be calculated by a formula as defined in the shareholders’ agreement. If the Company had purchased the remainder of CIA’s shares on September 30, 2010, the consideration would have been approximately $10,363,000.

72 2010 ANNUAL REPORT CGI GROUP INC
Note 25 Commitments, contingencies and guarantees (continued)
B) CONTINGENCIESFrom time to time, the Company is involved in legal proceedings, audits, claims and litigation arising in the ordinary course of its business. Certain of these matters seek damages in significant amounts. Although the outcome of such matters is not predictable with assurance, the Company has no reason to believe that the disposition of any such current matter could reasonably be expected to have a materially adverse impact on the Company’s financial position, results of operations or the ability to carry on any of its business activities.
In addition, the Company is engaged to provide services under contracts with the U.S. Government. The contracts are subject to extensive legal and regulatory requirements and, from time to time, agencies of the U.S. Government investigate whether the Company’s operations are being conducted in accordance with these requirements. Generally, the Government has the right to change the scope of, or terminate, these projects at its convenience. The termination, or reduction in the scope, of a major government project could have a materially adverse effect on the results of operations and financial condition of the Company.
C) GUARANTEES
Sale of assets and business divestituresIn connection with the sale of assets and business divestitures, the Company may be required to pay counterparties for costs and losses incurred as the result of breaches in representations and warranties, intellectual property right infringement and litigation against counterparties. While some of the agreements specify a maximum potential exposure of approximately $14,570,000 in total, others do not specify a maximum amount or limited period. It is impossible to reasonably estimate the maximum amount that may have to be paid under such guarantees. The amounts are dependent upon the outcome of future contingent events, the nature and likelihood of which cannot be determined at this time. No amount has been accrued in the consolidated balance sheets relating to this type of indemnification as at September 30, 2010. The Company does not expect to incur any potential payment in connection with these guarantees that could have a materially adverse effect on its consolidated financial statements.
Other transactionsIn the normal course of business, the Company may provide certain clients, principally governmental entities, with bid and performance bonds. In general, the Company would only be liable for the amount of the bid bonds if the Company refuses to perform the project once the bid is awarded. The Company would also be liable for the performance bonds in the event of default in the performance of its obligations. As at September 30, 2010, the Company provided for a total of $128,161,000 of these bonds. To the best of its knowledge, the Company is in compliance with its performance obligations under all service contracts for which there is a performance or bid bond, and the ultimate liability, if any, incurred in connection with these guarantees would not have a materially adverse effect on the Company’s consolidated results of operations or financial condition.
In addition, the Company provides a guarantee of $5,900,000 of the residual value of a leased property, accounted for as an operating lease, at the expiration of the lease term.

CGI GROUP INC 2010 ANNUAL REPORT 73
Note 26Financial instrumentsFAIR VALUEAll financial assets classified as held-to-maturity or loans and receivables, as well as financial liabilities classified as other liabilities, are initially measured at their fair values and subsequently at their amortized cost using the effective interest rate method. All financial assets and liabilities classified as held for trading are measured at their fair values. Gains and losses related to periodic revaluations are recorded in net earnings.
The Company has made the following classifications:
– Cash and cash equivalents (Note 3), short-term investments, and deferred compensation plan assets (Note 24) are designated as held for trading as this reflects management’s intentions.
– Trade accounts receivable (Note 4), work in progress, and funds held for clients are classified as loans and receivables.
– Accounts payable and accrued liabilities, accrued compensation, long-term debt, excluding obligations under capital leases (Note 10), and clients’ funds obligations are classified as other liabilities.
Transaction costs are comprised primarily of legal, accounting and other costs directly attributable to the issuance of the respective financial assets and liabilities. Transaction costs are capitalized to the cost of financial assets and liabilities classified as other than held for trading.
At September 30, 2010 and 2009, the estimated fair values of trade accounts receivable, work in progress, funds held for clients, accounts payable and accrued liabilities, accrued compensation, long-term debt, with the exception of Senior U.S. unsecured notes and the unsecured committed revolving term facility, and clients’ funds obligations approximate their respective carrying values.
The fair values of Senior U.S. unsecured notes and the unsecured committed revolving term facility, estimated by discounting expected cash flows at rates currently offered to the Company for debts of the same remaining maturities and conditions, are $112,937,000 and $941,396,000 at September 30, 2010, respectively, as compared to their carrying value of $109,899,000 and $964,223,000, respectively. At September 30, 2009, the fair value of the Senior U.S. unsecured notes was $116,859,000 as compared to its carrying value of $114,061,000, and the fair value of the revolving term facility approximated its carrying value of $126,043,000 (Note 10).
The following table summarizes the fair value of outstanding hedging instruments:2010 2009
Recorded as $ $
Hedge on net investments in self-sustaining foreign subsidiaries
US$920,000 debt designated as the hedging instrument to the Company’s net investment in U.S. subsidiaries (US$100,000 as at September 30, 2009)
Long term debt 947,416 107,220
€12,000 debt designated as the hedging instrument to the Company’s net investment in European subsidiaries (€12,000 as at September 30, 2009)
Long term debt 16,807 18,823
Cash flow hedges on future revenue
US$130,380 foreign currency forward contracts to hedge the variability in the expected foreign currency exchange rate between the U.S. dollar and the Canadian dollar (US$192,660 as at September 30, 2009)
Other current assetsOther long-term assets
8,91811,433
8,30316,148
US$44,820 foreign currency forward contracts to hedge the variability in the expected foreign currency exchange rate between the U.S. dollar and the Indian rupee (US$62,940 as at September 30, 2009)
Other current assetsOther long-term assets
Other long-term liabilities
2,3781,121
–
1,495488
78
$89,040 foreign currency forward contracts to hedge the variability in the expected foreign currency exchange rate between the Canadian dollar and the Indian rupee ($110,315 as at September 30, 2009)
Accrued liabilitiesOther long-term liabilities
1,5703,396
2,0057,570
Cash flow hedges on Senior U.S. unsecured notes
US$107,000 foreign currency forward contracts (US$107,000 as at September 30, 2009)
Other current assetOther long-term assets
1,277763
–5,736
The Company expects that approximately $11,096,000 of the accumulated net unrealized gains on all derivative financial instruments designated as cash flow hedges at September 30, 2010 will be reclassified in net income in the next 12 months.

74 2010 ANNUAL REPORT CGI GROUP INC
Note 26 Financial instruments (continued)
FAIR VALUE HIERARCHYFair value measurements recognized in the balance sheet are categorized in accordance with the following levels;
Level 1: quoted prices (unadjusted) in active markets for identical assets or liabilities.
Level 2: inputs other than quoted prices included in Level 1 but that are observable for the asset or liability, either directly or indirectly; and
Level 3: inputs for the asset or liability that are not based on observable market data.
The Company categorized the fair value measurement of cash and cash equivalents, short-term investments and deferred compensation plan assets in Level 1. For the cash flow hedges on future revenue and cash flow hedges on Senior U.S. unsecured notes, the Company categorized the fair value measurement in Level 2, as they are primarily derived from observable market inputs.
MARKET RISK ( INTEREST RATE RISK AND CURRENCY RISK )Market risk incorporates a range of risks. Movements in risk factors, such as interest rate risk and currency risk, affect the fair values of financial assets and liabilities.
Interest rate riskThe Company is exposed to interest rate risk on a portion of its long-term debt (Note 10) and does not currently hold any financial instruments that mitigate this risk. The Company analyzes its interest rate risk exposure on an ongoing basis using various scenarios to simulate refinancing or the renewal of existing positions. Based on these scenarios, a change in the interest rate of 1% would not have had a significant impact on net earnings and comprehensive income.
Currency riskThe Company operates internationally and is exposed to risk from changes in foreign currency rates. The Company mitigates this risk principally through foreign debt and forward contracts. The Company enters, from time to time, into foreign exchange forward contracts to hedge forecasted cash flows or contractual cash flows in currencies other than the functional currency of its subsidiaries (Note 2). Hedging relationships are designated and documented at inception and quarterly effectiveness assessments are performed during the year.
The Company is mainly exposed to fluctuations in the U.S. dollar and the euro. As at September 30, 2010, the portion of the cash and cash equivalents, accounts receivable, work in progress, accounts payable and accrued liabilities and accrued compensation denominated in U.S. dollars amount to US$16,427,000, US$184,237,000, US$260,687,000, US$116,353,000 and US$78,340,000, respectively. Additionally, as at September 30, 2010, the portion of the same items denominated in euros amount to €13,881,000, €18,462,000, €943,000, €9,924,000, and €3,237,000, respectively.
The following table details the Company’s sensitivity to a 10% strengthening of the U.S. dollar and the euro foreign currency rates on net earnings and comprehensive income against the Canadian dollar. The sensitivity analysis presents the impact of foreign currency denominated monetary items and adjusts their translation at period end for a 10% strengthening in foreign currency rates. For a 10% weakening of the U.S. dollar and the euro against the Canadian dollar, there would be an equal and opposite impact on net earnings and comprehensive income.
2010 2009
U.S. dollarimpact
Euroimpact
U.S. dollarimpact
Euroimpact
Increase in net earnings 16,485 116 11,739 938
Increase in comprehensive income 161,456 11,130 79,117 12,409
LIQUIDIT Y RISKLiquidity risk is the risk that the Company is not able to meet its financial obligations as they fall due or can do so only at excessive cost. The Company’s activities are financed through a combination of the cash flows from operations, borrowing under existing credit facilities, the issuance of debt and the issuance of equity. One of management’s primary goals is to maintain an optimal level of liquidity through the active management of the assets and liabilities as well as the cash flows.

CGI GROUP INC 2010 ANNUAL REPORT 75
The following table summarizes the carrying amount and the contractual maturities of both the interest and principal portion of significant financial liabilities as at September 30, 2010. All amounts contractually denominated in foreign currency are presented in Canadian dollar equivalent amounts using the period-end spot rate.
Carrying Amount
Contractual cash flows
Less thanone year
Between one and
two years
Between two and
five yearsBeyond5 years
$ $ $ $ $ $
Non-derivative financial liabilities
Accounts payable and accrued liabilities 304,376 304,376 304,376 – – –
Accrued compensation 191,486 191,486 191,486 – – –
Senior U.S. unsecured notes 109,899 116,799 93,113 1,236 22,450 –
Unsecured committed revolving term facility 964,223 977,861 9,092 968,769 – –
Obligations repayable in blended monthly instalments 22,049 23,961 6,292 5,052 11,211 1,406
Clients’ funds obligations 248,695 248,695 248,695 – – –
Derivative financial liabilities
Cash flow hedge on future revenue
Outflow 4,966 5,562 1,637 1,740 2,185 –
(Inflow) (23,850) (24,658) (11,447) (7,323) (5,888) –
1,821,844 1,844,082 843,244 969,474 29,958 1,406
As at September 30, 2010, the Company is holding cash and cash equivalents and short-term investments of $141,020,000 ($343,427,000 at September 30, 2009). The Company also has available $519,931,000 in unsecured revolving credit facilities and $25,000,000 in demand lines of credit (Note 10) ($1,359,279,000 and $25,000,000, respectively, at September 30, 2009). In addition, the funds held for clients of $248,695,000 ($332,359,000 at September 30, 2009) fully cover the clients’ funds obligations. Given the Company’s available liquid resources as compared to the timing of the payments of liabilities, management assesses the Company’s liquidity risk to be low.
CREDIT RISKThe Company takes on exposure to credit risk, which is the risk that a client will be unable to pay amounts in full when due. Financial instruments that potentially subject the Company to concentrations of credit risk consist of cash and cash equivalents, short-term investments, work in progress and accounts receivable.
Cash equivalents consist mainly of highly liquid investments, such as money market funds and term deposits, as well as bankers’ acceptances and bearer deposit notes issued by major banks (Note 3). None of the cash equivalents are in asset backed commercial paper products. The Company has deposited the cash equivalents with reputable financial institutions, from which management believes the risk of loss to be remote.
The Company has accounts receivable and work in progress derived from clients engaged in various industries including governmental agencies, finance, telecommunications, manufacturing and utilities that are not concentrated in any specific geographic area. These specific industries may be affected by economic factors that may impact accounts receivable. However, management does not believe that the Company is subject to any significant credit risk in view of the Company’s large and diversified client base.
The following table sets forth details of the age of accounts receivable that are past due:
2010 2009
$ $
Not past due 301,106 267,784
Past due 1-30 days 28,864 9,183
Past due 31-60 days 5,738 13,086
Past due 61-90 days 5,018 4,979
Past due more than 90 days 20,147 33,737
360,873 328,769
Allowance for doubtful accounts (11,524) (11,122)
349,349 317,647
The carrying amount of accounts receivable is reduced by an allowance account and the amount of the loss is recognized in the consolidated statement of earnings within costs of services, selling and administrative. When a receivable balance is considered uncollectible, it is written off against the allowance for doubtful accounts. Subsequent recoveries of amounts previously written off are credited against costs of services, selling and administrative in the consolidated statement of earnings. Overall, management does not believe that any single industry or geographic region represents a significant credit risk to the Company.

76 2010 ANNUAL REPORT CGI GROUP INC
Note 27Capital risk managementThe Company is exposed to risks of varying degrees of significance which could affect its ability to achieve its strategic objectives for growth. The main objectives of the Company’s risk management process are to ensure that risks are properly identified and that the capital base is adequate in relation to these risks.
The Company manages its capital to ensure that there are adequate capital resources while maximizing the return to shareholders through the optimization of the debt and equity balance. At September 30, 2010, total managed capital was $3,447,527,000 ($2,901,811,000 at September 30, 2009). Managed capital consists of long-term debt, including the current portion (Note 10), cash and cash equivalents (Note 3), short-term investments and shareholders’ equity. The basis for the Company’s capital structure is dependent on the Company’s expected business growth and changes in the business environment. When capital needs have been specified, the Company’s management proposes capital transactions for the approval of the Company’s Audit and Risk Management Committee and Board of Directors. The capital risk policy remains unchanged from prior periods.
The Company monitors its capital by reviewing various financial metrics, including the following:
– Debt/Capitalization
– Net Debt/Capitalization
– Debt/EBITDA
Debt represents long-term debt, including the current portion. Net debt, capitalization and EBITDA are non-GAAP measures. Net debt represents debt (including the impact of the fair value of forward contracts) less cash and cash equivalents and short-term investments. Capitalization is shareholders’ equity plus debt. EBITDA is calculated as earnings from continuing operations before income taxes, interest expense on long-term debt and depreciation and amortization. The Company believes that the results of the current internal ratios are consistent with its capital management objectives.
The Company is subject to external covenants on its credit facilities and its Senior U.S. unsecured notes. On the credit facilities, the ratios are as follows:
– A leverage ratio, which is the ratio of total debt to EBITDA for the four most recent quarters.
– An interest and rent coverage ratio, which is the ratio of the EBITDAR for the four most recent quarters to the total interest expense and the operating rentals in the same periods. EBITDAR, a non-GAAP measure, is calculated as EBITDA plus rent expense.
– A minimum net worth requirement, whereby shareholders’ equity, excluding foreign exchange translation adjustments included in accumulated other comprehensive loss, cannot be less than a specified threshold.
The ratios for the credit facilities are calculated on a consolidated basis, excluding Innovapost, which is a joint venture.
On the Senior U.S. unsecured notes, the ratios are as follows:
– A leverage ratio, which is the ratio of total debt adjusted for operating rent to EBITDAR for the four most recent quarters.
– A fixed charges coverage ratio, which is the ratio of the EBITDAR to the sum of interest expense plus operating rentals for the period for the four most recent quarters.
– A minimum net worth requirement, whereby shareholders’ equity, excluding foreign exchange translation adjustments included in accumulated other comprehensive loss, cannot be less than a specified threshold.
The ratios for the Senior U.S. unsecured notes are calculated based on specific subsidiaries of the Company that represent a significant portion of the Company’s consolidated operations.
The Company is in compliance with these covenants and monitors them on an ongoing basis. The ratios are also reviewed quarterly by the Company’s Audit and Risk Management Committee. The Company is not subject to any other externally imposed capital requirements.

CGI GROUP INC 2010 ANNUAL REPORT 77
Note 28Reconciliation of results reported in accordance with Canadian GAAP to U.S. GAAPThe material differences between Canadian and U.S. GAAP affecting the Company’s consolidated financial statements are detailed as follows:
2010 2009(Restated
Note 2a)
2008(Restated
Note 2a)
$ $ $
Reconciliation of net earnings:
Net earnings — Canadian GAAP 362,766 317,205 294,000
Adjustments for:
Stock-based compensation (i) (213) (3,759) (4,127)
Warrants (ii) 863 1,404 (5,721)
Reversal of income tax provision (iii) – (517) (7,452)
Other (iv) (140) 594 216
Net earnings — U.S. GAAP 363,276 314,927 276,916
Attributable to:
Shareholders of CGI Group Inc. 362,896 314,188 276,048
Non-controlling interest 380 739 868
Basic earnings per share attributable to shareholders of CGI Group Inc. — U.S. GAAP 1.27 1.02 0.87
Diluted earnings per share attributable to shareholders of CGI Group Inc. — U.S. GAAP 1.24 1.01 0.86
Net earnings — U.S. GAAP 363,276 314,927 276,916
Other comprehensive (loss) income (35,756) 35,434 64,649
Comprehensive income — U.S. GAAP 327,520 350,361 341,565
Attributable to:
Shareholders of CGI Group Inc. 327,140 349,622 340,697
Non-controlling interest 380 739 868
Reconciliation of shareholders’ equity:
Equity attributable to shareholders of CGI Group Inc. — Canadian GAAP 2,152,631 2,275,254 1,997,001
Adjustments for:
Stock-based compensation (ix) 58,411 58,411 58,411
Warrants (ii) (7,125) (7,988) (9,392)
Reversal of income tax provision (iii) (7,969) (7,969) (7,452)
Unearned compensation (v) (3,694) (3,694) (3,694)
Integration costs (vi) (6,606) (6,606) (6,606)
Goodwill (vii) 28,078 28,078 28,078
Income taxes and adjustment for change in accounting policy (viii) 9,715 9,715 9,715
Other (iv) (3,405) (3,265) (3,859)
Equity attributable to shareholders of CGI Group Inc. — U.S. GAAP 2,220,036 2,341,936 2,062,202
Equity attributable to non-controlling interest — Canadian and U.S. GAAP 6,452 6,342 5,922

78 2010 ANNUAL REPORT CGI GROUP INC
Note 28 Reconciliation of results reported in accordance with Canadian GAAP to U.S. GAAP (continued)
( i ) S tock-based compensat ionBeginning in fiscal 2008, the Company issued stock options with a three-year graded vesting period and a performance criteria. Under Canadian GAAP, the compensation cost for this type of option has been accounted for on a straight-line basis because the awards of graded vesting options have a similar expected life. Under U.S. GAAP, the graded vesting method must be used. The adjustment represents the compensation cost difference between using the straight-line and graded vesting method. This adjustment does not have an impact on shareholders’ equity.
( i i ) War rantsUnder Canadian GAAP, the fair value of warrants issued in connection with long-term outsourcing contracts is recorded as contract costs and amortized on a straight-line basis over the initial contract term. Under U.S. GAAP, the fair value of equity instruments issued was subtracted from the initial proceeds received in determining revenue. The 2010, 2009, and 2008 adjustments reflect the reversal of contract cost amortization, net of income taxes, which is included as a reduction to Canadian GAAP consolidated net earnings.
The fiscal 2008 adjustment also includes final determinations from agreements with tax authorities and expirations of statutes of limitations of prior year tax liabilities associated with the issuance of warrants that resulted in the reversal of $7,125,000 in tax liabilities during fiscal 2008. The reversal of this recovery was included as an increase to Canadian GAAP consolidated earnings.
( i i i ) Reversa l of income ta x prov is ionDuring fiscal 2009 and fiscal 2008, the Company reversed one-time income tax provisions pertaining to the determination of prior year tax liabilities after final agreement with tax authorities and the expirations of statutes of limitations relating to business acquisitions. The reversal of the provisions was included as an increase to Canadian GAAP consolidated earnings. Under U.S. GAAP, the adjustment was applied to the goodwill attributable to the acquisition prior to the adoption of ASC Topic 805, ‘‘Business Combination’’ on October 1, 2009. (Refer to (x) Recent accounting changes).
( iv ) Capi ta l izat ion of intangib le assetsEffective October 1, 2008, the Company adopted Section 3064, “Goodwill and Intangible Assets”. As a result of the standard, there is new guidance relating to eligible capitalizable costs in the development of intangibles. Under U.S. GAAP, there were no changes to capitalization standards. This adjustment is one of the items included in “other” and represents the net effect of costs that were expensed or capitalized under Canadian GAAP for which the accounting treatment is different under U.S. GAAP. For the years ended September 30, 2010, 2009 and 2008, the adjustment to U.S. GAAP net earnings is a decrease of $959,000, $198,000 and $368,000, respectively. As at September 30, 2010, 2009 and 2008, the adjustment to U.S. GAAP shareholders’ equity is an increase of $1,186,000, $2,145,000 and $2,341,000, respectively.
(v ) Unearned compensat ionUnder Canadian GAAP, prior to July 1, 2001, unvested stock options granted as a result of a business combination were not recorded. The adjustment reflects the intrinsic value of unvested stock options (see (vii) below) that would have been recorded as a separate component of shareholders’ equity for U.S. GAAP purposes. This unearned compensation was amortized over approximately three years, being the estimated remaining future vesting service period.
(v i ) Integrat ion costsUnder Canadian GAAP, prior to January 1, 2001, certain restructuring costs relating to the purchaser may be recognized in the purchase price allocation when accounting for business combinations, subject to certain conditions. Under U.S. GAAP, only costs relating directly to the acquired business may be considered in the purchase price allocation. This adjustment represents the charge to consolidated net earnings, net of goodwill amortization in 2001, recorded for Canadian GAAP purposes and net of income taxes.
(v i i ) Goodwi l lThe goodwill adjustment to shareholders’ equity results principally from the difference in the value assigned to stock options issued to IMRglobal Corp. employees. Under Canadian GAAP, the fair value of the outstanding vested stock options is recorded as part of the purchase price allocation whereas under U.S. GAAP, the fair value of both vested and unvested outstanding stock options granted as a result of the business acquisition is recorded. See (v) above for a further discussion relating to this item.

CGI GROUP INC 2010 ANNUAL REPORT 79
(v i i i ) Income ta xes and adjustment for change in account ing pol icyOn October 1, 1999, the Company adopted the recommendations of CICA Handbook Section 3465, “Income taxes”. The recommendations of Section 3465 are similar to the provisions of ASC Topic 740, “Income Taxes”, issued by the Financial Accounting Standards Board (“FASB”). Upon the implementation of Section 3465, the Company recorded an adjustment to reflect the difference between the assigned value and the tax basis of assets acquired in a business combination, which resulted in future income tax liabilities. The Company recorded this amount through a reduction of retained earnings as part of the cumulative adjustment. Under U.S. GAAP, this amount would have been reflected as additional goodwill.
( ix ) S tock-based compensat ionUnder Canadian GAAP, stock-based compensation cost was accounted for using the fair value based method beginning October 1, 2004. Under U.S. GAAP, ASC Topic 718, “Compensation — Stock Compensation”, did not require adoption of this standard until fiscal years beginning on or after June 15, 2005. The 2005 adjustments represent the charge to consolidated net earnings recorded for Canadian GAAP purposes as no such expense was recorded or required under U.S. GAAP. Beginning October 1, 2005, there is no difference between Canadian and U.S. GAAP in connection to stock-based compensation cost.
(x ) Recent account ing changesIn December 2007, FASB issued ASC Topic 805, “Business Combinations,” which became effective for the Company as of October 1, 2009 via prospective application to business combinations. This standard is similar to the corresponding provisions of CICA Section 1582, “Business Combinations”, (refer to Note 2a). As a result of the adoption of ASC Topic 805, tax adjustments for a total amount of $29,716,000 related to the final determinations and expiration of limitation periods were recognized during the year ended September 30, 2010 as a reduction of the income tax expense rather than applied to goodwill. This new accounting treatment is consistent with CICA Section 1582. Consequently, there is no GAAP difference in the year ended September 30, 2010 with respect to these items.
In December 2007, FASB issued ASC Topic 810, “Consolidation”, which became effective for the Company as of October 1, 2009 via retrospective application. This standard is similar to the corresponding provisions of CICA Section 1601 “Consolidated Financial Statements” and Section 1602, “Non-Controlling Interests”, (refer to Note 2a). The Company adopted ASC Topic 810 without significant effect on the Company’s consolidated financial statements. The effects on future periods will depend on the nature and significance of business combinations subject to these standards.
(x i ) Future account ing changesIn October 2009, the FASB issued Accounting Standards Update (“ASU”) 2009-13, “Multiple-Deliverable Revenue Arrangements”, an amendment to FASB ASC Topic 605, “Revenue Recognition”, and ASU 2009-14, “Certain Revenue Arrangements That Include Software Elements”, an amendment to FASB ASC Subtopic 985-605, “Software — Revenue Recognition”. ASU 2009-13 provides authoritative guidance on revenue arrangements with multiple deliverables that are outside the scope of the software revenue recognition guidance. Under this ASU, when VSOE or third party evidence for deliverables in an arrangement cannot be determined, a best estimate of the selling price is required to separate deliverables and allocate arrangement consideration using the relative selling price method. ASU 2009-13 also includes new disclosure requirements on how the application of the relative selling price method affects the timing and amount of revenue recognition. ASU 2009-14 provides guidance on arrangements that include software elements, including tangible products that have software components that are essential to the functionality of the tangible product and will no longer be within the scope of the software revenue recognition guidance, and software-enabled products that will now be subject to other relevant revenue recognition guidance. These standards must be adopted in the same period using the same transition method and are effective prospectively, with retrospective adoption permitted, for revenue arrangements entered into or materially modified in fiscal years beginning on or after June 15, 2010. Effective October 1, 2010, the Company will adopt these standards, on a prospective basis. The effects on future periods will depend on the nature and significance of the future customer contracts subject to these standards.